axa x dssg meetup sharing (feb 2016)
TRANSCRIPT

WHAT'S AN INSURER LIKE AXA
DOING IN THE BIG DATA WORLD?
Data science Meetup 23rd Feb 216
Philippe Marie-Jeanne
Group CDO & Head of the DIL
Ankur Agrawal
Head of the DIL@Asia

1 AXA’s transformation
3 | SMART DATA AND DATA INNOVATION LAB
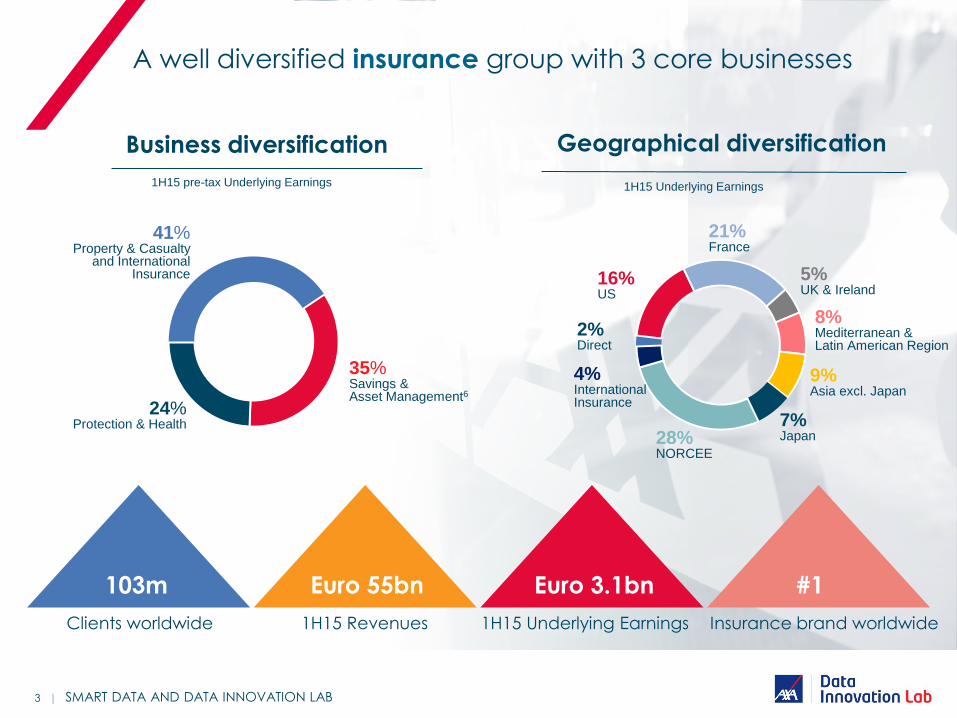
Business diversification Geographical diversification
A well diversified insurance group with 3 core businesses
35% Savings & Asset Management6
24% Protection & Health
41% Property & Casualty
and International Insurance
21% France
5% UK & Ireland
8% Mediterranean & Latin American Region
9% Asia excl. Japan
7% Japan 28%
NORCEE
4% International Insurance
2% Direct
16% US
103m Euro 55bn Euro 3.1bn #1
Clients worldwide 1H15 Revenues 1H15 Underlying Earnings Insurance brand worldwide
1H15 pre-tax Underlying Earnings 1H15 Underlying Earnings
4 | SMART DATA AND DATA INNOVATION LAB
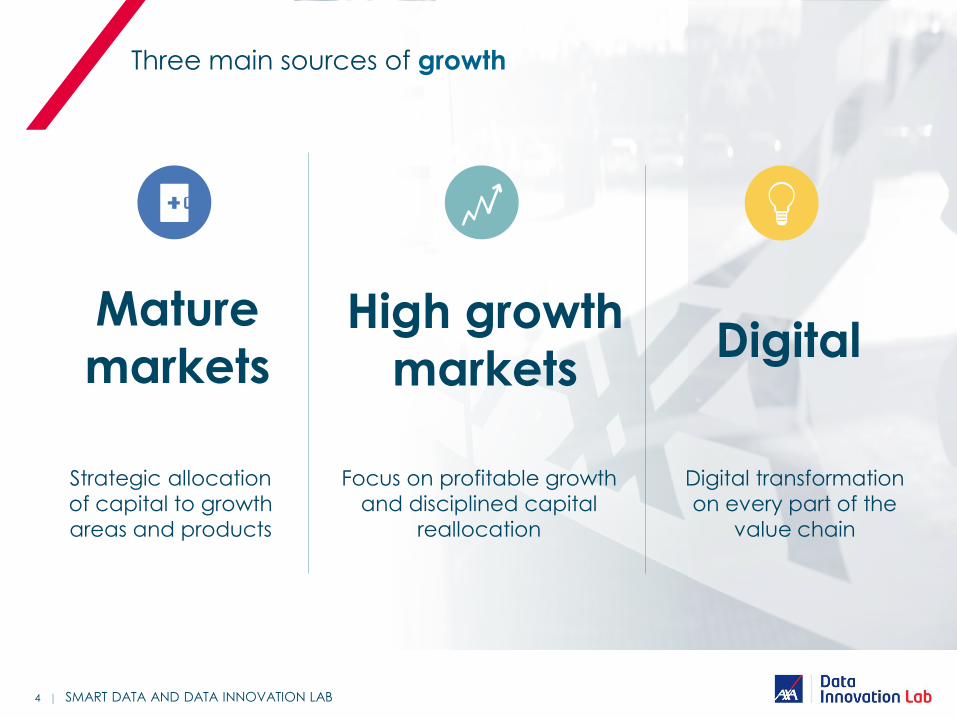
Three main sources of growth
92 EURO BN
revenues
Strategic allocation
of capital to growth
areas and products
Focus on profitable growth
and disciplined capital
reallocation
Digital transformation
on every part of the
value chain
Mature
markets High growth
markets Digital
The Data Innovation Lab
as a transformation engine
within AXA
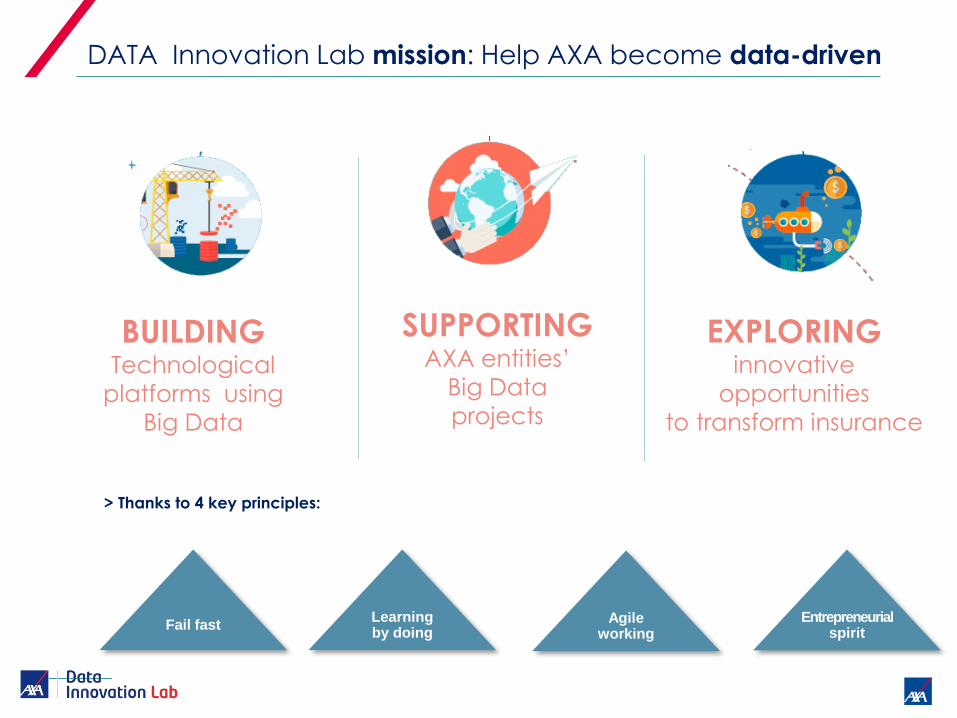
DATA Innovation Lab mission: Help AXA become data-driven
Fail fast Entrepreneurial
spirit Agile
working Learning by doing
> Thanks to 4 key principles:
BUILDING Technological
platforms using
Big Data
SUPPORTING AXA entities’
Big Data
projects
EXPLORING innovative
opportunities
to transform insurance

7 | SMART DATA AND DATA INNOVATION LAB
… Thanks to specific resources and assets…
AN INTERNATIONAL TALENT POOL SPECIFIC METHODOLOGIES
DATA!
A TEAM OF SELECTED EXPERTS PLATFORMS & TOOLS
8 | SMART DATA AND DATA INNOVATION LAB
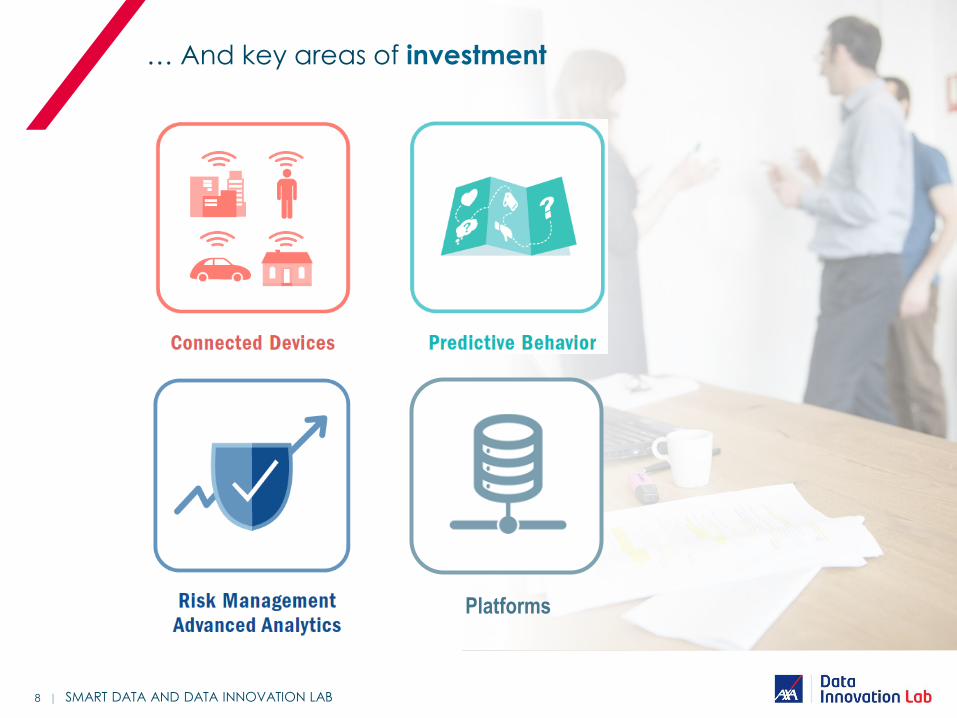
… And key areas of investment
Platforms
9 | SMART DATA AND DATA INNOVATION LAB
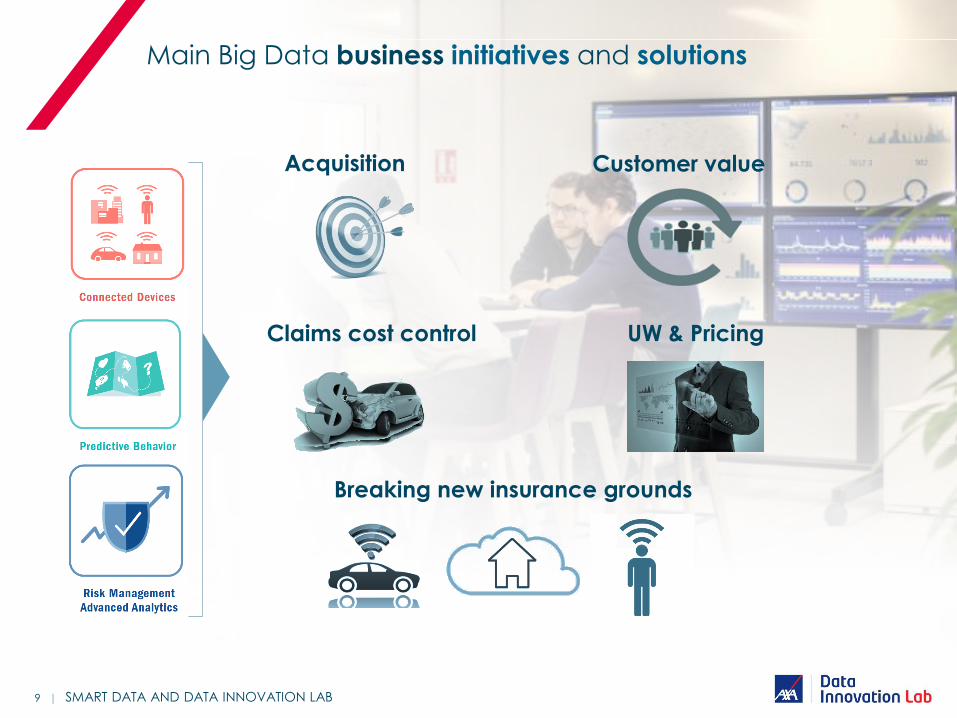
Main Big Data business initiatives and solutions
Acquisition Customer value
Claims cost control UW & Pricing
Breaking new insurance grounds
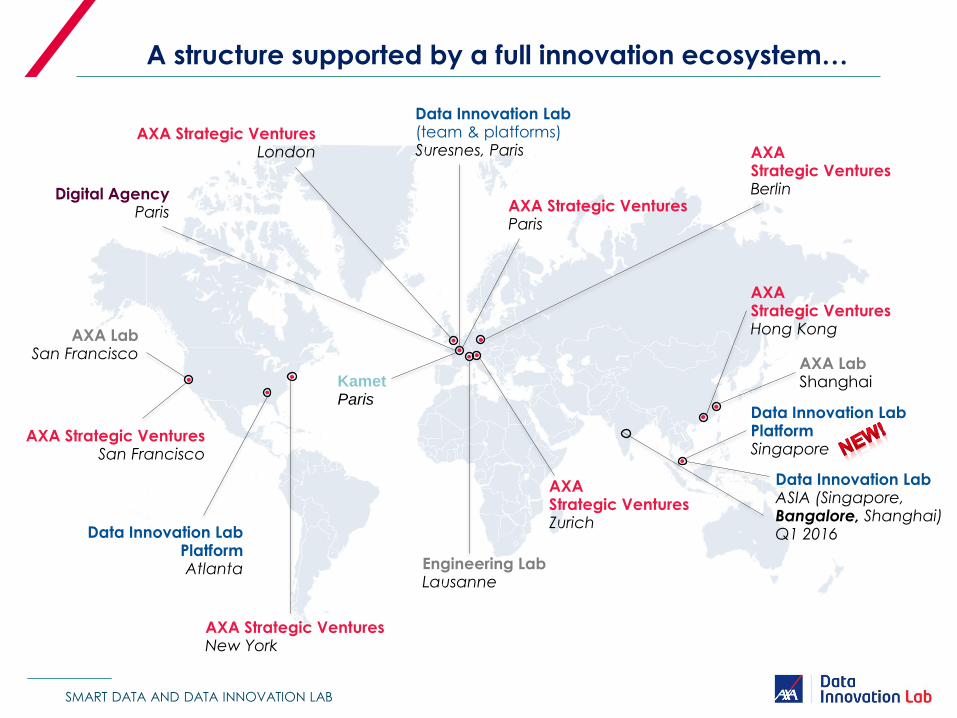
AXA Lab San Francisco
AXA Lab Shanghai
A structure supported by a full innovation ecosystem…
AXA Strategic Ventures New York
AXA Strategic Ventures Paris
AXA Strategic Ventures London
AXA Strategic Ventures San Francisco
AXA Strategic Ventures Hong Kong
AXA Strategic Ventures Zurich
AXA Strategic Ventures Berlin
Kamet Paris
Data Innovation Lab (team & platforms) Suresnes, Paris
Data Innovation Lab Platform Atlanta
Data Innovation Lab Platform Singapore
Data Innovation Lab ASIA (Singapore, Bangalore, Shanghai) Q1 2016
Engineering Lab Lausanne
Digital Agency Paris
SMART DATA AND DATA INNOVATION LAB
How big is Big Data for AXA?
A business perspective
”Big Data is an economical and technological revolution… …being defensive is a waste of time as it is
unavoidable and lethal” - Henri de Castries
AXA CEO
13 | SMART DATA AND DATA INNOVATION LAB
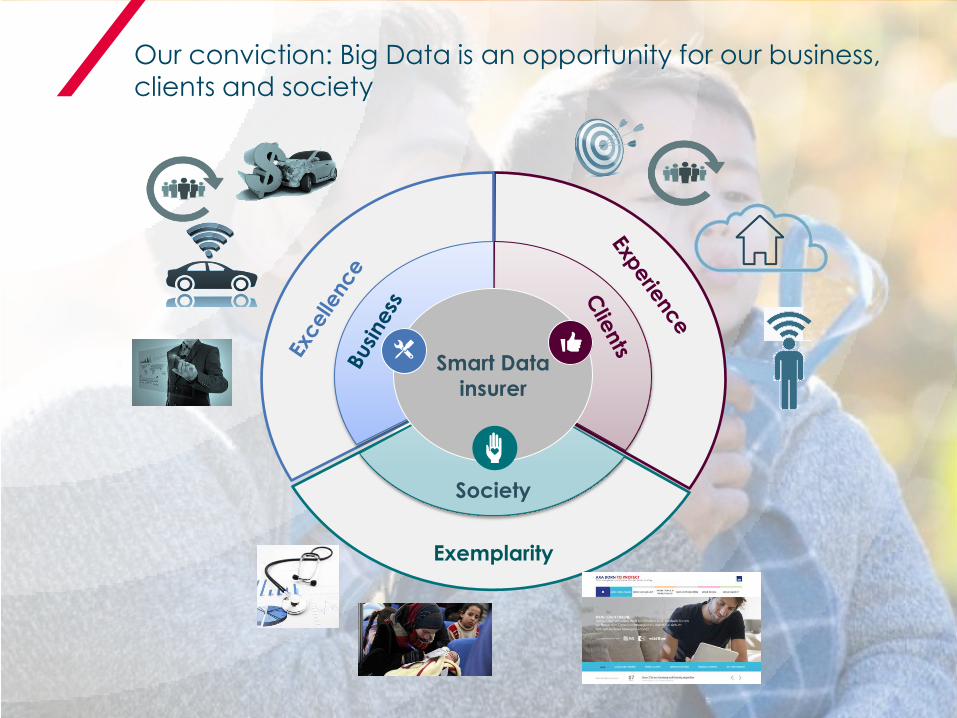
Smart Data
insurer
Society
Exemplarity
Our conviction: Big Data is an opportunity for our business,
clients and society
14 | SMART DATA AND DATA INNOVATION LAB
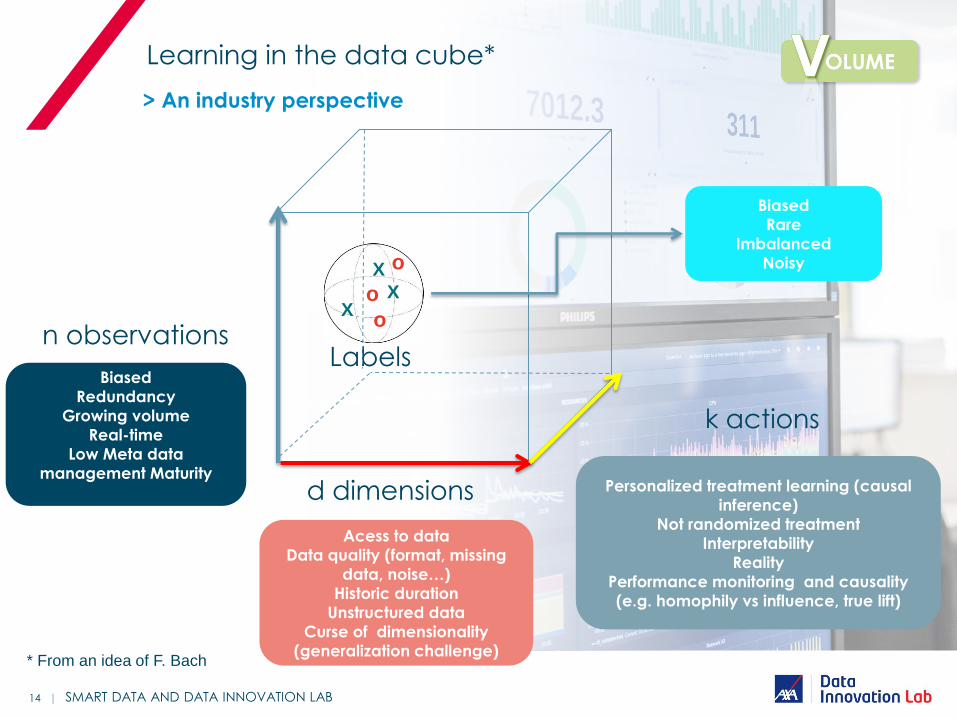
Learning in the data cube*
> An industry perspective
n observations
d dimensions
* From an idea of F. Bach
Biased
Redundancy
Growing volume
Real-time
Low Meta data
management Maturity
Acess to data
Data quality (format, missing
data, noise…)
Historic duration
Unstructured data
Curse of dimensionality
(generalization challenge)
Biased
Rare
Imbalanced
Noisy
Labels
X X
X o
o
o
Personalized treatment learning (causal
inference)
Not randomized treatment
Interpretability
Reality
Performance monitoring and causality
(e.g. homophily vs influence, true lift)
k actions
2 Deep Dive
Fraud project
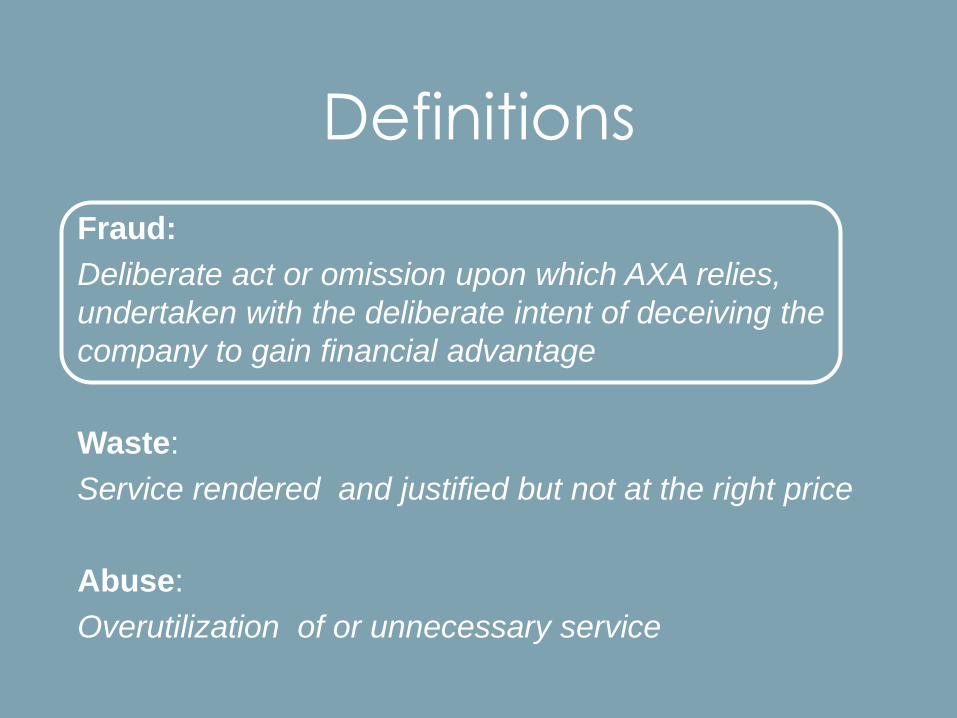
Fraud:
Deliberate act or omission upon which AXA relies,
undertaken with the deliberate intent of deceiving the
company to gain financial advantage
Waste:
Service rendered and justified but not at the right price
Abuse:
Overutilization of or unnecessary service
Definitions
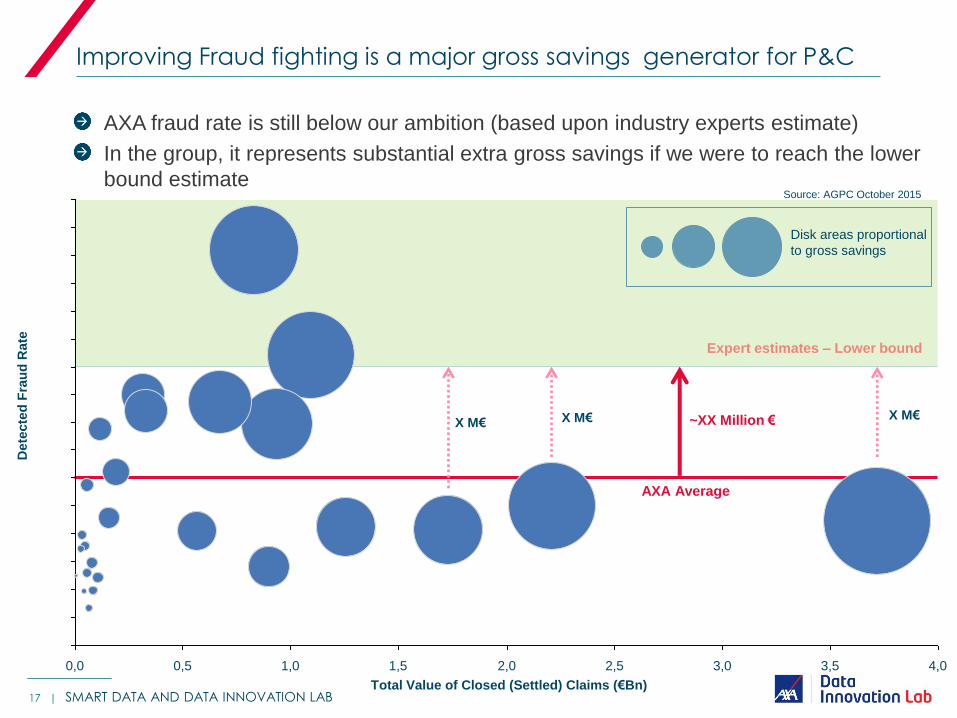
Improving Fraud fighting is a major gross savings generator for P&C
17 |
Expert estimates – Lower bound
0.0%
0.5%
1.0%
1.5%
2.0%
2.5%
3.0%
3.5%
4.0%
4.5%
5.0%
5.5%
6.0%
6.5%
7.0%
7.5%
8.0%
1,5 4,0 3,5 3,0 2,5 2,0 1,0 0,5 0,0
Dete
cte
d F
rau
d R
ate
Total Value of Closed (Settled) Claims (€Bn)
~XX Million €
Source: AGPC October 2015
Disk areas proportional
to gross savings
X M€ X M€
AXA Average
X M€
AXA fraud rate is still below our ambition (based upon industry experts estimate)
In the group, it represents substantial extra gross savings if we were to reach the lower
bound estimate
SMART DATA AND DATA INNOVATION LAB
Mission : The Data Innovation Lab (DIL) proposes to evaluate the opportunity to
develop and support an effective software to detect fraud, waste and abuse
(FWA) for interested entities
Key principles
Stick to business needs
Analysis is not enough
Leverage advanced data analytics
Data driven process
Replicability:
Mission & Principles
18 | SMART DATA AND DATA INNOVATION LAB
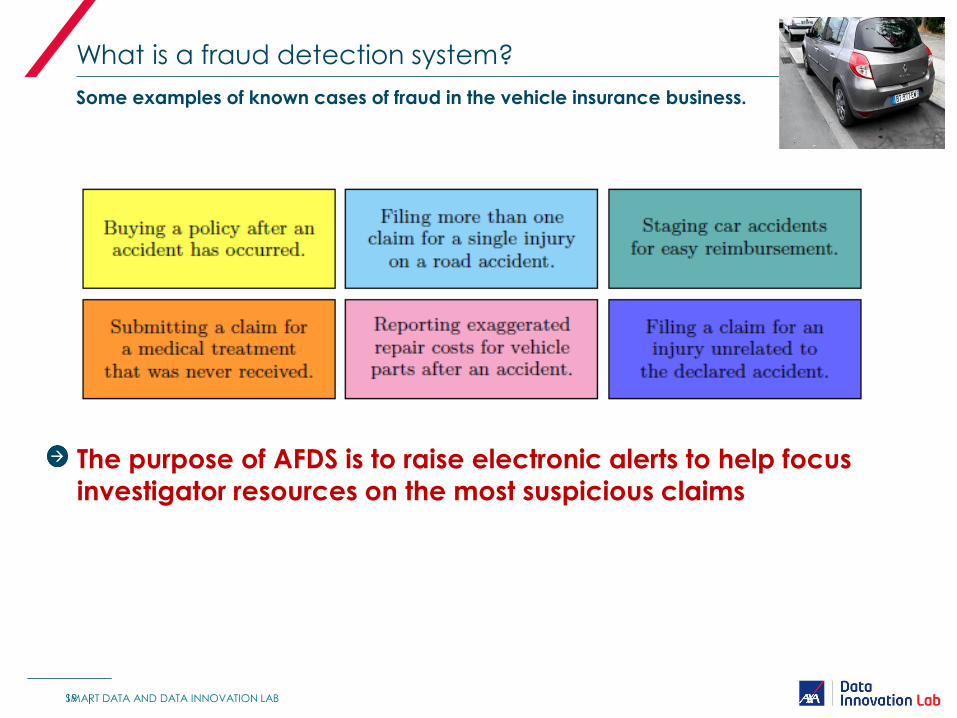
The purpose of AFDS is to raise electronic alerts to help focus
investigator resources on the most suspicious claims
What is a fraud detection system?
Some examples of known cases of fraud in the vehicle insurance business.
19 | SMART DATA AND DATA INNOVATION LAB
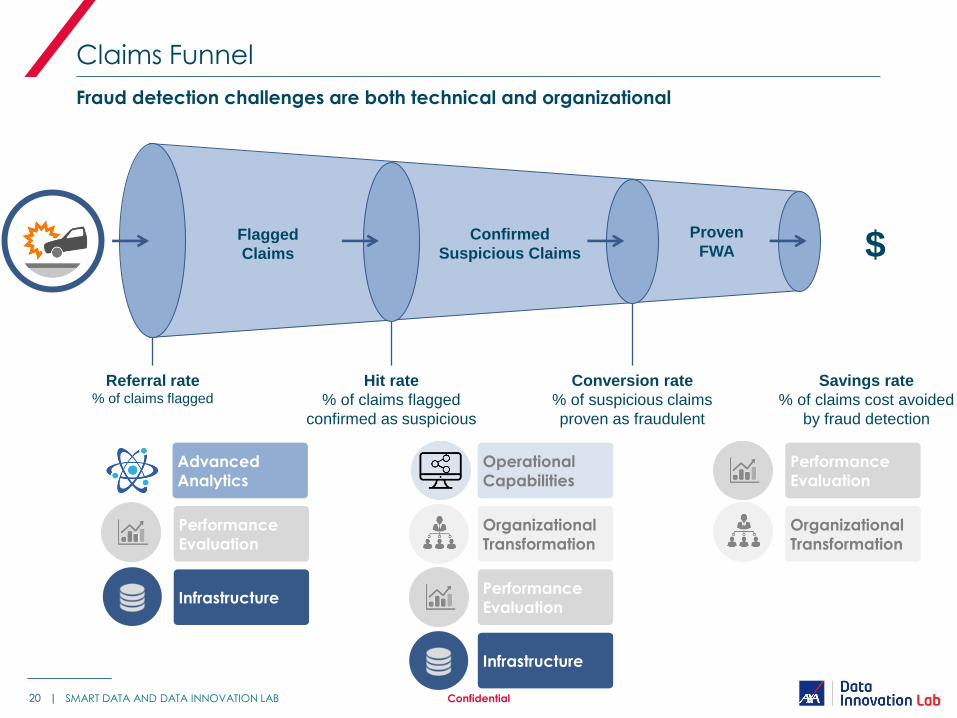
Claims Funnel
Fraud detection challenges are both technical and organizational
20 | Confidential
Flagged
Claims
Confirmed
Suspicious Claims $
Referral rate % of claims flagged
Hit rate
% of claims flagged
confirmed as suspicious
Conversion rate
% of suspicious claims
proven as fraudulent
Proven
FWA
Advanced
Analytics
Performance
Evaluation
Infrastructure
Operational
Capabilities
Organizational
Transformation
Performance
Evaluation
Infrastructure
Performance
Evaluation
Organizational
Transformation
Savings rate
% of claims cost avoided
by fraud detection
SMART DATA AND DATA INNOVATION LAB

Fraud detection modelling & Operations
Data scientists and operations cooperation is mandatory to ensure the success of fraud detection
21 |
Ingest, Clean & integrate data Develop a
predictive
model
Launch a pilot
to make a “live
test”
Estimate financial
benefits
Ingest new
data & refine
the model
Test the model on
historical data
& assess
performance
SMART DATA AND DATA INNOVATION LAB
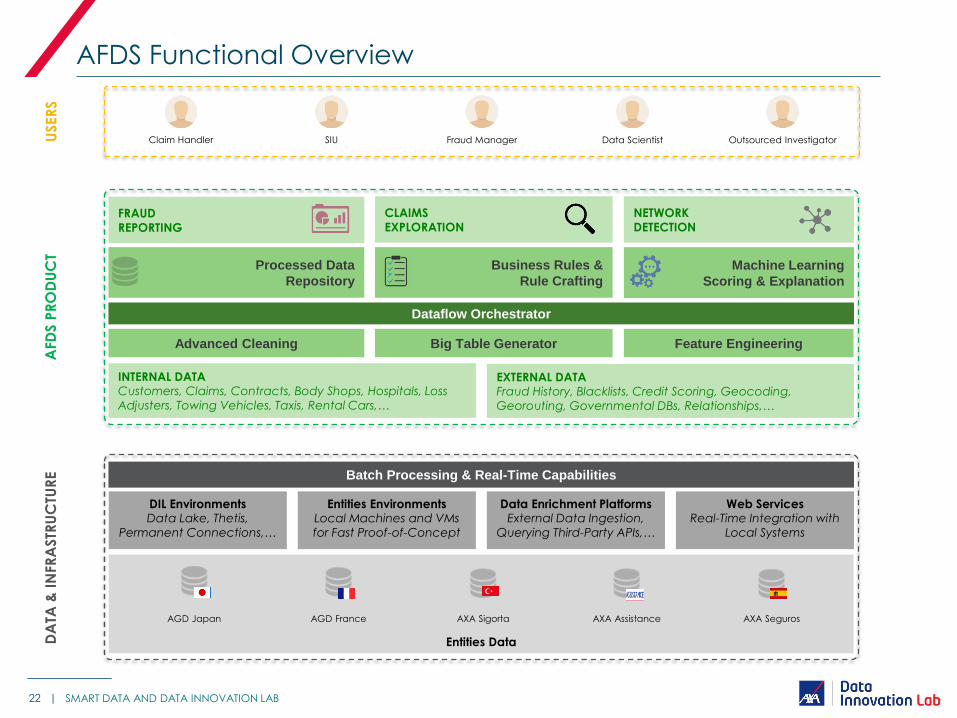
AFDS Functional Overview
Entities Data
AGD Japan
DIL Environments Data Lake, Thetis,
Permanent Connections,…
DA
TA &
IN
FR
ASTR
UC
TUR
E
AGD France AXA Sigorta AXA Assistance AXA Seguros
Batch Processing & Real-Time Capabilities
Entities Environments
Local Machines and VMs
for Fast Proof-of-Concept
Data Enrichment Platforms External Data Ingestion,
Querying Third-Party APIs,…
Web Services Real-Time Integration with
Local Systems
Fraud Manager Outsourced Investigator Claim Handler SIU Data Scientist USER
S
NETWORK
DETECTION
Processed Data
Repository
EXTERNAL DATA Fraud History, Blacklists, Credit Scoring, Geocoding,
Georouting, Governmental DBs, Relationships,…
INTERNAL DATA Customers, Claims, Contracts, Body Shops, Hospitals, Loss
Adjusters, Towing Vehicles, Taxis, Rental Cars,…
Machine Learning
Scoring & Explanation
FRAUD REPORTING
CLAIMS
EXPLORATION
AFD
S P
RO
DU
CT
Dataflow Orchestrator
Business Rules &
Rule Crafting
Advanced Cleaning Big Table Generator Feature Engineering
22 | SMART DATA AND DATA INNOVATION LAB

Data science challenges
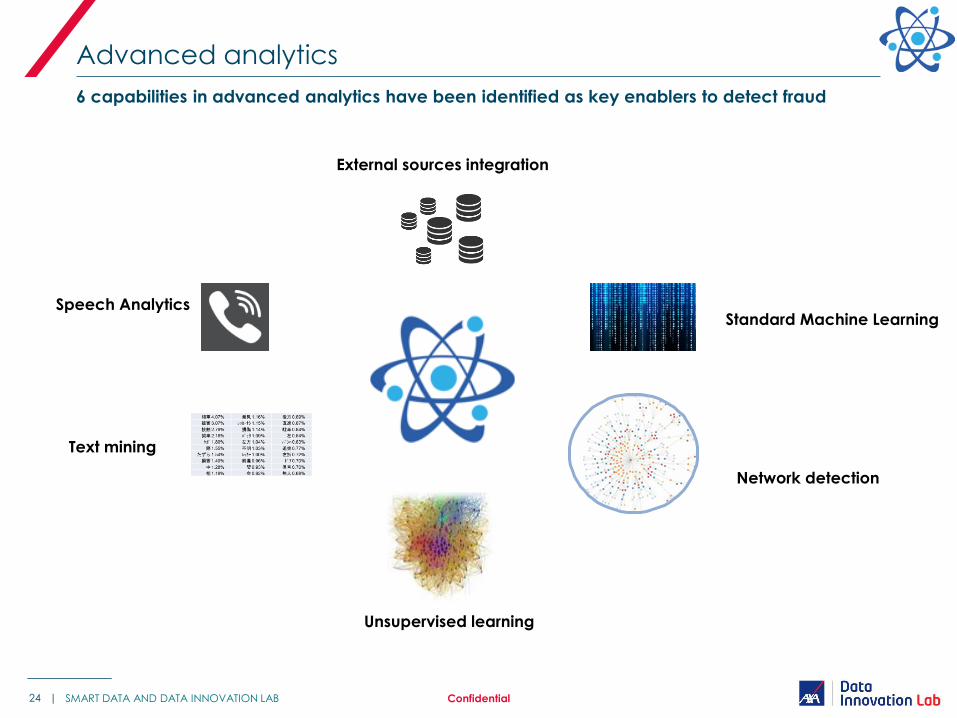
Advanced analytics
6 capabilities in advanced analytics have been identified as key enablers to detect fraud
24 | Confidential
External sources integration
Speech Analytics
Text mining
Network detection
Unsupervised learning
Standard Machine Learning
SMART DATA AND DATA INNOVATION LAB
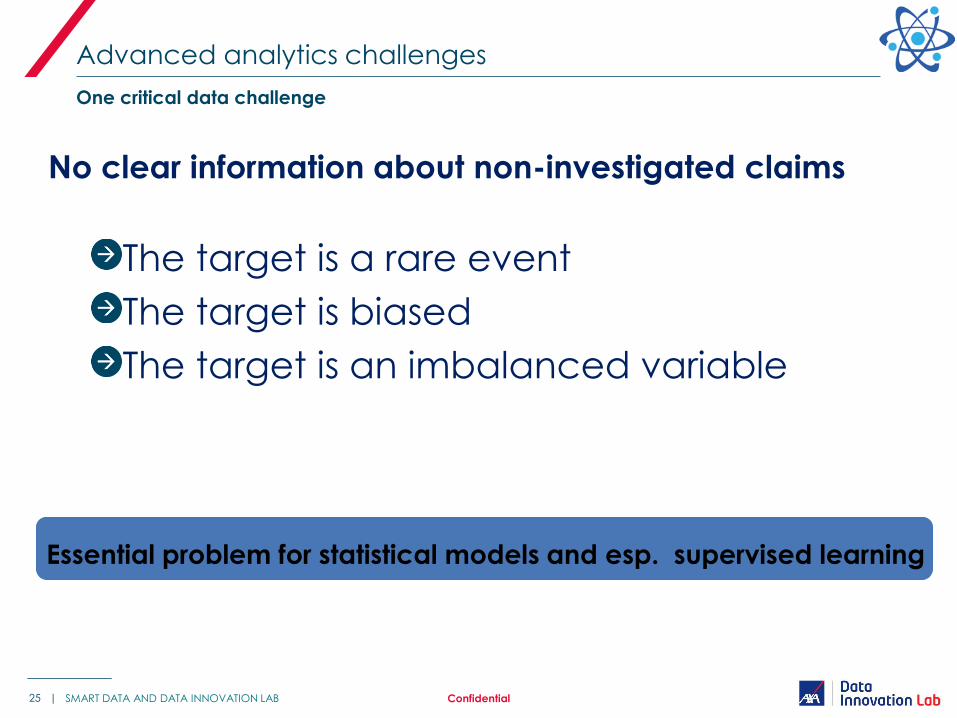
Advanced analytics challenges
One critical data challenge
25 | Confidential
Essential problem for statistical models and esp. supervised learning
SMART DATA AND DATA INNOVATION LAB
No clear information about non-investigated claims
The target is a rare event
The target is biased
The target is an imbalanced variable
Advanced analytics challenges
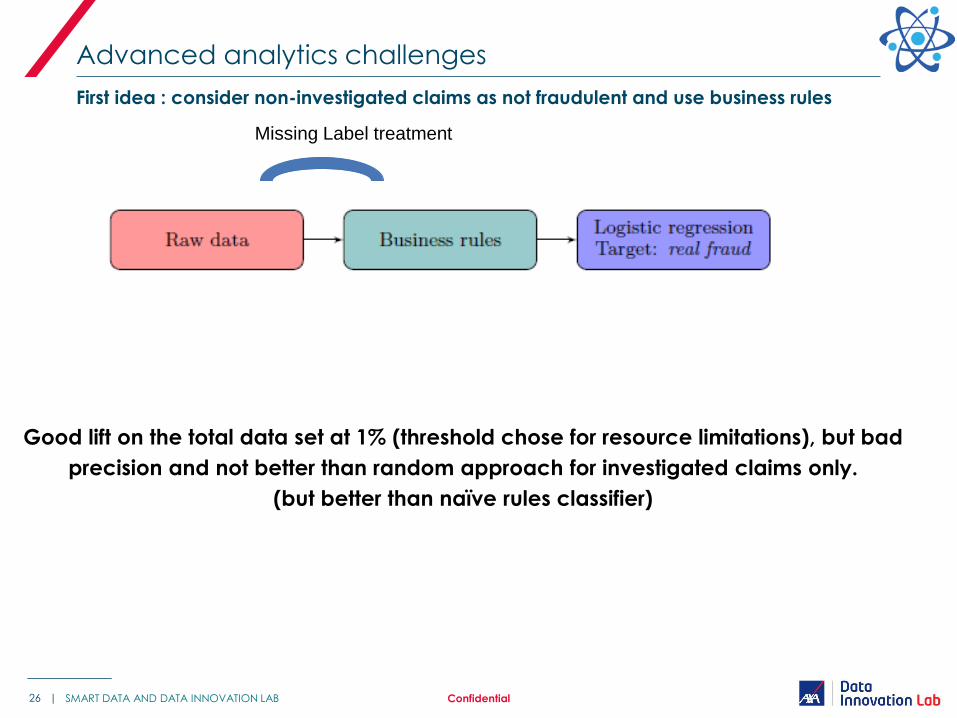
First idea : consider non-investigated claims as not fraudulent and use business rules
26 | Confidential
Good lift on the total data set at 1% (threshold chose for resource limitations), but bad
precision and not better than random approach for investigated claims only.
(but better than naïve rules classifier)
SMART DATA AND DATA INNOVATION LAB
Missing Label treatment
Advanced analytics challenges
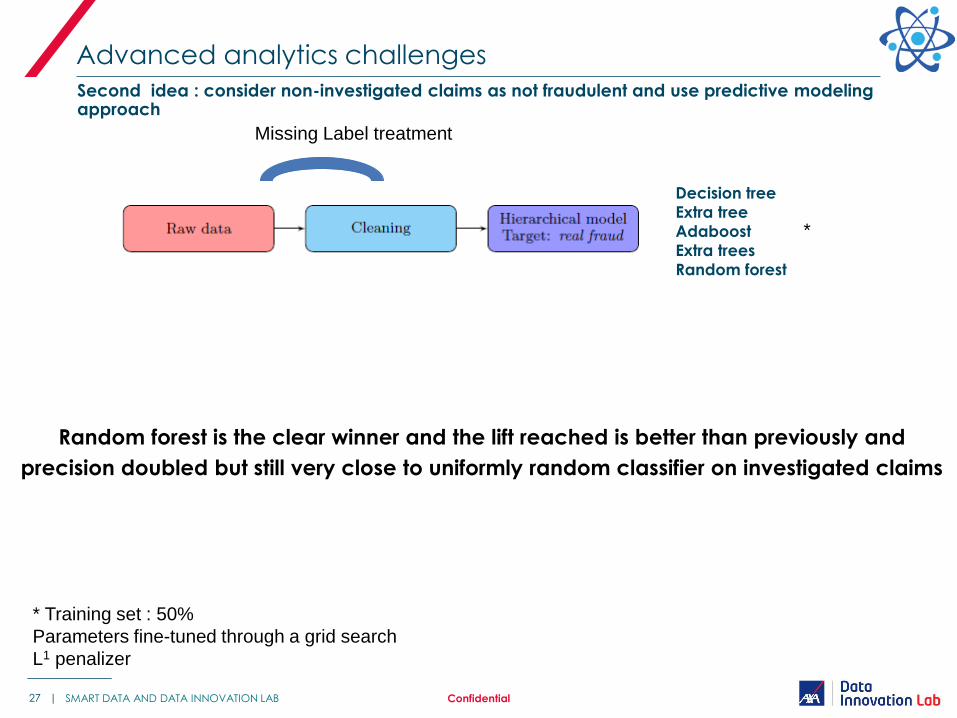
Second idea : consider non-investigated claims as not fraudulent and use predictive modeling approach
27 | Confidential
Random forest is the clear winner and the lift reached is better than previously and
precision doubled but still very close to uniformly random classifier on investigated claims
SMART DATA AND DATA INNOVATION LAB
Missing Label treatment
Decision tree
Extra tree
Adaboost
Extra trees
Random forest
* Training set : 50%
Parameters fine-tuned through a grid search
L1 penalizer
*
Advanced analytics challenges
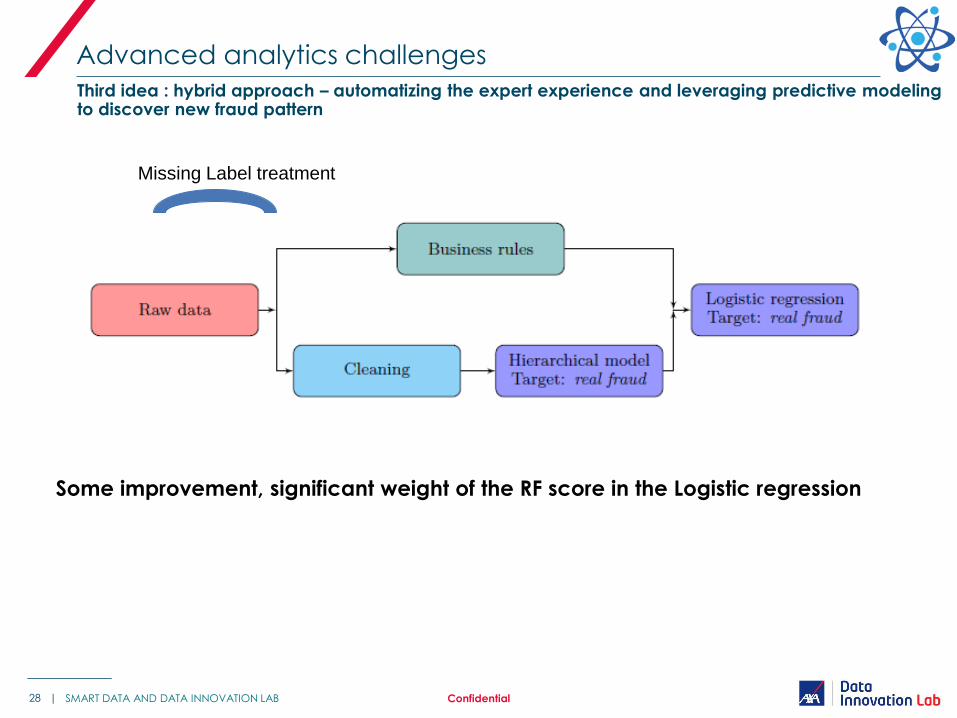
Third idea : hybrid approach – automatizing the expert experience and leveraging predictive modeling to discover new fraud pattern
28 | Confidential
Some improvement, significant weight of the RF score in the Logistic regression
SMART DATA AND DATA INNOVATION LAB
Missing Label treatment
Advanced analytics challenges
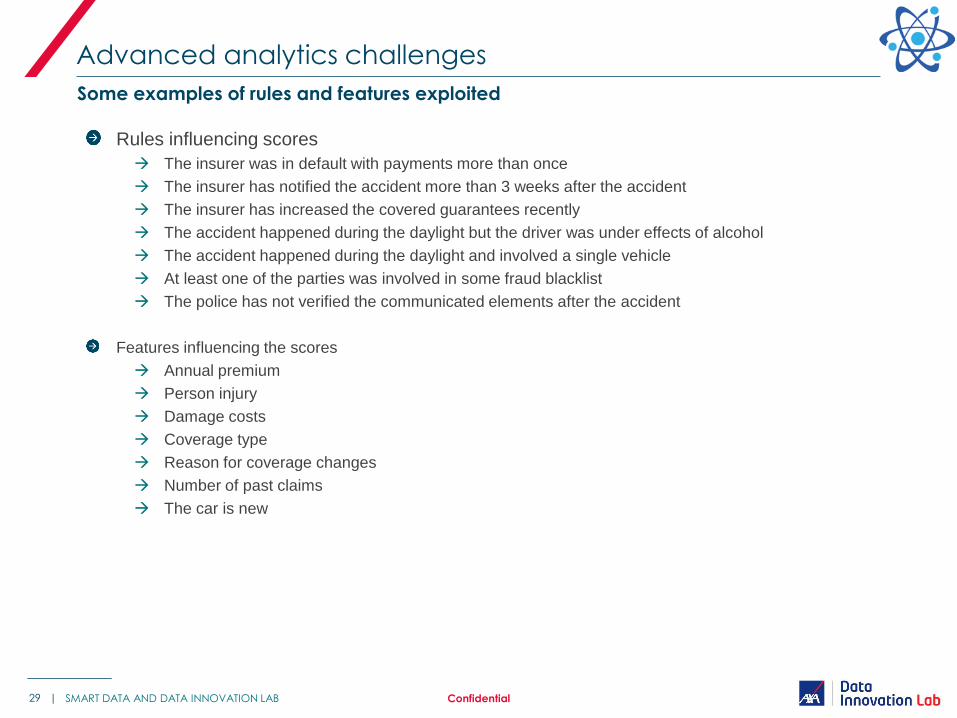
Some examples of rules and features exploited
29 | Confidential SMART DATA AND DATA INNOVATION LAB
Rules influencing scores
The insurer was in default with payments more than once
The insurer has notified the accident more than 3 weeks after the accident
The insurer has increased the covered guarantees recently
The accident happened during the daylight but the driver was under effects of alcohol
The accident happened during the daylight and involved a single vehicle
At least one of the parties was involved in some fraud blacklist
The police has not verified the communicated elements after the accident
Features influencing the scores
Annual premium
Person injury
Damage costs
Coverage type
Reason for coverage changes
Number of past claims
The car is new
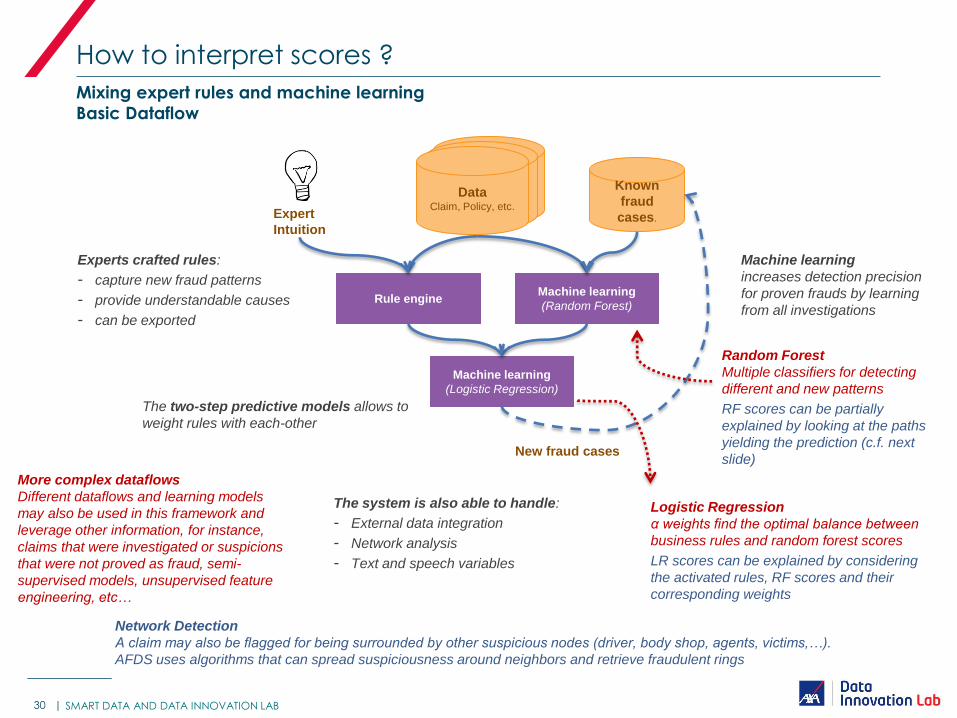
How to interpret scores ?
Mixing expert rules and machine learning
Basic Dataflow
30 |
Data Claim, Policy, etc.
Rule engine Machine learning
(Random Forest)
Machine learning
(Logistic Regression)
Known
fraud
cases. Expert
Intuition
Experts crafted rules:
- capture new fraud patterns
- provide understandable causes
- can be exported
Machine learning
increases detection precision
for proven frauds by learning
from all investigations
New fraud cases
The two-step predictive models allows to
weight rules with each-other
The system is also able to handle:
- External data integration
- Network analysis
- Text and speech variables
Random Forest
Multiple classifiers for detecting
different and new patterns
RF scores can be partially
explained by looking at the paths
yielding the prediction (c.f. next
slide)
Logistic Regression
α weights find the optimal balance between
business rules and random forest scores
LR scores can be explained by considering
the activated rules, RF scores and their
corresponding weights
More complex dataflows
Different dataflows and learning models
may also be used in this framework and
leverage other information, for instance,
claims that were investigated or suspicions
that were not proved as fraud, semi-
supervised models, unsupervised feature
engineering, etc…
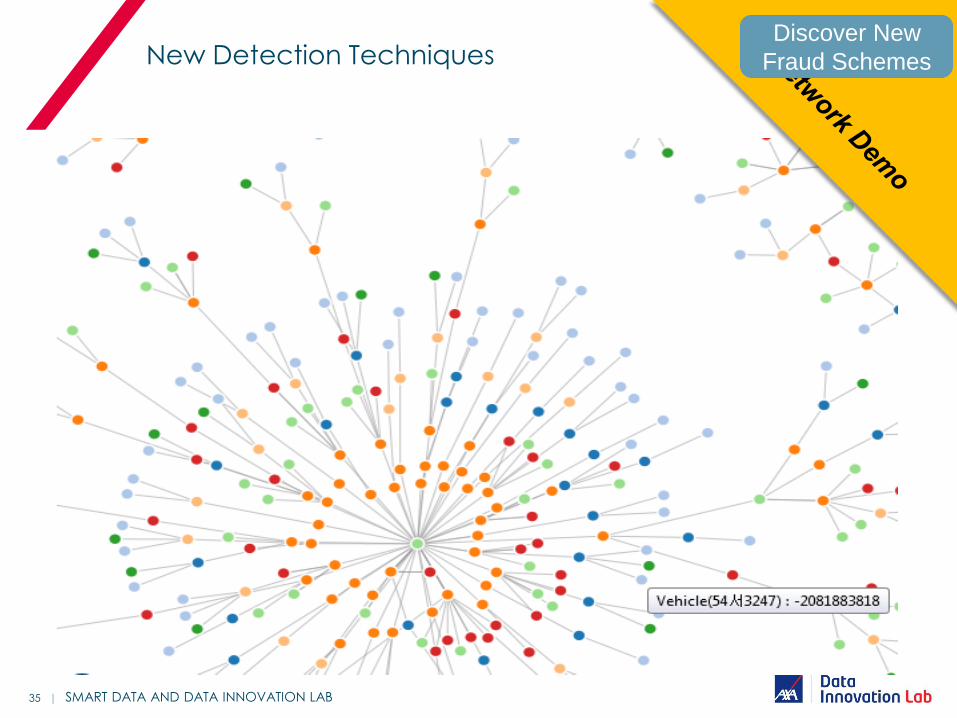
Network Detection
A claim may also be flagged for being surrounded by other suspicious nodes (driver, body shop, agents, victims,…).
AFDS uses algorithms that can spread suspiciousness around neighbors and retrieve fraudulent rings
SMART DATA AND DATA INNOVATION LAB
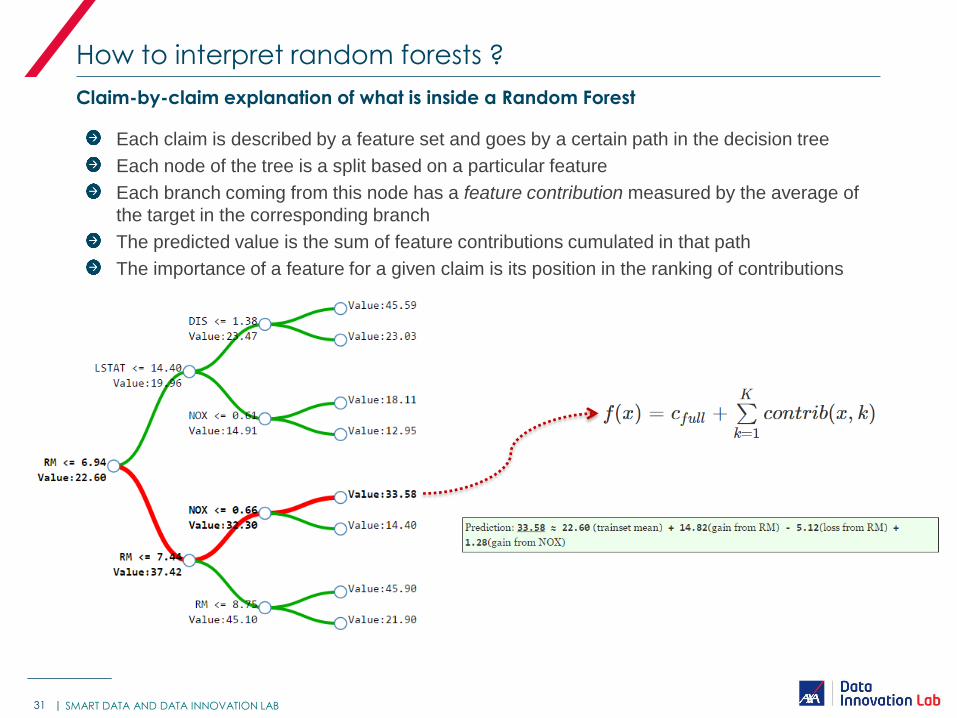
How to interpret random forests ?
Claim-by-claim explanation of what is inside a Random Forest
31 |
Each claim is described by a feature set and goes by a certain path in the decision tree
Each node of the tree is a split based on a particular feature
Each branch coming from this node has a feature contribution measured by the average of
the target in the corresponding branch
The predicted value is the sum of feature contributions cumulated in that path
The importance of a feature for a given claim is its position in the ranking of contributions
SMART DATA AND DATA INNOVATION LAB
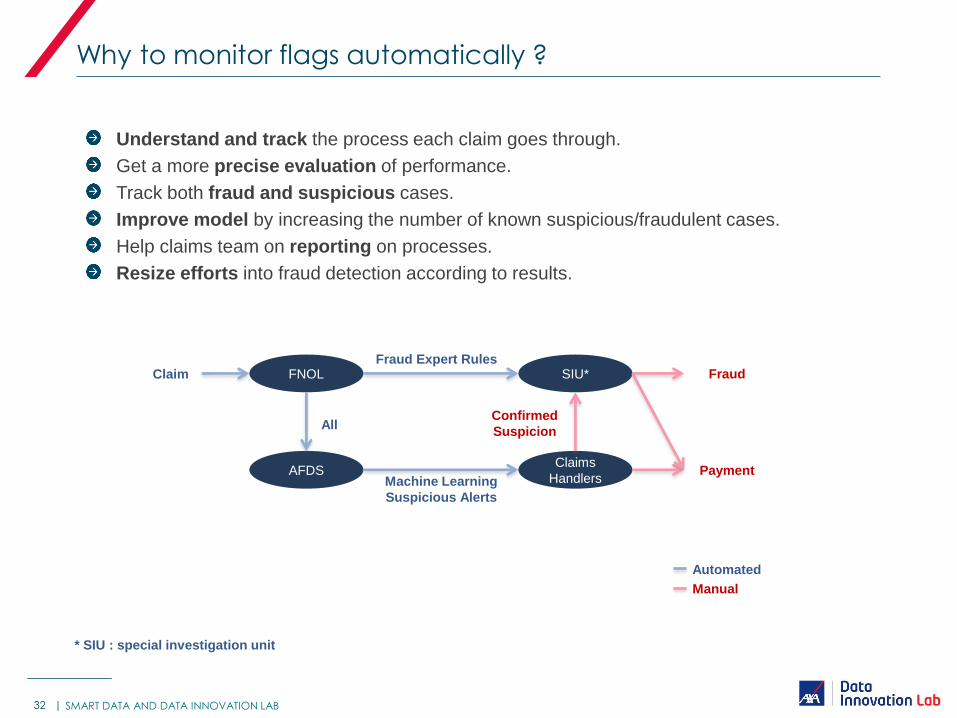
Why to monitor flags automatically ?
32 |
Understand and track the process each claim goes through.
Get a more precise evaluation of performance.
Track both fraud and suspicious cases.
Improve model by increasing the number of known suspicious/fraudulent cases.
Help claims team on reporting on processes.
Resize efforts into fraud detection according to results.
FNOL
AFDS
SIU*
Claims
Handlers
Fraud
Payment
Fraud Expert Rules Claim
Machine Learning
Suspicious Alerts
Confirmed
Suspicion All
Automated
Manual
* SIU : special investigation unit
SMART DATA AND DATA INNOVATION LAB
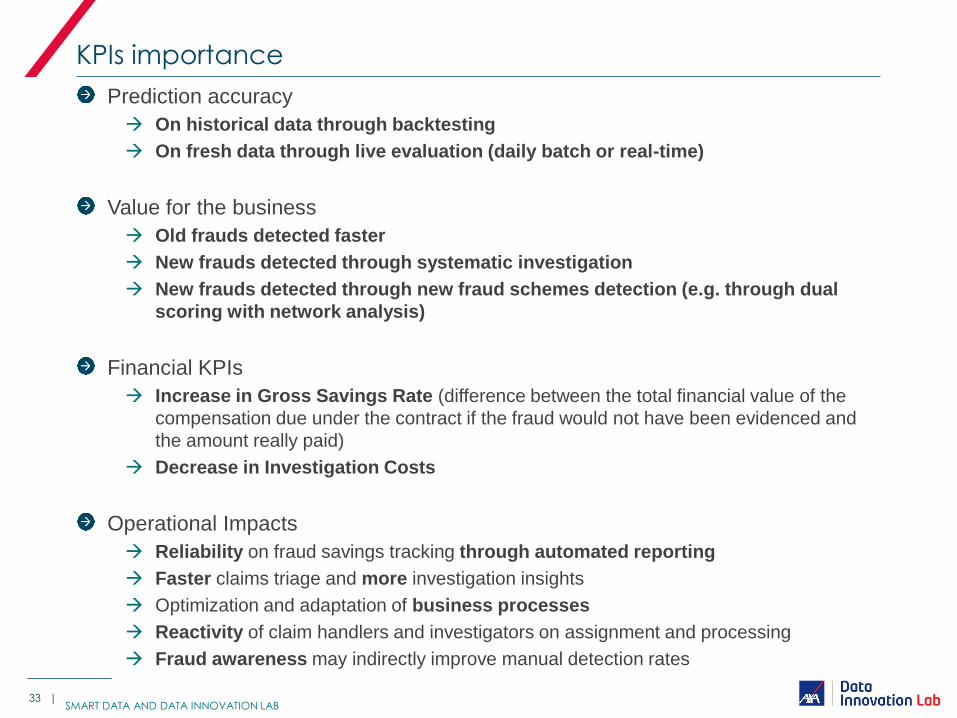
Prediction accuracy
On historical data through backtesting
On fresh data through live evaluation (daily batch or real-time)
Value for the business
Old frauds detected faster
New frauds detected through systematic investigation
New frauds detected through new fraud schemes detection (e.g. through dual
scoring with network analysis)
Financial KPIs
Increase in Gross Savings Rate (difference between the total financial value of the
compensation due under the contract if the fraud would not have been evidenced and
the amount really paid)
Decrease in Investigation Costs
Operational Impacts
Reliability on fraud savings tracking through automated reporting
Faster claims triage and more investigation insights
Optimization and adaptation of business processes
Reactivity of claim handlers and investigators on assignment and processing
Fraud awareness may indirectly improve manual detection rates
KPIs importance
33 | SMART DATA AND DATA INNOVATION LAB
34
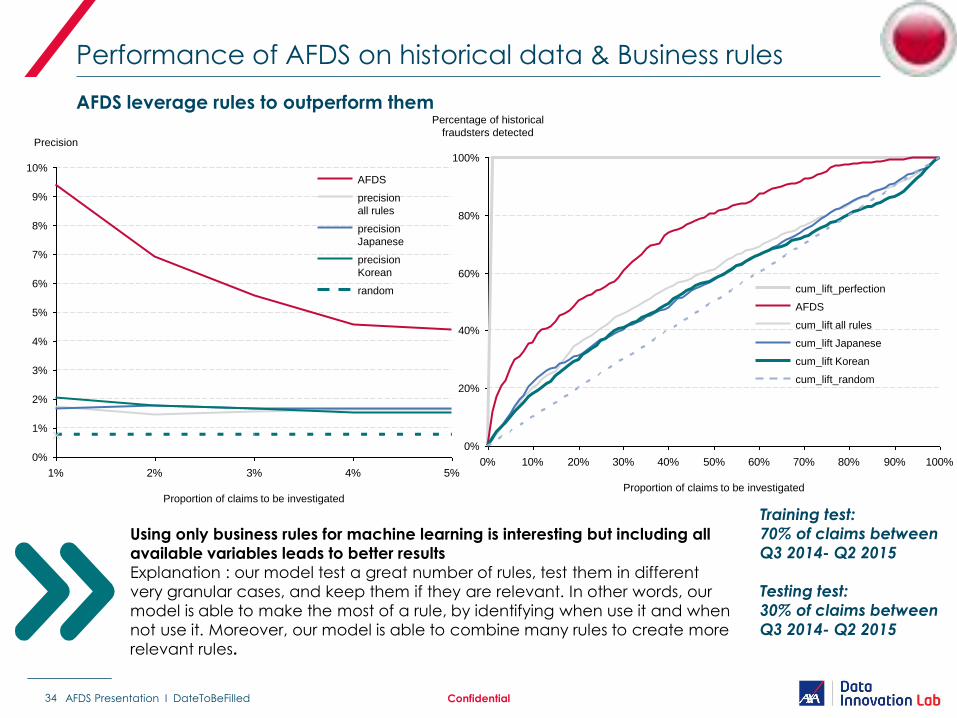
Performance of AFDS on historical data & Business rules
Training test:
70% of claims between
Q3 2014- Q2 2015
Testing test:
30% of claims between
Q3 2014- Q2 2015
AFDS leverage rules to outperform them
1% 2% 3% 4% 5%
1%
2%
0%
8%
7%
6%
4%
3%
10%
9%
5%
Precision
Proportion of claims to be investigated
0% 10% 20% 30% 40% 50% 60% 70% 80% 90% 100%
100%
80%
60%
40%
20%
0%
Percentage of historical
fraudsters detected
Proportion of claims to be investigated
random
precision
Korean
precision
Japanese
precision
all rules
AFDS
Using only business rules for machine learning is interesting but including all
available variables leads to better results
Explanation : our model test a great number of rules, test them in different
very granular cases, and keep them if they are relevant. In other words, our
model is able to make the most of a rule, by identifying when use it and when
not use it. Moreover, our model is able to combine many rules to create more
relevant rules.
cum_lift Korean
cum_lift_random
cum_lift all rules
cum_lift Japanese
AFDS
cum_lift_perfection
Confidential AFDS Presentation I DateToBeFilled
35 | SMART DATA AND DATA INNOVATION LAB
New Detection Techniques Discover New
Fraud Schemes
36 | SMART DATA AND DATA INNOVATION LAB
Conclusion
• Fraud is estimated to be a substantial source of savings
• Yet entities could improve their fraud detection rate:
• traditional methods generate too many false positives (technical challenge)
• fraud schemes are diverse and changing (organizational challenge)
• We think we can alleviate theses problems because:
• Our technical solution can be adapted by data scientists to local data environments and thus be specific enough to provide good results
• Yet our solution is generic enough to be deployed widely and help mutualize fraud experience across the group
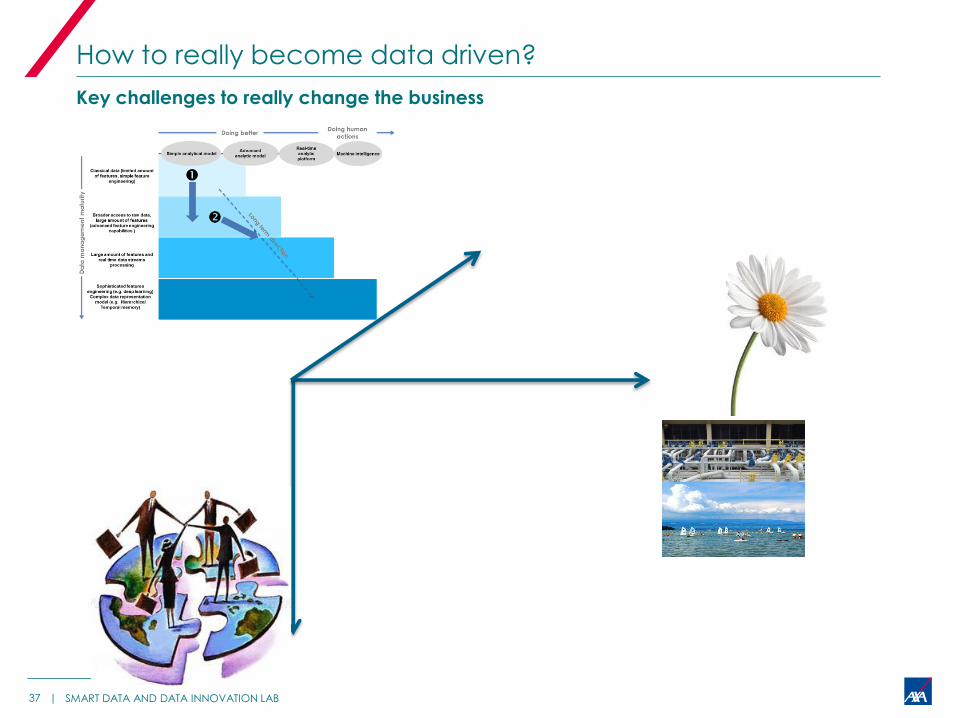
How to really become data driven?
37 | SMART DATA AND DATA INNOVATION LAB
Key challenges to really change the business