axon enterprise, inc. notice of annual meeting of … · shareholders will vote on the following...
TRANSCRIPT


AXON ENTERPRISE, INC.17800 North 85th Street
Scottsdale, Arizona 85255
NOTICE OF ANNUAL MEETING OF SHAREHOLDERSMay 31, 2019
To Our Shareholders:
The 2019 Annual Meeting of Shareholders (the “Annual Meeting”) of Axon Enterprise, Inc. (the “Company” or “Axon”) will be held at 10:00 a.m. (local time) on Friday, May 31, 2019, at the Company's headquarters located at 17800 North 85th Street, Scottsdale, AZ 85255 for the following purposes:
1. Electing the two Class A directors of the Company named in this proxy statement for a term of three years, and until their successors are elected and qualified;
2. Advisory vote to approve the compensation of the Company's named executive officers;
3. Ratifying the appointment of Grant Thornton LLP as the Company’s independent registered public accounting firm for fiscal year 2019;
4. To approve an amendment to the Company's Certificate of Incorporation to declassify the Board of Directors;
5. Shareholder proposal that the Board of Directors take the necessary steps to remove the super-majority vote requirement to approve amendments to the Company's Charter and Bylaws, and to replace with a simple majority vote requirement; and
6. Transacting such other business as may properly come before the Annual Meeting or any continuation, postponement or adjournment thereof.
Only holders of the Company’s common stock at the close of business on April 10, 2019 are entitled to notice of, and to vote at, the Annual Meeting and any adjournments or postponements thereof. Shareholders may vote in person or by proxy. A list of shareholders entitled to vote at the Annual Meeting will be available for examination by shareholders at the time and place of the Annual Meeting and during ordinary business hours, for a period of ten days prior to the Annual Meeting, at the principal executive offices of the Company at the address listed above.
Your vote is very important. Whether or not you plan to attend the Annual Meeting, we encourage you to read the proxy statement and vote as soon as possible. For specific instruction on how to vote your shares, please refer to the section entitled “General Information about the Annual Meeting of Shareholders” and the instructions on your proxy card or the voting instruction card you receive from your broker, bank or other intermediary. Please note that if you hold shares in different accounts, it is important that you vote the shares represented by each account.

By Order of the Board of Directors,
/s/ DOUGLAS E. KLINTDouglas E. KlintCorporate Secretary
Scottsdale, ArizonaApril 16, 2019
YOUR VOTE IS IMPORTANT. WHETHER OR NOT YOU EXPECT TO ATTEND THE ANNUAL MEETING IN PERSON, PLEASE VOTE ON THE INTERNET, BY TELEPHONE, OR MARK, SIGN, DATE AND PROMPTLY RETURN YOUR PROXY OR VOTING INSTRUCTION CARD IN THE ENCLOSED ENVELOPE.

TABLE OF CONTENTS
General Information About the MeetingGovernance
The Board of DirectorsBoard and Committee GovernanceDirector CompensationCertain Relationships and Related Transactions
Share OwnershipOwnership of Equity Securities of the CompanySection 16(a) Beneficial Ownership Reporting Compliance
Executive CompensationExecutive OfficersCompensation Discussion and AnalysisSummary Compensation TablePay Ratio of Chief Executive Officer Compensation to Median Employee Compensation2018 Grants of Plan-Based Awards
Audit MattersReport of the Audit Committee
ProposalsProposal No. 1 - Election of DirectorsProposal No. 2 - Advisory Approval of the Company's Executive CompensationProposal No. 3 - Ratification of Appointment of Independent Registered Public Accounting FirmProposal No. 4 - Amendment of Company's Certificate of Incorporation to Declassify our Board of DirectorsProposal No. 5 - Shareholder Proposal
Other MattersAnnex A - Marked Copy of Form of Amended and Restated Certificate of Incorporation
166
11151618181919192133343540404242444648
5052
A - 1

Axon Enterprise, Inc. | 2019 Proxy Statement | 1
AXON ENTERPRISE, INC.17800 North 85th Street
Scottsdale, Arizona 85255
PROXY STATEMENT FOR 2019 ANNUAL MEETING OF SHAREHOLDERS
GENERAL INFORMATION ABOUT THE ANNUAL MEETING AND VOTING
Why am I receiving these proxy materials?
Our Board of Directors (the “Board” or “Board of Directors”) has made these materials available to you on the Internet or has delivered printed versions of these materials to you by mail in connection with the Board of Directors’ solicitation of proxies for use at the Annual Meeting, which will take place at 10:00 a.m. local time on Friday, May 31, 2019 at the Company's headquarters located at 17800 North 85th Street, Scottsdale, AZ 85255. This proxy statement describes matters on which you, as a shareholder, are entitled to vote. It also gives you information on these matters so that you can make an informed decision. This proxy statement is first being made available or sent to shareholders on or about April 16, 2019.
What is included in these materials?
These materials include:
• This proxy statement for the Annual Meeting; and• The Company’s Annual Report on Form 10-K for the year ended December 31, 2018 (the “Annual Report”).
If you received printed versions of these materials by mail, these materials also include the proxy card or vote instruction form for the Annual Meeting.
Why did I receive a one-page notice in the mail regarding the Internet availability of proxy materials instead of printed proxy materials?
In accordance with the rules of the Securities and Exchange Commission (“SEC”), instead of mailing a printed copy of our proxy materials to all of our shareholders, we have elected to furnish such materials to shareholders by providing access to these documents over the Internet. Accordingly, on April 16, 2019 we sent a Notice of Internet Availability of Proxy Materials (the “Notice”) to shareholders of record and beneficial owners. Shareholders have the ability to access the proxy materials on a website referred to in the Notice or request to receive a printed or electronic set of the proxy materials by following the directions found in the Notice. The Company encourages you to take advantage of the availability of the proxy materials on the Internet in order to help reduce the cost and environmental impact of the Annual Meeting.

Axon Enterprise, Inc. | 2019 Proxy Statement | 2
How can I get electronic access to the proxy materials?
The Notice provides you with instructions regarding how to: (1) view our proxy materials for the Annual Meeting on the Internet; (2) vote your shares after you have viewed our proxy materials; (3) request a printed or electronic copy of the proxy materials; and (4) instruct us to send our future proxy materials to you electronically by mail or by email. Copies of the proxy materials are also available for viewing at the investor relations page of the Company’s website at http://investor.axon.com.
What proposals will be voted on at the Annual Meeting and how does the Board of Directors recommend I vote?
Shareholders will vote on the following items at the Annual Meeting:
Proposal Description Board Recommendation
No. 1 The election of the two Class A directors of the Company named in thisproxy statement for a term of three years, and until their successors areelected and qualified
FOR(all nominees)
No. 2 Advisory vote to approve the compensation of the Company's namedexecutive officers
FOR
No. 3 Ratification of the appointment of Grant Thornton LLP as the Company’sindependent registered public accounting firm for fiscal year 2019
FOR
No. 4 Amendment of the Company's Certificate of Incorporation to declassifythe Board of Directors
FOR
No. 5 Shareholder proposal that the Board take the necessary steps to removethe super-majority vote requirement to approve amendments to theCompany's charter and bylaws, and to replace with a simple majority voterequirement
NORECOMMENDATION
Shareholders will also vote on the transaction of any other business as may properly come before the Annual Meeting or any continuation, postponement or adjournment thereof. To the maximum extent allowed by the SEC’s proxy rules, the proxy holders will vote your shares in such other matters as they determine in their discretion.
Where are the Company’s principal executive offices located and what is the Company’s main telephone number?
The Company’s principal executive offices are located at 17800 North 85th Street, Scottsdale, Arizona 85255. The Company’s main telephone number is (800) 978-2737.
Who may vote at the Annual Meeting?
As of April 10, 2019 (the “Record Date”), there were 59,116,783 shares of the Company’s common stock outstanding. Each share of common stock entitles the holder to one vote on each matter that may properly come before the Annual Meeting. The holders of a majority of the voting power of all shares entitled to vote, present in person or represented by proxy, will constitute a quorum for the transaction of business at the Annual Meeting. Shareholders are not entitled to cumulative voting in the election of directors. Only shareholders as of the close of business on the Record Date are entitled to receive notice of, to attend, and to vote at the Annual Meeting.
What is the difference between a shareholder of record and a beneficial owner of shares held in street name?
Shareholder of Record
If your shares are registered directly in your name with the Company’s transfer agent, Broadridge Corporate Issuer Solutions, Inc., you are considered the shareholder of record with respect to those shares, and the Notice or printed materials were sent directly to you by the Company. If you request printed copies of the proxy materials by mail, you will also receive a printed proxy card.

Axon Enterprise, Inc. | 2019 Proxy Statement | 3
Beneficial Owner of Shares Held in Street Name
If your shares are held in an account at a brokerage firm, bank, broker-dealer, or other similar organization, then you are the beneficial owner of shares held in “street name,” and the Notice or the printed proxy materials were forwarded to you by that organization. The organization holding your account is considered the shareholder of record for purposes of voting at the Annual Meeting. As a beneficial owner, you have the right to direct that organization how to vote the shares held in your account. If you request printed copies of the proxy materials by mail, you will also receive a printed vote instruction form.
If I am a shareholder of record of the Company’s shares, how do I vote?
There are four ways to vote:
Via the Internet. If you received a Notice, you may vote via the Internet by visiting http://www.proxyvote.com and entering the control number found in the Notice.
By telephone. If you received or requested printed copies of the proxy materials by mail, you may vote by calling the toll free number found on the proxy card.
By mail. If you received or requested printed copies of the proxy materials by mail, you may vote by filling out the proxy card and returning it in the envelope provided.
In person. You may vote in person at the Annual Meeting. Bring your printed proxy card if you received one by mail. Otherwise, the Company will provide shareholders of record a ballot at the Annual Meeting.
If I am a beneficial owner of shares held in street name, how do I vote?
Your bank or broker will send you instructions on how to vote. There are four ways to vote:
Via the Internet. If you received a Notice, you may vote via the Internet by visiting http.//www.proxyvote.com and entering the control number found in the Notice.
By telephone. If you received or requested printed copies of the proxy materials by mail, you may vote by calling the toll free number found on the vote instruction form.
By mail. If you received or requested printed copies of the proxy materials by mail, you may vote by filling out the vote instruction form and returning it in the envelope provided.
In person. If you wish to vote in person at the Annual Meeting, you must obtain a legal proxy from the organization that holds your shares.
What constitutes a quorum in order to hold and transact business at the Annual Meeting?
Under Delaware law and the Company’s bylaws, the holders of a majority of the voting power of all shares entitled to vote, present in person or represented by proxy, at a meeting constitutes a quorum. Abstentions and broker non-votes will be counted as present to determine whether a quorum has been established. Once a share of the Company’s common stock is represented for any purpose at a meeting, it is deemed present for quorum purposes for the remainder of the meeting and any adjournments or postponements. If a quorum is not present, the Annual Meeting may be adjourned until a quorum is obtained.
How are proxies voted?
All valid proxies received prior to the Annual Meeting will be voted. All shares represented by a proxy will be voted and, where a shareholder specifies by means of the proxy a choice with respect to any matter to be acted upon, the shares will be voted in accordance with the shareholder’s instructions.

Axon Enterprise, Inc. | 2019 Proxy Statement | 4
What happens if I do not give specific voting instructions?
Shareholder of Record If you are a shareholder of record and you indicate when voting on the Internet or by telephone that you wish to vote as recommended by the Board, or sign and return a proxy card without giving specific voting instructions, then the proxy holders will vote your shares in the manner recommended by the Board on all matters presented in this proxy statement and as the proxy holders may determine in their discretion with respect to any other matters properly presented for a vote at the Annual Meeting.
Beneficial Owner of Shares Held in Street Name If you are a beneficial owner of shares held in street name and do not provide the organization that holds your shares with specific voting instructions, the organization that holds your shares may vote on routine matters but cannot vote on non-routine matters. If the organization that holds your shares does not receive instructions from you on how to vote your shares on a non-routine matter, the organization that holds your shares will inform the inspector of election that it does not have the authority to vote on such matters with respect to your shares. This is generally referred to as a “broker non-vote.”
Which ballot measures are considered “routine” or “non-routine”?
Proposal No. 3 (ratification of the appointment of the independent registered public accountants) is considered “routine.” A broker or other nominee may generally vote on routine matters, and therefore no broker non-votes are expected in connection with this proposal.
Proposals No. 1, No. 2, No. 4, and No. 5 (election of directors, advisory vote to approve the compensation of the Company's named executive officers, approval of an amendment to the Company's Certificate of Incorporation to declassify the Board of Directors, and the shareholder proposal to remove the super-majority voting requirement and to replace with a simple majority-vote requirement) are considered “non-routine.” A broker or other nominee cannot vote without specific instructions from the beneficial owner on non-routine matters, and therefore we anticipate there will be broker non-votes in connection with Proposals No. 1, No. 2, No. 4 and No. 5.
Can I change my vote after I have voted?
You may revoke your proxy and change your vote at any time before the final vote at the Annual Meeting by voting again via the Internet or by telephone (only your latest Internet or telephone proxy submitted prior to the Annual Meeting will be counted), by signing and returning a new proxy card or voting instruction form with a later date, or by attending the Annual Meeting and voting in person. However, your attendance at the Annual Meeting will not automatically revoke your proxy unless you vote again at the Annual Meeting or specifically request that your prior proxy be revoked by delivering to the Company’s Corporate Secretary at 17800 North 85th Street, Scottsdale, Arizona 85255, a written notice of revocation prior to the Annual Meeting.
Is my vote confidential?
Proxy instructions, ballots and voting tabulations that identify individual shareholders are handled in a manner that protects your voting privacy. Your vote will not be disclosed either within the Company or to third parties, except as necessary to meet applicable legal requirements; to allow for the tabulation and certification of votes; and to facilitate a successful proxy solicitation.
What is the voting requirement to approve each of the proposals?
Election of Directors
For Proposal No. 1, under our bylaws, assuming the existence of a quorum at the Annual Meeting, the two nominees for director who receive the affirmative vote of a plurality of all of the votes cast will be elected to the Board of Directors. This means that the two director nominees with the most votes will be elected. Votes to withhold will be counted toward a quorum, but will not affect the outcome of the vote on the election of directors. Broker non-votes will have no effect on the outcome of this proposal if a quorum is present.

Axon Enterprise, Inc. | 2019 Proxy Statement | 5
Advisory Vote to Approve the Compensation of the Company's Named Executive Officers (“Say-on-Pay”)
For Proposal No. 2, assuming the existence of a quorum at the Annual Meeting, the affirmative vote of a majority of the total votes of shares of common stock properly cast for or against the proposal in person or by proxy at the Annual Meeting is required for ratification. Broker non-votes and abstentions will have no impact on the outcome of this proposal if a quorum is present.
Ratification of Independent Registered Public Accountants
For Proposal No. 3, assuming the existence of a quorum at the Annual Meeting, the affirmative vote of a majority of the total votes of shares of common stock properly cast for or against the proposal in person or by proxy at the Annual Meeting is required for ratification. Broker non-votes and abstentions will have no impact on the outcome of this proposal if a quorum is present.
Amendment of the Company's Certificate of Incorporation to Declassify the Board of Directors
For Proposal No. 4, the affirmative vote of the holders of 75% of the outstanding shares of our common stock is necessary to adopt the proposed amendment to our certificate of incorporation. Unless otherwise instructed, proxy holders will vote the proxies received by them for this proposal. Broker non-votes and abstentions will have the effect of a vote against this proposal.
Shareholder Proposal - Remove Super-Majority Voting Requirement
For Proposal No. 5, assuming the existence of a quorum at the Annual Meeting, the affirmative vote of a majority of the total votes of shares of common stock properly cast for or against the proposal in person or by proxy at the Annual Meeting is required for approval. Broker non-votes and abstentions will have no impact on the outcome of this proposal if a quorum is present.
Who will serve as the inspector of election?
A member of the Company’s internal legal department will serve as the inspector of election.
Where can I find the voting results of the Annual Meeting?
The final voting results will be tallied by the inspector of election and, within four business days after the Annual Meeting, the Company expects to report the final results on Form 8-K with the SEC.
Who is paying for the cost of this proxy solicitation?
The Company will bear the cost of solicitation of proxies for the Annual Meeting. We are soliciting your proxy on behalf of our Board. In addition to the use of mail, proxies may be solicited by personal interview, telephone, facsimile, electronically, including e-mail, or otherwise, by our officers, directors and other employees. They will not receive any additional compensation for these activities. We also will request persons, firms and corporations holding shares in their names, or in the names of their nominees, that are beneficially owned by others to send or cause to be sent proxy materials to, and obtain proxies from, such beneficial owners and will reimburse such holders for their reasonable expenses in so doing.

Axon Enterprise, Inc. | 2019 Proxy Statement | 6
GOVERNANCE
THE BOARD OF DIRECTORS
Director Nominations
The Nominating and Corporate Governance Committee (the “NCG Committee”) is responsible for identifying and evaluating nominees for director and for recommending to the Board a slate of nominees for election at each annual meeting of shareholders. Nominees may be suggested by directors, members of management, shareholders, or, in some cases, by a third-party firm.
Shareholders who wish the NCG Committee to consider their recommendations for nominees for the position of director should submit their recommendations in writing by mail to the Nominating and Corporate Governance Committee, c/o Axon Enterprise, Inc., 17800 North 85th Street, Scottsdale, AZ 85255. Recommendations by shareholders that are made in accordance with these procedures will receive the same consideration by the NCG Committee as other suggested nominees.
Qualifications for All Directors
In its assessment of each potential candidate, including those recommended by shareholders, the NCG Committee considers the potential nominee’s demonstrated character, judgment, relevant business, functional and industry experience, and whether they possess a high degree of business, technological, medical or law enforcement acumen, independence, and other such factors the NCG Committee determines are pertinent in light of the current needs of the Board. The NCG Committee also takes into account the ability of a potential nominee to devote the time and effort necessary to fulfill his or her responsibilities to the Board of Directors. While the NCG Committee does not have a formal diversity policy, it strives to achieve a well-rounded balance of varying skill sets and backgrounds in the composition of the Board.
The NCG Committee’s process for identifying and evaluating nominees typically involves a series of internal discussions, review of information concerning candidates and interviews with selected candidates. The Company has not historically paid third parties to identify or assist in identifying or evaluating potential nominees but reserves the right to do so in the future.

Axon Enterprise, Inc. | 2019 Proxy Statement | 7
Specific Qualifications, Attributes, Skills and Experience to be Represented on the Board
The Board has identified particular qualifications, attributes, skills and experience that it believes are important to be represented on the Board as a whole in order to advise and contribute to the execution of the Company’s strategic objectives. Each Board member was selected in accordance with the process for the selection and nomination of directors described above. Accordingly, the Board believes that each of the Company’s Board members brings a myriad of attributes that combined benefit the Company and its shareholders. The following table summarizes certain key characteristics of the Company’s business and the associated attributes that have been identified as important to be represented on the Board.
Business Characteristics Qualifications, Attributes, Skills & Experience
The Company’s business is multifaceted and involves complexfinancial transactions.
• High level of financial literacy• Relevant CEO, CFO, or treasury experience• Certified Public Accountant, Certified Financial Analyst
The Company’s business requires compliance with a variety ofregulatory requirements across a number of countries andrelationships with various entities and non-governmentalorganizations.
• Governmental, legal or political experience
The Company’s TASER product lines utilize Neuro-MuscularIncapacitation from electrical currents as the method to disable aresisting suspect, which inherently involves medical and scientifictesting.
• Medical and/or scientific experience
The Company’s primary markets are law enforcement, militaryand corrections agencies.
• Law enforcement experience• Military experience
The Company’s business is expanding into the innovative field ofcloud computing and wearable technology which involvesdifferent point of views and perspectives from its traditionalTASER background.
• Emerging technologies experience
The Board’s responsibilities include understanding and overseeingthe various risks facing the Company and ensuring that appropriatepolicies and procedures are in place to effectively manage risk.
• Risk oversight• Management expertise
Director Nominees in 2019
Michael Garnreiter, ChairmanDirector since 2006Class AAge: 67Board Committees: Audit Committee (Chairman), Compensation Committee, NCG Committee, Litigation CommitteeOther Public Company Boards: Knight-Swift Transportation Holdings, Amtech Systems
Mr. Garnreiter most recently served as Vice President of Finance and Treasurer of Shamrock Foods, a privately-held manufacturer and distributor of foods and food-related products. He retired from this position in December 2015. From January 2010 until August 2012, Mr. Garnreiter was a managing director of Fenix Financial Forensics, a Phoenix-based litigation and financial consulting firm. From April 2002 through June 2006, Mr. Garnreiter was Executive Vice President, Treasurer, and Chief Financial Officer of the Main Street Restaurant Group. Mr. Garnreiter previously served with the international accounting firm, Arthur Andersen, from 1974 through March 2002 with increasing levels of responsibility, culminating as a partner. Mr. Garnreiter holds a B.S. degree in accounting from California State University at Long Beach and is a Certified Public Accountant.

Axon Enterprise, Inc. | 2019 Proxy Statement | 8
Specific Qualifications, Attributes, Skills and Experience:
High Level of Financial Literacy
Certified Public Accountant and former partner at Arthur Andersen. Served on the audit committee for each board he has served in the past.
Risk Oversight & Management Board Experience for Knight-Swift Transportation Holdings, Amtech Systems, IA Global Inc., and Fenix Financial Forensics gives ample experience relating to public company corporate governance matters.
Hadi PartoviDirector since 2010Class AAge: 46Board Committees: Compensation Committee (Chairman), NCG Committee, Merger and Acquisition Committee, Technology CommitteeOther Public Company Boards: None
Mr. Partovi is the CEO and co-founder of the non-profit education organization Code.org, and serves as a Director on the board of Convoy. Mr.Partovi is a past or present strategic advisor or early investor at numerous technology companies, including Facebook, Dropbox, Uber, airbnb, SpaceX, and Zappos. From 2009 through 2010, Mr.Partovi was Senior Vice President of Technology for MySpace (via acquisition) and from 2006 through 2009 he was President and Co-Founder of ILIKE, Inc. which was acquired by MySpace in 2009. From 2002 through 2005, Mr.Partovi was General Manager, Microsoft MSN Entertainment and MSN.com and from 1999 through 2001, he was Co-Founder and VP of Product and Professional Services for TELLME Networks, Inc. From 1994 through 1999, he was Program Manager for Microsoft Internet Explorer.Mr.Partovi holds B.A. and M.S. degrees in Computer Science, summa cum laude, from Harvard University.
Specific Qualifications, Attributes, Skills and Experience:
Technology Expertise Experience as an investor in technology companies provides Mr. Partovi with invaluable insight into software and Internet-related business development initiatives.
Risk Oversight & Management Experience as an advisor to multiple start-up companies provides Mr. Partovi experience in the unique challenges facing companies pursuing new technology.
Incumbent Directors in 2019
Vice Admiral (Retired) Richard H. Carmona M.D., M.P.H., F.A.C.S.Director since 2007Class CAge: 69Board Committees: NCG Committee (Chairman), Litigation Committee, Scientific and Medical CommitteeOther Public Company Boards: The Clorox Company, The Herbalife Company
Dr. Carmona was sworn in as the 17th Surgeon General of the United States on August 5, 2002 and served the statutory four year term. Prior to being named United States Surgeon General, Dr. Carmona was the chairman of the State of Arizona Southern Regional Emergency Medical System, a professor of surgery, public health and family and community medicine at the University of Arizona, and the Pima County Sheriff's Department surgeon and deputy sheriff. He is currently employed as Chief of Health Innovation of Canyon Ranch Health in Tucson, Arizona and has held that position since October 1, 2006. Dr. Carmona attended Bronx Community College of the City University of New York where he earned his associate of arts degree. Dr. Carmona holds a B.S. degree and medical degree from the University of California, San Francisco. He has also earned a Master’s Degree in Public Health from the University of Arizona.

Axon Enterprise, Inc. | 2019 Proxy Statement | 9
Specific Qualifications, Attributes, Skills and Experience:
High Level of Financial Literacy
As Chief of Heath Innovation at Canyon Ranch, CEO of Canyon Ranch Health, and as a member of other public company boards, Dr. Carmona is able to contribute to the oversight of the Company's financial matters.
Risk Oversight & Management Service on the Clorox Company and the Herbalife Company boards of directors provides valuable insight into public company corporate governance matters.
Relevant Political Background Service as the former Surgeon General of the U.S. provides a unique insight into political matters.
Medical and ScientificExpertise
As the Surgeon General of the U.S. as well as Dr. Carmona's extensive career in emergency medical services, provides him a deep understanding of health, safety and medicine.
Law Enforcement/Military Experience
Dr. Carmona is a combat decorated and disabled U.S. Army Special Forces Veteran and a highly decorated police officer, giving him unusual insight into our diverse customer base.
Julie CullivanDirector since 2017Class CAge: 53Board Committees: Audit Committee, Information Security Committee (Chairman)Other Public Company Boards: None.
Ms. Cullivan is the SVP, Business Operations and CIO at ForeScout Technologies, Inc., a leading Internet of Things (IoT) security company, where she is responsible for leading the cross functional initiatives and information security strategy to support the fast-growing company. Formerly EVP, Business Operations and CIO at FireEye, Inc., Ms. Cullivan was a member of the executive team that set the company’s strategy. With responsibility for both Business Operations and Information Technology, Ms. Cullivan helped scale FireEye from a private company, through its successful IPO, to a global publicly traded company.
Specific Qualifications, Attributes, Skills and Experience:
Technology Expertise Ms. Cullivan is a recognized leader in the cyber security field and a sought-after speaker on topics including women in security, security as a boardroom imperative, innovation and building high impact teams.
Risk Oversight & Management Experience as SVP, Business Operations and CIO where Ms. Cullivan leads cross functional initiatives and information security strategy in a high-growth environment.
Mark Kroll, Ph.D. Director since 2003Class BAge: 66Board Committees: Litigation Committee (Chairman), Scientific and Medical Committee (Chairman)Other Public Company Boards: Haemonetics Corporation
Dr. Kroll retired in July 2005 from St. Jude Medical, Inc., where he held various executive level positions since 1995, most recently as Senior Vice President and Chief Technology Officer, Cardiac Rhythm Management Division. Dr. Kroll holds a B.S. degree in Mathematics and a M.S. degree and a Ph.D. degree from the Electrical Engineering department of the University of Minnesota and an M.B.A. degree from the University of St. Thomas. Dr. Kroll is also the named

Axon Enterprise, Inc. | 2019 Proxy Statement | 10
inventor of over 350 issued U.S. patents and is a Fellow of the: American College of Cardiology, Heart Rhythm Society, Institute of Electronics and Electrical Engineering ("IEEE"), and the American Institute for Medicine and Biology in Engineering ("AIMBE").
Specific Qualifications, Attributes, Skills and Experience:
Technology Expertise Advanced mathematical and scientific education and technology and scientificaccomplishments as recognized by “Fellow” designations from IEEE andAIMBE provide a strong scientific background that is beneficial to theCompany.
Medical and ScientificExpertise
Scientific accomplishments as recognized by “Fellow” designations from theAmerican College of Cardiology and the Heart Rhythm Society provideinvaluable skills and experience to the TASER business.
Risk Oversight & Management Service on Haemonetic Corporation’s board of directors as well as leadershippositions at St. Jude’s Medical, Inc. provides beneficial experience inmanagement and oversight.
Matthew R. McBrady, Ph.D Director since 2016Class BAge: 48Board Committees: Audit Committee. Compensation Committee, Merger and Acquisition Committee (Chairman)Other Public Company Boards: None
From August 1998 through January 2000, Dr. McBrady served as an international economist with President Clinton’s Council of Economic Advisers and the U.S. Treasury Department. Dr. McBrady subsequently served as a professor of finance at the Wharton School of Business at the University of Pennsylvania (from September 2002 through May 2003) and at the Darden Graduate School of Business Administration at the University of Virginia (from May 2003 through December 2006). Dr. McBrady then worked as an investment professional within the North American Private Equity group at Bain Capital, LLC (from January 2007 through January 2009). Dr. McBrady then joined Silver Creek Capital Management, LLC as Managing Director and Head of Investment Strategy and Risk Management (from January 2009 through January 2014) prior to joining BlackRock, Inc. where he served as Managing Director and Chief Investment Officer of Multi-Strategy Hedge Funds from January 2014 through September 2016. Dr. McBrady holds a B.A. degree in Economics from Harvard University, a M.S. degree in International Economics from Oxford University (U.K.), and a Masters and Ph.D. degree in Business Economics from Harvard University. Dr. McBrady previously served as a director for the Company from January 2001 through June 2014.
Specific Qualifications, Attributes, Skills and Experience:
High Level of Financial Literacy
Service as a member of President Clinton’s Council of Economic Advisory and teaching positions at the Harvard Business School, the Wharton School of Business and the Darden Graduate School of Business Administration providing Dr. McBrady valuable financial knowledge and context. Service as Chief Investment Officer for BlackRock and investment strategy and management positions for other investment management firms.
Relevant Political Background Service as a member of President Clinton’s Council of Economic Advisors giving him insight into government processes.

Axon Enterprise, Inc. | 2019 Proxy Statement | 11
Patrick W. Smith, Chief Executive Officer Director since 1993Class BAge: 48Other Public Company Boards: None
Mr. Smith has served as Chief Executive Officer (“CEO”) and as a director of the Company since 1993. He is also co-founder of the Company. After graduating from Harvard, cum laude, in just three years (class of 1991), Mr. Smith entered directly into the Master of Business Administration program at the University of Chicago. In two years, he completed both a master’s degree in international finance from the University of Leuven in Leuven, Belgium and an M.B.A. degree with honors at the University of Chicago, graduating in the top 5% of his class. After completing graduate school in the summer of 1993, he co-founded Axon Enterprise, Inc. (F.K.A. TASER International, Inc.) in September 1993 with his brother, Thomas P. Smith.
Among other qualifications, Mr. Smith is the founder and visionary of the Company and brings to the Board extensive executive leadership experience in the technology industry, including the management of worldwide operations, sales, service, and support as well as technology innovation as he currently holds 30 patents.
Bret Taylor Director since 2014Class CAge: 39Board Committees: Merger and Acquisition Committee, Technology Committee (Chairman)Other Public Company Boards: Twitter, Inc.
Bret Taylor served as Group Product Manager at Google until June 2007, where he co-created Google Maps and the Google Maps API. He then joined venture capital firm Benchmark Capital as an entrepreneur-in-residence where he founded the social network FriendFeed, Inc. with former Google employee, Jim Norris. Mr. Taylor was the CEO of FriendFeed until August 2009, when Facebook acquired the company, and he was named Chief Technology Officer ("CTO") of Facebook. He was the CTO of Facebook until the summer of 2012, and supervised some of Facebook's then newest and most important products, including the creation of the Open Graph, the App Center, and its integration with the Apple App Store. Mr. Taylor was the CEO and co-founder of Quip, Inc. (“Quip”). Quip was acquired by Salesforce.com, Inc. in August 2016, and Mr. Taylor now serves as President and Chief Product Officer of Salesforce.com. Mr. Taylor attended Stanford University, where he earned his bachelor's degree and a master's degree in computer science.
Specific Qualifications, Attributes, Skills and Experience:
Technology Expertise Executive experience in established technology organizations such as Google, Facebook and Salesforce.com, as well as experiences founding new technology companies, through FriendFeed and Quip, provides Mr. Taylor insight into software and Internet-related business development initiatives.
Risk Oversight & Management Experience as President and Chief Product Officer of Salesforce.com provides Mr. Taylor experience in the unique challenges facing growing technology companies. Service on the Twitter, Inc. Board of Directors provides valuable insight into public company corporate governance matters.
BOARD AND COMMITTEE GOVERNANCE
Role of the Board of Directors
The principal duties of the Board of Directors is to oversee management and evaluate strategy. The fundamental responsibility of the directors is to exercise their business judgment to act in what they reasonably believe to be the

Axon Enterprise, Inc. | 2019 Proxy Statement | 12
best interest of the Company. and its shareholders. Our governance structure is designed to foster disciplined actions, effective decision-making, and appropriate monitoring of both compliance and performance.
Axon’s key governance documents, including our Corporate Governance Guidelines, are available at http://investor.axon.com/governance/documents-and-charters.
Board Leadership Structure
The Company’s governance documents provide the Board with flexibility to select the appropriate leadership structure for the Company. In making leadership structure determinations, the Board considers many factors, including the specific needs of the business and what is in the best interests of the Company’s shareholders. The current leadership structure is anchored by a non-management director as Chairman of the Board. The Board believes this structure provides a very well-functioning and effective balance between strong Company leadership and appropriate safeguards and oversight by independent directors.
• Chairman of the Board: Michael Garnreiter
• Chief Executive Officer: Patrick W. Smith
The principal role of the Chairman of the Board is to manage and to provide leadership to the Board of Directors of the Company. The Chairman is accountable to the Board and acts as a direct liaison between the Board and the management of the Company, through the CEO. The Chairman acts as the communicator for Board decisions where appropriate. The separation of the role of the Chairman from that of the CEO is based on the Board's view that the Chairman should be free from any interest and any business or other relationship that could interfere with the Chairman’s judgment, other than interests resulting from Company shareholdings and remuneration.
The Board conducts an annual evaluation of the performance of the Board and each of its standing committees, including peer assessments of each individual director.
Meetings of the Board of Directors
During the year ended December 31, 2018, the Board held seven meetings. During 2018, each director, with the exception of Bret Taylor, attended at least 75% of all regular Board and applicable committee meetings.
Committees of the Board of Directors
The following table summarizes the current membership of our standing non-management Board committees, and identifies the chairman of each committee and the number of committee meetings held in fiscal 2018:
AuditCommittee
CompensationCommittee
NCGCommittee
LitigationCommittee
Merger andAcquisitionCommittee
Scientificand
MedicalCommittee
TechnologyCommittee
InformationSecurity
Committee# Meetings 5 9 2 1 1 2 — —
DirectorRichard Carmona * X XJulie Cullivan X *Michael Garnreiter * X X XMark Kroll * *Matthew McBrady X X *Hadi Partovi * X X XBret Taylor X *
X = Member * = Chairman

Axon Enterprise, Inc. | 2019 Proxy Statement | 13
The Audit Committee, established in accordance with Section 3(a)(58)(A) of the Securities Exchange Act of 1934, as amended (the “Exchange Act”), exercises sole authority with respect to the selection of the Company’s independent registered public accounting firm and the terms of its engagement; reviews the policies and procedures of the Company and management with respect to maintaining the Company’s books and records; reviews with the independent registered public accounting firm, upon the completion of its audit, the results of the auditing engagement and any other recommendations the independent registered public accounting firm may have with respect to the Company’s financial, accounting or auditing systems; and reviews with the independent registered public accounting firm, upon the completion of its quarterly review of the Company’s financial statements, the results of the quarterly review and any other recommendations the independent registered public accounting firm may have in connection with such quarterly reviews. The Report of the Audit Committee for the year ended December 31, 2018 is included in this proxy statement.
The Compensation Committee determines salaries, stock and bonus awards and considers employment agreements for appointed officers of the Company, and prepares reports on these matters; considers and reviews grants of options and other equity awards under the Company’s compensations plans and administers such plans; and considers matters of director compensation, benefits and other forms of remuneration. The Compensation Committee Report for the year ended December 31, 2018 is included in this proxy statement. See “Compensation Discussion and Analysis” for more information regarding the Compensation Committee.
The NCG Committee is charged with identifying qualified candidates for nomination for election to the Board and nominating such candidates for election; and reviewing and making recommendation to the Board concerning the composition and size of the Board and its committees. The Committee also monitors the process to assess the Board’s effectiveness and is primarily responsible for oversight of corporate governance, and to develop and update our Corporate Governance Principles.
The Litigation Committee is responsible for reviewing and approving the settlement of certain litigation matters against the Company or its officers and directors to ensure the settlement is fair, reasonable and in the best interests of the Company’s shareholders. No member of the Litigation Committee was a named party in any pending litigation involving the Company.
The Merger and Acquisition Committee serves to focus on issues related to any proposed merger and acquisition activity or plans identified by the Company's management.
The Scientific and Medical Committee aims to create board linkage with the Company's Scientific and Medical Advisory Board which provides important feedback directly to the Company's management about scientific, medical and electrophysiology issues related to the Company's TASER products.
The Technology Committee was established to stay abreast of new technology and the impact of new technology on the Company's products and strategy.
The Information Security Committee was established to ensure that members of the Board of Directors actively understand information security protections and associated risks. The Information Security Committee engages in key decisions to help set the direction for the Company's information security strategy, as well as understand and prioritize information security capabilities and associated risk remediation.
The Audit Committee, Compensation Committee, the NCG Committee, and Litigation Committee have each adopted charters that govern their respective authority, responsibilities and operation. The charters of these committees are available on our website at http://investor.axon.com/governance/documents-and-charters.

Axon Enterprise, Inc. | 2019 Proxy Statement | 14
Audit Committee Financial Experts
The Board of Directors determined that Mr. Garnreiter and Dr. McBrady, independent directors of the Company, are audit committee financial experts within the meaning of that term under applicable rules promulgated by the SEC. Information about the past business and educational experience of Mr. Garnreiter and Dr. McBrady are included in this proxy statement under the heading “Governance--The Board of Directors.” The Board has also determined that each current member of the Audit Committee is financially literate and that Mr. Garnreiter and Dr. McBrady satisfy the financial sophistication requirements under the current listing standards of NASDAQ.
Director Independence
As of the date of this proxy statement, based upon the information submitted by each of its directors, the Board has made a determination that a majority of our current Board is independent as that term is defined by NASDAQ listing standards and that all of the members of our Board committees also meet any additional specific independence standards applicable to any committee on which such director serves, including the more stringent audit committee and compensation committee independence committee criteria. The Company has determined that all Board members, other than Patrick W. Smith and Dr. Mark Kroll, are independent under applicable NASDAQ and SEC rules. Each of our directors other than Mr. Smith and Dr. Kroll is also a “non-employee director” (within the meaning of Rule 16b-3 under the Exchange Act) and an “outside director” within the meaning of Section 162(m) of the Internal Revenue Code and related Treasury Regulations.
Patrick W. Smith is not independent because he is an executive officer of the Company. Dr. Mark Kroll is not independent because he provides medical advisory and consulting services to the Company (see “Certain Relationships and Related Transactions – Consulting Services”).
Board of Directors' Role in Risk Oversight
The Company’s risk management process is intended to ensure that risks are taken knowingly and purposefully. As such, the Company’s executive management keeps the Board apprised by presenting results of the process to identify, assess, prioritize and address strategic, financial, operating, business, compliance, litigation, regulatory, safety, reputational and other risks to the Company. Executive management meets with the Board on a quarterly basis to address high priority risks and on an as-needed basis to evaluate and monitor emerging risks.
Code of Ethics
The Company has adopted a Code of Ethics which is applicable to all employees, directors and consultants of the Company. A copy of the Company’s Code of Ethics is published and available on the investors portion of Company’s website at http://investor.axon.com/governance/documents-and-charters. The Company intends to disclose any future amendments or waivers to the Code of Ethics on the Company’s website within four business days following the date of such amendment or waiver, unless required by NASDAQ rules to disclose such event on Form 8-K.
Director Attendance at Annual Meetings of Shareholders
Directors are encouraged by the Company to attend each annual meeting of shareholders if their schedules permit. All of our directors attended the 2018 Annual Meeting of Shareholders.
Shareholder Communications with Directors
Shareholders may communicate with members of the Board by mail addressed to the Chairman, or any other individual member of the Board, to the full Board, or to a particular committee of the Board. In each case, such correspondence should be sent to the Company’s headquarters at 17800 North 85th Street, Scottsdale, AZ 85255. In general, any shareholder communication about bona fide issues concerning the Company delivered to the Secretary for forwarding to the Board of specified member or members will be forwarded in accordance with the shareholder's instructions.
Axon Enterprise, Inc. | 2019 Proxy Statement | 15
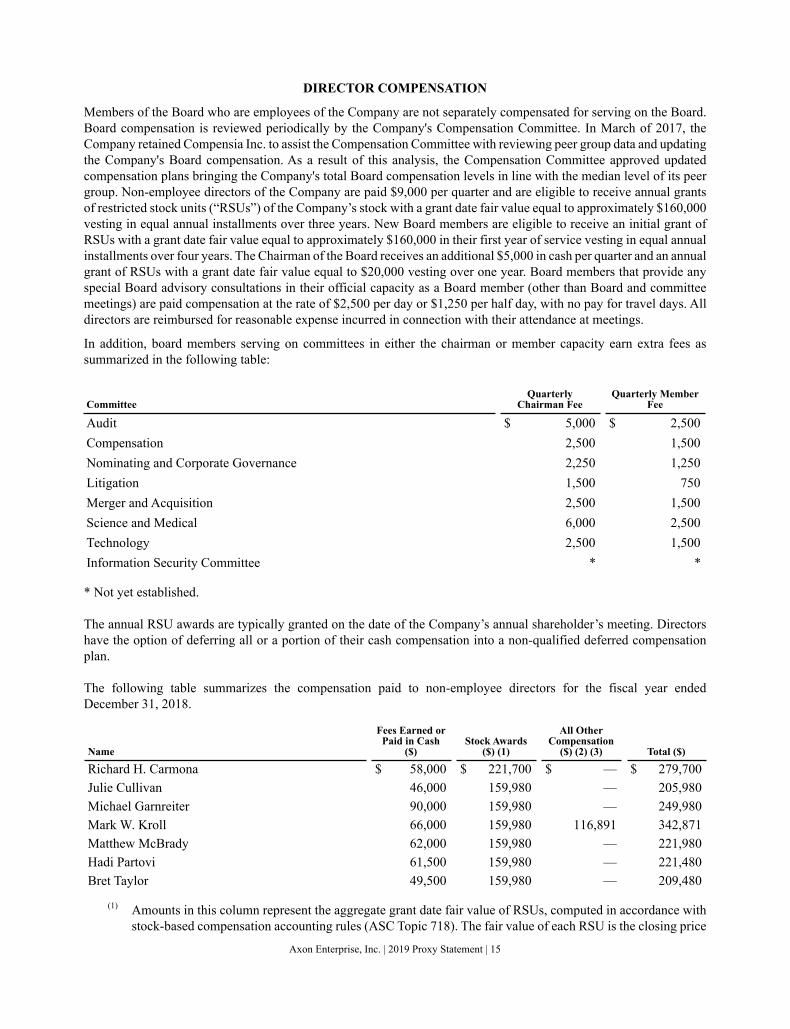
DIRECTOR COMPENSATION
Members of the Board who are employees of the Company are not separately compensated for serving on the Board. Board compensation is reviewed periodically by the Company's Compensation Committee. In March of 2017, the Company retained Compensia Inc. to assist the Compensation Committee with reviewing peer group data and updating the Company's Board compensation. As a result of this analysis, the Compensation Committee approved updated compensation plans bringing the Company's total Board compensation levels in line with the median level of its peer group. Non-employee directors of the Company are paid $9,000 per quarter and are eligible to receive annual grants of restricted stock units (“RSUs”) of the Company’s stock with a grant date fair value equal to approximately $160,000 vesting in equal annual installments over three years. New Board members are eligible to receive an initial grant of RSUs with a grant date fair value equal to approximately $160,000 in their first year of service vesting in equal annual installments over four years. The Chairman of the Board receives an additional $5,000 in cash per quarter and an annual grant of RSUs with a grant date fair value equal to $20,000 vesting over one year. Board members that provide any special Board advisory consultations in their official capacity as a Board member (other than Board and committee meetings) are paid compensation at the rate of $2,500 per day or $1,250 per half day, with no pay for travel days. All directors are reimbursed for reasonable expense incurred in connection with their attendance at meetings.
In addition, board members serving on committees in either the chairman or member capacity earn extra fees as summarized in the following table:
CommitteeQuarterly
Chairman FeeQuarterly Member
Fee
Audit $ 5,000 $ 2,500Compensation 2,500 1,500Nominating and Corporate Governance 2,250 1,250Litigation 1,500 750Merger and Acquisition 2,500 1,500Science and Medical 6,000 2,500Technology 2,500 1,500Information Security Committee * *
* Not yet established.
The annual RSU awards are typically granted on the date of the Company’s annual shareholder’s meeting. Directors have the option of deferring all or a portion of their cash compensation into a non-qualified deferred compensation plan.
The following table summarizes the compensation paid to non-employee directors for the fiscal year ended December 31, 2018.
Name
Fees Earned orPaid in Cash
($)Stock Awards
($) (1)
All OtherCompensation
($) (2) (3) Total ($)
Richard H. Carmona $ 58,000 $ 221,700 $ — $ 279,700Julie Cullivan 46,000 159,980 — 205,980Michael Garnreiter 90,000 159,980 — 249,980Mark W. Kroll 66,000 159,980 116,891 342,871Matthew McBrady 62,000 159,980 — 221,980Hadi Partovi 61,500 159,980 — 221,480Bret Taylor 49,500 159,980 — 209,480
(1) Amounts in this column represent the aggregate grant date fair value of RSUs, computed in accordance with stock-based compensation accounting rules (ASC Topic 718). The fair value of each RSU is the closing price

Axon Enterprise, Inc. | 2019 Proxy Statement | 16
of our common stock on the date of grant. Each non-employee director received an award of 2,577 RSUs on May 24, 2018. The awards vest in three equal installments on May 24, 2019, 2020 and 2021. Pursuant to SEC regulations, the amounts shown exclude the impact of estimated forfeitures related to service-based vesting conditions. The assumptions used in the calculations of the grant date fair value for stock awards are included in Note 1 to our Consolidated Financial Statements contained in our Annual Report on Form 10-K for fiscal 2018.
The following table shows equity-based awards granted in 2018, as well as the aggregate number of outstanding RSUs and options outstanding as of December 31, 2018. Prior to 2012, when the Company transitioned to the use of restricted stock units, non-employee directors received grants of options to acquire common stock under certain of the Company’s stock compensation plans.
2018 Stock-based Awards As of December 31, 2018
NameRestricted StockUnits Granted Grant Date
ApproximateGrant Date Fair
Value ($)
AggregateRestricted Stock
Units Outstanding
AggregateOptions
Outstanding
Richard H. Carmona 3,577 Various (4) $ 221,700 9,057 68,877Julie Cullivan 2,577 5/24/2018 159,980 6,779 —Michael Garnreiter 2,577 5/24/2018 159,980 8,057 —Mark W. Kroll 2,577 5/24/2018 159,980 8,057 —Matthew McBrady 2,577 5/24/2018 159,980 9,001 —Hadi Partovi 2,577 5/24/2018 159,980 8,057 —Bret Taylor 2,577 5/24/2018 159,980 8,057 —
(2) Other compensation for Dr. Kroll represents fees for consulting services provided. See “Certain Relationships and Related Transactions – Consulting Services” below.
(3) Non-employee directors have the option of participating in the non-qualified deferred compensation plan through which participants may elect to postpone the receipt and taxation of a portion of their compensation. All gains or losses are allocated fully to plan participants and the Company does not guarantee a rate of return on deferred balances. The Company does not make discretionary payments to the plan. There were no above-market returns for participants in the plan. Dr. Kroll participates in the Company's deferred compensation plan, and elected to defer $66,000 of earned compensation into the plan during the year ended December 31, 2018.
(4) On October 31, 2018, the Compensation Committee approved an additional grant of 1,000 shares to Dr. Carmona in recognition of improvements to the Company's corporate governance. The shares vest on October 31, 2019.
CERTAIN RELATIONSHIPS AND RELATED TRANSACTIONS
The Company reviews all relationships and transactions in which we and our directors, executive officers or their immediate family members are participants, to determine whether such persons have a direct or indirect material interest. Management is primarily responsible for the development and implementation of processes and controls to obtain information from the directors and executive officers with respect to related party transactions and for then determining, based on the facts and circumstances, whether the Company or a related party has a direct or indirect material interest in the transaction. As required under SEC rules, transactions that are determined to be directly or indirectly material to us or a related party are disclosed in our proxy statement. In addition, pursuant to the Audit Committee Charter, the Audit Committee, or a committee of independent directors duly appointed by the Board, reviews and approves related party transactions in accordance with NASDAQ rules. The Audit Committee is authorized to consult with independent legal counsel at the Company’s expense in determining whether to approve any such transaction.

Axon Enterprise, Inc. | 2019 Proxy Statement | 17
Consulting Services
The Company engages Dr. Mark Kroll, a member of the Board of Directors, to provide consulting services. The expenses related to these services, excluding travel related reimbursements, were approximately $0.1 million for the year ended December 31, 2018. At December 31, 2018, the Company had no accrued liabilities related to these services.
Software Services
The Company subscribes to a mobile collaboration software suite from Quip, a company that was co-founded and managed by Bret Taylor. In April 2016, Quip was acquired by Salesforce.com, and subsequent to the acquisition, the Company continued to consider Quip a related party. In November 2017, Mr. Taylor was appointed to President and Chief Product Officer of Salesforce.com. The Company now considers the consolidated Salesforce.com entity to be a related party. The cost to subscribe to various cloud-based hosting arrangements from Salesforce.com and Quip was $1.8 million for the year ended December 31, 2018, and the Company had a negligible amount of accrued liabilities as of December 31, 2018.

Axon Enterprise, Inc. | 2019 Proxy Statement | 18
SHARE OWNERSHIP
The following table sets forth information, as of March 31, 2019, with respect to beneficial ownership of the Company’s common stock by each current director or nominee for director, by each of our named executive officers (as defined by Item 402(a)(3) of Regulation S-K)(the “NEOs”), by all directors and executive officers as a group, and by each person who is known to the Company to be the beneficial owner of more than five percent of the Company’s outstanding common stock. The Company believes that, except as otherwise described below, each named beneficial owner has sole voting and investment power with respect to the shares listed. As of March 31, 2019, except as set forth below, there were no shares currently pledged by any NEO or director.
Name of Beneficial Owner (1) Shares Owned
SharesAcquirableWithin 60Days (2)
TotalBeneficialOwnership
Percent ofClass (3)
BlackRock, Inc. (4) 9,878,397 — 9,878,397 16.7%The Vanguard Group (5) 6,490,402 — 6,490,402 11.0Janus Henderson Group plc (6) 3,981,049 — 3,981,049 6.7
Patrick W. Smith 720,557 — 720,557 1.2Hadi Partovi 330,133 4,204 334,337 *Richard H. Carmona 61,590 49,271 110,861 *Mark W. Kroll 14,160 4,204 18,364 *Michael Garnreiter 25,204 4,204 29,408 *Bret S. Taylor 14,414 4,204 18,618 *Matthew R. McBrady 4,289 2,993 7,282 *Julie Cullivan — 859 859 *
Douglas E. Klint 46,632 — 46,632 *Jawad A. Ahsan 25,233 11,111 36,344 *Luke S. Larson 36,112 — 36,112 *Joshua M. Isner 17,572 — 17,572 *
All directors and executive officers as a group (12 persons) 1,295,896 81,050 1,376,946 2.3%
* Less than 1%(1) Except as noted in Notes 4, 5, and 6 below, the address of each of the persons listed is c/o Axon Enterprise,
Inc., 17800 North 85th Street, Scottsdale, AZ 85255.(2) Reflects the number of shares that could be purchased by exercise of options exercisable at March 31, 2019,
or options or restricted stock units vesting within 60 days thereafter under the Company’s stock incentive plans. (3) Based on 59,109,286 shares outstanding as of March 31, 2019. For purposes of computing the percentage of
outstanding shares held by each person or group of persons named above, any security which such person or group has the right to acquire within 60 days of March 31, 2019, is deemed to be outstanding for the purpose of computing the percentage ownership of such person or group, but is not deemed to be outstanding for the purpose of computing the percentage ownership of any other person or group.
(4) Represents shares of the Company's common stock beneficially owned as of December 31, 2018, based on the Schedule 13G/A filed on January 24, 2019 by BlackRock, Inc. In such filing, BlackRock, Inc. lists its address as 55 East 52nd Street, New York, New York 10055, and indicates it has sole voting power with respect to 9,731,368 shares of the Company's common stock, shared voting power with respect to no shares of the

Axon Enterprise, Inc. | 2019 Proxy Statement | 19
Company's common stock, sole dispositive power with respect to 9,878,397 shares of the Company's common stock, and shared dispositive power with respect to no shares of the Company's common stock.
(5) Represents shares of the Company's common stock beneficially owned as of December 31, 2018, based on the Schedule 13G/A filed on February 11, 2019 by The Vanguard Group. In such filing, The Vanguard Group lists its address as 100 Vanguard Blvd., Malvern, PA 19355, and indicates it has sole voting power with respect to 118,994 shares of the Company's common stock, shared voting power with respect to 9,101 shares of the Company's common stock, sole dispositive power with respect to 6,367,772 shares of the Company's common stock, and shared dispositive power with respect to 122,630 shares of the Company's common stock.
(6) Represents shares of the Company's common stock beneficially owned as of December 31, 2018, based on the Schedule 13G/A filed on February 11, 2019 by Janus Henderson Group, plc. In such filing, Janus Henderson Group plc llc lists its address as 201 Bishopsgate EC2M 3AE, United Kingdom, and indicates it has sole voting power with respect to no shares of the Company's common stock, shared voting power with respect to 3,981,049 shares of the Company's common stock, sole dispositive power with respect to no shares of the Company's common stock, and shared dispositive power with respect to 3,981,049 shares of the Company's common stock.
SECTION 16(a) BENEFICIAL OWNERSHIP REPORTING COMPLIANCE
Section 16(a) of the Exchange Act requires the Company’s executive officers and directors, and persons who beneficially own more than 10 percent of a registered class of the Company’s equity securities, to file reports of ownership and changes in ownership with the SEC. Executive officers, directors and greater than 10 percent beneficial owners are required by SEC regulations to furnish the Company with copies of all forms they file pursuant to Section 16(a). Based solely on a review of the copies of Section 16(a) reports furnished to the Company and written representations from certain reporting persons that no other reports were required, to the Company’s knowledge, such persons complied with all of the Section 16(a) filing requirements applicable to them in 2018, except as follows: Hadi Partovi and Patrick W. Smith each filed one late Form 4 (each reporting one transaction) and Mark W. Kroll filed one late Form 4 reporting two transactions.
EXECUTIVE COMPENSATION
EXECUTIVE OFFICERS
See “Governance--The Board of Directors” for biographical information for Patrick W. Smith, who is also our CEO.
Luke S. LarsonTitle: PresidentJoined Axon in 2008Age: 38
Mr. Larson serves as Axon’s President. Mr. Larson is responsible for day to day operations and execution for all aspects of the Company’s business. Mr. Larson joined Axon in June of 2008 and has served in a variety of executive and management roles including director of video products, product manager and product development manager. Prior to joining Axon, Mr. Larson served as a Marine Corps infantry officer. Mr. Larson graduated from University of Arizona with honors where he was an NROTC Scholarship recipient. He also received an MBA in International Business from Thunderbird School of Global Management.

Axon Enterprise, Inc. | 2019 Proxy Statement | 20
Jawad A. AhsanTitle: Chief Financial OfficerJoined Axon in 2017Age: 39
Mr. Ahsan joined the Company in April 2017 after serving as CFO for Market Track where he started in May of 2014. Prior to Market Track, Mr. Ahsan had a 13-year career at General Electric Company where he served as CFO of Clinical Business Solutions, a division of GE Healthcare IT. Prior to that appointment, he served as CFO for Healthcare Knowledge & Connectivity Solutions, which he helped guide to an exit into Caradigm, GE’s healthcare IT joint venture with Microsoft. Mr. Ahsan holds a B.A. in Economics from the College of the Holy Cross and an MBA from the MIT Sloan School of Management.
Joshua M. IsnerTitle: Chief Revenue OfficerJoined Axon in 2009Age: 33
Mr. Isner came to Axon in 2009 as a member of our Leadership Development Program. After rotating through several departments in the Company, he eventually helmed our domestic video and cloud sales team, which he led to a record year in 2014. Mr. Isner now oversees our entire sales organization. Mr. Isner was previously the Director of Leadership Development, Northeast Regional Sales Executive, VP of Video and Cloud Sales, and EVP of Global Sales at Axon. Mr. Isner has a B.S. in Government & Political Science from Harvard University.
Each executive officer serves at the discretion of our Board of Directors and no officer is subject to an agreement that requires the officer to serve the Company for a specified number of years. We have entered into employment-related agreements with each of the executive officers listed above. These agreements require notice of termination by the Company in certain situations that are described in further detail in this proxy statement under the heading “Compensation Discussion and Analysis--Employment Agreements and Other Arrangements.”

Axon Enterprise, Inc. | 2019 Proxy Statement | 21
COMPENSATION DISCUSSION AND ANALYSIS
The purpose of this Compensation Discussion and Analysis is to provide material information about our compensation objectives and policies and to explain and provide context for the material elements of the disclosure which follows in this proxy statement with respect to the compensation of our named executive officers (“NEOs”).
Fiscal 2018 Company Highlights and Compensation Overview
Our financial and business highlights for fiscal 2018 include the following:
• Full year revenue of $420 million, up 22% compared to fiscal 2017.• Full year income from operations of $25 million, up 91% compared to fiscal 2017.• International revenue of $85 million, up 39% compared to fiscal 2017.• Axon Cloud revenue of $92 million, up 60% compared to fiscal 2017.• We completed a follow-on offering of 4,645,000 shares of our common stock, which resulted in gross proceeds
of $246.2 million.• We launched TASER 7, the most significant redesign of the TASER device since 2003, and unveiled our first
LTE-connected body camera, Axon Body 3.
As described in more detail below and in the compensation tables that follow this Compensation Discussion and Analysis, our compensation structure applicable to our named executive officers did not change significantly during 2018, with the exception of compensation for Mr. Smith, our CEO.
Our Compensation Philosophy
The Compensation Committee (in this section, the “Committee”) is in place to address matters relating to the fair and competitive compensation of our NEOs and non-employee directors, together with matters relating to our other benefit plans. The Committee believes that executive compensation should be aligned with the values, objectives and financial performance of the Company.
Objectives of NEO compensation include:
• Attract and retain highly qualified individuals who are capable of making significant contributions critical to our long-term success;
• Promote a performance-oriented environment that encourages Company and individual achievement;• Reward NEOs for long-term strategic management and the enhancement of shareholder value;• Strengthen the relationship between pay and performance by emphasizing variable, at-risk compensation that
is dependent upon the achievement of specified corporate and personal performance goals; and• Align long-term management interests with those of shareholders, including long-term at-risk pay.
Our Compensation Programs
CEO Performance Award
On May 24, 2018, Axon's shareholders approved the Board of Directors’ grant of non-qualified stock options to purchase 6,365,856 shares of common stock to Patrick W. Smith (the "CEO Performance Award"). The CEO Performance Award consists of 12 vesting tranches with a vesting schedule based entirely on the attainment of both operational goals (performance conditions) and market capitalization goals (market conditions), assuming continued employment either as the CEO or as both Executive Chairman and Chief Product Officer and service through each vesting date. Each of the 12 vesting tranches of the CEO Performance Award have a 10-year contractual term and will vest upon certification by the Board of Directors that both (i) the market capitalization goal for such tranche, which begins at $2.5 billion for the first tranche and increases by increments of $1.0 billion thereafter, and (ii) any one of the following eight operational goals focused on revenue or eight operational goals focused on Adjusted EBITDA have been met for the previous four consecutive fiscal quarters.

Axon Enterprise, Inc. | 2019 Proxy Statement | 22
Eight Separate Revenue Goals (1)
(in thousands)
Eight Separate Adjusted EBITDA (CEO Performance Award) Goals
(in thousands)
Goal #1, $710,058 Goal #9, $125,000Goal #2, $860,058 Goal #10, $155,000
Goal #3, $1,010,058 Goal #11, $175,000Goal #4, $1,210,058 Goal #12, $190,000Goal #5, $1,410,058 Goal #13, $200,000Goal #6, $1,610,058 Goal #14, $210,000Goal #7, $1,810,058 Goal #15, $220,000Goal #8, $2,010,058 Goal #16, $230,000
(1) In connection with the business acquisition that was completed during the three months ended June 30, 2018, the revenue goals were adjusted for the acquiree's Target Revenue, as defined in the CEO Performance Award agreement.
As of December 31, 2018, the following operational goals were considered probable of achievement:
• Total revenue of $710.1 million; and
• Adjusted EBITDA (CEO Performance Award) of $125.0 million
The first two market capitalization goals have been achieved as of December 31, 2018. However, none of the shares subject to the CEO Performance Award have vested as of the date of this filing as the market capitalization goals and operational goals have not yet been achieved. The number of stock options expected to vest, based on the tranches considered probable of attainment, is 1.1 million shares. The total grant date fair value of the CEO Performance Award, including those tranches not considered probable of attainment as of December 31, 2018, was approximately $246.0 million. The fair value of the options when the CEO Performance Award was approved by our Board and accepted by Mr. Smith in February 2018 was approximately $72.4 million. Due to a significant increase in the price of Axon's common stock between February 2018 and May 2018, when our shareholders approved the CEO Performance Award, the grant date fair value for accounting purposes increased to the amount disclosed in the Summary Compensation Table.
Mr. Smith’s compensation for 2018 and 2019, following the approval of the CEO Performance Award, consists of an annual base salary of $24,000, consistent with the minimum wage requirements of Arizona law and the CEO Performance Award.
Other Executive Compensation
We utilize various non-cash compensation programs, in addition to traditional cash-based compensation methods. Specifically, we have utilized stock-based awards.
The principal components of compensation in 2018 and 2019 for our NEOs (other than the CEO) consist of the following:
• Annual salary;• Annual performance-based cash incentive plans, comprised of:
• Commissions on bookings growth for our Chief Revenue Officer; and• Payouts under the 2018 annual cash incentive plan based on the achievement of annual financial goals,
including goals related to: total booked contract value; new booked seats; earnings before interest, taxes, depreciation and amortization ("EBITDA"); increase in net promoter score; increase in customer engagement on Axon network; percentage of U.S. customers on a conducted electrical weapon ("CEW") service plan; and top 1200 customer churn;
• For 2018, long-term incentive equity compensation in the form of performance-based restricted stock units (“PSUs”) awarded pursuant to the TASER International, Inc. 2016 Stock Incentive Plan (the "2016 Plan");
Axon Enterprise, Inc. | 2019 Proxy Statement | 23
• For 2019, long-term equity compensation in the form of service-based restricted stock units (“RSUs”) awarded pursuant to the 2018 Stock Incentive Plan; no service-based restricted stock units were granted to the NEOs in 2018; and
• For 2019, long-term equity compensation in the form of eXponential stock units subject to certain milestone vesting periods ("XSUs"), discussed in more detail below.
Any decision to materially increase compensation is based upon the objectives listed above, taking into account all forms of compensation, as well as based upon individual achievement of performance goals. These goals include revenue and earnings targets as well as specific operational goals. Decisions regarding the CEO’s compensation are made by the Committee and reflect the same considerations used for the other NEOs. The Board has not adopted any clawback policies, but adopted stock ownership guidelines in December 2018.
eXponential Stock Performance Plan
On February 12, 2019, our shareholders approved the 2019 Stock Incentive Plan (the "2019 Plan"), which was adopted by the Board of Directors to reserve a sufficient number of shares to facilitate our eXponential Stock Performance Plan (“XSPP”) and grants of XSUs under the plan. There were five main reasons why the Board recommended that shareholders approve the 2019 Plan. The XSPP and equity incentive awards under the 2019 Plan:
1. Substitute short-term guaranteed share-based compensation and cash compensation for long-term, performance-vesting share-based compensation to deliver market competitive total pay,
2. Align the entire Company around clearly defined market cap, revenue and EBITDA performance goals through a broad-based plan that is offered to every employee,
3. Strengthen Axon’s ability to retain and recruit top technical talent,
4. Further align the interests of employees with those of the Company’s other shareholders, and
5. Incorporated shareholder feedback and input on plan design.
Pursuant to the XSPP, all eligible full-time U.S. employees were granted an award of 60 XSUs in January 2019, and certain employees had the opportunity to elect to receive a percentage of the value of their target compensation over a nine year period from 2019 to 2027 in the form of additional XSUs. For employees who elected to receive XSUs, the XSU grants were made as an up front, lump sum grant in January 2019, and are intended to replace that portion of the target compensation they elected to receive in the form of XSUs for the next nine years. Accordingly, their annual go forward target compensation will be reduced until 2027 by the amount of such compensation that the employees elected to receive in the form of the January 2019 XSU grants.
Messrs. Ahsan, Isner, and Larson each received an XSU grant of 598,537 shares on January 2, 2019. There have been no PSUs granted to the named executive officers for fiscal 2019 given the transition to XSUs.
The market capitalization and operational goals are identical to the CEO Performance Award, except for the number of shares that are used to calculate the market capitalization goals if shares outstanding exceed the XSU Maximum. Additionally, because the grant date is different than that of the CEO Performance Award, the measurement period for market capitalization is not identical.
The XSUs are grants of restricted stock units, each with a term of approximately nine years, that vest in 12 equal tranches. Each of the 12 tranches will vest upon certification by the Compensation Committee of the Board of Directors that both (i) the market capitalization goal for such tranche, which begins at $2.5 billion for the first tranche and increases by increments of $1.0 billion thereafter, and (ii) any one of eight operational goals focused on revenue or eight operational goals focused on Adjusted EBITDA have been met for the previous four consecutive fiscal quarters.
The XSPP contains an anti-dilution provision, which is used to calculate a maximum number of shares outstanding for purposes of determining achievement of the market capitalization goals whereby the maximum number of shares used
Axon Enterprise, Inc. | 2019 Proxy Statement | 24
to calculate the market capitalization goal is calculated by organically growing the current number of shares outstanding by 3% per year (the "XSU Maximum"). Any shares of Stock issued to Patrick W. Smith upon the exercise of the stock options granted to Mr. Smith under the CEO Performance Award shall increase the XSU Maximum. The XSU Maximum shall also be adjusted for acquisitions, spin-offs or other changes in the number of outstanding shares of common stock, if such changes have a corresponding adjustment on the market capitalization goals.
Axon’s shareholder outreach prior to introducing the XSPP included speaking with portfolio managers, analysts and corporate governance representatives at institutions that were among the highest percentage holders of Axon common stock for the purpose of gathering input and understanding best practices and shareholder preferences regarding share-based compensation plans. Shareholders tended to favor broad-based employee-wide plans over highly concentrated plans among senior management, and favor using performance-based share-based compensation, rather than cash, in delivering market-competitive total pay. Axon addressed shareholders’ dilution concerns by adopting into the XSPP a dilution guardrail of 3% annual share count growth, calculated on a daily basis, which removes any management incentive to dilute the share count to achieve the market cap goals. We credit our shareholder outreach efforts in helping us to design an employee-wide share-based compensation plan that drives alignment among shareholders, senior management and every employee.
Stock Ownership Guidelines
We adopted stock ownership guidelines for our named executive officers and Board members in December 2018. The stock ownership guidelines state that non-employee directors hold at least 8,000 shares of Company stock and that named executive officers own at least 50,000 shares of the Company’s stock. For purposes of these guidelines, stock ownership includes shares for which the executive or director has direct or indirect ownership or control, including Axon common stock plus vested and unvested Axon stock options and RSUs, including unvested performance-based RSUs and XSUs. Executives and directors are expected to meet their ownership guidelines once they have received enough grants to add up to the required minimum.
Processes and Procedures for Considering and Determining Executive Compensation
The Committee assists the Board of Directors in addressing matters relating to the fair and competitive compensation of our NEOs and non-employee directors, together with matters relating to our other benefit plans. The Committee is currently composed of three independent directors: Hadi Partovi (Chairman), Matthew McBrady, and Michael Garnreiter. The Committee makes the sole decision regarding compensation for the Chief Executive Officer and each NEO.
The Committee met nine times in 2018. All Committee members were present for each meeting.
Four members of management, Patrick W. Smith, CEO, Luke S. Larson, President, Jawad A. Ahsan, CFO, and Douglas E. Klint, Corporate Secretary and former EVP and General Counsel through August 2018, attended portions of the meetings. The agendas for these meetings were determined by the Committee members prior to the meetings. The Committee generally receives and reviews materials in advance of each meeting. Depending on the agenda for the particular meeting, materials may include:
• Financial reports;• Reports on levels of achievement of corporate performance objectives;• Schedules setting forth the total compensation of the NEOs, including base salary, cash incentives, equity
awards, perquisites and other compensation and any potential amounts payable to the NEOs pursuant to employment, severance and change of control agreements;
• Summaries which show the NEOs’ total accumulated stock awards and stock option holdings;• Information regarding compensation paid by comparable companies identified in executive compensation
surveys; and• Reports from consultants to the Compensation Committee.

Axon Enterprise, Inc. | 2019 Proxy Statement | 25
The Committee’s primarily responsibilities are to:• Review and approve corporate goals and objectives relevant to the compensation of NEOs, evaluate the
performance of the NEOs in light of these goals and objectives and determine and approve the compensation level of NEOs based on that evaluation;
• Evaluate and establish the incentive components of the CEO’s compensation and related bonus awards, taking into account the Company’s performance and relative shareholder return, the value of similar incentive awards to CEOs at comparable companies, the services rendered by the CEO and the awards given to the CEO in past years;
• Review and approve the design of the compensation and benefit plans that pertain to the CEO and other NEOs who report directly to the CEO;
• Administer equity-based plans, including stock incentive plans;• Approve the material terms of all employment, severance and change of control agreements for NEOs;• Retain compensation consultants and advisors as necessary, or appropriate, on an advisory basis to establish
comparator groups, benchmarking and targets for compensation related matters;• Recommend to the Board the compensation for Board members, such as retainers, committee fees, chairman
fees, stock awards and other similar items;• Provide oversight regarding the Company’s benefit and other welfare plans, policies and arrangements;• Form and delegate authority to subcommittees when appropriate; and• Prepare the Compensation Committee report to be included in the Company’s annual proxy statement and
Annual Report on Form 10-K filed with the SEC.
The Committee’s charter reflects these responsibilities, and the Committee and the Board periodically review and revise the charter. The full text of the Committee charter is available on our website at http://investor.axon.com/governance/documents-and-charters.
Role of Management and Consultants in Determining Executive Compensation
Our executive management supports the Committee in carrying out its responsibilities by preliminarily outlining compensation levels for NEOs, administering our benefit and other welfare plans and providing data to the Committee for analysis. Annually, compensation is initially proposed by the CEO for each executive (excluding the CEO), consisting of base salary, annual and long-term performance-based compensation and long-term equity compensation, which is then provided to the Committee for review and approval.
Our Committee has sole authority to engage the services of outside consultants and advisors, as it deems necessary or appropriate in the discharge of its duties and responsibilities. The Committee has budgetary authority to authorize and pay for the services of outside consultants and advisors, and such consultants and advisors report directly to the Committee. In 2017 and 2018, the Committee retained compensation consulting firm, Compensia, Inc., who provided research, data analyses, benchmarking and design expertise in developing and structuring compensation programs for its executives. The Company utilized that information in the design of its 2018 and 2019 executive compensation plans.
Peer Comparator Group
The scope of Compensia’s review in 2018 included determining an appropriate comparator group to compare the Company’s executive compensation to, based primarily on the following criteria: Industry and Global Industry Classification code, revenue, and market capitalization. Compensia selected public technology companies with annual sales between $150 million and $950 million, with market capitalization of $900 million to $10 billion.

Axon Enterprise, Inc. | 2019 Proxy Statement | 26
The Committee has selected the following comparator group when reviewing executive compensation:
2U, Inc. Ellie Mae, Inc. Proofpoint, Inc.8x8, Inc. Five9 Inc. Qualys, Inc.Alarm.com Holdings, Inc. HubSpot, Inc. RingCentral Inc.Benefitfocus, Inc. MINDBODY Inc. SPS Commerce Inc.Box. Inc. New Relic, Inc. Twilio Inc.Carbonite, Inc. Paycom Software, Inc. Zendesk Inc.Cornerstone OnDemand Inc. Paylocity Holding Corp. Zuora Inc.
In addition to the comparator group, to supplement the executive compensation information where publicly disclosed information was limited, Compensia provided executive compensation information for the NEOs based on its proprietary database for technology companies, primarily internet and software as a service companies, with revenues between $150 million and $950 million and a market capitalization between $900 million and $10 billion.
The following tables show the composition of each NEO’s total target direct compensation for 2018 and 2019:
2018 Annual Salary
Annual Target Incentive
Compensation (1)
Long-term Target Incentive Compensation--
PSUs(2) (3)
Long-term Equity Compensation--RSUs
(2) (3)
Target TotalDirect
Compensation
Name $ % Total $ % Total $ % Total $ % Total $
Patrick W. Smith(4) $350,000 17.1% $ — —% $ 1,500,000 73.2% $ 200,000 9.8% $ 2,050,000Luke S. Larson 325,000 26.5 150,000 12.2 600,000 49.0 150,000 12.2 1,225,000Jawad A. Ahsan 300,000 20.0 200,000 13.3 600,000 40.0 400,000 26.7 1,500,000Joshua M. Isner 275,000 20.0 600,000 43.6 400,000 29.1 100,000 7.3 1,375,000Douglas E. Klint 300,000 50.0 200,000 33.3 — — 100,000 16.7 600,000
(1) Presented at target levels. Actual results for 2018 exceeded targets, resulting in payouts under the annual cash incentive plan for Messrs. Larson and Ahsan in the amounts of approximately $192,000 and $255,000, respectively. Mr. Isner earned commissions in 2018 of approximately $1,348,000. See further discussion following under “Performance-Based Incentive Plans.”
(2) Approximate value; actual value of the PSUs and RSUs is based on the grant-date fair value.(3) These RSUs and PSUs were awarded in December 2017 and although the awards are intended as 2018
compensation awards, because they were granted in 2017 they were reflected as compensation in 2017 in Summary Compensation Table.
(4) The above table reflects the target compensation for Mr. Smith prior to the Board of Directors' approval of the CEO Performance Award. Upon approval, Mr. Smith's annual salary was reduced to $24,000.
2019Annual Salary
(1)Annual Target Incentive
Compensation
Long-term EquityCompensation--RSUs
(2)
Target Total Direct Compensation
(3)
Name $ % Total $ % Total $ % Total $Patrick W. Smith $ 24,000 100.0% $ — —% $ — —% $ 24,000Luke S. Larson 325,000 27.1 300,000 25.0 575,000 47.9 1,200,000Jawad A. Ahsan 300,000 27.3 300,000 27.3 500,000 45.5 1,100,000Joshua M. Isner 275,000 30.6 500,000 55.6 125,000 13.9 900,000
(1) Annual salary effective January 1, 2019.(2) Approximate value; actual value of the RSUs is based on the grant-date fair value. These RSUs were awarded
on January 2, 2019 and cliff vest on the 3-year anniversary of the award date.

Axon Enterprise, Inc. | 2019 Proxy Statement | 27
(3) Target total direct compensation reflected above excludes XSUs granted to Messrs. Larson, Ahsan, and Isner on January 2, 2019 which are discussed in more detail under “Executive Compensation — Compensation Discussion and Analysis — eXponential Stock Performance Plan". The grants made to Messrs. Larson, Ahsan, and Isner had a target value of $1,000,000 prior to the 3x risk and 9x time multipliers and were granted in lieu of traditional performance-based RSUs.
Annual Salary
Salaries for NEOs are reviewed annually, as well as at the time of a promotion or other changes in responsibilities. Consistent with our goal for overall compensation, we set salaries at a competitive level to ensure we can attract and retain our executives. There is no set percentile of market that we use and executive salaries vary in their positioning to market depending on facts; such as, tenure with the Company, results of personal, department and corporate performance, complexity of the business unit managed, and the perceived detrimental effects to the Company that may result from such executive’s departure. The base salaries of our NEOs, other than the CEO, were proposed by the CEO, established by the Committee and approved by the independent directors after considering compensation salary trends, overall level of responsibilities, total performance and compensation levels for comparable positions in the market for executive talent based on salary surveys and compensation data from comparator group companies.
After considering the above, the Committee left base salaries of our continuing NEOs for 2019 at 2018 levels. Following approval of the CEO Performance Award in May 2018, Mr. Smith’s annual base salary was reduced to $24,000, consistent with the minimum wage requirements of Arizona law as part of his compensation program, which is intended for him to derive his compensation from the CEO Performance Award.
Performance-Based Incentive Plans
The objective of the annual incentive payment plan and the use of equity-based awards in the form of PSUs have been to provide executives with a competitive total compensation opportunity, as well as to align executive rewards with company performance.
2018 Structure
The 2018 executive compensation structure included: payments under the annual cash incentive plan; PSUs that cliff vest based on three-year revenue and EBITDA goals, and for Mr. Isner, bookings-based commissions, paid quarterly. Each component was designed to incentivize specific Company business goals.
Payouts under the 2018 annual cash incentive plan were based on the achievement of the following annual financial goals and operational metrics: total booked contract value; new booked seats; EBITDA; increase in net promoter score; increase in customer engagement on Axon network; percentage of U.S. customers on a CEW service plan; and top 1200 customer churn. The Committee believed the criteria for the annual cash incentive plan were challenging, but achievable.
Sales commissions were earned based upon specific sales targets for each eligible NEO. Because the sales commissions are tied to metrics such as bookings growth and other operating results, the Committee did not set a maximum amount that could be paid under the plans for the NEOs.

Axon Enterprise, Inc. | 2019 Proxy Statement | 28
2018 Performance - Based Cash Incentive Plans Metrics
Metric Threshold Target Maximum Actual WeightWeighted
Payout
($ in millions)
Total booked contract value $ 575.0 $ 625.0 $ 650.0 $ 692.1 30.0% 45.00%New booked seats (in thousands) 65 80 100 94 25.0 33.50EBITDA $ 24.0 $ 29.0 $ 34.0 $ 35.8 25.0 37.50Increase in net promoter score (linearpayout from 0% to 10%) 0% 5.0% 10.0% (7.8)% 5.0 —Increase in customer engagement onAxon network 0% 5.0% 10.0% 5.0 % 7.5 7.50U.S. CEW handle service planpercentage 35.0% 45.0% 55.0% 42.0 % 5.0 4.25Top 1200 customer churn n/a 0.0% n/a 0.1 % 2.5 —
Actual attainment/plan payout 100% 127.75%
The 2018 performance-based cash incentive plan metrics were measured and paid after the Company determined its annual earnings for 2018. The total booked contract value, new booked seats, and U.S. handle service plan percentage metrics each have a threshold, target and maximum goal with corresponding base payouts of 50%, 100% and 150% of target, respectively. All metrics tied to the 2018 annual cash incentive plan are capped at a 150% payout. The weighted average payout achieved under the 2018 performance-based cash incentive plan was 127.75%.
Payouts under the 2018 annual cash incentive plan for Mr. Isner were primarily based on growth of the Company's bookings. For 2018, approximately $1,348,000 was based on the growth of total 2018 bookings as compared to 2017, and $65,000 was based on the completion of certain leadership courses.
For PSUs granted under the 2018 executive compensation structure, which were granted on December 4, 2017, the amount that will ultimately vest, if any, will be determined as follows: 80% of the awards granted are based upon the 2020 revenue for the total Company; and 20% are based upon 2020 EBITDA for the total Company. Earned PSUs cliff vest and would be released in February 2021. Should actual performance metrics exceed targeted metrics, executives will receive additional PSUs, for a total of up to 200% of target. The Committee decided to introduce sales targets related to three-year growth rates to promote and reward the achievement of long-term objectives and long-term strategic planning by our NEOs. The 2020 consolidated revenue and EBITDA metrics have threshold, target and maximum goals, based on compound annual growth rates, with payouts for each of these goals having payouts of 50%, 100% and 200%, respectively. If the threshold levels are not achieved, no amounts will be considered earned.
Terms and conditions of the performance-based Incentive Plans for NEOs are established by the Committee. The following table sets forth the target performance-based incentive compensation of our continuing NEOs for the year ended December 31, 2018.
Performance-based Incentive Plans - 2018 Target
Named ExecutiveAnnual
Cash IncentiveSales
CommissionsPSUs
(#)(1)(2)
Approximate Grant DateFair Value Total 2018
Patrick W. Smith (3) $ — $ — 62,241 $ 1,500,000 $ 1,500,000Luke S. Larson 150,000 — 24,896 600,000 750,000Jawad A. Ahsan 200,000 — 32,135 900,000 1,100,000Joshua M. Isner (4) 65,000 600,000 16,598 400,000 1,065,000Douglas E. Klint 200,000 — — — 200,000

Axon Enterprise, Inc. | 2019 Proxy Statement | 29
(1) The amount presented for Mr. Ahsan also includes a PSU grant of 7,239 shares awarded on May 3, 2018 which vests based on the same fiscal year 2020 GAAP revenue targets as the other awards for the NEOs.
(2) Historically, the Company's annual grant was in February of each year, but for 2018, it was shifted to the preceding December to better coincide with the Company's internal budgeting process. The 2018 PSUs were granted on December 4, 2017. Accordingly, although these PSU grants were intended as 2018 compensation, because they were granted in December 2017, they are reflected as compensation for 2017 in the Summary Compensation Table.
(3) The above table includes 62,241 PSUs granted to Mr. Smith prior to the Board of Director's approval of the CEO Performance Award, which had an approximate grant date fair value of $1,500,000. Mr. Smith will continue vesting in the awards as previously granted. The options granted to Mr. Smith pursuant to the CEO Performance Award are not included above as this award is intended to compensate Mr. Smith over a period of up to 10 years and the value is realizable only if and when when each set of market capitalization and operational goals are achieved. The fair value of the CEO Performance Award is reported in the Summary Compensation Table.
(4) The amount presented as annual cash incentive for Mr. Isner was based on the completion of certain leadership development courses.
Long-Term Service-Based Equity Compensation
The Committee believes that service-based equity compensation with multi-year vesting periods ensures that our NEOs have a continuing stake in our long-term success. As such, for 2018, the Committee granted RSUs on December 4, 2017, which vest over a three-year service period, to align our NEOs interests with those of shareholders, and to motivate our NEOs to make strategic long-term decisions.
In determining the total number of RSUs to award to each NEO, the Compensation Committee considered, among other things, the strategic objectives of the Company over the next three years, and the practice of comparator group companies. The following table sets forth the service-based RSU awards made to our continuing NEOs in December 2017.
2018 Awards (1) 2019 Awards (2)
Named Executive
Number ofService-based
RSUs Awarded
ApproximateGrant DateFair Value
Number ofService-based
RSUs Awarded
ApproximateGrant DateFair Value
Patrick W. Smith (3) 8,299 200,000 — —Luke S. Larson 6,224 150,000 12,747 575,000Jawad A. Ahsan 16,598 400,000 11,085 500,000Joshua M. Isner 4,149 100,000 2,772 125,000Douglas E. Klint 4,149 100,000 N/A N/A
(1) Historically, the Company's annual grant was in February of each year, but for 2018, it shifted to the preceding December to better coincide with its internal budgeting process.
(2) The 2019 awards cliff vest on January 2, 2022.
(3) The above table reflects the RSUs granted to Mr. Smith on December 4, 2017, prior to the Board of Director's approval of the CEO Performance Award. Mr. Smith will continue vesting in the awards granted prior to the approval of the CEO Performance Award.
Other Long-Term Performance-Based Equity Compensation
In addition to the PSUs granted in conjunction with the performance-based incentive plans described above, the Committee has, from time-to-time, approved performance-based equity awards to certain of our NEOs in keeping with the Committee’s goals to align the long-term interests of management with the Company’s shareholders. Generally,

Axon Enterprise, Inc. | 2019 Proxy Statement | 30
these awards vest upon the achievement of performance goals in the NEOs area of the business. The Committee’s intention in awarding these grants was to incentivize and reward the achievement of significant long-term strategic goals.
There were no outstanding long-term performance-based equity compensation awards at December 31, 2018. In January 2019, the Company granted XSU grants of 598,537 shares each to Messrs. Ahsan, Isner, and Larson.
Employment Agreements and Other Arrangements
In March 2017, the Company entered into an employment agreement with Jawad A. Ahsan pursuant to which he agreed to serve as its Chief Financial Officer. In December 2017, the Company entered into revised employment agreements with Patrick W. Smith, Luke S. Larson, Joshua M. Isner, and Douglas E. Klint pursuant to their continued service. Under the revised employment agreements with Mr. Smith, Mr. Larson and Mr. Klint, the notice/severance period for termination without cause was reduced from 24 months to 12 months. Mr. Smith's employment agreement terminated following shareholder approval of the CEO Performance Award on May 24, 2018 and the Company has no further obligations thereunder.
Perquisites and Other Personal Benefits
We have a non-qualified deferred compensation plan for certain executives, key employees and non-employee directors through which participants may elect to postpone the receipt and taxation of a portion of their compensation received from us. The non-qualified deferred compensation plan allows eligible participants to defer up to 80% of their base salary and up to 100% of other types of compensation. The plan also allows for matching and discretionary employer contributions. Employee deferrals are deemed 100% vested upon contribution. Distributions from the plan generally commence upon retirement, death, separation of service, specified date or upon the occurrence of an unforeseeable emergency. Distributions can be paid in a variety of forms from lump sum to installments over a period of years. Participants in the plan are entitled to select from a wide variety of investments available under the plan and are allocated gains or losses based upon the performance of the investments selected by the participant. All gains or losses are allocated fully to plan participants and we do not guarantee a rate of return on deferred balances. Assets related to this plan consist of corporate-owned life insurance contracts and are included in other assets in the consolidated balance sheets. Participants have no rights or claims with respect to any plan assets and any such assets are subject to the claims of our general creditors.
We do not provide our NEOs with other significant perquisites or other benefits, except for Company matching contributions to our defined contribution benefit plans and health care benefits that are widely available to employees. The Committee periodically reviews the levels of perquisites and other benefits that could be provided to the NEOs.
Compensation Deductibility
In general, Section 162(m) of the U.S. tax code denies a publicly held corporation a deduction for U.S. federal income tax purposes for compensation in excess of $1,000,000 per year per person to the executives designated in Section 162(m) of the Code, including, but not limited to, its chief executive officer, chief financial officer, and the next three highly compensated executives of such corporation whose compensation is required to be disclosed in its proxy statement. The exemption from Section 162(m)’s deduction limit for performance-based compensation has been repealed, effective for taxable years beginning after December 31, 2017, such that compensation paid to our covered executive officers in excess of $1,000,000 will not be deductible unless it qualifies for transition relief applicable to certain arrangements in place as of November 2, 2017.
Prior to the repeal of Section 162(m)’s performance-based exemption, we in general sought to structure our compensation programs in a manner intended to comply with Section 162(m), although our compensation committee reserved the right to provide compensation (such as base salary and service-based vesting RSUs) if, in its judgment, such payments were necessary to achieve our compensation objectives and in the best interests of the Company and its stockholders. However, despite the compensation committee’s efforts to structure certain compensation elements in a manner intended to be exempt from Section 162(m) and therefore not subject to its deduction limits, because of ambiguities and
Axon Enterprise, Inc. | 2019 Proxy Statement | 31
uncertainties as to the application and interpretation of Section 162(m) and the regulations issued thereunder, including the uncertain scope of the transition relief under the legislation repealing Section 162(m)’s exemption from the deduction limit, no assurance can be given that compensation intended to satisfy the requirements for exemption from Section 162(m) in fact will.
Moreover, despite the availability of transition relief described above, the Committee believes that stockholder interests are best served by not restricting the Committee’s discretion and flexibility in structuring its compensation programs. As such, the Committee has always, and continues to, reserve the right to amend arrangements that were initially intended to qualify as performance-based compensation for purposes of Section 162(m) if the Committee determines such amendments are in the best interests of the Company and its stockholders, even though such changes may cause the arrangements to fail to qualify for transition relief, resulting in a non-deductible compensation expense for the Company.
Going forward, the Committee will continue to monitor the impact that the repeal of the performance-based pay exception to Section 162(m) will have on the Company’s compensation programs and contracts, including whether and to what extent our existing contracts and programs qualify for the transition relief described above.

Axon Enterprise, Inc. | 2019 Proxy Statement | 32
COMPENSATION COMMITTEE REPORT
The Compensation Committee has reviewed and discussed with management the Compensation Discussion and Analysis included in this proxy statement. Based on these reviews and discussions, the Compensation Committee recommended to the Board of Directors that the Compensation Discussion and Analysis be included in this proxy statement and incorporated by reference in our 2018 Annual Report on Form 10-K.
.
The Compensation Committee:
Hadi Partovi, Chairman
Michael Garnreiter
Matthew McBrady
The foregoing Compensation Committee Report will not be deemed to be incorporated by reference by any general statement incorporating by reference this proxy statement into any filing under the Securities Act or under the Exchange Act, except to the extent that the Company specifically incorporates this information by reference, and will not otherwise be deemed filed under such Acts.
COMPENSATION COMMITTEE INTERLOCKS AND INSIDER PARTICIPATION
No member of the Compensation Committee is, or was during or prior to fiscal 2018, an officer or employee of the Company or any of its subsidiaries. None of the Company’s executive officers serves as a director or member of the compensation committee of another entity in a case where an executive officer of such other entity serves as a director or member of the Compensation Committee.

Axon Enterprise, Inc. | 2019 Proxy Statement | 33
SUMMARY COMPENSATION TABLE
Name and PrincipalPosition Year
Salary ($)
Bonus($)
StockAwards ($) (1)
Option Awards ($) (2)
Non-Equity Incentive Plan Compensation
($) (3)
All OtherCompensation
($) (4) Total ($)
Patrick W. Smith 2018 $ 70,027 (5) $ — $ — $ 245,953,429 $ — $ 3,254 $ 246,026,710Chief ExecutiveOfficer
2017 350,000 — 3,403,775 — — 11,900 3,765,675
2016 350,000 — 1,178,750 — — 11,878 1,540,628
Luke S. Larson 2018 325,000 — — — 191,624 12,604 529,228President 2017 325,000 300,000 2,849,986 — 108,371 14,859 3,598,216
2016 272,917 — 437,500 — 122,477 16,819 849,713
Jawad A. Ahsan 2018 300,000 200,000 (6) 299,984 — 255,499 1,504 1,056,987Chief FinancialOfficer
2017 225,850 70,000 2,400,024 — 121,138 934 2,817,946
Joshua M. Isner 2018 275,000 21,000 (6) — — 1,412,852 20,850 1,729,702Chief RevenueOfficer
2017 275,000 — 1,525,007 — 512,038 19,358 2,331,403
2016 222,917 — 100,000 — 631,490 18,119 972,526
Douglas E. Klint 2018 300,000 — — — 255,499 9,787 565,286Former EVP andGeneral Counsel
2017 300,000 — 199,986 — 108,371 9,492 617,849
2016 300,000 — 158,000 — — 9,544 467,544
(1) The amounts in this column reflect the aggregate grant date fair value for RSUs computed in accordance with stock-based accounting rules (ASC Topic 718). Pursuant to SEC regulations, the amounts shown exclude the impact of estimated forfeitures related to service-based vesting conditions. Assumptions included in the calculation of these amounts are included in footnote 1 to our financial statements for the fiscal year ended December 31, 2018 within our Annual Report on Form 10-K filed with the SEC.
For performance share unit awards, the value included in this column represents the grant-date fair value assuming the performance measures are achieved at target level, which is considered the probable outcome. The grant-date fair value of the performance share awards assuming achievement of the maximum performance levels for Mr. Ahsan's 2018 award is approximately $600,000.
Historically, the Company's annual grant was in February of each year, but for 2018, shifted to the preceding December to better coincide with its internal budgeting process. The 2018 PSUs were granted on December 4, 2017. Accordingly, although these PSU grants were intended as 2018 compensation, because they were granted in December 2017, they were reflected as compensation for 2017 in the Summary Compensation Table. Amounts include $1,700,014, $749,992, $1,000,006, $500,003, and $99,991 for Messrs. Smith, Larson, Ahsan, Isner and Klint, respectively, for stock awards made on December 4, 2017 related to fiscal year 2018 target compensation. For 2019, awards were granted on January 2, 2019.
(2) The amount reported as compensation for Mr. Smith represents the grant date fair value of options under the CEO Performance Award as computed in accordance with ASC Topic 718. Mr. Smith did not realize this amount in 2018 because vesting of the shares is entirely tied to achieving revenue, EBITDA and market cap performance milestones, which are described below. No options will vest simply through the passage of time, and to date, no options have vested.
The fair value of the options when the CEO Performance Award was approved by our Board and accepted by Mr. Smith in February 2018 was approximately $72.4 million. Due to a significant increase in the price of Axon's common stock between February 2018 and May 2018, when our shareholders approved the CEO Performance Award, the grant date fair value for accounting purposes increased to the amount disclosed in this Summary Compensation Table.

Axon Enterprise, Inc. | 2019 Proxy Statement | 34
The CEO Performance Award granted to Mr. Smith is an incentive for future performance in the form of a high-risk, high-reward compensation plan, and the value is realizable only if and when each set of market capitalization and operational goals are achieved and the options vest associated with each tranche.
The grant is intended to compensate Mr. Smith over a ten year term and will become vested as to all options subject to it only if our market capitalization increases to $13.5 billion and twelve operational goals are achieved during the ten year term of the award. 1/12th of the total number of options in the grant will become vested and exercisable each time: (i) Company market capitalization increases by $1 billion above the February 2018 market capitalization of approximately $1.5 billion; and (ii) one of sixteen operational goals tied to revenue and adjusted EBITDA are attained, subject to Mr. Smith’s continued service to the Company at each such vesting event. If any options have not vested by the end of the ten year term of the award, they will be forfeited and Mr. Smith will not realize the value of such options. As of the date of this filing, no sets of vesting milestones (a market capitalization goal paired with an operational goal) for this grant have been achieved and no shares subject to this grant have vested. The amounts and timing of compensation realized by Mr. Smith for the CEO Performance Award will differ from the amount reported here pursuant to the requirements for the Summary Compensation Table.
See “Executive Compensation — Compensation Discussion and Analysis — Our Compensation Programs — CEO Performance Award” above.
(3) In 2018, all the Company’s NEOs, excluding Messrs. Smith and Isner, received non-equity incentive compensation as a result of exceeding target metrics around bookings and other operating measures. Their 2018 incentive compensation was provided in the form of cash payouts, which were paid in February 2019. In 2017, all the Company’s NEOs, excluding Messrs. Smith and Isner, received non-equity incentive compensation as a result of exceeding target metrics around sales and other operating measures. Their 2017 incentive compensation was provided in the form of cash payouts, of which 15% of targeted amounts were paid in May, August and November with the remaining 55% with adjustments made for actual results, paid in February 2018. In 2016, all the Company’s then NEOs, excluding Messrs. Smith and Isner, received non-equity incentive compensation as a result of exceeding target metrics around sales and other operating measures. Their 2016 incentive compensation was provided in the form of cash payouts, of which 15% of targeted amounts were paid in May, August and November with the remaining 55% with adjustments made for actual results, paid in February 2017. Amounts for Mr. Isner represent commissions and, for 2017 and 2018, cash incentives earned upon completion of certain leadership development courses.
(4) Unless otherwise noted, other compensation consists of matching contributions made to 401(k) and contributions to health savings accounts.
(5) The amount paid to Mr. Smith for 2018 represents his existing salary level through February 28, 2018 and $24,000 annually thereafter consistent with the minimum wage requirements of Arizona law and the CEO Performance Award.
(6) The amounts paid to Mr. Ahsan and Mr. Isner represented one-time discretionary performance bonuses awarded in 2018.
PAY RATIO OF CHIEF EXECUTIVE OFFICER COMPENSATION TO MEDIAN EMPLOYEE COMPENSATION
The Company's compensation practices and programs are designed with the goal of ensuring compensation programs are fair, equitable, globally compliant and are aligned with its business objectives. Our CEO, Patrick W. Smith, has agreed to a compensation arrangement in the CEO Performance Award, which was approved by shareholders in May 2018, that vests based solely on attainment of both market capitalization and internal operational goals. We are providing a ratio of (i) Mr. Smith's 2018 annual total compensation to (ii) the median of the 2018 annual total compensation of all Axon employees, other than Mr. Smith calculated pursuant to the disclosure requirements of the Summary Compensation Table above as if all of our employees were named executive officers. For purposes of the Summary Compensation Table and the ratio calculated below, we are required to report pursuant to applicable SEC rules any stock option grants to Mr. Smith at values determined as of their respective grant dates and which are driven by certain assumptions prescribed by ASC 718. There may be a significant disconnect between what is reported as compensation for Mr. Smith in a given year in the Summary Compensation Table and the value actually realized as compensation in that year or over a period of time. Moreover, the compensation reported for the CEO Performance Award granted to Mr. Smith is an incentive for future performance over the course of ten years in the form of a high risk, high reward compensation plan, and the value is realizable only if and when each set of market capitalization and operational goals are achieved. As of the date of this filing, no vesting milestones for this grant have been achieved and no shares subject to this grant have vested. See “Executive Compensation — Compensation Discussion and Analysis — Our Compensation Programs — CEO Performance Award” above.

Axon Enterprise, Inc. | 2019 Proxy Statement | 35
Mr. Smith’s annual total compensation, as reported in the Summary Compensation Table, for 2018 was $246,026,710, and the median 2018 annual total compensation of all other employees was $95,157. Consequently, the applicable ratio of such amounts for 2018 was 2,585:1.
Our methodology for identifying the median of the 2018 annual total compensation for each of our employees other than Mr. Smith was as follows:
• We determined that as of December 31, 2018, Axon and all of our subsidiaries had 1,155 qualifying individuals (full-time, part-time and temporary employees other than Mr. Smith), of which 11% were based outside of the U.S. and 19% were production line employees.
• We did not include in the population of qualifying individuals any employees of staffing agencies whose compensation is determined by such agencies.
• We applied the requirements and assumptions required for the table in the Summary Compensation Table for each of such individuals as if he or she was a named executive officer to calculate the total annual compensation, including base salary or wages, performance-based commission payments, and equity awards based on their grant date fair values.
• We converted any payment earned or paid in a foreign currency to U.S. dollar using the average of the prevailing conversion rates for the month of December 2018.
• We selected the median of all total annual compensation amounts calculated in accordance with the foregoing.
The SEC rules for identifying the median compensated employee and calculating the pay ratio based on that employee’s annual total compensation allow companies to adopt a variety of methodologies, exclusions, and assumptions that reflect their compensation practices. As such, the pay ratio reported above may not be comparable to the pay ratio reported by other companies, even those in a related industry or of a similar size and scope. Other companies may have different employment practices, regional demographics or may utilize different methodologies and assumptions in calculating their pay ratios.
2018 GRANTS OF PLAN-BASED AWARDS
The following table shows information about awards made under various compensation plans during 2018:
Estimated future payouts undernon-equity incentive
plan awards
Estimated future payouts under equity incentive plan
awardsExerciseprice ofoptionsawards
($/share)
Grant date fairvalue of stock
and option awards($) (1)Name
GrantDate
Threshold($)
Target($)
Maximum($)
Threshold(#)
Target(#)
Maximum(#)
Patrick W. Smith 2/26/18 (2) — — — 530,488 6,365,856 6,365,856 $ 28.58 245,953,429
Luke S. Larson 75,000 150,000 225,000 (4) — — — — —
Jawad A. Ahsan 5/3/18 (3) — — — 3,620 7,239 14,478 — 299,984
100,000 200,000 300,000 (4) — — — — —
Joshua M. Isner — 665,000 — (5) — — — — —
Douglas E. Klint 100,000 200,000 300,000 (4) — — — — —
(1) Grant date fair value of RSUs and options, computed in accordance with stock-based compensation accounting rules (ASC 718). The fair value of each RSU is the closing price of our common stock on the date of grant. The assumptions used in the calculations of the grant date fair value for option awards are included in Note 1 to our Consolidated Financial Statements contained in our Annual Report on Form 10-K for fiscal 2018.
(2) The approval date of this award was May 24, 2018. This grant is intended to compensate Mr. Smith over its ten-year term and will become vested as to all shares subject to it only if both market capitalization and internal operational goals are attained during such ten year period. 1/12th of the total number of shares subject to the options will become vested and exercisable upon certification by the Board of Directors that both: (i) one of the market capitalization goals is achieved; and (ii) one of sixteen specified internal operational goals relating to financial results is attained, subject to Mr. Smith’s continued service at each such vesting event. If any tranches have not vested by the end of the ten-year term of the award, they will be forfeited and Mr. Smith will not realize the value of such shares. As of the date of this filing, none of the

Axon Enterprise, Inc. | 2019 Proxy Statement | 36
operational goals for this grant have been achieved and no options subject to this grant have vested. See “Executive Compensation — Compensation Discussion and Analysis — Our Compensation Programs — CEO Performance Award” above.
(3) The number of shares that ultimately vest is based upon the Company's compounded annual revenue growth rate compared to target for the three-year period ending December 31, 2020. Earned PSUs cliff vest at the end of that period. Should actual performance metrics exceed targeted metrics, executive will receive additional PSUs, up to a maximum of 200% of target.
(4) Payouts under the 2018 annual cash incentive plan are based on the achievement of annual financial goals, including goals related to: total booked contract value; new booked seats; EBITDA; increase in net promoter score; increase in customer engagement with the Axon network; percentage of U.S. customers on a CEW service plan; and top 1200 customer churn. Actual awards earned in 2018 were included in the Non-Equity Incentive Plan Compensation column in the Summary Compensation Table.
(5) Mr. Isner was eligible for commissions based on bookings growth for the Company. There was no maximum amount related to these commissions. Actual commissions earned in 2018 were included in the Non-Equity Incentive Plan Compensation column in the Summary Compensation Table.
OUTSTANDING EQUITY AWARDS AT FISCAL 2018 YEAR-END
The following table includes certain information with respect to all outstanding equity awards previously awarded to the NEOs as of December 31, 2018.
Option Awards Stock Awards
Name
Equity Incentive Plan
Awards: Number of Securities
Underlying Unexercised Unearned
Options (#)
Option Exercise
Price ($)
Option Expiration
Date
Number ofShares or
Unitsof Stock
ThatHave Not
Vested(#)
Market Value
of Shares or Unitsof Stock
That Have Not Vested
($)
Equity Incentive Plan Awards:
Number of Unearned Shares,
Units or Other Rights That Have
Not Vested(#)
Equity Incentive Plan Awards:
Market or Payout Value of Unearned
Shares, Units or Other Rights
That Have Not Vested
($)
Patrick W. Smith 6,365,856 (1) 28.58 2/26/2857,258 (2) 2,505,038 40,032 (3) 1,751,40015,154 (4) 662,988 62,241 (5) 2,723,0449,393 (6) 410,9445,533 (7) 242,069
Luke S. Larson — — —30,135 (2) 1,318,406 16,013 (3) 700,56914,728 (8) 644,350 24,896 (5) 1,089,2004,038 (4) 176,663
22,690 (6) 992,6884,150 (7) 181,563
Jawad A. Ahsan — — —44,445 (9) 1,944,469 6,667 (3) 291,68111,066 (7) 484,138 24,896 (5) 1,089,200
— — 7,239 (10) 316,706Joshua M. Isner — — —
12,054 (2) 527,363 5,004 (3) 218,9255,892 (8) 257,775 16,598 (5) 726,163
12,013 (6) 525,5692,766 (7) 121,013
Douglas E. Klint — — — — — — —
(1) This grant is intended to compensate Mr. Smith over its ten-year term and will become vested as to all shares subject to it only if both market capitalization and internal operational goals are attained during such ten year period. 1/12th of the total number of shares subject to the options will become vested and exercisable upon certification by the Board of Directors that both: (i) one of the market capitalization goals is achieved; and (ii) one of sixteen specified internal operational goals relating to financial results is attained, subject to Mr. Smith’s continued service at each such vesting event. If any tranches

Axon Enterprise, Inc. | 2019 Proxy Statement | 37
have not vested by the end of the ten-year term of the award, they will be forfeited and Mr. Smith will not realize the value of such shares. As of the date of this filing, none of the operational goals for this grant have been achieved and no options subject to this grant have vested. See “Executive Compensation — Compensation Discussion and Analysis — Our Compensation Programs — CEO Performance Award” above.
(2) These stock awards are performance based. The number of shares that ultimately vested was based on the compounded annual revenue growth rates for the total Company (50% of target shares) and Software and Sensors segment (50% of target shares) compared to target for the three-year period ending December 31, 2018. Based upon the performance achieved, the number of shares that vested in February 2019 were 186.6% of target, which has been presented in the above table.
(3) These stock awards are performance based. The number of shares that ultimately vest is based upon the Company's compounded annual revenue growth rate (50% of target shares) and its compounded annual international bookings growth rate (50% of target shares) both compared to target for the three-year period ending December 31, 2019. These stock awards are scheduled to vest in February 2020. The number of unvested shares presented equals the target shares.
(4) These stock awards vest at annual intervals over a three-year period and became fully vested in February 2019.(5) These stock awards are performance based. The number of shares that ultimately vest is based upon the Company's
compounded annual revenue growth rate (80% of target shares) and its compounded annual EBITDA growth rate (20% of target shares) both compared to target for the three-year period ending December 31, 2020. These stock awards are scheduled to vest in February 2021. The number of unvested shares presented equals the target shares. Reference is made to the “Compensation Discussion and Analysis--Performance-Based Incentive Plans” section above for further information about these awards.
(6) These stock awards vest at annual intervals over a three-year period and become fully vested in December 2019.(7) These stock awards vest at annual intervals over a three-year period and become fully vested in December 2020.(8) These stock awards vest at annual intervals over a five-year period and become fully vested in February 2020.(9) This stock award vests at annual intervals over a five-year period and becomes fully vested in April 2022.(10) This stock award is performance-based. The number of shares that ultimately vest is based upon the Company's compounded
annual revenue growth rate compared to target for the three-year period ending December 31, 2019. This stock award is scheduled to vest in February 2020. The number of unvested shares presented equals the target shares.
2018 OPTION EXERCISES AND STOCK VESTED
The following table provides information related to option exercises and vested stock awards for each NEO during the year ended December 31, 2018:
Option Awards Stock Awards
Name
Number ofShares
Acquired onExercise (#)
Value Realized onExercise ($)
Number ofShares
Acquired uponVesting (#)
Value Realized onVesting ($)
Patrick W. Smith 518,397 $ 22,731,332 73,716 $ 2,684,107Luke S. Larson — — 72,428 3,028,476Jawad A. Ahsan — — 16,643 712,523Joshua M. Isner — — 26,135 1,040,385Douglas E. Klint 25,000 1,628,250 15,353 571,298

Axon Enterprise, Inc. | 2019 Proxy Statement | 38
2018 NON-QUALIFIED DEFERRED COMPENSATION
On July 1, 2013 the Company adopted the TASER International, Inc. Deferred Compensation Plan ("DCP"). The DCP allows eligible executives, key employees and non-employee directors through which participants may elect to defer the receipt and taxation of a portion of their compensation. Compensation, as defined in the DCP, is comprised of base salary, bonus, commission, director fees, and such other cash or equity-based compensation approved by the Compensation Committee. Participants may elect to defer up to 80% of their base salary and up to 100% of other types of compensation. Participants are 100% vested at all times in amounts deferred pursuant to the DCP. All gains or losses are allocated fully to plan participants, and the Company does not guarantee a rate of return on deferred balances. There were no above-market returns for participants in the plan.
The following table provides information on NEO and Director participation in the DCP:
Name
ExecutiveContributions in
Last FY($)(1)
RegistrantContributions in
Last FY($)(1)(2)
AggregateEarnings in Last
FY($)(2)(3)
AggregateWithdrawals/Distributions
($)
Aggregate Balance atLast FYE
($)
Patrick W. Smith — — 433,141 (665,945) 1,101,100Joshua M. Isner 77,808 3,112 (28,009) — 307,845
(1) The amounts included in the table as executive contributions and registrant contributions in the last fiscal year were all reported as compensation in 2018 in the Summary Compensation Table.
(2) The Company does not make discretionary payments to the plan, but does make a restorative 401(k) match contribution to participants as their eligible wages for 401(k) purposes is net of contributions made to the deferred compensation plan.
(3) Aggregate earnings reflected represent deemed investment earnings from voluntary deferrals and Company contributions, as applicable. No amounts included in aggregate earnings are reported in the 2018 Summary Compensation Table because the plan does not provide for above-market or preferential earnings.

Axon Enterprise, Inc. | 2019 Proxy Statement | 39
POTENTIAL PAYMENTS UPON TERMINATION OR CHANGE OF CONTROL
Pursuant to the employment agreements, the Company may terminate each of the NEOs with or without cause. The conditions or events triggering the payment of severance benefits include the executive’s death, disability, termination without cause, termination for good reason, or termination following a change in control of the Company (i.e., double-trigger). Conditions to the payment of severance benefits include covenants relating to assignment of inventions, nondisclosure of Company confidential information, and non-competition with the Company for a period of 12 months after termination of employment. For Mr. Smith, benefits are determined pursuant to the CEO Performance Award.
The severance benefit amounts with respect to the above triggering events were determined based on competitive practices. The Company agreed to pay these variable amounts of compensation as severance benefits or change of control benefits in order to attract and retain NEOs.
The table below depicts the severance payable to each under the conditions indicated:
Termination Termination without Cause Termination due to Name with Cause or for Good Reason Change in Control Death or Disability
Luke S. Larson Earned but unpaidsalary and benefits
12 months salary; earnedbut unpaid bonuses
36 months salary;earned but unpaid
bonuses
18 months salary;earned but unpaid
bonusesJawad A. Ahsan 90 days salary 24 months salary; earned
but unpaid bonuses36 months salary;earned but unpaid
bonuses
18 months salary;earned but unpaid
bonusesJoshua M. Isner Earned but unpaid
salary and benefits
12 months salary; earnedbut unpaid commissions
36 months salary;earned but unpaid
commissions
18 months salary;earned but unpaid
commissionsDouglas E. Klint
Earned but unpaidsalary and benefits
12 months salary; earnedbut unpaid bonuses
36 months salary;earned but unpaid
bonuses
18 months salary;earned but unpaid
bonuses
For all NEOs, all non-vested RSUs and PSUs may immediately vest at target levels and restrictions would lapse. Accelerated vesting conditions are as follows:
• Termination with cause: no accelerated vesting• Termination without cause or for Good Reason and Termination due to Death or Disability: except for Mr.
Smith, acceleration of time-based awards. • Termination following a Change in Control: except for Mr. Ahsan, acceleration of all awards (both
performance-based and time-based). For Mr. Ahsan, only time-based awards would accelerate.
For Mr. Smith, additional accelerated vesting conditions pursuant to the CEO Performance Award are as follows:
Termination Termination Name with Cause without Cause Change of Control Death or Disability
Patrick W. Smith
Any tranches of theCEO PerformanceAward for which
the operational andmarket
capitalization goalshave been achievedas of the last date
of employment areimmediately vested
CEO Performance Awardoperational goals are
disregarded and marketcapitalization is
calculated as of the lastdate of employment; next
unattained tranche willpartially vest on aprorated basis by
comparing the six-monthmarket capitalization to
the goal
CEO PerformanceAward operational
goals are disregardedand an alternative
market capitalizationcalculation is utilized
for purposes ofdeterminingattainment of
unvested tranches,plus one additional
tranche
Any tranches of theCEO PerformanceAward for which
the operational andmarket
capitalization goalshave been achievedas of the last date
of employment areimmediately vested

Axon Enterprise, Inc. | 2019 Proxy Statement | 40
The table below reflects the severance compensation that would be provided to each of the NEOs of the Company assuming the termination of such executive’s employment occurred on December 31, 2018.
Named Executive Officer
Voluntary TerminationBy Executive
Terminationwith Cause
Termination without
Cause or for Good Reason (1)
Change ofControl (1)
Death orDisability (1)
Patrick W. Smith (2) $ — $ — $ 15,914,000 $ 23,215,782 $ —Luke S. Larson — — 2,511,887 5,658,218 2,674,387Jawad A. Ahsan — 73,973 3,284,105 3,584,105 3,134,105Joshua M. Isner — — 1,649,300 3,427,013 1,786,800Douglas E. Klint — — 555,499 1,155,499 705,499
(1) Includes the intrinsic value of non-vested performance stock options under the CEO Performance Award which would immediately vest and become exercisable as well as the value of non-vested PSUs and RSUs which would immediately vest and restrictions would lapse. For Mr. Smith, all RSUs accelerate only upon a termination following a change of control.
The value of RSU acceleration is equal to the $43.75 closing market price of shares of the Company’s common stock on December 31, 2018, multiplied by the number of units that would accelerate.
The following table shows the value of the accelerated RSU and PSU vesting as described above. As described above, performance-based awards accelerate only upon termination due to change of control.
Named Executive Officer
Total Time-Based AwardAcceleration
Total Performance-Based AwardAcceleration Total Acceleration
Patrick W. Smith $ 1,316,000 $ 5,816,913 $ 7,132,913Luke S. Larson $ 1,995,263 $ 2,496,331 $ 4,491,595Jawad A. Ahsan 2,428,606 — 2,428,607Joshua M. Isner 904,356 1,227,713 2,132,070Douglas E. Klint — — —
(2) Amounts for Mr. Smith consist of the value of the accelerated vesting of performance stock options under the CEO Performance Award, and, for a termination following a change in control, accelerated vesting of outstanding RSUs and PSUs.
AUDIT MATTERS
REPORT OF THE AUDIT COMMITTEE
The Audit Committee of the Board of Directors reviews the Company’s financial reporting process on behalf of the Board. The Audit Committee has sole authority to retain, set compensation and retention terms for, terminate, oversee and evaluate the work of the Company’s independent auditor. The independent auditor reports directly to the Audit Committee.
The Company’s management is responsible for the Company’s financial reporting process including its system of internal controls, and for the preparation of consolidated financial statements in accordance with accounting principles generally accepted in the United States. Grant Thornton LLP, the Company’s independent registered public accounting firm, is responsible for expressing an opinion based on their audits of the consolidated financial statements. In accordance with its written charter, the Audit Committee assists the Board of Directors in its oversight of (i) the integrity of the Company’s financial statements and the Company’s financial reporting processes and systems of internal control, (ii) the qualifications, independence and performance of the Company’s independent public accounting firm and the performance of the Company’s internal audit function, (iii) the Company’s compliance with legal and regulatory

Axon Enterprise, Inc. | 2019 Proxy Statement | 41
requirements involving financial, accounting and internal control matters, (iv) investigations into complaints concerning financial matters and (v) risks that may have a significant impact on the Company’s financial statements.
Further, the Audit Committee reviews reports prepared by management on various matters including critical accounting policies and issues, material written communications between the independent auditor and management, significant changes in the Company’s selection or application of accounting principles and significant changes to internal control procedures. It is not the duty or responsibility of the Audit Committee to conduct auditing and accounting reviews or procedures.
In discharging its oversight responsibilities with respect to the audit process, the Audit Committee (i) obtained from the independent public accounting firm a formal written statement describing all relationships between the independent public accounting firm and the Company that might bear on the independent public accounting firm’s independence consistent with the applicable requirements of the Public Company Accounting Oversight Board (“PCAOB”), (ii) discussed with the independent auditing firm any relationships that may impact its objectivity and independence, and (iii) considered whether any non-audit services provided to the Company by Grant Thornton LLP are compatible with maintaining their independence. The Audit Committee also discussed with the independent auditing firm their identification of audit risk, audit plans and audit scope, as well as all communications required by generally accepted auditing standards, including those described in Auditing Standard No. 1301, “Communications with Audit Committees” issued by the PCAOB.
The Audit Committee reviewed and discussed with management and its independent public auditors our annual audited financial statements and quarterly financial statements, including a review of the “Managements’ Discussion and Analysis of Financial Condition and Results of Operations” included in the Company’s Form 10-K and 10-Q filings, as well as the Company’s earnings letters and information related thereto.
During fiscal year 2018, the Audit Committee met with representatives of the independent public accounting firm, both with management present and in private sessions without management present, to discuss the results of the financial statement audit and quarterly reviews and to solicit their evaluation of the Company’s accounting principles, practices and judgments applied by management and the quality and adequacy of the Company’s internal controls.
In performing the above described functions, the Audit Committee acts only in an oversight capacity and necessarily relies on the work and assurances of the Company’s management and independent public accounting firm, which, in the independent public accounting firm’s report, expresses an opinion on the conformity of the Company’s annual financial statements to accounting principles generally accepted in the United States.
Based upon the Audit Committee’s discussion with the Company’s management and Grant Thornton LLP, and the Audit Committee’s review of the representations of the Company’s management and the report of the independent public accountants to the Audit Committee, the Audit Committee recommended to the Board that the audited financial statements be included in the Company’s Annual Report on Form 10-K for the fiscal year ended December 31, 2018. The Audit Committee also approved the selection of Grant Thornton LLP as the Company’s independent auditor for the fiscal year 2019.
February 27, 2019
The Audit Committee:
Michael Garnreiter, ChairmanMatthew McBrady
Julie Cullivan
The foregoing Report of the Audit Committee does not constitute soliciting material and should not be deemed filed or incorporated by reference into any other Company filing under the Securities Act of 1933 or Securities Exchange Act of 1934, except to the extent the Company specifically incorporates this Report by express reference therein.

Axon Enterprise, Inc. | 2019 Proxy Statement | 42
PROPOSALS
Overview of Proposals
This proxy statement contains five proposals requiring shareholder action.
• Proposal No. 1 requests the election of the two Class A directors of the Company named in this proxy statement for a term of three years, and until their successors are elected and qualified.
• Proposal No. 2 requests that shareholders vote to approve, on an advisory basis, the compensation of the Company's named executive officers.
• Proposal No. 3 requests the ratification on the appointment of Grant Thornton LLP as the Company’s independent registered public accounting firm for fiscal year 2019.
• Proposal No. 4 requests that shareholders vote to approve an amendment to the Company's Certificate of Incorporation to declassify the Board of Directors.
• Proposal No. 5 is a shareholder proposal that the Board take the necessary steps to remove the super-majority vote requirement to approve amendments to the Company's Charter and Bylaws, and to replace with a simple majority vote requirement.
Each proposal is discussed in more detail below.
PROPOSAL NO. 1 - ELECTION OF DIRECTORS
The Board is elected by and accountable to the shareholders to oversee their interest in the long-term health and the overall success of the Company’s business and its financial strength. The Board serves as the ultimate decision-making body of the Company except for those matters reserved to, or shared with, the shareholders. The Board selects and oversees the members of senior management, who are charged by the Board with conducting the business of the Company.
Election Process
The Board is currently comprised of eight directors. The directors are divided into three classes comprised as follows: two directors in Class A, three directors in Class B, and three directors in Class C. One class is elected each year for a three-year term and until their successors are elected and qualified. The classes of prospective directors will be determined upon appointment.
The two director nominees in Class A are up for nomination at the 2019 Annual Meeting. These directors would serve regular three-year terms until the annual meeting of shareholders in 2022, or until their respective successors are elected and qualified. These Class A directors are: Michael Garnreiter and Hadi Partovi.
The Board has no reason to believe that any of the nominees will be unwilling or unable to serve if elected a director. If any nominee is unable or unwilling to serve as a director at the date of the Annual Meeting or any postponement or adjournment thereof, the proxies may be voted for a substitute nominee, designated by the Board to fill such vacancy.
Unless marked otherwise, signed proxies received will be voted FOR the election of each of the nominees.
The Board of Directors recommends a vote FOR the election of Michael Garnreiter and Hadi Partovi.

Axon Enterprise, Inc. | 2019 Proxy Statement | 43
Vote RequiredFor Proposal No. 1, under our bylaws, assuming the existence of a quorum at the Annual Meeting, the twonominees for director who receive the affirmative vote of a plurality of all of the votes cast will be elected to theBoard of Directors. This means that the two director nominees with the most votes will be elected. Votes towithhold and broker non-votes will be counted toward a quorum, but will not affect the outcome of the vote on theelection of directors.

Axon Enterprise, Inc. | 2019 Proxy Statement | 44
PROPOSAL NO. 2 - ADVISORY APPROVAL OF THE COMPANY’S EXECUTIVE COMPENSATION
Shareholders will be given the opportunity to vote on the following advisory resolution (commonly referred to as “say on pay”):
RESOLVED, that the shareholders of Axon Enterprise, Inc. hereby approve the compensation paid to the Company’s NEOs, as disclosed pursuant to Item 402 of Regulation S-K, including the Compensation Discussion and Analysis, compensation tables and narrative discussion set forth in this proxy statement.
Background on Proposal
In accordance with the requirements of Section14A of the Exchange Act and related SEC rules, shareholders are being given the opportunity to vote at the annual meeting on this advisory resolution regarding the compensation of our NEOs.
As described in the Compensation Discussion and Analysis, our executive compensation program is designed to allow us to: attract and retain talent, link annual incentive compensation to our financial results produced during year, and link long term compensation in the form of stock awards to Company performance and enhancement of shareholder value. For a comprehensive description of our executive compensation program, philosophy and objectives, including the specific elements of executive compensation that comprised the program in 2018, please refer to the Compensation Discussion and Analysis. The Summary Compensation Table and other executive compensation tables (and accompanying narrative disclosures), provide additional information about the compensation that we paid to our NEOs in 2018.
In addition, at our 2017 Annual Meeting of Shareholders, the shareholders indicated, on an advisory vote basis, that they preferred that we hold Say on Pay votes on an annual basis (a frequency vote is required to be held at least once every six years). In light of these results, the Company’s Board of Directors decided to hold its future advisory votes on the compensation of named executive officers annually until the next frequency vote, which will be held on or before our 2023 Annual Meeting.
Effects of Advisory Vote
Because the vote on this proposal is advisory in nature, it will not affect any compensation already paid or awarded to our NEOs and will not be binding on the Board or the Compensation Committee. However, the Compensation Committee will consider the outcome of the vote when making future executive compensation decisions.
Overview and Summary; Consideration of Prior Year Say on Pay Vote
The Company believes in competitive compensation aligned with the values, objectives and financial performance of the Company. In 2018, 2017 and 2016, a significant amount of our executives’ potential total compensation was tied to performance. The Compensation Committee considers the performance criteria for the Company’s performance-based compensation challenging, but achievable. With the exception of the CEO Performance Award, for the years 2018, 2017, and 2016, performance-based targets were achieved.
At the 2018 Annual Meeting of Shareholders (“2018 Annual Meeting”), we presented to shareholders, for advisory approval, the Company’s executive compensation (“Say on Pay”). Of the 37.0 million votes cast on the Say on Pay vote (including abstentions), 97% were favorable for our Say on Pay resolution. The Compensation Committee considered this a favorable outcome and believed it conveyed our shareholders' support of the Compensation Committee’s decisions and existing executive compensation programs.
Our compensation opportunities for our named executive officers are predominantly delivered in the form of performance-based awards, including equity-based awards, which are designed to promote incentives that are aligned with long-term stockholder interests. It is the Committee’s intent that the total compensation for our NEOs be competitive to attract and retain highly qualified individuals who are capable of making significant contributions critical to our long-term success. The Compensation Committee will continue to consider the results from this year’s and future advisory votes on executive compensation.

Axon Enterprise, Inc. | 2019 Proxy Statement | 45
Unless marked to the contrary, proxies received will be voted FOR approval of the advisory vote on executive compensation.
The Board of Directors unanimously recommends a vote FOR approval of the resolution set forth above regarding the compensation of our named executive officers.
Vote RequiredFor Proposal No. 2, assuming the existence of a quorum at the Annual Meeting, the affirmative vote of a majorityof the total votes of share of common stock properly cast for or against the proposal, in person or represented byproxy at the meeting and entitled to vote on this proposal is required for approval. Abstentions and broker non-votes will have no impact on this proposal if a quorum is present.

Axon Enterprise, Inc. | 2019 Proxy Statement | 46
PROPOSAL NO. 3 - RATIFICATION OF APPOINTMENT OF INDEPENDENT REGISTERED PUBLIC ACCOUNTING FIRM
The Audit Committee has appointed Grant Thornton LLP, independent registered public accounting firm, to audit the consolidated financial statements of the Company for the year ending December 31, 2019. Grant Thornton LLP has acted as the independent registered public accounting firm for the Company since 2005. A representative of Grant Thornton LLP is expected to be present at the Annual Meeting, will have the opportunity to make a statement and is expected to be available to respond to appropriate questions.
Shareholder ratification of the selection of Grant Thornton LLP as our independent registered public accounting firm is not required by our bylaws or otherwise. Nonetheless, the Audit Committee is submitting the selection of Grant Thornton LLP to the shareholders for ratification as a matter of good corporate practice and because the Audit Committee values the views of our shareholders on our independent auditors.
If the shareholders fail to ratify the election, the Audit Committee will reconsider the appointment of Grant Thornton LLP. Even if the selection is ratified, the Audit Committee, in its discretion, may appoint a different independent registered public accounting firm at any time during the year if it determines that such an appointment would be in the Company’s best interest.
If the appointment is not approved by the shareholders, the adverse vote will be considered a direction to the Audit Committee to consider other auditors for next year. However, because of the difficulty in making any substitution of auditors so long after the beginning of the current year, the appointment in 2019 will stand, unless the Audit Committee finds other good reason for making a change.
Audit and Non-Audit Fees
The following table presents fees for audit, tax and other professional services rendered by Grant Thornton LLP for the years ended December 31, 2018 and 2017.
2018 2017
Audit fees $ 1,204,190 $ 1,413,067Audit-Related Fees — —Tax Fees — 35,513All Other Fees — —
$ 1,204,190 $ 1,448,580
Audit Fees: Consisted of fees billed for professional services rendered for the audit of Axon Enterprise, Inc.’s financial statements, fees billed related to Sarbanes-Oxley 404 review and services normally provided by Grant Thornton LLP in connection with statutory and regulatory filings or engagements and fees.
Audit-Related Fees: Audit-related fees related to professional services that are reasonably related to the performance of the audit or review of Axon's consolidated financial statements. No such services were rendered during the years ended December 31, 2018 or 2017.
Tax Fees: Consisted of fees billed principally for services provided in connection with worldwide tax consulting and planning services. No such services were rendered during the year ended December 31, 2018.
All Other Fees: All other fees related to services not included in the categories above, including services related to other regulatory reporting requirements. No such services were rendered during the years ended December 31, 2018 or 2017.

Axon Enterprise, Inc. | 2019 Proxy Statement | 47
Policy on Audit Committee Pre-Approval of Audit and Permissible Non-Audit Services of Independent Auditor
Consistent with SEC policies regarding auditor independence, the Audit Committee must pre-approve all audit and permissible non-audit services provided by our independent auditors. Our Non-Audit Services Pre-Approval Policy covers all services to be performed by our independent auditors. The policy contemplates a general pre-approval for all audit, audit-related, tax and all other services that are permissible, with a general pre-approval period of twelve months from the date of each pre-approval. Any other proposed services that are to be performed by our independent auditors, not covered by or exceeding the pre-approved levels or amounts, must be specifically approved in advance.
Prior to engagement, the Audit Committee pre-approves the following categories of services. These fees are budgeted, and the Audit Committee requires the independent auditors and management to report actual fees versus the budget periodically throughout the year, by category of service.
• Audit services include the annual financial statement audit (including required quarterly reviews) and other work required to be performed by the independent auditors to be able to form an opinion on our consolidated financial statements. Such work includes, but is not limited to, services associated with SEC registration statements, periodic reports, SEC reviews and other documents filed with the SEC or other documents issued in connection with securities offerings.
• Audit-related services are for services that are reasonably related to the performance of the audit or review of our financial statements or that are traditionally performed by the independent auditor. Such services typically include but are not limited to, due diligence services pertaining to potential business acquisitions or dispositions, accounting consultations related to accounting, financial reporting or disclosure matters not classified as “audit services,” statutory audits or financial audits for subsidiaries or affiliates, and assistance with understanding and implementing new accounting and financial reporting guidance.
• Tax services include all services performed by the independent auditors’ tax personnel, except those services specifically related to the financial statements, and includes fees in the area of tax compliance, tax planning and tax advice.
The Company’s CFO has the authority to engage the Company’s independent registered public accounting firm for amounts less than $5,000. There were no audit–related fees, tax fees or other fees in 2018.
The Audit Committee has considered and concluded that the provision by Grant Thornton LLP of non-audit services is compatible with Grant Thornton maintaining its independence.
Unless marked to the contrary, proxies received will be voted FOR ratification of the appointment of Grant Thornton LLP as the Company’s independent registered public accounting firm for the year ending December 31, 2019.
The Board of Directors recommends a vote FOR ratification of the appointment of Grant Thornton LLP as the Company’s independent registered public accounting firm for fiscal 2019.
Vote RequiredFor Proposal No. 3, assuming the existence of a quorum at the Annual Meeting, the affirmative vote of a majorityof the total votes of share of common stock properly cast for or against the proposal, in person or represented byproxy at the meeting and entitled to vote on this proposal is required for approval. Abstentions and broker non-votes will have no impact on this proposal if a quorum is present.

Axon Enterprise, Inc. | 2019 Proxy Statement | 48
PROPOSAL NO. 4 - AMENDMENT TO OUR CERTIFICATE OF INCORPORATION TO DECLASSIFY OUR BOARD OF DIRECTORS
Our Board of Directors has adopted resolutions proposing to amend Section 5 of the Company’s Certificate of Incorporation (the “certificate of incorporation”) to declassify the Board of Directors over a three-year period commencing at the 2020 annual meeting of shareholders.
General Information on the Proposed Amendment
Pursuant to Section 5 of our certificate of incorporation, the Board of Directors is divided into three classes, designated Class A, Class B and Class C. Each class consists, as nearly equal in number as may be possible, of one-third of the total number of directors constituting the entire Board of Directors, with each class of directors elected to serve three-year staggered terms of office. If the proposed amendment is adopted at the annual meeting, the classified (three-year, staggered term) board structure would be phased out, and the annual election of the entire Board of Directors for a one-year term would be phased in over a three-year period commencing at the 2020 annual meeting of shareholders and concluding at the 2022 annual meeting of shareholders. If the proposed amendment is adopted, from and after the 2020 annual meeting of shareholders, each member of the Board of Directors whose term expires would be elected to serve an annual (one-year) term.
If adopted, the proposed amendment would not affect the nominees for director who are elected at this annual meeting, and the term of office of such directors would expire at the 2022 annual meeting of shareholders (see Proposal No. 1 - Election of Directors). Therefore, directors who are elected at this annual meeting would be the final class of directors elected to serve for a three-year term. If adopted, the proposed amendment would not affect the term of any director currently serving in a class who was elected prior to this meeting, each of whom will complete his or her three-year term expiring at the 2020 annual meeting of shareholders or the 2021 annual meeting of shareholders, as applicable. If the proposed amendment is adopted, nominees elected at the 2020 annual meeting of shareholders would become the first group of directors elected to serve for an annual (one-year) term, and nominees elected at all annual meetings subsequent to the 2020 annual meeting of shareholders also would be elected to serve for an annual (one-year) term expiring at the immediately following annual meeting.
Considerations and Reasons for the Proposed Amendment
Our Board of Directors resolved to adopt and recommend the proposed amendment following the overwhelming support of the Company’s shareholders at the 2018 Annual Meeting of Shareholders for the non-binding advisory vote in favor of a shareholder proposal that the Board of Directors initiate a process to elect directors annually. Our Board also conducted a careful assessment of the risks and benefits of board declassification, which are described below, and reviewed the classified board structure in relation to the director election policies and practices that continue to evolve at S&P 500 and NASDAQ-listed companies.
In developing the proposed amendment, our Board of Directors considered the growing sentiment, particularly in the institutional investor community, favoring the annual election of directors. An increasing number of large companies provide for the annual election of directors, and many shareholders perceive that annual elections improve director accountability. In addition, proxy advisory firms, such as Institutional Shareholder Services, generally view declassification as a good corporate governance practice. Our Board of Directors concluded that it can continue to effectively oversee the management and protect the best interests of the Company and its shareholders under an annual-term election system. Our Board of Directors also considered the benefits of maintaining a classified board structure, which enhances stability and continuity with respect to the development and implementation of our Company’s long-term operating strategy and the successful execution of management’s strategic plan, and also helps to ensure that a majority of incumbent directors always have institutional knowledge and experience as directors of our Company. Our Board of Directors believes that a classified board structure provides an important measure of protection against unsolicited (or hostile) takeover attempts and tactics focusing on short-term financial gains, which may not be in the best long-term interests

Axon Enterprise, Inc. | 2019 Proxy Statement | 49
of all of the Company’s shareholders. Our Board further believes that a classified board structure provides directors with the time necessary to: fully evaluate the adequacy and fairness of any unsolicited takeover proposal; communicate with shareholders in a thoughtful, deliberate and fully informed manner regarding the merits and risks of an unsolicited takeover or change-in-control transaction and any strategic or financial alternatives that the Board of Directors believes are in the best interests of our Company and shareholders; deter certain manipulative and coercive takeover and change-in-control tactics; negotiate with enhanced bargaining power on behalf of all shareholders; and carefully weigh all strategic and financial alternatives to create value for all shareholders without the threat of the imminent removal of a majority or all of our Company’s directors by a single large shareholder or group of shareholders. When a board is not classified, the entire board can be replaced at a single annual meeting. Accordingly, if the proposed amendment is adopted, it would be easier for one or more shareholders holding a significant number of outstanding shares to seek to replace a majority of our Company’s directors, or the entire Board of Directors at once, whether or not in tandem with an acquisition proposal or offer for all of the Company’s shares and irrespective of the long- or short-term interests and objectives of such shareholder or shareholders.
Although our Board of Directors believes it is important to maintain appropriate defenses against potential inadequately priced, inopportunely timed, and coercive or manipulative takeover bids and tactics, it also believes it is vitally important to maintain shareholder confidence in the actions, decisions, policies and priorities of our Board of Directors by demonstrating that our Company’s directors listen carefully to the views, concerns and recommendations expressed by, and understand that they are accountable to, our shareholders. Accordingly, our Board of Directors has carefully considered the relative benefits and detriments of declassifying the Board of Directors and, for the reasons described above, our Board of Directors: has determined it is in the best interests of our shareholders to declassify the Board; has approved resolutions setting forth the proposed amendment to Section 5 of the certificate of incorporation; has resolved to submit the proposed amendment to shareholders for their consideration and adoption at this meeting; and has recommended that shareholders vote to adopt the proposed amendment.
Text of the Proposed Amendment to the Certificate of Incorporation
The general description of the proposed amendment to the certificate of incorporation set forth above is qualified in its entirety by reference to the complete text of the amendment, which is attached as Annex A to this proxy statement. If the proposed amendment is adopted at the 2019 annual meeting, it will become effective upon the filing by the Company with the Secretary of State of the State of Delaware of a certificate of amendment to the certificate of incorporation currently in effect.
Unless otherwise instructed, proxy holders will vote the proxies received by them FOR this proposal.
The Board of Directors recommends that the shareholders vote FOR the adoption of the proposed Amendment to Section 5 of our Certificate of Incorporation, as described above and as set forth in Annex A to this Proxy Statement.
Vote RequiredFor Proposal No. 4, the affirmative vote of the holders of 75% of the outstanding shares of our common stock is necessary to adopt the proposed amendment to our certificate of incorporation. Unless otherwise instructed, proxy holders will vote the proxies received by them FOR this proposal. Abstentions and broker non-votes will have the effect of a vote against this proposal.
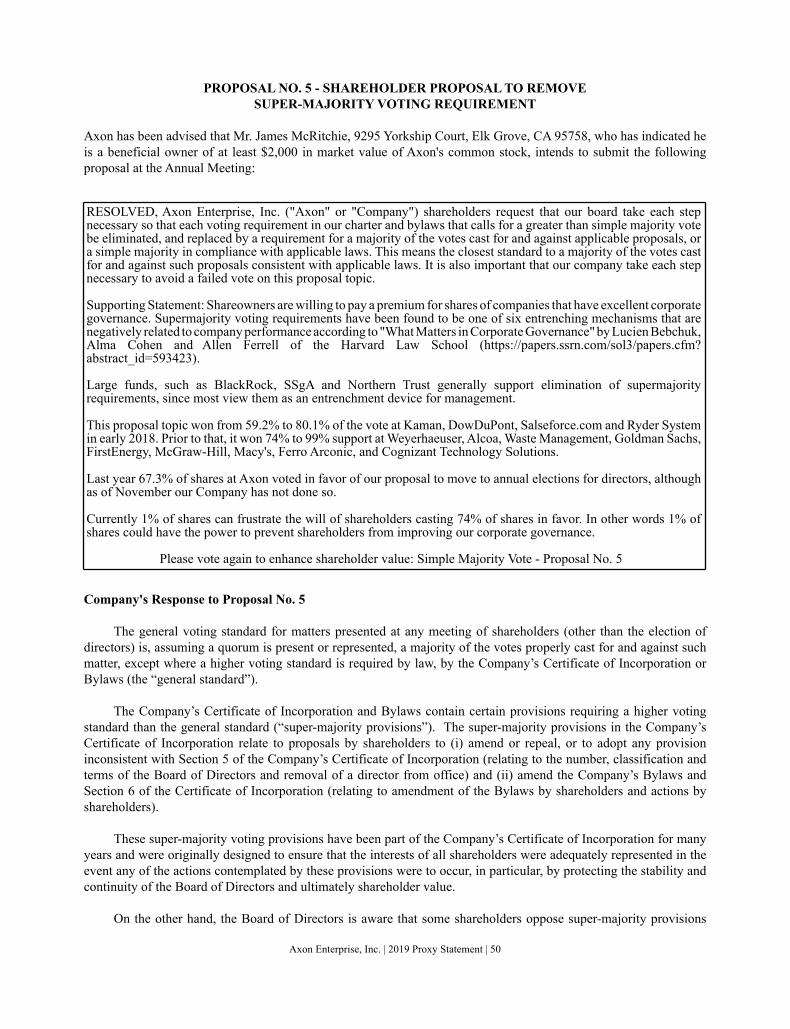
Axon Enterprise, Inc. | 2019 Proxy Statement | 50
PROPOSAL NO. 5 - SHAREHOLDER PROPOSAL TO REMOVE SUPER-MAJORITY VOTING REQUIREMENT
Axon has been advised that Mr. James McRitchie, 9295 Yorkship Court, Elk Grove, CA 95758, who has indicated he is a beneficial owner of at least $2,000 in market value of Axon's common stock, intends to submit the following proposal at the Annual Meeting:
RESOLVED, Axon Enterprise, Inc. ("Axon" or "Company") shareholders request that our board take each step necessary so that each voting requirement in our charter and bylaws that calls for a greater than simple majority vote be eliminated, and replaced by a requirement for a majority of the votes cast for and against applicable proposals, or a simple majority in compliance with applicable laws. This means the closest standard to a majority of the votes cast for and against such proposals consistent with applicable laws. It is also important that our company take each step necessary to avoid a failed vote on this proposal topic.
Supporting Statement: Shareowners are willing to pay a premium for shares of companies that have excellent corporate governance. Supermajority voting requirements have been found to be one of six entrenching mechanisms that are negatively related to company performance according to "What Matters in Corporate Governance" by Lucien Bebchuk, Alma Cohen and Allen Ferrell of the Harvard Law School (https://papers.ssrn.com/sol3/papers.cfm?abstract_id=593423).
Large funds, such as BlackRock, SSgA and Northern Trust generally support elimination of supermajority requirements, since most view them as an entrenchment device for management.
This proposal topic won from 59.2% to 80.1% of the vote at Kaman, DowDuPont, Salseforce.com and Ryder System in early 2018. Prior to that, it won 74% to 99% support at Weyerhaeuser, Alcoa, Waste Management, Goldman Sachs, FirstEnergy, McGraw-Hill, Macy's, Ferro Arconic, and Cognizant Technology Solutions.
Last year 67.3% of shares at Axon voted in favor of our proposal to move to annual elections for directors, although as of November our Company has not done so.
Currently 1% of shares can frustrate the will of shareholders casting 74% of shares in favor. In other words 1% of shares could have the power to prevent shareholders from improving our corporate governance.
Please vote again to enhance shareholder value: Simple Majority Vote - Proposal No. 5
Company's Response to Proposal No. 5
The general voting standard for matters presented at any meeting of shareholders (other than the election of directors) is, assuming a quorum is present or represented, a majority of the votes properly cast for and against such matter, except where a higher voting standard is required by law, by the Company’s Certificate of Incorporation or Bylaws (the “general standard”).
The Company’s Certificate of Incorporation and Bylaws contain certain provisions requiring a higher voting standard than the general standard (“super-majority provisions”). The super-majority provisions in the Company’s Certificate of Incorporation relate to proposals by shareholders to (i) amend or repeal, or to adopt any provision inconsistent with Section 5 of the Company’s Certificate of Incorporation (relating to the number, classification and terms of the Board of Directors and removal of a director from office) and (ii) amend the Company’s Bylaws and Section 6 of the Certificate of Incorporation (relating to amendment of the Bylaws by shareholders and actions by shareholders).
These super-majority voting provisions have been part of the Company’s Certificate of Incorporation for many years and were originally designed to ensure that the interests of all shareholders were adequately represented in the event any of the actions contemplated by these provisions were to occur, in particular, by protecting the stability and continuity of the Board of Directors and ultimately shareholder value.
On the other hand, the Board of Directors is aware that some shareholders oppose super-majority provisions

Axon Enterprise, Inc. | 2019 Proxy Statement | 51
because they may limit the ability of holders of a majority of our common stock to effect changes they desire. In fact, in response to concerns previously expressed by certain shareholders about the super-majority provisions in the Company’s Certificate of Incorporation, at the Company’s 2016 Annual Meeting management proactively presented, following the approval and recommendation of the Board of Directors, a proposal to amend the Company’s Certificate of Incorporation to remove the requirement of a super-majority vote to approve amendments to the Company’s Certificate of Incorporation and Bylaws. Although this proposal received the favorable vote of a slight majority (approximately 50.5%) of the shares of common stock outstanding on the record date for the 2016 Annual Meeting, it fell far short of the super-majority standard required to approve such amendment.
The Board of Directors does not support Proposal No. 5 because it disagrees with certain statements made in the proposal. For example, Proposal No. 5 states that 67.3% of shares of the Company voted in favor of a shareholder proposal at the 2018 Annual Meeting to move to annual elections of directors, but that the Company has not done so. Aside from not being relevant to subject matter of Proposal No. 5, in August 2018 the Board of Directors approved an amendment to the Company’s Certificate of Incorporation to de-stagger the Board of Directors and move to annual elections of directors. This amendment necessarily requires the approval of the Company’s shareholders, which the Board of Directors is seeking at this Annual Meeting (see Proposal No. 4). The Board of Directors respectfully disagrees with the insinuation the Company is not responsive to shareholder concerns. In addition, Proposal No. 5 states that 1% of shares of the Company can prevent shareholders from improving the Company’s corporate governance. This statement is misinforming because it applies to any voting standard. For example, where the outcome of any vote falls short of the vote required for passage by less than 1%, a shareholder holding 1% of shares could swing the voting outcome regardless of whether the voting standard is 33.33%, 50%, 66 2/3% or 75%. Similarly, where the outcome of any vote falls short of the vote required for passage by more than 1%, a shareholder holding 1% of shares cannot alter the outcome regardless of whether the voting standard is 33.33%, 50%, 66.23% or 75%.
However, the Board of Directors does not oppose Proposal No. 5 because the Board of Directors proactively recommended a similar management proposal to shareholders at the Company’s 2016 Annual Meeting in response to dialogue with its shareholders.
Accordingly, the Board of Directors is not recommending a vote for or against Proposal No. 5. Rather, the Board of Directors is interested in the viewpoints of the Company’s shareholders and will evaluate the voting results of Proposal No. 5 in determining what actions it will take. This evaluation will include considering: the voting results of this Proposal No. 5; the prior vote of shareholders on a similar proposal recommended by the Board of Directors at the Company’s 2016 Annual Meeting; and that the super-majority voting provisions, which the Board of Directors believes are favored by some shareholders to protect the stability and continuity of the Board of Directors and ultimately shareholder value, have been part of the Company’s Certificate of Incorporation for many years.
For Proposal No. 5, the Board of Directors will vote signed proxies in accordance with your instructions. Because the Board of Directors does not recommend for or against the shareholder proposal, proxies signed but where no voting instruction is indicated will not be voted for or against Proposal No. 5.
Vote RequiredFor Proposal No. 5, assuming the existence of a quorum at the Annual Meeting, the affirmative vote of a majority of the total votes of share of common stock properly cast for or against the proposal, in person or represented by proxy at the meeting and entitled to vote on this proposal is required for approval. Abstentions and broker non-votes will have no impact on this proposal if a quorum is present.

Axon Enterprise, Inc. | 2019 Proxy Statement | 52
OTHER MATTERS
CAUTIONARY STATEMENT REGARDING FORWARD-LOOKING STATEMENTS
This proxy statement contains forward-looking statements within the meaning of the Private Securities Litigation Reform Act of 1995. Statements in this proxy statement that are not historical facts are hereby identified as “forward-looking statements” for the purpose of the safe harbor provided by Section 21E of the Exchange Act, and Section 27A of the Securities Act. These forward-looking statements, including, without limitation, those relating to possible future market prices, market capitalization levels for Axon common stock and Axon's results of operations, wherever they occur in this proxy statement, are necessarily estimates reflecting the best judgment of the management of Axon and involve a number of risks and uncertainties that could cause actual results to differ materially from those suggested by the forward-looking statements. These forward-looking statements should, therefore, be considered in light of various important factors, including those set forth in this proxy statement.
Words such as “estimate,” “project,” “plan,” “intend,” “expect,” “anticipate,” “believe,” “would,” “should,” “could” and similar expressions are intended to identify forward-looking statements. These forward-looking statements are found at various places throughout this proxy statement. Important factors that could cause actual results to differ materially from those indicated by such forward-looking statements include those set forth in Axon’s filings with the SEC, including its Annual Report on Form 10-K for the fiscal year ended December 31, 2018, which accompanies this proxy statement.
Axon undertakes no obligation to publicly update any forward-looking statement, whether as a result of new information, future events or otherwise. In the event that Axon does update any forward-looking statement, no inference should be made that Axon will make additional updates with respect to that statement, related matters or any other forward-looking statements.
SHAREHOLDER PROPOSALS
To be eligible for inclusion in the Company’s proxy materials for the 2020 Annual Meeting of Shareholders, a proposal intended to be presented by a shareholder for action at that meeting must, in addition to complying with the shareholder eligibility and other requirements of the SEC’s rules governing such proposals, be received not later than December 20, 2019 by the Corporate Secretary of the Company at the Company’s principal executive offices, 17800 North 85th Street, Scottsdale, Arizona 85255.
Shareholders may bring business before an annual meeting of shareholders that is not submitted for inclusion in the Company's proxy materials (including the nomination of any person to be elected as a director) only if the shareholder proceeds in compliance with the Company’s bylaws. For business to be properly brought before an annual meeting of shareholders by a shareholder that is not submitted for inclusion in the Company's proxy materials (including the nomination of any person to be elected as a director), notice of the proposed business must be given to the Corporate Secretary of the Company in writing no later than 60 days before the annual meeting of shareholders or (if later) ten days after the first public notice of the meeting is sent to shareholders.
The notice to the Company’s Corporate Secretary must set forth as to each matter that the shareholder proposes to bring before the meeting: (a) the nature of the proposed business with reasonable particularity, including the exact text of any proposal to be presented for adoption, and the reasons for conducting that business at the annual meeting; (b) the shareholder’s name and address as they appear on the records of the Company, business address and telephone number, residence address and telephone number, and the number of shares of common stock of the Company directly or beneficially owned by the shareholder; (c) any interest of the shareholder in the proposed business; (d) the name or names of each person nominated by the shareholder to be elected or re-elected as a director, if any; and (e) with respect to any such director nominee, the nominee’s name, business address and telephone number, residence address and telephone number, the number of shares of common stock of the Company, if any, directly or beneficially owned by the nominee, all information relating to the nominee that is required to be disclosed in solicitations of proxies for elections of directors, or is otherwise required, under Regulation 14A of the Exchange Act or successor regulation, and

Axon Enterprise, Inc. | 2019 Proxy Statement | 53
a letter signed by the nominee stating the nominee’s acceptance of the nomination, the nominee’s intention to serve as a director if elected and consenting to being named as a nominee for director in any proxy statement relating to such election.
The presiding officer at any annual meeting shall determine whether any matter was properly brought before the meeting in accordance with the above provisions. If the presiding officer should determine that any matter has not been properly brought before the meeting, he or she will so declare at the meeting and any such matter will not be considered or acted upon.
HOUSEHOLDING OF ANNUAL MEETING MATERIALS
Some brokers and other nominee record holders may be participating in the practice of “householding” proxy statements and annual reports. This means that only one copy of the proxy statement and Annual Report may have been sent to multiple shareholders in a shareholder’s household. The Company will promptly deliver a separate copy of either document to any shareholder who contacts the Company’s investor relations department at 17800 North 85th Street, Scottsdale, Arizona 85255, phone number (480) 515-6330, requesting such copies. If a shareholder is receiving multiple copies of the proxy statement and Annual Report at the shareholder’s household and would like to receive a single copy of the proxy statement and annual report for a shareholder’s household in the future, shareholders should contact their broker, other nominee record holder, or the Company’s investor relations department to request mailing of a single copy of the proxy statement and annual report.
A copy of the Company’s Annual Report on Form 10-K for the fiscal year ended December 31, 2018, is available to shareholders without charge upon request to: Investor Relations, Axon Enterprise, Inc., 17800 North 85thStreet, Scottsdale, Arizona 85255.
IMPORTANT NOTICE REGARDING THE AVAILABILITY OF PROXYMATERIALS FOR THE SHAREHOLDER MEETING TO BE HELD ON MAY 31, 2019
The proxy materials for the Company’s Annual Meeting of Shareholders, including the 2018 Annual Report and this proxy statement, are available over the Internet by accessing the investor relations page of the Company’s website at http://investor.axon.com. Other information on the Company’s website does not constitute part of the Company’s proxy materials.
By Order of the Board of Directors,
/s/ DOUGLAS E. KLINT
Douglas E. KlintCorporate Secretary
April 16, 2019

Axon Enterprise, Inc. | 2019 Proxy Statement | A - 1
ANNEX A
AMENDED AND RESTATEDCERTIFICATE OF INCORPORATION
OFAXON ENTERPRISE, INC.
Axon Enterprise, Inc., a corporation organized and existing under and by virtue of the provisions of the General Corporation Law of the State of Delaware (the “Law”),
DOES HEREBY CERTIFY:
1. That the name of this corporation is Axon Enterprise, Inc. and that this corporation was originally incorporated pursuant to the General Corporation Law on January 5, 2001 under the name Taser International, Inc.
2. That the Board of Directors duly adopted resolutions proposing to amend and restate the Certificate of Incorporation of this corporation, declaring said amendment and restatement to be advisable and in the best interests of this corporation and its stockholders, and authorizing the appropriate officers of this corporation to solicit the consent of the stockholders therefor, which resolution setting forth the proposed amendment and restatement is as follows:
RESOLVED, that the Certificate of Incorporation of this corporation be amended and restated in its entirety to read as follows:
1. The name of the corporation is Axon Enterprise, Inc. (the “Corporation”).
2. The street and the mailing address of the Corporation’s registered office in the State of Delaware is Corporation Trust Center, 1209 Orange Street, City of Wilmington, County of New Castle, State of Delaware 19801. The name of its registered agent at such address is The Corporation Trust Company.
3. The purpose of the Corporation is to conduct any lawful business, to promote any lawful purpose, and to engage in any lawful act or activity for which corporations may be organized under the Law.
4. (a) The Corporation is authorized to issue a total of 225,000,000 shares of two classes of stock: 200,000,000 shares of Common Stock, par value $.00001 per share; and 25,000,000 shares of Preferred Stock, par value $.00001 per share.
(b) Holders of Common Stock are entitled to one vote per share on any matter submitted to the stockholders. On dissolution of the Corporation, after any preferential amount with respect to any series of Preferred Stock has been paid or set aside, the holders of Common Stock and the holders of any series of Preferred Stock entitled to participate in such distribution of assets are entitled to receive the net assets of the Corporation.
(c) The Board of Directors is authorized, subject to limitations prescribed by the Law and by the provisions of this Article 4, and to the approval of a majority of the Corporation’s independent and disinterested directors, to provide for the issuance of shares of Preferred Stock in series. The Board of Directors is further authorized to establish from time-to-time the number of shares to be included in each series and to determine the designations, relative rights, preferences and limitations of the shares of each series. The authority of the Board of Directors with respect to each series includes determination of the following:
(i) The number of shares in and the distinguishing designation of that series;
(ii) Whether shares of that series will have full, special, conditional, limited or no voting rights, except to the extent otherwise provided by the Law;

Axon Enterprise, Inc. | 2019 Proxy Statement | A - 2
(iii) Whether shares of that series will be convertible and the terms and conditions of the conversion, including provision for adjustment of the conversion rate in circumstances determined by the Board of Directors;
(iv) Whether shares of that series will be redeemable and the terms and conditions of the redemption, including the date or dates upon or after which they will be redeemable and the amount per share payable in case of redemption, which amount may vary under different conditions or at different redemption dates;
(v) The dividend rate, if any, on shares of that series, the manner of calculating any dividends and the preferences of any dividends;
(vi) The rights of shares of that series in the event of voluntary or involuntary dissolution of the Corporation and the right of priority of that series relative to the Common Stock and any other series of Preferred Stock on the distribution of assets on dissolution; and
(vii) Any other rights, preferences and limitations of that series that are permitted by the Law.
(d) No stockholder of the Corporation shall be entitled to any cumulative voting rights. The Board of Directors is authorized, subject to limitations prescribed by the Law, by resolution to create, issue and fix the terms of any preemptive or antidilution rights of any stockholder.
5. The number, classification and terms of the Board of Directors and the procedures to elect or remove directors and to fill vacancies on the Board of Directors shall be as follows:
(a) The number of directors that shall constitute the whole Board of Directors shall from time to time be fixed exclusively by the Board of Directors by a resolution adopted by a majority of the whole Board of Directors serving at the time of the vote. In no event shall the number of directors that constitute the whole Board of Directors be less than three (3) or more than nine (9). No decrease in the number of directors shall have the effect of shortening the term of any incumbent director.
(b) The Board of Directors of the Corporation shall be divided into three (3) classes designated Class A, Class B and Class C, respectively, as nearly equal in number as possible, with each director in office at the time of such initial classification receiving the classification approved by a majority of the Board of Directors. The initial term of office of directors of Class A shall expire at the annual meeting of stockholders of the Corporation in 2001, of Class B shall expire at the annual meeting of stockholders of the Corporation in 2002, and of Class C shall expire at the annual meeting of stockholders of the Corporation in 2003, and in all cases a director shall serve until the director’s successor is elected and qualified or until the director’s earlier death, resignation or removal. At each annual meeting of stockholders beginning with the annual meeting of stockholders in 2001, each director elected to succeed a director whose term is then expiring shall hold office until the third annual meeting of stockholders after his or her election and until his or her successor is elected and qualified or until his or her earlier death, resignation or removal. If the number of directors that constitutes the whole Board of Directors is changed as permitted by this Article, a majority of the whole Board of Directors that adopts the change shall also fix and determine the number of directors comprising each class; provided, however, that any increase or decrease in the number of directors shall be apportioned among the classes as equally as possible.
(b) Until the election of directors at the 2020 annual meeting of stockholders (each annual meeting of stockholders, an “Annual Meeting”), pursuant to Section 141(d) of the Law, the Board of Directors shall be divided into three classes of directors, Class A, Class B and Class C (each class as nearly equal in number as possible), with the directors in Class A having a term expiring at the 2022 Annual Meeting, the directors in Class B having a term expiring at the 2020 Annual Meeting and the directors in Class C having a term expiring at the 2021 Annual Meeting.
(c) Commencing with the election of directors at the 2020 Annual Meeting, pursuant to Section 141(d) of the Law, the Board of Directors shall be divided into two classes of directors, Class A and Class B, with the directors in Class A having a term that expires at the 2021 Annual Meeting and the directors in Class B having a term that expires at the 2022 Annual Meeting. The successors of the directors who, immediately prior to the 2020 Annual

Axon Enterprise, Inc. | 2019 Proxy Statement | A - 3
Meeting, were members of Class B (and whose terms expire at the 2020 Annual Meeting) shall be elected to Class A; the directors who, immediately prior to the 2020 Annual Meeting, were members of Class C (and whose terms were scheduled to expire at the 2021 Annual Meeting) shall become members of Class A for a term expiring at the 2021 Annual Meeting; and the directors who, immediately prior to the 2020 Annual Meeting, were members of Class A (and whose terms were scheduled to expire at the 2022 Annual Meeting) shall be members of Class B for a term expiring at the 2022 Annual Meeting.
(d) Commencing with the election of directors at the 2021 Annual Meeting, pursuant to Section 141(d) of the Law, there shall be a single class of directors, Class A, with all directors of such class having a term that expires at the 2022 Annual Meeting. The successors of the directors who, immediately prior to the 2021 Annual Meeting, were members of Class A (and whose terms expire at the 2021 Annual Meeting) shall be elected to Class A and the directors who, immediately prior to the 2021 Annual Meeting, were members of Class B (and whose terms were scheduled to expire at the 2022 Annual Meeting) shall become members of Class A for a term expiring at the 2022 Annual Meeting.
(e) From and after the election of directors at the 2022 Annual Meeting, the Board of Directors shall cease to be classified as provided in Section 141(d) of the Law, and the directors elected at the 2022 Annual Meeting (and each Annual Meeting thereafter) shall be elected for a term expiring at the next Annual Meeting.
(c) (f) Vacancies on the Board of Directors resulting from death, resignation, retirement, disqualification, removal from office or other cause, and newly created directorships resulting from any increase in the authorized number of directors, may be filled by no less than a majority vote of the remaining directors then in office, though less than a quorum, who are designated to represent the same class or classes of stockholders that the vacant position, when filled, is to represent or by the sole remaining director (but not by the stockholders except as required by the Law); provided that, with respect to any directorship to be filled by the Board of Directors by reason of an increase in the number of directors: (i) such directorship shall be for a term of office continuing only until the next election of one or more directors by the stockholders; and (ii) the Board of Directors may not fill more than two such directorships during the period between any two successive annual meetings of stockholders. Until the Board of Directors ceases to be classified pursuant to Section 5(e) above, each Each director chosen in accordance with this provision shall receive the classification of the vacant directorship to which he or she has been appointed or, if it is a newly-created directorship, shall receive the classification approved by a majority of the Board of Directors and shall hold office until the first meeting of stockholders held after his or her election for the purpose of electing directors of that classification and until his or her successor is elected and qualified or until his or her earlier death, resignation or removal from office.
(d) (g) A director may be removed from office before the expiration date of that director's term of office, with or without cause, only by an affirmative vote of the holders of 66.67% of the voting power of the then outstanding shares of capital stock entitled to vote thereon (the "Voting Stock"), voting together as a single class.
(e) (h) Notwithstanding any other provision of this Certificate of Incorporation or any provision of the Law that might otherwise permit a lesser or no vote, and in addition to any affirmative vote of the holders of any particular class or series of the capital stock of the Corporation required by the Law or by this Certificate of Incorporation, the affirmative vote of 75% of the Voting Stock, voting together as a single class, shall be required to amend or repeal, or to adopt any provision inconsistent with, this Article 5.
6. (a) All of the power of the Corporation, insofar as it may be lawfully vested by this Certificate of Incorporation in the Board of Directors, is hereby conferred upon the Board of Directors. In furtherance of and not in limitation of that power or the powers conferred by the Law, a majority of directors then in office (or such higher percentage as may be specified in the Bylaws with respect to any provision thereof) shall have the power to adopt, alter, amend and repeal the Bylaws of the Corporation, and notwithstanding any other provision of this Certificate of Incorporation or any provision of the Law that might otherwise permit a lesser or no vote, and in addition to any affirmative vote of the holders of any particular class or series of the capital stock of the Corporation required by the Law or by this Certificate of Incorporation, the Bylaws of the Corporation shall not be adopted, altered, amended or repealed by the stockholders of the Corporation except in accordance with the provisions of the Bylaws and by the vote of the holders of not less than 66.67% of the Voting Stock, voting together as a single class. Notwithstanding any other
Axon Enterprise, Inc. | 2019 Proxy Statement | A - 4
provision of this Certificate of Incorporation or any provision of the Law that might otherwise permit a lesser or no vote, and in addition to any affirmative vote of the holders of any particular class or series of the capital stock of the Corporation required by the Law or by this Certificate of Incorporation, the affirmative vote of the holders of not less than 66.67% of the Voting Stock, voting together as a single class, shall be required to amend or repeal, or to adopt any provision inconsistent with, this Article 6.
(b) Subject to the terms of any Preferred Stock, any action required or permitted to be taken by the stockholders of the Corporation must be taken at a duly called annual or special meeting of such stockholders or by written consent of all (but not less than all) stockholders entitled to vote in lieu of such a meeting.
7. A director of the Corporation shall not be personally liable to the Corporation or its stockholders for monetary damages for conduct as a director, provided that this Article does not eliminate the liability of any director for any act or omission for which such elimination of liability is not permitted under the Law. No amendment to the Law that further limits the acts or omissions for which elimination of liability is permitted will affect the liability of a director for any act or omission which occurs prior to the effective date of the amendment.
8. The Corporation may indemnify to the fullest extent not prohibited by law any person (an “Indemnified Person”) who is made, or threatened to be made, a party to an action, suit or proceeding, whether civil, criminal, administrative, investigative or other (including an action, suit or proceeding by or in the right of the Corporation), by reason of the fact that such person is or was a director, officer, employee or agent of the Corporation or a fiduciary within the meaning of the Employee Retirement Income Security Act of 1974 with respect to any employee benefit plan of the Corporation, or serves or served at the request of the Corporation as a director, officer, employee or agent, or as a fiduciary of an employee benefit plan, of another corporation, partnership, joint venture, trust or other enterprise. The Corporation may, in its sole discretion, pay for or reimburse the reasonable expenses incurred by any Indemnified Person in any such proceeding in advance of the final disposition of the proceeding. This Article 8 will not be deemed exclusive of any other provisions for indemnification of or advancement of expenses to an Indemnified Person that may be included in any statute, bylaw, agreement, general or specific action of the Board of Directors, vote of stockholders or other document or arrangement.
9. The election of directors need not be by written ballot unless a stockholder demands election by written ballot before voting begins at a meeting of stockholders.
10. The name and mailing address of the incorporator is Jeffrey S. Cronn, 1600 Pioneer Tower, 888 S.W. Fifth Avenue, Portland, Oregon 97204.
* * *
[REMAINDER OF PAGE INTENTIONALLY LEFT BLANK.]

Axon Enterprise, Inc. | 2019 Proxy Statement | A - 5
IN WITNESS WHEREOF, this Amended and Restated Certificate of Incorporation has been executed by a duly authorized officer of this corporation on this ___ day of _________, 2019.
By:
Name:
Title:

This Page Intentionally Left Blank

UNITED STATESSECURITIES AND EXCHANGE COMMISSION
Washington, D.C. 20549
Form 10-K
(Mark One)
ANNUAL REPORT PURSUANT TO SECTION 13 OR 15(d) OF THE SECURITIES EXCHANGE ACT OF1934
For the fiscal year ended December 31, 2018 or
TRANSITION REPORT PURSUANT TO SECTION 13 OR 15(d) OF THE SECURITIES EXCHANGEACT OF 1934
For the transition period from to Commission File Number: 001-16391
Axon Enterprise, Inc.(Exact name of registrant as specified in its charter)
Delaware 86-0741227(State or other jurisdiction of
incorporation or organization) (I.R.S. Employer
Identification No.)
17800 North 85th StreetScottsdale, Arizona 85255
(Address of principal executive offices) (Zip Code)
Registrant’s telephone number, including area code:(480) 991-0797
Securities registered pursuant to Section 12(b) of the Act:
Title of each class Name of exchange on which registered
Common Stock, $0.00001 par value per share The Nasdaq Global Select Market
Securities registered pursuant to Section 12(g) of the Act:None
(Title of Class)
Indicate by check mark if the registrant is a well-known seasoned issuer, as defined in Rule 405 of the Securities Act. Yes No Indicate by check mark if the registrant is not required to file reports pursuant to Section 13 or Section 15(d) of the Act. Yes No

Indicate by check mark whether the registrant (1) has filed all reports required to be filed by Section 13 or 15(d) of the Securities Exchange Act of 1934 during the preceding 12 months (or for such shorter period that the registrant was required to file such reports), and (2) has been subject to such filing requirements for the past 90 days. Yes No Indicate by check mark whether the registrant has submitted electronically every Interactive Data File required to be submitted pursuant to Rule 405 of Regulation S-T (§232.405 of this chapter) during the preceding 12 months (or for such shorter period that the registrant was required to submit such files). Yes No Indicate by check mark if disclosure of delinquent filers pursuant to Item 405 of Regulation S-K (§229.405 of this chapter) is not contained herein, and will not be contained, to the best of registrant’s knowledge, in definitive proxy or information statements incorporated by reference in Part III of this Form 10-K or any amendment to this Form 10-K.
Indicate by check mark whether the registrant is a large accelerated filer, an accelerated filer, a non-accelerated filer, a smaller reporting company or an emerging growth company. See the definitions of “large accelerated filer,” “accelerated filer,” “smaller reporting company” and “emerging growth company” in Rule 12b-2 of the Exchange Act.
Large accelerated filer Accelerated filer
Non-accelerated filer Smaller reporting company
Emerging growth company
If an emerging growth company, indicate by check mark if the registrant has elected not to use the extended transition period for complying with any new or revised financial accounting standards provided pursuant to Section 13(a) of the Exchange Act.
Indicate by check mark whether the registrant is a shell company (as defined in Rule 12b-2 of the Act). Yes No
The aggregate market value of the common stock held by non-affiliates of the registrant, based on the last sales price of the issuer’s common stock on June 30, 2018, which was the last business day of the registrant’s most recently completed second fiscal quarter, as reported by NASDAQ, was approximately $3,613,000,000. Solely for purposes of this disclosure, shares of common stock held by executive officers and directors of the registrant as of such date have been excluded because such persons may be deemed to be affiliates. This determination of executive officers and directors as affiliates is not necessarily a conclusive determination for any other purposes.
The number of shares of the registrant’s common stock outstanding as of February 18, 2019 was 58,829,384.
DOCUMENTS INCORPORATED BY REFERENCE
Parts of the registrant’s definitive proxy statement for its 2019 annual meeting of stockholders to be prepared and filed with the Securities and Exchange Commission not later than 120 days after December 31, 2018 are incorporated by reference into Part III of this Form 10-K.

2
AXON ENTERPRISE, INC.INDEX TO ANNUAL REPORT ON FORM 10-KFOR THE YEAR ENDED DECEMBER 31, 2018
PART I PageItem 1. BusinessItem 1A. Risk FactorsItem 1B. Unresolved Staff CommentsItem 2. PropertiesItem 3. Legal ProceedingsItem 4. Mine Safety Disclosures
PART IIItem 5. Market for Registrant’s Common Equity, Related Stockholder Matters and Issuer Purchases of
Equity SecuritiesItem 6. Selected Financial DataItem 7. Management’s Discussion and Analysis of Financial Condition and Results of OperationsItem 7A. Quantitative and Qualitative Disclosures About Market RiskItem 8. Financial Statements and Supplementary DataItem 9. Changes in and Disagreements With Accountants on Accounting and Financial DisclosureItem 9A. Controls and ProceduresItem 9B. Other Information
PART IIIItem 10. Directors, Executive Officers and Corporate GovernanceItem 11. Executive CompensationItem 12. Security Ownership of Certain Beneficial Owners and Management and Related Stockholder
MattersItem 13. Certain Relationships and Related Transactions, and Director IndependenceItem 14. Principal Accounting Fees and Services
PART IVItem 15. Exhibits, Financial Statement SchedulesItem 16. Form 10-K Summary
48
20212121
22
24255152949498
989898
9898
9999

3
PART I
Statements contained in this report that are not historical are “forward-looking statements” within the meaning of Section 27A of the Securities Act of 1933, as amended (the “Securities Act”), and Section 21E of the Securities Exchange Act of 1934, as amended (the “Exchange Act”), including statements regarding our expectations, beliefs, intentions and strategies regarding the future. We intend that such forward-looking statements be subject to the safe-harbor provided by the Private Securities Litigation Reform Act of 1995. Such statements give our current expectations or forecasts of future events; they do not relate strictly to historical or current facts. Words such as “may,” “will,” “should,” “could,” “would,” “predict,” “potential,” “continue,” “expect,” “anticipate,” “future,” “intend,” “plan,” “believe,” “estimate,” and similar expressions, as well as statements in future tense, identify forward-looking statements. However, not all forward-looking statements contain these identifying words.
We cannot guarantee that any forward-looking statement will be realized, although we believe we have been prudent in our plans and assumptions. Achievement of future results is subject to risks, uncertainties and potentially inaccurate assumptions. The following important factors could cause actual results to differ materially from those in the forward-looking statements: customer purchase behavior, including adoption of our software as a service delivery model; our exposure to cancellations of government contracts due to appropriation clauses, exercise of a cancellation clause, or non-exercise of contractually optional periods; our ability to design, introduce and sell new products or features; our ability to manage our supply chain and avoid production delays or shortages; changes in the costs of product components and labor; defects in our products; the impact of product mix on projected gross margins; loss of customer data, a breach of security or an extended outage, including our reliance on third-party cloud-based storage providers; negative media publicity regarding our products; our ability to defend against litigation and protect our intellectual property, and the resulting costs of this activity; changes in government regulations in the U.S. and internationally, especially related to the classification of our product by the United States Bureau of Alcohol, Tobacco, Firearms and Explosives and to evolving regulations surrounding privacy and data protection; counter-party risks relating to cash balances held in excess of FDIC insurance limits; our ability to integrate acquired businesses; and our ability to attract and retain key personnel. Many events beyond our control may determine whether results we anticipate will be achieved. Should known or unknown risks or uncertainties materialize, or should underlying assumptions prove inaccurate, actual results could differ materially from past results and those anticipated, estimated or projected. You should bear this in mind as you consider forward-looking statements. This report lists various important factors that could cause actual results to differ materially from expected and historical results. These factors are intended as cautionary statements for investors within the meaning of Section 21E of the Exchange Act and Section 27A of the Securities Act. Readers can find them under the heading “Risk Factors” in this Annual Report on Form 10-K, and investors should refer to them. You should understand that it is not possible to predict or identify all such factors. Consequently, you should not consider any such list to be a complete set of all potential risks or uncertainties.
Except as required by law, we undertake no obligation to publicly update forward-looking statements, whether as a result of new information, future events or otherwise. You are advised, however, to consult any further disclosures we make on related subjects in our Form 10-Q, 8-K and 10-K reports to the Securities and Exchange Commission ("SEC"). Our filings with the SEC may be accessed at the SEC’s web site at www.sec.gov.

4
Item 1. Business
Axon Enterprise, Inc. may be referred to as “the Company,” “Axon,” “we,” or “our.” We were incorporated in Arizona in September 1993 as ICER Corporation. We changed our name to AIR TASER, Inc. in December 1993 and to TASER International, Incorporated in April 1998. In January 2001, we reincorporated in Delaware as TASER International, Inc., and in April 2017, changed our name to Axon Enterprise, Inc.
Overview
Axon is a market-leading provider of law enforcement technology solutions. Our core mission is to protect life. We fulfill that mission through developing hardware and software products that advance the long term objectives of a) obsoleting the bullet, b) reducing social conflict, and c) enabling a fair and effective justice system.
We believe we are creating a sustainable and profitable business model while solving society's most challenging problems. Financially, we seek to sell our solutions via subscription plans that generate recurring revenue and cash flow and demonstrate leverage as we scale.
Our headquarters in Scottsdale, Arizona houses our executive management, sales, marketing, certain engineering, manufacturing, and other administrative support functions. We also have a software engineering development center located in Seattle, Washington, and subsidiaries located in Australia, Canada, Finland, Hong Kong, Germany, India, the Netherlands, the United Kingdom, and Vietnam.
Axon's operations comprise two reportable segments:
1) TASER: Axon is the market leader in the development, manufacture and sale of conducted energy weapons (CEWs), also known as conducted energy devices (CEDs), which we sell under our brand name, TASER. Research has shown that the TASER device is the most effective less than lethal force option, with the lowest likelihood of injury to officers and assailants. Since our inception in 1993, the TASER has been adopted by a majority of U.S. police departments and is used daily to help keep communities safe.
2) Software and Sensors: Axon is the market leader in on-officer body (Axon Body and Flex) and in-car (Axon Fleet) cameras as well as cloud-based digital evidence management software (Evidence.com). We develop, manufacture and sell fully integrated hardware and cloud-based software solutions that enable law enforcement to capture, securely store, manage, share and analyze video and other digital evidence. Of the 69 largest metropolitan area police departments in the U.S., 46 are on the Axon network.
Further information about our reportable segments and sales by geographic region is included in Notes 1 and 16 of the consolidated financial statements in Part II, Item 8 of this Annual Report on Form 10-K. For backlog by reportable segment, refer to Part II, Item 7 of this Annual Report on Form 10-K.
Strategic Growth Areas
In 2018, Axon invested heavily in four strategic growth areas, which were 1) TASER devices, 2) Sensors hardware, including on-officer body cameras and Axon Fleet in-car video systems, and our Axon Evidence connected software network, 3) Axon Records and 4) computer-aided dispatch software. The latter three growth areas are reported in our Software and Sensors segment.
These four strategic growth areas exist within an estimated $8.4 billion total addressable market, comprising CEWs ($1.8 billion), hardware sensors ($0.8 billion), and cloud-based public safety software ($5.8 billion.)
A description of each growth area follows:
• TASER devices: In December 2018, we began shipping TASER 7, which we believe is the most effective CEW ever made and is the first TASER device that works with a dock, allowing device logs to upload to our cloud-

5
based digital evidence management system. We are continuing to invest to make our TASER CEWs more capable and more connected over time.
• Axon sensors hardware and Axon Evidence digital evidence management software: We are continuing to invest in connected sensors to improve and create the next generation of body-worn and in-car cameras. Additionally, we are continuing to invest heavily in Axon Evidence features and roll out updates to Axon Evidence customers on a regular basis, meaning that our software solutions improve over time.
• Axon Records management systems: We are developing a cloud-based records management system, known in the law enforcement industry as an RMS, that is intuitive and easy-to-use. We believe that body camera video is a key source of truth on what transpired during any incident, and therefore should be the heart of the incident record. Axon Records will integrate seamlessly with the body camera video stored in Axon Evidence, and will leverage the data we are hosting to unlock value-added services for our customers.
• Computer-aided dispatch software: We aim to improve the dispatch market by developing software, known in the industry as computer-aided dispatch, or CAD. This type of software assists emergency call center operators in dispatching police, fire or medical services to respond to incidents. Our CAD software will seamlessly integrate with Axon Records and Axon Evidence, allowing for easier and more streamlined workflows for dispatchers, first responders, detectives, and the justice system.
Sales and Distribution
Axon's direct sales force and strong customer relationships represent key strategic advantages. The majority of our revenues are generated via direct sales, including our online store, although we do leverage distribution partners and third-party resellers.
Of the approximately 18,000 law enforcement agencies in the US, we have a customer relationship with approximately 17,000. Axon has dedicated sales representatives for the 1,200 largest agencies, which account for 70% to 80% of patrol officers. The remaining agencies are served via our telesales team as well as distributors. Internationally, we began focusing on a direct sales strategy in 2017, and in 2018 we made significant strides toward building out our international direct sales force, particularly in the United Kingdom, Europe, Australia and New Zealand.
No customer represented more than 10% of total net sales for the years ended December 31, 2018, 2017 or 2016.
Governmental agencies generally have the ability to terminate our contracts, in whole or in part, for reasons including, but not limited to, non-appropriation of funds.
Manufacturing and Supply Chain
We perform light manufacturing, final assembly, and final test operations at our headquarters in Scottsdale, Arizona, and own substantially all of the equipment required to develop, prototype, manufacture and assemble our finished products. We have continued to maintain both our ISO 9001 and our ISO 9001:2015 certifications.
We obtain many of our components from single source suppliers; however, because we own the injection molded component tooling used in their production, we believe we could obtain alternative suppliers in most cases without incurring significant production delays. For additional discussion of sources and availability of raw materials, refer to Note 1 to the consolidated financial statements included in Part II, Item 8 of this Annual Report on Form 10-K.
We provide limited manufacturer's warranties on our CEWs and Axon devices. For additional information about our warranties, refer to Note 1 to the consolidated financial statements in Part II, Item 8 of this Annual Report on Form 10-K.

6
Competition
TASER: Law Enforcement, Corrections and Private Security Markets: Our CEWs compete with a variety of other less-lethal alternatives, including rubber bullets or rubber baton rounds, pepper spray, mace, traditional stun guns, and police batons and night sticks. TASER devices offer advanced technology, versatility, portability, effectiveness, built-in accountability systems, and low injury rates, which enable us to compete effectively against other less-lethal alternatives.
The primary competitive factors in this market include a device’s accuracy, effectiveness, safety, cost, ease of use and an exceptional customer experience. We are aware of competitors providing competing CEW products primarily in international markets.
TASER: Private Citizen Market: In the private citizen market, these devices primarily compete with firearms, but also with other less lethal self-defense options such as pepper spray. The primary competitive factors in this market include a device’s cost, effectiveness, safety and ease of use.
Cameras & Software: Video Evidence Market: In the body-worn camera and in-car video markets, our competition primarily includes Motorola Solutions, Panasonic Corp., Reveal Media, Watchguard, L3 Mobile-Vision, Coban Technologies, Digital Ally, Getac and Utility Associates. We also compete with consumer wearable camera makers including GoPro and Garmin.
Our cloud based digital evidence management system, Axon Evidence, competes with both cloud-based platforms and on-premises based systems designed by third-parties or in-house by an agency's technology staff.
Key competitive factors in this market include product performance, product features, battery life, product quality and warranty, total cost of ownership, data security, data and information work flows, company reputation and financial strength, and relationships with customers.
Records Management and Computer-Aided Dispatch: The RMS and CAD markets are highly competitive and highly fragmented. Incumbent software providers include Motorola Solutions, Tyler Technologies, Central Square Technologies (formerly Superion, TriTech and Aptean), Hexagon AB, Niche Technology Inc., ALEN Inc., Caliber Public Safety (parent, Harris Systems USA), and Mark 43 Inc.
Seasonality
We have historically experienced higher net sales in our second and fourth quarters compared to other quarters in our fiscal year due primarily to municipal budget cycles. Additionally, new product introductions can significantly impact net sales, product costs and operating expenses. However, historical seasonal patterns, municipal budgets or historical patterns of product introductions should not be considered reliable indicators of our future net sales or financial performance.
Environmental Regulation
We are subject to environmental laws and regulations, including restrictions on the presence of certain substances in electronic products. Refer to Section 1A, Risk Factors under the heading “Environmental laws and regulations subject us to a number of risks and could result in significant liabilities and costs.”
Intellectual Property
We protect our intellectual property with U.S. and international patents and trademarks. Our patents and pending patent applications relate to technology used by us in connection with our products. We also rely on international treaties, organizations and laws to protect our intellectual property. As of December 31, 2018, we hold 158 U.S. patents, 70 U.S. registered trademarks, 102 international patents, and 293 international registered trademarks, and also have numerous patents and trademarks pending. We continuously assess whether and where to seek formal protection for

7
particular innovations and technologies based on such factors as the commercial significance of our operations and our competitors’ operations in particular countries and regions, our strategic technology or product directions in different countries, and the degree to which intellectual property laws exist and are meaningfully enforced in different jurisdictions. We have the exclusive rights to many Internet domain names, primarily including “TASER.com”, “Axon.com”, “Axon.net”, “Evidence.com” and “Axon.io.”
Confidentiality agreements are used with employees, consultants and key suppliers to help ensure the confidentiality of our trade secrets.
Employees
As of December 31, 2018, we had 1,155 full-time employees and 231 temporary employees. The breakdown of our full-time employees by department was as follows: 217 direct manufacturing employees, 360 research and development employees, 336 administrative and manufacturing support employees and 242 employees within sales, marketing, communications and training. Of the 231 temporary employees, approximately 80% worked in direct manufacturing roles. Our employees are not covered by any collective bargaining agreement, and we have never experienced a work stoppage. We believe that our relations with our employees are good.
Available Information
Our Annual Reports on Form 10-K, Quarterly Reports on Form 10-Q, Current Reports on Form 8-K, proxy statements and amendments to those reports filed with or furnished to the SEC are available free of charge on our website at http://investor.axon.com as soon as reasonably practicable after we electronically file or furnish such material to the SEC. The information on our website, including information about our trademarks, is not incorporated by reference into or otherwise a part of this Annual Report on Form 10-K. The SEC maintains a website that contains reports, proxy and information statements and other information regarding issuers that file electronically with the SEC at http://www.sec.gov.

8
Item 1A. Risk Factors
Because of the following factors, as well as other variables affecting our operating results, our past financial performance may not be a reliable indicator of our future performance and historical trends should not be used to anticipate our results or trends in future periods. You should carefully consider the trends, risks and uncertainties described below and other information in this Form 10-K and subsequent reports filed with or furnished to the SEC before making any investment decision with respect to our securities. If any of the following trends, risks or uncertainties actually occurs or continues, our business, financial condition or operating results could be materially adversely affected, the trading prices of our securities could decline, and you could lose all or part of your investment. All forward-looking statements attributable to us or persons acting on our behalf are expressly qualified in their entirety by this cautionary statement.
We are materially dependent on acceptance of our products by law enforcement markets, both domestic and international. If law enforcement agencies do not continue to purchase and use our products, our revenues will be adversely affected.
At any point, due to external factors and opinions, whether or not related to product performance, law enforcement agencies may elect to no longer purchase our CEWs or other products.
We substantially depend on sales of our TASER 7, TASER X26P and X2 CEWs, and if these products do not continue to be widely accepted, our growth prospects will be diminished.
In the years ended December 31, 2018, 2017 and 2016, we derived a significant portion of our revenues from sales of TASER CEW brand devices and related cartridges, and expect to depend on sales of these products for a significant portion of our revenue for the foreseeable future. A decrease in the selling prices of, or demand for these products, or their failure to maintain broad market acceptance, would significantly harm our growth prospects, operating results and financial condition.
The success of our Axon Evidence software as a service (“SaaS”) delivery model is materially dependent on acceptance of this business model by our law enforcement customers. Delayed or lengthy time to adoption by law enforcement agencies will negatively impact our sales and profitability.
A substantial number of law enforcement agencies may be slow to adopt our Axon Evidence digital data evidence management and storage solution, requiring extended periods of trial and evaluation. The hosted service delivery business model is not presently widely adopted by our law enforcement customer base. As such, the sales cycle has additional complexity with the need to educate our customers and address issues regarding agency bandwidth requirements, data retention policies, data security and chain of evidence custody. Delays in successfully securing widespread adoption of Axon Evidence services could adversely affect our revenues, profitability and financial condition.
If we are unable to design, introduce and sell new products or new product features successfully, our business and financial results could be adversely affected.
Our future success will depend on our ability to develop new products or new product features that achieve market acceptance in a timely and cost-effective manner. These products include, but are not limited to, Axon Body 3, Axon Records, Axon Dispatch, and future generations of the TASER CEW and Axon Fleet. The development of new products and new product features is complex, time consuming and expensive, and we may experience delays in completing the development and introduction of new products. We cannot provide any assurance that products that we may develop in the future will achieve market acceptance. If we fail to develop new products or new product features on a timely basis that achieve market acceptance, our business, financial results and competitive position could be adversely affected.
Delays in product development schedules may adversely affect our revenues and cash flows.
The development of CEWs, devices, sensors and software is a complex and time-consuming process. New products and enhancements to existing products can require long development and testing periods. Our focus on our SaaS platform also presents new and complex development issues. Significant delays in new product or service releases

9
or significant problems in creating new products or services could adversely affect our business, financial results and competitive position.
We face risks associated with rapid technological change and new competing products.
The technology associated with law enforcement devices is receiving significant attention and is rapidly evolving. While we have some patent protection in certain key areas of our CEW, Axon Device and SaaS technology, it is possible that new technology may result in competing products that operate outside our patents and could present significant competition for our products, which could adversely affect our business, financial results and competitive position.
Defects in our products could reduce demand for our products and result in a loss of sales, delay in market acceptance and damage to our reputation.
Complex components and assemblies used in our products may contain undetected defects that are subsequently discovered at any point in the life of the product. Defects in our products could result in a loss of sales, delay in market acceptance, damage to our reputation and increased warranty costs, which could adversely affect our business, financial results and competitive position.
If our security measures or those of our third-party cloud storage providers are breached and unauthorized access is obtained to customers’ data or our data, our network, data centers and service may be perceived as not being secure, customers may curtail or stop using our service and we may incur significant legal and financial exposure and liabilities.
Our service involves the storage and transmission of customers’ proprietary information, and security breaches could expose us to a risk of loss of information or the total deletion of all stored customer data, litigation and possible liability. We devote significant resources to engineer secure products and ensure security vulnerabilities are mitigated, and we require our third-party service providers to do so as well. Despite these efforts, security measures may be breached as a result of third-party action, employee error, and malfeasance or otherwise. Breaches could occur during transfer of data to data centers or at any time, and result in unauthorized access to our data or our customers’ data. Third parties may attempt to fraudulently induce employees or customers into disclosing sensitive information such as user names, passwords or other information in order to gain access to our data or our customers’ data. Additionally, hackers may develop and deploy viruses, worms, and other malicious software programs that attack or gain access to our networks and data centers.
Because the techniques used to obtain unauthorized access, or to sabotage systems, change frequently, grow more complex over time, and generally are not recognized until launched against a target, we may be unable to anticipate these techniques or to implement adequate preventative measures. Moreover, our security measures and those of our third-tparty service providers or customers may not detect such security breaches if they occur. Although we have developed systems and processes that are designed to protect our data and user data, to prevent data loss, and to prevent or detect security breaches, we cannot assure that such measures will provide absolute security, and we may incur significant costs in protecting against or remediating cyber-attacks.
A security breach could expose us to a risk of loss or inappropriate use of proprietary and sensitive data, or the denial of access to this data. A security breach could also result in a loss of confidence in the security of our service, disrupt our business, damage our reputation, lead to legal liability, negatively impact our future sales and significantly harm our growth prospects, operating results and financial condition.
Defects or disruptions in our services could impact demand for our services and subject us to substantial liability.
We currently serve our Axon Evidence customers from third-party cloud storage providers based in the U.S. and other countries. Interruptions in our service, or loss or corruption of digital evidence, may reduce our revenue, cause us to issue credits or pay penalties, cause customers to terminate their subscriptions and adversely affect our renewal rates and our ability to attract new customers. Our business will also be harmed if our customers and potential customers believe our service is unreliable.

10
Since our customers use our services for important aspects of their operations, any errors, defects, disruptions in service or other performance problems could hurt our reputation and may damage our customers’ operations. As a result, customers could elect to not renew our services or delay or withhold payment to us. We could also lose future sales or customers may make warranty or other claims against us, which could result in an increase in our warranty expense, an increase in collection cycles for and decline in the collectability of accounts receivable, and an increase in the expense and risk of litigation.
Our business is subject to complex and evolving U.S. and foreign laws and regulations regarding privacy, data protection, content, competition, consumer protection, and other matters. Many of these laws and regulations are subject to change and uncertain interpretation, and could result in claims, changes to our business practices, monetary penalties, increased cost of operations, or otherwise harm our business.
We are subject to a variety of laws and regulations in the United States and abroad that involve matters central to our business, including privacy, data protection and personal information, rights of publicity, content, intellectual property, advertising, marketing, distribution, data security, data retention and deletion, electronic contracts and other communications, competition, consumer protection, telecommunications, product liability, taxation, economic or other trade prohibitions or sanctions, securities law compliance, and online payment services. The introduction of new products, expansion of our activities in certain jurisdictions, or other actions that we may take may subject us to additional laws, regulations, or other government scrutiny. In addition, foreign data protection, privacy, content, competition, and other laws and regulations can impose different obligations or be more restrictive than those in the United States.
These U.S. federal and state and foreign laws and regulations, which in some cases can be enforced by private parties in addition to government entities, are constantly evolving and can be subject to significant change. As a result, the application, interpretation, and enforcement of these laws and regulations are often uncertain and may be interpreted and applied inconsistently from country to country and inconsistently with our current policies and practices.
We are also subject to laws and regulations that dictate whether, how, and under what circumstances we can transfer, process and/or receive certain data that is critical to our operations, including data shared between countries or regions in which we operate and data shared among our products and services. For example, in 2016, the European Union and United States agreed to an alternative transfer framework for data transferred from the European Union to the United States, called the Privacy Shield, but this new framework is subject to an annual review that could result in changes to our obligations and also may be challenged by national regulators or private parties. If one or more of the legal bases for transferring data from Europe to the United States is invalidated, if we are unable to transfer data between and among countries and regions in which we operate, or if we are prohibited from sharing data among our products and services, it could affect the manner in which we provide our services or adversely affect our financial results.
Proposed or new legislation and regulations could also significantly affect our business. There currently are a number of proposals pending before federal, state, and foreign legislative and regulatory bodies. In addition, the new European General Data Protection Regulation ("GDPR") took effect in May 2018 and applies to all of our products and services that provide service in Europe. The GDPR includes operational requirements for companies that receive or process personal data of residents of the European Union ("EU") that are different than those currently in place in the European Union. For example, we may be required to obtain consent and/or offer new controls to existing and new users in Europe before processing data for certain aspects of our service. In addition, the GDPR includes significant penalties for non-compliance. Similarly, there are a number of legislative proposals in the United States, at both the federal and state level, that could impose new obligations in areas affecting our business, such as liability for copyright infringement by third parties. In addition, some countries are considering or have passed legislation implementing data protection requirements or requiring local storage and processing of data or similar requirements that could increase the cost and complexity of delivering our services.
These laws and regulations, as well as any associated inquiries or investigations or any other government actions, may be costly to comply with and may delay or impede the development of new products, result in negative publicity, increase our operating costs, require significant management time and attention, and subject us to remedies that may harm our business, including fines or demands or orders that we modify or cease existing business practices.
11
Most of our end-user customers are subject to budgetary and political constraints that may delay or prevent sales.
Most of our end-user customers are government agencies. These agencies often do not set their own budgets and therefore, have limited control over the amount of money they can spend. In addition, these agencies experience political pressure that may dictate the manner in which they spend money. As a result, even if an agency wants to acquire our products, it may be unable to purchase them due to budgetary or political constraints, particularly in challenging economic environments. There can be no assurance that the economic and budgeting issues will not worsen and adversely impact sales of our products. Some government agency orders may also be canceled or substantially delayed due to budgetary, political or other scheduling delays, which frequently occur in connection with the acquisition of products by such agencies, and such cancellations may accelerate or be more severe than we have experienced historically.
We expend significant resources in anticipation of a sale due to our lengthy sales cycle and may receive no revenue in return.
Generally, law enforcement and corrections agencies consider a wide range of issues before committing to purchase our products, including product benefits, training costs, the cost to use our products in addition to, or in place of, other products, budget constraints and product reliability, safety and efficacy. The length of our sales cycle may range from a few weeks to as long as several years. Adverse publicity surrounding our products or the safety of such products has in the past, and could in the future, lengthen our sales cycle with customers. In the past, we believe that our sales were adversely impacted by negative publicity surrounding our products or the use of our products. See, for example, “Litigation - Product Litigation” in Note 9 of our consolidated financial statements included in Part II, Item 8 of this report. We may incur substantial selling costs and expend significant effort in connection with the evaluation of our products by potential customers before they place an order. If these potential customers do not purchase our products, we will have expended significant resources and received no revenue in return.
Due to municipal government funding rules, certain of our contracts are subject to appropriation, termination for convenience, or similar cancellation clauses, which could allow our customers to cancel or not exercise options to renew contracts in the future.
Although we have entered into contracts for the delivery of products and services in the future and anticipate the contracts will be completed, if agencies do not appropriate money in future year budgets, terminate contracts for convenience or if other cancellation clauses are invoked, revenue and cash associated with these bookings will not ultimately be recognized, and could result in a reduction to bookings and revenue.
An increasing percentage of our revenue is derived from subscription billing arrangements which may result in delayed cash collections and may increase customer credit risk on receivables and contract assets.
A growing portion of our sales are derived from subscription billing arrangements and on an open credit basis. While we perform ongoing credit evaluations of our customers' financial condition, if we become aware of information related to the creditworthiness of a major customer, or if future actual default rates on receivables in general differ from those currently anticipated, we may have to adjust our allowance for doubtful accounts, which could adversely affect our business, financial condition or operating results.
Changes in civil forfeiture laws may affect our customers’ ability to purchase our products
Some of our customers use funds seized through civil forfeiture proceedings to fund the purchase of our products. Changes in state legislatures could impact our customers’ ability to seize funds or use seized funds to fund purchases. Changes in civil forfeiture statutes or regulations are outside of our control and could limit the amount of funds available to our customers, which could adversely affect the sale of our products.

12
SaaS revenue for Axon Evidence is recognized over the terms of the contracts, which may be several years, and, as such, trends in new business may not be immediately reflected in our operating results.
Our SaaS service revenue is generally recognized ratably over the terms of the contracts, which generally range from one to five years. As a result, most of the SaaS revenue we report each quarter is the result of agreements entered into during previous quarters. Consequently, current positive or negative trends in this portion of our business may not be fully reflected in our revenue results for several periods.
We utilize multiple third-party cloud-based storage providers to host the Axon Evidence.com platform.
Utilizing and administering multiple cloud-based storage providers may result in duplication of efforts and resources, increased cost structure, and organization complexities. These complexities and additional costs could adversely affect our business, financial condition or operating results.
We may face personal injury, wrongful death and other liability claims that harm our reputation and adversely affect our sales and financial condition.
Our CEW products are often used in aggressive confrontations that may result in serious, permanent bodily injury or death to those involved. Our CEW products may be associated with these injuries. A person, or the family members of a person, injured in a confrontation or otherwise in connection with the use of our products, may bring legal action against us to recover damages on the basis of theories including wrongful death, personal injury, negligent design, defective product or inadequate warning. We are currently subject to a number of such lawsuits and we have been subject to significant adverse judgments and settlements. We may also be subject to lawsuits involving allegations of misuse of our products. If successful, wrongful death, personal injury, misuse and other claims could have a material adverse effect on our operating results and financial condition and could result in negative publicity about our products. We incur significant legal expenses in defending these cases, and significant litigation could also result in a diversion of management’s attention and resources, negative publicity and a potential award of monetary damages in excess of our insurance coverage. The outcome of any litigation is inherently uncertain and there can be no assurance that our existing or any future litigation will not have a material adverse effect on our business, financial condition or operating results.
Other litigation may subject us to significant litigation costs and judgments and divert management attention from our business.
We have been or could in the future be involved in numerous other litigation matters relating to our products, contracts and business relationships, including litigation against persons whom we believe have infringed on our intellectual property, infringement litigation filed against us, litigation against a competitor and litigation filed by a former distributor against us. Such matters have resulted, and are expected to continue to result in, substantial costs to us, including in the form of attorney’s fees and costs, damages, fines or other penalties, whether pursuant to a judgment or settlement, and diversion of our management’s attention, which could adversely affect our business, financial condition or operating results. There is also a risk of adverse judgments, as the outcome of litigation is inherently uncertain.
If we are unable to protect our intellectual property, we may lose our competitive advantage or incur substantial litigation costs to protect our rights. We may be subject to intellectual property infringement claims, which could cause us to incur litigation costs and divert management attention from our business.
Our future success depends upon our proprietary technology. Our protective measures, including patents, trademarks, copyrights, trade secret protection, and Internet identity registrations, may prove inadequate to protect our proprietary rights and market advantage. The right to stop others from misusing our trademarks and service marks in commerce depends, to some extent, on our ability to show evidence of enforcement of our rights against such misuse in commerce. Our efforts to stop improper use, if insufficient, may lead to loss of trademark and service mark rights, brand loyalty and notoriety among our customers and prospective customers. The scope of any patent to which we have or may obtain rights may not prevent others from developing and selling competing products. The validity and breadth of claims covered in technology patents involve complex legal and factual questions, and the resolution of such claims
13
may be highly uncertain, lengthy and expensive. In addition, our patents may be held invalid upon challenge, or others may claim rights in or ownership of our patents. Moreover, we are subject to litigation with parties that claim, among other matters, that we infringed their patents or other intellectual property rights. The defense and prosecution of patent and other intellectual property claims are both costly and time consuming, divert our management’s attention from our business and could result in a material adverse effect on our business, and financial position and operating results.
If our products were found to infringe a third-party’s proprietary rights, we could be forced to enter into costly royalty or licensing agreements in order to be able to sell our products or discontinue use of the protected technology. Such royalty and licensing agreements may not be available on terms acceptable to us or at all. We could also be required to pay substantial damages, fines or other penalties, indemnify customers or distributors, cease the manufacture, use, or sale of infringing products or processes, and/or expend significant resources to develop or acquire non-infringing technologies. There is no guarantee that our use of conventional technology searching and brand clearance searching will identify all potential rights holders. Rights holders may demand payment for past infringements and/or force us to accept costly license terms or discontinue use of protected technology and/or works of authorship that may include, for example, photos, videos, and software. Our current research and development focus on developing software-based products increases this risk.
We are a defendant in a litigation matter filed by Digital Ally Inc. (“Digital”) in the District of Kansas alleging patent infringement regarding our Axon Signal technology. For additional discussion of this matter, refer to Note 9 to the consolidated financial statements included in Part II, Item 8 of this Annual Report on Form 10-K. We believe the patent in question is both invalid and not infringed, and we do not currently believe it is probable that we will incur a material loss. If, contrary to our expectations, the court allows Digital’s entire market value and treble damage theories to proceed on summary judgment rulings, and if Digital ultimately succeeds on such theories at trial, the outcome could have an adverse effect on our results of operations in the period in which a liability is recognized and on our cash flows for the period in which any damages are paid.
Internationally, we can enforce patent rights only in the jurisdictions in which our patent applications have been granted.
Our U.S. patents protect us from imported infringing products coming into the U.S. from abroad. We have made applications for patents in a few foreign countries; however, these may be inadequate to protect markets for our products in other foreign countries. Each patent is examined and granted according to the law of the country where it was filed independent of whether a U.S. patent on similar technology was granted. A patent in a foreign country may be subject to cancellation if the claimed invention has not been sold in that country. Meeting the requirements of working invention differs by country and ranges from sales in the country to manufacturing in the country. U.S. export law, or the laws of some foreign countries, may prohibit us from satisfying the requirements for working the invention, creating a risk that some of our international patents may become unenforceable.
Government regulations applied to our products could materially and adversely affect our business.
We rely on the opinions of the U.S. Bureau of Alcohol, Tobacco, Firearms and Explosives, including the determination that a device that has projectiles propelled by the release of compressed gas in place of the expanding gases from ignited gunpowder, are not classified as firearms. Changes in statutes, regulations, and interpretation outside of our control may result in our products being classified or reclassified as firearms. Our private citizen market could be substantially reduced if consumers are required to obtain a registration to own a firearm prior to purchasing our products.
Federal regulation of sales in the U.S.: Our CEWs are not firearms regulated by the U.S. Bureau of Alcohol, Tobacco, Firearms and Explosives, but our consumer products are regulated by the U.S. Consumer Product Safety Commission. Although there are currently no Federal laws restricting sales of our core CEW products in the U.S., future Federal regulation could adversely affect sales of our products.
Axon body worn cameras and fleet vehicle cameras are subject to regulations including 21-CFR-47 Part 15, Subpart C for Bluetooth and WiFi transmission, US-DOT/UN 38.3 for transportation of lithium batteries, and FCC KDB 447498 + IEEE 1528-2013 Specific Absorption Rate ("SAR") regulations. These regulations are also beginning to affect CEWs with signal performance power magazine ("SPPM") technology and future CEWs implementing wireless

14
technology into the feature set. Compliance with government regulations could increase our operations and product costs and impact our future financial results.
Federal regulation of international sales: Our CEW devices are considered a “crime control” product by the U.S. Department of Commerce (“DOC”) for export directly from the U.S. Consequently, we must obtain an export license from the DOC for the export of our CEW devices from the U.S. other than to Canada. In addition, certain of our camera and software products require classifications from the DOC before they may be shipped internationally. Our inability to obtain DOC export licenses or classifications on a timely basis for sales of our products to our international customers could significantly and adversely affect our international sales.
State and local regulation: Our CEW devices are controlled, restricted or their use prohibited by a number of state and local governments. As of December 31, 2018, the possession of stun guns by the general public, including our CEW devices, is prohibited in four states: Hawaii, Massachusetts, New York, and Rhode Island, as well as in the District of Columbia. Some cities and municipalities also prohibit private citizen possession or use of our CEW products. Other jurisdictions may ban or restrict the sale of our CEW products and our product sales may be significantly affected by additional state, county and city governmental regulation.
International regulation: Certain jurisdictions prohibit, restrict, or require a permit for the importation, sale, possession or use of CEWs, including in some countries by law enforcement agencies, limiting our international sales opportunities.
Our CEW products are also subject to regulation by testing, safety and other standard organizations (e.g. ANSI, IEC, NIST).
Our international operations expose us to additional risks that could harm our business, operating results, and financial condition.
Our international operations are significant, and we plan to continue to grow internationally by acquiring existing entities or setting up new legal entities in new markets. In certain international markets, we have limited operating experience and may not benefit from any first-to-market advantages or otherwise succeed. In addition to risks described elsewhere in this section, our international operations expose us to other risks, including the following:
• Restrictions on foreign ownership and investments, and stringent foreign exchange controls that might prevent us from repatriating cash earned in countries outside the U.S.
• Import and export requirements, tariffs, trade disputes and barriers, and customs classifications that may prevent us from offering products or providing services to a particular market or obtaining necessary parts and components to manufacture products, which may lead to decreased sales and may increase our operating costs.
• Longer payment cycles in some countries, increased credit risk, and higher levels of payment fraud.
• Uncertainty regarding liability for products and services, including uncertainty as a result of local laws and lack of legal precedent.
• Different employee/employer relationships, existence of workers' councils and labor unions, and other challenges caused by distance, language, and cultural differences, making it harder to do business in certain jurisdictions.
Additionally, changes in international local political, economic, regulatory, tax, social, and labor conditions may adversely harm our business and compliance with complex foreign and U.S. laws and regulations that apply to our international operations increases our cost of doing business. These numerous and sometimes conflicting laws and regulations include, among others, environmental regulations, internal control and disclosure rules, privacy and data protection requirements, anti-corruption laws, such as the U.S. Foreign Corrupt Practices Act, and other local laws prohibiting corrupt payments to governmental officials, and competition regulations, among others.
Our business in the United Kingdom may be negatively impacted by uncertainty regarding the exit of the United Kingdom from the European Union (commonly referred to as "Brexit"). The exit itself could negatively impact the

15
United Kingdom and other economies, which could adversely affect sales of our products and services. We may also experience increased volatility in the value of the pound sterling, the euro and other European currencies. In addition, Brexit could lead to legal uncertainty and potentially divergent national laws and regulations in the United Kingdom and the European Union, and we may incur additional costs or need to make operational changes as we adapt to potentially divergent regulatory frameworks.
Violations of these laws and regulations could result in fines and penalties, criminal sanctions against us, our officers, or our employees, prohibitions on the conduct of our business and on our ability to offer our products and services in one or more countries, and could also materially affect our brand, our international growth efforts, our ability to attract and retain employees, our business, and our operating results. Although we have implemented policies and procedures designed to ensure compliance with these laws and regulations, there can be no assurance that our employees, contractors, or agents will not violate our policies.
Environmental laws and regulations subject us to a number of risks and could result in significant liabilities and costs.
We are subject to various state, federal and international laws and regulations governing the environment, including restricting the presence of certain substances in our products and making producers for those products financially responsible for the collection, treatment, recycling and disposal. In particular, environmental legislation within the EU may increase our cost of doing business internationally and impact our revenues from EU countries as we comply with and implement these requirements.
The EU has published Directives on the restriction of certain hazardous substances in electronic and electrical equipment (the “RoHS Directive”) and on electronic and electrical waste management (the “WEEE Directive”). The RoHS Directive restricts the use of a number of substances, including lead. The WEEE Directive directs members of the EU to enact laws, regulations, and administrative provisions to ensure that producers of electric and electronic equipment are financially responsible for the collection, recycling, treatment and environmentally responsible disposal of certain products sold into the EU. In addition, similar environmental legislation has been or may be enacted in other jurisdictions, including the U.S. (under federal and state laws) and other countries, the cumulative impact of which could be significant.
We continue to monitor the impact of specific registration and compliance activities required by the RoHS and WEEE Directives. We endeavor to comply with applicable environmental laws, yet compliance with such laws could increase our operations and product costs, increase the complexities of product design, procurement, and manufacturing, limit our ability to manage excess and obsolete non-compliant inventory, limit our sales activities, and impact our future financial results. Any violation of these laws can subject us to significant liability, including fines, penalties, and prohibiting sales of our products into one or more states or countries, and result in a material adverse effect on our financial condition.
Regulations related to voice, data and communications services may impact our ability to sell our products.
The radio spectrum is required to provide wireless voice, data and video communications services. The allocation of spectrum is regulated in the U.S. and other countries and limited spectrum space is allocated to wireless services and specifically to public safety users. In the U.S., the Federal Communications Commission (“FCC”) regulates spectrum use by non-federal entities and federal entities. Similarly, countries around the world have one or more regulatory bodies that define and implement the rules for use of radio spectrum and electromagnetic interference, pursuant to their respective national laws. We manufacture and market products in spectrum bands already made available by regulatory bodies. Consequently, our results could be negatively affected by the rules and regulations adopted from time to time by the FCC or regulatory agencies in other countries. Regulatory changes in current spectrum bands may also require modifications to some of our products so they can continue to be manufactured and marketed. If current products do not comply with the regulations set forth by these governing bodies, we may be unable to sell our products or could incur penalties, which could have an adverse impact on our financial condition, results of operations and cash flows.

16
Our dependence on third-party suppliers for key components of our devices could delay shipment of our products and reduce our sales.
We depend on certain domestic and international suppliers for the delivery of components used in the assembly of our products. Our reliance on third-party suppliers creates risks related to our potential inability to obtain an adequate supply of components or sub-assemblies and reduced control over pricing and timing of delivery of components and sub-assemblies. Specifically, we depend on suppliers of sub-assemblies, machined parts, injection molded plastic parts, printed circuit boards, custom wire fabrications and other miscellaneous customer parts for our products. We do not have long-term agreements with any of our suppliers and there is no guarantee that supply will not be interrupted. Due to changes imposed for imports of foreign products into the U.S., as well as potential port closures and delays created by terrorist attacks or threats, public health issues, national disasters or work stoppages, we are exposed to risk of delays caused by freight carriers or customs clearance issues for our imported parts. Any interruption of supply for any material components of our products could significantly delay the shipment of our products and have a material adverse effect on our revenues, profitability and financial condition.
Component shortages could result in our inability to produce at a volume to adequately meet customer demand, which could result in a loss of sales, delay in deliveries and injury to our reputation.
Single or sole-source components used in the manufacture of our products may become unavailable or discontinued. Delays caused by industry allocations or obsolescence may take weeks or months to resolve. In some cases, parts obsolescence may require a product re-design to ensure quality replacement components. These delays could cause significant delays in manufacturing and loss of sales, leading to adverse effects significantly impacting our financial condition or results of operations and injure our reputation.
We may experience a decline in gross margins due to rising raw material and transportation costs associated with a future increase in petroleum prices.
A significant number of our raw materials are comprised of petroleum-based products, or incur some form of landed cost associated with transporting the raw materials or components to our facility. A significant rise in oil prices could adversely impact our ability to sustain current gross margins by increasing component pricing and transportation costs.
We may experience a decline in gross margins due to a shift in product sales from CEWs to Axon devices which may continue to carry a lower gross margin.
We continue to invest in the growth of the Software and Sensors segment, and this expected growth may result in a higher percentage of total revenues being comprised of Software and Sensors products and services. Gross margin as a percentage of net sales for the Software and Sensors segment is currently lower than that of the TASER Devices segment, and may continue to be lower in the future.
To the extent demand for our products increases, our future success will be dependent upon our ability to manage our growth and to increase manufacturing production capacity, which may be accomplished by the implementation of customized manufacturing automation equipment.
To the extent demand for our products increases significantly in future periods, one of our key challenges will be to increase our production capacity to meet sales demand while maintaining product quality. Our primary strategies to accomplish this include introducing additional shifts, increasing the physical size of our assembly facilities, the hiring of additional production staff, and the implementation of additional customized automation equipment. The investments we make in this equipment may not yield the anticipated labor and material efficiencies. Our inability to meet any future increase in sales demand or effectively manage our expansion could have a material adverse effect on our revenues, financial results and financial condition.
17
Our future success is dependent on our ability to expand sales through distributors and direct sales and our inability to recruit new distributors or increase direct sales would negatively affect our sales.
Our distribution strategy is to pursue sales through multiple channels with an emphasis on independent distributors and direct sales. Our inability to establish relationships with and retain law enforcement equipment distributors, who we believe can successfully sell our products, would adversely affect our sales. In addition, our arrangements with our distributors are generally short-term. We are also focusing on direct sales to larger agencies through our regional sales managers and our inability to grow sales to these agencies in this manner could adversely affect our sales. If we do not competitively price our products, meet the requirements of our distributors or end-users, provide adequate marketing support, or comply with the terms of our distribution arrangements, our distributors may fail to aggressively market our products or may terminate their relationships with us. These developments would likely have a material adverse effect on our sales. Our reliance on the sales of our products by others also makes it more difficult to predict our revenues, cash flow and operating results.
The increased focus on direct sales compared to sales through distribution is dependent on our ability to sell into the states or foreign jurisdictions that have established distributor relationships.
In certain states and foreign jurisdictions we have decided to pursue sales directly with law enforcement customers, rather than working through established distribution channels. Our customers may have strong working relationships with distributors and we may face resistance to this change. If we do not overcome this resistance and effectively build a direct relationship with our customers, sales may be adversely affected.
Acquisitions and joint ventures may have an adverse effect on our business.
We may consider additional acquisitions or joint ventures as part of our long-term business strategy. These transactions involve significant challenges and risks including that the transaction does not advance our business strategy, expected synergies are not achieved, we do not realize a satisfactory return on our investment, we experience difficulty in the integration or coordination of new employees, business systems, and technology, or there is a diversion of management’s attention from our other businesses. These events could harm our operating results, financial condition or cash flows.
If our goodwill or intangible assets become impaired, we may be required to record a significant charge to earnings.
We acquire other companies and intangible assets and may not realize all the economic benefit from those acquisitions, which could cause an impairment of goodwill or intangibles. We review our amortizable intangible assets for impairment when events or changes in circumstances indicate the carrying value may not be recoverable. We test goodwill and non-amortizable intangible assets for impairment at least annually. If such goodwill or intangible assets are deemed to be impaired, an impairment loss equal to the amount by which the carrying amount exceeds the fair value of the assets would be recognized. Events which might indicate impairment include, but are not limited to, declines in stock price market capitalization or cash flows, adverse cost factors, deteriorating financial performance, strategic decisions made in response to economic, market and competitive conditions, the impact of the economic environment on us and our customer base, and/or relevant events such as changes in management, key personnel, litigation or customers.
We may be required to record a significant charge in our financial statements during the period in which any impairment of our goodwill or intangible assets is determined, which would negatively affect our results of operations.
Catastrophic events may disrupt our business.
A disruption or failure of our systems or operations in the event of a major earthquake, weather event, fire, explosion, failure to contain hazardous materials, industrial accident, cyber-attack, terrorist attack, or other catastrophic event could cause delays in completing sales, providing services, or performing other mission-critical functions. A catastrophic event that results in the destruction or disruption of any of our critical business or information technology

18
systems could harm our ability to conduct normal business operations and our operating results as well as expose us to claims, litigation and governmental investigations and fines.
Our financial performance is subject to risks associated with changes in the value of the U.S. dollar versus local currencies.
For current and potential international customers whose contracts are denominated in U.S. dollars, the relative change in local currency values creates relative fluctuations in our product pricing. These changes in international end-user costs may result in lost orders and reduce the competitiveness of our products in certain foreign markets. Additionally, intercompany sales to our non-U.S. dollar functional currency international subsidiaries are transacted in U.S. dollars which could increase our foreign exchange rate risk caused by foreign currency transaction gains and losses.
For non-U.S. dollar denominated sales, weakening of foreign currencies relative to the U.S. dollar generally leads us to raise international pricing, potentially reducing demand for our products. Should we decide not to raise local prices to fully offset the dollar’s strengthening, the U.S. dollar value of our foreign currency denominated sales and earnings would be adversely affected. We do not currently engage in hedging activities. Fluctuations in foreign currency could result in a change in the U.S. dollar value of our foreign denominated assets and liabilities including accounts receivable. Therefore, the U.S. dollar equivalent collected on a given sale could be less than the amount invoiced causing the sale to be less profitable than contemplated.
We also import selected components which are used in the manufacturing of some of our products. Although our purchase orders are generally in U.S. dollars, weakness in the U.S. dollar could lead to price increases for the components.
Unanticipated changes in our effective tax rate and additional tax liabilities may impact our operating results
We are subject to income taxes in the United States and various jurisdictions outside of the United States. Our effective tax rate could fluctuate due to changes in the mix of earnings and losses in countries with differing statutory tax rates. Our tax expense could also be impacted by changes in non-deductible expenses, changes in excess tax benefits related to exercises of stock options and vesting of restricted stock units, changes in the valuation of deferred tax assets and liabilities and our ability to utilize them, the applicability of withholding taxes, and changes in our liability for unrecognized tax benefits.
We are subject to tax examinations in multiple jurisdictions. While we regularly evaluate new information that may change our judgment resulting in recognition, derecognition or change in measurement of a tax position taken, there can be no assurance that the final determination of any examinations will not have an adverse effect on our operating results and financial position.
Our tax provision could also be impacted by changes in federal, state or international tax laws including fundamental tax law changes applicable to corporate multinationals.
Additionally, we may be subject to additional tax liabilities due to changes in non-income taxes resulting from changes in federal, state or international tax laws, changes in taxing jurisdictions’ administrative interpretations, decisions, policies, and positions, results of tax examinations, settlements or judicial decisions, changes in accounting principles, changes to the business operations, including acquisitions, as well as the evaluation of new information that results in a change to a tax position taken in a prior period.
The enactment of tax reform legislation, including legislation implementing changes in taxation of international business activities, could materially impact our financial position and results of operations.
Legislation or other changes in the tax laws could increase our liability and adversely affect our after-tax profitability. For example, the Tax Cuts and Jobs Act ("Tax Act") was enacted in the United States on December 22, 2017. The Tax Act had a significant impact on our effective tax rate, cash tax expenses and net deferred tax assets. The Tax Act, among other things, reduced the U.S. corporate statutory tax rate, eliminated or limited deduction of several expenses which were previously deductible, imposed a mandatory deemed repatriation tax on undistributed historic earnings of foreign subsidiaries, required a minimum tax on earnings generated by foreign subsidiaries and permitted a tax-free repatriation of foreign earnings through a dividends received deduction.

19
We maintain most of our cash balances, some of which are not insured, at four depository institutions.
We maintain the majority of our cash and cash equivalents accounts at four depository institutions. As of December 31, 2018, the aggregate balances in such accounts were $342.3 million. Our balances with these institutions regularly exceed Federal Deposit Insurance Corporation (“FDIC”) insured limits for domestic deposits and various deposit insurance programs covering our deposits in Australia, Finland, Germany, the Netherlands, the United Kingdom, and Vietnam.
We could suffer losses with respect to the uninsured balances if the depositary institutions failed and the institution’s assets were insufficient to cover its deposits and/or the governments did not take actions to support deposits in excess of existing insurance limits. Any such losses could have a material adverse effect on our liquidity, financial condition and results of operations.
We depend on our ability to attract and retain our key management, sales and technical personnel.
Our success depends upon the continued service of our key management personnel. Our success also depends on our ability to continue to attract, retain and motivate qualified technical personnel. Although we have employment agreements with certain of our officers and other members of our execute management team, the employment of such persons is “at-will” and either we or the employee can terminate the employment relationship at any time, subject to the applicable terms of the employment agreements. The competition for our key employees is intense. The loss of the service of one or more of our key personnel could adversely impact our business, prospects, financial condition and operating results.
We are highly dependent on the services of Patrick W. Smith, our Chief Executive Officer.
We are highly dependent on the services of Patrick W. Smith, our founder and Chief Executive Officer. Our future success depends upon our ability to retain executive officers, specifically Mr. Smith, and any failure to do so could adversely impact our business, prospects, financial condition and operating results.
Risks Related to Ownership of Our Common Stock
The trading price of our common stock has been, and is likely to continue to be, volatile. In addition to the factors discussed in this Annual Report on Form 10-K, the trading price of our common stock may fluctuate significantly in response to numerous factors, many of which are beyond our control, including:
• actual or anticipated fluctuations in our revenue and other operating results;• the financial projections we may provide to the public, any changes in these projections or our failure to meet
these projections;• actions of securities analysts who initiate or maintain coverage of us, changes in financial estimates by any
securities analysts who follow our company, or our failure to meet these estimates or the expectations of investors;
• investor sentiment with respect to our competitors, our business partners, and our industry in general;• announcements by us or our competitors of significant products or features, technical innovations, acquisitions,
strategic partnerships, joint ventures, or capital commitments;• announcements by us or estimates by third-parties of actual or anticipated changes in the size of our user base,
addressable market or the effectiveness of our products;• changes in operation performance and stock market valuations of technology companies in our industries,
including our developers and competitors;• price and volume fluctuations in the overall stock market, including as a result of trends in the economy as a
whole;• media coverage of our business and financial performance;• lawsuits threatened or filed against us;

20
• developments in anticipated or new legislation and pending lawsuits or regulator actions, including interim or final rulings by tax, judicial or regulatory bodies; and
• other events or factors, including those resulting from war or incidents of terrorism, or responses to these events.
Our revenues and operating results may fluctuate unexpectedly from quarter-to-quarter, which may cause our stock price to decline.
Our revenues and operating results have varied significantly in the past and may vary significantly in the future due to various factors, including, but not limited to:
• budgetary cycles of municipal, state and federal law enforcement and corrections agencies;• market acceptance of our products and services;• the timing of large domestic and international orders;• the outcome of any existing or future litigation;• adverse publicity surrounding our products, the safety of our products, or the use of our products;• changes in our sales mix;• new product introduction costs;• increased raw material expenses;• changes in our operating expenses; • changes in foreign currency exchange rates and• regulatory changes that may affect the marketability of our products.
As a result of these and other factors, we believe that period-to-period comparisons of our operating results may not be meaningful in the short term, and our performance in a particular period may not be indicative of our performance in any future period.
Item 1B. Unresolved Staff Comments
None.

21
Item 2. Properties
Our corporate headquarters and manufacturing facilities are based in an approximately 100,000 square foot facility in Scottsdale, Arizona, which we own. We also lease premises in Phoenix, Arizona; Scottsdale, Arizona; Topsfield, Massachusetts; Seattle, Washington; Melbourne, Australia; Sydney, Australia; Daventry, England; London, England; Tampere, Finland; Frankfurt, Germany; Mumbai, India; Amsterdam, Netherlands; and Ho Chi Minh City, Vietnam. Additionally, in December 2018, we entered into an agreement to purchase a leasehold interest to a parcel of land located in Maricopa County, Arizona on which we intend to construct our new headquarters.
We believe our existing facilities are well maintained and in good operating condition. We also believe we have adequate manufacturing capacity for our existing product lines. To the extent that we introduce new products in the future, we will likely need to acquire additional facilities to locate the associated production lines. However, we believe we can acquire or lease such facilities on reasonable terms. We continue to make investments in capital equipment as needed to meet anticipated demand for our products.
The majority of our locations support both of our reportable segments. Our Vietnam and Seattle, Washington locations primarily support our Software & Sensors segment.
Item 3. Legal Proceedings
See discussion of litigation in Note 9 to the consolidated financial statements included in Part II, Item 8 of this Annual Report on Form 10-K, which discussion is incorporated by reference herein.
Item 4. Mine Safety Disclosures
None.

22
PART II
Item 5. Market for Registrant’s Common Equity, Related Stockholder Matters and Issuer Purchases of Equity Securities
Market Information
Our common stock is quoted under the symbol “AAXN” on The NASDAQ Global Select Market.
Holders
As of December 31, 2018, there were 247 holders of record of our common stock.
Dividends
To date, we have not declared or paid cash dividends on our common stock. We do not intend to pay cash dividends in the foreseeable future.
Issuer Purchases of Equity Securities
In February 2016, our Board of Directors authorized a stock repurchase program to acquire up to $50.0 millionof our outstanding common stock subject to stock market conditions and corporate considerations. The stock repurchase program does not have a stated expiration date. During the year ended December 31, 2018, no common shares were purchased under the program. As of December 31, 2018 and 2017, $16.3 million remained available under the plan for future purchases. During 2016, we suspended our 10b-5 plan, and any future purchases will be discretionary.
Stock Performance Graph
The following stock performance graph compares the performance of our common stock to the NASDAQ Composite Index and the Russell 3000 Index. The graph covers the period from December 31, 2013 to December 31, 2018. The graph assumes that the value of the investment in our stock and in each index was $100 at December 31, 2013, and that all dividends were reinvested. We do not pay dividends on our common stock.

23
2013 2014 2015 2016 2017 2018
Axon Enterprise, Inc. $ 100.00 $ 166.75 $ 108.88 $ 152.64 $ 166.88 $ 275.50NASDAQ Composite 100.00 114.75 122.74 133.62 173.22 168.30Russell 3000 100.00 112.56 113.10 127.50 154.44 146.34

24
Item 6. Selected Financial Data
The following selected financial data should be read in conjunction with our consolidated financial statements and the notes thereto, and with Item 7, “Management’s Discussion and Analysis of Financial Condition and Results of Operations.” The statement of operations data for the years ended December 31, 2018, 2017 and 2016, and the balance sheet data as of December 31, 2018 and 2017, have been derived from, and should be read in conjunction with, our audited consolidated financial statements and the notes thereto included herein. The statement of operations data for the years ended December 31, 2015 and 2014, and the balance sheet data as of December 31, 2016, 2015 and 2014, is derived from our historical audited consolidated financial statements and the notes thereto which are not included in this Annual Report on Form 10-K. Dollars are in thousands, except per share amounts.
For the Year Ended December 31, 2018 2017 2016 2015 2014Statements of Operations Data:
Net sales (1) $ 420,068 $ 343,798 $ 268,245 $ 197,892 $ 164,525Gross margin 258,583 207,088 170,536 128,647 101,548Income from operations (2) 24,841 13,023 31,851 35,335 32,505Net income (3) 29,205 5,207 17,297 19,933 19,918Diluted earnings per share (3) $ 0.50 $ 0.10 $ 0.32 $ 0.37 $ 0.34
As of December 31, 2018 2017 2016 2015 2014Balance Sheet Data:
Working capital (4) (5) $ 392,144 $ 97,242 $ 99,192 $ 123,269 $ 102,669Total assets (4) (5) 719,540 338,112 278,163 229,881 185,368Total current liabilities 166,011 107,950 78,039 38,140 31,973Total stockholders’ equity (4) (5) (6) 467,324 167,444 150,888 157,004 129,106
(1) Amounts for the years ended December 31, 2017, 2016, 2015, and 2014 have not been adjusted under the modified retrospective method of adoption of Accounting Standards Codification Topic 606, Revenue from Contracts from Customers ("Topic 606"), and are presented consistent with the prior period amounts reported under ASC 605. Revenue for the year ended December 31, 2018 would have been $415.1 million under ASC 605.(2) Reflects the impact of increased spending on research and development and selling, general and administrative expenses to support growth.(3) Includes the favorable impact of a $8.9 million and $1.8 million discrete tax benefit primarily associated with windfalls related to stock-based compensation for restricted stock units ("RSUs") that vested or stock options that were exercised during the years ended December 31, 2018 and 2017, respectively. Includes tax expense of $8.0 million for the year ended December 31, 2017 related to the the enactment of the Tax Cuts and Jobs Act. Refer to Note 10 of the notes to our consolidated financial statements within this Annual Report on Form 10-K.(4) In May 2018, we sold 4,645,000 shares of our common stock, which included 645,000 shares pursuant to the full exercise of the underwriters' option to purchase additional shares, in an underwritten public offering at a price of $53.00 per share, which resulted in gross proceeds of $246.2 million. Net proceeds after deducting fees, commissions, and other expenses related to the offering were $234.0 million.(5) In 2016, 2015, and 2014, we used cash and cash equivalents to repurchase approximately $33.7 million, $7.6 million, and $22.4 million, respectively, of our common shares. (6) We recorded a net increase in stockholders’ equity (retained earnings) of $19.0 million as of January 1, 2018 due to the cumulative impact of adopting Topic 606 on contracts that were not complete as of that date. Refer to Note 2 of the notes to our consolidated financial statements within this Annual Report on Form 10-K for further discussion.
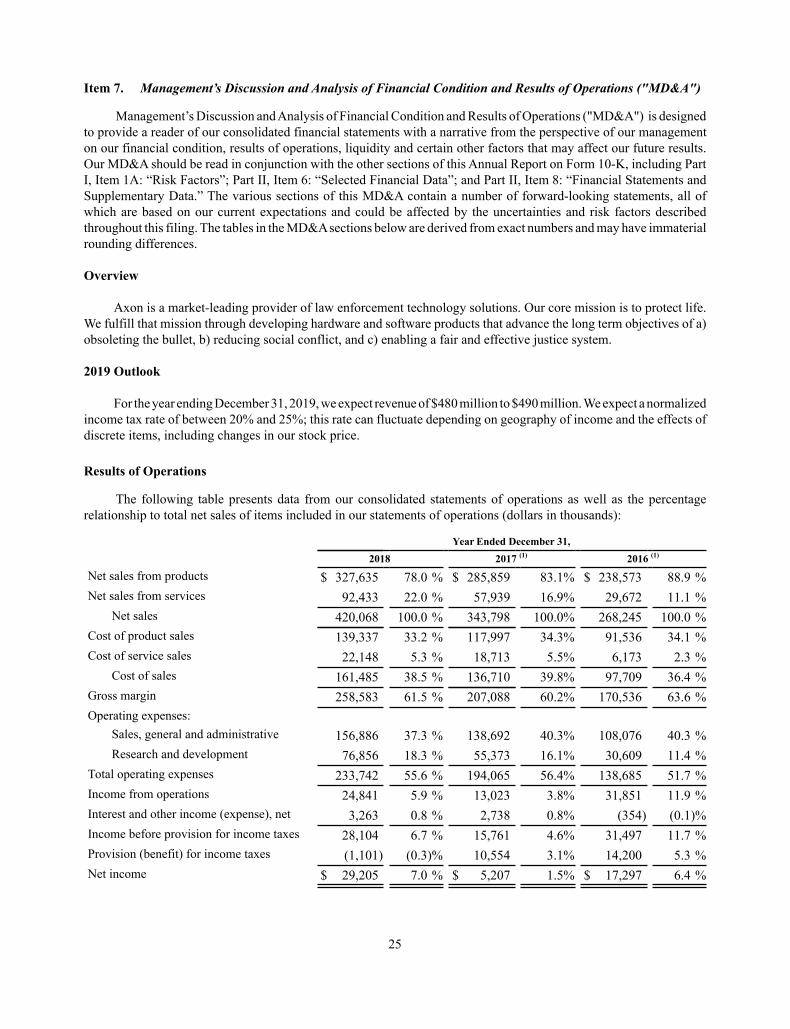
25
Item 7. Management’s Discussion and Analysis of Financial Condition and Results of Operations ("MD&A")
Management’s Discussion and Analysis of Financial Condition and Results of Operations ("MD&A") is designed to provide a reader of our consolidated financial statements with a narrative from the perspective of our management on our financial condition, results of operations, liquidity and certain other factors that may affect our future results. Our MD&A should be read in conjunction with the other sections of this Annual Report on Form 10-K, including Part I, Item 1A: “Risk Factors”; Part II, Item 6: “Selected Financial Data”; and Part II, Item 8: “Financial Statements and Supplementary Data.” The various sections of this MD&A contain a number of forward-looking statements, all of which are based on our current expectations and could be affected by the uncertainties and risk factors described throughout this filing. The tables in the MD&A sections below are derived from exact numbers and may have immaterial rounding differences.
Overview
Axon is a market-leading provider of law enforcement technology solutions. Our core mission is to protect life. We fulfill that mission through developing hardware and software products that advance the long term objectives of a) obsoleting the bullet, b) reducing social conflict, and c) enabling a fair and effective justice system.
2019 Outlook
For the year ending December 31, 2019, we expect revenue of $480 million to $490 million. We expect a normalized income tax rate of between 20% and 25%; this rate can fluctuate depending on geography of income and the effects of discrete items, including changes in our stock price.
Results of Operations
The following table presents data from our consolidated statements of operations as well as the percentage relationship to total net sales of items included in our statements of operations (dollars in thousands):
Year Ended December 31, 2018 2017 (1) 2016 (1)
Net sales from products $ 327,635 78.0 % $ 285,859 83.1% $ 238,573 88.9 %Net sales from services 92,433 22.0 % 57,939 16.9% 29,672 11.1 %
Net sales 420,068 100.0 % 343,798 100.0% 268,245 100.0 %Cost of product sales 139,337 33.2 % 117,997 34.3% 91,536 34.1 %Cost of service sales 22,148 5.3 % 18,713 5.5% 6,173 2.3 %
Cost of sales 161,485 38.5 % 136,710 39.8% 97,709 36.4 %Gross margin 258,583 61.5 % 207,088 60.2% 170,536 63.6 %Operating expenses:
Sales, general and administrative 156,886 37.3 % 138,692 40.3% 108,076 40.3 %Research and development 76,856 18.3 % 55,373 16.1% 30,609 11.4 %
Total operating expenses 233,742 55.6 % 194,065 56.4% 138,685 51.7 %Income from operations 24,841 5.9 % 13,023 3.8% 31,851 11.9 %Interest and other income (expense), net 3,263 0.8 % 2,738 0.8% (354) (0.1)%Income before provision for income taxes 28,104 6.7 % 15,761 4.6% 31,497 11.7 %Provision (benefit) for income taxes (1,101) (0.3)% 10,554 3.1% 14,200 5.3 %Net income $ 29,205 7.0 % $ 5,207 1.5% $ 17,297 6.4 %

26
Net sales to the U.S. and other countries are summarized as follows (dollars in thousands):
Year Ended December 31, 2018 2017 (1) 2016 (1)
United States $ 335,310 79.8% $ 282,810 82.3% $ 218,757 81.6%Other Countries 84,758 20.2% 60,988 17.7% 49,488 18.4%Total $ 420,068 100.0% $ 343,798 100.0% $ 268,245 100.0%
(1) Amounts for the years ended December 31, 2017 and 2016 have not been adjusted under the modified retrospective method of adoption of Topic 606, and are presented consistent with the prior period amounts reported under ASC 605.
International revenue grew 39.0% from 2017 to 2018, driven by increased sales in Australia, France, Singapore and the U.K.
Our operations are comprised of two reportable segments: the manufacture and sale of CEWs, batteries, accessories and extended warranties and other products and services (collectively, the “TASER” segment); and the development, manufacture, and sale of software and sensors, which includes the sale of devices, wearables, applications, cloud and mobile products (collectively, the "Software and Sensors" segment). Within the Software and Sensors segment, we specify sales of products and services. Revenue from our “products” in the Software and Sensors segment are generally from sales of sensors, including on-officer body cameras, Axon Fleet cameras, other hardware sensors, warranties on sensors, and other products, and is sometimes referred to as "Sensors and Other revenue." Revenue from our “services” in the Software and Sensors segment comprise sales related to the Axon Cloud, which includes Axon Evidence, cloud-based evidence management software revenue, other recurring cloud-hosted software revenue and related professional services, and is sometimes referred to as "Axon Cloud revenue." Within the Software and Sensors segment, we include only revenues and costs attributable to that segment which costs include: costs of sales for both products and services, direct labor, selling expenses for the sales team, product management and R&D for products included, or to be included, within the Software and Sensors segment. All other costs are included in the TASER segment.

27
For the Years Ended December 31, 2018 and 2017
Net Sales
Net sales by product line were as follows for the years ended December 31, 2018 and 2017 (dollars in thousands):
Year Ended December 31, DollarChange
PercentChange 2018 2017 (1)
TASER segment:TASER 7 $ 7,358 1.8% $ — —% $ 7,358 *TASER X26P 70,638 16.8% 64,426 18.7% 6,212 9.6 %TASER X2 78,837 18.8% 81,417 23.7% (2,580) (3.2)%TASER Pulse and Bolt 5,182 1.2% 4,340 1.3% 842 19.4 %Cartridges 68,258 16.3% 63,203 18.4% 5,055 8.0 %Extended warranties 15,753 3.8% 12,426 3.6% 3,327 26.8 %Other 7,089 1.7% 8,700 2.5% (1,611) (18.5)%
TASER segment 253,115 60.4% 234,512 68.2% 18,603 7.9 %Software and Sensors segment:
Axon Body 21,883 5.2% 15,184 4.4% 6,699 44.1 %Axon Flex 6,509 1.5% 10,083 2.9% (3,574) (35.4)%Axon Fleet 12,527 3.0% 2,954 0.9% 9,573 324.1 %Axon Dock 10,706 2.5% 9,736 2.8% 970 10.0 %Axon Evidence and cloudservices 90,291 21.5% 57,841 16.8% 32,450 56.1 %TASER Cam 3,871 0.9% 3,358 1.0% 513 15.3 %Extended warranties 11,860 2.8% 7,110 2.1% 4,750 66.8 %Other 9,306 2.2% 3,020 0.9% 6,286 208.1 %
Software and Sensors segment 166,953 39.6% 109,286 31.8% 57,667 52.8 %Total net sales $ 420,068 100.0% $ 343,798 100.0% $ 76,270 22.2 %
* Not meaningful
(1) Amounts for the year ended December 31, 2017 have not been adjusted under the modified retrospective method of adoption of Topic 606, and are presented consistent with the prior period amounts reported under ASC 605.

28
Net unit sales were as follows:
Year Ended December 31,
2018 2017Unit
ChangePercentChange
TASER 7 5,759 — 5,759 *TASER X26P 71,823 70,381 1,442 2.0 %TASER X2 65,855 76,106 (10,251) (13.5)%TASER Pulse and Bolt 18,398 12,504 5,894 47.1 %Cartridges 2,342,897 2,408,471 (65,574) (2.7)%Axon Body 85,965 89,808 (3,843) (4.3)%Axon Flex 15,541 26,025 (10,484) (40.3)%Axon Fleet 9,445 3,795 5,650 148.9 %Axon Dock 17,762 23,492 (5,730) (24.4)%TASER Cam 8,310 6,432 1,878 29.2 %
*Not meaningful
Net sales for the TASER segment increased $18.6 million, or 7.9%, primarily as a result of increased sales of TASER devices primarily attributable to increased sales under the Officer Safety Plan ("OSP") and TASER 60 installment payment programs, including sales of TASER 7 devices, which commenced during the three months ended December 31, 2018. Unit sales for law enforcement TASER devices decreased as compared to 2017 primarily as a result of the timing of the TASER 7 release and limited production of that device in 2018. We continue to see an increase in extended warranty revenue primarily as a result of the increased number of CEW devices in the field. Cartridge sales also increased compared to 2017 as an increase in the average sales price more than offset a slight decrease in unit sales. During the first quarter of 2017, the Home Office of the U.K. government approved our X2 devices for sale which resulted in increased sales within the U.K. of $6.4 million for the year ended December 31, 2018 compared to 2017.
Net sales for the Software and Sensors segment increased $57.7 million, or 52.8%, primarily due to continued adoption of on-officer cameras and related technologies, including our Axon Evidence digital evidence management software suite. Axon Evidence revenues increased $32.5 million, primarily driven by the continued increase in active users on the platform. Revenues related to Axon Fleet, which was introduced in the third quarter of 2017, increased $9.6 million. Combined net sales related to our Axon Body, Axon Flex, and Axon Dock products increased approximately $4.1 million as an increase in the average sales price more than offset the decrease in unit sales.
To gain more immediate feedback regarding activity for Axon camera products and Axon Evidence services, we also review bookings for these products. We consider bookings to be a statistical measure defined as the sales price of orders (not invoiced sales), including contractual optional periods we expect to be exercised, net of cancellations, placed in the relevant fiscal period, regardless of when the products or services ultimately will be provided. Most bookings will be invoiced in subsequent periods. Due to municipal government funding rules, in some cases certain of the future period amounts included in bookings are subject to budget appropriation or other contract cancellation clauses. Although we have entered into contracts for the delivery of products and services in the future and anticipate the contracts will be fulfilled, if agencies do not exercise contractual options, do not appropriate funds in future year budgets, or do enact a cancellation clause, revenue associated with these bookings may not ultimately be recognized, resulting in a future reduction to bookings. Bookings related to our Software and Sensors segment, net of cancellations, were $389.1 millionduring 2018, compared to $291.2 million in 2017, an increase of 33.6%.

29
The chart below illustrates our quarterly Software and Sensors bookings for each of the previous six fiscal quarters (in thousands):
Backlog - As of December 31, 2018 compared to December 31, 2017
Our backlog for products and services includes all orders that have been received and are believed to be firm.
In the TASER segment, we define backlog as equal to deferred revenue. Deferred revenue represents amounts invoiced to customers for goods and services to be delivered in subsequent periods. We process orders within the TASER segment quickly, and our best estimate of firm orders outstanding as of period end represents those that have been paid for but remain undelivered. The TASER segment backlog balance was $54.6 million as of December 31, 2018. We expect to realize $22.2 million of this deferred revenue balance as revenue during the next 12 months. This represents cash received and accounts receivable from customers on or prior to December 31, 2018 for products and services expected to be delivered in the next 12 months.
In the Software and Sensors segment, we define backlog as cumulative bookings, net of cancellations, less product and service revenue recognized to date. Bookings are generally realized as revenue over multiple years. The Software and Sensors backlog balance was $758.1 million as of December 31, 2018. This backlog balance includes $126.8 million of deferred revenue, and $631.3 million that has been recorded as bookings but not yet invoiced, all as of December 31, 2018. We expect to realize approximately $225.0 million of the December 31, 2018 backlog balance as revenue during the next 12 months.
TASERSoftware and
Sensors Total
(in thousands)Balance, beginning of period $ 46,685 $ 536,016 $ 582,701Add: additions to backlog, net of cancellations 261,027 389,062 650,089Less: revenue recognized during period 253,115 166,953 420,068Balance end of period $ 54,597 $ 758,125 $ 812,722
Our backlog of $812.7 million as of December 31, 2018 has increased significantly from $582.7 million as of December 31, 2017. The increase in TASER segment backlog is not expected to have a material impact on revenue or operating margins. Our significant increase in backlog, primarily in the Software and Sensors segment is indicative of expected revenue growth in this segment. Revenue growth in the Software and Sensors segment is expected to result in improved operating margins over time as additional revenue will cover a larger portion of our selling, general and

30
administrative expenses, and research and development costs, while we do not expect any material changes in gross margins.
Cost of Product and Service Sales (dollars in thousands):
Year Ended December 31,Dollar
ChangePercentChange2018 2017 (1)
TASER segment:Cost of product sales $ 80,354 31.7% $ 72,054 30.7% $ 8,300 11.5%
Software and Sensors segment:Cost of product sales 58,983 35.3% 45,943 42.0% 13,040 28.4%Cost of service sales 22,148 13.3% 18,713 17.1% 3,435 18.4%
Total cost of sales 81,131 48.6% 64,656 59.2% 16,475 25.5%Total cost of product and service sales $161,485 38.4% $136,710 39.8% $ 24,775 18.1%
(1) Amounts for the year ended December 31, 2017 have not been adjusted under the modified retrospective method of adoption of Topic 606, and are presented consistent with the prior period amounts reported under ASC 605.
Within the TASER segment, cost of product sales increased $8.3 million, or 11.5%, to $80.4 million in 2018, compared to $72.1 million in 2017, and increased as a percentage of sales to 31.7% from 30.7%. We did not experience significant changes in variable manufacturing costs during the year ended December 31, 2018 as compared to 2017. The overall increase in cost of product sales was attributable to higher unit sales. The increase in cost of product sales as a percentage of sales was primarily attributable to initial production costs for the TASER 7 device.
Within the Software and Sensors segment, cost of product and service sales was $81.1 million, an increase of $16.5 million, or 25.5%, from 2017. As a percentage of net sales, cost of product and service sales decreased to 48.6%in 2018 from 59.2% in 2017. The increase in cost of product sales was primarily attributable to higher sales volumes, and the increase in cost of service sales was driven by increased cloud storage costs. The decrease in total cost of sales as a percentage of total net sales was primarily due to the reduction of non-recurring expenses related to our data migration to our new cloud-storage provider that was completed in 2018, as well as increased leveraging of fixed costs related to cloud-storage.
Gross Margin (dollars in thousands):
Year Ended December 31, Dollar
ChangePercentChange 2018 2017 (1)
TASER segment $ 172,761 $ 162,458 $ 10,303 6.3%Software and Sensors segment 85,822 44,630 41,192 92.3%Total gross margin $ 258,583 $ 207,088 $ 51,495 24.9%
Gross margin as % of net sales 61.6% 60.2%
(1) Amounts for the year ended December 31, 2017 have not been adjusted under the modified retrospective method of adoption of Topic 606, and are presented consistent with the prior period amounts reported under ASC 605.
Gross margin increased $51.5 million to $258.6 million for the year ended December 31, 2018 compared to $207.1 million for 2017. As a percentage of net sales, gross margin increased to 61.6% for 2018 from 60.2% for 2017. As a percentage of net sales, gross margin for the TASER segment decreased slightly to 68.3% for the year ended December 31, 2018 from 69.3% for the year ended December 31, 2017. Within the Software and Sensors segment, gross margin as a percentage of net sales was 51.4% and 40.8% for the years ended 2018 and 2017, respectively. Within the Software and Sensors segment, hardware gross margin was 20.8% for the year ended December 31, 2018 and 10.5%

31
for the same period in 2017, while the service margins were 76.0% and 67.7% during those same periods, respectively. The increase in hardware gross margins during 2018 was primarily attributable to accounting changes required under the new revenue accounting standard. Previously, the level of discounting in our contracts resulted in a portion of the contractual consideration allocated to the delivered hardware being recognized as revenue ratably over the Axon Evidence subscription term, while the full cost of the product was recognized when the hardware was delivered to the customer resulting in lower gross margins initially. Under the new revenue accounting standard, generally the full amount of revenue related to the delivered hardware is recognized in the period in which it is delivered, resulting in better matching of the revenues and related costs. The increase in service margins during the year ended December 31, 2018 as compared to 2017 was attributable to the reduction of non-recurring expenses related to our data migration to our new cloud-storage provider that was completed in 2018, as well as increased leveraging of fixed costs related to cloud-storage.
Sales, General and Administrative ("SG&A") Expenses (dollars in thousands):
Year Ended December 31, DollarChange
PercentChange 2018 2017 (1)
Salaries, benefits and bonus $ 63,185 $ 58,450 $ 4,735 8.1 %Stock-based compensation 12,710 9,047 3,663 40.5 %Professional, consulting and lobbying 24,469 24,267 202 0.8 %Sales and marketing 19,427 17,368 2,059 11.9 %Travel and meals 9,908 10,637 (729) (6.9)%Depreciation and amortization 6,051 3,517 2,534 72.1 %Other 21,136 15,406 5,730 37.2 %Total sales, general and administrative expenses $ 156,886 $ 138,692 $ 18,194 13.1 %Sales, general, and administrative as a percentage of netsales 37.3% 40.3%

32
SG&A by type and by segment were as follows for the years ended December 31, 2018 and 2017 (dollars in thousands):
Year Ended December 31,Dollar
ChangePercent Change 2018 2017 (1)
TASER segment:Salaries, benefits and bonus $ 35,024 22.3% $ 32,009 23.1% $ 3,015 9.4 %Stock-based compensation 11,178 7.1% 6,115 4.4% 5,063 82.8 %Professional, consulting and lobbying 14,861 9.5% 12,017 8.7% 2,844 23.7 %Sales and marketing 7,535 4.8% 8,357 6.0% (822) (9.8)%Travel and meals 4,765 3.0% 4,867 3.5% (102) (2.1)%Depreciation and amortization 2,945 1.9% 607 0.4% 2,338 385.2 %Other 14,602 9.3% 14,230 10.3% 372 2.6 %
TASER segment 90,910 57.9% 78,202 56.4% 12,708 16.3 %Software and Sensors segment:
Salaries, benefits and bonus 28,161 17.9% 26,441 19.1% 1,720 6.5 %Stock-based compensation 1,532 1.0% 2,932 2.1% (1,400) (47.7)%Professional, consulting and lobbying 9,608 6.1% 12,250 8.8% (2,642) (21.6)%Sales and marketing 11,892 7.6% 9,011 6.5% 2,881 32.0 %Travel and meals 5,143 3.3% 5,770 4.2% (627) (10.9)%Depreciation and amortization 3,106 2.0% 2,910 2.1% 196 6.7 %Other 6,534 4.2% 1,176 0.8% 5,358 455.6 %
Software and Sensors segment 65,976 42.1% 60,490 43.6% 5,486 9.1 %Total sales, general and administrative expenses $ 156,886 100.0% $ 138,692 100.0% $ 18,194 13.1 %
(1) Amounts related to commissions expense for the year ended December 31, 2017 have not been adjusted under the modified retrospective method of adoption of Topic 606, and are presented consistent with the prior period amounts reported under ASC 605.
Within the TASER segment, SG&A increased $12.7 million, or 16.3%. Of the increase, $8.1 million related to higher salaries, benefits, bonus and stock-based compensation related primarily to sales and marketing, professional staff and general support staff, including $3.3 million of stock-based compensation expense related to the CEO Performance Award. Refer to Note 12 of the notes to our consolidated financial statements within this Annual Report on Form 10-K for additional discussion of the CEO Performance Award. Additionally, professional, consulting and lobbying expenses increased $2.8 million primarily related to increased legal fees, and depreciation and amortization expenses increased $2.3 million related to the expansion of our facilities and amortization of additional intangible assets over the past year.
Within the Software and Sensors segment, SG&A increased $5.5 million, or 9.1%, but decreased to 39.5% of sales as compared to 55.4% in the prior year. Commissions increased $2.3 million on higher sales, and salaries, benefits and bonus increased $1.7 million for additional headcount. Additionally, during 2018, we abandoned certain developed technology acquired in a business combination resulting in an impairment charge of approximately $2.0 million, which is included in the "Other" category. The remaining increases were primarily attributable to the overall growth of operations during 2018. Partially offsetting the increases was a $2.6 million decrease in professional, consulting and lobbying expense as spending normalized compared to the prior year.

33
Research and Development ("R&D") Expenses (dollars in thousands):
Year Ended December 31, DollarChange
PercentChange 2018 2017
Salaries, benefits and bonus $ 49,792 $ 33,682 $ 16,110 47.8 %Stock-based compensation 8,658 6,055 2,603 43.0 %Professional and consulting 4,183 4,351 (168) (3.9)%Travel and meals 2,192 1,674 518 30.9 %Other 12,031 9,611 2,420 25.2 %Total research and development expenses $ 76,856 $ 55,373 $ 21,483 38.8 %Research and development as a percentage of net sales 18.3% 16.1%
R&D by type and by segment were as follows for the years ended December 31, 2018 and 2017 (dollars in thousands):
Year Ended December 31,Dollar
ChangePercentChange 2018 2017
TASER segment:Salaries, benefits and bonus $ 9,174 11.9% $ 4,243 7.7% $ 4,931 116.2 %Stock-based compensation 1,594 2.1% 517 0.9% 1,077 208.3 %Professional and consulting 1,192 1.6% 1,098 2.0% 94 8.6 %Travel and meals 511 0.7% 388 0.7% 123 31.7 %Other 4,541 5.9% 2,131 3.8% 2,410 113.1 %
TASER segment 17,012 22.2% 8,377 15.1% 8,635 103.1 %Software and Sensors segment:
Salaries, benefits and bonus 40,618 52.8% 29,439 53.2% 11,179 38.0 %Stock-based compensation 7,064 9.2% 5,538 10.0% 1,526 27.6 %Professional and consulting 2,991 3.9% 3,253 5.9% (262) (8.1)%Travel and meals 1,681 2.2% 1,286 2.3% 395 30.7 %Other 7,490 9.7% 7,480 13.5% 10 0.1 %
Software and Sensors segment 59,844 77.8% 46,996 84.9% 12,848 27.3 %
Total research and development expenses $ 76,856 100.0% $ 55,373 100.0% $ 21,483 38.8 %
Within the TASER segment, R&D expenses increased $8.6 million or 103.1%. Salaries, benefits, bonus and stock-based compensation in the TASER segment increased $6.0 million in 2018 compared to 2017 as we continue to invest in personnel allocated to the development of new CEW related technologies. Additionally, test build materials included in the "Other" category were higher than the prior year primarily related to the launch of the TASER 7 device.
Our Software and Sensors segment was responsible for 59.8% of the overall increase in R&D expense. Within this segment, R&D expenses increased $12.8 million or 27.3%, but decreased to 35.8% of sales as compared to 43.0%in the prior year. Of the increase, $12.7 million related to salaries, benefits, bonus, and stock-based compensation. Partially offsetting the increase was a $1.0 million decrease in impairment expense as compared to 2017; during 2017, we abandoned certain developed technology acquired in a business combination.
We expect R&D expense to continue to increase in absolute dollars as we invest in the deployment of new CEW technologies and focus on growing the Software and Sensors segment as we add headcount and additional resources to develop new products and services to further advance our scalable cloud-connected device platform. We believe that these investments will result in an increase in our subscription revenue base, which over time will result in revenue increasing faster than the increase in SG&A expenses and R&D costs, as we reach economies of scale.

34
Interest and Other Income (Expense), Net
Interest and other income (expense), net was $3.3 million and $2.7 million for the years ended December 31, 2018 and 2017, respectively.
For the year ended December 31, 2018, we earned interest income of $4.4 million and had losses from foreign currency transaction adjustments of $1.1 million and interest expense of $0.1 million. For the year ended December 31, 2017, we earned interest income of $1.6 million and had gains from foreign currency transaction adjustments of $1.4 million which were partially offset by interest expense of $0.2 million.
Provision for Income Taxes
The income tax benefit was $1.1 million for the year ended December 31, 2018. The effective income tax rate for 2018 was (3.9%). The benefits related to excess stock-based compensation of $8.9 million and research and development credits of $6.9 million were partially offset by the tax effects of permanently non-deductible expenses for executive compensation of $1.2 million, an increase in uncertain tax benefits of $1.8 million and return to provision adjustments of $1.8 million. Additionally, we recorded a $2.0 million increase to our valuation allowance as of December 31, 2018 related to research and development tax credits that may not be utilized prior to expiration, partially offset by changes in certain foreign jurisdictions.
The provision for income taxes was $10.6 million for the year ended December 31, 2017. The effective income tax rate for 2017 was 66.9%. In connection with our initial analysis of the impact of the Tax Act, we were able to make reasonable estimates of the impact of the Tax Act and recorded a provisional net tax expense of $8.0 million in the period ended December 31, 2017, primarily related to the impact of the tax rate reduction on our deferred tax assets and deferred tax liabilities. This was partially offset by a $1.8 million benefit related to excess stock-based compensation deductions, as well as a $2.4 million benefit for research and development credits during the year ended December 31, 2017. An additional valuation allowance in the amount of $1.9 million was recorded as of December 31, 2017, related to certain research and development credits that may not be utilized prior to expiration and losses in certain foreign jurisdictions in which there was a cumulative loss.
Net Income
Our net income increased by $24.0 million to $29.2 million for the year ended December 31, 2018 compared to $5.2 million in 2017. Net income per basic and diluted share was $0.52 and $0.50, respectively, for 2018 compared to $0.10 per basic and diluted share for 2017.

35
Three Months Ended December 31, 2018 Compared to September 30, 2018
Net sales by product line were as follows (dollars in thousands):
Three Months Ended December 31, 2018
Three Months Ended September 30, 2018
DollarChange
PercentChange
TASER segment:TASER 7 $ 7,358 6.4% $ — —% $ 7,358 *TASER X26P 18,020 15.7% 17,998 17.2% 22 0.1 %TASER X2 16,151 14.1% 20,392 19.4% (4,241) (20.8)%TASER Pulse and Bolt 1,333 1.2% 1,402 1.3% (69) (4.9)%Cartridges 16,495 14.4% 18,406 17.6% (1,911) (10.4)%Extended warranties 4,186 3.6% 4,123 3.9% 63 1.5 %Other 1,758 1.5% 1,345 1.3% 413 30.7 %
TASER segment 65,301 56.9% 63,666 60.7% 1,635 2.6 %Software and Sensors segment:
Axon Body 6,801 5.9% 4,744 4.5% 2,057 43.4 %Axon Flex 1,980 1.7% 1,325 1.3% 655 49.4 %Axon Fleet 5,887 5.1% 1,809 1.7% 4,078 225.4 %Axon Dock 3,374 3.0% 2,178 2.1% 1,196 54.9 %Axon Evidence and cloud services 25,778 22.5% 23,915 22.8% 1,863 7.8 %TASER Cam 1,032 0.9% 717 0.7% 315 43.9 %Extended warranties 3,339 2.9% 3,161 3.0% 178 5.6 %Other 1,299 1.1% 3,321 3.2% (2,022) (60.9)%
Software and Sensors segment 49,490 43.1% 41,170 39.3% 8,320 20.2 %Total net sales $ 114,791 100.0% $ 104,836 100.0% $ 9,955 9.5 %
*Not meaningful
Net unit sales were as follows:
Three Months EndedDecember 31,
2018September 30,
2018Unit
ChangePercentChange
TASER 7 5,759 — 5,759 *TASER X26P 18,597 18,842 (245) (1.3)%TASER X2 13,088 16,729 (3,641) (21.8)%TASER Pulse and Bolt 7,490 3,750 3,740 99.7 %Cartridges 600,690 598,119 2,571 0.4 %Axon Body 26,167 17,622 8,545 48.5 %Axon Flex 5,080 3,487 1,593 45.7 %Axon Fleet 3,908 1,601 2,307 144.1 %Axon Dock 3,859 3,525 334 9.5 %TASER Cam 1,952 1,339 613 45.8 %
*Not meaningful

36
Net sales for the TASER segment increased $1.6 million, or 2.6%, on a sequential basis primarily due to an overall increase in TASER device handles, including initial sales of TASER 7. This increase was partially offset by lower sequential cartridge revenue, which was primarily attributable to timing.
Net sales for the Software and Sensors segment increased $8.3 million, or 20.2%, on a sequential basis. Axon Fleet contributed $4.1 million of the increase, driven by an increase in both units and average sales price following the release of the Fleet 2 device. Combined net sales related to our Axon Body, Axon Flex, and Axon Dock products contributed an additional increase of $3.9 million, primarily due to an increase in units. Axon Evidence revenues increased $1.9 million driven by the continued increase in active users on the platform. The increases were partially offset by a decrease in other revenue.
International sales were $24.3 million in for the three months ended December 31, 2018 compared to $16.7 million for the three months ended September 30, 2018, an increase of $7.6 million, driven by increased sales from Australia and Canada.
For the Years Ended December 31, 2017 and 2016
Net Sales
Net sales by product line were as follows for the years ended December 31, 2017 and 2016 (dollars in thousands):
Year Ended December 31, DollarChange
PercentChange 2017 (1) 2016 (1)
TASER segment:TASER X26P $ 64,426 18.7% $ 72,490 27.0% $ (8,064) (11.1)%TASER X2 81,417 23.7% 52,665 19.6% 28,752 54.6 %TASER Pulse and Bolt 4,340 1.3% 3,580 1.3% 760 21.2 %Cartridges 63,203 18.4% 52,305 19.5% 10,898 20.8 %Extended warranties 12,426 3.6% 9,880 3.7% 2,546 25.8 %Other 8,700 2.5% 11,724 4.4% (3,024) (25.8)%
TASER segment 234,512 68.2% 202,644 75.5% 31,868 15.7 %Software and Sensors segment:
Axon Body 15,184 4.4% 12,911 4.8% 2,273 17.6 %Axon Flex 10,083 2.9% 5,323 2.0% 4,760 89.4 %Axon Fleet 2,954 0.9% — —% 2,954 *Axon Dock 9,736 2.8% 7,422 2.8% 2,314 31.2 %Axon Evidence and cloud services 57,841 16.8% 29,260 10.9% 28,581 97.7 %TASER Cam 3,358 1.0% 4,888 1.8% (1,530) (31.3)%Extended warranties 7,110 2.1% 3,710 1.4% 3,400 91.6 %Other 3,020 0.9% 2,087 0.8% 933 44.7 %
Software and Sensors segment 109,286 31.8% 65,601 24.5% 43,685 66.6 %Total net sales $ 343,798 100.0% $ 268,245 100.0% $ 75,553 28.2 %
(1) Amounts for the years ended December 31, 2017 and 2016 have not been adjusted under the modified retrospective method of adoption of Topic 606, and are presented consistent with the prior period amounts reported under ASC 605.

37
Net unit sales were as follows:
Year Ended December 31,
2017 2016Unit
ChangePercentChange
TASER X26P 70,381 79,218 (8,837) (11.2)%TASER X2 76,106 47,700 28,406 59.6 %TASER Pulse and Bolt 12,504 9,549 2,955 30.9 %Cartridges 2,408,471 1,979,051 429,420 21.7 %Axon Body 89,808 66,154 23,654 35.8 %Axon Flex 26,025 14,173 11,852 83.6 %Axon Fleet 3,795 — 3,795 *Axon Dock 23,492 16,983 6,509 38.3 %TASER Cam 6,432 9,566 (3,134) (32.8)%
The increase in net sales for 2017 compared to 2016 in the TASER segment was primarily attributable to increased sales under the OSP and TASER 60 installment payment programs. During the first quarter of 2017, the Home Office of the U.K. government approved our X2 devices for sale which resulted in increased TASER X2 sales within the U.K. of $8.5 million for the year ended December 31, 2017 compared to no sales during 2016. Additionally, we increased cartridge sales by $10.9 million to $63.2 million during the year ended December 31, 2017 as compared to $52.3 million during the same period in 2016 which was primarily attributable to an increase in total devices in the field.
Net sales for the Software and Sensors segment were $109.3 million and $65.6 million for the years ended December 31, 2017 and 2016, respectively, an increase of $43.7 million, or 66.6%. The overall increase in the Software and Sensors segment was driven by continued adoption of on-officer cameras and related technologies, including our Axon Evidence digital evidence management software suite. Combined net sales related to our Axon Body, Axon Flex, and Axon Dock products increased approximately $9.3 million. We recorded net sales of $3.0 million related to Axon Fleet, our then-newly introduced in-car camera system, with no amounts recorded during the same period in 2016. Axon Evidence revenues for the year ended December 31, 2017 increased $28.6 million to $57.8 million as compared to the same period in 2016. This increase was primarily driven by the continued increase in active users on our Axon Evidence platform.
Cost of Product and Service Sales (dollars in thousands):
Year Ended December 31, DollarChange
PercentChange2017 (1) 2016 (1)
TASER segment:Cost of product sales $ 72,054 30.7% $ 61,930 30.6% $ 10,124 16.3%
Software and Sensors segment:Cost of product sales 45,943 42.0% 29,606 45.1% 16,337 55.2%Cost of service sales 18,713 17.1% 6,173 9.4% 12,540 203.1%
Total cost of sales 64,656 59.2% 35,779 54.5% 28,877 80.7%Total cost of product and service sales $ 136,710 39.8% $ 97,709 36.4% $ 39,001 39.9%
(1) Amounts for the years ended December 31, 2017 and 2016 have not been adjusted under the modified retrospective method of adoption of Topic 606, and are presented consistent with the prior period amounts reported under ASC 605.
Within the TASER segment, cost of product sales increased $10.1 million, or 16.3%, to $72.1 million in 2017, compared to $61.9 million in 2016, and remained relatively consistent as a percentage of sales at 30.7% from 30.6%.

38
We did not experience significant changes in variable manufacturing costs during the year ended December 31, 2017 as compared to 2016. The overall increase in cost of products sold was attributable to higher unit sales.
Within the Software and Sensors segment, cost of product and service sales was $64.7 million, an increase of $28.9 million, or 80.7%, from 2016. As a percentage of net sales, cost of product and service sales increased to 59.2% in 2017 from 54.5% in 2016. The increase in cost of product sales was primarily attributable to higher sales volumes, and the increase in cost of service sales was driven by increased cloud storage costs. The increase in total cost of sales as a percentage of total net sales was primarily attributable to non-recurring expenses related to our data migration to a new cloud-storage provider.
Gross Margin (dollars in thousands):
Year Ended December 31, Dollar
ChangePercentChange 2017 2016
TASER segment $ 162,458 $ 140,714 $ 21,744 15.5%Software and Sensors Segment 44,630 29,822 14,808 49.7%Total gross margin $ 207,088 $ 170,536 $ 36,552 21.4%
Gross margin as % of net sales 60.2% 63.6%
Gross margin increased $36.6 million to $207.1 million for the year ended December 31, 2017 compared to $170.5 million for 2016 . As a percentage of net sales, gross margin decreased to 60.2% for 2017 from 63.6% for 2016 . As a percentage of net sales, gross margin for the TASER segment was relatively consistent at 69.3% and 69.4% for the years ended December 31, 2017 and 2016, respectively. Within the Software and Sensors segment gross margin as a percentage of net sales was 40.8% and 45.5% for the years ended 2017 and 2016, respectively. Within the Software and Sensors segment, hardware gross margin was 10.5% for the year ended December 31, 2017 and 17.6% for the same period in 2016, while the service margins were 67.7% and 79.2% during those same periods, respectively. The decreased hardware margins were primarily attributable to higher discounting. In certain customer contracts, primarily within the Software and Sensors segment, the level of discounting resulted in a portion of the contractual consideration allocated to the delivered hardware to be recognized as revenue ratably over the Axon Evidence subscription term. However, the full cost of the product is recognized when the hardware is delivered to the customer resulting in lower gross margins initially. The decrease in service margins was primarily attributable to non-recurring expenses related to our data migration to a new cloud-storage provider.
Sales, General and Administrative Expenses (dollars in thousands):
Year Ended December 31, DollarChange
PercentChange 2017 2016
Salaries, benefits and bonus $ 58,450 $ 43,058 $ 15,392 35.7%Stock-based compensation 9,047 5,707 3,340 58.5%Professional, consulting and lobbying 24,267 19,321 4,946 25.6%Sales and marketing 17,368 15,132 2,236 14.8%Travel and meals 10,637 8,970 1,667 18.6%Other 18,923 15,888 3,035 19.1%Total sales, general and administrative expenses $ 138,692 $ 108,076 $ 30,616 28.3%Sales, general, and administrative as a percentageof net sales 40.3% 54.6%

39
SG&A by type and by segment were as follows for the years ended December 31, 2017 and 2016 (dollars in thousands):
Year Ended December 31,Dollar
ChangePercent Change 2017 2016
TASER segment:Salaries, benefits and bonus $ 32,009 23.1% $ 24,534 22.7% $ 7,475 30.5 %Stock-based compensation 6,115 4.4% 3,339 3.1% 2,776 83.1 %Professional, consulting and lobbying 12,017 8.7% 10,128 9.4% 1,889 18.7 %Sales and marketing 8,357 6.0% 8,305 7.7% 52 0.6 %Travel and meals 4,867 3.5% 4,277 4.0% 590 13.8 %Other 14,837 10.3% 13,034 12.1% 1,196 9.2 %
TASER segment 78,202 56.4% 63,617 58.9% 14,585 22.9 %Software and Sensors segment:
Salaries, benefits and bonus 26,441 19.1% 18,524 17.1% 7,917 42.7 %Stock-based compensation 2,932 2.1% 2,368 2.2% 564 23.8 %Professional, consulting and lobbying 12,250 8.8% 9,193 8.5% 3,057 33.3 %Sales and marketing 9,011 6.5% 6,827 6.3% 2,184 32.0 %Travel and meals 5,770 4.2% 4,693 4.3% 1,077 22.9 %Other 4,086 0.8% 2,854 2.6% (1,678) (58.8)%
Software and Sensors segment 60,490 43.6% 44,459 41.1% 16,031 36.1 %
Total sales, general and administrativeexpenses $ 138,692 100.0% $ 108,076 100.0% $ 30,616 28.3 %
(1) Amounts related to commissions expense for the years ended December 31, 2017 and 2016 have not been adjusted under the modified retrospective method of adoption of Topic 606, and are presented consistent with the prior period amounts reported under ASC 605.
Within the TASER segment, SG&A increased $14.6 million, or 22.9%, to $78.2 million from $63.6 million in 2016. This increase was primarily attributable to our continued efforts to build the necessary infrastructure to facilitate future growth which was evidenced by higher salaries, benefits, bonus and stock-based compensation of $10.3 million for the year ended December 31, 2017 as compared to 2016. Increased professional, consulting and lobbying fees of $1.9 million were primarily related to accounting and finance consulting costs attributable to our adoption of the new revenue recognition rules, international tax restructuring,and efforts towards remediation of internal control matters. The remaining other operating expenses were primarily attributable to the overall growth of operations during 2017.
Within the Software and Sensors segment, SG&A increased $16.0 million, or 36.1%, to $60.5 million in 2017 in comparison to the prior year. Salaries, benefits, bonus and stock-based compensation in the Software and Sensors segment increased $8.5 million as we continued to hire additional engineering, product management personnel, sales and marketing personnel and general support staff to further expand upon existing product offerings as well as the development of new products such as records management systems and computer aided dispatch systems. The increase in professional, consulting and lobbying expenses of $3.1 million was related to higher professional and consulting costs related to the implementation of a new revenue accounting software platform. Additionally, we incurred higher marketing consulting fees related to hosted events and conferences for customers as well as internal sales meetings. The increase in sales and marketing expense of $2.2 million relates to higher commissions on increased bookings, increased customer samples attributable to our delivery of on-officer cameras, Signal Sidearm, among other technologies, to prospective customers for evaluation purposes, as well as increased spending on sponsorships for major city police chief associations and major county sheriffs' associations. The remaining other operating expenses are primarily attributable to the overall growth of operations during 2017.

40
Research and Development Expenses (dollars in thousands):
Year Ended December 31, DollarChange
PercentChange 2017 2016
Salaries, benefits and bonus $ 33,682 $ 17,205 $ 16,477 95.8%Stock-based compensation 6,055 3,320 2,735 82.4%Professional and consulting 4,351 3,212 1,139 35.5%Travel and meals 1,674 969 705 72.8%Other 9,611 5,903 3,708 62.8%Total research and development expenses $ 55,373 $ 30,609 $ 24,764 80.9%Research and development as a percentage of net sales 16.1% 11.4%
R&D by type and by segment were as follows for the years ended December 31, 2017 and 2016 (dollars in thousands):
Year Ended December 31,Dollar
ChangePercentChange 2017 2016
TASER segment:Salaries, benefits and bonus $ 4,243 7.7% $ 2,301 7.5% $ 1,942 84.4 %Stock-based compensation 517 0.9% 639 2.1% (122) (19.1)%
Professional and consulting 1,098 2.0% 1,167 3.8% (69) (5.9)%Travel and meals 388 0.7% 345 1.1% 43 12.5 %Other 2,131 3.8% 1,435 4.7% 696 48.5 %
TASER segment 8,377 15.1% 5,887 19.2% 2,490 42.3 %Software and Sensors segment:
Salaries, benefits and bonus 29,439 53.2% 14,904 48.7% 14,535 97.5 %Stock-based compensation 5,538 10.0% 2,681 8.8% 2,857 106.6 %
Professional and consulting 3,253 5.9% 2,045 6.7% 1,208 59.1 %Travel and meals 1,286 2.3% 624 2.0% 662 106.1 %Other 7,480 13.5% 4,468 14.6% 3,012 67.4 %
Software and Sensors segment 46,996 84.9% 24,722 80.8% 22,274 90.1 %
Total research and development expenses $ 55,373 100.0% $ 30,609 100.0% $ 24,764 80.9 %
Within the TASER segment, R&D expenses increased $2.5 million, or 42.3%, to $8.4 million in 2017. Salaries, benefits, bonus and stock-based compensation in the TASER segment increased $1.8 million in 2017 compared to 2016. The increase for 2017 compared to 2016 was primarily driven by additional headcount as we continued to invest in the development of new CEW related technologies.
Within the Software and Sensors segment, R&D expenses increased $22.3 million, or 90.1%, to $47.0 million in 2017 from the prior year. Our Software and Sensors segment was responsible for approximately 85% of the overall expenses in R&D. Of the $22.3 million increase in R&D for the Software and Sensors segment, $17.4 million related to salaries, benefits, bonus, and stock-based compensation. The increase in professional and consulting expense of $1.2 million was primarily attributable to increased technical consulting fees related to the development and release of Signal Sidearm. Included in other R&D expenses for the Software and Services segment was $1.9 million of amortization of intangible assets related to acquired developed technology that was yet to be put into service. Additionally, during 2017, we abandoned certain developed technology acquired in a business combination resulting in an impairment charge of $1.0 million which was included in other R&D expenses.

41
Interest and Other Income (Expense), Net
Interest and other income (expense), net was $2.7 million and $(0.4) million for the years ended December 31, 2017 and 2016, respectively.
For the year ended December 31, 2017, we earned interest income of $1.6 million and had gains from foreign currency transaction adjustments of $1.4 million which were partially offset by interest expense of $0.2 million. For the year ended December 31, 2016, interest income of $0.7 million was more than offset by losses on foreign currency transaction adjustments of $1.1 million.
Provision for Income Taxes
The provision for income taxes was $10.6 million for the year ended December 31, 2017. The effective income tax rate for 2017 was 66.9%. In connection with our initial analysis of the impact of the Tax Act, we were able to make reasonable estimates of the impact of the Tax Act and recorded a provisional net tax expense of $8.0 million in the period ended December 31, 2017, primarily related to the impact of the tax rate reduction on our deferred tax assets and deferred tax liabilities. This was partially offset by a $1.8 million benefit related to excess stock-based compensation deductions, as well as a $2.4 million benefit for research and development credits during the year ended December 31, 2017. In addition, an additional valuation allowance in the amount of $1.9 million was recorded as of December 31, 2017, related to certain research and development credits that may not be utilized prior to expiration and losses in certain foreign jurisdictions in which there was a cumulative loss.
The provision for income taxes was $14.2 million for the year ended December 31, 2016. The effective income tax rate for 2016 was 45.1%. The effect of state income taxes of $0.9 million and the tax effects of intercompany transactions of $0.6 million were offset by a benefit of $1.9 million for research and development credits in the current year. The difference between statutory and foreign tax rates of $1.5 million was largely driven by losses incurred in a foreign entity for which no tax benefit will be realized. In addition, a valuation allowance in the amount of $1.8 million was recorded as of December 31, 2016 related to certain research and development tax credits that may not be utilized prior to expiration and losses in certain foreign jurisdictions in which there was a cumulative loss.
Net Income
Our net income decreased by $12.1 million to $5.2 million for the year ended December 31, 2017 compared to $17.3 million in 2016. Net income per basic and diluted share was $0.10 for 2017 compared to $0.33 and $0.32 per basic and diluted share, respectively, for 2016.
Non-GAAP Financial Measures
To supplement our financial results presented in accordance with accounting principles generally accepted in the U.S. ("GAAP"), we present the non-GAAP financial measures of EBITDA and Adjusted EBITDA (CEO Performance Award). Our management uses these non-GAAP financial measures in evaluating our performance in comparison to prior periods. We believe that both management and investors benefit from referring to these non-GAAP financial measures in assessing our performance, and when planning and forecasting our future periods. A reconciliation of GAAP to the non-GAAP financial measures is presented below.
• EBITDA (Most comparable GAAP Measure: Net income) - Earnings before interest expense, investment interest income, taxes, depreciation and amortization.
• Adjusted EBITDA (CEO Performance Award) (Most comparable GAAP Measure: Net income) - Earnings before interest expense, investment interest income, taxes, depreciation, amortization and non-cash stock-based compensation expense.
Although these non-GAAP financial measures are not consistent with GAAP, management believes investors will benefit by referring to these non-GAAP financial measures when assessing our operating results, as well as when forecasting and analyzing future periods. However, management recognizes that:

42
• these non-GAAP financial measures are limited in their usefulness and should be considered only as a supplement to our GAAP financial measures;
• these non-GAAP financial measures should not be considered in isolation from, or as a substitute for, our GAAP financial measures;
• these non-GAAP financial measures should not be considered to be superior to our GAAP financial measures; and
• these non-GAAP financial measures were not prepared in accordance with GAAP and investors should not assume that the non-GAAP financial measures presented in this Annual Report on Form 10-K were prepared under a comprehensive set of rules or principles.
EBITDA and Adjusted EBITDA (CEO Performance Award) reconcile to net income as follows (dollars in thousands):
For the Years Ended December 31,2018 2017
Net income $ 29,205 $ 5,207Depreciation and amortization 10,615 8,041Interest expense 86 186Investment interest income (3,002) (904)Provision for (benefit from) income taxes (1,101) 10,554
EBITDA $ 35,803 $ 23,084
Adjustments:Stock-based compensation expense 21,879 15,610
Adjusted EBITDA (CEO Performance Award) $ 57,682 $ 38,694
Liquidity and Capital Resources
Summary
As of December 31, 2018, we had $349.5 million of cash and cash equivalents, an increase of $274.4 million from December 31, 2017.
Cash Flows
The following table summarizes our cash flows from operating, investing and financing activities (in thousands):
Year Ended December 31, 2018 2017 2016
Operating activities $ 63,875 $ 18,471 $ 21,135Investing activities (9,860) 19,082 (3,045)Financing activities 219,348 (3,820) (34,554)Effect of exchange rate changes on cash and cash equivalents (774) 737 906Net increase (decrease) in cash and cash equivalents $ 272,589 $ 34,470 $ (15,558)

43
Operating activities
Net cash provided by operating activities in 2018 of $63.9 million consisted of $29.2 million in net income, the net add-back of non-cash income statement items totaling $32.5 million and a positive $2.2 million net change in operating assets and liabilities. Included in the non-cash items were $10.6 million in depreciation and amortization expense, $2.1 million related to the disposal and abandonment of intangible assets, $21.9 million in stock-based compensation expense, and $3.6 million related to deferred income taxes. The most significant increase to the portion of cash provided by operating activities related to the changes in operating assets and liabilities was a $54.2 millionincrease in deferred revenue. Of the increase, $2.8 million resulted from additional extended warranty sales, $23.2 million resulted from increased hardware deferred revenue from TASER Assurance Program ("TAP"), OSP and TASER 7 sales, and $30.1 million related to prepayments for Software and Sensors services. Operating cash flows were also impacted by decreased inventory of $14.8 million resulting from continued inventory optimization efforts. These increases were offset by increased accounts and notes receivable of $67.6 million and prepaid expenses and other assets of $12.7 million during 2018. The increases in accounts and notes receivable were due to increased sales during 2018, primarily sales made under the OSP and TASER 60 installment plans. The increase in prepaid expenses and other asset accounts of $12.7 million during 2018 was driven primarily by an increase in deferred commissions of $13.0 million representing amounts earned when a contract is booked which is then subsequently amortized.
Net cash provided by operating activities in 2017 of $18.5 million consisted of $5.2 million in net income, the net add-back of non-cash income statement items totaling $28.0 million and a negative $14.8 million net change in operating assets and liabilities. Included in the non-cash items are $8.0 million in depreciation and amortization expense, $1.1 million related to the disposal and abandonment of intangible assets, $15.6 million in stock-based compensation expense, $0.7 million of bond premium amortization and $2.8 million related to deferred income taxes. The most significant increase to the portion of cash provided by operating activities related to the changes in operating assets and liabilities was a $39.7 million increase in deferred revenue. Of the increase, $7.4 million resulted from additional extended warranty sales, $20.2 million resulted from increased hardware deferred revenue from TAP and OSP sales, and $12.5 million related to prepayments for Software and Sensors services. These increases were offset by increased accounts and notes receivable of $35.3 million, inventory of $11.7 million and prepaid expenses and other assets of $9.0 million during 2017. The increases in accounts and notes receivable were due to increased sales during 2017, specifically sales made under the OSP and TASER 60 installment plans. Operating cash flows were also impacted by increased inventory of $11.7 million in anticipation of higher sales in 2018 and for our National Field Trial Offer for body cameras. The increase in prepaid expenses and other asset accounts of $9.0 million during 2017 was driven primarily by increased deferred cost of product sales of $5.0 million related to contracts where the product had shipped but revenue was deferred due to contractual provisions resulting in the cost of product sales being deferred as an asset to be recognized in subsequent periods when revenue recognition criteria have been met, an increase in deferred commissions of $2.1 million representing amounts earned when a contract is booked, which is then subsequently amortized over the contractual period as products and services are delivered, and increased prepaid income taxes of $3.4 million.
Net cash provided by operating activities in 2016 of $21.1 million consisted of $17.3 million in net income, the net add-back of non-cash income statement items totaling approximately $8.8 million and a negative $4.9 million net change in operating assets and liabilities. Included in the non-cash items are $3.7 million in depreciation and amortization expense, $9.4 million in stock-based compensation expense, and $1.3 million of bond premium amortization. These additions were partially offset by an $1.4 million reduction related to excess tax benefit from stock-based compensation and $5.2 million related to deferred income taxes. The most significant increase to the portion of cash provided by operating activities related to the changes in operating assets and liabilities was a $34.3 million increase in deferred revenue. Of the increase, $8.1 million resulted from additional extended warranty sales, $15.6 million resulted from increased hardware deferred revenue from TAP and OSP sales, and $10.5 million related to prepayments for Software and Sensors services. We also had increases in cash provided from operating activities of $17.6 million for increases in accounts payable and accrued liabilities related primarily to increased inventory purchases. These increases were offset by increased prepaid expenses and other current assets of $10.6 million, inventory of $18.7 million and accounts and notes receivable of $28.4 million during 2016. The increases in accounts and notes receivable were due to increased sales during 2016, and increases in inventory resulted from higher anticipated sales for 2017. The increase in prepaid expenses and other asset accounts during 2016 was driven primarily increased deferred commissions of $1.8 million

44
attributable to higher sales, increased balances under corporate-owed life insurance policies of $1.1 million, $3.3 million of restricted cash related primarily to a customer contract requiring certain contractual payments to be deposited in escrow until approved for release, and $1.7 million of long-term contingent consideration deposited in escrow in connection with a business combination that was completed in December 2016.
Investing activities
Primarily as the result of equipment purchases and business acquisitions during the year, we used $9.9 millionfor investing activities in 2018. Calls and maturities on our investments, net of purchases, were $6.8 million. During 2018, we invested $5.0 million in cash for the acquisition of VIEVU, LLC, a public safety camera and cloud-based evidence management system provider for law enforcement agencies. We also invested $11.7 million in the purchase of property and equipment and intangibles, net of proceeds related to disposals.
Primarily as the result of investments that matured during the year, we generated $19.1 million from investing activities in 2017. Calls and maturities on our investments, net of purchases, were $41.1 million. During 2017, we invested $10.6 million in cash for the acquisition of Dextro, Inc., to continue building upon our Axon Artificial Intelligence group, and for the acquisition of Breon, our former distributor in Australia. We also invested $11.4 million in the purchase of property and equipment and intangibles, net of proceeds related to disposals.
Primarily as a result of investing cash generated from operating activities, we used $3.0 million in investing activities in 2016. Calls and maturities on our investments, net of purchases, were $8.9 million. During 2016, we invested $3.5 million in cash for the acquisition of developed technology and hiring of personnel to form the Axon Artificial Intelligence group. We also invested $8.4 million in the purchase of property and equipment and intangibles, net of proceeds related to disposals.
Financing activities
Net cash provided by financing activities was $219.3 million for the year ended December 31, 2018. In May 2018, we completed a public follow-on equity offering that generated net proceeds of $234.0 million. During 2018, we paid income and payroll taxes of $14.1 million on behalf of employees who net-settled stock awards during the period. Additionally, we paid $2.3 million for contingent consideration amounts earned during 2018 related to the acquisition of certain assets from Fossil Group, Inc. and Fossil Vietnam, Limited Liability Company in 2016 and to the acquisition of Dextro in 2017. These cash outflows were partially offset by $1.8 million of proceeds from the exercise of stock options.
Net cash used by financing activities was $3.8 million for the year ended December 31, 2017 . During 2017, we paid income and payroll taxes of $3.5 million on behalf of employees who net-settled stock awards during the period. Additionally, we paid $1.8 million for contingent consideration amounts earned during 2017 related to the acquisition of certain assets from Fossil Group, Inc. and Fossil Vietnam, Limited Liability Company in 2016. These cash outflows were partially offset by $1.4 million of proceeds from the exercise of stock options.
Net cash used by financing activities was $34.6 million for the year ended December 31, 2016. During 2016, we repurchased $33.7 million of our common stock, which was purchased for a weighted average cost of $18.90 per share, inclusive of applicable administrative costs. Additionally, we paid income and payroll taxes of $1.8 million on behalf of employees who net-settled stock awards during the period. These cash outflows were partially offset by $0.5 million of proceeds from the exercise of stock options, and $1.4 million of excess tax benefit from stock-based compensation. The purchase of common stock was made under a stock repurchase program authorized by our Board of Directors.
Liquidity and Capital Resources
Our most significant source of liquidity continues to be funds generated by operating activities and available cash and cash equivalents. In addition, our $100.0 million revolving credit facility is available for additional working capital needs or investment opportunities. Under the terms of the line of credit, available borrowings are reduced by outstanding letters of credit. Advances under the line of credit bear interest at LIBOR plus 1.0 to 1.5% per year determined in
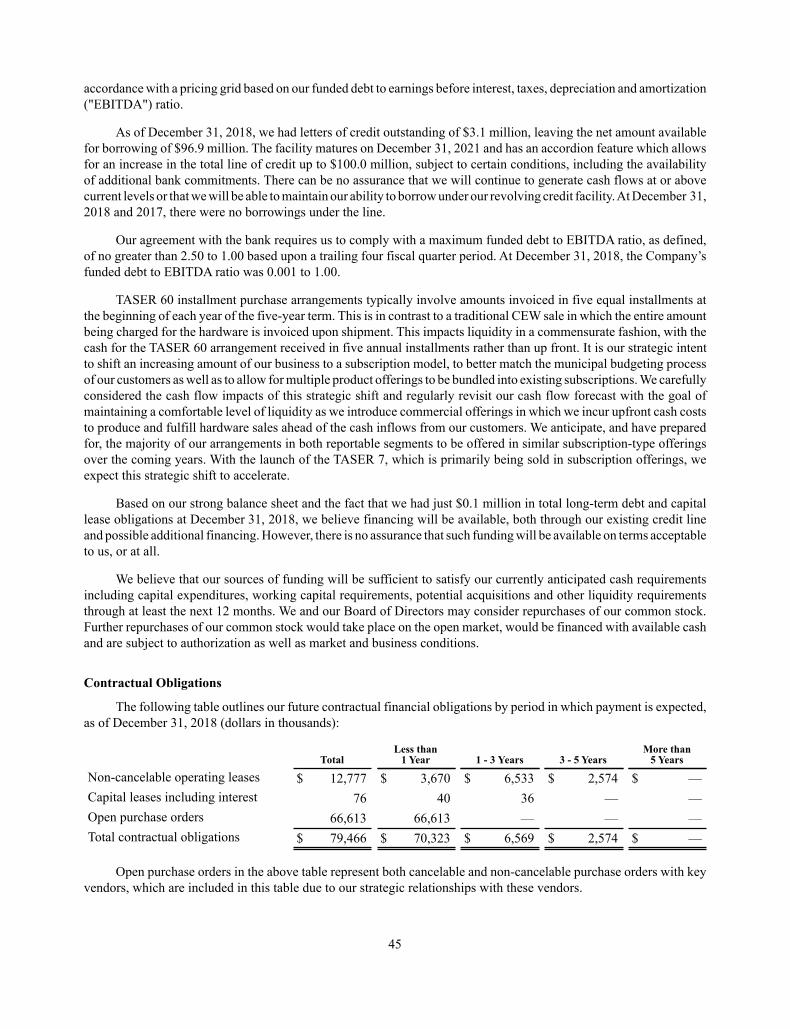
45
accordance with a pricing grid based on our funded debt to earnings before interest, taxes, depreciation and amortization ("EBITDA") ratio.
As of December 31, 2018, we had letters of credit outstanding of $3.1 million, leaving the net amount available for borrowing of $96.9 million. The facility matures on December 31, 2021 and has an accordion feature which allows for an increase in the total line of credit up to $100.0 million, subject to certain conditions, including the availability of additional bank commitments. There can be no assurance that we will continue to generate cash flows at or above current levels or that we will be able to maintain our ability to borrow under our revolving credit facility. At December 31, 2018 and 2017, there were no borrowings under the line.
Our agreement with the bank requires us to comply with a maximum funded debt to EBITDA ratio, as defined, of no greater than 2.50 to 1.00 based upon a trailing four fiscal quarter period. At December 31, 2018, the Company’s funded debt to EBITDA ratio was 0.001 to 1.00.
TASER 60 installment purchase arrangements typically involve amounts invoiced in five equal installments at the beginning of each year of the five-year term. This is in contrast to a traditional CEW sale in which the entire amount being charged for the hardware is invoiced upon shipment. This impacts liquidity in a commensurate fashion, with the cash for the TASER 60 arrangement received in five annual installments rather than up front. It is our strategic intent to shift an increasing amount of our business to a subscription model, to better match the municipal budgeting process of our customers as well as to allow for multiple product offerings to be bundled into existing subscriptions. We carefully considered the cash flow impacts of this strategic shift and regularly revisit our cash flow forecast with the goal of maintaining a comfortable level of liquidity as we introduce commercial offerings in which we incur upfront cash costs to produce and fulfill hardware sales ahead of the cash inflows from our customers. We anticipate, and have prepared for, the majority of our arrangements in both reportable segments to be offered in similar subscription-type offerings over the coming years. With the launch of the TASER 7, which is primarily being sold in subscription offerings, we expect this strategic shift to accelerate.
Based on our strong balance sheet and the fact that we had just $0.1 million in total long-term debt and capital lease obligations at December 31, 2018, we believe financing will be available, both through our existing credit line and possible additional financing. However, there is no assurance that such funding will be available on terms acceptable to us, or at all.
We believe that our sources of funding will be sufficient to satisfy our currently anticipated cash requirements including capital expenditures, working capital requirements, potential acquisitions and other liquidity requirements through at least the next 12 months. We and our Board of Directors may consider repurchases of our common stock. Further repurchases of our common stock would take place on the open market, would be financed with available cash and are subject to authorization as well as market and business conditions.
Contractual Obligations
The following table outlines our future contractual financial obligations by period in which payment is expected, as of December 31, 2018 (dollars in thousands):
TotalLess than
1 Year 1 - 3 Years 3 - 5 YearsMore than
5 Years
Non-cancelable operating leases $ 12,777 $ 3,670 $ 6,533 $ 2,574 $ —Capital leases including interest 76 40 36 — —Open purchase orders 66,613 66,613 — — —Total contractual obligations $ 79,466 $ 70,323 $ 6,569 $ 2,574 $ —
Open purchase orders in the above table represent both cancelable and non-cancelable purchase orders with key vendors, which are included in this table due to our strategic relationships with these vendors.

46
We are subject to U.S. federal income tax as well as income taxes imposed by several states and foreign jurisdictions. As of December 31, 2018, we had $6.1 million of gross unrecognized tax benefits related to uncertain tax positions. The settlement period for our long-term income tax liabilities cannot be determined; however, the liabilities are expected to increase by approximately $1.4 million within the next 12 months.
Off-Balance Sheet Arrangements
The discussion of off-balance sheet arrangements in Note 9 to the consolidated financial statements included in Part II, Item 8 of this Annual Report on Form 10-K is incorporated by reference herein.
Critical Accounting Estimates
We have identified the following accounting estimates as critical to our business operations and the understanding of our results of operations. The preparation of this Annual Report on Form 10-K requires us to make estimates and assumptions that affect the reported amount of assets and liabilities, disclosure of contingent assets and liabilities at the date of our consolidated financial statements, and the reported amounts of revenue and expenses during the reporting period. While we do not believe that a change in these estimates is reasonably likely, there can be no assurance that our actual results will not differ from these estimates. The effect of these estimates on our business operations is discussed below.
Product Warranties
We warranty our CEWs, Axon cameras and certain related accessories from manufacturing defects on a limited basis for a period of one year after purchase and, thereafter, will replace any defective unit for a fee. Estimated costs for the standard warranty are charged to cost of products sold when revenue is recorded for the related product. Future warranty costs are estimated based on historical data related to warranty claims on a quarterly basis and this rate is applied to current product sales. Historically, reserve amounts have been increased if management becomes aware of a component failure or other issue that could result in larger than anticipated warranty claims from customers. The warranty reserve is reviewed quarterly to verify that it sufficiently reflects the remaining warranty obligations based on the anticipated expenditures over the balance of the warranty obligation period, and adjustments are made when actual warranty claim experience differs from estimates. As of December 31, 2018 and 2017, our warranty reserve was approximately $0.9 million and $0.6 million, respectively. Warranty expense for the years ended December 31, 2018, 2017 and 2016 was $0.7 million, $0.1 million and $0.6 million, respectively. The increase in warranty expense for the year ended December 31, 2018 was primarily driven by higher than initially expected warranty claims for the Axon Flex 2 on-officer body camera. Warranty expense for the year ended December 31, 2017, was impacted by lower than initially expected warranty claims for the Axon Body 2 on-officer body camera. As of December 31, 2018, our reserve also included initial reserves related to TASER 7, Signal Sidearm, and Axon Fleet 2.
Revenue related to separately-priced extended warranties is initially recorded as deferred revenue at its contractual amount and subsequently recognized as net sales on a straight-line basis over the warranty service period. Costs related to extended warranties are charged to cost of product and service sales when incurred.
Inventory
Inventories are stated at the lower of cost and net realizable value. Cost is determined using the weighted average cost of raw materials, which approximates the first-in, first-out (“FIFO”) method and includes allocations of manufacturing labor and overhead. Provisions are made to reduce potentially excess, obsolete or slow-moving inventories, as well as trial and evaluation inventories to their net realizable value. These provisions are based on management’s best estimate after considering historical demand, projected future demand, inventory purchase commitments, industry and market trends and conditions among other factors. We evaluate inventory costs for abnormal costs due to excess production capacity and treats such costs as period costs.

47
During the year ended December 31, 2018, we recorded provisions to reduce inventories to their lower of cost and net realizable value of approximately $3.8 million compared to $2.0 million during 2017. The increase in provisions made during 2018 was primarily attributable to the impact of phasing out previous generations of VIEVU cameras in an effort to convert existing customers to Axon body camera deployments. The remaining change in the provision for 2018 was driven by analyses looking at projected sales data for existing products and making corresponding adjustments to state inventories at their lower of cost and net realizable value.
Revenue Recognition, Deferred Revenue and Accounts and Notes Receivable
We derive revenue from two primary sources: (1) the sale of physical products, including CEWs, Axon cameras, Axon Signal enabled devices, corresponding hardware extended warranties, and related accessories such as Axon docks, cartridges and batteries, among others, and (2) subscriptions to our Axon Evidence digital evidence management software as a service ("SaaS") (including data storage fees and other ancillary services), which includes varying levels of support. To a lesser extent, we also recognize training, professional services and revenue related to other software and SaaS services. We apply the five-step model outlined in Topic 606.
Many of our products and services are sold on a standalone basis.We also bundle our hardware products and services together and sell them to our customers in single transactions, where the customer can make payments over a multi-year period. For the the years ended December 31, 2018, 2017 and 2016, the composition of revenue recognized from contracts containing multiple performance obligations and those not containing multiple performance obligations was as follows (dollars in thousands):
For the Year Ended December 31, 2018TASER Software and Sensors Total
Contracts with Multiple PerformanceObligations $ 72,355 28.6% $ 159,318 95.4% $ 231,673 55.2%Contracts without Multiple PerformanceObligations 180,760 71.4 7,635 4.6 188,395 44.8Total $ 253,115 100.0% $ 166,953 100.0% $ 420,068 100.0%
For the Year Ended December 31, 2017 (1)
TASER Software and Sensors Total
Contracts with Multiple PerformanceObligations $ 53,865 23.0% $ 102,529 93.8% $ 156,394 45.5%Contracts without Multiple PerformanceObligations 180,647 77.0 6,757 6.2 187,404 54.5Total $ 234,512 100.0% $ 109,286 100.0% $ 343,798 100.0%
For the Year Ended December 31, 2016 (1)
TASER Software and Sensors Total
Contracts with Multiple PerformanceObligations $ 34,558 17.1% $ 56,270 85.8% $ 90,828 33.9%Contracts without Multiple PerformanceObligations 168,086 82.9 9,331 14.2 177,417 66.1Total $ 202,644 100.0% $ 65,601 100.0% $ 268,245 100.0%
(1) Amounts for the years ended December 31, 2017 and 2016 have not been adjusted under the modified retrospective method of adoption of Topic 606, and are presented consistent with the prior period amounts reported under ASC 605.
Additionally, we offer customers the ability to purchase CEW cartridges and certain services on an unlimited basis over the contractual term. Due to the unlimited nature of these arrangements whereby we are obligated to deliver
48
unlimited products at the customer’s request, we account for these arrangements as stand-ready obligations, and recognize revenue ratably over the contract period. Cost of product sales is recognized as the products are shipped to the customer.
Revenues are recognized upon transfer of control of promised products or services to customers in an amount that reflects the consideration we expect to receive in exchange for those products or services. We enter into contracts that can include various combinations of products and services, each of which is generally distinct and accounted for as a separate performance obligation. Revenue is recognized net of allowances for returns and any taxes collected from customers, which are subsequently remitted to governmental taxing authorities.
A performance obligation is a promise in a contract to transfer a distinct good or service to the customer, and is the unit of account in Topic 606. For contracts with multiple performance obligations, we allocate the contract transaction price to each performance obligation using our estimate of the standalone selling price ("SSP") of each distinct good or service in the contract.
Performance obligations to deliver products, including CEWs, cameras and related accessories such as cartridges, batteries and docks, are generally satisfied at the point in time we ship the product, as this is when the customer obtains control of the asset under our standard terms and conditions. In certain contracts with non-standard terms and conditions, these performance obligations may not be satisfied until formal customer acceptance occurs. Performance obligations to fulfill service-type extended warranties and provide our SaaS offerings, including Axon Evidence and other cloud services, are generally satisfied over time as the customer receives and consumes the benefits of these services over the stated service period.
We have elected to recognize shipping costs as an expense in cost of product sales when the control of hardware products or accessories have transferred to the customer.
Sales tax collected on sales is netted against government remittances and thus, recorded on a net basis.
Deferred revenue consists of payments received in advance related to products and services for which the criteria for revenue recognition have not yet been met. Deferred revenue that will be recognized during the subsequent twelve month period from the balance sheet date is recorded as current deferred revenue and the remaining portion is recorded as long-term. Generally, customers are billed in annual installments.
Sales are typically made on credit, and we generally do not require collateral. Management performs ongoing credit evaluations of its customers’ financial condition, and maintains an allowance for doubtful accounts. Uncollectible accounts are charged to expense when deemed uncollectible, and accounts and notes receivable are presented net of an allowance for doubtful accounts. This allowance represents management’s best estimate and application of judgment considering a number of factors, including third-party credit reports, actual payment history, cash discounts, customer-specific financial information and broader market and economic trends and conditions.
Valuation of Goodwill, Intangibles and Long-lived Assets
We do not amortize goodwill and intangible assets with indefinite useful lives. Such assets are required to be tested for impairment at least annually, or sooner whenever events or changes in circumstances indicate that the assets may be impaired. We perform our annual impairment assessment in the fourth quarter of each year. Finite-lived intangible assets and other long-lived assets are amortized over their estimated useful lives. Management evaluates whether events and circumstances have occurred that indicate the remaining estimated useful life of long-lived assets and intangible assets may warrant revision or that the remaining balance of these assets, including intangible assets with indefinite lives, may not be recoverable.
Circumstances that might indicate long-lived assets might not be recoverable could include, but are not limited to, a change in the product mix, a change in the way products and services are created, produced or delivered, or a significant change in the way our products are branded and marketed. When performing a review for recoverability, management estimates the future undiscounted cash flows expected to result from the use of the assets and their eventual

49
disposition. The amount of the impairment loss, if impairment exists, is calculated based on the excess of the carrying amounts of the assets over their estimated fair value computed using discounted cash flows. During the year ended December 31, 2018, we abandoned certain developed technology acquired in a business combination resulting in an impairment charge of $2.0 million. During the year ended December 31, 2017, we abandoned certain developed technology acquired in a business combination resulting in an impairment charge of $1.0 million. The impairment charges were recorded within the Software and Sensors Segment. No impairment losses were recorded during the year ended December 31, 2016.
Income Taxes
We recognize federal, state and foreign current tax liabilities or assets based on our estimate of taxes payable or refundable in the current fiscal year by tax jurisdiction. We also recognize federal, state and foreign deferred tax assets or liabilities, as appropriate, for our estimate of future tax effects attributable to temporary differences and carry forwards.
We recognize the tax benefit from an uncertain tax position only if it is more likely than not that the tax position will be sustained based on the technical merits of the position. The tax benefits recognized in the consolidated financial statements from such positions are measured based on the largest benefit that has a greater than fifty percent likelihood of being realized upon ultimate resolution. We must also assess whether uncertain tax positions as filed could result in the recognition of a liability for possible interest and penalties if any. We have completed research and development tax credit studies for each year a tax credit was claimed for federal, Arizona, and California income tax purposes. We determined that it was more likely than not that the full benefit of the research and development tax credit would not be sustained on examination and accordingly, have established a liability for unrecognized tax benefits of $5.2 million as of December 31, 2018. In addition, we established a $0.1 million liability related to uncertain tax positions for certain federal income tax liabilities, for a total unrecognized tax benefit of $5.3 million. We expect the amount of the unrecognized tax benefit to increase by approximately $1.4 million within the next 12 months. Should the unrecognized tax benefit of $5.3 million be recognized, our effective tax rate would be favorably impacted. Our estimates are based on information available to us at the time we prepare the income tax provision. Our income tax returns are subject to audit by federal, state, and local governments, generally years after the returns are filed. These returns could be subject to material adjustments or differing interpretations of the tax laws.
Our calculation of current and deferred tax assets and liabilities is based on certain estimates and judgments and involves dealing with uncertainties in the application of complex tax laws. Our estimates of current and deferred tax assets and liabilities may change based, in part, on added certainty or finality to an anticipated outcome, changes in accounting or tax laws in the U.S. and internationally, or changes in other facts or circumstances. In addition, we recognize liabilities for potential tax contingencies based on our estimate of whether, and the extent to which, additional taxes may be due. If we determine that payment of these amounts is unnecessary, or if the recorded tax liability is greater than our current assessment, we may be required to recognize an income tax benefit, or additional income tax expense, respectively, in our consolidated financial statements.
In preparing our consolidated financial statements, we assess the likelihood that our deferred tax assets will be realized from future taxable income. In evaluating our ability to recover our deferred income tax assets, we consider all available positive and negative evidence, including operating results, ongoing tax planning and forecasts of future taxable income on a jurisdiction by jurisdiction basis. A valuation allowance is established if we determine that it is more likely than not that some portion or all of the net deferred tax assets will not be realized.
Although we believe that our tax estimates are reasonable, the ultimate tax determination involves significant judgments that could become subject to audit by tax authorities in the ordinary course of business. As of December 31, 2018, we would need to generate approximately $55.1 million of pre-tax income in the U.S. in order to realize the net deferred tax assets for which a benefit has been recorded. This estimate considers the reversal of approximately $14.1 million in gross deferred tax liabilities, $3.5 million tax-effected. We have state net operating losses ("NOLs") of $2.5 million, which produce deferred tax assets of $0.2 million, which expire at various dates between 2029 and 2036. We anticipate our future income to continue to trend upward from our 2018 results, with sufficient pre-tax book income to realize a large portion of our deferred tax assets. However, based on specific income projections for years in which

50
Arizona R&D tax credits are set to expire, and cumulative losses in certain foreign jurisdictions, a reserve of $7.4 million has been recorded as a valuation allowance against deferred tax assets as of December 31, 2018.
Stock-Based Compensation
We have historically granted stock-based compensation to key employees and non-employee directors as a means of attracting and retaining highly qualified personnel. Stock-based compensation awards primarily consist of service-based RSUs. RSUs are classified as equity and measured at the fair market value of the underlying stock at the grant date. We recognize RSU expense using the straight-line attribution method over the requisite service period. We also issue performance-based RSUs, the vesting of which is contingent upon the achievement of certain performance criteria related to our operating performance, as well as successful and timely development and market acceptance of future product introductions. For performance-based RSUs containing only performance conditions, compensation cost is recognized using the graded attribution model over the explicit or implicit service period. For awards containing multiple service, performance or market conditions, and all conditions must be satisfied prior to vesting, compensation expense is recognized over the requisite service period, which is defined as the longest explicit, implicit or derived service period, based on management’s estimate of the probability of the performance criteria being satisfied, adjusted at each balance sheet date. For both service-based and performance-based RSUs,we account for forfeitures as they occur as a reduction to stock-based compensation expense and additional paid-in-capital.
For performance-based options, stock-based compensation expense is recognized over the expected performance achievement period of individual performance goals when the achievement of each individual performance goal becomes probable. For performance-based awards with a vesting schedule based entirely on the attainment of both performance and market conditions, stock-based compensation expense is recognized for each pair of performance and market conditions over the longer of the expected achievement period of the performance and market conditions, beginning at the point in time that the relevant performance condition is considered probable of achievement. The fair value of such awards is estimated on the grant date using Monte Carlo simulations. Refer to Note 12 of the notes to our consolidated financial statements within this Annual Report on Form 10-K.
We have granted a total of approximately 8.5 million performance-based awards (options and restricted stock units) of which approximately 6.8 million are outstanding as of December 31, 2018, the vesting of which is contingent upon the achievement of certain performance criteria including the successful development and market acceptance of future product introductions as well as our future sales targets and operating performance. These awards will vest and compensation expense will be recognized based on management’s best estimate of the probability of the performance criteria being satisfied using the most currently available projections of future product adoption and operating performance, adjusted at each balance sheet date. Changes in the subjective and probability-based assumptions can materially affect the estimate of the fair value of stock-based compensation and consequently, the related amount recognized in our statements of operations and comprehensive income.
Contingencies and Accrued Litigation Expense
We are subject to the possibility of various loss contingencies arising in the ordinary course of business, including product-related litigation. We consider the likelihood of loss or impairment of an asset or the incurrence of a liability, as well as our ability to reasonably estimate the amount of loss in determining loss contingencies. An estimated loss contingency is accrued when it is probable that an asset has been impaired or a liability has been incurred and the amount of loss can be reasonably estimated. We regularly evaluate current information available to us to determine whether such accruals should be adjusted and whether new accruals are required. Refer to Note 9 of our consolidated financial statements within this Annual Report on Form 10-K.

51
Item 7A. Quantitative and Qualitative Disclosures About Market Risk
Interest Rate Risk
We typically invest in a limited number of financial instruments, consisting principally of investments in money market accounts, certificates of deposit, corporate and municipal bonds with a typical long-term debt rating of “A” or better by any nationally recognized statistical rating organization, denominated in U.S. dollars. All of our cash equivalents and investments are treated as “held-to-maturity.” Investments in fixed-rate interest-earning instruments carry a degree of interest rate risk as their market value may be adversely impacted due to a rise in interest rates. As a result, we may suffer losses in principal if we sell securities that have declined in market value due to changes in interest rates. However, because we classify our debt securities as “held-to-maturity” based on our intent and ability to hold these instruments to maturity, no gains or losses are recognized due to changes in interest rates. These securities are reported at amortized cost. At December 31, 2018, we did not have any held-to-maturity investments.
Additionally, we have access to a $50.0 million line of credit borrowing facility which bears interest at LIBOR plus 1.0 to 1.5% per year determined in accordance with a pricing grid based on our funded debt to EBITDA ratio. Under the terms of the line of credit, available borrowings are reduced by outstanding letters of credit, which totaled $3.1 million at December 31, 2018. At December 31, 2018, there was no amount outstanding under the line of credit, and the available borrowing under the line of credit was $96.9 million. We have not borrowed any funds under the line of credit since its inception; however; should we need to do so in the future, such borrowings could be subject to adverse or favorable changes in the underlying interest rate.
Exchange Rate Risk
Our results of operations and cash flows are subject to fluctuations due to changes in foreign currency exchange rates, in each case compared to the U.S. dollar, related to transactions by our foreign subsidiaries. The majority of our sales to international customers are transacted in U.S. dollars and therefore, are not subject to exchange rate fluctuations on these transactions. However, the cost of our products to our customers increases when the U.S. dollar strengthens against their local currency, and we may have more sales and expenses denominated in foreign currencies in future years which could increase our foreign exchange rate risk. Additionally, intercompany sales to our non-U.S. dollar functional currency international subsidiaries are transacted in U.S. dollars which could increase our foreign exchange rate risk caused by foreign currency transaction gains and losses.
To date, we have not engaged in any currency hedging activities. However, we may enter into foreign currency forward and option contracts with financial institutions to protect against foreign exchange risks associated with certain existing assets and liabilities, certain firmly committed transactions, forecasted future cash flows and net investments in foreign subsidiaries. However, we may choose not to hedge certain foreign exchange exposures for a variety of reasons, including but not limited to the prohibitive economic cost of hedging particular exposures. As such, fluctuations in currency exchange rates could harm our business in the future.

52
Item 8. Financial Statements and Supplementary Data
Index to Consolidated Financial Statements Page
Consolidated Balance Sheets as of December 31, 2018 and 2017 Consolidated Statements of Operations and Comprehensive Income for the years ended December 31, 2018, 2017 and 2016 Consolidated Statements of Stockholders' Equity for the years ended December 31, 2018, 2017 and 2016 Consolidated Statements of Cash Flows for the years ended December 31, 2018, 2017 and 2016 Notes to Consolidated Financial Statements Selected Quarterly Financial Information (Unaudited) Report of Grant Thornton LLP, Independent Registered Public Accounting Firm
53545556579193

53
AXON ENTERPRISE, INC.CONSOLIDATED BALANCE SHEETS
(in thousands, except share data)
December 31, 2018 2017ASSETSCurrent assets:
Cash and cash equivalents $ 349,462 $ 75,105Short-term investments — 6,862Accounts and notes receivable, net of allowance of $1,882 and $754 as of December 31,2018 and 2017, respectively 130,579 56,064Contract assets, net 13,960 —Inventory 33,763 45,465Prepaid expenses and other current assets 30,391 21,696
Total current assets 558,155 205,192Property and equipment, net 37,893 31,172Deferred income tax assets, net 19,347 15,755Intangible assets, net 15,935 18,823Goodwill 24,981 14,927Long-term notes receivable, net of current portion 40,230 36,877Other assets 22,999 15,366
Total assets $ 719,540 $ 338,112LIABILITIES AND STOCKHOLDERS’ EQUITYCurrent liabilities:
Accounts payable $ 15,164 $ 8,592Accrued liabilities 41,092 23,502Current portion of deferred revenue 107,016 70,401Customer deposits 2,702 3,673Current portion of business acquisition contingent consideration — 1,693Other current liabilities 37 89
Total current liabilities 166,011 107,950Deferred revenue, net of current portion 74,417 54,881Liability for unrecognized tax benefits 2,849 1,706Long-term deferred compensation 3,235 3,859Business acquisition contingent consideration, net of current portion — 1,048Other long-term liabilities 5,704 1,224
Total liabilities 252,216 170,668Commitments and contingencies (Note 9)Stockholders’ equity:
Preferred stock, $0.00001 par value; 25,000,000 shares authorized; no shares issued andoutstanding as of December 31, 2018 and 2017 — —Common stock, $0.00001 par value; 200,000,000 shares authorized; 58,810,637 and52,969,869 shares issued and outstanding as of December 31, 2018 and 2017, respectively 1 1Additional paid-in capital 453,400 201,672Treasury stock at cost, 20,220,227 shares as of December 31, 2018 and 2017 (155,947) (155,947)Retained earnings 171,383 123,185Accumulated other comprehensive loss (1,513) (1,467)
Total stockholders’ equity 467,324 167,444Total liabilities and stockholders’ equity $ 719,540 $ 338,112
The accompanying notes are an integral part of these consolidated financial statements.

54
AXON ENTERPRISE, INC.CONSOLIDATED STATEMENTS OF OPERATIONS AND COMPREHENSIVE INCOME
(in thousands, except per share data) For the Years Ended December 31, 2018 2017 2016
Net sales from products $ 327,635 $ 285,859 $ 238,573Net sales from services 92,433 57,939 29,672
Net sales 420,068 343,798 268,245Cost of product sales 139,337 117,997 91,536Cost of service sales 22,148 18,713 6,173
Cost of sales 161,485 136,710 97,709Gross margin 258,583 207,088 170,536
Sales, general and administrative 156,886 138,692 108,076Research and development 76,856 55,373 30,609
Total operating expenses 233,742 194,065 138,685Income from operations 24,841 13,023 31,851Interest and other income (expense), net 3,263 2,738 (354)Income before provision for income taxes 28,104 15,761 31,497Provision (benefit) for income taxes (1,101) 10,554 14,200Net income $ 29,205 $ 5,207 $ 17,297Net income per share:
Basic $ 0.52 $ 0.10 $ 0.33Diluted $ 0.50 $ 0.10 $ 0.32
Weighted average shares outstanding:Basic 56,392 52,726 52,667Diluted 57,922 53,898 53,536
Net income $ 29,205 $ 5,207 $ 17,297Foreign currency translation adjustments (46) (2,370) 820Comprehensive income $ 29,159 $ 2,837 $ 18,117
The accompanying notes are an integral part of these consolidated financial statements.

55
AX
ON
EN
TE
RPR
ISE
, IN
C.
CO
NSO
LID
ATE
D S
TAT
EM
EN
TS
OF
STO
CK
HO
LD
ER
S’ E
QU
ITY
(in th
ousa
nds,
exce
pt sh
are
data
)
Com
mon
Sto
ckA
dditi
onal
Paid
-inC
apita
lTr
easu
ry S
tock
Acc
umul
ated
Oth
erC
ompr
ehen
sive
Inco
me
(Los
s)R
etai
ned
Ear
ning
s
Tota
lSt
ockh
olde
rs’
Equ
ity
Shar
esA
mou
ntSh
ares
Am
ount
Bal
ance
, Dec
embe
r 31,
201
553
,692
,192
$1
$17
8,14
318
,432
,158
$(1
22,2
01)
$83
$10
0,97
8$
157,
004
Issu
ance
of c
omm
on st
ock
unde
r em
ploy
ee p
lans
421,
128
—(1
,294
)—
——
—(1
,294
)St
ock-
base
d co
mpe
nsat
ion
——
9,36
9—
——
—9,
369
Exce
ss ta
x be
nefit
from
stoc
k-ba
sed
com
pens
atio
n—
—1,
438
——
——
1,43
8Pu
rcha
se o
f tre
asur
y st
ock
(1,7
88,0
69)
——
1,78
8,06
9(3
3,74
6)—
—(3
3,74
6)N
et in
com
e—
——
——
—17
,297
17,2
97Fo
reig
n cu
rren
cy tr
ansl
atio
n ad
just
men
ts—
——
——
820
—82
0B
alan
ce, D
ecem
ber 3
1, 2
016
52,3
25,2
511
187,
656
20,2
20,2
27(1
55,9
47)
903
118,
275
150,
888
Cum
ulat
ive
effe
ct o
f app
lyin
g a
chan
ge in
ac
coun
ting
prin
cipl
e—
—47
5—
——
(297
)17
8Is
suan
ce o
f com
mon
stoc
k un
der e
mpl
oyee
pla
ns64
4,61
8—
(2,0
69)
——
——
(2,0
69)
Stoc
k-ba
sed
com
pens
atio
n—
—15
,610
——
——
15,6
10N
et in
com
e—
——
——
—5,
207
5,20
7Fo
reig
n cu
rren
cy tr
ansl
atio
n ad
just
men
ts—
——
——
(2,3
70)
—(2
,370
)B
alan
ce, D
ecem
ber 3
1, 2
017
52,9
69,8
691
201,
672
20,2
20,2
27(1
55,9
47)
(1,4
67)
123,
185
167,
444
Cum
ulat
ive
effe
ct o
f app
lyin
g a
chan
ge in
ac
coun
ting
prin
cipl
e—
——
——
—18
,993
18,9
93Is
suan
ce o
f com
mon
stoc
k4,
645,
000
233,
993
——
——
233,
993
Issu
ance
of c
omm
on st
ock
for b
usin
ess c
ombi
natio
n (N
ote
15)
58,8
43—
8,22
6—
——
—8,
226
Issu
ance
of c
omm
on st
ock
unde
r em
ploy
ee p
lans
1,13
6,92
5—
(12,
370)
——
——
(12,
370)
Stoc
k-ba
sed
com
pens
atio
n—
—21
,879
——
——
21,8
79N
et in
com
e—
——
——
—29
,205
29,2
05Fo
reig
n cu
rren
cy tr
ansl
atio
n ad
just
men
ts—
——
——
(46)
—(4
6)B
alan
ce, D
ecem
ber 3
1, 2
018
58,8
10,6
37$
1$
453,
400
20,2
20,2
27$
(155
,947
)$
(1,5
13)
$17
1,38
3$
467,
324
The
acco
mpa
nyin
g no
tes a
re a
n in
tegr
al p
art o
f the
se c
onso
lidat
ed fi
nanc
ial s
tate
men
ts.

56
AXON ENTERPRISE, INC.CONSOLIDATED STATEMENTS OF CASH FLOWS
(in thousands)
For the Years Ended December 31, 2018 2017 2016Cash flows from operating activities:Net income $ 29,205 $ 5,207 $ 17,297Adjustments to reconcile net income to net cash provided by operating activities:
Depreciation and amortization 10,615 8,041 3,658Loss on disposal and abandonment of intangible assets 2,117 1,146 21Purchase accounting adjustments to goodwill — (23) 520Loss (gain) on disposal and impairment of property and equipment, net 303 (28) 42Bond premium amortization 34 657 1,265Stock-based compensation 21,879 15,610 9,369Deferred income taxes (3,592) 2,830 (5,167)Unrecognized tax benefits 1,144 (191) 582Tax benefit from stock-based compensation — — (1,438)
Change in assets and liabilities:Accounts and notes receivable (67,643) (35,305) (28,438)Inventory 14,804 (11,746) (18,668)Prepaid expenses and other assets (12,739) (8,992) (10,611)Accounts payable, accrued and other liabilities 13,506 1,530 18,399Deferred revenue 54,242 39,735 34,304
Net cash provided by operating activities 63,875 18,471 21,135
Cash flows from investing activities:Purchases of investments (4,331) (19,950) (56,086)Proceeds from call / maturity of investments 11,158 61,080 64,951Purchases of property and equipment (11,139) (10,419) (4,957)Proceeds from disposal of property and equipment — 24 42Purchases of intangible assets (558) (1,024) (3,495)Business acquisitions, net of cash acquired (4,990) (10,629) (3,500)
Net cash provided by (used in) investing activities (9,860) 19,082 (3,045)
Cash flows from financing activities:Net proceeds from equity offering 233,993 — —Repurchase of common stock — — (33,746)Proceeds from options exercised 1,757 1,383 478Income and payroll tax payments for net-settled stock awards (14,127) (3,453) (1,772)Payment of contingent consideration for business acquisitions (2,275) (1,750) (952)Excess tax benefit from stock-based compensation — — 1,438
Net cash provided by (used in) financing activities 219,348 (3,820) (34,554)
Effect of exchange rate changes on cash and cash equivalents (774) 737 906
Net increase (decrease) in cash and cash equivalents 272,589 34,470 (15,558)Cash and cash equivalents and restricted cash, beginning of year 78,438 43,968 59,526Cash and cash equivalents and restricted cash, end of year $ 351,027 $ 78,438 $ 43,968
The accompanying notes are an integral part of these consolidated financial statements.

AXON ENTERPRISE, INC.NOTES TO CONSOLIDATED FINANCIAL STATEMENTS
57
1. Organization and Summary of Significant Accounting Policies
Axon Enterprise, Inc. (“Axon”, the “Company”, "we", or "us") is a market-leading provider of law enforcement technology solutions. Our core mission is to protect life. We fulfill that mission through developing hardware and software products that advance the long term objectives of a) obsoleting the bullet, b) reducing social conflict, and c) enabling a fair and effective justice system.
The accompanying consolidated financial statements include the accounts of Axon Enterprise, Inc. and our wholly owned subsidiaries. All material intercompany accounts, transactions, and profits have been eliminated.
Basis of Presentation and Use of Estimates
The accompanying consolidated financial statements have been prepared in conformity with accounting principles generally accepted in the United States of America (“U.S. GAAP”). The preparation of these consolidated financial statements requires management to make estimates and assumptions that affect the reported amounts of assets and liabilities and disclosure of contingent assets and liabilities at the date of the consolidated financial statements and the reported amounts of revenues and expenses during the reporting period. Significant estimates and assumptions in these consolidated financial statements include:
• product warranty reserves,• inventory valuation,• revenue recognition,• valuation of goodwill, intangible and long-lived assets,• recognition, measurement and valuation of current and deferred income taxes,• stock-based compensation,• recognition and measurement of contingencies and accrued litigation expense, and• fair values of identified tangible and intangible assets acquired and liabilities assumed in business combinations.
Actual results could differ materially from those estimates.
Cash, Cash Equivalents and Investments
Cash, cash equivalents and investments include cash, money market funds, certificates of deposit, state and municipal obligations and corporate bonds. We place our cash and cash equivalents with high quality financial institutions. Although we deposit our cash with multiple financial institutions, our deposits regularly exceed federally insured limits.
Cash and cash equivalents include funds on hand and highly liquid investments purchased with initial maturity of three months or less. Short-term investments include securities with an expected maturity date within one year of the balance sheet date that do not meet the definition of a cash equivalent, and long-term investments are securities with an expected maturity date greater than one year. Based on management’s intent and ability, our investments are classified as held to maturity investments and are recorded at amortized cost. Held-to-maturity investments are reviewed quarterly for impairment to determine if other-than-temporary declines in the fair value have occurred for any individual investment that may affect our intent and ability to hold the investment until recovery. Other-than-temporary declines in the value of held-to-maturity investments are recorded as expense in the period the determination is made.
Inventory
Inventories are stated at the lower of cost and net realizable value. Cost is determined using the weighted average cost of raw materials, which approximates the first-in, first-out (“FIFO”) method and includes allocations of manufacturing labor and overhead. Provisions are made to reduce potentially excess, obsolete or slow-moving inventories, as well as trial and evaluation inventories to their net realizable value. These provisions are based on management’s best estimate after considering historical demand, projected future demand, inventory purchase commitments, industry and market trends and conditions among other factors. We evaluate inventory costs for abnormal costs due to excess production capacity and treat such costs as period costs.

AXON ENTERPRISE, INC.NOTES TO CONSOLIDATED FINANCIAL STATEMENTS – (Continued)
58
Property and Equipment
Property and equipment are stated at cost, net of accumulated depreciation and amortization. Additions and improvements are capitalized, while ordinary maintenance and repair expenditures are charged to expense as incurred. Depreciation is calculated using the straight-line method over the estimated useful lives of the assets.
Software Development Costs
We expense software development costs, including costs to develop software products or the software component of products and services to be marketed to external users, before technological feasibility of such products is reached. We have determined that technological feasibility is reached shortly before the release of those products and as a result, the development costs incurred after the establishment of technological feasibility and before the release of those products are not material.
Software development costs also include costs to develop software programs to be used solely to meet our internal needs and applications. We capitalize development costs related to these software applications once the preliminary project stage is complete and it is probable that the project will be completed and the software will be used to perform the intended function. Additionally, we capitalize qualifying costs incurred for upgrades and enhancements to existing software that result in additional functionality. Costs related to preliminary project planning activities, post-implementation activities, maintenance and minor modifications are expensed as incurred. Internal-use software is amortized on a straight line basis over its estimated useful life.
We evaluate the useful lives of these assets on an annual basis and test for impairment whenever events or changes in circumstances occur that could impact the recoverability of these assets.
Valuation of Goodwill, Intangible and Long-lived Assets
We do not amortize goodwill and intangible assets with indefinite useful lives; rather, such assets are required to be tested for impairment at least annually, or sooner whenever events or changes in circumstances indicate that the assets may be impaired. We perform our annual impairment assessment in the fourth quarter of each year. Finite-lived intangible assets and other long-lived assets are amortized over their estimated useful lives. Management evaluates whether events and circumstances have occurred that indicate the remaining estimated useful life of long-lived assets and intangible assets may warrant revision or that the remaining balance of these assets, including intangible assets with indefinite lives, may not be recoverable.
Circumstances that might indicate long-lived assets might not be recoverable could include, but are not limited to, a change in the product mix, a change in the way products and services are created, produced or delivered, or a significant change in the way our products are branded and marketed. When performing a review for recoverability, management estimates the future undiscounted cash flows expected to result from the use of the assets and their eventual disposition. The amount of the impairment loss, if impairment exists, is calculated based on the excess of the carrying amounts of the assets over their estimated fair value computed using discounted cash flows. During the year ended December 31, 2018, we abandoned certain developed technology acquired in a business combination resulting in an impairment charge of $2.0 million which was included in sales, general and administrative expense in the accompanying statement of operations. During the year ended December 31, 2017, we abandoned certain developed technology acquired in a business combination resulting in an impairment charge of $1.0 million which was included in research and development expense in the accompanying statement of operations. The impairment charges were recorded within the Software and Sensors Segment. No impairment losses were recorded during the year ended December 31, 2016.
Customer Deposits
We require deposits in advance of shipment for certain customer sales orders. Additionally, customers may elect to make deposits with us related to contracts for our products and services that were not executed as of the end of a reporting period. Customer deposits are recorded as a current liability in the accompanying consolidated balance sheets.

AXON ENTERPRISE, INC.NOTES TO CONSOLIDATED FINANCIAL STATEMENTS – (Continued)
59
Revenue Recognition, Deferred Revenue and Accounts and Notes Receivable
We derive revenue from two primary sources: (1) the sale of physical products, including CEWs, Axon cameras, Axon Signal enabled devices, corresponding hardware extended warranties, and related accessories such as Axon docks, cartridges and batteries, among others, and (2) subscriptions to our Axon Evidence digital evidence management software as a service ("SaaS") (including data storage fees and other ancillary services), which includes varying levels of support. To a lesser extent, we also recognize training, professional services and revenue related to other software and SaaS services. We apply the five-step model outlined in Accounting Standards Codification Topic 606, Revenue from Contracts from Customers ("Topic 606"). For additional discussion of the adoption of Topic 606, see Note 2.
Many of our products and services are sold on a standalone basis. We also bundle our hardware products and services together and sell them to our customers in single transactions, where the customer can make payments over a multi-year period. These sales may include payments for upfront hardware and services, as well as payments for hardware and services to be provided by us at a future date. Additionally, we offer customers the ability to purchase CEW cartridges and certain services on an unlimited basis over the contractual term. Due to the unlimited nature of these arrangements whereby we are obligated to deliver unlimited products at the customer’s request, we account for these arrangements as stand-ready obligations, and recognize revenue ratably over the contract period. Cost of product sales is recognized as the products are shipped to the customer.
Revenues are recognized upon transfer of control of promised products or services to customers in an amount that reflects the consideration we expect to receive in exchange for those products or services. We enter into contracts that can include various combinations of products and services, each of which is generally distinct and accounted for as a separate performance obligation. Revenue is recognized net of allowances for returns and any taxes collected from customers, which are subsequently remitted to governmental taxing authorities.
A performance obligation is a promise in a contract to transfer a distinct good or service to the customer, and is the unit of account in Topic 606. For contracts with multiple performance obligations, we allocate the contract transaction price to each performance obligation using our estimate of the standalone selling price ("SSP") of each distinct good or service in the contract.
Performance obligations to deliver products, including CEWs, cameras and related accessories such as cartridges, batteries and docks, are generally satisfied at the point in time we ship the product, as this is when the customer obtains control of the asset under our standard terms and conditions. In certain contracts with non-standard terms and conditions, these performance obligations may not be satisfied until formal customer acceptance occurs. Performance obligations to fulfill service-type extended warranties and provide our SaaS offerings, including Axon Evidence and other cloud services, are generally satisfied over time as the customer receives and consumes the benefits of these services over the stated service period.
We have elected to recognize shipping costs as an expense in cost of product sales when the control of hardware products or accessories have transferred to the customer.
Sales tax collected on sales is netted against government remittances and thus, recorded on a net basis.
Deferred revenue consists of payments received and amounts invoiced in advance related to products and services for which the criteria for revenue recognition have not yet been met. Deferred revenue that will be recognized during the subsequent twelve month period from the balance sheet date is recorded as current deferred revenue and the remaining portion is recorded as long-term. Generally, customers are billed in annual installments. See Note 2 for further disclosures about our deferred revenue.
Sales are typically made on credit, and we generally do not require collateral. Management performs ongoing credit evaluations of its customers’ financial condition, and maintains an allowance for doubtful accounts. Uncollectible accounts are charged to expense when deemed uncollectible, and accounts and notes receivable are presented net of an allowance for doubtful accounts. This allowance represents management’s best estimate and application of judgment

AXON ENTERPRISE, INC.NOTES TO CONSOLIDATED FINANCIAL STATEMENTS – (Continued)
60
considering a number of factors, including third-party credit reports, actual payment history, cash discounts, customer-specific financial information and broader market and economic trends and conditions. In the event that actual uncollectible amounts differ from our estimates, additional expense could be necessary.
Cost of Product and Service Sales
Cost of product sales represents manufacturing costs, consisting of materials, labor and overhead related to finished goods and components. Shipping costs incurred related to product delivery are also included in cost of products sold. Cost of service sales includes third-party cloud services, and software maintenance and support costs, including personnel costs, associated with supporting Evidence.com and other software related services.
Advertising Costs
We expense advertising costs in the period in which they are incurred. We incurred advertising costs of $1.1 million, $0.5 million and $0.4 million in the years ended December 31, 2018, 2017 and 2016, respectively. Advertising costs are included in sales, general and administrative expenses in the accompanying statements of operations.
Standard Warranties
We warranty our CEWs, Axon cameras and certain related accessories from manufacturing defects on a limited basis for a period of one year after purchase and, thereafter, will replace any defective unit for a fee. Estimated costs for the standard warranty are charged to cost of products sold when revenue is recorded for the related product. Future warranty costs are estimated based on historical data related to warranty claims on a quarterly basis and this rate is applied to current product sales. Historically, reserve amounts have been increased if management becomes aware of a component failure or other issue that could result in larger than anticipated warranty claims from customers. The warranty reserve is reviewed quarterly to verify that it sufficiently reflects the remaining warranty obligations based on the anticipated expenditures over the balance of the warranty obligation period, and adjustments are made when actual warranty claim experience differs from estimates. The warranty reserve is included in accrued liabilities on the accompanying consolidated balance sheets.
Changes in our estimated warranty reserve were as follows (in thousands):
2018 2017 2016
Balance, January 1 $ 644 $ 780 $ 314Utilization of reserve (458) (245) (155)Warranty expense 712 109 621Balance, December 31 $ 898 $ 644 $ 780
Research and Development Expenses
We expense as incurred research and development costs that do not meet the qualifications to be capitalized. We incurred research and development expense of $76.9 million, $55.4 million and $30.6 million in 2018, 2017 and 2016, respectively.
Income Taxes
Income taxes are accounted for under the asset and liability method. Deferred tax assets and liabilities are recognized for the future tax consequences attributable to differences between the financial statement amounts of assets and liabilities and their respective tax bases and operating loss and tax credit carry forwards. Deferred tax assets and liabilities are measured using enacted tax rates expected to apply to taxable income in future years in which those temporary differences are expected to be recovered or settled. The effect on deferred tax assets and liabilities of a change in tax rate is recognized in income in the period that includes the enactment date. Deferred tax assets are reduced through the establishment of a valuation allowance if, based upon available evidence, it is determined that it is more likely than not that the deferred tax assets will not be realized.

AXON ENTERPRISE, INC.NOTES TO CONSOLIDATED FINANCIAL STATEMENTS – (Continued)
61
We recognize the tax benefit from an uncertain tax position only if it is more likely than not that the tax position will be sustained on examination by the taxing authorities, based on the technical merits of the position. The tax benefits recognized in the consolidated financial statements from such a position are measured based on the largest benefit that has a greater than 50% likelihood of being realized upon ultimate resolution. Management also assesses whether uncertain tax positions, as filed, could result in the recognition of a liability for possible interest and penalties. Our policy is to include interest and penalties related to unrecognized tax benefits as a component of income tax expense. Refer to Note 10 for additional information regarding the change in unrecognized tax benefits.
Concentration of Credit Risk and Major Customers / Suppliers
Financial instruments that potentially subject us to concentrations of credit risk consist of accounts and notes receivable, contract assets, and cash. Sales are typically made on credit and we generally do not require collateral. Management performs ongoing credit evaluations of its customers’ financial condition and maintains an allowance for estimated losses. Uncollectible accounts are written off when deemed uncollectible, and accounts receivable are presented net of an allowance for doubtful accounts, which totaled $1.9 million and $0.8 million as of December 31, 2018 and 2017, respectively. Historically, we have experienced a low level of write-offs related to uncollectible accounts.
We maintain the majority of our cash at four depository institutions. As of December 31, 2018, the aggregate balances in such accounts were $342.3 million. Our balances with these institutions regularly exceed Federal Deposit Insurance Corporation (“FDIC”) insured limits for domestic deposits and various deposit insurance programs covering our deposits in Australia, Germany, Finland, the Netherlands, the United Kingdom, and Vietnam. To manage the related credit exposure, management continually monitors the creditworthiness of the financial institutions where we have deposits.
We sell some of our products through a network of unaffiliated distributors. We also sell directly to customers. No customer represented more than 10% of total net sales for the years ended December 31, 2018, 2017 or 2016.
At December 31, 2018, and 2017, no customer represented more than 10% of the aggregate balance of accounts and notes receivable and contract assets.
We currently purchase finished circuit boards and injection-molded plastic components from suppliers located in the U.S., Mexico and Taiwan. Although we currently obtain many of these components from single source suppliers, we own the injection molded component tooling used in their production. As a result, management believes it could obtain alternative suppliers in most cases without incurring significant production delays. We also purchase small, machined parts from a vendor in Taiwan, custom cartridge components from a proprietary vendor in the U.S., and electronic components from a variety of international and domestic distributors. We believe that there are readily available alternative suppliers in most cases who could consistently meet our needs for these components. We acquire most of our components on a purchase order basis and do not have any significant long-term contracts with suppliers.
Fair Value of Financial Instruments
We use the fair value framework that prioritizes the inputs to valuation techniques for measuring financial assets and liabilities measured on a recurring basis and for non-financial assets and liabilities when these items are re-measured. Fair value is considered to be the exchange price in an orderly transaction between market participants, to sell an asset or transfer a liability at the measurement date. The hierarchy below lists three levels of fair value based on the extent to which inputs used in measuring fair value are observable in the market. We categorize each of our fair value measurements in one of these three levels based on the lowest level input that is significant to the fair value measurement in its entirety. These levels are:
• Level 1 – Valuation techniques in which all significant inputs are unadjusted quoted prices from active markets for assets or liabilities that are identical to the assets or liabilities being measured.
• Level 2 – Valuation techniques in which significant inputs include quoted prices from active markets for assets or liabilities that are similar to the assets or liabilities being measured and/or quoted prices for assets or liabilities

AXON ENTERPRISE, INC.NOTES TO CONSOLIDATED FINANCIAL STATEMENTS – (Continued)
62
that are identical or similar to the assets or liabilities being measured from markets that are not active. Also, model-derived valuations in which all significant inputs and significant value drivers are observable in active markets are Level 2 valuation techniques.
• Level 3 – Valuation techniques in which one or more significant inputs or significant value drivers are unobservable. Unobservable inputs are valuation technique inputs that reflect our own assumptions about inputs that market participants would use in pricing an asset or liability.
We have cash equivalents and investments, which at December 31, 2018 and 2017, were comprised of money market funds, state and municipal obligations, corporate bonds, and certificates of deposits. See additional disclosure regarding the fair value of our cash equivalents and investments in Note 3. Included in the balance of other assets as of December 31, 2018 and 2017 was $3.6 million and $3.8 million, respectively, related to corporate-owned life insurance policies which are used to fund our deferred compensation plan. We determine the fair value of our insurance contracts by obtaining the cash surrender value of the contracts from the issuer, a Level 2 valuation technique.
Our financial instruments also include accounts and notes receivable, accounts payable and accrued liabilities. Due to the short-term nature of these instruments, their fair values approximate their carrying values on the balance sheet.
Segment and Geographic Information
Our operations are comprised of two reportable segments: the manufacture and sale of CEWs, batteries, accessories, extended warranties and other products and services (the “TASER” segment); and the development, manufacture and sale of software and sensors, which includes the sale of devices, wearables, applications, cloud and mobile products (collectively, the "Software and Sensors" segment). Reportable segments are determined based on discrete financial information reviewed by our Chief Executive Officer who is our chief operating decision maker ("CODM"). We organize and review operations based on products and services, and currently there are no operating segments that are aggregated. We perform an analysis of our reportable segments at least annually. Additional information related to our business segments is summarized in Note 16.
For the years ended December 31, 2018, 2017 and 2016, net sales by geographic area as well as the percentage relationship to total net sales included in the accompanying statements of operations were as follows (in thousands):
Year Ended December 31, 2018 2017 (1) 2016 (1)
United States $ 335,310 79.8% $ 282,810 82.3% $ 218,757 81.6%Other Countries 84,758 20.2 60,988 17.7 49,488 18.4Total $ 420,068 100.0% $ 343,798 100.0% $ 268,245 100.0%
(1) Amounts for the years ended December 31, 2017 and 2016 have not been adjusted under the modified retrospective method of adoption of Topic 606, and are presented consistent with the prior period amounts reported under ASC 605.
Sales to customers outside of the U.S. are typically denominated in U.S. dollars and are attributed to each country based on the shipping address of the distributor or customer. For the years ended December 31, 2018, 2017 and 2016, no individual country outside the U.S. represented more than 10% of net sales. Substantially all of our assets are located in the U.S.
Stock-Based Compensation
We recognize expense related to stock-based compensation transactions in which we receive services in exchange for equity instruments of the Company. Stock-based compensation expense for RSUs is measured based on the closing fair market value of our common stock on the date of grant. We recognize stock-based compensation expense over the award’s requisite service period on a straight-line basis for time-based RSUs and on a graded basis for RSUs that are

AXON ENTERPRISE, INC.NOTES TO CONSOLIDATED FINANCIAL STATEMENTS – (Continued)
63
contingent on the achievement of performance conditions. We recognize forfeitures as they occur as a reduction to stock-based compensation expense and to additional paid-in-capital.
Historically, we have calculated the fair value of stock options using the Black-Scholes-Merton option pricing valuation model, which incorporates various assumptions including expected volatility, expected life, expected dividends and risk-free interest rates. No stock options were awarded from 2012 to 2017.
On May 24, 2018 (the “Grant Date”), our stockholders approved the Board of Directors’ grant of 6,365,856 stock option awards to Patrick W. Smith, our CEO (the “CEO Performance Award”). The CEO Performance Award consists of 12 vesting tranches with a vesting schedule based entirely on the attainment of both operational goals (performance conditions) and market capitalization goals (market conditions), assuming continued employment either as the CEO or as both Executive Chairman and Chief Product Officer and service through each vesting date. Stock-based compensation expense associated with the CEO Performance Award is recognized over the requisite service period, which is defined as the longer of the expected achievement period for each pair of market capitalization and operational goals, beginning at the point in time when the relevant operational goal is considered probable of being met.
Given the complexity of the award, we utilized Monte Carlo simulations to simulate a range of possible future market capitalizations for the Company over the term of the options. The average of all iterations of the simulation was used as the basis for the valuation and market capitalization goal derived service period for each tranche. Additionally, we applied an illiquidity discount of 9.2% to the valuation because the award specifies a post-exercise holding period of 2.5 years. This discount was estimated using the Finnerty model and reduced by the impact of expected payroll and income taxes due upon exercise of the options, as the related proportion of shares are expected to be sold to satisfy such obligations. Additional assumptions used for the CEO Performance Award and the resulting estimates of weighted-average fair value per share of options granted are as follows:
Volatility 47.71%Risk-free interest rate 2.98%Dividend rate —Expected life of options 9.76 yearsWeighted average grant date fair value of options granted $38.64
The expected life of the options represents the estimated period of time from grant date until exercise; in this case, exercise is assumed to occur at the full contractual term of ten years from grant and is based on input from the CEO and his historical behavior of not exercising vested options. Expected stock price volatility is based on the average of the 9.76-year historical volatility and the implied volatility on 1,080-day call option for the Company. The risk-free interest rate is based on the implied yield available on United States Treasury bill zero-coupon issuances with an equivalent remaining term to the term of the options. We have not paid dividends in the past and do not plan to pay any dividends in the near future.
Other than the CEO Performance Award, no options were awarded during the year ended December 31, 2018. No options were awarded during the years ended December 31, 2017 or 2016.

AXON ENTERPRISE, INC.NOTES TO CONSOLIDATED FINANCIAL STATEMENTS – (Continued)
64
Income per Common Share
Basic income per common share is computed by dividing net income by the weighted average number of common shares outstanding during the periods presented. Diluted income per share reflects the potential dilution from outstanding stock options and unvested restricted stock units. The calculation of the weighted average number of shares outstanding and earnings per share are as follows (in thousands except per share data):
For the Year Ended December 31, 2018 2017 2016
Numerator for basic and diluted earnings per share:Net income $ 29,205 $ 5,207 $ 17,297
Denominator:Weighted average shares outstanding—basic 56,392 52,726 52,667Dilutive effect of stock-based awards 1,530 1,172 869Diluted weighted average shares outstanding 57,922 53,898 53,536Anti-dilutive stock-based awards excluded 6,757 386 443
Net income per common share:Basic $ 0.52 $ 0.10 $ 0.33Diluted $ 0.50 $ 0.10 $ 0.32
Recently Issued Accounting Guidance
Recently Adopted Accounting Pronouncements
In May 2014, the Financial Accounting Standards Board (“FASB”) issued Accounting Standards Update (“ASU”) 2014-09, Revenue from Contracts with Customers (“ASU 2014-09”) and Accounting Standards Codification ("ASC") Subtopic 340-40, Other Assets and Deferred Costs - Contracts with Customers ("ASC 340-40"), (collectively, “Topic 606”). On January 1, 2018, we adopted Topic 606 by applying the modified retrospective method of adoption for all contracts that were not substantially completed as of the adoption date. ASU 2014-09 requires entities to recognize revenue through the application of a five-step model, which includes identification of the contract, identification of the performance obligations, determination of the transaction price, allocation of the transaction price to the performance obligations and recognition of revenue as the entity satisfies the performance obligations. Refer to Note 2 for further discussion.
In August 2016, the FASB issued ASU 2016-15, Statement of Cash Flows (Topic 230): Classification of Certain Cash Receipts and Cash Payments. ASU 2016-15 eliminates the diversity in practice related to the classification of certain cash receipts and payments. ASU 2016-15 designates the appropriate cash flow classification, including requirements to allocate certain components of these cash receipts and payments among operating, investing and financing activities. We adopted ASU 2016-15 effective January 1, 2018, and the adoption of this ASU did not have a material impact on our consolidated financial statements.
In October 2016, the FASB issued ASU 2016-16, Income Taxes (Topic 740) - Intra-Entity Transfers of Assets Other Than Inventory. ASU 2016-16 requires an entity to recognize income tax consequences of an intra-entity transfer of an asset other than inventory when the transfer occurs. This removes the exception to postpone recognition until the asset has been sold to an outside party. We adopted ASU 2016-16 effective January 1, 2018, and the adoption of this ASU did not have a material impact on our consolidated financial statements.
In November 2016, the FASB issued ASU 2016-18, Statement of Cash Flows - Restricted Cash (Topic 230), which amends the existing guidance relating to the treatment of restricted cash and restricted cash equivalents on the statement of cash flows. We adopted ASU 2016-18 effective January 1, 2018, and retrospectively updated the

AXON ENTERPRISE, INC.NOTES TO CONSOLIDATED FINANCIAL STATEMENTS – (Continued)
65
presentation of our consolidated statements of cash flows to include amounts of restricted cash with cash and cash equivalents when reconciling the beginning-of-period and end-of-period amounts.
In January 2017, the FASB issued ASU 2017-01, Business Combinations (Topic 805) to provide a more robust framework to use in determining when a set of acquired assets and activities is a business. The amendments in ASU 2017-01 provide a screen to determine when a set of acquired integrated assets and activities is not a business, and if the screen is not met it may result in fewer transactions that qualify as a business combination under ASC Topic 805. We adopted ASU 2017-01 effective January 1, 2018, and the adoption of this ASU did not have a material impact on our consolidated financial statements.
In May 2017, the FASB issued ASU 2017-09, Compensation - Stock Compensation (Topic 718), which provides guidance on determining which changes to the terms and conditions of share-based payment awards require an entity to apply modification accounting under Topic 718. We adopted ASU 2017-09 effective January 1, 2018, and the adoption of this ASU did not have a material impact on our consolidated financial statements.
In September 2018, the FASB issued ASU 2018-15, Intangibles—Goodwill and Other—Internal-Use Software (Subtopic 350-40): Customer’s Accounting for Implementation Costs Incurred in a Cloud Computing Arrangement That Is a Service Contract. The guidance reduces complexity for the accounting for costs of implementing a cloud computing service arrangement and aligns the requirements for capitalizing implementation costs incurred in a hosting arrangement that is a service contract with the requirements for capitalizing implementation costs incurred to develop or obtain internal-use software (and hosting arrangements that include an internal use software license). The accounting for the service element of a hosting arrangement that is a service contract is not affected by the amendments. We adopted ASU 2018-15 prospectively effective July 1, 2018, and the adoption of this ASU did not have a material impact on our consolidated financial statements.
Effective the first quarter of 2019:
In February 2016, the FASB issued ASU 2016-02, Leases (Topic 842), which is intended to increase transparency and comparability among organizations by requiring the recognition of right-of-use (“ROU”) assets and lease liabilities on the balance sheet. In July 2018, the FASB issued additional guidance which provided an additional transition method for adopting the updated guidance. Under the additional transition method, entities may elect to recognize a cumulative-effect adjustment to the opening balance of retained earnings in the year of adoption. We currently plan to adopt this standard using the modified retrospective approach.
Most prominent among the changes in the standard is the requirement for lessees to recognize ROU assets and lease liabilities for those leases classified as operating leases under current U.S. GAAP. The standard requires additional disclosures to enable users of financial statements to assess the amount, timing, and certainty of cash flows arising from leases. We intend to elect certain of the available practical expedients upon adoption. We have evaluated our existing lease portfolio and believe that our population of leases is relatively low in number. We have implemented key processes and controls to enable the accurate assessment of leases and preparation of related financial information.
We are nearing completion of the opening balance sheet adjustment related to ASU 2016-02. We expect adoption of the standard will result in the recognition of ROU assets of approximately $11 million and lease liabilities of approximately $12 million for operating leases as of January 1, 2019, with no impact to retained earnings. Additionally, we anticipate that our accounting for capital leases will remain substantially unchanged.
In June 2018, the FASB issued ASU 2018-07, Compensation - Stock Compensation (Topic 718), expanding the scope of Topic 718 to include share-based payment transactions for acquiring goods and services from nonemployees. The adoption of this ASU is not expected to have a material impact on our consolidated financial statements.

AXON ENTERPRISE, INC.NOTES TO CONSOLIDATED FINANCIAL STATEMENTS – (Continued)
66
Effective the first quarter of 2020:
In June 2016, the FASB issued ASU 2016-13, Financial Instruments - Credit Losses (Topic 326): Measurement of Credit Losses on Financial Instruments. ASU 2016-13 includes an impairment model (known as the current expected credit loss model) that is based on expected losses rather than incurred losses. Under the new guidance, an entity recognizes as an allowance its estimate of expected credit losses, which the FASB believes will result in more timely recognition of such losses. The use of forecasted information is intended to incorporate more timely information in the estimate of expected credit loss. Early adoption is permitted.We are currently in the process of evaluating the impact of adoption of ASU 2016-13 on our consolidated financial statements.
In August 2018, the FASB issued ASU 2018-13, Fair Value Measurement (Topic 820): Disclosure Framework—Changes to the Disclosure Requirements for Fair Value Measurement. ASU 2018-13 eliminates, adds and modifies certain disclosure requirements for fair value measurements. The amendments applicable to the disclosures of changes in unrealized gains and losses, the range and weighted average of significant unobservable inputs used to develop Level 3 fair value measurements, and the narrative description of measurement uncertainty should be applied prospectively for only the most recent interim or annual period presented in the initial year of adoption. All other amendments should be applied retrospectively to all periods presented upon their effective date. Early adoption is permitted, and an entity is also permitted to early adopt any removed or modified disclosures and delay adoption of the additional disclosures until their effective date. As ASU 2018-13 only revises disclosure requirements, it will not have a material impact on our consolidated financial statements.
Reclassification of Prior Year Presentation
Certain prior year amounts have been reclassified for consistency with the current year presentation. These reclassifications had no effect on the reported results of operations.
2. Revenues
Adoption of ASC Topic 606, "Revenue from Contracts with Customers"
On January 1, 2018, we adopted Topic 606 using the modified retrospective method applied to those contracts which were not completed as of January 1, 2018. Results for reporting periods beginning after January 1, 2018 are presented under Topic 606, while prior period amounts are not adjusted, and continue to be reported in accordance with our historic accounting under ASC 605. We recorded a net increase in stockholders’ equity (retained earnings) of $19.0 million as of January 1, 2018 due to the cumulative impact of adopting Topic 606 on contracts that were not complete as of that date. The areas most significantly impacted were contracts with contingent hardware revenue and the treatment of incremental costs of obtaining contracts with customers.

AXON ENTERPRISE, INC.NOTES TO CONSOLIDATED FINANCIAL STATEMENTS – (Continued)
67
The impact as a result of applying Topic 606 was a net increase to net sales of $5.0 million for the twelve months ended December 31, 2018, and a net decrease to sales, general and administrative expenses of approximately $3.6 million related to the costs of obtaining contracts for the same periods, as compared to what would have been recognized under ASC 605. The impacts to the December 31, 2017 balance sheet of adopting Topic 606 are presented below (in thousands):
December 31, 2017
(As reported)
Impact of Adoptionof Topic 606 on
Opening Balance Sheet
January 1, 2018(As adjusted)
Accounts and notes receivable, net $ 56,064 $ 28,915 $ 84,979Contract assets, net — 5,512 5,512Prepaid expense and other current assets 21,696 2,003 23,699
Total impacted current assets 77,760 36,430 114,190Deferred income tax assets, net 15,755 (5,158) 10,597Long-term notes receivable 36,877 (12,977) 23,900Other assets 15,366 5,323 20,689
Total impacted assets 145,758 23,618 169,376
Accrued liabilities 23,502 2,512 26,014Current portion of deferred revenue 70,401 863 71,264
Total impacted current liabilities 93,903 3,375 97,278Deferred revenue, net of current portion 54,881 1,249 56,130
Total impacted liabilities 148,784 4,624 153,408Retained earnings 123,185 18,994 142,179
Total impacted stockholders' equity 123,185 18,994 142,179Total impacted liabilities and stockholders' equity 271,969 23,618 295,587

AXON ENTERPRISE, INC.NOTES TO CONSOLIDATED FINANCIAL STATEMENTS – (Continued)
68
Nature of Products and Services
The following table presents our revenues by primary product and service offering (in thousands):
Year Ended December 31, 2018 Year Ended December 31, 2017 (1)
TASERSoftware and
Sensors Total TASERSoftware and
Sensors TotalTASER 7 $ 7,358 $ — $ 7,358 $ — $ — $ —TASER X26P 70,638 — 70,638 64,426 — 64,426TASER X2 78,837 — 78,837 81,417 — 81,417TASER Pulse and Bolt 5,182 — 5,182 4,340 — 4,340Cartridges 68,258 — 68,258 63,203 — 63,203Axon Body — 21,883 21,883 — 15,184 15,184Axon Flex — 6,509 6,509 — 10,083 10,083Axon Fleet — 12,527 12,527 — 2,954 2,954Axon Dock — 10,706 10,706 — 9,736 9,736Axon Evidence and cloudservices — 90,291 90,291 — 57,841 57,841TASER Cam — 3,871 3,871 — 3,358 3,358Extended warranties 15,753 11,860 27,613 12,426 7,110 19,536Other 7,089 9,306 16,395 8,700 3,020 11,720
Total $ 253,115 $ 166,953 $ 420,068 $ 234,512 $ 109,286 $ 343,798
(1) Amounts for the year ended December 31, 2017 have not been adjusted under the modified retrospective method of adoption of Topic 606, and are presented consistent with the prior period amounts reported under ASC 605.
Contract Balances
The timing of revenue recognition may differ from the timing of invoicing to customers. We generally have an unconditional right to consideration when we invoice our customers and record a receivable. We record a contract asset when revenue is recognized prior to invoicing, or a contract liability (deferred revenue) when revenue will be recognized subsequent to invoicing.
Contract assets generally result from our subscription programs where we satisfy a hardware performance obligation upon shipment to the customer, and the right to the portion of the transaction price allocated to that hardware performance obligation is conditional on our future performance of a SaaS service obligation under the contract. We recognize a portion of the amount allocated to hardware products shipped to the customer as accounts receivable when invoiced to the customer, and record the remaining allocated value as a contract asset as we have generally fulfilled our hardware performance obligation upon shipment. Unbilled accounts receivable expected to be invoiced and collected within twelve months was $17.3 million as of December 31, 2018, and was included in accounts receivable on our consolidated balance sheet.
Contract liabilities generally consist of deferred revenue on our subscription programs where we generally invoice customers at the beginning of each annual period and record a receivable at the time of invoicing when there is an unconditional right to consideration.
Deferred revenue is comprised mainly of unearned revenue related to our Axon Evidence SaaS platform, secure cloud-based storage, service-type extended warranties, stand-ready obligations in our cartridge programs, and rights to future CEW, camera and related accessories hardware in our subscription programs. Revenue for Axon Evidence and cloud-based storage, our service-type extended warranties and stand-ready cartridge programs is generally

AXON ENTERPRISE, INC.NOTES TO CONSOLIDATED FINANCIAL STATEMENTS – (Continued)
69
recognized on a straight-line basis over the subscription term. Revenue for the rights to future hardware is generally recognized at the point in time the hardware products are shipped to the customer.
Payment terms and conditions vary by contract type and geography, but our standard terms are that payments are due within 30 days from the date of invoice.
The following table presents our contract assets, contract liabilities and certain information related to these balances as of and for the year ended December 31, 2018 (in thousands):
December 31, 2018
Contract assets, net $ 13,960Contract liabilities (deferred revenue) 181,433Revenue recognized in the period from:
Amounts included in contract liabilities at the beginning of the period 63,475
Contract liabilities (deferred revenue) consisted of the following (in thousands):
December 31, 2018 December 31, 2017 (1)
Current Long-Term Total Current Long-Term Total
Warranty:TASER $ 12,797 $ 16,847 $ 29,644 $ 12,501 $ 18,619 $ 31,120Software and Sensors 8,273 6,516 14,789 6,293 4,195 10,488
21,070 23,363 44,433 18,794 22,814 41,608Hardware:TASER 9,355 15,598 24,953 4,164 11,401 15,565Software and Sensors 20,878 24,685 45,563 16,956 14,781 31,737
30,233 40,283 70,516 21,120 26,182 47,302Software and Sensors Services 55,713 10,771 66,484 30,487 5,885 36,372Total $ 107,016 $ 74,417 $ 181,433 $ 70,401 $ 54,881 $ 125,282
December 31, 2018 December 31, 2017 (1)
Current Long-Term Total Current Long-Term Total
TASER $ 22,152 $ 32,445 $ 54,597 $ 16,665 $ 30,020 $ 46,685Software and Sensors 84,864 41,972 126,836 53,736 24,861 78,597Total $ 107,016 $ 74,417 $ 181,433 $ 70,401 $ 54,881 $ 125,282
(1) Amounts as of December 31, 2017 have not been adjusted under the modified retrospective method of adoption of Topic 606, and are presented consistent with the prior period amounts reported under ASC 605.
Remaining Performance Obligations
As of December 31, 2018, we had approximately $900 million of remaining performance obligations, which included both recognized contract liabilities as well as amounts that will be invoiced and recognized in future periods. The remaining performance obligations are limited only to arrangements that meet the definition of a contract under Topic 606 as of December 31, 2018. We expect to recognize between 15% - 20% of this balance over the next twelve months, and expect the remainder to be recognized over the following five to seven years, subject to risks related to

AXON ENTERPRISE, INC.NOTES TO CONSOLIDATED FINANCIAL STATEMENTS – (Continued)
70
delayed deployments, budget appropriation or other contract cancellation clauses.
Costs to Obtain a Contract
We recognize an asset for the incremental costs of obtaining a contract with a customer, which consist primarily of sales commissions. These costs are ascribed to or allocated to the underlying performance obligations in the contract and amortized consistent with the recognition timing of the revenue for the underlying performance obligations.
For contract costs related to performance obligations with an amortization period of one year or less, we apply the practical expedient to expense these sales commissions when incurred. These costs are recognized as incurred within sales, general and administrative expenses on the accompanying consolidated statements of operations and comprehensive income.
As of December 31, 2018, our assets for costs to obtain contracts were as follows (in thousands):
December 31, 2018
Current deferred commissions (1) $ 7,062Deferred commissions, net of current portion (2) 15,530
$ 22,592
(1) Current deferred commissions are included within prepaid expenses and other current assets on the accompanying consolidated balance sheet.(2) Deferred commissions, net of current portion, are included in other assets on the accompanying consolidated balance sheet.
During the year ended December 31, 2018, we recognized $5.3 million of amortization related to deferred commissions. These costs are recorded within sales, general and administrative expenses on the accompanying consolidated statements of operations and comprehensive income.
Significant Judgments
Our contracts with certain municipal government customers may be subject to budget appropriation, other contract cancellation clauses or future periods which are optional. In contracts where the customer’s performance is subject to budget appropriation clauses, we generally consider the likelihood of non-appropriation to be remote when determining the contract term and transaction price. Contracts with other cancellation provisions or optional periods may require judgment in determining the contract term, including the existence of material rights, transaction price and identifying the performance obligations.
At times, customers may request changes that either amend, replace or cancel existing contracts. Judgment is required to determine whether the specific facts and circumstances within the contracts require the changes to be accounted for as a separate contract or as a modification. Generally, contract modifications containing additional goods and services that are determined to be distinct and sold at their SSP are accounted for as a separate contract. For contract modifications where both criteria are not met, the original contract is updated and the required adjustments to revenue and contract assets, liabilities, and other accounts will be made accordingly.
Our contracts with customers often include promises to transfer multiple products and services to a customer. Determining whether products and services are considered distinct performance obligations that should be accounted for separately rather than together may require significant judgment. We consider CEW devices and related accessories, as well as cameras and related accessories, to be separately identifiable from each other as well as from extended warranties on these products and the SaaS subscriptions to Axon Evidence and other cloud services.
In contracts where there are timing differences between when we transfer a promised good or service to the customer and when the customer pays for that good or service, we have determined that, with the exception of our TASER 60 installment purchase arrangements, our contracts generally do not include a significant financing component.

AXON ENTERPRISE, INC.NOTES TO CONSOLIDATED FINANCIAL STATEMENTS – (Continued)
71
For the year ended December 31, 2018, we recorded revenue of $48.2 million, including $1.3 million of interest income, under our TASER 60 plan. For the year ended December 31, 2017, we recorded revenue of $40.7 million including $0.7 million of interest income under our TASER 60 plan. Amounts for the year ended December 31, 2017 have not been adjusted under the modified retrospective method of adoption of Topic 606.
Judgment is required to determine the SSP for each distinct performance obligation.We analyze separate sales of our products and services as a basis for estimating the SSP of our products and services and then use that SSP as the basis for allocating the transaction price when our products and services are sold together in a contract with multiple performance obligations. In instances where the SSP is not directly observable, such as when we do not sell the product or service separately, we determine the SSP using information that may include market conditions, time value of money and other observable inputs. We typically have more than one SSP for individual products and services due to the stratification of those products and services by customers and circumstances. In these instances, we may use information such as geographic region and distribution channel in determining the SSP.
3. Cash, Cash Equivalents and Investments
The following tables summarize the Company's cash, cash equivalents, and held-to-maturity investments at December 31, 2018 and December 31, 2017 (in thousands):
As of December 31, 2018
AmortizedCost
GrossUnrealized
Losses Fair ValueCash and Cash
EquivalentsShort-TermInvestments
Cash $ 144,095 $ — $ 144,095 $ 144,095 $ —
Level 1:Money market funds 205,367 — 205,367 205,367 —
Total $ 349,462 $ — $ 349,462 $ 349,462 $ —
As of December 31, 2017
AmortizedCost
GrossUnrealized
Losses Fair ValueCash and Cash
EquivalentsShort-TermInvestments
Cash $ 53,459 $ — $ 53,459 $ 53,459 $ —
Level 1:Money market funds 20,884 — 20,884 20,884 —Corporate bonds 6,632 (6) 6,626 — 6,632
Subtotal 27,516 (6) 27,510 20,884 6,632
Level 2:State and municipal obligations 992 — 992 762 230
Subtotal 992 — 992 762 230Total $ 81,967 $ (6) $ 81,961 $ 75,105 $ 6,862

AXON ENTERPRISE, INC.NOTES TO CONSOLIDATED FINANCIAL STATEMENTS – (Continued)
72
4. Inventory
Inventories are stated at the lower of cost and net realizable value. Cost is determined using the weighted average cost of raw materials which approximates the FIFO method and includes allocations of manufacturing labor and overhead. Included in finished goods at December 31, 2018 and December 31, 2017 was $1.4 million and $1.4 million, respectively, of trial and evaluation hardware units. Provisions are made to reduce excess, obsolete or slow-moving inventories to their net realizable value. Inventories consisted of the following at December 31 (in thousands):
2018 2017
Raw materials $ 19,670 $ 20,119Finished goods 14,093 25,346Total inventory $ 33,763 $ 45,465
5. Property and Equipment
Property and equipment consisted of the following at December 31 (in thousands):
EstimatedUseful Life 2018 2017
Land N/A $ 2,900 $ 2,900Building and leasehold improvements 3-39 years 19,578 18,383Production equipment 3-7 years 19,817 19,075Computers, equipment and software 3-5 years 8,392 6,780Furniture and office equipment 5-7 years 6,529 5,262Vehicles 5 years 1,385 1,057Website development costs 3 years 687 687Capitalized internal-use software development costs 3 years 3,670 3,695Construction-in-process N/A 14,820 9,810Total cost 77,778 67,649Less: Accumulated depreciation (39,885) (36,477)Property and equipment, net $ 37,893 $ 31,172
Depreciation and amortization expense related to property and equipment was $4.9 million, $3.4 million and $2.5 million for the years ended December 31, 2018, 2017 and 2016, respectively, of which $1.4 million, $1.1 millionand $0.7 million was included in cost of sales for the respective years.
6. Goodwill and Intangible Assets
The changes in the carrying amount of goodwill for the year ended December 31, 2018 were as follows (in thousands):
TASERSoftware and
Sensors Total
Balance, January 1, 2018 $ 1,453 $ 13,474 $ 14,927Goodwill acquired — 10,285 10,285Foreign currency translation adjustments (115) (116) (231)Balance, December 31, 2018 $ 1,338 $ 23,643 $ 24,981

AXON ENTERPRISE, INC.NOTES TO CONSOLIDATED FINANCIAL STATEMENTS – (Continued)
73
Intangible assets (other than goodwill) consisted of the following (in thousands):
December 31, 2018 December 31, 2017
UsefulLife
GrossCarryingAmount
AccumulatedAmortization
NetCarryingAmount
GrossCarryingAmount
AccumulatedAmortization
NetCarryingAmount
Amortizable (definite-lived)intangible assets:
Domain names 5-10 years $ 3,161 $ (732) $ 2,429 $ 3,161 $ (428) $ 2,733Issued patents 4-15 years 2,940 (1,106) 1,834 2,697 (913) 1,784Issued trademarks 3-11 years 1,053 (599) 454 860 (397) 463Customer relationships 4-8 years 3,701 (880) 2,821 1,377 (451) 926Non-compete agreements 3-4 years 540 (439) 101 556 (346) 210Developed technology 3-7 years 13,404 (7,081) 6,323 13,469 (3,956) 9,513Re-acquired distributionrights 2 years 1,928 (1,813) 115 2,133 (711) 1,422Total amortizable 26,727 (12,650) 14,077 24,253 (7,202) 17,051
Non-amortizable (indefinite-lived) intangible assets:
TASER trademark 900 900 900 900Patents and trademarkspending 958 958 872 872Total non-amortizable 1,858 1,858 1,772 1,772
Total intangible assets $ 28,585 $ (12,650) $ 15,935 $ 26,025 $ (7,202) $ 18,823
Amortization expense of intangible assets was $5.7 million, $4.7 million and $0.9 million for the years ended December 31, 2018, 2017 and 2016, respectively. Estimated amortization for intangible assets with definitive lives for the next five years ended December 31, and thereafter, is as follows (in thousands):
2019 $ 3,4632020 3,2942021 2,8522022 1,2112023 934Thereafter 2,323Total $ 14,077
7. Other Long-Term Assets
Other long-term assets consisted of the following at December 31 (in thousands):
2018 2017
Cash surrender value of corporate-owned life insurance policies $ 3,596 $ 3,846Deferred commissions (1) 15,530 6,803Restricted cash (2) 661 3,333Prepaid expenses, deposits and other 3,212 1,384Total other long-term assets $ 22,999 $ 15,366
(1) Represents assets for the incremental costs of obtaining contracts with customers, which consist primarily of sales commissions. These costs are ascribed to or allocated to the underlying performance obligations in the contracts and

AXON ENTERPRISE, INC.NOTES TO CONSOLIDATED FINANCIAL STATEMENTS – (Continued)
74
amortized consistent with the recognition timing of the revenue for the underlying performance obligations. The amounts as of December 31, 2017 have not been adjusted under the modified retrospective method of adoption of Topic 606, and are presented consistent with the prior period amounts. In connection with our adoption of Topic 606, we recorded an adjustment of $7.3 million as of January 1, 2018, and of that amount, $5.4 million was recorded within other assets. The adjusted balance of long-term deferred commissions as of January 1, 2018 was $12.2 million.(2) As of December 31, 2018, restricted cash primarily consisted of $0.6 million for a performance guarantee related to an international customer sales contract.
8. Accrued Liabilities
Accrued liabilities consisted of the following at December 31 (in thousands):
2018 2017
Accrued salaries, benefits and bonus $ 19,063 $ 8,957Accrued professional, consulting and lobbying fees 4,894 3,870Accrued warranty expense 898 644Accrued income and other taxes 4,167 2,558Other accrued expenses 12,070 7,473Accrued liabilities $ 41,092 $ 23,502
9. Commitments and Contingencies
Operating and capital lease obligations
We have entered into operating leases for various office space, storage facilities and equipment. As of December 31, 2018, our leases are for terms ranging from less than one year to five years. Our leases generally contain multi-year renewal options and escalation clauses. Rent expense under all operating leases, including both cancelable and non-cancelable leases, was $4.2 million, $2.9 million and $1.8 million for the years ended December 31, 2018, 2017, and 2016, respectively.
Future minimum lease payments under non-cancelable leases at December 31, 2018, are as follows (in thousands):
Operating Capital
2019 $ 3,670 $ 402020 3,572 362021 2,961 —2022 2,001 —2023 573 —Thereafter — —Total minimum lease payments $ 12,777 76Less: Amount representing interest (6)Capital lease obligation $ 70
Land Lease Purchase Agreement
On December 13, 2018, we entered into a Purchase and Sale Agreement ("PSA") to purchase a leasehold interest to a parcel of land located in Maricopa County, Arizona for a period of 84 years, on which we intend to construct our

AXON ENTERPRISE, INC.NOTES TO CONSOLIDATED FINANCIAL STATEMENTS – (Continued)
75
new headquarters. The purchase price of the land lease was $13.1 million. It is also contemplated that we will prepay the rent under the lease in the amount of $10.9 million. The PSA includes a due diligence period, during which we may terminate and forfeit our initial deposit of $0.2 million.
Purchase commitments
We routinely enter into cancelable and non-cancelable purchase orders with many of our key vendors. Based on the strategic relationships with many of these vendors, our ability to cancel these purchase orders and maintain a favorable relationship would be limited. As of December 31, 2018, we had approximately $66.6 million of open purchase orders.
Litigation
Product Litigation
As a manufacturer of weapons and other law enforcement tools used in high-risk field environments, we are often the subject of products liability litigation concerning the use of our products. We are currently named as a defendant in eight lawsuits on the TASER weapons side of our business, all brought by individuals alleging either wrongful death or personal injury in connection with arrests. While the facts vary from case to case, these product liability claims typically allege defective product design, manufacturing, and/or failure to warn. They seek compensatory and sometimes punitive damages, often in unspecified amounts.
We continue to aggressively defend all product litigation. As a general rule, it is our policy not to settle suspect injury or death cases. Exceptions are sometimes made where the settlement is strategically beneficial to us. Due to the confidential nature of our litigation strategy and the confidentiality agreements that are executed in the event of a settlement, we do not identify or comment on specific settlements by case or amount. Based on current information, we do not believe that the outcome of any such legal proceeding will have a material effect on our financial position, results of operations, or cash flows. We are self-insured for the first $5.0 million of any product claim made after 2014. No judgment or settlement has ever exceeded this amount in any products case. We continue to maintain product liability insurance coverage, including an insurance policy fronting arrangement, above our self-insured retention with various limits depending on the policy period.
Other Litigation
We are a defendant in a litigation matter filed by Digital Ally Inc. (“Digital”) in the District of Kansas alleging patent infringement regarding our Axon Signal technology. Digital seeks a judgment of infringement, monetary damages, a permanent injunction, punitive damages and attorneys’ fees and costs. Both fact and expert discovery are now complete. The parties filed motions for summary judgment on January 31, 2019 and briefing is expected to be complete by the end of March 2019. No trial date has yet been set but, if necessary, is expected to occur in Q4 2019 or Q1 2020.
We are vigorously defending this litigation. The case has been substantially narrowed based on (1) the district court’s dismissal of all of Digital’s antitrust claims in January 2017; this ruling was affirmed by the Federal Circuit in May 2018 and the U.S. Supreme Court denied review; (2) the district court’s dismissal of Digital’s ‘292 patent from the litigation with prejudice in March 2018, and Digital’s execution of a covenant not to sue Axon on that patent on existing Axon products; and (3) Digital’s dismissal of certain inconsistent claims in the ‘452 patent, leaving only one independent claim for resolution by the court. We believe the ‘452 patent is both invalid and not infringed, and we do not believe it is probable that we will incur a material loss.
The October 2018 litigation filed by former VIEVU, LLC employee Amani Kiogora in King County, Washington has been dismissed against Axon. Safariland, LLC has accepted the defense and indemnification of VIEVU for any alleged commissions owed.

AXON ENTERPRISE, INC.NOTES TO CONSOLIDATED FINANCIAL STATEMENTS – (Continued)
76
The April 2016 arbitration claim filed by Antoine di Zazzo, our former distributor in France, was successfully resolved in our favor in December 2018, including an award of fees and costs.
The litigation information in this note is current through the date of these financial statements.
U.S. Federal Trade Commission Investigation
In June 2018 we received a letter from the U.S. Federal Trade Commission (“FTC”) with respect to its non-public investigation into our acquisition of VIEVU, LLC in May 2018. The FTC requested that we provide certain information and documentation relating to the acquisition. We are cooperating with the investigation.
General
From time to time, we are notified that we may be a party to a lawsuit or that a claim is being made against us. It is our policy to not disclose the specifics of any claim or threatened lawsuit until the summons and complaint are actually served on us. After carefully assessing the claim, and assuming we determine that we are not at fault or we disagree with the damages or relief demanded, we vigorously defend any lawsuit filed against us. We record a liability when losses are deemed probable and reasonably estimable. When losses are deemed reasonably possible but not probable, we determine whether it is possible to provide an estimate of the amount of the loss or range of possible losses for the claim, if material for disclosure. In evaluating matters for accrual and disclosure purposes, we take into consideration factors such as our historical experience with matters of a similar nature, the specific facts and circumstances asserted, the likelihood of our prevailing, the availability of insurance, and the severity of any potential loss. We reevaluate and update accruals as matters progress over time.
Based on our assessment of outstanding litigation and claims as of December 31, 2018, we have determined that it is not reasonably possible that these lawsuits will individually, or in the aggregate, materially affect our results of operations, financial condition or cash flows. However, the outcome of any litigation is inherently uncertain and there can be no assurance that any expense, liability or damages that may ultimately result from the resolution of these matters will be covered by our insurance or will not be in excess of amounts recognized or provided by insurance coverage and will not have a material adverse effect on our operating results, financial condition or cash flows.
Off-Balance Sheet Arrangements
Under certain circumstances, we use letters of credit and surety bonds to guarantee our performance under various contracts, principally in connection with the installation and integration of our Axon cameras and related technologies. Certain of our letters of credit contracts and surety bonds have stated expiration dates, with others being released as the contractual performance terms are completed. We expect to fulfill all contractual performance obligations related to outstanding guarantees. At December 31, 2018, we had outstanding letters of credit of approximately $3.1 million, which are expected to expire in May 2019 and September 2021. Additionally, we had approximately $14.1 million of outstanding surety bonds at December 31, 2018, with $0.4 million expiring in 2019, $0.7 million expiring in 2020, $2.3 million expiring in 2021, $3.1 million expiring in 2022 and the remaining $7.6 million expiring in 2023.
10. Income Taxes
On December 22, 2017, the U.S. government enacted comprehensive tax legislation commonly referred to as the Tax Cuts and Jobs Act (the “Tax Act”). The Tax Act made broad and complex changes to the U.S. tax code including, but not limited to, reducing the U.S. federal corporate tax rate from 35 percent to 21 percent for tax years beginning in 2018 and requiring companies to pay a one-time transition tax on earnings of certain foreign subsidiaries that were previously tax deferred. The Tax Act established certain new provisions which are applicable to us including (1) creating a new provision designed to tax global intangible low-tax income ("GILTI"); (2) establishing a deduction for foreign derived intangible income ("FDII"); (3) repealing the domestic production activity deduction; and (4) establishing new limitations on certain executive compensation.

AXON ENTERPRISE, INC.NOTES TO CONSOLIDATED FINANCIAL STATEMENTS – (Continued)
77
During the year ended December 31, 2017, we recorded additional net tax expense of $7.6 million for the impact of the Tax Act using the current available information and technical guidance on the interpretations of the Tax Act. As permitted by SEC Staff Accounting Bulletin 118, Income Tax Accounting Implications of the Tax Cuts and Jobs Act, we recorded provisional estimates and have subsequently finalized our accounting analysis based on the guidance, interpretations, and data available as of December 31, 2018. We recorded additional tax expense of $0.3 million during the three months ended December 31, 2018 upon finalization of our accounting analysis.
Income before income taxes included the following components for the years ended December 31 (in thousands):
2018 2017 2016
United States $ 25,751 $ 14,978 $ 38,414Foreign 2,353 783 (6,917)Total $ 28,104 $ 15,761 $ 31,497
Significant components of the provision for income taxes are as follows for the years ended December 31 (in thousands):
2018 2017 2016
Current:Federal $ 4,900 $ 6,039 $ 16,346State 1,377 1,263 1,534Foreign 228 656 1,050Total current 6,505 7,958 18,930
Deferred:Federal (8,382) 4,539 (4,145)State (364) (1,631) (977)Foreign (3) (78) (45)Total deferred (8,749) 2,830 (5,167)
Tax impact of unrecorded tax benefits liability 1,143 (234) 437Provision for income taxes (Income tax benefit) $ (1,101) $ 10,554 $ 14,200

AXON ENTERPRISE, INC.NOTES TO CONSOLIDATED FINANCIAL STATEMENTS – (Continued)
78
A reconciliation of our effective income tax rate to the federal statutory rate follows for the years ended December 31 (in thousands):
2018 2017 2016
Federal income tax at the statutory rate $ 5,902 $ 5,518 $ 11,024State income taxes, net of federal benefit (215) 339 889Difference between statutory and foreign tax rates 7 (560) 1,521Permanent differences (1) 725 300 (457)Executive compensation limitation 1,167 — —Research and development (6,908) (2,380) (1,928)Return to provision adjustment 1,780 23 327Change in liability for unrecognized tax benefits 1,768 7 700Excess stock-based compensation benefit (2) (8,907) (1,819) (77)Change in valuation allowance 1,984 1,949 1,779Tax effects of intercompany transactions 1,004 (277) 630Adjustments to deferred tax assets, net resulting from enactment of new tax law(3) — 7,601 —Other 592 (147) (208)Provision for income taxes (Income tax benefit) $ (1,101) $ 10,554 $ 14,200Effective tax rate (3.9)% 66.9% 45.1%
(1) Permanent differences include certain expenses that are not deductible for tax purposes including meals and entertainment, certain transaction costs, lobbying fees, and unfavorable income as a result of GILTI offset by favorable items including the domestic production activities deduction, for tax years 2017 and 2016, and a deduction for FDII for 2018.
(2) For the years ended December 31, 2018 and 2017, the provision for income taxes included $8.9 million and $1.8 million, respectively, of benefits resulting from excess stock-based compensation that were recorded as a decrease in the provision for income taxes. For the year ended December 31, 2016, we included $1.4 millionof benefits resulting from excess stock-based compensation that were recorded as increases to additional paid-in capital in the consolidated statement of changes in stockholders' equity.
(3) The adjustment to deferred tax assets of $7.6 million was a result of the impact of changes in the U.S. federal effective tax rate, as well as a reduction of the stock-based compensation deferred tax asset due to expected permanent limitations on its deductibility for certain key executives under the Tax Act.

AXON ENTERPRISE, INC.NOTES TO CONSOLIDATED FINANCIAL STATEMENTS – (Continued)
79
Significant components of our deferred income tax assets and liabilities are as follows at December 31 (in thousands):
2018 2017
Deferred income tax assets:Net operating loss carryforward $ 2,347 $ 3,691Deferred revenue 13,304 9,442Deferred compensation 858 1,109Inventory reserve 1,294 702Non-qualified and non-employee stock option expense 3,758 3,704Capitalized research and development — 485Amortization 412 —Research and development tax credit carryforward 5,193 3,817Reserves, accruals, and other 3,094 1,921Total deferred income tax assets 30,260 24,871
Deferred income tax liabilities:Depreciation (2,195) (2,027)Amortization (57) (1,398)Other (1,232) (256)Total deferred income tax liabilities (3,484) (3,681)
Net deferred income tax assets before valuation allowance 26,776 21,190Valuation allowance (7,429) (5,435)Net deferred income tax assets $ 19,347 $ 15,755
We have $2.5 million of state net operating losses (“NOLs”) which expire at various dates between 2029 and 2036. We also have a federal NOL of $1.5 million which expires in 2036, and is subject to limitation under Internal Revenue Code (“IRC”) Section 382. We have $0.1 million of federal R&D credits, which expire in 2024 and 2027, and are also subject to limitation under IRC Section 382. We have $9.7 million of Arizona R&D credits carrying forward, which expire at various dates between 2019 and 2033. In the U.K., Canada, and Germany, we have $8.9 million, $1.4 million, and $0.1 million of NOLs, respectively, which expire at various dates or may be carried forward indefinitely.
In preparing our consolidated financial statements, management has assessed the likelihood that deferred income tax assets will be realized from future taxable income. In evaluating the ability to recover its deferred income tax assets, management considers all available evidence, positive and negative, including our operating results, ongoing tax planning and forecasts of future taxable income on a jurisdiction by jurisdiction basis. A valuation allowance is established if it is determined that it is more likely than not that some portion or all of the net deferred income tax assets will not be realized. Management exercises significant judgment in determining our provisions for income taxes, our deferred income tax assets and liabilities, and our future taxable income for purposes of assessing our ability to utilize any future tax benefit from our deferred income tax assets.
As of December 31, 2018, we continue to demonstrate positive income in the U.S. federal and state tax jurisdictions; however, we have Arizona R&D tax credits expiring unutilized each year. Therefore, management has concluded that it is more likely than not that our Arizona R&D deferred tax asset will not be realized.
As of December 31, 2018, we have cumulative pre-tax losses in Australia, the U.K., and Canada, which limits the ability to consider other subjective evidence, such as projections for future growth. On the basis of this evaluation, a full valuation allowance has been recorded for these jurisdictions. The amount of the deferred tax asset considered

AXON ENTERPRISE, INC.NOTES TO CONSOLIDATED FINANCIAL STATEMENTS – (Continued)
80
realizable; however, could be adjusted in future periods if objective negative evidence in the form of cumulative losses is no longer present and additional weight is given to subjective evidence such as projections for growth.
We consider the undistributed earnings of certain non-U.S. subsidiaries to be indefinitely reinvested outside of the United States on the basis of estimates that future domestic cash generation will be sufficient to meet future domestic cash needs and our specific plans for reinvestment of those subsidiary earnings. We project that our foreign earnings will be utilized offshore for working capital and future foreign growth. The determination of the unrecognized deferred tax liability on those undistributed earnings is not practicable due to our legal entity structure and the complexity of U.S. and local country tax laws. If we decide to repatriate the undistributed foreign earnings, we will need to recognize the income tax effects in the period we change our assertion on indefinite reinvestment.
We complete R&D tax credit studies for each year that an R&D tax credit is claimed for federal, Arizona, and California income tax purposes. Management has made the determination that it is more likely than not that the full benefit of the R&D tax credit will not be sustained on examination and recorded a liability for unrecognized tax benefits of $5.2 million as of December 31, 2018. In addition, management accrued approximately $0.1 million for estimated uncertain tax positions related to certain federal income tax liabilities. Should the unrecognized tax benefit of $5.3 million be recognized, our effective tax rate would be favorably impacted.
The following table presents a roll forward of our liability for unrecognized tax benefits, exclusive of accrued interest, as of December 31 (in thousands):
2018 2017 2016
Balance, beginning of period $ 4,243 $ 4,050 $ 3,396Increase in previous year tax positions 213 379 206Increase in current year tax positions 1,982 587 448Decrease due to lapse of statutes of limitations (380) (773) —Balance, end of period $ 6,058 $ 4,243 $ 4,050
Federal income tax returns for 2015 through 2017 remain open to examination by the U.S. Internal Revenue Service (the “IRS”), while state and local income tax returns for 2014 through 2017 also generally remain open to examination by state taxing authorities. The 2004 through 2013 income tax returns are only open to the extent that net operating loss or other tax attributes carrying forward from those years were utilized in 2014 through 2017. The foreign tax returns for 2014 through 2017 also generally remain open to examination. Our U.S. federal income tax return for fiscal year 2016 is currently under audit by the Internal Revenue Service.
We recognize interest and penalties related to unrecognized tax benefits within the provision (benefit) for income tax expense line in the accompanying consolidated statements of operations and comprehensive income. As of December 31, 2018 and 2017, we had accrued interest of $0.1 million.
11. Line of Credit
We have a $100.0 million unsecured revolving line of credit with a domestic bank, of which $10.0 million is available for letters of credit. The credit agreement matures on December 31, 2021 and has an accordion feature which allows for an increase in the total line of credit up to $100.0 million, subject to certain conditions, including the availability of additional bank commitments.
At December 31, 2018 and 2017, there were no borrowings under the line. Under the terms of the line of credit, available borrowings are reduced by outstanding letters of credit. As of December 31, 2018, we had letters of credit outstanding of approximately $3.1 million under the facility and available borrowing of $96.9 million. Advances under the line of credit bear interest at LIBOR plus 1.0 to 1.5% per year determined in accordance with a pricing grid based on our funded debt to earnings before interest, taxes, depreciation and amortization ("EBITDA") ratio.

81
We are required to comply with a maximum funded debt to EBITDA ratio of no greater than 2.50 to 1.00 based upon a trailing four fiscal quarter period. At December 31, 2018, our funded debt to EBITDA ratio was 0.001 to 1.00.
12. Stockholders’ Equity
Common Stock and Preferred Stock
We have authorized the issuance of two classes of stock designated as “common stock” and “preferred stock,” each having a par value of $0.00001 per share. We are authorized to issue 200 million shares of common stock and 25 million shares of preferred stock.
Follow-On Offering
In May 2018, we sold 4,645,000 shares of our common stock, which included 645,000 shares pursuant to the full exercise of the underwriters' option to purchase additional shares, in an underwritten public offering at a price of $53.00 per share, which resulted in gross proceeds of $246.2 million. Net proceeds after deducting fees, commissions, and other expenses related to the offering were $234.0 million.
CEO Performance Award
On May 24, 2018, our stockholders approved the CEO Performance Award of 6,365,856 stock option awards. The CEO Performance Award consists of 12 vesting tranches with a vesting schedule based entirely on the attainment of both operational goals (performance conditions) and market capitalization goals (market conditions), assuming continued employment either as the CEO or as both Executive Chairman and Chief Product Officer and service through each vesting date. Each of the 12 vesting tranches of the CEO Performance Award have a 10-year contractual term and will vest upon certification by the Compensation Committee of the Board of Directors that both (i) the market capitalization goal for such tranche, which begins at $2.5 billion for the first tranche and increases by increments of $1.0 billion thereafter, and (ii) any one of the following eight operational goals focused on revenue or eight operational goals focused on Adjusted EBITDA have been met for the previous four consecutive fiscal quarters. Adjusted EBITDA for purposes of the CEO Performance Award ("Adjusted EBITDA (CEO Performance Award)") is defined as net income (loss) attributable to common stockholders before interest expense, investment interest income, provision (benefit) for income taxes, depreciation and amortization, and stock-based compensation expense.
Eight Separate Revenue Goals (1)
(in thousands)
Eight Separate Adjusted EBITDA (CEO Performance Award) Goals
(in thousands)
Goal #1, $710,058 Goal #9, $125,000Goal #2, $860,058 Goal #10, $155,000
Goal #3, $1,010,058 Goal #11, $175,000Goal #4, $1,210,058 Goal #12, $190,000Goal #5, $1,410,058 Goal #13, $200,000Goal #6, $1,610,058 Goal #14, $210,000Goal #7, $1,810,058 Goal #15, $220,000Goal #8, $2,010,058 Goal #16, $230,000
(1) In connection with the business acquisition that was completed during the three months ended June 30, 2018 (Note 15), the revenue goals have been adjusted for the acquiree's Target Revenue, as defined in the CEO Performance Award agreement.
As of December 31, 2018, the following operational goals were considered probable of achievement:
• Total revenue of $710.1 million; and

AXON ENTERPRISE, INC.NOTES TO CONSOLIDATED FINANCIAL STATEMENTS – (Continued)
82
• Adjusted EBITDA (CEO Performance Award) of $125.0 million.
Stock-based compensation expense associated with the CEO Performance Award is recognized over the longer of the expected achievement period for each pair of market capitalization and operational goals, beginning at the point in time when the relevant operational goal is considered probable of being met. The probability of meeting an operational goal and the expected achievement point in time for meeting a probable operational goal are based on a subjective assessment of our forward-looking financial projections, taking into consideration statistical analysis. Even though no tranches of the CEO Performance Award vest unless a market capitalization and a matching operational goal are both achieved, stock-based compensation expense is recognized when an operational goal is considered probable of achievement regardless of whether a market capitalization goal is actually achieved. Additionally, stock-based compensation represents a non-cash expense and is recorded in sales, general, and administrative operating expense on our consolidated statements of operations and comprehensive income.
The first two market capitalization goals have been achieved as of December 31, 2018. However, none of the stock options granted under the CEO Performance Award have vested thus far as the operational goals have not yet been achieved as of December 31, 2018. As there are two operational goals considered probable of achievement, we recorded stock-based compensation expense of $3.3 million related to the CEO Performance Award from the Grant Date through December 31, 2018. The number of stock options that would vest related to the two tranches is approximately 1.1 million shares.
As of December 31, 2018, we had $42.0 million of total unrecognized stock-based compensation expense for the operational goals that were considered probable of achievement, which will be recognized over a weighted-average period of 7.2 years. As of December 31, 2018, we had unrecognized stock-based compensation expense of $200.7 million for the operational goals that were considered not probable of achievement.
Stock-based Compensation Plans
We have historically utilized stock-based compensation, consisting of RSUs and stock options, for key employees and non-employee directors as a means of attracting and retaining quality personnel. Service-based grants generally have a vesting period of 3 to 5 years and a contractual maturity of ten years. Performance-based grants generally have vesting periods ranging from 1 to 5 years and a contractual maturity of ten years.
On March 29, 2018, our Board of Directors approved the 2018 Stock Incentive Plan (the “2018 Plan"), which was subsequently approved by stockholders at the Annual Meeting of Stockholders on May 24, 2018. Under the 2018 Plan, we reserved for future grants: (i) 1.0 million shares of common stock, plus (ii) the number of shares of common stock that were authorized but unissued under our 2016 Stock Incentive Plan (the “2016 Plan”) and all prior Company equity plans as of the effective date of the 2018 Plan, and (iii) the number of shares of stock that have been granted under the prior plans that either terminate, expire or lapse for any reason after the effective date of the 2016 Plan. As of December 31, 2018, approximately 1.7 million shares remain available for future grants. Shares issued upon exercise of stock awards from these plans have historically been issued from our authorized unissued shares.
Performance-based stock awards
We have issued performance-based stock options and performance-based RSUs, the vesting of which is generally contingent upon the achievement of certain performance criteria related to our operating performance, as well as successful and timely development and market acceptance of future product introductions. In addition, certain of the performance RSUs have additional service requirements subsequent to the achievement of the performance criteria. Compensation expense is recognized over the requisite service period, which is defined as the longest explicit, implicit or derived service period based on management’s estimate of the probability of the performance criteria being satisfied, adjusted at each balance sheet date.

AXON ENTERPRISE, INC.NOTES TO CONSOLIDATED FINANCIAL STATEMENTS – (Continued)
83
Restricted Stock Units
The following table summarizes RSU activity for the years ended December 31 (number of units and aggregate intrinsic value in thousands):
2018 2017 2016
Numberof
Units
WeightedAverage
Grant-DateFair Value
Numberof
Units
WeightedAverage
Grant-DateFair Value
Numberof
Units
WeightedAverage
Grant-DateFair Value
Units outstanding, beginning of year 2,348 $ 23.47 1,330 $ 20.40 1,139 $ 19.30Granted 381 46.06 1,731 24.59 718 19.75Released (772) 23.85 (519) 18.85 (414) 15.91Forfeited (302) 24.73 (194) 24.61 (113) 21.65Units outstanding, end of year 1,655 28.34 2,348 23.47 1,330 20.40Aggregate intrinsic value at year end $ 72,406
Aggregate intrinsic value represents our closing stock price on the last trading day of the period, which was $43.75 per share at December 31, 2018, multiplied by the number of RSUs. The fair value as of the respective vesting dates of RSUs that vested during the year ended December 31, 2018 was $36.6 million. Certain RSUs that vested in 2018 were net-share settled, such that we withheld shares with value equivalent to the employees’ minimum statutory obligation for the applicable income and other employment taxes, and remitted the cash to the appropriate taxing authorities. Total shares withheld during 2018 were 0.2 million and had a value of approximately $7.8 million on their respective vesting dates as determined by the closing stock price of our stock. Payments for the employees’ tax obligations are reflected as a financing activity within the statement of cash flows. These net-share settlements had the effect of share repurchases by us as they reduced the amount of shares that would have otherwise been issued as a result of the vesting.
In 2018, 2017 and 2016, we granted approximately 94,000, 353,000 and 79,000 performance-based RSUs, respectively (included in the table above). Certain of the performance-based RSUs outstanding as of December 31, 2018 can vest with a range of shares earned being between 0% and 200% of the targeted shares granted, depending on the final achievement of pre-determined performance criteria as of the vesting date. As of December 31, 2018, the performance criteria had been met for approximately 4,000 of the 0.4 million performance-based RSUs outstanding. We recognized $4.8 million, $2.5 million and $2.1 million of compensation expense related to performance-based RSUs during the years ended December 2018, 2017 and 2016, respectively.
As of December 31, 2018, there was $35.9 million in unrecognized compensation costs related to RSUs under our stock plans. We expect to recognize the cost related to the RSUs over a weighted average period of 2.26 years.

AXON ENTERPRISE, INC.NOTES TO CONSOLIDATED FINANCIAL STATEMENTS – (Continued)
84
Stock Option Activity
The following table summarizes stock option activity for the years ended December 31 (number of options in thousands):
2018 2017 2016
Numberof
Options
WeightedAverageExercise
Price
Numberof
Options
WeightedAverageExercise
Price
Numberof
Options
WeightedAverageExercise
Price
Options outstanding, beginning of year 804 $ 4.99 1,008 $ 5.40 1,103 $ 5.37Granted 6,366 28.58 — — — —Exercised (664) 5.09 (198) 6.99 (95) 5.02Expired / terminated (48) 4.55 (6) 8.32 — —Options outstanding, end of year 6,458 28.24 804 4.99 1,008 5.40Options exercisable, end of year 92 4.45 775 5.00 977 5.42
6.4 million stock options were granted in 2018 and none were granted in 2017 or 2016. The total intrinsic value of options exercised was $28.5 million, $3.2 million and $2.0 million for the years ended December 31, 2018, 2017and 2016, respectively. The intrinsic value for options exercised was calculated as the difference between the exercise price of the underlying stock option awards and the market price of our common stock on the date of exercise.
Of the total stock options exercised during the year ended December 31, 2018, 0.3 million were exercised and the shares then sold by our CEO in connection with our follow-on offering. The CEO surrendered already owned shares to cover the exercise price of the option exercises. The option exercises were net-share settled such that we withheld shares with value equivalent to the CEO’s minimum statutory obligation for the applicable income and other employment taxes, and remitted the cash to the appropriate taxing authorities. Total shares withheld for tax purposes and surrendered to cover the option exercises were 0.1 million and 29,854, respectively, and had a value of $6.2 million and $1.6 million, respectively, on the exercise date as determined by the closing stock price on that day. Payments for the employee's tax obligations are reflected as a financing activity within the statement of cash flows. We recorded a liability for the tax withholding to be paid by us as a reduction to additional paid-in capital.
The following table summarizes information about stock options that were fully vested or expected to vest as of December 31, 2018 (number of options in thousands):
Options Outstanding Options Exercisable
Range ofExercise Price
Number ofOptions
Outstanding
WeightedAverageExercise
Price
WeightedAverage
RemainingContractualLife (Years)
Number ofOptions
Exercisable
WeightedAverageExercise
Price
WeightedAverage
RemainingContractualLife (Years)
$4.20 - $6.30 92 $ 4.45 1.54 92 $ 4.45 1.54
The aggregate intrinsic value of options outstanding and options exercisable at December 31, 2018 was $3.6 million and $3.6 million, respectively. Aggregate intrinsic value represents the difference between the exercise price of the underlying stock option awards and the closing market price of our common stock of $43.75 on December 31, 2018.
At December 31, 2018, we had 6,365,856 unvested options outstanding with a weighted average exercise price of $28.58 per share, weighted average grant-date fair value of $38.64 per share and weighted average remaining contractual life of 9.8 years. The aggregate intrinsic value of unvested options at December 31, 2018 was $96.6 million.
We granted approximately 1.0 million performance-based stock options (included in the table above) from 2008 through 2011. As of December 31, 2018, approximately 0.1 million performance-based stock options are outstanding

AXON ENTERPRISE, INC.NOTES TO CONSOLIDATED FINANCIAL STATEMENTS – (Continued)
85
and exercisable. The aggregate grant-date fair value of the 0.1 million performance-based stock options vested as of December 31, 2018 was approximately $3.6 million.
Stock-based Compensation Expense
We account for stock-based compensation using the fair-value method. Reported stock-based compensation was classified as follows for the years ended December 31 (in thousands):
2018 2017 2016
Cost of product and service sales $ 511 $ 508 $ 342Sales, general and administrative expenses 12,710 9,047 5,707Research and development expenses 8,658 6,055 3,320Total stock-based compensation expense $ 21,879 $ 15,610 $ 9,369Income tax benefit $ 4,049 $ 5,791 $ 3,526
Stock Repurchase
In February 2016, our Board of Directors authorized a stock repurchase program to acquire up to $50.0 millionof our outstanding common stock subject to stock market conditions and corporate considerations. During the year ended December 31, 2016, we purchased, under a Rule 10b5-1 plan, approximately 1.8 million common shares for a total cost of approximately $33.7 million, or a weighted average cost of $18.90 per share. As of December 31, 2018 and 2017, $16.3 million remained available under the plan for future purchases. We suspended our 10b5-1 plan during 2016, and any future purchases will be discretionary.
Stock Incentive Plan
In February 2019, our shareholders approved a new stock incentive plan (the “2019 Plan”) authorizing an additional 6.0 million shares, plus remaining available shares under prior plans, for issuance under the new plan.
eXponential Stock Performance Plan
On February 12, 2019 , our shareholders approved the 2019 Plan, which was adopted by the Board of Directors to reserve a sufficient number of shares to facilitate our eXponential Stock Performance Plan (“XSPP”) and grants of eXponential Stock Units (“XSUs”) under the plan. Pursuant to the XSPP, all eligible full-time U.S. employees were granted an award of 60 XSUs in January 2019, and certain employees had the opportunity to elect to receive a percentage of the value of their target compensation over the next nine years (2019-2027) in the form of additional XSUs. For employees who elected to receive XSUs, the XSU grants were made as an up front, lump sum grant in January 2019, and are intended to replace that portion of the target compensation they elected to receive in the form of XSUs for the next nine years. Accordingly, their go forward target compensation will be reduced until 2027 by the amount of such compensation that the employees elected to receive in the form of the January 2019 XSU grants. A total of approximately 5.1 million XSUs were granted in January 2019.
The XSUs are grants of restricted stock units, each with a term of approximately nine years, that vest in 12equal tranches. Each of the 12 tranches will vest upon certification by the Compensation Committee of the Board of Directors that both (i) the market capitalization goal for such tranche, which begins at $2.5 billion for the first tranche and increases by increments of $1.0 billion thereafter, and (ii) any one of eight operational goals focused on revenue or eight operational goals focused on Adjusted EBITDA have been met for the previous four consecutive fiscal quarters.
The XSPP contains an anti-dilution provision, which is used to calculate a maximum number of shares outstanding for purposes of determining achievement of the market capitalization goals whereby the maximum number of shares used to calculate the market capitalization goal is calculated by organically growing the current number of shares outstanding by 3% per year (the "XSU Maximum"). Any shares of Stock issued to Patrick W. Smith upon the

AXON ENTERPRISE, INC.NOTES TO CONSOLIDATED FINANCIAL STATEMENTS – (Continued)
86
exercise of the stock options granted to Mr. Smith under the CEO Performance Award shall increase the XSU Maximum. The XSU Maximum shall also be adjusted for acquisitions, spin-offs or other changes in the number of outstanding shares of common stock, if such changes have a corresponding adjustment on the market capitalization goals.
The market capitalization and operational goals are identical to the CEO Performance Award, except for the number of shares that are used to calculate the market capitalization goals if shares outstanding exceed the XSU Maximum. Additionally, because the grant date is different than that of the CEO Performance Award, the measurement period for market capitalization is not identical.
13. Related Party Transactions
We subscribe to a mobile collaboration software suite from Quip, a company that was co-founded and managed by Bret Taylor, a member of our Board of Directors. In April 2016, Quip was acquired by Salesforce, and subsequent to the acquisition, we continue to consider Quip a related party. In November 2017, Mr. Taylor was appointed to President and Chief Product Officer of Salesforce. We now consider the consolidated Salesforce entity to be a related party. The cost to subscribe to various cloud-based hosting arrangements from Salesforce and Quip was $1.8 million, $1.2 million and $0.8 million for the years ended December 31, 2018, 2017 and 2016, respectively. Amounts owed as of December 31, 2018 and 2017 were negligible.
14. Employee Benefit Plans
We have a defined contribution profit sharing 401(k) plan for eligible employees, which is qualified under Sections 401(a) and 401(k) of the Internal Revenue Code of 1986, as amended. Employees are entitled to make tax-deferred contributions of up to the maximum allowed by law of their eligible compensation.
We also have a non-qualified deferred compensation plan for certain executives, key employees and non-employee directors through which participants may elect to postpone the receipt and taxation of a portion of their compensation, including stock-based compensation, received from us. The non-qualified deferred compensation plan allows eligible participants to defer up to 80% of their base salary and up to 100% of other types of compensation. The plan also allows for matching and discretionary employer contributions. Employee deferrals are deemed 100% vested upon contribution. Distributions from the plan generally commence upon retirement, death, separation of service, specified date or upon the occurrence of an unforeseeable emergency. Distributions can be paid in a variety of forms from lump sum to installments over a period of years. Participants in the plan are entitled to select from a wide variety of investments available under the plan and are allocated gains or losses based upon the performance of the investments selected by the participant. All gains or losses are allocated fully to plan participants and we do not guarantee a rate of return on deferred balances. Assets related to this plan consist of corporate-owned life insurance contracts and are included in other assets in the consolidated balance sheets. Participants have no rights or claims with respect to any plan assets and any such assets are subject to the claims of our general creditors.
Contributions to the plans are made by both the employee and us. Our contributions are based on the level of employee contributions and are immediately vested. Our matching contributions to the 401(k) plan for the years ended December 31, 2018, 2017 and 2016, were approximately $3.2 million, $2.5 million and $1.6 million, respectively. Future matching or profit sharing contributions to the plans are at our sole discretion.
15. Business Acquisitions
Dextro, Inc.
On February 8, 2017, we acquired all of the outstanding common stock of Dextro for a total purchase price of $7.5 million. Dextro's technology provides one of the first computer-vision and deep learning systems to make the visual contents in video searchable in real time. This technology will allow law enforcement agencies and departments

AXON ENTERPRISE, INC.NOTES TO CONSOLIDATED FINANCIAL STATEMENTS – (Continued)
87
to quickly isolate and analyze critical seconds of footage from massive amounts of video data. The technology acquired, along with the Dextro employees that joined Axon, were key additions to the Axon Artificial Intelligence team.
The purchase price of $7.5 million consisted primarily of cash, net of cash acquired, and contingent consideration of $1.0 million representing potential earn-outs to former stockholders based on predetermined future metrics. As of December 31, 2018, 0.6 million was earned and paid relative to the former stockholder earn-out provisions. We also agreed to additional earn-out provisions to former Dextro employees totaling approximately $1.4 million based, in part, on predetermined future metrics. The additional earn-outs were not included as part of the purchase price and are being expensed as compensation for the employees in the period earned.
The major classes of assets and liabilities to which we allocated the purchase price were as follows (in thousands):
Accounts receivable $ 12Property and equipment 46Developed technology 5,800Goodwill 2,703Deferred income tax liabilities, net (1,074)
Total purchase price $ 7,487
We assigned the goodwill to the Software and Sensors segment. Identifiable definite-lived intangible assets were assigned a total weighted average amortization period of 3.4 years. Dextro has been included in our consolidated results of operations subsequent to the acquisition date. Pro forma results of operations for Dextro have not been presented because they are not material to the consolidated results of operations. In connection with the acquisition, we incurred and expensed costs of approximately $0.2 million, which included legal, accounting and other third-party expenses related to the transaction.
Breon Enterprises
On July 1, 2017, we acquired certain tangible and intangible assets from Breon, which was our distributor in the Australia region. This transaction, which was accounted for as a business combination under ASC 805, is intended to expand our growth across Australia and surrounding regions by growing our in-country sales and support team.
The purchase price of $4.2 million was paid in full in July 2017. As of the acquisition date, we had a $2.2 millionpre-existing accounts receivable balance from Breon for our sales of goods and services to Breon prior to the acquisition date. This receivable balance was cash settled in full separately from the business combination at its book value, which was considered to be the fair value due to the short-term nature of the receivable.
The major classes of assets to which we allocated the purchase price were as follows (in thousands):
Re-acquired distribution rights $ 2,100Customer relationships 400Goodwill 1,650
Total purchase price $ 4,150
We assigned $0.8 million of the goodwill to each of the TASER and Software and Sensors segments. The assignment of goodwill was based on our estimate of how the acquired assets would contribute cash flows to us over time. Identifiable definite-lived intangible assets were assigned a total weighted average amortization period of 2.1 years. Breon has been included in our consolidated results of operations subsequent to the acquisition date. Pro forma results of operations for Breon have not been presented because they are not material to the consolidated results of operations. Costs related to the acquisition were expensed as incurred and were considered insignificant.

AXON ENTERPRISE, INC.NOTES TO CONSOLIDATED FINANCIAL STATEMENTS – (Continued)
88
VIEVU
On May 3, 2018, we acquired all of the outstanding ownership interests of VIEVU, a public safety camera and cloud-based evidence management system provider for law enforcement agencies.
The estimated purchase price of $17.6 million consisted of $5.0 million in cash, net of cash acquired of $0.1 million, and $2.4 million, or 58,843 shares, of our common stock issued to VIEVU’s parent company, Safariland, LLC (“Safariland”). Additionally, the purchase price consisted of contingent consideration of up to $6.0 million, or 141,226additional shares of common stock, if certain conditions relating to retention of certain VIEVU customers are met as of the first and second anniversaries of the acquisition date. The fair value of the contingent consideration as of the acquisition date was $5.8 million. The purchase price also included the fair value of a long-term Product Development and Supplier Agreement (the “Supply Agreement”) with Safariland, pursuant to which Safariland will be our preferred provider of holsters for our CEW products. The estimated fair value of the Supply Agreement as of the acquisition date was $4.5 million, a portion of which was recorded within accrued liabilities and the remaining portion recorded within other long-term liabilities.
Pursuant to ASC 805, the acquisition of VIEVU has been accounted for as a business combination, under the acquisition method of accounting, which resulted in acquired assets and assumed liabilities being measured at their estimated fair values as of the acquisition date. As of the acquisition date, goodwill was measured as the excess of consideration transferred, which is also generally measured at fair value, over the net acquisition date fair values of the assets acquired and liabilities assumed. Goodwill includes the value of intangible assets that do not qualify for separate recognition as well as strategic benefits we expect to realize from the acquisition. $5.2 million of the acquired goodwill is expected to be deductible for tax purposes.
The major classes of assets and liabilities to which we have allocated the purchase price were as follows (in thousands):
Accounts receivable $ 1,776Inventory 2,626Prepaid expenses and other assets 362Property and equipment 459Contract assets 1,472Intangible assets 4,510Goodwill 10,285Accounts payable and accrued liabilities (3,345)Deferred revenue (543)
Total purchase price $ 17,602
We have assigned the goodwill to the Software and Sensors segment. Identifiable definite-lived intangible assets were assigned a total weighted average amortization period of 5.1 years. VIEVU has been included in our consolidated results of operations subsequent to the acquisition date. Revenue included in our consolidated financial statements from the acquisition date through December 31, 2018 was $6.7 million. Direct costs incurred by the VIEVU legal entity and costs attributable to legacy VIEVU employees were approximately $16.9 million through December 31, 2018.
The following unaudited pro forma financial information presents the combined results of operations for the years ending December 31, 2018, and 2017, respectively, as though the VIEVU acquisition that occurred during the reporting period had occurred as of January 1, 2017. The unaudited pro forma results include certain adjustments, which are primarily comprised of the change in amortization of intangible assets established in purchase accounting compared to VIEVU's legacy intangible assets, and reclassifying the expense recorded during the three months ended June 30, 2018 related to assumed purchase commitments to the pro forma 2017 results. In addition, we have made pro forma adjustments in 2018 to exclude nonrecurring transaction costs directly attributable to the acquisition.

AXON ENTERPRISE, INC.NOTES TO CONSOLIDATED FINANCIAL STATEMENTS – (Continued)
89
These unaudited pro forma results of operations are presented for informational purposes only as required by U.S. GAAP, and do not include any anticipated cost savings or other effects of future integration efforts associated with the Company's acquisition strategy to secure major city customer relationships. As such, they may not be indicative of the results we would have achieved if the acquisition had taken place on January 1, 2017, nor are they indicative of future results of operations (in thousands, except per share amounts):
For the Years Ended December 31,
2018 2017
Net sales $ 423,890 $ 352,985Net income (loss) $ 27,035 $ (2,145)Net income (loss) per share:
Basic $ 0.49 $ (0.04)Diluted $ 0.47 $ (0.04)
In connection with the acquisition, we incurred and expensed costs of approximately $0.8 million, which included legal, accounting and other third-party expenses related to the transaction. Subsequent to the acquisition date, we recorded expenses of $1.2 million related to purchase commitments assumed in the VIEVU business combination that exceeded estimated future demand.
16. Segment Data
Our operations are comprised of two reportable segments: the manufacture and sale of CEWs, batteries, accessories, extended warranties and other products and services (the “TASER” segment); and the development, manufacture, and sale of software and sensors, which includes the sale of devices, wearables, applications, cloud and mobile products (collectively, the “Software and Sensors” segment). Within the Software and Sensors segment, we specify sales of products and services. Revenue from our “products” in the Software and Sensors segment are generally from sales of sensors, including on-officer body cameras, Axon Fleet cameras, other hardware sensors, warranties on sensors,and other products, and is sometimes referred to as "Sensors and Other revenue." Revenue from our “services” in the Software and Sensors segment comprise sales related to the Axon Cloud, which includes Axon Evidence, cloud-based evidence management software revenue, other recurring cloud-hosted software revenue and related professional services, and is sometimes referred to as "Axon Cloud revenue." Within the Software and Sensors segment, we include only revenues and costs attributable to that segment which costs include: costs of sales for both products and services, direct labor, selling expenses for the sales team, product management and R&D for products included, or to be included, within the Software and Sensors segment. All other costs are included in the TASER segment. Our Chief Executive Officer, who is the CODM, is not provided asset information by segment, and therefore, no asset information is provided.

AXON ENTERPRISE, INC.NOTES TO CONSOLIDATED FINANCIAL STATEMENTS – (Continued)
90
Information relative to our reportable segments was as follows (in thousands):
For the year ended December 31, 2018
TASERSoftware and
Sensors Total
Net sales from products $ 253,115 $ 74,520 $ 327,635Net sales from services — 92,433 92,433
Net sales 253,115 166,953 420,068Cost of product sales 80,354 58,983 139,337Cost of service sales — 22,148 22,148
Cost of sales 80,354 81,131 161,485Gross margin 172,761 85,822 258,583
Sales, general and administrative 90,910 65,976 156,886Research and development 17,012 59,844 76,856
Income (loss) from operations $ 64,839 $ (39,998) $ 24,841
For the year ended December 31, 2017
TASERSoftware and
Sensors Total
Net sales from products (1) $ 234,512 $ 51,347 $ 285,859Net sales from services (1) — 57,939 57,939
Net sales (1) 234,512 109,286 343,798Cost of product sales 72,054 45,943 117,997Cost of service sales — 18,713 18,713
Cost of sales 72,054 64,656 136,710Gross margin 162,458 44,630 207,088
Sales, general and administrative (1) 78,202 60,490 138,692Research and development 8,377 46,996 55,373
Income (loss) from operations $ 75,879 $ (62,856) $ 13,023

AXON ENTERPRISE, INC.NOTES TO CONSOLIDATED FINANCIAL STATEMENTS – (Continued)
91
For the year ended December 31, 2016
TASERSoftware and
Sensors Total
Net sales from products (1) $ 202,644 $ 35,929 $ 238,573Net sales from services (1) — 29,672 29,672
Net sales (1) 202,644 65,601 268,245Cost of product sales 61,930 29,606 91,536Cost of service sales — 6,173 6,173
Cost of sales 61,930 35,779 97,709Gross margin 140,714 29,822 170,536
Sales, general and administrative (1) 63,617 44,459 108,076Research and development 5,887 24,722 30,609
Income (loss) from operations $ 71,210 $ (39,359) $ 31,851
(1) Amounts for the years ended December 31, 2017 and 2016 have not been adjusted under the modified retrospective method of adoption of Topic 606, and are presented consistent with the prior period amounts reported under ASC 605.
17. Selected Quarterly Financial Data (unaudited)
Selected quarterly financial data for years ended December 31, 2018 and 2017 follows (in thousands, except per share data):
Quarter EndedMarch 31, June 30, September 30, December 31,
2018 2018 2018 2018 (1)
Net sales $ 101,215 $ 99,226 $ 104,836 $ 114,791Gross margin 64,461 63,143 65,633 65,346Net income 12,926 8,485 5,711 2,083Earnings per share (2):
Basic $ 0.24 $ 0.15 $ 0.10 $ 0.04Diluted $ 0.24 $ 0.15 $ 0.10 $ 0.03
Quarter Ended March 31, June 30, September 30, December 31,
2017 2017 2017 2017Net sales (3) $ 79,242 $ 79,643 $ 90,262 $ 94,651Gross margin 48,670 45,637 49,765 63,016Net income (loss) (3) 4,580 2,276 422 (2,071)Earnings (loss) per share (2) (3):
Basic $ 0.09 $ 0.04 $ 0.01 $ (0.04)Diluted $ 0.09 $ 0.04 $ 0.01 $ (0.04)
(1) Results of operations for the three months ended December 31, 2018 included out of period adjustments related to prior quarterly periods in 2018 and 2017. The aggregate out of period adjustment was approximately $1.8 million, reflecting a $0.9 million decrease to net sales, a $1.3 million increase to sales, general and administrative expense, and a $0.4 million decrease to provision for income taxes. Based on our quantitative and qualitative analysis, we do not

AXON ENTERPRISE, INC.NOTES TO CONSOLIDATED FINANCIAL STATEMENTS – (Continued)
92
consider the out of period impact to be material to our financial position or results of operations for any prior periods or for the quarter or year ended December 31, 2018.
(2) Basic and diluted earnings per share are computed independently for each of the quarters presented. Therefore, the sum of quarterly basic and diluted per share information may not equal annual basic and diluted earnings per share.
(3) Amounts for 2017 have not been adjusted under the modified retrospective method of adoption of Topic 606, and are presented consistent with the prior period amounts reported under ASC 605.
18. Supplemental Disclosure to Cash Flows
Supplemental non-cash and other cash flow information were as follows as of and for the years ended December 31 (in thousands):
2018 2017 2016
Supplemental disclosures:Cash and cash equivalents $ 349,462 $ 75,105 $ 40,651Restricted cash $ 1,565 $ 3,333 $ 3,317Total cash, cash equivalents and restricted cash shown in thestatements of cash flows $ 351,027 $ 78,438 $ 43,968
Cash paid for income taxes, net of refunds $ 10,609 $ 11,487 $ 14,048
Non-cash transactions:Contingent consideration related to business combinations $ — $ 1,007 $ 3,325Property and equipment purchases in accounts payable 501 133 82Non-cash purchase consideration related to businesscombinations 12,508 — —Purchase of assets under capital lease obligations — — 134

93
REPORT OF INDEPENDENT REGISTERED PUBLIC ACCOUNTING FIRM
Board of Directors and StockholdersAxon Enterprise, Inc.
Opinion on the financial statements We have audited the accompanying consolidated balance sheets of Axon Enterprise, Inc. (a Delaware corporation) and subsidiaries (the “Company”) as of December 31, 2018 and 2017, the related consolidated statements of operations and comprehensive income, stockholders’ equity, and cash flows for each of the three years in the period ended December 31, 2018, and the related notes and financial statement schedule included under Item 15(a) (collectively referred to as the “financial statements”). In our opinion, the financial statements present fairly, in all material respects, the financial position of the Company as of December 31, 2018 and 2017, and the results of its operations and its cash flows for each of the three years in the period ended December 31, 2018, in conformity with accounting principles generally accepted in the United States of America.
We also have audited, in accordance with the standards of the Public Company Accounting Oversight Board (United States) (“PCAOB”), the Company’s internal control over financial reporting as of December 31, 2018, based on criteria established in the 2013 Internal Control-Integrated Framework issued by the Committee of Sponsoring Organizations of the Treadway Commission (“COSO”), and our report dated February 27, 2019 expressed an unqualified opinion.
Change in accounting principleAs discussed in Note 2 to the consolidated financial statements, in the first quarter of 2018, the Company changed its method of accounting for revenue due to the adoption of Accounting Standards Codification Topic 606, Revenue from Contracts with Customers.
Basis for opinion These financial statements are the responsibility of the Company’s management. Our responsibility is to express an opinion on the Company’s financial statements based on our audits. We are a public accounting firm registered with the PCAOB and are required to be independent with respect to the Company in accordance with the U.S. federal securities laws and the applicable rules and regulations of the Securities and Exchange Commission and the PCAOB.
We conducted our audits in accordance with the standards of the PCAOB. Those standards require that we plan and perform the audit to obtain reasonable assurance about whether the financial statements are free of material misstatement, whether due to error or fraud. Our audits included performing procedures to assess the risks of material misstatement of the financial statements, whether due to error or fraud, and performing procedures that respond to those risks. Such procedures included examining, on a test basis, evidence supporting the amounts and disclosures in the financial statements. Our audits also included evaluating the accounting principles used and significant estimates made by management, as well as evaluating the overall presentation of the financial statements. We believe that our audits provide a reasonable basis for our opinion.
/s/ GRANT THORNTON LLP
We have served as the Company’s auditor since 2005.
Phoenix, ArizonaFebruary 27, 2019
94
Item 9. Changes in and Disagreements With Accountants on Accounting and Financial Disclosure
None.
Item 9A. Controls and Procedures
Attached as exhibits to this Form 10-K are certifications of the Chief Executive Officer (as the principal executive officer) and Chief Financial Officer (as the principal financial and accounting officer), which are required in accordance with Rule 13a-14 of the Exchange Act. This “Controls and Procedures” section includes information concerning the controls and controls evaluation referred to in the certifications. This section should be read in conjunction with the certifications and the Grant Thornton LLP attestation report for a more complete understanding of the topics presented. Grant Thornton LLP has independently assessed the effectiveness of our internal control over financial reporting and its report is included below.
Evaluation of Disclosure Controls and Procedures
Our Chief Executive Officer and Chief Financial Officer are responsible for the evaluation of the effectiveness of our disclosure controls and procedures (as defined in Rules 13a-15(e) under the Exchange Act) as of the end of the period covered by this Annual Report on Form 10-K. Our disclosure controls and procedures are designed to ensure that information we are required to disclose in reports that we file or submit under the Exchange Act is (i) recorded, processed, summarized and reported within the time periods specified in the SEC’s rules and forms and (ii) accumulated and communicated to our management, including our Chief Executive Officer and Chief Financial Officer, as appropriate to allow timely decisions regarding required disclosure. Based on this evaluation, our Chief Executive Officer and our Chief Financial Officer have concluded that as of December 31, 2018 our disclosure controls and procedures were effective to ensure that information we are required to disclose in reports that we file or submit under the Exchange Act (i) is recorded, processed, summarized and reported within the time periods specified in SEC rules and forms, and (ii) is accumulated and communicated to our management, including our Chief Executive Officer and our Chief Financial Officer, as appropriate to allow timely decisions regarding required disclosure.
Management Report on Internal Control over Financial Reporting
Management is responsible for establishing and maintaining adequate internal control over financial reporting (as defined in Rule 13a-15(f) under the Exchange Act). Management has assessed the effectiveness of our internal control over financial reporting as of December 31, 2018 based on criteria set forth in Internal Control - Integrated Framework issued by the Committee of Sponsoring Organizations of the Treadway Commission (2013 framework). As a result of this assessment, management concluded that, as of December 31, 2018, our internal control over financial reporting was effective in providing reasonable assurance regarding the reliability of financial reporting and the preparation of financial statements for external purposes in accordance with generally accepted accounting principles. Grant Thornton LLP has independently assessed the effectiveness of our internal control over financial reporting and its report is included below.
In accordance with guidance issued by the SEC, companies are permitted to exclude acquisitions from their assessment of internal control over financial reporting for the fiscal year in which the acquisition occurred. Our management’s evaluation of internal control over financial reporting excluded the internal control activities of VIEVU, which we acquired in May 2018 as discussed in Note 15 to our consolidated financial statements. We have included the financial results of VIEVU in the consolidated financial statements from the date of acquisition. Total revenue excluded from our assessment of internal control over financial reporting represented approximately 2% of our consolidated total revenue in 2018. Total VIEVU assets excluded from our assessment of internal control over financial reporting represented approximately 3% of our consolidated total assets as of December 31, 2018.
Remediation of Prior Period Material Weakness
Management previously identified and disclosed in our Annual Report on Form 10-K for the year ended December 31, 2017, as well as in our Quarterly Reports on Form 10-Q for each interim period in fiscal 2018, a material weakness

95
in our internal control over financial reporting. Specifically, during the fourth quarter of 2017, management identified a material weakness related to account reconciliations and monitoring over our U.K. subsidiary, Axon Public Safety U.K. Ltd. ("APS UK"), which resulted from a breakdown in the operation of identified preventative and detective controls which led to us not initially recording some transactions correctly during 2016 and the interim periods in 2017.
To remediate the material weakness described above, management implemented a plan to design new controls and enhance the design of existing controls and procedures. Specifically:
• on June 1, 2018, management completed the migration of APS UK onto the same ERP and global set of controls as other locations, which subjects APS UK activity to those processes and controls by the same corporate accounting team in Scottsdale, Arizona that perform the accounting activities for other locations; and
• management transitioned all accounting reconciliation and review procedures and controls to the corporate accounting team.
Changes in Internal Control over Financial Reporting
Except as noted above, there was no change in our internal control over financial reporting during the fiscal quarter ended December 31, 2018, that has materially affected, or is reasonably likely to materially affect, our internal control over financial reporting.

96
REPORT OF INDEPENDENT REGISTERED PUBLIC ACCOUNTING FIRM
Board of Directors and StockholdersAxon Enterprise, Inc.
Opinion on internal control over financial reportingWe have audited the internal control over financial reporting of Axon Enterprise, Inc. (a Delaware corporation) and subsidiaries (the “Company”) as of December 31, 2018, based on criteria established in the 2013 Internal Control-Integrated Framework issued by the Committee of Sponsoring Organizations of the Treadway Commission (“COSO”). In our opinion, the Company maintained, in all material respects, effective internal control over financial reporting as of December 31, 2018, based on criteria established in the 2013 Internal Control-Integrated Framework issued by COSO.
We also have audited, in accordance with the standards of the Public Company Accounting Oversight Board (United States) (“PCAOB”), the consolidated financial statements of the Company as of and for the year ended December 31, 2018, and our report dated February 27, 2019 expressed an unqualified opinion on those financial statements.
Basis for opinionThe Company’s management is responsible for maintaining effective internal control over financial reporting and for its assessment of the effectiveness of internal control over financial reporting, included in the accompanying Management Report on Internal Control over Financial Reporting (“Management’s Report”). Our responsibility is to express an opinion on the Company’s internal control over financial reporting based on our audit. We are a public accounting firm registered with the PCAOB and are required to be independent with respect to the Company in accordance with the U.S. federal securities laws and the applicable rules and regulations of the Securities and Exchange Commission and the PCAOB.
We conducted our audit in accordance with the standards of the PCAOB. Those standards require that we plan and perform the audit to obtain reasonable assurance about whether effective internal control over financial reporting was maintained in all material respects. Our audit included obtaining an understanding of internal control over financial reporting, assessing the risk that a material weakness exists, testing and evaluating the design and operating effectiveness of internal control based on the assessed risk, and performing such other procedures as we considered necessary in the circumstances. We believe that our audit provides a reasonable basis for our opinion.
Our audit of, and opinion on, the Company’s internal control over financial reporting does not include the internal control over financial reporting of VIEVU, a wholly-owned subsidiary, whose financial statements reflect total assets and revenues constituting 3 percent and 2 percent, respectively, of the related consolidated financial statement amounts as of and for the year ended December 31, 2018. As indicated in Management’s Report, VIEVU was acquired during 2018. Management’s assertion on the effectiveness of the Company’s internal control over financial reporting excluded internal control over financial reporting of VIEVU.
Definition and limitations of internal control over financial reportingA company’s internal control over financial reporting is a process designed to provide reasonable assurance regarding the reliability of financial reporting and the preparation of financial statements for external purposes in accordance with generally accepted accounting principles. A company’s internal control over financial reporting includes those policies and procedures that (1) pertain to the maintenance of records that, in reasonable detail, accurately and fairly reflect the transactions and dispositions of the assets of the company; (2) provide reasonable assurance that transactions are recorded as necessary to permit preparation of financial statements in accordance with generally accepted accounting principles, and that receipts and expenditures of the company are being made only in accordance with authorizations of management and directors of the company; and (3) provide reasonable assurance regarding prevention or timely detection of unauthorized acquisition, use, or disposition of the company’s assets that could have a material effect on the financial statements.

97
Because of its inherent limitations, internal control over financial reporting may not prevent or detect misstatements. Also, projections of any evaluation of effectiveness to future periods are subject to the risk that controls may become inadequate because of changes in conditions, or that the degree of compliance with the policies or procedures may deteriorate.
/s/ GRANT THORNTON LLP
Phoenix, ArizonaFebruary 27, 2019
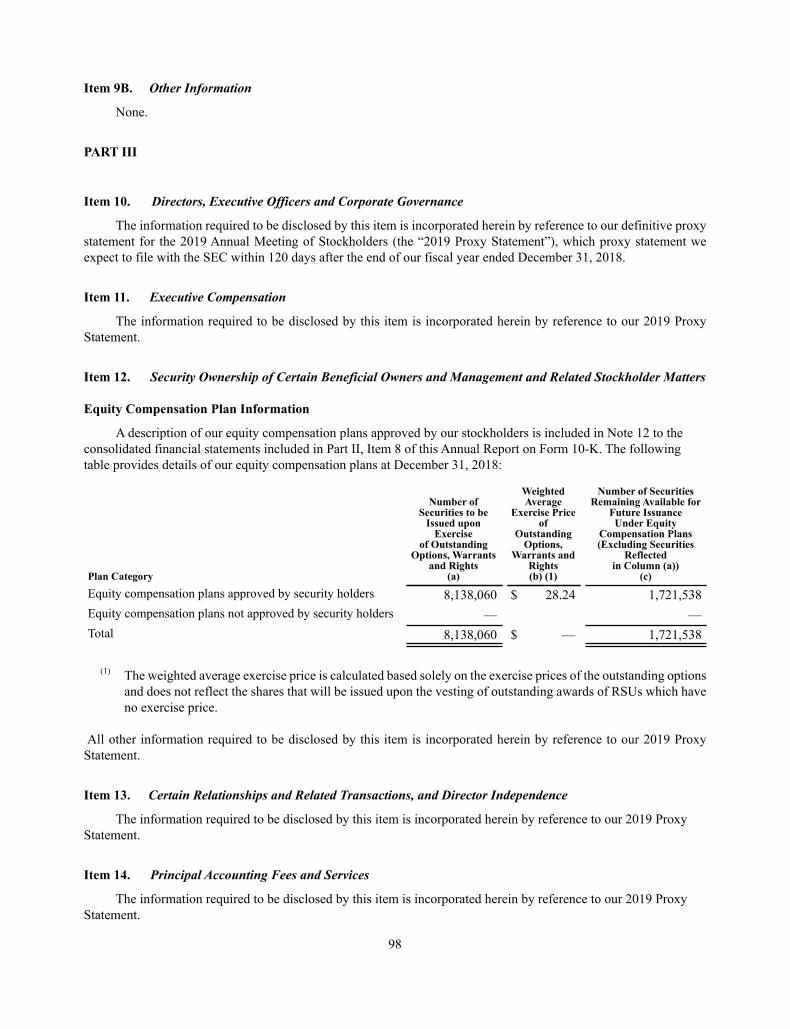
98
Item 9B. Other Information
None.
PART III
Item 10. Directors, Executive Officers and Corporate Governance
The information required to be disclosed by this item is incorporated herein by reference to our definitive proxy statement for the 2019 Annual Meeting of Stockholders (the “2019 Proxy Statement”), which proxy statement we expect to file with the SEC within 120 days after the end of our fiscal year ended December 31, 2018.
Item 11. Executive Compensation
The information required to be disclosed by this item is incorporated herein by reference to our 2019 Proxy Statement.
Item 12. Security Ownership of Certain Beneficial Owners and Management and Related Stockholder Matters
Equity Compensation Plan Information
A description of our equity compensation plans approved by our stockholders is included in Note 12 to the consolidated financial statements included in Part II, Item 8 of this Annual Report on Form 10-K. The following table provides details of our equity compensation plans at December 31, 2018:
Plan Category
Number of Securities to be
Issued upon Exercise
of Outstanding Options, Warrants
and Rights(a)
Weighted Average
Exercise Price of
Outstanding Options,
Warrants and Rights(b) (1)
Number of SecuritiesRemaining Available for
Future Issuance Under Equity
Compensation Plans (Excluding Securities
Reflectedin Column (a))
(c)
Equity compensation plans approved by security holders 8,138,060 $ 28.24 1,721,538Equity compensation plans not approved by security holders — —Total 8,138,060 $ — 1,721,538
(1) The weighted average exercise price is calculated based solely on the exercise prices of the outstanding options
and does not reflect the shares that will be issued upon the vesting of outstanding awards of RSUs which have no exercise price.
All other information required to be disclosed by this item is incorporated herein by reference to our 2019 Proxy Statement.
Item 13. Certain Relationships and Related Transactions, and Director Independence
The information required to be disclosed by this item is incorporated herein by reference to our 2019 Proxy Statement.
Item 14. Principal Accounting Fees and Services
The information required to be disclosed by this item is incorporated herein by reference to our 2019 Proxy Statement.

99
PART IV
Item 15. Exhibits, Financial Statement Schedules
(a) The following documents are filed as part of this report:
1. Consolidated financial statements: All consolidated financial statements as set forth under Part II, Item 8 of this report.
2. Supplementary Financial Statement Schedules: Schedule II — Valuation and Qualifying Accounts
Other schedules have not been included because they are not applicable or because the information is included elsewhere in this report.
SCHEDULE II – VALUATION AND QUALIFYING ACCOUNTS (Dollars in thousands)
Description
Balance atBeginningof Period
Charged toCosts andExpenses
Charged toOther
Accounts Deductions
Balance atEnd ofPeriod
Allowance for doubtful accounts:Year ended December 31, 2018 $ 729 $ 1,189 $ — $ (36) $ 1,882Year ended December 31, 2017 443 592 — (306) 729Year ended December 31, 2016 322 205 — (84) 443
3. Exhibits:
ExhibitNumber Description3.1
Complete copy of the Certificate of Incorporation, as amended consisting of (i) Certificate of Incorporation filed January 5, 2001, (ii) Certificate of Amendment filed April 20, 2001, (iii) Certificate of Amendment filed December 31, 2004, and (iv) Certificate of Amendment filed April 4, 2017 (incorporated by reference to Exhibit 3.5 to the Quarterly Report on Form 10-Q, filed May 10, 2018)
3.2** Bylaws, as amended, consisting of Bylaws adopted January 6, 2001, amended April 10, 2001, January 17, 2016, April 5, 2017, and December 13, 2018.
4.1 Form of Common Stock Certificate (incorporated by reference to Exhibit 4.2 to Registration Statement on Form SB-2, effective May 11, 2001 (Registration No. 333-55658))
10.1* Form of Indemnification Agreement between the Company and its directors (incorporated by reference to Exhibit 10.4 to Registration Statement on Form SB-2, effective May 11, 2001 (Registration No. 333-55658))
10.2* Form of Indemnification Agreement between the Company and its officers (incorporated by reference to Exhibit 10.15 to Registration Statement on Form SB-2, effective May 11, 2001 (Registration No. 333-55658))
10.3* 2001 Stock Option Plan (incorporated by reference to Exhibit 10.7 to Registration Statement on Form SB-2, effective May 11, 2001 (Registration No. 333-55658))
10.4* 2004 Outside Director Stock Option Plan, as amended (incorporated by reference to Exhibit 10.16 to the Annual Report on Form 10-KSB, filed March 31, 2005)
10.5* 2009 Stock Incentive Plan (incorporated by reference to Appendix A to 2009 Proxy Statement, filed April 15, 2009)
10.6* 2013 Stock Incentive Plan (incorporated by reference to Appendix of 2013 Proxy Statement, filed on April 3, 2013)

100
ExhibitNumber Description10.7*
TASER International, Inc. Deferred Compensation Plan (incorporated by reference to Exhibit 10.1 to Form 8-K, filed on July 12, 2013)
10.8* 2016 Stock Incentive Plan (incorporated by reference to Annex B of 2016 Proxy Statement, filed on April 15, 2016)
10.9* Executive Employment Agreement with Jawad A. Ahsan, dated March 20, 201710.10* Executive Employment Agreement with Patrick W. Smith, dated December 1, 2017 (incorporated by reference
to Exhibit 10.1 to the Current Report on Form 8-K, filed December 4, 2017)10.11* Executive Employment Agreement with Luke S. Larson, dated December 1, 2017 (incorporated by reference to
Exhibit 10.2 to the Current Report on Form 8-K, filed December 4, 2017)10.12* Executive Employment Agreement with Douglas E. Klint, dated December 1, 2017 (incorporated by reference
to Exhibit 10.3 to the Current Report on Form 8-K, filed December 4, 2017)10.13* Executive Employment Agreement with Joshua M. Isner, dated December 1, 2017 (incorporated by reference to
Exhibit 10.4 to the Current Report on Form 8-K, filed December 4, 2017)10.14* Axon Enterprise, Inc. 2018 Stock Incentive Plan (incorporated by reference to Annex B of the Company's definitive
Proxy Statement on Schedule 14A filed on April 13, 2018)10.15* CEO Performance Award (incorporated by reference to Annex A of the Company's definitive Proxy Statement
on Schedule 14A filed on April 13, 2018)10.16**^ Purchase and Sale Agreement between Axon Enterprise Holding Company and Apex Park at Pima, L.L.C.*10.17 Amended and Restated Credit Agreement dated December 31, 2018 between the Company and JP Morgan Chase
Bank, N.A. (incorporated by reference to Exhibit 10.1 to the Current Report on Form 8-K, dated January 7, 2019)10.18* Axon Enterprise, Inc. 2019 Stock Incentive Plan (incorporated by reference to Annex A of the Company's definitive
Proxy Statement on Schedule 14A filed on December 31, 2018)10.19* Axon Enterprise, Inc. 2019 Stock Incentive Plan Exponential Stock Unit Grant Notice (incorporated by reference
to Annex B of the Company’s definitive Proxy Statement on Schedule 14A filed on December 31, 2018)21.1** List of Subsidiaries23.1** Consent of Grant Thornton, LLP, independent registered public accounting firm24.1** Powers of attorney (see signature page)31.1** Principal Executive Officer Certification pursuant to Rule 13a-14(a) or Rule 15d-14(a)31.2** Principal Financial Officer Certification pursuant to Rule 13a-14(a) or Rule 15d-14(a)32***
Principal Executive Officer and Principal Financial Officer Certification pursuant to 18 U.S.C. Section 1350 as adopted pursuant to Section 906 of the Sarbanes-Oxley Act of 2002
101.INS** XBRL Instance Document101.SCH** XBRL Taxonomy Extension Schema Document101.CAL** XBRL Taxonomy Calculation Linkbase Document101.LAB** XBRL Taxonomy Label Linkbase Document101.PRE** XBRL Taxonomy Presentation Linkbase Document
* Management contract or compensatory plan or arrangement** Filed herewith*** Furnished herewith^ Confidential treatment was requested with respect to omitted portions of this Exhibit, which portions have
been filed separately with the U.S. Securities and Exchange Commission.
Item 16. Form 10-K Summary
Not applicable.
101
SIGNATURES
Pursuant to the requirements of Section 13 or 15(d) of the Securities Exchange Act of 1934, the registrant has duly caused this report to be signed on its behalf by the undersigned, thereunto duly authorized.
AXON ENTERPRISE, INC.
Date: February 27, 2019 By: /s/ PATRICK W. SMITH
Chief Executive Officer, Director(Principal Executive Officer)
Date: February 27, 2019 By: /s/ JAWAD A. AHSAN Chief Financial Officer (Principal Financial and Accounting Officer)

102
POWER OF ATTORNEY
KNOW ALL PERSONS BY THESE PRESENTS, that each person whose signature appears below constitutes and appoints Patrick W. Smith his or her true and lawful attorney-in-fact and agent, with full power of substitution and resubstitution, for him or her in any and all capacities, to sign any amendments to this Annual Report on Form 10-K, and to file the same, with exhibits thereto and other documents in connection therewith, with the Securities and Exchange Commission, hereby ratifying and confirming all that each of said attorneys-in-fact, or his substitute or substitutes, may do or cause to be done by virtue hereof.
Pursuant to the requirements of the Securities Exchange Act of 1934, this report has been signed by the following persons on behalf of the registrant and in the capacities and on the dates indicated.
Signature Title Date
Chief Executive Officer, Director/s/ PATRICK W. SMITH (Principal Executive Officer) February 27, 2019Patrick W. Smith
Chief Financial Officer/s/ JAWAD A. AHSAN (Principal Financial and Accounting Officer) February 27, 2019Jawad A. Ahsan
/s/ MICHAEL GARNREITER Director February 27, 2019Michael Garnreiter
/s/ HADI PARTOVI Director February 27, 2019Hadi Partovi
/s/ MARK W. KROLL Director February 27, 2019Mark W. Kroll
/s/ RICHARD H. CARMONA Director February 27, 2019Richard H. Carmona
/s/ BRET S. TAYLOR Director February 27, 2019Bret S. Taylor
/s/ MATTHEW R. MCBRADY Director February 27, 2019Matthew R. McBrady
/s/ JULIE A. CULLIVAN Director February 27, 2019Julie A. Cullivan

This Page Intentionally Left Blank

This Page Intentionally Left Blank

This Page Intentionally Left Blank

