azerbaijan 2021 energy policy review
TRANSCRIPT

Energy Policy ReviewAzerbaijan 2021
Co-funded bythe European Union

Energy Policy ReviewAzerbaijan 2021
Co-funded bythe European Union

The IEA examines the full spectrum of energy issues including oil, gas and coal supply and demand, renewable energy technologies, electricity markets, energy efficiency, access to energy, demand side management and much more. Through its work, the IEA advocates policies that will enhance the reliability, affordability and sustainability of energy in its 30 member countries, 8 association countries and beyond.
Please note that this publication is subject to specific restrictions that limit its use and distribution. The terms and conditions are available online at www.iea.org/t&c/
Source: IEA. All rights reserved.International Energy Agency Website: www.iea.org
IEA member countries:
Australia Austria BelgiumCanadaCzech Republic DenmarkEstoniaFinland France Germany Greece HungaryIreland ItalyJapanKorea Luxembourg Mexico Netherlands New Zealand NorwayPoland Portugal Slovak Republic Spain Sweden Switzerland Turkey United Kingdom United States
The European Commission also participates in the work of the IEA
IEA association countries:
BrazilChinaIndiaIndonesiaMoroccoSingaporeSouth AfricaThailand
INTERNATIONAL ENERGYAGENCY

3
FOR
EWO
RD
Foreword
The International Energy Agency (IEA) has been conducting in-depth peer reviews of the energy policies of its member countries – and of other countries – since 1976, and it recently modernised these reviews to focus on some of the countries’ key energy transition and security challenges.
Azerbaijan is one of the focus countries of the EU4Energy programme, which is carried out by the IEA and the European Union along with the Energy Community Secretariat and the Energy Charter Secretariat. The other EU4Energy focus countries are Armenia, Belarus, Georgia, Kazakhstan, Kyrgyzstan, Moldova, Tajikistan, Turkmenistan, Ukraine and Uzbekistan. The programme is designed to support the goals and aspirations of the 11 focus countries to implement sustainable energy policies and foster co-operative energy sector development at the regional level. As part of this programme, the IEA conducts in-depth reviews of each focus country.
Azerbaijan’s oil and gas production continues to support the country’s economy and energy supply and provide most of its exports and government revenue. However, many major oil and gas importing countries have recently pledged to reduce greenhouse gas emissions to net zero by mid-century, adding an extra element of uncertainty to the long-term economic outlook for countries like Azerbaijan that are heavily dependent on hydrocarbon exports.
To help Azerbaijan respond to its energy sector challenges, this report proposes several ways it can make both its energy supply and consumption more efficient and diverse. The review recommends that Azerbaijan transition gradually from its current system – which is government-owned and -operated, vertically integrated, and subsidised – to competitive markets with significant private sector participation and cost-covering energy prices. The withdrawal of subsidies should, however, be accompanied by support measures for the country’s economically vulnerable citizens. Such a transition would attract new market entrants and new investments, including to develop Azerbaijan’s significant solar and wind energy resources. These measures would also help limit greenhouse gas emissions.
This in-depth review aims to guide Azerbaijan in its energy sector reforms and help it achieve its energy policy goals of making the most of its abundant resources and providing affordable, secure and clean energy to its population.
IEA
. All
right
s re
serv
ed.

5
TABL
E O
F C
ON
TEN
TS
ENERGY INSIGHTS
Foreword ..............................................................................................................................3
1. Executive summary .....................................................................................................11
Scaling down the long-term importance of oil and gas .....................................................11
A path to a more efficient, dynamic and sustainable energy system ................................12
Gas and electricity market reform .....................................................................................13
Securing larger electricity supplies ....................................................................................15
Using energy more efficiently ............................................................................................15
Energy research, development and innovation merit additional effort ..............................16
Further energy data improvements ...................................................................................17
Key recommendations .......................................................................................................17
2. General energy policy .................................................................................................19
Country overview ...............................................................................................................19
Energy supply and demand ...............................................................................................21
Energy production and domestic supply ...........................................................................22
Energy consumption ..........................................................................................................23
Energy sector governance ................................................................................................25
Key policies and reform efforts ..........................................................................................27
Energy statistics ................................................................................................................30
Assessment .......................................................................................................................31
Recommendations .............................................................................................................33
ENERGY SECURITY
3. Oil and natural gas ......................................................................................................35
Overview ............................................................................................................................35
Supply ................................................................................................................................36
Exploration and production ................................................................................................39
Trade .................................................................................................................................44
IEA
. All
right
s re
serv
ed.

TABLE OF CONTENTS
6
State oil and gas revenue ..................................................................................................51
Demand .............................................................................................................................52
Regulation ..........................................................................................................................54
Domestic operations and infrastructure ............................................................................57
Security of supply ..............................................................................................................61
Assessment .......................................................................................................................61
Recommendations .............................................................................................................65
4. Electricity......................................................................................................................69
Overview ............................................................................................................................69
Supply and demand ...........................................................................................................69
Electricity sector structure and reform ...............................................................................75
Networks ............................................................................................................................78
Prices and tariffs ................................................................................................................80
Security of supply ..............................................................................................................82
Assessment .......................................................................................................................84
Recommendations .............................................................................................................88
5. District heating ............................................................................................................91
Overview ............................................................................................................................91
Supply and demand ...........................................................................................................91
Regulation and prices ........................................................................................................92
Modernising DH infrastructure ...........................................................................................94
Assessment .......................................................................................................................95
Recommendations .............................................................................................................97
ENERGY SYSTEM TRANSFORMATION
6. Energy and climate change ........................................................................................99
Overview ............................................................................................................................99
CO2 emissions from fuel combustion ............................................................................. 100
Institutions ....................................................................................................................... 103
IEA
. All
right
s re
serv
ed.

TABLE OF CONTENTS
7
TABL
E O
F C
ON
TEN
TS Policy .............................................................................................................................. 103
Local air pollution ............................................................................................................ 107
Assessment .................................................................................................................... 107
Recommendations .......................................................................................................... 109
7. Energy efficiency ...................................................................................................... 111
Overview ......................................................................................................................... 111
Trends by sector ............................................................................................................. 113
Policies and measures ................................................................................................... 118
Assessment .................................................................................................................... 122
Recommendations .......................................................................................................... 126
8. Renewable energy .................................................................................................... 129
Overview ......................................................................................................................... 129
Supply ............................................................................................................................. 129
Renewable energy potential ........................................................................................... 133
Institutions ....................................................................................................................... 136
Policies and measures ................................................................................................... 136
Assessment .................................................................................................................... 138
Recommendations .......................................................................................................... 142
9. Energy research, development and demonstration ............................................. 145
Overview ......................................................................................................................... 145
Funding ........................................................................................................................... 145
Energy research institutions ........................................................................................... 145
Energy technology innovation ........................................................................................ 146
Assessment .................................................................................................................... 147
Recommendations .......................................................................................................... 148
ANNEXES
ANNEX A: Organisation of the review ............................................................................ 151
ANNEX B: Energy balances and key statistical data ..................................................... 154
IEA
. All
right
s re
serv
ed.

TABLE OF CONTENTS
8
ANNEX C: International Energy Agency Shared Goals ................................................. 158
ANNEX D: Acronyms, abbreviations and units of measure ........................................... 160
LIST OF FIGURES, TABLES AND BOXES
Figures Map of Azerbaijan .......................................................................................20 Energy production, supply and consumption by fuel and sector, 2019 .....21 Primary energy production by source, 2000-2019 .....................................22 Total energy supply by source, 2000-2019 ................................................22 Breakdown of TES by source in selected countries, 2018 ........................23 Total final consumption by sector, 2000-2019 ...........................................24 Total final consumption by source and sector, 2019 ..................................24
Figure 3.1 Crude oil and NGL production, 2000-2019 ................................................42 Figure 3.2 Natural gas production, 2000-2019 ............................................................43 Figure 3.3 Crude oil and condensate exports by country, 2005-2019 ........................45 Figure 3.4 Oil product net trade by country, 2005-2019 ..............................................46 Figure 3.5 Oil product net trade by category, 2005-2019 ............................................46 Figure 3.6 Azerbaijan’s oil and gas infrastructure .......................................................50 Figure 3.7 Oil supply by sector, 2000-2019 .................................................................52 Figure 3.8 Natural gas supply by sector, 2000-2019 ...................................................53 Figure 3.9 Natural gas prices for households in selected countries, 2019 .................56 Figure 4.1 Azerbaijan’s electricity supply and consumption, 2000-2019 ....................70 Figure 4.2 Breakdown of electricity generation by source, 2019 ................................71 Figure 4.3 Electricity generation by source, 2000-2019 ..............................................71 Figure 4.4 Breakdown of electricity generation by source in selected countries, .......... 2019 ............................................................................................................72 Figure 4.5 Azerbaijan’s electricity trade by country, 2000-2019 .................................74 Figure 4.6 Electricity consumption by sector, 2007-2019............................................75 Figure 4.7 Azerbaijan’s monthly electricity generation, January 2015-January 2020 .75 Figure 4.8 Electricity sector structure ..........................................................................76 Figure 4.9 Residential electricity prices in Azerbaijan and selected countries, 2019 .82 Figure 5.1 District heat generation by source, 2007-2019 ..........................................92 Figure 5.2 District heat consumption by sector, 2007-2019 ........................................92 Figure 6.1 Greenhouse gas emissions by sector, 1990-2018 .................................. 100 Figure 6.2 CO2 emissions from fuel combustion by sector, 1990-2019 ................... 100 Figure 6.3 Energy-related CO₂ emissions and main drivers, 2000-2019 ................. 101 Figure 6.4 CO₂ intensity in Azerbaijan and selected countries, 2019 ...................... 102 Figure 6.5 CO₂ intensity in Azerbaijan and selected countries, 2000-2018 ............. 102 Figure 6.6 CO₂ intensity of power and heat generation in Azerbaijan and .................... selected countries, 2000-2018 ................................................................ 103 Figure 7.1 Energy consumption and its drivers, 2000-2019 ..................................... 112 Figure 7.2 Final energy consumption by sector, 2000-2019 .................................... 112
IEA
. All
right
s re
serv
ed.

TABLE OF CONTENTS
9
TABL
E O
F C
ON
TEN
TS Figure 7.3 TFC per capita in Azerbaijan and selected countries, 2018* .................. 113
Figure 7.4 TFC in the residential sector by source, 2008-2019 ............................... 114 Figure 7.5 TFC in transport by source, 2008-2018 .................................................. 115 Figure 7.6 TFC in industry by source, 2008-2019 .................................................... 115 Figure 7.7 TFC by manufacturing industry subsector, 2019 .................................... 116 Figure 7.8 Decomposition of energy consumption in manufacturing, 2010-2018 .... 117 Figure 7.9 TFC in the primary sector and services by source, 2008-2019 .............. 117 Figure 8.1 Renewable energy shares in Azerbaijan’s energy system, 1990-2019 .. 130 Figure 8.2 Renewable energy in Azerbaijan’s TES, 2000-2019 .............................. 130 Figure 8.3 Bioenergy supply by source and use by sector, 2019 ............................ 131 Figure 8.4 Renewable energy share of TES in Azerbaijan and selected countries, ...... 2018 ......................................................................................................... 131 Figure 8.5 Renewable energy in Azerbaijan’s electricity generation, 2000-2019 .... 132 Figure 8.6 Renewable energy in electricity generation in Azerbaijan and ..................... selected countries, 2018 .......................................................................... 132 Figure 8.7 Phases of variable renewable energy integration and their key ................... challenges ................................................................................................ 133 Figure 8.8 Solar energy potential in Azerbaijan ........................................................ 134 Figure 8.9 Wind energy potential in Azerbaijan ........................................................ 135 Tables
Azerbaijan energy subsidies, 2010-2019 (in real 2019 USD million) ............30
Azerbaijan’s initial and remaining oil and gas reserves, 2019 .......................... (in million barrels of oil equivalent) .................................................................38
Azerbaijan oil and natural gas export revenues, 2014-2019 .........................51 Natural gas tariffs in Azerbaijan .....................................................................56
Table 4.1 Table 4.1 Installed electricity generating capacity (GW) ................................73 Table 4.2 Electricity transmission network capacity, 2018 .............................................78 Table 4.3 Azerbaijan electricity tariffs, 2020 ..................................................................81
Table 7.1 Excise tax rates for passenger vehicles, 2019 ............................................ 120 Boxes Box 3.1 The status of national borders in the Caspian Sea ........................................43 Box 3.2 The Sangachal oil and gas terminal ...............................................................47 Box 3.3 SOCAR ...........................................................................................................58 Box 4.1 The July 2018 Mingachevir blackouts ............................................................83 Box 4.2 Elements of successful power market reforms ..............................................85 Box 6.1 Azerbaijan’s NDC measures to mitigate energy-related GHG emissions .. 104 Box 7.1 Key barriers to energy efficiency in Azerbaijan ........................................... 119
IEA
. All
right
s re
serv
ed.

11
ENER
GY
INSI
GH
TS
1. Executive summary Oil and gas exports continue to dominate Azerbaijan’s economy and provide the majority of government revenue. Although they are plentiful, the long-term outlook for fossil fuel resources (and therefore for government revenue) is becoming uncertain in light of recent commitments by major importing countries to achieve net-zero greenhouse gas (GHG) emissions by 2050.
This report proposes several ways to increase the efficiency of domestic energy supply and usage to respond to this challenge. In essence, it recommends that Azerbaijan transitions gradually from its current system – which is government-owned and -operated, vertically integrated and subsidised – to competitive markets with significant private sector participation and cost-covering energy prices. Of course, subsidy withdrawal would need to be accompanied by support measures for financially vulnerable citizens. Such a transition would help diversify the economy away from oil and gas exports while attracting new market entrants and new investments, including in renewable energy. These measures would also help reduce GHG emissions.
These recommendations actually support efforts that are already under way. Prompted by the oil price shock of 2014-2015, the government recently drafted several reform proposals, and many new laws are awaiting approval. Laws governing the electricity and gas sectors since the 1990s will be revised, and specific legislation on energy efficiency and renewable energy will be introduced. In addition, the country’s first specific energy strategy is nearing completion. The government has furthermore decided to diversify foreign direct investment away from oil and gas and towards infrastructure and industry, and it has already taken steps to improve Azerbaijan’s investment climate.
Scaling down the long-term importance of oil and gas Oil and natural gas bring in around 90% of Azerbaijan’s export revenues, and they finance around 60% of the government budget. They also supply 98% of primary energy and more than 90% of the country’s electricity. Oil and, more recently, gas have been largely responsible for the remarkable rise in living standards in Azerbaijan since the late 1990s.
Azerbaijan has succeeded in creating a stable upstream oil and gas investment climate and has become an important and reliable oil and gas exporter. A major achievement of international significance is the recently completed Southern Gas Corridor (SGC) that supplies gas from Azerbaijan’s Shah Deniz 2 field to Europe through Turkey. The SGC gives Azerbaijan a new source of gas export revenues while helping Europe diversify its gas supply routes and improve gas security as its domestic production continues to
IEA
. All
right
s re
serv
ed.

1. EXECUTIVE SUMMARY
12
decline. The IEA expects European gas import demand to rise by around 45 billion cubic metres per year (bcm/a) by 2025.[1] With capacity increases, the SGC could transport twice the 16 bcm/a production of the Shah Deniz 2 field, which could lead to Azerbaijan becoming a regional gas hub.
Although oil and gas will remain major sources of wealth for Azerbaijan in the short and medium terms, two factors in particular indicate a less important role for them in the long term. The first is that oil production, which dates to the mid-19th century, has been in decline since 2010. Although natural gas production, which became significant in the 2000s, continues to increase, total export revenues are falling due to lower oil production. The oil price shocks of 2014-2015 and 2020 highlighted the risks of short-term fuel price fluctuations and strengthen the case for further long-term efforts to diversify the economy.
Second, the emerging global push for clean energy will inevitably affect oil and gas demand. Several of the world’s largest energy importers (the European Union, Japan and South Korea) have recently pledged to reduce GHG emissions to net-zero by 2050, and China is aiming for the same by 2060. These targets therefore imply little demand for oil or gas without carbon capture, utilisation and storage (CCUS) three decades from now. Technology breakthroughs and policy changes may further accelerate this transition, and competition for export opportunities among producing countries may well intensify, increasing the risk of many oil and gas assets becoming stranded.
Managing the costs of new developments is crucial to Azerbaijan’s future success as an internationally competitive producer, and reducing the carbon footprint of production is also likely to be necessary. The State Oil Company of the Azerbaijan Republic (SOCAR), the country’s national oil company, is targeting to eliminate gas flaring completely in 2021 and is also successfully working to reduce methane emissions. The potential of using CCUS to enhance oil recovery and produce hydrogen from natural gas should also be studied. The IEA encourages the government to continue working closely with the leading oil and gas sector companies operating in the country to reduce sectoral emissions.
The government has recognised the need to reduce economic dependence on oil and gas exports. Efforts to modernise and increase oil refining and petrochemical production have been successful and continue to produce improvements. SOFAZ, the State Oil Fund of the Republic of Azerbaijan, could stimulate further diversification.
A path to a more efficient, dynamic and sustainable energy system It is critical to increase efficiency, attract new entrants and investments, and diversify the energy supply in Azerbaijan’s current energy system in which gas, electricity and heat are supplied by financially burdened monopolies at strongly subsidised prices. Policy responses should therefore include energy tariff reform, electricity and gas market reform, greater renewable energy use and higher energy efficiency.
[1] IEA (2020), Gas 2020.
IEA
. All
right
s re
serv
ed.

1. EXECUTIVE SUMMARY
13
ENER
GY
INSI
GH
TS The level of energy prices is central to attract investment and encourage citizens to use
energy efficiently. As part of the country’s social policy, the government sets domestic end-user prices for electricity, natural gas and oil very low, often below the full cost of supply. The IEA estimates that in 2019, Azerbaijan’s implied subsidies for oil, natural gas and decline.
The tariff system includes cross-subsidies between consumer groups and energy carriers as well as direct subsidies from the state budget. The low price of natural gas in particular creates distortions. For example, it discourages the use of renewable energy for electricity production and, as it favours individual gas boilers for space heating, it inhibits the use of potentially more efficient system solutions such as district heating and cooling, electricity and heat pumps. Low oil prices meanwhile encourage the use of large, inefficient cars that are often acquired second-hand, and the effects of this may intensify as car ownership becomes more common.
Subsidised tariffs do not encourage residential and industrial consumers to use energy more efficiently, even though it would make economic sense for the country as a whole. Tariff reform should therefore be central to Azerbaijan’s energy sector reform efforts. The oil and gas saved through improved efficiency or through substitution by renewable energy could be exported at much higher prices or turned into higher-value-added petrochemicals. Furthermore, the GHG emissions avoided would help the country meet its Paris Agreement climate target (see below).
To reduce subsidies in the longer term, more emphasis should be placed on explaining to the public that blanket energy subsidies are a highly regressive measure that benefits mainly the well-off. These subsidies should be phased out gradually and replaced by support mechanisms that protect vulnerable groups.
Gas and electricity market reform Azerbaijan would also benefit from more dynamic, efficient and environmentally and financially sustainable electricity and gas markets. The IEA therefore strongly encourages the government to intensify efforts to unbundle monopoly operations, increase competition and attract private investment to build new infrastructure and modernise the existing system. Reforming the tariff system and phasing out gas subsidies to enable cost recovery and fair competition across all power and heat technologies is essential. To ensure that reforms are socially acceptable, this complex task requires careful action to protect vulnerable consumers. It also requires continuous education and training efforts to guarantee that enough people have the planning capabilities and skills necessary to deliver the reforms efficiently and effectively. A campaign to improve public awareness of the reasons for energy policy changes and the benefits of future reforms is also needed.
Electricity demand in Azerbaijan is set to grow in the years and decades ahead. The whole population has access to affordable electricity, and wider electrification is expected to raise demand considerably from the currently low 2 500 kilowatt hours (kWh) per capita per year. The country needs a more dynamic electricity sector, and investments in new and more efficient generating capacity and electricity grids are essential. The IEA welcomes the government’s determination to reform the electricity system and gradually move from a state-dominated, vertically integrated system to a more dynamic, efficient and environmentally sustainable one. The challenge now is to deliver it.
IEA
. All
right
s re
serv
ed.
1. EXECUTIVE SUMMARY
14
Azerbaijan’s 2016 Strategic Roadmap recognised the need for electricity reform, and several reform proposals have been drafted. These include the draft laws on electricity, on the role of the regulator in energy and public utilities, and on the use of renewable energy in electricity generation. The IEA urges the government to adopt the pending legislation and proceed to implement an ambitious electricity market reform for the benefit of the country and its economy.
The government should first focus on the issues of governance and financial viability. Tariffs and subsidies should be reformed to enable full cost recovery and encourage investments in power sector development, which should help reduce operating costs and improve generation, transmission and distribution efficiency. To enable the energy sector to allocate resources more efficiently, the IEA furthermore urges the government to reform and gradually abolish subsidies for natural gas in electricity generation. The government should also focus at the outset on setting specific policy objectives for a secure, efficient and clean electricity system. Although Azerbaijan has enough gas resources to generate all the electricity it needs for decades to come, it is also in the enviable position of having hydropower and significant solar and wind power potential. As solar and wind technology costs have declined dramatically in recent years, tapping into their potential would allow the country to save its natural gas for export at the same time as reducing domestic GHG emissions.
In this context, the IEA welcomes the government’s ambition to raise the share of renewable energy in total generating capacity from 16% in 2018 to 30% in 2030, and congratulates it on its first power purchase agreements (PPAs) for a 240-megawatt (MW) wind farm, signed in late 2020, and 230 MW of solar power capacity, signed in early 2021. When the time comes for the government to consider renewable energy targets beyond 2030, it should take account of both the economic potential of renewable energy and the scope for other policies and measures to meet energy policy goals. Cost-effectiveness should be a key criterion for choosing among policy options: for example, it may be less costly to meet longer-term energy policy goals by increasing energy efficiency than by building new generating capacity.
To meet electricity market reform objectives, policies and measures must provide for unbundling, third-party access to grids, transparent wholesale markets, and partial privatisation of monopolies. It follows that Azerenergy’s generating assets should be effectively unbundled from its transmission grid ownership and grid operations. At the same time, transmission and distribution tariffs should be separated from energy supply tariffs to enable the use of performance-based incentives, while electricity generation should be opened up to competition and wholesale and retail markets created. There is a strong case for undertaking such a broad and complex reform gradually. The first step should be to remove entry barriers for new participants and begin to institute unsubsidised cost-based economic dispatch of power plants to increase efficiency. This should be quite feasible, since – aside from autoproducers – almost all generating capacity is owned by Azerenergy.
To increase competition, some of Azerenergy’s generating assets could be privatised. The emphasis should be on privatisation as a means of increasing competition and operational efficiency rather than as an end in itself, with full privatisation unlikely to be necessary to achieve the desired goals. For example, in many European countries the state remains the majority shareholder in electricity generators that operate in competitive wholesale markets. New entrants could be entirely private or based on public-private partnerships,
IEA
. All
right
s re
serv
ed.
1. EXECUTIVE SUMMARY
15
ENER
GY
INSI
GH
TS provided that barriers to market entry are removed. An important point to consider relates
to raising the share of variable solar and wind power capacity. As the government plans to attract investment through long-term PPAs, a mechanism should be designed to integrate PPAs into the future wholesale market.
The establishment of the regulator in 2017 was a major step in electricity market reform. Since the Azerbaijan Energy Regulatory Agency (AERA) remains closely overseen by the Ministry of Energy, just like the electricity sector monopolies Azerenergy and Azerishiq, it will be essential to grant it the legal right to take binding decisions and issue recommendations. This also applies to its work in natural gas and district heating.
Securing larger electricity supplies Having an uninterrupted supply of electricity is critical for a modern society. In their efforts to ensure electricity security, many IEA member countries have found it useful to put in place a comprehensive framework, supported by laws, regulations, policies and measures that address generation, transmission, distribution and supply challenges. The IEA urges Azerbaijan to consider a similar framework approach that takes account of electricity infrastructure needs and long-term network development. The government should ensure that it has sufficient personnel qualified to carry out the tasks required under the framework. It should also organise emergency response exercises, as they have proven effective in boosting preparedness and response capability in other countries.
An electricity security framework should cover the areas of fuel security, resource adequacy, operational security and governance. Azerbaijan’s fuel supply appears secure, as the country has significant natural gas resources and is about to diversify by investing in renewable energy generation. Resource adequacy is supported both by generating capacity that is set to expand and is already able to meet twice the peak demand, and by cross-border connections. In addition, efforts to modernise networks are under way to keep up with growing network demands. The July 2018 blackouts demonstrated that several domains of operational security require improvement, as does the area of governance, including legislation, institutions and regulation. Furthermore, the electricity security framework should include targets and indicators that are regularly monitored and reviewed to measure progress and help ensure that electricity security is maintained and improved.
Using energy more efficiently As other countries with legacy infrastructure and subsidised energy prices, Azerbaijan has plenty of scope to improve its energy efficiency. The IEA strongly encourages the government to recognise that greater energy efficiency can benefit the economy, reduce pollution and create additional jobs, and to rapidly adopt the laws, strategies, policies and measures needed to realise this potential. Strong policies on energy efficiency will become increasingly relevant because more buildings will be constructed, more appliances and equipment sold, and more vehicles purchased in the years and decades ahead. A long-term approach is therefore needed to keep the country on an environmentally sustainable energy pathway.
Instead of subsidising energy use for everyone, the government should focus social policy measures on those in real need while gradually switching to more efficient energy use. As
IEA
. All
right
s re
serv
ed.
1. EXECUTIVE SUMMARY
16
part of its targeted support measures, it could, for example, launch programmes to replace the least efficient household appliances (refrigerators, washing machines, etc.) with new, highly energy-efficient models, offering subsidies for the least well-off.
As renovations to improve the energy efficiency of the existing building stock, especially residential and public buildings, would also save energy while benefitting citizen health, the case for introducing financing mechanisms for energy-efficient housing is strong. The government should also ensure that residential buildings comply with energy efficiency regulations. In many IEA countries, compliance is verified by public sector building inspectors, which is an approach Azerbaijan’s government should consider.
Experience in IEA member countries shows that minimum energy performance standards are among the most effective and cost-efficient energy efficiency policy instruments. The government should therefore introduce stringent standards across all sectors to cover buildings, vehicles, appliances and equipment. These standards should be underpinned by an effective energy efficiency audit mechanism. It should also update the standards regularly and, when applicable, accompany them with energy labelling.
Azerbaijan’s population, half of which still lives in the countryside, is expected to continue growing, urbanising and becoming wealthier. The country will thus need to build more urban infrastructure in the coming decades, including new heating systems. Space heating is currently based on individual boilers that burn subsidised gas. However, modern district heating and cooling (DHC) systems, combined with more efficient electricity generation, heat pumps, waste heat use and thermal storage, could offer a solution that is more efficient and cost-effective while reducing CO2 emissions.
As transport sector oil use more than tripled between 2000 and 2018, energy and climate considerations should be integrated into long-term transport and urban development policies so that Azerbaijan does not become locked into inefficient and energy-intensive private car-dominated urban structures. For example, if private car ownership in Azerbaijan were to increase to the current European Union (EU) average, the country’s car fleet would expand almost fourfold to five million. Expansion of the Baku metro in recent years has improved public transport availability, but further replacement of private vehicles with public transport, walking and cycling would improve air quality and reduce noise and congestion, especially in the Greater Baku area, which is home to almost half the population and half the country’s vehicles.
Tackling the rise in transport fuel demand (unrestrained by prices or taxes) and the hike in natural gas use (subsidised in all sectors) is also necessary for Azerbaijan to achieve its Paris Agreement goal of reducing net GHG emissions by 35% from 1990 to 2030. In 2018, the latest year for which data are available, net GHG emissions were 2.5% above the 2030 target. Cutting GHG emissions from oil and gas production would also reduce total GHG emissions considerably.
Energy research, development and innovation merit additional effort Energy research, development and innovation (RDI) is necessary to help Azerbaijan maintain and improve its economic competitiveness, and to enable diversification away
IEA
. All
right
s re
serv
ed.

1. EXECUTIVE SUMMARY
17
ENER
GY
INSI
GH
TS from oil and gas. For these reasons, the IEA encourages the government to step up its
energy RDI efforts significantly.
Further energy data improvements Reliable data is the basis of sound policymaking. The IEA congratulates the State Statistical Committee of the Republic of Azerbaijan (SSC) for improving energy efficiency data collection and monitoring, and it encourages the SSC to further develop national energy statistics to improve data coverage and quality and to inform policy decisions.
Key recommendations The government of Azerbaijan should:
Finalise laws and plans for which approval is pending as soon as possible, and ensure their effective implementation based on clearly designated responsibilities and accountabilities, with adequate resources.
Diversify the domestic energy mix to gradually reduce oil and gas dependence.
Institute further structural energy reforms in a phased manner to develop competitive markets based on prices that reflect the full energy supply cost, and to ensure transparent and non-discriminatory grid access; support reforms by measures that guarantee the energy regulator’s independence and capacity, and aid the most vulnerable citizens.
Take steps to increase the efficiency of energy supply and use, and incorporate energy and climate considerations into long-term urban development and transport plans to limit energy demand growth.
Develop an integrated long-term strategic plan for energy and climate change that incorporates and builds on reform measures to date, and that aims to deliver the country’s nationally determined contribution (NDC) under the Paris Agreement, including through the use of renewable energy
IEA
. All
right
s re
serv
ed.

19
ENER
GY
INSI
GH
TS
2. General energy policy
Key data (2019 provisional)
TES: 15.9 Mtoe (natural gas 65.7%, oil 32.7%, hydro 0.8%, other* 0.8%), +14.6% since 2008
TES per capita: 1.6 toe (world average 2018: 1.9 toe)
TES per unit of GDP: 110 toe/2015 USD million PPP (world average 2018: 111 toe/USD million PPP)
Energy production: 60.1 Mtoe (oil 65.3%, natural gas 34.2%, hydro 0.2%, other* 0.2%), -0.1% since 2008
* Includes bioenergy, waste, wind, solar PV and heat from heat pumps.
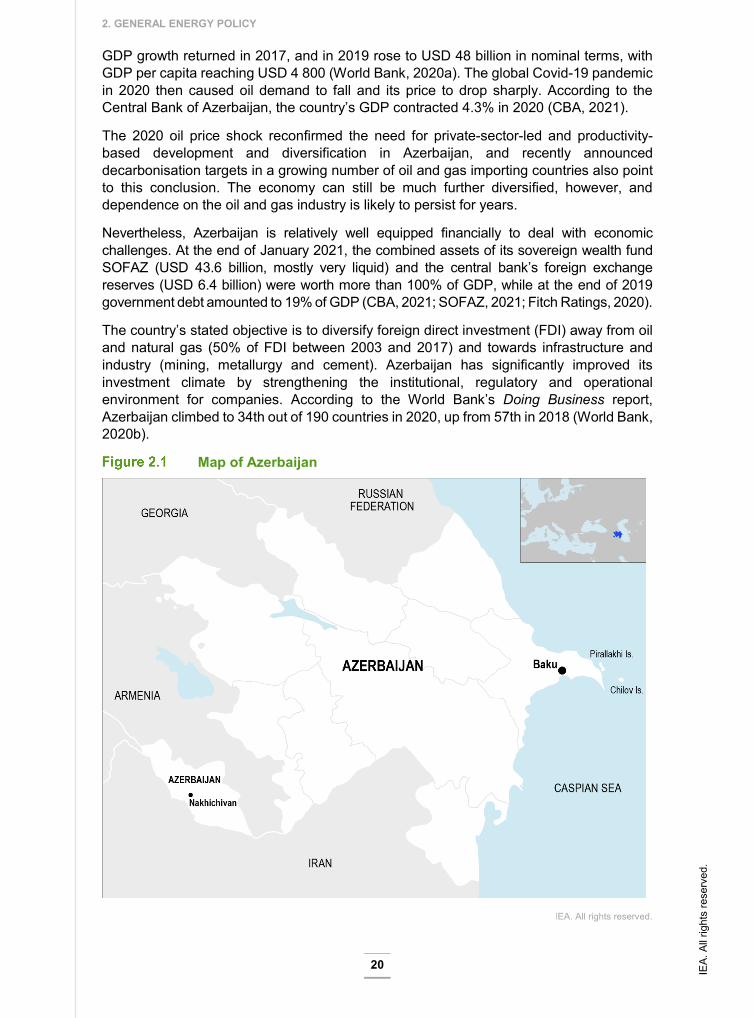
Country overview Located in the southern Caucasus region, the Republic of Azerbaijan (hereafter ‘Azerbaijan’) is bordered by the Caspian Sea to the east, Armenia and Georgia to the west, the Russian Federation (hereafter ‘Russia’) to the north and Iran to the south. The Nakhchivan Autonomous Republic, the country’s exclave on the southwestern side of Armenia, also has a short border with Turkey. Azerbaijan has an area of around 87 000 km2, and its population of 10.0 million has grown at a rate of around 0.9%/a in recent years. Baku is the country’s capital and largest city.
Azerbaijan’s economy is driven by the oil and gas sector, which accounts for around 90% of the country’s exports and 30-50% of its GDP, depending on oil prices. Export revenues from oil, and increasingly from gas, have brought Azerbaijan significant wealth and raised the country’s standard of living. Oil and gas sector dominance has led to heavier economic dependence on industry and construction (52.2% of GDP in 2018) than on services (34.8%). The dynamics of the oil and gas sector influence economic growth considerably, both through industrial activity and consumer spending linked to employment and salaries. Agriculture provides 5.2% of GDP, but still almost 40% of all jobs.
Nominal GDP grew almost ninefold to USD 75 billion from 2004 to 2014, driven by oil and gas export revenues (World Bank, 2020a). However, the global oil price collapse of 2014-2015 forced Azerbaijan to devalue its currency against the USD, and its nominal GDP in USD terms dropped by half from 2014 to 2016. The government decided to accelerate the implementation of policies to diversify the economy, and in 2016 President Ilham Aliyev approved a development policy framework to devise strategic roadmaps for the main sectors of the economy.
IEA
. All
right
s re
serv
ed.
2. GENERAL ENERGY POLICY
20
GDP growth returned in 2017, and in 2019 rose to USD 48 billion in nominal terms, with GDP per capita reaching USD 4 800 (World Bank, 2020a). The global Covid-19 pandemic in 2020 then caused oil demand to fall and its price to drop sharply. According to the Central Bank of Azerbaijan, the country’s GDP contracted 4.3% in 2020 (CBA, 2021).
The 2020 oil price shock reconfirmed the need for private-sector-led and productivity-based development and diversification in Azerbaijan, and recently announced decarbonisation targets in a growing number of oil and gas importing countries also point to this conclusion. The economy can still be much further diversified, however, and dependence on the oil and gas industry is likely to persist for years.
Nevertheless, Azerbaijan is relatively well equipped financially to deal with economic challenges. At the end of January 2021, the combined assets of its sovereign wealth fund SOFAZ (USD 43.6 billion, mostly very liquid) and the central bank’s foreign exchange reserves (USD 6.4 billion) were worth more than 100% of GDP, while at the end of 2019 government debt amounted to 19% of GDP (CBA, 2021; SOFAZ, 2021; Fitch Ratings, 2020).
The country’s stated objective is to diversify foreign direct investment (FDI) away from oil and natural gas (50% of FDI between 2003 and 2017) and towards infrastructure and industry (mining, metallurgy and cement). Azerbaijan has significantly improved its investment climate by strengthening the institutional, regulatory and operational environment for companies. According to the World Bank’s Doing Business report, Azerbaijan climbed to 34th out of 190 countries in 2020, up from 57th in 2018 (World Bank, 2020b).
Map of Azerbaijan
IEA. All rights reserved.
IEA
. All
right
s re
serv
ed.

2. GENERAL ENERGY POLICY
21
ENER
GY
INSI
GH
TS Energy supply and demand
This section offers a general overview of topics that are presented in more detail in subsequent chapters of this report.
As Azerbaijan is a major oil and natural gas producer, these two commodities dominate the country’s exports and domestic energy supply (Figure 2.2). Overall, Azerbaijan produces around four times the energy it consumes and has one of the world’s highest levels of energy self-sufficiency. In recent years, it has exported almost 90% of its oil production and over 40% of its natural gas.
Azerbaijan’s domestic energy supply (TES) is based on natural gas (66% in 2019) and oil (33% in 2019). Natural gas is used to generate most of the country’s electricity and heat (over 90% in 2019). Crude oil is refined locally to satisfy most of the nation’s oil product consumption, and local production is about to expand following a refinery upgrade that is now under way. It is noteworthy that no coal is used in the country.
The residential sector is traditionally the largest final energy consumer, responsible for 32% of final consumption (TFC) in 2019, with households consuming energy mostly in the form of natural gas (80% of total household consumption in 2019). Energy consumption in the transport sector, which has more than tripled since 2000, accounted for 26% of TFC in 2019, almost all in the form of oil (just under 99% of total transport consumption in 2019). Industry was also responsible for around 26% of TFC, with oil as its main energy source (50% of the sectoral total in 2019). Services and the primary sector together accounted for 16% of TFC in 2019, increasingly in the form of natural gas (39% of the sectoral total).
Although the government has not yet prepared long-term energy scenarios examining future supply and demand, it is expected to do so when formulating the Long-Term Development Strategy of the Energy Sector of the Republic of Azerbaijan under a presidential decree of 29 May 2019 on Acceleration of Reforms in the Energy Sector of the Republic of Azerbaijan.
Energy production, supply and consumption by fuel and sector, 2019
Oil and natural gas dominate energy production, exports and domestic supply.
* Includes international aviation and marine bunker fuel. Not included in TES. ** Includes hydro, bioenergy, waste, wind, solar PV and heat. Note: Mtoe = million tonnes of oil equivalent. TES = total energy supply. TFC = total final consumption of energy. Source: IEA (2021), World Energy Balances 2021, www.iea.org/statistics.
ResidentialCommercialTransport
Industry
Exports (net)
Bunkering, transformation and losses
0
10
20
30
40
50
60
70
Production TES TFC (by fuel) TFC (by sector)
MtoeBunker fuels*
Other**
Electricity
Natural gas
Oil
IEA 2021. All rights reserved.
IEA
. All
right
s re
serv
ed.

2. GENERAL ENERGY POLICY
22
Energy production and domestic supply Both oil and gas have a long history in Azerbaijan, but production surged to new levels in the mid-2000s when the Azeri-Chirag-Gunashli oil block, the Shah Deniz gas field and their related export infrastructure began operations (see Chapter 3). Oil production peaked in 2010, while gas production appears set to continue increasing at least until 2022-2023 (Figure 2.3). Overall, total energy production in 2019 was almost three times higher than in 2000, at 60.1 million tonnes of oil equivalent (Mtoe).
Primary energy production by source, 2000-2019
Azerbaijan’s oil and gas production began to surge in the mid-2000s.
* Includes hydro, bioenergy and waste, wind, solar PV and heat pumps; not visible at this scale Source: IEA (2020), World Energy Balances 2020, www.iea.org/statistics.
Total energy supply by source, 2000-2019
Azerbaijan’s TES increased an average 1.8% per year from 2000 to 2019.
* Includes bioenergy, waste, wind, solar PV and heat pumps; not visible at this scale. Note: Electricity trade not included. Source: IEA (2021), World Energy Balances 2021, www.iea.org/statistics.
TES – dominated by oil and gas – declined rapidly in the first years after the collapse of the Soviet Union. It has grown relatively modestly since then (+41% since 2000; Figure 2.4), with energy efficiency improvements and structural change in the economy largely offsetting the impact of increased economic activity. From 2008 (before the global financial crisis) to 2019, TES increased only 15% to reach 15.9 Mtoe. Growth resulted mostly from
10
20
30
40
50
60
70
2000 2002 2004 2006 2008 2010 2012 2014 2016 2018 2019
Mtoe
Others*
Oil
Natural gas
IEA 2021. All rights reserved.
2 4 6 8
10 12 14 16 18
2000 2002 2004 2006 2008 2010 2012 2014 2016 2018 2019
Mtoe
Other*
Hydro
Oil
Natural gas
IEA 2021. All rights reserved.
IEA
. All
right
s re
serv
ed.

2. GENERAL ENERGY POLICY
23
ENER
GY
INSI
GH
TS natural gas consumption (up by around 1.5 Mtoe or 16% since 2008), mainly in the service
sector. Oil consumption rose 14% from 2008, with the transport sector responsible for most of the increase.
Figure 2.5 compares Azerbaijan’s TES composition with that of other economies. Fossil fuels accounted for over 99% of the country’s domestic energy production in 2019, compared with the world average of 81% (2018), but Azerbaijan was unusual in not using coal: all its fossil fuel use was in the form of oil and natural gas.
Breakdown of TES by source in selected countries, 2018
Azerbaijan’s TES is among the world’s most fossil fuel-intensive.
* Covers Armenia, Azerbaijan, Belarus, Georgia, Kazakhstan, Kyrgyzstan, Moldova, Tajikistan, Turkmenistan, Ukraine and Uzbekistan. ** Includes solar PV, solar thermal, wave and ocean power, and other power generation (e.g. from fuel cells). Note: Electricity trade not included. Source: IEA (2020), World Energy Balances 2020, www.iea.org/statistics.
Energy consumption Although Azerbaijan’s TFC declined strongly in the 1990s, it has risen more than 60% since 2000. From before the global financial crisis in 2008 up until 2019, TFC increased by 37% to reach 10.8 Mtoe (Figure 2.6).
0% 20% 40% 60% 80% 100%
TurkmenistanKazakhstanAzerbaijanUzbekistan
BelarusRussian Federation
EU4Energy average*SerbiaTurkeyWorld
Republic of MoldovaCroatia
GeorgiaRomaniaUkraineArmenia
KyrgyzstanBulgaria
AustriaTajikistan
NorwaySwitzerland
Oil Natural gas Coal Peat Nuclear Hydro Bioenergy and waste Wind Solar** Geothermal
IEA 2021. All rights reserved.
Azerbaijan
IEA
. All
right
s re
serv
ed.

2. GENERAL ENERGY POLICY
24
The residential sector has traditionally been the largest energy consumer. In 2018, it accounted for 32% of TFC, followed by transport and industry (both 26%) and the service and primary sector (16%). Since 2008, transport has accounted for 46% of TFC growth, more than any other sector.
Total final consumption by sector, 2000-2019
Azerbaijan’s TFC increased 65% from 2000 to 2019, mostly as a result of growth in the transport and residential sectors.
* Includes commercial and public services, agriculture and forestry. ** Includes non-energy consumption. Source: IEA (2020), World Energy Balances 2020, www.iea.org/statistics.
Natural gas is the largest source of TES, but a major share of it is transformed into electricity and heat. That leaves oil as the main source of Azerbaijan’s TFC, at 42% in 2019, while natural gas accounted for 40% (Figure 2.7). Electricity accounted for 15% of TFC and district heat for 3%. Oil is the primary energy source in transport and industry, while natural gas is the main fuel in the residential sector and is also increasingly important in the service sector.
Total final consumption by source and sector, 2019
Oil and natural gas dominate Azerbaijan’s TFC.
* Includes non-energy consumption. ** Includes commercial and public services, agriculture and forestry. Note: For ease of readability, shares of less than 1% are not shown. Source: IEA (2021), World Energy Balances 2021, www.iea.org/statistics.
2
4
6
8
10
12
2000 2002 2004 2006 2008 2010 2012 2014 2016 2018 2019
MtoeServices/other*
Industry**
Transport
Residential
IEA 2021. All rights reserved.
42%
20%
99%
50%
40%
39%
80%
31%
15%
38%
16%
1%
13%
3%
1%
3%
6%
1%
0% 20% 40% 60% 80% 100%
Total
Services/other**
Residential
Transport
Industry*
Oil
Natural gas
Electricity
District heat
Bioenergy and waste
IEA 2021. All rights reserved.
IEA
. All
right
s re
serv
ed.

2. GENERAL ENERGY POLICY
25
ENER
GY
INSI
GH
TS Energy sector governance
The Presidential Administration, the Cabinet of Ministers and the Ministry of Energy (MoE) are the energy sector’s main government institutions, while individual subsectors are controlled by several state-owned monopolies, including SOCAR (oil refining, natural gas distribution and supply), Azerenergy (Azerenerji, electricity generation and transmission), Azerishiq (electricity distribution and supply) and Azeristiliktejhizat (district heat).
Executive Executive power is held by the President of the Republic of Azerbaijan, and the president assembles a Cabinet of Ministers to organise the work of the executive authorities. The Cabinet of Ministers is an executive body accountable directly to the president.
The MoE is the central executive authority responsible for implementing state policy and the various regulations, orders and decrees issued by the government for the energy sector. The MoE board, approved by the Cabinet of Ministers, has the authority to issue orders within its area of competence, meaning most domains within the energy sector except tariff regulation, which is under the authority of the Tariff Council.
The Tariff Council determines the retail and wholesale tariffs for electricity, gas, district heat and refined petroleum products as well as purchase tariffs for renewable electricity. The Minister of Economy is the chairman of the Tariff Council, and members include the deputy ministers of Finance, Justice, Energy, Transport, Communication and Information Technologies, Agriculture, Health, Education, Labour and Social Defence of the People, the vice-chairmen of the committees of Customs and of State City Building and Architecture and the deputy chairman of the State Tax Service.
In December 2017, the Azerbaijan Energy Regulatory Agency (AERA) was established under the MoE. AERA regulates producers, transmission operators, distributors, suppliers and consumers in the fields of electricity, district heat and gas supply; undertakes energy market analysis; proposes restructuring measures; and develops the investment climate. Eventually, after approval of the draft Law on the Regulator, all functions related to calculating and approving energy tariffs will be transferred from the Tariff Council to AERA. The draft law was submitted to the Cabinet of Ministries for inter-ministerial consultations in July 2019.
In September 2020, the President of Azerbaijan signed a decree establishing the State Agency for Renewable Energy Sources. The new agency will report to the MoE.
The Ministry of Ecology and Natural Resources is a central executive body implementing state policy on environmental protection. It maintains environmental safety, monitors the extraction of natural resources and their conservation in the country and takes measures to avert damage to natural ecological systems from economic or other activities.
The Ministry of Emergency Situations is responsible for emergency response mechanisms in all sectors of the economy. Its mandate includes emergencies arising from natural and man-made disasters and fire, as well as emergencies involving power systems, utility systems, hydropower facilities, oil and gas production and processing plants and main pipelines.
IEA
. All
right
s re
serv
ed.

2. GENERAL ENERGY POLICY
26
The State Statistical Committee of the Republic of Azerbaijan (SSC) is responsible for official energy statistics and meets regularly with the MoE to discuss data findings and potential additional information needs.
Legislative The Azerbaijani legal system is based on civil law and founded on the country’s Constitution. International agreements in which Azerbaijan is one of the parties constitute an integral part of the legislative system. When there is disagreement between normative legal acts (except within the Constitution and acts accepted by way of referendum) and international agreements in which Azerbaijan is one of the parties, the provisions of the international agreement prevail.
The legislative body of Azerbaijan is the National Assembly (Milli Məclis in Azerbaijani), a unicameral parliament whose 125 deputies are directly elected for a five-year term. The most recent elections for the National Assembly were held in February 2020.
Under the Constitution, those having the right to submit drafts of laws and other questions for consideration by the National Assembly are: deputies of the National Assembly, the President of the Azerbaijan Republic, the Supreme Court, citizens’ groups presenting at least 40 000 signatures, the Prosecutor's Office and the National Assembly (Ali Majlis) of the Nakhichevan Autonomous Republic.
Drafts of laws are submitted to the president for signing within 14 days of their acceptance. Laws and decrees of the National Assembly become valid from the date of their publication unless otherwise specified within the law or decree.
Main energy legislation Azerbaijan’s energy legislation dates mostly from the second half of the 1990s. The 1998 Law on Energy is a framework law regulating the exploration, development, production, processing, storage, transportation, distribution and use of all “energy materials and products”. Any person planning to carry out energy activities must obtain special permission from the MoE based on an energy contract or an application submitted prior to project initiation.
Article 3 of the 1998 Law on Energy defines Azerbaijan’s energy policy, which includes the following objectives:
effective production, transportation, distribution, storage, use and safety of energy products
creation of infrastructure to efficiently provide energy to all consumers and create new jobs; establishment of competition and minimal monopoly conditions in the energy sector; organisation of energy sector activities based on various types of ownership, long-term contracts and permits; creation of favourable conditions for local businesses producing high-quality products; and creation of favourable conditions for the application of efficient and environmentally safe technologies
conservation of energy resources, waste reduction, efficient energy consumption and the use of renewable energy sources
reduction of negative environmental impacts
in case of energy shortages, subsidy provision for producers and consumers to increase energy efficiency
IEA
. All
right
s re
serv
ed.

2. GENERAL ENERGY POLICY
27
ENER
GY
INSI
GH
TS
creation of favourable legal and economic conditions for investments
development of state energy programmes.
A number of other laws are also in force, all adopted in the second half of the 1990s.
The 1996 Law on the Use of Energy Resources defines the legal, economic and social foundations of state policy in the use of energy resources, as well as general policy implementation measures.
The 1998 Law on Subsoil regulates oil and gas exploration, use, protection, safety and control in the field of the use of mineral resources, including oil reserves, located in Azerbaijan and the Azerbaijani sector of the Caspian Sea shelf.
The 1998 Law on Gas Supply regulates the production, processing, transportation, storage, distribution, sale and use of all types of gas.
Oil and gas exploration and production projects involving international partners operate almost exclusively under production sharing agreements (PSAs), each of which has the status of a separate law (see Chapter 3).
The main laws dealing with electricity are the 1998 Law on the Use of Energy Resources, the 1998 Law on Electric Power Industry and the 1999 Law on Electricity and Heating Plants. Under the 1998 Law on Electric Power Industry and its subsequent revisions, a permit is required for the production, transmission, distribution and sale of electricity, as well as its import and export, unless otherwise specified by law.
Azerbaijan does not yet have individual laws on renewable energy or energy efficiency, but such laws have been drafted and are now (April 2021) being approved.
Key policies and reform efforts With oil and natural gas exports being the government’s main source of revenue, the energy sector is the driving force behind Azerbaijan’s economic development. Completion of the geopolitically important Southern Gas Corridor between Azerbaijan and Europe has opened another source of gas export revenue.
In the domestic energy sector, a major issue is the need to transition from a government-owned and -operated vertically integrated, subsidised system to competitive markets with a large measure of private sector participation. Significant economic and energy efficiency potential thus remains untapped.
The country’s energy mix is heavily concentrated on fossil fuels, with oil and gas accounting for more than 98% of total supply. While supply security is not a concern, heavy fossil fuel reliance results in high greenhouse gas (GHG) emissions, and it also exposes the country to fuel price fluctuation risks. In addition, investments are needed to modernise ageing infrastructure.
Along with oil and gas, the electricity sector has a leading role in Azerbaijan’s social and economic development. Large investments in power generation and transmission since 2009 have improved power supply quality remarkably. Electricity generation is now sufficient to cover domestic demand, and the power system is capable of supplying electricity of acceptable quality to almost the entire population. Setting energy prices at the
IEA
. All
right
s re
serv
ed.

2. GENERAL ENERGY POLICY
28
optimal level, however, is critical to attract investment and to encourage citizens to use energy efficiently.
With its excellent solar and wind resources and significant prospects for biomass, geothermal and hydropower, Azerbaijan has strong renewable energy potential. Practical deployment has been limited, however, considering the scale of available resources and the country’s long-term ambitions.
Renewable energy, together with energy efficiency, also offers the most promising low-carbon solution to meet Azerbaijan’s climate targets. In its nationally determined contribution (NDC) under the Paris Agreement, the country committed to reduce its GHG emissions 35% from the 1990 level by 2030. The government is also working to meet the UN’s 2030 Sustainable Development Goals (SDGs), among which SDG 7 (access to affordable, reliable, sustainable and modern energy resources) is a priority for Azerbaijan; this should synergise with efforts to achieve the Paris Agreement goal.
Reform efforts and planned laws Azerbaijan established laws for the electricity and gas sectors in the 1990s, but it does not yet have specific legislation for areas such as energy efficiency and renewable energy, nor does it have an explicit energy strategy. However, the government recently drafted several reform proposals and approval is pending for many new laws. They are discussed in more detail in the corresponding chapters of this report.
Reform momentum was triggered by the impact of oil price shocks on the national economy. Following both the 2007-2008 global financial crisis and the 2014-2015 oil price collapse (and resultant sharp oil export revenue losses), the government began promoting economic diversification. In 2012, the government tabled the development strategy Azerbaijan 2020: Look into the Future to foster non-hydrocarbon-based economic growth.
In 2016, strategic road maps on the national economy and 11 individual sectors were adopted in response to the steep decline in global oil prices. They include economic development strategies and action plans for 2016-2020, a long-term outlook to 2025 and a vision beyond 2025. They also target annual average GDP growth of 3% to 2025.
The 2016 Strategic Roadmap for the Development of Utilities (electricity, heat, water and gas) sets several specific strategic targets, such as sustainable and efficient utility sector regulation, the production of fully diversified and environmentally clean electrical power, the establishment of efficient and effective gas distribution infrastructure, the installation of sustainable and reliable heating supply systems, and lower water supply losses. It also calls for gradual transition to a liberal market model based on enhanced competition, unbundling, establishment of a wholesale market and a higher share of renewable energy. The roadmap was updated in July 2018.
Although many laws have been drafted in the past couple of years, they have yet to be adopted. In May 2019, a presidential order approved the document “Acceleration of Reforms in the Energy Sector of the Republic of Azerbaijan”. It proposes various reforms, such as the promotion of renewable energy and private sector investment in renewables, the preparation of a long-term energy sector development strategy, higher gas and heat system efficiency, and gradual opening of the electricity market to competition.
IEA
. All
right
s re
serv
ed.

2. GENERAL ENERGY POLICY
29
ENER
GY
INSI
GH
TS It also envisages the drafting of four new laws:
on a regulator for the energy sector and utility services
on using renewable energy resources for electricity production
on the gas supply (revision of the 1998 law)
on the energy sector (revision of the 1998 law).
A draft Law on Electricity, modelled on EU laws, targets gradual market reform by 2025. The government plans to permit independent generators to enter the sector and acquire existing power plants or build new ones (see Chapter 4).
Furthermore, a draft Law on the Efficient Use of Energy Resources and Energy Efficiency has been prepared with the assistance of Energy Charter experts. A National Action Plan on Energy Efficiency has also been prepared under the EU4Energy Programme (ECS, 2020).
For technical assistance with energy sector reform, the government has been working in partnership with donors, international organisations and consultants, including the Asian Development Bank (ADB), the European Bank for Reconstruction and Development (EBRD), the European Union (EU), the United States Agency for International Development (USAID) and the World Bank.
Tariffs and subsidies The domestic energy sector’s financial viability is a major issue. Investments are needed to modernise and expand electricity, heat and gas infrastructure, but incentives have been weakened by a lack of competition and low end-user tariffs.
Under the country’s social policy, end-user prices for electricity, natural gas and oil are very low. The tariff system includes cross-subsidies between consumer groups and energy carriers as well as direct subsidies from the state budget. Natural gas pricing particularly creates distortions. For example, it discourages the use of renewable energy for electricity production, heat pump adoption, and the installation of system solutions including the combined generation of district heating, cooling and electricity – all of which offer potential efficiency gains and CO2 emissions reductions. Meanwhile, low oil prices favour large, inefficient cars that are often acquired second-hand.
Low end-user prices imply considerable subsidies (Table 2.1). The IEA user price-gap methodology can be employed to estimate subsidies for fossil fuels consumed directly by end users or as inputs for electricity generation. In Azerbaijan’s case, natural gas and oil subsidies make up the difference between export prices and end-user prices, i.e. the opportunity cost of pricing domestic energy below international market levels. For electricity, the subsidy is the difference between the reference price and the end-user price.
Since 2015, implied subsidies for oil, gas and fossil-fuelled electricity have all increased significantly, reflecting higher oil and gas export prices. In 2019, Azerbaijan’s implied subsidies amounted to USD 1.9 billion, or 4% of the country’s GDP. The average subsidisation rate was 43%, for a total of USD 190 per inhabitant.
IEA
. All
right
s re
serv
ed.

2. GENERAL ENERGY POLICY
30
Azerbaijan energy subsidies, 2010-2019 (in real 2019 USD million) 2010 2011 2012 2013 2014 2015 2016 2017 2018 2019 Oil 140 477 569 691 181 28 273 741 1 131 977 Electricity 264 296 352 427 326 591 699 757 956 483 Gas 468 595 578 594 483 544 550 581 835 448 Total 871 1 368 1 498 1 712 990 1 162 1 522 2 079 2 922 1 909
Source: https://www.iea.org/topics/energy-subsidies.
Moreover, network tariffs for gas and electricity are based on a “cost-plus” methodology that does not encourage utilities to make their services more cost-efficient. On the contrary, this calculation method provides a perverse incentive for utilities to raise their operational costs to justify additional regulated revenue.
The financial burden of state-owned enterprises (SOEs) in the energy sector is increased by significant labour surpluses. Removing these structural constraints would require targeted and fiscally more efficient, explicit subsidy mechanisms (ADB, 2020).
Role separation could benefit both the government and SOEs. The World Bank proposes clear distinctions among the state’s roles as owner, policy maker and regulator. The aim should be for the state to separate decision-making from ownership responsibilities and act as an engaged and professional owner of its assets, while granting the SOEs operational independence (World Bank, 2017).
In addition, better corporate governance could significantly raise SOE competitiveness and profitability. OECD Guidelines on Corporate Governance of State-Owned Enterprises offers helpful international benchmarks.
Energy statistics Detailed, complete, timely and reliable statistics are essential to support energy and climate decision-making in any country. In Azerbaijan, the SSC is responsible for collecting, validating and disseminating official energy statistics. Statistical data are open and in the public domain. The SSC also meets regularly with the MoE to discuss and share findings from the latest annual energy data. Other relevant entities are invited to participate in this event, making it a platform for dialogue and information-sharing among national data providers and users.
Since 2007, Azerbaijan’s official energy balance has been presented in accordance with international standards and methodology; the SSC actively participated in the working group developing the guidelines. Energy data are also shared with relevant international organisations: annual statistics with the United Nations Statistics Division (UNSD) and the IEA, and monthly oil and gas data with the Joint Organizations Data Initiative (JODI).
The first household energy consumption survey was carried out in 2008 and was repeated in greater detail in 2017 to enable the development of energy efficiency indicators for the residential sector. Thanks to these surveys, data on solid biomass consumption are considered very reliable.
The SSC took on the task of compiling energy efficiency indicators in 2018, and having a national energy balance aligned with international standards greatly facilitates its work.
IEA
. All
right
s re
serv
ed.

2. GENERAL ENERGY POLICY
31
ENER
GY
INSI
GH
TS Some indicators are already available for the industry sector, and the household energy
end-use consumption survey conducted in 2018 has also allowed the development of residential sector indicators. These data are essential to assess and monitor developments in Azerbaijan’s largest energy-consuming sector. Furthermore, in accordance with the latest medium-term statistics strategy, the SSC is collecting disaggregated transport activity data, which will greatly help develop energy efficiency data in that sector.
According to a presidential decree approved in 2018, an “integrated information system of public utility services” (IISPUS) is to be created, with the MoE as operator. The system will encompass metadata for public utility services (including natural gas, electricity and district heating) as well as an open data management system accessible to all stakeholders (energy providers, consumers and the regulator).
Assessment Since the IEA in-depth review of 2015, Azerbaijan has remained a source of stable and uninterrupted oil and gas supplies for diversified export markets. A major achievement has been completion of the Southern Gas Corridor and the launch of gas supply flows from the Shah Deniz 2 field to several European countries. Azerbaijan’s government and state-owned SOCAR were instrumental in realising this internationally significant project.
In the domestic energy sector, the government has taken important steps to develop its legal and regulatory climate, diversify its energy mix, and strengthen its energy security:
A Strategic Road Map for the Development of Public Utility Services (Electricity, District Heat, Water and Natural Gas) in the Republic of Azerbaijan was approved by the president in 2016 and updated in July 2018. It set several strategic targets, including for sustainability and efficiency.
A new electricity law was drafted in concordance with a presidential decree in 2017 and aligned with the UE Third Energy Package.
The Energy Regulatory Agency was established in 2017.
The document “Acceleration of Reforms in the Energy Sector of the Republic of Azerbaijan” was approved by presidential order in 2019. It deals with reforms involving the promotion of renewable energy, efforts to increase energy efficiency, preparation of a long-term energy sector development strategy, and proposals for a planned transition to market-based competition in the power sector.
This 2019 order resulted in the preparation of draft laws on a regulator for the energy sector and utilities services; on boosting the use of renewables for electricity production; on promoting energy efficiency; and on gas supply.
In addition, the government has signed and ratified the Paris Agreement, and its NDC is to reduce GHG emissions 35% from the 1990 level by 2030. To this end, it has outlined climate change mitigation actions in a number of sectors including energy, and the Ministry of Ecology and Natural Resources is preparing both a national strategy for climate change and a national low-carbon strategy.
The government has also taken steps to meet growing electricity demand and strengthen energy security by commissioning new power plants. Around 2 gigawatts (GW) of capacity have been commissioned in the past ten years, with much of it coming online recently.
IEA
. All
right
s re
serv
ed.

2. GENERAL ENERGY POLICY
32
An immediate priority is to ensure that the draft laws and reforms currently under consideration in several areas are finalised and then implemented effectively, with clearly defined details on what is to be done and when; which parties are responsible for delivery; and whether the necessary resources are available.
Current focus is primarily on what needs to be achieved by 2030. Important as this is, it also arguable that an integrated long-term strategy is needed – one that builds on the various strategy documents and plans currently under consideration, provides longer-term plans through 2040 or 2050, and brings together all the various strands of work on energy and climate change. Such a plan would be strengthened by private sector and other external stakeholder consultations; by instituting carefully planned governance arrangements based on close cross-government co-ordination; and by including clear targets and indicating how they are to be delivered.
There is also scope to build on progress already made and undertake structural reforms to develop competitive markets. This might best be done on a phased basis, bearing in mind the difficulties of moving from subsidised to market prices, and accompanied by measures to provide appropriate support for the most economically vulnerable citizens. Competitive markets would help attract private sector investment and send price signals reflecting future cost changes. Targeted subsidies could still be provided to not only protect society’s most vulnerable, but to support carefully directed government objectives such as the promotion of new renewables and energy efficiency (market prices alone would encourage this transition in the first place). One priority should be to ensure transparent and non-discriminatory access to the grid, as this is a prerequisite for a competitive power market and for attracting overseas investment in new generation capacity.
These changes will inevitably generate demand for new skills and capabilities in a variety of fields, for example in emissions measurement; energy and climate modelling; renewables, co-generation and trigeneration; and heating and cooling. Developing these skills in consultation with the private sector as well as schools, universities and research organisations – backed by the necessary financial resources, of course – should help minimise the risk that future capability gaps would impede progress, and should also create new skilled jobs.
Improving energy data use Reliable data is the basis for sound policymaking. Since the 2015 IEA review, the SSC has improved energy efficiency data collection and monitoring and has also expanded public access to user-friendly energy information. The SSC is to be congratulated on the steps it has taken.
Given additional resources, it should be possible to raise the coverage of energy efficiency data for the main sectors of the economy (residential, transport and industry) as well as increase the level of data disaggregation. To support priority energy efficiency policies, stakeholders (the SSC and the MoE) should clearly define responsibilities, compile a list of missing key indicators and formulate an action plan to fill the data gaps. This exercise should also clarify who will estimate data between surveys, and how to maximise synergies with existing data collection mechanisms to avoid increasing respondent burden. Once the IISPUS project is finalised, its energy consumption data could inform these estimates.
After the Law on the Efficient Use of Energy Resources and Energy Efficiency has been adopted, it is expected that secondary legislation will define obligations and responsibilities
IEA
. All
right
s re
serv
ed.

2. GENERAL ENERGY POLICY
33
ENER
GY
INSI
GH
TS for monitoring the impact of its measures. The IEA encourages the SSC to continue
participating actively in the inter-agency working group related to the laws to ensure that monitoring mechanisms meet international standards.
The MoE is one of the main users of official energy data, as is the Ministry of Ecology and Natural Resources, which uses it to formulate the energy module of the national GHG inventory. Leading academic programmes dealing with long-term energy modelling should also be considered important stakeholders and users of national energy data. Data available in electronic formats facilitates information-sharing among authorities, as does close communication among energy data users. Having the main stakeholders actively involved in the biannual consultative meetings would spur further development and use of energy statistics in the country, supporting the government’s objectives in the areas of energy efficiency, long-term energy modelling and GHG emissions reductions.
Recommendations The government of Azerbaijan should:
Build on existing policy work and plans with a view to developing an integrated long-term strategic plan for energy and climate change, ensuring effective co-ordination among all relevant government ministries and agencies as well as consultation with the private sector, higher education bodies and other stakeholders.
Take the necessary action to rapidly finalise the draft laws and plans currently under consideration, including those for energy efficiency and renewables co-generation and trigeneration, and ensure their effective implementation based on clearly defined responsibilities and accountabilities, with adequate resources.
Take steps to assess and build the capabilities and skills needed in the future, including through education and training, and improve public awareness of the reasons for energy policy changes and their benefits.
Further develop the national energy statistics system to improve data coverage and quality and to inform policy decisions by:
> Ensuring (with the help of the SSC) that appropriate data are available for energy planning and for energy efficiency indicator development (for the residential, transport and industry sectors).
> Defining appropriate progress-monitoring mechanisms in secondary energy efficiency legislation through dialogue between the MoE and the SSC, while also clarifying related responsibilities.
> Developing the biannual stakeholder meeting between the MoE and the SSC so that it provides a flexible platform for dialogue among all the main data providers and users, including academia.
> Completing the IISPUS project and adopting it as the main instrument of electronic data governance for public utility services.
IEA
. All
right
s re
serv
ed.
2. GENERAL ENERGY POLICY
34
References
ADB (Asian Development Bank) (2020), Reforms, Opportunities, and Challenges for State-Owned Enterprises, ADB, Manila.
CBA (Central Bank of the Republic of Azerbaijan) (2021), Statistical Bulletin 12/2020, 07759fc3336d1b8b0d8436279.pdf (cbar.az).
ECS (Energy Charter Secretariat) (2020), In-Depth Review of the Energy Efficiency Policy of the Republic of Azerbaijan, ECS, Brussels.
Fitch Ratings (2020), Fitch revises outlook on Azerbaijan to negative; affirms at 'BB+',www.fitchratings.com/research/sovereigns/fitch-revises-outlook-on-azerbaijan-to-negative-affirms-at-bb-10-04-2020.
IEA (International Energy Agency) (2021), World Energy Balances 2021, www.iea.org/statistics.
SOFAZ (State Oil Fund of the Republic of Azerbaijan) (2021), www.oilfund.az/en/report-and-statistics/recent-figures.
World Bank (2020a), Azerbaijan country information, data.worldbank.org/country/AZ.
World Bank (2020b), Ease of Doing Business in Azerbaijan, www.doingbusiness.org/en/data/exploreeconomies/azerbaijan).
World Bank (2017), Republic of Azerbaijan: Corporate Governance and Ownership of State-Owned Enterprises, WB, Washington, DC.
IEA
. All
right
s re
serv
ed.
35
ENER
GY
SEC
UR
ITY
3. Oil and natural gas
Key data (2019 provisional) Oil production*: 37.5 Mt (0.78 Mb/d), -15.8% since 2008
Net oil exports*: 31.2 Mt (0.65 Mb/d) (no imports, exports 31.2 Mt)
Net oil product exports: 0.90 Mt (0.02 Mb/d) (imports 0.3 Mt, exports 1.2 Mt)
Share of oil: 65.3% of domestic energy production, 32.9% of TES, 0.2% of electricity generation, 41.9% of TFC
Oil consumption by sector**: 4.9 Mt (transport 62.4%, industry 27.6%, services 6.8%, other energy 2.7%, power and heat generation 0.3%, residential 0.2%)
Gas production***: 24.5 bcm, +50.3% since 2008
Net gas exports: 11.8 bcm, +125% since 2008
Share of natural gas: 34.2% of domestic energy production, 66.1% of TES, 92.5% of electricity generation, 39.9% of TFC
Gas consumption by sector: 12.5 bcm (power and heat generation 49.2%, residential 26.5%, other energy 9.8%, industry 8.2%, services 6.3%, transport <0.1%)
* Includes condensates and NGLs.
** Excludes international marine bunkers.
*** Marketable quantity, i.e. excluding quantities re-injected, vented or flared.
Overview Azerbaijan depends on crude oil for most of its export and government revenue. Developments in global oil demand and prices are therefore critical for the country. Oil production began in the mid-19th century but has been in decline since 2010. Natural gas is also important to Azerbaijan’s economy. In contrast to oil, natural gas production, which became significant in the 2000s, continues to increase. Efforts to modernise and increase oil refining and petrochemicals production have been successful and are continuing.
Oil and gas resources are plentiful, but the long-term outlook for exports – and therefore for government revenue – is uncertain, as major importing countries have recently committed to net-zero GHG emissions by 2050.
Domestically, oil and gas continue to provide almost all primary energy, including around 90% of electricity generation. The state-owned State Oil Company of the Azerbaijan
IEA
. All
right
s re
serv
ed.
3. OIL AND NATURAL GAS
36
Republic (SOCAR) controls almost all segments of the sector and the government sets retail prices very low by international standards. Incentives are needed for investments to modernise pipelines and improve efficiency.
Supply History of Azerbaijan’s oil and gas production
Azerbaijan is one of the first places in the world to have produced oil regularly. The history of its oil and gas sector can be split into five distinct phases: early history (to 1870), first oil boom (1871-1921), onshore boom in the Soviet era (1921-48), offshore boom in the Soviet era (1949-91), and the third oil boom (1991 onwards).
Active local production and trade of light and dark crude oil has been documented as early as the 10th century, initially around the Absheron Peninsula and later in Baku as well as Balakhany. In the 16th century, some 500 oil wells were dug by hand to depths of as much as 35 metres (m) in Baku alone. Azerbaijani oil was transported and sold in Europe, Turkey, the Northern Caucasus, Iran and Central Asia.
The world’s first modern oil well was drilled in Absheron, Bibiheybat, in 1846, 13 years before the first US oil well in Pennsylvania. New well drilling technologies opened new fields and boosted oil production. As the number of operating companies multiplied, Azerbaijan introduced its first oil industry regulations and concession auctions in 1872. After almost a decade in Azerbaijan, Bank Rothschild founded the Caspian-Black Sea Oil Company in 1886 and controlled 42% of Baku’s oil exports by 1890. Azerbaijani production rose from 20 thousand barrels per day (kbd) (1 million tonnes/year [Mt/a]) in 1883 to 200-220 kbd (10-11 Mt/a) in 1901-1904, accounting for over 50% of world production.
Rising oil volumes required infrastructure. In 1859, the country built its first oil refinery1 and by 1867 some 15 oil refineries were operating. The first ever oil pipeline to connect the Baku refineries to the Balakhany oil fields (12 km) was commissioned in 1878, and by 1898 some 230 km of pipes linked refineries to oil fields. The Baku-Batumi railway was commissioned in 1883 to export crude oil and oil products to Europe. The Baku-Batumi pipeline was completed in 1907.
Oil production subsequently fell to around 150 kbd (7.4 Mt/a in 1910-1917) under the pressures of war, revolution and other shocks. On the eve of the Soviet nationalisation of Azerbaijan’s oil industry in 1920, oil production had deteriorated to 60 kbd (2.9 Mt/a), and it fell further to 50 kbd in 1921 (2.5 Mt/a). At the time, the oil industry comprised some 270 oil producing enterprises, 49 small and mid-sized drilling firms, 25 refining companies, and over 100 mechanical, repair and other businesses.
The first of two peaks in drilling during the Soviet era delivered large onshore discoveries. Oil output rose steadily to 470 kbd (23.6 Mt) in 1941, accounting for 76% of Soviet oil production. Output then quickly slid to an average 240 kbd (12.0 Mt/a) in 1943-1946, as the USSR transferred Azerbaijan’s oil engineers to develop fields in Central Asia.
The second Soviet-era drilling peak came in the early 1950s and opened up offshore exploitation, as some of the first techniques for offshore drilling and infrastructure were 1 A combination of distillation and cooling plants for the extraction of kerosene.
IEA
. All
right
s re
serv
ed.
3. OIL AND NATURAL GAS
37
ENER
GY
SEC
UR
ITY established in Azerbaijan. In 1950, the Oil Rocks field (Neft Dashlari), some 50 km offshore
at a depth of 6-25 m, was commissioned2 and several other oil and gas fields followed.3 Oil Rocks involved 300 km of causeways ("Estacada") linking fixed production platforms and serving to both support pipelines and carry supplies. Output in the Oil Rocks field peaked in 1964-1965 at around 150 kbd (7.7 Mt/a) when total Azerbaijani production reached 430 kbd (21.5 Mt/a).
Until 1970, offshore work depths did not exceed 40 m. Subsequent investment in offshore equipment extended depths to 70 m and eventually to 350 m in the late 1970s and early 1980s at fields such as Chirag, Kapaz, and Gunashli (Gunashli currently produces more than 60% of SOCAR's oil). Production from new offshore fields slowed but did not stop the steady decline in aggregate Azerbaijani output that began after 1965-1966 and lasted until 1995 (except for a brief recovery in 1985-1988). Overall, production stagnated and slowly declined to 410 kbd (20 Mt/a), or 5.7% of the Soviet Union’s output in 1970. Declines continued until the recession following Azerbaijani independence (post-1991), when oil production fell to 200 kbd (10 Mt/a) (Ciarreta and Nasirov, 2010).
Following collapse of the USSR, Azerbaijan adopted a new oil and gas strategy aimed at boosting the country’s economy. In September 1994, SOCAR and a BP-led consortium of international energy companies (organised as the Azerbaijan International Operating Company – AIOC)4 signed a 30-year (1994-2024) production sharing agreement (PSA) called the Contract of the Century to develop the supergiant Azeri-Chirag-Gunashli (ACG) block. In September 2017, the PSA was extended to the end of 2049.5 In 1996, the government signed a further PSA for developing the Shah Deniz gas field with another BP-led consortium (including SOCAR and five other companies).6 The combined contracts revitalised the oil and gas sector, attracting massive international investments and increases in oil and gas revenues for the country.
In 2006, construction of the Baku-Tbilisi-Ceyhan (BTC) pipeline to transport oil from Baku to the Mediterranean substantially facilitated the access of Caspian Sea oil resources to the world oil market. More recently, the construction of natural gas pipelines through Turkey to the European Union has unlocked access to Caspian gas resources and yielded Azerbaijan associated export revenues while allowing associated gas condensate production to rise.
Reserves
Azerbaijan’s remaining commercial liquid reserves (crude and condensate) are typically indicated to be 7.0 billion barrels (bbl) (BP, 2020). However, the Wood Mackenzie consultancy suggests they may amount to only 4.11 billion bbl and explains that official data tend to be optimistic and often include some sub-commercial volumes (Wood
2 Well No. 1 was drilled to 942 m in depth in the Neft Dashlary formation in November 1949 and was commissioned to produce 100 tonnes (t) of oil per day, laying the foundations for offshore oil production. 3 Gum-Deniz, Sangachal-Divanni-Deniz-Khara-Zira Island, Bulla-Deniz, Darwin pitcher, Kurovdag, Mishovdag, Kursanga, Garabaghly, Galmaz, Garabagh and others. 4 13 leading oil companies (AMOCO, BP, Delta, Exxon, Itochu, Lukoil, McDermott, Pennzoil, Remco, SOCAR, Statoil, Turkish Petrol and UNOCAL) from eight countries (Azerbaijan, Japan, Norway, Russia, Saudi Arabia, Turkey, the United Kingdom and the United States). 5 The participating interests in the extended PSA are BP (30.37%), SOCAR (25%), MOL (9.57%, acquired from Chevron in 2020), INPEX (9.31%), Statoil (7.27%), ExxonMobil (6.79%), TPAO (5.73%), ITOCHU (3.65%) and ONGC Videsh (2.31%). 6 The current participating interests in the PSA are BP (28.8%),TPAO (19%), SOCAR (16.7%), Petronas (15.5%), Lukoil (10%) and NIOC (10%).
IEA
. All
right
s re
serv
ed.

3. OIL AND NATURAL GAS
38
Mackenzie, 2020). Azerbaijan’s natural gas reserves in 2019 have been estimated at between 630 billion cubic metres (bcm) (Wood Mackenzie) and 2 800 bcm (BP), with OPEC giving a relatively central value of 1 718 bcm (OPEC, 2020). At 2019 gross production levels (780 kbd for oil and 35.6 bcm for natural gas, according to SSC, 2020a), this equates to a reserve life (reserves divided by annual gross production) of 15-25 years for oil and 18-79 years for natural gas (Table 3.1).
Azerbaijan’s oil and gas reserves are located mainly in the South Caspian basin, split between the Kura Intermontane depression and the South Caspian depression. The former includes most of the onshore fields and the shallow-water offshore fields. The latter contains the deeper water reservoirs, which have almost all of Azerbaijan's significant remaining resources with exploration and development potential (Wood Mackenzie, 2020).
The shallow waters of the Absheron-Pribalkhan trough, off the Absheron Peninsula, contain most of Azerbaijan’s liquid reserves in a few large fields. There are also some onshore resources in the Gobustan trough, but these account for around only 3% of oil reserves. Azerbaijan's gas reserves exist both as non-associated offshore gas deposits and as associated gas at offshore oil fields (onshore reserves are insignificant). Most of the reserves are concentrated in the Absheron-Pribalkhan trough and the South Caspian deep-water sub-basin.
Azerbaijan’s initial and remaining oil and gas reserves, 2019 (in million barrels of oil equivalent)
Recoverable
Produced*
Remaining reserves 2020 Production
2019 (SSC)
Reserve life (years)
Wood Mackenzie BP Wood
Mackenzie BP Wood Mackenzie BP
Liquids 18 625 21 520 14 520 4 105 7 000 280 15 25
Gas 8 525 24 045 4 095 4 430 19 950 252 18 79
Total 27 150 45 565 18 615 8 535 26 950 512 17 53
* Based on Wood Mackenzie (2020), p 27. Sources: BP (2020), Statistical Review of World Energy 2020; Wood Mackenzie (2020), Azerbaijan upstream summary, p. 27; SSC (2020a), Energy of Azerbaijan 2020.
Onshore fields (including the onshore Absheron peninsula, one of the world’s oldest oil provinces) account for around only 3% of total Azerbaijani output today. They have suffered heavy depletion over many decades of development. Nevertheless, onshore reserves offer some limited upside potential through rehabilitation and deeper exploration.
Offshore fields now offer the greatest potential for the future. The shallow-water Absheron province is the main productive oil play, and its remaining prospective resources lie to the south of the peninsula. Multiple fields have been discovered there in the past 50 years, including the ACG (around 70% of both current oil production and remaining commercial oil reserves), Gunashli (around 10% of current oil production), oil at Gum Deniz, gas at Bahar, and large discoveries at Oil Rocks (Wood Mackenzie, 2020). Outside of the Absheron-Pribalkhan trend (where the ACG field is), offshore oil exploration has been disappointing. Offshore commercial fields offer further prospects for the development of gas resources, notably at Shah Deniz Phase 3 and in the form of ACG non-associated gas. In the north and west of the Absheron peninsula, minor oil discoveries have been made, some of which yielded gas (including SOCAR’s Nakhichevan field).
IEA
. All
right
s re
serv
ed.

3. OIL AND NATURAL GAS
39
ENER
GY
SEC
UR
ITY While underexplored, the centre and south of the Caspian have revealed significant
structures at water depths of 30-1 000 m, containing mainly gas and condensate. The area’s significant gas potential was confirmed by discoveries at the Shah Deniz gas field (around 80% of remaining commercial gas reserves, according to Wood Mackenzie), and at Umid in 2010 and Absheron in 2011 (discovered in 500 m of water).
Exploration and production
Licensing: Production sharing agreements and risk service contracts Azerbaijan’s oil and gas resource development since 1991 has depended on licensing international oil companies (IOCs). Azerbaijan does not allocate exploration and development licences through routine competitive licensing rounds; instead, SOCAR has directly negotiated almost all contracts. It has arranged licences annually since 1991, except in 2003, 2006, 2013 and 2015. It conferred the first 25 licences in the 10 years from 1991 to 2000, after which activity slowed and the next 25 licences were awarded from 2001 to 2018. Following the first contract relinquishment in 1999, companies had relinquished 17 licences by 2018. Exploration remains active, with several exploration and appraisal wells planned (both on- and offshore).
In Azerbaijan, upstream projects involving international partners operate almost exclusively under PSAs (also called production sharing contracts [PSCs]), but recently risk service contracts (RSCs) have also been awarded. Prior to the ground-breaking ACG PSA in 1994 (often referred to as the Contract of the Century), Azerbaijan used joint venture (JV) contracts, but none have been issued since 1998 and all previous JVs were converted to PSAs by 2010. Through SOCAR, the state holds a direct interest in all PSAs of 10-50%. The first RSC was awarded in 2017 (offshore Umid-Babek), with a second following in 2018 (offshore Karabagh). Each individual PSA and RSC is ratified by the parliament and the president and has the status of a separate law.
PSAs and RSCs share common attributes: they both grant foreign oil companies exclusive rights to explore a defined area and to make discoveries; neither confers a right to title over the oil produced; both deduct production costs to determine net profit for sharing; and neither surrenders sovereignty over resources. The foreign partner assumes all risks and costs (carrying SOCAR through the initial investment phases) and, if it makes a commercial discovery, has those costs reimbursed plus a share of the production. A PSA remunerates companies in oil (cost oil and profit oil), while an RSC remunerates companies with cash for costs and profit oil.
PSA and RSC terms include signature bonuses paid to the state, commerciality bonuses in the event of a commercial discovery, production bonuses when a commercial discovery comes into production, fixed cost recovery (excluding bonuses), and profit splits based on a sliding-scale recovery factor.7 No royalties are payable, and crude oil (for cost recovery and profit sharing) is valued at the netback value (weighted average price for quarterly export sales adjusted for transportation costs). Azerbaijan has respected the tax stability
7 The R-factor defines the sliding scale that divides remaining production after cost recovery between the contractor and the government. R = cumulative net income / cumulative investment, where cumulative net income = cumulative capital cost recovery + cumulative financing cost recovery + cumulative contractor's profit share, and where cumulative investment = cumulative capital costs incurred
IEA
. All
right
s re
serv
ed.

3. OIL AND NATURAL GAS
40
of grandfathered PSAs (Wood Mackenzie, 2020), with the terms of taxation set out in PSAs unaffected by any subsequent changes in Azerbaijan’s tax regime.
Any associated gas is supplied to SOCAR free of charge under PSA terms, but recent contracts allow for reassessment of the terms in the event of a non-associated gas discovery.
Most Azerbaijani PSAs have an exploration phase that lasts three years and imposes a minimum work plan (environmental and site surveys, defined numbers of 3D seismic surveys, and a defined number of exploration wells). PSAs may have an optional two-year extension, contingent on drilling more wells. If exploration results in a commercial discovery, the government usually awards a 25-year development phase (plus a negotiable five-year extension). The development phase begins with the preparation of a work programme that has to be undertaken within three years of the date the commercial discovery is announced.
Subject to SOCAR’s approval, PSA or RSC contractors may assign all or part of their interest to third parties. They can also give up their contract area to SOCAR, with 90 days’ notice and once all obligations have been fulfilled or against payment of an equivalent sum to SOCAR. Contract holders are not charged VAT but must pay a 10% withholding tax. Tax rates for foreign subcontractors vary and are defined separately for individual PSAs.
Drilling Onshore drilling has historically fallen to SOCAR. Between 1986 and 1996, SOCAR’s activity (both onshore and offshore as well as in maintenance) declined significantly because of insufficient funds. SOCAR failed to develop discoveries (such as ACG), expand production, or further its exploration programme. However, SOCAR’s financial resources recovered following Azerbaijani independence and the arrival of IOCs. It made its first major offshore deep-water discovery in 2010 (the Umid field).
Offshore drilling in Azerbaijan involves significant complications, notably deep reservoirs (3 000-6 000 m, roughly twice the depth of onshore fields), high pressures (typically over 8 500 psi, or 586 bar), and unconsolidated seabeds. IOCs drilled 18 offshore exploration wells between 1991 and 2018, of which only two resulted in commercial discoveries (the Shah Deniz and the Absheron gas condensate fields).
Furthermore, the services sector for the oil and gas industry has continually constrained exploration and development, and it has taken almost three decades to build up offshore drilling facilities. Insufficient deep-water facilities and a concentration of service providers in just a few companies have imposed long lead times before first production, particularly for deepwater projects.
Semi-submersible rigs are essential both for deepwater exploration and appraisal activity and for developing complex projects (such as Shah Deniz and Absheron). To manage the post-independence scarcity of drilling facilities, early offshore operators (four companies) formed the first “Rig Club” to share two rigs (Dada Gorgud and Istiglal). This was not enough to prevent persistent rig shortages, however, so SOCAR pressured international operators for assistance, resulting in initial upgrades (Istiglal in 1999, at a cost of USD 210 million, and Dada Gorgud in 2000, worth USD 36 million) followed by further modernisation. Dada Gorgud is now capable of drilling to 7 620 m in water depths of up to 475 m, and Istiglal (which was further upgraded in 2015-2016) can drill to 7 620 m in water
IEA
. All
right
s re
serv
ed.

3. OIL AND NATURAL GAS
41
ENER
GY
SEC
UR
ITY up to 700 m deep for over-pressured formations. The Istiglal upgrades permitted
development of the Shah Deniz field.
In 2003, a new semi-submersible rig, the Maersk Explorer, was added (drilling to 9 140 m, in water depths of up to 1 000 m), and in May 2017 Azerbaijan’s Caspian Drilling Company completed the Heydar Aliyev (at a cost of more than USD 1 billion), a semi-submersible sixth-generation rig capable of withstanding up to 1 400 atmospheres of pressure at water depths of up to 1 000 m. While the rig spudded its first well in 2018 for Total's Absheron EPS, it will facilitate deepwater activity in general and help free up other drilling resources. Azerbaijan’s operators also occasionally arrange to use a small fleet of jack-up rigs operating elsewhere in the Caspian.
Oil production
Azerbaijan’s oil production peaked at just over 1 million barrels per day (mbd) in 2009-2010 (of which around 40 kbd was gas condensate) and then gradually declined to 780 kbd in 2019 (of which 60 kbd is condensate and 17 kbd is natural gas liquids [NGLs]) (Figure 3.1). Development of the ACG field has sustained output growth since 1997, and it continues to supply most of Azerbaijan’s oil. In 2010, ACG production amounted to 828 kbd, or around 80% of the country’s total oil supply, but by 2019 it had fallen to 540 kbd, representing around 70% of the total (IEA, 2020a). ACG’s peak thus fell well below the 1.2 mbd expected by BP in 2006 (BP, 2006).
Azerbaijan has agreed to several voluntary output cuts in recent years. In December 2016, it joined other non-OPEC producers to co-operate with OPEC in efforts to stabilise the oil market (later formalised in a Charter of Cooperation or Declaration of Cooperation, signed on 2 July 2019). On that occasion, Azerbaijan agreed to cut output by 20 kbd for six months (from a baseline value of 796 kbd in October 2016) as part of broader non-OPEC cuts of 558 kbd and OPEC cuts of 1.2 mbd starting 1 January 2017.
Since then, OPEC and non-OPEC countries have regularly extended their Declaration of Cooperation at biannual OPEC/non-OPEC meetings. In 2020, as part of the OPEC+ response to the Covid-19 impact on oil demand, Azerbaijan agreed to cut production from 720 kbd in October 2019 to an average of 580 kbd from June to December 2020. In 2021, OPEC+ has reduced the production cuts, enabling Azerbaijan to gradually increase its production to 620 kbd in July. Future oil production will depend upon managing the decline of the ACG field, the development of condensate and NGL production from offshore gas discoveries, and future exploration success.
To manage falling ACG production, BP (the operator) is investing in short-cycle brown-field opportunities at ACG. The company is also investing in a new production platform (Azeri Central East [ACE]) to ramp up production to a peak of 100 kbd in the mid-2020s, briefly stabilising overall ACG output. The new investment follows extension of the PSA in 2017 to end-2049.
The development of offshore condensate production in recent years has slowed the decline in Azerbaijani oil output, reflecting the preponderance of gas discoveries in new developments (e.g. Absheron, Shafag Asiman and Babek). Despite additional condensate from offshore gas projects (notably Shah Deniz 2 and Absheron Deep Water), overall liquids production will continue to fall as output from ACG declines.
IEA
. All
right
s re
serv
ed.

3. OIL AND NATURAL GAS
42
Figure 3.1 Crude oil and NGL production, 2000-2019
Azerbaijan’s crude oil production has been in gradual decline since peaking in 2009-2010.
*Gas condensates from Shah Deniz are included in natural gas liquids data. Note: 2019 data are provisional. Source: IEA (2021a), World Energy Balances 2021 (database), www.iea.org/statistics.
Companies have also shown renewed interest in onshore and near-shore exploration. Although smaller than the deepwater fields, onshore prospects tend towards higher-value liquids; projects do not depend upon semi-submersible offshore rigs with limited availability; and any discoveries can be more readily fast-tracked for development (Wood Mackenzie, 2020). BP signed a PSA with SOCAR in December 2014 to jointly explore and develop potential prospects in the shallow-water area around the Absheron Peninsula up to the margins of the Caspian basin in water depths of up to 40 m and potential reservoir depths of 3 000-5 000 m. This PSA gives BP a 50% interest as operator. BP has since committed to drill exploration wells in three prospective areas.
Gas production
Azerbaijan has three main sources of gas: 1) the Shah Deniz field, the country’s largest gas resource (around 19 bcm output in 2020); 2) associated gas from the ACG block, which is provided free to SOCAR under the PSA; and 3) volumes produced by SOCAR from the Shallow-Water Gunashli field and other smaller fields.
Shah Deniz phase 1 started production in 2006 and quickly made Azerbaijan an important producer of gas as well as oil. It allowed the country to halt gas imports from Russia and rapidly become a regional gas exporter. Initially, Shah Deniz 1 could produce around 10 bcm/a of natural gas and around 50 kbd of condensates. In 2014, action was taken to remove bottlenecks, increasing production capacity to 10.8 bcm/a. The construction of Shah Deniz 2 started in 2014 and the first gas was delivered in July 2018. Shah Deniz 2 is ramping up to produce 16 bcm/a in the early 2020s (Figure 3.2).
Shah Deniz 2 is the gas source for the Southern Gas Corridor (SGC) project, which will take Caspian gas across Georgia and Turkey to Europe. The 16 bcm/a maximum production has been sold under long-term contracts to Turkey (6 bcm) and Greece, Bulgaria and Italy (10 bcm). SOCAR announced in 2018 that a phase 3 was being considered for Shah Deniz, but it is not yet clear whether this will go ahead (Caspian News, 2018; Wood Mackenzie, 2020).
2%
4%
6%
8%
10%
12%
10
20
30
40
50
60
2000 2002 2004 2006 2008 2010 2012 2014 2016 20182019
Mt
Natural gasliquids*
Crude oil
Share of NGLs intotal production(right axis)
IEA 2021. All rights reserved.
IEA
. All
right
s re
serv
ed.

3. OIL AND NATURAL GAS
43
ENER
GY
SEC
UR
ITY Figure 3.2 Natural gas production, 2000-2019
Azerbaijan’s natural gas production is set to continue increasing to at least 2022-2023 as the Shah Deniz 2 and Absheron projects ramp up.
Notes: 2019 data are provisional. Graph covers marketable quantity, i.e. excluding quantities re-injected, vented or flared. Source: IEA (2021a), World Energy Balances 2021 (database), www.iea.org/statistics.
Two other recent discoveries appear set to boost longer-term Azerbaijani gas production: Umid and Absheron (deepwater). Umid, commissioned in 2012, currently produces modest volumes, and SOCAR has so far not succeeded in attracting IOC partners for its expansion. Absheron, fast-tracked via a small-scale early-production scheme (as a single subsea well), is expected to begin production in 2022 and reach 1.4 bcm in 2023 (reserves are estimated at 350 bcm of gas and 350 mb of condensate). Subsequently, a larger-scale Phase 1 project will expand output.
Box 3.1 The status of national borders in the Caspian Sea
The legal status of national borders in the Caspian Sea has a direct impact on offshore oil and gas development as well as on the development of trans-border infrastructure, notably oil and gas pipelines crossing the Caspian.
The five Caspian states (Azerbaijan, Islamic Republic of Iran (hereafter ‘Iran’), Kazakhstan, Russia and Turkmenistan) signed the landmark Convention on the Legal Status of the Caspian Sea in August 2018, almost 30 years after the breakup of the Soviet Union. The Convention establishes a special legal regime for the Caspian Sea, distinguishing between the legal treatment of its surface and seabed (subsoil). It also provides a framework for future bilateral or trilateral talks, as well as environmental protection measures, and allows construction of subsea pipelines under agreements only between affected countries (Article 14), obviating the need for approval by all Caspian states. The Convention should allow the resolution of various territorial claims by the Caspian states, as most states have ratified it (Turkmenistan in December 2018, Kazakhstan and Azerbaijan in February 2019, and Russia in October 2019). Only Iran has not ratified the Convention.
Independently of the Convention, Russia, Kazakhstan and Azerbaijan agreed on demarcations of their respective maritime borders in the north Caspian Sea (based on the median line principle) through individual agreements between 1998 and 2003, and they signed a trilateral accord in 2003-2004. The agreement specifically includes development
5
10
15
20
25
30
2000 2002 2004 2006 2008 2010 2012 2014 2016 20182019
bcm
Associated gas
Non-associated gas
IEA 2020. All rights reserved.
IEA
. All
right
s re
serv
ed.

3. OIL AND NATURAL GAS
44
of three blocks straddling the Russia-Kazakhstan border (Khvalynskoye, Kurmangazy and Tsentralnoye), specifying a 50/50 split between the two countries. Other Russian-Kazakh trans-median geological structures must be developed under separate agreements and will require a 50/50 JV when disputed.
South Caspian Sea border delimitation remains in dispute, but a framework for future bilateral talks exists, since Kazakhstan and Turkmenistan have both agreed to the median line principle, although their maritime border remains undefined. The Azerbaijan-Turkmenistan maritime border has a potentially greater impact on the oil and gas industry. The signing of a memorandum of understanding between Azerbaijan and Turkmenistan in January 2021 on joint exploration and development of the Dostluk (Friendship) field (formerly Serdar/Kapaz) is a positive development. It also paves the way to potentially developing the Trans-Caspian Gas Pipeline to deliver Turkmen gas to Azerbaijan and Europe.
Both Azerbaijan and Turkmenistan have border disputes with Iran, which refuses to support the median line principle and does not recognise the Russian-Kazakh-Azerbaijani trilateral accord.
Further exploration and development of deepwater offshore prospects will support the expansion of gas production. Prospects include further development of discovered resources of non-associated (deep) gas at ACG, Babek (SOCAR-operated) and Shafag Asiman (BP-operated) (Wood Mackenzie, 2020). As with oil, lead times from discovery to first gas production could be long due to deepwater service facility constraints. Major gas export expansion would also require new gas processing facilities and pipeline extension.
The ramp-up in Shah Deniz 2 and Absheron production looks set to lift Azerbaijani gas production in 2019 by around 4 bcm/a to an initial peak of around 28 bcm/a in 2022-2023. After a slight dip in subsequent years, new development (Babek, Umid, and Absheron Phases 1 and 2) could push output from 2022-2023 up by 10% to a new peak in 2030 (Rystad Energy, 2020). Development of Shah Deniz 3 would further augment output.
Trade
Crude oil trade
Azerbaijan exports only one single crude quality, the relatively light sweet grade Azeri Light (35.2° API and 0.14% S). In 2019, Azerbaijan reported total exports of 31.2 Mt of crude and condensates. Exports peaked at around 44 Mt in 2009-2010 and have declined steadily since then, following Azerbaijan’s falling crude production (Figure 3.3). The decline accelerated slightly in 2019 after the country adhered to the OPEC/Non-OPEC Declaration of Cooperation that obliged it to cut output, and exports fell further in 2020 as these cuts were expanded.
IEA
. All
right
s re
serv
ed.
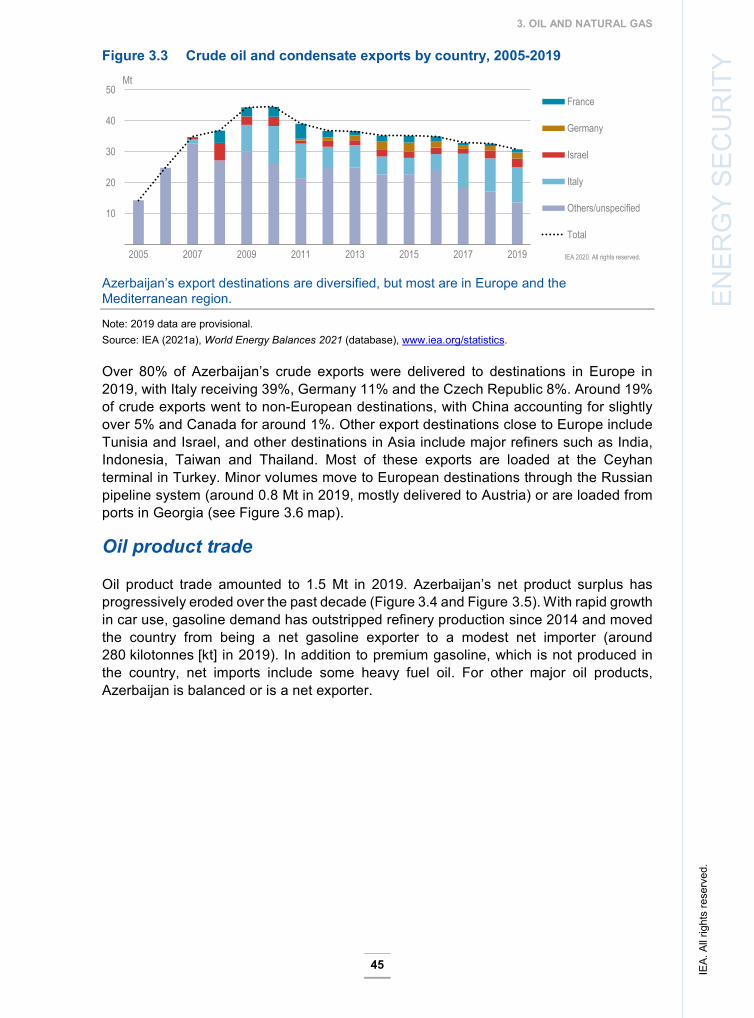
3. OIL AND NATURAL GAS
45
ENER
GY
SEC
UR
ITY Figure 3.3 Crude oil and condensate exports by country, 2005-2019
Azerbaijan’s export destinations are diversified, but most are in Europe and the Mediterranean region.
Note: 2019 data are provisional. Source: IEA (2021a), World Energy Balances 2021 (database), www.iea.org/statistics.
Over 80% of Azerbaijan’s crude exports were delivered to destinations in Europe in 2019, with Italy receiving 39%, Germany 11% and the Czech Republic 8%. Around 19% of crude exports went to non-European destinations, with China accounting for slightly over 5% and Canada for around 1%. Other export destinations close to Europe include Tunisia and Israel, and other destinations in Asia include major refiners such as India, Indonesia, Taiwan and Thailand. Most of these exports are loaded at the Ceyhan terminal in Turkey. Minor volumes move to European destinations through the Russian pipeline system (around 0.8 Mt in 2019, mostly delivered to Austria) or are loaded from ports in Georgia (see Figure 3.6 map).
Oil product trade
Oil product trade amounted to 1.5 Mt in 2019. Azerbaijan’s net product surplus has progressively eroded over the past decade (Figure 3.4 and Figure 3.5). With rapid growth in car use, gasoline demand has outstripped refinery production since 2014 and moved the country from being a net gasoline exporter to a modest net importer (around 280 kilotonnes [kt] in 2019). In addition to premium gasoline, which is not produced in the country, net imports include some heavy fuel oil. For other major oil products, Azerbaijan is balanced or is a net exporter.
10
20
30
40
50
2005 2007 2009 2011 2013 2015 2017 2019
Mt
France
Germany
Israel
Italy
Others/unspecified
Total
IEA 2020. All rights reserved.
IEA
. All
right
s re
serv
ed.

3. OIL AND NATURAL GAS
46
Figure 3.4 Oil product net trade by country, 2005-2019
Azerbaijan’s oil product trade is relatively balanced and regional.
Note: 2019 data are provisional. Source: IEA (2021a), World Energy Balances 2021 (database), www.iea.org/statistics.
Figure 3.5 Oil product net trade by category, 2005-2019
Azerbaijan’s domestic refineries meet demand for most products, excluding premium gasoline.
Note: 2019 data are provisional. Source: IEA (2021a), World Energy Balances 2021 (database), www.iea.org/statistics.
Refining policy has focused on meeting domestic gasoline demand, and the resulting surplus products, mainly gasoil and kerosene, create export opportunities. More generally, SOCAR imports products to cover local needs during peak seasonal demand, periods of refinery maintenance or refinery outages.
Oil export infrastructure
Although much of Azerbaijan's oil and gas infrastructure dates from the Soviet era, its export infrastructure was diversified after independence in the 1990s and 2000s in response to large new upstream projects. Foreign investment has been critical for building the new export routes and maintaining the legacy pipeline network, which remains in need of intensive repairs.
Oil is exported through three pipelines and by rail. Crude oil is mostly delivered by the BTC pipeline to Ceyhan, Turkey, and by the Western Route Export Pipeline (WREP) to Supsa,
- 3.5
- 3.0
- 2.5
- 2.0
- 1.5
- 1.0
- 0.5
0.5
2005 2007 2009 2011 2013 2015 2017 2019
Mt
TurkmenistanItalyTurkeyGeorgiaRussian FederationOthers/unspecifiedNet trade
IEA 2020. All rights reserved.
Net exports
Net imports
- 3.5
- 3.0
- 2.5
- 2.0
- 1.5
- 1.0
- 0.5
0.5
2005 2007 2009 2011 2013 2015 2017 2019
MtMotor gasoline
Fuel oil
LPG
Jet kerosene
Petroleum coke
Gas/diesel oil
Others/unspecified
Net trade
IEA 2021. All rights reserved.
Net exports
Net imports
IEA
. All
right
s re
serv
ed.

3. OIL AND NATURAL GAS
47
ENER
GY
SEC
UR
ITY Georgia, but the Northern Route Export Pipeline (NREP) to Novorossiysk, Russia and rail
connections to the Batumi and Kulevi terminals on the Black Sea coast of Georgia are also used (SOCAR Trading, 2020).
The 1 768-km BTC links the Sangachal terminal (Box 3.2) to the Ceyhan marine terminal in Turkey. It has a capacity of 1.2 mbd. The BTC was inaugurated in May 2005 and its first oil reached Ceyhan in May 2006. While it mainly transports oil from ACG and condensate from Shah Deniz, it also carries oil from Kazakhstan and Turkmenistan. BP operates the Azerbaijani and Georgian sections of the pipeline, and BOTAS International Limited the Turkish section.
The 833-km WREP (Baku-Supsa pipeline) has a capacity of 150 kbd. It was completed in 1999, following an intergovernmental agreement with Georgia signed in 1996. The WREP is owned by the AIOC and operated by BP.
The 1 330-km NREP has been operating since 1983, and originally transported crude oil from Grozny (Russia) to Baku for processing. In 1997, the pipeline was reversed and upgraded to pump crude from the Sangachal terminal to the port of Novorossiysk in the Black Sea basin. The pipeline was then used to export ACG crude until 2007 when this oil shifted to the BTC pipeline. SOCAR continues to use the 105-kbd NREP to diversify export outlets, but volumes averaged around only 25 kbd in 2014-2018 (Wood Mackenzie, 2020). The pipeline is operated collaboratively by Russia’s oil pipeline operator, Transneft, and SOCAR.
Cross-border rail infrastructure can transport around 280 kbd of crude oil, condensate and refined products to Georgia's Black Sea ports of Batumi, Kulevi and Poti, and to Kars in Turkey. Usage has fallen well below capacity, however, as competitive pipeline options are preferred. The Baku-Tbilisi-Batumi/Poti rail line (built in 1883, repaired and restored in 1999) is used by SOCAR and by ACG producers not belonging to the BTC Pipeline consortium; it is also used for gas condensate from Shah Deniz. The Baku-Kulevi line was commissioned in 2008.
Kazakh crude and Turkmen oil products are transported on both lines to the Georgian ports. Azerbaijan's Caspian ports and terminals regularly trans-ship Central Asian crude and refined products to the Black Sea (via pipeline or rail, mainly from SOCAR’s 10 Mt/a Dubendi Oil Terminal, which is 50 km northeast of Baku) and to the Mediterranean (crude via the BTC pipeline). Despite requiring multiple transfers between tankers, pipelines and rail, the routes are competitive with exports via Russia because, unlike in the Transneft system, they segregate the crude, preserving its quality-linked value.
Box 3.2 The Sangachal oil and gas terminal
Sangachal is one of the world's largest oil and gas terminals, and it is the critical hub of Azerbaijan’s oil and gas sector. It receives, processes, stores and exports crude oil and gas from all BP-operated assets in the Caspian basin, particularly from ACG and Shah Deniz. It also receives third-party oil from Kazakhstan and Turkmenistan. The terminal is located in a 600-hectare area on the Caspian Sea coast 55 km south of Baku. It is owned by the Azerbaijani International Operating Company and operated by BP.
IEA
. All
right
s re
serv
ed.

3. OIL AND NATURAL GAS
48
The Sangachal terminal was built in two phases: the Early Oil Project (EOP) and the Sangachal Terminal Expansion Programme (STEP). EOP, built in 1996-1997, handles oil from the Chirag offshore field. Housing four crude storage tanks (25.5 kb each), it can process, store and export 120 kbd of crude via pipeline to Supsa and Novorossiysk. STEP significantly expanded the terminal’s capacity to receive, process and store oil from the Azeri and Deepwater Gunashli sections of the ACG field, and to receive and process gas from the Shah Deniz field. It houses three crude oil storage tanks of 880 kb each, together with the ACG oil processing facilities. It also accommodates the head pump station of the BTC oil pipeline and the compressor of the Baku-Tbilisi-Erzurum gas pipeline (also known as the South Caucasus Pipeline [SCP]). In 2018, the terminal was further expanded to accommodate gas from Shah Deniz.
The terminal can process 1.2 mbd of crude and store around 3.2 mb (4.0 mb maximum). It can also process around 50 million cubic metres per day (mcm/d) (18.2 bcm/a) of gas (30 mcm/d from Shah Deniz and 20 mcm/d from ACG).
During the first three months of 2020, the Sangachal terminal exported about 735 kbd of crude and condensate (640 kbd via the BTC and around 95 kbd through the WREP). BP indicates that processed gas during this period amounted to 51 mcm/d. Most of it was exported via the SCP and SCP expansion system, but some of it was fed into the national gas grid.
Sources: BP (2019), Sangachal terminal, www.bp.com/en_az/azerbaijan/home/who-we-are/operationsprojects/terminals/sangachal_terminal.html; BP (2018), Work on Sangachal terminal expansion project completed by 95%, https://en.trend.az/business/energy/2863889.html.
Gas trade
The Azerbaijani gas market and gas trade remained modest until 2007, when Shah Deniz 1 was commissioned. Since then, gas supply has expanded rapidly. Azerbaijan has developed its own natural gas use, with around 96% of the population today having access to gas, and has put pipeline infrastructure in place for gas exports.
After the commissioning of Shah Deniz 1, the Azerbaijani gas market developed rapidly, and Azerbaijan transitioned from being a net gas importer (from Russia) to a regional exporter, with exports going to Georgia and Turkey (via the SCP) as well as to Russia (2010-2014). Sharply rising domestic demand and a surge in exports (from 1.8 bcm in 2007 to 6.8 bcm in 2011 and 8.1 bcm in 2015) tightened the Azerbaijani gas balance in 2016 and 2017, forcing the country to import gas from Russia and Turkmenistan (via Iran) to meet domestic demand as well as its rising export obligations to Georgia and Turkey.
The launch of Shah Deniz 2 in 2018 enabled Azerbaijan to reduce gas imports and expand exports. The seasonality of Azerbaijani gas demand is likely to continue to create periodic domestic supply shortfalls, sustaining some import volumes. Imports from Turkmenistan fell from 1.8 bcm in 2017 to 0.6 bcm in 2019, while those from Russia increased from 0.3 bcm in 2017 to around 1 bcm in 2018 and dropped again to 0.7 bcm in 2019.
Exports reached 11.8 bcm in 2019, notably to Turkey through the newly launched Trans-Anatolian Pipeline (TANAP). Azerbaijan also exports gas to Georgia (2 bcm in 2018,
IEA
. All
right
s re
serv
ed.

3. OIL AND NATURAL GAS
49
ENER
GY
SEC
UR
ITY including gas from Shah Deniz and SOCAR's own fields). Exports are set to increase
another 4 bcm/a by 2022-2023 as gas production ramps up (see earlier section on gas production).
Azerbaijan’s Nakhichevan exclave has imported gas under a swap agreement with Iran since 2004, in which Baku supplies gas to Iran’s isolated northwest border city of Astara (disconnected from Iran’s gas grid) and Iran transits 85% of it to Nakhichevan while retaining 15% as payment-in-kind for its role. In 2020, Turkey and Azerbaijan fast-tracked a new pipeline to Nakhichevan through eastern Turkey (planned since 2010) with a capacity of around 2 bcm/a (over four times the region's consumption). The pipeline will not begin operating until 2022 at the earliest (Eurasianet, 2020).
Gas export infrastructure
The SGC dominates Azerbaijan’s gas export infrastructure. The project was planned to transport Caspian gas to Europe, initially from Shah Deniz 2, and potentially later from the broader Caspian region. Azerbaijan signed an initial Joint Declaration on the SGC with the European Union in January 2011 and committed to the long-term supply of about 10 bcm/a of gas (ECS, 2011).
The 3 600-km SGC pipeline system comprises four parts: the Shah Deniz 2 gas field; the SCP expansion from the Sangachal terminal to Georgia; the TANAP from Turkey’s border with Georgia to its border with Greece; and the Trans-Adriatic Pipeline (TAP) from Greece’s border with Turkey across Albania and under the Adriatic Sea to Puglia in Italy. SOCAR and BP are key shareholders in each of the four parts of the SGC, but several other national and international energy companies also hold shares in them. The SGC, which was a priority energy project for the European Union, has now been successfully completed. The 16-bcm/a TANAP was commissioned in 2018 and the 10-bcm/a TAP in November 2020, and their capacity can be doubled with additional investments. Gas deliveries to Italy began at the end of December 2020.
In late 2011, the European Union began negotiations with Azerbaijan and Turkmenistan on developing a Trans-Caspian pipeline to transport Turkmen gas to Europe through Azerbaijan and Turkey. Despite negotiations reportedly ongoing, other neighbouring countries have yet to support the project (see Box 3.1). No natural gas is currently transited through the territory of Azerbaijan.
IEA
. All
right
s re
serv
ed.

3. OIL AND NATURAL GAS
50
Figure 3.6 Azerbaijan’s oil and gas infrastructure
IEA 2020. All rights reserved.
Azerbaijan also exports gas to Georgia, for which it is the main gas supplier. SOCAR exports the gas via a legacy Kazi Magomed-Kazakh pipeline, which was commissioned in 1970 and extended to Tbilisi in 1972. The 5-bcm/a pipeline was originally used to deliver Russian and Turkmen gas to Azerbaijan and also to Georgia and Armenia. In 2010, the pipeline was reversed to export Azerbaijani gas under a five-year gas sales agreement that was cut short at the end of 2014 (IEA, 2020b).
Azerbaijan’s pipeline system has been connected with Iran’s through the Kazi Magomed-Astara line since 1971. The line was used as part of a swap to deliver Iranian gas to the Soviet Union, which exported an equivalent amount to Europe. The capacity was 11.4 bcm/a. Azerbaijan reversed the line in 2006 to allow exports to Iran (1-2 bcm/a) to supply the Nakhichevan exclave through swaps.
IEA
. All
right
s re
serv
ed.

3. OIL AND NATURAL GAS
51
ENER
GY
SEC
UR
ITY State oil and gas revenue
Crude oil, oil products and natural gas account for around 60% of the government budget revenue and 90% of Azerbaijan’s annual export revenue. The State Oil Fund of the Republic of Azerbaijan (SOFAZ) alone has provided around half of the government’s revenue in the past decade. From 2010 to 2019, its share ranged from 36.9% in 2017 to 58.2% in 2013 and the median was 49.7% (SOFAZ, 2019). The oil and gas sector share in 2019 totalled 59%: in addition to SOFAZ transfers, it included taxes paid by SOCAR and the foreign contractors of the ACG and Shah Deniz PSAs.
The government established SOFAZ in 1999 as a sovereign wealth fund for oil industry revenues. The main objective of SOFAZ is to accumulate and efficiently manage oil and gas revenues by transforming depletable hydrocarbon reserves into assets in non-oil sectors, both domestically and internationally, which, in turn, generate perpetual income for both current and future generations. According to its rules, SOFAZ is to save and invest 25% of the peak oil and gas revenues it receives. To date, most of its revenues have been used to fund the government budget, but total assets grew from USD 22 billion to USD 43 billion between 2010 and 2019, and they generated an average annual rate of return of 1.8%. As of January 2021, SOFAZ held assets of USD 43.6 billion, almost equalling the country’s GDP.
In 2019, SOFAZ’s revenues totalled AZN 19.0 billion (USD 11.2 billion) and expenditures AZN 11.6 billion (USD 6.8 billion). The revenues were mostly from the sales of oil from ACG (USD 7.9 billion) and gas and condensates from Shah Deniz (USD 0.6 billion). The state share of the ACG profit oil is fixed at 75%, while its share of Shah Deniz gas is based on a sliding-scale recovery factor defined in the PSA. Revenues also included returns from SOFAZ’s investments (USD 2.1 billion), bonus payments (USD 0.45 billion) and other oil and gas sales revenue, transit fees and acreage fees (USD 0.069 billion in total). Transfers to the government budget accounted for 98% of SOFAZ’s expenditures, while the rest was used for social projects and SOFAZ’s administrative expenses (SOFAZ, 2019).
The share of oil and gas in Azerbaijan’s export revenues is relatively stable, ranging from 90% to 94% during 2014-2019. Growing volumes of gas exports increased its share of export revenues from 7% in 2014 to 13% in 2019, while declining volumes and unit prices of crude oil reduced its share from 83% in 2014 to 74% in 2019 (Table 3.2).
Azerbaijan oil and natural gas export revenues, 2014-2019 Exports (USD bn)
2014 2015 2016 2017 2018 2019
Crude oil 24.9 12.4 10.3 12.3 16.3 14.4
Oil products 1.4 0.8 0.4 0.3 0.5 0.5
Natural gas 2.2 1.9 1.1 1.3 1.7 2.6
Oil and gas, total 28.5 15.1 11.8 13.9 18.5 17.5
IEA
. All
right
s re
serv
ed.

3. OIL AND NATURAL GAS
52
Share of total AZ exports, %
2014 2015 2016 2017 2018 2019
Crude oil 83 75 79 79 80 74
Natural gas 7 11 9 8 8 13
Oil and gas, total 94 90 90 90 91 90
Source: SSC (2020b), The Foreign Trade of Azerbaijan.
Demand
Oil demand
In 2019, oil consumption in Azerbaijan was 4.9 Mt (Figure 3.7). Excluding power and heat generation, it rose by just over 47% between 2008 and 2019. Most of the growth came from the transport sector, where oil consumption increased 51% over the period. The government does not publish energy scenarios, but it is reasonable to assume that oil demand in transport will continue to rise as car ownership increases.
The transport sector (mostly road transport) remains by far the largest oil-consuming sector, using 62% of the total in 2019. Road transport consumption is split roughly 60/40 between motor gasoline and diesel. Industry consumption has increased slightly in recent years and accounted for around 28% of the total in 2019. The service sector and agriculture accounted for another 7%, with the remainder attributed to the residential and energy sectors.
Until 2009, fuel oil was a major source of power and heat production, but it has since been phased out. Following a 2002 presidential decree, most oil-fired power plants were modernised and switched to natural gas. However, fuel oil can still be used in emergencies. In fact, some fuel oil had to be imported to run power plants during 2014-2018 because of natural gas shortages. In 2019, a tiny amount of oil was still used in power and heat generation.
Figure 3.7 Oil supply by sector, 2000-2019
Transport demand increased Azerbaijan’s oil consumption over the past decade, while its use in power and heat plants became marginal.
* Includes non-specified consumption in the energy sector ** Includes commercial and public services, agriculture, forestry and fishing. Note: Total consumption includes international aviation (which does not appear in TES) and excludes international marine bunkers. Source: IEA (2021a), World Energy Balances 2021 (database), www.iea.org/statistics.
1.0
2.0
3.0
4.0
5.0
6.0
7.0
2000 2002 2004 2006 2008 2010 2012 2014 2016 20182019
MtResidential
Power and heat generation
Other energy*
Services/other**
Industry
Transport
IEA 2021. All rights reserved.
IEA
. All
right
s re
serv
ed.

3. OIL AND NATURAL GAS
53
ENER
GY
SEC
UR
ITY Gas demand
Natural gas is the main source of primary energy in Azerbaijan, accounting for two-thirds of the total in 2019. As the country’s gas production has increased, so has gas demand, reaching 11.1 bcm in 2018 and 12.6 bcm in 2019 (Figure 3.8). Natural gas has taken the place of fuel oil in power and heat plants, and today it accounts for more than 90% of the country’s electricity generation. The government’s policy of expanding the gas network to reach the whole population has led to inexpensive gas becoming the main heating fuel. Demand is seasonal: it is lowest in May and June (around 0.7 bcm per month) and highest in December-February (around 1.5-1.8 bcm per month).
Figure 3.8 Natural gas supply by sector, 2000-2019
Gas demand in Azerbaijan is dominated by power and heat plants, followed by households.
* Includes commercial and public services, agriculture and forestry. ** Includes non-energy consumption. *** Includes the energy sector’s own consumption and losses in oil and gas production. Note: 1 bcm equals 0.85 Mtoe. Source: IEA (2021a), World Energy Balances 2021 (database), www.iea.org/statistics.
Power generation and co-generation8 accounted for around 49% of Azerbaijani natural gas use in 2019, the residential, service and tertiary sectors combined for 33%, industry for 8%, the energy industry itself for around 4% (oil and gas extraction, refining and pipelines), and petrochemical feedstocks for less than 1%. Losses amounted to over 5% of total gas supplied to the Azerbaijani market. While the figure for losses is down from a peak of 12% in 2009-2010, it is well above the 1% global average.
Although gas use in transport remains very limited, SOCAR has developed compressed natural gas vehicle fuels in the Baku area, helping cut oil product imports and reduce fuel costs for drivers. Out of Baku’s 2 200 buses, around 600 run on compressed natural gas (CNG) (Azernews, 2020).
8 Co-generation refers to the combined production of heat and power.
2
4
6
8
10
12
14
2000 2002 2004 2006 2008 2010 2012 2014 2016 20182019
bcm
Transport
Services/other*
Industry**
Other energy***
Residential
Power and heat generation
IEA 2021. All rights reserved.
IEA
. All
right
s re
serv
ed.

3. OIL AND NATURAL GAS
54
Regulation
Laws The two main segments of Azerbaijan’s oil and gas sector are export-oriented production and the state-controlled domestic market. The main laws governing oil and gas development and operations were adopted in the 1990s and include (ECS 2011):
The 1996 Energy Resources Law, which sets out the social, economic and legal bases of state policy relating to use of energy resources.
The 1998 Subsoil Law, covering subsoil resources in Azerbaijan and within the Azerbaijani sector of the Caspian Sea (including, but not limited to, oil and gas). It governs the exploration, use, protection, safety and supervision of the use of subsoil resources, and it stipulates that no person or legal entity may engage in oil or gas exploration and production without a licence. Moreover, a production licence must be issued for a particular subsoil block.
The 1998 Energy Law, which complements the Subsoil Law. It regulates the exploration, exploitation, production, processing, storage, transportation, distribution and use of all “energy materials and products”, including oil and gas. It stipulates that the production rights for a specified block are granted exclusively on the basis of a contract, detailing the terms and conditions of such a contract and the procedure for its conclusion.
The 1998 Law on Gas Supply, concerning all types of gas in Azerbaijan (including natural gas) and regulating the industry in various areas, including production, processing, transportation, storage, distribution, marketing and use.
The 1998 Law on Natural Monopolies (amended in 2001), which regulates natural monopolies in relevant commodity markets and their relations to consumers and state bodies. It applies particularly to monopolies involved in pipeline transportation, storage and distribution of natural gas.
The 1992 Law on the Protection of Foreign Investment, covering the purchase/lease of rights to land and natural resources. It deals with the creation of enterprises and representative offices wholly owned by foreign investors, and with their participation in JVs with Azerbaijani citizens or organisations. It guarantees foreign investors the right to repatriate earnings and profits, after payment of all taxes and duties, and provides protection against subsequent adverse changes to legal or regulatory regimes (though not for legislation on taxation, military defence, national security or environmental protection).
The 2009 Law on the Application of Special Economic Regulations to Oil and Gas Activity for Export Purposes, which provides economic incentives for Azerbaijani suppliers of goods and services for oil and gas projects outside the country.
As part of the 2019 push for energy sector reform (see Chapter 2), the Ministry of Energy (MoE) is preparing a revision of the 1998 Law on Gas Supply that would include a phased transition to a gas supply market with the aim of improving overall sector performance. The Law on the Regulator is also pending approval. Once in force, it will empower the Azerbaijan Energy Regulatory Agency (AERA, established in 2017) to regulate natural gas and other utility operations.
IEA
. All
right
s re
serv
ed.

3. OIL AND NATURAL GAS
55
ENER
GY
SEC
UR
ITY Regulatory bodies
Since the early 1990s, Azerbaijan has been transitioning gradually to separate policy, regulatory oversight and industry operations in the oil and gas sector. Before the Fuel and Energy Ministry (FEM) was created in 2001, SOCAR itself, since its creation in 1992, had been in charge of regulating the oil and gas industry, while the President of Azerbaijan directly controlled SOCAR and made all final decisions on contracts with foreign investors. When the FEM came into being in 2001, it was given jurisdiction over the state-owned energy companies (SOCAR and Azerenergy) and the authority to prepare legislation, determine energy policy, set tariffs and ensure energy security. While FEM negotiated PSAs, SOCAR still signed the final agreements.
The MoE was created in 2013 to replace FEM and was given expanded powers to issue licences as well as oversee state enterprises and ensure they follow the state's interests. It was also put in charge of preparing, negotiating and monitoring PSAs as well as signing subsoil agreements. This division of responsibilities was intended to address potential conflicts of interest with SOCAR that had previously existed. It is not clear, however, whether the MoE is fully exercising these powers yet (Wood Mackenzie, 2020).
With the establishment of AERA in December 2017 and the pending Law on the Regulator, the government is taking steps to more clearly separate energy policymaking and oversight of the state-owned monopoly. This is consistent with the market reform objective of the pending revision of the Law on Gas Supply (see above).
Retail tariffs The Tariff Council sets the wholesale and retail prices of all oil products and natural gas (and electricity and district heat) except for imports of premium gasoline, the price of which is determined by retailers.
Retail prices for oil products and natural gas are not directly linked to the international market. While various methods exist to set energy tariffs, they are generally determined based on a “cost-plus” methodology. By international standards, gasoline and diesel prices in Azerbaijan are very low, but they are in line with those of many other producing countries. Retail oil prices are changed relatively seldom, and the changes appear to lack transparency, despite their substantial impacts on consumers. In January 2015, the Tariff Council increased the retail price per litre of AI-92 gasoline from AZN 0.70 to AZN 0.72 (USD 0.42) and that of diesel from AZN 0.60 to AZN 0.62 (USD 0.36). In July 2017, at the request of SOCAR, the Tariff Council increased the retail price per litre of AI-92 gasoline by AZN 0.2 to AZN 0.90 (USD 0.52). In July 2020, SOCAR hiked the price of imported premium Euro-95 gasoline from AZN 1.1 to AZN 1.2 per litre to align it with import costs (Ona, 2020). The Tariff Council raised the retail price of RON-92 gasoline to AZN 1 (USD 0.59) and that of diesel to AZN 0.8 (USD 0.47) per litre in January 2021.
Natural gas tariffs have been relatively stable and are among the lowest in the region (Figure 3.9). There were few price adjustments during 2008-2019, and the latest changes relate to the introduction of “inclining block tariffs”. The preferential limit for residential gas tariffs was increased from 1 500 cubic metres per year (m3/a) to 1 700 m3/a in December 2016 and further to 2 200 m3/a in May 2019. As a result of these changes, more than 1.8 million subscribers and more than 7 million citizens are now in the lowest price category, and the proportion of gas subscribers in this category has increased from 70% to 85%.
IEA
. All
right
s re
serv
ed.

3. OIL AND NATURAL GAS
56
Like many other producer countries, the Azerbaijani government subsidises citizens and businesses by providing low-cost energy, particularly low-cost natural gas. All consumers, irrespective of income, benefit from the low regulated gas tariffs. However, restricting energy prices to below market levels leads to inefficient energy use and weakens incentives to invest in improvements and stop leaks in gas transportation and the distribution grid. The IEA measures the cost of fossil fuel subsidies in Azerbaijan and other exporting countries as the difference between export prices and domestic end-user prices. This price-gap analysis therefore puts the cost of Azerbaijan’s annual oil subsidies at around USD 900 million and gas subsidies at around USD 600 million in 2017-2019 (see Chapter 2). For example, the average gas export price in 2019 was USD 190 (AZN 330) per 1 000 m3, which was significantly higher than the tariffs for domestic consumers (Table 3.3).
Natural gas tariffs in Azerbaijan No. Service Tariff (AZN/1 000 m3), incl. VAT
1. Natural gas processing 5.5
2. Transportation of natural gas (per 100 km) 2
3. Wholesale price to the distributors 75
4. Retail price of natural gas
4.1. Residential customers
4.1.1. with annual consumption up to 2 200 m3 100
4.1.2. with annual consumption higher than 2 200 m3 200
4.2 Non-residential customers 200
5. Electricity generators (consuming at least 10 mcm/month) 120
USD 1 = AZN 1.70 Source: Tariff Council (2021), Processing, transportation, wholesale and retail tariffs of natural gas.
Figure 3.9 Natural gas prices for households in selected countries, 2019
IEA. All rights reserved.
Gas prices for households in Azerbaijan are very low by international standards.
Notes: PPP = purchasing power parity. MWh = megawatt hour. Source: IEA (2021b), World Energy Prices 2021 (database), www.iea.org/statistics.
0
20
40
60
80
100
120
140USD PPP/MWh
IEA
. All
right
s re
serv
ed.

3. OIL AND NATURAL GAS
57
ENER
GY
SEC
UR
ITY Domestic operations and infrastructure
Midstream Oil transportation and storage SOCAR owns and operates Azerbaijan's domestic crude oil pipeline system, which comprises over 770 km of onshore and 1 975 km of offshore pipelines and nine pump stations.
Overall, Azerbaijan has some 7.1 mb of storage capacity for crude oil, condensate and oil products, equalling less than ten days of their combined production. The storage is for operational purposes, and most of the capacity is at the terminals of Sangachal (4.0 mb) and Dubendi (2.2 mb). Other storage facilities include Ali-Bairamly (four tanks of 35 kb each), Dashgil (two tanks of 140 kb each), Puta (six tanks of 35 kb each) and Surakhany (six tanks of 35 kb and three tanks of 14 kb each).
Gas transportation and storage SOCAR subsidiary Azerigaz owns and operates the domestic gas pipeline system and implements the state programme of expanding gas supply to the country's municipalities. The gas supply system includes around 4 500 km of trunk lines and more than 36 000 km of low- and medium-pressure distribution grids, 7 compressor stations and 150 gas distribution stations. In 2019, around 1 700 km of new lines were added, and 680 km of the existing grid (less than 2% of the total length) refurbished. Losses remain high by international standards at more than 5% of total gas supplied.
Azerbaijan has two underground gas storage facilities, both in depleted gas reservoirs: the 1.5-bcm Galmaz (75 km south-west of Baku) and the 2-bcm Garadagh. In May 2019, a new compressor station at Galmaz boosted storage capacity by 0.5 bcm and pumping capacity by 30% to 13 mcm/day, helping to meet demand during peak winter periods and facilitating the transportation of Azerbaijani gas. Gas storage also helps minimise the effects of any production outages. SOCAR is considering action to expand total capacity at Galmaz and Garadagh to 5 bcm by increasing operating pressures.
Downstream In addition to oil and gas production, storage and transportation, SOCAR is involved in oil refining, gas processing and petrochemicals production at several locations. It also has a monopoly in gas retail, but not in oil retail, where there is market competition. SOCAR has modernised and expanded its production facilities in recent years, and it is planning a major integrated oil, gas and petrochemical complex (OGPC) in Garadagh, close to the Sangachal terminal (see Box 3.3).
IEA
. All
right
s re
serv
ed.

3. OIL AND NATURAL GAS
58
Box 3.3 SOCAR
The Azerbaijani government created SOCAR in 1992 to manage oil and gas production, refining, exports and imports on behalf of the state. Today, SOCAR is the country’s largest company in terms of tax revenue, employment and international presence.
SOCAR explores for oil and gas; produces, transports, processes and refines oil, gas, and gas condensate; negotiates contracts for the state; markets oil products and petrochemicals in both domestic and international markets; and supplies natural gas to industry and the public in Azerbaijan. It has a domestic market monopoly in natural gas and in oil refining and oil product distribution. It also has subdivisions and trusts operating as corporate entities (SOCAR, 2020). Overseas, SOCAR owns a refinery in Turkey, has oil product marketing activities in several countries (Georgia, Turkey, Romania, Switzerland, Germany and Ukraine) and international oil trading offices.9
SOCAR holds the state’s stakes in all upstream PSAs and RSCs in Azerbaijan as well as in oil and gas export pipelines. Other international partners in the PSAs often carry SOCAR's financial obligations through one or more contract phases (e.g. the exploration phase).
It also participates in around 30 JVs, such as the Caspian Drilling Company (offshore drilling operations), Cross Caspian Oil and Gas Logistics LLC, Azfen (construction), Baku Shipyard LLC, BOSShelf LLC (offshore construction), Oil and Gas ProServ LLC, SOCAR Foster Wheeler Engineering Service, SOCAR KBR, and SOCAR Petrofac.
The state company’s oil output has averaged around 150 kbd since 2016, equivalent to roughly 20% of Azerbaijani output. Its production is relatively stable, and its share in overall production has been rising slightly. SOCAR’s oil production costs averaged USD 9.37/bl in 2018, up 5.8% from 2017. SOCAR’s gross natural gas output has averaged around 6.4 bcm/a since 2016, or a bit more than one-fifth of Azerbaijani output.
SOCAR’s revenues, which come mainly from the ACG and Shah Deniz fields, amounted to USD 49 billion in 2019, with a net profit of USD 382 million. International sales and trading (conducted through SOCAR Trading in Switzerland) accounted for 76% of total revenues. By product category, most revenue (61%) came from crude oil sales, 26.5% from oil products, 4.7% from petrochemical products, and 4.9% from natural gas (SOCAR, 2020).
The Azerbaijani state continues to provide financial and strategic support to SOCAR. The government supports the company through investments, subsidies, loans and tax breaks, and by facilitating the raising of capital. In turn, SOCAR pays taxes, invests and supplies oil and natural gas domestically at prices that the government sets substantially below world market prices. In his August 2020 speech about liberalising the economy, President Aliyev called for broader reforms in the sphere of privatisation (BRI, 2020).
9 In Geneva, London, Singapore, Dubai and Houston, plus several other representative offices.
IEA
. All
right
s re
serv
ed.

3. OIL AND NATURAL GAS
59
ENER
GY
SEC
UR
ITY Oil refining
SOCAR has recently concentrated its refining operations at the Heydar Aliyev Refinery (HAR) northeast of Baku and closed and demolished the older Azerneftyag refinery in the city of Baku. The HAR has a capacity of 6 Mt/a, or around 130 kbd. For the past 10 years, total refinery runs have fluctuated from 115 kbd to 130 kbd, averaging 120 kbd.
The HAR produces liquefied petroleum gas (LPG), gasoline, kerosene and diesel, primarily for the domestic market, as well as low-sulphur coke. Its output meets most Azerbaijani needs for heavy fuel oil and light products, except for small shares of gasoline and kerosene. The HAR also provides feedstock for the Azerikimya complex in Sumgayit, north of Baku.
To accommodate closure of the Azerneftyag refinery and to add bitumen blowing capacity to maintain asphalt production, HAR capacity is being expanded. The renovation project, which includes upgrading as well as expansion, is expected to be completed in 2023 and increase throughput up to 7.5 Mt/a, or 150 kbd (SOCAR, 2021). It will reduce import requirements and boost gasoline and diesel quality from Euro 2 to Euro 5, which will also help improve air quality in and around Baku (BRI, 2020). The upgrades will ensure HAR’s reliable operations for another 15 years – long enough to integrate an entirely new refinery at the gas processing and petrochemicals production complex planned to be constructed in Garadagh (see below).
Gas processing and monetisation Azerbaijan’s gas processing capacity has been expanded to accommodate its rise in gas production, and it now totals around 25 bcm/a. Gas is processed at two facilities: the Sangachal terminal (around 18 bcm/a; see Box 3.2) and Garadagh (6.5 bcm/a). The Garadagh gas processing plant is linked to a 2-bcm gas storage facility, and both are operated by SOCAR. The Garadagh plant produces dry gas, natural gasoline, butane, a propane-butane mixture, heavy condensates, and other products (SOCAR, 2020). Despite several expansions and upgrades since being commissioned in 1961, it is now relatively old and there are plans to replace it with a new 10-bcm/a plant in the Garadagh OGPC (see below).
Having ample gas supplies has allowed Azerbaijan to develop industrial activities to monetise the gas at three facilities: the SOCAR Methanol plant (also in Garadagh) and the SOCAR Azerikimya and SOCAR Carbamide complexes in Sumgayit. There are plans to replace the Sumgayit complexes with new capacity to be built at the Garadagh OGPC.
The SOCAR Methanol plant was commissioned in 2013. It has a capacity of 650-700 kt/a of high-purity methanol. Production is mostly exported to Turkey, Western Europe and the Mediterranean region (SOCAR, 2020).
The SOCAR Azerikimya complex holds an ethylene-polyethylene plant (EP-300) and a polymer plant as well as an isopropyl alcohol production unit. It also produces steam and electricity (32 MW capacity). Plant modernisation in 2017-2021 boosted production capacity and product quality, and in 2018 the complex produced over 337 kt of products such as polyethylene, ethylene, propylene, liquid and heavy pyrolysis resin, butane-butylene fractions and absolute isopropyl alcohol. Around 70% of production is exported, including to Turkey, Russia, the Caucasus, Central Asia, Eastern and Western Europe, China and Viet Nam (MENAFN, 2019).
IEA
. All
right
s re
serv
ed.

3. OIL AND NATURAL GAS
60
The SOCAR Carbamide fertiliser complex was commissioned in January 2019. It will
gradually increase production to 2023, when it is expected to use around 435 mcm/a of natural gas to produce 400 kt/a of liquid ammonia and 650 kt/a of granulated urea. Around 70% of its production will be exported, while the remaining 30% is expected to entirely eliminate the need to import nitrogen fertilisers (Globuc, 2019).
Garadagh oil, gas and petrochemical complex SOCAR is planning to build an integrated OGPC in Garadagh, 15 km south of Baku. The complex would be built in phases, with the first one comprising a gas processing plant (10 bcm/a) and several petrochemical plants: a gas-powered ethylene pyrolysis plant (610 kt/a), a propylene plant (130 kt/a) and a polyethylene plant (600 kt/a) as well as Butene-1 and Hexene-1 plants and a heat and power plant. The complex plans to use the NGLs recovered from gas plants as a low-cost feedstock. SOCAR has not made a final investment decision on the project. A possible second phase would include an oil refinery complex able to produce Euro 5-compliant diesel and gasoline.
The integrated complex is designed to increase the hydrocarbon sector’s production capacity, improve product quality, expand product range and generally raise the value-added revenues Azerbaijan derives from its oil and gas resources. It would also enable SOCAR to shut down and demolish old facilities in Baku and Sumgayit, which would make the areas available for urban development and reduce potential health risks to the population.
Retail oil market Unlike retail gas supply, retail oil supply is not under a monopoly. Retail prices for diesel and RON-92 gasoline are set by the government, but prices for imported RON-95 follow international market rates. Azpetrol is the largest retail oil supplier, with 94 fuel stations at the end of 2020, while Lukoil has around 70 and SOCAR has 35 (Petrolplaza, 2020). A growing number of fuel stations also offer CNG.
Retail gas market The domestic gas market has been operated by SOCAR’s subsidiary Azerigaz since 2009. The company transports, distributes and markets natural gas in Azerbaijan, and, through its Gas Export Department, it also exports SOCAR gas to Georgia, Iran and Russia. In 2019, the company transported a total of 12.6 bcm within or outside the country, supplying 2 247 000 natural gas customers – 31 000 of which are non-residential, including the gas-fired power plants that generated 92% of Azerbaijan’s electricity in 2019. All the natural gas prices are set by the government (the Tariff Council) at a very low level by international standards (Finans, 2019).
In a recent move, the government adopted on 28 December 2020 a decision to restructure the domestic natural gas supply. The decision entrusts the state-owned company Azercontract with organising natural gas purchases from producers and its transportation, distribution and sale to the domestic consumers from 1 January 2021. According to the decision, Azercontract will buy natural gas from producers and sell it to Azerigaz for domestic use.
IEA
. All
right
s re
serv
ed.
3. OIL AND NATURAL GAS
61
ENER
GY
SEC
UR
ITY Security of supply
The Ministry of Emergency Situations, established in 2005, is responsible for emergency response mechanisms in all sectors of the economy, including oil and gas production and processing facilities and main pipelines. SOCAR has its own emergency response system for emergency situations.
As a net exporter of oil and gas with domestic refining and storage capacity, Azerbaijan has not developed emergency storage or stock monitoring systems. The country has mitigated the risk of supply/demand shocks by diversifying its export routes and its oil product import sources.
Assessment Azerbaijan’s economy and energy supply depend heavily on oil and gas. The two fuels bring in around 90% of the country’s export revenue and finance around 60% of the government budget. They also supply 98% of primary energy and more than 90% of the country’s electricity.
Oil and, more recently, gas have been largely responsible for the significant increase in the living standards in Azerbaijan since the late 1990s. At the same time, their dominance of the economy has left the country exposed to swings in global oil prices. After the oil price decline in 2014-2015 resulted in a contraction of GDP, the government launched measures to stimulate other sectors of the economy. These efforts are gradually bearing fruit, with non-petroleum economic activity rising to 59% of GDP in 2018. The global economic recession of 2020 and the collapse in oil prices in spring 2020 underline the importance of further efforts to diversify the economy.
The government is also preparing to reform the gas and electricity markets to increase economic efficiency. The major question is how to increase efficiency, attract investments and new entrants and diversify the energy supply in the current context of heavily subsidised natural gas prices.
Role of gas set to increase as oil production declines Oil production, which had already begun in the mid-19th century, peaked at over 1 mbd of crude and 40 kbd of gas condensate in 2009-2010, and has gradually declined since then. By 2019, crude production had fallen to 779 kbd, only partly offset by growth in condensate output to 80 kbd. In 2020, as part of the OPEC+ response to the Covid-19 impact on oil demand, Azerbaijan agreed to cut production from 720 kbd in October 2019 to an average of 580 kbd from June to December 2020. In 2021, OPEC+ has decreased the production cuts, enabling Azerbaijan to gradually increase its production to 620 kbd in July 2021.
In contrast to the decline in oil production, natural gas production continues to increase. Most gas comes from the Shah Deniz field, where Phase 1 production started in the mid-2000s and helped turn the country from a gas importer into an exporter. Production started at Shah Deniz 2 in 2018, and the field will reach full production – around 16 bcm/a – by 2022, helping lift the country’s total output from 24 bcm in 2019 to around 28 bcm/a in 2022-2023. Further increases from other fields towards 2030 are foreseen.
Shah Deniz 2, a development of international significance, is the gas source for the SGC project, which transports Caspian gas across Georgia and Turkey to Europe. The 16 bcm/a
IEA
. All
right
s re
serv
ed.
3. OIL AND NATURAL GAS
62
maximum production has been sold under long-term contracts to companies in Turkey (6 bcm) and Greece, Bulgaria and Italy (10 bcm). Gas deliveries to Italy, the SGC’s final destination, began at the end of 2020. Overall, the SGC is a remarkable achievement, and SOCAR is one of its key shareholders.
Azerbaijan is an important and reliable gas exporter that, through the SGC, has helped Europe diversify its gas supply routes and improve gas security. This is significant, as domestic production in Europe is steadily declining at the same time as the IEA anticipates European demand to rise importantly, by around 45 bcm/a by 2025 (IEA, 2020c). With capacity increases, the SGC could transport twice what Shah Deniz 2 can produce, which could open the way to Azerbaijan becoming a regional gas hub. Azerbaijan’s interconnected gas system and the seasonal swings in its gas demand add to this potential.
Azerbaijan has succeeded in creating a stable upstream oil and gas investment climate: PSA terms have been maintained and companies have had tax stability. The best example is the ACG contract area (developed under the 1994 Contract of the Century between the government and a BP-led consortium), which is the source of around 70% of the country’s crude oil production and more than USD 140 billion in government revenue since 1997 (Azernews, 2019). It also contains almost 70% of the country’s remaining commercial liquids. In 2017, Azerbaijan reached a major milestone when it extended the ACG PSA from 2024 to the end of 2049, an additional 25 years.
At 2019 production levels, Azerbaijan’s oil reserves will last for up to 25 years and its gas reserves for up to 79 (see Table 3.1). However, despite projects to develop natural gas and condensate production in upcoming years, a steady decline in liquids output seems likely without significant reforms to make oil exploration and production more attractive.
Azerbaijan’s future success as an internationally competitive producer will depend on how well it manages the costs of new developments. The focus should be on collaborative access to resources and contracting strategies as well as local capability development, notably in digital technologies. In addition, an important emerging factor is the environmental footprint of production (see below).
In the short and medium term, Azerbaijan’s position as a gas exporter may become stronger, with domestic production in Europe declining faster than demand and many IOCs indicating that they will gradually switch their focus from oil and gas to clean energy and electricity. However, the long-term outlook for exports – and therefore for government revenue – is uncertain, as importing countries increasingly adopt ambitious policies to limit GHG emissions.
Global push for clean energy will affect oil and gas revenues Several of the world’s largest energy importers (the European Union, Japan and South Korea) have recently pledged to reduce GHG emissions to net-zero by 2050, and China is aiming for the same by 2060. These targets imply little demand for oil or gas without carbon capture, utilisation and storage (CCUS) three decades from now. Technology breakthroughs and policy changes in other importing countries may further accelerate this transition, and competition for export opportunities among producing countries may well intensify, raising the risk of many oil and gas assets becoming stranded.
IEA
. All
right
s re
serv
ed.

3. OIL AND NATURAL GAS
63
ENER
GY
SEC
UR
ITY The government should prepare Azerbaijan’s economy and its own finances for an
eventual decline in oil and gas revenues. It has acted with foresight and saved around one-quarter of its revenue in the sovereign wealth fund, SOFAZ, which holds assets equivalent to around 100% of the country’s GDP. However, if oil and gas revenue inflows to SOFAZ were to dry up, outflows to the government budget at the current rate would deplete the fund in just six years. To enlarge its financial buffer, the government could consider saving a higher share of oil and gas revenues in the fund and find ways to raise the relatively low average rate of return (1.8%/a from 2010 to 2019) of the fund’s investments.
In its efforts to manage Azerbaijan’s oil and gas resources, the government could look to Norway for inspiration. It is worth noting that, while natural gas fuels almost all electricity production and space heating in Azerbaijan, Norway exports practically all the gas it produces, generating almost all its electricity from renewable sources and using that electricity to heat its buildings. Azerbaijan has excellent untapped renewable energy potential and could consider aiming for something similar (see Chapter 8). Azerbaijan’s 2030 target of roughly doubling the share of renewable energy to 30% of total electricity generating capacity is a welcome move in the right direction.
The government should also prepare for the possibility of importing countries gradually placing stricter requirements on the GHG intensity of oil and gas production. SOCAR succeeded in eliminating gas flaring altogether in 2020 (see Chapter 6), and it is also working to reduce methane emissions with its partner companies and in its own activities. An additional way to reduce GHG intensity would be to integrate low-carbon electricity into oil and gas production. The IEA encourages the government to continue working closely with leading companies operating in the country’s oil and gas sector to reduce sectoral emissions to help meet Azerbaijan’s 2030 climate targets. Most of the IOCs operating in Azerbaijan have set net-zero targets; for example, BP will have to implement measures to reduce emissions associated with production and consumption in Azerbaijan. The government should therefore develop a strategy that encompasses IOC plans to discover what it would mean for the country.
To increase value-added production from Azerbaijan’s oil and gas resources, SOCAR has recently increased and modernised its petrochemicals capacity, helping to eliminate imports, create new exports and reduce local pollution. This work continues with plans to construct the Garadagh integrated OGPC. As the complex would replace facilities currently located close to cities, it would improve the safety and air quality of those populations and the IEA therefore encourages constructing the OGPC.
Beyond being used to produce petrochemicals, natural gas could also be converted into fuels such as hydrogen, using CCUS to avoid emissions. As hydrogen is increasingly being recognised as a decarbonisation option, its global demand may begin to grow quickly, potentially providing an opportunity for Azerbaijan to diversify its exports. Because CCUS technology could be used both to help mitigate CO2 emissions from gas processing and oil refining and to enhance oil recovery, its potential in Azerbaijan should be studied.
One further way to increase oil and gas revenue is to raise the efficiency of domestic transportation, distribution and use. Reducing leakage by investing in pipelines would help, as would reducing currently high oil and gas subsidies: this would encourage energy efficiency investments, save energy for other uses and strengthen incentives for clean
IEA
. All
right
s re
serv
ed.
3. OIL AND NATURAL GAS
64
energy use in electricity and heat generation. Opening the domestic market to competition would also encourage more efficient operations.
Domestic market reform would yield multiple benefits Domestically, oil and gas provide 98% of primary energy, and gas is used for more than 90% of electricity generation. SOCAR controls all segments of the oil and gas sector apart from retail oil supply. Efficiency could be increased by introducing competition, reforming tariffs to at least cover supply costs and eliminate cross-subsidies, and abolishing SOCAR’s role in social and employment policy.
To improve sector performance, the IEA encourages the government to consider transitioning gradually to a liberalised domestic market, particularly for gas. As a very welcome first step, the regulator (AERA) was established in December 2017. Next, in the interests of transparency, the government should ensure AERA’s independence from the MoE, the policy maker, and grant it the legal right to take binding decisions and issue gas market rules and network codes, including on tariffs.
The government is preparing to revise the Law on Gas Supply, and the IEA encourages it to model gas market reform on international best practices. At minimum, network operations should be separated from gas production and sales, and non-discriminatory third-party access to the network should be allowed. The level of ambition and the pace of reform need to be consistent with electricity market reform measures, given that subsidised gas is the dominant fuel for electricity production and that low tariffs on gas used for power generation make renewable energy and efficiency measures less appealing. Even lower gas prices for households disincentivise other heating options, such as gas-based combined generation of power, district heating and cooling (see Chapter 5).
Regardless of how open the market is, it is essential that regulations enable operational profitability. As in many other producer countries, Azerbaijan’s government has chosen to subsidise citizens and businesses by providing low-cost energy in the form of oil, natural gas, electricity and district heat. This tariff policy leads to the inefficient use of natural resources that could (and should) be better used elsewhere.
The availability of artificially inexpensive gasoline and diesel encourages citizens to purchase inefficient vehicles, and the impacts of this policy will become more obvious – and the implied subsidies larger – as the car fleet continues to expand. In the gas sector, subsidies help gas outcompete other, potentially more efficient, options for generating heat and electricity (see Chapters 4 and 5). Gas tariffs that do not cover costs not only constrain SOCAR/Azerigaz financially, they undermine incentives to improve gas networks and, if markets are opened to competition, discourage new entrants.
The currently low tariffs reduce SOCAR’s profits and the autonomy of its decision-making, as does the retention of significant labour surpluses. To help improve the financial viability of SOCAR, and that of Azerbaijan’s domestic energy supply in general, the government should gradually eliminate state-owned energy companies’ involvement in social protection and employment policy. Instead of subsidising oil and gas prices for all consumers, the government should provide direct support to low-income and vulnerable ones. Paying a fair market price would motivate consumers to use energy more efficiently and provide a clear incentive for suppliers to improve productivity. Oil and gas saved through improved efficiency could be exported at much higher prices or turned into higher-value-added petrochemicals.
IEA
. All
right
s re
serv
ed.

3. OIL AND NATURAL GAS
65
ENER
GY
SEC
UR
ITY Recommendations
The government of Azerbaijan should:
Prepare for potentially large swings in fossil fuel revenues and for a decline in oil and gas income in the long term by actively pursuing efforts to diversify the economy and the range of goods and services that are exported.
Upstream
Manage costs for new developments to keep the sector internationally competitive, focusing on collaborative access to resources and contracting strategies as well as local capability development, notably in digital technologies.
Work closely with the world’s leading companies present in Azerbaijan’s oil and gas sector on reducing sectoral emissions to help meet Azerbaijan’s 2030 climate targets.
Domestic market
Consider the case for a gradual transition to liberalised domestic markets for oil and gas, which would help incentivise investment in new gas developments.
Ensure the independence of the regulator in the interests of transparency and give it the power to issue gas market rules and network codes.
Gradually shift the burdens of social support and subsidisation away from SOCAR to enable it to focus on its corporate role, and instead provide government support directly to low-income and vulnerable consumers.
Accelerate the renovation of ageing oil and gas pipelines to reduce losses and raise their performance to international standards.
Accelerate the Garadagh integrated OGPC project to enable the closure of existing facilities near urban centres.
IEA
. All
right
s re
serv
ed.

3. OIL AND NATURAL GAS
66
References
Azernews (2020), President Aliyev urges highest standards in country’s transportation system [UPDATE], www.azernews.az/nation/161949.html.
Azernews (2019), BP reveals Azerbaijan's revenues from ACG, www.azernews.az/nation/159878.html#:~:text=Azerbaijan's%20direct%20revenues%20from%20the,Georgia%20and%20Turkey%20Bakhtiyar%20Aslanbayli.
BP (2020), Statistical Review of World Energy 2020, www.bp.com/statisticalreview.
BP (2019), Sangachal terminal, www.bp.com/en_az/azerbaijan/home/who-we-are/operationsprojects/terminals/sangachal_terminal.html.
BP (2018), Work on Sangachal terminal expansion project completed by 95%, https://en.trend.az/business/energy/2863889.html.
BP (2006), BP in Azerbaijan, www.bp.com/content/dam/bp/business-sites/en/global/corporate/pdfs/investors/bp-ic-azerbaijan-fieldtrip-presentation-slides-sept06.pdf.
BRI (Baku Research Institute) (2020), SOCAR: Big problems at the largest company in Azerbaijan, https://bakuresearchinstitute.org/socar-big-problems-at-the-largest-company-in-azerbaijan/.
Caspian News (2018), Azerbaijan to dig deeper beneath Caspian and open Shah Deniz 3 energy field, https://caspiannews.com/news-detail/azerbaijan-to-dig-deeper-beneath-caspian-open-shah-deniz-3-energy-field-2018-2-6-46/.
Ciarreta, A. and S. Nasirov (2010), Analysis of Azerbaijan oil and gas sector, www.investment-hr.com/oil_gas_docs/azerbaijan%20oil%20gas%20sector%20report.pdf.
ECS (Energy Charter Secretariat) (2020), In-Depth Review of the Energy Efficiency Policy of the Republic of Azerbaijan, ECS, Brussels.
ECS (2011), Follow-up In-Depth Review of the Investment Climate and Market Structure in the Energy Sector, ECS, Brussels.
Eurasianet (2020), Turkey to build gas pipeline to supply Nakhchivan, https://eurasianet.org/turkey-to-build-gas-pipeline-to-supply-nakhchivan.
Finans (2019), “Azəriqaz”: “Payız-qış mövsümündə təbii qaza olan gündəlik tələbat 35-38 milyon kubmetrdir” – MÜSAHİBƏ, https://finans.az/xeber/azeriqaz-payiz-qis-movsumunde-tebii-qaza-olan-gundelik-telebat-35-38-milyon-kubmetrdir-musahibe.html.
Globuc (2019), SOCAR to increase carbamide production, https://globuc.com/news/socar-to-increase-carbamide-production.
IEA (International Energy Agency) (2021a), World Energy Balances 2021 (database), www.iea.org/statistics.
IEA (2021b), World Energy Prices 2021 (database), www.iea.org/statistics.
IEA (2020a), Oil Market Report, OECD/IEA, Paris.
IEA (2020b), Georgia 2020 Energy Policy Review, www.iea.org/reports/georgia-2020.
IEA (2020c), Gas 2020, https://www.iea.org/reports/gas-2020.
IEA
. All
right
s re
serv
ed.

3. OIL AND NATURAL GAS
67
ENER
GY
SEC
UR
ITY MENAFN (Middle East North Africa Financial Network) (2019), SOCAR's Azerikimya
Production Union eyes to increase output next year, https://menafn.com/1097913860/SOCARs-Azerikimya-Production-Union-eyes-to-increase-output-next-year.
Ona news agency (2020), Gasoline AI-95 price rise in Azerbaijan, https://ona.az/en/economy/gasoline-ai-95-price-rise-in-azerbaijan-14761.
OPEC (Organization of the Petroleum Exporting Countries) (2020), Annual Statistical Bulletin 2020, OPEC, Vienna.
Petrolplaza (2020a), Azpetrol opens new fuel station in Azerbaijan’s capital Baku, https://www.petrolplaza.com/news/26295.
Petrolplaza (2020b), SOCAR reaches 35 fuel stations in Azerbaijan, https://www.petrolplaza.com/news/25582.
Rystad Energy (2020), UCube Country Fact Sheet: Azerbaijan.
SOCAR (State Oil Company of the Azerbaijan Republic) (2021), https://socar.az/socar/en/news-and-media/news-archives/news-archives/2021/02.
SOCAR (2020), SOCAR website, https://socar.az/socar/en/company/about-socar/discover-socar.
SOCAR Trading (2020), Azeri light marketing & export options, https://www.socartrading.com/marketing/marketing-export.
SOFAZ (State Oil Fund of the Republic of Azerbaijan) (2019), Annual Report 2019, SOFAZ, Baku.
SSC (State Statistical Committee of Azerbaijan) (2020a), Energy of Azerbaijan 2020, SSC, Baku.
SSC (2020b), The Foreign Trade of Azerbaijan. SSC, Baku.
Tariff Council of the Republic of Azerbaijan (2021), Processing, transportation, wholesale and retail tariffs of natural gas, http://tariffcouncil.gov.az/?/en/content/96/.
Wood Mackenzie (2020), Azerbaijan upstream summary, Wood Mackenzie, Edinburgh.
IEA
. All
right
s re
serv
ed.

69
ENER
GY
SEC
UR
ITY
4. Electricity
Key data (2019 provisional)
Total generation: 26.1 TWh, +20.5% since 2008
Generation mix: natural gas 92.5%, hydro 6.0%, bioenergy and waste 0.8%, wind 0.4%, oil 0.2%, solar PV 0.2%
Net exports: 1.35 TWh (exports 1.49 TWh, imports 0.14 TWh)
Installed capacity: 7.6 GW
Consumption: 21.6 TWh (residential 29.6%, services 29.1%, industry 20.3%, energy sector 13.8%, agriculture 5.3%, transport 1.8%), +30.1% since 2008
Overview Azerbaijan’s electricity supply relies on the country’s ample natural gas resources. The electricity system is dominated by state-owned monopolies, and the government sets all wholesale and retail prices.
Investments are needed to modernise and expand generating capacity and networks to ensure security of supply and enable electricity demand growth. Electricity market reform is being undertaken to attract private sector investment and increase efficiency, and several laws and other legal instruments have been drafted and are awaiting approval.
Meanwhile, the country’s significant solar and wind power potential could be harnessed to meet several energy policy goals simultaneously. The government has recently set a target for renewable energy to provide 30% of generating capacity by 2030, around twice the current share.
Supply and demand Over the past 15 years, increased domestic natural gas production has led to the installation of new gas-fired generating capacity to replace oil-fired capacity and to meet expected electricity demand growth. Today, more than 90% of Azerbaijan’s electricity is generated at flexible natural gas plants and network losses have fallen from 11.7% of total supply in 2015 to less than 10% in 2019. Electricity consumption has grown only modestly (averaging 2.5% per year since 2013), and the country has also begun to use its generating capacity for exports (Figure 4.1).
IEA
. All
right
s re
serv
ed.

4. ELECTRICITY
70
Electricity supply per capita in Azerbaijan is around 2 500 kilowatt hours (kWh)/year, or roughly 30% lower than the global average of around 3 500 kWh/year. Although the government does not publish scenarios on electricity trends, per capita electricity supply is set to expand in the medium to long term, with global technology trends pointing to increasing electrification of the economy.
Figure 4.1 Azerbaijan’s electricity supply and consumption, 2000-2019
Azerbaijan’s electricity consumption has remained relatively stable in recent years, while network losses have declined and exports increased.
Note: 2019 data are provisional. Source: IEA (2021a), World Energy Balances 2021 (database), www.iea.org/statistics.
Generation Azerbaijan’s gross electricity generation reached 26.1 terawatt hours (TWh) in 2019, up 20% from 2008. Natural gas is the main source of electricity, at 92% in 2019 (ten-year average 88%). Hydropower accounted for 6% (ten-year average 9%) and other renewable sources (solar, wind and waste) for 1% of total generation (Figure 4.2). Co-generation1 plants generated 7.5 TWh of electricity, or 31% of the total in 2019.
In the first eight months of 2020, electricity generation was 0.7% lower than during the same period in 2019. The decline can be linked to the impact of Covid-19 on economic activity, but the decline is mild compared with other countries (MoE, 2020c).
1 Co-generation refers to the combined production of heat and power.
- 10
- 5
5
10
15
20
25
30
2000 2002 2004 2006 2008 2010 2012 2014 2016 20182019
TWh
Imports
Production
Network losses
Exports
Final consumption
IEA 2020. All rights reserved.
IEA
. All
right
s re
serv
ed.

5. DISTRICT HEATING
71
ENER
GY
SEC
UR
ITY Figure 4.2 Breakdown of electricity generation by source, 2019
Azerbaijan’s electricity mix is dominated by natural gas.
* Includes bioenergy and waste, wind, oil and solar PV. Note: 2019 data are provisional. Source: IEA (2021a), World Energy Balances 2021 (database), www.iea.org/statistics.
A major switch from mostly fuel oil-based generation to natural gas started in the early 2000s. Since then, the share of oil in the electricity supply has dropped rapidly, and fuel oil is currently used only as an emergency fuel (Figure 4.3).
Figure 4.3 Electricity generation by source, 2000-2019
Azerbaijan has phased out oil use in electricity generation.
* Not visible at this scale. Note: 2019 data are provisional. Source: IEA (2021a), World Energy Balances 2021 (database), www.iea.org/statistics.
Because of the dominance of natural gas, Azerbaijan’s reliance on fossil fuels for electricity far exceeds the global average of around two-thirds (Figure 4.4).
92.5%
6.0%
1.5%
Natural gas
Hydro
Others*
IEA 2020. All rights reserved.
- 5
5
10
15
20
25
30
2000 2002 2004 2006 2008 2010 2012 2014 2016 2018 2019
TWh
Waste*
Wind and solar*
Oil
Hydro
Natural gas
Net trade
IEA 2020. All rights reserved.
IEA
. All
right
s re
serv
ed.

4. ELECTRICITY
72
Figure 4.4 Breakdown of electricity generation by source in selected countries, 2019
Azerbaijan can reduce its heavy reliance on gas by increasing solar and wind power generation.
* Covers Armenia, Azerbaijan, Belarus, Georgia, Kazakhstan, Kyrgyzstan, Moldova, Tajikistan, Turkmenistan, Ukraine and Uzbekistan. ** Includes solar photovoltaic (PV), solar thermal, wave and ocean power, and other power generation (e.g. from fuel cells). Note: 2019 data are provisional. Source: IEA (2021a), World Energy Balances 2021 (database), www.iea.org/statistics.
Capacity Azerbaijan’s installed generation capacity stood at 7.6 gigawatts (GW) at the end of 2019. Gas-fired power plants accounted for around 83% of the total, followed by hydropower plants (HPPs) at 15% (Table 4.1). All large HPPs are connected to reservoirs, but none has pumped storage facilities. The combined capacity of solar PV and wind power totalled 0.1 GW in 2019. Total capacity has increased by 2.4 GW from 2005, or by half. Around 90% of these capacity additions are gas-fired.
However, further capacity additions are on the way. A 385-megawatt (MW) modular gas-fired power plant in the Gobu district is expected to be commissioned in 2022. The 36-MW Ordubad HPP in the Nakhchivan Autonomous Republic is also under construction, and the Ministry of Energy (MoE) is in talks with international energy companies about building a private combined-cycle gas turbine (CCGT) of up to 550 MW.
0% 20% 40% 60% 80% 100%
Turkmenistan (2018)
Belarus
Republic of Moldova
Azerbaijan
Kazakhstan
Uzbekistan (2018)
Serbia
EU4Energy average*
Russian Federation
Turkey
Bulgaria
Romania
Armenia
Ukraine
Croatia
Georgia
Austria
Kyrgyzstan
Tajikistan
Oil Natural gas Coal Peat Nuclear Bioenergy and waste Hydro Wind Solar** GeothermalIEA 2020. All rights reserved.
Azerbaijan
IEA
. All
right
s re
serv
ed.

5. DISTRICT HEATING
73
ENER
GY
SEC
UR
ITY Azerbaijan has also started to focus on exploiting its significant solar and wind power
potential (see Chapter 8). After an international bidding competition, the MoE signed a power purchase agreements (PPAs) for 240 MW of wind power in December 2020 and for 230 MW of solar in March 2021. The build-own-operate (BOO) contracts come with 20-year power purchase agreements. The Ministry is also preparing auctions for another 1 GW of renewable electricity capacity.
Table 4.1 Installed electricity generating capacity (GW)
Energy source 2005 2010 2016 2017 2018 2019
Hydro 0.97 1.00 1.11 1.11 1.13 1.14
Solar PV - - 0.02 0.03 0.03 0.04
Wind - 0.00 0.02 0.02 0.07 0.07
Combustible fuels 4.29 5.50 6.77 6.79 6.60 6.40
Oil - - 0.01 0.01 0.03 0.03
Gas 4.29 5.50 6.76 6.78 6.56 6.36
Bioenergy and waste - - 0.04 0.04 0.05 0.05
Total capacity 5.26 6.50 7.91 7.94 7.83 7.64
Note: 2019 data are provisional. Source: IEA (2021a), World Energy Balances 2021 (database), www.iea.org/statistics.
State-owned Azerenergy owns around 85% of the country’s generating capacity, including the 2 400-MW gas-fired Azerbaijan Thermal Power Plant (TPP) and the 424-MW Mingachevir HPP in Mingachevir, a key city for electricity generation. In total, 92% of all installed capacity belongs to state-owned companies. Private companies, mainly autoproducers at oil and gas facilities, had a capacity of around 600 MW in 2019.
According to the Energy Charter Secretariat (ECS), peak demand in the Unified Energy System of Azerbaijan (i.e. without the Nakhchivan Autonomous Republic) was around 3 700 MW in 2017. Thus, the system’s installed capacity of around 6 800 MW exceeds domestic demand considerably. This is due partly to the unanticipated slowdown in economic growth (and therefore in electricity demand) that followed the oil price drop of 2014-2015 (ECS, 2020). As a result, capacity factors for TPPs are rather low. According to the SSC, they averaged 37.3% from 2011 to 2019, ranging from 34.6% in 2017 to 41.3% in 2012 (SSC, 2020). Azerbaijan’s electricity system is thus dominated by relatively new CCGT and gas engine plants that are underutilised.
Prioritising the use of the most efficient power plants and, correspondingly, avoiding the use of the least efficient ones, would raise fleet-wide plant efficiency. In fact, the Energy Charter Secretariat has calculated that making electricity generation more energy-efficient would save the sector around two billion cubic metres (bcm) of gas per year and would also reduce CO2 emissions by 4.8 million tonnes (Mt) per year (ECS, 2020).
IEA
. All
right
s re
serv
ed.

4. ELECTRICITY
74
Imports and exports Azerbaijan has electricity interconnections with Georgia, Turkey, Russia and Iran. In 2019, the country exported 1.5 TWh and imported 0.1 TWh, resulting in net exports of 1.4 TWh, or around 5% of total generation (Figure 4.5). Azerbaijan became a net exporter in 2007, and since 2016 has increased its exports notably, thanks to the commissioning of the Azerbaijan-Georgia-Turkey (AGT) Power Bridge line. It currently exports electricity mostly to Georgia.
Figure 4.5 Azerbaijan’s electricity trade by country, 2000-2019
The surge in Azerbaijan’s gas production since 2007 has helped it become a net exporter of electricity.
Note: 2019 data are provisional. Source: IEA (2021a), World Energy Balances 2021 (database), www.iea.org/statistics.
Consumption Electricity consumption totalled 21.6 TWh in 2019, one-quarter more than in 2008, but relatively unchanged since 2014 (Figure 4.6). The residential sector accounted for 30% of the total and the service sector for 29%. From 2008 to 2019, commercial sector electricity consumption rose 72% while residential use actually fell 14% as a result of a tariff increase in 2016, the installation of meters and more assiduous bill collection. The commercial sector is expected to drive demand in the medium term.
Industry was the third-largest electricity consumer, at 20% of the total (+36% since 2008), followed by energy industries (14%, +178% since 2008) and agriculture (5%, +79% since 2008). Electricity consumption for transport, which accounted for just 2% of the total, has decreased by one-third since 2008 as rail travel has declined.
- 1.5
- 1.0
- 0.5
0.5
1.0
1.5
2.0
2000 2002 2004 2006 2008 2010 2012 2014 2016 20182019
TWh
Islamic Republic of Iran
Turkey
Russian Federation
Georgia
Others/unspecified
Net trade
Net imports
Net exports
IEA 2020. All rights reserved.
IEA
. All
right
s re
serv
ed.

5. DISTRICT HEATING
75
ENER
GY
SEC
UR
ITY Figure 4.6 Electricity consumption by sector, 2007-2019
While service and industry electricity consumption in Azerbaijan has risen quickly, household use has been falling since 2016.
* Includes forestry. ** Includes oil and gas extraction, oil refineries and unspecified energy sectors. *** Includes commercial and public services. Note: 2019 data are provisional. Electricity consumption data starting in 2007 are available in an internationally comparable format. Source: IEA (2021a), World Energy Balances 2021 (database), www.iea.org/statistics.
Electricity generation is closely linked to domestic demand, which peaks in winter for heating (the peak month is January) and in summer for cooling (the peak occurs around July) (Figure 4.7). Historically, the winter peak (averaging 2 150 gigawatt hours (GWh)/month) has been higher than the summer peak (around 2 000 GWh/month).
Figure 4.7 Azerbaijan’s monthly electricity generation, January 2015-January 2020
Azerbaijani electricity demand peaks in winter for heating and in summer for cooling.
Sources: SSC (2020).
Electricity sector structure and reform Azerbaijan is at an early stage of liberalising its electricity sector. The state-owned vertically integrated monopolies Azerenergy and Azerishiq continue to dominate the sector and the government still sets the wholesale and retail electricity prices, but a new electricity market law promoting liberalisation was drafted recently and its approval is now pending.
5
10
15
20
25
2007 2010 2013 2016 2019
TWh
Transport
Agriculture*
Energy**
Industry
Services***
Residential
IEA 2020. All rights reserved.
0.5
1.0
1.5
2.0
2.5
Jan-15 Jul-15 Jan-16 Jul-16 Jan-17 Jul-17 Jan-18 Jul-18 Jan-19 Jul-19 Jan-20
TWh
IEA
. All
right
s re
serv
ed.

4. ELECTRICITY
76
Azerenergy (Azerenerji OJSC) owns and operates all power plants, except for a few small renewable energy facilities and some industrial autoproduction capacity (Figure 4.8). It also owns and operates the transmission system. Meanwhile, Azerishiq OJSC owns the distribution networks and operates distribution, supply and other customer services (connection, metering and billing) in the regional networks of Aran, Baku, Canub, Garb, Markazi Aran, Shimal and Shimal Garb. In the Nakhchivan Autonomous Republic, transmission and distribution systems are directly operated by the Nakhchivan Energy Authority. Azerishiq OJSC (formerly Bakielektrikshebeke OJSC, i.e. Baku Electric Company), was created in 2015 when the government passed Azerenergy’s distribution assets and functions to this new company as the first step towards market reform.
Figure 4.8 Electricity sector structure
Azerbaijan’s electricity sector is dominated by the state-owned companies Azerenergy and Azerishiq.
Note: State Agency on Alternative and Renewable Energy Sources (SAARES) power plants are owned by Azeralternative LLC, as SAARES was abolished in 2019. Azerenergy also operates at the 110-kilovot (kV) level. Source: INOGATE Technical Secretariat (2016) as modified by IRENA (2019).
Azerenergy and Azerishiq receive government budget support to implement part of their capital expenditure programmes. According to the MoE, state capital investments from 2015 to 2019 amounted to USD 397 million for Azerenergy and USD 601 million for Azerishıq. The companies need this government financial support both because their tariffs are set at a level that keeps services affordable and because they have significantly more employees than they need for optimum efficiency, as state-owned enterprises often serve social protection and employment policy purposes (ADB, 2020).
The 1998 Law on the Power Industry provides the legal basis for the electricity sector. It sets out some provisions for third-party access so that Azerenergy can purchase electricity from other generators, and other entities can buy electricity from Azerenergy (or other state companies) and sell it to end-consumers in their own grids or through the state transmission system. In practice, these arrangements account for around 1% of electricity generation.
The 2016 Strategic Roadmap Following the global oil price decline in 2014-2015 and the subsequent recession in Azerbaijan, its government set out to reform the economy, drawing up plans for the electricity sector as part of this task. The 2016 Strategic Roadmap for the Development of
IEA
. All
right
s re
serv
ed.

5. DISTRICT HEATING
77
ENER
GY
SEC
UR
ITY Utilities (electricity, heating, water and gas) called for a gradual transition to a liberal market
model based on enhanced competition, unbundling, establishment of a wholesale market and expanding the share of renewable energy. The Roadmap included a development strategy to 2020, a long-term outlook to 2025 and a vision beyond 2025 (GoA, 2016).
The Roadmap proposed eliminating end-user subsidies and introducing differentiated end-user tariffs for different times of the day. It also included several quantitative targets for 2020, including for example to reduce distribution losses, add 1.9 GW of conventional power plant capacity and 420 MW of renewable electricity capacity, and increase the efficiency of combined-cycle power plants from 47% to 50%.
Following a recommendation in the Roadmap, the Azerbaijan Energy Regulatory Agency (AERA) was established in December 2017. AERA reports to the MoE and covers the electricity, natural gas and heat sectors. Its functions include licensing and the development and submission of proposals on tariff design and methodology. Its precise roles and responsibilities will be clarified in the Law on the Regulator for which adoption is pending (see next section).
Since 2016, generating efficiency has continued to improve, network infrastructure has been modernised and the bill collection rate has increased. Nevertheless, many of the suggested reforms have yet to be implemented, and the three key electricity sector challenges identified by the Asian Development Bank (ADB) in 2016 remain valid: improving operational and financial efficiency; restoring and maintaining high levels of service throughout the country; and establishing a sustainable cost recovery financing mechanism (ADB, 2016b).
Current reform plans The Order of the President of the Republic of Azerbaijan on the Acceleration of Reforms in the Energy Sector of the Republic of Azerbaijan was adopted in May 2019 to boost reform efforts. It broadly reiterates the 2016 market reform ideas and sets timetables for preparing electricity sector laws and regulations.
According to the MoE, the government’s aim is to establish a transparent, competitive and open electricity market to which access will be allowed on a fair and equal basis. Government subsidies and expenditures will gradually be eliminated and renewable energy used to diversify the electricity supply and reduce dependence on natural gas (MoE, 2020a).
The government drafted several laws for electricity market reform that were awaiting adoption in December 2020, including on the development of the electricity market; on the role and responsibilities of the regulator in energy and public utility services; and on the use of renewable energy in electricity generation (see Chapter 8). Agreements for power purchases and sales, investments, transmission network connections and land leases have also been drafted with the help of international consultants (MoE, 2020b).
The Law on the Regulator, modelled on the EU Third Energy Package, sets out the regulator’s main activities as tariff setting, licensing, market monitoring, and settling disputes and customer claims. Proposals have also been drafted for tariff methodology and for accelerating reforms in the heating sector. Business models for co-generation of power and heat and trigeneration of power, heat and cooling are also covered in the draft Law on Electricity (see Chapter 5).
IEA
. All
right
s re
serv
ed.

4. ELECTRICITY
78
The draft Law on Electricity draws on international experience and envisages gradual market liberalisation by 2025. It provides a legal framework to progressively unbundle Azerenergy and allow independent generators to enter the sector and acquire existing power plants or build new ones, while safeguarding energy sustainability and security. In preparation for unbundling generation assets and functions from transmission, and for possible privatisation, Azerenergy’s power plants will be separated into individual companies. A plan has also been drafted to privatise the renewable electricity capacity of Azeralternative LLC (16 MW) and some modular thermal capacity, while public-private partnerships are planned for building gas-fired capacity (MoE, 2020a).
The MoE has also stated that the government aims to raise the share of renewable energy in total electricity generation capacity to 30% by 2030, roughly doubling the 2018 share of 16%. The Ministry has identified eight potential areas for the construction of solar and wind power facilities (100-200 MW each) and plans to use auctions to choose project participants. It has also signed memorandums of understanding (MoUs) to co-operate on renewable energy ventures with 11 large companies, including BP, Equinor, Total, Masdar and ACWA Power (MoE, 2020b). In January 2020, the MoE signed implementing agreements with ACWA Power to build, own and operate 240 MW of wind capacity and with Masdar for 230 MW of solar capacity. Project agreements, including 20-year PPAs, were signed in December 2020 with ACWA Power and in March 2021 with Masdar (see Chapter 8).
Networks Transmission and distribution Azerbaijan’s high-voltage network totals around 7 800 km: 1 505 km at 220 kV; 31 km at 230 kV; 1 542 km at 330 kV; and 477 km at 500 kV (Table 4.2). The network has 93 high-voltage substations.
Although the distribution system’s voltage is generally below 110 kV, in some cases both the transmission system operator (TSO) and the distribution system operator (DSO) operate at the 110-kV level. The total installed capacity of the substations operated by the DSO Azerishiq exceeds 10 000 megavolt amperes (MVA).
Table 4.2 Electricity transmission network capacity, 2018
Voltage (kV) Number of lines Length (km) Number of substations Capacity (MVA)
110 189 4 325 70 5 335 220 29 1 505 13 5 223 230 1 31 - - 330 24 1 542 8 3 745 500 3 477 2 2 667
Source: Azerenergy (2020), http://azerenerji.gov.az/index/page/14.
Efforts to reduce network losses are delivering results. From 2015 to 2019, the percentage of transmission losses in total electricity supply fell from 2.1% to 1.5%, and distribution losses from 9.6% to 7.5% (SSC, 2020). Azerishiq is carrying out a programme to rehabilitate distribution network substations and lines, replace low-quality customer
IEA
. All
right
s re
serv
ed.

5. DISTRICT HEATING
79
ENER
GY
SEC
UR
ITY service lines and install smart meters across the country. The programme, designed to run
from 2016 to 2022, is backed by a USD 750 million loan from the ADB.
A government working group on network strengthening and integration was established based on the May 2019 presidential order to accelerate energy sector reforms. It has identified the requirements for international standards covering energy system management, power transmission, relay protection and automation, and network strengthening (MoE, 2020b).
The German company VPC has been contracted to determine technical options to increase the share of renewable energy in electricity generation capacity to 30% by 2030. It has been studying network connection opportunities for pilot projects and to determine measures for network integration and strengthening (MoE, 2020b; see Chapter 8).
Cross-border connections Azerbaijan’s power system is interconnected with those of Georgia, Turkey, Russia and Iran. Cross-border flows are operated and metered by Azerenergy and governed by bilateral agreements.
Azerbaijan’s electricity system is synchronised with Russia’s Integrated Power System/Unified Power System (IPS/UPS), as is Georgia’s. Iran will be synchronised with the IPS/UPS once grid compatibility studies have been completed in 2021 (FNA, 2020).
Azerbaijan has two cross-border connections with Georgia: the 500-kV (700 MW) Samukh-Gardabani and the 330-kV Agstafa-Gardabani lines. The 500-kV line is part of the AGT Power Bridge. The lines from Azerbaijan to Georgia and from Georgia to Turkey were all completed in 2013 and power transmission started in 2016. A second 330-kV connection being added to the 330-kV (670 MW) Agstafa-Gardabani line is expected to become operational in 2022 (IEA, 2020b).
With Turkey, Azerbaijan has three cross-border connections in the Nakhchivan Autonomous Republic: the 154-kV Igdir-Babek 1 and 2 lines and the 34.5-kV Adaliq-Sadarak.
Cross-border capacity with Russia is around 350 MW and the main connection is the 330-kV Yashma- Derbent line; the other connection, the 110-kV Yalama-Bilici line, is seldom used. Negotiations are under way to develop a second 330-kV Absheron-Derbent air transmission line with Russia as well as a Russia-Azerbaijan-Iran electricity corridor.
Azerbaijan’s five cross-border connections with Iran are the 330-kV Mugan line, the 230-kV Imishli and 110-kV Astara-Astara lines, owned by Azerenergy, and the 132-kV Araz-Araz and 132-kV Julfa-Julfa lines, owned by the Nakhchivan Energy Authority. Mugan, the main connection, began operations in 2016. Total cross-border capacity with Iran is 600 MW (MoE, 2020). A 220-kV Masalli connection is also being constructed.
System operation Azerenergy’s Central Dispatching Department (CDD) operates Azerbaijan’s transmission system. It uses a supervisory control and data acquisition (SCADA) system to manage, control and optimise the system in real time.
IEA
. All
right
s re
serv
ed.

4. ELECTRICITY
80
Azerbaijan does not yet have a network code for its transmission and distribution systems, but one is being prepared (a draft code was issued for stakeholder review in early 2020). The network code is expected to set the rules and technical requirements for electricity system and market operations, serving to ensure supply reliability, quality and security and enable gradual variable renewable energy expansion.
Prices and tariffs The Tariff Council sets electricity prices for generators and consumers in a variety of categories (Table 4.3). In practice, the tariffs for producers are feed-in tariffs for small renewable electricity producers, while the wholesale electricity tariff is what the DSO Azerishiq pays to the TSO Azerenergy for electricity. The wholesale tariff thus includes payments for electricity generated at Azerenergy’s large hydro and thermal power plants, for feed-in tariffs for small producers of renewables for electricity, and for electricity transmission to the distribution network. The transit tariff is what Azerishiq pays for the transmission of electricity from its three wind power plants.
The several energy-intensive industries that are supplied directly from the transmission network are also eligible for daytime and night-time tariffs.
On the retail side, block tariffs apply to residential consumers and a flat-rate tariff to all other consumers, regardless of category, voltage or capacity. Because residential electricity tariffs are a social policy instrument (like residential natural gas and district heat tariffs), they do not reflect the true cost of service.
Twice in recent years the government has raised the consumption threshold for the lowest tariff (i.e. the category with the highest implied subsidies). In late 2016, it increased the threshold from 250 kWh/month to 300 kWh/month, and in April 2020 it was temporarily raised to 400 kWh/month for two months in relation to the Covid-19 economic downturn.
Of Azerbaijan’s 2.6 million electricity customers at the end of 2018, those with monthly use of less than 300 kWh were responsible for 28% of total electricity consumption, according to the government.
The tariff system also provides implicit cross-subsidies from urban to rural customers: even though retail electricity tariffs, which include compensation for distribution, are the same across the whole country, it costs Azerishiq much more to supply rural customers than urban ones. Essentially, demand per customer is lower and capital costs higher in the countryside. This type of cross-subsidisation that reflects social policy designed to support rural communities is common in many countries in which the state is a major shareholder in electricity supply companies (ADB, 2016a).
Overall, the electricity tariff system includes and implies sizeable consumer subsidies. Azerenergy’s and Azerishiq’s financial reports are not made public, but the IEA has used the commonly applied price-gap methodology to estimate that electricity subsidies from 2015 to 2019 averaged USD 700 million per year, due mainly to subsidies to keep natural gas prices low (see Table 2.1 in Chapter 2). For example, Azerbaijan’s natural gas export price averaged USD 190 (AZN 323) per 1 000 m3 in 2019, but the price charged domestically for natural gas for electricity generation was much lower at only AZN 120 per 1 000 m3.
IEA
. All
right
s re
serv
ed.

5. DISTRICT HEATING
81
ENER
GY
SEC
UR
ITY Table 4.3 Azerbaijan electricity tariffs, 2020
Service Tariff (AZN/kWh, including VAT)
1. Tariffs for producers
1.1 Small hydropower 0.05
1.2 Wind power 0.055
1.3 Other alternative and renewable energy 0.057
2. Wholesale tariffs 0.057
2.1 Energy-intensive industry (chemicals, aluminium and steel enterprises with monthly consumption of at least 5 GWh)
2.1.1. Daytime (08:00-22:00) 0.058
2.1.2. Night-time (22:00-08:00) 0.028
3. Transit 0.02
4. Retail tariffs
4.1 Residential
4.1.1. Monthly consumption up to 300 kWh 0.07
4.1.2. Monthly consumption more than 300 kWh 0.11
4.2 Non-residential 0.09
Note: AZN 1 = USD 0.59/USD 1 = AZN 1.70. Source: Tariff Council (2020), Elektrik enerjisinin ölkədaxili tarifləri, http://www.tariffcouncil.gov.az/?/az/content/70/.
Metering has helped improve the financial performance of the electricity sector. While Azerenergy started a programme to install pre-paid end-user meters in 2007, Azerishiq took it over in 2015 and the expectation is that all consumers will soon be equipped with smart meters. Collection rates reached more than 94% in 2018, a major improvement from around 50% in 2007.
International comparison shows that in purchasing power parity (PPP) terms, Azerbaijan’s residential electricity price is relatively low, but still higher than in Georgia, its main electricity export destination (Figure 4.9).
IEA
. All
right
s re
serv
ed.

4. ELECTRICITY
82
Figure 4.9 Residential electricity prices in Azerbaijan and selected countries, 2019
Despite being subsidised, Azerbaijan’s residential electricity prices are higher than in its main electricity export destinations.
Source: IEA (2021b), World Energy Prices 2021 (database), www.iea.org/statistics.
Security of supply Azerbaijan has improved its electricity supply security over the past decade with major investments to modernise generation and strengthen the east-west transmission system. Construction of gas-fired generation capacity has curtailed the electricity shortages that used to be common. Electricity supply security relies on use of the country’s abundant domestic natural gas as the default energy source and on the establishment of adequate national generation capacity. In 2019, Azerbaijan had 7.6 GW of capacity, 6.4 GW of which was gas-fired, while peak demand was around 4 GW.
At the same time, more network infrastructure needs to be modernised, and the country continues to lack governance and operational security protocols and measures for electricity security. Out-of-date technologies and equipment have decreased the reliability and efficiency of energy system operations, while the lack of electricity supply reliability has been one of the government’s main energy security concerns. The July 2018 countrywide blackout particularly revealed the urgent need to improve the electricity system’s ability to maintain reliability and respond to emergencies (see Box 4.1).
After this blackout, the President of the Republic of Azerbaijan set new priorities for Azerenergy to restore the power system’s generating capacity, modernise the substations and increase the transmission system’s load capacity. In 2018, the MoE and the German company VPC launched a broad programme to meet these goals, and by the end of 2019, 485 MW of lost power had been restored through power plant rehabilitation. Azerenergy, which is still implementing the programme (destined to end in 2021), intends to restore 1 000 MW of lost power capacity (MoE, 2020a). Pending electricity market reforms also aim to boost security of supply by improving the power sector’s financial viability and investment capacity.
However, a regulatory framework for monitoring power quality had yet to be introduced as of September 2019. According to AERA, draft rules have been submitted to the government to approve the calculations of the System Average Interruption Duration Index (SAIDI) and the System Average Interruption Frequency Index (SAIFI). The draft rules also
50100150200250300350400
USD PPP/MWh
IEA 2021. All rights reserved
IEA
. All
right
s re
serv
ed.

5. DISTRICT HEATING
83
ENER
GY
SEC
UR
ITY cover the methodology for calculating consumer compensation for exceeding the threshold
levels of these indicators (ECS, 2020).
Box 4.1 The July 2018 Mingachevir blackouts
On 3-4 July 2018, Azerbaijan was hit by two blackouts that left most of the country without electricity, and in some cases without water, for several hours. Thirty-nine cities and districts across the country were affected.
Azerenergy, the plant’s owner and operator, stated that the blackouts were caused by a sudden increase in electricity demand for air conditioning during a strong heat wave and a simultaneous explosion at the Mingachevir thermal power plant’s substation in north-western Azerbaijan.
However, a government investigation found rather different causes. At the plant level, they included the continued use of outdated equipment and a disregard for technical and security norms. Within the electricity system, capacity to compensate for power disruptions was insufficient, and the responsible organisations had been focusing mainly on individual initiatives rather than on implementing the country’s strategic development plan.
The blackouts revealed major areas for improvement at several levels. The think tank Center for Economic and Social Development (CESD) recommended that the technical functioning of the country’s power plants and electricity system be improved, that its electricity supply be diversified and that its electricity generation and network systems be better integrated. Furthermore, Azerbaijan’s economy and state-owned enterprises need to prepare for electricity risks and the entities responsible for maintaining electricity security (such as Azerenergy) need to be better organised and co-ordinated.
CESD also pointed out that the state funds allocated to developing and strengthening the electricity system had been spent inefficiently and improperly monitored.
Source: CESD (2018), Azerbaijan’s countrywide electricity blackout: Problems, causes, and results, http://cesd.az/new/?p=11477.
Globally, the concept of electricity security is being broadened to also respond to three emerging challenges: the clean energy transition, cyber security and climate change. Technology developments and climate change mitigation efforts are spurring an electricity supply transition from centralised, vertically integrated systems of relatively few large, dispatchable thermal power plants to more diversified capacity types and sizes that include variable solar and wind power in particular. While cyber security concerns are linked with the increasing digitalisation of electricity supply systems, the need for demand-side measures is also rising as connected devices, electric vehicles and behind-the-meter distributed energy resources become more prevalent. Finally, mounting evidence indicates that electricity system infrastructure needs to be better adapted to climate change impacts such as heat waves and droughts, and the associated reductions in water availability (IEA, 2020b). These emerging electricity security concerns are likely to become increasingly relevant for Azerbaijan.
IEA
. All
right
s re
serv
ed.

4. ELECTRICITY
84
Assessment Azerbaijan’s electricity demand is set to rise in the years and decades ahead. Although the entire population has access to affordable electricity, the current supply level of around 2 500 kWh per capita per year is relatively low – and expanding electrification will only increase demand. To maximise the benefits of electricity for the population, investments are required in new and more efficient generating capacity and electricity grids. The country needs a more dynamic electricity sector and could model transformation on international best practices that demonstrate how to develop competitive electricity wholesale and retail markets. The IEA welcomes the government’s determination to reform the electricity system by gradually transitioning from a state-dominated vertically integrated system to a more dynamic, efficient and environmentally sustainable one. The challenge now is to deliver this metamorphosis.
Market reform The need for electricity reform was recognised in the 2016 Strategic Roadmap, and several proposals have been drafted, including the draft laws on electricity; on the role of the regulator in energy and public utilities; and on the use of renewable energy in electricity generation.
The IEA urges the government to adopt the pending legislation and to implement ambitious electricity market reforms for the benefit of the country and its economy. International experience suggests that reform approaches should be shaped by a country’s specific political and economic context, be tailored to achieve desired policy outcomes, and offer multiple institutional pathways to achieve the desired outcomes (see Box 4.2).
The government should first focus on governance issues and financial viability. Tariffs and subsidies should be revised to enable full cost recovery, and to encourage investment in power sector development and RD&D. Reforms of this kind should help reduce operating costs and improve generation, transmission and distribution efficiency.
Specific policy objectives should also be set for a secure, efficient and clean electricity system. Although Azerbaijan has enough gas resources to generate all the electricity it needs for decades to come, it is also in the enviable position of having excellent solar and wind power potential. Technology costs for solar and wind have declined dramatically, making it more inviting for the country to tap into their potential and save more natural gas for exports and for petrochemical production, for example. To enable the energy sector to allocate resources more efficiently, the IEA urges the government to also reform and gradually abolish subsidies for natural gas in electricity generation.
At the same time, diversifying electricity generation to include more renewable energy would help limit CO2 emissions, in line with Azerbaijan’s commitment under the Paris Agreement. In this context, the IEA welcomes the government’s plans to raise the share of renewable energy in total generating capacity from 16% in 2018 to 30% 2030.
IEA
. All
right
s re
serv
ed.

5. DISTRICT HEATING
85
ENER
GY
SEC
UR
ITY Box 4.2 Elements of successful power market reforms
From its recent analysis of power market reforms around the world, the World Bank has identified ten elements for success:
Power sector reforms should be designed according to the enabling conditions of each country and oriented primarily towards achieving better sector outcomes.
Every power sector reform design needs to be thoroughly grounded in the political realities of the specific country to which it pertains.
Greater emphasis should be placed on building institutional capacity for power sector planning and associated implementation.
Generation plants should be procured through a transparent and competitive process, with as much contractual flexibility as the context allows.
Unbundling should not be the highest priority in countries where more fundamental financial and governance challenges persist; it should be undertaken primarily to facilitate deeper reforms.
Wholesale power markets remain a viable option for countries that have all the foundational measures in place; others may derive greater benefit from regional trade.
Greater efforts should be made to strengthen the corporate governance and managerial practices of state-owned utilities.
The regulatory framework needs to be adapted to reflect the institutional context and accommodate emerging technological trends.
Private sector participation in distribution should be considered only when enabling conditions are met.
Achieving the 21st-century goals of universal access and decarbonisation will require additional reform measures targeted explicitly at these objectives.
Source: Foster and Rana (2020), Rethinking Power Sector Reform in the Developing World.
Policies and measures are needed to meet electricity market reform objectives, for example to provide for unbundling, third-party access to grids, transparent wholesale markets, and partial privatisation of monopolies. If reform is to be successful, it must ensure the effective unbundling of Azerenergy’s generating assets from its transmission grid ownership and grid operations. It must also provide for non-discriminatory third-party access to the transmission and distribution grids. At the same time, transmission and distribution tariffs should be separated from energy supply tariffs to enable the use of performance-based incentives.
Electricity generation should be opened up to competition, and wholesale and retail markets created. This is best done gradually. The first steps should be to remove entry barriers for new participants and to transition towards unsubsidised cost-based economic dispatch of power plants to increase efficiency. This should be quite feasible, since – except for autoproducers – almost all generating capacity is owned by Azerenergy.
To increase competition, the government should consider privatising some of Azerenergy’s generating assets. Emphasis should be on privatisation as a potential means to increase competition and operational efficiency rather than as an end in itself, and full privatisation will probably not be necessary to achieve the desired goals. For example, in
IEA
. All
right
s re
serv
ed.

4. ELECTRICITY
86
many European countries, the state remains the majority shareholder in electricity generators that operate in competitive wholesale markets. New entrants could also be entirely private or based on public-private partnerships, as long as market entry barriers are removed. An important point to consider relates to increasing the share of variable solar and wind power capacity. As the government plans to attract investment through long-term PPAs, a mechanism should be designed to integrate PPAs into the future wholesale market (see Chapter 8).
Gains from more efficient generation and grid operations would limit the need to raise end-user prices, and in any case social policy measures could be targeted to vulnerable customers.
A major step in Azerbaijan’s electricity market reform has been the establishment of a regulator. As AERA remains closely overseen by the MoE, just like the electricity sector monopolies Azerenergy and Azerishiq, it will be essential to grant it the legal right to take binding decisions and issue recommendations.
Efficiency would be further increased by differentiating consumer tariffs by time of use to encourage electricity consumption when it is less expensive, and thus help businesses increase their competitiveness. Time-of-use tariffs are standard practice in many countries, as they provide an incentive for demand-response applications, smooth the daily load curve, decrease peak loads and reduce the need for additional capacity. Dynamic end-user pricing could also encourage utilities to innovate, for example in terms of demand-response measures.
Electricity security Having an uninterrupted supply of electricity is critical for a modern society. In their efforts to ensure electricity security, many IEA member countries have found it useful to put a comprehensive framework in place, supported by laws, regulations, policies and measures that address generation, transmission, distribution and supply challenges. The IEA urges Azerbaijan to consider a similar framework approach.
An electricity security framework should include clear targets covering fuel security, resource adequacy, operational security and governance. It should also include indicators to measure progress. Azerbaijan’s fuel/energy source security appears sound, as the country has significant natural gas resources and is set to diversify into solar and wind power generation. The country is also relatively well placed to deal with resource adequacy, and it is building more power plants and cross-border connections to supplement its generating capacity, which already is twice as high as peak demand. Furthermore, efforts to modernise Azerbaijan’s networks are under way to keep up with growing demands.
Operational security challenges are more of a concern. While the gas-fired power plants that dominate generation are relatively new and flexible, the 2018 blackouts demonstrated that improvements are needed in several areas: system operations, emergency protocols, resilience, co-ordination and communications, and situational awareness. Another key area to strengthen is governance, including legislation, institutions and regulation.
IEA
. All
right
s re
serv
ed.

5. DISTRICT HEATING
87
ENER
GY
SEC
UR
ITY New risks for electricity security are emerging in three areas: the clean energy transition
(i.e. grid integration of variable renewable electricity), cyber security and climate change (IEA, 2020b). The IEA recommends a five-point approach to respond to them:
1. Put the right framework and institutions in place: clearly establish responsibilities, incentives and rules.
2. Identify risks: undertake regular systemwide risk analyses. 3. Manage and mitigate risk: improve preparedness across the electricity supply chain. 4. Monitor progress: track, record and share experiences. 5. Respond and recover: cope with outages or attacks and benefit from the lessons
learned.
Energy policy makers should raise awareness of these three risk areas and engage with all government agencies as well as stakeholders to improve understanding and decide how to avoid and deal with complications.
To help prevent electricity security emergencies, the government should carry out emergency response exercises, as they have proven effective in boosting preparedness and response capability in other countries. In addition, the government could devise probabilistic simulations to assess how various system elements contribute to operational security related to solar and wind generation variability, generator and transmission line outages, cross-border connection availability, system reserve margins, load variability and demand response.
Efficient system operations A decade of electricity sector changes lies ahead for Azerbaijan as it implements market reforms and takes action to roughly double the share of renewable electricity in total generating capacity by 2030. While the government should assess electricity infrastructure requirements and prepare long-term network development plans, it also needs to ensure that it has enough people with the expertise necessary to accomplish this transformation.
Of increasing concern is the grid integration of variable solar and wind power, which will require greater electricity system flexibility. While gas-fired capacity will continue to provide flexibility, the government should also prepare a general plan for ancillary services, including storage and demand response. An ancillary services market should be developed to allow energy-intensive enterprises (such as aluminium and steel manufacturing) to participate in a demand-response system.
As cross-border trade can also be a source of flexibility and improved economic efficiency, the IEA is glad to note that Azerbaijan has strengthened its cross-border connections. The country intends to significantly increase its electricity exports in the coming years, while trade with hydropower-rich Georgia would allow seasonal imports of hydropower generation.
Azerbaijan is modernising its transmission and distribution infrastructure and has succeeded in reducing network losses in recent years. Modernising network infrastructure offers the opportunity to upgrade it and make it smarter: installing smart meters, digital substations and sensor control and operational systems would help raise efficiency. It would also accommodate higher shares of solar and wind power and prompt the adoption of cyber-security protection measures. Furthermore, it would encourage the use of
IEA
. All
right
s re
serv
ed.

4. ELECTRICITY
88
demand-side response systems to reduce curtailments of solar and wind power generation and support electric vehicle integration (IEA, 2020c).
Finally, Azerbaijan needs a network code to ensure electricity system stability and reliability. A code can facilitate the successful integration of increasing shares of solar and wind power, and would also help ensure equipment quality and standardisation. The IEA therefore urges the Azerbaijani authorities to adopt the network code that has been drafted as soon as possible.
Recommendations The government of Azerbaijan should:
Support effective unbundling and develop competitive electricity wholesale and retail markets, overseen by an independent regulatory body with clear duties and appropriate powers, to enable third-party access to the grid on non-discriminatory terms and to help attract private sector investment.
Consider the case for privatising elements of the country’s generating capacity and developing public-private partnerships to promote competition and operational efficiency.
Develop a transparent electricity tariff-setting methodology that will incentivise investment in efficient power sector development and RD&D.
Differentiate tariffs according to voltage level and time of use.
Develop and introduce a framework for short- and long-term generation, transmission, distribution and supply security, supported by targets and indicators to measure progress.
Task the regulator and the TSO with preparing a long-term network development plan, monitoring its implementation and updating it regularly.
Prepare a plan to develop ancillary services, including storage and demand-side response, to maintain network stability and security.
Expedite the adoption of a network code for the electricity system, including rules and standards for variable renewable energy integration.
IE
A. A
ll rig
hts
rese
rved
.

5. DISTRICT HEATING
89
ENER
GY
SEC
UR
ITY References
ADB (Asian Development Bank) (2020), Reforms, Opportunities, and Challenges for State-Owned Enterprises, ADB, Manila.
ADB (2016a), Economic analysis. Power Distribution Enhancement Investment Program (RRP AZE 42401-014), ADB, Manila.
ADB (2016b), Sector assessment (summary): Energy. Power Distribution Enhancement Investment Program (RRP AZE 42401-014), ADB, Manila.
Azerenergy (2020), Energy transmission table, http://azerenerji.gov.az/index/page/14.
CESD (Center for Economic and Social Development) (2018), Azerbaijan’s countrywide electricity blackout: Problems, causes, and results, http://cesd.az/new/?p=11477.
ECS (Energy Charter Secretariat) (2020), In-Depth Review of the Energy Efficiency Policy of the Republic of Azerbaijan, ECS, Brussels.
FNA (Fars News Agency) (2020), Iran’s power grid soon to connect to Azeri, Russian grids, https://en.farsnews.ir/newstext.aspx?nn=13990621000366.
Foster, V. and A. Rana (2020), Rethinking Power Sector Reform in the Developing World, Sustainable Infrastructure Series, World Bank, Washington, DC, https://doi.org/10.1596/978-1-4648-1442-6.
GoA (Government of Azerbaijan) (2016), Strategic Roadmap for Development of Utilities Services (Electric Energy, Heating, Water and Gas) in the Republic of Azerbaijan, GoA, Baku.
IEA (International Energy Agency) (2021a), World Energy Balances 2021 (database), www.iea.org/statistics.
IEA (2021b), World Energy Prices 2021 (database), www.iea.org/statistics.
IEA (2020a), Georgia 2020, www.iea.org/reports/georgia-2020.
IEA (2020b), Power Systems in Transition, www.iea.org/reports/power-systems-in-transition.
IEA (2020c), World Energy Outlook 2020, www.iea.org/reports/world-energy-outlook-2020.
IEA (2019), Energy Prices and Taxes 2019 (database), www.iea.org/statistics.
INOGATE Technical Secretariat (2016), Preparation of a concept note and a roadmap for the setup of an independent energy regulator, towards the development of the country’s energy market – Activity completion report, as modified by IRENA (2019), Renewables Readiness Assessment: Republic of Azerbaijan, https://www.irena.org/publications/2019/Dec/RRA-Republic-of-Azerbaijan.
MoE (Ministry of Energy) (2020a), The development of electric power engineering following independence (the third stage, after 1991), http://minenergy.gov.az/en/elektroenergetika/musteqillik-elde-edildikden-sonra-elektroenergetikanin-inkisafi1991-ciilden-sonraki-ucuncu-dovr.
MoE (2020b), The development of the renewable energy sector was a priority in the first half, https://minenergy.gov.az/en/xeberler-arxivi/berpa-olunan-enerji-sahesinin-inkisafi-birinci-yarimilde-prioritet-olub.
IEA
. All
right
s re
serv
ed.

4. ELECTRICITY
90
MoE (2020c), Electricity production in the country decreased in the eight months of current year, https://minenergy.gov.az/en/xeberler-arxivi/bu-ilin-sekkiz-ayi-uzre-olkede-elektrik-enerjisi-istehsali-azalib_3094.
SSC (State Statistical Committee of Azerbaijan) (2020), Energy of Azerbaijan 2020, SSC, Baku.
Tariff Council of the Republic of Azerbaijan (2020), Elektrik enerjisinin ölkədaxili tarifləri, http://www.tariffcouncil.gov.az/?/az/content/70/.
IEA
. All
right
s re
serv
ed.

91
ENER
GY
SEC
UR
ITY
5. District heating
Key data (2019 provisional)
Total generation: 0.33 Mtoe, +125% since 2008
Sources: natural gas 99.9%, oil 0.1%
Consumption: 0.32 Mtoe (industry 54.3%, residential 38.3%, services/other 7.4%), +133% since 2008
Overview Azerbaijan uses natural gas for around 99% of its space heating. In the decades since the collapse of the Soviet Union, the government has focused on expanding the natural gas grid to the whole population, and district heating (DH) has become less important.
Detailed data on the market shares of individual heating technologies in Azerbaijan are not available, but individual gas boilers cover at least 80% of heating needs, owing to generous subsidies for small-scale gas use. However, DH continues to be important in some sectors: in 2017, it provided heating services to 26% of hospitals; 9% of preschools; 6% of schools; and 2.6% of residential buildings (ECS, 2020). Moreover, there is scope for it to figure more significantly in Azerbaijan’s future energy system. Combined with electricity and cooling generation and heat pump and waste heat use, modern DH technology has the potential to provide economically and environmentally attractive clean energy.
Supply and demand Practically all Azerbaijan’s district heat is generated from natural gas (Figure 5.1). In 2019, district heat consumption amounted to 0.32 million tonnes of oil equivalent (Mtoe) (133% more than in 2008) (Figure 5.2), or 3% of the country’s total final consumption (TFC). Residential district heat use grew more than fourfold from 2008 to 2019, while consumption in the energy industry declined to almost zero. The share of heat generated by co-generation1 plants therefore decreased from 64% in 2008 to 9% in 2017 (ECS, 2020). Reversing the declining trend of the past decade, the use of DH for process heat in the chemicals/petrochemicals sector started in 2018.
1 Co-generation refers to the combined production of heat and power.
IEA
. All
right
s re
serv
ed.

5. DISTRICT HEATING
92
All DH is supplied by the state-owned monopoly Azeristiliktejhizat, which was founded in 2005 to improve DH supply infrastructure that had been severely damaged in the first national reform period after independence in 1991. The company operates 550 boilers in 51 of the country’s 63 administrative regions. In 2017, it supplied heat to 3 800 residential buildings, 291 schools, 150 kindergartens, 159 health sector facilities and 1 188 other service sector premises (Azeristiliktechizat, 2020).
Figure 5.1 District heat generation by source, 2007-2019
Virtually all of Azerbaijan’s district heat is produced from natural gas.
Source: IEA (2021), World Energy Balances 2021 (database), www.iea.org/statistics.
Figure 5.2 District heat consumption by sector, 2007-2019
Azerbaijan’s residential district heat consumption has grown more than fourfold since 2008.
* Includes oil and gas extraction and oil refineries. ** Includes commercial and public services, agriculture and forestry. Note: Heat consumption data have been available in an internationally comparable format since 2007. Source: IEA (2021), World Energy Balances 2021 (database), www.iea.org/statistics.
Regulation and prices Unlike electricity and gas networks, DH networks are local and often supplied by one producer that also owns the distribution grid. DH networks are typically subject to monopoly regulation to protect customers from paying excessively high prices. The
0.10
0.20
0.30
0.40
2007 2008 2009 2010 2011 2012 2013 2014 2015 2016 2017 2018 2019
Mtoe
Oil
Natural gas
IEA 2021. All rights reserved.
0.10
0.20
0.30
0.40
2007 2008 2009 2010 2011 2012 2013 2014 2015 2016 2017 2018 2019
Mtoe
Industry
Energy*
Services/other**
Residential
IEA 2021. All rights reserved.IE
A. A
ll rig
hts
rese
rved
.

5. DISTRICT HEATING
93
ENER
GY
SEC
UR
ITY regulatory framework, which affects both how prices are set and who has access to the
DH network, can vary from strict government regulation to free market competition with minimal regulation.
Azerbaijan and Hungary are examples of countries that have strictly regulated DH markets, in which the end-user heat price (tariff) is set directly or indirectly by the government. DH companies are subsidised to compensate for losses from heat tariffs that do not fully cover generation and distribution costs. In contrast, Sweden and Finland have unregulated DH markets, in which DH has to compete with other heat sources such as direct electric heating or heat pumps (IEA, 2019).
In some cases, a regulator is responsible for price-setting, often in conformity with a model of some kind. These situations tend to fit somewhere between strict government regulation and free market pricing systems. Prices can be regulated according to a cost-plus model, which allows the heat supplier to cover its costs and obtain a reasonable return on its investments (this is what happens in the Slovak Republic, for example). Another model for price regulation puts a cap on the DH price and allows for any price models below that cap. The price cap can be based on best practice through a market benchmark, as in Denmark, or defined by an alternative heating technology, as in Norway and the Netherlands (IEA, 2019; 2018).
In Azerbaijan, district heat prices are regulated by the Tariff Council and approved by the government. Current tariffs, which have been in force since December 2011 and were reconfirmed in January 2017, apply to all DH systems in the country. For residential use, the tariff is AZN 0.15 per m2 of living area per month, and for non-residential use it is AZN 0.25 per m3 of heated space per month. For the relatively few consumers with a heat meter, the tariff is AZN 30 per gigacalorie (Gcal). Tariffs for hot water used to be set by the Tariff Council, but since January 2017 they have been determined by Azeristiliktejhizat, which increased the tariffs (per m3) for households from AZN 0.4 to AZN 1.92 and for non-households from AZN 1.5 to AZN 3.1 (ECS, 2020).
Importantly, natural gas tariffs in Azerbaijan differ across consumer groups, which puts DH at a competitive disadvantage with other heating technologies. In 2019, gas prices per 1 000 m3 were AZN 100 for small consumers (individual gas boiler users) and AZN 120 for electricity generators, but AZN 200 for district heat generators (see Chapter 3).
Azeristiliktechizat does not publish its financial reports, but it is obvious that current tariffs do not enable the company to make a profit, let alone generate sufficient revenue for the investments needed to rehabilitate and modernise the DH system. According to the Law on the State Budget, the company has consistently received state aid. In 2011-2012, the aid was allocated as increases in fixed capital (USD 51 million in total), and in 2013 as a subsidy (USD 27 million). Since 2014, state aid to Azeristiliktechizat has been categorised as financial assistance (totalling USD 110 million from 2014 to 2019, or USD 18.4 million per year) (ECS, 2020).
The current tariff methodology does not oblige or encourage Azeristiliktechizat to reduce its operational costs or to improve the efficiency of heat generation or distribution. In fact, international experience shows that this kind of tariff methodology may instead prompt utilities to increase their costs to justify a greater need for regulated revenue.
IEA
. All
right
s re
serv
ed.

5. DISTRICT HEATING
94
Modernising DH infrastructure Azerbaijan’s DH infrastructure is in need of modernisation. Many boilers have low efficiency, and a substantial part of the 870-km distribution network requires refurbishment. Modern technology offers many new opportunities to raise the energy supply efficiency through integrated district heating, cooling and electricity systems, but finding the financing necessary for investments is difficult because of below-cost district heat tariffs and subsidies for natural gas heating.
Azerbaijan does not have an official strategy for the DH sector, or for the heating sector in general. Since 2005 (subsequent to a 2004 USAID technical assistance project), Azeristiliktechizat has focused on abandoning large, Soviet-era centralised systems and establishing smaller boilers in individual urban areas. These smaller boilers typically supply heat to 10-15 blocks of flats and are relatively highly automated.
Distribution losses were relatively stable from 2010 to 2017 at 11-13% of heat generated, and decreased to 7% in 2018 (SSC, 2019). However, a lack of heat meters means that these figures are indicative only, calculated according to a formula.
Modernising existing DH systems would reduce thermal losses and water leakage and decrease maintenance and repair costs. Integrating heating, cooling and electricity would also help optimise energy supply more generally.
Heating and electricity systems can be integrated in several ways, for example through co-generation or by using heat pumps to generate district heat. From a given electricity input, heat pumps can produce roughly three to four times more energy in the form of heat, depending on the outdoor temperature and the technology used. They are thus an attractive heating option with no local emissions of their own. DH systems typically use large heat pumps.
DH systems can also be used to generate cooling in absorption/adsorption chillers (refrigerators that use heat instead of electricity to drive the cooling process). With heat pumps, DH and district cooling (DC) can be generated in an efficient and integrated process. Combining DH and DC in an integrated district energy network can deliver efficiency gains of 30-50%. District energy is best suited to densely populated areas that can exploit waste heat and provide flexibility to the electricity grid through thermal inertia (IEA, 2020). DH and DC can also be generated together with electricity through trigeneration, as is done, for example, in the district heating and cooling (DHC) systems of Stockholm and Helsinki.
In Azerbaijan, DHC could be used in the Baku area, for example, to supply large residential buildings, industries, offices, commercial buildings such as shopping malls, and public services such as hospitals.
As heat can also be stored more easily than electricity, thermal storage could be used to facilitate system balancing as more power is generated from variable wind and solar resources (an emerging sector in Azerbaijan). In an open electricity market, a DH supplier can also respond to price and demand signals by using co-generation, heat pumps and thermal storage. For example, in times of high electricity demand, it can adjust DH generation to maximise power production and use thermal storage to cover heat demand, while in periods of excess power, it can mobilise more heat pumps to generate heat.
IEA
. All
right
s re
serv
ed.

5. DISTRICT HEATING
95
ENER
GY
SEC
UR
ITY When modernising DH networks, equipping them with fourth-generation DH (4GDH)
systems would offer efficiency gains, as these low-temperature networks reduce the supply temperature to around 50°C in flow pipes from the producer and to 20°C in the return pipes to better match the heat demand profile. Furthermore, a 4GDH network should be able to recycle heat from low-temperature sources and distribute it with low losses in the network. Lower temperatures also enable the use of more waste heat, not only from industry but also from supermarkets and data centres, as well as heat from renewable sources such as geothermal energy and solar irradiation.
Assessment Although Azerbaijan’s government has successfully restored the DH system that was practically dismantled in the 1990s, for several reasons the system remains economically unviable. Natural gas subsidies favour individual gas boilers over other heating technologies, while the state-owned DH monopoly Azeristiliktechizat needs to find revenues to modernise its ageing and inefficient Soviet-legacy infrastructure. Nevertheless, the current lack of economic viability does not mean that DH has little or no future. Modern DH technology, combined with electricity and cooling generation and heat pump and waste heat use, has been proven an economically and environmentally attractive way to supply energy in many IEA member countries, and could be in Azerbaijan also if certain energy market reforms are carried out.
Gas price subsidies for residential consumers remain a major barrier to DH development. The household price for gas is only half what Azeristiliktechizat must pay for gas to generate district heat. As a result, individual gas boilers are by far the most popular space heating technology in the country. Many apartments in multi-apartment buildings have voluntarily been disconnected from the DH network and opted for individual natural gas or electric boilers instead. This compounds the challenge for DH systems, because the disconnection of customers from the system leads to overcapacity, which in turn increases the average cost of heat supply for final consumers.
At the same time, the consumer tariff for district heat does not appear to reflect actual supply costs and is too low for Azeristiliktechizat to generate the revenues needed to modernise the Soviet-era infrastructure. Thus, Azeristiliktechizat is subsidised from the state budget to cover its losses (around USD 60 million from 2016 to 2019). Furthermore, district heat prices remain the same throughout the year and for all the country’s DH systems, and nominal prices have not been changed since 2011.
The government should therefore introduce cost-reflective consumption-based energy tariffs that would enable Azeristiliktechizat to fully recover its costs and compete on equal terms in the heat market. Until such tariffs are introduced, the viability of DH infrastructure could be maintained by avoiding any further erosion of the DH customer base: the best way to do this would be to ensure that the cost of natural gas for DH does not exceed the price for residential consumers.
A more diversified and dynamic pricing approach that recognises differences in heat loads and generating costs would also help save energy and encourage the development of new business models. Examples of numerous other countries employing this type of approach may provide useful models for Azerbaijan’s government.
IEA
. All
right
s re
serv
ed.

5. DISTRICT HEATING
96
It is quite possible that DH could become more attractive in Azerbaijan’s new and renovated urban areas. As around half of the nation’s population still lives in the countryside, its cities are set to continue to grow, and new urban areas will need heating solutions. In addition to being an efficient and cost-effective option, DHC systems that integrate electricity generation, heat pumps, waste heat use and thermal storage would also help reduce CO2 emissions.
Establishing a more efficient integrated energy system would also allow the country to save more natural gas for export. An upgraded system could be built gradually and should be more economically viable than the current one, which is based on subsidised natural gas and therefore ensures complete dominance of individual natural gas boilers, the continuous need for DH subsidies, and the loss of potential gas export revenues.
To identify heating sector opportunities, the government should develop a heat map that includes existing DH capacities and waste heat from industry and power generation. It could then assess strategic investments in DH infrastructure modernisation based on this heat map, and direct public and private investment funds towards these areas. The government should also evaluate cogeneration and trigeneration potential, and introduce incentives or obligations to support them.
It will also be critical to co-ordinate policies on DH, cooling, natural gas and energy efficiency. For example, incentives would be needed for a DH system with overcapacity to improve the energy efficiency of its operations and promote efficiency for end users. While lower heat demand in a DH system could be compensated for by additional new customers as more people move into urban areas, this would require the establishment of undistorted competition among heating options (i.e. the abolishment of price subsidies for individual gas users). Regulation should encourage heat supply innovation and integration with smart and energy-efficient buildings, and incentives should be introduced to reward gradually more efficient generation. The government should also set efficiency improvement targets for Azeristiliktechizat: additional options to boost the company’s operational efficiency include restructuring and full or partial privatisation.
An obvious way to increase efficiency is through metering, which is currently absent throughout the DH chain. Although the 1998 Law on Energy stipulates that all energy supplied must also be metered, in reality DH network losses are calculated through a formula that covers only living space, not the full dwelling area. The installation of meters and implementation of consumption-based billing would therefore enable Azeristiliktechizat to track actual network losses, while consumers would receive transparent information on what they are being billed for. Replacing boilers and pipes, and installing energy controls such as individual heating substations and temperature-regulating valves, would also increase efficiency. To encourage further improvements, the government should also facilitate the establishment of energy service companies.
IEA
. All
right
s re
serv
ed.

5. DISTRICT HEATING
97
ENER
GY
SEC
UR
ITY Recommendations
The government of Azerbaijan should:
Implement a new regulatory framework for the heating sector, one that promotes cost-effectiveness, competition, efficiency and flexibility, including through sector integration, and encourages investment for these purposes. Achieving these ends would involve:
> Transitioning to a system of cost-reflective consumption-based energy tariffs, which would enable Azeristiliktechizat to fully recover its costs and compete on equal terms in the heat market.
> Introducing efficiency improvement targets for Azeristiliktechizat.
> Possibly restructuring Azeristiliktechizat, and fully or partly privatising it to leverage private investment to modernise and rehabilitate DH.
> Promoting co-generation at existing power plants.
Consolidate and co-ordinate policies in the areas of district heating and cooling, natural gas and energy efficiency, and support the development and demonstration of efficient, integrated systems to supply heating, cooling and electricity (trigeneration).
Improve the energy efficiency of district heating through policies and programmes to
> Replace old and inefficient boilers with modern ones.
> Replace old pipes with modern, pre-insulated ones.
> Install meters throughout the system – from boiler exit meters to building-level heat meters – and introduce compulsory apartment-level metering for new buildings.
> Install energy controls, including individual heating substations and temperature-regulating valves (TRVs).
> Racilitate the establishment of energy service companies.
IEA
. All
right
s re
serv
ed.

5. DISTRICT HEATING
98
References
Azeristiliktechizat (2020), http://azeristilik.gov.az (accessed September 2020).
ECS (Energy Charter Secretariat) (2020), In-Depth Review of the Energy Efficiency Policy of the Republic of Azerbaijan, ECS, Brussels.
IEA (International Energy Agency) (2021), World Energy Balances 2021 (database), www.iea.org/statistics.
IEA (2020), Energy Technology Perspectives 2020, https://www.iea.org/reports/energy-technology-perspectives-2020.
IEA (2019), Energy Policies of IEA Countries: Sweden 2019, https://www.iea.org/reports/energy-policies-of-iea-countries-sweden-2019-review.
IEA (2018), Energy Policies of IEA Countries: Slovak Republic 2018, https://www.iea.org/reports/energy-policies-of-iea-countries-slovak-republic-2018-review.
SSC (State Statistical Committee of Azerbaijan) (2019), Environment in Azerbaijan 2019, SSC, Baku.
IEA
. All
right
s re
serv
ed.
99
ENER
GY
SYST
EM T
RAN
SFO
RM
ATIO
N
6. Energy and climate change
Key data (2019 provisional)
Total GHG emissions* without LULUCF** (2018): 53.6 MtCO2-eq.
Total GHG emissions* with LULUCF** (2018): 46.4 MtCO2-eq.
Energy-related CO₂ emissions
From fuel combustion: 34.1 MtCO₂ (+17.3% since 2005, -36.3% since 1990)
By fuel: natural gas 68.1%, oil 31.4%, other 0.4%
By sector: power and heat generation 36.3%, transport 24.4%, residential 19.3%, commercial 7.6%, industry 7.0%, other energy 5.4%
CO₂ intensity (CO₂ emissions per GDP): 0.24 kgCO₂/USD (2015 PPP) (world average 0.26)
* For non-Annex I countries of the UNFCCC, recent data availability is limited.
** Land use, land-use change and forestry.
Overview Azerbaijan joined the United Nations Framework Convention on Climate Change (UNFCCC) in 1995 and ratified the Kyoto Protocol in 2000. As a Non-Annex 1 Party to the Convention, it did not have to set a target for its GHG emissions, but it has nevertheless committed to reduce them. Its main measures in the energy sector have been switching from oil to natural gas, increasing power and heat generation efficiency, and limiting methane leaks from oil and gas production. In October 2016, Azerbaijan ratified the Paris Agreement and pledged to reduce its net GHG emissions to 35% below the 1990 level by 2030.
In 2018, Azerbaijan’s net GHG emissions, which include a net sink of 7.2 million tonnes of carbon dioxide equivalent (MtCO2-eq) from LULUCF, totalled 46.4 MtCO2-eq, or 2.5% more than the 2030 target level.
Broken down by GHG, CO2 accounted for 61.0% of total emissions in 2018, CH4 for 31.5%, N2O for 6.5% and F-gases for 0.9%. The relatively high share of CH4 is linked to the country’s significant oil and gas production.
IEA
. All
right
s re
serv
ed.

6. ENERGY AND CLIMATE CHANGE
100
By sector, energy-related emissions accounted for 73% of Azerbaijan’s total GHG emissions (Figure 6.1). Total GHG emissions increased 8% from 2005 to 2018, while the share of energy-related emissions decreased by six percentage points.
Figure 6.1 Greenhouse gas emissions by sector, 1990-2018
Azerbaijan’s total GHG emissions have risen less than 10% since 2005.
* Includes fuel combustion (for power and heat generation, and for industry, transport, residential and commercial energy consumption), fugitive emissions from fuels and the energy industry’s own consumption. Sources: MENR (2018), Second Biennial Update Report of the Republic of Azerbaijan; SSC (2020), Environment in Azerbaijan 2020 (data for 2014, 2016 and 2018).
CO2 emissions from fuel combustion In 2019, Azerbaijan’s CO2 emissions from fuel combustion were 34.1 Mt (+18% from 2008) (Figure 6.2). Power and heat generation, which relies on natural gas for more than 90% of its primary energy, accounted for 36% of the total. The remaining emissions came from transport (24%), the residential sector (19%), the energy industry, mainly oil and gas production and oil refining (5%), the commercial sector (8%) and the manufacturing industry (7%).
Figure 6.2 CO2 emissions from fuel combustion by sector, 1990-2019
The highest portion of Azerbaijan’s CO2 emissions from fuel combustion come from electricity and heat generation.
* Includes oil and gas extraction, oil refineries, own use in electricity and heat generation, and unspecified energy industry own use. ** Includes construction and manufacturing. *** Includes commercial and public services, and agriculture, forestry and fishing. Source: IEA (2021), CO₂ Emissions from Fuel Combustion 2021 (database), www.iea.org/statistics.
01020304050607080
1990 2000 2005 2010 2014 2016 2018
MtCO₂-eqWaste
Industry processes
Agriculture
Energy*
IEA 2021. All rights reserved.
10
20
30
40
50
60
1990 1992 1994 1996 1998 2000 2002 2004 2006 2008 2010 2012 2014 2016 2019
MtCO₂
Other energy*
Industry**
Services/other***
Residential
Transport
Power and heat generation
IEA 2021. All rights reserved.
IEA
. All
right
s re
serv
ed.

6. ENERGY AND CLIMATE CHANGE
101
ENER
GY
SYST
EM T
RAN
SFO
RM
ATIO
N The structure of Azerbaijan’s CO2 emissions by sector has changed quite markedly since
2000. While emissions from power and heat generation have declined 20%, those from transport have more than tripled (252%). Emissions have virtually doubled (98%) in the residential sector and grown by four-fifths (85%) in the oil and gas sector. In contrast, emissions halved in industry (-51%) from 2000 to 2018, but production capacity increases raised them by over three-quarters (77%) from 2018 to 2019. The commercial sector’s emissions developed in a similar manner, dropping by half between 2000 and 2018 (-48%) and more than doubling from 2018 to 2019 (148%). Related energy use trends in these sectors are analysed elsewhere in this report (see Chapters 3, 4 and 7).
Azerbaijan’s CO2 emissions are driven by a set of factors that include population changes and the structure and size of its economy. These, together with the technologies deployed, determine the economy’s energy intensity.
Because Azerbaijan’s economy relies heavily on oil and gas exports, the country’s CO2 emissions are not strongly linked to its GDP (Figure 6.3). Rather, emissions correlate more strongly with electricity generation, which is based on natural gas and is the highest-emitting sector. Growing electricity consumption is in turn linked with population increases (+25% since 2000) and economic activity outside the oil and gas sector.
Figure 6.3 Energy-related CO₂ emissions and main drivers, 2000-2019
Azerbaijan’s high share of oil and gas exports in GDP dampens the impact of GDP changes on CO2 emissions.
Notes: TES = total energy supply. PPP = purchasing power parity. GDP in constant 2015 USD prices at PPP. Source: IEA (2021), CO₂ Emissions from Fuel Combustion 2021 (database), www.iea.org/statistics.
Azerbaijan’s CO2 intensity of GDP, at 0.24 kilogrammes of carbon dioxide (kgCO2)/USD (2015 PPP) in 2019, is below the world average (Figure 6.4). This reflects the structure of its economy as well as its lack of reliance on coal in electricity generation: over the past two decades, the country’s power plants have been modernised and fuel oil has been replaced by natural gas as the main energy source.
50
100
150
200
250
300
350
400
2000 2002 2004 2006 2008 2010 2012 2014 2016 2018 2019
Index (2000 = 100)
GDP/ capita (PPP)
Electricity generation
Population
CO₂ emissions
CO₂/TES
TES/GDP
IEA 2021. All rights reserved.
IEA
. All
right
s re
serv
ed.

6. ENERGY AND CLIMATE CHANGE
102
Figure 6.4 CO₂ intensity in Azerbaijan and selected countries, 2019
Azerbaijan’s CO2 intensity is below the world average.
* Covers Armenia, Azerbaijan, Belarus, Georgia, Kazakhstan, Kyrgyzstan, Moldova, Tajikistan, Turkmenistan, Ukraine and Uzbekistan. Note: When recent data are not available, the year for the latest data are indicated in the chart. Source: IEA (2021), CO₂ Emissions from Fuel Combustion 2021 (database), www.iea.org/statistics.
Figure 6.5 CO₂ intensity in Azerbaijan and selected countries, 2000-2018
Rapid GDP growth has helped reduce the carbon intensity of Azerbaijan’s economy.
Source: IEA (2021), CO₂ Emissions from Fuel Combustion 2021 (database), www.iea.org/statistics.
In 2018, Azerbaijan’s power generation sector emitted an average of 430 grammes of CO2 per kilowatt hour (gCO2/kWh) of electricity (Figure 6.6). The relatively high carbon intensity reflects the high share (92%) of natural gas in power generation. In the short term, this could be reduced by increasing both the efficiency of gas-fired power generation and the use of renewable energy, and by introducing incentives to this end as part of electricity market reform (see Chapter 4). In the longer term, carbon capture and storage (CCS) could also be a viable option for Azerbaijan.
0.1 0.2 0.3 0.4 0.5 0.6 0.7 0.8
kgCO₂/USD (2015 PPP)
IEA 2021. All rights reserved.
0.1
0.2
0.3
0.4
0.5
0.6
0.7
0.8
2000 2002 2004 2006 2008 2010 2012 2014 2016 2018
kgCO₂ / USD (2015 PPP)Russian Federation
Non-Annex I countries(UNFCCC)Georgia
IEA total
Azerbaijan
European Union
IEA 2021. All rights reserved.
IEA
. All
right
s re
serv
ed.

6. ENERGY AND CLIMATE CHANGE
103
ENER
GY
SYST
EM T
RAN
SFO
RM
ATIO
N Figure 6.6 CO₂ intensity of power and heat generation in Azerbaijan and selected
countries, 2000-2018
Azerbaijan’s power sector carbon intensity is declining slowly, but various incentives could reduce it further.
Source: IEA (2021), CO₂ Emissions from Fuel Combustion 2021 (database), www.iea.org/statistics.
Institutions The Ministry of Ecology and Natural Resources (MENR) is responsible for formulating environmental and climate policy, and its Climate Change and Ozone Center co-ordinates the National GHG Inventory. The Center has four departments dedicated to: the GHG inventory; Climate Change Impact Assessment; Adaptation; and Climate and Ozone. GHG data is published in the annual Environment in Azerbaijan report prepared by the State Statistical Committee (SSC).
The National Coordination Council on Sustainable Development, set up in 2016 and headed by the deputy prime minister, brings together representatives from various ministries to ensure that the country’s socio-economic programmes and strategies conform to the UN Sustainable Development Goals. The Council includes a separate working group for environmental issues, including climate change.
Policy Azerbaijan’s January 2017 Nationally Determined Contribution (NDC) to the Paris Agreement under the UNFCCC lays out the country’s climate policy objectives and planned mitigation policies and measures. The NDC defined the country’s first-ever quantitative target for GHG emissions: a 35% reduction from the 1990 level by 2030.1
Prior to submitting its NDC, as a Non-Annex 1 Party to the UNFCCC, Azerbaijan did not have an emissions target, and climate policy received rather limited attention in government policy documents. The Azerbaijan 2020 vision from 2012 did, however, include a target to decrease energy and CO2 intensities to the OECD average, and the 2016 strategic roadmaps covering heavy industry and machinery, utilities, and manufacturing and processing agricultural products listed several measures to address 1 In absolute terms, the 35% reduction equates to a drop of 25.7 MtCO2-eq from the 1990 level excluding LULUCF (73.3 MtCO2-eq), or 24.4 MtCO2-eq from 1990 level including LULUCF (69.6 MtCO2-eq).
100
200
300
400
500
600
700
2000 2002 2004 2006 2008 2010 2012 2014 2016 2018
gCO₂/kWhNon-Annex I countries(UNFCCC)Azerbaijan
IEA total
Russian Federation
European Union
Georgia
IEA 2021. All rights reserved.
IEA
. All
right
s re
serv
ed.

6. ENERGY AND CLIMATE CHANGE
104
climate change. These measures aimed to increase energy and waste management efficiency, renewable energy production, and the size of forested areas.
However, Azerbaijan does not yet have legal instruments to support its goal to reduce GHG emissions. It also has yet to adopt laws on energy efficiency and renewable energy, and to develop plans for introducing carbon pricing of any kind. It also lacks a specific climate strategy, although MENR, together with the UN Development Programme (UNDP), is now preparing a national action plan to meet the NDC targets. MENR has also begun to formulate a national strategy for low-carbon development and has established related working groups that bring together representatives of various ministries and state agencies.
The 2017 NDC Azerbaijan’s 2017 NDC outlines climate change mitigation actions for the electricity and heat, oil and gas, residential and commercial, transport, agricultural, and waste sectors, as well as for LULUCF. They focus on technological improvements, but also include regulatory changes and public awareness measures (see Box 6.1). The NDC document also explicitly mentions that declining global oil prices will constrain the country’s ability to meet its pledge.
A key part of the Paris Agreement is establishing a common system for the transparency of climate change mitigation. Measurement, reporting and verification (MRV) is central to effective NDC implementation. Measurement is needed to identify emissions trends and determine where to focus emissions reduction efforts and to monitor progress. Reporting and verification are important for ensuring transparency, good governance, accountability, and the credibility of results. Sound MRV is also a precondition for introducing carbon pricing.
Azerbaijan has plans for an MRV system that would apply to around 70 emitting facilities However, the government recognises that building an MRV system will require greater institutional capacity within the government – which means personnel must be trained to calculate emissions projections and verify emissions – as well as increased know-how within companies.
It is for these reasons that Azerbaijan has not yet introduced a national MRV system. Instead, the emitting companies have been measuring and reporting emissions themselves, and the environmental administration under MENR has been analysing the reports and verifying them through company inspections. However, according to Azerbaijan’s 2018 Second Biennial Update Report to the UNFCCC, the government suspended all company inspections, including environmental ones, from 2015 to 2021 to stimulate entrepreneurship (MENR, 2018).
Box 6.1 Azerbaijan’s NDC measures to mitigate energy-related GHG emissions
Power and heat • develop legislative acts and regulatory documents on energy • raise awareness on energy efficiency • replace existing technologies in electricity and heat production with modern ones • reconstruct distribution networks and transmission lines • implement insulation works and applying modern lighting systems
IEA
. All
right
s re
serv
ed.

6. ENERGY AND CLIMATE CHANGE
105
ENER
GY
SYST
EM T
RAN
SFO
RM
ATIO
N
Oil and gas • apply new and modern environmentally friendly processing technologies • produce fuel in line with EURO-5 standards in a new refinery complex by 2019 and
strengthen the capacity of the staff • modernise gas pipelines and gas distribution systems and take other measures to
decrease losses by up to 1% by 2020 and ensure the volume of reduction complies with international standards by 2050
• capture emissions to the atmosphere from oil and gas production • prevent gas leakages in oil and gas processing and at distribution networks
Residential and commercial sectors • deploy control and measurement devices in electricity, heat and natural gas systems
on a massive scale • promote the use of energy-efficient light bulbs • use modern energy-saving technologies in heating systems • organise public awareness programmes on energy efficiency
Alternative and renewable energy sources • accelerate the use of renewable energy for heating, enhancing the use of innovative
technologies • construct small hydropower plants (HPPs) on small rivers, irrigation canals and water
basins • use biomass, solar power, electric and heat energy, wind power, heat pumps and
geothermal energy in all sectors of the economy.
Transport • use environmentally friendly forms of transport • increase the use of electric vehicles for public transport • electrify railway lines and transition to alternating current (AC) systems in traction • improve and expand smart transport management systems • develop underground transport and increase the number of underground stations • eliminate traffic jams by constructing road junctions and underground and surface
pedestrian crossings
Source: UNFCCC (2017), Information to the United Nations Framework Convention on Climate Change (UNFCCC) on the Intended Nationally Determined Contribution (INDC) of the Republic of Azerbaijan, https://www4.unfccc.int/sites/ndcstaging/PublishedDocuments/Azerbaijan%20First/INDC%20Azerbaijan.pdf.
Limiting GHG emissions from oil and gas production The outlook for oil and gas exports in a decarbonising world is of critical strategic importance for Azerbaijan. Oil and gas continue to provide around 90% of the country’s export revenue, and completion of the Trans-Adriatic Pipeline in late 2020 means that gas exports to the European Union are set to increase significantly. However, many importing countries are aiming to move away from oil and gas use in the medium to long term. The European Union especially is striving to make its economy carbon-neutral by 2050.
As 15% of global energy-related GHG emissions come from the process of getting oil and gas out of the ground and to consumers, it would be beneficial to reduce the GHG intensity of oil and gas production as soon as possible. Options that are likely to be cost-effective
IEA
. All
right
s re
serv
ed.

6. ENERGY AND CLIMATE CHANGE
106
include minimising the flaring of associated gases and venting of CO2, reducing methane emissions, and integrating renewables and low-carbon electricity into new upstream developments. Putting a price on methane emissions should encourage the oil and gas industry to limit such emissions and recover methane, which could then be sold (IEA, 2020b; 2020c).
The State Oil Company of the Azerbaijan Republic (SOCAR) is part of the Zero Routine Flaring by 2030 initiative launched by the World Bank and the UN in 2015. From 2011 to 2017, SOCAR reduced annual gas flaring from its operations by more than 600 million cubic metres (mcm) and is targeting to eliminate flaring completely in 2021. The company is also working to reduce methane emissions to 95 mcm per year by 2022 under the plan "Reduction of associated gas emissions in SOCAR and projects involving SOCAR for 2017-2022". In addition, it is planning to adopt in 2021 a low-emission development strategy to 2030. (MGP, 2021; SOCAR, 2020a).
To make oil and gas production more compatible with emissions reductions, facilities could be equipped with carbon capture, utilisation and storage (CCUS), and the captured CO2 used more extensively in petrochemical production or converted to zero-carbon fuels (e.g. hydrogen). CCUS equipment could also help mitigate CO2 emissions from gas processing and oil refining and aid enhance oil recovery (IEA, 2020a; 2020b).
To combat climate change and the pollution that threatens the environmental sustainability of the Caspian Sea and Absheron Peninsula, in May 2020 SOCAR initiated the Caspian Environmental Protection Initiative (CEPI). Global oil and gas companies operating in Azerbaijan (BP AGT, Equinor Absheron AS and Total E&P Absheron B.V.) have also joined the CEPI. The initiative brings these companies together to share knowledge and experience, conduct joint research and implement environmental activities in a co-ordinated manner (SOCAR, 2020b).
Climate change adaptation The government is preparing a national climate change adaptation plan focused on the three priority areas of water, agriculture and coastal areas. This work, led by MENR and involving representatives of the relevant ministries and state agencies, builds on adaptation measures for agriculture, water supply, forestry, coastal communities, human health and tourism already identified in Azerbaijan’s Third National Communication to the UNFCCC from 2015.
For the energy sector, the main concerns are linked to water availability, both to supply cooling water to thermal power plants – which generated 92.5% of Azerbaijan’s electricity in 2019 – and for hydropower, which generated 6.0%. Some of the key climate change impacts on the country are expected to result from reduced water availability as winter precipitation and snow-melt water decrease, surface and groundwater resources diminish, summertime precipitation declines and drought periods become longer/more frequent (Arent, 2018).
IEA
. All
right
s re
serv
ed.

6. ENERGY AND CLIMATE CHANGE
107
ENER
GY
SYST
EM T
RAN
SFO
RM
ATIO
N Of the other major energy system impacts of climate change listed by the IEA (IEA, 2016),
several are particularly relevant for Azerbaijan:
Higher temperatures increase transmission losses and reduce overall transmission efficiency.
Higher temperatures reduce the viscosity of transported fuels.
Higher temperatures increase cooling demand (mostly affecting electricity) and reduce heating demand (involving heating fuels and electricity).
Extreme events (e.g. flooding, landslides) and erosion can damage electricity networks as well as oil and gas pipelines.
Local air pollution Transport is by far the largest source of air pollution in Azerbaijan. According to the SSC, it accounted for 85% of the country’s total air pollutant volume in 2018, up from 47% in 2005 and 78% in 2010. During this period (2005-2018), total national air pollutant emissions remained broadly flat (SSC, 2019).
As transport was responsible for more than three-fifths of the country’s total oil consumption in 2018, better fuel quality is the key to limit air pollution from this sector. Azerbaijan follows EU vehicle emission standards, and since April 2014 it has been applying the Euro 4 standard, which sets emission limits for several pollutants, including NOx and PM. Ongoing modernisation of the Heydar Aliyev Oil Refinery, which supplies almost all the country’s transport fuel, will enable it to produce high-quality diesel and gasoline that meet the Euro 5 standard (see Chapter 3). Although electric vehicles offer significant potential to reduce local air pollution, their numbers remain low in Azerbaijan.
In contrast with transport, air pollution from stationary sources has fallen in the past 15 years, thanks to a switch from oil- to gas-fired power generation and to modern technologies in oil and gas production. Emissions could be reduced further by increasing efficiency, saving energy and using alternative energy sources.
Assessment Under the Paris Agreement, Azerbaijan’s NDC goal is to reduce net GHG emissions 35% from 1990 to 2030. In 2018, its emissions (including LULUCF) stood at 46.4 MtCO2-eq – 33.4% below the 1990 level and 2.5% higher than the 2030 target. According to the most recent IEA data, in 2019 Azerbaijan’s CO2 emissions from fuel combustion amounted to 34.1 MtCO₂ (+17.3% since 2005, -36.3% since 1990). Attaining the 2030 NDC target will be complicated if the country does not tackle the rise in transport fuel demand (unrestrained by prices or taxes) and expanding natural gas consumption (subsidised in all sectors).
Since Azerbaijan currently does not have legally binding climate targets or measures, the government should consider introducing them, for example as part of revising the Law on Energy. The government has, however, outlined climate change mitigation actions for the power and heat, oil and gas, residential and commercial, transport, agriculture and waste sectors. These measures primarily entail technological improvements to reduce negative
IEA
. All
right
s re
serv
ed.

6. ENERGY AND CLIMATE CHANGE
108
environmental impacts, together with some regulatory changes and public awareness measures, but more concrete implementation plans and policies are now needed to enact them.
Other actions could also be considered. For example, modernising the vehicle fleet by instituting fuel efficiency requirements would help reduce air pollution and CO2 emissions, as would using the country’s valuable fossil fuel resources more efficiently and increasing the use of its considerable untapped renewable energy resources in power generation. Fossil fuel subsidy reforms and revenue-neutral carbon pricing could achieve these ends, making more oil and gas available for export.
There is also a strong case for developing policies and strategies beyond 2030. As more buildings will be constructed, more appliances and equipment sold, and more vehicles bought in upcoming decades, strong energy efficiency policies will be increasingly relevant, and the country will need a long-term approach to keep it on an environmentally sustainable pathway. With its population set to continue to grow, urbanise and become wealthier, Azerbaijan will need to build more urban infrastructure: energy and climate concerns should be an integral part of long-term transport and urban development policies to avoid the lock-in of private car-dominated, inefficient and energy-intensive urban structures. For instance, if private car ownership in Azerbaijan were to increase to the current EU average, it would explode almost fourfold to 5 million (see Chapter 7).
The long-term decarbonisation objectives of the European Union and many other countries challenge Azerbaijan’s reliance on oil and gas for export revenue. Further measures are therefore needed both to reduce the CO2 intensity of oil and gas production and to diversify the country’s economy.
Climate change could affect Azerbaijan’s energy supply in several ways. Abnormal heat could necessitate power plant capacity reductions as well as reduce the availability of water for cooling thermal power plants and for generating hydropower. While higher temperatures and stronger winds could complicate electricity transmission and distribution, higher temperatures would also likely reduce energy demand in the winter and raise consumption in the summer.
Encouragingly, MENR is preparing a National Strategy for Low-Carbon Development and a Climate Change Adaptation Plan, and working groups made up of representatives from all the relevant ministries and state agencies have been established. To make policymaking more effective, a system to measure, report and verify emissions should be introduced, modelling capacity should be increased and co-ordination among the relevant government ministries and other entities strengthened.
IEA
. All
right
s re
serv
ed.

6. ENERGY AND CLIMATE CHANGE
109
ENER
GY
SYST
EM T
RAN
SFO
RM
ATIO
N Recommendations
The government of Azerbaijan should:
Introduce legally binding obligations to limit GHG emissions in line with the 2030 NDC and with plans beyond 2030, and to develop emissions projections to show whether the country is on track to meet its emissions reduction targets.
Adopt a guiding policy document and action plan to enable the country to meet its 2030 NDC, develop a Low-Emission Development Strategy outlining plans to limit GHG emissions beyond 2030, and identify in these documents the most cost-effective policies and measures to achieve their objectives.
Introduce a system for measuring, reporting and verifying GHG emissions, and increase capacity to model them.
IEA
. All
right
s re
serv
ed.

6. ENERGY AND CLIMATE CHANGE
110
References
Arent, D.J. et al. (2018), “Key economic sector and services”, in AR5 Climate Change 2014: Impacts, Adaptation and Vulnerability. Part A: Global and Sectoral Aspects. Contribution of Working Group II to the Fifth Assessment Report of the Intergovernmental Panel on Climate Change, Field, C.B. et al. (eds.), Cambridge University Press, Cambridge and New York, pp. 659-708, www.ipcc.ch/site/assets/uploads/2018/02/WGIIAR5-Chap10_FINAL.pdf.
IEA (International Energy Agency) (2021), CO₂ Emissions from Fuel Combustion 2021 (database), www.iea.org/statistics.
IEA (2020a), Sustainable Recovery, www.iea.org/reports/sustainable-recovery.
IEA (2020b), The Oil and Gas Industry in Energy Transitions, www.iea.org/reports/the-oil-and-gas-industry-in-energy-transitions.
IEA (2020c), Methane Emissions from Oil and Gas, www.iea.org/reports/methane-emissions-from-oil-and-gas.
IEA (2016), Energy, Climate Change and Environment 2016 Insights, www.iea.org/reports/energy-climate-change-and-environment-2016-insights.
MENR (Ministry of Ecology and Natural Resources) (2018), Second Biennial Update Report of the Republic of Azerbaijan to UN Framework Convention on Climate Change, MENR, Baku.
MGP (Methane Guiding Principles) (2021), Signatory Reporting SOCAR, https://methaneguidingprinciples.org/wp-content/uploads/2021/01/Methane-Guiding-Principles_Reporting-SOCAR.pdf.
SOCAR (State Oil Company of the Azerbaijan Republic) (2020a), Annual Sustainable Development Report 2019, https://socar.az/socar/assets/documents/en/socar-annual-reports/Sustainable%20development%20report-2019.pdf.
SOCAR (2020b), company website, www.socar.az/socar/en/company.
SSC (State Statistical Committee) (2020), Environment in Azerbaijan 2020, SSC, Baku.
UNFCCC (United Nations Framework Convention on Climate Change) (2017), Information to the United Nations Framework Convention on Climate Change (UNFCCC) on the Intended Nationally Determined Contribution (INDC) of the Republic of Azerbaijan, https://www4.unfccc.int/sites/ndcstaging/PublishedDocuments/Azerbaijan%20First/INDC%20Azerbaijan.pdf.
IEA
. All
right
s re
serv
ed.
111
ENER
GY
SYST
EM T
RAN
SFO
RM
ATIO
N
7. Energy efficiency
Key data (2019 provisional)
Total final consumption (TFC): 10.8 Mtoe (oil 41.9%, natural gas 39.9%, electricity 14.9%, district heat 2.9%, bioenergy and waste 0.4%), +37% since 2008
TFC by sector: residential 32.2%, transport 26.1%, industry 26.1%, services/other 15.6%
TFC per capita: 1.1 toe (world average 2018: 1.3 toe), +20% since 2008, +41% since 2010
Energy intensity (TFC/GDP): 74 toe/2015 USD million PPP (world average 2018: 77 toe/USD million PPP), +7% since 2008, +40% since 2010
Overview Population growth and economic development are major drivers of energy demand. From 2000 to 2019, Azerbaijan’s GDP increased more than fourfold, largely owing to higher oil and gas exports since the mid-2000s. Its population expanded by almost one-quarter, and total final consumption (TFC) of energy by almost two-thirds (Figure 7.1).
Azerbaijan’s use of energy increased 65% between 2000 and 2019 to reach 10.8 million tonnes of oil equivalent (Mtoe). Most (over 60%) of this growth resulted from oil use in the transport sector more than tripling. The country’s main energy sources in 2019 were oil (42%), natural gas (40%) and electricity (15%).
Since 2008, transport has shown the strongest absolute growth (+70%), whereas consumption in the residential sector (still the largest end consumer) increased only 1%. Industry consumption was essentially flat for a decade, but it jumped almost 30% from 2018 to 2019 due to new economic activity. Commercial consumption has also increased rapidly in recent years (+118% since 2008), but from a low base (Figure 7.2).
Globally, while technologies and processes are becoming more efficient, structural factors such as changes in transport modes and increasing floor area per person are dampening the impact of these technical efficiency gains on energy demand and slowing global energy intensity improvements. This poses a challenge for Azerbaijan’s policymakers, as the country’s population is projected to continue increasing. Judging from other countries’ experiences, the quality of the housing stock will improve as the population becomes wealthier. Heating and cooling devices are expected to become more efficient but also more numerous, as are other household appliances.
IEA
. All
right
s re
serv
ed.

7. ENERGY EFFICIENCY
112
Figure 7.1 Energy consumption and its drivers, 2000-2019
Azerbaijan’s final energy use has remained quite stable in the past decade, both per capita and per unit of output.
* Expressed in constant 2015 USD billion at purchasing power parity (PPP). Note: Azerbaijan’s GDP includes a large share of oil and gas exports, the value of which may fluctuate strongly year-on-year. This may affect the accuracy of TFC/GDP as an indicator of energy intensity and efficiency. Source: IEA (2021), World Energy Balances 2021 (database), www.iea.org/statistics.
Figure 7.2 Final energy consumption by sector, 2000-2019
TFC growth in Azerbaijan (65% from 2000 to 2019) resulted mostly from increasing transport sector oil use.
* Includes non-energy use. ** Includes commercial and public services, agriculture, forestry, fishing and non-specified consumption. Note: Azerbaijan has followed international standards for energy data collection since 2007. For industry and the commercial sector, the pre-2007 definitions and time series are not fully comparable with the current ones. Source: IEA (2021), World Energy Balances 2021 (database), www.iea.org/statistics.
Energy intensity can be measured as TFC per capita, and in 2019 Azerbaijan’s per capita TFC was 1.1 tonne of oil equivalent (toe), or 18% below the 2018 world average of 1.3 toe (Figure 7.3). Energy intensity is often also measured as TFC per GDP. In 2019, Azerbaijan’s energy intensity per unit of GDP at PPP was 74 toe per million USD – just below the 2018 world average of 77 toe per million USD. However, the high share of oil and gas exports in GDP constrain the usefulness of TFC/GDP as an efficiency indicator for Azerbaijan (see note under Figure 7.1.).
50 100 150 200 250 300 350 400 450 500
2000 2002 2004 2006 2008 2010 2012 2014 2016 2018 2019
Index (2000 = 100)
GDP*
TFC
TFC / capita
Population
TFC / GDP*
IEA 2021. All rights reserved.
0.5 1.0 1.5 2.0 2.5 3.0 3.5 4.0
2000 2002 2004 2006 2008 2010 2012 2014 2016 2018 2019
Mtoe
Residential
Transport
Industry*
Services/other**
IEA 2021. All rights reserved.
IEA
. All
right
s re
serv
ed.

7. ENERGY EFFICIENCY
113
ENER
GY
SYST
EM T
RAN
SFO
RM
ATIO
N Figure 7.3 TFC per capita in Azerbaijan and selected countries, 2018*
Azerbaijan’s energy intensity is below the world average, both per unit of output and per capita.
* Comparable data available for 2018. Note: TFC does not include energy transformation. Source: IEA (2019b), World Energy Balances 2019 (database), www.iea.org/statistics.
Trends by sector Residential In 2019, the residential sector was the largest end user of energy, consuming 3.5 Mtoe and accounting for 32% of TFC. The sector’s TFC has remained stable (+1% since 2008), but its TFC structure has continued to change, as natural gas use for space heating has increased at the expense of electricity (Figure 7.4). Today the gas grid reaches 96% of Azerbaijan’s population thanks to the government’s grid expansion policy.
Natural gas therefore made up 80% of residential TFC in 2019, up from 75% in 2008. Electricity provided 15%, down from 19% in 2008, while district heat accounted for 3% of residential TFC. District heat in Azerbaijan is generated from natural gas and its use in the residential sector more than quadrupled from 2008 (a rise of 314%), but subsidies are significantly higher for gas used in residential natural gas boilers than by district heat generators (see Chapter 5).
Residential heating is dominated by individual natural gas boilers. According to the SSC, 20% of all dwellings were connected to a centrally driven heating system in 2019 and 2% had hot water delivered through a district heating system. Oil and bioenergy (firewood) together accounted for less than 1% of residential TFC: firewood use decreased 83% from 2008 to 2019 and oil by 90% mainly owing to the government’s policy to expand natural gas use. Thus, almost four-fifths of dwellings were individually heated in 2018, mostly by natural gas boilers but in some cases by electricity.
1.0
2.0
3.0
4.0
5.0toe/capita
IEA 2021. All rights reserved.
IEA
. All
right
s re
serv
ed.

7. ENERGY EFFICIENCY
114
Figure 7.4 TFC in the residential sector by source, 2008-2019
Natural gas is Azerbaijan’s main energy source, as it is inexpensive and almost the entire population has access to the grid.
Source: IEA (2021), World Energy Balances 2021 (database), www.iea.org/statistics.
Although residential sector TFC increased only slightly from 2010 to 2018, by 6.3% (196 kilotonnes of oil equivalent [ktoe]), the decomposition of energy consumption reveals that without energy efficiency improvements, it would have been 5.1% (169 ktoe) higher in 2018. From 2010 to 2018, changes in the sector’s structure raised its TFC by 65 ktoe, and increased activity (i.e. floor area expansion) boosted it another 299 ktoe (IEA, 2020c).
Transport Transport accounts for most of the increase in Azerbaijan’s TFC since 2000 (see Figure 7.2). In 2019, it was the second-largest consuming sector (26% of TFC) at 2.8 Mtoe, up 70% from 2008 (Figure 7.5). The sector consumes oil for almost all its energy needs (99% in 2019). Electricity made up around 1% of consumption in 2019 (down 31% from 2008), while natural gas use remains marginal.
Vehicle ownership and transport volumes have expanded quickly in the past decade. From 2005 to 2018, the total number of registered vehicles in Azerbaijan more than doubled from 612 000 to 1 371 000 (an increase of 124%) (SSC, 2019a). Also during this period, the number of passenger cars increased from 479 000 to 1 171 000 (+144%), while passenger cars ownership per thousand inhabitants rose from 56 to 119. The number of buses increased by only 4 000, or 15%. In recent years (2015-2018) growth has been slow, with the total number of vehicles rising by 3.6%.
Azerbaijan’s vehicle fleet is rather old: in 2018, only 6% of all motor vehicles in the country were less than five years old, while 77% were more than 10 years old, up from 50% in 2010. Lorries and buses were older than the average, implying low fuel efficiency, a greater impact on the environment and high operational and maintenance costs compared with new vehicles. Around 40% of passenger cars imported into Azerbaijan over the last decade were second-hand.
The total volume of public transport roughly doubled (+113%) during 2005-2018, and all forms of travel (excluding railways) expanded. Since 2015, however, the increase has been only 6%. In 2018, 88% of passenger transport was by road (23.8 billion passenger-km, up from 10.9 billion pkm in 2005), compared with only 1.6% by rail (0.5 billion pkm,
0.5
1.0
1.5
2.0
2.5
3.0
3.5
4.0
2008 2009 2010 2011 2012 2013 2014 2015 2016 2017 2018 2019
Mtoe
Bioenergy
Oil
District heat
Electricity
Natural gas
IEA 2021. All rights reserved.
IEA
. All
right
s re
serv
ed.

7. ENERGY EFFICIENCY
115
ENER
GY
SYST
EM T
RAN
SFO
RM
ATIO
N down from 0.9 billion pkm in 2005). The Baku metro carried 8.9% of all passenger volume
(SSC, 2019a).
The picture is similar for freight transport. In 2005, 44% of the country’s inland freight volumes were transported by road, but by 2018 it had risen to 79% (equalling 16.9 billion tonne-kilometres [tkm]), while rail’s share dropped from 56% to 21% (to 4.5 billion tkm).
Figure 7.5 TFC in transport by source, 2008-2018
Azerbaijan’s TFC for transport is centred on oil and has grown more rapidly than for any other sector.
* Not visible at this scale. Note: Excludes international aviation and navigation. Source: IEA (2021), World Energy Balances 2021 (database), www.iea.org/statistics.
Industry In 2019, industry consumed 2.8 Mtoe, or 26% of TFC, virtually equal to transport consumption (Figure 7.6). Its TFC dropped notably in the aftermath of the 2008 economic crisis, bottoming out in 2010 and then rising to surpass the pre-crisis level in 2016. Overall, TFC grew only 4% from 2008 to 2018 but jumped almost 30% from 2018 to 2019.
Figure 7.6 TFC in industry by source, 2008-2019
TFC in Azerbaijan’s industry sector has exceeded the 2008 level, driven by oil use.
* Negligible. Note: Includes non-energy consumption. Source: IEA (2021), World Energy Balances 2021 (database), www.iea.org/statistics.
0.5
1.0
1.5
2.0
2.5
3.0
2008 2009 2010 2011 2012 2013 2014 2015 2016 2017 2018 2019
Mtoe
Natural gas*
Electricity*
Oil
IEA 2021. All rights reserved.
0.5
1.0
1.5
2.0
2.5
3.0
2008 2009 2010 2011 2012 2013 2014 2015 2016 2017 2018 2019
Mtoe
Bioenergy and waste*
District heat
Electricity
Natural gas
Oil
IEA 2021. All rights reserved.
IEA
. All
right
s re
serv
ed.

7. ENERGY EFFICIENCY
116
In recent years, oil consumption increased from 42% in 2015 to 50% of the total in 2019, at the cost of natural gas, which fell from 45% in 2015 to 31% in 2019. District heat consumption started in 2018 and accounted for 6% of industry consumption in 2019. These consumption patterns mainly reflect developments in the country’s petrochemical and cement sectors (SSC, 2019b). The petrochemical sector is expected to expand in upcoming years as the government takes steps to diversify the economy away from oil and gas production.
By subsector, the chemical and petrochemical industry is the largest energy consumer, at 40% of the total in 2019 (Figure 7.7). The other large energy users are food processing and non-metallic minerals (mainly cement production).
Figure 7.7 TFC by manufacturing industry subsector, 2019
TFC in Azerbaijan’s manufacturing industry is spread across several major subsectors.
* Includes machinery, textiles and leather, paper, pulp and printing, wood and wood products, transport equipment and unspecified industrial consumption. Note: Excludes mining and quarrying and construction. Source: IEA (2021), World Energy Balances 2021 (database), www.iea.org/statistics.
Total energy consumption in manufacturing increased by 229 ktoe (37.7%) during 2010-2018. The decline in energy intensity reduced consumption by 270 ktoe, but changes in manufacturing structure increased it by 185 ktoe and greater manufacturing activity boosted it 315 ktoe (Figure 7.8).
The most significant energy efficiency improvement was in the chemical subsector (151 ktoe), followed by the food industry (73 ktoe) and iron and steel (64 ktoe). At the same time, higher energy intensity increased energy consumption in the machine-building sector by 28 ktoe.
40%
22%
21%
6%4%
7%Chemical and petrochemical
Food and tobacco
Non-metallic minerals
Non-ferrous metals
Iron and steel
Other*
IEA 2021. All rights reserved.
IEA
. All
right
s re
serv
ed.

7. ENERGY EFFICIENCY
117
ENER
GY
SYST
EM T
RAN
SFO
RM
ATIO
N Figure 7.8 Decomposition of energy consumption in manufacturing, 2010-2018
Azerbaijan’s industrial energy efficiency improved the most in the chemical and food industries and in iron and steel production.
Source: IEA (2020b), Energy Efficiency Indicators, www.iea.org/reports/energy-efficiency-indicators-2020.
Services and agriculture
Energy consumption in services and agriculture, forestry and fishing totalled 1.7 Mtoe in 2019, or 16% of the country’s TFC (Figure 7.9).
Figure 7.9 TFC in the primary sector and services by source, 2008-2019
Electricity consumption drives growing energy demand in Azerbaijan’s commercial sector.
Note: Includes commercial and public services, agriculture, forestry and fishing. Source: IEA (2021), World Energy Balances 2021 (database), www.iea.org/statistics.
From 2008 to 2019, TFC in services (both public and commercial) increased by 720 ktoe, or 158%, reflecting the country’s overall economic development. In recent years, most of the energy consumed has come from electricity (2013-2018 average 66%), but in 2019 natural gas and electricity were on par. The decomposition of the change in TFC (+224 ktoe) reveals that energy intensity accounted for 34 ktoe of the total change, and activity increase for 190 ktoe.
In agriculture, forestry and fishing, TFC grew 64% from 2008 to 509 ktoe in 2019, reflecting increased mechanisation of the sector. Agriculture depends on oil for most of its energy needs (63%), but also uses electricity (19%) and natural gas (17%). The decomposition of the change in TFC in the sector shows that without energy efficiency improvements, it
- 200- 150- 100- 50
50 100 150 200
Food andtobacco
Chemical andpetrochemical
Non-metallicminerals
Ferrous metals Machinery Other
ktoe
Activity Effect
Structure Effect
Intensity Effect
IEA 2021. All rights reserved.
0.2 0.4 0.6 0.8 1.0 1.2 1.4 1.6 1.8
2008 2009 2010 2011 2012 2013 2014 2015 2016 2017 2018 2019
Mtoe
Bioenergy
District heat
Natural gas
Oil
Electricity
IEA 2021. All rights reserved.
IEA
. All
right
s re
serv
ed.

7. ENERGY EFFICIENCY
118
would have been 42 ktoe (or 8.5%) higher in 2018. Increased activity during 2008-2019 raised TFC by 128 ktoe (IEA, 2020c).1
Policies and measures Azerbaijan has yet to adopt specific legislation, strategies, action plans and targets for energy efficiency. Many obstacles hinder energy efficiency improvements (see Box 7.1), and government institutions for implementing energy efficiency policy also remain to be developed. Nevertheless, the situation is expected to improve soon: the government recently developed a draft energy efficiency law that is awaiting adoption and is also preparing a national energy efficiency action plan (see below).
Existing energy legislation refers to energy efficiency in rather general terms. In the 1996 Law on the Use of Energy Resources, it is included among the guiding principles for governing the use of energy resources. The 1998 Law on Energy, in turn, lists the conservation of energy resources and the efficient use of energy among the principal energy market policies. In practice, energy efficiency has not been a particular area of focus for the government, and legislation passed to date has had very limited impact, partly because end-use energy prices have been kept very low and because minimum energy performance standards (MEPS) have not been introduced. Efficiency measures implemented in recent years have been financed primarily by foreign donors, including the European Union and the European Bank for Reconstruction and Development (EBRD).
In 2012, the government set a target to improve energy efficiency 20% by 2020, but this goal was not supported by a strategy or legal framework. The 2016 Strategic Road Map for the Development of Utilities was more specific and has produced results. It outlined the need for greater efficiency in the gas, electricity and district heat sectors and aimed specifically to reduce electricity distribution losses in Baku from 8.5% to 7% by 2020, and in the other regions from 12% to 8%. It also aspired to reduce gas distribution losses from 18.6% to 8% by 2020, and these efforts to reduce losses have been quite successful (see Chapters 3 and 4).
A draft Law on the Efficient Use of Energy Resources and Energy Efficiency is in the process of adoption. The draft law was prepared by the Energy Charter Secretariat and the Ministry of Energy (MoE) as part of the EU-funded EU4Energy programme and it is based on EU and other international best practice. It passed the inter-ministerial consultation process in 2018 and was submitted to the Administration of the President in May 2019.
Once adopted, the law will define the legal, organisational and economic basis for energy efficiency policies and measures. The draft law covers the entire energy chain: exploration and production, transportation, distribution, supply and final use. It also includes a requirement to develop a five-year national energy efficiency action plan (NEEAP). The MoE started developing the NEEAP with the support of the EU4Energy programme in May 2019.
1 The structure effect is not assessed for agriculture and services due to the absence of disaggregated indicators within the sector.
IEA
. All
right
s re
serv
ed.

7. ENERGY EFFICIENCY
119
ENER
GY
SYST
EM T
RAN
SFO
RM
ATIO
N On final use, the draft law’s areas of action are:
Buildings: minimum energy performance requirements (MEPRs) for new and renovated buildings; an energy performance certification system; compulsory energy audits and energy managers for non-residential buildings larger than 10 000 m2.
Energy-related products: energy labelling and ecodesign (energy performance) requirements.
Industry: energy audits; energy management systems (EMSs) and energy managers; the promotion and development of energy services and an energy efficiency obligation scheme.
Box 7.1 Key barriers to energy efficiency in Azerbaijan
In its 2020 In-Depth Review of the Energy Efficiency Policy of the Republic of Azerbaijan, the Energy Charter Secretariat identified several barriers to improving energy efficiency in the country (ECS, 2020):
The country has no legislative framework or targets for energy efficiency.
Before 2016, political willingness to implement energy efficiency reforms was lacking.
Azerbaijan’s energy tariff policy is not sustainable and does not create incentives to implement energy efficiency measures and broader strategic targets, such as increasing energy exports.
Non-cost-reflective energy tariffs and the lack of a long-term energy tariff policy cause consumers to be resistant to tariff increases.
The MoE’s Energy Efficiency and Ecology Department lacks sufficient human resources to introduce energy efficiency policies.
General awareness and knowledge about the multiple benefits of energy efficiency are low.
Removing barriers such as these have helped governments in other countries save energy and money, reduce harmful emissions and create jobs.
Source: ECS (2020), In-Depth Review of the Energy Efficiency Policy of the Republic of Azerbaijan.
Buildings Specific policies and measures to save energy in buildings have yet to be adopted. For example, there are no MEPRs for buildings or building components. Although several energy audit training programmes have been carried out in recent years, energy audits are still not required. Expertise in the sector is scarce, and awareness of the benefits of energy efficiency refurbishments and of renewable energy technologies (e.g. solar thermal installations for hot water production) remains low, hindering action. Financing programmes to construct energy-efficient buildings do not exist, partly because low subsidised energy prices lengthen the payback period, reducing their attractiveness. Low subsidised energy prices are also part of the reason that construction companies have notactively considered energy efficiency measures, and why consumers are not seeking energy-efficient appliances. Fortunately, the pending energy efficiency law is expected to fill many of these gaps.
IEA
. All
right
s re
serv
ed.

7. ENERGY EFFICIENCY
120
Comprehensive data on the energy efficiency potential of the building stock are not available, but two studies from the 2010s indicate that savings of around 50% are feasible. The INOGATE ESIB project,2 which undertook an energy audit of a common Soviet-era nine-floor residential building in Baku, observed a specific energy demand of 210 kilowatt hours per square metre (kWh/m2) per year for space heating and estimated that around half of that energy could be saved. Similarly, the NAMA project3 to retrofit six State Oil Company of the Azerbaijan Republic (SOCAR) buildings indicated a technical energy-saving potential of 58% (ECS, 2020).
Transport Although Azerbaijan does not have specific measures to increase energy efficiency in transport, excise taxes on passenger cars and buses favour small engines (Table 7.1). However, incentives to purchase vehicles with an engine capacity of less than 2 000 cubic centimetres (cm3) are not particularly strong,4 while excise taxes do not consider the age of the vehicle or its emissions of air pollutants or CO2.
Transport costs are high in Azerbaijan, and limited domestic connectivity outside of Baku continues to constrain rural residents’ economic prospects. Azerbaijan’s road and rail networks need to be modernised, and more money needs to be spent on maintenance so that the country can take better advantage of its position on the Caspian Sea and its proximity to major markets such as Iran, the Russian Federation and Turkey (OECD, 2019). Road investments dominate government spending on transport infrastructure, while inland waterway transport infrastructure remains of significant but secondary importance. Only 0.2% of inland infrastructure spending benefits the country’s rail network (ITF, 2019).
Excise tax rates for passenger vehicles, 2019
Engine capacity (cm3) Tax rate
Up to 2 000 AZN 0.30 for each cm3
Up to 3 000 AZN 600 + AZN 5 for each cm3 between 2 001 and 3 000 cm3
Up to 4 000 AZN 5 600 + AZN 13 for each cm3 between 3 001 and 4 000 cm3
Up to 5 000 AZN 18 600 + AZN 35 for each cm3 between 4 001 and 5 000 cm3
More than 5 000 AZN 53 600 + AZN 70 for each cm3 above 5 000 cm3
Source: ECS (2020), In-Depth Review of the Energy Efficiency Policy of the Republic of Azerbaijan.
2 The Energy Saving Initiative in the Building Sector in the Eastern European and Central Asian Countries (ESIB), funded by the European Commission and implemented from 2010 to 2014. 3 Nationally Appropriate Mitigation Actions (NAMAs) for low-carbon end-use sectors in Azerbaijan (2015–2019), funded by the Global Environment Facility (GEF), UNDP and SOCAR. 4 For example, the excise tax for a passenger car of 1 600 cm3 of engine capacity is AZN 480 (USD 282), but for engine capacity of 2 500 cm3 it is AZN 3 100 (USD 1 824).
IEA
. All
right
s re
serv
ed.
Table 7.1

7. ENERGY EFFICIENCY
121
ENER
GY
SYST
EM T
RAN
SFO
RM
ATIO
N Azerbaijan has stressed the importance of measures to promote environmentally friendly
forms of transport. Steps include introducing electric vehicles for public transportation, electrifying railway lines, improving transport management systems and metro transport (e.g. increasing the number of metro stations), eliminating traffic congestion by constructing road junctions, and constructing underground and surface pedestrian crossings (OECD, 2016).
In recent years, public transport availability has been improved by Baku metro and railway network expansions, and 300 compressed natural gas (CNG) buses were also added to the Baku bus fleet. Repair and electrification of the national railway network have been carried out, and locomotives and rolling stock have been modernised. Efforts to increase economic efficiency have also improved the environmental performance of Azerbaijan’s railways. At the same time, however, railway use has declined in absolute terms (SSC, 2019a).
According to the World Economic Forum, Azerbaijan ranks 27th of 141 countries in the category of "quality of road infrastructure", 34th in the category of "railway density" and 11th in "efficiency of train services".
Industry There are currently no estimates of energy efficiency potential, and no targets or incentives to reduce energy consumption in industry. At the same time, low energy tariffs continue to undermine the economic attractiveness of energy efficiency measures.
However, the government is drafting a national action plan on energy efficiency. The draft suggests setting up a database on energy efficiency measures that would delineate their potential and benefits, arranged according to industry subsector. It also includes the introduction of energy audits, applied energy management systems, and a system for periodically reporting the results of efficiency measures.
In the energy industry, several state programmes to install meters have been enacted to reduce electricity and gas distribution losses, to increase power plant efficiency and to prevent the theft and inefficient use of electricity. They have focused primarily on improving utilities’ financial viability.
Appliances MEPS and energy labelling have proven highly effective policy tools to improve the efficiency of new appliances, and although they are now used in over 80 countries, Azerbaijan has yet to introduce them. The country needs to adopt standards for devices and products (required for energy labelling) and establish a certification mechanism. It also requires more specialists in this field.
The most recent study on Azerbaijan’s energy-saving potential, carried out in 2015 by the Center for Energy Efficiency (CENEF) and the Copenhagen Centre on Energy Efficiency (C2E2), looked at replacing household appliances and lighting with the most efficient options. It concluded that these replacements could reduce household energy consumption by 7%. However, Azerbaijan’s relatively low energy prices weaken the incentive to replace appliances.
According to SSC statistics on the penetration of household appliances, the country is likely to experience particularly rapid growth in dishwashers (available in 7% of households
IEA
. All
right
s re
serv
ed.

7. ENERGY EFFICIENCY
122
in 2017) and air conditioners (45% in 2017). Dishwashers reduce hot water needs (and therefore energy consumption) compared with hand washing, while air conditioners can significantly raise peak electricity demand in the summer.
An example of successful technology deployment to increase energy efficiency is the widespread installation of meters for electricity and gas consumption in recent years. They have helped reduce losses and promote more rational energy use.
Assessment Like other countries that have legacy infrastructure and subsidised energy prices, there is great potential for Azerbaijan to use energy more efficiently. The IEA strongly encourages the government to view energy efficiency as a source of revenue, clean air and jobs, and to quickly adopt the laws, strategies, policies and measures needed to realise these possibilities.
Although Azerbaijan does not yet have specific energy efficiency legislation, the government has been committed to developing it in recent years. In 2016, the president approved the Strategic Roadmap for Development of Utilities Services (Electric Energy, Heating, Water and Gas) and the parliament ratified the Paris Agreement. Furthermore, the president is expected to submit the draft Law on the Efficient Use of Energy Resources and Energy Efficiency to the parliament soon, and the government is also developing the country’s NEEAP.
There is a strong argument for taking rapid action on energy efficiency, building on the draft legislation currently being considered and bearing in mind Azerbaijan’s Paris Agreement pledge to reduce GHG emissions 35% from 1990 to 2030. Experience in IEA member countries has demonstrated that MEPS are among the most effective and cost-efficient energy efficiency policy instruments. The government should therefore introduce stringent standards across all sectors (covering buildings, vehicles, appliances and equipment) and should implement an effective energy efficiency audit mechanism to ensure compliance. It should also regularly update the standards and, when applicable, accompany them with energy labelling.
In addition to regulating through stringent energy efficiency standards, the government could do more to encourage investment in energy-efficient equipment. This would require changes to the tariff regulation methodology.
Energy prices must be set at an optimal level to attract investment and to encourage citizens to use energy efficiently. However, Azerbaijan’s end-user energy prices, which are set by the government, are currently among the lowest in the region and do not reflect the full cost of supply (see Chapters 3 and 4). In 2018, the country’s energy price subsidies were three times higher than in 2010, totalling USD 2.6 billion or 5.8% of GDP, according to IEA estimates. Such subsidised tariffs do not encourage residential and industrial consumers to improve their energy efficiency (IEA, 2019b), even though doing so would benefit the whole country economically. The oil and gas saved thanks to energy efficiency measures could be exported for revenue, or simply used more efficiently elsewhere for the good of the national economy.
Instead of subsidising energy for everyone, the government should gradually switch to supporting more efficient energy use. For example, it could launch programmes to replace
IEA
. All
right
s re
serv
ed.

7. ENERGY EFFICIENCY
123
ENER
GY
SYST
EM T
RAN
SFO
RM
ATIO
N the highest-consuming household appliances (refrigerators, washing machines, etc.) with
highly energy-efficient new models. Because low energy prices are perceived a form of social aid in Azerbaijan, subsidy programmes could target only those in real need.
A strong statistical data collection system is essential to monitor, evaluate and enforce energy efficiency policies and measures. The government should ensure the availability of robust and meaningful disaggregated energy efficiency indicators by sector. It should also use the data to assess the energy efficiency potential of the buildings, transport and industry sectors.
Another area that merits considerable attention is energy efficiency capacity-building and training, which should be co-ordinated both nationally and regionally. Dedicated educational programmes should also be launched at both levels.
Buildings and appliances The residential and commercial sectors account for around half of Azerbaijan’s TFC. They have significant energy efficiency potential, as the energy performance of the existing building stock is low and there are no MEPRs for new buildings and appliances. Disaggregated data for a more detailed analysis are needed.
The economic benefits of retrofits are likely to be highest when projects focus on the least efficient buildings and include both building envelope improvements and heating equipment installation. Raising building efficiency, through retrofits and efficient construction that encourage electrification and the installation of smart energy management systems, helps improve energy system security and resilience by reducing energy use (IEA, 2020a).
In line with the Energy Charter Secretariat’s work to identify the main barriers to energy efficiency in Azerbaijan’s buildings, the IEA encourages the government to:
Introduce specific targets and MEPRs for energy efficiency in new and existing public and residential buildings.
Review and update standards for the thermal protection of buildings.
Increase awareness of the benefits of energy-efficient buildings among decision makers, businesses and the general population.
Introduce financial incentives or state support to improve energy efficiency in buildings.
Increase awareness of no-cost or low-cost energy efficiency measures in public and residential buildings.
Introduce incentives for local municipalities and owners of buildings to reduce energy consumption.
Energy codes and standards will be essential to improve the energy performance and comfort of Azerbaijan’s buildings. As the long-term benefits for consumers in terms of energy-cost savings and health benefits are clear, there is a strong argument for introducing financing mechanisms for efficient housing. The government also needs to
IEA
. All
right
s re
serv
ed.

7. ENERGY EFFICIENCY
124
introduce energy efficiency standards for non-residential buildings and dedicated energy efficiency programmes for commercial ones.
The government should also ensure that residential buildings will comply with future energy efficiency regulations. It should consider the approach used in many IEA countries, where compliance is verified by public sector building inspectors.
Azerbaijan does not have MEPRs, energy labelling or financial incentives for energy-efficient appliances. The government should therefore introduce them, starting with products that are less technically complex and that may offer the highest energy savings for residential consumers, such as heaters, air conditioners, dishwashers, washing machines and televisions, in addition to lightbulbs. MEPRs should also be applied to appliances used in industry and the service sector.
As low electricity prices typically dampen consumer interest in higher-efficiency appliances, tariff reform is needed. Households and services are the foremost electricity consuming sectors. Measures to raise the efficiency of electricity use as well as the level of electricity security include modernising transmission and distribution systems, introducing MEPRs for appliances, deploying energy management systems for buildings, and auditing large buildings (government, residential and corporate).
Transport TFC in the transport sector, which has more than tripled since 2000, accounted for 26% of the country’s TFC in 2019. The number of vehicles has more than doubled since 2005, but ownership rates remain relatively low by international standards. In 2018, Azerbaijan had 119 passenger cars per 1 000 inhabitants, while the EU rate, for example, exceeded 500 per 1 000 inhabitants. Road transport energy consumption is expected to continue rising rapidly in the medium term, as the country’s road network is improved and people become wealthier. Policy decisions are therefore critical to ensure that the transport sector’s developmental pathway prioritises sustainability and efficiency.
Practically all vehicles in Azerbaijan are imported. Around two-fifths are second-hand, and as the number of these imports has been rising in recent years, older vehicles with lower energy performance are having a significant impact on the sector’s energy consumption. To improve energy efficiency and limit air pollution, the government should set minimum energy efficiency requirements for all vehicles imported and sold, including second-hand ones.
Measures to raise Azerbaijan’s fuel prices and taxes – which are among the lowest in the world – are critical to improve energy efficiency and limit pollution and CO2 emissions from transport. This could be done in a revenue-neutral manner. A scrappage system could also be considered for old light- and heavy-duty vehicles and buses, as they tend to pollute more. Projects to scrap old vehicles have been carried out in recent years, and Azerbaijan does offer incentives under certain conditions for the purchase of vehicles that use low-carbon fuels, but specific subsidies for direct vehicle purchases appear to be an expensive policy measure.
More ambitious policy attention should be given to railway use, as increased rail transport could yield multiple benefits. A positive development is the commissioning of a new railway line connecting Baku to Ganja in 2018, and policies and programmes promoting further
IEA
. All
right
s re
serv
ed.

7. ENERGY EFFICIENCY
125
ENER
GY
SYST
EM T
RAN
SFO
RM
ATIO
N intercity rail travel should be considered. A long-term regional vision could include building
a network of high-speed rail, as it is at least 12 times more energy-efficient on average than air or road travel per pkm (IEA, 2019a).
Clearly, replacing private vehicle use with public transport, walking or cycling improves air quality and reduces noise and congestion. Those who would particularly benefit from this transition are people living in cities with high pollution, such as the Greater Baku area, where almost half of Azerbaijan’s population lives and nearly half of all its vehicles are registered. Although public transport availability has improved in recent years with expansion of the Baku metro, it will be important to integrate public transport considerations into urban planning to create a more sustainable and efficient transport system as Azerbaijan’s population continues to urbanise.
Industry Industry accounted for 26% of Azerbaijan’s TFC in 2019. In absolute terms, industry sector TFC has fluctuated over the past two decades and is 40% higher than in 2008.
International practice shows that price signals are the most effective way to incentivise industry to implement energy efficiency measures, but Azerbaijan’s non-cost-reflective energy tariffs do not provide them. Its tariff design does not stimulate efficient use of the electricity system because electricity prices do not depend on voltage and capacity, and time-of-use pricing and peak pricing have not been instituted for all consumers (ECS, 2020). Tariff reform is therefore also essential for the industry sector.
As tariff reform would likely increase energy prices for industry, including small and medium-sized enterprises, the government could consider temporary measures to neutralise the impact of energy costs on competitiveness, where necessary. Investing in energy-efficient equipment could quickly generate financial savings that would allow industries to spend more on their core business operations. As the IEA explains in its 2020 Sustainable Recovery report, payback periods for investing in more energy-efficient industrial electric motors, heat pumps for low-temperature process heat and agricultural irrigation pumps are typically attractive. Governments can encourage energy efficiency investments by introducing mandatory state-level energy audits and by offering financial incentives (tax deductions, guaranteed lending, rebates, cash-for-replacement schemes) as well as specific incentives for energy management systems and the training and hiring of energy managers (IEA, 2020a). Azerbaijan’s government should consider including incentives such as these in its draft energy efficiency law.
IEA
. All
right
s re
serv
ed.

7. ENERGY EFFICIENCY
126
Recommendations The government of Azerbaijan should:
Adopt a national strategy and action plan to improve energy efficiency, ensuring all necessary support is provided through new legislation; then implement and enforce the plan, reviewing all monitoring and evaluation data regularly to assess progress, and adjust the plan as necessary to deliver the strategy objectives.
Ensure that robust and meaningful disaggregated energy efficiency indicators are available for the buildings, transport and industrial sectors to be able to monitor, evaluate and enforce policies and measures.
Assess the energy efficiency potential of the buildings, transport and industrial sectors by aggregating existing data and by international benchmarks.
Introduce and enforce minimum efficiency requirements, including for energy-using and energy-related products and new buildings.
Introduce measures to support renovation of the existing building stock, especially residential and public buildings.
Step up the development of public transportation networks and continue to incentivise the purchase of low-carbon vehicles.
Take action to raise both industry and general public awareness of the benefits of energy efficiency.
IEA
. All
right
s re
serv
ed.

7. ENERGY EFFICIENCY
127
ENER
GY
SYST
EM T
RAN
SFO
RM
ATIO
N References
ECS (Energy Charter Secretariat) (2020), In-Depth Review of the Energy Efficiency Policy of the Republic of Azerbaijan, ECS, Brussels.
IEA (International Energy Agency) (2021), World Energy Balances 2021 (database), www.iea.org/statistics.
IEA (2020a), Sustainable Recovery, www.iea.org/reports/sustainable-recovery.
IEA (2020b), Energy Efficiency Indicators, www.iea.org/reports/energy-efficiency-indicators-2020.
IEA (2019a), The Future of Rail, www.iea.org/reports/the-future-of-rail.
IEA (2019b), World Energy Outlook 2019, https://www.iea.org/reports/world-energy-outlook-2019.
IEA (2018), World Energy Outlook 2018, https://www.iea.org/reports/world-energy-outlook-2018.
ITF (International Transport Forum) (2019), Transport performance indicators, ITF Transport Statistics (database), ITF, Paris, www.oecd-ilibrary.org/transport/data/itf-transport-statistics/transport-performance-indicators_2122fa17-en.
OECD (Organisation for Economic Co-operation and Development) (2019), Investment in sustainable infrastructure in Azerbaijan, in Sustainable Infrastructure for Low-Carbon Development in Central Asia and the Caucasus: Hotspot Analysis and Needs Assessment, Green Finance and Investment, OECD Publishing, Paris.
OECD (2016), Financing climate action in Azerbaijan, OECD Publishing, Paris.
SSC (State Statistical Committee of Azerbaijan) (2019a), Environment in Azerbaijan 2019, SSC, Baku.
SSC (2019b), Industry of Azerbaijan, SSC, Baku.
IEA
. All
right
s re
serv
ed.

129
ENER
GY
SYST
EM T
RAN
SFO
RM
ATIO
N
8. Renewable energy
Key data (2019 provisional)
Total renewable energy supply: 0.23 Mtoe (1.4% of TES): hydropower 0.13 Mtoe (0.8% of TES), bioenergy 0.08 Mtoe (0.5%), wind 0.009 Mtoe (0.06%), solar 0.004 Mtoe (0.02%)
Total renewable electricity supply: 1.8 TWh (7.0% of electricity generation): hydropower 1.6 TWh (6.0% of electricity generation), wind 0.11 TWh (0.4%), waste 0.10 TWh (0.4%), solar 0.04 TWh (0.2%)
World renewable energy shares (2018): 13.5% of TES and 25.2% of electricity generation
Overview Azerbaijan has excellent renewable energy potential. In addition to being quite sunny and windy, the country also has considerable hydro, bioenergy and geothermal resources, but its energy policy has focused until recently on developing Azerbaijan’s significant oil and gas resources. This focus is changing, however: the government is now drafting legislation to promote renewable energy and is aiming for renewable energy to provide 30% of electricity generating capacity by 2030, roughly twice the current share. Major contracts to build wind and solar power capacity were signed in early 2020.
Supply The share of renewable energy sources (RES) in Azerbaijan’s total energy supply (TES) has been stable – but low – since the 1990s. The portion of RES in electricity generation was higher during 2008-2019, ranging from 7% to 18% of total generation. This strong variation reflects the country’s changing hydrological conditions and, in consequence, its hydropower output. The dominance of hydropower in RES leads to similarities in the patterns of RES in TES and RES in total final consumption (TFC) (Figure 8.1).
Hydropower accounted for 59% of total renewable energy supply in 2019, with the remainder coming mainly from municipal waste and bioenergy (Figure 8.2). With a combined installed capacity of 102 megawatts (MW) in 2019, wind power and solar PV shares remain small, but the government has indicated a strong desire to develop the sector. Statistics for heat pumps were available for the first time in 2018, showing a total installed capacity of 1.4 MW. Heat pumps are also in the early stages of utilisation in the country.
IEA
. All
right
s re
serv
ed.

8. RENEWABLE ENERGY
130
Figure 8.1 Renewable energy shares in Azerbaijan’s energy system, 1990-2019
Azerbaijan is in the early stages of realising its significant renewable energy potential.
* Includes direct use in TFC and indirect use through electricity and heat. Source: IEA (2021), World Energy Balances 2021 (database), www.iea.org/statistics.
Figure 8.2 Renewable energy in Azerbaijan’s TES, 2000-2019
Hydropower dominates Azerbaijan’s relatively low renewable energy supply.
* Not visible at this scale. ** Includes primary solid biofuels and renewable waste. Note: Mtoe = million tonnes of oil equivalent. Source: IEA (2021), World Energy Balances 2021 (database), www.iea.org/statistics.
Azerbaijan’s bioenergy supply totalled 0.12 Mtoe in 2019 and consisted of renewable municipal waste and primary solid biofuels (Figure 8.3). Municipal waste has been used since 2012 at the Baku solid waste incineration plant. The plant can incinerate 0.5 Mt of solid waste per year to generate around 200 gigawatt hours (GWh) of electricity annually. Solid biofuels are used mostly in the commercial and residential sectors for space heating and, in some cases, cooking.
Following a peak in hydropower generation, the supply of energy from renewables and waste has declined since 2010. In addition to being caused by hydropower fluctuations, this drop reflects the reduced use of wood for heating, a result of the government’s policy to expand the natural gas network and promote natural gas as a clean and modern heating option. At less than 2%, the share of RES in Azerbaijan’s TES was well below the world average in 2018 (Figure 8.4).
2%
4%
6%
8%
10%
12%
Total energy supply Electricity generation Total final energy consumption *
1990
2000
2008
2019
IEA 2021. All rights reserved.
1%
2%
3%
4%
0.10
0.20
0.30
0.40
2000 2002 2004 2006 2008 2010 2012 2014 2016 20182019
MtoeSolar*
Wind*
Bioenergy**
Hydro
Renewables share(right axis)
IEA 2021. All rights reserved.
IEA
. All
right
s re
serv
ed.

8. RENEWABLE ENERGY
131
ENER
GY
SYST
EM T
RAN
SFO
RM
ATIO
N Figure 8.3 Bioenergy supply by source and use by sector, 2019
The Baku waste incineration plant is the major user of municipal waste, from which it generates electricity.
Source: IEA (2021), World Energy Balances 2021 (database), www.iea.org/statistics.
Figure 8.4 Renewable energy share of TES in Azerbaijan and selected countries, 2018
Azerbaijan’s share of renewables is far below the world average because of the dominance of oil and gas in its TES.
* Includes solid biofuels, renewable waste, liquid biofuels and biogases. ** Includes hydropower (excluding pumped storage) and tidal, wave and ocean energy. Source: IEA (2021), World Energy Balances 2021 (database), www.iea.org/statistics.
Renewable electricity generation In 2019, Azerbaijan had a total installed renewable electricity capacity of 1 291 MW. Renewable energy accounted for 17% of the country’s total installed capacity and for 7% (1.81 terawatt hours [TWh]) of its electricity generation.
Azerbaijan’s renewable electricity comes primarily from hydropower (Figure 8.5). From 2008 to 2019, hydropower capacity increased by around 15% to 1 145 MW. The major change was the 2010-2017 refurbishment of the Mingachevir hydropower plant (HPP) and its capacity upgrade from 284 MW to 424 MW. Wind power capacity was 66 MW, of which 50 MW was added in 2018, and that of solar PV was 35 MW in 2018.
54%46%
Primary solidbiofuels
Renewablemunicipal waste
Total supply0.12 Mtoe
63%
22%
9%6% Energy
transformationServices
Residential
Industry
IEA 2021. All rights reserved.
0%
20%
40%
60%Bioenergy*
Solar
Geothermal
Wind
Hydro**
IEA 2020. All rights reserved.
IEA
. All
right
s re
serv
ed.

8. RENEWABLE ENERGY
132
Figure 8.5 Renewable energy in Azerbaijan’s electricity generation, 2000-2019
Although Azerbaijan’s solar and wind power shares remain insignificant compared with hydropower, they are set to expand considerably.
* Not visible at this scale. ** Includes renewable municipal waste. Not visible at this scale. Source: IEA (2020a), World Energy Balances 2020 (database), www.iea.org/statistics.
Azerbaijan’s share of renewables in electricity generation in 2019 (7%) was below the world average (25% in 2018) (Figure 8.6). Major new capacity additions (240 MW of wind power and 230 MW of solar PV) are set to come online around 2022, which are expected to increase both the total capacity and the share of renewable power generation.
Figure 8.6 Renewable energy in electricity generation in Azerbaijan and selected countries, 2018
The portion of renewables in Azerbaijan’s electricity generation is below the global average but is expected to increase quickly.
* Includes solid biofuels, renewable waste, liquid biofuels and biogases. ** Includes hydropower (excluding pumped storage) and tidal, wave and ocean energy. Source: IEA (2020a), World Energy Balances 2020 (database), www.iea.org/statistics.
Increasing the share of variable renewable energy (VRE) – namely solar and wind power – in electricity generation will have implications for power system operations. The IEA has identified six phases of VRE integration, each with its own challenges and responses (IEA, 2017) (Figure 8.7). With its minor solar and wind generation, Azerbaijan – like most other countries today – is in Phase 1, in which VRE integration should not pose any difficulties.
4%
8%
12%
16%
20%
1.0
2.0
3.0
4.0
5.0
2000 2002 2004 2006 2008 2010 2012 2014 2016 20182019
TWhSolar*
Wind*
Bioenergy**
Hydro
Renewables share(right axis)
IEA 2021. All rights reserved.
0%
20%
40%
60%
80%
100%Bioenergy*
Solar
Geothermal
Wind
Hydro**
IEA 2020. All rights reserved.IE
A. A
ll rig
hts
rese
rved
.

8. RENEWABLE ENERGY
133
ENER
GY
SYST
EM T
RAN
SFO
RM
ATIO
N Typically, challenges begin to emerge in Phase 3, when solar and wind power reach 10%
of total generation. Azerbaijan’s gas and hydropower plants are well suited to provide the system flexibility needed at higher levels of solar and wind power generation.
Figure 8.7 Phases of variable renewable energy integration and their key challenges
IEA. All rights reserved.
As new solar and wind capacity begin to move Azerbaijan towards Phase 2, its gas and hydro plants will provide the system flexibility needed.
Source: Adapted from IEA (2018b), World Energy Outlook 2018.
Renewable energy potential Although a comprehensive atlas of Azerbaijan’s renewable energy resources has not yet been published, several studies since the late 1990s have indicated significant untapped potential, mainly for solar and wind energy, but also for hydropower, biomass and geothermal resources.
Solar According to the Ministry of Energy (MoE), Azerbaijan’s technical solar power potential is around 23 000 MW. The country has 2 400 to 3 200 hours of sunshine per year and its annual solar intensity is estimated at 1 500 kilowatt hours per square metre (kWh/m2) to 2 000 kWh/m2; both values are high compared with other countries. The best resources are in the central river valleys and in the north and northwest of the country.
IEA
. All
right
s re
serv
ed.

8. RENEWABLE ENERGY
134
Figure 8.8 Solar energy potential in Azerbaijan
Source: World Bank (2020a), Global Solar Atlas: Azerbaijan, https://globalsolaratlas.info/download/azerbaijan. This map, adapted by the IEA, was obtained from the “Global Solar Atlas 2.0, a free, web-based application is developed and operated by the company Solargis s.r.o. on behalf of the World Bank Group, utilizing Solargis data, with funding provided by the Energy Sector Management Assistance Program (ESMAP). For additional information: https://globalsolaratlas.info. The Works are licensed under the Creative Commons 4.0 Attribution International license, CC BY 4.0.
Wind Azerbaijan has around 3 000 MW of technical and around 800 MW of economic wind power potential according to the MoE. Harnessing the economic potential could generate around 2.4 TWh per year, which would conserve around 500 million cubic metres (mcm) of natural gas and avoid 1 Mt of CO2 emissions. The best resources are along the Caspian Sea, particularly on the Absheron Peninsula, where wind speeds average around 6 m per second and are higher than that from January to April and from September to December (CIC, 2013; Kerimov, Ismailova and Rahmanov, 2013).
At the time of writing (October 2020), the MoE and the regulator, along with the International Financial Corporation, were preparing a roadmap for offshore wind in Azerbaijan. The goal is to identify potentially rich wind energy areas, their economic viability, network connectivity and possible onshore and offshore environmental impacts.
IEA
. All
right
s re
serv
ed.

8. RENEWABLE ENERGY
135
ENER
GY
SYST
EM T
RAN
SFO
RM
ATIO
N Figure 8.9 Wind energy potential in Azerbaijan
Source: World Bank (2020b), Global Wind Atlas: Azerbaijan, https://globalwindatlas.info/en/area/Azerbaijan?print=true. This map, adapted by the IEA, was obtained from the “Global Solar Atlas 2.0, a free, web-based application is developed and operated by the company Solargis s.r.o. on behalf of the World Bank Group, utilizing Solargis data, with funding provided by the Energy Sector Management Assistance Program (ESMAP). For additional information: https://globalsolaratlas.info. The Works are licensed under the Creative Commons 4.0 Attribution International license, CC BY 4.0.
Hydropower Hydropower is currently Azerbaijan’s primary source of renewable energy, but its potential has not been fully exploited. Modernising large hydropower installations would increase their capacity, and for small hydropower, numerous small mountain rivers in various regions of the country offer potential. According to the MoE, the technical potential for small hydro is 520 MW, which could generate up to 3.2 TWh annually. The MoE will prepare a strategy to develop small hydropower, based on water potential, water shortages and the country’s power generation needs (MoE, 2020). Water availability has recently received government attention at the highest level (Eurasianet, 2020).
Geothermal The former State Agency on Alternative and Renewable Energy Resources (SAARES) estimates Azerbaijan’s geothermal energy potential to be up to 800 MW. Initial studies indicate that Azerbaijan has 11 geothermal zones with water temperatures ranging from 30°C to 100°C (ANAS, 2004).
IEA
. All
right
s re
serv
ed.

8. RENEWABLE ENERGY
136
Biomass and waste With growth in agriculture, forestry, industry and services creating opportunities for heat and electricity generation from biomass and waste, the MoE estimates technical potential of 380 MW. For instance, the more than 2 Mt of solid domestic and industrial waste disposed of at waste treatment sites in Azerbaijan annually could be used to generate heat and/or electricity in Baku and other large industrial cities.
Institutions The MoE oversees renewable energy policy. Policy implementation was delegated to SAARES from 2009 to 2018, but the agency was abolished in 2018 and its functions transferred to the MoE. In September 2020, the President of Azerbaijan signed a decree establishing the State Agency for Renewable Energy Sources. The new agency will report to the MoE.
Policies and measures Azerbaijan’s energy supply relies on the country’s abundant oil and natural gas resources, and interest in using renewable energy has begun to increase only recently. The government recognises that using more renewable energy in power generation can help diversify the country’s energy sources as well as divert natural gas from power generation to potentially more profitable exports and use in petrochemicals, in addition to helping the country meet its Paris Agreement climate objectives.
Azerbaijan does not have a specific renewable energy strategy or action plan. In 2014, SAARES drafted a national strategy on the use of alternative and renewable energy sources for 2015-2020, but the document was not formally adopted (ECS, 2020). However, the 2016 Strategic Roadmap for the Development of Utilities (Electricity, Heating, Water and Gas) in the Republic of Azerbaijan included the addition of 420 MW of renewable electricity capacity by 2020: 350 MW of wind, 50 MW of solar and 20 MW of bioenergy.
The government is aiming for renewable energy to provide 30% of electricity generating capacity in the country by 2030, and in May 2020 the Cabinet of Ministers approved the Action Plan on Attracting Additional Investments in the Renewable Energy Sector (MoE, 2020). The role for renewable energy in heat supply is small, and no direct involvement in transport is envisaged.
Draft renewable electricity law As of October 2020, Azerbaijan did not have a regulatory framework for renewable energy, except for specific purchase tariffs for certain types of renewable electricity and tax exemptions for companies purchasing renewable energy equipment and generating renewable energy (see section below).
However, a law on renewable electricity is in the works. Following instructions from the Cabinet of Ministers in March 2018, the MoE has prepared a draft Law on Renewable Energy Sources in Electricity Generation. The draft was to be submitted to the President of the Republic of Azerbaijan by the end of May 2020.
IEA
. All
right
s re
serv
ed.

8. RENEWABLE ENERGY
137
ENER
GY
SYST
EM T
RAN
SFO
RM
ATIO
N The new regulatory framework outlined in the draft law includes competitive bidding
processes for renewable electricity projects as well as support mechanisms such as feed-in tariffs, and net-metering and net-billing schemes. Rules for these instruments have been drafted, as have templates for power purchase agreements (PPAs) and connection agreements (ECS, 2020).
Current incentives The government offers tax and tariff exemptions to promote renewable electricity generation and alternative energy production. Qualifying companies and entrepreneurs are exempt from customs duties and, for a period of seven years, value-added tax for technical equipment and facilities. They are also exempted from paying property tax, land tax and half their income tax (Aydin, 2019).
Azerbaijan’s electricity market is strongly regulated, and all electricity tariffs, including purchase tariffs for RES generators, are set by the Tariff Council. For small hydropower, the tariff is AZN 0.05 (USD 0.029) per kWh; for wind power it is AZN 0.055 (USD 0.032 US cents) per kWh; and for other renewable energy it is up to AZN 0.057 (USD 0.034) per kWh. Large hydropower is not eligible for a purchase tariff. For comparison, the wholesale electricity tariff in Azerbaijan has been AZN 0.057/kWh since 2016.
Permitting Renewable electricity facilities are granted permits in a four-step process. First, local authorities award a land use permit, then a construction permit is granted by the Ministry of Ecology and Natural Resources, the Ministry of Health and the Ministry of Emergency Situations. Third, electricity generation is permitted by the MoE,1 and fourth, a permit for network connection is granted by the network owner (the transmission system operator or the distribution system operator; see Chapter 4).
Current projects In a significant development for Azerbaijan’s renewable energy sector, in January 2020 the MoE signed implementing agreements for the country’s first two independent power projects, under which ACWA Power of Saudi Arabia will build, own and operate 240 MW of wind power, and Masdar of the United Arab Emirates will develop, build and operate 230 MW of solar PV capacity. The two companies were selected in a three-stage process from the seven companies that submitted proposals (ACWA, 2020; Masdar, 2020). The projects are backed by 20-year PPAs, the details of which have not been disclosed. The MoE and Azerenergy, the power offtaker, signed the main project agreements, including the PPAs, with ACWA Power in December 2020 and with Masdar in March 2021.
The MoE expects the USD 400 million projects to generate 1.4 TWh of renewable electricity per year, save more than 300 mcm of natural gas that would otherwise be used for power generation, reduce CO2 emissions by more than 0.6 Mt and create hundreds of jobs.
The wind power capacity is to consist of 40 turbines of 6 MW each, 17 of which (102 MW) will be built in Pirakashkul in the Absheron region and 23 (138 MW) in a mountainous area
1 The key document is the 24 November 2016 Resolution No. 482 of the Cabinet of Ministers of the Republic of Azerbaijan on the Establishment of Power Limits for the Production of Electricity and Commissioning of Electrical Installations.
IEA
. All
right
s re
serv
ed.

8. RENEWABLE ENERGY
138
in the Khizi region, and the 230 MW of solar power capacity will be built in the Garadagh and Absheron regions. Commercial operations are to begin in 2022 (MoE, 2020; Masdar, 2020). The Khizi region is already home to the 50-MW Yeni Yashma wind power park, which was commissioned in 2018.
The MoE is also preparing to construct roughly 1 000 MW of additional renewable electricity capacity through competitive bidding processes. It is currently defining and prioritising zones of high renewable energy potential, and it will then assess land ownership, existing infrastructure and environmental concerns (IRENA, 2019). With the help of the European Bank for Reconstruction and Development, the MoE is developing renewable energy auctions to attract more private investment to the sector.
To increase the share of renewable energy in the country's total electricity capacity to 30% by 2030, the MoE invited the German consulting company VPC to determine the optimal limit of new capacity to be connected to the electricity grid. According to its report, Azerbaijan needs to install 1 500 MW to reach the 30% target by 2030. VPC suggests doing this in three stages: 440 MW in 2020-2022, 460 MW in 2023-2025 and 600 MW in 2026-2030.
Addressing solar PV development specifically, the Asian Development Bank (ADB) is financing the design and construction of the country’s first floating solar PV (FPV) plant. The 100-kW pilot plant will be installed on Lake Boyukshor, close to Baku. While FPV installations require stricter standards than land-based PV because of their exposure to water, the advantages over land-based PV are that they are quick to install and land use is not an issue. They also allow higher energy yields because of the cooling effect of the water (ADB, 2018). Azerbaijan’s many reservoirs offer opportunities to synergise FPV technology with existing hydropower generation and related grid infrastructure.
Renewable energy for heat Natural gas is the default heating fuel in Azerbaijan, but continued reliance on it will not allow the country to decarbonise its heat use in the decades ahead. Furthermore, gas resources may be better used for exports or as a feedstock for petrochemical production. District heating, heat pumps and gas heat pumps are all alternatives to individual gas boilers, while renewable heat options include solar thermal heating, low-emission biomass boilers and geothermal energy with ground-source heat pumps. Solar thermal technologies can provide hot water at low operational cost, while geothermal ground-source heat pumps offer efficient and reliable solutions for the whole year, since underground temperatures are relatively stable. Geothermal heat pumps enable seasonal storage and offer high performance during cold spells (as a heat provider) or heat waves (as a cooling provider) (IEA, 2020a).
Azerbaijan’s main renewable energy projects for heating have been the installation of solar collectors at the SOS Children’s Village in Baku and solar panels at some educational and medical facilities.
Assessment Although Azerbaijan’s energy supply is strongly dominated by oil and natural gas, the country also has excellent renewable energy potential that – aside from large hydro –
IEA
. All
right
s re
serv
ed.

8. RENEWABLE ENERGY
139
ENER
GY
SYST
EM T
RAN
SFO
RM
ATIO
N remains largely untapped. Solar power’s estimated technical potential is 23 GW, wind
power’s is 3 GW, and small hydro, geothermal and bioenergy add another 1 GW.
Azerbaijan’s renewable energy potential promises multiple advantages for the country, the benefits of which can only become greater as technological innovation makes renewables more affordable. Wind and solar power generating costs have fallen significantly over the past decade, and in many countries they are now the lowest-cost forms of new generation (IEA, 2020b). Relying more on renewable energy would help Azerbaijan save natural gas for exports and for use in the petrochemical industry; reduce the country’s GHG emissions to meet its 2030 Paris Agreement commitment; and improve electricity security by diversifying generation.
As part of its planned energy market reforms, the government has drafted a renewable electricity law and aims for renewable energy to provide 30% of electricity generating capacity by 2030 – almost twice the 2018 share of 16%. The draft law would provide the legal basis to develop renewable energy projects in the country and would introduce competitive bidding processes and support mechanisms such as feed-in tariffs. Templates for PPAs and connection agreements have also been drafted.
The IEA applauds the government’s increased ambition to develop renewable energy and urges it to adopt the pending legislation without delay. This needs to be done in a co-ordinated manner, consistent with other pending energy reforms, particularly the country’s overall energy strategy and the Law on Electricity. Short-, medium- and long-term renewable energy targets are needed, as is an action plan that includes policies and measures to ensure the targets are met. Progress should be monitored and plans regularly updated.
International experience shows that renewable energy targets are most effective when it is clear why they are being adopted. Their level should reflect the economic potential of renewable energy, as well as the use of other policies and measures to meet energy policy goals. For example, it is often more affordable to meet policy goals by increasing energy efficiency than by building new generating capacity. Cost-effectiveness should be a key policy choice criterion.
Attracting investment Increasing the share of renewable electricity capacity to 30% of the total by 2030 means much more generating capacity will need to be built, which raises questions about the most effective way to do this and what kind of a regulatory regime is needed. Government plans include large hydropower, and although solar and wind power offer excellent potential, attracting investments in these technologies generally requires adequate remuneration, grid access, system integration, and the removal of non-economic barriers. In general, renewable energy should be developed as an integral part of the electricity market and should be factored into electricity market design at the outset (see Chapter 4).
Azerbaijan does not have a competitive electricity market to provide price signals for investors. At the same time, it has excess electricity generation capacity, and the price of the natural gas that fuels 90% of electricity generation is low because it is subsidised.2 As long as the state-owned monopoly generator (Azerenergy) receives subsidised gas for 2 In 2019, the natural gas export price averaged AZN 33 (USD 19) per megawatt hour (MWh), while the price of gas for domestic electricity generation was set at AZN 12 per MWh. The fixed annual wholesale electricity price was AZN 57 per MWh.
IEA
. All
right
s re
serv
ed.

8. RENEWABLE ENERGY
140
power generation and the wholesale power price is set by the government, private companies will find it difficult to compete and would not want to enter the sector without specific guarantees from the government. Plus, private companies may perceive a longer-term risk of gas exports decreasing in upcoming decades because of gradually stricter climate policies in importing countries, and of renewable energy facing strong cost competition from natural gas domestically as a result.
While the purpose of the pending electricity market reform is to introduce more competition and dynamism to the sector, the government could also make renewable energy more cost-competitive by phasing out fossil fuel subsidies and introducing carbon pricing or a revenue-neutral carbon tax. Fuel subsidy reform, which is dealt with more fully in other chapters, would offer numerous benefits. Together with carbon pricing, it would help the country meet its CO2 emissions reduction targets and save gas for exports and for petrochemical production. Fuel subsidy reform and carbon pricing or a revenue-neutral carbon tax offer a much better way forward than direct subsidies for renewable energy, which would be inefficient both for the energy sector and for the national economy.
Competitive bidding and long-term purchase agreements Finding the optimal level of remuneration for renewable electricity will be challenging as long as the country does not have a competitive electricity market. To overcome similar investment challenges, many countries have used auctions (centralised, competitive procurement of renewable energy capacity through a government or public body), and they have been instrumental in driving down prices, especially for solar PV and wind (IEA, 2018a). They are typically accompanied by long-term PPAs.
In fact, Azerbaijan has already begun to use auctions and PPAs to attract renewable energy investors. In December 2020, the MoE and Azerenergy signed a 20-year PPA for a 240-MW wind farm with Saudi Arabia’s ACWA Power and in March 2021 for a 230-MW solar power project with Abu Dhabi’s Masdar. These are very promising developments.
Although PPAs help facilitate project financing, as they reduce the perceived project risk, they should be used with care. As the World Bank finds in its study of power market reforms across the world since the 1990s, long-term contracts can distort power dispatch and build contractual rigidity into the power system, both of which significantly limit the scope for competition when a wholesale market is eventually introduced. On the other hand, while wholesale markets should provide price signals for dispatch and new capacity investments, they do not guarantee those investments. Two suggestions can be offered to balance these considerations: first, using supply auctions may well be worthwhile to ensure that investment takes place, especially as the auctions can be geared towards specific policy goals or technologies (Foster and Rana, 2020). Before the electricity market is fully functional, annually adjusted price caps could be introduced to limit the risk of collusion. Second, a mechanism should be designed to integrate PPAs into the future market.
It could make sense to expand renewable capacity in increments to allow time for rising electricity demand to counterbalance the current power generation capacity surplus, and for electricity market reforms to be implemented. This should in turn reduce the need for long-term PPAs that could otherwise lock in a large segment of renewable energy supply outside the competitive market, reducing efficiency and incentives for innovation in the sector.
IEA
. All
right
s re
serv
ed.

8. RENEWABLE ENERGY
141
ENER
GY
SYST
EM T
RAN
SFO
RM
ATIO
N Declining technology costs continue to improve Azerbaijan’s prospects to exploit its vast
solar and wind energy resources. Beyond onshore wind, the government should also study options to harness the country’s offshore wind potential. While the technology remains more expensive than for onshore wind or solar power, it offers access to high wind speeds and there are no land use competition or local opposition issues. Synergies could be created with the offshore oil and gas companies already operating in the country.
Grid integration and the need for more power system flexibility As VRE shares expand, new approaches to electricity market design and investments in grid infrastructure will be needed. Establishing a regulatory framework that facilitates the integration of renewables should be part of the electricity market reform: for example, clear rules are needed on how to organise power dispatch and how to allocate and govern grid connection costs. Auctions for solar and wind capacity should ideally incorporate system costs.
Increasing solar and wind power generation capacity considerably (to more than 10% of total generation) would require Azerbaijan’s power system to become more flexible to accommodate the natural daily and seasonal variations of these energy sources (see Figure 8.7). The country’s most obvious sources of flexibility are its combined-cycle gas turbine, gas engine and hydropower plants, and it could strengthen its electricity networks. Additional options include stronger cross-border connections, electricity trading, and storage ranging from minutes to hours and days (for example, pumped hydro and district heating systems with thermal storage; see Chapter 5). Financial incentives to put these measures in place and to establish demand-response capabilities should be considered as part of the electricity market reform. Emerging flexibility options include grid-scale batteries and hydrogen production, but reducing their cost continues to be a major challenge (IEA, 2020a; 2020b).
One intriguing option is the installation of FPV capacity on reservoirs connected to HPPs. Azerbaijan has several reservoirs suitable for this, the largest of which is the 605-km2 Mingachevir HPP reservoir. Although FPV is a nascent technology, coupling it with hydropower would offer several advantages. Transmission costs should be low, as FPV equipment could be linked to the HPP substation and no extra grids would need to be built. Also, solar and hydro generation could balance each other, as dry seasons offer the highest solar resources while rainy seasons offer the best hydro potential. A hybrid FPV-hydro plant could also use pumped hydro technology to store excess solar power.
Faster permitting Permitting renewable energy projects is often a complex and sometimes lengthy process. Ideally, the whole procedure – from site selection to gathering basic data for project evaluation and planning, to negotiating terms and conditions with the government – should involve close co-ordination of all relevant government agencies. Azerbaijan’s government should explore how to streamline the licensing process, and recognise that project implementation could be made more efficient through the use of tools such as requests for prequalification (RFPQs), requests for proposal (RFPs) and government support agreements (GSAs). Ideally, the entire permitting and licensing process would be managed through a single point of contact (i.e. a one-stop shop).
IEA
. All
right
s re
serv
ed.

8. RENEWABLE ENERGY
142
Local solutions for electricity and heat supply In Azerbaijan’s remote mountainous areas where it is expensive to build grid infrastructure, off-grid renewable energy systems could be a cost-effective way to provide electricity, particularly as their prices have declined in recent years. Pilot projects could be carried out, keeping in mind lessons learned from other countries. Renewable heat could also be provided in these areas, both directly (e.g. through clean bioenergy, geothermal or solar heat) and indirectly (through heat pumps).
The government should install off-grid renewable energy technologies through pilot programmes to ensure cost-effective energy access to all parts of the country. These pilots should incorporate the sustainable use of local renewable energy resources for heat.
The government could consider providing incentives for small renewable energy suppliers, to encourage entrepreneurship and the establishment of small businesses in the energy sector.
Recommendations The government of Azerbaijan should:
Evaluate the economic potential of renewable energy and use the assessment results to design an action plan to take advantage of that potential.
Set renewable energy targets that take account of the cost-effectiveness of all available policy options and of the need for consistency with electricity market reform measures.
Minimise the costs of additional renewable energy capacity through competitive bidding processes and by identifying ways to incorporate long-term PPAs into the competitive electricity market the government plans to introduce.
Take account of the need for renewable energy integration in plans to develop and and upgrade the grid.
Facilitate renewable energy capacity increases by streamlining authorisation and licensing processes as well as project implementation procedures, keeping in mind the case for establishing a single point of contact and for ensuring that grid connection rules do not discourage renewable electricity.
Develop and implement programmes to install solar collectors, batteries and other independent renewable energy technologies in remote parts of the country to ensure cost-effective access to energy in those areas.
Consider providing incentives for small renewable energy suppliers, to encourage entrepreneurship and the establishment of small businesses in the energy sector.
IEA
. All
right
s re
serv
ed.

8. RENEWABLE ENERGY
143
ENER
GY
SYST
EM T
RAN
SFO
RM
ATIO
N References
ACWA Power (2020), ACWA power expands its geographic footprint by entering the Azerbaijan market, www.acwapower.com/news/acwa-power-expands-its-geographic-footprint-by-entering-the-azerbaijan-market/.
ADB (Asian Development Bank) (2018), Floating solar energy development: Technical assistance report, www.adb.org/sites/default/files/project-documents/52079/52079-001-tar-en.pdf.
ANAS (Azerbaijan’s National Academy of Science) (2004), Alternative energy sources in the Republic of Azerbaijan, http://physics.gov.az/PowerEng/2004/v1article/art01.pdf.
Aydin, U. (2019), Energy insecurity and renewable energy sources: Prospects and challenges for Azerbaijan, ADBI working paper 992, ADB, Tokyo, www.adb.org/publications/energy-insecurity-renewable-energy-sources-challenges-azerbaijan.
Azernews (2020), Minister: Azerbaijan seeks to boost renewables by 30 pct by 2030, https://www.azernews.az/business/166074.html.
CIC (Caspian Information Centre) (2013), Azerbaijan: Alternative and renewable energy – a business perspective, http://dspace.bhos.edu.az/xmlui/bitstream/handle/123456789/1065/Azerbaijan-Alternative-and-Renewable-Energy.pdf?sequence=1.
ECS (Energy Charter Secretariat) (2020), In-Depth Review of the Energy Efficiency Policy of the Republic of Azerbaijan, ECS, Brussels.
Eurasianet (2020), Azerbaijan faces growing water shortage, https://eurasianet.org/azerbaijan-faces-growing-water-shortage.
Foster, V. and A. Rana (2020), Rethinking Power Sector Reform in the Developing World, Sustainable Infrastructure Series, World Bank, Washington, DC, doi:10.1596/978-1-4648-1442-6.
IEA (International Energy Agency) (2021), World Energy Balances 2021 (database), www.iea.org/statistics.
IEA (2020a), Energy Technology Perspectives 2020, www.iea.org/reports/energy-technology-perspectives-2020.
IEA (2020b), Projected Costs of Generating Electricity 2020, www.iea.org/reports/projected-costs-of-generating-electricity-2020.
IEA (2018a), 20 Renewable Energy Policy Recommendations, www.iea.org/reports/20-renewable-energy-policy-recommendations.
IEA (2018b), World Energy Outlook 2018, www.iea.org/reports/world-energy-outlook-2018.
IEA (2017), Status of Power System Transformation 2017, www.iea.org/reports/status-of-power-system-transformation-2017.
IRENA (International Renewable Energy Agency) (2019), Renewables Readiness Assessment: Republic of Azerbaijan, IRENA, Abu Dhabi, www.irena.org/-/media/Files/IRENA/Agency/Publication/2019/Dec/IRENA_RRA_Azerbaijan_2019.PDF.
IEA
. All
right
s re
serv
ed.

8. RENEWABLE ENERGY
144
Kerimov, R., Ismailova, Z. and N.R. Rahmanov (2013), Modeling of wind power producing in Caspian Sea conditions, International Journal on Technical and Physical Problems of Engineering, Vol. 5, No. 2, www.iotpe.com/IJTPE/IJTPE-2013/IJTPE-Issue15-Vol5-No2-Jun2013/20-IJTPE-Issue15-Vol5-No2-Jun2013-pp136-142.pdf.
Masdar (2020), Masdar signs agreement to develop landmark solar project in Azerbaijan, https://news.masdar.ae/en/news/2020/01/09/14/39/masdar-signs-agreement-to-develop-landmark-solar-project-in-azerbaijan.
MoE (Ministry of Energy) (2020), MoE website, http://minenergy.gov.az/en/xeberler-arxivi.
SSC (State Statistical Committee of Azerbaijan) (2019), Environment in Azerbaijan 2019, SSC, Baku.
World Bank (2020a), Global Solar Atlas: Azerbaijan, https://globalsolaratlas.info/download/azerbaijan.
World Bank (2020b), Global Wind Atlas: Azerbaijan, https://globalwindatlas.info/en/area/Azerbaijan?print=true.
IEA
. All
right
s re
serv
ed.

145
ENER
GY
SYST
EM T
RAN
SFO
RM
ATIO
N
9. Energy research, development and demonstration
Overview The Azerbaijan National Academy of Sciences (ANAS) co‑ordinates academic research, while the Ministry of Energy, the Ministry of Transport, Communications and High Technologies, the Azerbaijan State Oil and Industrial University and the State Oil Company of Azerbaijan Republic (SOCAR) carry out research and development (R&D) activities in their own institutes or by funding other organisations. Private businesses, international financial institutions (IFIs) and donors also contribute to R&D.
Nevertheless, Azerbaijan has significant potential to increase its R&D activities, including in the energy field, with the support of long-term planning. Overall spending on R&D is low, and the country does not yet have a specific strategy or action plan for energy R&D.
Funding According to the Science Development Foundation, Azerbaijan’s total R&D spending over the past decade equates to around 0.2% of its GDP (SDF, 2020). This is around half what the lowest-spending Organisation for Economic Co‑ operation and Development (OECD) member country spends, and less than one-tenth of the OECD average (around 2.5% of GDP), but is similar to the R&D spending of many of Azerbaijan’s neighbours.
R&D is primarily publicly funded, 86% from public research institutions and 9% from higher education establishments, while private sector funding covers only 5%. More than 80% of total funding is allocated to basic research, and less than 20% to applied R&D. The level of competitive funding (project-based and grants) remains negligible (WB, 2018). Around 65% of total funding has been allocated to the natural and technical sciences in recent years, but detailed information about energy R&D spending is not available.
Energy research institutions Azerbaijan has a number of research and higher education institutions that carry out energy technology R&D. They have participated in national and international programmes and projects, enabling Azerbaijani scientists and researchers to contribute to the development of these projects while acquiring new skills and knowledge.
IEA
. All
right
s re
serv
ed.

9. ENERGY RESEARCH, DEVELOPMENT AND DEMONSTRATION
146
The main institutions are:
the Azerbaijan Technical University the Baku Engineering University the Azerbaijan State Oil and Industry University ANAS’s Institute of Physics and Institute of Petrochemical Processes the Azerbaijan Scientific-Research and Design-Prospecting Power Engineering Institute,
Ltd SOCAR’s Oil and Gas Research and Design Institute the Azerbaijan State University of Architecture and Construction the Baku Higher Oil School.
Developing relevant skills and know-how, for example through better schooling and greater participation in higher education programmes, is necessary to carry out R&D activities. Such knowledge and capabilities are also critical for Azerbaijan to develop its economy more generally. Although steps are being taken to make improvements, the Asian Development Bank (ADB) has suggested that more resources and a more effective institutional setup and cohesive policy framework are needed to further develop the country’s infrastructure and human capital (ADB, 2019).
The 2019‑2023 State Programme on Increasing the International Competitiveness of the Higher Education System promotes dual-degree programmes with highly rated universities in other countries. For example, the Baku Higher Oil School, in conjunction with the Geneva Business School, is introducing a dual-diploma MBA in Oil and Gas Management.
Energy technology innovation According to the Word Bank, Azerbaijan’s public sector R&D institutions, which focus primarily on basic research, have relatively weak links with the private sector and, consequently, there is scope to improve the country’s commercialisation and general innovation performance (patents, etc.) (WB, 2018). The ADB has also argued that private sector participation in R&D should be increased. To this end, in January 2019 the president issued an order on Ensuring Co‑ ordination in the Field of Innovative Development in the Republic of Azerbaijan. Efforts to stimulate innovation include the establishment of technology parks, which are typically offered tax, land acquisition and customs benefits. The High Tech Research Center under the Ministry of Transport, Communications and High Technologies was established in 2008 to import advanced technologies to Azerbaijan and develop science-based industries in the country. The Center has developed prototypes of light-emitting diodes (LEDs) and a small-scale LED production line, for example.
ANAS’s High Technologies Park (HTP) was created by a presidential decree of 8 November 2016. The HTP aims to establish application mechanisms for industry-driven projects, provide technological innovation for mass production, and facilitate practical work in the field of science and technology. Petrochemicals is one of the HTP’s focus areas.
Baku Engineering University started a technology park in 2013 to support student innovation. The park organises competitions and provides funding to help students
IEA
. All
right
s re
serv
ed.

9. ENERGY RESEARCH, DEVELOPMENT AND DEMONSTRATION
147
ENER
GY
SYST
EM T
RAN
SFO
RM
ATIO
N develop innovative ideas, and BP sponsors high-spec labs in support of this work. The
university is launching a programme to prepare specialists in long-term energy planning.
SOCAR, the country’s largest company, conducts research, development and innovation (RDI) activities in its Oil and Gas Research and Design Institute. It provides AZN 5 million per year for research, together with the National Academy of Science; it also offers stipends for scientists. The Institute’s work covers a wide range of petroleum industry activities: geological and geophysical surveys of prospects and oil and gas fields; exploration, and the preparation of prospects for development; oil and gas field development; well drilling, completion and operation; petrochemical and petroleum processing engineering; petroleum industry economic and management studies; the preparation of short-term reservoir engineering strategies; environmental protection; and the processing, storage and transportation of petroleum products (SOCAR, 2020).
Assessment RDI activities are necessary to help Azerbaijan maintain and improve the competitiveness of its economy and diversify it away from oil and gas. The country has the means to increase its RDI potential and make better use of it, but stronger efforts and a long-term commitment are required.
Several of Azerbaijan’s research and education institutions have been important in setting the country on the path to further technological progress. They have participated in various national and international programmes and projects, enabling Azeri scientists and researchers to contribute to the work being done while acquiring new skills and knowledge.
At the same time, RDI governance in Azerbaijan remains fragmented, as do its systems. Policy and funding are not as well co‑ordinated as they could be and would benefit from streamlining. A welcome sign of improvement and interest is the January 2019 presidential order on Ensuring Co‑ordination in the Field of Innovative Development in the Republic of Azerbaijan.
Total R&D spending remains at 0.2% of GDP, which is low by international standards, so there is a strong case to be made for increasing spending and changing the country’s approach. R&D is primarily funded from Azerbaijan’s state budget, with the private sector providing only 5% of the total, whereas in developed economies the private sector covers the majority of R&D expenditures, followed by higher education institutions. Furthermore, the share of funding allocated to applied research in Azerbaijan is low (less than 20% of the total) and should be raised to develop the economy’s non-oil sectors; the level of competitive funding (project-based and grants) should also be increased. Active policies to promote co-operation among public research institutions, universities and the private sector will be required to enact the necessary revisions.
Regarding energy RDI specifically, the government should develop a strategy, policies and programmes. It should also encourage and facilitate wider participation in international RDI programmes and projects.
As Azerbaijan’s economy, as well as its energy research and technology base, is dominated by the oil and gas industry, there is a strong argument for diversification focused on energy efficiency and renewable energy. RDI in the field of energy efficiency and
IEA
. All
right
s re
serv
ed.

9. ENERGY RESEARCH, DEVELOPMENT AND DEMONSTRATION
148
renewable energy would benefit from framework legislation to create better conditions and provide incentives for small and medium-sized enterprises (SMEs).
Given their importance, the government should also place stronger emphasis on energy sector digitalisation and smart technologies, including smart grids, energy storage, digital technologies for power, district heating and cooling (DHC) and gas networks as well as new oil and gas sector technologies, notably carbon capture, utilisation and storage (CCUS).
For the oil and gas industry, international experience offers models of resource development compatible with deep decarbonisation, with especial focus on CCUS, hydrogen production and strategies to find and develop non-combustion uses for hydrocarbons. Incorporating CCUS into petrochemical production may be particularly rewarding, given the potential for cost-efficient carbon storage options (IEA, 2020a). Depleted oil and gas reservoirs also merit careful consideration because they could be one of the lowest-cost CO2 storage options in a future in which hundreds of millions of tonnes of CO2 will need to be stored. The availability of inexpensive natural gas and CO2 storage could also provide a comparative advantage in the production of clean hydrogen. Furthermore, as technologies to capture CO2 and to inject it for enhanced oil recovery are commercially mature and have been applied in industry for decades, they could be used to boost oil production from existing assets as well as reduce Azerbaijan’s overall emissions intensity and avoid the need for new production infrastructure.
Recommendations The government of Azerbaijan should:
Formulate an integrated energy RDI strategy based on close co-ordination among ANAS, the Ministry of Energy, the Ministry of Transport, Communications and High Technologies, SOCAR, private sector businesses, and IFIs and donors in the field; include measures to ensure their continued co-operation for effective implementation of the strategy.
Establish a framework to develop infrastructure and knowledge related to sustainable technologies, especially energy efficiency and renewable energy, in the RDI strategy.
Include in the RDI strategy:
> a mixture of base financing and competitive project-based granting
> support for innovative SMEs and start-ups
> support for research on climate change and adaptation in the energy sector
> measures to further develop university technology parks
> measures to strengthen the country’s capacity to participate in international RDI and education programmes, including Horizon Europe 2021-2027, and to develop a national contact point.
IEA
. All
right
s re
serv
ed.

9. ENERGY RESEARCH, DEVELOPMENT AND DEMONSTRATION
149
ENER
GY
SYST
EM T
RAN
SFO
RM
ATIO
N Place strong emphasis in the RDI strategy on smart technologies and digitalisation of
the energy sector, including smart grids and energy storage; on digital technologies for power and gas networks; and on new oil and gas sector technologies, including CCUS.
Facilitate access to available technology transfer options offered by climate funds, IFIs and donors, build up relevant policy capacity, and promote the development of relevant projects.
Track public energy-related R&D funding in detail (e.g. by technology and energy source) to inform energy-related R&D policy decisions.
IEA
. All
right
s re
serv
ed.

9. ENERGY RESEARCH, DEVELOPMENT AND DEMONSTRATION
150
References
ADB (Asian Development Bank) (2019), Azerbaijan 2019-2023 – Promoting Diversified and Inclusive Growth, Country Partnership Strategy, ADB, Manila, www.adb.org/sites/default/files/institutional-document/510266/cps-aze-2019-2023.pdf.
IEA (International Energy Agency) (2020a), The Oil and Gas Industry in Energy Transitions, OECD/IEA, Paris.
IEA (2020b), Energy Technology Perspectives 2020, OECD/IEA, Paris.
SDF (Science Development Foundation) (2020), Main indicators, http://sdf.gov.az/development/uploads/azerb_elmi_potensial_2020_en/1_science/002_1.1en.pdf.
SOCAR (State Oil Company of Azerbaijan Republic) (2020), SOCAR website, research and development, www.socar.az/socar/en/research-and-development/proceedings/about-journal.
WB (World Bank) (2018), Azerbaijan: The Role of Higher Education in Innovation, World Bank, Washington, DC, http://documents1.worldbank.org/curated/en/222451557427795620/pdf/Azerbaijan-The-Role-of-Higher-Education-in-Innovation.pdf.
IEA
. All
right
s re
serv
ed.

151
ANN
EXES
ANNEX A: Organisation of the review
Review criteria The Shared Goals, which were adopted by the IEA Ministers at their 4 June 1993 meeting in Paris, provide
the evaluation criteria for the in-depth reviews (IDRs) conducted by the IEA. The Shared Goals are
presented in Annex C.
Review team and preparation of the report The IEA in-depth review team visited Baku 17-21 February 2020. The team met with government officials,
energy suppliers, interest groups and various other organisations.
This report was drafted on the basis of these meetings, the team’s preliminary assessment of the country’s
energy policy, the government’s response to the IEA energy policy questionnaire and other information.
The members of the team were:
IEA member countries • Edmund HOSKER, Adviser to the IEA, UNITED KINGDOM (Team leader)
• Paule ANDEREGG, Energy Efficiency Specialist, Swiss Federal Office of Energy, SWITZERLAND
• Kavita JADHAV, Oil & Gas Sector Specialist, Department for Business, Energy & Industrial Strategy,
UNITED KINGDOM
EU4Energy countries • Adkham ABDULLAEV, Head of Sector, Energy Statistics, RES & EE Calculations, State Committee
of the Republic of Uzbekistan on Statistics, UZBEKISTAN
• Giorgi CHIKOVANI, CEO, Georgian Energy Development Fund, GEORGIA
• Marine GOGOLADZE, Head of Industry, Construction and Energy Statistics Division under Business
Statistics Department, GEOSTAT, GEORGIA
• Shokhzod ISLAMOV, Deputy Head, Department for Green Economy Development, Ministry of
Economy and Industry, UZBEKISTAN
• Miromil SAIDOV, Chief Specialist, Department for Development of Electric Networks, Ministry of
Energy, UZBEKISTAN
IEA secretariat • Joel COUSE, Special Adviser, Directorate of Energy Markets and Security
• Rebecca GAGHEN, Head, Division for Europe, Middle East, Africa and Latin America, Office of
Global Energy Relations
IEA
. All
right
s re
serv
ed.

ANNEXES
152
IEA for EU4Energy programme • Mariana BOTEZATU, Country Expert for Moldova
• Jacinta BYRNE-DEQUEANT, Administrative Co-ordinator
• Borys DODONOV, Country Expert for Ukraine
• Markus FAGER-PINTILÄ, Statistics Programme Manager
• Andrei MALOCHKA, Country Expert for Belarus
• Zaur MAMMADOV, Country Expert for Azerbaijan
• Murman MARGVELASHVILI, Country Expert for Georgia
• Anna PETRUS, Programme Officer
• Tolib SULTANOV, Country Expert for Uzbekistan
• Miika TOMMILA, Key author of the IDR report
The team is grateful for the co-operation and assistance of the many people it met throughout the visit.
Thanks to their kind hospitality, openness and willingness to share information, the visit was highly
informative, productive and enjoyable. The team expresses its gratitude to Mr. Samir Valiyev, Deputy
Minister of Energy, and to Mr Yusif Yusifov, Deputy Chairman of the State Statistical Committee, for
co-ordinating the response to the IEA energy policy questionnaire and for supporting the team visit. The
team also expresses sincere thanks to Mr. Zaur Mammadov, Country Expert for Azerbaijan of the IEA for
EU4Energy Programme, and Mr. Javid Abdullayev, Adviser to the Minister of Energy, for their great
organisational skills, personal commitment and ability to respond to the team’s many requests in a very
professional and effective manner.
Miika Tommila drafted chapters 1-2 and 4-9 of this report and Joel Couse was the lead author of chapter
3. Markus Fager-Pintilä prepared the graphs and drafted the sections related to statistics and energy
data. Edmund Hosker reviewed the full report and provided useful comments throughout. Anna Petrus
co-ordinated the review process.
The report was prepared under the guidance of Rebecca Gaghen, Head of the Europe, Middle East,
Africa and Latin America Division. Helpful comments and updates were provided by the review team
members and IEA staff, including Simon Bennett, Szilvia Doczi, Jean-Baptiste Dubreuil, Peter Fraser,
Cesar Alejandro Hernandez, Tom Howes, Sara Moarif, Gergely Molnar and Takahiro Oki. Therese Walsh
managed the editing process and Kristine Douaud edited the report. Astrid Dumond managed the
production process, Isabelle Nonain-Semelin finalised the layout, and Tanya Dyhin prepared the maps
and images.
IEA
. All
right
s re
serv
ed.

ANNEXES
153
ANN
EXES
Organisations interviewed ACE Consultants
ADB
Azerbaijan Architecture and Construction University
Azerbaijan Energy Engineering and Consulting LLC
Azerbaijan Oil and Industry University
Azerbaijan Technical University
Azerenergy
Azerigaz
Azerishiq
Azeristiliktejhizat
BP
EBRD
Ecological Enlightenment and Monitoring Social Union
Ecological Information Public Union
Energy Charter expert
EU Delegation to Baku
EU4Climate
Helind Energy
International EcoEnergy Academy
ITOCHU
Ministry of Ecology and Natural Resources
Ministry of Energy
Provitaz
Regulatory Authority of Ministry of Energy (Energy Services Regulation)
Science Development Foundation
Scientific-Research and Design-Prospecting Power Engineering Institute, Ltd
SOCAR
State Statistical Committee
State Tax Service
Tariff Council
Total
UNDP
IEA
. All
right
s re
serv
ed.

ANNEXES
154
ANNEX B: Energy balances and key statistical data
Azerbaijan
Energy balances and key statistical data
Unit: MtoeSUPPLY 1990 2000 2010 2016 2017 2018 2019
TOTAL PRODUCTION 20.78 18.81 67.15 58.76 55.83 56.84 60.10
Coal - - - - - - -Peat - - - - - - -Oil 12.57 14.09 52.78 42.77 40.31 40.44 39.26Natural gas 8.04 4.57 13.99 15.72 15.27 16.13 20.58Biofuels and w aste¹ 0.02 0.02 0.09 0.10 0.10 0.11 0.12Nuclear - - - - - - -Hydro 0.14 0.13 0.30 0.17 0.15 0.15 0.13Wind - - 0.00 0.00 0.00 0.01 0.01Geothermal - - - - - - -Solar/other² - - - 0.00 0.00 0.00 0.00
TOTAL NET IMPORTS 2.42 -7.54 -54.52 -44.64 -40.79 -42.08 -44.01
Coal Exports - - - - - - -Imports 0.09 - - - - - -Net imports 0.09 - - - - - -
Oil Exports 8.11 7.81 48.85 38.14 35.34 35.33 33.90Imports 4.43 0.09 0.03 0.32 0.53 0.33 0.29Int'l marine and aviation bunkers -0.35 -0.10 -0.48 -0.23 -0.21 -0.16 -0.35Net imports -4.02 -7.82 -49.30 -38.05 -35.02 -35.15 -33.96
Natural gas Exports 4.40 - 5.20 6.76 7.44 8.32 9.94Imports 10.89 0.24 - 0.25 1.77 1.51 -Net imports 6.50 0.24 -5.20 -6.51 -5.67 -6.81 -9.94
Electricity Exports 0.29 0.07 0.04 0.09 0.11 0.12 0.13Imports 0.15 0.12 0.01 0.01 0.01 0.01 0.01Net imports -0.14 0.04 -0.03 -0.08 -0.10 -0.11 -0.12
TOTAL STOCK CHANGES -0.53 0.03 -0.81 0.31 -0.51 -0.17 -0.16
TOTAL SUPPLY (TES)³ 22.67 11.30 11.82 14.42 14.54 14.59 15.94Coal 0.09 - - - - - -Peat - - - - - - -Oil 8.09 6.28 3.62 4.84 5.25 5.13 5.25Natural gas 14.46 4.83 7.85 9.40 9.13 9.30 10.54Biofuels and w aste¹ 0.02 0.02 0.09 0.10 0.10 0.11 0.12Nuclear - - - - - - -Hydro 0.14 0.13 0.30 0.17 0.15 0.15 0.13Wind - - 0.00 0.00 0.00 0.01 0.01Geothermal - - - - - - -Solar/other² - - - 0.00 0.00 0.00 0.00Electricity trade⁴ -0.14 0.04 -0.03 -0.08 -0.10 -0.11 -0.12
Shares in TES (%)Coal 0.4 - - - - - -Peat - - - - - - -Oil 35.7 55.5 30.6 33.5 36.1 35.2 32.9Natural gas 63.8 42.7 66.4 65.2 62.8 63.7 66.1Biofuels and waste¹ 0.1 0.2 0.8 0.7 0.7 0.8 0.7Nuclear - - - - - - -Hydro 0.6 1.2 2.5 1.2 1.0 1.0 0.8Wind - - 0.0 0.0 0.0 0.0 0.1Geothermal - - - - - - -Solar/other² - - - 0.0 0.0 0.0 0.0Electricity trade⁴ -0.6 0.4 -0.3 -0.6 -0.7 -0.8 -0.7
0 is negligible, - is nil, .. is not available. Please note: rounding may cause totals to differ from the sum of the elements.
IEA
. All
right
s re
serv
ed.

ANNEXES
155
ANN
EXES
Unit: MtoeDEMAND
FINAL CONSUMPTION 1990 2000 2010 2016 2017 2018 2019
TFC 16.71 6.53 6.91 8.99 8.93 9.47 10.80Coal 0.09 - - - - - -Peat - - - - - - -Oil 4.06 1.93 2.66 3.39 4.00 4.42 4.53Natural gas 9.29 3.07 3.06 3.91 3.29 3.21 4.31Biofuels and w aste¹ 0.02 0.02 0.09 0.03 0.04 0.04 0.04Geothermal - - - - - - -Solar/other² - - - - - - -Electricity 1.36 1.24 1.05 1.51 1.47 1.53 1.61Heat 1.90 0.26 0.06 0.14 0.14 0.27 0.32
Shares in TFC (%)Coal 0.5 - - - - - -Peat - - - - - - -Oil 24.3 29.6 38.4 37.7 44.8 46.7 41.9Natural gas 55.6 47.0 44.3 43.5 36.8 33.8 39.9Biofuels and waste¹ 0.1 0.3 1.3 0.3 0.4 0.4 0.4Geothermal - - - - - - -Solar/other² - - - - - - -Electricity 8.1 19.0 15.2 16.9 16.4 16.2 14.9Heat 11.4 4.1 0.8 1.6 1.5 2.9 2.9
TOTAL INDUSTRY⁵ 9.58 2.02 1.27 2.27 2.09 2.20 2.82Coal - - - - - - -Peat - - - - - - -Oil 1.39 0.94 0.57 0.92 1.13 1.27 1.40Natural gas 6.26 0.80 0.54 1.05 0.65 0.47 0.86Biofuels and w aste¹ 0.00 0.00 0.00 0.00 0.00 0.00 0.01Geothermal - - - - - - -Solar/other² - - - - - - -Electricity 0.61 0.06 0.15 0.30 0.31 0.32 0.38Heat 1.32 0.21 0.00 - - 0.13 0.17
Shares in total industry (%)Coal - - - - - - -Peat - - - - - - -Oil 14.5 46.4 45.2 40.6 54.0 57.9 49.6Natural gas 65.4 39.9 42.9 46.0 31.1 21.6 30.6Biofuels and waste¹ 0.0 0.0 0.0 0.0 0.1 0.1 0.2Geothermal - - - - - - -Solar/other² - - - - - - -Electricity 6.4 3.1 11.9 13.3 14.8 14.6 13.4Heat 13.7 10.6 0.0 - - 5.8 6.1
TRANSPORT⁴ 2.21 0.84 1.72 2.17 2.59 2.85 2.82OTHER⁶ 4.91 3.67 3.93 4.54 4.25 4.43 5.17
Coal 0.09 - - - - - -Peat - - - - - - -Oil 0.71 0.23 0.41 0.33 0.32 0.34 0.35Natural gas 2.85 2.24 2.52 2.87 2.64 2.73 3.44Biofuels and w aste¹ 0.02 0.02 0.09 0.03 0.03 0.04 0.04Geothermal - - - - - - -Solar/other² - - - - - - -Electricity 0.68 1.13 0.85 1.18 1.12 1.18 1.19Heat 0.58 0.05 0.05 0.14 0.14 0.14 0.14
Shares in other (%)Coal 1.8 - - - - - -Peat - - - - - - -Oil 14.4 6.3 10.5 7.2 7.6 7.6 6.8Natural gas 57.9 60.9 64.1 63.1 62.0 61.7 66.7Biofuels and waste¹ 0.3 0.5 2.3 0.7 0.8 0.8 0.7Geothermal - - - - - - -Solar/other² - - - - - - -Electricity 13.7 30.8 21.7 25.9 26.4 26.6 23.1Heat 11.8 1.4 1.4 3.1 3.2 3.3 2.8
IEA
. All
right
s re
serv
ed.

ANNEXES
156
Unit: MtoeDEMAND
ENERGY TRANSFORMATION AND LOSSES 1990 2000 2010 2016 2017 2018 2019
ELECTRICITY GENERATION⁷Input (Mtoe) 5.17 4.78 3.76 5.08 5.13 5.13 5.08Output (Mtoe) 1.99 1.61 1.61 2.15 2.09 2.17 2.24Output (TWh) 23.15 18.70 18.71 24.95 24.32 25.23 26.07
Output Shares (%)Coal - - - - - - -Peat - - - - - - -Oil 34.4 72.0 0.1 10.4 5.4 0.2 0.2Natural gas 58.4 19.8 81.5 80.8 86.4 91.7 92.5Biofuels and waste¹ - - - 0.7 0.7 0.6 0.8Nuclear - - - - - - -Hydro 7.2 8.2 18.4 7.9 7.2 7.0 6.0Wind - - 0.0 0.1 0.1 0.3 0.4Geothermal - - - - - - -Solar/other² - - - 0.1 0.2 0.2 0.2
TOTAL LOSSES 5.96 4.77 4.65 5.35 5.54 5.06 5.08of w hich:
Electricity and heat generation⁸ 3.18 3.17 2.15 2.93 3.04 2.96 2.84Other transformation 0.32 0.23 0.39 0.44 0.56 0.38 0.37Ow n use and transmission/distribution losses 2.46 1.36 2.11 1.98 1.95 1.72 1.88
Statistical differences - - -0.26 -0.09 -0.06 -0.06 -0.06
INDICATORS 1990 2000 2010 2016 2017 2018 2019
20.57 12.11 47.99 51.45 51.53 52.30 53.467.16 8.05 9.05 9.76 9.85 9.94 10.021.10 0.93 0.25 0.28 0.28 0.28 0.300.92 1.67 5.68 4.07 3.84 3.90 3.773.17 1.40 1.31 1.48 1.48 1.47 1.590.39 0.52 0.08 0.09 0.10 0.10 0.100.81 0.54 0.14 0.17 0.17 0.18 0.202.33 0.81 0.76 0.92 0.91 0.95 1.0853.5 27.3 23.5 31.4 30.8 30.9 -
GDP (billion 2015 USD)Population (millions)TES/GDP (toe/1000 USD)⁹Energy production/TESPer capita TES (toe/capita)Oil supply/GDP (toe/1000 USD)⁹TFC/GDP (toe/1000 USD)⁹Per capita TFC (toe/capita)CO2 emissions from fuel combustion (MtCO2) 10
CO2 emissions from bunkers (MtCO2)10 1.0 0.3 1.4 0.7 0.6 0.5 -
GROWTH RATES (% per year) 90-00 00-10 10-16 16-17 17-18 18-19 00-19
TES -6.7 0.5 3.4 0.8 0.4 9.2 1.8Coal -100.0 - - - - - -Peat - - - - - - -Oil -2.5 -5.4 5.0 8.6 -2.3 2.3 -0.9Natural gas -10.4 5.0 3.0 -2.9 1.9 13.3 4.2Biofuels and w aste¹ 1.2 16.8 1.9 1.8 8.0 4.8 10.0Nuclear - - - - - - -Hydro -0.8 8.4 -9.0 -10.9 1.2 -11.5 0.1Wind - - 68.6 -3.9 274.2 27.4 -Geothermal - - - - - - -Solar/other² - - - 6.3 5.6 12.5 -
TFC -9.0 0.6 4.5 -0.6 6.0 14.0 2.7Electricity consumption -0.9 -1.6 6.3 -3.0 4.3 4.8 1.4Energy production -1.0 13.6 -2.2 -5.0 1.8 5.7 6.3Net oil imports 6.9 20.2 -4.2 -8.0 0.4 -3.4 8.0GDP -5.2 14.8 1.2 0.2 1.5 2.2 8.1TES/GDP -1.7 -12.5 2.2 0.6 -1.1 6.9 -5.8TFC/GDP -4.0 -12.4 3.3 -0.7 4.5 11.5 -5.0
0 is negligible, - is nil, .. is not available. Please note: rounding may cause totals to differ from the sum of the elements.
IEA
. All
right
s re
serv
ed.
ANNEXES
157
ANN
EXES
Footnotes to energy balances and key statistical data 1. Biofuels and waste comprise solid biofuels, industrial waste and municipal waste. Data are often
based on partial surveys and may not be comparable between countries.
2. Other includes ambient heat used in heat pumps.
3. Excludes international marine bunkers and international aviation bunkers.
4. Total supply of electricity represents net trade. A negative number in the share of TES indicatesthat exports are greater than imports.
5. Industry includes non-energy use.
6. Other includes residential, commercial and public services, agriculture/forestry, fishing and othernon-specified.
7. Inputs to electricity generation include inputs for electricity, co-generation (CHP) and heat plants.Output refers to electricity generation only.
8. Losses arising from electricity and heat production by main-activity and autoproducers. For non-fossil-fuel electricity generation, theoretical losses are based on plant efficiencies of around 33%for nuclear and solar thermal, 10% for geothermal and 100% for hydro, wind and solar photovoltaic.
9. Toe per thousand USD at 2015 prices and exchange rates.
10. CO2 emissions from fuel combustion were estimated using the IPCC Tier I Sectoral Approachmethodology from the 2006 IPCC Guidelines. Emissions from international marine and aviationbunkers are not included in national totals.
IEA
. All
right
s re
serv
ed.

ANNEXES
158
ANNEX C: International Energy Agency Shared Goals The member countries* of the International Energy Agency (IEA) seek to create conditions in which the
energy sectors of their economies can make the fullest possible contribution to sustainable economic
development and to the well-being of their people and the environment. In formulating energy policies,
the establishment of free and open markets is a fundamental point of departure, though energy security
and environmental protection need to be given particular emphasis by governments. IEA countries
recognise the significance of increasing global interdependence in energy. They therefore seek to
promote the effective operation of international energy markets and encourage dialogue with all
participants. To secure their objectives, member countries therefore aim to create a policy framework
consistent with the following goals:
1. Diversity, efficiency and flexibility within the energy sector are basic conditions for longer-term
energy security: the fuels used within and across sectors and the sources of those fuels should be as
diverse as practicable. Non-fossil fuels, particularly nuclear and hydro, make a substantial contribution to
the energy supply diversity of IEA countries as a group.
2. Energy systems should have the ability to respond promptly and flexibly to energy emergencies.
In some cases, this requires collective mechanisms and action: IEA countries co-operate through the
Agency in responding jointly to oil supply emergencies.
3. The environmentally sustainable provision and use of energy are central to the achievement of
these shared goals. Decision makers should seek to minimise the adverse environmental impacts of energy
activities, just as environmental decisions should take account of the energy consequences. Government
interventions should respect the Polluter Pays Principle when practicable.
4. More environmentally acceptable energy sources need to be encouraged and developed. Clean
and efficient fossil fuel use is essential. The development of economic non-fossil sources is also a priority.
A number of IEA member countries wish to retain and improve the nuclear option for the future, at the
highest available safety standards, because nuclear energy does not emit carbon dioxide. Renewable
energy sources will also have an increasingly important contribution to make.
5. Improved energy efficiency can promote both environmental protection and energy security in a cost-
effective manner. There are significant opportunities for greater energy efficiency at all stages of the
energy cycle, from production to consumption. Strong efforts by governments and all energy users are
needed to realise these opportunities.
6. Continued research, development and market deployment of new and improved energy
technologies make a critical contribution to achieving the objectives outlined above. Energy technology
policies should complement broader energy policies. International co-operation in the development and
dissemination of energy technologies, including industry participation and co-operation with non-member
countries, should be encouraged.
IEA
. All
right
s re
serv
ed.

ANNEXES
159
ANN
EXES
7. Undistorted energy prices enable markets to work efficiently. Energy prices should not be held
artificially below the costs of supply to promote social or industrial goals. To the greatest extent necessary
and practicable, the environmental costs of energy production and use should be reflected in prices.
8. Free and open trade and a secure framework for investment contribute to efficient energy markets
and energy security. Distortions to energy trade and investment should be avoided.
9. Co-operation among all energy market participants helps improve information access and
understanding, and encourages the development of efficient, environmentally acceptable and flexible
energy systems and markets worldwide. These are needed to help promote the investment, trade and
confidence necessary to achieve global energy security and environmental objectives.
(The Shared Goals were adopted by IEA Ministers at the meeting of 4 June 1993 at Paris, France.)
* Australia, Austria, Belgium, Canada, the Czech Republic, Denmark, Estonia, Finland, France, Germany, Greece, Hungary, Ireland, Italy, Japan, Korea, Luxembourg, Mexico, the Netherlands, New Zealand, Norway, Poland, Portugal, the Slovak Republic, Spain, Sweden, Switzerland, Turkey, the United Kingdom, the United States.
IEA
. All
right
s re
serv
ed.

ANNEXES
160
ANNEX D: Acronyms, abbreviations and units of measure
Acronyms and abbreviations AC Alternating current
ACG Azeri-Chirag-Gunashli
ADB Asian Development Bank
AERA Azerbaijan Energy Regulatory Agency
AGT Azerbaijan-Georgia-Turkey
ANAS Azerbaijan’s National Academy of Science
BOO Build-own-operate
BTC Baku-Tbilisi-Ceyhan
CCGT Combined-cycle gas turbine
CCS Carbon capture and storage
CCUS Carbon capture, utilisation and storage
CDD Central Dispatching Department
CENEF Center for Energy Efficiency
CEPI Caspian Environmental Protection Initiative
CESD Center for Economic and Social Development
CNG Compressed natural gas
DH District heating
DHC District heating and cooling
DSO Distribution system operator
ECS Energy Charter Secretariat
EMS Energy management systems
EOP Early Oil Project
EBRD European Bank for Reconstruction and Development
EU European Union
FDI Foreign direct investment
FEM Fuel and Energy Ministry
GSA Government support agreements
HAR Heydar Aliyev Refinery
HTP High Technologies Park
IDR In-depth reviews
IEA International Energy Agency
IFI International financial institutions
IISPUS Integrated information system of public utility services
INDC Intended Nationally Determined Contribution
IOC International oil companies
IEA
. All
right
s re
serv
ed.

ANNEXES
161
ANN
EXES
JODI Joint Organizations Data Initiative
JV Joint venture
LED Light-emitting diodes
LPG Liquefied petroleum gas
MENR Ministry of Ecology and Natural Resources
MEPR Minimum energy performance requirements
MEPS Minimum energy performance standards
MoE Ministry of Energy
MoU Memorandums of understanding
MRV Measurement, reporting and verification
NDC Nationally determined contribution
NEEAP National energy efficiency action plan
NGL Natural gas liquids
NREP Northern Route Export Pipeline
OECD Organisation for Economic Co-operation and Development
OGPC Oil, gas and petrochemical complex
OPEC Organization of the Petroleum Exporting Countries
PPA Power purchase agreements
PPP Purchasing power parity
PSA Production sharing agreement
R&D Research and development
RDI Research, development and innovation
RES Renewable energy sources
RFP Requests for proposal
RSC Risk service contracts
SAARES State Agency on Alternative and Renewable Energy Sources
SAIDI System Average Interruption Duration Index
SAIFI System Average Interruption Frequency Index
SCADA Supervisory control and data acquisition
SCP South Caucasus Pipeline
SDG Sustainable Development Goals
SGC Southern Gas Corridor
SME Small and medium-sized enterprises
SOE State-owned enterprises
SSC State Statistical Committee
STEP Sangachal Terminal Expansion Programme
TANAP Through the newly launched Trans-Anatolian Pipeline
TAP Trans-Adriatic Pipeline
TES Total energy supply
TFC Total final consumption
IEA
. All
right
s re
serv
ed.

ANNEXES
162
TPP Thermal Power Plant
TRV Temperature regulating valves
TSO Transmission system operator
UNDP UN Development Programme
UNFCCC United Nations Framework Convention on Climate Change
UNSD United Nations Statistics Division
USAID United States Agency for International Development
VRE Variable renewable energy
WREP Western Route Export Pipeline
Units of measure
bcm billion cubic metres
gCO2 gramme of carbon dioxide
GW gigawatt
GWh gigawatt hour
kb thousand barrels
kbd thousand barrels per day
km kilometres
kt kilotonne
ktoe kilotonne of oil equivalent
kV kilovolt
kW kilowatt
kWh kilowatt hour
m3 cubic metre
mcm million cubic metres
Mt million tonnes
MtCO₂ million tonnes of carbon dioxide
MtCO₂-eq million tonnes of carbon dioxide equivalent.
Mtoe million tonnes of oil equivalent
Mt/a million tonnes per annum (million tonnes per year)
MW megawatt
MWh megawatt hour
toe tonne of oil equivalent
TWh terawatt hour
IEA
. All
right
s re
serv
ed.
This publication has been produced with the financial assistance of the European Union and is part of the EU4Energy programme. This publication reflects the views of the International Energy Agency (IEA) Secretariat but does not necessarily reflect those of individual IEA member countries or the European Union. The IEA makes no representation or warranty, express or implied, in respect to the publication’s contents (including its completeness or accuracy) and shall not be responsible for any use of, or reliance on, the publication.
EU4Energy is a collaboration between the IEA, the European Union, Focus Countries and other implementing parties, designed to support the aspirations of Focus Countries to implement sustainable energy policies and foster co-operative energy sector development at the regional level.
This publication and any map included herein are without prejudice to the status of or sovereignty over any territory, to the delimitation of international frontiers and boundaries and to the name of any territory, city or area.
IEA. All rights reserved.IEA PublicationsInternational Energy Agency Website: www.iea.orgContact information: www.iea.org/about/contact
Typeset in France by IEA - June 2021 Cover design: IEA

Azerbaijan 2021Energy Policy Review
Oil and gas continue to dominate Azerbaijan’s economy and provide most of its export and government revenue. While these resources have sharply raised the country’s living standards since the late 1990s and remain plentiful, the long-term outlook for this economic model is uncertain. Oil production is declining and major oil and gas importing countries have pledged to reduce greenhouse gas emissions to net-zero by mid-century, implying little demand three decades from now for oil or gas without carbon capture and storage.
This report assesses the energy sector and related economic challenges facing Azerbaijan. It proposes several ways to respond by increasing the efficiency and diversity of domestic energy supply and use. The overriding recommendation is a gradual transition to competitive markets with significant private sector participation and energy prices that reflect the cost of production. The withdrawal of subsidies should be accompanied by support measures for those most in need. Such a transition would attract new market entrants and new investments, helping to develop Azerbaijan’s significant solar and wind potential, and limiting greenhouse gas emissions.
These recommendations are in line with efforts already underway in Azerbaijan. Prompted by the oil price shock in 2014-15, the government has recently drafted proposals for electricity and gas market reforms, as well as laws on energy efficiency and renewable energy. The country’s first specific energy strategy is also nearing completion. The report encourages Azerbaijan to move swiftly to adopt all these proposals and implement them effectively to ensure secure and sustainable energy in the future.
Co-funded bythe European Union