b i o t e c h n o l o g y biotechnology alykhan ladha brian peters ryan gardecki taimur ali khan...
Post on 22-Dec-2015
214 views
TRANSCRIPT
B I O T E C H
N O L O G Y
BIOTECHNOLOGY
AlyKhan Ladha
Brian Peters
Ryan Gardecki
Taimur Ali Khan
Weiwei Sun
B I O T E C H
N O L O G Y
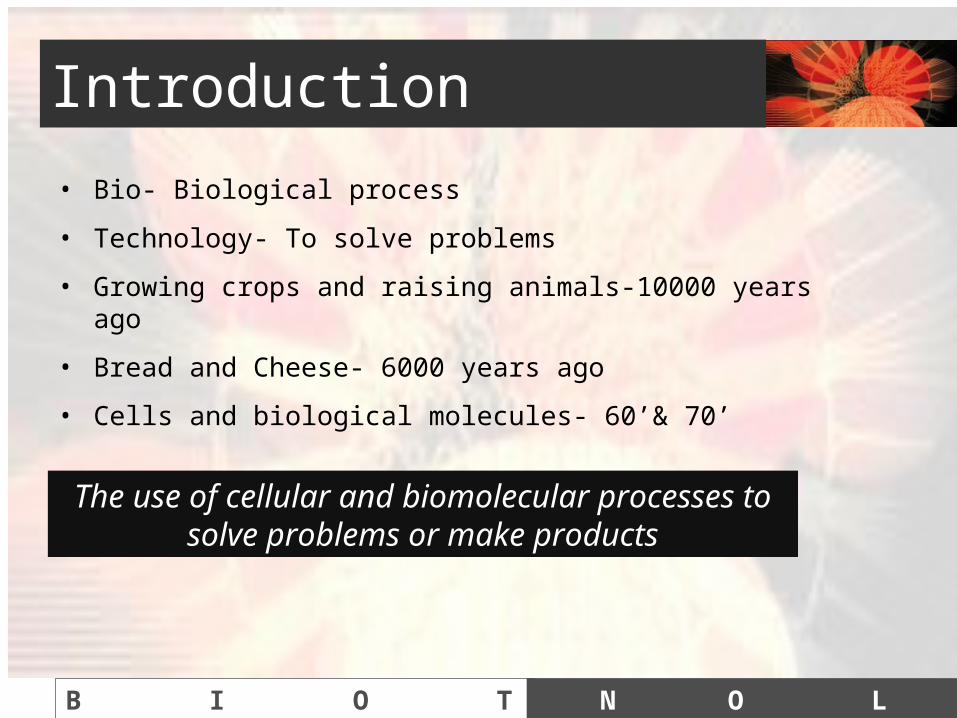
Introduction
• Bio- Biological process
• Technology- To solve problems
• Growing crops and raising animals-10000 years ago
• Bread and Cheese- 6000 years ago
• Cells and biological molecules- 60’& 70’
The use of cellular and biomolecular processes to solve problems or make
products

B I O T E C H
N O L O G Y
Cells and biological Molecules
• Cells have the same structure – DNA- Deoxyribonucleic Acid
• Cell construction • Operations• Coordinates activities
– Protein
• Instruction to make proteins – directed by DNA• Todays Biotechnology – Using technologies to create
proteins by the means of DNA– Specific– Precise – Predictable
B I O T E C H
N O L O G Y
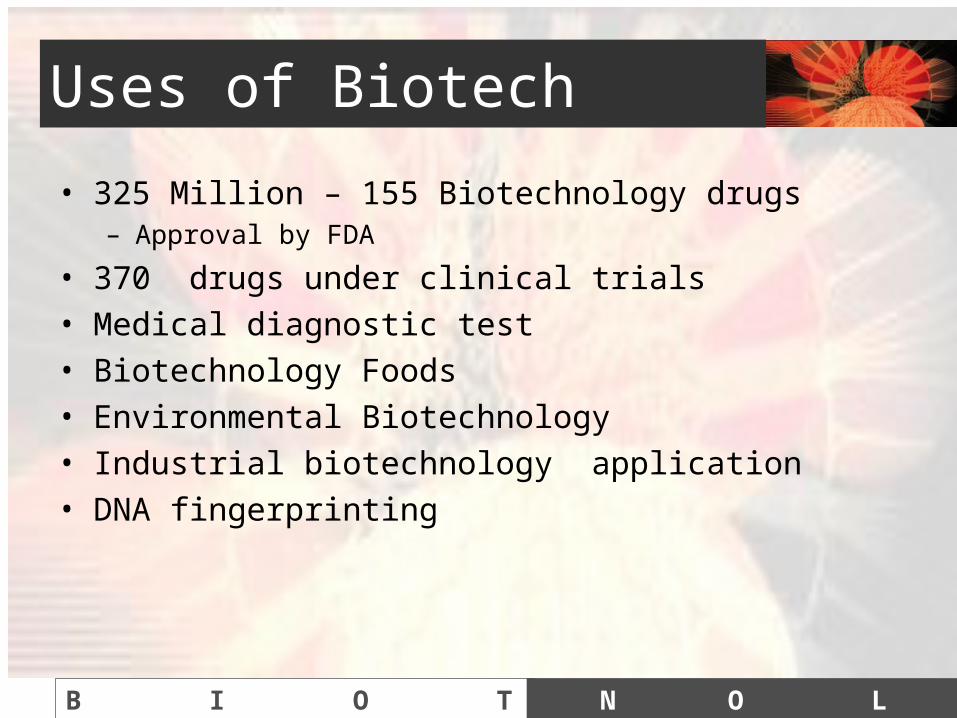
Uses of Biotech
• 325 Million – 155 Biotechnology drugs– Approval by FDA
• 370 drugs under clinical trials• Medical diagnostic test • Biotechnology Foods• Environmental Biotechnology• Industrial biotechnology application • DNA fingerprinting
B I O T E C H
N O L O G Y
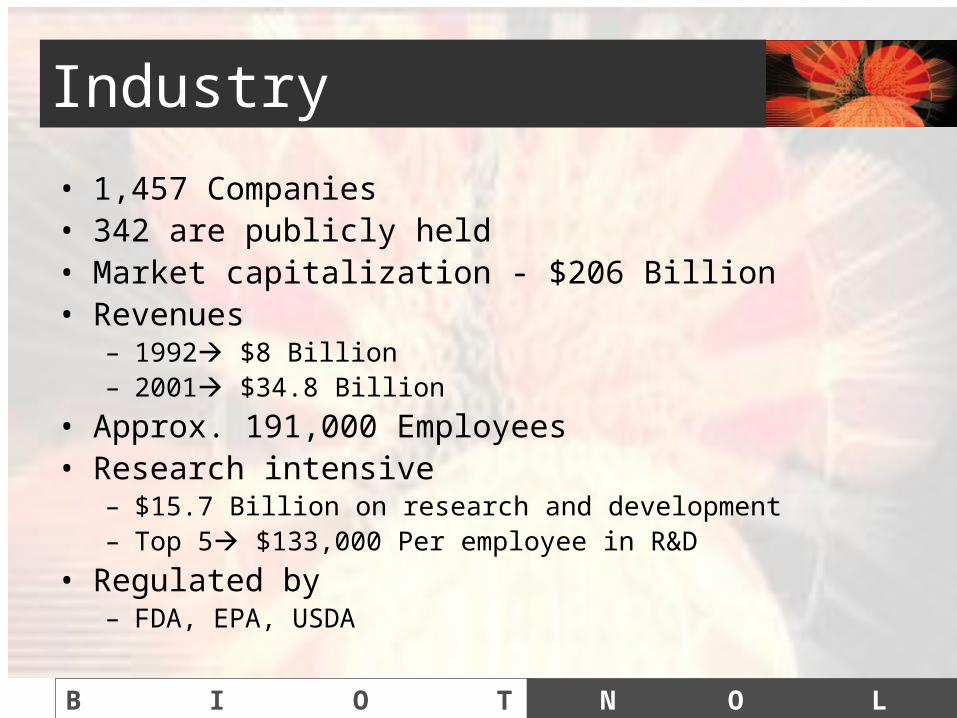
Industry
• 1,457 Companies • 342 are publicly held• Market capitalization - $206 Billion • Revenues
– 1992 $8 Billion – 2001 $34.8 Billion
• Approx. 191,000 Employees • Research intensive
– $15.7 Billion on research and development – Top 5 $133,000 Per employee in R&D
• Regulated by – FDA, EPA, USDA
B I O T E C H
N O L O G Y
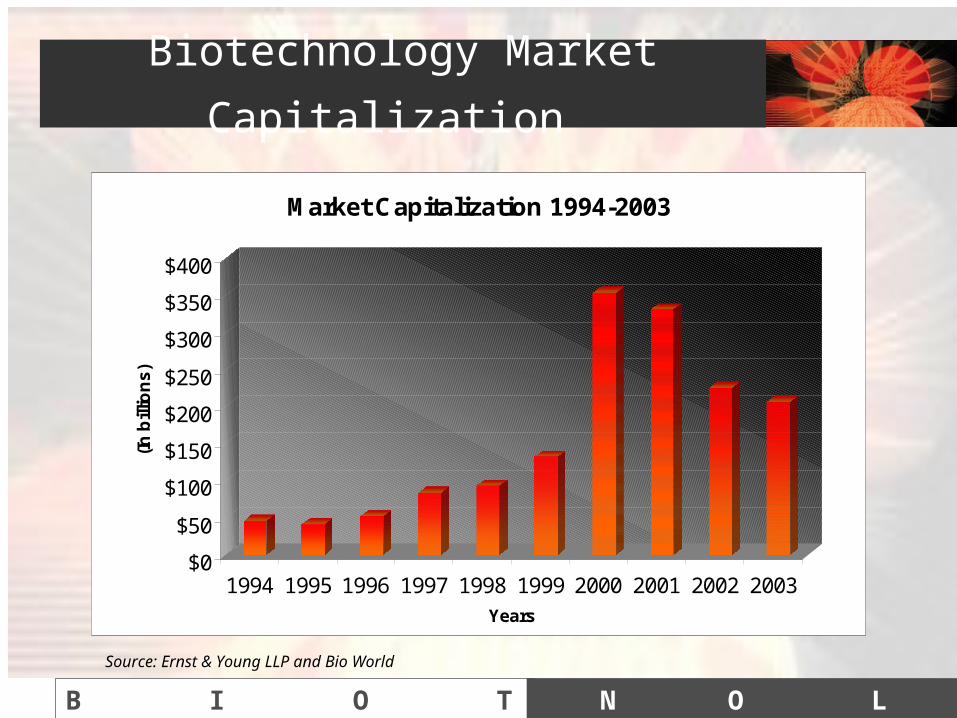
Biotechnology Market Capitalization
$0
$50
$100
$150
$200
$250
$300
$350
$400
(In
bill
ion
s)
1994 1995 1996 1997 1998 1999 2000 2001 2002 2003Years
Market Capitalization 1994-2003
Source: Ernst & Young LLP and Bio World
B I O T E C H
N O L O G Y
PATENTS
• Biotech inventions are subject to the same rules as all other inventions
• What can be patented– Product – Method– Use
• Examples– DNA and RNA sequences– proteins, enzymes, antibiotics– antibodies, antigens– micro-organisms, cell lines, hybrids
B I O T E C H
N O L O G Y
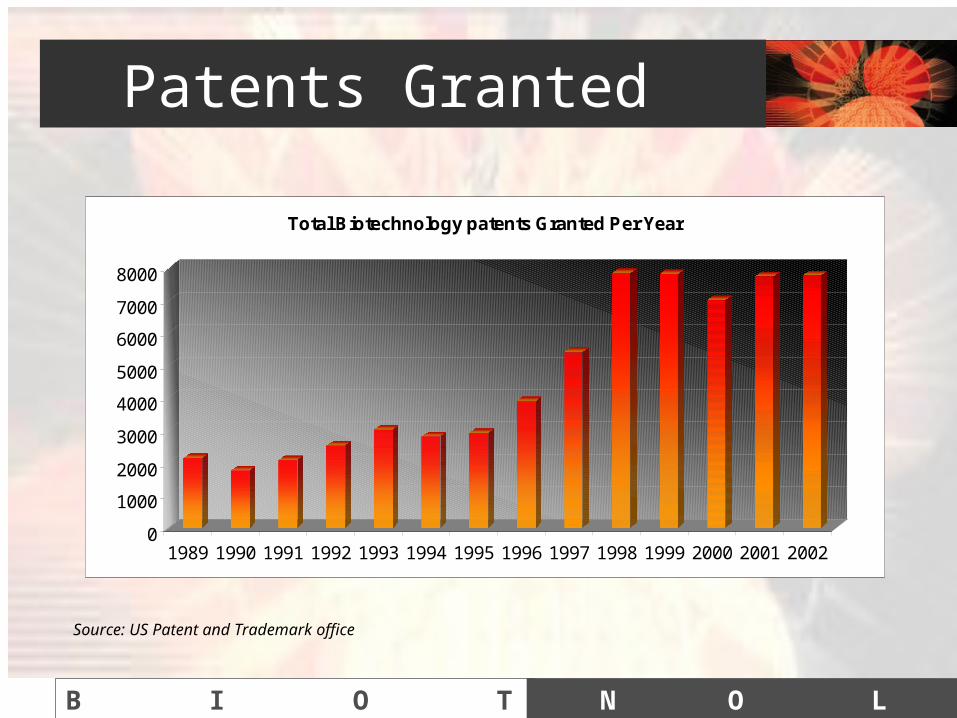
Patents Granted
0
1000
2000
3000
4000
5000
6000
7000
8000
1989 1990 1991 1992 1993 1994 1995 1996 1997 1998 1999 2000 2001 2002
Total Biotechnology patents Granted Per Year
Source: US Patent and Trademark office

B I O T E C H
N O L O G Y
Industry Statistics
Year 2001 2000 1999 1998 1997 1996 1995 1994 1993
Sales 20.7 19.3 16.1 14.5 13 10.8 9.3 7.7 7.0
Revenue 28.5 26.7 22.3 20.2 17.4 14.6 12.7 11.2 10
R&D Expense 15.7 14.2 10.7 10.6 9.0 7.9 7.7 7.0 5.7
No. of Public Companies
342 339 300 316 317 294 260 265 235
No. Of Companies
1457 1379 1273 1311 1274 1287 1308 1311 1272
Employees 191* 174 162 155 141 118 108 103 97
Source: Ernst & Young annual biotechnology industry Report 1993-2001
* In Thousands

B I O T E C H
N O L O G Y
Biotech Industry
B I O T E C H
N O L O G Y
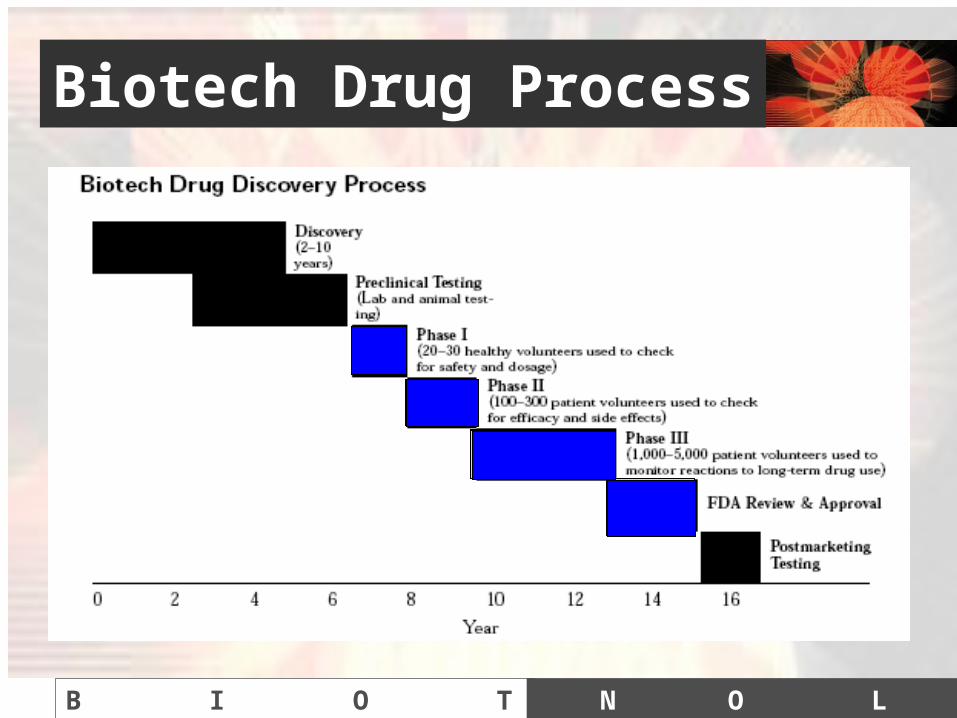
Biotech Drug Process
B I O T E C H
N O L O G Y
FDA
Food and Drug Administration
• Sets health and safety standards• Drugs, food , medical devices, cosmetics
products, and biologics• Also monitor for proper production standards• Ensure labeling is truthful and informative.
B I O T E C H
N O L O G Y
Brief History
• 1862 Abraham Lincoln created the Burro of Agriculture and appointed Charles Wetherill to head the chemistry department
• The FDA today has a budget of over 1.2 billion and a staff of over 9000
Highlights• 1911—wonder cures illegal • 1962—Thalidomide kept of US shelves• 1992—FDA starts to charge an application and
service fee
B I O T E C H
N O L O G Y
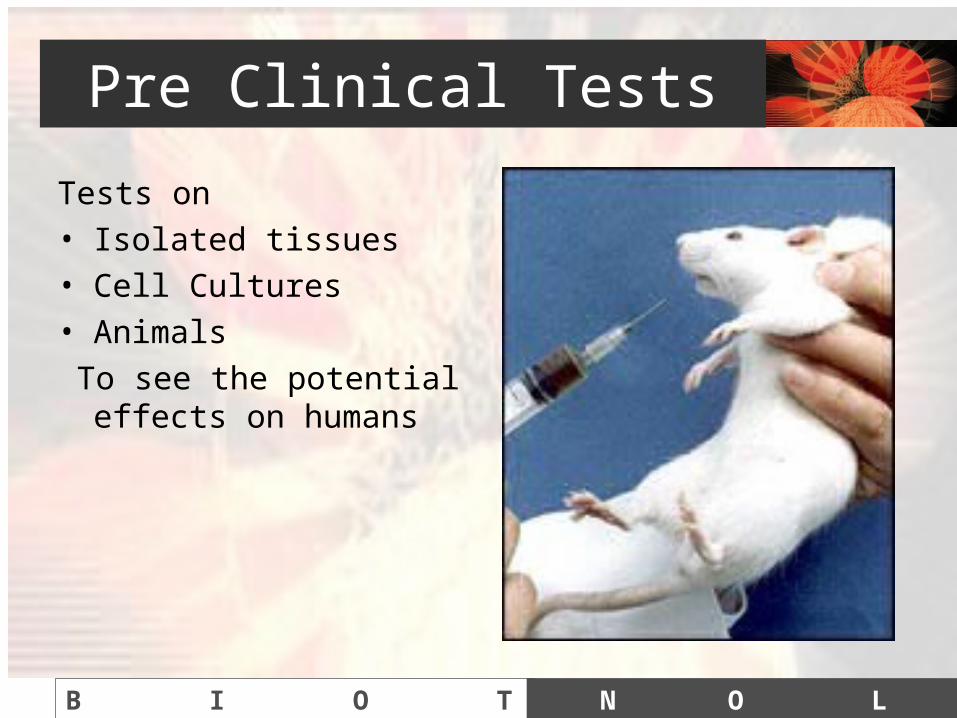
Pre Clinical Tests
Tests on• Isolated tissues• Cell Cultures• Animals To see the potential
effects on humans
B I O T E C H
N O L O G Y
The IND
Investigational New Drug ApplicationTwo Rolls
• Exemption from marketing application in order to transport the drug
• FDA review of Pre clinical drug information • Takes as long as 30 days• At this time patents are usually applied for,
patents last generally for 20 years

B I O T E C H
N O L O G Y
Phase One
• Ranging from 1 to 3 years
• Begins to analysis the drugs safety profile
• How the drug is absorbed, metabolized and excreted
• Improves Chances of making it to market by 30%
B I O T E C H
N O L O G Y
Phase Two
• Ranging about 2 years• Specifically tests the drugs safety and side
effects• Purpose is to set dosages • Making it through phase two increase your
chances of being approves by 60%

B I O T E C H
N O L O G Y
Phase Three
• Ranging between 3 and 4 years• Verifies the drug is effective in its intended use • Assessment of long term effects• At this point the drug has a 70% chance of FDA
approval.Processing of the NDA New Drug Application• This can take be done in as little as 6 month or as
long as 2 years• Drugs are subject to ongoing review, making sure
no adverse side effects appear from the drug.Insert timeline graph
B I O T E C H
N O L O G Y
Cont..
• Cost : between 350 and 500 million to bring a drug through the FDA process
• All the testing is done in-house (that is by the companies with the FDA overseeing data)
• Only a small percentage of totally original drugs are produced every year.
B I O T E C H
N O L O G Y
AMGEN
• Amgen Inc. is a global biotechnology company that discovers, develops, manufactures and markets human therapeutics based on advances in cellular and molecular biology.
• It was founded in 1980, and commenced operation on January 21, 1981.
• It is headquartered in Thousand Oaks, California; Amgen conducts business in 19 countries and has research, manufacturing, distribution and sales facilities worldwide
• In July 2002, the Company completed its acquisition of Immunex Corporation, a biotechnology company dedicated to developing immune system science to protect human health
B I O T E C H
N O L O G Y
Mission and Values
• MissionAmgen is striving to be the best human therapeutics company. This means embracing constant change, pursuing innovation wherever it leads. It means developing today’s opportunities to their fullest, acting with speed and decisiveness. It means overcoming challenges when they arise with grace, determination, and courage. It means delivering on promises made, and committing to promises yet to be envisioned.
• Values● Be science-based● Compete intensely and win● Create value for patients, staff, and stockholders● Be ethical● Trust and respect each other● Ensure quality● Work in teams● Collaborate, communicate, and be accountable

B I O T E C H
N O L O G Y
Amgen Culture
• Amgen has over 10,000 staff members
• Amgen tries to nurtures a culture that encourages high standards of excellence, original thinking, a passion for the process of discovery, and a willingness to take risks.
• The company has sought to develop a work environment that is results-focused and team-oriented to cope with the rapidly changing environment.
B I O T E C H
N O L O G Y
Management
• Kevin Sharer (joined Amgen in 1992)Chairman of the Board, Chief Executive Officer and President, Amgen Inc.
• Dennis M. Fenton, Ph.D. (joined Amgen in 1982)Executive vice president of Operations
• Fabrozio Bonanni, Dr. Chem (joined Amgen in 1999)Senior Vice President, Manufacturing
• Hassan Dayem, Ph.D (joined Amgen in 2002)Senior Vice President and Chief Information Officer

B I O T E C H
N O L O G Y
Products
• Amgen's strategic approach for discovery research is organized around five therapeutic areas –
1. Hematology, 2. Oncology, 3. Inflammation, 4. Neurology,5. Metabolic Disorders.
• These programs are enhanced and expanded through external research collaborations, acquisitions, and product licensing opportunities.

B I O T E C H
N O L O G Y
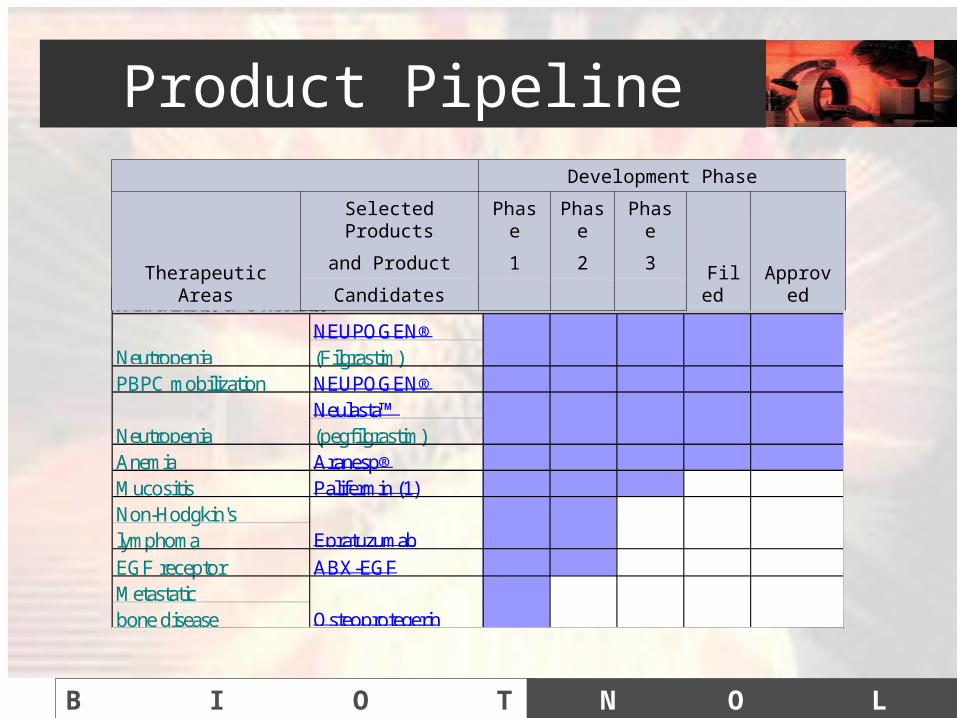
Product Pipeline
X – Filed on Oct 10, 2003
Development Phase
Therapeutic Areas
Selected Products Phase Phase Phase
Filed Approved
and Product 1 2 3
Candidates
Nephrology
Anemia
EPOGEN®
(Epoetin alfa)
Anemia
Aranesp®
(darbepoetin alfa)
Secondary Cinacalcet
hyperparathyroidism hydrochloride
X
B I O T E C H
N O L O G Y
Product Pipeline
NEUPOGEN®(Filgrastim)
PBPC mobilization NEUPOGEN®Neulasta™(pegfilgrastim)
Anemia Aranesp®Mucositis Palifermin (1)Non-Hodgkin'slymphomaEGF receptor ABX-EGFMetastaticbone disease
Hematology & Oncology
Neutropenia
Neutropenia
Epratuzumab
Osteoprotegerin
Development Phase
Therapeutic Areas
Selected Products Phase Phase Phase
Filed Approved
and Product 1 2 3
Candidates

B I O T E C H
N O L O G Y
ProductsDevelopment Phase
Therapeutic Areas
Selected Products Phase Phase Phase
Filed Approved
and Product 1 2 3
Candidates
ENBREL®(etanercept)
Polyarticular-coursejuvenile rheumatoidarthritisPsoriatic arthritis ENBREL®
Kineret®(anakinra)
Ankylosing spondylitisENBREL®Psoriasis ENBREL®Rheumatoid Arthritis PEG-sTNF-R1 (2)Osteoporosis Osteoprotegerin
Primary Cinacalcethyperparathyroidism hydrochlorideParkinson's disease GDNF (3)
Neurology & Endocrinology
Rheumatoid arthritis
ENBREL®
Bone & Inflammation
Rheumatoid arthritis*
B I O T E C H
N O L O G Y
Selected Products
• Cinacalcet hydrochloride
• Amgen’s first small molecule therapeutic in development, entered phase 3 clinical trials in December 2001. Filed on Oct 10, 2003.
• Licensed from NPS Pharmaceuticals, Inc., it is an orally active compound that specifically binds and modulates the calcium-sensing receptor on the surface of the parathyroid gland, decreasing the secretion of parathyroid hormone.
• Excessive secretion of parathyroid hormone occurs in 85% of patients with end-stage renal disease and can result in a variety of serious medical complications.

B I O T E C H
N O L O G Y
Selected Products• Aranesp (darbepoetin alfa)• Amgen’s latest anemia treatment, was approved in 2002 in the United
States, Europe, and Australia for the treatment of chemotherapy-related anemia.
• Aranesp is a recombinant erythropoietic protein(a protein that stimulates production of oxygen-carrying red blood cells).
• Aranesp has shown to increases red blood cell count and maintain target hemoglobin levels in cancer patients undergoing chemotherapy where anemia is due to the effects.
• Aranesp has a long half-life (approximately three times longer than Epoetin alfa) allowing treatment with less-frequent dosing.
B I O T E C H
N O L O G Y
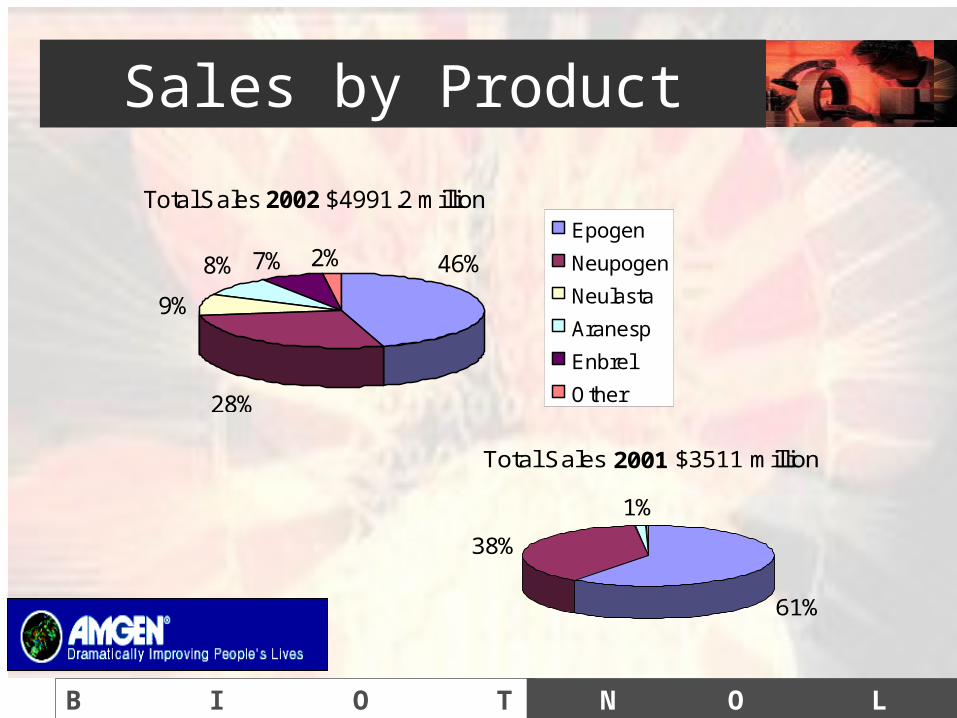
Sales by Product
Total Sales 2002 $4991.2 million
28%
9%
7% 2%8% 46%
Epogen
Neupogen
Neulasta
Aranesp
Enbrel
Other
Total Sales 2001 $3511 million
61%
38%
1%
B I O T E C H
N O L O G Y
GrowthAmgen’s top line grew 42% in 2002 as a result of :
• a 24% increase in the combined sales of Amgen’s anemia therapeutics EPOGEN and Aranesp;
• a 37% increase in the combined sales of the company’s infection-fighting therapeutics NEUPOGEN and Neulasta;
• and the addition of $362 million in sales of *ENBREL, Amgen’s new inflammation therapeutic acquired in mid-2002 with the company’s acquisition of Immunex Corporation.
*note: new developments in Enbrel have recently been shown to work against psoriasis (scaly skin condition that affects up to 7.5 million Americans released Nov 19,2003)

B I O T E C H
N O L O G Y
Growth• Amgen anticipates continued strong growth in product sales through
2005 as the company’s newest therapeutics gather momentum
• The company indicated that has almost 40 development programs
• They intend to expand their lines through approval of new products, and the continued investment in new product development.
• Amgen will continue to use significant amounts of cash for the company’s capital expenditure requirements, as well as for its share repurchase program.
• Its strong cash flow will also be used to fund potential product candidates in-licensing opportunities

B I O T E C H
N O L O G Y
Opportunities Abroad
US Sales By Product (in millions)
Epogen 37%
Aranesp 14%Neupogen 13%
Neulasta 17%
Enbrel 18%Other 1%
Total Sales $5,523.2
Total Sales $767.3
Inernational Sales By Product (in millions)
Aranesp50%
Neupogen38%
Enbrel4%
Other3%
Neulata5%
• Market penetration internationally
• 3Q Sales 2003
B I O T E C H
N O L O G Y
Threats
• Must obtain regulatory approval
• Face substantial competition, to discover, develop, acquire or commercialize products before others.
• Dependent on third parties for a significant portion of supply and fill and finish of many products.
• Side affects may arise on products reducing sales
• May be required to pay law suits
B I O T E C H
N O L O G Y
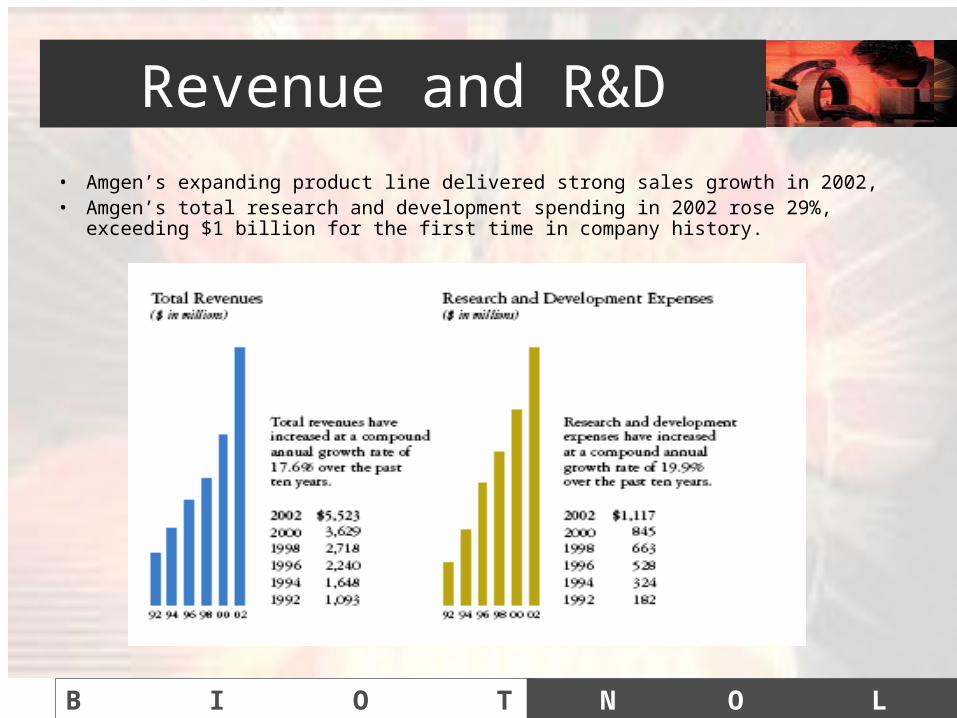
Revenue and R&D
• Amgen’s expanding product line delivered strong sales growth in 2002,• Amgen’s total research and development spending in 2002 rose 29%,
exceeding $1 billion for the first time in company history.
B I O T E C H
N O L O G Y
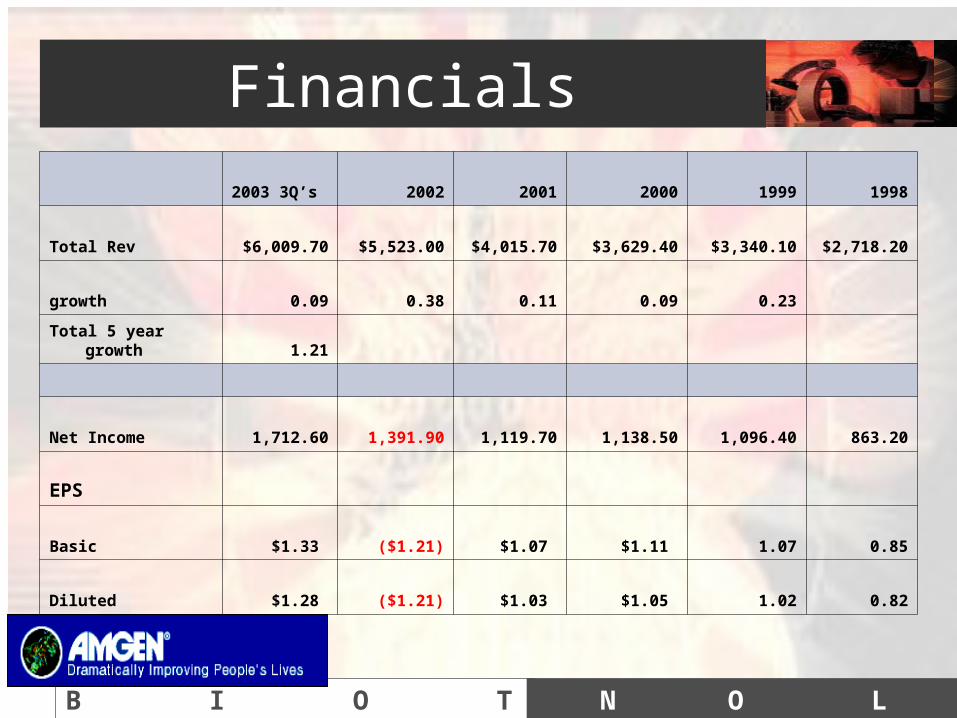
Financials
2003 3Q’s 2002 2001 2000 1999 1998
Total Rev $6,009.70 $5,523.00 $4,015.70 $3,629.40 $3,340.10 $2,718.20
growth 0.09 0.38 0.11 0.09 0.23
Total 5 year growth 1.21
Net Income 1,712.60 1,391.90 1,119.70 1,138.50 1,096.40 863.20
EPS
Basic $1.33 ($1.21) $1.07 $1.11 1.07 0.85
Diluted $1.28 ($1.21) $1.03 $1.05 1.02 0.82
B I O T E C H
N O L O G Y
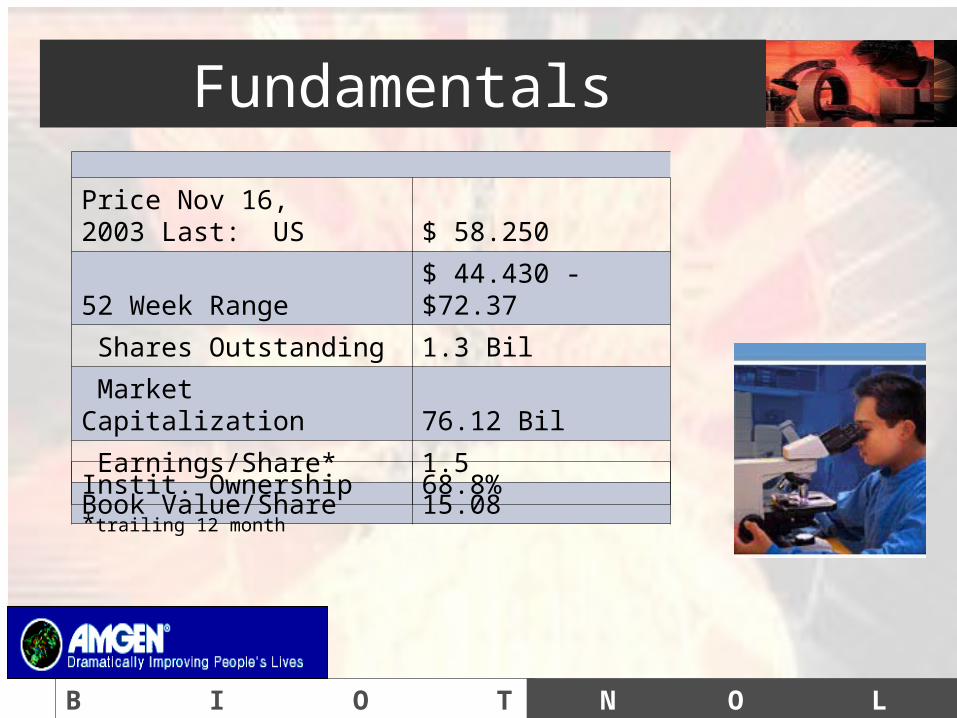
Fundamentals
Price Nov 16, 2003 Last: US $ 58.250
52 Week Range $ 44.430 - $72.37
Shares Outstanding 1.3 Bil
Market Capitalization 76.12 Bil
Earnings/Share* 1.5
Book Value/Share 15.08
*trailing 12 month
Instit. Ownership 68.8%
B I O T E C H
N O L O G Y
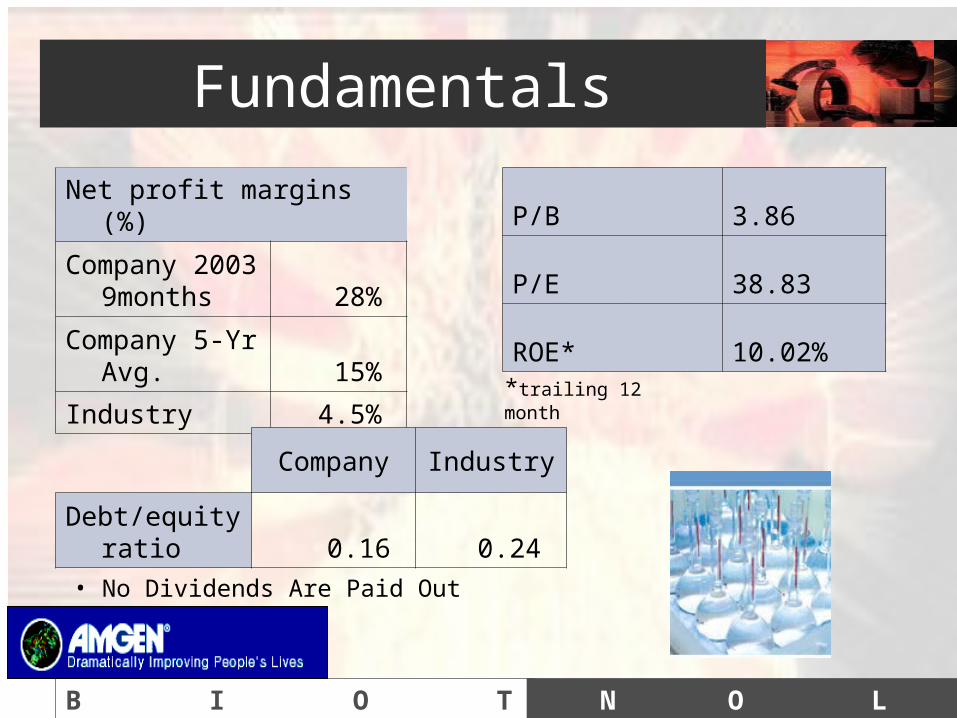
Fundamentals
Net profit margins (%)
Company 2003 9months 28%
Company 5-Yr Avg. 15%
Industry 4.5%
Company Industry
Debt/equity ratio 0.16 0.24
• No Dividends Are Paid Out
P/B 3.86
P/E 38.83
ROE* 10.02%*trailing 12 month

B I O T E C H
N O L O G Y
Cash
2002 2001 2000
CFO 2248.80 1480.20 1634.60
-FCInv 2167.60 441.80 437.70
+ Net Borrow 2824.70 0.00 0.00
FCFE 2905.90 1038.40 1196.90
Cash and Cash Equivalents 3rd Q $5025 Mil
Plans to spend between $1.3 and $1.5 billion in 2003.
B I O T E C H
N O L O G Y
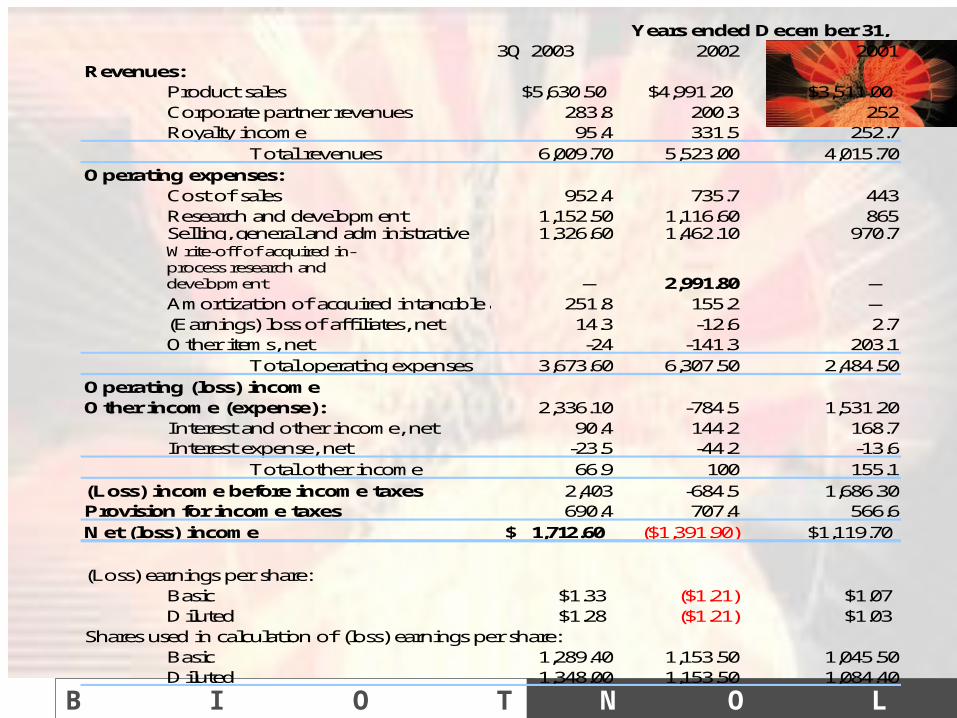
3Q 2003 2002 2001Revenues:
Product sales $5,630.50 $4,991.20 $3,511.00Corporate partner revenues 283.8 200.3 252Royalty income 95.4 331.5 252.7
Total revenues 6,009.70 5,523.00 4,015.70Operating expenses:
Cost of sales 952.4 735.7 443Research and development 1,152.50 1,116.60 865Selling, general and administrative 1,326.60 1,462.10 970.7
— 2,991.80 — Amortization of acquired intangible assets 251.8 155.2 — (Earnings) loss of affiliates, net 14.3 -12.6 2.7Other items, net -24 -141.3 203.1
Total operating expenses 3,673.60 6,307.50 2,484.50Operating (loss) income Other income (expense): 2,336.10 -784.5 1,531.20
Interest and other income, net 90.4 144.2 168.7Interest expense, net -23.5 -44.2 -13.6
Total other income 66.9 100 155.1(Loss) income before income taxes 2,403 -684.5 1,686.30Provision for income taxes 690.4 707.4 566.6Net (loss) income 1,712.60$ ($1,391.90) $1,119.70
(Loss) earnings per share:Basic $1.33 ($1.21) $1.07Diluted $1.28 ($1.21) $1.03
Shares used in calculation of (loss) earnings per share:Basic 1,289.40 1,153.50 1,045.50Diluted 1,348.00 1,153.50 1,084.40
Write-off of acquired in-process research and development
Years ended December 31,
B I O T E C H
N O L O G Y
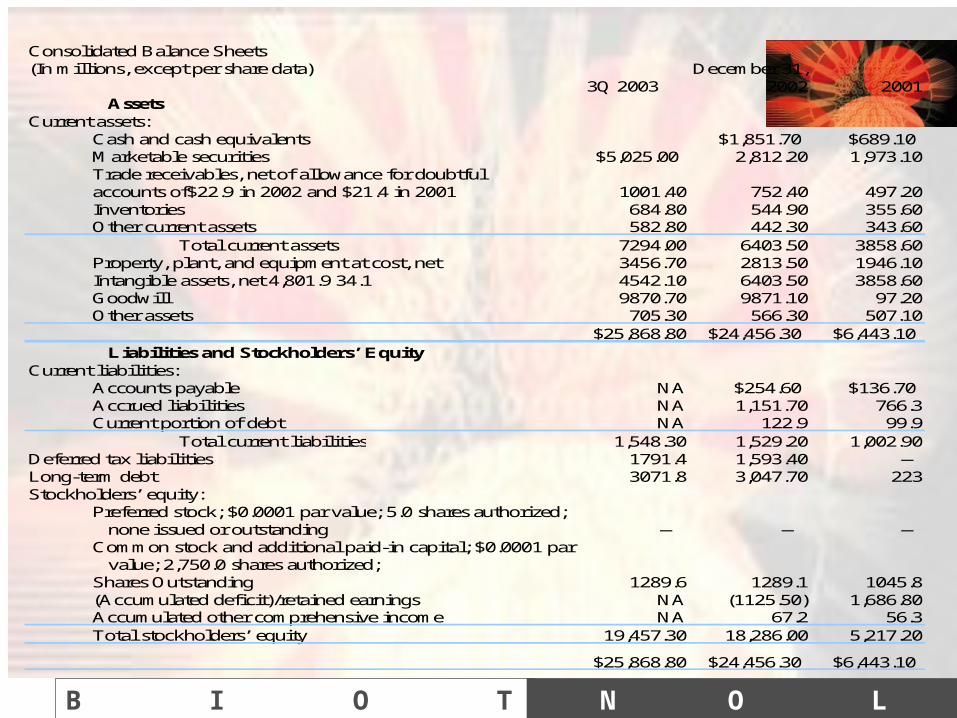
Consolidated Balance Sheets(In millions, except per share data) December 31,
3Q 2003 2002 2001 Assets
Current assets:Cash and cash equivalents $1,851.70 $689.10Marketable securities 2,812.20 1,973.10Trade receivables, net of allowance for doubtfulaccounts of$22.9 in 2002 and $21.4 in 2001 1001.40 752.40 497.20Inventories 684.80 544.90 355.60Other current assets 582.80 442.30 343.60
Total current assets 7294.00 6403.50 3858.60Property, plant, and equipment at cost, net 3456.70 2813.50 1946.10Intangible assets, net 4,801.9 34.1 4542.10 6403.50 3858.60Goodwill 9870.70 9871.10 97.20Other assets 705.30 566.30 507.10
$25,868.80 $24,456.30 $6,443.10 Liabilities and Stockholders’ Equity
Current liabilities:Accounts payable NA $254.60 $136.70Accrued liabilities NA 1,151.70 766.3Current portion of debt NA 122.9 99.9
Total current liabilities 1,548.30 1,529.20 1,002.90Deferred tax liabilities 1791.4 1,593.40 —Long-term debt 3071.8 3,047.70 223Stockholders’ equity:
Preferred stock; $0.0001 par value; 5.0 shares authorized; none issued or outstanding — — —Common stock and additional paid-in capital; $0.0001 par value; 2,750.0 shares authorized; Shares Outstanding 1289.6 1289.1 1045.8(Accumulated deficit)/retained earnings NA (1125.50) 1,686.80Accumulated other comprehensive income NA 67.2 56.3Total stockholders’ equity 19,457.30 18,286.00 5,217.20
$25,868.80 $24,456.30 $6,443.10
$5,025.00
B I O T E C H
N O L O G Y
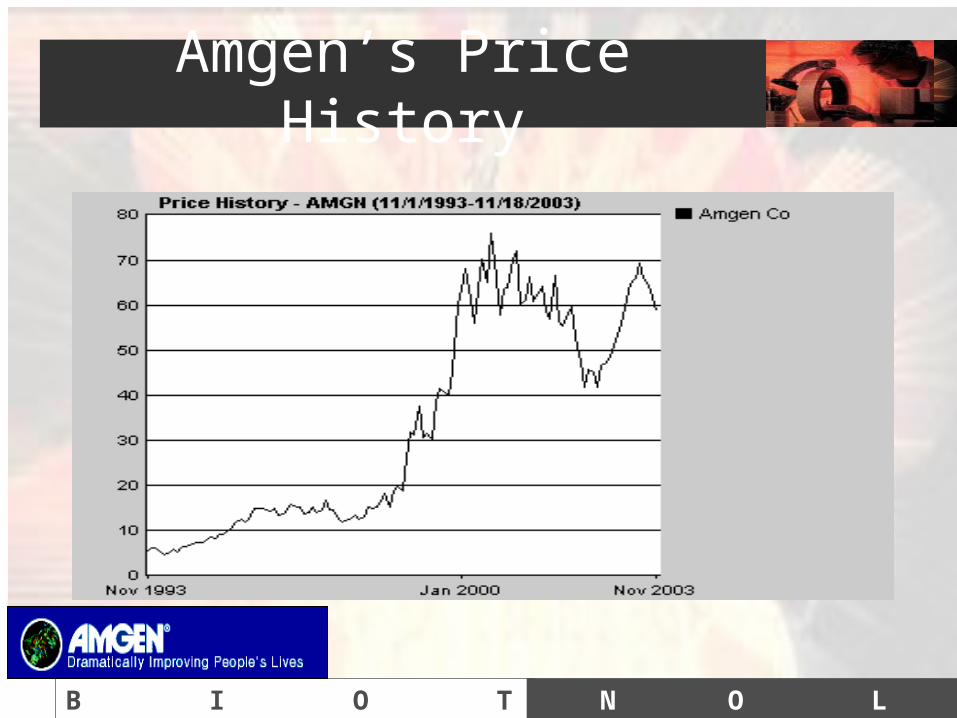
Amgen’s Price History

B I O T E C H
N O L O G Y
Amgen vs. Nasdaq Biotech
B I O T E C H
N O L O G Y
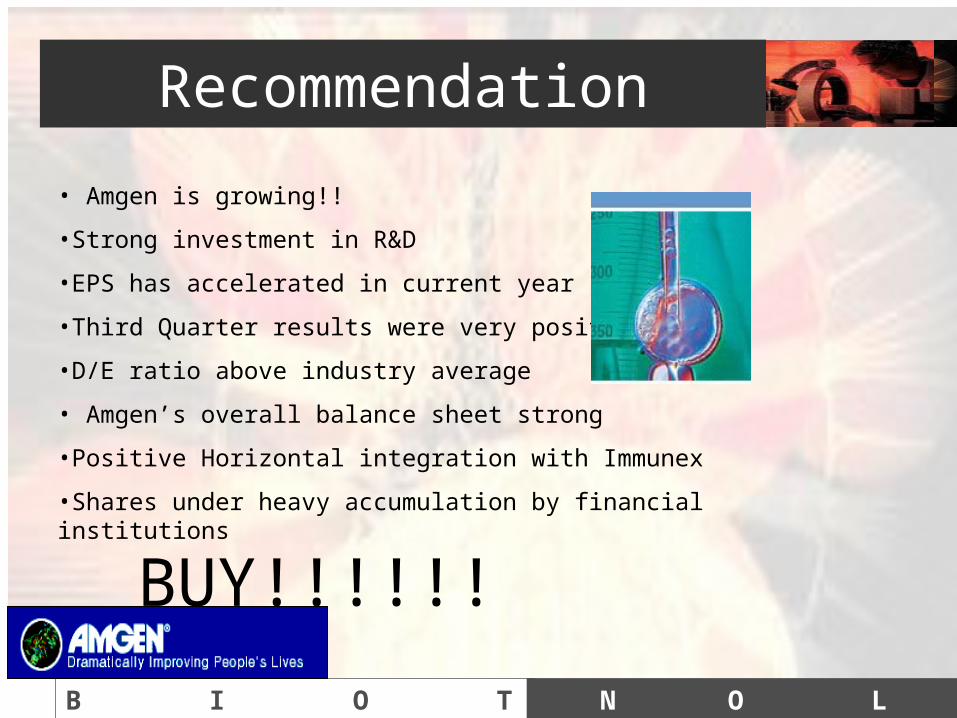
Recommendation
• Amgen is growing!!
•Strong investment in R&D
•EPS has accelerated in current year
•Third Quarter results were very positive
•D/E ratio above industry average
• Amgen’s overall balance sheet strong
•Positive Horizontal integration with Immunex
•Shares under heavy accumulation by financial institutions
BUY!!!!!!

B I O T E C H
N O L O G Y

B I O T E C H
N O L O G Y
Protein Design Lab (PDL)
About PDL
• Located in Fremont, CA
• Ticker is – PDLi – on the NASDQ
• Employ’s roughly 460 people
• 108 R&D, 90 in Clinical/Preclinical trials
• Current Price opening on Friday Nov. 21st
• $13.17
B I O T E C H
N O L O G Y
PDL…..
Protein Design Labs, Inc. is a leader in the development of humanized monoclonal antibodies to treat various disease conditions.
Currently have antibodies in clinical development for:
autoimmune
inflammatory conditions,
asthma and cancer.
B I O T E C H
N O L O G Y
Board of Directors• Laurence Jay Korn, Ph.D.
ChairmanProtein Design Labs, Inc.
• Karen A. DawesPrincipalKnowledgeable Decisions, LLC
• Jürgen Drews, M.D.Director Protein Design Labs, Inc.
• L. Patrick Gage, Ph.D.Director Protein Design Labs, Inc.
• George M. Gould, Esq.Of CounselGibbons, Del Deo, Dolan,Griffinger & Vecchione
• Max Link, Ph.D.DirectorProtein Design Labs, Inc.
• Mark McDadeChief Executive OfficerProtein Design Labs, Inc.
• Cary L. Queen, Ph.D.Senior Vice PresidentProtein Design Labs, Inc.
• Jon S. Saxe, Esq.PresidentSaxe Associates

B I O T E C H
N O L O G Y
Core Technology
• Monoclonal antibody is PDL's core technology.
• Monoclonal antibodies are identical proteins that bind specifically to a receptor or other target on the surface of cells in order to produce a desired therapeutic effect. For a variety of technical reasons, many monoclonal antibodies are initially developed in mice

B I O T E C H
N O L O G Y
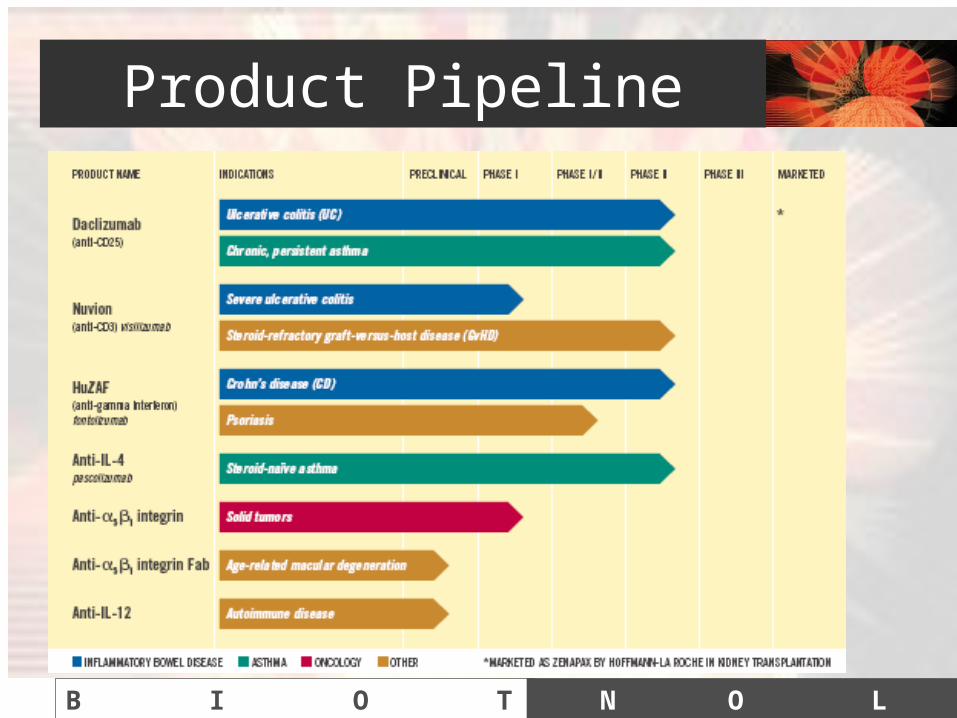
Products
• Developing over 40 cancer and autoimmune antibodies
• Primary focus in 2003 will be their portfolio of 3 main antibodies
– Inflamatory bowel disease
– Treatment of asthma
– Solid tumor – Colitis
B I O T E C H
N O L O G Y
Product Pipeline
B I O T E C H
N O L O G Y
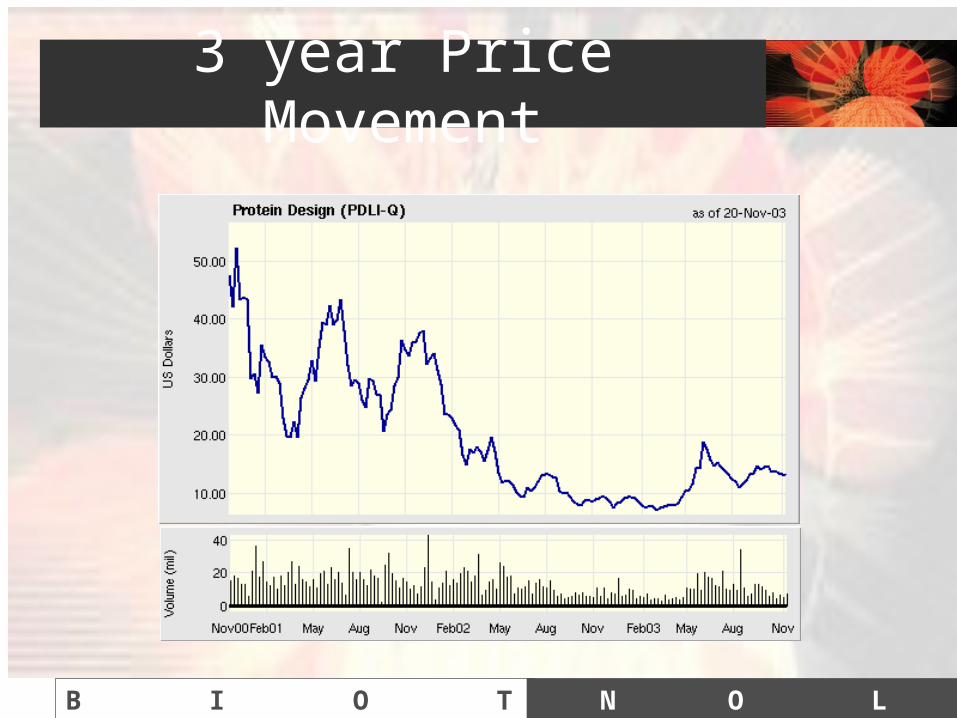
3 year Price Movement
B I O T E C H
N O L O G Y
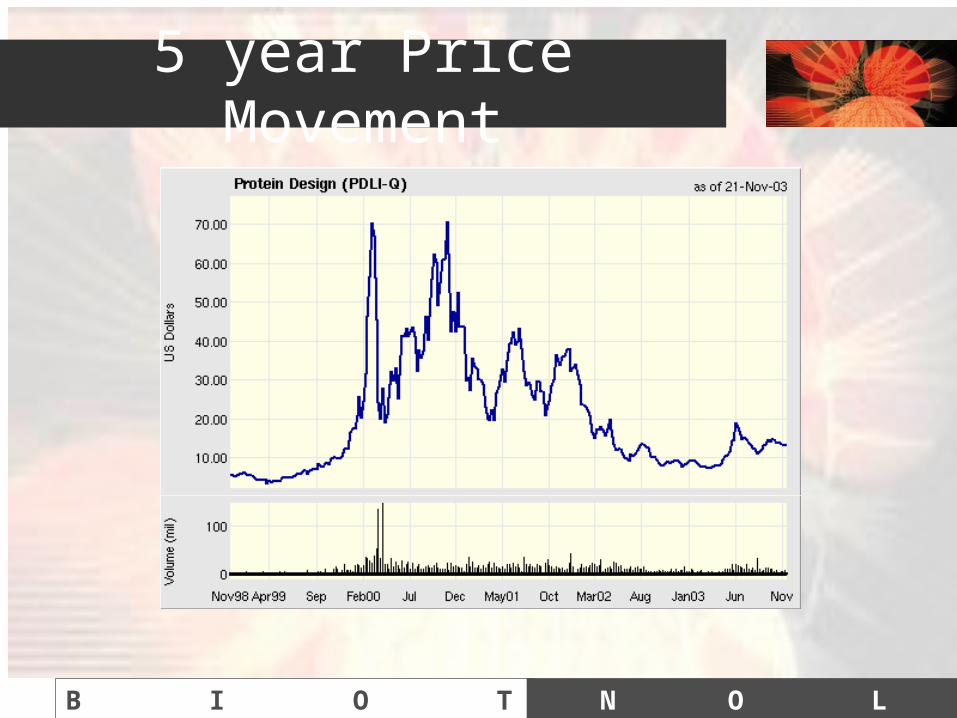
5 year Price Movement
B I O T E C H
N O L O G Y
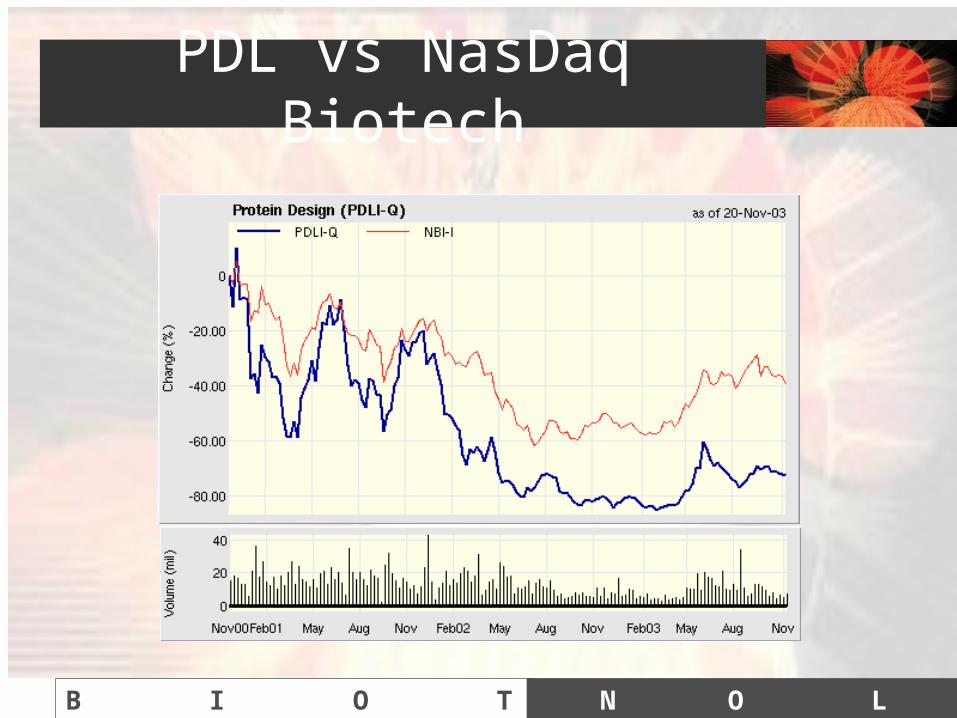
PDL vs NasDaq Biotech
B I O T E C H
N O L O G Y
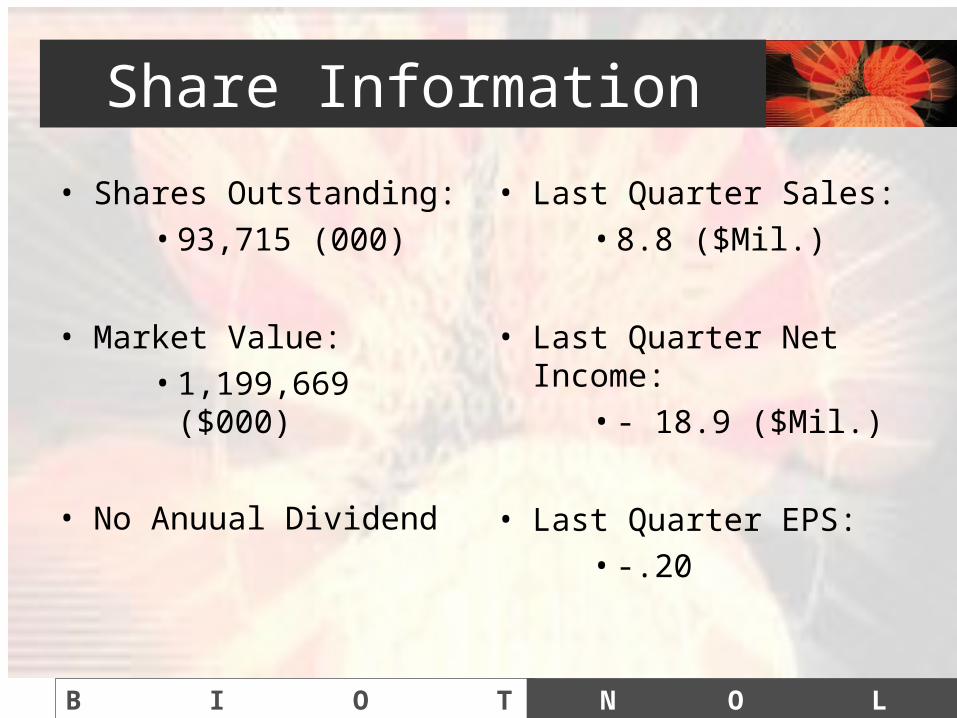
Share Information
• Shares Outstanding: • 93,715 (000)
• Market Value: • 1,199,669 ($000)
• No Anuual Dividend
• Last Quarter Sales: • 8.8 ($Mil.)
• Last Quarter Net Income:
• - 18.9 ($Mil.)
• Last Quarter EPS: • -.20
B I O T E C H
N O L O G Y
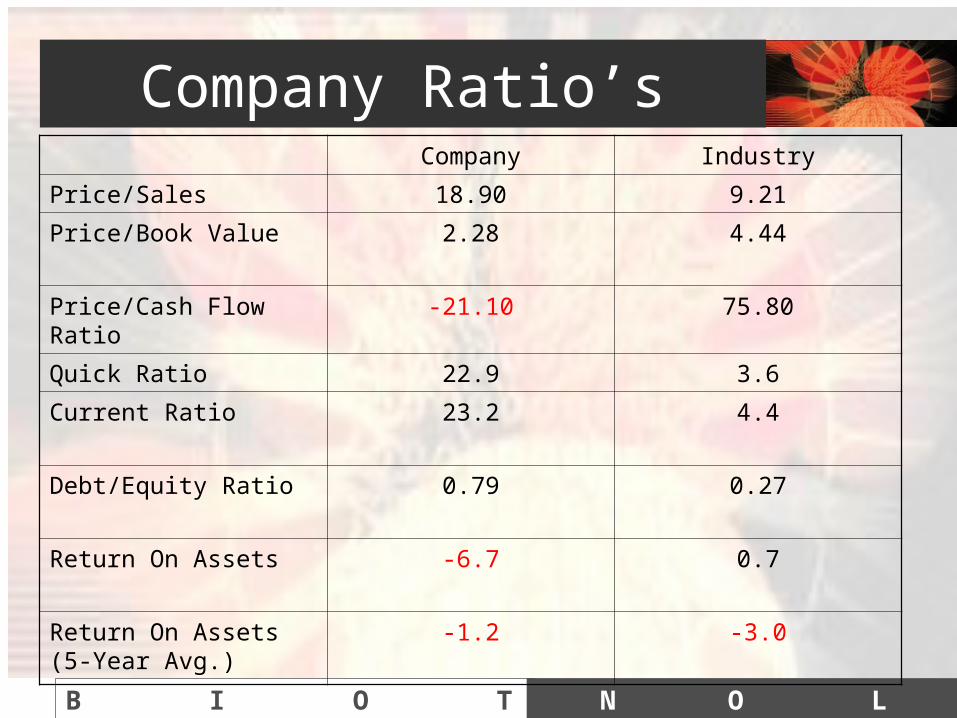
Company Ratio’sCompany Industry
Price/Sales 18.90 9.21
Price/Book Value 2.28 4.44
Price/Cash Flow Ratio -21.10 75.80
Quick Ratio 22.9 3.6
Current Ratio 23.2 4.4
Debt/Equity Ratio 0.79 0.27
Return On Assets -6.7 0.7
Return On Assets (5-Year Avg.)
-1.2 -3.0
B I O T E C H
N O L O G Y
B I O T E C H
N O L O G Y

B I O T E C H
N O L O G Y

B I O T E C H
N O L O G Y
Cash Burn Analysis
• Avg # of years from Preclinical to market = 10 years
• Avg cost to bring a product through all stages= $800,000,000
B I O T E C H
N O L O G Y
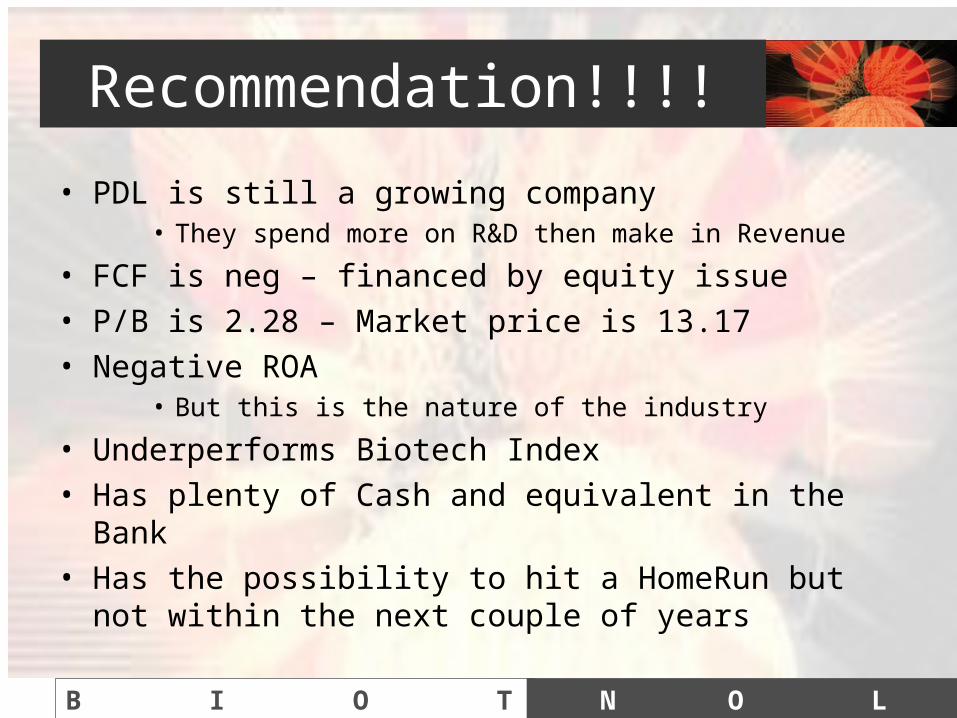
Recommendation!!!!
• PDL is still a growing company• They spend more on R&D then make in Revenue
• FCF is neg – financed by equity issue• P/B is 2.28 – Market price is 13.17• Negative ROA
• But this is the nature of the industry
• Underperforms Biotech Index• Has plenty of Cash and equivalent in the Bank• Has the possibility to hit a HomeRun but not within the
next couple of years
B I O T E C H
N O L O G Y
What should you Do?
DON’T BUY !!!!!-there are better Biotech companies, as we’ve seen
B I O T E C H
N O L O G Y
Questions
?????????????
B I O T E C H
N O L O G Y
B I O T E C H
N O L O G Y
Security Facts• Symbol: DNA• Traded on: New York Stock Exchange
(NYSE)• Trading history:
– Oct. 14, 1980• 1 million shares offered at $35.00 on NASDAQ (symbol
GENE)• Share price $35 →$88 within an hour $35m profit• Largest stock run-ups ever
– 1999• Began to trade on NYSE under symbol DNA

B I O T E C H
N O L O G Y
Company Highlights
• World’s 2nd largest biotechnology company• The first biotechnology venture, founded in 1976• Two founders:
Robert A. Swanson—Venture Capitalist
Herbert W. Boyer ----Biochemist
•Cohen-Boyer’s patent
•Dr. Boyer and his colleague, Cohen, have published the world-first report on “recombinant DNA technology” in 1973
B I O T E C H
N O L O G Y
Company Highlights (cont’d)
• Year 1980: went public– Successfully raised $35 million for Genentech.
• Year 1990: – Acquired by Roche Holding (Switzerland)
• Now:– Healthy growth for 27 years with 5,252 employees and
12 marketed products – 5X5 goal expected to be achieved by 2005– Carrying diverse product portfolio
B I O T E C H
N O L O G Y
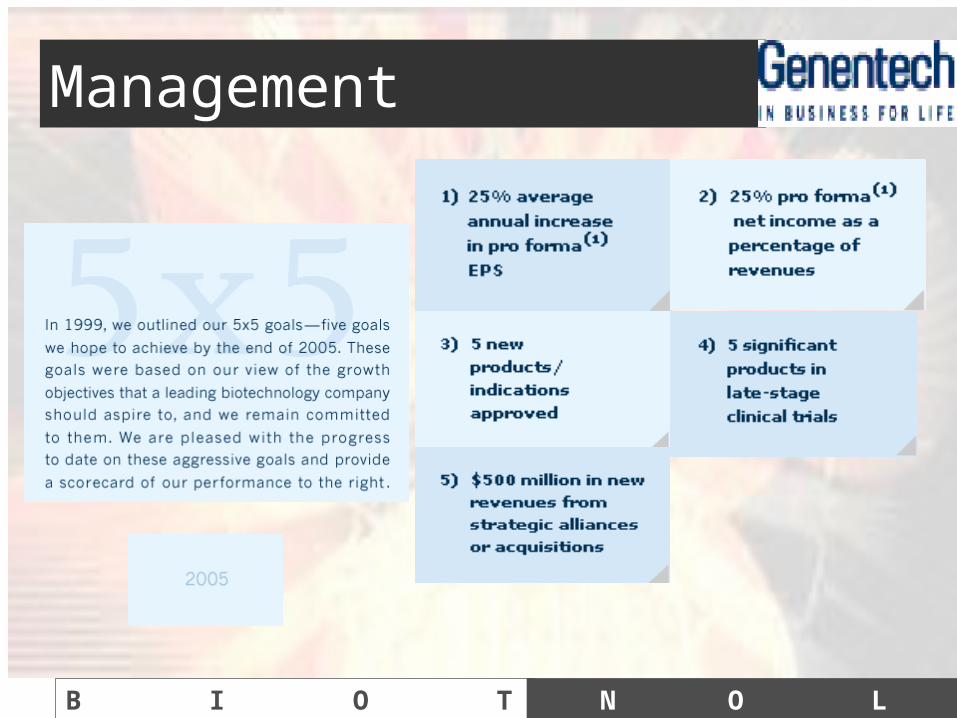
Management
B I O T E C H
N O L O G Y
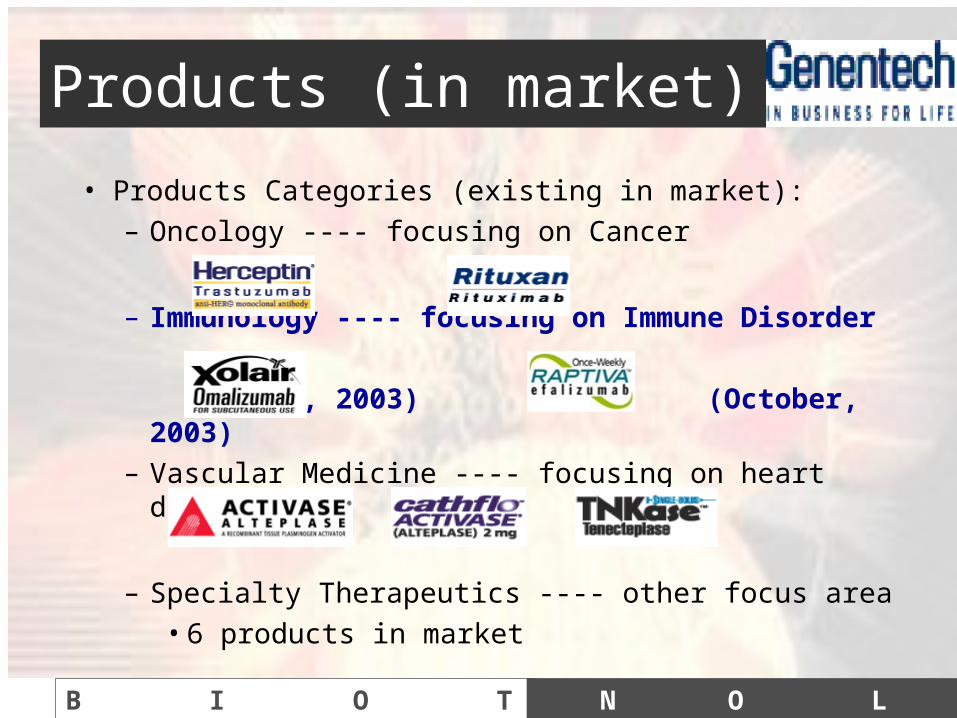
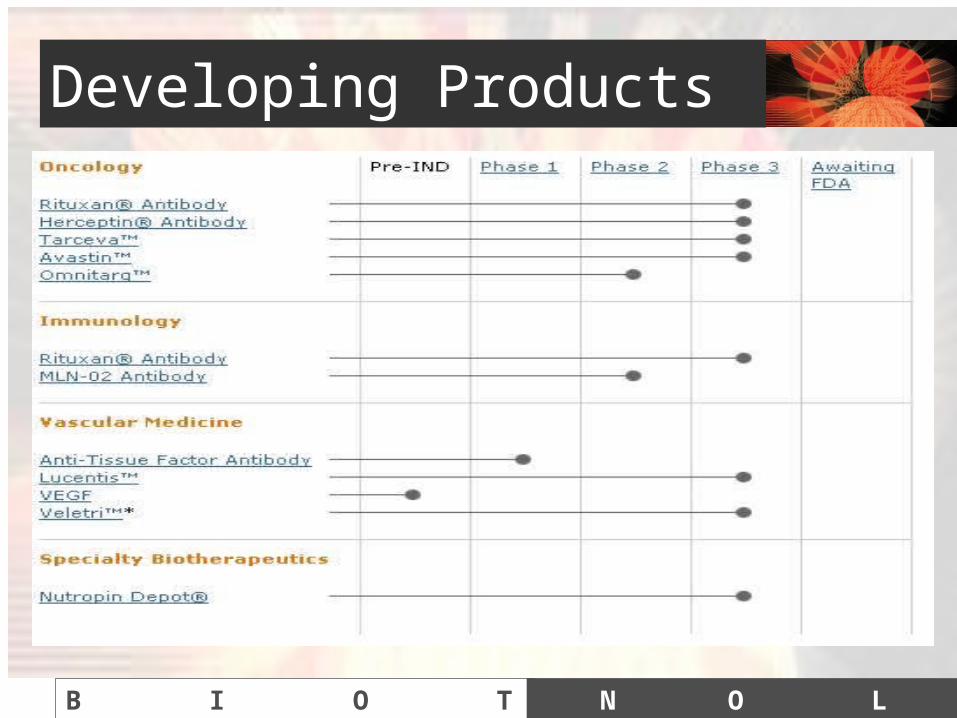
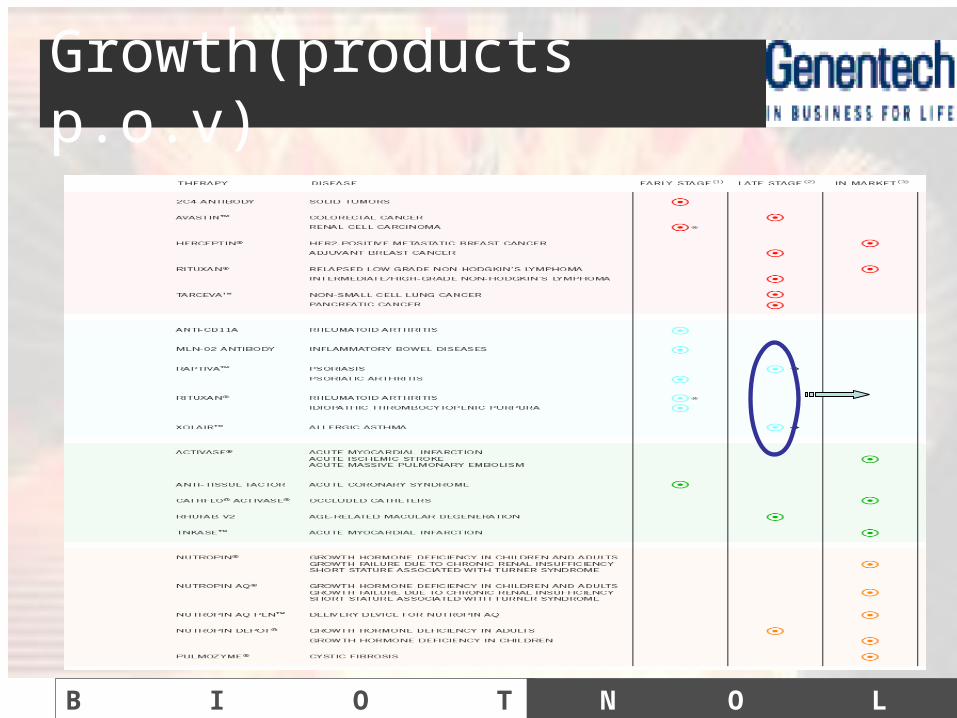
Products (in market)
• Products Categories (existing in market):– Oncology ---- focusing on Cancer
– Immunology ---- focusing on Immune Disorder
(June, 2003) (October, 2003)
– Vascular Medicine ---- focusing on heart disease
– Specialty Therapeutics ---- other focus area• 6 products in market
B I O T E C H
N O L O G Y
Developing Products

B I O T E C H
N O L O G Y
Products (cont’d)
54%
18%
14%
8%
6% Rituxan
Herceptin
Growth Hormone
Thrombolytig
Pulmozyme
Other
B I O T E C H
N O L O G Y
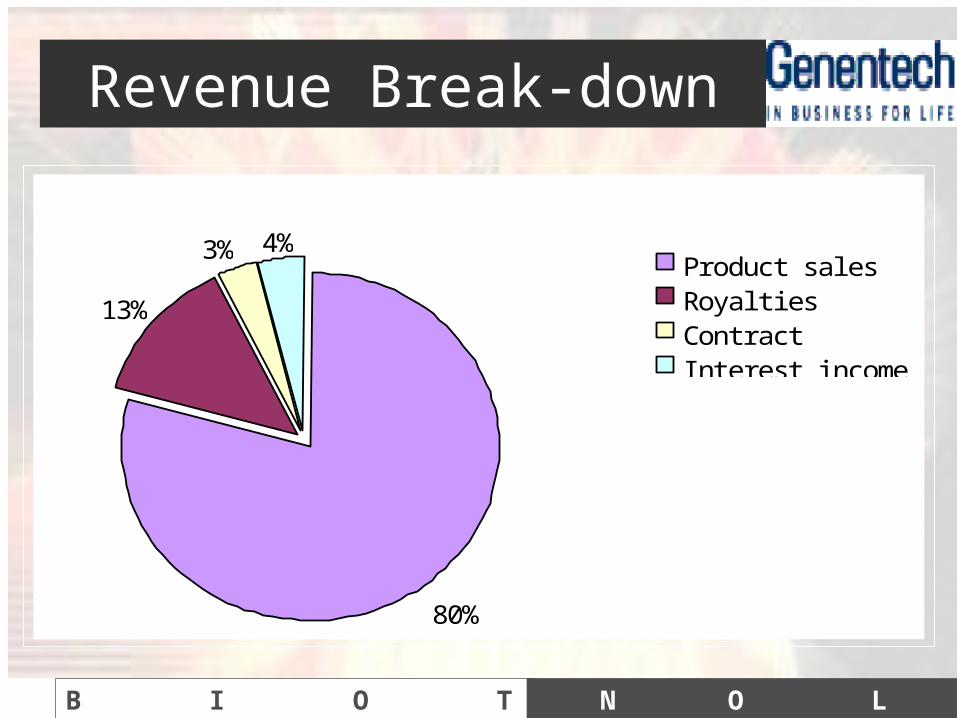
Revenue Break-down
80%
13%
3% 4%Product sal esRoyal t i esCont ract I nterest i ncome

B I O T E C H
N O L O G Y
Financial Analysis Tour
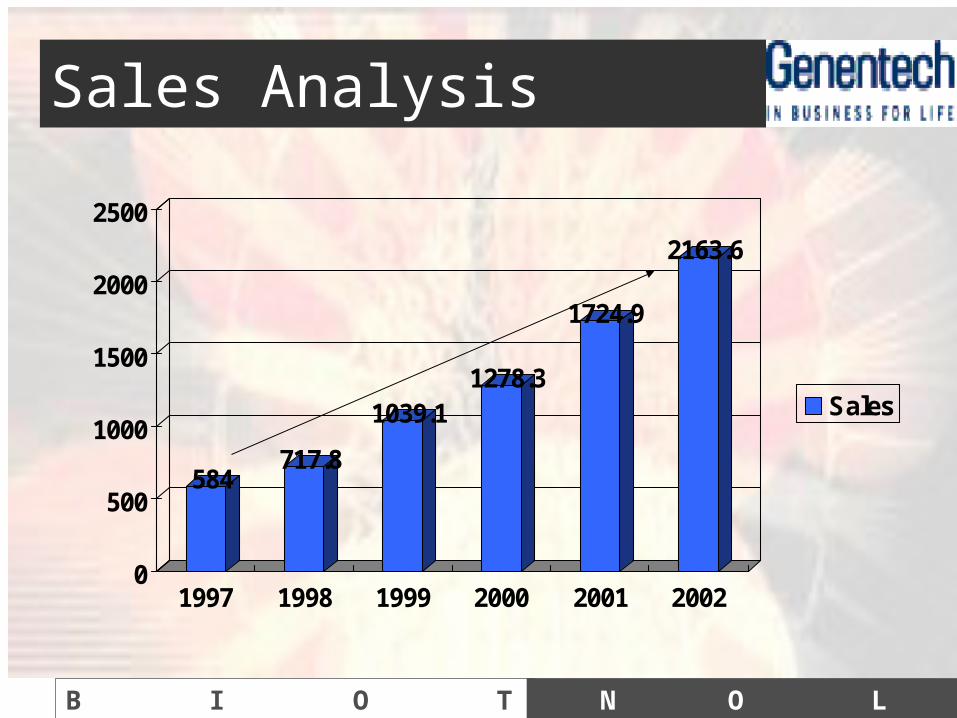
• Income Statement– Total revenue is $2,719.3– Sales growth is 21.01%– Net profit margin = 2.8% (higher than the industry
average)– High depreciation cost– Big gap between year 2001 and 2002
• Due to repurchase of Capital stock
B I O T E C H
N O L O G Y
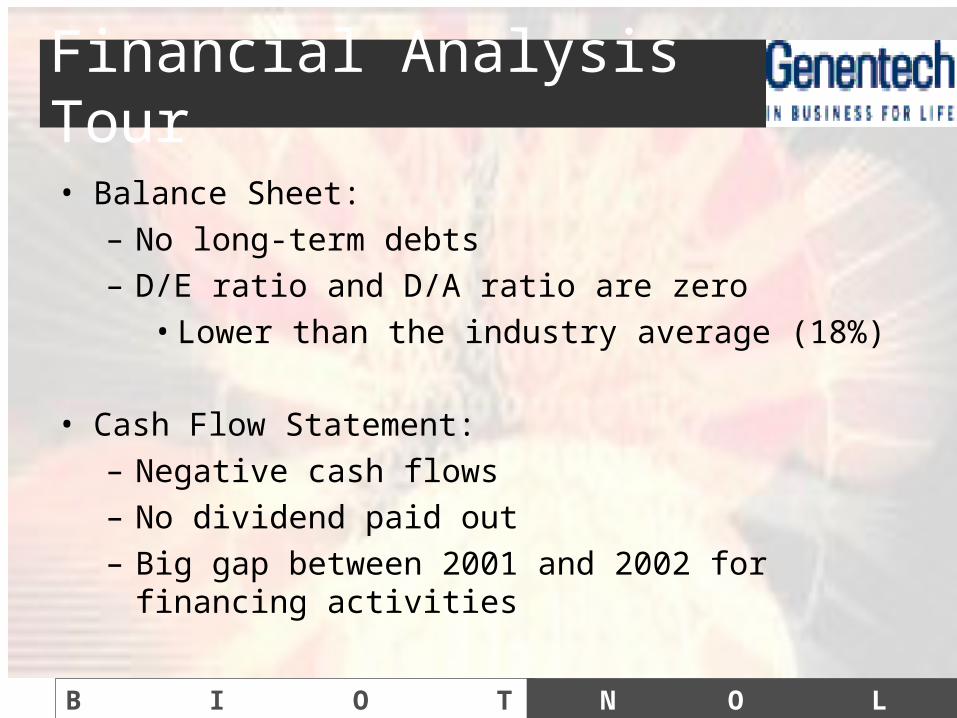
Financial Analysis Tour
• Balance Sheet:– No long-term debts– D/E ratio and D/A ratio are zero
• Lower than the industry average (18%)
• Cash Flow Statement:– Negative cash flows– No dividend paid out– Big gap between 2001 and 2002 for financing
activities

B I O T E C H
N O L O G Y
Stock Analysis
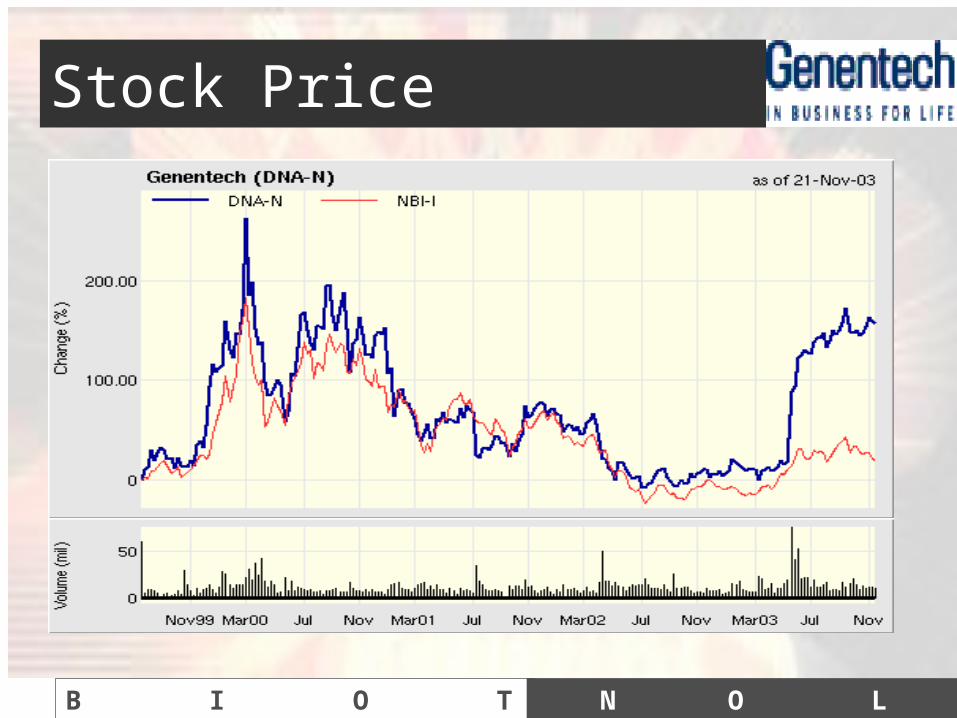
• Symbol: DNA• Current Price: $82.66 (close price on Nov. 21)
• Number of outstanding Shares: 514.69million• Book value per share: $10.37
B I O T E C H
N O L O G Y
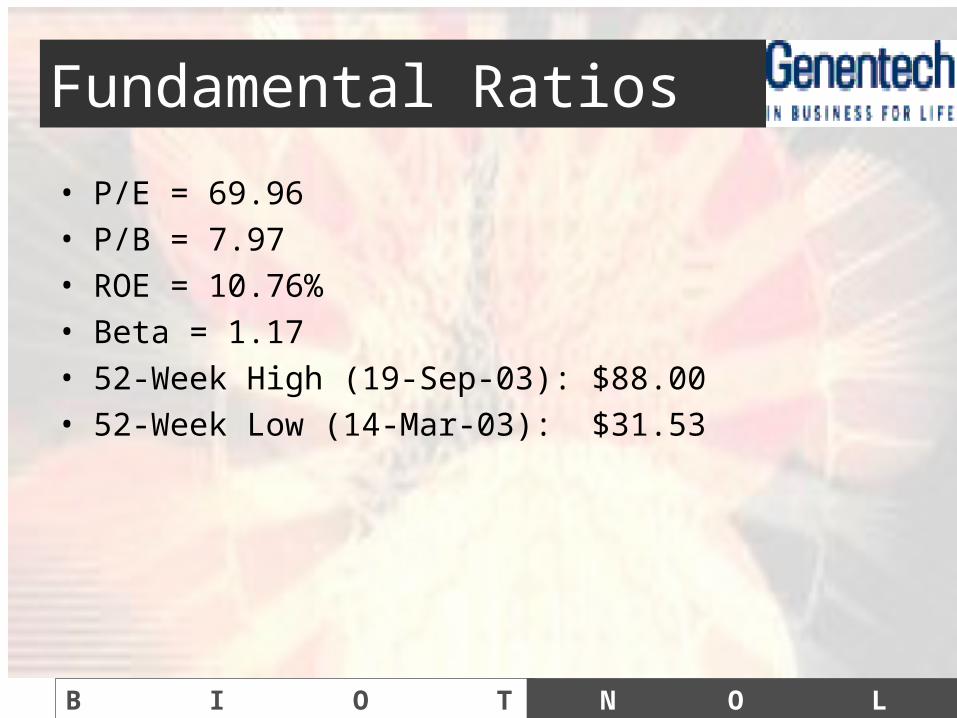
Fundamental Ratios
• P/E = 69.96• P/B = 7.97• ROE = 10.76%• Beta = 1.17• 52-Week High (19-Sep-03): $88.00• 52-Week Low (14-Mar-03): $31.53
B I O T E C H
N O L O G Y
Stock Price

B I O T E C H
N O L O G Y
Valuation
• No dividend paid – DDM does not work
• Always get (-) Cash Flow– FCF analysis ?
• Suitable method: Cash Burn Model– cash burn rate assessment
B I O T E C H
N O L O G Y
Cash Burn Rate
• Cash burn rate permits a length of time before additional financing, usually another equity issue, is required.
• Genentech’s research and development cost are only 1/3 of its revenue. The increase in revenue is double the increase in R&D expenses. ---- It is a good trend.
• Genentech’s diverse product portfolio ensure it has the biotech industry’s most extensive track record in all phases of the long and resource-intensive process of bringing new disease treatments to patients.
B I O T E C H
N O L O G Y
Growth(products p.o.v)
B I O T E C H
N O L O G Y
Sales Analysis
584717.8
1039.11278.3
1724.9
2163.6
0
500
1000
1500
2000
2500
1997 1998 1999 2000 2001 2002
Sales

B I O T E C H
N O L O G Y
Research & Development Cost
470.9396.2 367.3
489.9 526.2623.5
0100200300400
500600700800900
1000
1997 1998 1999 2000 2001 2002
Costs (R&D andCOG)
B I O T E C H
N O L O G Y
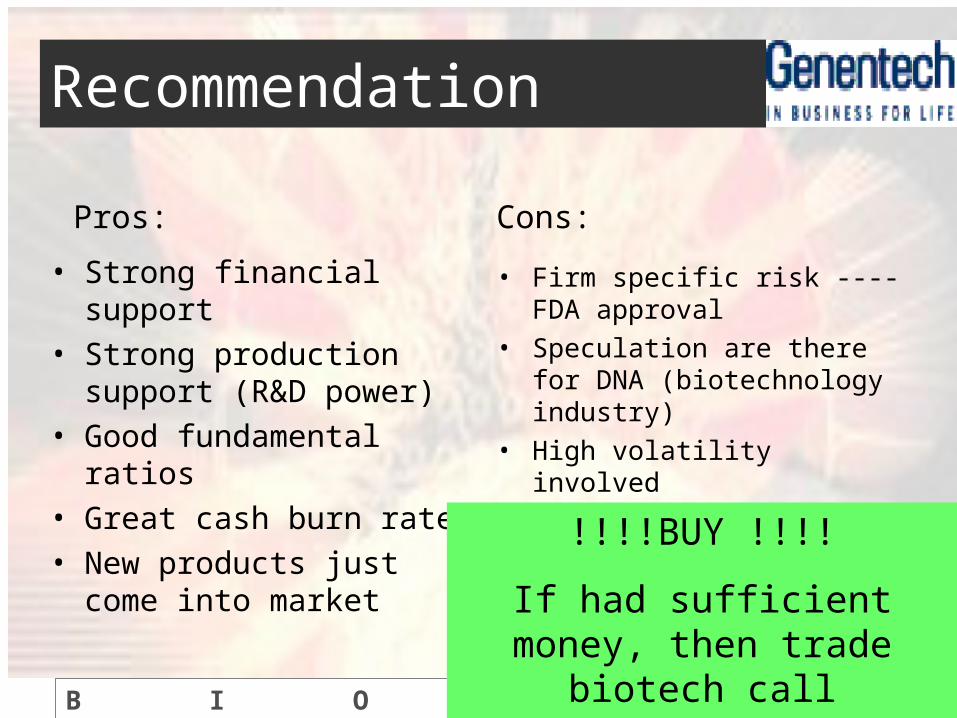
Recommendation
• Strong financial support• Strong production support
(R&D power)• Good fundamental ratios• Great cash burn rate• New products just come
into market
• Firm specific risk ---- FDA approval
• Speculation are there for DNA (biotechnology industry)
• High volatility involved
Pros: Cons:
!!!!BUY !!!!
If had sufficient money, then trade biotech call options!!!