b-ibi restoration decision framework and site identification
TRANSCRIPT

B-IBI Restoration Decision Framework and Site
Identification
July 30, 2014
Alternate Formats Available
B-IBI Restoration Decision Framework and Site Identification
Prepared for:
The State Of Washington Department of Ecology Interagency Agreement No. C1300210
Submitted by:
Jo Opdyke Wilhelm (Project Manager) Debra Bouchard Chris Gregersen Chris Knutson Kate Macneale King County Water and Land Resources Division Department of Natural Resources and Parks

B-IBI Restoration Decision Framework and Site Identification
King County i July 2014
Publication Information
This project has been funded wholly or in part by the United States Environmental Protection Agency (EPA) under Puget Sound Ecosystem Restoration and Protection Cooperative Agreement Grant PC-00J20101 with Washington Department of Ecology (Ecology). The funding comes by means of a grant administered by Ecology (Interagency Agreement No. C1300210). The final report will be available on request from King County and Ecology and will also be available for download on the Puget Sound Stream Benthos (PSSB) website1. The contents of this document do not necessarily reflect the views and policies of the EPA, nor does mention of trade names or commercial products constitute endorsement or recommendation for use.
Acknowledgements
We thank the EPA and Ecology for supporting this project via federal EPA pass through funds to King County from the Washington State Department of Ecology as part of the Puget Sound Action Agenda: Ecosystem Restoration and Protection. We thank Peter Leinenbach, US EPA Region 10 and Ken Rauscher, King County DNRP for their help generating GIS data for each sampling site including watershed delineation and land use/land cover calculations. We thank Gino Lucchetti, King County DNRP for his big picture thinking, brainstorming, and technical advice. We thank Colin Hume, Stephen Stanley, Susan Grigsby, and Kelly Slattery of Ecology for helping us determine how to incorporate the Puget Sound Watershed Characterization and for their excellent work and patience running the models multiple times. We thank Elene Dorfmeier, King County DNRP for her statistical expertise and R code abilities that derived the 90th quantile regression line for the biological potential calculations. We thank the wonderful Puget Sound area stakeholders who have contributed their ideas, time, and suggestions to this project. We thank Tom Ventur for his attention to detail during final editing and formatting of this document. And finally we thank Doug Howie, Colin Hume, Tom Gries (Ecology), Leska Fore (PSP), Gretchen Hayslip (EPA), Kate O’Laughlin, Jim Simmonds, Gino Lucchetti, Scott Stolnack (King County DNRP), and Mindy Fohn (Kitsap County) for their insightful comments and suggestions in reviewing an early draft of this document.
1 Reports, presentations, and relevant documents are available on the Restoration Priorities project page of the PSSB: http://pugetsoundstreambenthos.org/Projects/Restoration-Priorities-2014.aspx. See Appendix A.

B-IBI Restoration Decision Framework and Site Identification
King County ii July 2014
Contact Information
Jo Wilhelm King County Water and Land Resources Division 201 South Jackson Street, Suite 600 Seattle, WA 98104-3855 206-477-4849 [email protected]
Citation
King County. 2014. B-IBI Restoration Decision Framework and Site Identification. Prepared by Jo Opdyke Wilhelm, Debra Bouchard, Chris Gregersen, Chris Knutson, and Kate Macneale. Water and Land Resources Division. Seattle, Washington.

B-IBI Restoration Decision Framework and Site Identification
King County iii July 2014
Table of Contents
Executive Summary.............................................................................................................................................. v
1.0 Background ............................................................................................................................................... 1
1.1 Introduction ......................................................................................................................................... 1
1.2 Macroinvertebrate Data Sources ................................................................................................. 2
1.3 Landscape Analysis ........................................................................................................................... 2
1.4 Stakeholder Workshop .................................................................................................................... 3
2.0 Restoration Literature .......................................................................................................................... 4
3.0 Restoration Decision Framework: Filtering Criteria ................................................................ 7
3.1 Median B-IBI Score: “Fair” .............................................................................................................. 7
3.2 Ecoregion: Puget Lowland .............................................................................................................. 8
3.3 Sampling History: N>2 & recent or N>4 .................................................................................... 9
3.4 Watershed Area: 200-3000 Acres .............................................................................................10
3.5 Puget Sound Watershed Characterization Water Flow Processes Model ..................11
3.6 Filtering Criteria Summary ..........................................................................................................12
4.0 Restoration Decision Framework: Ranking Criterion ............................................................13
4.1 Understanding Biological Potential ..........................................................................................13
4.2 Ranking Sites Based on Biological Potential .........................................................................15
5.0 Site Selection ..........................................................................................................................................17
6.0 Conclusions and Next Steps ..............................................................................................................23
6.1 Other Factors Considered .............................................................................................................23
6.2 Next Steps ...........................................................................................................................................24
7.0 Literature Cited .....................................................................................................................................25
Appendices ............................................................................................................................................................32
Appendix A: PSSB Project Web Page ......................................................................................................33
Appendix B: B-IBI10-50 vs. B-IBI0-100 .........................................................................................................34
Appendix C: QA/QC of B-IBI Data ............................................................................................................36
Appendix D: B-IBI Biological Condition Categories ..........................................................................37
Appendix E: QA/QC of Watershed Delineations ................................................................................38
Appendix F: Stakeholder Workshop Agenda .......................................................................................42
Appendix G: Stakeholder Feedback Exercise ......................................................................................43
Appendix H: Restoration Literature Consulted ..................................................................................44

B-IBI Restoration Decision Framework and Site Identification
King County iv July 2014
Figures
Figure 1. Level III ecoregions of the Puget Sound drainage basin. .............................................. 8
Figure 2. PSWC management matrix. ....................................................................................................12
Figure 3. Observed biological potential. ..............................................................................................13
Figure 4. Scoring biological potential. ...................................................................................................14
Figure 5. Plot of the biological potential (black 90th quantile regression line) relative to “fair” and “good” B-IBI categories. .................................................................................15
Figure 6. Distribution of selected sites by percent watershed urbanization.........................16
Figure 7. Conceptual diagram of the restoration decision framework. ...................................17
Figure 8. Residuals for the 59 filtered “fair” sites were calculated by subtracting the 90th percentile B-IBI score for a given watershed urbanization from the observed B-IBI score. ...............................................................................................................18
Figure 9. Location of the top 30 “fair” sites (green dots) after applying the restoration decision framework criteria. .........................................................................22
Tables
Restoration Decision Framework summary table. ......................................................... 7 Table 1.
Rank ordered list of the top 59 sites remaining after applying the Table 2.restoration decision framework. .........................................................................................19
The WRIA location for the top sites prioritized for restoration strategy Table 3.development. ...............................................................................................................................21
The agency responsible for data collection for the top sites prioritized for Table 4.restoration strategy development.......................................................................................21

B-IBI Restoration Decision Framework and Site Identification
King County v July 2014
EXECUTIVE SUMMARY
The overall goal of Washington State’s Puget Sound Partnership (PSP) is to restore Puget Sound. This project implements priority work consistent with the PSP Action Agenda for the protection and restoration of Puget Sound by addressing the PSP’s Ecosystem Recovery Target for freshwater benthic macroinvertebrates. Macroinvertebrates play a crucial role in stream ecosystems and are good indicators of ecological health. The multimetric Puget Lowland Benthic Index of Biotic Integrity (B-IBI) is a standardized scoring system applied to samples of benthic macroinvertebrates collected from streams and is currently used by over 20 cities, counties, tribes and state and federal agencies in their assessment of streams in the Puget Sound Basin. The PSP has two ecosystem recovery targets related to freshwater benthic macroinvertebrates: one involves preserving all streams with “excellent” B-IBI scores and the second calls for restoring 30 streams with “fair” B-IBI scores. This report addresses the second target, specifically applying a decision framework to identify and prioritize the top 30 drainages with the greatest potential to see B-IBI scores raised from “fair” to “good” with the application of appropriate management, restoration, and/or conservation activities. This report is part of a larger project funded by the Washington State Department of Ecology to develop strategies to address the two stream benthic macroinvertebrate targets. The restoration decision framework is based on widely available landscape data and simple calculations, and it is intended to be simple, transparent, and updatable with new information. The framework consists of five criteria that were used to filter sites, so that the remaining sites could be ranked. These filtering criteria include median B-IBI score, ecoregion, sampling history, watershed area, and the Puget Sound Watershed Characterization water flow model, and the rationale for each is described in section 2.0. These five filters define conditions for “fair” B-IBI sites to ensure that sites selected for restoration activities (1) have minimal inherent variability in response to natural factors, (2) have reliable B-IBI condition categorization (e.g., good data quality/recent sampling history), (3) are a size that is tractable, i.e., a scale at which change can be effectively tracked, measured and related to local and watershed scale conditions, and (4) are considered hydrologically important without already being completely degraded. The filtering criteria were applied to the current list of sites (n=1053) within Puget Sound for which we have benthic macroinvertebrate data as well as accurate watershed delineations. By applying the five filters, the number of sites under consideration was reduced to 59. With the filtering complete, a single criterion (biological potential) was applied to order and prioritize the remaining 59 sites and identify the top 30. Observed biological potential describes the upper limit of biological condition based on watershed urbanization. B-IBI scores furthest below their presumed “attainable” potential theoretically have the capacity for more biological lift and were ranked highest to ensure allocation of limited management resources towards sites with the greatest capacity for improvement. The concept of biological potential and the rationale for its inclusion are described in more detail in section 3.0.

B-IBI Restoration Decision Framework and Site Identification
King County vi July 2014
This restoration decision framework provides an approach for identifying sites for future restoration actions based on B-IBI scores. The framework includes criteria that have been identified as being important in recent scientific reviews regarding restoration and allows for a systematic review of a large range of sites to maximize potential success. Although more information about the watersheds and the sites themselves would be helpful when prioritizing, this framework enables a rapid evaluation of over 1000 sites using readily available data. As additional information from sites becomes available, the framework should be expanded and/or modified accordingly. However, until then, the initial framework provides a transparent guide for efficiently identifying where restoration actions may provide the highest likelihood of meeting the PSP target of improving B-IBI scores from “fair” to “good.” With the restoration decision framework defined and the top priority sites identified, the next steps include developing restoration strategies and planning level cost estimates for the top 30 “fair” sites and their watersheds and developing potential preservation/conservation strategies and planning level cost estimates for the “excellent” sites and their watersheds. These steps will likely involve engaging local experts and staff to identify what types of restoration actions are possible, determine key watershed stressors contributing to low B-IBI scores, leverage or enhance overlapping restoration/conservation efforts, help understand local conditions and disturbances driving B-IBI scores, and initiate engagement with partners who will be critical in future restoration/conservation implementation.

B-IBI Restoration Decision Framework and Site Identification
King County Science and Technical Support Section 1 July 2014
1.0 BACKGROUND
1.1 Introduction
The overall goal of Washington State’s Puget Sound Partnership (PSP) is to restore Puget Sound. Many streams that drain into Puget Sound are threatened from pollutant runoff, habitat degradation, and altered flow regimes. Such threats may result in extinction of aquatic species or a decline in biodiversity. This project, titled “Strategies for Preserving and Restoring Small Puget Sound Drainages,” implements priority work consistent with the Puget Sound Action Agenda for the protection and restoration of Puget Sound by addressing near-term actions C2.1 NTA 2 and C2.3 NTA 22 (PSP 2012). The State of Washington Department of Ecology (Ecology) is the lead organization for developing and implementing strategies for watershed protection and restoration, the area of emphasis this project falls within. Two of the PSP’s Ecosystem Recovery Targets are based on freshwater benthic macroinvertebrates. Benthic macroinvertebrates play a crucial role in stream ecosystems and are good indicators of ecological health. The multimetric Puget Lowland Benthic Index of Biotic Integrity (B-IBI) is a standardized scoring system applied to samples of benthic macroinvertebrates collected from streams. The B-IBI was developed in the early 1990s and is widely used to report stream biological health by over 20 cities, counties, tribes and state and federal agencies in the Puget Sound Basin. The PSP freshwater benthic macroinvertebrate targets state:
By 2020, 100 percent of Puget Sound lowland stream drainage areas monitored with baseline B-IBI scores of 42-46 or better retain these “excellent” scores and mean B-IBI scores of 30 Puget Sound lowland drainage areas improve from “fair” to “good” (PSP 2012).
The purpose of this project is to develop strategies and cost estimates for addressing these two targets. This report addresses the second target, specifically identifying and prioritizing the top drainages for restoring from “fair” to “good” B-IBI scores. Sites with “excellent” scores were identified and mapped in a previous report (King County 2014a) and will not be discussed further in this report. With help from Ecology’s Puget Sound Watershed Characterization project team and with input from regional stakeholders, King County developed a decision framework to identify and prioritize 30 drainages. With appropriate management, restoration, and/or conservation activities, these drainages have the potential to see B-IBI scores raised from “fair” to “good.” This document describes the rationale for each framework criterion and identifies the top priority sites. The watershed prioritization described in this report builds
2 C2.1 NTA 2 is managing urban runoff at the basin and watershed scale; C2.3 NTA 2 is map, prioritize, and restore degraded streams.

B-IBI Restoration Decision Framework and Site Identification
King County Science and Technical Support Section 2 July 2014
on the Task 2 deliverable (King County 2014a) which identified all sites that scored in the “fair” B-IBI range. Watershed prioritization is necessary before protection/restoration strategy development and implementation cost estimates can be completed.
1.2 Macroinvertebrate Data Sources
This project utilizes existing benthic macroinvertebrate monitoring data from streams throughout the Puget Sound drainage basin (Water Resource Inventory Areas [WRIA] 1-19) and does not involve collecting new benthic macroinvertebrate data. B-IBI scores3 were downloaded on November 18, 2013 from a regional database maintained by King County, the Puget Sound Stream Benthos (PSSB) data management system (http://www.pugetsoundstreambenthos.org/). Following quality assurance/quality control (QA/QC) work to remove duplicative data (Appendix C), 1125 sampling locations were identified in Puget Sound that were sampled between 1994 and 2012. 2013 B-IBI scores are not included because the majority of samples had not been processed for taxonomic identification at the time of download. Sites with B-IBI scores falling in the “fair” range (Appendix D) are the most relevant for this report. See King County 2014a for maps, descriptions, and further breakdown of the downloaded B-IBI data.
1.3 Landscape Analysis
Geographic information systems (GIS) analysis was conducted for the sites identified as having “fair” B-IBI scores to delineate contributing watersheds and calculate landscape metrics at buffer and watershed scales. Details of all landscape metrics calculated can be found in King County 2014a, but metrics utilized in the decision framework will be briefly mentioned here. Contributing watersheds were delineated4 following the methods laid out by Leinenbach (2011a, 2011b) and King County (2013) based on the 30 meter National Elevation Dataset (Gesch 2007, Gesch et al. 2002) available from the National Hydrography Dataset. QA/QC work on the watershed delineations (Appendix E), verified 1053 of the 1125 Puget Sound watersheds associated with B-IBI sampling. The restoration decision framework was applied to these remaining 1053 watersheds.
3 The PSSB has several user-defined options for determining how the B-IBI scores are calculated. For this project, the following were chosen for the data download: (1) streams and rivers in Puget Sound, (2) all projects, (3) B-IBI10-50 (see Appendix B describing why B-IBI10-50 is used instead of the newly developed B-IBI0-
100) , (4) replicates combined, (5) taxonomic resolution as defined by project metadata, (6) Wisseman (1998) attributes, (7) subsampling at 500 organisms, (8) all years with available data through 2012. 4 The watershed shapefiles and spatial data summarized in a spreadsheet are available for download on the PSSB under the subheadings GIS Resources/Shapefiles.

B-IBI Restoration Decision Framework and Site Identification
King County Science and Technical Support Section 3 July 2014
Three GIS-derived landscaped metrics are incorporated in the decision framework including level III ecoregion (Omernik 1987, EPA 2013), watershed area for the upstream contributing watershed, and landcover from 2011 Coastal Change Analysis Program (C-CAP) (NOAA 2011). Percent urbanization, defined as the sum of high-, medium-, and low-intensity development, was calculated from the 2011 C-CAP data and was used to derive the biological potential for a given site. Descriptions and rationale for the ecoregion, watershed area, and biological potential criteria are described in more detail in section 2.0 of this report.
Ecology’s Puget Sound Watershed Characterization (PSWC) is a regional scale tool that integrates landscape-scale measures of landcover and hydrology. A subset of B-IBI watersheds were run through the PSWC hydrology water flow processes model which is described in more detail in section 2.5 of this report.
Previous GIS work (see King County 2014a) will be called upon or new work conducted if deemed necessary for restoration prioritization or restoration strategy work related to this project. For example, addressing ownership on a parcel by parcel basis across the scale of the entire Puget Sound region was not feasible due to the large number of sites and time requirements. However, public, private, and jurisdictional ownership likely will be assessed for the reduced set of “fair” sites identified in this document to inform the development of restoration or conservation strategies – the next step in this project.
1.4 Stakeholder Workshop
King County hosted a B-IBI Restoration Priorities Stakeholder Workshop in Seattle the afternoon of March 19, 2014. The workshop was attended by 41 people representing 14 entities5 including 3 people via web conference. Several additional stakeholders who could not attend the workshop provided feedback via email. The workshop introduced the project to regional stakeholders, presented potential restoration framework criteria, and solicited suggestions and feedback. This information was all considered in the development of the final restoration decision framework. All workshop presentations and handout materials are available online at the PSSB Restoration Priorities project page6 (Appendix A). See Appendices F and G for the workshop agenda and the description of the participation process used to rank criteria.
5 Staff from the following organizations attended: City of Bellevue, City of Bellingham, City of Everett, City of Kirkland, City of Seattle, Environmental Protection Agency, King County, Pierce County Surface Water Mgt., Puget Sound Partnership, Seattle City Light, Snohomish County, Washington Dept. of Ecology, WRIA 7, and WRIA 9. 6 PSSB Restoration Priorities project page: http://pugetsoundstreambenthos.org/Projects/Restoration-Priorities-2014.aspx

B-IBI Restoration Decision Framework and Site Identification
King County Science and Technical Support Section 4 July 2014
2.0 RESTORATION LITERATURE
The development of a decision framework for restoring stream basin B-IBI scores from “fair” to “good” included a literature review of stream basin restoration effectiveness studies with a focus on benthic macroinvertebrates. It should be noted that most stream and river restoration projects have focused on improving water quality, managing riparian areas, creating or restoring fish habitat and fish passage, and stabilizing banks (Bernhardt et al. 2005). Improving conditions for macroinvertebrates is rarely an expressed goal. As a result, studies describing macroinvertebrate responses to restoration actions often appear to have been opportunistic; macroinvertebrates may have been measured, but the projects had been intended primarily to benefit fish (e.g., additions of boulders and/or large wood that increase habitat complexity, riparian plantings that were intended to reduce stream temperatures). Other studies describe actions that targeted water quality (e.g., removing point sources of contaminants, reducing nutrients) or channel stabilization (e.g., to reduce sediment delivery), and in these, macroinvertebrates were one of many variables measured. The studies resulting from these projects certainly provide some valuable information and insights, but it may be that restoration actions that explicitly target macroinvertebrates are more informative and ultimately more successful than projects focused on other taxa and conditions. New literature that includes any information on the impacts of restoration actions on macroinvertebrates will continue to be sought and incorporated throughout the duration of this project. Appendix H lists the literature consulted to date and this section seeks to succinctly summarize some of the key take-away points. Current literature suggests restoring diverse and resilient benthic macroinvertebrate communities requires restoring the physical, chemical, and ecological conditions and processes that influence those communities (Chin et al. 2010, Feld et al. 2011, Hilderbrand et al. 2005, Langford et al. 2009). When there is a single limiting factor that is restored or improved with little effort, such as restoring riparian buffers to reduce fine sediment inputs in an otherwise unimpacted watershed, invertebrate communities can recover over time (reviewed by Feld et al. 2011). Likewise, when a point source of pollution is removed from an otherwise intact stream, water quality can improve and invertebrate communities can recover (Clements et al. 2010). The more obvious and the more discreet the problem, the easier it may be to fix. There are examples of invertebrate recovery following actions that were not necessarily designed to benefit invertebrates (e.g., stabilizing eroding channels that then led to increased channel width, reduced stream velocities, and improved B-IBI scores, Chin et al. 2010), but ultimately the invertebrates recovered because the limiting condition was improved. In contrast, when the physical, chemical, and ecological conditions are all degraded, as in highly urbanized watersheds with significant impervious surfaces, there may be few if any restoration actions that would be sufficient to successfully restore those communities (Paul et al. 2009, Stranko et al. 2012, Walsh et al. 2005). Examples of cases in which restoration was not as effective as hoped often conclude that restoring only one factor was insufficient because other stressors persisted (Suren and McMurtrie 2005). Other examples point to a lack of an effect when the action taken was thought to address a limiting factor, but ultimately that factor was found to have no effect regardless of

B-IBI Restoration Decision Framework and Site Identification
King County Science and Technical Support Section 5 July 2014
restoration (Lepori et al. 2005, Palmer et al. 2010). Therefore, researchers suggest identifying the full suite of stressors affecting a watershed and prioritizing restoration plans that restore all conditions and processes (Feld et al. 2011, Palmer et al. 2010, Walsh et al. 2005). When accounting for the confounding stressors affecting a site, researchers advise considering factors across a range of scales. Just as scale matters for understanding how various conditions and processes affect macroinvertebrates (e.g., local substrate is important as well as land use in watershed, Morley and Karr 2002), the scale of a restoration action relative to the problem may be important in predicting outcome (Jahnig et al. 2010). Both the absolute and the relative proportion of a river network that is degraded will affect what restoration actions are possible as well as the likelihood of success (e.g., Herbst and Kane 2009). Unfortunately, much of the support for this comes from analyses examining why particular restoration projects were not effective. For example, when benthic communities fail to recover following local habitat restoration, authors often suggest there are persistent problems with water quality or altered hydrology that are due to larger, watershed-scale impacts (Walsh et al. 2005). Researchers also suggest accounting for the multiple life stages and diverse life histories of the invertebrate taxa themselves (Gore 1985, Knop et al. 2011). For example, when there are not rapid (within 2 years) improvements in an invertebrate community, authors often cite that a lack of local sources of colonists may be limiting recovery (Knop et al. 2011, Langford et al. 2009). Even when taxa are represented within a watershed, there may be limits to how far they can move due to natural or anthropogenic limitations (Parkyn and Smith 2011, Sundermann et al. 2011). For example, Blakely and others (2006) demonstrated that small road culverts may be barriers to upstream flight and may therefore limit the colonization of upstream reaches by some winged insects. Many researchers call for restoring landscape connectivity (e.g., Jansson et al. 2007, Urban et al. 2006), to ensure there are corridors for a diverse range of stream taxa to move among source populations and restored sites (Brederveld et al. 2011, Galic et al. 2013). Also, restoring stream and river reaches for other taxa, such as salmonids or other fish, may or may not increase the densities and richness of invertebrate communities (e.g., Albertson et al. 2010; Louhi et al. 2011; Wootton 2012). These results suggest there may be trade-offs among restoration strategies, depending on the taxa (and life stages) that are being targeted. The literature indicates there may be specific approaches that are most appropriate for prioritizing, designing and monitoring restoration projects (Adams et al. 2002, Bunn et al. 2010, Lorenz et al. 2009, Miller et al. 2010). Regarding prioritization, Merovich and others (2013) describe a process of ranking watersheds for conservation that are in a region heavily influenced by mining activities. Although the disturbances from mining may not be equivalent to the effects of other land uses, the process illustrates how watershed scale, the distribution of high and low-quality habitats, and the organization of the river network should be incorporated in restoration prioritization (Thomas 2014). Regarding project design, several papers have highlighted the unfortunate loss of information and insight that has resulted from poorly designed projects (Bernhardt et al. 2005; Miller et al. 2010). The

B-IBI Restoration Decision Framework and Site Identification
King County Science and Technical Support Section 6 July 2014
strongest inferences of restoration effectiveness are derived from studies with robust experimental designs and statistical analyses (e.g., Before-After-Control-Impact [BACI] design and analysis; Louhi et al. 2011). Projects that lack appropriate control or reference sites for comparison provide little information that can be transferred elsewhere (Miller et al. 2010). Finally, researchers note that monitoring protocols must allow for sampling over a sufficient time to assess effectiveness (Northington and Hershey 2006). This can be due to the time it takes for taxa to disperse to and colonize a site, but also because restoration activities – especially large scale physical habitat restoration – can be disturbances in and of themselves and the biophysical system requires time to respond and adapt (Muotka et al. 2002, Spanhoff and Arle 2007). Initially, as systems are recovering, there may be a lack of appropriate food or microhabitat for certain taxa (e.g., shredders may take longer to respond than grazers if detritus inputs remain small but algae production is high, Laasonen et al. 1998). Likewise, following restoration, invertebrate taxa richness often increases faster than density (Miller et al. 2010), and this may have implications for how quickly other measures of interest (e.g., detrital processing, prey availability for fish) recover. Clements and others (2010) demonstrated that thresholds in recovery may be detectable with certain statistical analyses, and those may be useful in identifying why certain taxa are able to recover more quickly than others. One study, Friberg and others (2013), suggests that full recovery of some sites may not be possible, even after conditions are restored and recovery is allowed to progress for nearly 20 years. Recent reviews suggest a critical next step in restoration science is refining and improving monitoring protocols, and funding monitoring to ensure that effectiveness can be evaluated over a sufficient period of time (Feld et al. 2011, Miller et al. 2010).

B-IBI Restoration Decision Framework and Site Identification
King County Science and Technical Support Section 7 July 2014
3.0 RESTORATION DECISION
FRAMEWORK: FILTERING CRITERIA
This section describes the rationale for the criteria incorporated into the restoration decision framework. The framework was applied to the 1053 sites with benthic macroinvertebrate data in Puget Sound that also have accurate watershed delineations. Five filtering criteria were applied first and reduced the number of sites under consideration from 1053 to 59 sites (Table 1). The restoration decision framework is intended to be simple, transparent, and updatable with new information. It is based on widely available landscape data or simple calculations. Criteria were applied in the order listed.
Restoration Decision Framework summary table. Table 1.
The number of sites was reduced from 1053 to 59 for consideration for restoration strategy development.
Criterion # Sites
Remaining
All B-IBI Sites 1053
Median “Fair” B-IBI Scores 439
Puget Lowland Ecoregion 362
Sampling History 174
Watershed Area 81
Puget Sound Watershed Characterization 59
Biological Potential N/A (ranked)
3.1 Median B-IBI Score: “Fair”
The median is the middle score in an ordered list of scores and is the point at which half the scores are above and half the scores are below. The median B-IBI was calculated from annual data for all Puget Sound macroinvertebrate monitoring locations. Sites with a median B-IBI score of “fair” (28-36) were selected for further consideration. The selection of “fair” sites was specified in the agreement/scope of work and in the PSP Ecosystem Recovery Target. Median was chosen because it reflects the typical score at a site and is less sensitive to extreme scores especially for smaller sample sizes7 compared to the mean which may be skewed by low or high outlier scores. Stakeholders who attended the workshop were supportive of using median as the measure of central tendency rather than mean. 1053 sites considered 439 have “fair” median B-IBI score
7 B-IBI sites were sampled between 1 and 15 times with an average sample size of 4 and a median of 3.

B-IBI Restoration Decision Framework and Site Identification
King County Science and Technical Support Section 8 July 2014
3.2 Ecoregion: Puget Lowland
Ecoregions denote areas within which ecosystems are generally similar based on geology, physiography, vegetation, climate, soils, land use, wildlife, and hydrology. These biotic and abiotic phenomena can affect or reflect differences in ecosystem quality and integrity (Omernik 1987, 1995). Ecoregions are defined at different nested hierarchical levels. Level I is the coarsest level and divides North America into 15 regions whereas level II divides the continent into 50 classes (CEC 1997, 2006). There are 105 level III ecoregions in the continental U.S. The Puget Sound watershed includes four Level III ecoregions derived from Omernik (1987) and refined by the US EPA ecoregion framework (EPA 2013): North Cascades, Coastal Range, Cascades, and Puget Lowland (Figure 1). Sites within the Puget Lowland ecoregion were selected for futher consideration.
Figure 1. Level III ecoregions of the Puget Sound drainage basin.
Only sites within the Puget Lowland ecoregion (pink) are selected for further consideration in the restoration decision framework.
B-IBI Restoration Decision Framework and Site Identification
King County Science and Technical Support Section 9 July 2014
Site selection was limited to just one ecoregion to ensure similar climatic, physiographic, and geologic conditions and to limit regional variability. Reducing regional variablity from natural factors should be helpful down the line when monitoring will attempt to assess whether management and restoration actions are associated with improved biological integrity as measured by B-IBI. The Puget Lowland ecoregion is centered around Puget Sound and is characterized by a mild maritime climate with annual precipitation averaging 800-900 mm (31.5-35.5 inches). Elevation ranges from sea level to 460 meters (1,509 feet) but is rarely above 160 meters (525 feet) (Franklin and Dyrness 1973). Most non-forestry land development (urban, rural, and agriculture) in the Puget Sound basin is located in the Puget Lowland ecoregion. 439 sites considered 362 are within the Puget Lowland ecoregion
3.3 Sampling History: N>2 & recent or N>4
Macroinvertebrate sampling history was taken into consideration including the number of times a site was sampled and when the most recent sample was collected. A site that is sampled one or two times can be scored with the B-IBI, however little is known about the range of natural variability at the site or whether the one or two scores accurately depicts the true biotic integrity. Using a measure of central tendency (e.g. average or median) from multiple samples over several years for a given site allows for increased confidence that the “true” B-IBI score is “fair” and provides variability bounds that will help when it comes time to measure an effect from restoration or management actions. In addition, stream conditions and biological communities can change rapidly in response to human and natural perturbations. As a result, older data may or may not adequately reflect current site conditions. If only older data are available, but they are from many years (e.g., five or more) the increased confidence that the B-IBI score accurately characterizes the site may overcome the lack of recent data. Sites selected for further consideration had to have
1) Three or more years of data with the most recent B-IBI data collected within the last five years (2008-2012) or
2) Five or more years of data8.
8 For sites that only have pre-2008 data, there likely will be a range of landcover change in the intervening years within the contributing watershed. This may be a criterion that is re-visited on a site by site basis when the next step of developing restoration strategies begins. For example, a site that is in a watershed that has seen a large amount of urbanization since the most recent B-IBI sample was collected may not still appropriately be classified as a “fair” site. In such circumstances, the site may be removed from the restoration priority list and all sites ranked lower bump up one place.

B-IBI Restoration Decision Framework and Site Identification
King County Science and Technical Support Section 10 July 2014
For example, if the most recent B-IBI data for a site are from 2007 or earlier, but data includes 5 years of sampling, this site will remain on the list. Pre-restoration data collection is strongly recommended if restoration/management actions are planned for a site to ensure an accurate assessment of pre-restoration conditions and to improve the likelihood of being able to measure any effect of the action. Pre-restoration monitoring is absolutely essential in cases where B-IBI data from the last 5 years do not exist. 362 sites considered 174 meet sampling history requirements
3.4 Watershed Area: 200-3000 Acres
The upstream contributing watershed area was calculated in ArcGIS for each B-IBI sampling location. This measurement represents the total area drained by any upstream tributaries that feed into the sampling location. Several measures of stream size (e.g., stream order, stream length, watershed area) are highly correlated (Allan 1995) and watershed area was chosen because it is easily and accurately calculated with current GIS tools. Intermediate sized watersheds (200-3000 acres) were chosen to maximize the potential to identify projects that may be both large enough to be consequential but small enough to be feasible and tractable. The chance that restoration efforts could be undermined or overwhelmed by land cover change on a single parcel is reduced by eliminating small watersheds. In contrast, restoration/management efforts are kept to a more manageable scale while increasing the likelihood of being able to measure an effect of specific projects by eliminating much larger watersheds and focusing on intermediate sized systems. Another reason to target a smaller range of watershed size is that biological expectations change from headwaters to mouth in stream ecosystems in response to changing physical conditions (Vannote et al. 1980). It follows that even in pristine systems invertebrate communities in headwaters will be different from intermediate sized systems, which will be different from larger rivers. Therefore, one B-IBI scoring system may not be appropriate across stream/watershed sizes and in some regions of the United States separate multimetric indices have been developed for either headwater (e.g., Wachter 2003) or large nonwadeable rivers (e.g., Flotemersch et al. 2006, Lazorchak et al. 2000, Wessell et al. 2008). The existing Puget Lowland B-IBI is typically used to characterize intermediate sized streams. A minimum watershed area threshold can also help increase the likelihood that perennial flow conditions are met. Macroinvertebrate sample collection is usually conducted between July and September in the Puget Sound region during summer low flow conditions (e.g., Cusimano et al. 2006, King County 2002) when some headwater or intermittent streams may be dry. Invertebrate response to natural drying stressors such as increased water temperatures or decreased dissolved oxygen may translate into low invertebrate

B-IBI Restoration Decision Framework and Site Identification
King County Science and Technical Support Section 11 July 2014
abundance or low biotic metric evaluations (Clarke et al. 2008a, Davis et al. 2003, Delucchi 1988, Feminella 1996, Page et al. 2008). Therefore, B-IBI scores from small headwater streams may not be comparable to more permanent streams. The size of the watershed needed to generate perennial flow is highly variable in the Pacific Northwest depending on precipitation, topography, surficial and underlying geology and land use. King County (unpublished 2010 draft) evaluated several related studies conducted in Western Washington and Oregon (Konrad 2000, Clarke et al. 2008b, Palmquist 2005, and Jaeger et al. 2007) and recommended a criterion of greater than 100 acres to ensure a “high likelihood” of perennial flows. In a regional study assessing land use effects and regulatory effectiveness on streams King County (2014b) targeted perennial, fish bearing watersheds between 150 and 3118 acres in size. These guidelines were approximated for this project and sites with contributing watershed areas between 200 and 3000 acres were selected for further consideration. 174 sites considered 81 meet watershed area requirements
3.5 Puget Sound Watershed Characterization Water
Flow Processes Model
The upstream contributing watersheds for the remaining filtered sites were next run through Ecology’s Puget Sound Watershed Characterization (PSWC) water flow processes model. The water flow model was chosen because of the ecological importance of hydrologic indicators (DeGasperi et al. 2009). This model incorporates hydrography, land cover, precipitation, soils, geology, roads, wetlands, and slope data to assess water delivery, surface storage, and recharge/ discharge. The PSWC is a regional scale tool that integrates landscape-scale measures of landcover and hydrology in a novel way that other metrics do not capture. The PSWC assessment provides information about the relative value of watersheds for their contributions to essential components of the water flow processes such as delivery, surface storage, groundwater recharge, and discharge. The PSWC assesses the inherent importance of watersheds based on the presence of areas critical to those components of the water flow process such as depressional wetlands (storage) or rain on snow areas (delivery). It also assesses the degree of impact to those critical areas in the contributing watershed, the degradation of which generally accelerates the movement of surface flows downstream. This accelerated delivery increases downstream flooding and erosion and subsequently degrades aquatic habitats over time. The PSWC can be used to prioritize watersheds to protect or restore (Stanley 2010, Stanley et al. 2012) based upon a combination of the assessments of importance and degradation to create a management matrix (see Figure 2 below). Those watersheds which score highest for importance and lowest for degradation may be best to focus protection measures in. Conversely, those watersheds which are highly important for water flow but also highly degraded should be the focus of active efforts to restore those processes. The

B-IBI Restoration Decision Framework and Site Identification
King County Science and Technical Support Section 12 July 2014
PSWC model is being used in the restoration decision framework to exclude those sites whose watersheds are more likely to present “limiting factors” to restoration at the site and reach scale. These watersheds are less important to water flow processes with fewer features critical to the delivery and movement of water, and are those most degraded by human activities. Consequently, those watersheds which fall into the categories in the bottom right corner of the management matrix (i.e., RD2, RD1, D2, and D1 in Figure 2) were filtered out of consideration.
Figure 2. PSWC management matrix.
The PSWC evaluates the relative level of importance and degradation of water flow processes for each watershed. The restoration decision framework excludes watersheds that fall in the bottom quartile (lower right: RD2, RD1, D2, D1) of the management matrix with low importance and high degradation.
81 sites considered 59 meet PSWC filtering criterion
3.6 Filtering Criteria Summary
The criteria introduced so far have all involved defining conditions for “fair” B-IBI sites to ensure that sites selected for restoration activities (1) have minimal inherent variability in response to natural factors, (2) have reliable B-IBI condition categorization (e.g., good data quality), (3) are a size that is tractable, i.e., a scale at which change can be effectively tracked, measured and related to local and watershed scale conditions, and (4) are hydrologically important without already being completely degraded.

B-IBI Restoration Decision Framework and Site Identification
King County Science and Technical Support Section 13 July 2014
4.0 RESTORATION DECISION
FRAMEWORK: RANKING CRITERION
With the filtering complete, a single criterion (biological potential) is applied to each site and scored to order and prioritize the remaining sites. This section introduces the concept of biological potential, describes how it is calculated, and ranks the 59 remaining sites.
4.1 Understanding Biological Potential
The plot of the B-IBI against a disturbance gradient such as watershed urbanization for Puget Sound demonstrates a wedge-shaped factor-ceiling relationship (Figure 3). The outer edge or envelope of this wedge is the observed biological potential which describes the existing upper limit of biological condition with increasing urbanization (Paul et al. 2009).
Figure 3. Observed biological potential.
The 90th
quantile regression line (y = 40.308 - 0.222*x) of watershed urbanization against the median B-IBI for sites across Puget Sound (n=1053) represents the observed biological potential. This line approximates the upper boundary of biological condition that the data indicate is currently attainable given watershed urbanization. When B-IBI scores fall above this line (within and above the gray box) they represent sites performing at or above their potential as predicted by watershed urbanization.
Percent watershed urbanization was calculated for over 1,000 B-IBI sampling sites throughout Puget Sound as the sum of high-, medium-, and low-intensity development

B-IBI Restoration Decision Framework and Site Identification
King County Science and Technical Support Section 14 July 2014
from 2011 C-CAP land cover data. Watershed urbanization was selected as the human disturbance gradient because it has been identified as the primary driver for B-IBI scores in the Puget Sound region and watershed urbanization alone explained as much variability in B-IBI scores as a more complicated multi-disturbance model (Fore et al. 2013). The observed biological potential was calculated by fitting the 90th quantile regression line to the relationship between B-IBI and watershed urbanization: 90th quantile regression = “attainable” B-IBI = 40.308 - 0.222*(%Watershed Urbanization) Data points above this line indicate the existing upper limit (top 10%) of scores given the level of watershed urbanization. Sites were scored for biological potential by subtracting the 90th percentile B-IBI score for a given watershed urbanization from the observed score. Sites “over-performing” expectations by exceeding their potential have positive residuals (blue shading, Figure 4). “Under-performing” sites have negative residuals (green shading, Figure 4). Rank ordering of residuals was used to prioritize sites for restoration actions.
Figure 4. Scoring biological potential.
Sites were scored relative to the biological potential by subtracting the current 90th
percentile B-IBI at a given urbanization level (the black line) from the observed score. Sites overperforming expectations (blue shading) have positive residuals and sites below their potential (green shading) have negative residuals. Rank ordering of residuals was used to prioritize sites for restoration actions.

B-IBI Restoration Decision Framework and Site Identification
King County Science and Technical Support Section 15 July 2014
4.2 Ranking Sites Based on Biological Potential
This report focuses on addressing the PSP recovery target of restoring 30 sites and their watersheds from “fair” to “good” B-IBI. Overlaying the scoring categories for “fair” and “good” with the 90th quantile biological potential line can help illustrate which sites are most likely to have their B-IBI scores increased to the “good” range given our current understanding of the relationship between B-IBI and watershed urbanization (Figure 5). B-IBI scores further below the 90th percentile score for their percent urbanization theoretically have the capacity for more biological lift and it seems prudent to allocate limited management resources towards sites with the greatest capacity for improvement. Therefore, the 59 sites that emerged from the filtering steps of the restoration decision framework were placed in rank order based on the calculated residual. In other words, sites with a greater distance below their probable biological potential based on the site’s level of urbanization (larger negative residual) were scored higher for restoration prioritization than sites closer to or already meeting their biological potential.
Figure 5. Plot of the biological potential (black 90th
quantile regression line) relative to “fair” and “good” B-IBI categories.
Sites falling within the yellow box have the greatest likelihood of successfully increasing B-IBI scores to the “good” category (green box) following management actions.
It is worth noting that sites with high levels of watershed urbanization (greater than 10.4%) are less likely to achieve “good” B-IBI scores based on the relationship between watershed urbanization and B-IBI generated from currently available data. There are

B-IBI Restoration Decision Framework and Site Identification
King County Science and Technical Support Section 16 July 2014
exceptions to this urbanization “rule” (Figure 5) Therefore the decision framework does not include watershed urbanization as a filter to exclude sites with highly urbanized watersheds. However, both the PSWC and the ranking based on biological potential incorporate watershed urbanization and tend to favor sites with relatively low levels of watershed urbanization (Figure 6). Over time as restoration strategies are implemented and monitored, it is conceivable that the biological potential line will shift. The biological potential that is predicted by the equation is derived from the current data and therefore reflects what is known now. Consequently, the equation should be re-calculated and assessed as more data become available.
Figure 6. Distribution of selected sites by percent watershed urbanization.
Distribution illustrates that the majority of the top ranked sites (green and yellow) have minimal (<20%) urbanization within their watersheds.
21
8
1
14
4
4 2 2 3
0
5
10
15
20
25
30
35
0 to 10 10 to 20 20 to 30 30 to 40 40 to 50 > 50
Co
un
t o
f S
ites
% Watershed Urbanization (2011)
Top 30 30 to 59

B-IBI Restoration Decision Framework and Site Identification
King County Science and Technical Support Section 17 July 2014
5.0 SITE SELECTION
The criteria described in sections 2 and 3 were applied to the 1053 Puget Sound locations that have been monitored using benthic macroinvertebrates to first reduce the number of sites and then to prioritize the top sites for restoration actions. See Figure 7 for a summary of the filtering steps that reduced the number of sites under consideration from 1053 to 59.
Figure 7. Conceptual diagram of the restoration decision framework.
Criteria were applied in order and resulted in the reduction of sites from 1053 to 59 for further consideration (values indicate the number of sites).

B-IBI Restoration Decision Framework and Site Identification
King County Science and Technical Support Section 18 July 2014
As discussed in section 3, the observed biological potential was used to calculate predicted B-IBI scores for the 59 sites remaining after the filtering criteria were applied. The observed B-IBI score minus the 90th percentile score for the equivalent percent urbanization resulted in residuals ranging from -11.7 to 6.2 (Figure 8). These were put in rank order so that the site with the largest negative residual (e.g., the observed score is the most below its biological potential given its level of watershed urbanization) is ranked #1 and the site with the largest positive residual is ranked #59. With this ranking an initial 30 top priority sites can be identified (Table 2).
Figure 8. Residuals for the 59 filtered “fair” sites were calculated by subtracting the 90th
percentile B-IBI score for a given watershed urbanization from the observed B-IBI score.
The sites were put in rank order so that the largest negative residual is ranked first. This ranking provides the prioritization order for all 59 sites and can be used to identify the top 30.
-12
-10
-8
-6
-4
-2
0
2
4
6
8
0 10 20 30 40 50 60 70 80 90 100
Resid
uals
(O
bserv
ed
- P
red
icte
d)
% Watershed Urbanization (2011)
Secondary Priority (31 to 59)
Top Priority (1 to 30)

B-IBI Restoration Decision Framework and Site Identification
King County Science and Technical Support Section 19 July 2014
Rank ordered list of the top 59 sites remaining after applying the restoration decision framework. Table 2.
Site information, B-IBI scores, and decision framework criteria are shown.
Rank ID Site Code WRIA Stream Agency Latitude Longitude
19
99
20
00
20
01
20
02
20
03
20
04
20
05
20
06
20
07
20
08
20
09
20
10
20
11
20
12
Median Ecoregion N N_L5 Samp Hist WS area PSWC BioP WS
Urb%
1 884 KCST-16 15 Stavis Ck. Kitsap 47.614 -122.875167
24 32 28 24 40
28 Pug Low 5 0 N>4 2116.3 P2 -11.7 2.7
2 354 E2887 9 Tahlequah Ck. King - Roads 47.334554 -122.508612
22 24 32 34 32 28 24
28 Pug Low 7 3 N>2,>2007 984.1 C1 -11.2 4.9
3 867 KCSSWM-022 - Upper 15 Carpenter Ck. (Kitsap) Kitsap 47.810435 -122.521057
24 26 28 28 28 30
24 28
28 Pug Low 8 2 N>2,>2007 564.9 P3R -10.9 6.2 4 883 KCST-17 15 Seabeck Ck. Kitsap 47.627817 -122.8392
40 30 22 36 26 22
28 Pug Low 6 0 N>4 2946.1 P2R -10.9 6.5
5 647 BagleyClalCty4.6 18 Bagley Ck. Clallam 48.064283 -123.324619
28 30
26
30
29 Pug Low 4 1 N>2,>2007 1481.8 C2 -10.7 2.9 6 342 E2153 7 Brockway Ck. King - Roads 47.529513 -121.802481 14 28
30 28 38 30 22 46 38 34 38
30 Pug Low 11 3 N>2,>2007 1497.6 P3 -10.3 0.2
7 1100 BiBi-034 - Herron Creek 15 Herron Ck. Pierce 47.271067 -122.805943
30 30 34 30 Pug Low 3 3 N>2,>2007 642.9 P3 -9.7 2.7
8 244 09MID1537 9 Crisp Ck. King - DNRP 47.28987 -122.058042
34 30
34 30 26 24 30 20 20 26 28 Pug Low 10 5 N>2,>2007 1522.3 P1R -9.4 13.3 9 896 BiBi-025 - Ray Nash Creek 15 Ray Nash Ck. Pierce 47.31866 -122.65909
24
34
26 34
28 28 Pug Low 5 3 N>2,>2007 1391.5 R3 -9.3 13.5
10 273 VashJudd 9 Judd Ck. King - DNRP 47.40993 -122.47088
30 30 30
32 24 32 34 30 Pug Low 7 4 N>2,>2007 2754.6 P3R -9.2 4.8 11 303 E1105 7 Harris Ck. King - Roads 47.721954 -121.876792
24 36 38 26 26 32 28 30 32
32
31 Pug Low 10 2 N>2,>2007 759.5 P1 -9.0 1.6
12 1292 KCSSWM-020 15 Big Scandia Ck. Kitsap 47.7155 -122.6574
22
24
32
40 28 Pug Low 4 2 N>2,>2007 1440.4 R3 -8.9 15.4
13 346 E1031 7 Snoqualmie R. - S Fork Trib King - Roads 47.464867 -121.758054 14 24 30 30 34 30 22 30 32 28 34 24
30 Pug Low 12 3 N>2,>2007 830.9 P1R -8.5 8.1 14 908 BIBI-028 - Purdy Creek 15 Purdy Ck. (Burley Lagoon) Pierce 47.38921 -122.6255
30
36
26
30
30 Pug Low 4 2 N>2,>2007 2314.2 P2R -8.4 8.4
15 222 09COV1862 9 Rock Ck. Trib (Covington) King - DNRP 47.317211 -122.00522
20
26 30 28 34 34 22 32
29 Pug Low 8 4 N>2,>2007 659.4 R3 -8.1 14.5 16 500 CAR2B 5 Harvey Ck. Snohomish 48.25214 -122.13922
32 28 42
32 Pug Low 3 3 N>2,>2007 339.6 P2R -8.0 1.5
17 501 CAR3A 7 Little Pilchuck Ck. (Snohomish) Snohomish 48.09226 -122.045304
32 30 28
30 Pug Low 3 3 N>2,>2007 1412.4 P1R -7.7 11.8 18 523 65B 9 Fisher Ck. (Vashon) King - DNRP 47.383942 -122.481469
32 30 40 32 24 32 Pug Low 5 5 N>2,>2007 1242.5 C2 -7.7 2.9
19 959 7-981 7 Swartz Lake Ck. Snohomish 48.068309 -121.953934
32
34 20
32 Pug Low 3 2 N>2,>2007 1845.2 P1 -7.7 3.0
20 880 KCSSWM-031 15 Little Boston Kitsap 47.85565 -122.5716
34 36 24 32 32
26
32 Pug Low 6 1 N>2,>2007 499.9 P1 -7.3 4.4 21 1099 BiBi-033 - Spiketon Creek 10 Spiketon Ck. Pierce 47.14929 -122.02613
32
34
26
32 Pug Low 3 1 N>2,>2007 920.9 R1 -7.2 5.1
22 86 BiBi-001 - Artondale Creek 15 Artondale Ck. Pierce 47.300062 -122.622276
30
32 26 32
26
30
28 30 Pug Low 7 3 N>2,>2007 1644.2 R3 -7.1 14.3 23 272 VashChris 9 Christenson Ck. King - DNRP 47.40277 -122.51693
28 34 32 22 34 34 26 34 33 Pug Low 8 5 N>2,>2007 500.8 C2 -6.7 2.7
24 962 7-279 7 Ricci Ck. Snohomish 47.821204 -122.039211
38
32 32
32 Pug Low 3 2 N>2,>2007 2225.7 P2R -6.4 8.5
25 248 09MID1958 9 Icy Ck. King - DNRP 47.278886 -121.978571
34 38
38 38 26 44 28 34 26 30 34 Pug Low 10 5 N>2,>2007 253.8 P3 -6.2 0.5 26 260 09NEW2128 9 Newaukum Ck. - N Fork King - DNRP 47.234245 -121.93519
30 32
36 26 46 38 38 32 30 36 34 Pug Low 10 5 N>2,>2007 1025.0 P1 -6.1 1.1
27 1295 KCSSWM-030 15 Jump Off Ck. Kitsap 47.8068 -122.6692
30
22
28
28 Pug Low 3 1 N>2,>2007 830.9 R -6.0 28.4 28 1291 KCSSWM-019 15 Anderson Ck. (Kitsap) Kitsap 47.5262 -122.6819
28
34 34
24
31 Pug Low 4 1 N>2,>2007 1221.8 P3R -5.8 15.8
29 1290 KCSSWM-018 - (Gorst Trib) 15 Parish Ck. Kitsap 47.5284 -122.7142
36
30 32
32
32 Pug Low 4 1 N>2,>2007 1128.9 P3R -5.4 13.2 30 524 65A 9 Tahlequah Ck. King - DNRP 47.334583 -122.508608
36 34 36 34 34 34 Pug Low 5 5 N>2,>2007 984.1 C1 -5.2 4.9
31 282 E1078 7 Cherry Ck. - N Fork King - Roads 47.750501 -121.911981 16 20 34 34
32 36 36 46 42
32
34 Pug Low 10 2 N>2,>2007 1124.9 P2 -5.0 5.7
32 1270 KCSSWM-001 - Lower 15 Barker Ck. Kitsap 47.6378 -122.6701
30 24 28 28 Pug Low 3 3 N>2,>2007 2512.6 R -4.9 33.4 33 814 GreenThCo36th 13 Green Cove Ck. Thurston 47.083383 -122.950408
30 38 40 30 30 28 30
30 Pug Low 7 1 N>2,>2007 1762.5 R1 -4.7 25.4
34 347 E1045 7 Boxley Ck. Trib King - Roads 47.445891 -121.728739 22 28
36 36 40 32 36 46 38 46 32
36 Pug Low 11 3 N>2,>2007 421.0 P1 -4.3 0.0 35 496 CAR1A 7 Carpenter Ck. (Woods Ck.) Trib Snohomish 48.01148 -121.958336
36 36 20
36 Pug Low 3 3 N>2,>2007 421.0 C1 -4.3 0.0
36 306 E1139 8 Fifteenmile Ck. King - Roads 47.483739 -122.029482 22 26 36 38 30 34 40 36 38 42 32 32
35 Pug Low 12 3 N>2,>2007 2984.3 P1 -4.1 5.5
37 876 KCST-7 15 Gamble Ck. Kitsap 47.776933 -122.594317
26 34 34 34 30
34 Pug Low 5 0 N>4 1512.9 R3 -4.0 10.4 38 156 08ISS4724 8 Carey Ck. King - DNRP 47.426952 -121.97338
42
38 32 32 38 28 36 36 36 Pug Low 8 5 N>2,>2007 2844.2 P3 -4.0 1.6
39 873 KCSSWM-009 15 Boyce Ck. Kitsap 47.608833 -122.9098
28 36 40 42 40 36
34
36 Pug Low 7 1 N>2,>2007 1006.6 P1 -3.8 2.4 40 242 09MID1374 9 O'Grady Ck. King - DNRP 47.275597 -122.088114
30 28
38 38 36 36 34 30 30 38 35 Pug Low 10 5 N>2,>2007 703.0 R2 -3.7 7.0
41 879 KCSSWM-011 15 Little Anderson Ck. Kitsap 47.655733 -122.755017
28 40
26 34 32
34
33 Pug Low 6 1 N>2,>2007 2276.4 C2 -3.6 16.5 42 348 E1023 7 Clough Ck. King - Roads 47.473741 -121.78624 20 36
38 44 28 40 30 40 38 32 34
36 Pug Low 11 3 N>2,>2007 1379.7 P1 -3.5 3.8
43 314 E633-CIP-1 8 Rock Ck. (Lower Cedar) King - Roads 47.379965 -122.017497
20 38
28 38 30 34 26 40
32 Pug Low 8 4 N>2,>2007 1552.1 R1 -3.2 22.8
44 151 08ISS3958 8 Cabin Ck. King - DNRP 47.519491 -122.038574
42 36
32 30 36 34 38 36 28
36 Pug Low 9 4 N>2,>2007 369.8 P3 -3.1 5.6 45 520 05B 7 Cherry Ck. King - DNRP 47.740049 -121.941377
40 28 46 36 36 36 Pug Low 5 5 N>2,>2007 924.5 C1 -3.1 5.6
46 153 08ISS4294 8 Fifteenmile Ck. King - DNRP 47.484906 -122.028632
36
24 40 32 38 38 40 36 28 36 Pug Low 9 5 N>2,>2007 2993.4 P1R -3.1 5.6 47 947 Stensland Middle 8 Stensland Ck. King - Roads 47.686092 -122.081153
30 38 32 30 31 Pug Low 4 4 N>2,>2007 306.7 R2 -2.8 29.2
48 320 P325 8 May Ck. (Lake Washington) King - Roads 47.501068 -122.107952
32 34 36 40 36 36 30
36 Pug Low 7 3 N>2,>2007 456.6 P2 -2.7 7.4
49 502 CAR3C 5 Portage Ck. Snohomish 48.17619 -122.121975
34 32 36
34 Pug Low 3 3 N>2,>2007 959.2 P3R -2.6 16.5 50 332 E818 7 Raging R. Trib King - Roads 47.503829 -121.904076 22 30
34 32 40 28 40 42 42 40 36
36 Pug Low 11 3 N>2,>2007 1595.2 P1R -2.5 7.9
51 283 E1076 7 Cherry Ck. Trib King - Roads 47.740329 -121.906761 24 36 28 36 36 42 36 30 40 36 34 38
36 Pug Low 12 3 N>2,>2007 581.6 P2R -2.4 8.7 52 168 08LAK3879 8 Laughing Jacobs Ck. King - DNRP 47.56535 -122.045569
28 28
28 28 30 22 32 30 30 28 28 Pug Low 10 5 N>2,>2007 2869.8 R2 -2.2 45.7
53 936 WAM06600-111639 8 Bear Ck. (Sammamish R.) King - DNRP 47.685836 -122.081748
30 36 30 34 32 Pug Low 4 4 N>2,>2007 350.9 R2 -2.0 28.6 54 865 KCST-20 15 Barker Ck. Kitsap 47.638427 -122.668879
32 36 30 16 26 32 34
32 Pug Low 7 0 N>4 2502.8 R -0.9 33.5
55 286 E1191 7 Coal Ck. (Snoqualmie R.) King - Roads 47.526182 -121.837064
42 34 38 34 36 36 32
36 Pug Low 7 3 N>2,>2007 1949.1 P2R -0.7 16.4
56 1288 KCSSWM-012 15 Mosher Ck. Kitsap 47.6122 -122.6547
38 26
30
30 30 Pug Low 4 2 N>2,>2007 1051.9 R2 1.1 51.4 57 815 IndianThCoWheeler 13 Indian Ck. (Lower Deschutes) Thurston 47.035544 -122.881733
30 30 26 28 32 18
29 Pug Low 6 1 N>2,>2007 1099.7 R 1.3 56.8
58 818 MissionThCoBethel 13 Mission Ck. Thurston 47.063684 -122.884651
36 30 28 36 28 36
33 Pug Low 6 1 N>2,>2007 380.5 R 3.2 47.4 59 264 09SOO1022 9 Soosette Ck. King - DNRP 47.332643 -122.15626
28 36
32 30 40 38 32 34 36 34 Pug Low 9 5 N>2,>2007 2804.8 R2 6.2 56.4

B-IBI Restoration Decision Framework and Site Identification
King County Science and Technical Support Section 20 July 2014

B-IBI Restoration Decision Framework and Site Identification
King County Science and Technical Support Section 21 July 2014
The 59 sites remaining after applying the restoration decision framework are located in eight of the nineteen Puget Sound water resource inventory areas (WRIAs): 5, 7, 8, 9, 10, 13, 15, and 18 (Table 3) and are primarily located in Snohomish, King, Pierce, and Kitsap counties (Table 4, Figure 9). None of the sites prioritized as the top 30 are in WRIA 8 or 13.
The WRIA location for the top sites prioritized for restoration strategy development. Table 3.
WRIA # WRIA Name Top 59 Top 30
5 Stillaguamish 2 1
7 Snohomish 14 6
8 Cedar-Sammamish 9 0
9 Duwamish-Green9 11 9
10 Puyallup-White 1 1
13 Deschutes 3 0
15 Kitsap 18 12
18 Elwha-Dungeness 1 1
The agency responsible for data collection for the top sites prioritized for restoration Table 4.strategy development.
Collection Agency Top 59 Top 30
Clallam County 1 1
King County - DNRP 16 8
King County - Roads 14 4
Kitsap County 14 8
Pierce County 5 5
Snohomish County 6 4
Thurston County 3 0
9 For the purposes of salmon conservation planning, Vashon-Maury Island was transferred from WRIA 15 to WRIA 9. Vashon-Maury Island is considered part of WRIA 9 for this project.

B-IBI Restoration Decision Framework and Site Identification
King County Science and Technical Support Section 22 July 2014
Figure 9. Location of the top 30 “fair” sites (green dots) after applying the restoration decision framework criteria.
The 59 sites sites before biological potential ranking are shown in yellow, all sites with median “fair” scores are shown in red, and all B-IBI sampling locations are shown as hollow circles for context.
B-IBI Restoration Decision Framework and Site Identification
King County Science and Technical Support Section 23 July 2014
6.0 CONCLUSIONS AND NEXT STEPS
The restoration prioritization framework provides an approach for identifying sites for future restoration actions. The decision framework includes criteria that have been identified as being important in recent scientific reviews regarding restoration and allows for a systematic review of sites to maximize potential success. Although more information about the watersheds and the sites themselves would be helpful when prioritizing sites, this framework enables a rapid evaluation of over 1000 sites using readily available desktop data. As additional information from sites becomes available, particularly data that allow measurement of the influence of human and natural disturbances over time, the framework should be expanded and/or modified accordingly. However, until then, the initial framework provides a transparent guide for efficiently identifying where restoration actions, the type and scale of which have yet to be defined, may provide the highest likelihood of meeting the PSP target of improving B-IBI scores from “fair” to “good.” By applying the current restoration decision framework, 59 sites were identified from 1053, which represent “fair” B-IBI sites with probable improvement potential and that should be considered further for assessing biological effectiveness of restoration actions. Of these, the top 30 sites have been identified based on their potential for biological lift. However, these may not be the final 30 that are ultimately chosen for restoration strategy development. As this project enters the next phase of trying to identify particular stressors and potential restoration strategies on a watershed by watershed basis, it is possible that there may be some sites where appropriate restoration strategies cannot be identified for one reason or another. If this does in fact happen, such sites will be moved to the bottom of the 59-site list and all other sites will move up in priority.
6.1 Other Factors Considered
Numerous additional factors or criteria were considered when developing the restoration decision framework, and any and all information available may inform the development of restoration strategies for the prioritized sites. It was beyond the scope of this project to assemble data at the scale of Puget Sound for some factors such as land ownership or the location for proposed restoration projects. However, these will be considered on a site by site or watershed by watershed basis as stressors are identified and restoration strategies and management actions are considered. Additional pieces of information such as hydrology metrics calculated from gaging data or water quality data are only available at specific locations and may be considered where data are available. Other factors such as connectivity to source invertebrate populations or watershed context (e.g., the condition of the riparian buffer relative to the condition of the whole watershed) were deemed more applicable to identifying potential restoration strategies than as coarse filters with established thresholds to be used in the decision framework that would dictate inclusion or exclusion of sites.

B-IBI Restoration Decision Framework and Site Identification
King County Science and Technical Support Section 24 July 2014
6.2 Next Steps
With the restoration decision framework defined and the top priority sites identified, the next steps include developing restoration strategies and planning level cost estimates for the top 30 “fair” sites and developing potential preservation/conservation strategies and planning level cost estimates for the “excellent” sites. These steps will likely involve (1) identifying what types of restoration actions are possible, and (2) trying to identify key stressors with available desktop information10 in each watershed that are contributing to low B-IBI scores so that appropriate restoration strategies can be identified. The PSWC and biological potential in the context of individual invertebrate metrics may both prove to have utility in identifying key stressors. Local experts and staff from jurisdictions where these sites are located will be sought to contribute their knowledge and expertise regarding the high priority sites to help identify areas of potential overlap with existing restoration/conservation efforts that could be enhanced (e.g., high priority reaches in the salmon recovery plans), to help understand local conditions and disturbances which may be driving the B-IBI scores, and to initiate engagement with partners who will be critical in restoration implementation. A second stakeholder workshop will be held to provide peer review and input on the draft preservation and restoration strategies.
10 The scope of work specifically states this project will not include any field work.

B-IBI Restoration Decision Framework and Site Identification
King County Science and Technical Support Section 25 July 2014
7.0 LITERATURE CITED
Adams, S. M., W. R. Hill, M. J. Peterson, M. G. Ryon, J. G. Smith, and A. J. Stewart. 2002.
Assessing recovery in a stream ecosystem: applying multiple chemical and
biological endpoints. Ecological Applications 12(5):1510-1527.
Allan, J. D. 1995. Stream ecology: structure and function of running waters. Kluwer
Academic Publishers, Boston, MA.
Albertson, L. K., B. J. Cardinale, S. C. Zeug, L. R. Harrison, H. S. Lenihan, and M. A. Wydzga.
2010. Impacts of Channel Reconstruction on Invertebrate Assemblages in a
Restored River. Restoration Ecology 19:627-638.
Bernhardt, E. S., M. A. Palmer, J. D. Allan, G. Alexander, K. Barnas, S. Brooks, J. Carr, S.
Clayton, C. Dahm, J. Follstad-Shah, D. Galat, S. Gloss, P. Goodwin, D. Hart, B. Hassett,
R. Jenkinson, S. Katz, G. M. Kondolf, P. S. Lake, R. Lave, J. L. Meyer, T. K. O’Donnell, L.
Pagano, B. Powell, E. Sudduth. 2005. Synthesizing U.S. River Restoration Efforts.
Science 308:636-637.
Blakely, T. J., J. S. Harding, A. R. McIntosh, and M. J. Winterbourn. 2006. Barriers to the
recovery of aquatic insect communities in urban streams. Freshwater Biology
51:1634-1645.
Brederveld, R. J., S. C. Jähnig, A. W. Lorenz, S. Brunzel, and M. B. Soons. 2011. Dispersal as a
limiting factor in the colonization of restored mountain streams by plants and
macroinvertebrates. Journal of Applied Ecology 48:1241-1250.
Bunn, S. E., E. G. Abal, M. J. Smith, S. C. Choy, C. S. Fellows, B. D. Harch, M. J. Kennard, and F.
Sheldon. 2010. Integration of science and monitoring of river ecosystem health to
guide investments in catchment protection and rehabilitation. Freshwater Biology
55:223-240.
[CEC] Commission for Environmental Cooperation. 1997. Ecological regions of North
America: toward a common perspective. Commission for Environmental
Cooperation, Montreal, Quebec, Canada. 71p. Map (scale 1:12,500,000).
[CEC] Commission for Environmental Cooperation. 2006. Ecological regions of North
America - Levels I, II, and III. Commission for Environmental Cooperation, Montreal,
Quebec, Canada. Map (scale 1:10,000,000).
Chin, A., F. Gelwick, D. Laurencio, L. R. Laurencio, M. S. Byars, and M. Scoggins. 2010.
Linking Geomorphological and Ecological Responses in Restored Urban Pool-Riffle
Streams. Ecological Restoration 28:460-474.

B-IBI Restoration Decision Framework and Site Identification
King County Science and Technical Support Section 26 July 2014
Clements, W. H., N. K. M. Vieira, and D. L. Sonderegger. 2010. Use of ecological thresholds to
assess recovery in lotic ecosystems. Journal of the North American Benthological
Society 29:1017-1023.
Clarke, A., R. Mac Nally, N. Bond, and P. S. Lake. 2008a. Macroinvertebrate diversity in
headwater streams: a review. Freshwater Biology 53:1707-1721.
Clarke, S. E., K. M. Burnett, and D. J. Miller. 2008b. Modeling streams and hydrogeomorphic
attributes in Oregon from digital and field data. Journal of the American Water
Resources Association 44:459-477.
Cusimano, R., Merritt, G., Plotnikoff, R., Wiseman, C., Smith, C. & Washington State
Department of Fish and Wildlife (2006) Status and Trends Monitoring for
Watershed Health and Salmon Recovery: Quality Assurance Monitoring Plan. p. 62.
Environmental Assessment Program Washington State Department of Ecology,
Ecology Publication No. 06-03-203, Olympia, Washington.
Davis, S., S. W. Golladay, G. Vellidis, and C. M. Pringle. 2003. Macroinvertebrate
biomonitoring in intermittent coastal plain streams impacted by animal agriculture.
Journal of Environmental Quality 32:1036-1043.
DeGasperi, C. L., H. B. Berge, K. R. Whiting, J. J. Burkey, J. L. Cassin, and R. R. Fuerstenberg.
2009. Linking hydrologic alteration to biological impairment in urbanizing streams
of the Puget Lowland, Washington, USA. Journal of the American Water Resources
Association 45:512-533.
Delucchi, C. M. 1988. Comparison of community structure among streams with different
temporal flow regimes. Canadian Journal of Zoology 66:579-586.
[EPA] U.S. Environmental Protection Agency. 2013. Level III ecoregions of the continental
United States. Map. (1:7,500,000). U.S. EPA - National Health and Environmental
Effects Research Laboratory, Corvallis, Oregon.
Feld, C.K., S. Birk, D. C. Bradley, D. Hering, J. Kail, A. Marzin, A. Melcher, D. Nemitz, M. L.
Pedersen, F. Pletterbauer, D. Pont, P. F. M. Verdonschot, and N. Friberg. 2011. From
Natural to Degraded Rivers and Back Again: A Test of Restoration Ecology Theory
and Practice. Advances in Ecological Research 44:119-209.
Feminella, J. W. 1996. Comparison of benthic macroinvertebrate assemblages in small
streams along a gradient of flow permanence. Journal of the North American
Benthological Society 15:651-669.
Flotemersch, J. E., J. B. Stribling, and M. J. Paul. 2006. Concepts and approaches for the
bioassessment of non-wadeable streams and rivers. U.S. Environmental Protection
Agency, Cincinnati, Ohio.
Fore, L., R. Wisseman, J. O. Wilhelm, D. Lester, K. Adams, G. Hayslip, and P. Leinenbach.
2013. Using natural history attributes of stream invertebrates to measure stream

B-IBI Restoration Decision Framework and Site Identification
King County Science and Technical Support Section 27 July 2014
health. King County Department of Natural Resources and Parks, Seattle,
Washington.
Franklin, J. F. and C. T. Dyrness. 1973. Natural vegetation of Oregon and Washington. USDA
Forest Service Gen. Tech. Rep., PNW-8, Portland, Oregon.
Friberg, N., A. Baattrup-Pedersen, E. A. Kristensen, B. Kronvang, S. E. Larsen, M. L. Pedersen,
J. Skriver, H. Thodsen, and P. Wiberg-Larsen. 2013. The River Gelså restoration
revisited: Habitat specific assemblages and persistence of the macroinvertebrate
community over an 11-year period. Ecological Engineering 66:150-157.
Galic, N., G. M. Hengeveld, P. J. Van den Brink, A. Schmolke, P. Thorbek, E. Bruns, and H. M.
Baveco. 2013. Persistence of Aquatic Insects across Managed Landscapes: Effects of
Landscape Permeability on Re-Colonization and Population Recovery. PLoS ONE
8(1):e54584. doi:10.1371/journal.pone.005484.
Gesch, D., Oimoen, M., Greenlee, S., Nelson, C., Steuck, M., and Tyler, D. 2002. The National
Elevation Dataset. Photogrammetric Engineering and Remote Sensing 68:5-11.
Gesch, D. B. 2007. The National Elevation Dataset. Pages 99-118 in D. Maune, editor. Digital
Elevation Model Technologies and Applications: The DEM User’s Manual, 2nd
Edition. American Society for Photogrammetry and Remote Sensing, Bethesda,
Maryland.
Gore, J. A. 1985. Mechanisms of colonization and habitat enhancement for benthic
macroinvertebrates in restored river channels in J. A. Gore, editor. The Restoration
of Rivers and Streams: Theories and Experience. Butterworth Publishers, Boston,
MA.
Herbst, D. B., and J. M. Kane. 2009. Responses of aquatic macroinvertebrates to stream
channel reconstruction in a degraded rangeland creek in the Sierra Nevada.
Ecological Restoration 27:76-88.
Hilderbrand, R. H., A. C. Watts, and A. M. Randle. 2005. The myths of restoration ecology.
Ecology and Society 10:19.
Jaeger, K. L., D. R. Montgomery, and S. M. Bolton. 2007. Channel and perennial flow
initiation in headwater streams: Management implications of variability in source-
area size. Environmental Management 40:775-786.
Jähnig, S. C., K. Brabec, A. Buffagni, S. Erba, A. W. Lorenz, T. Ofenböck, P. F. M. Verdonschot,
and D. Hering. 2010. A comparative analysis of restoration measures and their
effects on hydromorphology and benthic invertebrates in 26 central and southern
European rivers. Journal of Applied Ecology 47:671-680.
Jansson, R., C. Nilsson, and B. Malmqvist. 2007. Restoring freshwater ecosystems in riverine
landscapes: the roles of connectivity and recovery processes. Freshwater Biology
52:589-596.

B-IBI Restoration Decision Framework and Site Identification
King County Science and Technical Support Section 28 July 2014
Karr, J.R., Fausch, K.D., Angermeier, P.L., Yant, P.R. & Schlosser, I.J. 1986. Assessing
biological integrity in running waters: a method and its rationale. Illinois Natural
History Survey Special Publication, 5, 1-28.
King County. 2014a. Strategies for preserving and restoring small Puget Sound drainages:
Task 2 - geospatial analysis. Prepared by Chris Gregersen, Jo Opdyke Wilhelm, and
Chris Knutson, Water and Land Resources Division. Seattle, Washington.
King County. 2014b. Assessing land use effects and regulatory effectiveness on streams in
rural watersheds of King County. Prepared by Gino Lucchetti, Jeff Burkey, Chris
Gregersen, Leska Fore (Statistical Design), Chris Knutson, Josh Latterell, Paul
McCombs, Ray Timm, Jennifer Vanderhoof, and Jo Opdyke Wilhelm, Water and Land
Resources Division. Seattle, Washington.
King County. 2013. Watershed delineation and land cover calculations for Puget Sound
stream basins. Prepared by Jo Opdyke Wilhelm (King County Water and Land
Resources Division), Peter Leinenbach (US Environmental Protection Agency),
Leska Fore (Statistical Design), Deb Lester (King County Water and Land Resources
Division), Karen Adams (Washington State Department of Ecology), and Gretchen
Hayslip (US Environmental Protection Agency). Seattle, Washington.
King County. Unpublished 2010 draft. A salmon-based classification to guide fish protection
measures for agricultural waterways maintenance. Prepared by Gino Lucchetti and
Kollin Higgins. Water and Land Resources Division. Seattle, Washington.
King County. 2002. Sampling and analysis plan: Ambient streams and rivers routine
monitoring, ambient streams and rivers wet weather monitoring, and SWAMP
streams and rivers trace metals and organics monitoring. Prepared by Bob Kruger,
King County Environmental Laboratory, King County Water and Land Resources
Division, Seattle, Washington.
Knop, E., F. Herzog, and B. Schmid. 2011. Effect of connectivity between restoration
meadows on invertebrates with contrasting dispersal abilities. Restoration Ecology
19:151-159.
Konrad, C. 2000. The frequency and extent of hydrologic disturbances in streams in the
Puget Lowland, Washington. University of Washington, Seattle, WA.
Laasonen, P., T. Muotka, and I. Kivijärvi. 1998. Recovery of macroinvertebrate communities
from stream habitat restoration. Aquatic Conservation: Marine and Freshwater
Ecosystems 8:101-113.
Langford, T. E. L., P. J. Shaw, A. J. D. Ferguson, and S. R. Howard. 2009. Long-term recovery
of macroinvertebrate biota in grossly polluted streams: Re-colonisation as a
constraint to ecological quality. Ecological Indicators 9:1064-1077.
B-IBI Restoration Decision Framework and Site Identification
King County Science and Technical Support Section 29 July 2014
Lazorchak, J. M., B. H. Hill, D. K. Averill, D. V. Peck, and D. J. Klemm. 2000. Environmental
Monitoring and Assessment Program - Surface Waters: Field Operations and
Methods for Measuring the Ecological Condition of Non-Wadeable Rivers and
Streams. EPA/620/R-00/007, Environmental Protection Agency, Cincinnati, Ohio.
Leinenbach, P. 2011a. Automated watershed digitization using NHDPlus datasets and the
ArcHydro extension. United States Environmental Protection Agency (USEPA),
Seattle, Washington.
Leinenbach, P. 2011b. Landscape sampling of the 1027 sampling sites in the Puget Sound
Basin. United States Environmental Protection Agency (USEPA), Seattle,
Washington.
Lepori, F., D. Palm, E. Brannas, and B. Malmqvist. 2005. Does restoration of structural
heterogeneity in streams enhance fish and macroinvertebrate diversity? Ecological
Applications 15:2060-2071.
Lorenz, A., S. Jähnig, and D. Hering. 2009. Re-Meandering German Lowland Streams:
Qualitative and Quantitative Effects of Restoration Measures on Hydromorphology
and Macroinvertebrates. Environmental Management 44:745-754.
Louhi, P., Mykra, H., Paavola, R., Huusko, A., Vehanen, T., Maki-Petays, A., and Muotka, T.
2011. Twenty years of stream restoration in Finland: little response by benthic
macroinvertebrate communities. Ecological Application 21:1950-1961.
Merovich, G. T., J. T. Petty, M. P. Strager, and J. B. Fulton. 2013. Hierarchical classification of
stream condition: a house–neighborhood framework for establishing conservation
priorities in complex riverscapes. Freshwater Science 32:874-891.
Miller, S. W., P. Budy, and J. C. Schmidt. 2010. Quantifying Macroinvertebrate Responses to
In-Stream Habitat Restoration: Applications of Meta-Analysis to River Restoration.
Restoration Ecology 18:8-19.
Morley, S. A. 2000. Effects of urbanization on the biological integrity of Puget Sound
lowland streams: Restoration with a biological focus. University of Washington,
Seattle.
Morley, S. A., and J. R. Karr. 2002. Assessing and restoring the health of urban streams in
the Puget Sound basin. Conservation Biology 16:1498-1509.
Muotka, T., R. Paavola, A. Haapala, M. Novikmec, and P. Laasonen. 2002. Long-term
recovery of stream habitat structure and benthic invertebrate communities from in-
stream restoration. Biological Conservation 105:243-253.
[NOAA] National Oceanic and Atmospheric Administration Coastal Services Center. 2011.
The Coastal Change Analysis Program (C-CAP) Regional Land Cover., NOAA Coastal
Services Center, Charleston, South Carolina. Accessed at
www.csc.noaa.gov/digitalcoast/data/ccapregional.

B-IBI Restoration Decision Framework and Site Identification
King County Science and Technical Support Section 30 July 2014
Northington, R. M., and A. E. Hershey. 2006. Effects of stream restoration and wastewater
treatment plant effluent on fish communities in urban streams. Freshwater Biology
51:1959-1973.
Omernik, J. M. 1987. Ecoregions of the conterminous United States. Map Supplement (scale
1:7,500,000). Ann. of the Association of American Geographers 77:118-125.
Omernik, J. M. 1995. Ecoregions: a spatial framework for environmental management.
Pages 49-62 in W. S. Davis and T. P. Simon, editors. Biological Assessment and
Criteria: Tools for Water Resource Planning and Decision Making. Lewis Publishers,
Boca Raton, FL.
Page, N. A., L. S. Fore, M. Eymann, and J. C. 2008. Assessment of the use of B-IBI in greater
Vancouver streams (2003-2006). Prepared for Metro Vancouver LWMP
Environmental Management, Vancouver, BC.
Palmer, M. A., H. L. Menninger, and E. Bernhardt. 2010. River restoration, habitat
heterogeneity and biodiversity: a failure of theory or practice? Freshwater Biology
55:205-222.
Palmquist, R. 2005. Type N stream demarcation pilot study (PIP report). Washington State
DNR: Cooperative Monitoring Evaluation and Research Committee of Timber, Fish,
and Wildlife.
Parkyn, S. M., and B. J. Smith. 2011. Dispersal constraints for stream invertebrates: setting
realistic timescales for biodiversity restoration. Environmental Management
48:602-614.
Paul, M. J., D. W. Bressler, A. H. Purcell, M. T. Barbour, E. T. Rankin, and V. H. Resh. 2009.
Assessment Tools for Urban Catchments: Defining Observable Biological Potential.
JAWRA Journal of the American Water Resources Association 45:320-330.
[PSP]Puget Sound Partnership. 2012. The 2012/2013 Action Agenda for Puget Sound. p.
499. Puget Sound Partnership, Olympia, Washington.
Spänhoff, B., and J. Arle. 2007. Setting Attainable Goals of Stream Habitat Restoration from
a Macroinvertebrate View. Restoration Ecology 15:317-320.
Stanley, S. 2010. Puget Sound Watershed Characterization - Introduction to the Water Flow
Assessment for Puget Sound. Washington State Department of Ecology, Olympia,
Washington.
Stanley, S., S. Grigsby, D. Booth, D. Hartley, R. Horner, T. Hruby, J. Thomas, P. Bissonnette, R.
Fuerstenberg, J. Lee, P. Olson, and G. Wilhere. 2012. Puget Sound Characterization -
Volume 1: The Water Resource Assessments (Water Flow and Water Quality)
Washington State Department of Ecology, Olympia, Washington.

B-IBI Restoration Decision Framework and Site Identification
King County Science and Technical Support Section 31 July 2014
Stranko, S. A., R. H. Hilderbrand, and M. A. Palmer. 2012. Comparing the Fish and Benthic
Macroinvertebrate Diversity of Restored Urban Streams to Reference Streams.
Restoration Ecology 20:747–755.
Sundermann, A., S. Stoll, and P. Haase. 2011. River restoration success depends on the
species pool of the immediate surroundings. Ecological Applications 21:1962-1971.
Suren, A. M., and S. McMurtrie. 2005. Assessing the effectiveness of enhancement activities
in urban streams: II. Responses of invertebrate communities. River Research and
Applications 21:439-453.
Thomas, G. 2014. Improving restoration practice by deriving appropriate techniques from
analysing the spatial organization of river networks. Limnologica - Ecology and
Management of Inland Waters 45:50-60.
Urban, M. C., D. K. Skelly, D. Burchsted, W. Price, and S. Lowry. 2006. Stream communities
across a rural-urban landscape gradient. Biodiversity research 12:337-350.
Vannote, R. L., G. W. Minshall, K. W. Cummins, J. R. Sedell, and C. E. Cushing. 1980. The river
continuum concept. Canadian Journal of Fisheries and Aquatic Sciences 37:130-137.
Wachter, H. M. 2003. Application of the benthic index of biotic integrity (B-IBI) to
headwater streams in the Puget Lowland. University of Washington, Seattle.
Walsh, C. J., T. D. Fletcher, and A. R. Ladson. 2005. Stream restoration in urban catchments
through redesigning stormwater systems: looking to the catchment to save the
stream. Journal of the North American Benthological Society 24:690-705.
Wessell, K., R. Merritt, J. Wilhelm, J. D. Allan, K. Cummins, and D. Uzarski. 2008. Biological
evaluation of Michigan's non-wadeable rivers using macroinvertebrates. Aquatic
Ecosystem Health & Management 11:335-351.
Wootton, J. T. 2012. River Food Wed Response to Large-Scale Riparian Zone Manipulations.
PLoS ONE 7(12): e51839. doi:10.1371/journal.pone.0051839.
Wulkan, B. 2011. Setting targets for Puget Sound recovery: Revised addendum to technical
memorandum on runoff from the built environment dated March 23, 2011. Puget
Sound Partnership, Tacoma, Washington.

B-IBI Restoration Decision Framework and Site Identification
King County Science and Technical Support Section 32 July 2014
APPENDICES
Appendix A: PSSB Project Web Page
Appendix B: B-IBI10-50 vs. B-IBI0-100
Appendix C: QA/QC of B-IBI Data
Appendix D: B-IBI Biological Condition Categories
Appendix E: QA/QC of Watershed Delineations
Appendix F: Stakeholder Workshop Agenda
Appendix G: Stakeholder Feedback Exercise
Appendix H: Restoration Literature Consulted

B-IBI Restoration Decision Framework and Site Identification
King County Science and Technical Support Section 33 July 2014
Appendix A: PSSB Project Web Page
Deliverables and presentations related to this project will be posted to the project web page on the Puget Sound Stream Benthos website (Figure A-1): http://pugetsoundstreambenthos.org/Projects/Restoration-Priorities-2014.aspx
Figure A-1. Screen Capture of the “Restoration Priorities” project page on the PSSB.
Presentations and deliverables are available for download and this page will be routinely updated throughout the duration of this project.

B-IBI Restoration Decision Framework and Site Identification
King County Science and Technical Support Section 34 July 2014
Appendix B: B-IBI10-50
vs. B-IBI0-100
The justification for deciding to use the 10-50 B-IBI scoring system instead of the recently updated 0-100 scoring system is summarized here.
1. The agreement and scope of work between King County and Ecology specified selecting “fair” sites for restoration based on the original 10-50 scoring system.
2. The PSP Ecosystem Recovery Targets (28-36 for “fair” and > 42 for “excellent” sites) are based on the 10-50 scoring system. There is no timeline for when PSP might evaluate whether their targets are applicable regardless of the scoring system or if the targets need to be modified.
3. While the two scoring systems are highly correlated, “fair” does not mean the same thing in both scoring systems. The distribution of the sites in qualitative condition categories such as “good,” “fair,” “poor,” etc. changes considerably with the new 0-100 scoring system. For example, the majority of sites (~59%) that were “fair” with the 10-50 B-IBI are considered “good” with the 0-100 B-IBI. However, the result of shifting to the 0-100 scoring system for selecting “fair” sites would significantly alter the list of sites that are identified and ranked. The PSP decision to identify “fair” sites using the 10-50 scoring system was informed at least in part by a discussion of the number of sites in King County that were “fair” or below (63%, Wulkan 2011). There was a sense that focusing on “fair” sites would ensure targeting sites that were not terribly degraded (e.g., “poor” or “very poor”) such that restoration could result in measureable improvement in stream condition. Using the 0-100 scoring system to select “fair” sites would select sites that are relatively more degraded (“poor” in the 10-50 B-IBI) and are likely harder to restore.
4. Both the 10-50 and 0-100 B-IBI were presented at the March 2014 stakeholder workshop. The 10-50 scoring system was used to identify which sites met the “fair” criteria, with the 0-100 B-IBI used for calculating the biological potential. This approach addresses the fact that the 10-50 scoring system was referenced in the scope of work and the PSP targets and allows for incorporation of the improved 0-100 B-IBI for other aspects of the project. However, switching between the two B-IBIs caused considerable confusion and it was clear that one scoring system needs to be selected and used throughout the project.
5. While the 0-100 B-IBI has been presented at a number of conferences and stakeholder workshops, there is not yet a final report or publication documenting the recalibration of the B-IBI.
The timing does not mesh well with the deliverable timeline for this project, but eventually the PSP target and future renditions of the restoration decision framework should shift to utilizing the 0-100 B-IBI even though the “fair” condition for the two B-IBIs does not identify the same pool of sites (see item #3 above and Table C-1 below). When the recovery targets are modified to include the new scoring system, rather than specifying that 30 “fair” sites be improved to “good,” it may be more appropriate to target improvement for 30 sites
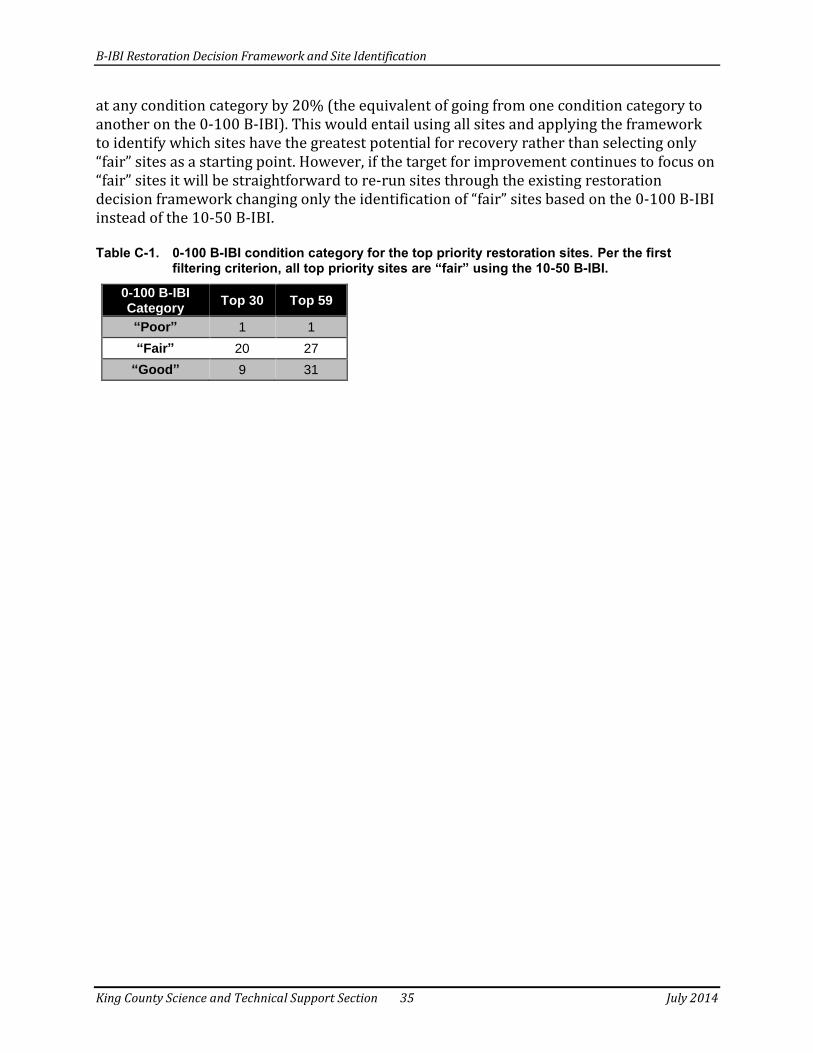
B-IBI Restoration Decision Framework and Site Identification
King County Science and Technical Support Section 35 July 2014
at any condition category by 20% (the equivalent of going from one condition category to another on the 0-100 B-IBI). This would entail using all sites and applying the framework to identify which sites have the greatest potential for recovery rather than selecting only “fair” sites as a starting point. However, if the target for improvement continues to focus on “fair” sites it will be straightforward to re-run sites through the existing restoration decision framework changing only the identification of “fair” sites based on the 0-100 B-IBI instead of the 10-50 B-IBI. Table C-1. 0-100 B-IBI condition category for the top priority restoration sites. Per the first
filtering criterion, all top priority sites are “fair” using the 10-50 B-IBI.
0-100 B-IBI Category
Top 30 Top 59
“Poor” 1 1
“Fair” 20 27
“Good” 9 31

B-IBI Restoration Decision Framework and Site Identification
King County Science and Technical Support Section 36 July 2014
Appendix C: QA/QC of B-IBI Data
B-IBI scores were downloaded from the PSSB on November 18, 2013 for this project using the “Metric by Year” download option. Some site duplication was present in the data. If these duplicates were not addressed, some sites would be erroneously removed from consideration based on sampling history that does not accurately reflect the number of times a site was sampled. The following quality assurance/quality control (QA/QC) steps were taken after data download and importation into Excel to identify and merge duplicate site data:
1. Identify and merge site ID duplicates. Site ID is a unique number assigned by the PSSB to each site. However, some sites are assigned to multiple projects often in different years. The B-IBI data for a site ID represented in multiple projects are downloaded into multiple rows representing each project. These multiple rows were consolidated so that each site ID only has one row of data.
2. Identify and merge site code duplicates. Site code is defined by a project steward for each agency with data in the PSSB. There are a few cases where sites initially sampled by one agency were taken over by another agency. For example, from 2009 to 2013 the King County WRIA 8 sampling project took over several regional sentinel sites previously sampled by Ecology. The B-IBI data for a site code representing different agencies are downloaded into multiple rows representing each agency. These multiple rows were confirmed to be from the same site and were consolidated so that each site code only has one row of data11.
Identify latitude/longitude duplicates and merge if appropriate. Latitude and longitude for each site location are reported in decimal degrees to at least 6 decimal places. Several sites had identical latitude/longitude locations and were investigated more closely12. It appears that some project stewards have created new site codes for sites that are very proximate and it is necessary to contact each project steward to determine if the sites are indeed the same13. To minimize time consuming outreach, only the sites that would emerge from the filtering criteria described in this report were investigated further. Per communication with Jennifer Oden of Snohomish County, two sites on Ricci Creek (site codes “ricci” and “7-279”) and two sites on Swartz Lake Creek (site codes “swlktr” and “7-981”) were deemed to represent one site on each of the creeks. Once these multiple rows were confirmed to be from the same site, the rows were consolidated.
11 There was one case where the same site code was sampled in 2011 and 2012. In both cases, the sample that was collected earlier in the calendar year was selected to be the “official” B-IBI score. The latter sample results could be influenced by the previous sampling activity and stream disruption. 12 Sites that were close, but not exact matches were assumed to be unique and were not further evaluated. However, latitude/longitude duplicates to fewer decimal places (e.g., 3 or 4) or a GIS buffering exercise may reveal additional sites with data effectively describing the same location. 13 It is possible that very proximate sites may be up and downstream of a restoration action or paired on the mainstem and mouth of a tributary and are intentionally set up as separate sites because they are measuring different conditions. In other cases, staff turnover or the creation of a new sampling design may explain why new site codes were created for what could effectively be considered the same site.

B-IBI Restoration Decision Framework and Site Identification
King County Science and Technical Support Section 37 July 2014
Appendix D: B-IBI Biological Condition Categories
The B-IBI scoring system is a quantitative method for determining and comparing the biological condition of streams. The B-IBI is composed of 10 metrics and each individual metric is given a score of 1, 3, or 5, with higher numbers given to conditions representative of streams unaltered by anthropogenic influence. These metrics are then added together for the single, integrated overall B-IBI score ranging from 10 to 50 which fall in one of five biological condition classes (Table D-1). Table D-1. Five classes of biological condition categories modified from Karr et al. (1986) by
Morley (2000).
Biological Condition
Description B-IBI Range
Excellent Comparable to least disturbed reference condition; overall high taxa diversity, particularly of mayflies, stoneflies, caddis flies, long-lived, clinger, and intolerant taxa. Relative abundance of predators high.
46-50
Good Slightly divergent from least disturbed condition; absence of some long-lived and intolerant taxa; slight decline in richness of mayflies, stoneflies, and caddis flies; proportion of tolerant taxa increases
38-44
Fair Total taxa richness reduced – particularly intolerant, long-lived, stonefly, and clinger taxa; relative abundance of predators declines; proportion of tolerant taxa continues to increase
28-36
Poor Overall taxa diversity depressed; proportion of predators greatly reduced as is long-lived taxa richness; few stoneflies or intolerant taxa present; dominance by three most abundant taxa often very high
18-26
Very Poor Overall taxa diversity very low and dominated by a few highly tolerant taxa; mayfly, stonefly, caddis fly, clinger, long-lived, and intolerant taxa largely absent; relative abundance of predators very low
10-16
The PSP freshwater macroinvertebrate target specifies that 100 percent of Puget Sound lowland stream drainage areas monitored with baseline B-IBI scores of 42-46 or higher retain these “excellent” scores. Therefore, the term “excellent” for the purposes of this project extends from 42 to 50 and includes part of the B-IBI “good” condition class.

B-IBI Restoration Decision Framework and Site Identification
King County Science and Technical Support Section 38 July 2014
Appendix E: QA/QC of Watershed Delineations
Basins for contributing watersheds were delineated automatically based on the pour point of the basin and the topology of the watershed (see methods in Leinenbach 2011a, 2011b and King County 2013). For the most part this methodology produces accurate basins, though occasionally erroneous boundaries are produced that render the delineated basin unusable. Because of this, all the basins were QA/QC’d to check for proper delineation and to make sure the pour point of the basin aligned with the sampling location. 1,125 basins were assessed, and of these a total of 72 were removed from further consideration due to one of the errors listed below14. Therefore, the restoration decision framework was applied to the remaining 1,053 basins. Several delineation errors were identified during the QA/QC process including the following:
Point used for delineation not in proper location. Occasionally the point used to delineate the basin was in the wrong location, which would cause the delineation to follow that point as if it were on a stream when in fact it wasn’t (Figure E-1). These errors generally resulted in basins that were often much smaller than the actual basin. Basins were delineated in a matter that snapped them to the nearest NHD stream; however, if the point used for delineation was not in the correct location this often produced an erroneous basin.
14 Only four of the 72 basins with delineation errors were sites that met the filter conditions (e.g., median “fair” B-IBI scores within the Puget Lowland ecoregion with appropriate sampling history and basins areas between 200 and 3000 acres) and would have been run through the Puget Sound Watershed Characterization model. These four basins included Deep and Stonequarry creeks in the Green Duwamish basin and Walsh Lake diversion and a Cottage Lake Creek tributary in the Cedar/Sammamish basin.

B-IBI Restoration Decision Framework and Site Identification
King County Science and Technical Support Section 39 July 2014
Figure E-1. Example of a delineated basin where the pour point was not in the correct location resulting in an erroneous delineation. In this example, the point should have snapped to the stream (red arrow), which then would have allowed accurate delineation.
Improper watershed delineated. In this situation, points used for delineation were
in close proximity to a tributary stream and as a result the automated delineation was done in error for the wrong basin, or just for a tributary of the basin (Figure E-2). These resulted in basins that were either outside of the actual basin, only a portion of the actual basin, or much larger than the actual basin.

B-IBI Restoration Decision Framework and Site Identification
King County Science and Technical Support Section 40 July 2014
Figure E-2. Example of a delineated basin where the pour point was erroneously located
downstream of a tributary confluence resulting in an inaccurately large basin delineation. The pour point should have been upstream of the tributary confluence on the north tributary, which would have resulted in a basin about half the size. The horizontal blue line represents an approximation of the southern extent of the correctly delineated basin.
Delineated boundary error. Due to general mapping errors or areas with flat
topology that are difficult to delineate, many basins had erroneous boundaries that were improperly delineated for unknown reasons (Figure E-3).

B-IBI Restoration Decision Framework and Site Identification
King County Science and Technical Support Section 41 July 2014
Figure E-3. Example of a delineated basin where the stream layer used for the delineation seems
to be the source of error. The basin highlighted with a turquoise outline includes an area at the upstream extent that is not hydrologically connected to the rest of the basin and this area should have been omitted from the basin delineation.
During the QA/QC process, basins were checked in several ways. First, the sampling point location was checked to confirm the point corresponded to the pour point of the delineated watershed. Next, the basin was checked against the most recent ortho imagery, topography, and the national hydraulic dataset stream layer. This visual check was done to confirm that the stream and all tributaries were included within the delineated basin while also making sure no outside streams or portions of other basins were included. For small tributaries and large tracts of basins without prominent topology or defined streams, it was occasionally difficult to be positive that the delineated basin was correct. Because basins were delineated with the best available data, areas that were unclear were considered to be properly delineated. Basin delineations were only considered erroneous and therefore omitted from future consideration if there was clear evidence that the basin was improperly delineated.
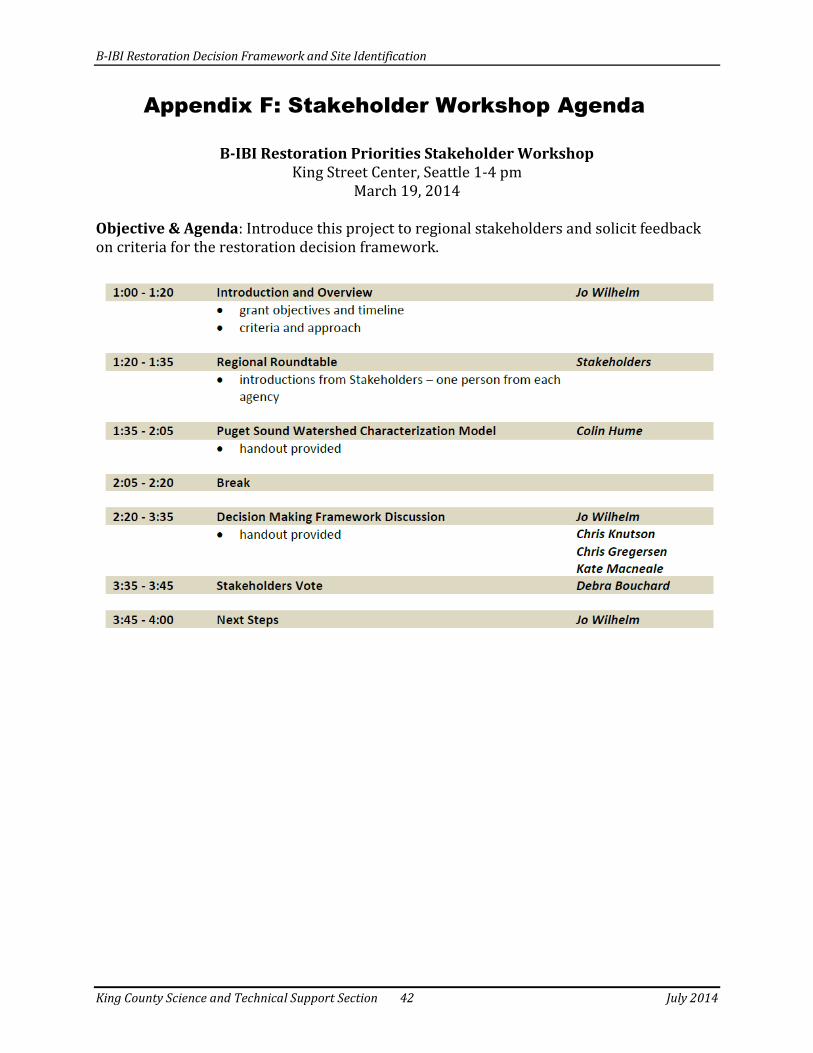
B-IBI Restoration Decision Framework and Site Identification
King County Science and Technical Support Section 42 July 2014
Appendix F: Stakeholder Workshop Agenda
B-IBI Restoration Priorities Stakeholder Workshop
King Street Center, Seattle 1-4 pm March 19, 2014
Objective & Agenda: Introduce this project to regional stakeholders and solicit feedback on criteria for the restoration decision framework.

B-IBI Restoration Decision Framework and Site Identification
King County Science and Technical Support Section 43 July 2014
Appendix G: Stakeholder Feedback Exercise
We asked participants to weigh in on which criteria they deemed the most important by placing dots in one of the eleven criteria presented. Participants added a twelfth category related to possible restoration actions. Each attendee was given 12 dots to distribute based on their best professional judgment. This feedback (Table G-1) was integral in developing the final restoration decision framework. Table G-1. Criteria presented for consideration in the restoration decision framework. Workshop
participants voted for different criteria with each attendee given 12 dots to represent what they think are the most important factors.
Factor/Criteria Description of filtering or ranking options presented # dots
Puget Sound Watershed Characterization Model
Utilize the water flow processes model to either calculate and ranking importance minus degradation or use the protection/restoration management matrix.
25
Watershed Area Filtering for sites that have contributing watersheds between 200 and 3000 acres.
7
Mean B-IBI Filtering for sites that have a mean “Fair” score. Median was discussed as more suitable and will likely be used.
25
Sampling History Filtering for sites that have a long sampling record (N>5) if they have not been sampled in recent years (since 2008).
12
Threatened Fish Ranking sites based on the presence of threatened fish (bull trout, Chinook, steelhead).
6
% Natural Buffer Sites with >50% natural landcover in the buffer score higher. “Natural” includes forest, shrub, wetland, and grass landcover.
12
% Urbanization Ranking sites according to % watershed urbanization (0-10%, 10-20%, 20-30%, >30%).
10
Watershed Context Using a combination of % natural buffer and % urbanization to rank sites and provide a site-specific watershed context.
38
Urban Growth Area Ranking sites according to whether the site is within the UGA, the watershed is within the UGA, or neither.
6
Biological potential Using the relationship between watershed urbanization and B-IBI scores to determine how far a site is from its biological potential.
49
Connectivity Sites with intact natural habitat that can serve as a source population for aerial and aquatic dispersal would score higher than those that don’t have source populations
22
Other What restoration actions are possible for the site 70
TOTAL VOTES CAST 282
TOTAL VOTES POSSIBLE (not counting presenters) 432

B-IBI Restoration Decision Framework and Site Identification
King County Science and Technical Support Section 44 July 2014
Appendix H: Restoration Literature Consulted
Abbe, T., and A. Brooks. 2011. Geomorphic, Engineering, and Ecological Considerations
When Using Wood in River Restoration. Pages 419-452 in A. Simon, S. J. Bennett, and
M. C. Janine, editors. Stream Restoration in Dynamic Fluvial Systems: Scientific
Approaches, Analyses, and Tools. John Wiley & Sons.
Adams, S. M., W. R. Hill, M. J. Peterson, M. G. Ryon, J. G. Smith, and A. J. Stewart. 2002.
Assessing recovery in a stream ecosystem: applying multiple chemical and
biological endpoints. Ecological Applications 12(5):1510-1527.
Alberti, M., D. Booth, K. Hill, B. Coburn, C. Avolio, S. Coe, and D. Spirandelli. 2007. The
impact of urban patterns on aquatic ecosystems: An empirical analysis in Puget
lowland sub-basins. Landscape and Urban Planning 80:345.
Albertson, L. K., B. J. Cardinale, S. C. Zeug, L. R. Harrison, H. S. Lenihan, and M. A. Wydzga.
2010. Impacts of Channel Reconstruction on Invertebrate Assemblages in a
Restored River. Restoration Ecology 19:627-638.
Andrew Ayres, H. G., Brandon Goeller, Manuel Lago, Marta Catalinas, Ángel García Cantón,
Roy Brouwer, Oleg Sheremet, Jan Vermaat, Natalie Angelopoulos, Ian Cowx. 2014.
Inventory of river restoration measures: effects, costs and benefits. Report for
REFORM: REstoring rivers FOR effective catchment Management.
Bae, Y., H. Kil, and K. Bae. 2005. Benthic macroinvertebrates for uses in stream
biomonitoring and restoration. KSCE Journal of Civil Engineering 9:55-63.
Barnes, J. B., I. P. Vaughan, and S. J. Ormerod. 2013. Reappraising the effects of habitat
structure on river macroinvertebrates. Freshwater Biology 58:2154-2167.
Becker, A., and B. J. Robson. 2009. Riverine macroinvertebrate assemblages up to 8 years
after riparian restoration in a semi-rural catchment in Victoria, Australia. Marine
and Freshwater Research 60:1309-1316.
Beechie, T. J., D. A. Sear, J. D. Olden, G. R. Pess, J. M. Buffington, H. Moir, P. Roni, and M. M.
Pollock. 2010. Process-Based Principles for Restoring River Ecosystems. BioScience
60:209-222.
Bernhardt, E. S., M. A. Palmer, J. D. Allan, G. Alexander, K. Barnas, S. Brooks, J. Carr, S.
Clayton, C. Dahm, J. Follstad-Shah, D. Galat, S. Gloss, P. Goodwin, D. Hart, B. Hassett,
R. Jenkinson, S. Katz, G. M. Kondolf, P. S. Lake, R. Lave, J. L. Meyer, T. K. O’Donnell, L.
Pagano, B. Powell, E. Sudduth. 2005. Synthesizing U.S. River Restoration Efforts.
Science 308:636-637.

B-IBI Restoration Decision Framework and Site Identification
King County Science and Technical Support Section 45 July 2014
Bernhardt, E. S., and M. A. Palmer. 2011. River restoration: the fuzzy logic of repairing
reaches to reverse catchment scale degradation. Ecological Applications 21:1926-
1931.
Besacier-Monbertrand, A. L., A. Paillex, and E. Castella. 2012. Short-term impacts of lateral
hydrological connectivity restoration on aquatic macroinvertebrates. River
Research and Applications. DOI: 10.1002/rra.1259.
Black, R. W., M. D. Munn, and R. W. Plotnikoff. 2004. Using macroinvertebrates to identify
biota-land cover optima at multiple scales in the Pacific Northwest, USA. Journal of
the North American Benthological Society 23:340-362.
Blakely, T. J., J. S. Harding, A. R. McIntosh, and M. J. Winterbourn. 2006. Barriers to the
recovery of aquatic insect communities in urban streams. Freshwater Biology
51:1634-1645.
Bockelmann, B. N., E. K. Fenrich, B. Lin, and R. A. Falconer. 2004. Development of an
ecohydraulics model for stream and river restoration. Ecological Engineering
22:227-235.
Bogan, M. T., and K. S. Boersma. 2012. Aerial dispersal of aquatic invertebrates along and
away from arid-land streams. Freshwater Science 31:1131-1144.
Borchardt, D. 1993. Effects of flow and refugia on drift loss of benthic macroinvertebrates:
implications for habitat restoration in lowland streams. Freshwater Biology 29:221-
227.
Bradshaw, A. D. 1996. Underlying principles of restoration. Canadian Journal of Fisheries
and Aquatic Sciences 53:3-9.
Brederveld, R. J., S. C. Jähnig, A. W. Lorenz, S. Brunzel, and M. B. Soons. 2011. Dispersal as a
limiting factor in the colonization of restored mountain streams by plants and
macroinvertebrates. Journal of Applied Ecology 48:1241-1250.
Broadmeadow, S., and T. R. Nisbet. 1999. The effects of riparian forest management on the
freshwater environment: a literature review of best management practice. Hydrol.
Earth Syst. Sci. 8:286-305.
Brooks, S. S., and A. J. Boulton. 1991. Recolonization dynamics of benthic
macroinvertebrates after artificial and natural disturbances in an Australian
temporary stream. Marine and Freshwater Research 42:295-308.
Brooks, S. S., M. A. Palmer, B. J. Cardinale, C. M. Swan, and S. Ribblett. 2002. Accessing
stream ecosystem rehabilitation: community structure data. Restoration Ecology
10:156-168.
Bryce, S. A., D. P. Larsen, R. M. Hughes, and P. R. Kaufmann. 1999. Assessing relative risks to
aquatic ecosystems: A mid- Appalachian case study. JAWRA Journal of the American
Water Resources Association 35:23-36.

B-IBI Restoration Decision Framework and Site Identification
King County Science and Technical Support Section 46 July 2014
Bunn, S. E., E. G. Abal, M. J. Smith, S. C. Choy, C. S. Fellows, B. D. Harch, M. J. Kennard, and F.
Sheldon. 2010. Integration of science and monitoring of river ecosystem health to
guide investments in catchment protection and rehabilitation. Freshwater Biology
55:223-240.
Cairns, J., editor. 1994. Rehabilitating Damaged Ecosystems. Second edition. CRC Press.
Carline, R. F., and M. C. Walsh. 2007. Responses to Riparian Restoration in the Spring Creek
Watershed, Central Pennsylvania. Restoration Ecology 15:731-742.
Carter, J. L., A. H. Purcell, S. V. Fend, and V. H. Resh. 2009. Development of a local-scale
urban stream assessment method using benthic macroinvertebrates: an example
from the Santa Clara Basin, California. Journal of the North American Benthological
Society 28:1007-1021.
Carter, T., C. R. Jackson, A. Rosemond, C. Pringle, D. Radcliffe, W. Tollner, J. Maerz, D. Leigh,
and A. Trice. 2009. Beyond the urban gradient: barriers and opportunities for timely
studies of urbanization effects on aquatic ecosystems. Journal of the North American
Benthological Society 28:1038-1050.
Chin, A., F. Gelwick, D. Laurencio, L. R. Laurencio, M. S. Byars, and M. Scoggins. 2010.
Linking Geomorphological and Ecological Responses in Restored Urban Pool-Riffle
Streams. Ecological Restoration 28:460-474.
Christensen, M. J. 1996. Effects of stream restoration on macroinvertebrate communities in
an Oregon Coast Range system. Oregon State University.
Clements, W. H., N. K. M. Vieira, and D. L. Sonderegger. 2010. Use of ecological thresholds to
assess recovery in lotic ecosystems. Journal of the North American Benthological
Society 29:1017-1023.
Clews, E., and S. J. Ormerod. 2010. Appraising riparian management effects on benthic
macroinvertebrates in the Wye River system. Aquatic Conservation: Marine and
Freshwater Ecosystems 20:S73-S81.
Cockerill, K., and W. P. Anderson. 2014. Creating False Images: Stream Restoration in an
Urban Setting. JAWRA Journal of the American Water Resources Association 50:468-
482.
Cole, M. B. 2013. Kinne Brook: 2012-2013 pre-restoration macroinvertebrate assessment.
Prepared for Wild and Scenic Westfield River Committee.
Collins, K. E., C. Doscher, H. G. Rennie, and J. G. Ross. 2013. The Effectiveness of Riparian
‘Restoration’ on Water Quality—A Case Study of Lowland Streams in Canterbury,
New Zealand. Restoration Ecology 21:40-48.
Craig, L. S., M. A. Palmer, D. C. Richardson, S. Filoso, E. S. Bernhardt, B. P. Bledsoe, M. W.
Doyle, P. M. Groffman, B. A. Hassett, S. S. Kaushal, P. M. Mayer, S. M. Smith, and P. R.

B-IBI Restoration Decision Framework and Site Identification
King County Science and Technical Support Section 47 July 2014
Wilcock. 2008. Stream restoration strategies for reducing river nitrogen loads.
Frontiers in Ecology and the Environment 6:529-538.
Doyle, M. W., and F. Douglas Shields. 2012. Compensatory Mitigation for Streams Under the
Clean Water Act: Reassessing Science and Redirecting Policy. JAWRA Journal of the
American Water Resources Association 48:494-509.
Entrekin, S. A., J. L. Tank, E. J. Rosi-Marshall, T. J. Hoellein, and G. A. Lamberti. 2009.
Response of secondary production by macroinvertebrates to large wood addition in
three Michigan streams. Freshwater Biology 54:1741-1758.
Ernst, A. G., D. R. Warren, and B. P. Baldigo. 2012. Natural-channel-design restorations that
changed geomorphology have little effect on macroinvertebrate communities in
headwater streams. Restoration Ecology 20:532-540.
Feld, C. K. 2004. Identification and measure of hydromorphological degradation in Central
European lowland streams. Hydrobiologia 516:69-90.
Feld, C.K., S. Birk, D. C. Bradley, D. Hering, J. Kail, A. Marzin, A. Melcher, D. Nemitz, M. L.
Pedersen, F. Pletterbauer, D. Pont, P. F. M. Verdonschot, and N. Friberg. 2011. From
Natural to Degraded Rivers and Back Again: A Test of Restoration Ecology Theory
and Practice. Advances in Ecological Research 44:119-209.
Finkenbine, J. K., J. W. Atwater, and D. S. Mavinic. 2000. Stream health after urbanization.
JAWRA Journal of the American Water Resources Association 36:1149-1160.
Friberg, N., A. Baattrup-Pedersen, E. A. Kristensen, B. Kronvang, S. E. Larsen, M. L. Pedersen,
J. Skriver, H. Thodsen, and P. Wiberg-Larsen. 2013. The River Gelså restoration
revisited: Habitat specific assemblages and persistence of the macroinvertebrate
community over an 11-year period. Ecological Engineering 66:150-157.
Friberg, N., B. Kronvang, H. Ole Hansen, and L. M. Svendsen. 1998. Long-term, habitat-
specific response of a macroinvertebrate community to river restoration. Aquatic
Conservation: Marine and Freshwater Ecosystems 8:87-99.
Friberg, N., B. Kronvang, L. M. Svendsen, H. O. Hansen, and M. B. Nielsen. 1994. Restoration
of a channelized reach of the River Gelså, Denmark: Effects on the
macroinvertebrate community. Aquatic Conservation: Marine and Freshwater
Ecosystems 4:289-296.
Galic, N., G. M. Hengeveld, P. J. Van den Brink, A. Schmolke, P. Thorbek, E. Bruns, and H. M.
Baveco. 2013. Persistence of Aquatic Insects across Managed Landscapes: Effects of
Landscape Permeability on Re-Colonization and Population Recovery. PLoS ONE
8(1):e54584. doi:10.1371/journal.pone.005484.
Gerhard, M., and M. Reich. 2000. Restoration of Streams with Large Wood: Effects of
Accumulated and Built-in Wood on Channel Morphology, Habitat Diversity and
Aquatic Fauna. International Review of Hydrobiology 85:123-137.

B-IBI Restoration Decision Framework and Site Identification
King County Science and Technical Support Section 48 July 2014
Goetz, S., and G. Fiske. 2008. Linking the diversity and abundance of stream biota to
landscapes in the mid-Atlantic USA. Remote Sensing of Environment 112:4075-
4085.
Gore, J. A. 1982. Benthic invertebrate colonization: source distance effects on community
composition. Hydrobiologia 94:183-193.
Gore, J. A. 1985. Mechanisms of colonization and habitat enhancement for benthic
macroinvertebrates in restored river channels in J. A. Gore, editor. The Restoration
of Rivers and Streams: Theories and Experience. Butterworth Publishers, Boston,
MA.
Gore, J. A., D. J. Crawford, and D. S. Addison. 1998. An analysis of artificial riffles and
enhancement of benthic community diversity by physical habitat simulation
(PHABSIM) and direct observation. Regulated Rivers: Research & Management
14:69-77.
Gore, J. A., J. B. Layzer, and J. Mead. 2001. Macroinvertebrate instream flow studies after 20
years: a role in stream management and restoration. Regulated Rivers: Research &
Management 17:527-542.
Gørtz, P. 1998. Effects of stream restoration on the macroinvertebrate community in the
River Esrom, Denmark. Aquatic Conservation: Marine and Freshwater Ecosystems
8:115-130.
Grant, E. H. C., W. H. Lowe, and W. F. Fagan. 2007. Living in the branches: population
dynamics and ecological processes in dendritic networks. Ecology Letters 10:165-
175.
Haapala, A., T. Muotka, and P. Laasonen. 2003. Distribution of benthic macroinvertebrates
and leaf litter in relation to streambed retentivity: implications for headwater
stream restoration. Boreal Environmental Research 8:19-30.
Habberfield, M. W., S. S. Blersch, S. J. Bennett, and J. F. Atkinson. 2014. Rapid Geomorphic
and Habitat Stream Assessment Techniques Inform Restoration Differently Based
on Levels of Stream Disturbance. JAWRA Journal of the American Water Resources
Association. DOI: 10.1111/jawr.12156.
Hallett, L. M., S. Diver, M. V. Eitzel, J. J. Olson, B. S. Ramage, H. Sardinas, Z. Statman-Weil, and
K. N. Suding. 2013. Do We Practice What We Preach? Goal Setting for Ecological
Restoration. Restoration Ecology 21:312-319.
Harris, S. C., T. H. Martin, and K. W. Cummins. 1995. A Model for Aquatic Invertebrate
Response to Kissimmee River Restoration. Restoration Ecology 3:181-194.
Harrison, S. S. C., J. L. Pretty, D. Shepherd, A. G. Hildrew, C. Smith, and R. D. Hey. 2004. The
effect of instream rehabilitation structures on macroinvertebrates in lowland rivers.
Journal of Applied Ecology 41:1140-1154.

B-IBI Restoration Decision Framework and Site Identification
King County Science and Technical Support Section 49 July 2014
Heinrich, K. K., M. R. Whiles, and C. Roy. 2014. Cascading Ecological Responses to an In-
Stream Restoration Project in a Midwestern River. Restoration Ecology 22:72-80.
Herbst, D. B., and J. M. Kane. 2009. Responses of aquatic macroinvertebrates to stream
channel reconstruction in a degraded rangeland creek in the Sierra Nevada.
Ecological Restoration 27:76-88.
Hilderbrand, R. H., A. D. Lemly, C. A. Dolloff, and K. L. Harpster. 1997. Effects of large woody
debris placement on stream channels and benthic macroinvertebrates. Canadian
Journal of Fisheries and Aquatic Sciences 54:931-939.
Hilderbrand, R. H., A. C. Watts, and A. M. Randle. 2005. The myths of restoration ecology.
Ecology and Society 10:19.
Hines, S. L. 2007. The Effects of Restoration Structures on Nutrient Uptake and
Macroinvertebrate Communities in Urban Restored Streams in Greensboro, North
Carolina The University of North Carolina at Greensboro.
Hoellein, T. J., J. L. Tank, S. A. Entrekin, E. J. Rosi-Marshall, M. L. Stephen, and G. A. Lamberti.
2012. Effects of benthic habitat restoration on nutrient uptake and ecosystem
metabolism in three headwater streams. River Research and Applications 28:1451-
1461.
Hughes, R. M., S. Dunham, K. G. Maas-Hebner, J. A. Yeakley, M. Harte, N. Molina, C. C. Shock,
and V. W. Kaczynski. 2014. A Review of Urban Water Body Challenges and
Approaches: (2) Mitigating Effects of Future Urbanization. Fisheries 39:30-40.
Hughes, R. M., S. Dunham, K. G. Maas-Hebner, J. A. Yeakley, M. Harte, N. Molina, C. C. Shock,
V. W. Kaczynski, and J. Schaeffer. 2014. A Review of Urban Water Body Challenges
and Approaches: (1) Rehabilitation and Remediation. Fisheries 39:18-29.
Ilmonen, J., H. Mykrä, R. Virtanen, L. Paasivirta, and T. Muotka. 2012. Responses of spring
macroinvertebrate and bryophyte communities to habitat modification: community
composition, species richness, and red-listed species. Freshwater Science 31:657-
667.
Jähnig, S., and A. Lorenz. 2008. Substrate-specific macroinvertebrate diversity patterns
following stream restoration. Aquatic Sciences - Research across Boundaries
70:292-303.
Jähnig, S. C., K. Brabec, A. Buffagni, S. Erba, A. W. Lorenz, T. Ofenböck, P. F. M. Verdonschot,
and D. Hering. 2010. A comparative analysis of restoration measures and their
effects on hydromorphology and benthic invertebrates in 26 central and southern
European rivers. Journal of Applied Ecology 47:671-680.
Jansson, R., C. Nilsson, and B. Malmqvist. 2007. Restoring freshwater ecosystems in riverine
landscapes: the roles of connectivity and recovery processes. Freshwater Biology
52:589-596.

B-IBI Restoration Decision Framework and Site Identification
King County Science and Technical Support Section 50 July 2014
Johnson, T. E., J. N. McNair, P. Srivastava, and D. D. Hart. 2007. Stream ecosystem responses
to spatially variable land cover: an empirically based model for developing riparian
restoration strategies. Freshwater Biology 52:680-695.
Jones, M. L., R. G. Randall, D. Hayes, W. Dunlop, J. Imhof, G. Lacroix, and N. J. R. Ward. 1996.
Assessing the ecological effects of habitat change: moving beyond productive
capacity. Canadian Journal of Fisheries and Aquatic Sciences 53:446-457.
Knop, E., F. Herzog, and B. Schmid. 2011. Effect of connectivity between restoration
meadows on invertebrates with contrasting dispersal abilities. Restoration Ecology
19:151-159.
Korsu, K. 2004. Response of Benthic Invertebrates to Disturbance From Stream
Restoration: The Importance of Bryophytes. Hydrobiologia 523:37-45.
Laasonen, P., T. Muotka, and I. Kivijärvi. 1998. Recovery of macroinvertebrate communities
from stream habitat restoration. Aquatic Conservation: Marine and Freshwater
Ecosystems 8:101-113.
Lake, P. S., N. Bond, and P. Reich. 2007. Linking ecological theory with stream restoration.
Freshwater Biology 52:597-615.
Langford, T. E. L., P. J. Shaw, A. J. D. Ferguson, and S. R. Howard. 2009. Long-term recovery
of macroinvertebrate biota in grossly polluted streams: Re-colonisation as a
constraint to ecological quality. Ecological Indicators 9:1064-1077.
Larned, S. T., A. M. Suren, M. Flanagan, B. J. F. Biggs, and T. Riis. 2006. Macrophytes in Urban
Stream Rehabilitation: Establishment, Ecological Effects, and Public Perception.
Restoration Ecology 14:429-440.
Larson, M. G., D. B. Booth, and S. A. Morley. 2001. Effectiveness of large woody debris in
stream rehabilitation projects in urban basins. Ecological Engineering 18:211-226.
Lee, J. H., and K.-G. An. 2014. Integrative restoration assessment of an urban stream using
multiple modeling approaches with physical, chemical, and biological integrity
indicators. Ecological Engineering 62:153-167.
Lemly, A. D., and R. H. Hilderbrand. 2000. Influence of large woody debris on stream insect
communities and benthic detritus. Hydrobiologia 421:179-185.
Lepori, F., D. Palm, E. Brannas, and B. Malmqvist. 2005. Does restoration of structural
heterogeneity in streams enhance fish and macroinvertebrate diversity? Ecological
Applications 15:2060-2071.
Lewis, C. A., N. P. Lester, A. D. Bradshaw, J. E. Fitzgibbon, K. Fuller, L. Hakanson, and C.
Richards. 1996. Considerations of scale in habitat conservation and restoration.
Canadian Journal of Fisheries and Aquatic Sciences 53 (Suppl. 1):440-445.

B-IBI Restoration Decision Framework and Site Identification
King County Science and Technical Support Section 51 July 2014
Lorenz, A., D. Hering, C. Feld, and P. Rolauffs. 2004. A new method for assessing the impact
of hydromorphological degradation on the macroinvertebrate fauna of five German
stream types. Hydrobiologia 516:107-127.
Lorenz, A., S. Jähnig, and D. Hering. 2009. Re-Meandering German Lowland Streams:
Qualitative and Quantitative Effects of Restoration Measures on Hydromorphology
and Macroinvertebrates. Environmental Management 44:745-754.
Louhi, P., Mykra, H., Paavola, R., Huusko, A., Vehanen, T., Maki-Petays, A., and Muotka, T.
2011. Twenty years of stream restoration in Finland: little response by benthic
macroinvertebrate communities. Ecological Application 21:1950-1961.
Luderitz, V., T. Speierl, U. Langheinrich, W. Volkl, and R. M. Gersberg. 2011. Restoration of
the Upper Main and Rodach rivers - The success and its measurement. Ecological
Engineering 37:2044-2055.
Maul, J. D., J. L. Farris, C. D. Milam, C. M. Cooper, S. Testa, and D. L. Feldman. 2004. The
influence of stream habitat and water quality on macroinvertebrate communities in
degraded streams of northwest Mississippi. Hydrobiologia 518:79-94.
McDermond-Spies, N., D. Broman, A. Brantner, and K. Larsen. 2014. Family-Level Benthic
Macroinvertebrate Communities Indicate Successful Relocation and Restoration of a
Northeast Iowa Stream. Ecological Restoration 32:161-170.
McIntosh, M. D., M. E. Benbow, and A. J. Burky. 2002. Effects of stream diversion on riffle
macroinvertebrate communities in a Maui, Hawaii, stream. River Research and
Applications 18:569-581.
McManamay, R. A., D. J. Orth, and C. A. Dolloff. 2013. Macroinvertebrate Community
Responses to Gravel Addition in a Southeastern Regulated River. Southeastern
Naturalist 12:599-618.
Meisenbach, W. J., H. Tychsen, C. Siu, and K. H. Baker. 2012. Failure of reach-scale
restoration to improve biotic integrity in a mid-Atlantic stream. Environment and
Pollution 1:124-131.
Merill, L., and D. J. Tonjes. 2014. A Review of the Hyporheic Zone, Stream Restoration, and
Means to Enhance Denitrification. Critical Reviews in Environmental Science and
Technology doi:10.1080/10643389.2013.829769.
Merovich, G. T., J. T. Petty, M. P. Strager, and J. B. Fulton. 2013. Hierarchical classification of
stream condition: a house–neighborhood framework for establishing conservation
priorities in complex riverscapes. Freshwater Science 32:874-891.
Merz, J. E., and L. K. Ochikubo Chan. 2005. Effects of gravel augmentation on
macroinvertebrate assemblages in a regulated California River. River Research and
Applications 21:61-74.

B-IBI Restoration Decision Framework and Site Identification
King County Science and Technical Support Section 52 July 2014
Mika, S., J. Hoyle, K. Fryirs, M. Leishman, M. Sanders, A. Arthington, R. Creese, M. Dahm, C.
Miller, B. Pusey, A. Spink, G. Kyle, T. Howell, B. Wolfenden, D. Ryder, D. Keating, A.
Boulton, G. Brierley, and A. P. Brooks. 2010. Inside the 'black box' of river
restoration: using catchment history to identify disturbance and response
mechanisms to set targets for process-based restoration. Ecology and Society 15:8.
Miller, S. W., P. Budy, and J. C. Schmidt. 2010. Quantifying Macroinvertebrate Responses to
In-Stream Habitat Restoration: Applications of Meta-Analysis to River Restoration.
Restoration Ecology 18:8-19.
Moerke, A. H., K. J. Gerard, J. A. Latimore, R. A. Hellenthal, and G. A. Lamberti. 2004.
Restoration of an Indiana, USA, stream: bridging the gap between basic and applied
lotic ecology. Journal of the North American Benthological Society 23:647-660.
Moerke, A. H., and G. A. Lamberti. 2004. Restoring Stream Ecosystems: Lessons from a
Midwestern State. Restoration Ecology 12:327-334.
Morley, S. A. 2000. Effects of urbanization on the biological integrity of Puget Sound
lowland streams: Restoration with a biological focus. University of Washington,
Seattle.
Morley, S. A., and J. R. Karr. 2002. Assessing and restoring the health of urban streams in
the Puget Sound basin. Conservation Biology 16:1498-1509.
Muehlbauer, J. D., M. W. Doyle, and E. S. Bernhardt. 2011. Macroinvertebrate community
responses to a dewatering disturbance gradient in a restored stream. Hydrology and
Earth System Sciences Discussions 15:1771-1783.
Mueller, M., J. Pander, and J. Geist. 2014. The ecological value of stream restoration
measures: An evaluation on ecosystem and target species scales. Ecological
Engineering 62:129-139.
Muotka, T., and P. Laasonen. 2002. Ecosystem recovery in restored headwater streams: the
role of enhanced leaf retention. Journal of Applied Ecology 39:145-156.
Muotka, T., R. Paavola, A. Haapala, M. Novikmec, and P. Laasonen. 2002. Long-term
recovery of stream habitat structure and benthic invertebrate communities from in-
stream restoration. Biological Conservation 105:243-253.
Muotka, T., and J. Syrjänen. 2007. Changes in habitat structure, benthic invertebrate
diversity, trout populations and ecosystem processes in restored forest streams: a
boreal perspective. Freshwater Biology 52:724-737.
Nakano, D., and F. Nakamura. 2006. Responses of macroinvertebrate communities to river
restoration in a channelized segment of the Shibetsu River, Northern Japan. River
Research and Applications 22:681-689.

B-IBI Restoration Decision Framework and Site Identification
King County Science and Technical Support Section 53 July 2014
Nedeau, E. J., R. W. Merritt, and M. G. Kaufman. 2003. The effect of an industrial effluent on
an urban stream benthic community: water quality vs. habitat quality.
Environmental Pollution 123:1-13.
Nederveld, L. B. 2009. Sediment Remediation Impacts on Macroinvertebrate Community
Structure: Assessing the Success of Urban Stream Restoration. Grand Valley State
University.
Negishi, J. N., M. Inoue, and M. Nunokawa. 2002. Effects of channelisation on stream habitat
in relation to a spate and flow refugia for macroinvertebrates in northern Japan.
Freshwater Biology 47:1515-1529.
Negishi, J. N., and J. S. Richardson. 2003. Responses of organic matter and
macroinvertebrates to placements of boulder clusters in a small stream of
southwestern British Columbia, Canada. Canadian Journal of Fisheries and Aquatic
Sciences 60:247-258.
Nilsson, C., L. E. Polvi, J. Gardeström, E. M. Hasselquist, L. Lind, and J. M. Sarneel. 2014.
Riparian and instream restoration of boreal streams and rivers: success or failure?
Ecohydrology doi: 10.1002/eco.1480.
Northington, R. M., and A. E. Hershey. 2006. Effects of stream restoration and wastewater
treatment plant effluent on fish communities in urban streams. Freshwater Biology
51:1959-1973.
Ogren, S. A. 2014. Using indicators of biotic integrity for assessment of stream condition.
Michigan Technological University.
Paillex, A., S. Dolédec, E. Castella, S. Mérigoux, and D. C. Aldridge. 2013. Functional diversity
in a large river floodplain: anticipating the response of native and alien
macroinvertebrates to the restoration of hydrological connectivity. Journal of
Applied Ecology 50:97-106.
Palmer, M. A., H. L. Menninger, and E. Bernhardt. 2010. River restoration, habitat
heterogeneity and biodiversity: a failure of theory or practice? Freshwater Biology
55:205-222.
Pander, J., and J. Geist. 2013. Ecological indicators for stream restoration success. Ecological
Indicators 30:106-118.
Parkyn, S. M., R. J. Davies-Colley, N. J. Halliday, K. J. Costley, and G. F. Croker. 2003. Planted
Riparian Buffer Zones in New Zealand: Do They Live Up to Expectations?
Restoration Ecology 11:436-447.
Parkyn, S. M., and B. J. Smith. 2011. Dispersal constraints for stream invertebrates: setting
realistic timescales for biodiversity restoration. Environmental Management
48:602-614.

B-IBI Restoration Decision Framework and Site Identification
King County Science and Technical Support Section 54 July 2014
Paul, M. J., D. W. Bressler, A. H. Purcell, M. T. Barbour, E. T. Rankin, and V. H. Resh. 2009.
Assessment Tools for Urban Catchments: Defining Observable Biological Potential.
JAWRA Journal of the American Water Resources Association 45:320-330.
Penrose, D. 2009. The Use of Aquatic Insects to Assess the Effectiveness of Stream
Restoration in North Carolina. Pages 1-11 NWQEP Notes: The NCSU Water Quality
Group Newsletter, Raleigh, North Carolina.
Peterson, E. E., D. M. Theobald, and J. M. Ver Hoef. 2007. Geostatistical modelling on stream
networks: developing valid covariance matrices based on hydrologic distance and
stream flow. Freshwater Biology 52:267-279.
Peterson, E. E., and J. M. Ver Hoef. 2010. A mixed-model moving-average approach to
geostatistical modeling in stream networks. Ecology 91:644-651.
Petty, J. T., and D. Thorne. 2005. An Ecologically Based Approach to Identifying Restoration
Priorities in an Acid-Impacted Watershed. Restoration Ecology 13:348-357.
Pohlon, E., C. Augspurger, U. Risse-Buhl, J. Arle, M. Willkomm, S. Halle, and K. Küsel. 2007.
Querying the Obvious: Lessons from a Degraded Stream. Restoration Ecology
15:312-316.
Pollard, A. I., and T. Reed. 2004. Benthic invertebrate assemblage change following dam
removal in a Wisconsin stream. Hydrobiologia 513:51-58.
Purcell, A. H. 2007. Benthic macroinvertebrates and ecological assessments: examining the
biological potential of urban stream restoration in the San Francisco Bay Area.
University of California, Berkeley, CA.
Purcell, A. H., C. Friedrich, and V. H. Resh. 2002. An Assessment of a Small Urban Stream
Restoration Project in Northern California. Restoration Ecology 10:685-694.
Rader, R. B., N. J. Voelz, and J. V. Ward. 2008. Post-Flood Recovery of a Macroinvertebrate
Community in a Regulated River: Resilience of an Anthropogenically Altered
Ecosystem. Restoration Ecology 16:24-33.
Reich, M., J. L. Kershner, and R. C. Wildman. 2003. Restoring streams with large wood: a
synthesis. American Fisheries Society Symposium.
Richards, C., G. E. Host, and J. W. Arthur. 1993. Identification of predominant environmental
factors structuring stream macroinvertebrate communities within a large
agricultural catchment. Freshwater Biology 29:285-294.
Roni, P., editor. 2005. Monitoring stream and watershed restoration. American Fisheries
Society, Bethesda, MD.
Roni, P. and T. J. Beechie, editors. 2013. Stream and watershed restoration. John Wiley &
Sons, Ltd. Hoboken, New Jersey.
Roni, P., T. J. Beechie, R. E. Bilby, F. E. Leonetti, M. M. Pollock, and G. R. Pess. 2002. A review
of stream restoration techniques and a hierarchical strategy for prioritizing

B-IBI Restoration Decision Framework and Site Identification
King County Science and Technical Support Section 55 July 2014
restoration in Pacific Northwest watersheds. North American Journal of Fisheries
Management 22:1-20.
Rosenfeld, J., D. Hogan, D. Palm, H. Lundquist, C. Nilsson, and T. Beechie. 2011. Contrasting
Landscape Influences on Sediment Supply and Stream Restoration Priorities in
Northern Fennoscandia (Sweden and Finland) and Coastal British Columbia.
Environmental Management 47:28-39.
Sarriquet, P. E., P. Bordenave, and P. Marmonier. 2007. Effects of bottom sediment
restoration on interstitial habitat characteristics and benthic macroinvertebrate
assemblages in a headwater stream. River Research and Applications 23:815-828.
Schiff, R., G. Benoit, and J. MacBroom. 2011. Evaluating stream restoration: A case study
from two partially developed 4th order Connecticut, U.S.A. streams and evaluation
monitoring strategies. River Research and Applications 27:431-460.
Scrimgeour, G. J., W. M. Tonn, and N. E. Jones. 2014. Quantifying effective restoration:
reassessing the productive capacity of a constructed stream 14 years after
construction. Canadian Journal of Fisheries and Aquatic Sciences 71:589-601.
Selego, S. M., C. L. Rose, G. T. Merovich Jr., S. A. Welsh, and J. T. Anderson. 2012. Community-
Level Response of Fishes and Aquatic Macroinvertebrates to Stream Restoration in a
Third-Order Tributary of the Potomac River, USA. International Journal of Ecology.
doi:10.1155/2012/753634
Selvakumar, A., T. O’Connor, and S. Struck. 2010. Role of Stream Restoration on Improving
Benthic Macroinvertebrates and In-Stream Water Quality in an Urban Watershed:
Case Study. Journal of Environmental Engineering 136:127-139.
Simon, A., S. J. Bennett, and J. M. Castro. 2011. Stream Restoration in Dynamic Fluvial
Systems: Scientific Approaches, Analyses, and Tools. Geophysical Monograph Series.
Smith, D. G., G. M. Ferrell, D. A. Harned, and T. F. Cuffney. 2011. A Study of the Effects of
Implementing Agricultural Best Management Practices and In-Stream Restoration
on Suspended Sediment, Stream Habitat, and Benthic Macroinvertebrates at Three
Stream Sites in Surry County, North Carolina, 2004–2007—Lessons Learned U.S.
Geological Survey Scientific Investigations Report 2011–5098, Prepared in
cooperation with the North Carolina Department of Environment and Natural
Resources, Division of Soil and Water Conservation.
Smith, R. F., Alexander, L.C. and Lamp, W.O. 2009. Dispersal by terrestrial stages of stream
insects in urban watersheds: a synthesis of current knowledge. Journal of North
American Benthological Society 28:1022-1037.
Sovell, L. A., B. Vondracek, J. A. Frost, and K. G. Mumford. 2000. Impacts of rotational
grazing and riparian buffers on physicochemical and biological characteristics of
Southeastern Minnesota, USA, streams. Environmental Management 26:629-641.
B-IBI Restoration Decision Framework and Site Identification
King County Science and Technical Support Section 56 July 2014
Spänhoff, B., and J. Arle. 2007. Setting Attainable Goals of Stream Habitat Restoration from
a Macroinvertebrate View. Restoration Ecology 15:317-320.
Stanley, S. 2010. Puget Sound Watershed Characterization - Introduction to the Water Flow
Assessment for Puget Sound. Washington State Department of Ecology, Olympia,
Washington.
Stanley, S., S. Grigsby, D. Booth, D. Hartley, R. Horner, T. Hruby, J. Thomas, P. Bissonnette, R.
Fuerstenberg, J. Lee, P. Olson, and G. Wilhere. 2012. Puget Sound Characterization -
Volume 1: The Water Resource Assessments (Water Flow and Water Quality)
Washington State Department of Ecology, Olympia, Washington.
Stanley, S., S. Grigsby, T. Hruby, and P. Olson. 2010. Puget Sound Watershed
Characterization Project: Description of Methods, Models and Analysis (Draft for
Peer Review). Washington State Department of Ecology, Olympia, Washington.
Still, J. 2009. A Macroinvertebrate Survey of Sandy Creek in Durham County, NC: A
Comparative Study of Post-Restoration and Pre-Restoration Surveys. Nicholas
School of the Environment of Duke University.
Stranko, S. A., R. H. Hilderbrand, and M. A. Palmer. 2012. Comparing the Fish and Benthic
Macroinvertebrate Diversity of Restored Urban Streams to Reference Streams.
Restoration Ecology 20:747–755.
Sudduth, E. B. 2004. Effects of bioengineered bank stabilization on urban streams.
University of Georgia.
Sudduth, E. B., and J. L. Meyer. 2006. Effects of Bioengineered Streambank Stabilization on
Bank Habitat and Macroinvertebrates in Urban Streams. Environmental
Management 38:218-226.
Sudduth, E. B., J. L. Meyer, and E. S. Bernhardt. 2007. Stream Restoration Practices in the
Southeastern United States. Restoration Ecology 15:573-583.
Sullivan, S. M., M. C. Watzin, and W. C. Hession. 2004. Understanding stream geomorphic
state in relation to ecological integrity: evidence using habitat assessments and
macroinvertebrates. Environmental Management 34:669-683.
Sundermann, A., C. Antons, N. Cron, A. W. Lorenz, D. Hering, and P. Haase. 2011a.
Hydromorphological restoration of running waters: effects on benthic invertebrate
assemblages. Freshwater Biology 56:1689-1702.
Sundermann, A., S. Stoll, and P. Haase. 2011b. River restoration success depends on the
species pool of the immediate surroundings. Ecological Applications 21:1962-1971.
Suren, A. M., P. Lambert, and B. K. Sorrell. 2011. The Impact of Hydrological Restoration on
Benthic Aquatic Invertebrate Communities in a New Zealand Wetland. Restoration
Ecology 19:747-757.

B-IBI Restoration Decision Framework and Site Identification
King County Science and Technical Support Section 57 July 2014
Suren, A. M., and S. McMurtrie. 2005. Assessing the effectiveness of enhancement activities
in urban streams: II. Responses of invertebrate communities. River Research and
Applications 21:439-453.
Suurkuukka, H., R. Virtanen, V. Suorsa, J. Soininen, L. Paasivirta, and T. Muotka. 2014.
Woodland key habitats and stream biodiversity: Does small-scale terrestrial
conservation enhance the protection of stream biota? Biological Conservation
170:10-19.
Sweeney, B. W., T. L. Bott, J. K. Jackson, L. A. Kaplan, J. D. Newbold, L. J. Standley, W. C.
Hession, and R. J. Horwitz. 2004. Riparian deforestation, stream narrowing, and loss
of stream ecosystem services. Proceedings of the National Academy of Sciences of
the United States of America 101(39):14132-14137.
Temperton, V. M., E. Higgs, Y. D. Choi, E. Allen, D. Lamb, C.-S. Lee, J. Harris, R. J. Hobbs, and J.
B. Zedler. 2014. Flexible and Adaptable Restoration: An Example from South Korea.
Restoration Ecology 22:271-278.
Testa, S., F. Douglas Shields, and C. M. Cooper. 2011. Macroinvertebrate response to stream
restoration by large wood addition. Ecohydrology 4:631-643.
Thom, R. M., G. W. Williams, and H. L. Diefenderfer. 2005. Balancing the need to develop
coastal areas with the desire for ecologically functioning coastal environment: Is net
ecosystem improvement possible? Restoration Ecology 13:193-203.
Thomas, G. 2014. Improving restoration practice by deriving appropriate techniques from
analysing the spatial organization of river networks. Limnologica - Ecology and
Management of Inland Waters 45:50-60.
Tsang, Y.-P. 2008. Use of macroinvertebrate predictive models to evaluate the stream
restoration effect. University of Maryland.
Tullos, D. D., Penrose, D.L., Jennings, G.D. and Cope, W.G. 2009. Analysis of functional traits
in reconfigured channels: implications for the bioassessment and disturbance of
river restoration. Journal of North American Benthological Society 28:80-92.
Urban, M. C., D. K. Skelly, D. Burchsted, W. Price, and S. Lowry. 2006. Stream communities
across a rural-urban landscape gradient. Biodiversity research 12:337-350.
Vaate, A. B. D., A. G. Klink, M. Greijdanus-Klaas, L. H. Jans, J. Oosterbaan, and F. Kok. 2007.
Effects of habitat restoration on the macroinvertebrate fauna in a foreland along the
River Waal, the main distributary in the Rhine delta. River Research and
Applications 23:171-183.
Ver Hoef, J. M., E. Peterson, and D. Theobald. 2006. Spatial statistical models that use flow
and stream distance. Environmental and Ecological Statistics 13:449-464.

B-IBI Restoration Decision Framework and Site Identification
King County Science and Technical Support Section 58 July 2014
Verdonschot, P. F. 2009. Impact of hydromorphology and spatial scale on
macroinvertebrate assemblage composition in streams. Integrated Environmental
Assessment and Management 5:97-109.
Violin, C. R. 2011. Macroinvertebrate responses to watershed land use and local-scale
stream restoration. University of North Carolina at Chapel Hill.
Violin, C. R., P. Cada, E. B. Sudduth, B. A. Hassett, D. L. Penrose, and E. S. Bernhardt. 2011.
Effects of urbanization and urban stream restoration on the physical and biological
structure of stream ecosystems. Ecological Applications 21:1932-1949.
Walsh, C. J. 2004. Protection of in-stream biota from urban impacts: minimise catchment
imperviousness or improve drainage design? Marine and Freshwater Research
55:317-326.
Walsh, C. J., and P. F. Breen. 2001. A biological approach to assessing the potential success
of habitat restoration in urban streams. Restoration Ecology 24:706-723.
Walsh, C. J., T. D. Fletcher, and A. R. Ladson. 2005. Stream restoration in urban catchments
through redesigning stormwater systems: looking to the catchment to save the
stream. Journal of the North American Benthological Society 24:690-705.
Walsh, C. J., and J. Kunapo. 2009. The importance of upland flow paths in determining urban
effects on stream ecosystems. Journal of the North American Benthological Society
28:977-990.
Walsh, C. J., A. K. Sharpe, P. F. Breen, and J. A. Sonneman. 2001. Effects of urbanization on
streams of the Melbourne region, Victoria, Australia. I. Benthic macroinvertebrate
communities. Freshwater Biology 46:535-551.
Walter, C. A., D. Nelson, and J. I. Earle. 2012. Assessment of Stream Restoration: Sources of
Variation in Macroinvertebrate Recovery throughout an 11-Year Study of Coal Mine
Drainage Treatment. Restoration Ecology 20:431-440.
Wang, X. 2001. Integrating water-quality management and land-use planning in a
watershed context. Journal of Environmental Management 61:25-36.
Wilhere, G. F., T. Quinn, D. Gombert, J. Jacobson, and A. Weiss. 2013. The Puget Sound
Watershed Characterization Project Volume 2: A Coarse-scale Assessment of the
Relative Value of Small Drainage Areas and Marine Shorelines for the Conservation
of Fish and Wildlife Habitats in Puget Sound Basin. Washington Department of Fish
and Wildlife, Habitat Program, Olympia, Washington.
Willey, K. T. 2008. Environmental Factors Determining the Pre-Restoration Benthic
Macroinvertebrate Assemblage in a Stream Used by Cattle. MS. Virginia Polytechnic
Institute and State University.
Wood, P. J., and P. D. Armitage. 1997. Biological effects of fine sediment in the lotic
environment. Environmental Management 21:203-217.

B-IBI Restoration Decision Framework and Site Identification
King County Science and Technical Support Section 59 July 2014
Wootton, J. T. 2012. River Food Wed Response to Large-Scale Riparian Zone Manipulations.
PLoS ONE 7(12): e51839. doi:10.1371/journal.pone.0051839.