b pont effe edinburg 4 may 2015
TRANSCRIPT

Policy options for greater equity and quality in education: a comparative perspective
Beatriz PontSenior Education Policy Analyst

Investing in equity in education is key
PIKETTY (2014)
Increasing wealth inequalities (r>g) have negative consequences.
Knowledge and skills diffusion are key to productivity growth and reduction of inequality.
For greater convergence in growth, need for progressive wealth tax and invest in education and skills for the more disadvantaged.
CINGANO (2014)
Income inequality has negative impact on further growth Wider gaps in income prevent skills development among low SES and
generate more inequality and prevent growth Inequality affects growth: Undermining education opportunities for low
SES children. lowering social mobility and hampering skills development.

Individual and societal benefits of raising skills
Source: OECD (2013), PIAAC.
Likelihood of positive outcomes among highly literate adults, PIAAC 2012

Education failure imposes high costs to individuals and to society
It limits capacity of economies to grow and innovate
Damages social cohesion and mobility and is expensive:
Higher public health expendituresHigher welfare, increased criminality
.. and the crisis and new economic data has brought equity to the forefront
Reducing school failure pays off
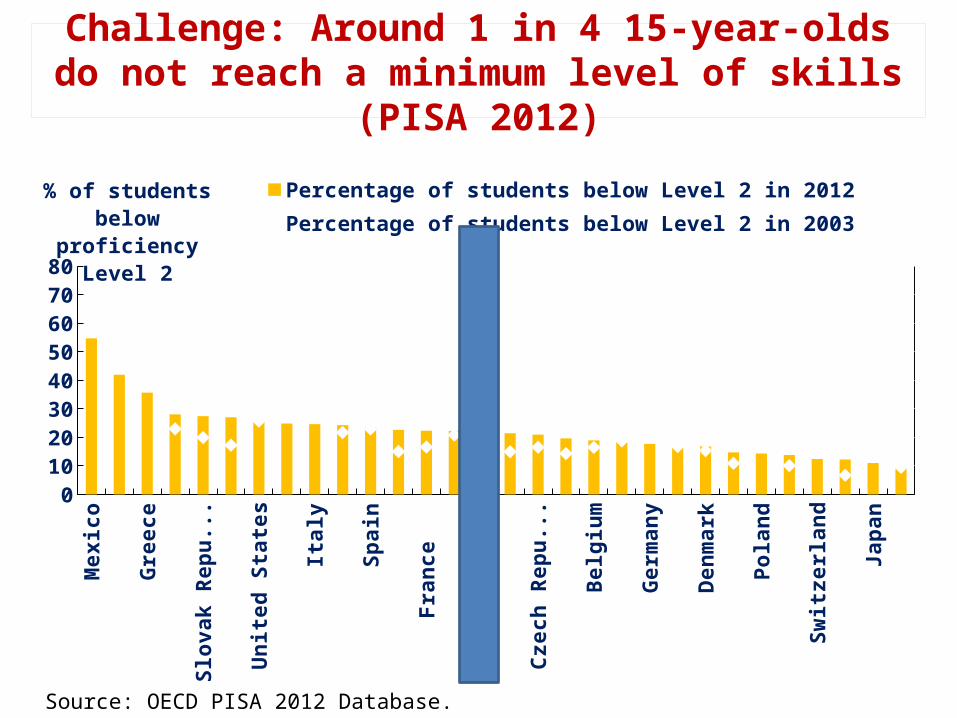
Challenge: Around 1 in 4 15-year-olds do not reach a minimum level of skills (PISA 2012)
Mex
ico
Turk
eyGr
eece
Hung
ary
Slov
ak R
epub
licSw
eden
Uni
ted
Stat
esPo
rtug
alIta
lyLu
xem
bour
gSp
ain
New
Zea
land
Fran
ce
Nor
way
OEC
D av
erag
e 20
03Ic
elan
dCz
ech
Repu
blic
Aust
ralia
Belg
ium
Aust
riaGe
rman
yIre
land
Denm
ark
Net
herla
nds
Pola
ndCa
nada
Switz
erla
ndFi
nlan
dJa
pan
Kore
a
01020304050607080
Percentage of students below Level 2 in 2012Percentage of students below Level 2 in 2003
% of students be-low proficiency
Level 2
Source: OECD PISA 2012 Database.

Challenge: The impact of background on performance is strong (PISA 2012)
Hun
gary
New
Zea
land
Fran
ceIs
rael
Belg
ium
Ger
man
yLu
xem
bour
gCh
ileD
enm
ark
Aust
riaPo
rtug
alCz
ech
Repu
...Sp
ain
Pola
ndO
ECD
ave
...Au
stra
liaIr
elan
dSw
itzer
land
Gre
ece
Slov
enia
Uni
ted
Stat
esN
ethe
rland
sJa
pan
Swed
enIta
lyFi
nlan
dU
nite
d Ki
...M
exic
oCa
nada
Nor
way
Turk
eyKo
rea
Icel
and
Esto
nia
0.0
0.5
1.0
1.5
2.0
2.5
3.0Students in the bottom quarter of the ESCS index Immigrant students
Source: OECD PISA 2012 Database.
Relative risk of scoring in bottom quarter in PISA mathematics 2012

Challenge: The share of those who do not complete remains high (EAG 2014)
Mex
ico
Port
ugal
Italy
Chile
1
Den
mar
k
Nor
way
Gre
ece
Fran
ce
Irela
nd
Esto
nia
Ger
man
y
Aust
ria
Switz
erla
nd
Isra
el
Cana
da
Slov
ak R
epu.
..
Pola
nd
0
20
40
60
80
100 25-34 55-64 %
% of those who have not completed upper secondary education, 2012
Source: OECD (2014), Education at a Glance 2014: OECD Indicators, OECD Publishing, Paris, Table A1.2a.

High performing systems combine quality with equity (PISA 2012)
68101214161820222426350
400
450
500
550
600
NetherlandsEstoniaFinland
Japan
Sweden
Australia Canada
Iceland
Norway
Mexico
Korea
Italy
Israel
Germany
TurkeyGreece
Spain
United Kingdom
Czech Republic
Denmark
Slovenia
Ireland
AustriaSwitzerland
Poland
United States
Chile
Hungary
Slovak RepublicPortugal Luxembourg
France New Zealand
Belgium
Percentage of variation in performance explained by the PISA index of economic, social and cultural status
Mea
n m
athe
mati
cs sc
ore
OEC
D a
v-er
age
OECD average
Strong socio-economic
impact on student performance
Socially equitable distribution of
learning opportunities

0 20 000 40 000 60 000 80 000 100 000120 000140 000160 000180 000200 000400
450
500
550
600
447.984415
413.281467422.632355
477.044455481.644744
498.957882
520.545522
466.481430
517.501097
553.766659
487.063181
499.749903
518.070400513.525056
484.319298494.984674
485.321181
518.750335536.406918
501.127422
501.497460
492.795697
522.971758
478.260636
514.745239
493.934231
504.150766
500.026757
481.366786
505.540743
489.373070
530.931004
489.845098
R² = 0.00481005870595552
Average spending per student from the age of 6 to 15 (USD, PPPs) Ma
the
ma
tic
s p
erf
orm
an
ce
on
PIS
A 2
01
2 It is how money is invested that matters
Source: OECD (2015), Education Policy Outlook 2015: Making Reforms Happen.
Spending per student and average math performance, PISA 2012

Mean mathematics performance, by school location, after accounting for socio-economic status
Fig II.3.311 Making effective reforms happen is key
11
Funding grants
Subsidies for disadvantaged
schools Reforms in school leadership
and teachers
Support to students
from specific populations
Setting national priorities for
education
New middle school reform
National commitment to
ECEC
School improvement
VETreforms
Teacher training reform
OECD countries are using different policy options to improve their education systems…
School evaluation
reform
Student funding
But only around 1 in 10 reported evaluation to gauge impact

Mean mathematics performance, by school location, after accounting for socio-economic status
Fig II.3.31212 There are clear common policy trends across countries
Key policies implemented across OECD countries by policy lever, 2008-14(based on countries’ self reports)
0
5
10
15
20
25
30
35%
Students: Raising Outcomes
Institutions: Enhancing quality
Systems: Governing effectively

Policies to achieve more equitable education systems
Source: OECD PISA 2012.
Invest early and through upper secondary
Support low performing
disadvantaged schools
Eliminate system level
obstacles to equity

Avoid system level policies that hinder equity
More equitable
system level policies
ECECAustralia/Canada/
Chile/Mexico/Nordic/
France/Spain
Comprehensive education
and postpone trackingNordic/Austria/Germany
Equivalent upper
secondary pathways
Nordic/AlbertaManage school choice to avoid
inequities Neths/Chile
Make funding responsive to
needs Chile/Netherlands/Australia/
OntarioSource: OECD PISA 2012.

Manage school choice
Opt for higher quality
schools, and might foster efficiency, spur
innovation and raise quality overall.
Choice can result in a greater sorting and
segregation of students by ability,
income and ethnic background.
Choice
Equity

Mean mathematics performance, by school location, after accounting for socio-economic status
Fig II.3.3
30 40 50 60 70 80 90 100
76.5262332598113
71.249389025421472.3610292282187
82.7753225457255
47.2460886316524
76.3572840734428
82.321898959712481.4710420934067
91.133490403052
73.590424307814473.4893326457736
62.5622625960757
86.3608156348884
79.6907684339825
74.5645176953318
75.851059225026877.800951265576978.3182468193718
73.5806642976278
56.5338076972942
81.8313747315391
77.5352072037241
90.9572980454197
76.4243860986361
68.5604575765451
64.3522251858872
74.631510712846475.2142148588128
86.8861295209222
82.7492658818095
72.3201437743716
79.3908209086003
73.8155884458266
R² = 0.173535060657998
School competition
Mor
e so
cial
in
clu
-si
on
Less
soc
ial
incl
usio
n
%
Netherlands: Control on the local level with quota / Nijmegen: central subscription system
Belgium (Flemish community): Inter-Network Enrolment
Commission
School competition and social inclusion, PISA 2012
Managing school choice to prevent segregation

Fairness in allocation of resources: better results
-0.5-0.3-0.10.10.30.50.70.91.11.31.5350
400
450
500
550
600
650
R² = 0R² = 0-
Equity in resource allocation (index-point difference)
Mat
hem
atics
per
form
ance
(sco
re p
oint
s)
Less equity
Allocation of resources and PISA mathematics performance, PISA , 2012
Source: OECD PISA 2012.
Netherlands: Performance-based budgeting
in secondary, vocational and tertiary education
(if institution reduces drop out)
Australia: Review of Funding for Schooling (2011)
Chile: Law on Preferential
Subsidies (2008)
UK England:Pupil premium

Insufficient systemic support
Schools’ inadequate response to
student needs
Insufficient support for
staff
Poor manageme
nt
Impact of student’s
socio-economic
background
Wider range of abilities
Challenging school climate
Poor school environmen
tsDemanding learni
ng environme
nt
Inadequate support
systems
Disadvantaged students and schools face concrete challenges

Students may have different opportunities depending on schools they attend
Netherlands
Belgium
Germany
Austria
Japan
Slovak Republic
Ireland
Portugal
Czech
RepublicChile
Mexico
Australia
Turkey
Poland
Canada
Sweden
Finland0.0
0.5
1.0
1.5
2.0
2.5
3.0
3.5
4.0
4.5
Students in socio-economically disadvantaged schoolsStudents in socio-economically average schoolsStudents in socio-economically advantaged schools
20
Relative risk of scoring in the bottom quarter of the performance distribution, PISA 2012

Support disadvantaged students and schools
Supporting
disadvantaged
schools
General strategies
IRL/FIN/AUST/N. ZEAL/GER
Supportive school
climates/dataH.
PERF./DK/FR
Quality professionalsAUSTR/NOR
Effective classroom strategiesParental and
community engagement
MX/NETH

General strategies to support school improvement
Source: OECD PISA 2012.
Mex
ico
Port
ugal
Cana
daIc
elan
dU
nite
d St
ates
Chile
Turk
eyU
nite
d Ki
ngdo
mD
enm
ark
Aus
tral
iaSw
itze
rlan
dN
ew Z
eala
ndSw
eden
Isra
elIr
elan
dO
ECD
ave
rage
Spai
nH
unga
ryLu
xem
bour
gEs
toni
aFi
nlan
dBe
lgiu
mKo
rea
Gre
ece
Nor
way
Aus
tria
Net
herl
ands
Ital
yCz
ech
Repu
blic
Japa
nFr
ance
Slov
ak R
epub
licG
erm
any
Slov
enia
Pola
nd
-0.5-0.4-0.3-0.2-0.1
00.10.20.30.40.50.60.70.8
Index of teacher-student relations Index of disciplinary climate
Mean index
Mexico: PEC (2010-13)
Australia: Students First 2014
New Zealand: Student Achievement Function (2010)
UK: Wales: School Improve-
ment 2012N. Ireland: ESGS 2009
Ireland: National Strategy to Improve Literacy and
Numeracy (2011)
Norway: Better Learn-ing Environment (2009-14)

Esto
nia
Icel
and
Kore
aTu
rkey
Nor
way
Cana
daM
exic
oU
nite
d Ki
ngdo
mFi
nlan
dIt
aly
Swed
enJa
pan
Net
herla
nds
Uni
ted
Stat
esSl
oven
iaG
reec
eSw
itzer
land
Irel
and
Aus
tral
iaO
ECD
ave
rage
Pola
ndSp
ain
Czec
h Re
publ
icPo
rtug
alA
ustr
iaD
enm
ark
Chile
Luxe
mbo
urg
Ger
man
yBe
lgiu
mIs
rael
Fran
ceN
ew Z
eala
ndH
unga
rySl
ovak
Rep
ublic
0.0
0.5
1.0
1.5
2.0
2.5
3.0
3.5
Increased likelihood of students in the bottom quarter of the ESCS index scoring in the bottom quarter of the mathematics performance distributionIncreased likelihood of immigrant students scoring in the bottom quarter of the mathematics performance distributionRatio
OECD average
New Zealand: Policies to support
Māori/Pasifika populations
(2008-13)
France/Portugal:Education Priority Zones
Austria: New middle
school reform
Germany: National Action Plan
on Integration (2011)
Finland: National Core Curriculum for Instruction Preparing
Immigrants for Basic Education (2009)
Australia: Smarter schools partnership for disadvantaged schools Aboriginal torres islanders action plan.
Strategies to support disadvantaged schools and students
Source: OECD PISA 2012.

Reforms to support the teaching profession
Kore
aFi
nlan
dM
exic
oA
lber
ta ..
.Fl
ande
rs ..
.N
ethe
rl...
Aus
tral
iaEn
glan
d ...
Isra
elU
nite
d St
...Ch
ileA
vera
geN
orw
ayJa
pan
Den
mar
kPo
land
Icel
and
Esto
nia
Braz
ilIt
aly
Czec
h Re
...Po
rtug
alSp
ain
Swed
enFr
ance
Slov
ak R
e...
0
10
20
30
40
50
60
70
80
90
100
Perc
enta
ge o
f tea
cher
s
Netherlands:Teachers’ Programme
2013-20 (2013) Australia: Institute for Teaching and School Leadership (2010)
Finland: OSAAVA programme
(2010-16)
Korea: Evaluation system
(2010)
Mexico: Teacher Professional
Service (2013)
France: Reform of teacher training
programmes (2013)
Source: OECD (2014), TALIS..
% lower secondary teachers who "agree" or "strongly agree" that teaching profession is a valued profession in society, TALIS 2014

Policies to achieve more equitable education systems and reduce dropout
Invest early and through upper secondary
Support low performing
disadvantaged schools
Eliminate system level
obstacles to equity
No single model for success in the implementation of education reforms Reforms are specific to country’s education system context.
Some factors for effective implementation:
Placing the student and learning at the centre;
Invest in capacity-building; Leadership and coherence; Stakeholder engagement; Clear and actionable plans.

Main sources for further information
Education Policy Outlookwww.oecd.org/edu/policyoutlook.htm
www.oecd.org/edu/equity

For further information Beatriz Pont, [email protected] @beatrizpont
www.oecd.org/edu/policyoutlook.htm www.oecd.org/pisa