b-school alumni employment report - gmac.com · alumni perspectives survey 2018 the b-school alumni...
TRANSCRIPT

Alumni Perspectives Survey 2018
Market Intelligence
B-School Alumni Employment Report
Alumni Perspectives Survey 2018

Alumni Perspectives Survey 2018
The B-School Alumni Employment Report, Alumni Perspectives Survey 2018 report is a product of the Graduate Management Admission Council (GMAC), a nonprofit organization of 223 leading graduate business schools from around the world actively committed to advancing the art and science of admissions. The Council provides the solutions necessary for business schools and candidates to discover and evaluate one another to ensure that talent never goes undiscovered. GMAC owns and administers the Graduate Management Admission Test® (GMAT®) exam, used by more than 7,000 graduate programs worldwide, as well as the NMAT by GMAC™ exam, used for entrance into graduate management programs in India. The Council is based in Reston, VA. with offices in London, New Delhi, and Hong Kong.

Alumni Perspectives Survey 2018
Contents
• Introduction
• Executive Summary
• Current Employment Status
• B-School Alumni Entrepreneurs
• B-School Alumni Employees
• Organizational Characteristics
• Industry of Employment
• Job Function
• Job Level
• Job Progression
• Job Activities
• Employment Location
• Compensation: Base Salary
• Industry Highlights
• Products/Services
• Technology
• Finance/Accounting
• Government/Nonprofit
• Manufacturing
• Consulting
• Health Care
• Energy/Utilities

Alumni Perspectives Survey 2018
Introduction
10,882 Alumni from 274 Institutions Responded to the
GMAC Alumni Perspectives Survey
During the fourth quarter of 2017, the Graduate Management Admission Council (GMAC) partnered with 51 institutions to facilitate the Alumni Perspectives Survey. In addition, GMAC surveyed past alumni participants, which increased institutional representation to 274. In total, nearly 11,000 alumni responded and provided detailed information about their graduate management education and employment experiences.
Alumni who responded represent various MBA and business master’s program categories, including full-time MBA, professional MBA, executive MBA, quantitative business master’s, and non-quantitative business master’s programs. Full-time MBA programs include two- and one-year programs. Professional MBA programs include part-time, flexible, and online MBA programs. Quantitative business master’s programs include master in accounting, data analytics, and finance programs. Non-quantitative business master’s programs include master’s in management, international management, marketing, and entrepreneurship.
This report—the second in a series of topical reports based on this year’s Alumni Perspectives Survey—presents the findings associated with business school alumni employment, including employment status, entrepreneurship, industry, job functions, and salary. In addition, detailed data is shown for eight industries, including products/services, technology, finance/accounting, and consulting.
Explore with Interactive and Benchmark Reports
An Interactive Data Report and Benchmark Report tool accompany the 2018 Alumni Perspectives Survey, available exclusively to institutions that participated in the survey. The Interactive Data Report is an online tool that lets users customize data searches by multiple survey response variables such as overall value, career preparation, employment characteristics, and more. The Benchmark Report tool allows schools to benchmark their program’s responses against aggregated response from their peers.
Business School Participation in GMAC Research
The Graduate Management Admission Council offers graduate business schools opportunities to gather data and generate insights about the business school pipeline.
Schools can sign-up to participate in the GMAC Application Trends Survey, Corporate Recruiters Survey, and Alumni Perspectives Survey at http://www.gmac.com/surveysignup.
4

Alumni Perspectives Survey 2018
Introduction
Demographic Profile of B-School Alumni
Program Type RespondentsGender Median
Age At Graduation
Median Years Since Graduation
School Location
Male Female U.S. Non-U.S.
Overall 10,882 74% 26% 30 6 74% 26%
Pro
gra
m C
ate
go
ries Full-time MBA 5,897 77% 23% 29 8 71% 29%
Professional MBA 2,318 71% 29% 32 6 88% 12%
Executive MBA 1,102 82% 18% 37 6 75% 25%
Quantitative Master’s 429 62% 38% 25 4 79% 21%
Non-Quantitative Master’s 911 54% 46% 26 3 49% 51%
Sp
ecif
ic P
rog
ram
Ty
pes
Full-time two-year program (FT2MBA)
4,195 78% 22% 29 9 91% 9%
Full-time one-year MBA (FT1MBA)
1,664 75% 25% 30 5 22% 78%
Part-time lockstep MBA (PT Cohort)
1,016 74% 26% 32 5 80% 20%
Part-time self-paced MBA (PT Self-Paced)
967 70% 30% 32 7 95% 5%
Master of Accounting (MAcc)
223 53% 47% 24 6 100% 0%
Master in Finance (MFin) 153 71% 29% 26 3 44% 56%
Master in Management/ Global Management (MiM)
521 56% 44% 25 3 40% 60%
5

Alumni Perspectives Survey 2018
Executive Summary
B-School Alumni Find Career Success Across a Range of
Industries and Job Functions, with Variation by Graduation Year
The vast majority of b-school alumni are employed, whether for a company (79%) or as self-employed entrepreneurs (10%). B-school alumni working for companies tend to work for multinational organizations (61%) and a third (33%) work for companies with more than 25,000 employees. Nearly 1 in 10 alumni work at start-ups (8%).
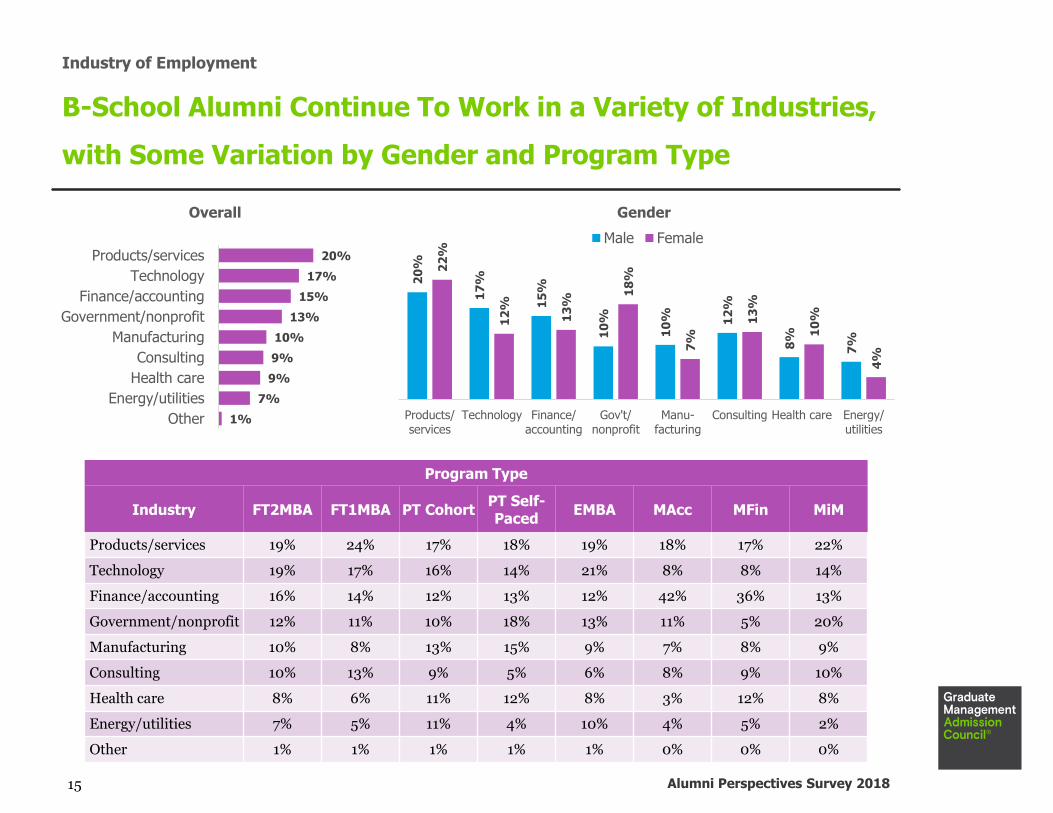
B-school alumni are employed across a range of industries and job functions. The top industries include products/services (20%), technology (17%), and finance/accounting (15%). The most common job functions include general management (24%), finance/accounting (21%), and marketing/sales (18%). Recent alumni are more likely than earlier alumni to work in the technology and products/services industries. Earlier alumni are more likely to work in the finance/accounting and consulting industries.
The majority of business school alumni feel their graduate management education advanced their careers at a faster rate compared with peers who do not have a graduate management education. Recent alumni tend to be employed in mid-level positions (49%), while those who graduated earlier have climbed into senior, executive, or c-suite positions.
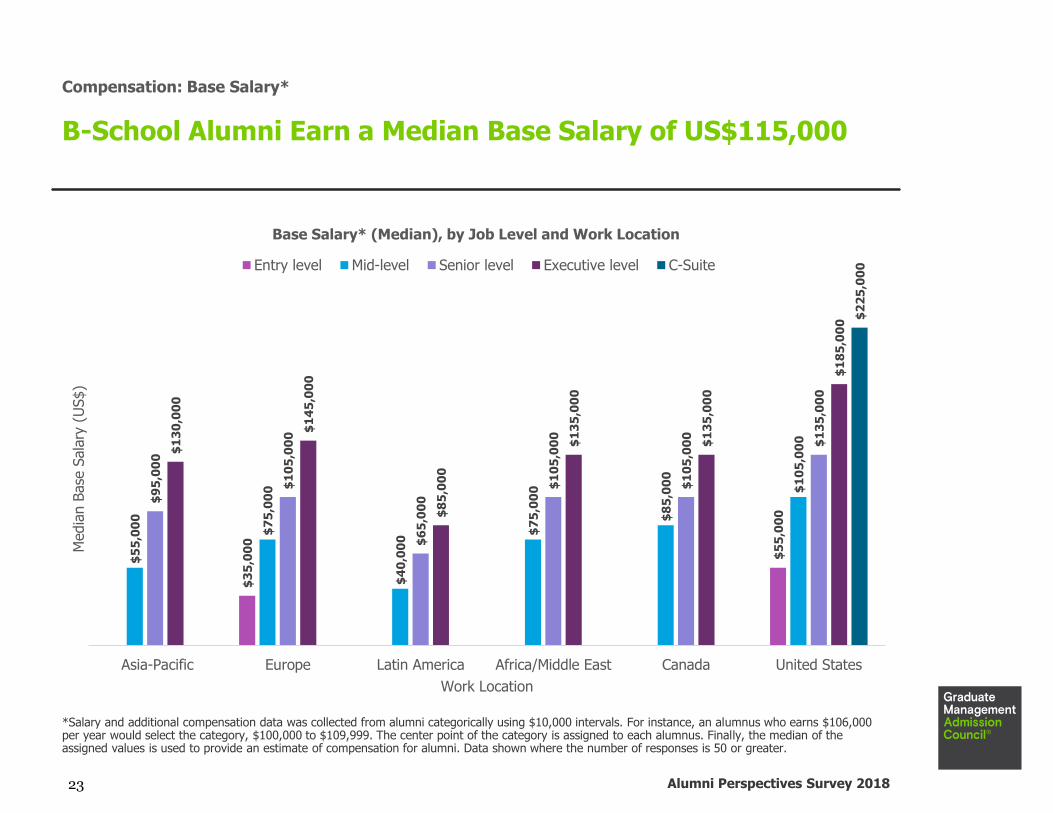
The median base salary among alumni is US$115,000, with variation by job level and location. For instance, the median salary of b-school alumni working at mid-level positions in the US is US$105,000 compared with US$85,000 in Canada, US$75,000 in Europe, and US$55,000 in Asia-Pacific. At the executive level, b-school alumni working in the US earn US$185,000 compared with US$135,000 in Canada, US$145,000 in Europe, and US$130,000 in Asia-Pacific.
One in 10 b-school alumni are entrepreneurs. The rate of entrepreneurship among alumni increases with years removed from graduation. For instance, 5 percent of the class of 2017 are self-employed compared with 17 percent of the class of 2001 and 23 percent of the class of 1991.
Entrepreneurs most often found their own business (85%) rather than purchasing a business (8%) or other means of acquisition. Only 14 percent of alumni entrepreneurs sought venture capital, but the majority of those that did received at least some venture capital (69%). Entrepreneurs are driven by the desire to be their own boss, they see self-employment as the best avenue for their ideas, and they believe entrepreneurship is an opportunity for greater income.
6

Alumni Perspectives Survey 2018
Current Employment Status

Alumni Perspectives Survey 2018
Current Employment Status
Most Alumni Are Employed for a Company (79%) or as an
Entrepreneur (10%)
79%
10%
5%6%
Overall
Employed Entrepreneur Seeking employment Not in the workforce
Overall, 89 percent of responding b-school alumni are employed, including 79 percent that work for a company and 10 percent that are self-employed entrepreneurs. The unemployment rate* among respondents is 6 percent. Alumni who were domestic students during their studies currently have an unemployment rate of 4 percent compared with an unemployment rate of 11 percent among alumni who were international students during their studies.
85% 80% 81% 79% 77% 74% 78% 86%
11% 11% 9% 10% 14% 13%16% 10%
Dom
est
ic
Inte
rnational
Asi
a-P
aci
fic
Euro
pe
Latin
Am
erica
Afr
ica/
Mid
dle
East
Canada
United
Sta
tes
Student Status & Citizenship
84% 78% 90% 88% 82% 97%76% 76%
12% 13%8% 9% 13%
2%
7% 7%
FT2MBA FT1MBA PT Cohort PT Self-paced EMBA MAcc MFIn MiM
Program Type
* Employment statistics are recalculated to align with Bureau of Labor Statistics U-3 “Total unemployed, as a percent of the civilian labor force,” which removes individuals not in the workforce (6% of the alumni sample) from the calculation (https://www.bls.gov/news.release/empsit.t15.htm)
8

Alumni Perspectives Survey 2018
B-School Alumni Entrepreneurs

Alumni Perspectives Survey 2018
5%
23%
0%
5%
10%
15%
20%
25%
% o
f b-s
chool alu
mni w
ho a
re e
ntr
epre
neurs
Graduation Year
Rate of Entrepreneurship, by Graduation Year
B-School Alumni Entrepreneurs
B-School Alumni Tend To Embark on Entrepreneurial
Ventures Several Years After Graduation
One in 10 (10%) b-school alumni are entrepreneurs today.
10

Alumni Perspectives Survey 2018
B-School Alumni Entrepreneurs
Most Entrepreneurs Founded Their Own Company in the
Consulting or Products/Services Industry, Few Sought VC
2%
4%
8%
85%
Received transfer of ownership
Inherited
Purchased
Founded
Business Acquisition
1%
2%
3%
5%
6%
8%
13%
26%
36%
Other
Government/nonprofit
Energy/utilities
Manufacturing
Health care
Technology
Finance/accounting
Products/services
Consulting
Industry
14% sought
venture capital
69% received
venture capital
31% did not receive venture capital
55%
84%
50%
87%
92%
73%
75%
6%
14%
14%
21%
23%
29%
33%
Consulting
Finance/accounting
Products/services
Health care
Manufacturing
Technology
Energy/utilities
Venture Capital, by Industry
Sought VC Received VC
11

Alumni Perspectives Survey 2018
B-School Alumni Entrepreneurs
Most B-School Entrepreneurs Are Motivated to Be Their Own Boss
and See Self-Employment as the Best Avenue for Their Ideas
8%
27%
31%
52%
56%
58%
61%
64%
65%
14%
25%
40%
27%
31%
28%
30%
29%
28%
78%
48%
29%
21%
12%
14%
10%
7%
7%
Couldn’t find a job
An entrepreneurial friend/family was a role model
Working for someone else did not appeal to me
Always wanted to start my own business
Balance work and family
Flexible hours
Opportunity for greater income
Best avenue for my ideas/goods/services
Wanted to be my own boss
Motivation for Pursuing Entrepreneurship
Very important Somewhat important Not at all important
Average annual revenue stream of nearly US$7 million
12

Alumni Perspectives Survey 2018
B-School Alumni Employees

Alumni Perspectives Survey 2018
Organizational Characteristics
B-School Alumni Work in a Variety of Organizational
Types/Sizes; Larger Organizations Have More Int’l Clientele
17% 19%
29%
13%8%
GlobalFortune 100
GlobalFortune 500
Publiclytraded
Familyowned
Start-up
Type of Organization
7%9%
12%
6%
14%
8%10%
33%
Few
er
than 2
5
25-1
00
101-5
00
501-1
,000
1,0
01-5
,000
5,0
01-1
0,0
00
10,0
01-2
5,0
00
More
than 2
5,0
00
Size of Organization
76%66%
56%
24%33%
44%
Small(< 1,001)
Mid(1,001-10,000)
Large(10,001+)
% o
f cl
ients
Clientele, by Organization Size
Domestic Clients International Clients
61% of b-school alumni work for companies with locations in multiple countries
14
Alumni Perspectives Survey 2018
Industry of Employment
B-School Alumni Continue To Work in a Variety of Industries,
with Some Variation by Gender and Program Type
1%
7%
9%
9%
10%
13%
15%
17%
20%
Other
Energy/utilities
Health care
Consulting
Manufacturing
Government/nonprofit
Finance/accounting
Technology
Products/services
Overall
Program Type
Industry FT2MBA FT1MBA PT CohortPT Self-Paced
EMBA MAcc MFin MiM
Products/services 19% 24% 17% 18% 19% 18% 17% 22%
Technology 19% 17% 16% 14% 21% 8% 8% 14%
Finance/accounting 16% 14% 12% 13% 12% 42% 36% 13%
Government/nonprofit 12% 11% 10% 18% 13% 11% 5% 20%
Manufacturing 10% 8% 13% 15% 9% 7% 8% 9%
Consulting 10% 13% 9% 5% 6% 8% 9% 10%
Health care 8% 6% 11% 12% 8% 3% 12% 8%
Energy/utilities 7% 5% 11% 4% 10% 4% 5% 2%
Other 1% 1% 1% 1% 1% 0% 0% 0%
20
%
17
%
15
%
10
%
10
% 12
%
8%
7%
22
%
12
%
13
%
18
%
7%
13
%
10
%
4%
Products/services
Technology Finance/accounting
Gov't/nonprofit
Manu-facturing
Consulting Health care Energy/utilities
Gender
Male Female
15

Alumni Perspectives Survey 2018
19%
23%
8%
18%18%
13%
15%
10%
11%10%
18%
12%
6%
8%
4%
6%
1990 or earlier 1991 to 1995 1996 to 2000 2001 to 2005 2006 to 2010 2011 to 2015 2016 to 2017
Perc
ent
of em
plo
yed a
lum
ni
Graduation Year
Industry, by Graduation Year
Products/services Technology Finance/accounting Government/nonprofit
Manufacturing Consulting Health care Energy/utilities
Industry of Employment
Recent B-School Alumni Are More Likely To Work in Tech and
Products/Services Compared with Finance and Consulting
16

Alumni Perspectives Survey 2018
Job Function
B-School Alumni Continue to Work in a Variety of Job
Functions, with Some Variation by Gender and Program Type
4%
4%
6%
10%
13%
18%
21%
24%
Other
Human resources
IT/MIS
Operations/logistics
Consulting
Marketing/sales
Finance/accounting
General management
Overall
Program Type
Job function FT2MBA FT1MBA PT CohortPT Self-Paced
EMBA MAcc MFin MiM
General management 22% 26% 26% 26% 35% 2% 9% 27%
Finance/accounting 24% 16% 15% 19% 11% 82% 57% 14%
Marketing/sales 19% 21% 18% 18% 18% 1% 6% 17%
Consulting 14% 18% 13% 8% 10% 10% 9% 13%
Operations/logistics 10% 8% 14% 14% 9% 1% 7% 13%
IT/MIS 4% 5% 10% 8% 11% 1% 6% 2%
Human resources 4% 3% 2% 3% 2% 0% 2% 7%
Other 4% 4% 2% 4% 4% 2% 4% 7%
25
%
22
%
16
%
13
%
10
%
7%
2%
21
%
18
% 22
%
13
%
9%
5% 7
%
Generalmgt.
Finance/Acct.
Marketing/sales
Consulting Operations/logistics
IT/MIS Humanresources
Gender
Male Female
17

Alumni Perspectives Survey 2018
28%
18%
24%
20%
13%
20%
12%
15%
5%
13%
5%
6%
2%
4%
1990 or earlier 1991 to 1995 1996 to 2000 2001 to 2005 2006 to 2010 2011 to 2015 2016 to 2017
Perc
ent
of em
plo
yed a
lum
ni
Graduation Year
Job Function, by Graduation Year
General management Finance/accounting Marketing/sales Consulting
Operations/logistics IT/MIS Human resources
Job Function
Recent B-School Alumni Are More Likely To Work in
Marketing/Sales, Consulting, and Operations/Logistics
18

Alumni Perspectives Survey 2018
2% 1% 1% 1% 1% 5%19%19% 20% 22% 25%
32%
46%
49%34% 38% 34%
42%44%
35%23%
25%26% 29%
23%
16% 10% 7%20% 15% 14% 10% 6% 4% 2%
1990 or earlier 1991 to 1995 1996 to 2000 2001 to 2005 2006 to 2010 2011 to 2015 2016 to 2017
% o
f em
plo
yed
Graduation Year
Job Levels, by Graduation Year
Entry level Mid-level Senior level Executive level C-Suite
Job Level
B-School Alumni Climb the Corporate Hierarchy as They
Accumulate Experience; Most Satisfied with Career Progression
3%8%
14%
44%
32%
Verydissatisfied
Dissatisfied Neutral Satisfied VerySatisfied
% o
f em
plo
yed
Satisfaction with Career ProgressionMost alumni from the classes of 2016 and 2017 currently work in mid-level (49%) or senior-level (23%) positions. An additional 19 percent are in entry-level positions. As alumni accumulate experience, they tend to rise to higher job levels. For example, most alumni that graduated between 1996 and 2000 currently work in senior level (34%) and executive level (29%) positions.
Overall, most alumni are satisfied with their career progression to date (76%). Earlier alumni express higher levels of satisfaction with their career progression than recent alumni.
19

Alumni Perspectives Survey 2018
64%
68%
84%
87%
I could not have obtained mycurrent job without my GME
I receved more promotions aftergraduation
My GME moved me further alongin my career
The skills I developed in b-schooladvanced my career
% Agree
Overall
Job Progression
Graduate Management Education Advances Careers of Alumni
Compared with Peers Without a Business Degree
73
%
63
%
57
%
54
%
58
%
56
%
63
%
55
%
88
%
81
%
80
%
79
%
83
%
80
%
80
%
76
%90
%
84
%
84
%
84
%
89
%
86
%
83
%
78
%
74
%
65
%
66
%
65
%
66
%
54
%
56
%
52
%
FT2MBA FT1MBA PT Cohort PT Self-paced EMBA Macc MFIn MiM
% A
gre
e
Program Type*
I could not have obtained my current job without my GME My GME moved me further along in my career
The skills I developed in b-school advanced my career I received more promotions after graduation
Respondents were asked to indicate their level of agreement with statements
about their career progression relative to peers who do not have a graduate
management education.
20

Alumni Perspectives Survey 2018
Job Activities
B-School Alumni Tend to Grow Their Roles Over Time; Recent
Alumni Are More Likely to Work on Virtual Teams
55%
55%
62%
68%
69%
Manage vendors/suppliers
Make hiringdecisions
Manage a budget
Superviseemployees
Work on virtualteams
Overall
64
%
47
% 57
% 72
%
61
%
59
%
52
% 65
%
68
%
65
%
49
%
45
%
68
% 80
%
44
%
80
%
76
% 85
%
72
%
70
%
59
%
49
% 64
%
59
%
40
%50
%
72
%
66
%
74
%
47
%
50
%
52
% 64
% 76
%
60
%
Manage a budget Make hiring decisions Supervise employees Work on virtual teams Managevendors/suppliers
Job Activities, by Job Function
Marketing/sales Operations/logistics Consulting General management Finance/accounting Human resources IT/MIS
28
%
9% 2
3%
56
%
31
%46
%
35
% 50
% 66
%
45
%67
%
65
% 77
%
72
%
57
%
87
%
88
%
95
%
75
%
73
%
97
%
96
%
96
%
71
% 85
%
Manage a budget Make hiringdecisions
Superviseemployees
Work on virtualteams
Managevendors/suppliers
Job Activities, by Job Level
Entry level Mid-level Senior level Executive level C-Suite
21

Alumni Perspectives Survey 2018
Asia-Pacific,
6%
Europe, 8%
Latin America,
6%
Africa/ Middle
East, 3%
Canada, 4%
United States, 73%
Location of Employment
Employment Location
Most B-School Alumni Work in the Same Region Pre- and
Post-Graduation and in their Region of Citizenship
Current Work Location, by Pre-Business School Work Location
Pre-Business School Work Location
Current Work Location
Asia- Pacific EuropeLatin
AmericaAfrica/
Middle EastCanada United States
Asia-Pacific 57% 5% 0% 2% 3% 33%
Europe 3% 72% 1% 3% 4% 16%
Latin America 1% 5% 68% 1% 2% 23%
Africa/Middle East 1% 7% 0% 71% 3% 17%
Canada 3% 3% 1% 2% 81% 10%
United States 1% 1% 0% 0% 0% 97%
55%72% 67% 73% 79%
97%
45%28% 33% 27% 21%
3%
Asia-Pacific Europe LatinAmerica
Africa/Middle East
Canada UnitedStates
Region of citizenship
Work Location, by Citizenship
In region Outside region
22
Alumni Perspectives Survey 2018
*Salary and additional compensation data was collected from alumni categorically using $10,000 intervals. For instance, an alumnus who earns $106,000 per year would select the category, $100,000 to $109,999. The center point of the category is assigned to each alumnus. Finally, the median of the assigned values is used to provide an estimate of compensation for alumni. Data shown where the number of responses is 50 or greater.
Compensation: Base Salary*
B-School Alumni Earn a Median Base Salary of US$115,000
$3
5,0
00
$5
5,0
00
$5
5,0
00
$7
5,0
00
$4
0,0
00
$7
5,0
00
$8
5,0
00
$1
05
,00
0
$9
5,0
00
$1
05
,00
0
$6
5,0
00
$1
05
,00
0
$1
05
,00
0
$1
35
,00
0
$1
30
,00
0
$1
45
,00
0
$8
5,0
00
$1
35
,00
0
$1
35
,00
0
$1
85
,00
0
$2
25
,00
0
Asia-Pacific Europe Latin America Africa/Middle East Canada United States
Media
n B
ase
Sala
ry (
US$)
Work Location
Base Salary* (Median), by Job Level and Work Location
Entry level Mid-level Senior level Executive level C-Suite
23

Alumni Perspectives Survey 2018
Industry Highlights

Alumni Perspectives Survey 2018
Industry Highlights
Products/Services

Alumni Perspectives Survey 2018
Products/Services Industry
Employer Characteristics
14%
22%
32%
26%
7%
GlobalFortune 100
GlobalFortune 500
Publiclytraded
Familyowned
Start-up
Type of Organization
9%10%
14%
5%
14%
8% 9%
30%
Few
er
than 2
5
25-1
00
101-5
00
501-1
,000
1,0
01-5
,000
5,0
01-1
0,0
00
10,0
01-2
5,0
00
More
than 2
5,0
00
Size of Organization
85%64% 58%
16%36% 42%
Small(< 1,001)
Mid(1,001-10,000)
Large(10,001+)
% o
f cl
ients
Clientele, by Organization Size
Domestic Clients International Clients
67% of b-school alumni in the products/services industry work for companies with locations in multiple countries
26

Alumni Perspectives Survey 2018
Products/Services Industry
Employment Characteristics
2%
4%
5%
8%
12%
18%
25%
27%
Other
Human resources
IT/MIS
Consulting
Operations/logistics
Finance/accounting
Marketing/sales
General management
% of employed
Job Functions of B-School Alumni
0% 1% 5%
22%20%
35%39%
43%39%
40%38%
23%31%
17%13% 10%
10% 6% 5% 2%
2001 to2005
2006 to2010
2011 to2015
2016 to2017
% o
f em
plo
yed
Graduation Year
Job Levels, by Graduation Year
Entry level Mid-level Senior level Executive level C-Suite
4%7%
16%
43%
30%
Verydissatisfied
Dissatisfied Neutral Satisfied VerySatisfied
% o
f em
plo
yed
Satisfaction with Career Progression
27

Alumni Perspectives Survey 2018
Products/Services Industry
Job Characteristics
71
%
50
%
62
%
69
%
68
%
65
%
52
%
69
%
69
% 74
%
43
% 47
%
64
% 67
%
47
%
82
%
77
%
86
%
71
%
79
%
73
%
54
%
72
%
61
%
54
%
47
%
76
%
63
%
64
%
40
%
62
%
60
%
69
%
78
%
64
%
Manage a budget Make hiring decisions Supervise employees Work on virtual teams Managevendors/suppliers
Job Activities, by Job Function
Marketing/sales Operations/logistics Consulting General management Finance/accounting Human resources IT/MIS
28

Alumni Perspectives Survey 2018
Products/Services Industry
Annual Base Salary, by Job Function and Job Level$105,0
00
$105,0
00
$115,0
00
$125,0
00
$115,0
00
$90,0
00
$120,0
00
$45,0
00
$95,0
00
$125,0
00
$155,0
00
$210,0
00
Mark
eting/
sale
s
Opera
tions/
logis
tics
Consu
ltin
g
Genera
lm
anagem
ent
Fin
ance
/acc
ounting
Hum
an
reso
urc
es
IT/M
IS
Entr
y level
Mid
-leve
l
Senio
r le
vel
Execu
tive level
C-S
uite
Media
n B
ase
Sala
ry (
US$)
Base Salary* (Median), by Job Function and Job Level
Job Function Job Level
*Salary and additional compensation data was collected from alumni categorically using $10,000 intervals. For instance, an alumnus who earns $106,000 per year would select
the category, $100,000 to $109,999. The center point of the category is assigned to each alumnus. Finally, the median of the assigned values is used to provide an estimate of
compensation for alumni. ND: Data shown where the number of responses is 50 or greater.
29

Alumni Perspectives Survey 2018
Industry Highlights
Technology

Alumni Perspectives Survey 2018
Technology Industry
Employer Characteristics
31%
21%
34%
8%
19%
GlobalFortune 100
GlobalFortune 500
Publiclytraded
Familyowned
Start-up
Type of Organization
6%9%
12%
5%
10%8%
11%
40%
Few
er
than 2
5
25-1
00
101-5
00
501-1
,000
1,0
01-5
,000
5,0
01-1
0,0
00
10,0
01-2
5,0
00
More
than 2
5,0
00
Size of Organization
75%62%
50%
25%38%
50%
Small(< 1,001)
Mid(1,001-10,000)
Large(10,001+)
% o
f cl
ients
Clientele, by Organization Size
Domestic Clients International Clients
84% of b-school alumni in the technology industry work for companies with locations in multiple countries
31

Alumni Perspectives Survey 2018
Technology Industry
Employment Characteristics
2%
4%
10%
11%
12%
12%
24%
25%
Other
Human resources
Consulting
Operations/logistics
IT/MIS
Finance/accounting
General management
Marketing/sales
% of employed
Job Functions of B-School Alumni
1% 1% 4% 10%
26% 26%
48%
61%
43%50%
37%24%
24% 17% 8%5%
5% 6% 3% 0%
2001 to2005
2006 to2010
2011 to2015
2016 to2017
% o
f em
plo
yed
Graduation Year
Job Levels, by Graduation Year
Entry level Mid-level Senior level Executive level C-Suite
3%7%
16%
43%
31%
Verydissatisfied
Dissatisfied Neutral Satisfied VerySatisfied
% o
f em
plo
yed
Satisfaction with Career Progression
32

Alumni Perspectives Survey 2018
Technology Industry
Job Characteristics
56
%
46
%
53
%
84
%
59
%
54
%
49
%
60
%
78
%
61
%
35
%
35
%
53
%
88
%
38
%
73
% 76
%
83
%
85
%
71
%
72
%
56
%
65
%
78
%
43
%
44
%
74
%
65
%
89
%
46
%
42
% 48
%
63
%
78
%
53
%
Manage a budget Make hiring decisions Supervise employees Work on virtual teams Managevendors/suppliers
Job Activities, by Job Function
Marketing/sales Operations/logistics Consulting General management Finance/accounting Human resources IT/MIS
33

Alumni Perspectives Survey 2018
Technology Industry
Annual Base Salary, by Job Function and Job Level$125,0
00
$125,0
00
$125,0
00
$135,0
00
$125,0
00
$125,0
00
$115,0
00
$65,0
00
$115,0
00
$135,0
00
$175,0
00
$185,0
00
Mark
eting/
sale
s
Opera
tions/
logis
tics
Consu
ltin
g
Genera
lm
anagem
ent
Fin
ance
/acc
ounting
Hum
an
reso
urc
es
IT/M
IS
Entr
y level
Mid
-leve
l
Senio
r le
vel
Execu
tive level
C-S
uite
Media
n B
ase
Sala
ry (
US$)
Base Salary* (Median), by Job Function and Job Level
Job Function Job Level
*Salary and additional compensation data was collected from alumni categorically using $10,000 intervals. For instance, an alumnus who earns $106,000 per year would select
the category, $100,000 to $109,999. The center point of the category is assigned to each alumnus. Finally, the median of the assigned values is used to provide an estimate of
compensation for alumni. ND: Data shown where the number of responses is 50 or greater.
34

Alumni Perspectives Survey 2018
Industry Highlights
Finance/Accounting

Alumni Perspectives Survey 2018
Finance/Accounting Industry
Employer Characteristics
19%23%
37%
10%
5%
GlobalFortune 100
GlobalFortune 500
Publiclytraded
Familyowned
Start-up
Type of Organization
10%6%
11%
5%
12%
7%
12%
37%
Few
er
than 2
5
25-1
00
101-5
00
501-1
,000
1,0
01-5
,000
5,0
01-1
0,0
00
10,0
01-2
5,0
00
More
than 2
5,0
00
Size of Organization
86% 80%71%
14% 20%29%
Small(< 1,001)
Mid(1,001-10,000)
Large(10,001+)
% o
f cl
ients
Clientele, by Organization Size
Domestic Clients International Clients
66% of b-school alumni in the finance/accounting industry work for companies with locations in multiple countries
36

Alumni Perspectives Survey 2018
Finance/Accounting Industry
Employment Characteristics
1%
2%
4%
6%
7%
11%
17%
51%
Other
Human resources
Operations/logistics
IT/MIS
Consulting
Marketing/sales
General management
Finance/accounting
% of employed
Job Functions of B-School Alumni
1% 1% 7%
34%25% 27%
54%
46%
43%50%
30% 14%18%
16% 6% 4%13%5% 3% 1%
2001 to2005
2006 to2010
2011 to2015
2016 to2017
% o
f em
plo
yed
Graduation Year
Job Levels, by Graduation Year
Entry level Mid-level Senior level Executive level C-Suite
3%7%
12%
44%
34%
Verydissatisfied
Dissatisfied Neutral Satisfied VerySatisfied
% o
f em
plo
yed
Satisfaction with Career Progression
37

Alumni Perspectives Survey 2018
Finance/Accounting Industry
Job Characteristics
60
%
42
%
55
%
68
%
45
%
47
% 53
%
73
%
71
%
43
%
53
%
46
%
66
% 70
%
41
%
77
% 80
%
88
%
72
%
61
%
40
%
39
%
60
%
57
%
30
%33
%
63
%
56
%
93
%
44
%
47
% 53
%
66
%
77
%
67
%
Manage a budget Make hiring decisions Supervise employees Work on virtual teams Managevendors/suppliers
Job Activities, by Job Function
Marketing/sales Operations/logistics Consulting General management Finance/accounting Human resources IT/MIS
38

Alumni Perspectives Survey 2018
Technology Industry
Annual Base Salary, by Job Function and Job Level$125,0
00
$110,0
00
$115,0
00
$155,0
00
$115,0
00
$125,0
00
$55,0
00 $
105,0
00
$145,0
00
$205,0
00 $250,0
00
Mark
eting/
sale
s
Opera
tions/
logis
tics
Consu
ltin
g
Genera
lm
anagem
ent
Fin
ance
/acc
ounting
Hum
an
reso
urc
es
IT/M
IS
Entr
y level
Mid
-leve
l
Senio
r le
vel
Execu
tive level
C-S
uite
Media
n B
ase
Sala
ry (
US$)
Base Salary* (Median), by Job Function and Job Level
Job Function Job Level
ND
*Salary and additional compensation data was collected from alumni categorically using $10,000 intervals. For instance, an alumnus who earns $106,000 per year would select
the category, $100,000 to $109,999. The center point of the category is assigned to each alumnus. Finally, the median of the assigned values is used to provide an estimate of
compensation for alumni. ND: Data shown where the number of responses is 50 or greater.
39

Alumni Perspectives Survey 2018
Industry Highlights
Government/Nonprofit

Alumni Perspectives Survey 2018
Government/Nonprofit Industry
Employer Characteristics
0% 0% 0%
2%
1%
GlobalFortune 100
GlobalFortune 500
Publiclytraded
Familyowned
Start-up
Type of Organization
6%
9%
14%
11%
22%
11% 11%
15%
Few
er
than 2
5
25-1
00
101-5
00
501-1
,000
1,0
01-5
,000
5,0
01-1
0,0
00
10,0
01-2
5,0
00
More
than 2
5,0
00
Size of Organization
90% 88% 82%
10% 12% 18%
Small(< 1,001)
Mid(1,001-10,000)
Large(10,001+)
% o
f cl
ients
Clientele, by Organization Size
Domestic Clients International Clients
36% of b-school alumni in the gov’t/nonprofit industry work for companies with locations in multiple countries
41

Alumni Perspectives Survey 2018
Government/Nonprofit Industry
Employment Characteristics
17%
4%
7%
8%
8%
11%
15%
31%
Other
Human resources
IT/MIS
Operations/logistics
Consulting
Marketing/sales
Finance/accounting
General management
% of employed
Job Functions of B-School Alumni
3% 3% 8%18%
32% 34%
45%
49%
43% 41%
33%
21%17% 13%
12% 9%6% 9% 3% 3%
2001 to2005
2006 to2010
2011 to2015
2016 to2017
% o
f em
plo
yed
Graduation Year
Job Levels, by Graduation Year
Entry level Mid-level Senior level Executive level C-Suite
4%9%
14%
41%
32%
Verydissatisfied
Dissatisfied Neutral Satisfied VerySatisfied
% o
f em
plo
yed
Satisfaction with Career Progression
42

Alumni Perspectives Survey 2018
Government/Nonprofit Industry
Job Characteristics
64
%
53
%
63
%
48
%
57
%
66
%
49
%
64
%
63
%
57
%
38
%
36
%
48
%
61
%
31
%
81
%
75
%
85
%
55
%
56
%
69
%
55
%
62
%
38
% 42
%
63
%
72
%
81
%
49
%
35
%
58
%
60
% 65
%
57
% 61
%
Manage a budget Make hiring decisions Supervise employees Work on virtual teams Managevendors/suppliers
Job Activities, by Job Function
Marketing/sales Operations/logistics Consulting General management Finance/accounting Human resources IT/MIS
43

Alumni Perspectives Survey 2018
Government/Nonprofit Industry
Annual Base Salary, by Job Function and Job Level$75,0
00 $95,0
00
$75,0
00
$105,0
00
$85,0
00
$100,0
00
$115,0
00
$45,0
00
$75,0
00
$105,0
00 $
135,0
00
$145,0
00
Mark
eting/
sale
s
Opera
tions/
logis
tics
Consu
ltin
g
Genera
lm
anagem
ent
Fin
ance
/acc
ounting
Hum
an
reso
urc
es
IT/M
IS
Entr
y level
Mid
-leve
l
Senio
r le
vel
Execu
tive level
C-S
uite
Media
n B
ase
Sala
ry (
US$)
Base Salary* (Median), by Job Function and Job Level
Job Function Job Level
*Salary and additional compensation data was collected from alumni categorically using $10,000 intervals. For instance, an alumnus who earns $106,000 per year would select
the category, $100,000 to $109,999. The center point of the category is assigned to each alumnus. Finally, the median of the assigned values is used to provide an estimate of
compensation for alumni. ND: Data shown where the number of responses is 50 or greater.
44

Alumni Perspectives Survey 2018
Industry Highlights
Manufacturing

Alumni Perspectives Survey 2018
Manufacturing Industry
Employer Characteristics
20%
28%
39%
25%
2%
GlobalFortune 100
GlobalFortune 500
Publiclytraded
Familyowned
Start-up
Type of Organization
3%6%
11%
5%
16%
9% 9%
41%
Few
er
than 2
5
25-1
00
101-5
00
501-1
,000
1,0
01-5
,000
5,0
01-1
0,0
00
10,0
01-2
5,0
00
More
than 2
5,0
00
Size of Organization
76%64%
50%
24%36%
50%
Small(< 1,001)
Mid(1,001-10,000)
Large(10,001+)
% o
f cl
ients
Clientele, by Organization Size
Domestic Clients International Clients
84% of b-school alumni in the manufacturing industry work for companies with locations in multiple countries
46

Alumni Perspectives Survey 2018
Manufacturing Industry
Employment Characteristics
1%
3%
4%
6%
19%
20%
22%
25%
Other
Consulting
IT/MIS
Human resources
Operations/logistics
Finance/accounting
Marketing/sales
General management
% of employed
Job Functions of B-School Alumni
0% 1% 4% 9%25%
32%
47%45%
40%
42%
32% 32%25%
20%13% 11%
11% 6% 4% 3%
2001 to2005
2006 to2010
2011 to2015
2016 to2017
% o
f em
plo
yed
Graduation Year
Job Levels, by Graduation Year
Entry level Mid-level Senior level Executive level C-Suite
2%
9%13%
45%
32%
Verydissatisfied
Dissatisfied Neutral Satisfied VerySatisfied
% o
f em
plo
yed
Satisfaction with Career Progression
47

Alumni Perspectives Survey 2018
Manufacturing Industry
Job Characteristics
74
%
46
%
61
%
74
%
67
%
56
%
55
%
65
% 68
%
68
%
48
%
48
%
56
%
78
%
52
%
85
%
77
%
85
%
73
% 77
%
74
%
54
%
67
%
67
%
39
%
67
%
77
%
69
%
88
%
60
%
68
%
55
%
74
%
87
%
81
%
Manage a budget Make hiring decisions Supervise employees Work on virtual teams Managevendors/suppliers
Job Activities, by Job Function
Marketing/sales Operations/logistics Consulting General management Finance/accounting Human resources IT/MIS
48

Alumni Perspectives Survey 2018
Manufacturing Industry
Annual Base Salary, by Job Function and Job Level$115,0
00
$105,0
00
$135,0
00
$115,0
00
$115,0
00
$105,0
00
$125,0
00 $165,0
00
$235,0
00
Mark
eting/
sale
s
Opera
tions/
logis
tics
Consu
ltin
g
Genera
lm
anagem
ent
Fin
ance
/acc
ounting
Hum
an
reso
urc
es
IT/M
IS
Entr
y level
Mid
-leve
l
Senio
r le
vel
Execu
tive level
C-S
uite
Media
n B
ase
Sala
ry (
US$)
Base Salary* (Median), by Job Function and Job Level
Job Function Job Level
ND ND ND
*Salary and additional compensation data was collected from alumni categorically using $10,000 intervals. For instance, an alumnus who earns $106,000 per year would select
the category, $100,000 to $109,999. The center point of the category is assigned to each alumnus. Finally, the median of the assigned values is used to provide an estimate of
compensation for alumni. ND: Data shown where the number of responses is 50 or greater.
49

Alumni Perspectives Survey 2018
Industry Highlights
Consulting

Alumni Perspectives Survey 2018
Consulting Industry
Employer Characteristics
13% 13%15%
14%
10%
GlobalFortune 100
GlobalFortune 500
Publiclytraded
Familyowned
Start-up
Type of Organization
15% 15%
10%
5%
12%
5% 7%
31%
Few
er
than 2
5
25-1
00
101-5
00
501-1
,000
1,0
01-5
,000
5,0
01-1
0,0
00
10,0
01-2
5,0
00
More
than 2
5,0
00
Size of Organization
85%64% 58%
16%36% 42%
Small(< 1,001)
Mid(1,001-10,000)
Large(10,001+)
% o
f cl
ients
Clientele, by Organization Size
Domestic Clients International Clients
75% of b-school alumni in the consulting industry work for companies with locations in multiple countries
51

Alumni Perspectives Survey 2018
Consulting Industry
Employment Characteristics
1%
1%
2%
3%
6%
8%
11%
69%
Other
Human resources
IT/MIS
Operations/logistics
Finance/accounting
Marketing/sales
General management
Consulting
% of employed
Job Functions of B-School Alumni
0% 0% 5%
25%15% 18%
44%
52%
42%52%
38%
18%29%
24%13% 4%
14%6% 1% 1%
2001 to2005
2006 to2010
2011 to2015
2016 to2017
% o
f em
plo
yed
Graduation Year
Job Levels, by Graduation Year
Entry level Mid-level Senior level Executive level C-Suite
2%7%
12%
45%
34%
Verydissatisfied
Dissatisfied Neutral Satisfied VerySatisfied
% o
f em
plo
yed
Satisfaction with Career Progression
52

Alumni Perspectives Survey 2018
Consulting Industry
Job Characteristics
44
%
34
%
45
%
73
%
59
%
52
% 56
%
68
%
64
%
64
%
56
%
49
%
79
%
87
%
48
%
75
% 79
% 85
%
83
%
76
%
63
%
44
%
60
% 67
%
46
%
Manage a budget Make hiring decisions Supervise employees Work on virtual teams Managevendors/suppliers
Job Activities, by Job Function
Marketing/sales Operations/logistics Consulting General management Finance/accounting
53
Alumni Perspectives Survey 2018
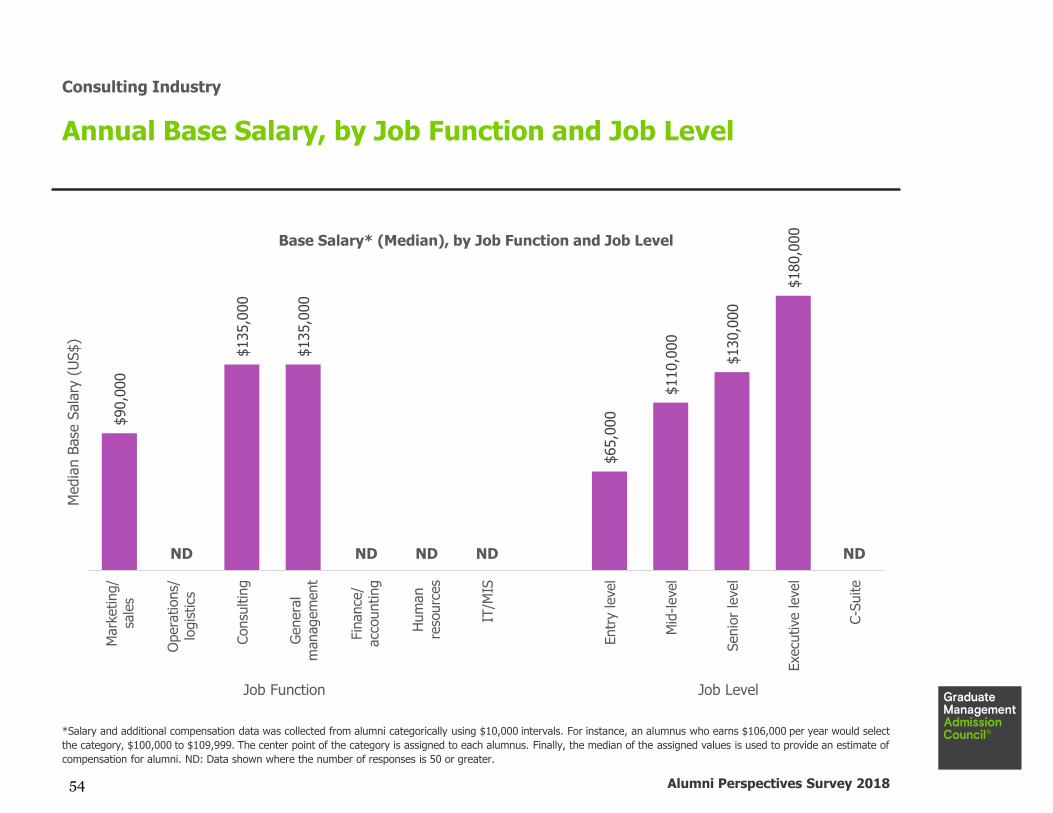
Consulting Industry
Annual Base Salary, by Job Function and Job Level$90,0
00
$135,0
00
$135,0
00
$65,0
00
$110,0
00
$130,0
00
$180,0
00
Mark
eting/
sale
s
Opera
tions/
logis
tics
Consu
ltin
g
Genera
lm
anagem
ent
Fin
ance
/acc
ounting
Hum
an
reso
urc
es
IT/M
IS
Entr
y level
Mid
-leve
l
Senio
r le
vel
Execu
tive level
C-S
uite
Media
n B
ase
Sala
ry (
US$)
Base Salary* (Median), by Job Function and Job Level
Job Function Job Level
ND ND ND ND ND
*Salary and additional compensation data was collected from alumni categorically using $10,000 intervals. For instance, an alumnus who earns $106,000 per year would select
the category, $100,000 to $109,999. The center point of the category is assigned to each alumnus. Finally, the median of the assigned values is used to provide an estimate of
compensation for alumni. ND: Data shown where the number of responses is 50 or greater.
54

Alumni Perspectives Survey 2018
Industry Highlights
Health Care

Alumni Perspectives Survey 2018
Health Care Industry
Employer Characteristics
18%21%
29%
7% 6%
GlobalFortune 100
GlobalFortune 500
Publiclytraded
Familyowned
Start-up
Type of Organization
4% 5% 6%4%
14%11%
15%
40%
Few
er
than 2
5
25-1
00
101-5
00
501-1
,000
1,0
01-5
,000
5,0
01-1
0,0
00
10,0
01-2
5,0
00
More
than 2
5,0
00
Size of Organization
86% 82%68%
14% 18%32%
Small(< 1,001)
Mid(1,001-10,000)
Large(10,001+)
% o
f cl
ients
Clientele, by Organization Size
Domestic Clients International Clients
56% of b-school alumni in the health care industry work for companies with locations in multiple countries
56

Alumni Perspectives Survey 2018
Health Care Industry
Employment Characteristics
8%
3%
7%
7%
13%
15%
20%
28%
Other
Human resources
IT/MIS
Consulting
Operations/logistics
Finance/accounting
Marketing/sales
General management
% of employed
Job Functions of B-School Alumni
0% 1% 5% 11%22%
44%44%
52%41%
34%36%
27%23%
14% 10%8%14% 8% 4% 2%
2001 to2005
2006 to2010
2011 to2015
2016 to2017
% o
f em
plo
yed
Graduation Year
Job Levels, by Graduation Year
Entry level Mid-level Senior level Executive level C-Suite
3%7%
13%
45%
32%
Verydissatisfied
Dissatisfied Neutral Satisfied VerySatisfied
% o
f em
plo
yed
Satisfaction with Career Progression
57

Alumni Perspectives Survey 2018
Health Care Industry
Job Characteristics
68
%
49
%
51
%
72
%
60
%
60
%
61
%
68
%
61
%
68
%
47
%
42
% 45
%
76
%
47
%
78
%
78
%
79
%
73
%
67
%72
%
59
%
69
%
63
%
50
%
44
%
46
% 50
%
79
%
50
%
Manage a budget Make hiring decisions Supervise employees Work on virtual teams Managevendors/suppliers
Job Activities, by Job Function
Marketing/sales Operations/logistics Consulting General management Finance/accounting IT/MIS
58

Alumni Perspectives Survey 2018
Health Care Industry
Annual Base Salary, by Job Function and Job Level$125,0
00
$105,0
00
$115,0
00 $145,0
00
$115,0
00
$115,0
00
$105,0
00
$125,0
00
$175,0
00
$185,0
00
Mark
eting/
sale
s
Opera
tions/
logis
tics
Consu
ltin
g
Genera
lm
anagem
ent
Fin
ance
/acc
ounting
Hum
an
reso
urc
es
IT/M
IS
Entr
y level
Mid
-leve
l
Senio
r le
vel
Execu
tive level
C-S
uite
Media
n B
ase
Sala
ry (
US$)
Base Salary* (Median), by Job Function and Job Level
Job Function Job Level
ND ND
*Salary and additional compensation data was collected from alumni categorically using $10,000 intervals. For instance, an alumnus who earns $106,000 per year would select
the category, $100,000 to $109,999. The center point of the category is assigned to each alumnus. Finally, the median of the assigned values is used to provide an estimate of
compensation for alumni. ND: Data shown where the number of responses is 50 or greater.
59

Alumni Perspectives Survey 2018
Industry Highlights
Energy/Utilities

Alumni Perspectives Survey 2018
Energy/Utilities Industry
Employer Characteristics
24%27%
44%
8% 6%
GlobalFortune 100
GlobalFortune 500
Publiclytraded
Familyowned
Start-up
Type of Organization
4% 6%
12%
5%
16%
9%12%
36%
Few
er
than 2
5
25-1
00
101-5
00
501-1
,000
1,0
01-5
,000
5,0
01-1
0,0
00
10,0
01-2
5,0
00
More
than 2
5,0
00
Size of Organization
82% 75%
52%
18% 25%
48%
Small(< 1,001)
Mid(1,001-10,000)
Large(10,001+)
% o
f cl
ients
Clientele, by Organization Size
Domestic Clients International Clients
68% of b-school alumni in the energy/utilities industry work for companies with locations in multiple countries
61

Alumni Perspectives Survey 2018
Energy/Utilities Industry
Employment Characteristics
2%
4%
5%
7%
12%
15%
27%
28%
Other
Human resources
IT/MIS
Consulting
Marketing/sales
Operations/logistics
Finance/accounting
General management
% of employed
Job Functions of B-School Alumni
0% 0% 4%14%
29%36%
53%46%
41%
46%
31%34%22%
12% 8% 4%8% 5% 3% 1%
2001 to2005
2006 to2010
2011 to2015
2016 to2017
% o
f em
plo
yed
Graduation Year
Job Levels, by Graduation Year
Entry level Mid-level Senior level Executive level C-Suite
3%
9%14%
45%
29%
Verydissatisfied
Dissatisfied Neutral Satisfied VerySatisfied
% o
f em
plo
yed
Satisfaction with Career Progression
62

Alumni Perspectives Survey 2018
Energy/Utilities Industry
Job Characteristics
60
%
39
%
52
%
78
%
63
%
60
%
47
%
59
% 64
% 67
%
35
%
33
%
48
%
68
%
40
%
84
%
69
%
85
%
76
%
75
%
62
%
55
%
63
%
56
%
41
%
54
%
38
%
54
%
92
%
65
%
Manage a budget Make hiring decisions Supervise employees Work on virtual teams Managevendors/suppliers
Job Activities, by Job Function
Marketing/sales Operations/logistics Consulting General management Finance/accounting IT/MIS
63

Alumni Perspectives Survey 2018
Energy/Utilities Industry
Annual Base Salary, by Job Function and Job Level$145,0
00
$145,0
00
$155,0
00
$125,0
00
$125,0
00
$150,0
00
$210,0
00
Mark
eting/
sale
s
Opera
tions/
logis
tics
Consu
ltin
g
Genera
lm
anagem
ent
Fin
ance
/acc
ounting
Hum
an
reso
urc
es
IT/M
IS
Entr
y level
Mid
-leve
l
Senio
r le
vel
Execu
tive level
C-S
uite
Media
n B
ase
Sala
ry (
US$)
Base Salary* (Median), by Job Function and Job Level
Job Function Job Level
ND ND ND ND ND
*Salary and additional compensation data was collected from alumni categorically using $10,000 intervals. For instance, an alumnus who earns $106,000 per year would select
the category, $100,000 to $109,999. The center point of the category is assigned to each alumnus. Finally, the median of the assigned values is used to provide an estimate of
compensation for alumni. ND: Data shown where the number of responses is 50 or greater.
64

Alumni Perspectives Survey 2018
Contact Information
Contributors
The following individuals from the GMAC Research
Department made significant contributions to the
publication of this report: Gregg Schoenfeld, Director,
Management Education Research, questionnaire
development and interpretation of data, and drafting of the
manuscript for intellectual content; Matt Hazenbush,
Research Communications Senior Manager, manuscript
review; Rebecca Estrada-Worthington, Survey Research
Manager, questionnaire design, sample development, survey
management; Maryam Bastani, Research Assistant,
sample development, administrative work and report
development; Tacoma Williams, Research Senior
Coordinator, quality assurance.
For questions or comments regarding the study findings,
methodology or data, please contact the GMAC Research
Department at [email protected].
65

Alumni Perspectives Survey 2018
©2018 Graduate Management Admission Council® (GMAC®). All rights reserved.
No part of this publication may be reproduced, stored in a retrieval system, distributed or transmitted in any form by any means, electronic, mechanical, photocopying, recording or otherwise, without the prior written permission of GMAC. For permission contact the GMAC legal department at [email protected].
NMAT by GMAC™ is a trademark and GMAT®, Graduate Management Admission Council®, and Graduate Management Admission Test® are registered trademarks of the Graduate Management Admission Council in the United States and other countries. Net Promoter® is a registered trademark of Satmetrix Systems, Inc. NPS® is a registered trademark of Bain & Company, Satmetrix Systems, Inc., and Fred Reichheld.