b wf 5-4 printtaylors/g473/aeg2016/1... · oregon watershed assessment manual page 5 watershed...
TRANSCRIPT
Watershed Fundamentals Table of Contents
Introduction .......................................................... 3 What is a Watershed? .......................................... 3 Watershed Terminology ...................................... 4
Definitions......................................................... 4 Assessment Size .............................................. 4
Regional Patterns in Watershed Conditions................................................. 6
Large-Scale Processes .................................... 6 Stream Network................................................ 8
Water Dynamics ................................................. 11 The Hydrologic Cycle ..................................... 11 Hydrologic Data: Collection and Use.............. 13 Consumptive Uses of Water........................... 16
Soil Erosion and Sediment in Streams ............ 16 Raindrop Splash............................................. 18 Ravel .............................................................. 18 Surface Rilling ................................................ 18 Shallow and Deep-Seated Landslides............ 19 Soil Creep and Earth Flows............................ 20 Road-Related Erosion .................................... 21 Channel Erosion............................................. 21
Vegetation ........................................................... 22 Role of Upland Vegetation.............................. 22 Role of Riparian Vegetation............................ 23 Role of Ambient Air Temperature ................... 25 Summary ........................................................ 26
Wetlands ............................................................. 26 Water Quality Improvement............................ 26 Flood Attenuation and
Desynchronization .................................... 27 Groundwater Recharge and Discharge .......... 27 Fish and Wildlife Habitat................................. 27
Aquatic Resources............................................. 27 Water Quality ...................................................... 27
Beneficial Uses of Water ................................ 28 Criteria and Indicators .................................... 28
Fisheries Resources .......................................... 30

Table of Contents (continued)
Potential Land Management Effects................. 39 General........................................................... 39 Cumulative Effects.......................................... 39
References .......................................................... 42 Glossary .............................................................. 43

Oregon Watershed Assessment Manual Page 3 Watershed Fundamentals
Figure 1. Watershed is an area of land that drains downslope to the lowest point.
Watershed Fundamentals
INTRODUCTION
Making decisions about a watershed is an important responsibility; decisions must be based on a solid understanding of the characteristics of the watershed and how physical processes shape watershed conditions. This section provides basic background information on watershed functions and processes to help users understand the assessment procedure and the results of the assessment process. Watershed “processes” refer to those natural physical, chemical, and biological mechanisms that interact to form aquatic ecosystems. For example, the input and routing of water, sediments,1 and large wood through stream channels involve many inter-related processes occurring both in-channel and upslope.
WHAT IS A WATERSHED?
The term “watershed” describes an area of land that drains downslope to the lowest point (Figure 1). The water moves by means of a network of drainage pathways that may be underground or on the surface. Generally, these pathways converge into a stream and river system that becomes progressively larger as the water moves downstream. However, in some arid regions, the water drains to a central depression such as a lake or marsh with no surface-water exit.
Watersheds can be large or small. Every stream, tributary, or river has an associated watershed, and small watersheds aggregate together to become larger watersheds. It is a relatively easy task to delineate watershed boundaries using a topographical map that shows stream channels. The watershed boundaries will follow the major ridge-line around the channels and meet at the bottom where the water flows out of the watershed, commonly referred to as the mouth of the stream or river.
The connectivity of the stream system is the primary reason why aquatic assessments need to be done at the watershed level. Connectivity refers to the physical connection between tributaries and the river, between surface water and groundwater, and between wetlands and these water sources. Because the water moves downstream in a watershed, any activity that affects the water quality, quantity, or rate of 1 Terms found in bold italic throughout the text are defined in the Glossary at the end of this component.
Oregon Watershed Assessment Manual Page 4 Watershed Fundamentals
movement at one location can change the characteristics of the watershed at locations downstream. For this reason, everyone living or working within a watershed needs to cooperate to ensure good watershed conditions.
WATERSHED TERMINOLOGY
Definitions
“Watershed” can refer to drainage areas of a wide variety of sizes, and this may create confusion about what is being discussed. Words such as draw, drainage, basin, and sub-basin are also used to describe areas that drain water. The term basin usually refers to a larger river basin, and the terms drainage and draw are usually a component of a watershed or subwatershed. The Federal Guide to Watershed Analysis suggests using specific terms for the different levels (Figure 2). In addition, the hierarchical structure of the watershed system allows for the systematic assignment of identification numbers. The US Geological Survey (USGS) has developed maps that assign a Hydrologic Unit Code (HUC) number to the larger watersheds. This number is often referred to as the watershed HUC Number and consists of four pairs of numbers or “fields.” Thus, HUC Number 17090001 denotes the watershed that is the Middle Fork of the Willamette River and is referred to as a 4th field HUC. The State of Oregon has 49 4th field HUC’s. These 4th field HUC’s are quite large and the State of Oregon has subdivided them further into 5th field HUC’s. There are 1,063 5th field watersheds, with an average size of 58,218 acres. Further subdivision is possible, and portions of the assessment process summarize information by subwatershed. The State of Oregon is currently working on delineating 6th field subwatersheds statewide.
Assessment Size
The assessment is designed to provide a consistent process and repeatable results across the state. In order to maintain consistency, it is necessary to define an appropriate watershed size that establishes a standard approach to assessing watershed conditions. Performing a large-scale screening assessment of a very large basin, as in the case of the Bradbury Process (Bradbury 1995) or the Upper Columbia Ecosystem Management Project, may help establish regional priorities, but will not be of much value for specific project prioritization and development. A comprehensive
assessment of a very large basin can be a daunting task because it is difficult to compile large amounts of data and then portray and interpret them in a meaningful way. The resulting maps can become too large to handle or the scale will become so small that it is impossible to portray information with any degree of resolution. On the other
hand, a comprehensive assessment in a very small basin may produce useful site-specific information but there will be no context to evaluate this information to larger areas. For these reasons THIS ASSESSMENT MANUAL WAS DESIGNED for 5TH FIELD WATERSHEDS, OR WATERSHEDS OF ABOUT 60,000 ACRES. The existing 1,063 5th field watersheds defined by the State of Oregon should be used as the basis for assessment. The assessment process can be applied to several connected watersheds, which will allow the results to be combined and form a composite assessment of a larger basin or ecoregion.
See Start-Up component, which describes how to identify and
subdivide your watershed.
Oregon Watershed Assessment Manual Page 5 Watershed Fundamentals
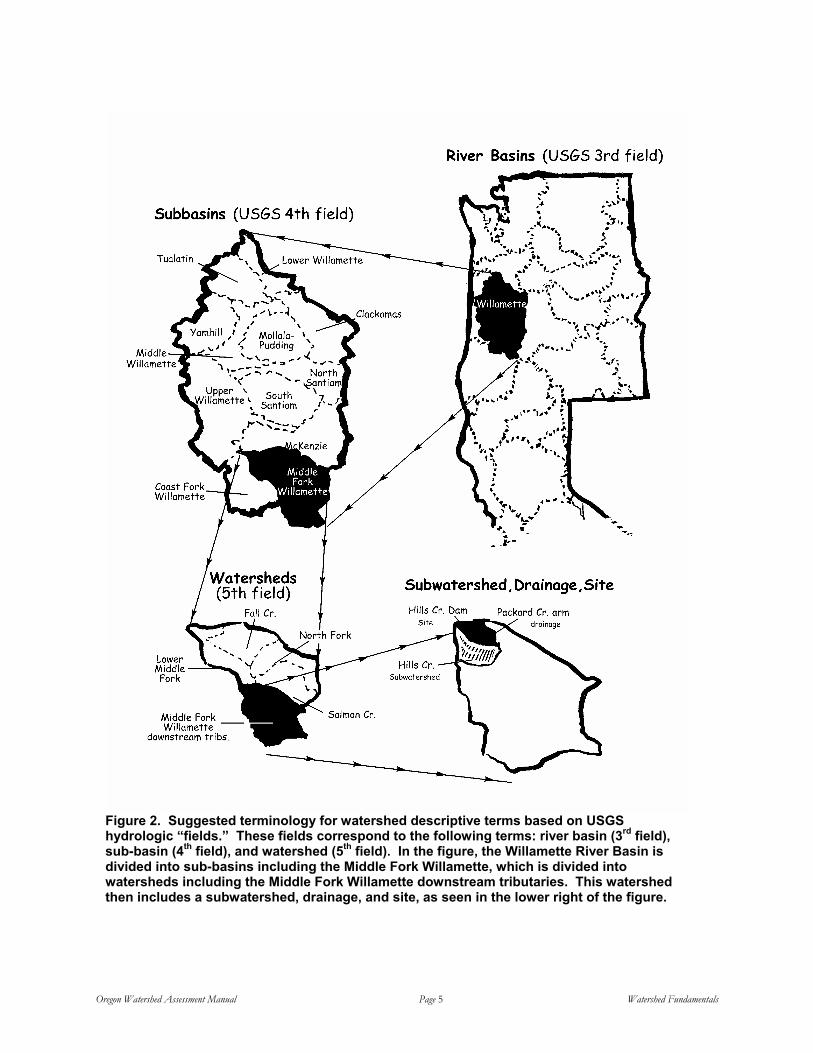
Figure 2. Suggested terminology for watershed descriptive terms based on USGS hydrologic “fields.” These fields correspond to the following terms: river basin (3rd field), sub-basin (4th field), and watershed (5th field). In the figure, the Willamette River Basin is divided into sub-basins including the Middle Fork Willamette, which is divided into watersheds including the Middle Fork Willamette downstream tributaries. This watershed then includes a subwatershed, drainage, and site, as seen in the lower right of the figure.

Oregon Watershed Assessment Manual Page 6 Watershed Fundamentals
REGIONAL PATTERNS IN WATERSHED CONDITIONS
Large-Scale Processes
The geology, climate, and disturbance regimes of an area influence the shape and condition of a watershed. The geology, climate, and vegetation of the area determines the type and distribution of soils within the watershed, which influences the amount of erosion and the character of sediments in the stream channels. Also, geologic uplifting from deep within the earth can influence the slope and orientation of the bedrock material. Earthquakes can cause large blocks of the earth’s surface to shift, creating distinctive fault lines.
The prevailing local climate acts upon this geologic setting to determine the quantity and timing of precipitation that falls into the watershed, which in turn influences the vegetation patterns. Latitude, elevation, and aspect (directional position) are important because they influence the timing and quantity of the solar energy that a watershed receives, and influence vegetation patterns within the watershed.
In addition to the climatic patterns that shape the landscape, watersheds are subject to periodic disturbances that can have a significant influence on stream channel conditions. Natural disturbances may be large-scale events like flood or fire that impact the entire watershed, or can be very localized, such as a pocket of trees that are blown down into the stream channel. Watersheds will typically undergo short periods of catastrophic change—for example, a large storm that produces huge floods and widespread landslides—followed by intervening periods of relative stability. Both large- and small-scale natural disturbances are an integral part of the watershed’s evolution, and the aquatic community has adapted to this disturbance regime. For example, floods can create new pools, and landslides can act to deliver large trees and spawning gravels to stream channels, both of which are important for forming fish habitat.
Human activities can modify the natural disturbance regimes by changing the timing and intensity of these natural processes. For example, urbanization and roads increase impervious surfaces and change the routing of water (Figure 3). These conditions can increase flood peaks and landslide frequency above the range that would be expected in undeveloped conditions. Conversely, dams and other water impoundments can reduce flood peaks and interrupt sediment supply, impacting the
aquatic system by limiting the creation of side-channels or delivery of spawning gravels.
All of these factors work together over time to form consistent patterns over geographic areas with similar characteristics. Large areas of land that have similar characteristics are referred to as ecoregions. The State of Oregon is divided into ecoregions that have been identified
through the analysis of the patterns and composition of biotic and abiotic phenomena that reflect differences in ecosystem quality and integrity. These phenomena include climate, geology, physiography, vegetation, soils, land use, wildlife, and hydrology. Each ecoregion has characteristic disturbance regimes that shape the form and function of watersheds in the region. This assessment manual uses Level III and Level IV ecoregions to help characterize patterns within a watershed (Figure 4.)
See Start-Up and Identification of Watershed Issues component
for details on how to determine the ecoregion(s)
in your watershed.

Oregon Watershed Assessment Manual Page 7 Watershed Fundamentals

Oregon Watershed Assessment Manual Page 8 Watershed Fundamentals
See Channel Habitat Type component for instructions
on identifying CHTs.
Figure 3. Human activities such as urbanization and road development can modify the routing
of water. An increase in impervious surfaces causes a decrease in infiltration and an increase in runoff.
Stream Network
The processes that operate in a particular watershed work on a number of different levels. On a large scale, the geologic and climatic conditions shape gross watershed characteristics such as basin
size and stream density. On a finer scale, geologic conditions and biologic inputs combine to influence localized characteristics such as the number of pools in a section of stream. This makes the stream channel network a focal point of many watershed processes occurring between ridge-
tops. Common patterns in these formative processes have produced groups of streams that display similar physical characteristics (Figure 5). These stream groups provide aquatic habitat conditions that respond in predictable patterns to natural and human-caused modifications. These groupings of stream types are called Channel Habitat Types (CHTs). This channel stratification system

Oregon Watershed Assessment Manual Page 9 Watershed Fundamentals
Figure 4. This assessment manual uses Level III (shown in figure) and IV ecoregions to characterize patterns within a watershed.

Oregon Watershed Assessment Manual Page 10 Watershed Fundamentals
See Historical Conditions and Channel Modification components to map human impacts to the
stream channels.
provides a framework and mechanism for evaluating (1) basin-wide stream channel conditions, (2) the influences of land management activities on specific stream reaches, and (3) potential restoration opportunities.
The Historical Conditions Assessment component provides a methodology for obtaining and interpreting historical material to identify where potential impacts may have occurred, and to
describe what the watershed may have looked like before human activities. The Channel Modification Assessment component systematically determines how the channels in the watershed have been modified by various human uses. Often, it is hard to separate impacts resulting from current, ongoing land and water management activities from
historical or legacy activities. For that reason, knowledge of past use can provide a context to help us understand the current condition of a watershed.
Figure 5. Typical distribution of CHTs in a mountainous watershed.
Oregon Watershed Assessment Manual Page 11 Watershed Fundamentals
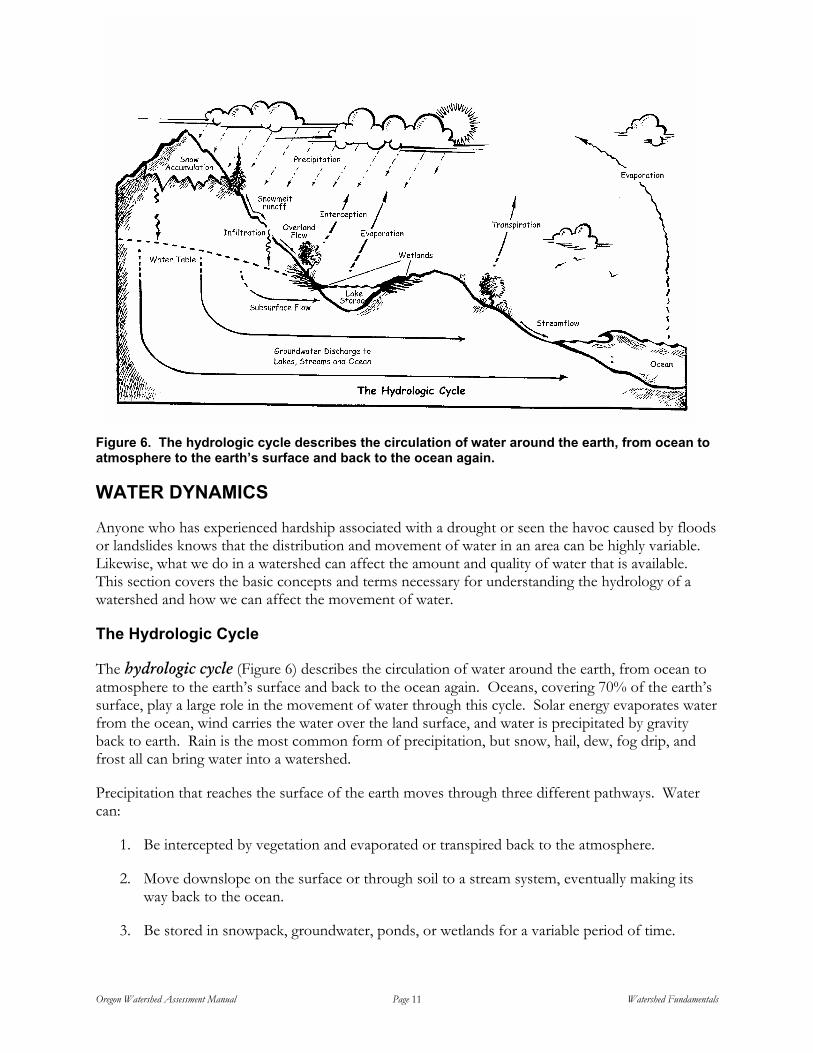
Figure 6. The hydrologic cycle describes the circulation of water around the earth, from ocean to atmosphere to the earth’s surface and back to the ocean again.
WATER DYNAMICS
Anyone who has experienced hardship associated with a drought or seen the havoc caused by floods or landslides knows that the distribution and movement of water in an area can be highly variable. Likewise, what we do in a watershed can affect the amount and quality of water that is available. This section covers the basic concepts and terms necessary for understanding the hydrology of a watershed and how we can affect the movement of water.
The Hydrologic Cycle
The hydrologic cycle (Figure 6) describes the circulation of water around the earth, from ocean to atmosphere to the earth’s surface and back to the ocean again. Oceans, covering 70% of the earth’s surface, play a large role in the movement of water through this cycle. Solar energy evaporates water from the ocean, wind carries the water over the land surface, and water is precipitated by gravity back to earth. Rain is the most common form of precipitation, but snow, hail, dew, fog drip, and frost all can bring water into a watershed.
Precipitation that reaches the surface of the earth moves through three different pathways. Water can:
1. Be intercepted by vegetation and evaporated or transpired back to the atmosphere.
2. Move downslope on the surface or through soil to a stream system, eventually making its way back to the ocean.
3. Be stored in snowpack, groundwater, ponds, or wetlands for a variable period of time.

Oregon Watershed Assessment Manual Page 12 Watershed Fundamentals
Heat from the sun can evaporate water from any point in the cycle, from the surface of vegetation, ground, or water bodies. The rate of evaporation in a watershed is dependent on the water surface area exposed to the air, air temperature, humidity, and wind. The average annual evaporation from shallow lakes in Oregon ranges from 20 inches on the coast to 46 inches in the south-central region of the state. Transpiration is the loss of water to the atmosphere through living plants. The two processes of evaporation and transpiration are referred to as evapotranspiration (ET). The difference between rainfall and runoff in a watershed can largely be explained by ET. The annual amount of water leaving a drainage basin as runoff varies, from less than 10% of yearly precipitation in hot desert climates to greater than 90% in the Cascade Mountains. The amount of water intercepted, evaporated, and transpired in a watershed is dependent on the type and the extent of vegetative cover in a watershed. Land uses that alter the vegetative cover of a watershed can affect the water available for runoff.
When water evaporates, it enters the atmosphere as water vapor that eventually condenses to form drops of water (if the temperature is above 32°F) or ice crystals (if below 32°F). When the drops of water or ice crystals have grown large enough or when the wind moves them through the air, they fall to the earth. Upon reaching the earth, water will tend to move downslope, under the influence of gravity. Precipitation intensity, the rate at which water is delivered to the earth’s surface, is usually less than infiltration, the rate at which water enters the soil. Thus, most of the precipitation infiltrates into the soil and little, if any, surface runoff or overland flow occurs. In the case where the precipitation intensity exceeds the soil infiltration rate, surface runoff occurs. Additionally, there are a few watershed conditions under which surface runoff will occur, including precipitation on very steep slopes, in watersheds with thin soils over bedrock, and in disturbed watersheds (particularly those with a large area of impervious surfaces). Land uses in a watershed can have a significant impact on infiltration rates. Decreases in infiltration rates result in water moving more quickly to streams, causing peak flows to occur earlier and to be larger in magnitude. Decreases in infiltration also reduce water storage and result in lower low flows.
Water that enters the soil infiltrates vertically to the groundwater table. From there, water moves either toward the river channel or percolates and becomes groundwater. Water that enters the river channel becomes surface water, called streamflow or discharge. Streamflow is conveyed by gravity through the stream channel to connect with progressively larger channels, eventually flowing into the ocean. The length of stream channels with actively flowing water depends on the volume of water moving through the system. During the dry season, there are typically fewer actively flowing channels than during wetter periods.
Groundwater can be recharged from the nearby stream channel (a losing reach) or can provide flow to the channel (a gaining reach), depending on the relative energy (hydraulic gradient) and the ability to transmit flow. The direction of flow between connected surface- and groundwaters depends on the hydraulic gradient and the ability of the soils to transmit flow.
Water can be stored in seasonal snowpack, as groundwater storage, or in surface-water storage such as ponds, wetlands, lakes, and reservoirs. Spring runoff is derived from melting snowpacks, whereas summer baseflows represent groundwater discharge to the stream during dry or low-flow periods. Water stored in ponds, marshes, wetlands, and lakes are often of special interest because these areas represent unique features in the watershed and may be used in special ways by plants, animals, and humans. Land uses in a watershed can have a significant impact on the amount of stored water.
Oregon Watershed Assessment Manual Page 13 Watershed Fundamentals
Conditions that reduce the infiltration rate can also lead to a reduction in the amount of water held in groundwater storage.
Hydrologic Data: Collection and Use
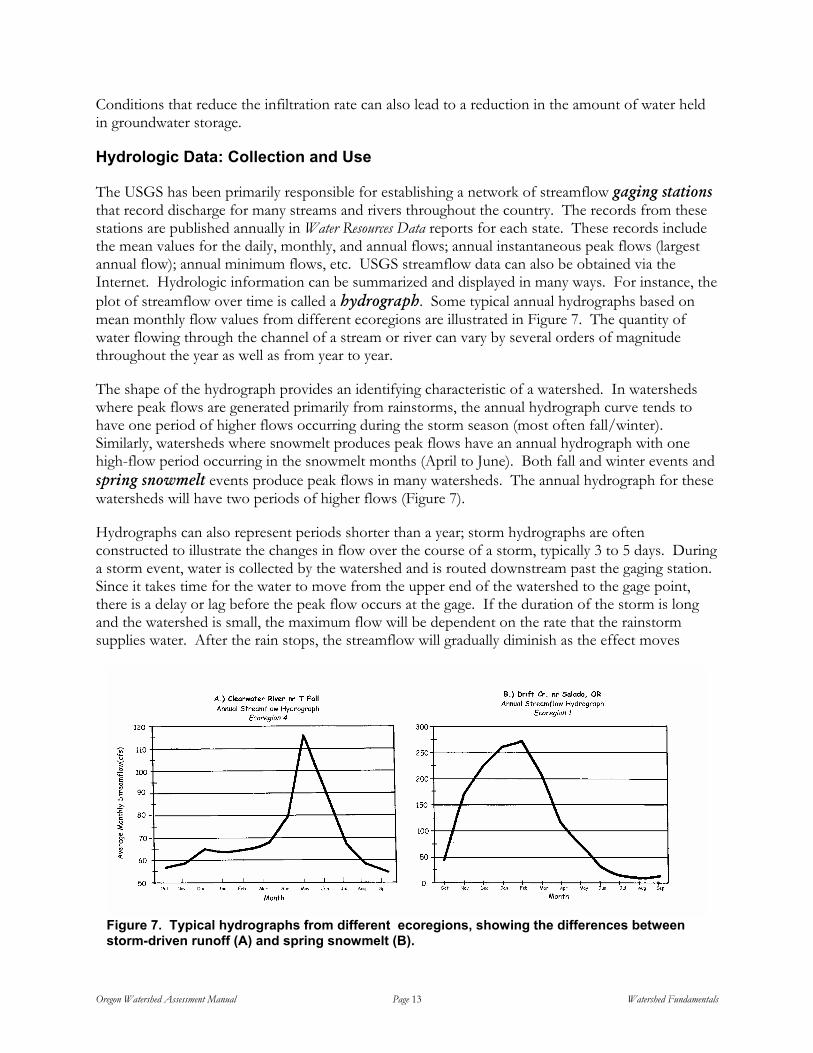
The USGS has been primarily responsible for establishing a network of streamflow gaging stations that record discharge for many streams and rivers throughout the country. The records from these stations are published annually in Water Resources Data reports for each state. These records include the mean values for the daily, monthly, and annual flows; annual instantaneous peak flows (largest annual flow); annual minimum flows, etc. USGS streamflow data can also be obtained via the Internet. Hydrologic information can be summarized and displayed in many ways. For instance, the plot of streamflow over time is called a hydrograph. Some typical annual hydrographs based on mean monthly flow values from different ecoregions are illustrated in Figure 7. The quantity of water flowing through the channel of a stream or river can vary by several orders of magnitude throughout the year as well as from year to year.
The shape of the hydrograph provides an identifying characteristic of a watershed. In watersheds where peak flows are generated primarily from rainstorms, the annual hydrograph curve tends to have one period of higher flows occurring during the storm season (most often fall/winter). Similarly, watersheds where snowmelt produces peak flows have an annual hydrograph with one high-flow period occurring in the snowmelt months (April to June). Both fall and winter events and spring snowmelt events produce peak flows in many watersheds. The annual hydrograph for these watersheds will have two periods of higher flows (Figure 7).
Hydrographs can also represent periods shorter than a year; storm hydrographs are often constructed to illustrate the changes in flow over the course of a storm, typically 3 to 5 days. During a storm event, water is collected by the watershed and is routed downstream past the gaging station. Since it takes time for the water to move from the upper end of the watershed to the gage point, there is a delay or lag before the peak flow occurs at the gage. If the duration of the storm is long and the watershed is small, the maximum flow will be dependent on the rate that the rainstorm supplies water. After the rain stops, the streamflow will gradually diminish as the effect moves
Figure 7. Typical hydrographs from different ecoregions, showing the differences between storm-driven runoff (A) and spring snowmelt (B).

Oregon Watershed Assessment Manual Page 14 Watershed Fundamentals
down the channel and the storage decreases substantially. Watersheds with steep slopes and/or thin soils tend to move water relatively quickly, and their hydrographs will be distinctively shaped with sharply rising, spiked peaks. Such watersheds are often referred to as “flashy.” Larger watersheds or watersheds with deep soils that retain water or have extensive storage will tend to have more rounded or flatter-shaped hydrographs (Figure 8).
While streams have been flowing for millions of years, humans have collected streamflow data for only a small snapshot in time. Through the use of statistics, the recent past can be used as a predictor of the near future. For example, the data can be used to determine how much water will be available in the average year. Also, the probability that an extreme event such as a flood or drought may occur can be estimated
Information on these extreme events is of special interest, because floods can change the shape of the stream channel and can impact the floodplain, whereas droughts can affect the vegetation and organisms that depend on a constant supply of water or moisture. There is always a risk that some type of extreme event may occur within any given year. Analysis of the historic streamflow records provides a way to determine the probability that an event of a given magnitude will be exceeded. For example, a 100-year flood has a 1% chance of occurring in any given year; a 25-year flood has a 4% probability of occurring in any given year. Figure 9 illustrates some example recurrence
Figure 8. Hydrograph patterns showing the difference between watersheds with a steeper topography, which have a rapid runoff response (top), and watersheds with flatter topography, which have a slower, more prolonged runoff response (bottom).

Oregon Watershed Assessment Manual Page 15 Watershed Fundamentals
intervals with probabilities.
Land uses in a watershed can have a significant impact on the frequency of floods. For example, impounding water in a reservoir can reduce the frequency and magnitude of floods in the portion of the river below the dam; reservoir operations must be clearly taken into account in a hydrologic assessment.
Understanding long-term climate and streamflow data can help the user realize the variability of the watershed’s response to climatic conditions. The Hydrology and Water Use Assessment component provides direction on how to obtain and use this information specific to your watershed.
Land use and vegetation cover in upland areas can have distinct impacts on the watershed. Large-scale vegetation change can directly influence the flow regime. Reduced vegetation will reduce the amount of transpiration that takes place but can result in higher evaporation rates. Vegetation
See Hydrology and Water Use component for
how to obtain climate and streamflow data.
Figure 9. A recurrence interval is the average length of time between two events (rain, flooding) of the same size or larger. Recurrence intervals are associated with a probability, as illustrated in the figure for streamflow.
Oregon Watershed Assessment Manual Page 16 Watershed Fundamentals
See Hydrology and Water Use component
for how to assess consumptive water use.
removal can also increase snow retention in high-elevation forests. The melting of these accumulations can affect the timing of the winter flow pattern, especially in rain-on-snow areas. The Hydrology and Water Use component provides an evaluation methodology to determine the extent of these effects.
Urbanization increases the area of impervious surfaces on upland areas so water runs off and is not absorbed by soil. This situation can result in increased peak flows, which alter aquatic habitat, and reduced water storage, which causes in reduced summer low flows. Upland agriculture can route water to the stream more efficiently due to ditch and tile drains. This also decreases absorption of water into the groundwater storage system and can result in reduced summer low flows.
Historical and current fire suppression activities have altered the vegetation communities and allowed dead wood material to accumulate to dangerous levels in unmanaged forests. Fire exclusion practices have allowed juniper to become established in former meadow areas. In the absence of periodic fires, sage becomes established; mature sagebrush then offers juniper a protected environment in which to establish. In order to restore the meadow environment, periodic disturbance by fire or other means is needed. In upslope forests this same kind of disturbance, along with retention of larger trees, will be required to re-establish the ponderosa pine/grass (open savannah) plant community. In areas where dead wood material has accumulated, there is an increased risk of hotter, more severe fires. Hot fires remove all ground cover, expose bare soils, and can create “hydrophobic soils,” which increase overland flows and runoff. These conditions can have a severe impact on riparian conditions and channel stability. This is a concern in some east-side ecoregions (identified in the Ecoregions appendix).
Consumptive Uses of Water
The use of water and its energy are very essential to the needs of modern society. Obviously, when water is removed or flows are restricted, the function of the watershed is affected. When
groundwater is used excessively for irrigation, the flow in adjacent streams or stream reaches can be reduced, resulting in increased stream temperatures. Thus, even irrigation withdrawals that reduce groundwater discharge can also influence in-stream flows. An important part of the assessment process is to identify the locations and amounts
of consumptive water uses, and then assess the effect on the watershed and the ecosystem. The Hydrology and Water Use component provides a methodology to make this assessment.
SOIL EROSION AND SEDIMENT IN STREAMS
Sediment in streams comes from the erosion of upland areas, lateral movement of stream channels (i.e., meandering), and downcutting of streambeds. The Sediment Sources Assessment component evaluates sources of fine sediments and coarse sediments. Fine particles deposited on the streambed may blanket spawning gravels and reduce survival of fish eggs incubating in the gravel. Fine sediment may cover the exposed rock surfaces preferred by aquatic insects, reducing the food supply to fish. Suspended sediments cause turbidity (clouding of the water), which prevents fish from feeding. Large deposits of coarse sediments can overwhelm the channel capacity,
Oregon Watershed Assessment Manual Page 17 Watershed Fundamentals
resulting in pool-filling, burial of spawning gravels, and, in some cases, complete burial of the channel, resulting in subsurface streamflows.
The hardness of the underlying rock and its fracturing as the land is uplifted over long periods of time determine the rate of erosion. These geological processes also influence the pattern and density of streams in a watershed. Hill slopes in the central Coast Range erode quickly because of the high rainfall, soft rock, and rapid uplifting of the land by forces deep in the earth. These processes create steep slopes and a high stream density in coastal watersheds. In contrast, central Oregon watersheds usually erode more slowly due to low rainfall, hard underlying rock, and relatively slow uplifting of the land. In these portions of central Oregon, slopes are gentle and streams are sparse across the landscape.
Human activities occur within the backdrop of natural forces that control erosion in a watershed. Understanding the differences between natural and human-induced erosion is important in developing a watershed restoration plan. We have little control over natural erosion rates; in fact, it would be undesirable to decrease the natural erosion rates in a watershed, because aquatic organisms have locally evolved to the natural conditions. Because we can influence only human-induced erosion, it is important to understand how erosion processes are altered by management activities, whether the accelerated erosion is significant compared to natural rates, and where these changes are occurring in the watershed.
The Sediment Sources Assessment component contains methods for identifying various sources of erosion from the following eight potential sediment sources:
1. Road instability 2. Slope instability (not related to roads) 3. Rural road runoff 4. Urban runoff 5. Surface erosion from crop land 6. Surface erosion from range land 7. Surface erosion from burned land 8. Other discrete sources
In addition to identifying potential sediment sources, the sediment assessment helps determine which portions of the watershed have a higher potential for accelerated erosion due to human activities, and segregates human from natural sources of erosion.
It is important to recognize that much eroding soil will deposit on a hill slope before it reaches the stream. This is good news, since there are a number of things that can be done to fix a site that is eroding before the sediment enters the streams. For example, water draining from a rutted road surface can be diverted onto a well-drained slope where the sediment will be filtered out, and the clean water can flow beneath the ground’s surface to the stream.
The distinction between erosion and sediment in the stream can become blurred when eroded soil is deposited in or near the stream. A good example of this is a beaver dam, which traps soil particles flowing in the stream. Beaver dams can be so effective at trapping sediment that a large deposit of sediment into a stream can be unnoticeable downstream of the beaver dam. Where dams are stable for a long time and do not wash out during floods, beaver activity can locally raise the elevation of a
Oregon Watershed Assessment Manual Page 18 Watershed Fundamentals
valley bottom. In such cases, the soil is trapped in place for centuries or longer. Of course, if the beaver dam complexes are temporary and wash out each winter, their overall influence on sediment is minimal.
Another important consideration is that erosion and sedimentation primarily occur in pulses during infrequent events. Typically, an intense rainfall event or flood that happens only once every decade will trigger a chain of events causing large amounts of soil to move rapidly downhill and into streams. An example of this is the February 1996 flood in the Willamette River basin. Over 80% of the annual sediment production for the Willamette River occurred during a few days in February when the flood took place. If the sediment conditions of a stream were examined only during “average” conditions, the sediment yield would probably be greatly underestimated.
There are a number of mechanisms that move soil downhill and into stream channels. The next sections discuss these erosion processes.
Raindrop Splash
Raindrop splash occurs when a raindrop hits a bare soil surface, creates a small crater, and splatters soil grains in all directions. On sloping ground, these detached soil particles have a tendency to land downhill and can be moved further downhill by water that flows over the soil surface. Individually, soil movement caused by the collision of a raindrop is insignificant, but when multiplied by many millions of raindrops the results become noticeable.
Raindrop splash is not common in most of Oregon under natural conditions. Vegetation and organic material at the soil surface absorbs the energy of a raindrop and the soil remains intact. However, if machinery, intense grazing, or high-intensity fire removes this protective material, raindrop splash can occur. Raindrop splash is most noticeable where the soil is not very cohesive, such as soils derived from granitic rock or volcanic ash, or those high in sand or silt.
Ravel
Some soils become less cohesive as they dry. On steeper slopes, gravity can exceed the forces that hold the soil together and particles move downhill. Raveling is noticeable along steep surfaces immediately uphill of roads. Frost heaves often make conditions worse by reducing the forces that normally hold the soil together. Bare road cuts can produce a sizeable amount of raveled soil, which collects in the road ditch. If this ravel is not removed, this raveled soil can move down the road ditch and into streams during heavy rainfall or when the snow is melting. Ravel is also common on steep, bare stream banks. Here, the detached soil particles have a direct pathway into the stream.
Surface Rilling
Water flowing over the surface of the soil can carry off surface soil in a process called soil rilling. Natural soil rilling does not occur much in Oregon. The ability of the soil to absorb water is usually greater than the rainfall intensity, so no water flows over the soil surface. However, surface rilling does occur where the ability of the soil to absorb water has been reduced, such as road surfaces, intensely grazed areas, plowed steep slopes, or areas recently burned by hot fires. Rainfall collects on the compacted or burned surface and, as it moves downhill, cuts small rills where the soil is
Oregon Watershed Assessment Manual Page 19 Watershed Fundamentals
softer. Damaged soils can recover their ability to absorb rain. Vegetative cover, frost heave, and soil organisms typically increase soil permeability over time.
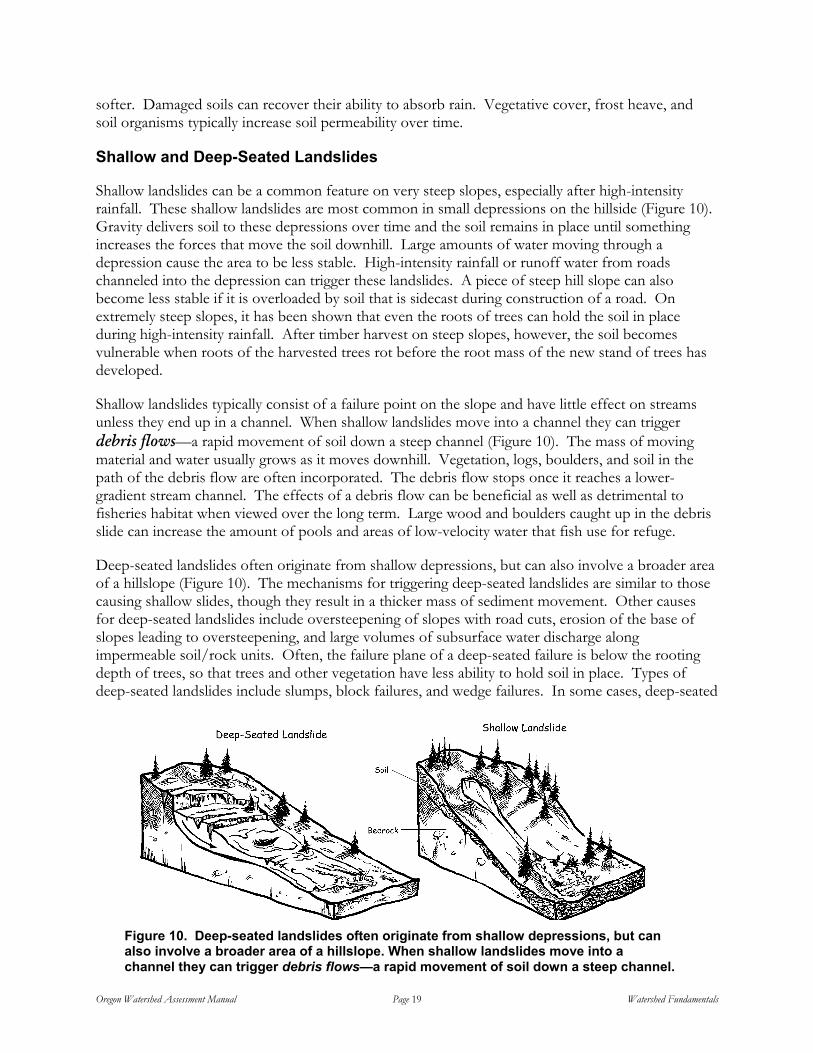
Shallow and Deep-Seated Landslides
Shallow landslides can be a common feature on very steep slopes, especially after high-intensity rainfall. These shallow landslides are most common in small depressions on the hillside (Figure 10). Gravity delivers soil to these depressions over time and the soil remains in place until something increases the forces that move the soil downhill. Large amounts of water moving through a depression cause the area to be less stable. High-intensity rainfall or runoff water from roads channeled into the depression can trigger these landslides. A piece of steep hill slope can also become less stable if it is overloaded by soil that is sidecast during construction of a road. On extremely steep slopes, it has been shown that even the roots of trees can hold the soil in place during high-intensity rainfall. After timber harvest on steep slopes, however, the soil becomes vulnerable when roots of the harvested trees rot before the root mass of the new stand of trees has developed.
Shallow landslides typically consist of a failure point on the slope and have little effect on streams unless they end up in a channel. When shallow landslides move into a channel they can trigger debris flows—a rapid movement of soil down a steep channel (Figure 10). The mass of moving material and water usually grows as it moves downhill. Vegetation, logs, boulders, and soil in the path of the debris flow are often incorporated. The debris flow stops once it reaches a lower-gradient stream channel. The effects of a debris flow can be beneficial as well as detrimental to fisheries habitat when viewed over the long term. Large wood and boulders caught up in the debris slide can increase the amount of pools and areas of low-velocity water that fish use for refuge.
Deep-seated landslides often originate from shallow depressions, but can also involve a broader area of a hillslope (Figure 10). The mechanisms for triggering deep-seated landslides are similar to those causing shallow slides, though they result in a thicker mass of sediment movement. Other causes for deep-seated landslides include oversteepening of slopes with road cuts, erosion of the base of slopes leading to oversteepening, and large volumes of subsurface water discharge along impermeable soil/rock units. Often, the failure plane of a deep-seated failure is below the rooting depth of trees, so that trees and other vegetation have less ability to hold soil in place. Types of deep-seated landslides include slumps, block failures, and wedge failures. In some cases, deep-seated
Figure 10. Deep-seated landslides often originate from shallow depressions, but can also involve a broader area of a hillslope. When shallow landslides move into a channel they can trigger debris flows—a rapid movement of soil down a steep channel.

Oregon Watershed Assessment Manual Page 20 Watershed Fundamentals
landslides can dam and divert flow in streams, because of the large volume of sediment delivered.
Soil Creep and Earth Flows
Soil creep occurs as gravity moves the soil mantle downhill toward streams at rates too small to observe. Soil creep occurs on all sloping areas but is more noticeable in steep terrain. Earth flows are like soil creep except they occur at a faster rate where water saturates the soil and rock mantle. Trees on the surface of an earth flow often become tilted as the soil they are rooted in moves downhill (Figure 11). Creeping soil and earth flows can ultimately constrict stream channels. The stream erodes the soil away, usually during high flows.
Soil creep and earth flows are natural phenomena, although some human activities can accelerate their movement. For example, overloading a slope with sidecast or undercutting a slope during road construction can increase soil movement or cause earth flows. Once an earth flow becomes accelerated, there is little that can be done to fix the problem.
Figure 11. Soil creep and earth flows occur as gravity moves soil downhill toward streams. Trees on the surface of an earth flow often become tilted as the soil they are rooted in moves downhill.

Oregon Watershed Assessment Manual Page 21 Watershed Fundamentals
See Channel Habitat Type Classification component.
Road-Related Erosion
The road network is another potentially significant erosion feature. Improperly placed roads can divert sediment-laden water to streams. Poor drainage of roads can lead to gullying and channeling of the road surface. Improper maintenance of inboard road ditches can cause saturation of the roadbed, leading to mass wasting.
Road washouts also can occur when a road adjacent to the stream is undercut and a portion of the road drops into the stream, or at stream crossings during a high flow where there was either an undersized or plugged culvert or bridge. In steeper terrain, road washouts can create shallow landslides on unstable fill or cut-slopes failures. Appropriate sizing of culverts and bridges at stream crossings, locating roads away from streams, designing roads properly, and correctly disposing of soil during road construction on steeper slopes can prevent most road washouts.
Channel Erosion
The appearance of a channel reflects site-specific, relatively short-term processes, such as flow energy, and resistive forces set in the broader landscape factors of geology and climate. The complex interactions among these factors ensure that stream channels are seldom in a steady state. One of the most obvious results of this dynamic situation is channel erosion. It is a natural process resulting from the stream power being greater than the resistive forces. Considerable damage can be done to a stream and the fish habitat it provides by drastically changing the relationship between flow energy and resistive forces such as sediment deposits. Channel erosion and meandering help create gravel deposits, deep pools, and areas of low water velocity that are critical to fish habitat.
Channel erosion often occurs when in-stream sediment supplies are low and flows are high. The excess stream energy is directed at the channel bed or bank. As this process continues, the channel will start to form a meander pattern. During drought periods when floods are infrequent or sediment supply is unusually high, a stream typically experiences a net increase in sediment stored within its channel. Much of the stream energy is spent reworking sediment deposits rather than eroding banks. In addition to these site-specific, seasonal influences, the role of channel erosion is dictated by the channel type, which is in turn a result of the landscape factors of geology and climate. For example, lower-gradient streams show a much greater response to both natural and human-caused variations in flood frequency and sediment supply.
The stream channel shape and configuration reflect the balance between erosive forces and sediment deposition. Channel shape also provides a useful way to characterize various portions of the
watershed. The Channel Habitat Type Classification component of the manual describes how to classify channels within a watershed to help understand how each portion of the stream network interacts with the entire watershed. In addition, classification of channels allows some modest
predictive capabilities about how channels react to changes within the watershed.
Due to the complexity of the many interactions that influence channel erosion, it is beyond the scope of this document to present assessment methodologies for channel erosion. In basins where obvious and widespread erosion is occurring, a geomorphologist or hydrologist should be consulted.
Oregon Watershed Assessment Manual Page 22 Watershed Fundamentals
See Historical Conditions component and Ecoregions appendix for
assessment of fire history and other disturbances.
See Sediment Sources component for discussion
of the effects of vegetative removal on soil erosion.
See Hydrology and Water Use component for discussion of how vegetation removal
affects hydrology.
VEGETATION
Human activities can alter the vegetative patterns in a watershed through timber harvest, forest management practices, fire suppression, agriculture, grazing, and conversion to urban areas. These changes can potentially impact water temperatures, sediment delivery to streams, and the amount and timing of runoff. To evaluate these potential impacts, it is important to understand the
functions of vegetation in a watershed, and how alteration of vegetation can ultimately influence fish habitat and water quality.
Vegetation patterns and characteristics within a watershed generally change over time. Fires are a primary process of vegetative disturbance that has the potential to cause widespread tree death and the initiation of new forests. The
frequency of stand-replacing fires, referred to as fire cycles, varies in Oregon from west to east due to decreases in precipitation, and from north to south because of increasing temperature and occurrence of lightning. Fire regimes are also strongly affected by topography; e.g., south-facing slopes burn more frequently than wide valley floors. Fires can be detrimental to a watershed when ground cover is removed, bare soil is exposed, the soil is damaged or sterilized, or large downed wood in the channel is destroyed, affecting channel stability. Typically, a catastrophic event such as a fire removes or sets back the established vegetative growth and a new cycle of recovery begins. Insects and disease also affect this cycle. When dry, dead material derived from trees killed by insects or disease accumulates, the risk of fire increases and eventually most areas burn. The typical history of fires and other disturbances, and their effects on vegetation in the watershed, are discussed in the Ecoregions appendix and evaluated on a local basis in the Historical Conditions component.
Role of Upland Vegetation
Vegetation functions to slow runoff and reduce soil compaction, allowing better percolation of rainfall into soils and groundwater, which creates better water storage for summer baseflows. In
addition, the patterns, sizes, and composition of the vegetation affect many wildlife species. Finally, vegetative composition and density can reduce or prevent soil erosion. Leaves and branches intercept the falling rain and reduce the effect of raindrop splash. Vegetative litter from dead leaves and branches builds up an organic surface that provides
protection of the soil layer. Root systems help to keep soil material from moving downslope. When landslides do occur they often bring large wood into the channel, which has an important influence on channel condition and fish habitat. The effects of vegetation removal on soil erosion are discussed in the Sediment Sources component.
In some areas of Oregon, upland vegetation may influence snow accumulation, and the timing of snowmelt and runoff. In areas of the western Cascades, snowmelt in open areas may be accelerated during the relatively warm and windy winter storms that come from the southwest. In eastern Oregon, patterns of vegetation may change the process of

Oregon Watershed Assessment Manual Page 23 Watershed Fundamentals
snow accumulation and melt, potentially changing the timing and amount of runoff in the late spring and summer. Removal of landscape vegetation can also increase water yield and discharge during the normal low-flow period, although the effect is short-term. The effects of vegetation removal on the hydrology of the watershed are evaluated in the Hydrology and Water Use Assessment component.
Role of Riparian Vegetation
The green areas along streams and rivers are riparian areas; the characteristic plant communities that occur there are referred to as riparian vegetation. Riparian areas generally have higher levels of soil moisture than adjacent upland areas, and usually are well-vegetated. A wide variety of hydrologic, geomorphic, and biotic processes determine the character of the riparian zone.
Riparian vegetation influences fish habitat and water quality in a number of ways. Riparian vegetation may act as a filter in some areas, keeping sediment and pollutants out of streams. The roots of riparian vegetation stabilize stream banks by reducing erosion and preventing stream channels from downcutting. Streamside vegetation provides habitat for insects, some of which fall in the water and provide a food source for fish. In addition, vegetative litter is an important source of nutrients to the stream. During high stream flows, riparian vegetation may slow and dissipate the energy of floodwaters, preventing erosion (Figure 12). Although all of these are important functions of riparian vegetation, they are difficult to quantify and are beyond the scope of this assessment process. This assessment focuses only on the functions of the riparian areas in providing a source of large wood to the stream, and in providing shade for temperature` control. Riparian areas that are
Figure 12. The riparian zone provides a number of functions, as illustrated.

Oregon Watershed Assessment Manual Page 24 Watershed Fundamentals
See Ecoregions appendix and Riparian/Wetlands component regarding the role of LWD.
functioning to provide these two key inputs will also generally provide the other functions and processes attributed to riparian areas.
Large Wood Recruitment
Riparian areas are an important source of large woody debris (LWD) that enters, or is recruited to, the stream channel. LWD includes tree boles, root wads, and large branches, and is recruited to the stream by bank erosion, mortality (disease or fire), or wind throw. As mentioned above, trees from both the riparian and upland areas may also be carried into the stream by landslides (Figure 13).
In the stream channel, LWD diverts and obstructs flow, thereby increasing channel complexity (i.e., the large wood creates pools and riffles that provide areas of different velocity and depth). This complexity provides cover from predators, creates rearing areas, and develops refuge areas for fish during high stream flows. LWD also creates storage sites for sediment in all sizes of streams. In small headwater streams, wood controls sediment movement downstream. In larger streams, accumulation of sediment behind LWD often provides spawning gravels. LWD plays an important role in stream nutrient dynamics by retaining leaf litter and needles, making these energy supplies
available for consumption by aquatic insects that ultimately serve as food for fish.
The importance of riparian zones for providing LWD varies by ecoregion. The Ecoregions appendix provides a
description of potential riparian vegetation and the role of LWD in different areas of the state. The Riparian/Wetlands Assessment component provides a methodology to assess and evaluate the vegetation associated with riparian zones.
Figure 13. Large woody debris is recruited to the stream by bank erosion, mortality (disease or fire), or wind throw.

Oregon Watershed Assessment Manual Page 25 Watershed Fundamentals
Riparian Shade
Although other processes besides shading affect heating and cooling of water (such as groundwater inflows), shading can have the biggest affect because it counteracts the most important source of stream heating during the summer—solar radiation. Riparian enhancement efforts that provide shade have a high potential to contribute to temperature moderation as well as provide direct benefits to fish and wildlife habitat.
Shade provided by riparian vegetation affects stream temperature by reducing the inputs of solar radiation to the water surface. Although the vegetation itself will radiate heat to the stream, the increase in water temperature due to radiation from this source is very small compared with heating from direct solar radiation. Radiation from vegetation is important, however, because it decreases fluctuation of water temperatures on a daily (or diurnal) basis (Figure 14) in forested streams compared with streams that have no canopy cover. The slope and aspect of a site also affect the amount of radiation received. In some areas (e.g., deep canyons) the topography of the land can also provide significant shade.
Role of Ambient Air Temperature
In most streams evaporation of moisture is a primary mechanism of stream cooling; the heat is used to turn water into vapor. Turbulent streams (e.g., high-gradient streams with cascades, etc.) will cool faster than slow streams with smooth surface conditions, due to the higher evaporation rate. Inputs
Figure 14. Radiation from vegetation decreases fluctuation of water temperatures on a daily basis in forested streams compared with streams that have no canopy cover. Inputs of cool groundwater are also a significant source of stream cooling in some areas.

Oregon Watershed Assessment Manual Page 26 Watershed Fundamentals
of cool groundwater are also a significant source of stream cooling in some areas (Figure 14). Likewise, inputs from hot springs can raise stream temperatures.
Stream temperatures are cooler than the ambient air temperature because of the higher specific heat of the water, and the cooling processes associated with evaporation and the inflow of groundwater. The daily patterns in stream temperature follow the daily change in air temperature. Typically, the maximum daily temperature occurs in the late afternoon and the minimum occurs late at night or early morning (Figure 14).
In many streams in Oregon, late-summer streamflows are lowest when the net heat gain is the greatest, resulting in the warmest water temperatures of the year. This phenomenon reflects the fact that the maximum water temperature is a result of both the net heat received and the amount of water that is heated. Consequently, the maximum annual stream temperatures may be higher in low-flow or drought years even though the stream receives the same level of heating each year.
Summary
All of the physical processes described above play a role in the temperature of water. However, vegetative density in riparian zones is typically the most important process that can be changed by management activities. The Riparian/Wetlands Assessment component provides a methodology to determine the current condition of the site vegetation, and to predict the effect of increasing or decreasing shade levels. The Ecoregions appendix provides a description of potential shade associated with riparian vegetation in different areas of the state. The Water Quality Assessment component identifies where existing high stream temperatures have been identified.
WETLANDS
Wetlands can be present in the riparian zone, or they can occur in upslope areas with no obvious surface connection to a stream channel. Wetlands provide a variety of important functions, including water quality improvement, flood attenuation and desynchronization, groundwater recharge and discharge, and fish and wildlife habitat. These functions are described in the following subsections.
Water Quality Improvement
Wetlands aid in water quality improvement by trapping sediment, and contaminants that may be attached to the sediments. Dense wetland vegetation tends to slow the rate of movement of water, which allows sediments to settle out. Although deposition of sediments is beneficial to downstream resources, excessive sedimentation may have negative impacts on the wetland itself. When a wetland is subjected to ongoing sediment deposition, the bottom elevation of the wetland will change; over time, this change could lead to wetland loss.
Vegetation within wetlands also can assimilate certain nutrients and some toxins, thereby protecting downstream resources. The anaerobic environment of many wetland soils breaks down nitrogen compounds and keeps many compounds in a nonreactive form. The ability of a wetland to provide this function is limited: At a certain point, toxins can build up to lethal levels in the wetland community and decrease the wetland’s capacity to metabolize the nutrients entering from upstream

Oregon Watershed Assessment Manual Page 27 Watershed Fundamentals
sources. In addition, plant die-back and decay can re-release nutrients or toxins back into the system, although many toxins are actually converted to less harmful forms or bound in sediments.
Flood Attenuation and Desynchronization
Wetlands can help alleviate downstream flooding by storing, intercepting, or delaying surface runoff. Wetlands within the floodplain of a river can hold water that has overtopped river banks.
Floodwater desynchronization occurs when wetlands higher in the watershed temporarily store water, reducing peak flows. The most effective wetlands at providing desynchronization are generally located in the middle elevations of the watershed; these wetland locations are far enough away from the receiving water to create delay, but are low enough in the watershed to collect significant amounts of water.
Groundwater Recharge and Discharge
Wetlands are intimately associated with groundwater, and some wetlands can function to recharge underlying aquifers. Wetlands are sources of groundwater discharge that may help extend streamflows into the drier summer months. In eastern Oregon, restoring wet meadows in stream headwaters has extended the seasonal duration of streamflow.
Fish and Wildlife Habitat
Wetlands provide habitat and food for a wide variety of aquatic and terrestrial plant and animal species. Many species rely on wetlands for all or a portion of their life cycle. In addition to directly providing habitat, wetlands can indirectly support fish through some of the functions, discussed previously, that protect water quality and channel stability. Estuarine wetlands provide important feeding and holding areas for outmigrating salmon smolts.
AQUATIC RESOURCES
The sections above briefly describe fundamental processes operating in a watershed. The watershed assessment characterizes these processes because they influence fisheries and water quality in the watershed and set the stage for assessment of aquatic resources. Fisheries and water quality are important aquatic resources that are evaluated as a fundamental expression of healthy watersheds. The relationship between these resources and statewide regulatory issues is discussed in more detail in the Start-Up and Identification of Watershed Issues assessment components.
WATER QUALITY
A combination of the natural watershed processes and the effect of human activities determines water quality at a particular site on a stream or river. Water quality is described in terms of the beneficial uses of water and the level of quality needed to support those uses. Measures of water quality—the criteria or indicators—provide the connection between the beneficial uses of water and the natural and human sources of watershed inputs. The following paragraphs briefly discuss the relationships illustrated in Figure 15.

Oregon Watershed Assessment Manual Page 28 Watershed Fundamentals
Beneficial Uses of Water
The streams and rivers in the diverse landscapes of Oregon support different uses of water. To focus the water quality assessment, it is necessary to identify the beneficial uses of water that are important in the watershed as well as those that are specifically identified in the Oregon water quality standards. Beneficial uses determine which water quality criteria apply. For example, assessment for drinking water primarily focuses on the presence of pathogens that can cause disease or chemicals that can contribute to long-term health effects such as cancer risk. Assessment for water that supports fish populations focuses on elements of the stream system such as temperature, dissolved oxygen, metals, and chemical contaminants.
Criteria and Indicators
Water quality criteria provide a warning system when activities in a watershed are limiting beneficial uses. Water quality criteria are specifically established in the State Water Quality Standards by major river basin. Indicators refer to values used in the analysis when the state standards do not specify a numerical criteria. The list of criteria and indicators in Figure 15 illustrates the relationship between beneficial uses of water and the potential sources that may alter the quality of the receiving water. Water quality concerns can be grouped into several major categories for analysis—nutrients, bacteria, temperature, dissolved oxygen, and toxics. Water quality status can be evaluated indirectly by examining the health of the aquatic community using aquatic invertebrates and fish populations.
Figure15. Measures of water quality—the criteria or indicators—provide the connection
between the beneficial uses of water and the natural and human sources of watershed inputs. These relationships provide the context for water quality and fisheries assessments.

Oregon Watershed Assessment Manual Page 29 Watershed Fundamentals
Nutrients
Nutrients refer to chemicals that stimulate growth of algae and aquatic plants in water. In fast-moving streams, algae grow attached to the substrate and are called “periphyton.” Algae and aquatic plants are a necessary part of the stream ecosystem and act as the primary producers in a stream—processing the sun’s energy into food that is used by aquatic insects and crustaceans. These invertebrates in turn provide food for stream fish. Excess algae and aquatic plant growth, however, becomes a problem in slow-moving streams and rivers, and in still waters such as ponds and lakes. The excessive growth can result in low or no dissolved oxygen and interfere with recreation, and certain algae can produce chemicals that are toxic to livestock and wildlife. Phosphorus and nitrogen are the major growth-limiting nutrients in water, and are therefore the focus of a water quality evaluation.
Bacteria
Bacteria in the coliform group are used as indicators to test the sanitary quality of water for drinking, swimming, and shellfish culture. Bacteria in the coliform group are found in wastes associated with warm-blooded animals, including humans, domestic animals, and other mammals and birds; these bacteria are indicators of contamination of surface waters by sewage, feedlots, grazing, and urban runoff. The State of Oregon specifies the use of Escherichia coli (E. coli) as the bacterial indicator for water contact recreation, such as swimming, and fecal coliform bacteria as the indicator in marine and estuarine waters used for shellfish growing. E. coli is a more specific test for organisms that occur in warm-blooded animals. The fecal coliform procedure tests positive for some bacteria that occur naturally in the environment, but has generally been accepted as a good screening tool.
Fecal coliform bacteria enter streams from many sources associated with human and animal wastes in urban and agricultural watersheds. In range lands, bacterial contamination occurs primarily from direct deposition of fecal material in streams. Good vegetative cover on the upslope areas and dense riparian vegetation impedes contaminated runoff from reaching streams. Once coliform bacteria enter streams, the majority settle to the bottom and are attached to sediment particles. The stream sediments can act as a reservoir for fecal coliform bacteria; bacteria are resuspended when bottom sediments are disturbed through increased turbulence or animal movement.
Temperature and Dissolved Oxygen
Cool temperatures and high dissolved oxygen are necessary features of streams that support salmonid fish and the associated aquatic community. Suitable temperature ranges have been evaluated for all life history stages of salmonids—adult migration, spawning, egg incubation, embryo development, juvenile rearing, and juvenile migration. The biological rationale for temperature criteria are based on laboratory and field studies. Laboratory studies evaluate egg development rate and juvenile survival under constant temperatures. Field studies evaluate the effect of water temperature on adult and juvenile migration behavior and adult spawning behavior. Oregon water quality standards are established to protect fish populations based on sublethal effects to fish, such as susceptibility to disease, inability to spawn, reduced survival rate of eggs, reduced growth and survival rate of juveniles, increased competition for limited habitat and food, and reduced ability to compete with other species. A general numerical standard of 64º Fahrenheit (7-day moving average of maximum temperatures) was established in Oregon on the basis of preventing these sublethal effects. Several documents (Boyd and Sturdevant 1997, Oregon Department of Environmental

Oregon Watershed Assessment Manual Page 30 Watershed Fundamentals
Quality 1995) have been published by state agencies to help understand the technical basis for the standard, and what managers and land owners can do to meet the standard. High dissolved oxygen is a basic physiological requirement of cold-water fishes. Critical dissolved oxygen levels for various life stages have been evaluated in laboratory and field studies. The early larval stages of fish are wholly dependent on the transfer of oxygen within the redd, the salmonid gravel nest. When oxygen is below saturation, salmonid embryos are smaller than usual and hatching is either delayed or is premature. Salmonid juveniles survive in dissolved oxygen less than saturation, but growth, food conversion efficiency, and swimming performance are adversely affected. Water quality criteria are established to provide for the natural fluctuations below saturation while assuring sufficient dissolved oxygen to protect aquatic life. The concentration of dissolved oxygen is a function of many factors: water temperature, surface and intragravel water interchange, water velocity, substrate permeability, and the oxygen demand of organic material. The content of oxygen in water is directly related to water temperature and barometric pressure, and therefore, temperature and pressure (estimated through elevation) must be measured at the same time.
Toxic Contaminants
Toxic contaminants refer to chemicals introduced by human activities that may be deleterious to people or aquatic organisms. Organic compounds are man-made chemicals that are used for a variety of industrial purposes and as pesticides and herbicides. Metals often occur naturally, but when introduced into the environment or concentrated during mining or industrial processes, they can reach a toxic level. Toxicity covers a range of responses in aquatic organisms, from lethal to sublethal effects. Water quality criteria based on lethal effects are determined by exposing aquatic organisms to the chemical in a laboratory and determining at what concentration 50% of the organisms die. Tests for setting sublethal criteria follow an organism through its life cycle and evaluate the effects on growth and reproduction. These standard toxicity tests are the basis for the majority of water quality criteria recommended by US Environmental Protection Agency (EPA). The State of Oregon has adopted criteria recommended by EPA and listed in a document called the EPA “Goldbook.”
Because of the wide variety of organic chemicals, it is not feasible to list the criteria for each chemical in a screening assessment. Establishing the “safe” level for these chemicals is the subject of continuing debate among scientists and there is often little agreement. Therefore, for the screening assessment, the suggested approach is to record the number of times an organic chemical exceeds the detection limits. If a number of these exceedences are recorded, then a water quality specialist or toxicologist should be consulted.
Metals mining, such as gold and silver mines, are located in mineralized zones that may contain other elements such as cadmium, zinc, copper, lead, mercury, and arsenic. These metals can reach groundwater in dissolved form, or in surface waters as dissolved or particulate material. Criteria for metals are expressed as acute and chronic values. Toxicity for most metals is based on the hardness of the receiving water, and therefore the criteria are expressed as a function of hardness.
FISHERIES RESOURCES
Because modifications to watershed process tend to “roll downhill” and influence the stream channel network, it is important to understand the patterns of fish use and the habitat requirements of fish in the watershed. The Biennial Report on the Status of Wild Fish in Oregon (Hooten et al. 1995)

Oregon Watershed Assessment Manual Page 31 Watershed Fundamentals
contains information on over 40 native fish species occurring in Oregon. The salmonids are the most widespread group of fish in the state and best-recognized as an indicator of watershed health. These are a class of fish that include salmon, trout, and char. This assessment process focuses on evaluating salmonid populations and habitat conditions. In areas where there are sensitive nonsalmonid fish species, this approach may be adapted to evaluate the specific needs of those species.
Salmonids have a wide variety of life history patterns (Figure 16). They may be anadromous—spending some portion of their life history in the ocean and returning to freshwater streams to spawn. They may be resident and spend their entire lives in the stream network. Or they may move between large river systems or reservoirs and the stream network where they were born.
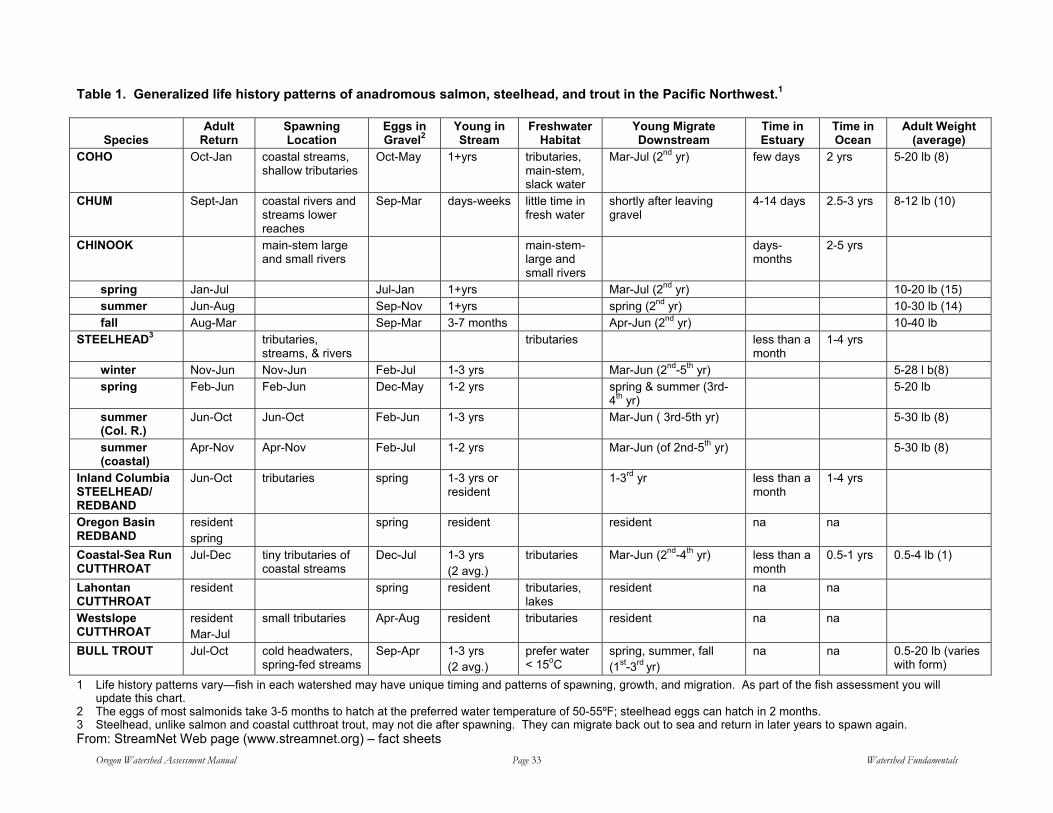
Chinook, coho, steelhead, and cutthroat trout are the most common anadromous salmonids occurring in Oregon. Anadromous chum salmon and kokanee/sockeye salmon also occur in Oregon, but have more limited distributions. Redband (rainbow) trout and interior cutthroat trout are the most common resident salmonids; bull trout also occur in Oregon but have a limited distribution. The life history patterns and distribution in the stream network of the most common salmonids are summarized in Table 1 and described in the following paragraphs (Figure 17). These descriptions are general in nature; it is not uncommon for fish species to have life history patterns adapted to the watershed of origin. For this reason the Fish and Fish Habitat Assessment component asks users to describe the known life history patterns of fish occurring in their watershed. The Biennial Report on the Status of Wild Fish in Oregon provides some watershed-specific information and contains more detailed information on the life history patterns of nonsalmonid fish species that may occur in your watershed.
Figure 16. Salmon and trout have three distinct life history patterns: (1) “anadromous,” spending some portion of their life history in the ocean and returning to freshwater streams to spawn; (2) “resident,” spending their entire lives in the stream network; or (3) fluvial or adfluvial, moving between large river systems or reservoirs and the stream network where they were born.

Oregon Watershed Assessment Manual Page 33 Watershed Fundamentals
Table 1. Generalized life history patterns of anadromous salmon, steelhead, and trout in the Pacific Northwest.1
Species
Adult Return
Spawning Location
Eggs in Gravel2
Young in Stream
Freshwater Habitat
Young Migrate Downstream
Time in Estuary
Time in Ocean
Adult Weight (average)
COHO Oct-Jan coastal streams, shallow tributaries
Oct-May 1+yrs tributaries, main-stem, slack water
Mar-Jul (2nd yr) few days 2 yrs 5-20 lb (8)
CHUM Sept-Jan coastal rivers and streams lower reaches
Sep-Mar days-weeks little time in fresh water
shortly after leaving gravel
4-14 days 2.5-3 yrs 8-12 lb (10)
CHINOOK main-stem large and small rivers
main-stem-large and small rivers
days-months
2-5 yrs
spring Jan-Jul Jul-Jan 1+yrs Mar-Jul (2nd yr) 10-20 lb (15) summer Jun-Aug Sep-Nov 1+yrs spring (2nd yr) 10-30 lb (14) fall Aug-Mar Sep-Mar 3-7 months Apr-Jun (2nd yr) 10-40 lb STEELHEAD3 tributaries,
streams, & rivers tributaries less than a
month 1-4 yrs
winter Nov-Jun Nov-Jun Feb-Jul 1-3 yrs Mar-Jun (2nd-5th yr) 5-28 l b(8) spring Feb-Jun Feb-Jun Dec-May 1-2 yrs spring & summer (3rd-
4th yr) 5-20 lb
summer (Col. R.)
Jun-Oct Jun-Oct Feb-Jun 1-3 yrs Mar-Jun ( 3rd-5th yr) 5-30 lb (8)
summer (coastal)
Apr-Nov Apr-Nov Feb-Jul 1-2 yrs Mar-Jun (of 2nd-5th yr) 5-30 lb (8)
Inland Columbia STEELHEAD/ REDBAND
Jun-Oct tributaries spring 1-3 yrs or resident
1-3rd yr less than a month
1-4 yrs
Oregon Basin REDBAND
resident spring
spring resident resident na na
Coastal-Sea Run CUTTHROAT
Jul-Dec tiny tributaries of coastal streams
Dec-Jul 1-3 yrs (2 avg.)
tributaries Mar-Jun (2nd-4th yr) less than a month
0.5-1 yrs 0.5-4 lb (1)
Lahontan CUTTHROAT
resident spring resident tributaries, lakes
resident na na
Westslope CUTTHROAT
resident Mar-Jul
small tributaries Apr-Aug resident tributaries resident na na
BULL TROUT
Jul-Oct cold headwaters, spring-fed streams
Sep-Apr 1-3 yrs (2 avg.)
prefer water < 15oC
spring, summer, fall (1st-3rd yr)
na na 0.5-20 lb (varies with form)
1 Life history patterns vary—fish in each watershed may have unique timing and patterns of spawning, growth, and migration. As part of the fish assessment you will update this chart.
2 The eggs of most salmonids take 3-5 months to hatch at the preferred water temperature of 50-55ºF; steelhead eggs can hatch in 2 months. 3 Steelhead, unlike salmon and coastal cutthroat trout, may not die after spawning. They can migrate back out to sea and return in later years to spawn again. From: StreamNet Web page (www.streamnet.org) – fact sheets
Oregon Watershed Assessment Manual Page 34 Watershed Fundamentals
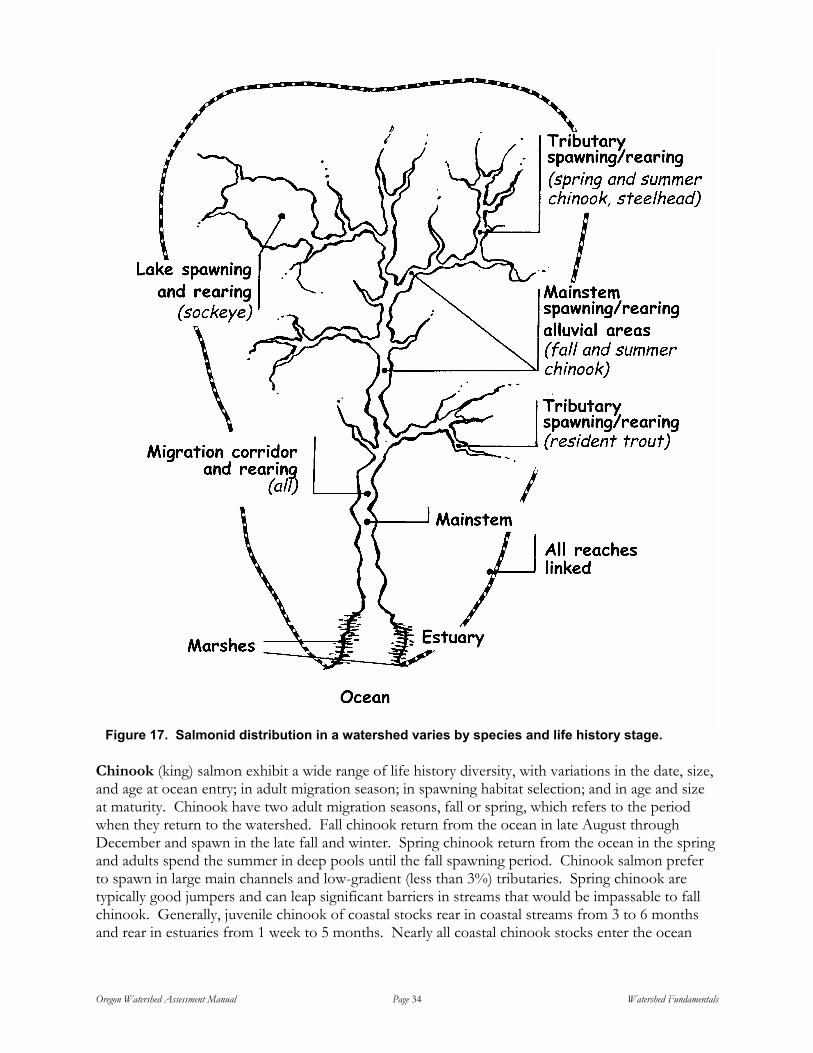
Chinook (king) salmon exhibit a wide range of life history diversity, with variations in the date, size, and age at ocean entry; in adult migration season; in spawning habitat selection; and in age and size at maturity. Chinook have two adult migration seasons, fall or spring, which refers to the period when they return to the watershed. Fall chinook return from the ocean in late August through December and spawn in the late fall and winter. Spring chinook return from the ocean in the spring and adults spend the summer in deep pools until the fall spawning period. Chinook salmon prefer to spawn in large main channels and low-gradient (less than 3%) tributaries. Spring chinook are typically good jumpers and can leap significant barriers in streams that would be impassable to fall chinook. Generally, juvenile chinook of coastal stocks rear in coastal streams from 3 to 6 months and rear in estuaries from 1 week to 5 months. Nearly all coastal chinook stocks enter the ocean
Figure 17. Salmonid distribution in a watershed varies by species and life history stage.

Oregon Watershed Assessment Manual Page 35 Watershed Fundamentals
during their first summer or fall. Some coastal and Columbia River spring chinook spend one summer and one winter in fresh water. Chinook adults range from 2 to over 70 pounds, with the average size ranging from 10 to 40 pounds.
Coho (silver) salmon usually spawn from November to February. Coho prefer to spawn and rear in small, low-gradient (less than 3%) tributary streams. Adults are good jumpers and often ascend higher-gradient reaches to access spawning areas in the upper portions of a watershed. Adult coho may spend several weeks to several months in fresh water before spawning, depending on the distance they have to migrate to their spawning areas. Juveniles normally spend one summer and one winter in fresh water. They migrate to the ocean in the spring, 1 year after emergence. Most adults mature at 3 years of age, but some males mature as jacks or precocious males. Coho adults rarely exceed 15 pounds.
Steelhead/Rainbow/Redband: The rainbow trout species consists of multiple subspecies that are closely related fish that exhibit differences in life history patterns, distribution, and/or body form. Currently, three subspecies of rainbow trout are recognized in Oregon: (1) coastal steelhead/rainbow trout, (2) inland Columbia Basin redband/steelhead trout, and (3) Oregon Basin redband trout.
Coastal steelhead are seagoing rainbow trout that occur west of the Cascade Mountains and have a wide variety of fresh- and saltwater rearing and adult migration strategies. Juvenile steelhead may rear 1 to 4 years in fresh water before migrating to saltwater. Steelhead may reside in saltwater 1 to 3 years. Adult steelhead that enter fresh water between May and October are called “summer-run” fish. These fish hold several months in fresh water prior to spawning. Adults that enter between November and April are called “winter-run” fish. These fish are more sexually mature when they go upstream and they stay in fresh water for a shorter time before spawning. Steelhead return to saltwater after spawning. Resident rainbow trout remain in the same stream network throughout their entire life. Rainbow trout typically spawn in the winter or spring. Both rainbow and steelhead spawn more than once.
Inland Columbia Basin redband/steelhead occur in the Columbia Basin east of the Cascade Mountains. This subspecies includes anadromous steelhead and resident redband trout, both of which can occur in the same stream system. There are also isolated redband trout populations in streams that are above barriers to anadromous fish. Juvenile steelhead before returning to fresh water to spawn. Most inland steelhead are summer-run fish, entering fresh water between March and October and holding for several months prior to spawning. Only four populations of winter-run steelhead are found in Oregon; these populations occur in Fifteenmile Creek and adjacent creeks.
Oregon Basin redband trout occur in the following basins: Klamath, Summer Lake, Abert Lake, Fort Rock Valley, Christmas Valley, Fossil Lake, Silver Lake, and Malheur. Populations in each of these basins are completely isolated by natural geological features, except for the Klamath Basin. These trout are adapted to thrive in the often warm and alkali waters of the Great Basin streams where they occur. Historically, these redband trout populations had adfluvial life histories, which means they migrated between the spawning areas in streams to rearing areas in lakes and marshes. The diking, channeling, irrigation
Oregon Watershed Assessment Manual Page 36 Watershed Fundamentals
See Fish and Fish Habitat component for habitat evaluation process.
diversions, and draining of marshlands that have occurred extensively in these basins has resulted in the loss of rearing habitat and functional migration corridors.
Cutthroat trout have three subspecies occurring in Oregon: (1) coastal cutthroat trout, which occur west of the Cascade Mountains; (2) Lahontan cutthroat trout, occurring in southeastern Oregon, and (3) westslope cutthroat trout, which occur in the John Day Basin.
Coastal cutthroat trout have variable life history patterns. Some migrate to the ocean while others remain in the same area of a stream all of their lives. They spawn in the spring or fall and the juveniles emerge by June or July. Cutthroat trout tend to spawn in very small tributaries. Sea-run cutthroat trout rarely exceed a length of 20 inches or a weight of 4 pounds.
Lahontan cutthroat trout occupy remnant streams in the basin of historical Lake Lahontan. These fish have evolved a tolerance to high alkaline conditions. Lahontan cutthroat tend to be small-sized and occupy small streams that usually have no other fish species present.
Westslope cutthroat trout only occur in the John Day Basin in Oregon. These populations all have a resident life history and remain in the same stream system their entire lives. Westslope cutthroat are specialized to feed on insects and other invertebrates, while the other cutthroat subspecies occurring in Oregon prefer to feed on other fish.
Bull trout are a char closely related to trout. Researchers believe the bull trout populations in Oregon became established during the last glacial period, which helps explain why they need cold water to successfully reproduce. Bull trout in Oregon have three distinct life history patterns: They may be (1) adfluvial fish that migrate between lakes or reservoirs and spawn in streams, (2) fluvial fish that migrate to large rivers and spawn in small tributaries, or (3) resident fish that remain in the same stream network for their entire lives. The migratory forms of bull trout move long distances to reach their spawning tributaries. Typically, bull trout occur farther upstream in the watershed than other salmonids. Bull trout grow slowly, do not mature until age 5 or older and will live for 12 or more years. They typically spawn in the fall as water temperatures are decreasing, and can spawn annually or in alternate years. Bull trout are predatory on other fish and can grow to 30 pounds where adequate food is available.
There are many elements of in-stream fish habitat that affect the production of salmonids during the freshwater phases of their life history (Figure 18). Physical habitat features include depth and water
velocity ranges (usually grouped by channel units), cover, spawning gravels, and temperature ranges. The Oregon Department of Fish and Wildlife has compiled extensive amounts of stream habitat data from over 5,000 miles of stream surveys and has developed a series of benchmark
values for key physical habitat conditions. The Fish and Fish Habitat Assessment component uses these benchmark values as a comparison in order to evaluate the current condition of fish habitat in the watershed.
It is clear from the descriptions of the life histories that the anadromous trout and salmon occurring in Oregon watersheds migrate long distances upstream and downstream during their life cycles.

Oregon Watershed Assessment Manual Page 37 Watershed Fundamentals
Figure 18. Elements of in-stream fish habitat that affect salmonid production in fresh water include depth and water velocity, cover, spawning gravels, and temperature ranges.
These conditions are dependent on such physical characteristics as pools and side channels, substrate, and riparian vegetation.

Oregon Watershed Assessment Manual Page 38 Watershed Fundamentals
Resident trout will also move up and downstream to seek food, shelter, and spawning. Culverts under roads can block fish passage through a number of factors, including jumps, no resting pools, insufficient depth, excessive water velocity, or a combination of these factors (Figure 19). The migration barrier portion of the Fish and Fish Habitat Assessment provides a protocol for mapping potential barriers, and identifying if an existing crossing is a barrier.
Figure 19. Culverts under roads can block fish passage through a number of factors,
including excessive water velocity, insufficient depth, excessively high jumps, or a combination of these factors.
Oregon Watershed Assessment Manual Page 39 Watershed Fundamentals
POTENTIAL LAND MANAGEMENT EFFECTS
General
Potential impacts to streams from human activities are based on the nature of the disturbance and the responses of the watershed to the disturbance. Human activities can create disturbances that alter how watershed processes function in predictable patterns. This watershed assessment manual recognizes that it is the manner in which land management activities are conducted combined with the local sensitivity or resilience of the landscape that ultimately determine the type and severity of potential effects. However land use activities can be used to screen for potential impacts. Table 2 summarizes the types of disturbances that can be created by specific land use activities and lists how the watershed may respond to these disturbances in terms of fish habitat or water quality conditions. The References section lists a number of comprehensive discussions on this topic.
Cumulative Effects
Cumulative effects can be defined as the changes to the environment caused by the interaction of natural ecosystem processes with the effects of land use and other human activities distributed through time and over the landscape. According to this definition, individual actions that by themselves are relatively minor may impact resources when combined with other modifications that have occurred in the watershed. The current habitat condition at any location in a stream is a function of the watershed activities that currently occur upslope and upstream, added to the effect of historical activities. For example, in a typical managed forest, historical streamside timber harvest combined with stream cleaning, splash damming, and use of streams as transportation corridors have resulted in a legacy of low LWD frequency. Downstream in an agricultural area, streams were often channelized and riparian forests were removed. These historical changes combined with present-day expansion of suburban areas, for example, result in altered channel conditions throughout the watershed. Cumulative effects are detected in the assessment process by describing and identifying the location of historical activities, by assessing the current riparian and habitat conditions (which reflect past and present actions), and by combining the outcome of assessment sections into one Watershed Condition Evaluation.
The impact on the watershed from multiple activities depends on where and when they occur. This assessment addresses the location of impacts through a mapping process that links the impacts to specific Channel Habitat Types. This process also addresses the timing of watershed modifications by identifying historical activities that may have long-term channel impacts (e.g., splash dams and channelization), and those which have current and future impacts (e.g., limited wood recruitment from riparian zones). The Channel Habitat Type Classification component identifies stream reaches that are most susceptible to impacts and are the most responsive to enhancement efforts based on physical characteristics. These sensitive reaches can then become a focal point for follow-up studies, monitoring efforts, or protection and enhancement efforts.
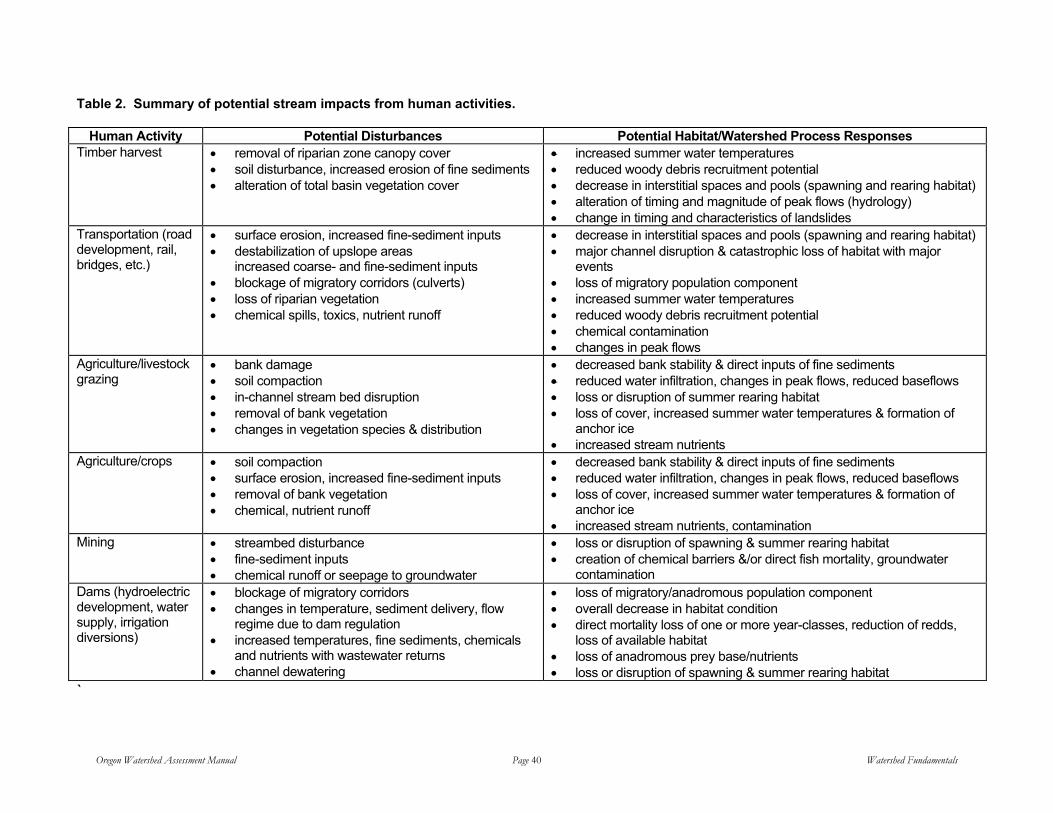
Oregon Watershed Assessment Manual Page 40 Watershed Fundamentals
Table 2. Summary of potential stream impacts from human activities.
Human Activity Potential Disturbances Potential Habitat/Watershed Process Responses Timber harvest • removal of riparian zone canopy cover
• soil disturbance, increased erosion of fine sediments • alteration of total basin vegetation cover
• increased summer water temperatures • reduced woody debris recruitment potential • decrease in interstitial spaces and pools (spawning and rearing habitat) • alteration of timing and magnitude of peak flows (hydrology) • change in timing and characteristics of landslides
Transportation (road development, rail, bridges, etc.)
• surface erosion, increased fine-sediment inputs • destabilization of upslope areas
increased coarse- and fine-sediment inputs • blockage of migratory corridors (culverts) • loss of riparian vegetation • chemical spills, toxics, nutrient runoff
• decrease in interstitial spaces and pools (spawning and rearing habitat) • major channel disruption & catastrophic loss of habitat with major
events • loss of migratory population component • increased summer water temperatures • reduced woody debris recruitment potential • chemical contamination • changes in peak flows
Agriculture/livestock grazing
• bank damage • soil compaction • in-channel stream bed disruption • removal of bank vegetation • changes in vegetation species & distribution
• decreased bank stability & direct inputs of fine sediments • reduced water infiltration, changes in peak flows, reduced baseflows • loss or disruption of summer rearing habitat • loss of cover, increased summer water temperatures & formation of
anchor ice • increased stream nutrients
Agriculture/crops • soil compaction • surface erosion, increased fine-sediment inputs • removal of bank vegetation • chemical, nutrient runoff
• decreased bank stability & direct inputs of fine sediments • reduced water infiltration, changes in peak flows, reduced baseflows • loss of cover, increased summer water temperatures & formation of
anchor ice • increased stream nutrients, contamination
Mining • streambed disturbance • fine-sediment inputs • chemical runoff or seepage to groundwater
• loss or disruption of spawning & summer rearing habitat • creation of chemical barriers &/or direct fish mortality, groundwater
contamination Dams (hydroelectric development, water supply, irrigation diversions)
• blockage of migratory corridors • changes in temperature, sediment delivery, flow
regime due to dam regulation • increased temperatures, fine sediments, chemicals
and nutrients with wastewater returns • channel dewatering
• loss of migratory/anadromous population component • overall decrease in habitat condition • direct mortality loss of one or more year-classes, reduction of redds,
loss of available habitat • loss of anadromous prey base/nutrients • loss or disruption of spawning & summer rearing habitat
`
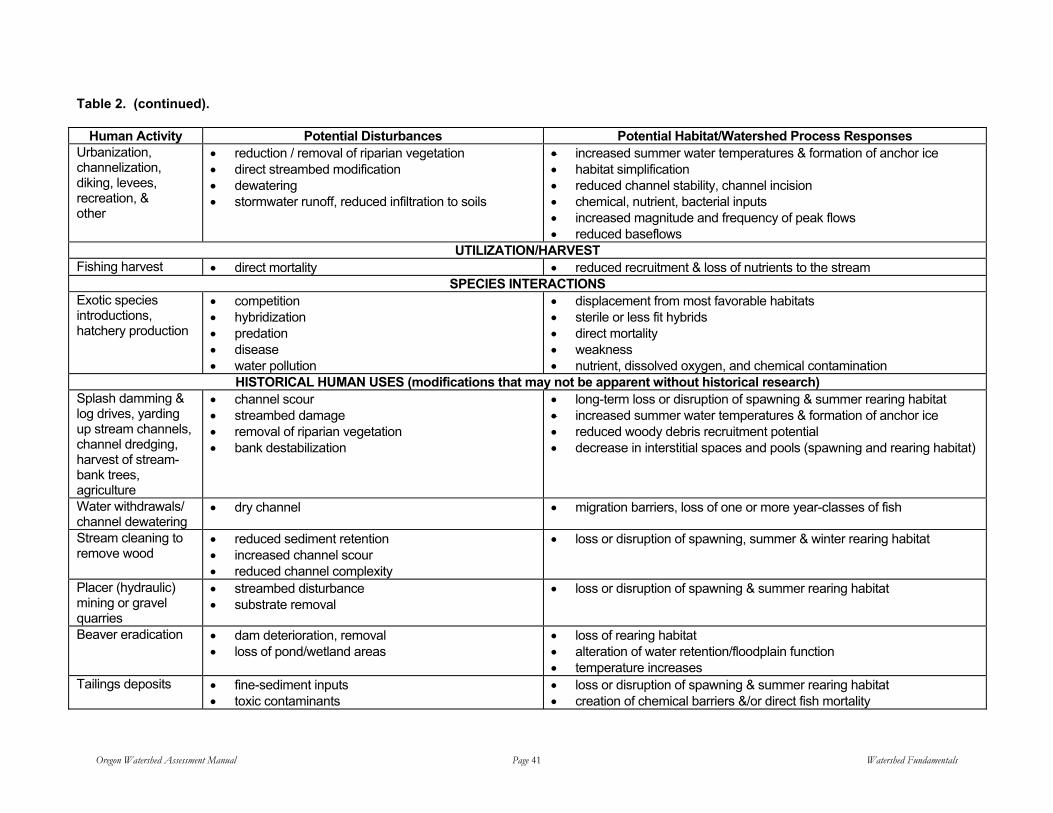
Oregon Watershed Assessment Manual Page 41 Watershed Fundamentals
Table 2. (continued).
Human Activity Potential Disturbances Potential Habitat/Watershed Process Responses Urbanization, channelization, diking, levees, recreation, & other
• reduction / removal of riparian vegetation • direct streambed modification • dewatering • stormwater runoff, reduced infiltration to soils
• increased summer water temperatures & formation of anchor ice • habitat simplification • reduced channel stability, channel incision • chemical, nutrient, bacterial inputs • increased magnitude and frequency of peak flows • reduced baseflows
UTILIZATION/HARVEST Fishing harvest • direct mortality • reduced recruitment & loss of nutrients to the stream
SPECIES INTERACTIONS Exotic species introductions, hatchery production
• competition • hybridization • predation • disease • water pollution
• displacement from most favorable habitats • sterile or less fit hybrids • direct mortality • weakness • nutrient, dissolved oxygen, and chemical contamination
HISTORICAL HUMAN USES (modifications that may not be apparent without historical research) Splash damming & log drives, yarding up stream channels, channel dredging, harvest of stream-bank trees, agriculture
• channel scour • streambed damage • removal of riparian vegetation • bank destabilization
• long-term loss or disruption of spawning & summer rearing habitat • increased summer water temperatures & formation of anchor ice • reduced woody debris recruitment potential • decrease in interstitial spaces and pools (spawning and rearing habitat)
Water withdrawals/ channel dewatering
• dry channel • migration barriers, loss of one or more year-classes of fish
Stream cleaning to remove wood
• reduced sediment retention • increased channel scour • reduced channel complexity
• loss or disruption of spawning, summer & winter rearing habitat
Placer (hydraulic) mining or gravel quarries
• streambed disturbance • substrate removal
• loss or disruption of spawning & summer rearing habitat
Beaver eradication • dam deterioration, removal • loss of pond/wetland areas
• loss of rearing habitat • alteration of water retention/floodplain function • temperature increases
Tailings deposits • fine-sediment inputs • toxic contaminants
• loss or disruption of spawning & summer rearing habitat • creation of chemical barriers &/or direct fish mortality
Oregon Watershed Assessment Manual Page 42 Watershed Fundamentals
See Watershed Condition Evaluation component regarding how to combine and use the information gathered in the
assessment process.
The use of watershed resources often causes conflicts and even the irreplaceable loss of important resources. A key objective of this assessment is to understand how the watershed functions, including identification of factors that limit fish populations and contribute to water quality concerns. The Watershed Condition Evaluation component will use the information gathered in the assessment to help
watershed councils prioritize actions to protect and restore fish habitat and water quality.
REFERENCES
Beckman, H.O., and N.C. Brady. 1969. The Nature and Properties of Soils, Seventh Edition. The Macmillan Co., New York.
Behnke, R.J. 1992. Native Trout of Western North America. American Fisheries Society Monograph 6. Bethesda, MD.
Bell, M. 1986. Fisheries Handbook of Engineering Requirements and Biological Criteria. US Army Corps of Engineers. Washington, DC.
Boyd, M., and D. Sturdevant. 1997. The Scientific Basis for Oregon’s Stream Temperature Standards: Common Questions and Straight Answers. Oregon Department of Environmental Quality, unpublished agency document, Portland, Oregon.
Bruce, J.P., and R.H. Clark. 1966. Introduction to Hydrometeorology. Pergamon Press, Oxford.
Buchanan, D.V., M.L. Hanson, and R.M. Hooten. 1997. Status of Oregon’s Bull Trout. Oregon Department of Fish and Wildlife, Salem, Oregon.
Evans, W.A., and B. Johnston. 1980. Fish Migration and Fish Passage: A Practical Guide to Solving Fish Passage Problems. US Forest Service, EM-7100-2, Washington, DC.
Hooten, B., S. Jacobs, et al. 1995. Biennial Report on the Status of Wild Fish in Oregon. Oregon Department of Fish and Wildlife, Salem, Oregon.
Jumikis, A. 1966. Thermal Soil Mechanics. Rutgers University Press. New Brunswick, NJ.
Leopold, L.B. 1994. A View of the River. Harvard University Press, Cambridge, MA.
Logan, R S. and R.A. Fletcher. 1996. Forest Ecosystem Stewardship. MSU Publications, Bozeman, MT.
Linsley, R.K., M. Kohler, and J. Pauhus. 1975. Hydrology for Engineers. McGraw-Hill, New York.
Meehan, W.R. (ed.). 1991. Influences of Forest and Rangeland Management on Salmonid Fishes and Their Habitats. American Fisheries Society Special Publication. Bethesda, MD.
Omernik, J.M. and A.L. Gallant, 1986. Ecoregions of the Pacific Northwest. United States Environmental Protection Agency, Corvallis, OR. EPA/600/3-86/033.

Oregon Watershed Assessment Manual Page 43 Watershed Fundamentals
Omernik, J., 1994. Ecoregions: a spatial framework for environmental management. Chapter 5 in W.S. Davis and T.P. Simon, eds. Biological assessment and criteria: tools for water resource planning and decision making, Lewis Publishers, Boca Raton, FL.
Oregon Department of Environmental Quality. 1995. 1991-1994 Water Quality Standards Review. Oregon Department of Environmental Quality, Portland, Oregon.
OSU Draft Document. 1998. Watershed Stewardship: A Learning Guide. Oregon State University, Corvallis.
Pearcy, B. 1992. Ocean Ecology of North Pacific Salmonids. University of Washington Press, Seattle.
Regional Interagency Executive Committee. Ecosystem Analysis at the Watershed Scale—Federal Guide for Watershed Analysis. Version 2.2. August 1995.
Satterlund, D.R. 1972. Wildland Watershed Management. John Wiley & Sons, New York.
Trotter, P.C. 1987. Cutthroat Native Trout of the West. Colorado Associated University Press.
Yates, S. 1988. Adopting A Stream: A Northwest Handbook. Adopt-A-Stream Foundation.
US Geological Survey. 1974. Map: Hydrological Unit Map for State of Oregon. US Department of the Interior, Washington, DC.
Vannote, R., G. Minshall, K. Cummins, J. Sedell, and C. Cushing. 1980. The River Continuum Concept. Canadian Journal of Fish Aquatic Science, Vol. 37.
GLOSSARY
abiotic: Something that is not living (for example, rock).
adfluvial: Migrating between spawning areas in streams and rearing areas in lakes or reservoirs.
anadromous: Fish that move from the sea to fresh water for reproduction.
aquifer: A body of rock that can collect groundwater, and can yield water to wells and springs. A groundwater reservoir.
benchmark: An initial context for evaluating stream habitat quality. Derived from reference conditions, analysis of regional survey data, and published information.
biotic: Something that is living, or pertaining to living things.
canopy cover: The overhanging vegetation over a given area.
channel complexity: A term used in describing fish habitat. A complex channel contains a mixture of habitat types that provide areas with different velocity and depth for use by different fish life stages. A simple channel contains fairly uniform flow and few habitat types.

Oregon Watershed Assessment Manual Page 44 Watershed Fundamentals
channel confinement: Ratio of bankfull channel width to width of modern floodplain. Modern floodplain is the flood-prone area and may correspond to the 100-year floodplain. Typically, channel confinement is a description of how much a channel can move within its valley before it is stopped by a hill slope or terrace.
Channel Habitat Types (CHT): Groups of stream channels with similar gradient, channel pattern, and confinement. Channels within a particular group are expected to respond similarly to changes in environmental factors that influence channel conditions. In this process, CHTs are used to organize information at a scale relevant to aquatic resources, and lead to identification of restoration opportunities.
channel pattern: Description of how a stream channel looks as it flows down its valley (for example, braided channel or meandering channel).
char: A close relative to trout, another salmonid. Bull trout are a species of char.
cohesive: When describing soil, tendency of soil particles to stick together. Examples of soils with poor cohesion include soils from volcanic ash, and those high in sand or silt.
connectivity: The physical connection between tributaries and the river, between surface water and groundwater, and between wetlands and these water sources.
debris flow: A type of landslide that is a mixture of soil, water, logs, and boulders which travels quickly down a steep channel.
discharge: Outflow; the flow of a stream, canal, or aquifer.
disturbance: Events that can affect watersheds or stream channels, such as floods, fires, or landslides. They may vary in severity from small-scale to catastrophic, and can affect entire watersheds or only local areas.
drainage basin: A geographic and hydrologic subunit of a watershed.
downcutting: When a stream channel deepens over time.
ecoregion: Land areas with fairly similar geology, flora and fauna, and landscape characteristics that reflect a certain ecosystem type.
elevation: The vertical reference of a site location above mean sea level, measured in feet or meters.
emergence: For salmonids, the time of year when fry swim up from gravels in their nesting site and begin to swim in the stream.
estuarine: pertaining to, or in, an estuary.
evapotranspiration (ET): The amount of water leaving to the atmosphere through both evaporation and transpiration.
fish life stage: See life stage.

Oregon Watershed Assessment Manual Page 45 Watershed Fundamentals
flood attenuation: When flood levels are lowered by water storage in wetlands.
flood peak: The highest amount of flow that occurs during a given flood event.
floodplain: The flat area adjoining a river channel constructed by the river in the present climate, and overflowed at times of high river flow.
fluvial fish: Fish that rear in larger rivers and spawn in smaller river tributaries.
gaining reach: Reach where groundwater is flowing into the stream channel to become surface water.
gaging station: A selected section of a stream channel equipped with a gage, recorder, or other facilities for measuring stream discharge.
hydraulic gradient (hydraulic head): Water level from a given point upstream to a given point downstream; or the height of the water surface above a subsurface point. Used in analysis of both ground- and surface-water flow, and is an expression of the relative energy between two points.
hydrograph: A graph of runoff rate, inflow rate, or discharge rate, past a specific point over time.
hydrologic cycle: The circulation of water around the earth, from ocean to atmosphere and back to ocean again.
hydrology: The science of the behavior of water from the atmosphere into the soil.
Hydrologic Unit Codes (HUCs): US Geological Survey designations that correspond to specific watersheds, and are expressed in a hierarchical scale.
hydrophobic soils: Soils that do not easily soak up water, and thus increase the rate of surface runoff.
impervious surface: Surface (such as pavement) that does not allow, or greatly decreases, the amount of infiltration of precipitation into the ground.
infiltration: The rate of movement of water from the atmosphere into the soil.
large woody debris (LWD): Logs, stumps, or root wads in the stream channel, or nearby. These function to create pools and cover for fish, and to trap and sort stream gravels.
legacy activities: Past land use practices that have contributed to current watershed and stream channel conditions.
life stage (fish life stage): A part of a fish’s life cycle, with identifiable habitat requirements associated with it; for example, summer rearing, spawning, and juvenile outmigration to ocean waters.
low flows: The minimum rate of flow for a given period of time.

Oregon Watershed Assessment Manual Page 46 Watershed Fundamentals
mass wasting: (also soil mass movement): Downslope transport of soil and rocks due to gravitational stress.
meandering: When a stream channel moves laterally across its valley.
peak flow: The maximum instantaneous rate of flow during a storm or other period of time.
precipitation: The liquid equivalent (inches) of rainfall, snow, sleet, or hail collected by storage gages.
precipitation intensity: The rate at which water is delivered to the earth’s surface.
raindrop splash: Erosion created when a raindrop hits a bare soil surface. Not common in most of Oregon.
rain-on-snow (event): When snowpacks are melted by warm rains, causing peak flow events. Rain-on-snow events usually occur within the transient snow zone.
raveling: Erosion caused by gravity, especially during rain, frost, and drying periods. Often seen on steep slopes immediately uphill of roads.
recurrence interval(s) (return interval): Determined from historical records. The average length of time between two events (rain, flooding) of the same size or larger. Recurrence intervals are associated with a probability. (For example, a 25-year flood would have a 4% probability of happening in any given year.)
recruited large woody debris: A professional term assessing the amount or size of large trees in a riparian area that could potentially fall in (recruit) to the stream channel. Mechanisms for recruitment include small landslides, bank undercutting, wind throw during storms, individual trees dying of age or disease, and transport from upstream reaches.
redd: The salmonid gravel nest.
resident fish: Nonmigratory fish that remain in the same stream network their entire lives.
rilling (surface rilling): Erosion caused by water carrying off particles of surface soil.
riparian area(s): Areas bordering streams and rivers.
riparian zone(s): An administratively defined distance from the water’s edge that can include riparian plant communities and upland plant communities. Alternatively, an area surrounding a stream, in which ecosystem processes are within the influence of stream processes.
riparian vegetation: Vegetation growing on or near the banks of a stream or other body of water in soils that are wet during some portion of the growing season. Includes areas in and near wetlands, floodplains, and valley bottoms (from Meehan 1991).
salmonid: Fish of the family Salmonidae, including salmon, trout, char, whitefish, ciscoes, and grayling. Generally, the term refers mostly to salmon, trout, and char.
Oregon Watershed Assessment Manual Page 47 Watershed Fundamentals
sediments, fine and coarse: Fragments of rock, soil, and organic material transported and deposited into streambeds by wind, water, or gravity.
soil creep: When gravity moves the soil mantle downhill at rates too small to observe.
specific heat (of water): The amount of heat required to make a 1º change in water or air temperatures.
splash damming: Historical practice where a small dam was built across a stream to impound water and logs. The dam was then removed (usually with explosives) to release the impounded logs and water, causing scour downstream.
spring snowmelt: The time when the seasonal snowpack melts out.
stand-replacing fire: A fire of enough severity, at a local level, to kill all the mature trees.
stream cleaning: The removal of large wood or fine organic matter (i.e., branches, twigs, leaves, etc.) from stream channels. Historically, this practice was used to remove debris jams that were thought to block fish passage, or to remove fine organic matter that was thought to cause water quality problems such as reducing aquatic oxygen levels. Because stream cleaning was found to damage fish habitat, it is currently not a common practice. stream density (drainage density): Total length of natural stream channels in a given area, expressed as miles of stream channel per square mile of area.
substrate: Mineral or organic material that forms the bed of a stream.
surface runoff: Water that runs across the top of the land without infiltrating the soil.
transpiration: Loss of water to the atmosphere from living plants.
upland vegetation: Vegetation typical for a given region, growing on drier upland soils. The same plant species may grow in both riparian and upland zones.
wind throw (also blowdown): The uprooting and felling of trees by strong gusts of wind.