b1029 0013-4651/2011/158(8)/b1029/13/$28.00 v c the ... · glad catalyst nanorods, ... size,...
TRANSCRIPT

Oxygen Reduction Reaction Electrocatalytic Activity ofGlancing Angle Deposited Platinum Nanorod Arrays
Wisam J. Khudhayer,a,*,z Nancy N. Kariuki,b Xiaoping Wang,b Deborah J. Myers,b
Ali U. Shaikh,c and Tansel Karabacakd
aDepartment of Systems Engineering, cDepartment of Chemistry, and dDepartment of Applied Science,University of Arkansas at Little Rock, Little Rock, Arkansas 72204, USAbChemical Sciences and Engineering Division, Argonne National Laboratory, Argonne, Illinois 60439-4837, USA
The electrocatalytic oxygen reduction reaction (ORR) activity of vertically-aligned Pt nanorods has been evaluated utilizing cyclicvoltammetry (CV) and rotating-disk electrode (RDE) techniques in a 0.1 M HClO4 solution at temperatures ranging from 20 to60 �C. A glancing angle deposition (GLAD) technique was used to fabricate Pt nanorod arrays on glassy carbon (GC) electrodes.GLAD catalyst nanorods, without any carbon support, have been produced at different lengths varying between 50 and 400 nm,corresponding to 0.04–0.32 mg/cm2 Pt loadings, with diameter and spacing values ranging from about 5 up to 100 nm. The scan-ning electron microscopy (SEM), transmission electron microscopy (TEM), and X-ray diffraction (XRD) results reveal that Ptnanorods are well-isolated, vertically aligned, and single-crystal. Crystal orientation analysis demonstrates that large surface areaPt nanorod sidewalls are mainly dominated by Pt(110) planes, which is known to be the most active crystal plane of Pt for theORR. Compared to a commercial high-surface-area-supported Pt (Pt/C) catalyst, the CV results show that the Pt-nanorod electro-catalyst exhibits a more positive oxide reduction peak potential, indicating that GLAD Pt nanorods are less oxophilic. Moreover,the nanorods exhibit enhanced stability against loss of electrochemically-active surface area as a result of potential cycling inacidic electrolyte as compared to the Pt/C catalyst. Specific ORR activities determined by the RDE technique for GLAD Pt nano-rods of different lengths are analyzed and compared to literature values for polycrystalline Pt, nano-structured thin film Pt (3MNSTF Pt), and to those measured for Pt/C. RDE results reveal that Pt-nanorod electrocatalysts exhibit higher area-specific activity,higher electron-transfer rate constant, and comparable activation energy for ORR than those of Pt/C due to their larger crystallitesize, single-crystal property, and dominance of the preferred crystal orientations for ORR. However, Pt nanorods show lower massspecific activity than that of Pt/C electrocatalyst due to the large diameter of nanorods.VC 2011 The Electrochemical Society. [DOI: 10.1149/1.3599901] All rights reserved.
Manuscript submitted July 23, 2010; revised manuscript received April 29, 2011. Published June 22, 2011.
Fuel cells are attractive power sources for use in portable, sta-tionary, and transportation applications.1,2 Polymer electrolytemembrane (PEM) fuel cells, among the various types of fuel cells,are expected to be a high impact technology because they operate atrelatively low temperatures (�80�C), have high power density, canvary their output quickly to meet changes in power demand, and aresuited for automotive applications where quick startup is required.2–4
However, the high cost of Pt electrocatalysts is one of the major bar-riers to widespread implementation of fuel cell power sources in avariety of applications. The oxygen reduction reaction (ORR) at thecathode is the major contributor to single cell efficiency losses dueto the slow kinetics, unlike the anodic hydrogen oxidation reaction(HOR), necessitating high Pt loadings at the cathode to reduce theselosses. Typical anode and cathode electrocatalysts are comprised ofplatinum nanoparticles (3–5 nm in size) supported on carbon black.3
In addition to the high cost of the typical Pt electrocatalysts, the car-bon support causes additional challenges. These challenges includeoxidation of the carbon support resulting in loss of Pt nanoparticles,5
promotion of the formation of peroxide species by the carbon sup-port leading to degradation of the membrane polymer,6 and separa-tion of carbon from the ionomer in the electrode structure leading toloss of catalyst electrochemically-active surface area.5 Due to theseissues, extensive efforts are underway to develop high-performance,durable, carbon-free, and low cost (low Pt loading) electrocatalystmaterials.4
Carbon-free unsupported Pt nanoparticles (Pt-black) can avoidthe problems associated with carbon, however, the large particle sizeof Pt-black translates to high cathode Pt loadings required to achieveadequate electrochemically-active surface area (approximately 2 mgPt/cm2 compared to< 0.4 mg Pt/cm2 for carbon-supported Pt) andelectronic conductivity.3,4 In recent years, carbon-free catalyst elec-trode approaches have been proposed, such as coating of Pt films ofsub-micron thickness directly on the membrane, gas diffusion layer(GDL),7–13 columnar Ti and CrN supports,14,15 or on an organic
whisker support layer.16 Using these approaches, the carbon-relatedproblems mentioned above can be avoided and promising resultshave been demonstrated. With the exception of the organic whiskerapproach, however, the fuel cell performance of such continuous Ptfilm approaches7–13 generally falls below that of conventional fuelcells with higher loadings (typically �0.4 mg Pt/cm2) due to thecontinuous, non-porous, and polycrystalline structure of the Pt thinfilm.
Recently, 3M has demonstrated the improved durability andarea-specific activity of nano-structured thin film Pt (3M NSTF Pt)electrocatalyst layers consisting of large-grained polycrystalline Ptthin films deposited on and encapsulating oriented crystallinewhiskers of an organic pigment material.16 However, the polycrys-talline nature of Pt thin films has the important disadvantages ofbeing prone to oxidation at the grain boundaries17 and comprised ofa mixture of low index planes with varying ORR activities. The(111) plane is the energetically-favorable growth plane of Pt films.Single-crystal data of Markovic et al.18 show that the ORR activityin perchloric acid electrolyte for different crystal planes of platinumfollows the trend Pt(110)> Pt(111)> Pt(100), with relative ORRactivities of approximately 1.5, 1.2, and 0.6 as compared to poly-crystalline Pt.19 In sulfuric acid electrolyte, the activity trend wasfound to be Pt(110)> Pt(100) >> Pt(111)17. Kadiri et al.,20 employ-ing the same method, found that the ORR in perchloric acid (a non-adsorbing anion) is relatively insensitive to the Pt surface structure,but is structure-sensitive in solutions containing adsorbing anionslike bisulfate, phosphate, or chloride, which impede the reaction.Recently, Subbaraman et al.21,22 have shown that the sulfonate ionof the perfluorosulfonic acid fuel cell electrolyte (e.g., Nafion) can-not be considered non-adsorbing and that the sensitivity of the crys-tal face to deactivation of ORR by adsorbed sulfonate is the same asthat of the [bi]sulfate anion. In the presence of perfluorosulfonicacid ionomer in the fuel cell electrode, it is therefore beneficial todecrease the ORR inhibiting effect of adsorbed sulfonate by maxi-mizing the fraction of exposed crystal faces with weak sulfonateadsorption (e.g., (110)). In another study, Chen et al.23 reported thatenhanced ORR electrocatalytic activity of Pt nanotubes in 0.5 M
* Electrochemical Society Student Member.z E-mail: [email protected]
Journal of The Electrochemical Society, 158 (8) B1029-B1041 (2011)0013-4651/2011/158(8)/B1029/13/$28.00VC The Electrochemical Society
B1029
Downloaded 29 Jun 2011 to 144.167.57.133. Redistribution subject to ECS license or copyright; see http://www.ecsdl.org/terms_use.jsp

H2SO4 might be attributed to preferential exposure of certain crystalfacets of nanotubes. Therefore, controlling the electrode roughnessfactor (electrochemically-active surface area/geometric surfacearea), promoting a single-crystal property, and controlling the crys-tal orientation by promoting the Pt[110] orientation over the Pt[111]orientation may further enhance the electrochemical activity ofPEM fuel cell cathodes.
The aim of this study is to investigate the morphology, crystalproperty, electrochemical activity, and ORR kinetics of vertically-aligned Pt nanorod arrays fabricated by the glancing angle deposi-tion (GLAD) technique. The GLAD technique provides the novelcapability of growing 3D nanostructure arrays with interestingmaterial properties.24–31 It offers a simple, single-step, cost- andtime-efficient method for fabricating nano-structured arrays of vari-ous elemental materials as well as alloys and oxides. The GLADtechnique uses the “shadowing effect,” which is a “physical self-assembly” process through which obliquely incident atoms/moleculescan only deposit on the tops of higher surface points, such as thetips of a nano-structured array or the highest points of a rough orpatterned substrate. Recently, Gasda et al.32 compared the fuel cellperformance of conventional polycrystalline Pt thin films and Ptparticles produced by GLAD and demonstrated that the particle-electrodes exhibit a higher mass activity than continuous-layer filmand conventional Teflon-bonded Pt-black (TBPBE) electrodes athigh current densities. The results of Gasda et al. suggest that theGLAD technique combines the advantages of thin film electrodeswith the ability to fabricate porous electrodes allowing efficientreactant flow especially for high-current density operations.
Scanning electron microscopy (SEM), transmission electron mi-croscopy (TEM), h–2h scan and pole-figure X-ray diffraction(XRD) have been utilized to study the morphology and crystallo-graphic structure of the Pt nanorods. Cyclic voltammetry (CV) androtating-disk electrode experiments (RDE) were performed at roomtemperature to characterize the ORR activity and activity stabilityof the Pt nanorods and of the conventional Pt/C PEM fuel cell cath-ode electrocatalyst for comparison. Finally, the temperature depend-ence of the ORR kinetics was studied at temperatures between 20and 60�C to calculate the apparent rate constant and the activationenergy for ORR.
Experimental
Fabrication and material characterization of Pt nanorods—Weemployed a DC magnetron sputter GLAD technique (Excel Instru-
ments, India) to fabricate vertically-aligned Pt nanorods. A growthtime of 8, 30, and 60 min resulted in 50, 200, and 400 nm long nano-rod arrays. The schematic of the GLAD experimental setup is shownin Fig. 1. Pt nanorods were deposited at a glancing angle of 85�(with respect to substrate normal) on glassy carbon disk inserts (5mm OD� 4 mm thick, Pine Instrument), using a 99.99% pure Ptcathode (diameter about 2.54 cm). The substrate (glassy carbon diskinsert), located at a distance of about 12 cm from the cathode, wasmounted on a sample holder which was attached to a stepper motorand rotated at a speed of 2 rpm around the substrate normal axis.The depositions were performed under a base pressure of 2.4� 10�6
Torr that was achieved using a turbo-molecular pump backed by amechanical pump. During Pt deposition, the sputter power was150 W with an ultrapure Ar working gas pressure of 2.4 mTorr. ThePt nanorod deposition rate (i.e., nanorod length per growth time)was approximately 7.5 nm/min as measured by the analysis ofcross-sectional SEM images and confirmed by quartz crystal micro-balance measurements (QCM, Inficon Q-pod QCM monitor, crystal:6 MHz gold coated standard quartz). For the QCM measurements,the Pt nanorods were deposited directly on quartz crystals and theloading values were determined by comparing the oscillation fre-quencies of the blank and the coated crystal.33
The surface morphology of Pt nanorods was investigated usingSEM analysis (FESEM-6330F, JEOL Ltd, Tokyo, Japan). The Crys-tallographic structure of the nanorods was determined using TEManalysis (JEOL JEM 2100F, Ltd, Tokyo, Japan), h–2h XRD (BrukerD8 discover), and pole-figure XRD. For SEM and XRD analysis, Ptnanorods were deposited on Si(100) wafer pieces which weremounted on the substrate holder in the same Pt deposition experi-ments carried out on the glassy carbon samples. For TEM analysis,Pt nanorods deposited on silicon substrates were scraped off ontoholey carbon grids. The h–2h XRD scan method is a versatile tech-nique for the study of crystal orientations perpendicular to thesubstrate plane (i.e., orientation of crystal planes parallel to the sub-strate surface or, in other words, “texture”) of thin films and nano-structured coatings. On the other hand, XRD pole-figure analysisprovides information on the angular dependence of a specific crystalorientation over angles ranging from 0� (perpendicular to the sub-strate plane) to about 90� (parallel to the substrate plane). In ourstudy, XRD pole-figures of Pt(100), Pt(110), and Pt(111) were per-formed using a step size of the azimuth angle D/¼ 3� (/¼ 0–360�)and 1� for the range of v values of 0–50� and 60–90�, respectively,with a step size of 10�. For example, a pole-figure peak observed atv¼ 0� corresponds to a crystal plane oriented perpendicular to the
Figure 1. (Color online) Schematic of theglancing angle deposition (GLAD) tech-nique used for the fabrication of nanorodarrays.
Journal of The Electrochemical Society, 158 (8) B1029-B1041 (2011)B1030
Downloaded 29 Jun 2011 to 144.167.57.133. Redistribution subject to ECS license or copyright; see http://www.ecsdl.org/terms_use.jsp
substrate (i.e., along the nanorod axis), while pole-figure peaks or aring-shaped intensity pattern located at v� 90� indicates the exis-tence of crystal orientations parallel to the substrate plane (i.e., crys-tal planes on the sidewalls of nanorods).
Electrode preparation and electrochemical characterization—Eelectrochemical measurements (CV and RDE) were performed atdifferent temperatures to characterize the ORR activity and kineticsof the Pt nanorod and Pt/C catalysts using a three-electrode cell anda potentiostat (Pine Instrument, CH Instruments bipotentiostat). Themeasurement setup was a typical three-electrode system, consistingof a working electrode (Pt nanorods or Pt/C on glassy carbon), a Ptwire counter electrode located in a separate fritted compartment,and a mercury/mercurous sulfate (Hg/Hg2SO4) reference electrodewith a filling solution of 0.5 M H2SO4. The measured potential ofthis reference electrode versus the reversible hydrogen electrode(RHE) was used to convert all potentials, given in the remainder ofthe paper, to the RHE scale. The electrolyte was deaerated or oxy-gen (O2)-saturated 0.1 M HClO4 (GFS Chemical, Inc., veritas dou-ble-distilled in >18 MX-cm�1 Millipore water). Both the argon (Ar,for deaeration) and O2 gases used were ultrahigh purity (99.999%Ar, 99.99% O2, Linde). An interchangeable, removable glassy car-bon disk (5 mm OD� 4 mm thick) of a ring-disk electrode (RDE,6.5 mm ID, 7.5 mm OD, Pine Instruments) was used as a substratefor preparing the Pt nanorod electrodes. This interchangeable elec-trode allowed us to use the same ring assembly with different diskinserts. The geometric area of the glassy carbon disk working elec-trode was �0.196 cm2. After sealing in the ring-disk housing andimmersion in the electrolyte, the glassy carbon/Pt nanorod workingelectrodes were scanned from 0.05 to 1.05 V at a scan rate of 10mV/s. The samples were also scanned numerous times in the 0.6 to1.0 V range at 50 mV/s to establish the stability of the Pt-nanorodsamples in the acidic environment. RDE measurements were per-formed at room temperature in an oxygen-saturated 0.1 M HClO4
solution at scan rates of 10, 20, and 50 mV/s at rotation rates of1600, 2025, and 2500 rpm, and at elevated temperatures at 20 mV/sand a rotation rate of 1600 rpm.
The conventional carbon-supported Pt nanoparticle electrode(Pt/C 20 wt % Pt on carbon-black, Clean Fuel Cell Energy, LLC)was prepared as described by Gasteiger et al.4 and Garsany et al.34
Briefly, a stock solution of 20% isopropanol and 0.02% Nafion ion-omer was prepared by mixing 20 ml of isopropanol with 79.6 ml ofDI water, and 0.4 ml of 5% Nafion ionomer solution (Clean FuelCell Energy, LLC). Ten milligrams of the Pt/C catalyst was mixedwith 5 ml of the stock isopropanol/Nafion solution using an ultraso-nicator. A 10 �L droplet of the well-dispersed catalyst ink waspipetted onto the clean, polished glassy carbon rotating disk elec-trode, leading to a Pt loading of 20 �g Pt/cm2. In order to get smoothand crack-free films covering the entire surface of glassy carbonelectrode, solvent evaporation was slowed by covering the catalystink-coated electrode with a beaker. The Nafion film thickness basedon the loading on the glassy carbon electrode was estimated to beless than 0.1 �m, which is in the range where diffusion effectswithin the thin film are considered to be negligible.35 After prepara-tion, the electrodes were immersed in deaerated 0.1 M HClO4 underpotential control of 0.5 V. The potential was then cycled between 0and 1.0 V in order to produce an electrochemically-clean electrodesurface.
Results and Discussion
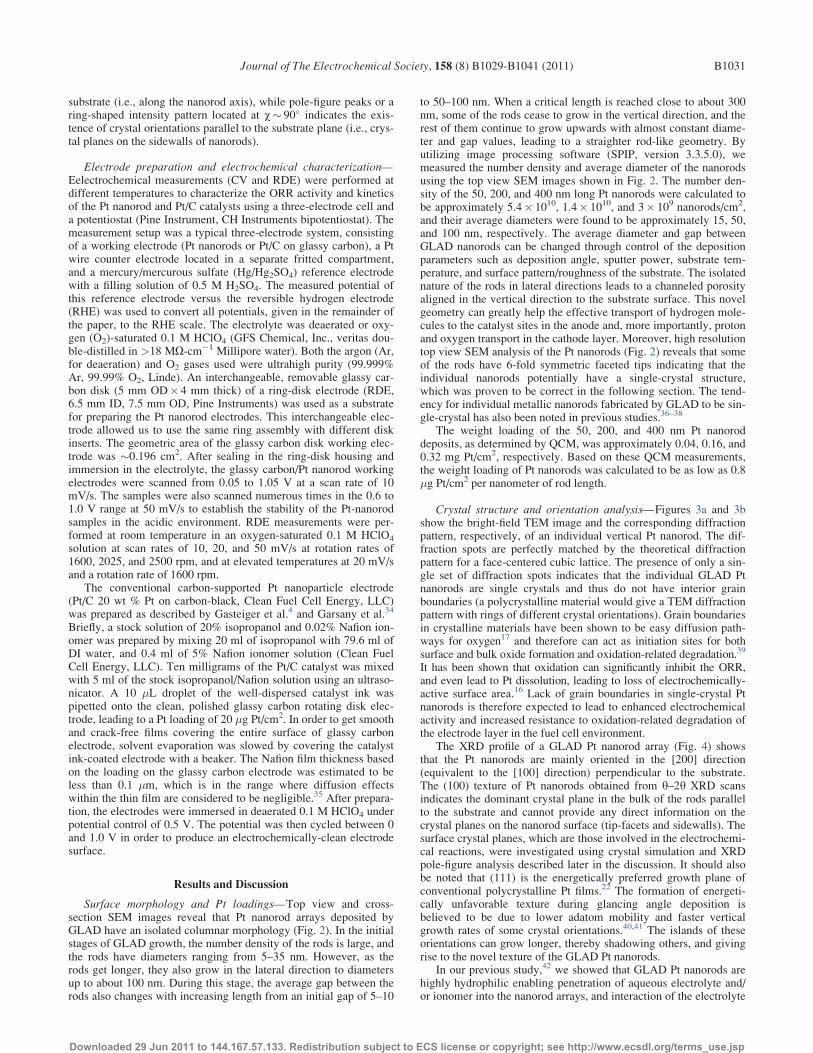
Surface morphology and Pt loadings—Top view and cross-section SEM images reveal that Pt nanorod arrays deposited byGLAD have an isolated columnar morphology (Fig. 2). In the initialstages of GLAD growth, the number density of the rods is large, andthe rods have diameters ranging from 5–35 nm. However, as therods get longer, they also grow in the lateral direction to diametersup to about 100 nm. During this stage, the average gap between therods also changes with increasing length from an initial gap of 5–10
to 50–100 nm. When a critical length is reached close to about 300nm, some of the rods cease to grow in the vertical direction, and therest of them continue to grow upwards with almost constant diame-ter and gap values, leading to a straighter rod-like geometry. Byutilizing image processing software (SPIP, version 3.3.5.0), wemeasured the number density and average diameter of the nanorodsusing the top view SEM images shown in Fig. 2. The number den-sity of the 50, 200, and 400 nm long Pt nanorods were calculated tobe approximately 5.4� 1010, 1.4� 1010, and 3� 109 nanorods/cm2,and their average diameters were found to be approximately 15, 50,and 100 nm, respectively. The average diameter and gap betweenGLAD nanorods can be changed through control of the depositionparameters such as deposition angle, sputter power, substrate tem-perature, and surface pattern/roughness of the substrate. The isolatednature of the rods in lateral directions leads to a channeled porosityaligned in the vertical direction to the substrate surface. This novelgeometry can greatly help the effective transport of hydrogen mole-cules to the catalyst sites in the anode and, more importantly, protonand oxygen transport in the cathode layer. Moreover, high resolutiontop view SEM analysis of the Pt nanorods (Fig. 2) reveals that someof the rods have 6-fold symmetric faceted tips indicating that theindividual nanorods potentially have a single-crystal structure,which was proven to be correct in the following section. The tend-ency for individual metallic nanorods fabricated by GLAD to be sin-gle-crystal has also been noted in previous studies.36–38
The weight loading of the 50, 200, and 400 nm Pt nanoroddeposits, as determined by QCM, was approximately 0.04, 0.16, and0.32 mg Pt/cm2, respectively. Based on these QCM measurements,the weight loading of Pt nanorods was calculated to be as low as 0.8�g Pt/cm2 per nanometer of rod length.
Crystal structure and orientation analysis—Figures 3a and 3bshow the bright-field TEM image and the corresponding diffractionpattern, respectively, of an individual vertical Pt nanorod. The dif-fraction spots are perfectly matched by the theoretical diffractionpattern for a face-centered cubic lattice. The presence of only a sin-gle set of diffraction spots indicates that the individual GLAD Ptnanorods are single crystals and thus do not have interior grainboundaries (a polycrystalline material would give a TEM diffractionpattern with rings of different crystal orientations). Grain boundariesin crystalline materials have been shown to be easy diffusion path-ways for oxygen17 and therefore can act as initiation sites for bothsurface and bulk oxide formation and oxidation-related degradation.39
It has been shown that oxidation can significantly inhibit the ORR,and even lead to Pt dissolution, leading to loss of electrochemically-active surface area.16 Lack of grain boundaries in single-crystal Ptnanorods is therefore expected to lead to enhanced electrochemicalactivity and increased resistance to oxidation-related degradation ofthe electrode layer in the fuel cell environment.
The XRD profile of a GLAD Pt nanorod array (Fig. 4) showsthat the Pt nanorods are mainly oriented in the [200] direction(equivalent to the [100] direction) perpendicular to the substrate.The (100) texture of Pt nanorods obtained from h–2h XRD scansindicates the dominant crystal plane in the bulk of the rods parallelto the substrate and cannot provide any direct information on thecrystal planes on the nanorod surface (tip-facets and sidewalls). Thesurface crystal planes, which are those involved in the electrochemi-cal reactions, were investigated using crystal simulation and XRDpole-figure analysis described later in the discussion. It should alsobe noted that (111) is the energetically preferred growth plane ofconventional polycrystalline Pt films.22 The formation of energeti-cally unfavorable texture during glancing angle deposition isbelieved to be due to lower adatom mobility and faster verticalgrowth rates of some crystal orientations.40,41 The islands of theseorientations can grow longer, thereby shadowing others, and givingrise to the novel texture of the GLAD Pt nanorods.
In our previous study,42 we showed that GLAD Pt nanorods arehighly hydrophilic enabling penetration of aqueous electrolyte and/or ionomer into the nanorod arrays, and interaction of the electrolyte
Journal of The Electrochemical Society, 158 (8) B1029-B1041 (2011) B1031
Downloaded 29 Jun 2011 to 144.167.57.133. Redistribution subject to ECS license or copyright; see http://www.ecsdl.org/terms_use.jsp
with not only the tips, but also with the high-surface-area nanorodside walls as well. Therefore, we have investigated the possiblecrystal orientations of the Pt nanorod tip facets and side walls bycalculating the angles between the different planes of the Pt nano-rods utilizing Crystal-Maker software (CrystalMaker SoftwareLtd.). Pt has a face-centered cubic (fcc) crystal structure and hasseveral equivalent crystal planes due to the symmetry of the fcc lat-tice. For example, the (100), (010), and (001) planes of Pt are allidentical, and in the following sections we will call them (100)-typeplanes (one can also use the notation {100} to represent the familyof (100) planes). Similarly, (110), (101), and (011) planes of Pt havethe same atomic configuration and we will call them (110)-typeplanes. Individual single-crystal GLAD Pt nanorods are mainly ori-ented with the [100] direction perpendicular to the substrate plane(Fig. 4) and it is possible for (100) planes to make angles of 90, 90,55, 45, 45, and 90� with the crystal planes (001), (010), (111), (110),(101), and (011), respectively (Note: This method of crystal orienta-tion calculation cannot be used for a polycrystalline material due tothe randomly oriented nature of crystal grains). This implies that thenanorod sidewalls are most likely oriented in the [001] and [010]
directions, which are identical to [100] orientation. The (011) plane,which is a (110)-type plane, also makes a 90� angle with the (100)plane. Hence, the side walls of Pt nanorods are expected to have(100) and (110)-type crystal planes, as shown in Fig. 5. For the fac-ets observed at the tips of the nanorods (Fig. 2), the tilt angle a ofthe facets, measured from the line parallel to the nanorod axis utiliz-ing cross-sectional SEM images, was found to range from 54 to 45�,indicating that the facets seen on the tips are likely to be oriented inthe [111], [110], and [101] directions (Fig. 5). Therefore, the facetsof the tips of the nanorods are expected to have (111) and (110)-type planes.
The theoretical calculation above has been confirmed by XRDpole-figure measurements on Pt nanorods, as shown in Fig. 6. Pole-figure results indicate that the sidewalls of the nanorods, whichdominate the overall surface area of the rods, mainly involve (110)planes (Fig. 6c) as they are seen to form a strong ring pattern locatedat approximately 80� from the surface normal. A weak and incom-plete ring, at about 80�, has also been observed for the (100) planesat the sidewalls of the nanorods (Fig. 6b). This indicates that someof the sidewalls are oriented along [100] directions, consistent with
Figure 2. Top and cross-section scanningelectron microscopy (SEM) views ofGLAD Pt nanorod arrays grown at lengthsof (a) 50, (b) 200, and (c) 400 nm.
Journal of The Electrochemical Society, 158 (8) B1029-B1041 (2011)B1032
Downloaded 29 Jun 2011 to 144.167.57.133. Redistribution subject to ECS license or copyright; see http://www.ecsdl.org/terms_use.jsp

the theoretical predictions explained above (Fig. 5). From Figs. 6a,6b, and 6c, it can be clearly seen that the facets of the nanorod tipshave [111], [100], and [110] orientations as they form rings at about58, 55, and 44�, respectively. These pole-figure results are also con-sistent with the simulation results (Fig. 5) with the exception of the
presence of the (100) plane at the tips of the nanorods. This mightbe attributed to the presence of some nanorods which are oriented inthe [110] direction perpendicular to the substrate (i.e., weak Pt(220)peaks observed in XRD results shown in Fig. 4), thus having [100]planes at the tips of these nanorods. Therefore, especially for longnanorods (i.e., length> tip diameter), the nanorods are expected tohave a large fraction of Pt(110) planes because these are the domi-nant planes at the high-surface-area nanorod sidewalls. We believethat the dominant exposed crystal plane of the nanorods is Pt(110),the plane that is the most active for the ORR.18–22
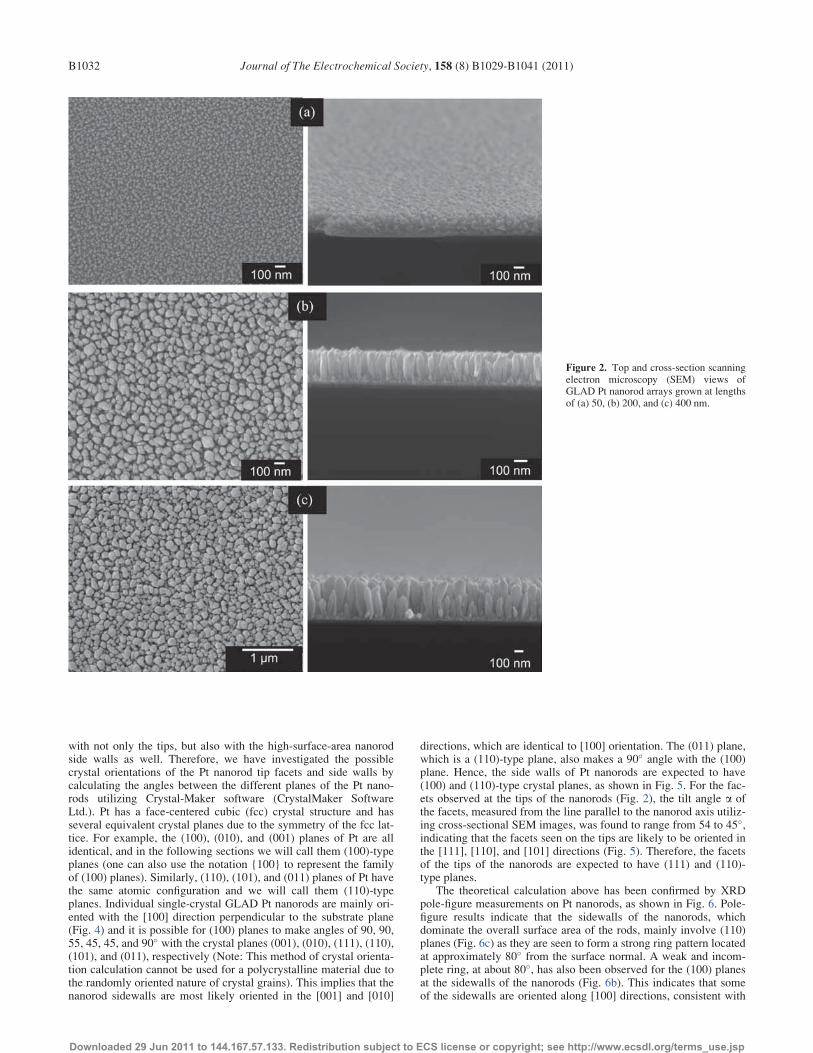
Electrochemical characterization—Electrochemical active sur-face area measurements and surface area stability—CV and RDEmeasurements were performed on 50, 200, and 400 nm long Ptnanorods which correspond to Pt loadings of 0.04, 0.16, and 0.32mg/cm2, respectively. For comparison, these measurements werealso performed on Pt/C with a Pt loading 0.02 mg/cm2. During CVmeasurements, the GLAD Pt nanorod array electrodes were scannedbetween 0 and 1.0 V in O2-free 0.1 M HClO4 at a scan rate of 10mV/s. As shown in the CVs for the Pt nanorods in O2-free electro-lyte (Figs. 7a and 7b), the Pt nanorods have an oxide reduction peakpotential of 0.83 V. This potential is 50 mV more positive than theoxide reduction peak observed for Pt/C (Fig. 7b) indicating that theGLAD Pt nanorods are less oxophilic than Pt/C.43 As shown inFig. 7b, the peak potential for oxide reduction is nearly identical tothat of polycrystalline Pt.
The electrochemically-active surface area (ECSA) of a high sur-face area catalyst is a critical parameter for defining the Pt loadingsnecessary in the fuel cell application. The ECSAs of the Pt/C andGLAD Pt nanorods were estimated using the charge for hydrogenadsorption derived from the room temperature CVs. These wereobtained by integrating the charge between the double layer regionand the onset of hydrogen evolution, after subtracting the doublelayer charging current, and using the following equation to convertthis charge to ECSAs44)
ECSAðcm2Pt=gPtÞ ¼ Chargeð�C=cm2Þ210ð�C=cm2ÞPtLoadingðgPt=cm2Þ [1]
The results show that the ECSAs of 50, 200, and 400 nm long Ptnanorods and of Pt/C with Pt loadings of 0.04, 0.16, 0.32 and 0.02mg/cm2 are 13, 12, 6.7, and 60 m2/g Pt, respectively. The ECSAvalue of Pt/C electrocatalyst is in good agreement with values
Figure 3. (a) Bright-field transmssion electron microscopy (TEM) image ofan individual Pt nanorod and (b) the correspoding selective area electron dif-fraction (SAED) pattern. Scale bar shown is 50 nm. The single set of diffrac-tion spots in the SAED pattern in (b) shows that the individual Pt nanorodhas a single crystal structure.
Figure 4. X-ray diffraction (XRD) profiles of 50, 200, and 400 nm longGLAD Pt nanorod arrays. Data is offset for clarity.
Figure 5. Top-view of a single crystal Pt nanorod oriented in the Pt[100]direction (with respect to surface normal along the x-direction out of thepage) showing the simulated results of possible crystal orientations at itssidewalls and at the facets of the nanorod tip.
Journal of The Electrochemical Society, 158 (8) B1029-B1041 (2011) B1033
Downloaded 29 Jun 2011 to 144.167.57.133. Redistribution subject to ECS license or copyright; see http://www.ecsdl.org/terms_use.jsp

reported in the literature.4 The decreasing ECSA with increasingnanorod length may be attributed to the increase in nanorod diame-ter concurrent with the increase in length. Larger diameter decreasesthe surface area to volume ratio of the rods. In addition, incompletewetting of the nanorods with increasing nanorod length can furtherreduce the measured ECSA. Based on previously reported BETmeasurements on GLAD carbon nanorods,45 Pt nanorods of 500 nmlength are expected to have an effective surface area enhancementfactor (SAEF, ratio of real surface area to substrate geometric area)of 40. Due to the similar number density and diameters of 400 and500 nm long nanorods, the estimated SAEF of 400 nm Pt nanorodsis calculated to be approximately 32 (40� 400 nm/500 nm). How-ever, as can be seen from the SEM images shown in Fig. 2, Pt nano-rods that are shorter than about 300 nm do not have uniform heightsdue to the competitive growth mechanism during the initial stagesof deposition. This causes a change of number density as a functionof nanorod length as the growth progresses until they reach a satura-
tion thickness at about 300 nm. At these initial stages, the diametersof nanorods also increase with their length. Therefore, below 300nm, the total surface area of the Pt nanorods is not expected to line-arly depend on their length. However, we can assume that the sur-face area of the nanorods is dominated by the sidewall area, whichis proportional to the nanorod length, diameter, and number density.By comparing the length, average diameter, and number density of200 and 400 nm long rods, we estimated the SAEF of 200 nm Ptnanorods as �25 [¼ 32� (200/400)� (50/100)� (14� 109/3� 109)]. Similarly, by comparing 50 and 200 nm long rods, we cal-culated the SAEF of the 50 nm Pt nanorods to be �7 [¼ 25� (50/200)� (15/50)� (54� 109/14� 109)]. Dividing these the SAEFs bythe measured Pt loading values, the effective surface areas for the50, 200, and 400 nm long Pt nanorods were calculated to be approx-imately 17, 15, and 10 m2/g Pt, respectively. Based on our electro-chemical measurements the 50, 200, and 400 nm long Pt nanorodshave ECSAs of 13, 12, and 6.7 m2/g Pt, respectively. Thus, the
Figure 6. (Color online) XRD pole-figureresults for the Pt(111), Pt(100), andPt(110) planes for glancing angle depos-ited (GLAD) Pt nanorods. The Pt(110)plane are mainly oriented at about 80�from the surface normal, which corre-sponds to the nanorod sidewalls.
Journal of The Electrochemical Society, 158 (8) B1029-B1041 (2011)B1034
Downloaded 29 Jun 2011 to 144.167.57.133. Redistribution subject to ECS license or copyright; see http://www.ecsdl.org/terms_use.jsp

utilization factor of 50, 200, and 400 nm long Pt nanorods were esti-mated to be approximately 76% (13/17� 100), 80% (12/15� 100)and 67% (6.7/10� 100), respectively. Higher utilization of shorternanorods is believed to be due to the more complete wetting of thenanorod sidewalls by the electrolyte solution.
The 50, 200, and 400 nm long Pt nanorods samples were scannedmultiple times in the 0.6 to 1.0 V potential range at a scan rate of 50mV/s to establish their stability in an acidic environment. Figure 8shows a series of CVs, taken at room temperature, from 50, 200,and 400 nm Pt nanorods over 250 and 4500 cycles. For comparison,the results for the Pt/C are shown in Fig. 9a. ECSA analysis showsthat only 60% of the initial ECSA of the Pt/C sample remained after1000 potential cycles, while after 4500 cycles the 50, 200, and 400nm Pt nanorods retained 59, 63, and 82% of their initial ECSAs,respectively (Fig. 8). These results indicate that the Pt nanorods aremore stable than Pt/C with potential cycling over a potential regionand in an acidic environment relevant to the PEM fuel cell cathodeenvironment. A shift in the final Pt/C oxide formation and reductionpeak potentials (Fig.9a) toward those of the Pt nanorods may beattributed to a decrease in Pt oxophilicity due to an increase in Pt/C
platinum particles sizes with cycling caused by ripening processes,as recently summarized by Shao-Horn et al.46 This behavior hasbeen also been observed by Debe et al.16
ORR kinetic analysis—The RDE CV traces taken at a rotation rateof 1600 rpm were used to evaluate and compare the ORR kineticcurrent densities of the Pt nanorod and Pt/C catalysts. Figures 9band 10a show the ORR current densities, as a function of potential,obtained from RDE tests in oxygen-saturated 0.1 M HClO4 at 20
�Cand 1600 rpm, using Pt/C (20 wt % Pt) catalyst at a Pt loading of0.02 mg/cm2, and 50, 200, and 400 nm long Pt nanorods with Ptloadings of 0.04–0.32 mg/cm2. The scan rates were 10 and 20 mV/sfor Pt nanorods and Pt/C catalysts, respectively. The effects ofpseudo-capacitive currents on the calculated ORR activities wereeliminated by subtracting the background currents in CVs taken inargon-purged electrolyte from the currents in CVs taken in oxygen-saturated electrolyte. As shown in Figs. 9b and 10a, both Pt/C andthe Pt nanorods exhibit the typical mixed kinetic-diffusion con-trolled region from approximately 0.75 to 1.00 V and diffusion-lim-ited current region from 0.2 to 0.7 V. The diffusion-limited currentdensities normalized to geometric surface area are well-defined,similar for the Pt nanorod catalyst and for the Pt/C, and are within10% of the theoretical diffusion limiting current expected for a rota-tion rate of 1600 rpm and room temperature (5.7 mA/cm2).4,47,48
This agreement clearly indicates adequate coverage of the glassycarbon electrodes by the Pt/C film and by the nanorods and minimaleffects of oxygen diffusion within the electrode films.4,7,47 Slightdifferences in diffusion-limiting current were observed for the 50,200, and 400 nm nanorod samples; these differences will be dis-cussed later. The slight decrease in the limiting current of Pt/C atpotentials less than 0.20 V (Fig. 9b), in the region of hydrogenadsorption, indicates the formation of H2O2 and a change in theORR pathway from a four- to a two-electron mechanism.18 Thischange in the mechanism is less pronounced in the case of Pt nano-rods (i.e., hydrogen peroxide production rate on Pt nanorods islower than that of Pt/C) as can be seen in Fig. 10a, indicating thatthe contribution from the two-electron process at <0.2 V is lowerfor the nanorods. This observation is similar to what was seen forsingle-crystal Pt(110) electrodes.18
The electrocatalytic activities of Pt nanorods for the ORR wereextracted from the background-corrected RDE CVs using the well-known mass-transport correction for RDE measurements4,47,48
ik ¼ ðilim � iÞðilim � iÞ [2]
where i is the measured current at a specified potential, ilim is themeasured limiting current, and ik is the kinetic current. The assump-tions for extracting ik from the RDE data using Eq. (2) are validover the current range of 0.1 ilim< i< 0.8 ilim.
47 Specific activitiescan be determined by calculation of ik using Eq. (2) and normaliza-tion to measured Pt ECSA and Pt loading. The area-specific activityprovides a measure of the electrocatalytic activity of Pt atoms at thesurface, thus, it is specifically meaningful for structure-sensitivereactions. The mass-specific activity has practical implications forfuel cells in that it can be used to calculate catalyst cost per unitpower output. The ORR area-specific activities and mass-specificactivities for the Pt nanorod and Pt/C catalysts are shown inFigs. 10b-d. Equation (2) has been shown to provide accurateassessment of the electrocatalytic activity of catalysts in thin filmRDE electrodes for film thicknesses of <0.1 �m.4,7 Mass transportwithin the electrode structure can have a significant influence on thethin film RDE data for thicker films.7
To verify the assumption of negligible effects of mass transportof oxygen within the nanorod electrodes, an analysis of the rotationrate dependence of the RDE ORR data for the thickest electrodecomprised of the 400 nm Pt nanorods was performed. Figure 11ashows the RDE profiles of 400 nm long Pt nanorods at differentrotation speeds of 1600, 2025, and 2500 rpm in oxygen-saturated
Figure 7. (Color online) (a) Room temperature CVs in O2-free 0.1 MHClO4 at a scan rate 10 mV/s of 50, 200, and 400 nm long Pt nanorods,which correspond to Pt loadings of 0.04, 0.16, and 0.32 mg/cm2, respec-tively, and (b) Comparison of CVs of Poly-Pt, Pt/C, and 200 nm long Ptnanorods in O2-free 0.1 M HClO4 at a scan rate 10 mV/s. Data in (b) werenormalized to measured Pt ECSA.
Journal of The Electrochemical Society, 158 (8) B1029-B1041 (2011) B1035
Downloaded 29 Jun 2011 to 144.167.57.133. Redistribution subject to ECS license or copyright; see http://www.ecsdl.org/terms_use.jsp
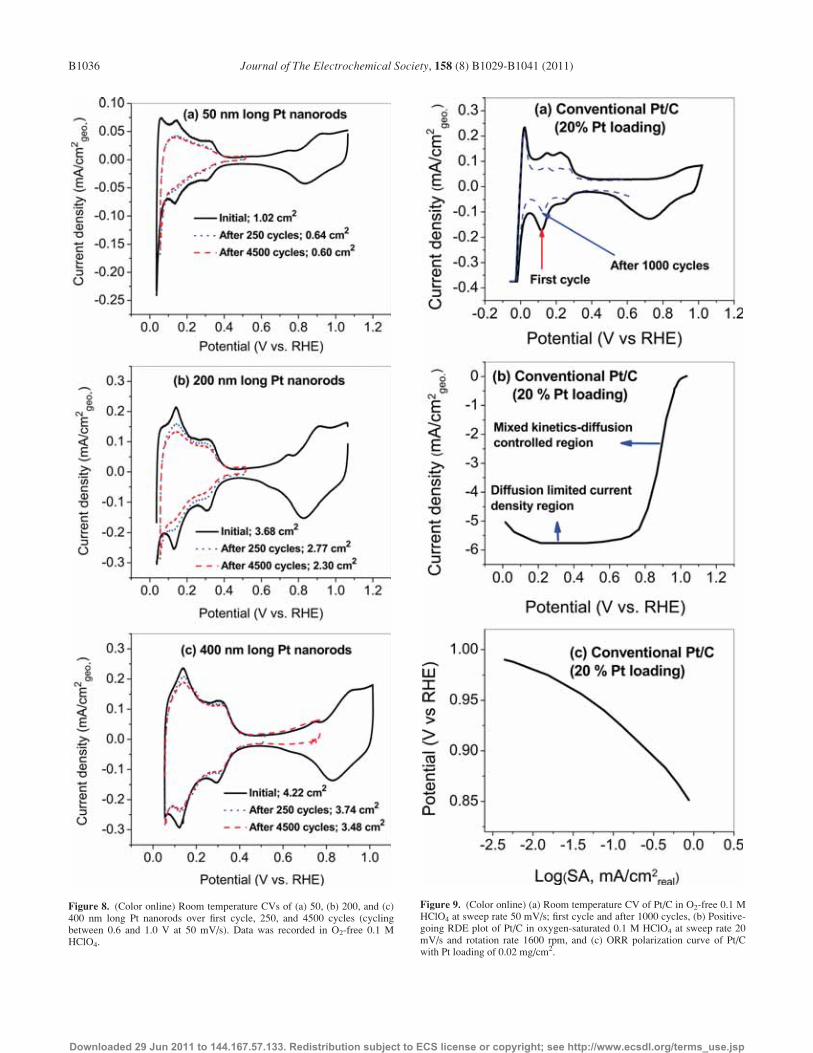
Figure 9. (Color online) (a) Room temperature CV of Pt/C in O2-free 0.1 MHClO4 at sweep rate 50 mV/s; first cycle and after 1000 cycles, (b) Positive-going RDE plot of Pt/C in oxygen-saturated 0.1 M HClO4 at sweep rate 20mV/s and rotation rate 1600 rpm, and (c) ORR polarization curve of Pt/Cwith Pt loading of 0.02 mg/cm2.
Figure 8. (Color online) Room temperature CVs of (a) 50, (b) 200, and (c)400 nm long Pt nanorods over first cycle, 250, and 4500 cycles (cyclingbetween 0.6 and 1.0 V at 50 mV/s). Data was recorded in O2-free 0.1 MHClO4.
Journal of The Electrochemical Society, 158 (8) B1029-B1041 (2011)B1036
Downloaded 29 Jun 2011 to 144.167.57.133. Redistribution subject to ECS license or copyright; see http://www.ecsdl.org/terms_use.jsp

Figure 10. (Color online) (a) Room temperature CVs of 50, 200, 400 nm long Pt nanorods in oxygen-saturated 0.1 M HClO4 at a scan rate of 10 mV/s and rota-tion speed of 1600 rpm, (b,c) Calculated ORR area- and mass-specific activities as a function of potential on 50, 200, and 400 nm long Pt nanorods, (d) depend-ence of area- and mass-specific activities on the ECSA of Pt nanorods of different lengths (different Pt loadings), and comparison of the ORR specific activityfrom polycrystalline Pt, Pt/C, NSTF Pt (3M), and Pt nanorods of different lengths. Data are plotted for the positive-going sweep. The data for polycrystalline Ptand NSTF Pt (3M) catalysts were taken from Mayrhofer et al.47 Based on the current range (0.1 ilim< i< 0.8 ilim) used for extracting kinetic currents, (b) and (c)were restricted to potential ranges of 0.81–0.96, 0.89–0.98, and 0.90–1.00 V for 50, 200, and 400 nm Pt nanorods, respectively.
Journal of The Electrochemical Society, 158 (8) B1029-B1041 (2011) B1037
Downloaded 29 Jun 2011 to 144.167.57.133. Redistribution subject to ECS license or copyright; see http://www.ecsdl.org/terms_use.jsp
0.1 M HClO4 at a scan rate of 10 mV/s. Equation 2 can be expandedto take into account the effects of diffusion within a film electrode49
1
i¼ 1
ikþ 1
ifþ 1
id¼ 1
ikþ 1
ifþ 1
Kx12
[3]
where if represents the film-diffusion-limited current or current den-sity controlled by reactant diffusion within the electrode film, K is aconstant dependent on oxygen concentration and diffusion coeffi-cient of oxygen in the electrolyte and on its kinematic viscosity, x isthe angular rotation velocity of the RDE, and the other terms havethe same meaning as in Eq. (2). A Koutecky-Levich plot,50 (1/i) vs.1/x1/2, for a fixed potential should show a linear relationship with aslope of 1/K and a y-intercept of 1/ik þ 1/if. The Koutecky-Levichplots for the 400 nm Pt nanorod RDE ORR data at rotation rates of1600, 2025, and 2500 rpm are shown in Fig. 11b for the diffusion-limited current (current at 0.4 V) and for the currents at 0.90 and0.95 V. These plots are linear and parallel, as expected. To deter-mine if film diffusion is affecting the kinetic currents obtained fromRDE measurements and to correct for its effect, the y-intercept ofthe Koutecky-Levich plot for i¼ id is subtracted from the y-interceptfor the same plot at the potential of interest (e.g., 0.90 V). Compari-son of the kinetic currents derived directly from the y-intercepts ofthe Koutecky-Levich plots (ik) to those corrected for film diffusion(ik’) indicates the extent of the influence of film diffusion on theRDE measurements. This comparison for the 400 nm Pt nanorodRDE data shows that film diffusion has minimal effect on the cur-rents at 0.90 and 0.95 V, with <5% difference between ik and ik’.Since all the other films tested in this study were thinner than the400 nm film, it is expected that film diffusion has minimal influenceon the kinetic currents at 0.90 and 0.95 V for these films as well.
Based on the absence of film diffusion effects at 0.90 and 0.95V, Eq. (2) was used to extract kinetic currents from the oxygen-satu-rated electrolyte RDE CVs (Figs. 9b and 10a). The effect of differ-ent Pt loadings (i.e., nanorod length and diameter) for GLAD Ptnanorods is demonstrated in Figs. 10a, 10b and 10c. Based on thecurrent range (0.1 ilim< i< 0.8 ilim) used for extracting kinetic cur-rents, the polarization curves in Figs. 10b and 10c for 50, 200, and400 nm long Pt nanorods were restricted to potential ranges of 0.81–0.96, 0.89–0.98, and 0.90–1.00 V, respectively. As shown in Fig.10b, the 200 and 400 nm long nanorods have nearly identical area-specific ORR activities at �0.90 V, while the 50 nm nanorods haverelatively low activity. Two factors that may contribute to the lowerrelative ORR activity of the 50 nm nanorods are: (1) the much lowerPt loading (0.04 versus 0.16 and 0.32 mg Pt/cm2) leading to reducedcoverage of the glassy carbon disk with nanorods, evident in theslightly lower diffusion-limited current for this sample (Fig. 10a)and (2) the 50 nm nanorods do not have well-developed sidewallsand have almost a particle-like structure as compared to the 200 and400 nm long nanorods (Fig. 2). This means that the electrolyte is incontact mainly with the facets at the tips of the nanorods which areoriented in the [111], [100], and [110] directions (Figs. 4, 5, and 6).The lower electrochemical activity of the (111) and (100) facescompared to that of the (110) face will result in lower ORR activityof the 50 nm long Pt nanorods compared to the activity of the 200and 400 nm long nanorods that have well-developed (110) sidewallsin addition to the tip and facet orientations. Figure 10c also showsthat the 400 nm long nanorod sample has lower mass-specific activ-ity at � 0.9 V than that of the 50 and 200 nm long nanorod samplesdue to larger diameters and incomplete wetting compared to shorternanorods. This observation is also supported by the utilization cal-culation shown in the previous section.
The area- and mass-specific activities for Pt/C and Pt nanorods at0.9 and 0.95 V are reported in Table I. The reported values of area-and mass-specific activities at 0.9 V taken from the literature4,16,47,49
for polycrystalline Pt and Pt/C are also given in Table I for compari-son. Based on the reported area-specific activity and ECSA of 8 m2/g for NSTF,47 the mass-specific activity was calculated and is alsoreported in Table I. The area- and mass-specific activities measured
for Pt/C in this study are in good agreement with the values reportedby Gasteiger et al.4 and by Paulus et al.48 and slightly lower thanthose reported by Garsany et al.34 As discussed by Garsany et al.,34
the higher SA and MA values reported in their study might be attrib-uted to optimization of the catalyst ink formulations. Figure 10dshows the dependence of area- and mass-specific ORR activity at0.90 V on the length and ECSA of Pt nanorods. Of the three nanorodlengths studied, the 200 nm length exhibited the highest mass activ-ity and area-specific activity nearly identical to that of the 400 nmsample. As discussed above, the 200 nm long nanorods are longenough to have well-developed sidewalls with the preferred [110]orientation but, unlike the 400 nm long nanorods, they have smallerdiameters and better wetting. As shown in Table I and Fig. 10e, thearea-specific ORR activity of the 50 nm long Pt nanorods is higherthan that of Pt/C, while the 200 nm and 400 nm long nanorods havearea-specific activities that are higher than the Pt NSTF catalyst andcomparable to that of polycrystalline Pt. As explained in the intro-duction, electrochemical activity in 0.1 M HClO4 electrolyte followsthe trend Pt(110)> Pt(111)> polycrystalline Pt>Pt(100).18,19
Because the sidewalls of the Pt nanorods are dominated by (110)planes, one would expect a higher area-specific ORR activity forGLAD nanorods compared to polycrystalline Pt. Polycrystalline Pt-like ORR activities may be due to the existence of Pt(100) planes at
Figure 11. (Color online) (a) Room temperature positive-going RDE curvesfor 400 nm long Pt nanorods in oxygen-saturated 0.1 M HClO4 at scan rate10 mV/s and different rotation speeds (1600, 2025, and 2500 rpm) and (b)Koutecky-Levich plots for 400 nm long Pt nanorods extracted from (a) at0.4, 0.90, and 0.95 V.
Journal of The Electrochemical Society, 158 (8) B1029-B1041 (2011)B1038
Downloaded 29 Jun 2011 to 144.167.57.133. Redistribution subject to ECS license or copyright; see http://www.ecsdl.org/terms_use.jsp

the sidewalls and tips of some of the nanorods and to the presence oflow coordination sites at the edges of the low index planes, whichcan reduce the electrochemical activity compared to that of idealpure Pt(110) in perchloric acid electrolyte. It should be noted thatthe existence of Pt(100) planes is expected to improve ORR electro-catalytic activity if adsorbing electrolytes such as sulfuric acid orperfluorosulfonic acid fuel cell electrolyte (e.g., Nafion) are usedinstead of non-adsorbing perchloric acid electrolyte,21,22 asexplained in the introduction.
The higher area-specific activity of the Pt NSTF catalysts com-pared to Pt/C catalysts has been attributed to the large Pt crystallitesize resulting in average coordination numbers of surface Pt andcorresponding surface electronic properties approaching those ofpolycrystalline Pt.47 As shown in Fig. 2a, the 50 nm long nanorodshave diameters ranging from 5 to 20 nm and thus, due to the single-crystal nature, their crystallite dimensions are expected to be in therange of 5–50 nm (i.e., diameter-length). The comparable area-spe-cific activities of the 50 nm Pt nanorod and the Pt NSTF catalysts isbelieved to be due to the similar Pt crystallite dimensions of thesecatalysts. In addition to the effects of electrochemically activePt(110) planes of Pt nanorods discussed above, the higher area-spe-cific activity of the 200 and 400 nm nanorods can likewise be attrib-uted in part to their larger crystallite dimensions compared to the 50nm nanorods, Pt/C, and to the Pt NSTF. However, the large crystal-lite size of the Pt nanorod and the Pt NSTF catalysts result in alower ratio of surface to bulk Pt atoms and a concomitantly lowermass activity than Pt/C, as shown in Fig. 10e and Table I
Temperature-dependence study—Hydrodynamic voltammograms ofthe Pt nanorods and the Pt/C catalyst were obtained as a function oftemperature between 20 and 60�C in oxygen-saturated 0.1 M HClO4
at 20 mV/s scan rate and 1600 rpm electrode rotation speed. Figure12 shows an increase in the limiting current in the temperature rangeof 20–40�C. The increase in current density can be attributed to anincrease in the oxygen diffusion rates with increasing temperaturedue to a decrease in electrolyte viscosity. At a temperature of 60�C,a slight decrease in the limiting current density was observed (Fig.12), indicating a decrease in both the oxygen concentration and den-sity of the electrolyte at elevated temperature due to a drasticincrease in the vapor pressure of water. This observation was con-firmed by Paulus et al.48 who derived an expression which repre-sents the temperature-dependent limiting current density using thephysical-chemical properties of pure water.
Since ik depends on the oxygen concentration in the electrolyte,which decreases with increasing the operating temperature,48,52,53 itis most appropriate to define the kinetics of the reaction in terms ofa concentration-independent apparent rate constant, kapp.
52 Theapparent rate constants of ORR can be calculated from Eq. (4) at aconstant overpotential52
Figure 12. (Color online) RDE plots at different temperatures varyingbetween 20 and 60�C of (a) Pt/C and (b) 200 nm Pt nanorods in oxygen-satu-rated 0.1 M HClO4 at sweep rate 20 mV/s and rotation rate 1600 rpm.
Table I. Summary of the evaluated ORR electrocatalytic activity (area-specific and mass-specific activities at 0.90 and 0.95 V) of Pt-nanorod
array and Pt/C catalysts in 0.1 M HClO4 and comparison to the literature ORR activity values for various Pt catalysts.
Method Sample
Ptloading(mg/cm2)
ECSA(m2/g)
T(�C)
Scanrate
(mV/s)
SA(�A/cm2) MA(A/mg)
References0.90(V) 0.95(V) 0.90(V) 0.95(V)
RDE 50 nm long Pt nanorods 0.040 13 20 10 632 166 0.08 0.02 This work
RDE 200 nm long Pt nanorods 0.160 12 20 10 1080 250 0.13 0.03 This work
RDE 400 nm long Pt nanorods 0.320 6.7 20 10 1194 266 0.08 0.02 This work
TF-RDE 20% Pt/C 0.020 60 20 20 288 76 0.18 0.05 This work
RDE Bulk Poly-Pt — — 20 20 1200 — — — Ref. 47
TF-RDE NSTF Pt 0.042 8 20 20 750 — 0.06 — Ref. 47
TF-RDE Pt/C (TKK) 0.014 (d¼ 1–1.5 nm) >60 20 20 100 — — — Ref. 47
TF-RDE Pt/C (TKK) 0.014 (d¼ 2–3 nm) >60 20 20 200 — — — Ref. 47
TF-RDE PT/C (TKK) 0.014 (d¼ 5 nm) >60 20 20 350 — — — Ref. 47
TF-RDE 46% Pt/HSC (TKK) 0.017 132 25 10 292 — 0.27 — Ref. 51
TF-RDE 20% Pt/C 0.014 66 30 20 305 — 0.21 — Ref. 34
Journal of The Electrochemical Society, 158 (8) B1029-B1041 (2011) B1039
Downloaded 29 Jun 2011 to 144.167.57.133. Redistribution subject to ECS license or copyright; see http://www.ecsdl.org/terms_use.jsp

kapp ¼ �iknFAreal½O2�½Hþ� [4]
where kapp is the apparent rate constant, ik is the kinetic current cal-culated from Eq. (2), n is the number of electrons involved in thereaction, F is the Faraday constant, Areal is the electrochemically-active surface area, [O2] is the oxygen concentration in the bulk ofthe electrolyte solution, and [Hþ] is the bulk concentration of pro-tons (0.1 M). The oxygen concentration [O2] values at differenttemperatures were taken from the values reported by Wakabayashiet al.52 in which [O2] values were calculated based on Henry’s law.The apparent rate constants for ORR on Pt/C and Pt nanorods werecalculated at 0.93 and 0.95 V, where the rate of electron transfer isvery slow and clearly the rate-determining step. The apparent rateconstant values were calculated at potentials higher than 0.90 Vbecause the RDE current of Pt nanorods at 0.90 V and 60�C is in thediffusion-limited region, as shown in Fig. 12b. Table II shows thatthe apparent ORR rate constant on Pt nanorods (5 cm4/mol s) ishigher than that of the conventional catalysts (2 cm4/mol s) indicat-ing that the ORR rate on Pt nanorods is larger than on Pt/C. TheArrhenius equation48,53 was utilized to calculate the activation ener-gies for ORR on both Pt/C and Pt nanorods
ln kapp ¼ �Ea
R
1
Tþ lnA [5]
where Ea is the activation energy, A is the pre-exponential factor, Tis the operating temperature, and R is the gas constant. Figure 13shows the Arrhenius plots of the value of kapp evaluated at 0.93 and0.95 V from Eq. (4) versus (1/T) which gives straight lines. TheORR activation energies for Pt/C and Pt nanorods, determined fromthe slopes of these lines, are listed in Table II. It should be notedthat there are contradictory reports about the activation energy of Pt/C in the literature. Grgur et al.54 calculated the activation energy tobe 42 kJ/mol on all three low index Pt single crystal surfaces in 0.05M H2SO4 at 0.8 V. Paulus et al.48 reported lower activation energiesof 26 and 28 kJ/mol on Pt/C in 0.5 M H2SO4 and 0.5 M HClO4,respectively. It was found that these values are in good agreementwith the values reported for polycrystalline Pt in sulfuric acid withpH¼ 1 at 0.8 V,55 and in perchloric acid with pH¼ 1.9 at 0.8 V,56
which are 25 and 20 kJ/mol, respectively. Recently, Kongkanand etal.53 reported an activation energy value of �25 kJ/mol at 0.575 and0.625 V (vs. SCE) on Pt/C and single-wall carbon nanotube-sup-ported Pt nanoparticles, while the ORR rate constant is 2-fold higherfor the Pt/SWCNT electrode than that of Pt/C. On the other hand,significantly larger activation energy of �40 kJ/mol was observedby Yano et al.57 in 0.1 M HClO4 at �0.8 V on Nafion-coated filmelectrodes of bulk Pt and Pt nanoparticles dispersed on carbon black.This value is comparable to those on the bulk Pt electrode measuredby Wakabayashi et al.52 In summary, activation energy values of Pt/C electrode reported in the literature vary within the range of 20–40kJ/mol in liquid electrolytes, and can get as large as �60 kJ/mol inoperating PEM fuel cells.58–60 Neyerlin et al.61 determined the appa-rent activation energies of Pt/C electrode in operating PEM fuelcells at zero overpotential, constant overpotentials of 0.3 and 0.35V, and 0.9 V iR-free cell voltage to be 67, 38 and 33, and 10 kJ/mol,respectively. It was suggested that scattered activation energy data
in the literature is mainly due to the use of different definition of theterms and conditions utilized to extract the kinetics data.61 Activa-tion energy value of 30 kJ/mol calculated from our experiments onPt/C is in good agreement with majority of the reported valueswhich are in the range of 20–40 kJ/mol.48,53,55,56,61 Moreover, wenote that the activation energy of 25.8 kJ/mol for the Pt nanorod cat-alyst falls in the lower limit of the values reported in the literature(i.e., in the range of 20–40 kJ/mol) for Pt/C and polycrystalline Pt.
Conclusion
The glancing angle deposition technique was utilized to fabricatevertically-aligned Pt nanorod arrays on glassy carbon substrates.The ORR activity of the nanorod arrays was investigated usingcyclic volammtery and rotating disk electrode techniques at roomtemperature and as a function of temperature up to 60�C. It wasfound that GLAD Pt nanorods exhibit higher area-specific activity,higher reaction rate constant, comparable activation energy, andgreater stability against electrochemically-active surface area losscompared to conventional Pt/C electrode. The enhanced ORR activ-ity of Pt nanorods was attributed to their larger crystallite size andthe dominance of Pt(110) crystal planes on the nanorod sidewalls,which was reported to be the most active plane for ORR. The mass-specific ORR activity of the Pt nanorods was found to be lower thanthat of the Pt/C catalyst, mainly due to the large diameter of nano-rods. Decreasing the diameter of the nanorods, thereby increasingthe surface/bulk atom ratio, or using alloyed Pt nanorods, platinummass-specific activity can be potentially improved. These and simi-lar surface engineering and chemical modification approaches mayopen the way for utilizing GLAD nanorods as cathode catalysts inPEM fuel cells.
Acknowledgments
The authors would like to thank the UALR NanotechnologyCenter and Dr. Fumiya Watanabe for his valuable support and dis-cussions during SEM, XRD, and TEM measurements. A portion ofthis research was conducted at Argonne National Laboratory, a U.S.Department of Energy, Office of Science Laboratory, operatedby UChicago Argonne, LLC, under contract no. DE-AC02-06CH11357. The Argonne National Laboratory authors would liketo acknowledge the support of the U.S. Department of Energy,Office of Energy Efficiency and Renewable Energy, Fuel Cell Tech-nologies Program, program manager Nancy Garland.
Table II. Calculated apparent reaction rate constant and activa-
tion energy for the ORR on Pt/C and GLAD Pt nanorods at
0.95 V.
SampleECSA(m2/g Pt)
kapp at 0.95 Vand 20�C(cm4/mol s)
Ea (kJ/mol)at 0.95 V
20% Pt/C 60 2 30.06 0.5
200 nm long Pt nanorods 12 5 25.86 0.5
Figure 13. (Color online) Arrhenius plots for the apparent rate constant kappon Pt/C and GLAD Pt nanorods at 0.93 and 0.95 V vs. RHE.
Journal of The Electrochemical Society, 158 (8) B1029-B1041 (2011)B1040
Downloaded 29 Jun 2011 to 144.167.57.133. Redistribution subject to ECS license or copyright; see http://www.ecsdl.org/terms_use.jsp

References
1. Report of the DOE Basic Energy Sciences Workshop on Hydrogen Production,Storage, and Use (May 2003), online copy available at http://www.sc.doe.gov/bes/hydrogen.pdf.
2. Fuel Cell Handbook, EG&G Technical Services Inc, 7th Ed. (U.S. Department ofEnergy, Office of Fossil Energy, National Energy Technology Laboratory, 2004),online copy available at http://www.netl.doe.gov/technologies/coalpower/fuelcells/seca/pubs/FCHandbook7.pdf.
3. J. Zhang, PEM fuel cell electrocatalysts and catalyst layer: fundamentals andapplications, Springer-Verlag, London (2008).
4. H. A. Gasteiger, S. S. Kocha, B. Sompalli, and F. T. Wagner, Appl. Catal., B, 56, 9(2005).
5. H. Tang, Z.G. Qi, M. Ramani, and J. F. Elter, J. Power Sources, 158, 1306 (2006).6. J. L. Qiao, M. Saito, K. Hayamizu, and T. J. Okada, J. Electrochem. Soc., 153,
A967 (2006).7. U. A. Paulus, T. J. Schmidt, H. A. Gasteiger, and R. J. Behm, J. Electroanal.
Chem., 495, 134 (2001).8. D. Gruber, N. Ponath, J. Muller, and F. Lindstaedt, J. Power Sources, 150, 67
(2005).9. M. K. Debe, A. K. Schomoeckel, G. D. Vernstrom, and R. Atanasoski, J. Power
Sources, 161, 1002 (2006).10. D. Gurber and J. Muller, J. Power Sources, 171, 294 (2007).11. A. Caillard, C. Coutanceau, P. Braulta, J. Mathias, and J.-M. Leger, J. Power Sour-
ces, 162, 66 (2006).12. M. Gustavsson, H. Ekstrom, P. Hanarpa, L. Eureniusa, G. Lindbergh, E. Olsson,
and B. Kasemoa, J. Power Sources, 163, 671 (2007).13. C. Chien and K. Jeng, Mater. Chem. Phys., 103, 400 (2007).14. A. Bonakdarpour, M. D. Fleischauer, M.J. Brett, and J. R. Dahn, Appl. Catal., A,
349, 110 (2008).15. M. D. Gasda, G. A. Eisman, and D. Gall, J. Electrochem. Soc., 157, B71 (2010).16. M. K. Debe, A. K. Schmoeckel, S. M. Hendricks, G. D. Vernstrom, G. M. Haugen,
and R. T. Atanasoski, ECS Trans., 1(8), 51 (2006).17. A. Atkinson, R. I. Taylor, and A. E. Hughes, Philos. Mag. A, 45(5), 823 (1982).18. N. M. Markovic and P. N. Ross, Surf. Sci. Rep., 45, 121 (2002).19. V. R. Stamenkovic, B. Fowler, B. S. Mun, G. Wang, P. N. Ross, C. A. Lucas, and
N. M. Markovic, Science, 315, 493 (2007).20. F. El Kadiri, R. Faure, and R. Durand, J. Electroanal. Chem., 301, 177 (1999).21. R. Subbaraman, D. Strmcnik, V. Stamenkovic, and N. M. Markovic, J. Phys.
Chem. C, 114, 8414 (2010).22. R. Subbaraman, D. Strmcnik, A. P. Paulikas, V. R. Stamenkovic, and N. M. Mar-
kovic, ChemPhysChem., 11, 2825 (2010).23. Z. Chen, M. Waje, W. Li, and Y. Yan, Angew. Chem., Int. Ed., 46, 4060 (2007).24. S. Antonino, B. Peter, S. Bruno, T. Jean-Marie, S. Walter van, Nature Mater., 4,
366 (2005).25. T. Karabacak and T.-M. Lu, in Handbook of Theoretical and Computational Nano-
technology, M. Rieth and W. Schommers, Editors, Chap. 69, p. 729, American.Scientific, Stevenson Ranch, CA (2005).
26. T. Karabacak, G.-C. Wang, and T.-M. Lu, J. Vac. Sci. Technol. A, 22, 1778 (2004).27. F. Tang, T. Karabacak, L. Li, M. Pelliccione, G.-C. Wang, and T.-M. Lu, J. Vac.
Sci. Technol. A, 25, 160 (2007).28. S. Kim, N. Koratkar, T. Karabacak, and T.-M. Lu, Appl. Phys. Lett., 88, 263106
(2006).29. P. Morrow, F. Tang, T. Karabacak, P.-I. Wang, D.-X. Ye, G.-C. Wang, and T.-M.
Lu, J. Vac. Sci. Technol. A, 24, 205 (2006).
30. F. Tang, T. Karabacak, P. Morrow, C. Gaire, G.-C. Wang, and T.-M. Lu, Phys.Rev. B, 72, 165402 (2005).
31. E. Main, T. Karabacak, and T.-M. Lu, J. Appl. Phys., 95, 4346 (2004).32. M. D. Gasda, R. Teki, T.-M. Lu, N. Koratkar, G. A. Eisman, and D. Gall, J. Elec-
trochem. Soc., 156, B614 (2009).33. W. J. Khudhayer, A. U. Shaikh, and T. Karabacak, Advanced Science Letters, 4,
1-9 (2011)34. Y. Garsany, O. A. Baturina, K. E. Swider-Lyons, and S. S. Kocha, Anal. Chem.,
82, 6321 (2010).35. E. Higuchi, H. Uchida, and M. Watanabe, J. Electroanal. Chem., 583, 69 (2005).36. T. Karabacak, J. S. DeLuca, D. Ye, P.-I Wang, G.-C. Wang, and T.M. Lu, J. Appl.
Phys., 99, 064304 (2006).37. T. Karabacak, P.-I. Wang, G.-C. Wang, and T.-M. Lu, Thin Solid Films, 493, 293
(2005).38. T. Karabacak, P.-I. Wang, G.-C. Wang, and T.-M. Lu, Mat. Res. Soc. Symp. Proc.,
788, 75 (2004).39. V. Komanicky, K. C. Chang, A. Menzel, N. M. Markovic, H. You, X. Wang, and
D. Myers, J. Electrochem. Soc., 153, B446 (2006).40. P. Morrow, F. Tang, T. Karabacak, P.-I. Wang, D.-X. Ye, G.-C. Wang, and T.-M.
Lu, J. Vac. Sci. Technol. A, 24, 205 (2006).41. F. Tang, T. Karabacak, P. Morrow, C. Gaire, G.-C. Wang, and T.-M. Lu, Phys.
Rev. B, 72, 165402 (2005).42. W. J. Khudhayer, R. Sharma, and T. Karabacak, Nanotechnology, 20, 275302
(2009).43. N. Markovic, H. Gasteiger, and P. N. Ross, J. Electrochem. Soc., 144, 1591
(1997).44. T. R. Ralph, G. A. Hards, J. E. Keating, S. A. Campbell, D. P. Wilkinson, M.
Davis, J. St-Pierre, and M. C. Johnson, J. Electrochem. Soc., 144, 3845 (1997).45. G. K. Klema and M. J. Brett, J. Electrochem. Soc., 150, E342 (2003).46. Y. Shao-Horn, W. C. Sheng, S. Chen, P. J. Ferreira, E. F. Holby, and D. Morgan,
Top. Catal., 46, 285 (2007).47. K. J. J. Mayrhofer, D. Strmcink, B. B. Blizanac, V. Stamenkovic, M. Arenz, and
N. M. Markovic, Electrochim Acta, 53, 3181 (2008).48. U. A. Paulus, T. J. Schmidt, H. A. Gasteiger, and R. J. Behm, J. Electroanal.
Chem., 495, 134, (2001).49. D. R. Lawson, L. U. Whiteley, C. R. Martin, M. N. Szentimay, and J. I. Song,
J. Electrochem. Soc., 135, 2247 (1988).50. A. J. Bard and L. R. Faulkner, Electrochemical Methods, John Wiley & Sons, New
York (1980).51. I. Takahashi and S. S. Kocha, J. Power Sources, 195, 6312 (2010).52. N. Wakabayashi, M. Takeichi, M. Itagaki, H. Uchida, and M. Watanabe, J. Elec-
troanal. Chem., 574, 339 (2005).53. A. Kongkanand, S. Kuwabata, G. Girishkumar, and P. Kamat, Langmuir, 22, 2392,
(2006).54. B. N. Grgur, N. M. Markovic, and P. N. Ross, Can. J. Chem., 75, 1465 (1997).55. A. Damjanovic and D. B. Sepa, Electrochim. Acta, 35, 1157 (1990).56. D. B. Sepa, M. V. Vojnovic, L. Vracar, and A. Damjanovic, Electrochim. Acta, 31,
91 (1986).57. H. Yano, E. Higuchi, H. Uchida, and M. Watanabe, J. Phys. Chem. B, 110, 16544
(2006).58. S. Mukerjee, S. Srinivasan, and M. P. Soriaga, J. Phys. Chem., 99, 4577 (1995).59. P. S. Beattie, V. I. Basura, and S. Holdcroft, J. Electroanal. Chem., 468, 180 (1999).60. A. J. Appleby, J. Electrochem. Soc., 117, 328 (1970).61. K. C. Neyerlin, W. Gu, J. Jorne, and H. A. Gasteiger, J. Electrochem. Soc., 153,
A1955 (2006).
Journal of The Electrochemical Society, 158 (8) B1029-B1041 (2011) B1041
Downloaded 29 Jun 2011 to 144.167.57.133. Redistribution subject to ECS license or copyright; see http://www.ecsdl.org/terms_use.jsp