b7 - integrated uncertainty management rev 3
TRANSCRIPT
TECHNICAL REPORT
TM
DEMO 2000
INTEGRATED UNCERTAINTY MANAGEMENT CTR NO B7
REPORT NO. MSKJ/01AAAA54 REVISION NO. 3
DET NORSKE VERITAS KVÆRNER OIL & GAS CORROCEAN
TECHNICAL REPORT
16 February 2005 , C:\DATA\UiO materiale\B7 - Integrated Uncertainty Management Rev 3.doc
DET NORSKE VERITAS AS Division Nordic Countries Risk Management
Date of first issue: Project No.: 25 June 2001 620B1503 Approved by: Organisational unit:
See Document Review History DNV Consulting Oil & Gas
Client: Client ref.: Demo 2000 136844/298
Summary: This report summarises the results from the B-activities of the Demo2000 project "Integrated Uncertainty Management." For more in-depth information on the theoretical foundation and description, please refer to the reports: ?? "Demo 2000 – Framework for Mapping of work and decision processes - CTR No B1". ?? "Demo 2000 - Work and Decision Processes of Suppliers - CTR No B2". ?? "Demo 2000 - State-of the-art of Multidisiplinary Uncertainty analysis - CTR No B3". ?? "Demo 2000 – Development of Building Blocks and preparation of input for Integrated
Uncertainty Analyses – CTR No B4". ?? "Demo 2000 - Standardised method for multidisciplinary uncertainty analysis - CTR No B5". ?? "Demo 2000 - Demonstrator , Results from using the standardised method for multidisplinary
analysis uncertainty analysis – CTR No B6". ?? "Demo 2000 - Demonstrator , Guidance on how to use the computer model for integrated
uncertainty analysis - CTR No B6".
Report No.: Subject Group: mskj/01aaaa54
Indexing terms Report title: Integrated uncertainty management
Standardised method, Risk Management, Uncertainty management, Probabilistic analysis
Work carried out by: Monica Solem No distribution without permission from the
Client or responsible organisational unit
Work verified by: Frank Børre Pedersen Limited distribution within
Det Norske Veritas
Date of this revision: Rev. No.: Number of pages: 18.11.2001 3 41 Unrestricted distribution
DET NORSKE VERITAS KVÆRNER OIL & GAS CORROCEAN
Report No: mskj/01aaaa54, rev. 3
TECHNICAL REPORT
Page i Reference to part of this report which may lead to misinterpretation is not permissible.
16 February 2005, B7 - Integrated Uncertainty Management Rev 3.doc
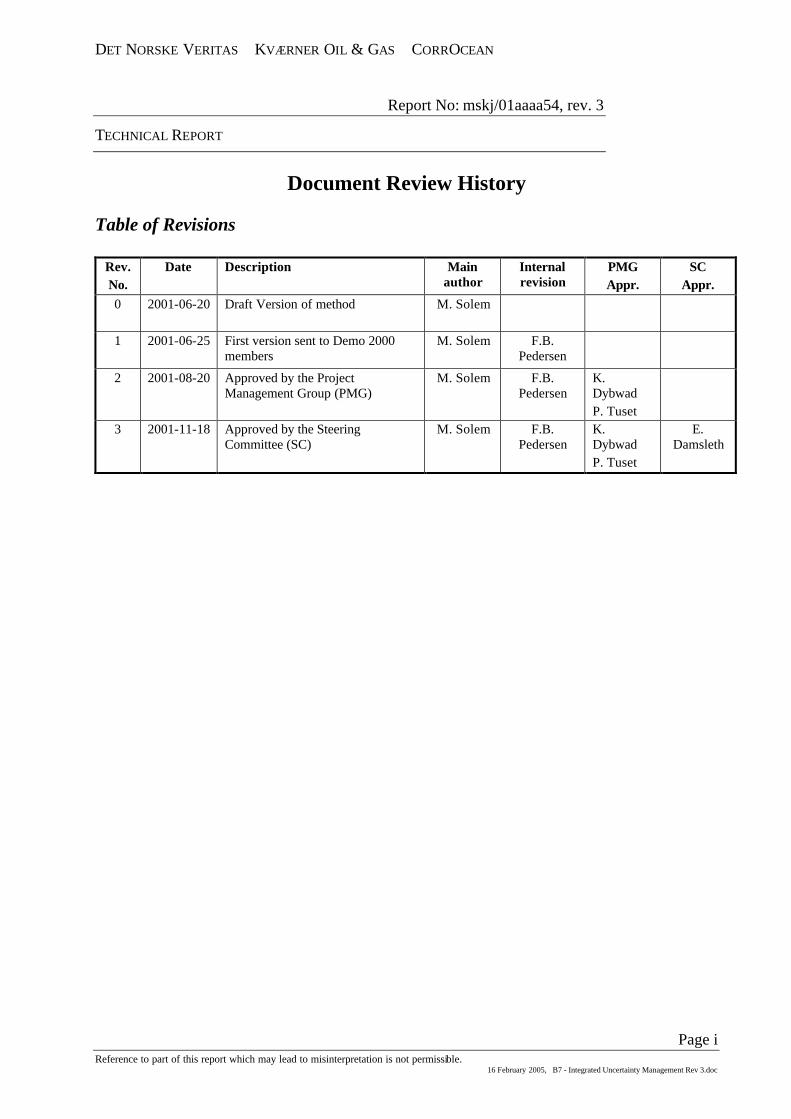
Document Review History Table of Revisions
Rev. No.
Date Description Main author
Internal revision
PMG Appr.
SC Appr.
0
2001-06-20 Draft Version of method M. Solem
1
2001-06-25 First version sent to Demo 2000 members
M. Solem F.B. Pedersen
2 2001-08-20 Approved by the Project Management Group (PMG)
M. Solem F.B. Pedersen
K. Dybwad P. Tuset
3 2001-11-18 Approved by the Steering Committee (SC)
M. Solem F.B. Pedersen
K. Dybwad P. Tuset
E. Damsleth

DET NORSKE VERITAS KVÆRNER OIL & GAS CORROCEAN
Report No: mskj/01aaaa54, rev. 3
TECHNICAL REPORT
Page ii Reference to part of this report which may lead to misinterpretation is not permissible.
16 February 2005, B7 - Integrated Uncertainty Management Rev 3.doc
Table of Content Page
1 OBJECTIVES...............................................................................................................1 1.1 Objectives of the DEMO 2000 programme 1 1.2 Objectives of the Integrated Uncertainty Management project 1 1.3 Objectives of this report 1
2 INTRODUCTION ........................................................................................................2
3 DECISION UNDER UNCERTAINTY........................................................................3 3.1 Traditional discounted cash flow approach 3 3.2 Deterministic Scenario Based Approach 3 3.3 Probabilistic Approach 4
4 INTEGRATED UNCERTAINTY ANALYSIS...........................................................5 4.1 The Integrated Risk Modelling Approach (IRMA) method 11 4.2 Strengths of the standardised method 17
5 IMPACT ON CURRENT WORK PROCESSES.......................................................18
6 CONCEPT EVALUATION .......................................................................................19 6.1 Objective of the analysis 19 6.2 Different ranking criteria for alternative decisions 19 6.3 Case description 20 6.4 Selection of Development Solution 24 6.5 Sensitivity measures 28 6.6 Including the effect of new technology 35 6.7 Calculating total uncertainty 38 6.8 The total uncertainty of a given concept 38 6.9 The total uncertainty of a field development solution 39
7 REFERENCES ...........................................................................................................41
DET NORSKE VERITAS KVÆRNER OIL & GAS CORROCEAN
Report No: mskj/01aaaa54, rev. 3
TECHNICAL REPORT
Page 1 Reference to part of this report which may lead to misinterpretation is not permissible.
16 February 2005, B7 - Integrated Uncertainty Management Rev 3.doc
1 OBJECTIVES
1.1 Objectives of the DEMO 2000 programme The main objective of the DEMO 2000 Programme is to contribute to long-term competitiveness in the oil industry and continued profitable development of the resources on the Norwegian continental shelf. The Programme shall generate expertise and qualify new technology that enables new field development on the Norwegian continental shelf through the utilisation of new and more cost effective technology. The intention is also to use the programme to launch new Norwegian industrial products, systems and processes for sale in the global offshore market.
1.2 Objectives of the Integrated Uncertainty Management project Integrated Uncertainty Management is a DEMO 2000 project, with additional external partners. The main objective of the project Integrated Uncertainty Management (Phase I) is: ”To improve economic performance of oil and gas fields by developing and demonstrating work processes, methodologies and tools within uncertainty management. This will result in efficient identification and communication of uncertainty and improved decision support throughout the value chain of an offshore field. Special focus shall be put on early phases up to and including award of major contracts”
Particular emphasis is put on combining the opportunities of the reservoir with the uncertainties in building and operating the facilities in a full technical, economical and commercial risk evaluation.
1.3 Objectives of this report This report summarises the results from the B-activities of the Demo2000 project "Integrated Uncertainty Management" For more in-depth information on the theoretical foundation and description, please refer to the reports: ?? "Demo 2000 - Framework for Mapping of work and decision processes - CTR No B1". ?? "Demo 2000 - Work and Decision Processes of Suppliers - CTR No B2". ?? "Demo 2000 - State-of the-art of Multidisiplinary Uncertainty analysis - CTR No B3". ?? "Demo 2000 - Development of Building Blocks and preparation of input for Integrated
Uncertainty Analyses - CTR No B4". ?? "Demo 2000 - Standardised method for multidisciplinary uncertainty analysis - CTR No B5". ?? "Demo 2000 - Demonstrator , Results from using the standardised method for
multidisplinary analysis uncertainty analysis - CTR No B6". ?? "Demo 2000 - Demonstrator , Guidance on how to use the computer model for integrated
uncertainty analysis - CTR No B6".
DET NORSKE VERITAS KVÆRNER OIL & GAS CORROCEAN
Report No: mskj/01aaaa54, rev. 3
TECHNICAL REPORT
Page 2 Reference to part of this report which may lead to misinterpretation is not permissible.
16 February 2005, B7 - Integrated Uncertainty Management Rev 3.doc
2 INTRODUCTION Offshore field development is a complex activity involving uncertainties from a wide range of sources. These uncertainties comprise both potentially negative/unwanted consequences (risks), but also positive/desired consequences. Managing these uncertainties in an optimal manner taking into consideration all links of the value chain and different phases of the lifecycle of the field is the objective of Integrated Uncertainty Management. The uncertainties come from a wide range of areas and disciplines, and may be of a complete different nature. Nevertheless, they all contribute to the overall uncertainty of the total field economy.
The actual production characteristics of reservoirs have always been a major uncertainty when deciding on the development solution for the fields. Good communication and understanding between the reservoir engineers, the facility engineers and operations group, is a pre-requisite to minimise the risk for costly mistakes and utilise the vast upside potentials that exist in most reservoirs. In a situation where production systems are brought closer to the reservoirs (seabed separation and down-hole factories), the need for collaboration has become even more important than before. This calls for highly integrated reservoir – facility - operation teams and tools matching these needs.
The need for a standardised approach to uncertainty analysis and management of field development solutions covering all involved disciplines and phases of the lifecycle is obviously expedient.
When this is accomplished, the analysis may produce valuable decision support information related to ?? Total uncertainty related to different field development concepts ?? Robustness and sensitivity of a concept to changes in underlying parameters ?? Cost-benefit of introducing new technology into a concept ?? Cost-benefit and optimal degree of flexibility in a field development concept ?? Decision support for ranking different field development alternatives ?? etc

DET NORSKE VERITAS KVÆRNER OIL & GAS CORROCEAN
Report No: mskj/01aaaa54, rev. 3
TECHNICAL REPORT
Page 3 Reference to part of this report which may lead to misinterpretation is not permissible.
16 February 2005, B7 - Integrated Uncertainty Management Rev 3.doc
3 DECISION UNDER UNCERTAINTY The most challenging decision business executive face is choosing among alternative capital investment opportunities. This is because the decision maker must choose a single course of action from among those available to him, even though the consequences of some, if not all possible courses of action will depend on parameters that cannot be predicted with certainty.
Different techniques for understanding, analysing and managing risk and opportunities within decision making processes are available, a few of these are discussed briefly below;
?? Traditional discounted cash flow approach ?? Deterministic scenario based approach ?? Probabilistic approach
3.1 Traditional discounted cash flow approach Traditional discounted cash flow (DCF) analysis techniques may be used to give a perspective of the attraction of the investment opportunities. The future cash flow of offshore field investments are in general uncertain. The effect of the cash flow uncertainty is usually incorporated into the discount rate in the traditional approach. The discount rate used is the (risk-adjusted) market rate for projects of similar risk levels, i.e. the expected return on alternative investments of similar risk.
The inherent uncertainty (technical, economical, time schedule, etc.) of alternative solutions for specific offshore field may differ significantly. Hence, to be able to compare concepts one must introduce a risk-adjusted discount rate for each of the solutions; perform uncertainty analysis for all of the field development alternatives.
Given the risk-adjusted discount rates of each of the development solutions and the most likely cash flow, a point estimate of the net present value may be calculated.
This approach to calculating the performance measure under uncertainty still only provides one number for indicators. Both the most likely value and the associated range of the performance measure should be considered before a decision is made.
The methodologies used by oil companies to estimate the range of the performance indicators varies from deterministic scenario based approach to “fully” integrated probabilistic approach out of which the deterministic scenario based approach is the least sophisticated.
3.2 Deterministic Scenario Based Approach The deterministic scenario based approach produces a most likely value and the associated range of the performance measure in question.
In general, the value of performance indicators of feasible field development solutions depends on a set of uncertainties originating from different sources. The uncertainties that have an influence on the financial value of the investment opportunity are typically related to drilling, capital, operational, abandonment costs, drilling and construction schedule, concept performance

DET NORSKE VERITAS KVÆRNER OIL & GAS CORROCEAN
Report No: mskj/01aaaa54, rev. 3
TECHNICAL REPORT
Page 4 Reference to part of this report which may lead to misinterpretation is not permissible.
16 February 2005, B7 - Integrated Uncertainty Management Rev 3.doc
(infield flowline capacity, production ceilings, well deliverability, downtime, etc.) and amount of future income (reserve volumes, oil price, etc.).
The complete set of possible outcomes (outcome space) of a performance indicator may be extracted from a set of calculations taking into consideration all possible combinations of the realisation of each the random variables. However, this is an impracticable task as the number of combinations easily becomes enormous. Normally, a couple of cases are selected to represent the future realisation of the set of uncertainties and thereby the range of the performance indicator. Typically, a pessimistic and an optimistic case are selected in order to estimate the range of the financial indicator in question. The scenarios are populated with values extracted from uncertainty analyses performed by the various disciplines and the estimates are supposed to represent the most probable outcome and the range of the indicator in question. However, these scenarios are rather arbitrary in nature and such “deterministic” case based approaches do not always give a good picture of either the most likely outcome or the outcome range as the cumulative probability associated with each of the estimates are unknown.
This deterministic case based approach does not fully honour the uncertainty. A probabilistic integrated approach that aims at representing the total uncertainty of investment opportunities is presented in the following. The aim of such analyses is to help the decision –maker choose wisely under consideration of uncertainty.
3.3 Probabilistic Approach In order to make proper decisions it is essential that the total uncertainty picture is revealed. Such approaches require use of statistical techniques that incorporate uncertainty more fully into the analysis utilising probability distributions rather than single deterministic numbers. The statistics of the performance indicators needs to be revealed in order to have a good picture of the risk level of the alternatives.
Uncertainty analyses are commonly performed today within the various disciplines and throughout the different phases of the lifecycle. However, integrated models that represent the total uncertainty provide more precise decision support. This approach necessitates the use of multidisciplinary skills and resources and will be referred to as an integrated uncertainty analysis. Integrated Uncertainty Analysis and the results of such is described in the remaining chapters of this report.
The calculations of economic indicators such as net-present value (NPV) rests on a discounted cash flow (DCF) approach. Having introduced the integrated uncertainty analysis approach and total uncertainty, the magnitude of the risk-adjusted term may have to be re-considered. For example, if market fluctuations are included in the model as an uncertainty, it is necessary to identify whether this element already is accounted for and adjust the risk term of the discount rate accordingly.

DET NORSKE VERITAS KVÆRNER OIL & GAS CORROCEAN
Report No: mskj/01aaaa54, rev. 3
TECHNICAL REPORT
Page 5 Reference to part of this report which may lead to misinterpretation is not permissible.
16 February 2005, B7 - Integrated Uncertainty Management Rev 3.doc
4 INTEGRATED UNCERTAINTY ANALYSIS Integrated Uncertainty Analysis must be multi-disciplinary but also need to cover the lifecycle of the field in order to produce a representative total uncertainty related to the field development. The lifecycle of an offshore field may be described using 5 phases: ?? Explore (Exploration) ?? Appraise (Field development) ?? Develop (Realisation) ?? Produce (Operation) ?? Abandon (Removal)
The lifecycle is depicted in Figure 1.
Exp
lora
tio
n
Dev
elo
pm
ent
Pro
du
ctio
n
Ab
and
on
men
t
Ap
pra
isal
Figure 1 Illustration of the lifecycle
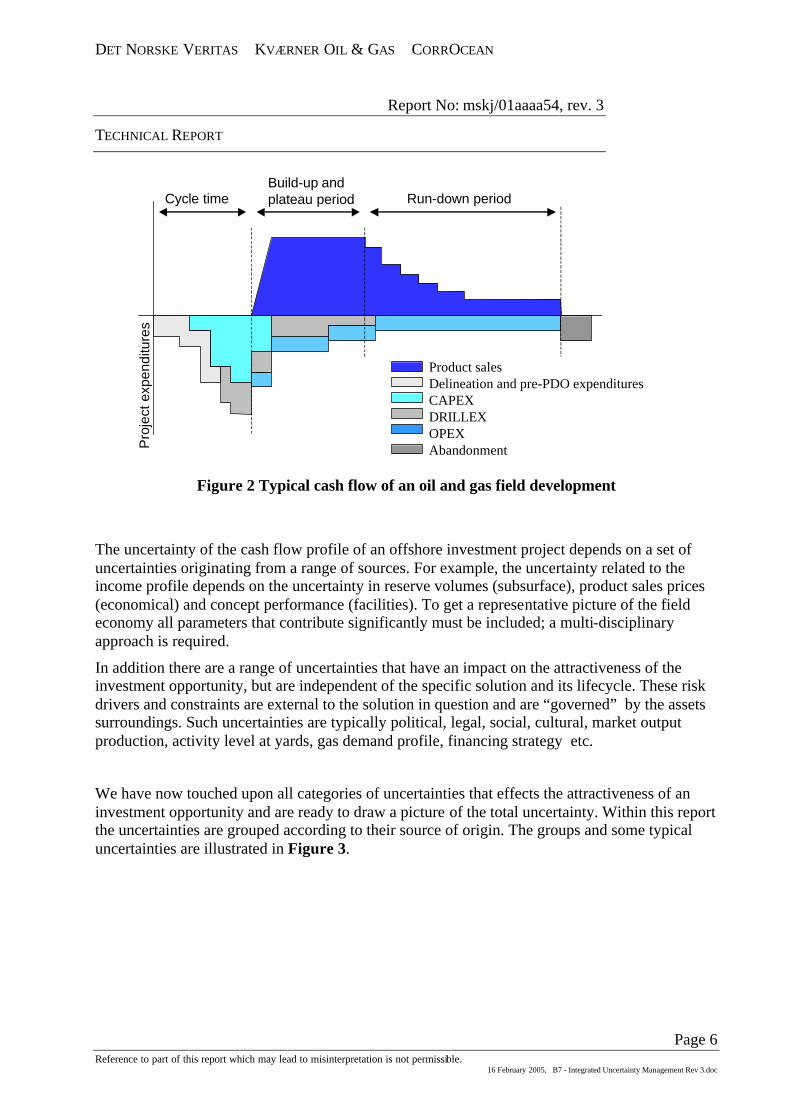
The cash flow of cost and income for a field development will vary throughout the phases of the lifecycle. The typical cash flow of an oil and gas field development is shown in Figure 2. This figure illustrates the connection between the phases and the main cash-flow contributors. As can be seen from the figure, there is no strict one-to-one correspondence between the phases of the lifecycle and the cash-flow contributors; for example drilling expenditures (DRILLEX) may be found in both the appraisal, development and production phase.
DET NORSKE VERITAS KVÆRNER OIL & GAS CORROCEAN
Report No: mskj/01aaaa54, rev. 3
TECHNICAL REPORT
Page 6 Reference to part of this report which may lead to misinterpretation is not permissible.
16 February 2005, B7 - Integrated Uncertainty Management Rev 3.doc
Product salesDelineation and pre-PDO expendituresCAPEXDRILLEXOPEXAbandonmentP
roje
ct e
xpen
ditu
res
Cycle timeBuild-up andplateau period Run-down period
Figure 2 Typical cash flow of an oil and gas field development
The uncertainty of the cash flow profile of an offshore investment project depends on a set of uncertainties originating from a range of sources. For example, the uncertainty related to the income profile depends on the uncertainty in reserve volumes (subsurface), product sales prices (economical) and concept performance (facilities). To get a representative picture of the field economy all parameters that contribute significantly must be included; a multi-disciplinary approach is required.
In addition there are a range of uncertainties that have an impact on the attractiveness of the investment opportunity, but are independent of the specific solution and its lifecycle. These risk drivers and constraints are external to the solution in question and are “governed” by the assets surroundings. Such uncertainties are typically political, legal, social, cultural, market output production, activity level at yards, gas demand profile, financing strategy etc.
We have now touched upon all categories of uncertainties that effects the attractiveness of an investment opportunity and are ready to draw a picture of the total uncertainty. Within this report the uncertainties are grouped according to their source of origin. The groups and some typical uncertainties are illustrated in Figure 3.

DET NORSKE VERITAS KVÆRNER OIL & GAS CORROCEAN
Report No: mskj/01aaaa54, rev. 3
TECHNICAL REPORT
Page 7 Reference to part of this report which may lead to misinterpretation is not permissible.
16 February 2005, B7 - Integrated Uncertainty Management Rev 3.doc
Company external
•Insurance•Oil/Gas price
•Oil/Gas demand
•Interest rate
•Political risks
Company internal
•Project financing
•Partner relations•Resource allocation
•Decision timing
Project internal
Figure 3 Schematic illustration of the total uncertainty of an offshore investment project.
As illustrated in Figure 3 a field development solution is subject to risk drivers and constraints from the project, the company/corporate level and company external variables: ?? Project internal: This group contains uncertainties that are specific to the concept in
question. These are typically related to drilling, capital, operational, abandonment costs and income potential (resource basis and system performance).
?? Company internal: This group contains the models, variables or constraints that follow from company strategies, plans and data/information systems. These are external to the project, but may impose restrictions/constraints on the project.
?? Company external: This group contains external independent variables that enter into the other models. These are typically political, social economic, cultural, market etc. uncertainties that may come into play throughout the asset lifecycle.
Further to this it is useful to group the uncertainties into the following classes: ?? Parameter uncertainty/estimate uncertainty: Uncertainty associated with the value of a
particular random parameter. The possible outcomes of a random variable are usually described by a statistical distribution. Parameter uncertainty is sometimes also denoted as estimate uncertainty.
DET NORSKE VERITAS KVÆRNER OIL & GAS CORROCEAN
Report No: mskj/01aaaa54, rev. 3
TECHNICAL REPORT
Page 8 Reference to part of this report which may lead to misinterpretation is not permissible.
16 February 2005, B7 - Integrated Uncertainty Management Rev 3.doc
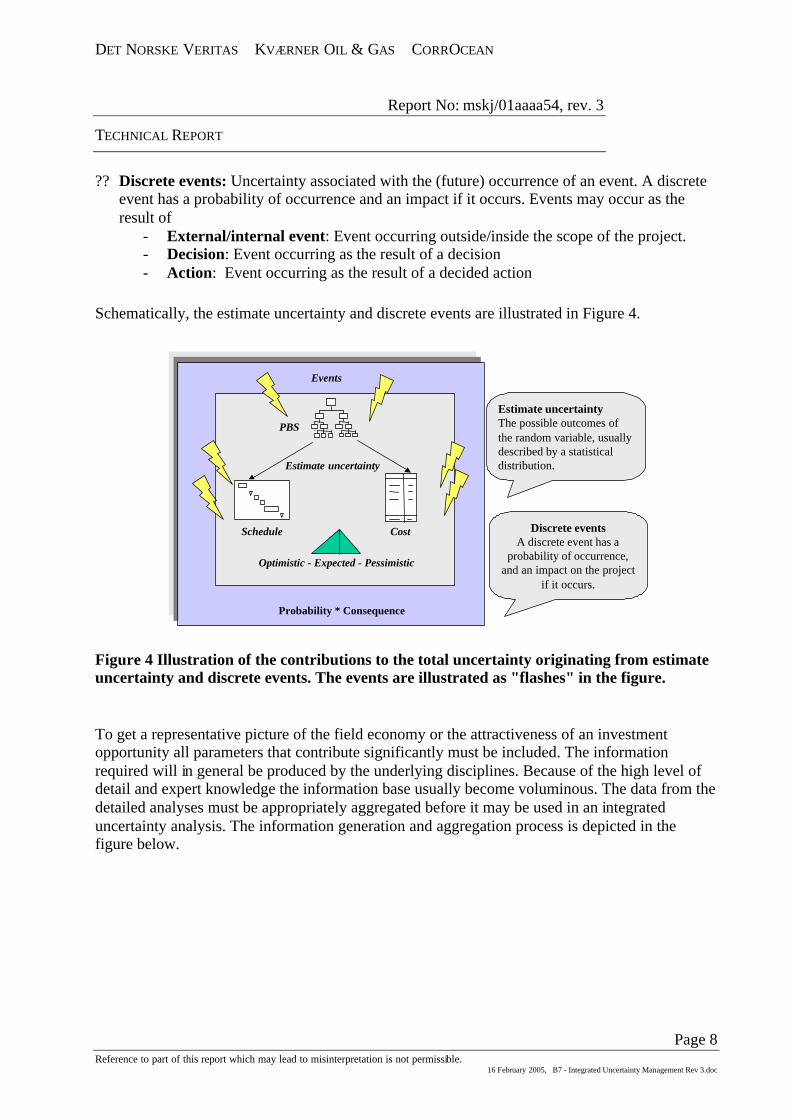
?? Discrete events: Uncertainty associated with the (future) occurrence of an event. A discrete event has a probability of occurrence and an impact if it occurs. Events may occur as the result of
- External/internal event: Event occurring outside/inside the scope of the project. - Decision: Event occurring as the result of a decision - Action: Event occurring as the result of a decided action
Schematically, the estimate uncertainty and discrete events are illustrated in Figure 4.
Probability * Consequence
Discrete eventsA discrete event has a
probability of occurrence,and an impact on the project
if it occurs.
Events
PBS
Schedule Cost
Estimate uncertainty
Optimistic - Expected - Pessimistic
Estimate uncertaintyThe possible outcomes ofthe random variable, usuallydescribed by a statisticaldistribution.
Figure 4 Illustration of the contributions to the total uncertainty originating from estimate uncertainty and discrete events. The events are illustrated as "flashes" in the figure.
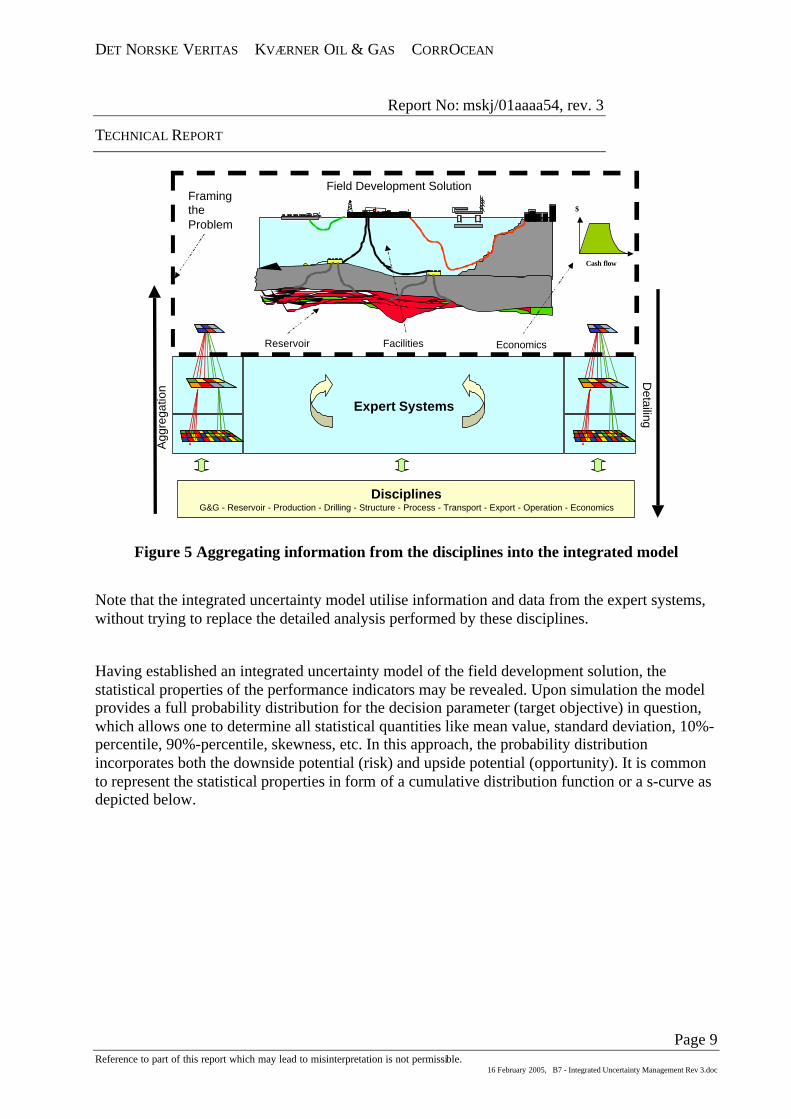
To get a representative picture of the field economy or the attractiveness of an investment opportunity all parameters that contribute significantly must be included. The information required will in general be produced by the underlying disciplines. Because of the high level of detail and expert knowledge the information base usually become voluminous. The data from the detailed analyses must be appropriately aggregated before it may be used in an integrated uncertainty analysis. The information generation and aggregation process is depicted in the figure below.
DET NORSKE VERITAS KVÆRNER OIL & GAS CORROCEAN
Report No: mskj/01aaaa54, rev. 3
TECHNICAL REPORT
Page 9 Reference to part of this report which may lead to misinterpretation is not permissible.
16 February 2005, B7 - Integrated Uncertainty Management Rev 3.doc
Agg
rega
tion
Expert Systems
DisciplinesG&G - Reservoir - Production - Drilling - Structure - Process - Transport - Export - Operation - Economics
Detailing
Reservoir
Field Development Solution
Facilities Economics
Cash flow
$
FramingtheProblem
Figure 5 Aggregating information from the disciplines into the integrated model
Note that the integrated uncertainty model utilise information and data from the expert systems, without trying to replace the detailed analysis performed by these disciplines.
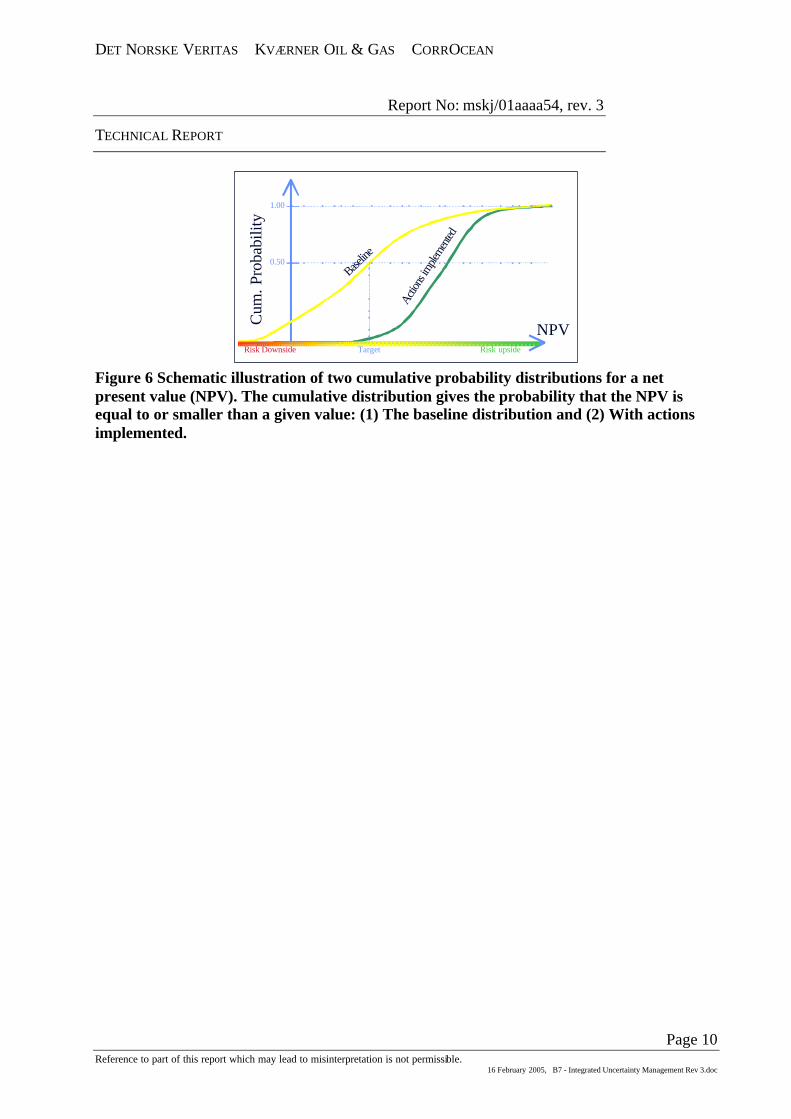
Having established an integrated uncertainty model of the field development solution, the statistical properties of the performance indicators may be revealed. Upon simulation the model provides a full probability distribution for the decision parameter (target objective) in question, which allows one to determine all statistical quantities like mean value, standard deviation, 10%-percentile, 90%-percentile, skewness, etc. In this approach, the probability distribution incorporates both the downside potential (risk) and upside potential (opportunity). It is common to represent the statistical properties in form of a cumulative distribution function or a s-curve as depicted below.
DET NORSKE VERITAS KVÆRNER OIL & GAS CORROCEAN
Report No: mskj/01aaaa54, rev. 3
TECHNICAL REPORT
Page 10 Reference to part of this report which may lead to misinterpretation is not permissible.
16 February 2005, B7 - Integrated Uncertainty Management Rev 3.doc
NPV
Cum
. Pro
babi
lity
Baseline
Actio
ns im
plemen
ted
1.00
0.50
Target Risk upsideRisk Downside
Figure 6 Schematic illustration of two cumulative probability distributions for a net present value (NPV). The cumulative distribution gives the probability that the NPV is equal to or smaller than a given value: (1) The baseline distribution and (2) With actions implemented.
DET NORSKE VERITAS KVÆRNER OIL & GAS CORROCEAN
Report No: mskj/01aaaa54, rev. 3
TECHNICAL REPORT
Page 11 Reference to part of this report which may lead to misinterpretation is not permissible.
16 February 2005, B7 - Integrated Uncertainty Management Rev 3.doc
4.1 The Integrated Risk Modelling Approach (IRMA) method A standardised method named Integrated Risk Modelling Approach (IRMA) have been developed to handle integrated uncertainty analysis for field development solutions. The main objective of the standard method is to develop a model for calculation of decision parameters (target objectives) taking the total uncertainty into account.
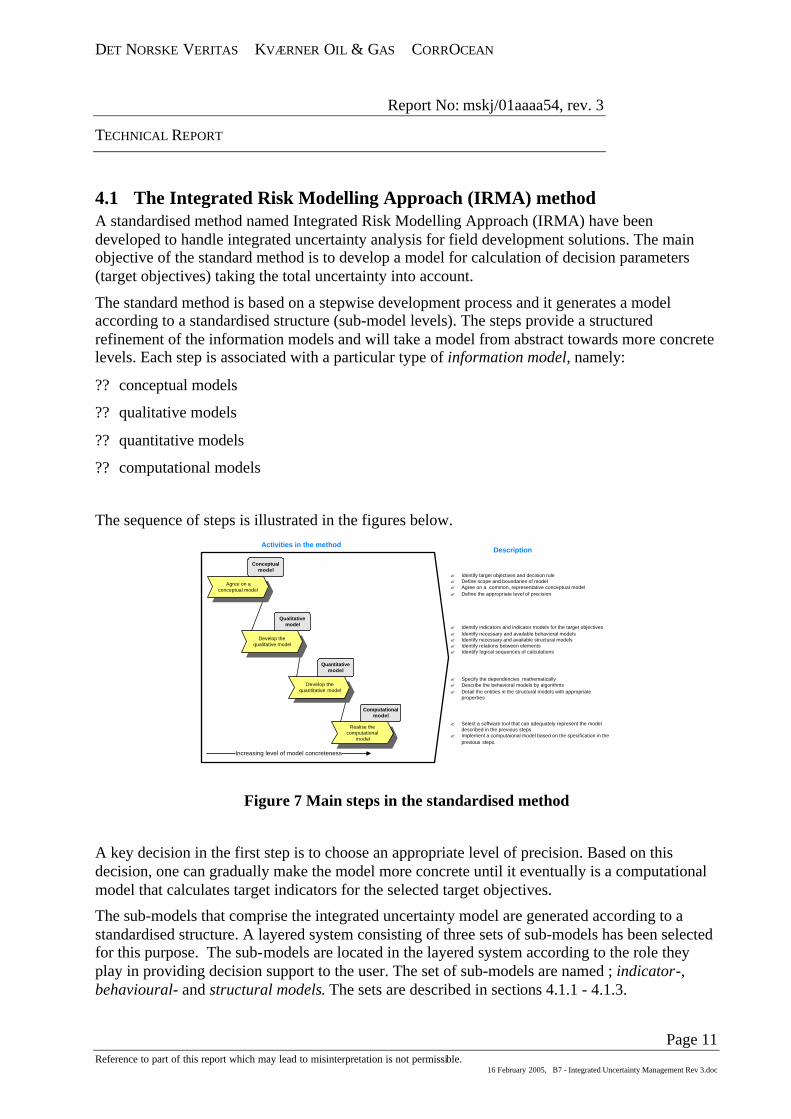
The standard method is based on a stepwise development process and it generates a model according to a standardised structure (sub-model levels). The steps provide a structured refinement of the information models and will take a model from abstract towards more concrete levels. Each step is associated with a particular type of information model, namely:
?? conceptual models
?? qualitative models
?? quantitative models
?? computational models
The sequence of steps is illustrated in the figures below.
DescriptionActivities in the method
Increasing level of model concreteness
Realise thecomputational
model
Computationalmodel
Develop thequantitative model
Quantitativemodel
Develop thequalitative model
Qualitativemodel
Agree on aconceptual model
Conceptualmodel
? Identify target objectives and decision rule? Define scope and boundaries of model? Agree on a common, representative conceptual model? Define the appropriate level of precision
? Identify indicators and indicator models for the target objectives? Identify necessary and available behavioral models? Identify necessary and available structural models? Identify relations between elements? Identify logical sequences of calculations
? Specify the dependencies mathematically? Describe the behavioral models by algorithms? Detail the entities in the structural models with appropriate
properties
? Select a software tool that can adequately represent the modeldescribed in the previous steps
? Implement a computaional model based on the specification in theprevious steps.
Figure 7 Main steps in the standardised method
A key decision in the first step is to choose an appropriate level of precision. Based on this decision, one can gradually make the model more concrete until it eventually is a computational model that calculates target indicators for the selected target objectives.
The sub-models that comprise the integrated uncertainty model are generated according to a standardised structure. A layered system consisting of three sets of sub-models has been selected for this purpose. The sub-models are located in the layered system according to the role they play in providing decision support to the user. The set of sub-models are named ; indicator-, behavioural- and structural models. The sets are described in sections 4.1.1 - 4.1.3.
DET NORSKE VERITAS KVÆRNER OIL & GAS CORROCEAN
Report No: mskj/01aaaa54, rev. 3
TECHNICAL REPORT
Page 12 Reference to part of this report which may lead to misinterpretation is not permissible.
16 February 2005, B7 - Integrated Uncertainty Management Rev 3.doc
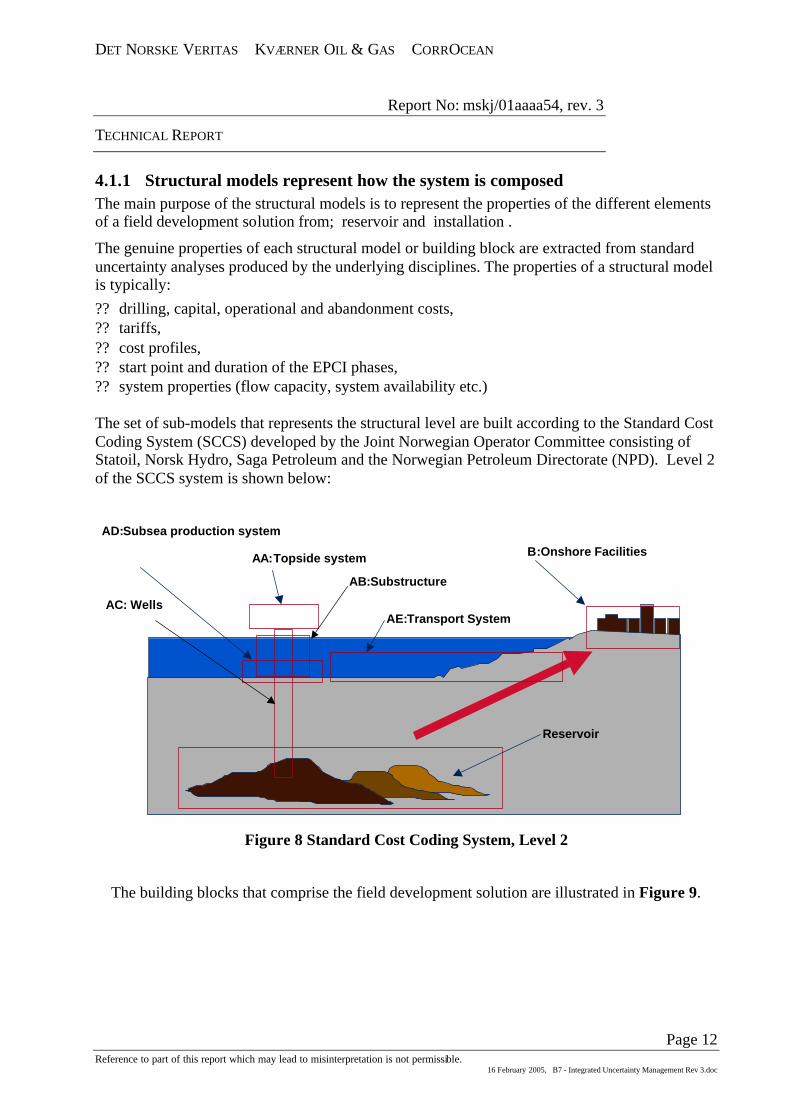
4.1.1 Structural models represent how the system is composed The main purpose of the structural models is to represent the properties of the different elements of a field development solution from; reservoir and installation .
The genuine properties of each structural model or building block are extracted from standard uncertainty analyses produced by the underlying disciplines. The properties of a structural model is typically: ?? drilling, capital, operational and abandonment costs, ?? tariffs, ?? cost profiles, ?? start point and duration of the EPCI phases, ?? system properties (flow capacity, system availability etc.) The set of sub-models that represents the structural level are built according to the Standard Cost Coding System (SCCS) developed by the Joint Norwegian Operator Committee consisting of Statoil, Norsk Hydro, Saga Petroleum and the Norwegian Petroleum Directorate (NPD). Level 2 of the SCCS system is shown below:
AA:Topside system
AD:Subsea production system
AE:Transport System
B:Onshore Facilities
Reservoir
AC: Wells
AB:Substructure
Figure 8 Standard Cost Coding System, Level 2
The building blocks that comprise the field development solution are illustrated in Figure 9.

DET NORSKE VERITAS KVÆRNER OIL & GAS CORROCEAN
Report No: mskj/01aaaa54, rev. 3
TECHNICAL REPORT
Page 13 Reference to part of this report which may lead to misinterpretation is not permissible.
16 February 2005, B7 - Integrated Uncertainty Management Rev 3.doc
SCCSReservoir AA AB AC AD AE
aa (topsides)- aaEpciStart- aaEpciDur- aaCapex- aaCapexStart- aaCapexDur- aaAvail- aaNpco- aaOpex- aaAbdex- aaOilProcTariff- aaGasProcTariff
seg (Segment Model)seg4
seg3seg2
seg1
- seg1NumWells- seg1NumPreWells- seg1RfPlateau- seg1AvgWellDeliv- seg1Gor- seg1Stoiip- seg1Rf
ab (substr.)
- abEpciStart- abEpciDur- abCapex- abCapexStart- abCapexDur- abAvail- abOpex- aaAbdex
ac (wells)
- acEpciStart- acEpciDur- acCapex- acCapexStart- acCapexDur- acAvail- acDrillingStart- acDrillingDur- acTimeDrillex- acOpex- acAbdex
ad (SPS)- adAbdex- adOilOpexOo- adOilOpexPdm- adGasOpexOo- adGasOpexPdm- adTimeOpexOfs- adTimeOpexOns- adTimeOpexIns- adEpciStart- adEpciDur- adCapex- adCapexStart- adCapexDur- adAvail- adOpex- ad2IsQualified- adInfieldFlowCap
ae (Transport)
- aeAbdex- aeOilOpexOo- aeOilOpexPdm- aeGasOpexOo- aeGasOpexPdm- aeTimeOpexOfs- aeTimeOpexOns- aeTimeOpexIns- aeEpciStart- aeEpciDur- aeCapex- aeCapexStart- aeCapexDur- aeAvail
Genuine properties of building blocks
Structural
models
Figure 9 Structural models, Building blocks
4.1.2 Behavioural models represent how the system works The behavioural models represent how things works, interacts or behaves; how the set of structural elements perform. The main purpose of these models is to provide the required information to the indicator (models).
The time schedule of a feasible field development solution represents a behaviour model. The main purpose of the schedule model is to estimate the time-of-first-oil that is input in the oil and gas production model. The schedule model is composed of the necessary activities of the EPCI phases and drilling, which all have to be completed prior to production.
The schedules for the main activities are illustrated in the figures below for the 3 alternatives

DET NORSKE VERITAS KVÆRNER OIL & GAS CORROCEAN
Report No: mskj/01aaaa54, rev. 3
TECHNICAL REPORT
Page 14 Reference to part of this report which may lead to misinterpretation is not permissible.
16 February 2005, B7 - Integrated Uncertainty Management Rev 3.doc
Figure 10 Main activities in the schedule for the 3 alternatives
The schedule model receives input from the structural models with start dates and duration of the various EPCI activities and the necessary drilling before production start, and calculates TOFO that is input to the production model.
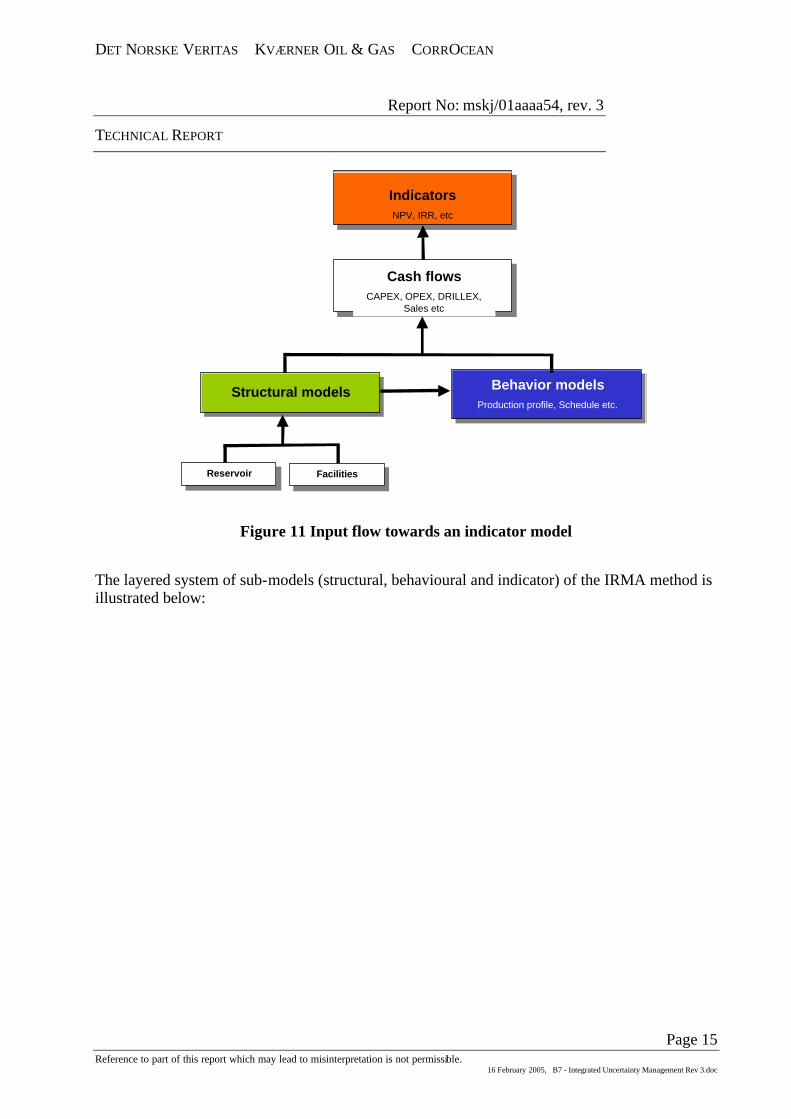
4.1.3 Indicator models measure the system The essential purpose of an indicator is to measure a certain aspect of the modelled system. The Net Present Value (NPV) and the Internal Rate of return (IRR) are two common indicators used to measure different economic aspects of a field development solution.
DET NORSKE VERITAS KVÆRNER OIL & GAS CORROCEAN
Report No: mskj/01aaaa54, rev. 3
TECHNICAL REPORT
Page 15 Reference to part of this report which may lead to misinterpretation is not permissible.
16 February 2005, B7 - Integrated Uncertainty Management Rev 3.doc
IndicatorsNPV, IRR, etc
Cash flowsCAPEX, OPEX, DRILLEX,
Sales etc
Structural models Behavior modelsProduction profile, Schedule etc.
Reservoir Facilities
Figure 11 Input flow towards an indicator model
The layered system of sub-models (structural, behavioural and indicator) of the IRMA method is illustrated below:
DET NORSKE VERITAS KVÆRNER OIL & GAS CORROCEAN
Report No: mskj/01aaaa54, rev. 3
TECHNICAL REPORT
Page 16 Reference to part of this report which may lead to misinterpretation is not permissible.
16 February 2005, B7 - Integrated Uncertainty Management Rev 3.doc
UOR,RF_plat
Ind
icat
or
mo
del
sB
ehav
iour
al M
odel
sS
tru
ctu
ral M
od
els
External or unresolved issues- Oil price- Gas price- Tarifs (?)- Exchange rates
Cost
CO2 TaxOPEXDRILLEX CAPEX
Income
NPV IRR
TOFO
Constraint/Flow Model
QOplateau
DrillingModel
QOinit
TOFO
Total welldeliverability
NP
CO
AvailabilityModel
Availability
- Topsides epci_start, epci_duration- Substructure epci_start, epci_duration- Wells epci_start, epci_duration- Wells drilling_start, drilling_dur- SPS epci_start, epci_duration- Transport epci_start, epci_duration
WellsTopsides Substructure SPS Transport
Flowline capacity
PBS
- Topsides Availability- Substructure Availability- Wells Availability- SPS Availability- Transport Availability
CA
PE
X
Gas prodOil prod
Gas prod
TARIFF
Gas prod
Gas prodOil prod
Wel
ls D
urat
ion
(Dril
ling)
Rig
Rat
e
TOFO
t1 t2 t3
QOplateau
QOinit
Qoil
time
)( 3ttplateaudecline eQOQO ??? ?
Gas
Production Model
- epci_start/dur- capex_start/dur- capex
- epci_start/dur- capex_start/dur- capex
- epci_start/dur- capex_start/dur- capex-drilling_start/dur
- Booster pump or not
New technology
- epci_start/dur- capex_start/dur- capex
- epci_start/dur- capex_start/dur- capex
OP
EX
, W
ells
Dur
atio
n (f
or W
ellh
ead
Pla
tform
)
ABDEX
AB
DE
X
- STOIIP- RF- Avg well deliverability- #wells-#pre-drilled wells
Segment ModelRigs- Rig rate
Avg well deliverability
# wells
# pre-drilled wells
builduprate
Capeff
Schedule Model
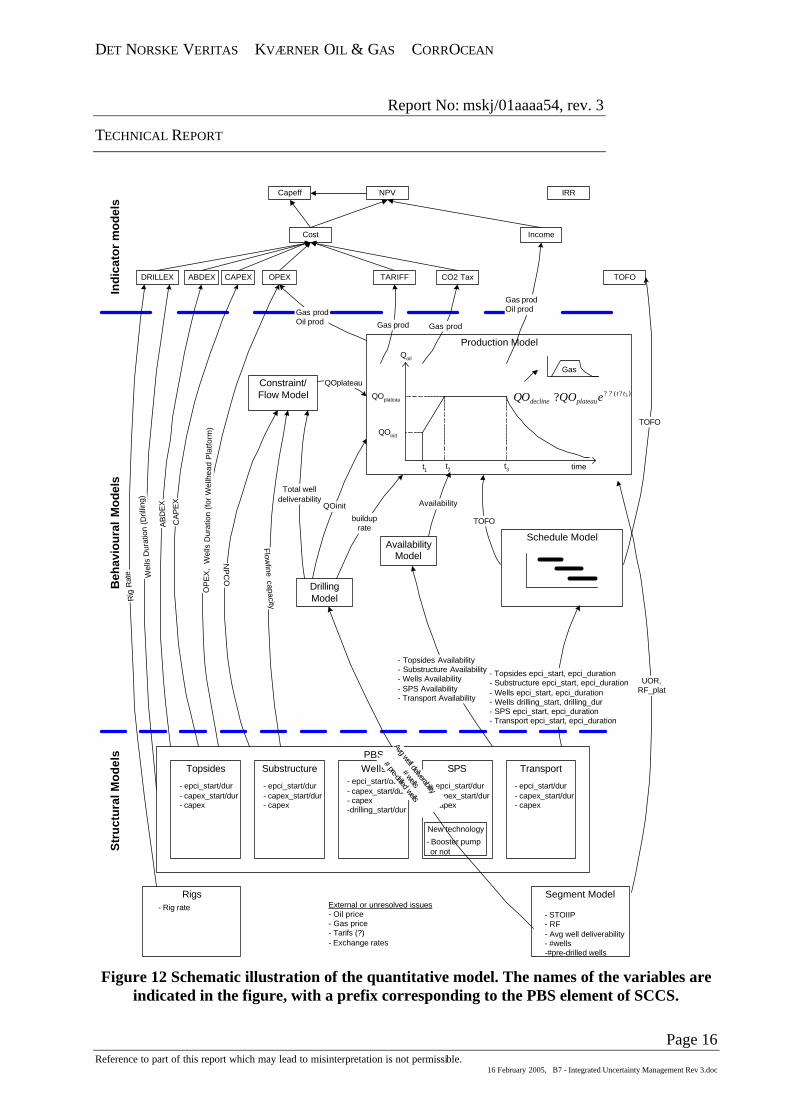
Figure 12 Schematic illustration of the quantitative model. The names of the variables are
indicated in the figure, with a prefix corresponding to the PBS element of SCCS.
DET NORSKE VERITAS KVÆRNER OIL & GAS CORROCEAN
Report No: mskj/01aaaa54, rev. 3
TECHNICAL REPORT
Page 17 Reference to part of this report which may lead to misinterpretation is not permissible.
16 February 2005, B7 - Integrated Uncertainty Management Rev 3.doc
4.2 Strengths of the standardised method As sub-models contain the genuine properties of a structural part of the system, a behavioural part of the system, or an indicator of the system, different concepts or cases may easily be established simply by replacing one sub-model by another. The standardised method is therefore specifically designed for studies of:
- Entirety approach (total uncertainty)
- Concept selection (several different sub-models for the different concepts in the total model)
- Flexibility and robustness (sub-models with different degree of robustness and flexibility)
- New technology (sub-model with new technology)
- Supports the “LEGO” –principle
- Does not replace detailed analyses, but provide a means of aggregating data from the disciplines.
- Handles different levels of detailing

DET NORSKE VERITAS KVÆRNER OIL & GAS CORROCEAN
Report No: mskj/01aaaa54, rev. 3
TECHNICAL REPORT
Page 18 Reference to part of this report which may lead to misinterpretation is not permissible.
16 February 2005, B7 - Integrated Uncertainty Management Rev 3.doc
5 IMPACT ON CURRENT WORK PROCESSES Uncertainty analyses are commonly used today within the various disciplines and throughout the different phases of the lifecycle. However, in order to estimate the total uncertainty of a decision parameter (target objective) the information from these separate analysis need to be integrated. In order to incorporate the integration process, the current work processes need to be altered as illustrated schematically in the figure below.
BusinessProcess
Exploration Appraisal Development Operation Abandonment
Feasibility Concept PDO Prep
IntegratedUncertaintyModelling
Integrator
ManagementEconomyField Dev.ReservoirG&G
Integrated Uncertainty Model
IntegratorManagementEconomyField Dev.
ReservoirG&G
Integrated Uncertainty Model
IntegratedUncertaintyManagement
unc. model
unc. model
unc.model
unc. model
unc. model
unc.model
UncertaintyManagement
IntegratorManagementEconomyField Dev.
ReservoirG&G unc. model
unc. model
unc.model
unc. model
unc. model
unc.model
1.) The activities in thepresent work processes(yellow)
2.) The activities in thestandardised method(green), being integratedacross disciplines andover time.
3.) Integrated uncertaintymanagement, whereintegration is both acrossdisciplines and over time.
Figure 13 Schematic illustration of the work processes (upper), the processes in the standardised method (middle), and the combined process (lower), i.e. the integrated
uncertainty management process.
Note from the figure that a new discipline has emerged, namely the "integrator". The role of the integrator is to facilitate the uncertainty management, i.e. to conduct some of the activities in the method and to facilitate the activities involving several disciplines. Although this is partly the mandate of project leaders today, it still introduces genuinely new activities.
Because of the high level of detail and expert knowledge the information base usually become voluminous. The information must go through a “filtering” process before it may be used in an integrated uncertainty analysis. This “filtering” normally takes place in the disciplines (expert evaluation). The disciplines will hand over information to the uncertainty integrator .
DET NORSKE VERITAS KVÆRNER OIL & GAS CORROCEAN
Report No: mskj/01aaaa54, rev. 3
TECHNICAL REPORT
Page 19 Reference to part of this report which may lead to misinterpretation is not permissible.
16 February 2005, B7 - Integrated Uncertainty Management Rev 3.doc
6 CONCEPT EVALUATION This section gives a short description of how the method and results presented in this report may be applied to concept evaluation and ranking.
From a technological viewpoint the main purpose of the evaluation is to come up with the “best” development concept for the field. The term development concept refers here to the assessment of the field’s production base and commercial potential as well as outlines of any technical solution, utilisation of existing infrastructure and transportation alternatives.
6.1 Objective of the analysis In order to demonstrate the use of the method an uncertainty analysis of a set of field development alternatives have been performed. For details with regards to calculation procedure, see reference /5/.
The objective of the uncertainty analyses is to provide decision support regarding the following decisions: ?? Selection of development solution
?? Assessing concepts robustness ?? Assessing cost-benefit of robustness
?? Assessing cost-effectiveness of flexibility ?? Deciding on the use of new technology The documentation produced to support each of the decisions are presented in the following.
6.2 Different ranking criteria for alternative decisions Decision support means information that allows the decision-makers to rank different alternatives according to some ranking criteria or decision rule. Different decision-makers may have different criteria for ranking the alternatives, as they may have different risk attitude. The decision-maker’s risk attitude determines which decision criteria are the more important. The chosen criteria will reflect the risk attitude of the decision-maker. Three target objectives are selected here. The first two are strictly financial, namely, ?? Net present value (NPV) ?? Capital efficiency (Capeff) In addition to these, it is of special interest to assess also ?? Time of first oil (TOFO) This in particular may depend on the maturity of the chosen technology.
In order to rank decisions, a decision rule or ranking criteria must be established. For the Demonstrator, the following alternative ranking criteria will be used: ?? Ranking alternatives based on the expected value ?? Ranking alternatives based on distribution percentiles P10/P90.
DET NORSKE VERITAS KVÆRNER OIL & GAS CORROCEAN
Report No: mskj/01aaaa54, rev. 3
TECHNICAL REPORT
Page 20 Reference to part of this report which may lead to misinterpretation is not permissible.
16 February 2005, B7 - Integrated Uncertainty Management Rev 3.doc
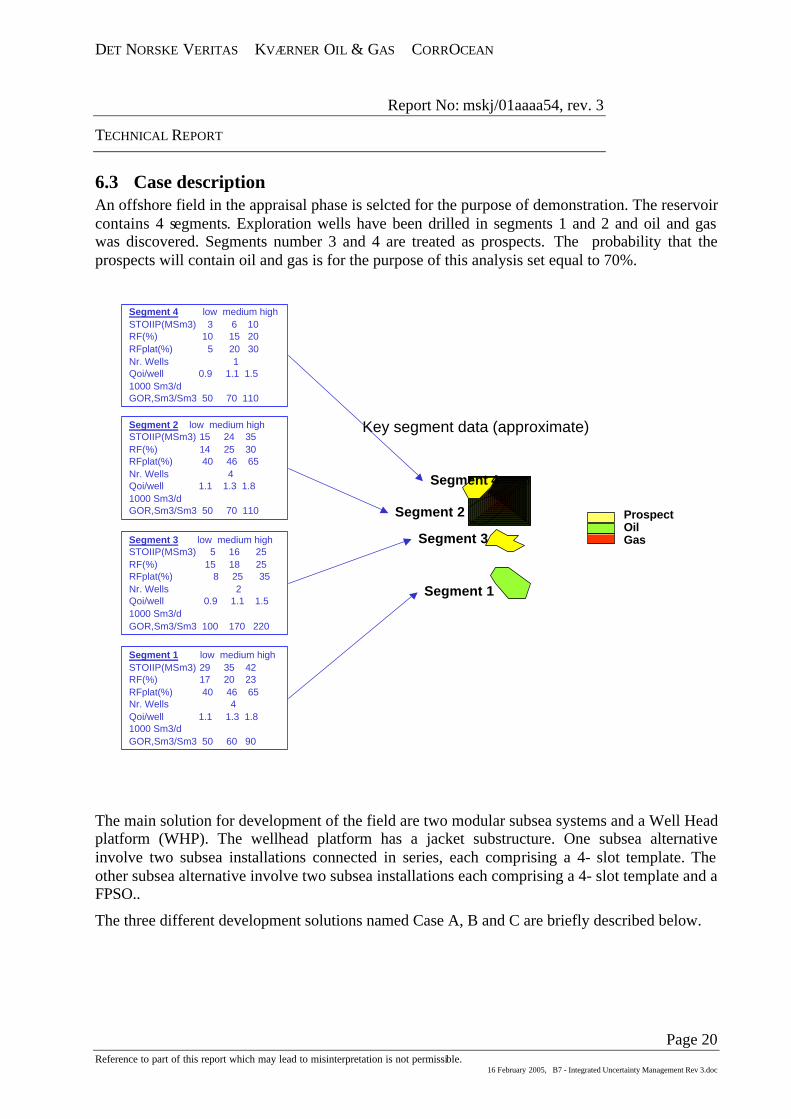
6.3 Case description An offshore field in the appraisal phase is selcted for the purpose of demonstration. The reservoir contains 4 segments. Exploration wells have been drilled in segments 1 and 2 and oil and gas was discovered. Segments number 3 and 4 are treated as prospects. The probability that the prospects will contain oil and gas is for the purpose of this analysis set equal to 70%.
Segment 3
Segment 4
Segment 2
Segment 2 low medium highSTOIIP(MSm3) 15 24 35RF(%) 14 25 30RFplat(%) 40 46 65Nr. Wells 4Qoi/well 1.1 1.3 1.81000 Sm3/dGOR,Sm3/Sm3 50 70 110 Prospect
OilGas
Key segment data (approximate)
Segment 1 low medium highSTOIIP(MSm3) 29 35 42RF(%) 17 20 23RFplat(%) 40 46 65Nr. Wells 4Qoi/well 1.1 1.3 1.81000 Sm3/dGOR,Sm3/Sm3 50 60 90
Segment 3 low medium highSTOIIP(MSm3) 5 16 25RF(%) 15 18 25RFplat(%) 8 25 35Nr. Wells 2Qoi/well 0.9 1.1 1.51000 Sm3/dGOR,Sm3/Sm3 100 170 220
Segment 4 low medium highSTOIIP(MSm3) 3 6 10RF(%) 10 15 20RFplat(%) 5 20 30Nr. Wells 1Qoi/well 0.9 1.1 1.51000 Sm3/dGOR,Sm3/Sm3 50 70 110
Segment 1
The main solution for development of the field are two modular subsea systems and a Well Head platform (WHP). The wellhead platform has a jacket substructure. One subsea alternative involve two subsea installations connected in series, each comprising a 4- slot template. The other subsea alternative involve two subsea installations each comprising a 4- slot template and a FPSO..
The three different development solutions named Case A, B and C are briefly described below.
DET NORSKE VERITAS KVÆRNER OIL & GAS CORROCEAN
Report No: mskj/01aaaa54, rev. 3
TECHNICAL REPORT
Page 21 Reference to part of this report which may lead to misinterpretation is not permissible.
16 February 2005, B7 - Integrated Uncertainty Management Rev 3.doc
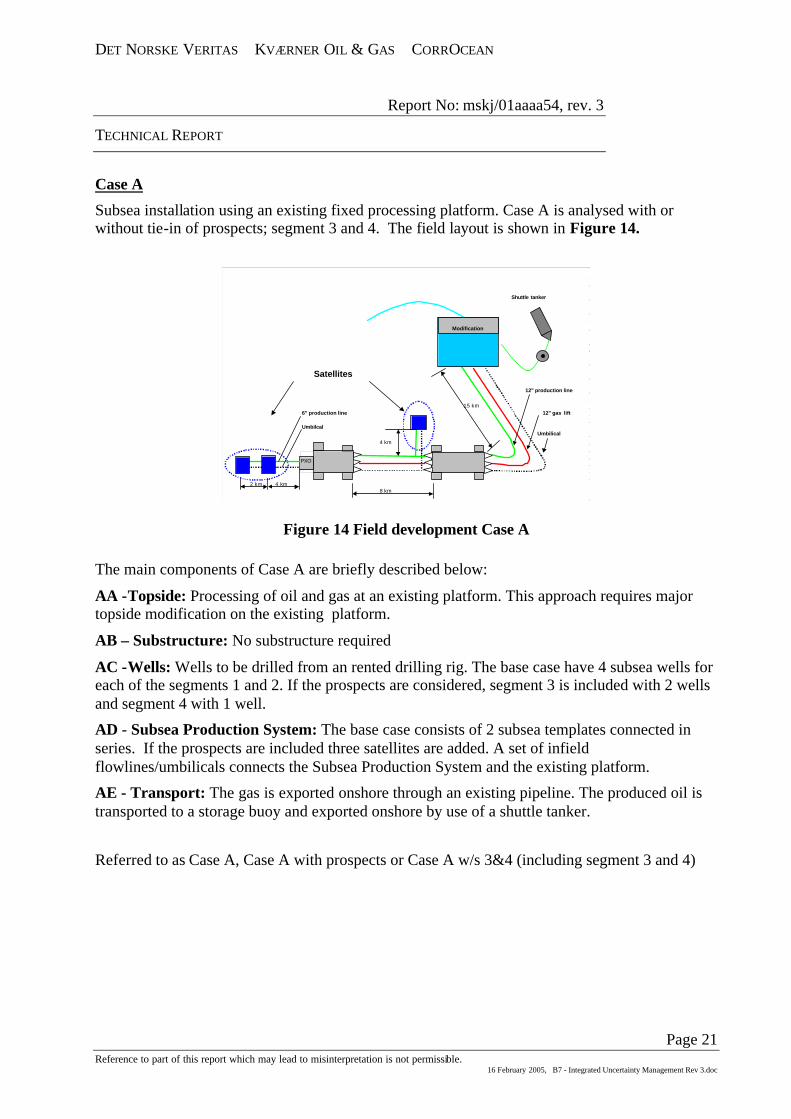
Case A
Subsea installation using an existing fixed processing platform. Case A is analysed with or without tie-in of prospects; segment 3 and 4. The field layout is shown in Figure 14.
Shuttle tanker
12" production line
15 km6" production line 12" gas lift
UmbilcalUmbilical
4 km
2 km 4 km8 km
PXO
Modification
Satellites
Figure 14 Field development Case A
The main components of Case A are briefly described below:
AA -Topside: Processing of oil and gas at an existing platform. This approach requires major topside modification on the existing platform.
AB – Substructure: No substructure required
AC -Wells: Wells to be drilled from an rented drilling rig. The base case have 4 subsea wells for each of the segments 1 and 2. If the prospects are considered, segment 3 is included with 2 wells and segment 4 with 1 well.
AD - Subsea Production System: The base case consists of 2 subsea templates connected in series. If the prospects are included three satellites are added. A set of infield flowlines/umbilicals connects the Subsea Production System and the existing platform.
AE - Transport: The gas is exported onshore through an existing pipeline. The produced oil is transported to a storage buoy and exported onshore by use of a shuttle tanker.
Referred to as Case A, Case A with prospects or Case A w/s 3&4 (including segment 3 and 4)
DET NORSKE VERITAS KVÆRNER OIL & GAS CORROCEAN
Report No: mskj/01aaaa54, rev. 3
TECHNICAL REPORT
Page 22 Reference to part of this report which may lead to misinterpretation is not permissible.
16 February 2005, B7 - Integrated Uncertainty Management Rev 3.doc
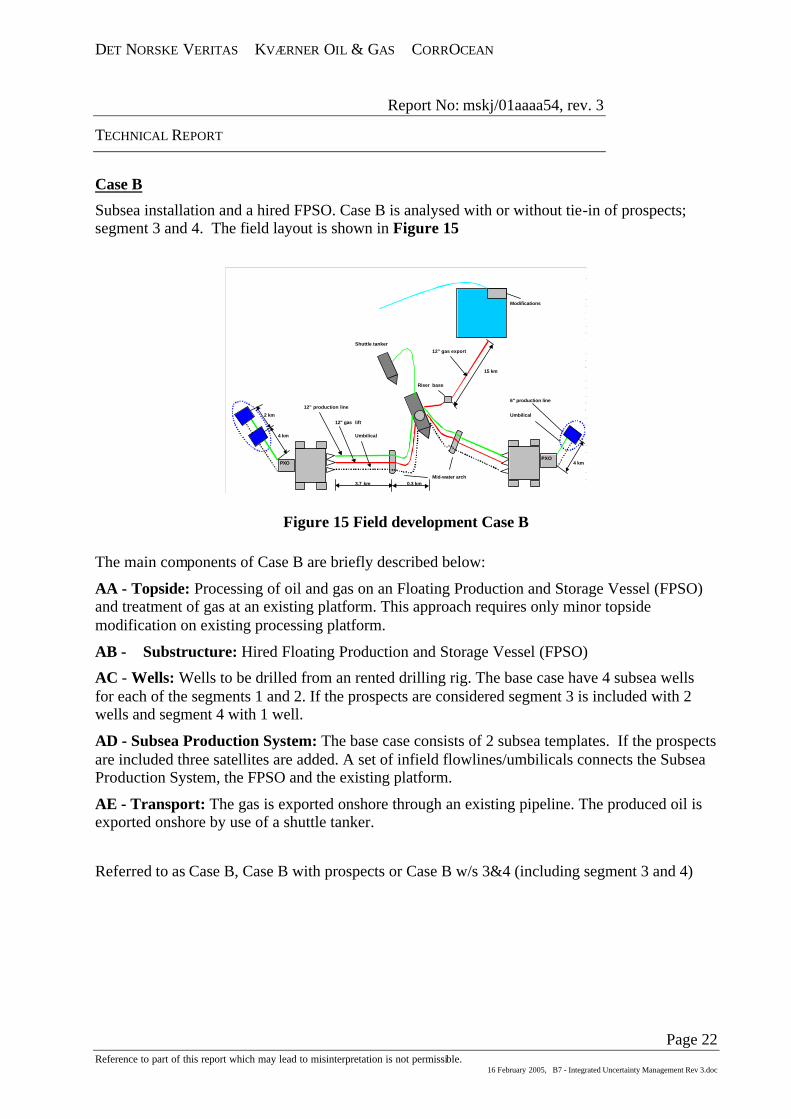
Case B
Subsea installation and a hired FPSO. Case B is analysed with or without tie-in of prospects; segment 3 and 4. The field layout is shown in Figure 15
Modifications
Shuttle tanker12" gas export
15 km
Riser base
6" production line12" production line
2 km Umbilical12" gas lift
4 km Umbilical
4 km
Mid-water arch3.7 km 0.3 km
PXOPXO
Figure 15 Field development Case B
The main components of Case B are briefly described below:
AA - Topside: Processing of oil and gas on an Floating Production and Storage Vessel (FPSO) and treatment of gas at an existing platform. This approach requires only minor topside modification on existing processing platform.
AB - Substructure: Hired Floating Production and Storage Vessel (FPSO)
AC - Wells: Wells to be drilled from an rented drilling rig. The base case have 4 subsea wells for each of the segments 1 and 2. If the prospects are considered segment 3 is included with 2 wells and segment 4 with 1 well.
AD - Subsea Production System: The base case consists of 2 subsea templates. If the prospects are included three satellites are added. A set of infield flowlines/umbilicals connects the Subsea Production System, the FPSO and the existing platform.
AE - Transport: The gas is exported onshore through an existing pipeline. The produced oil is exported onshore by use of a shuttle tanker.
Referred to as Case B, Case B with prospects or Case B w/s 3&4 (including segment 3 and 4)
DET NORSKE VERITAS KVÆRNER OIL & GAS CORROCEAN
Report No: mskj/01aaaa54, rev. 3
TECHNICAL REPORT
Page 23 Reference to part of this report which may lead to misinterpretation is not permissible.
16 February 2005, B7 - Integrated Uncertainty Management Rev 3.doc
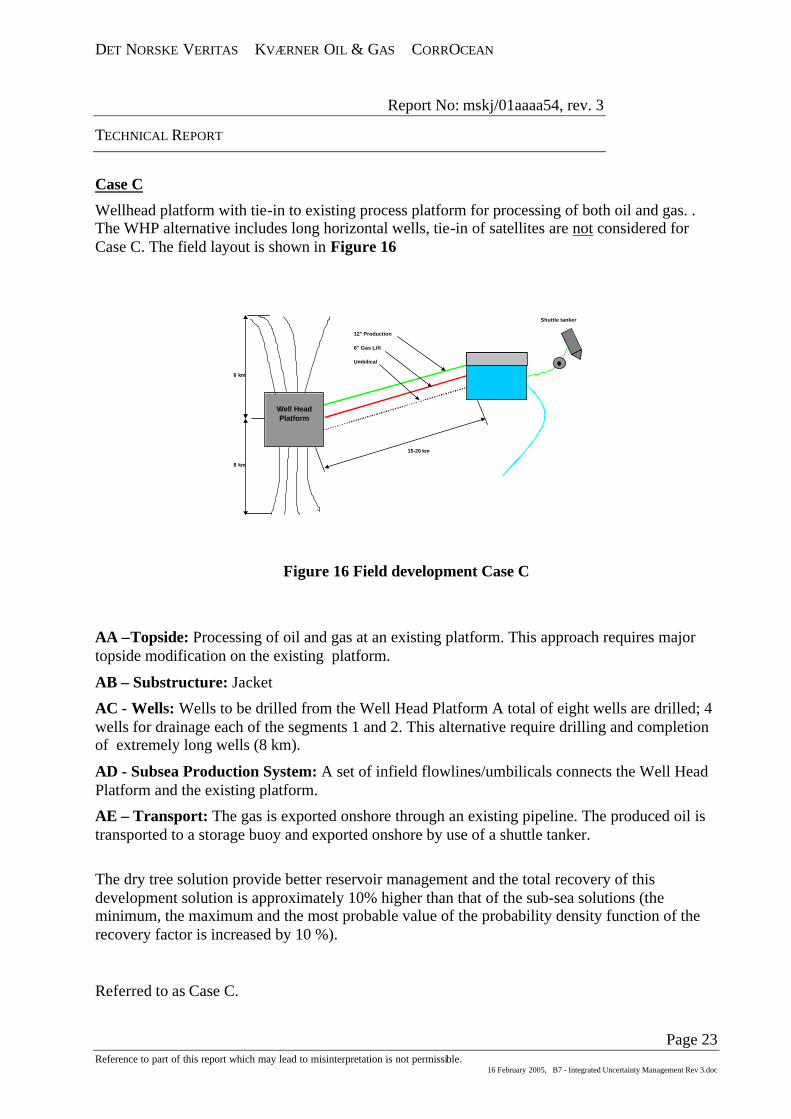
Case C
Wellhead platform with tie-in to existing process platform for processing of both oil and gas. . The WHP alternative includes long horizontal wells, tie-in of satellites are not considered for Case C. The field layout is shown in Figure 16
Shuttle tanker
12" Production
6" Gas Lift
Umbilical
8 km
15-20 km
8 km
Well Head Platform
Figure 16 Field development Case C
AA –Topside: Processing of oil and gas at an existing platform. This approach requires major topside modification on the existing platform.
AB – Substructure: Jacket
AC - Wells: Wells to be drilled from the Well Head Platform A total of eight wells are drilled; 4 wells for drainage each of the segments 1 and 2. This alternative require drilling and completion of extremely long wells (8 km).
AD - Subsea Production System: A set of infield flowlines/umbilicals connects the Well Head Platform and the existing platform.
AE – Transport: The gas is exported onshore through an existing pipeline. The produced oil is transported to a storage buoy and exported onshore by use of a shuttle tanker. The dry tree solution provide better reservoir management and the total recovery of this development solution is approximately 10% higher than that of the sub-sea solutions (the minimum, the maximum and the most probable value of the probability density function of the recovery factor is increased by 10 %).
Referred to as Case C.
DET NORSKE VERITAS KVÆRNER OIL & GAS CORROCEAN
Report No: mskj/01aaaa54, rev. 3
TECHNICAL REPORT
Page 24 Reference to part of this report which may lead to misinterpretation is not permissible.
16 February 2005, B7 - Integrated Uncertainty Management Rev 3.doc
6.4 Selection of Development Solution Providing decision support with regard to concept selection is one of the strengths of the standardised method. The method allows for calculation of the relevant indicators that serve as the basis for the decision support.
In addition to the selection process described above, more detailed information regarding the alternatives may be obtained using various sensitivity measures. The sensitivity analysis provides more insight into the various contributions to the uncertainty
After the alternatives have been ranked according to the ranking criteria/decision rule, the robustness of the concept should be analysed. This comprises
?? Robustness of physical system: The likelihood that a physical parameter (pressure, temperature, weight, etc) stays within the acceptance limits (design criteria). The robustness is a measure of how much variation in physical parameters the selected concept can accept.
?? Robustness of indicators: The likelihood that the indicator(s) for the target objectives stay(s) within the acceptance limits and how much variation in underlying parameters can the indicators accept before they fall outside the acceptance limits.
?? Robustness of decision: The likelihood that the "best" decision will - in retrospect - still be the best decision, and how much variation in the underlying parameters can the alternatives accept before the ranking is altered.
The information on sensitivity and robustness provide additional information that may be used directly to rank the alternatives (by letting the sensitivity/robustness be the ranking criteria) or indirectly as a means to substantiate the ranking/decision.
DET NORSKE VERITAS KVÆRNER OIL & GAS CORROCEAN
Report No: mskj/01aaaa54, rev. 3
TECHNICAL REPORT
Page 25 Reference to part of this report which may lead to misinterpretation is not permissible.
16 February 2005, B7 - Integrated Uncertainty Management Rev 3.doc
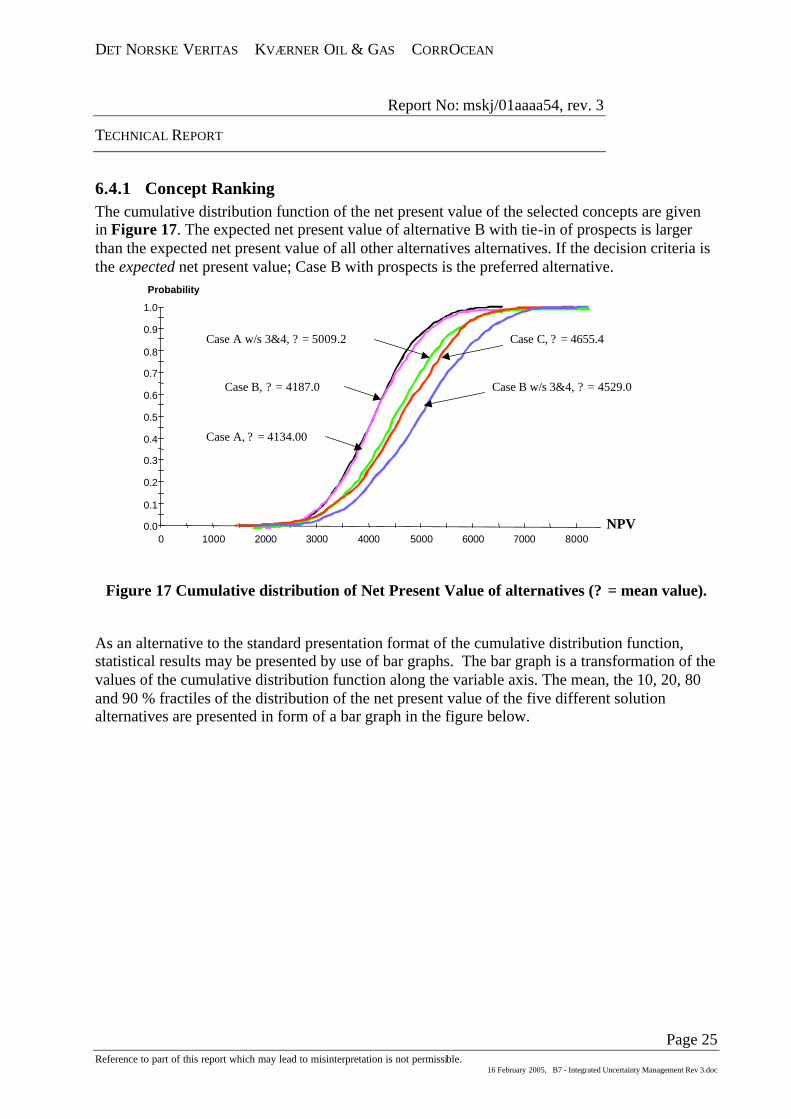
6.4.1 Concept Ranking The cumulative distribution function of the net present value of the selected concepts are given in Figure 17. The expected net present value of alternative B with tie-in of prospects is larger than the expected net present value of all other alternatives alternatives. If the decision criteria is the expected net present value; Case B with prospects is the preferred alternative.
0.0
0.1
0.2
0.3
0.4
0.5
0.6
0.7
0.8
0.9
1.0
0 1000 2000 3000 4000 5000 6000 7000 8000
Probability
NPV
Case A, ? = 4134.00
Case B, ? = 4187.0
Case A w/s 3&4, ? = 5009.2
Case B w/s 3&4, ? = 4529.0
Case C, ? = 4655.4
Figure 17 Cumulative distribution of Net Present Value of alternatives (? = mean value).
As an alternative to the standard presentation format of the cumulative distribution function, statistical results may be presented by use of bar graphs. The bar graph is a transformation of the values of the cumulative distribution function along the variable axis. The mean, the 10, 20, 80 and 90 % fractiles of the distribution of the net present value of the five different solution alternatives are presented in form of a bar graph in the figure below.

DET NORSKE VERITAS KVÆRNER OIL & GAS CORROCEAN
Report No: mskj/01aaaa54, rev. 3
TECHNICAL REPORT
Page 26 Reference to part of this report which may lead to misinterpretation is not permissible.
16 February 2005, B7 - Integrated Uncertainty Management Rev 3.doc
3000 4000 5000 6000
Case A
Case B
Case A w/s 3&4
Case C
Case B w/s 3&4
npv
10-90 percentile
20-80 percentile
Mean
Statistics for npv
Figure 18 Bar graph of Net Present Value of alternatives.
If we select the expected capital efficiency as the decision rule, Case C is the best alternative, see Figure 18. And the upside potential of Case C is significant larger than for the other alternatives with regards to capital efficiency. Note that the ranking of the alternatives have changed as compared to the ranking based on the expected net present value.
However, if the decision criteria is changed to the 10% fractile of the distribution, Case A becomes the preferred alternative.
0.6 0.7 0.8 0.9 1.0 1.1 1.2 1.3 1.4 1.5 1.6 1.7 1.8
Case B
Case B w/s 3&4
Case A w/s 3&4
Case A
Case C
Statistics for Capeff
10-90 percentile
20-80 percentile
Mean
Capeff
Figure 19 Statistics for Capital Efficiency of the different alternatives.
DET NORSKE VERITAS KVÆRNER OIL & GAS CORROCEAN
Report No: mskj/01aaaa54, rev. 3
TECHNICAL REPORT
Page 27 Reference to part of this report which may lead to misinterpretation is not permissible.
16 February 2005, B7 - Integrated Uncertainty Management Rev 3.doc
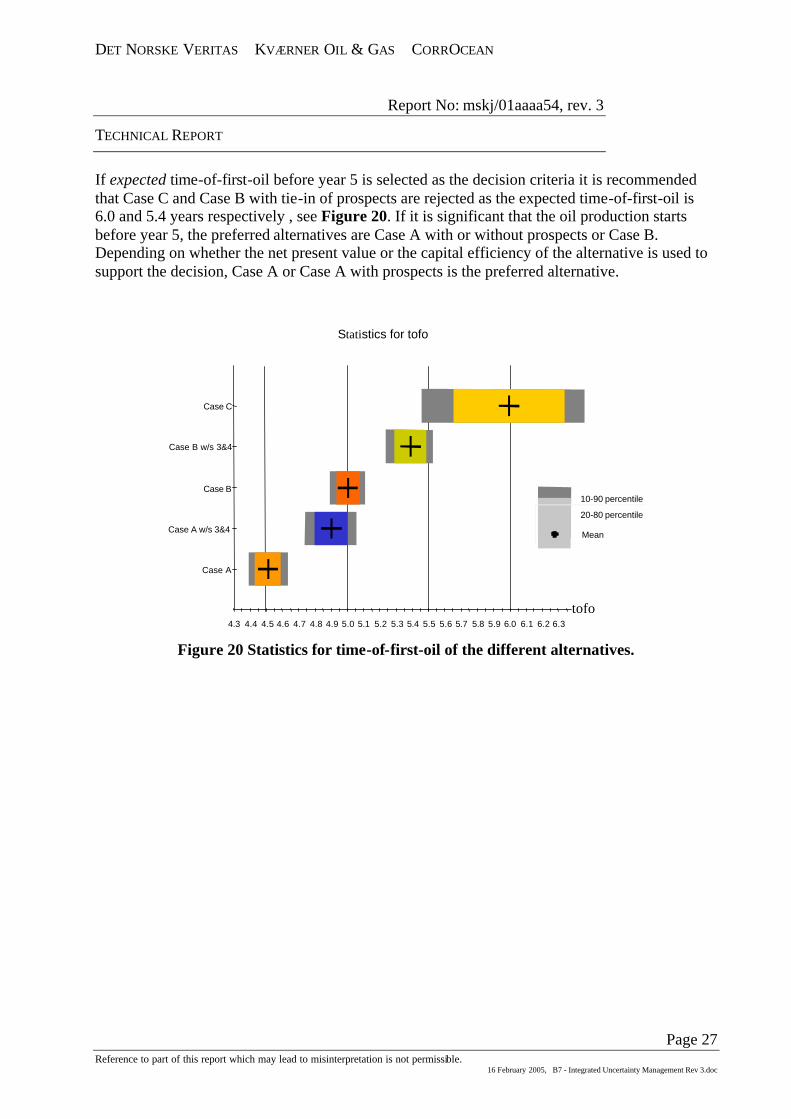
If expected time-of-first-oil before year 5 is selected as the decision criteria it is recommended that Case C and Case B with tie-in of prospects are rejected as the expected time-of-first-oil is 6.0 and 5.4 years respectively , see Figure 20. If it is significant that the oil production starts before year 5, the preferred alternatives are Case A with or without prospects or Case B. Depending on whether the net present value or the capital efficiency of the alternative is used to support the decision, Case A or Case A with prospects is the preferred alternative.
4.3 4.4 4.5 4.6 4.7 4.8 4.9 5.0 5.1 5.2 5.3 5.4 5.5 5.6 5.7 5.8 5.9 6.0 6.1 6.2 6.3
Case A
Case A w/s 3&4
Case B
Case B w/s 3&4
Case C
Statistics for tofo
10-90 percentile
20-80 percentile
Mean
tofo
Figure 20 Statistics for time-of-first-oil of the different alternatives.

DET NORSKE VERITAS KVÆRNER OIL & GAS CORROCEAN
Report No: mskj/01aaaa54, rev. 3
TECHNICAL REPORT
Page 28 Reference to part of this report which may lead to misinterpretation is not permissible.
16 February 2005, B7 - Integrated Uncertainty Management Rev 3.doc
6.5 Sensitivity measures In an uncertainty analysis, all uncertainties contribute to the (total) uncertainty of the output variable. In order to identify appropriate measures to manage the uncertainties, it is of special interest to identify which are the most important uncertainties. Case A has been selected for the purpose of illustration.
Sensitivity of output variable to omission of an uncertainty, i.e. making an uncertainty deterministic is illustrated by fixing the following variables: ?? Topside expenditure; aaCapex (lump-sum contract for topside upgrading) ?? Recovery factor of segments 1 and 2 ?? In-place volumes for segments 1 and 2 The deterministic values are set equal to the most probable value of the distribution. The results of the sensitivity analysis is presented graphically in the tornado plot.
3000 3200 3400 3600 3800 4000 4200 4400 4600 4800 5000 5200 5400
Case A
Case A Fixed Stoiip
Case A Fixed aaCapex
Case A Fixed Rf
Statistics for NPV
10-90 percentile
20-80 percentile
Mean
NPV
Figure 21 Omission sensitivity; The uncertainty in the input variables is eliminated and the effect on the uncertainty of the output variable is illustrated. Out of the variables looked at her, the recovery factors are the most important uncertainties as this has the largest influence on the overall results.
If the benefit of controlling/eliminating the uncertainty as calculated by this approach outweighs the cost, the action is cost-effective. The difference between the expected net present value of base case and the case with a lump- sum contract for topside upgrading is 170 MNOK. It is cost-effective to eliminate this uncertainty if the payment is less than this amount.

DET NORSKE VERITAS KVÆRNER OIL & GAS CORROCEAN
Report No: mskj/01aaaa54, rev. 3
TECHNICAL REPORT
Page 29 Reference to part of this report which may lead to misinterpretation is not permissible.
16 February 2005, B7 - Integrated Uncertainty Management Rev 3.doc
Sensitivity of output to changes in a parameter describing a distribution (e.g. a mean value, variance, P10/P90, etc) is illustrated by changing the following properties: ?? The most probable outcome of the Recovery factor of segments 1 and 2 decreased by 5% ?? The most probable outcome of the In-place volumes for segments 1 and 2 decreased by 10% ?? The P10 of In-place volumes of segments 1 and 2 decreased by 30% The results of the sensitivity analysis is presented graphically in the tornado plot.
10-90 percentile
20-80 percentile
Mean
2400 2600 2800 3000 3200 3400 3600 3800 4000 4200 4400 4600 4800 5000 5200
Case A Low Stoiip -30%
Case A MostProb Stoiip -10%
Case A MostProb Rf -5%
Case A
Statistics for NPV
NPV
Figure 22 Parametric sensitivity; The parameter describing the distribution is changed and the effect on the uncertainty of the output variable is illustrated.
Among those sensitivities investigate here the decrease of the lower limit of the distribution function of the in-place-volume is the most important as this variable has the largest influence on the overall results. If the recovery factor is reduced by 30%, the net present value of the investment decreases by 430MNOK. Importance may be ranged based on a realistic change, on a percentage change etc., however, as the ranking express the relative importance of variables the change need to be harmonised.

DET NORSKE VERITAS KVÆRNER OIL & GAS CORROCEAN
Report No: mskj/01aaaa54, rev. 3
TECHNICAL REPORT
Page 30 Reference to part of this report which may lead to misinterpretation is not permissible.
16 February 2005, B7 - Integrated Uncertainty Management Rev 3.doc
6.5.1 Robustness, flexibility and real options The sensitivity measures defined so far address questions of the form "How much does the output change when the input variables change?" Instead we might be interested in the answer to “What is the probability of upgrading given the selected concept?
6.5.1.1 Robustness of physical system A physical system is designed to meet different design criteria, such as area, weight, process capacity, etc. If the actual performance of the system does not meet these criteria, actions have to be implemented. To minimise the chance of having to perform such after-the-fact actions, one may add robustness to the physical system by (cost-effectively) investing in extended design criteria, such as estimated necessary oil processing capacity plus added reserve.
The process of obtaining optimal design criteria is not trivial. The process is outlined in a simplified manner below.
?? The distribution of the “required” oil production capacity and the selected design values are given, see Figure 23. The required oil production capacity is estimated to be between 40,000 and 100,000 STB/d with 50,000 as the most likely value. The design value is set equal to the expected value (? ), the most probable (peak) and the 10, 50 and 90 % fractiles (p10, p50 and p90) of the probability density function. The probability that the selected design value is adequate defines the robustness of the design. The failure domain is defined as the area beyond the design value; the probability that re-work is required is illustrated in the figure for a design value equal to p90.
Probability density function
0
0.000005
0.00001
0.000015
0.00002
0.000025
0.00003
0.000035
0.00004
40000 50000 60000 70000 80000 90000 100000
Oil Production Capacity [STB/d]
p[O
il P
rod
uct
ion
Cap
acity
]
Distr. Mean p50 Peak p10 p90
Failure domain
Figure 23 Distribution of the “required” oil production capacity, design criterion and associated failure domain
DET NORSKE VERITAS KVÆRNER OIL & GAS CORROCEAN
Report No: mskj/01aaaa54, rev. 3
TECHNICAL REPORT
Page 31 Reference to part of this report which may lead to misinterpretation is not permissible.
16 February 2005, B7 - Integrated Uncertainty Management Rev 3.doc
The area of the failure domain is a function of the selected design value and decreases as the design value increases. However, it is normally not cost-efficient to select the largest estimated value as the design value.
A Floating Production and Storage Vessel (FPSO) has been selected for the purpose of demonstration. The weight and area of the production plant of a FPSO may only be increased within certain limits after the main dimensions of the vessel has been decided upon. In order to find the most cost-efficient design value the following relations are derived:
?? The expected cost of an FPSO as function of production capacity (design value). The cost per STB/D is set equal to 47,000 NOK
?? The probability of upgrading as function of the design value.
?? The expected cost of re-work. The cost of re-work is a calculated as the standard cost times a re-work factor. In this demonstrator, the re-work factor equals the ratio of the selected design value and the estimated maximum “required” oil production capacity.
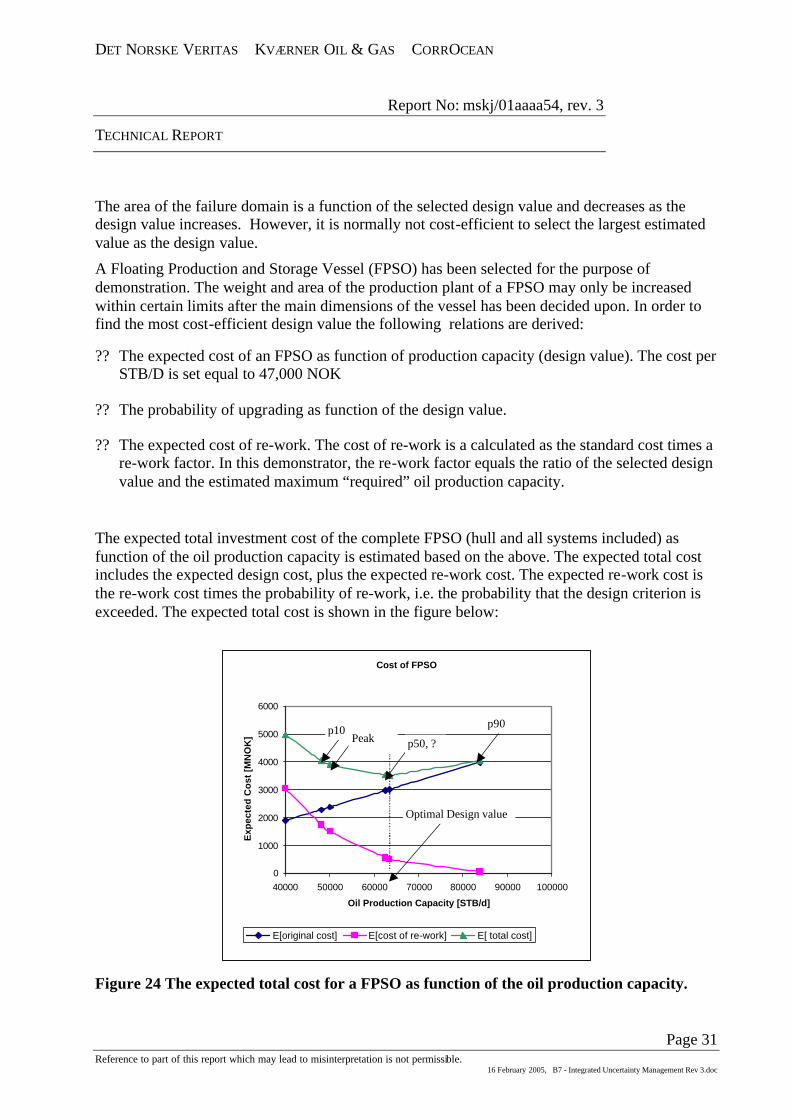
The expected total investment cost of the complete FPSO (hull and all systems included) as function of the oil production capacity is estimated based on the above. The expected total cost includes the expected design cost, plus the expected re-work cost. The expected re-work cost is the re-work cost times the probability of re-work, i.e. the probability that the design criterion is exceeded. The expected total cost is shown in the figure below:
Cost of FPSO
0
1000
2000
3000
4000
5000
6000
40000 50000 60000 70000 80000 90000 100000
Oil Production Capacity [STB/d]
Exp
ecte
d C
ost
[M
NO
K]
E[original cost] E[cost of re-work] E[ total cost]
Optimal Design value
p50, ?p10
Peakp90
Figure 24 The expected total cost for a FPSO as function of the oil production capacity.
DET NORSKE VERITAS KVÆRNER OIL & GAS CORROCEAN
Report No: mskj/01aaaa54, rev. 3
TECHNICAL REPORT
Page 32 Reference to part of this report which may lead to misinterpretation is not permissible.
16 February 2005, B7 - Integrated Uncertainty Management Rev 3.doc
The design value of the oil production capacity should be set equal to the expected value of the distribution in order to minimise the expected total cost of the development solution; the FPSO should be designed based on this value. If the 10% fractile is selected as the design value, the total expected cost increase with 400 MNOK.
For this particular case the optimal design value is the expected value even though the probability of exceedance of the 90% fractile design value is significant lower than that of the expected value; increasing the robustness of the design through an increase of the design value of the oil production capacity beyond the expected value is not cost-efficient for this particular case.
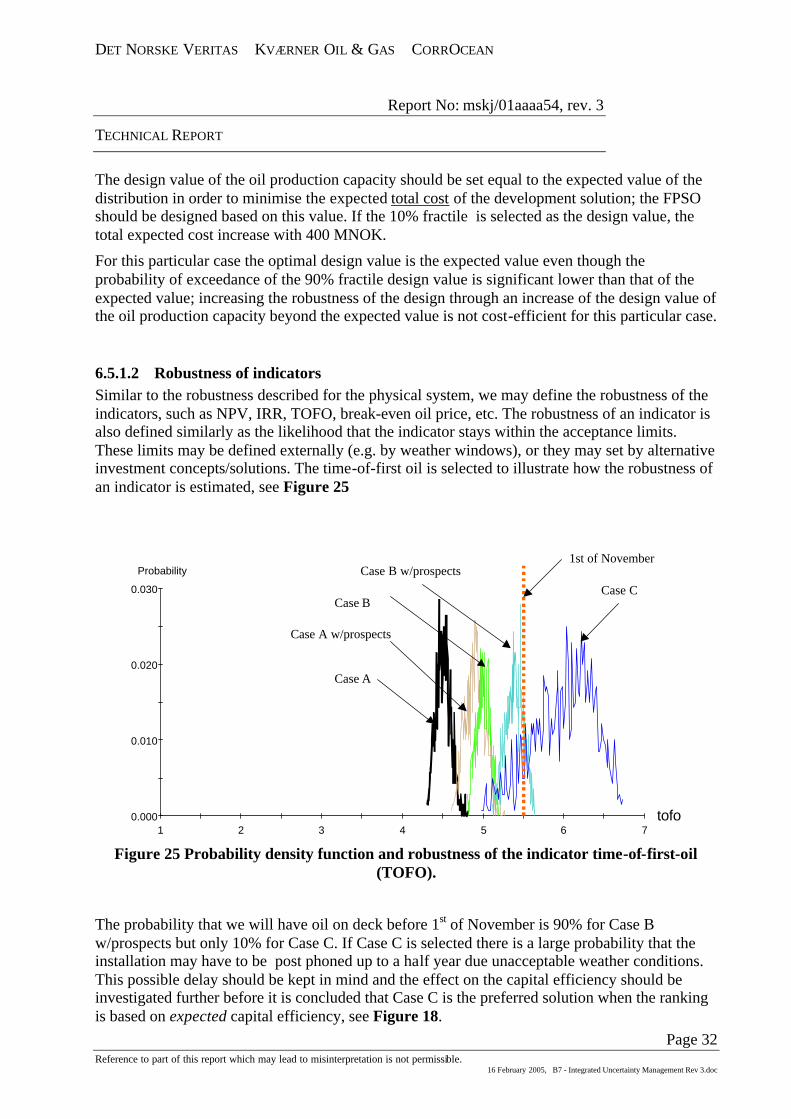
6.5.1.2 Robustness of indicators Similar to the robustness described for the physical system, we may define the robustness of the indicators, such as NPV, IRR, TOFO, break-even oil price, etc. The robustness of an indicator is also defined similarly as the likelihood that the indicator stays within the acceptance limits. These limits may be defined externally (e.g. by weather windows), or they may set by alternative investment concepts/solutions. The time-of-first oil is selected to illustrate how the robustness of an indicator is estimated, see Figure 25
0.000
0.010
0.020
0.030
1 2 3 4 5 6 7
Probability
tofo
Case A
Case C
Case B w/prospects
Case B
Case A w/prospects
1st of November
Figure 25 Probability density function and robustness of the indicator time-of-first-oil
(TOFO).
The probability that we will have oil on deck before 1st of November is 90% for Case B w/prospects but only 10% for Case C. If Case C is selected there is a large probability that the installation may have to be post phoned up to a half year due unacceptable weather conditions. This possible delay should be kept in mind and the effect on the capital efficiency should be investigated further before it is concluded that Case C is the preferred solution when the ranking is based on expected capital efficiency, see Figure 18.
DET NORSKE VERITAS KVÆRNER OIL & GAS CORROCEAN
Report No: mskj/01aaaa54, rev. 3
TECHNICAL REPORT
Page 33 Reference to part of this report which may lead to misinterpretation is not permissible.
16 February 2005, B7 - Integrated Uncertainty Management Rev 3.doc
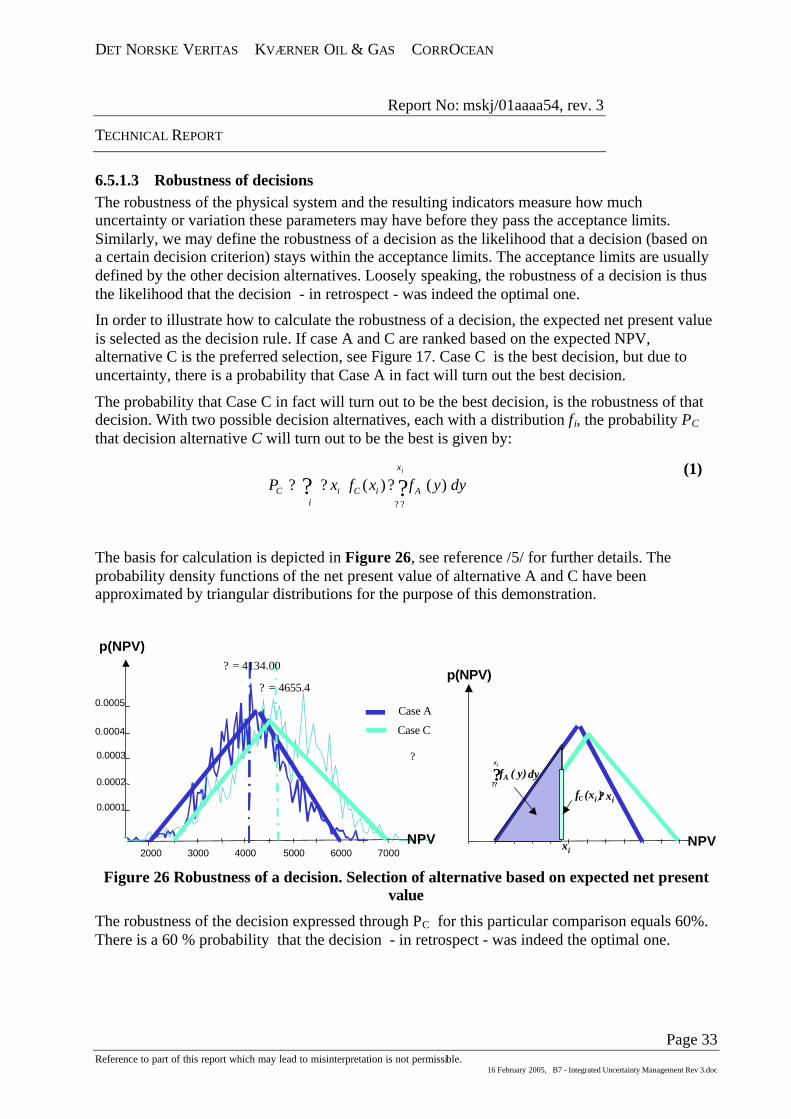
6.5.1.3 Robustness of decisions The robustness of the physical system and the resulting indicators measure how much uncertainty or variation these parameters may have before they pass the acceptance limits. Similarly, we may define the robustness of a decision as the likelihood that a decision (based on a certain decision criterion) stays within the acceptance limits. The acceptance limits are usually defined by the other decision alternatives. Loosely speaking, the robustness of a decision is thus the likelihood that the decision - in retrospect - was indeed the optimal one.
In order to illustrate how to calculate the robustness of a decision, the expected net present value is selected as the decision rule. If case A and C are ranked based on the expected NPV, alternative C is the preferred selection, see Figure 17. Case C is the best decision, but due to uncertainty, there is a probability that Case A in fact will turn out the best decision.
The probability that Case C in fact will turn out to be the best decision, is the robustness of that decision. With two possible decision alternatives, each with a distribution fi, the probability PC that decision alternative C will turn out to be the best is given by:
? ???
???i
x
AiCiC
i
dyyfxfxP )()( (1)
The basis for calculation is depicted in Figure 26, see reference /5/ for further details. The probability density functions of the net present value of alternative A and C have been approximated by triangular distributions for the purpose of this demonstration.
0.0005
2000 3000 4000 5000 6000 7000
p(NPV)
0.0004
0.0002
0.0003
0.0001
NPV
Case C
Case A
? = 4134.00
? = 4655.4p(NPV)
NPV
???
xi
dy( y)fA
? xiC (xi )f
xi
?
Figure 26 Robustness of a decision. Selection of alternative based on expected net present
value
The robustness of the decision expressed through PC for this particular comparison equals 60%. There is a 60 % probability that the decision - in retrospect - was indeed the optimal one.

DET NORSKE VERITAS KVÆRNER OIL & GAS CORROCEAN
Report No: mskj/01aaaa54, rev. 3
TECHNICAL REPORT
Page 34 Reference to part of this report which may lead to misinterpretation is not permissible.
16 February 2005, B7 - Integrated Uncertainty Management Rev 3.doc
6.5.2 Assessing cost-effectiveness of flexibility During the project, new opportunities that cannot be handled cost-effectively within the selected concept may arise. To plan for such possible changes one adds flexibility to the concept.
A chosen field development solution is considered flexible if it: ?? can include nearby marginal discoveries ?? new structures can be added to the solutions ?? has extra slots on a subsea template with pull-in porch for satellite wells ?? etc These are considered as flexibility rather than robustness because flexibility enables a concept to handle structural changes. The value offered by flexibility may be treated in much the same way as that of options in financial theory. The challenge is to include the upside potential offered by the flexibility, as it usually refers to an uncertain future income that is not part of the present project plans.
Case A and B; the subsea concepts allow for tie-in of satellite wells. The investment required to facilitate the tie-in may be done up-front to prevent more costly changes later on. The flexibility is added in order to allow for possible additional future income.
Whether it is cost effective to invest in flexibility up-front depends on the probability of harvesting in the future and the additional cost of post phoned investment. In our case there is an additional tie-in cost of 500 million NOK if the investment is post phoned until the results from the exploration wells are available. Further, the cost effectiveness of flexibility; the probability that the prospects generate income in the future is set equal to 70% and 90%.
3200 3400 3600 3800 4000 4200 4400 4600 4800 5000 5200 5400 5600 5800
Case A pre 70%
Case A pre 90%
Case A post 500
NPV
Statistics for npv
10-90 percentile
20-80 percentile
Mean
Figure 27 Cost effectiveness of added flexibility.
The results from the analysis are presented in Figure 27. Having selected the expected net present value as the decision rule, it is concluded that it is more cost effective to post phone the investment than investing up-front. The uncertainty of the future income is more important than the additional cost of 500 MNOK.
DET NORSKE VERITAS KVÆRNER OIL & GAS CORROCEAN
Report No: mskj/01aaaa54, rev. 3
TECHNICAL REPORT
Page 35 Reference to part of this report which may lead to misinterpretation is not permissible.
16 February 2005, B7 - Integrated Uncertainty Management Rev 3.doc
6.6 Including the effect of new technology Analysing the effect of new technology is another important use of the standardised method. New technology is an important contributor, and sometimes a premise, in new field development solutions. Including new technology in a field development solution will typically give rise to potential downside consequences and potential upside consequences (opportunities). Such downside and upside consequences are typically: ?? Delayed schedule ?? Non-acceptance of technology ?? Reduced availability of technology ?? Generally larger uncertainty in basic variables (cost, time, RAM data, etc) ?? Enhanced performance or recovery ?? Improved field economics It is important to evaluate the combined and total effect of the new technology. A simplified analysis have been constructed to illustrate the cost-effectiveness of using the new technology. In order to increase the oil and gas recovery of the field development alternatives based on Case A, an unqualified booster pump is considered. As a contingency, a well-known, qualified pump may be installed. The statistical properties of the unqualified booster pump relative those of the well proven technology is outlined below:
?? the probability density function of the infield flow capacity is shifted along the x-axis
(+40,000 STB/d). ?? the probability density function of the capital investment is shifted along the x-axis (+100
MNOK) ?? the probability density function of the EPCI duration is shifted along the x-axis (+0.5 years) ?? the probability density function of the availability is shifted along the x-axis (-2%) The risk that that the new technology will turn out to be non-acceptable and has to be replaced by contingency solutions, is included in the analysis as a discrete event, with a probability and resulting consequence. The probability that the new technology is rejected is set equal to 20%. If the unqualified booster pump is rejected and the proven pump need to be installed, there is an impact on the capital costs of the Subsea Production System and the total schedule of the project. The following increase of costs and time has been implemented as compared to a selecting the proven technology prior to start of the EPCI phase of the the Subsea Production System. ?? the probability density function of the capital investment is shifted along the x-axis (+100
MNOK) ?? the probability density function of the EPCI duration is shifted along the x-axis (+0.5 years) The cost-benefit of implementing the new technology is estimated based on the distribution of the net present value and time-of-first-oil of the field development solution with and without the unqualified booster pump.
DET NORSKE VERITAS KVÆRNER OIL & GAS CORROCEAN
Report No: mskj/01aaaa54, rev. 3
TECHNICAL REPORT
Page 36 Reference to part of this report which may lead to misinterpretation is not permissible.
16 February 2005, B7 - Integrated Uncertainty Management Rev 3.doc
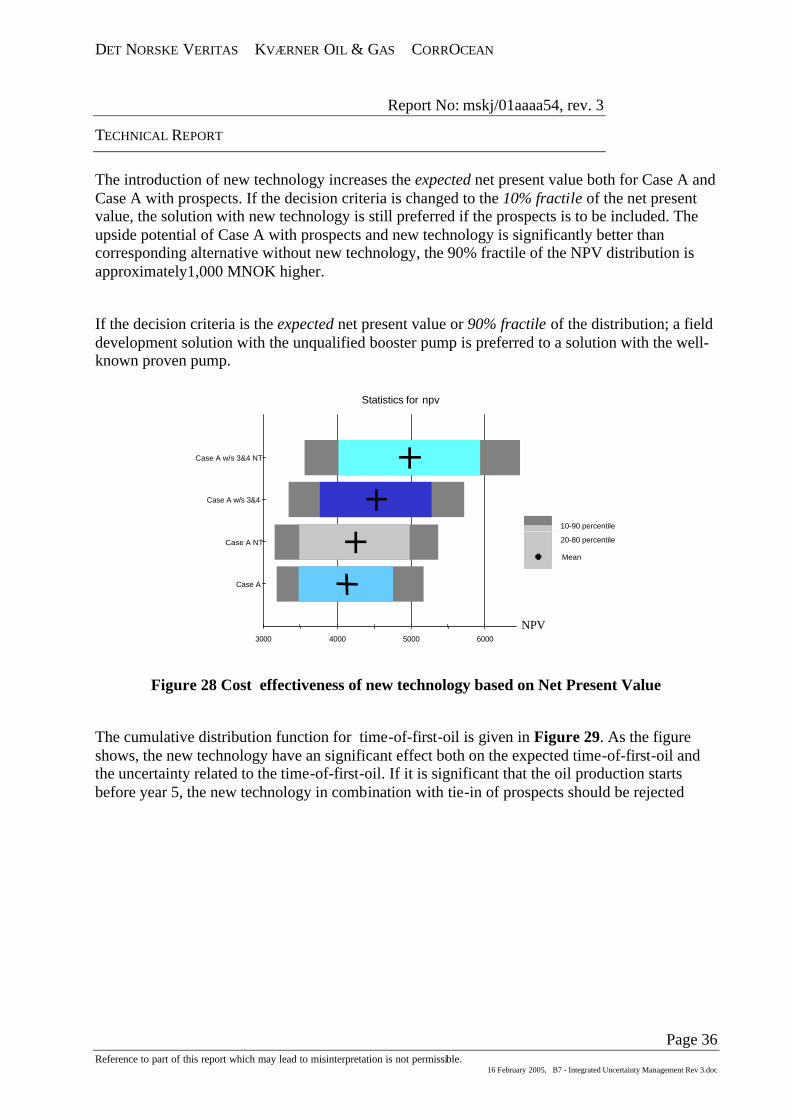
The introduction of new technology increases the expected net present value both for Case A and Case A with prospects. If the decision criteria is changed to the 10% fractile of the net present value, the solution with new technology is still preferred if the prospects is to be included. The upside potential of Case A with prospects and new technology is significantly better than corresponding alternative without new technology, the 90% fractile of the NPV distribution is approximately1,000 MNOK higher.
If the decision criteria is the expected net present value or 90% fractile of the distribution; a field development solution with the unqualified booster pump is preferred to a solution with the well-known proven pump.
3000 4000 5000 6000
Case A
Case A NT
Case A w/s 3&4
Case A w/s 3&4 NT
Statistics for npv
10-90 percentile
20-80 percentile
Mean
NPV
Figure 28 Cost effectiveness of new technology based on Net Present Value
The cumulative distribution function for time-of-first-oil is given in Figure 29. As the figure shows, the new technology have an significant effect both on the expected time-of-first-oil and the uncertainty related to the time-of-first-oil. If it is significant that the oil production starts before year 5, the new technology in combination with tie-in of prospects should be rejected

DET NORSKE VERITAS KVÆRNER OIL & GAS CORROCEAN
Report No: mskj/01aaaa54, rev. 3
TECHNICAL REPORT
Page 37 Reference to part of this report which may lead to misinterpretation is not permissible.
16 February 2005, B7 - Integrated Uncertainty Management Rev 3.doc
4.3 4.4 4.5 4.6 4.7 4.8 4.9 5.0 5.1 5.2 5.3 5.4 5.5 5.6
Case A
Case A w/s 3&4
Case A NT
Case A w/s 3&4 NT
Statistics for tofo
10-90 percentile
20-80 percentile
Mean
TOFO
Figure 29 Cost effectiveness of new technology based on Time Of First Oil
DET NORSKE VERITAS KVÆRNER OIL & GAS CORROCEAN
Report No: mskj/01aaaa54, rev. 3
TECHNICAL REPORT
Page 38 Reference to part of this report which may lead to misinterpretation is not permissible.
16 February 2005, B7 - Integrated Uncertainty Management Rev 3.doc
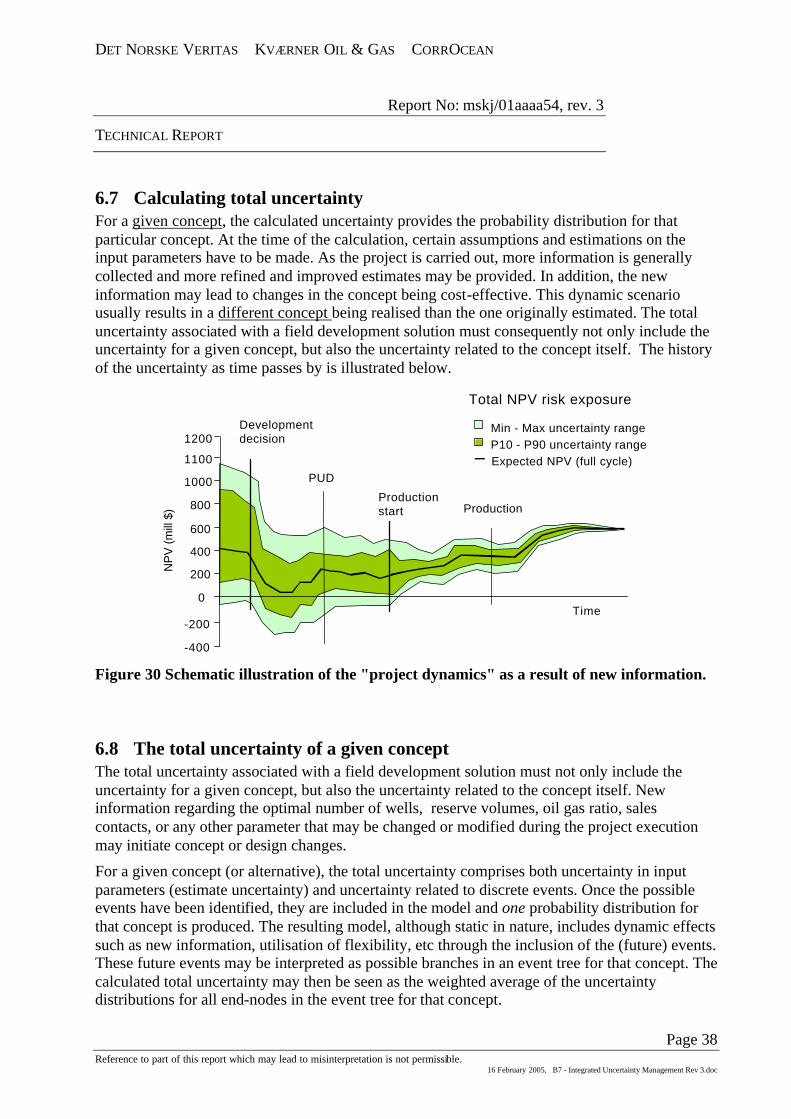
6.7 Calculating total uncertainty For a given concept, the calculated uncertainty provides the probability distribution for that particular concept. At the time of the calculation, certain assumptions and estimations on the input parameters have to be made. As the project is carried out, more information is generally collected and more refined and improved estimates may be provided. In addition, the new information may lead to changes in the concept being cost-effective. This dynamic scenario usually results in a different concept being realised than the one originally estimated. The total uncertainty associated with a field development solution must consequently not only include the uncertainty for a given concept, but also the uncertainty related to the concept itself. The history of the uncertainty as time passes by is illustrated below.
Time
Development decision
Productionstart
NP
V (
mill
$)
0
200
400
600
800
1000
-400
-200
1100
Min - Max uncertainty rangeP10 - P90 uncertainty rangeExpected NPV (full cycle)
1200
Production
Total NPV risk exposure
PUD
Figure 30 Schematic illustration of the "project dynamics" as a result of new information.
6.8 The total uncertainty of a given concept The total uncertainty associated with a field development solution must not only include the uncertainty for a given concept, but also the uncertainty related to the concept itself. New information regarding the optimal number of wells, reserve volumes, oil gas ratio, sales contacts, or any other parameter that may be changed or modified during the project execution may initiate concept or design changes.
For a given concept (or alternative), the total uncertainty comprises both uncertainty in input parameters (estimate uncertainty) and uncertainty related to discrete events. Once the possible events have been identified, they are included in the model and one probability distribution for that concept is produced. The resulting model, although static in nature, includes dynamic effects such as new information, utilisation of flexibility, etc through the inclusion of the (future) events. These future events may be interpreted as possible branches in an event tree for that concept. The calculated total uncertainty may then be seen as the weighted average of the uncertainty distributions for all end-nodes in the event tree for that concept.
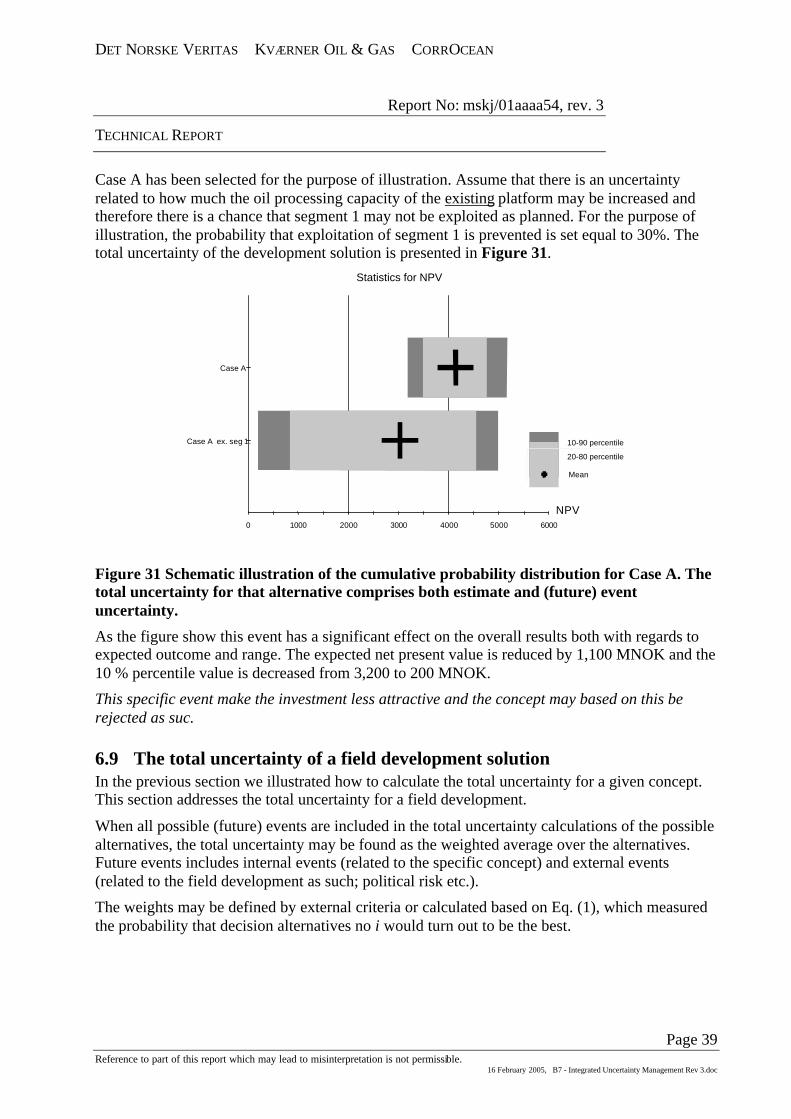
DET NORSKE VERITAS KVÆRNER OIL & GAS CORROCEAN
Report No: mskj/01aaaa54, rev. 3
TECHNICAL REPORT
Page 39 Reference to part of this report which may lead to misinterpretation is not permissible.
16 February 2005, B7 - Integrated Uncertainty Management Rev 3.doc
Case A has been selected for the purpose of illustration. Assume that there is an uncertainty related to how much the oil processing capacity of the existing platform may be increased and therefore there is a chance that segment 1 may not be exploited as planned. For the purpose of illustration, the probability that exploitation of segment 1 is prevented is set equal to 30%. The total uncertainty of the development solution is presented in Figure 31.
0 1000 2000 3000 4000 5000 6000
Case A ex. seg 1.
Case A
Statistics for NPV
10-90 percentile
20-80 percentile
Mean
NPV
Figure 31 Schematic illustration of the cumulative probability distribution for Case A. The total uncertainty for that alternative comprises both estimate and (future) event uncertainty.
As the figure show this event has a significant effect on the overall results both with regards to expected outcome and range. The expected net present value is reduced by 1,100 MNOK and the 10 % percentile value is decreased from 3,200 to 200 MNOK.
This specific event make the investment less attractive and the concept may based on this be rejected as suc.
6.9 The total uncertainty of a field development solution In the previous section we illustrated how to calculate the total uncertainty for a given concept. This section addresses the total uncertainty for a field development.
When all possible (future) events are included in the total uncertainty calculations of the possible alternatives, the total uncertainty may be found as the weighted average over the alternatives. Future events includes internal events (related to the specific concept) and external events (related to the field development as such; political risk etc.).
The weights may be defined by external criteria or calculated based on Eq. (1), which measured the probability that decision alternatives no i would turn out to be the best.
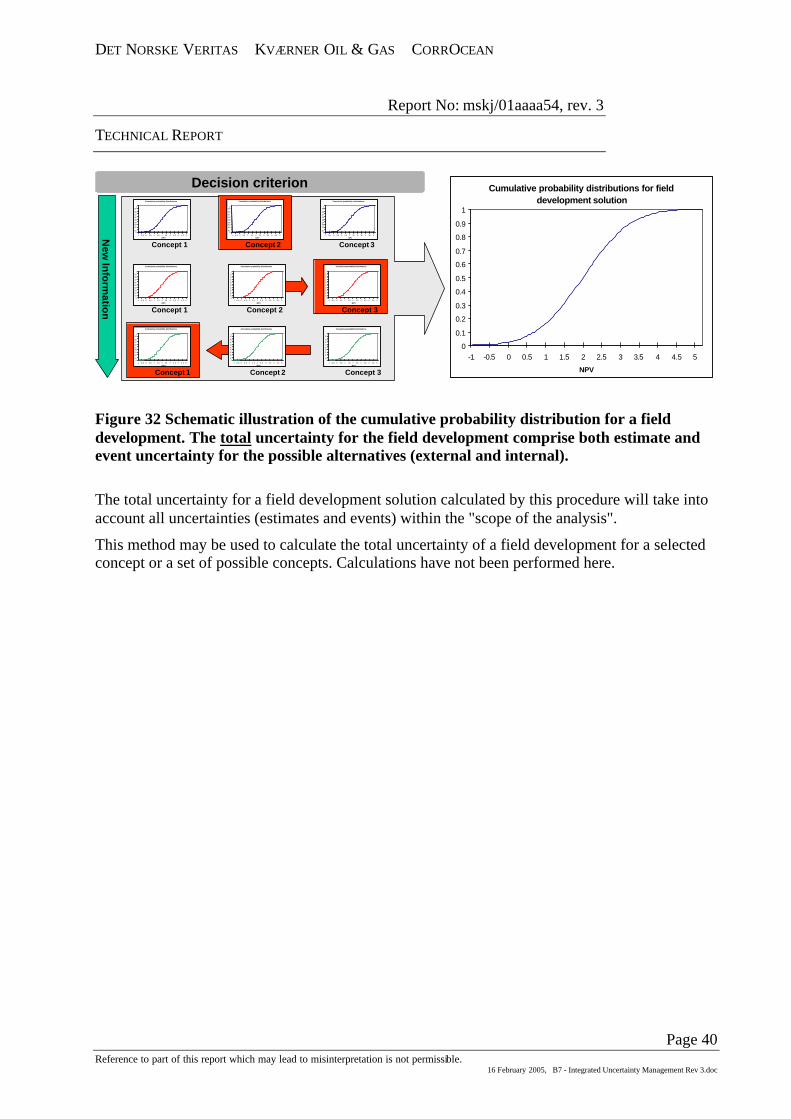
DET NORSKE VERITAS KVÆRNER OIL & GAS CORROCEAN
Report No: mskj/01aaaa54, rev. 3
TECHNICAL REPORT
Page 40 Reference to part of this report which may lead to misinterpretation is not permissible.
16 February 2005, B7 - Integrated Uncertainty Management Rev 3.doc
Decision criterion
New
Info
rmatio
n
Cumulative probability distributions
00,1
0,20,30,40,50,60,70,8
0,91
-1 -0,5 0 0,5 1 1,5 2 2,5 3 3 ,5 4 4 ,5 5NPV
Concept 1
Cumulative probability distributions
00,1
0,20,30,40,50,60,70,8
0,91
-1 -0,5 0 0,5 1 1,5 2 2,5 3 3,5 4 4,5 5NPV
Concept 2
Cumulative probability distributions
00,1
0,20,30,40,50,60,70,8
0,91
-1 -0,5 0 0,5 1 1,5 2 2,5 3 3,5 4 4,5 5NPV
Concept 3
Cumulative probability distributions
00,10,20,30,40,50,60,70,80,9
1
-1 -0,5 0 0,5 1 1,5 2 2,5 3 3 ,5 4 4 ,5 5NPV
Concept 1
Cumulative probability distributions
00,10,20,30,40,50,60,70,80,91
-1 -0,5 0 0 ,5 1 1 ,5 2 2 ,5 3 3,5 4 4,5 5NPV
Concept 2
Cumulative probability distributions
00,10,20,30,40,50,60,70,80,9
1
-1 -0,5 0 0,5 1 1,5 2 2,5 3 3,5 4 4,5 5NPV
Concept 3
Cumulative probability distributions
00,1
0,20,30,40,50,60,70,8
0,91
-1 -0,5 0 0,5 1 1,5 2 2,5 3 3 ,5 4 4 ,5 5NPV
Concept 1 Concept 2
Cumulative probability distributions
00,1
0,20,30,40,50,60,70,8
0,91
-1 -0,5 0 0 ,5 1 1 ,5 2 2 ,5 3 3,5 4 4,5 5NPV
Cumulative probability distributions
00,1
0,20,30,40,50,60,70,8
0,91
-1 -0,5 0 0,5 1 1,5 2 2,5 3 3,5 4 4,5 5NPV
Concept 3
Cumulative probability distributions for field development solution
0
0.1
0.2
0.3
0.4
0.5
0.6
0.7
0.8
0.9
1
-1 -0.5 0 0.5 1 1.5 2 2.5 3 3.5 4 4.5 5
NPV
Figure 32 Schematic illustration of the cumulative probability distribution for a field development. The total uncertainty for the field development comprise both estimate and event uncertainty for the possible alternatives (external and internal). The total uncertainty for a field development solution calculated by this procedure will take into account all uncertainties (estimates and events) within the "scope of the analysis".
This method may be used to calculate the total uncertainty of a field development for a selected concept or a set of possible concepts. Calculations have not been performed here.

DET NORSKE VERITAS KVÆRNER OIL & GAS CORROCEAN
Report No: mskj/01aaaa54, rev. 3
TECHNICAL REPORT
Page 41 Reference to part of this report which may lead to misinterpretation is not permissible.
16 February 2005, B7 - Integrated Uncertainty Management Rev 3.doc
7 REFERENCES
/1/
"Demo 2000 – Framework for Mapping of work and decision processes – CTR No B1"- Rev. 3
/2/
"Demo 2000 – Work and Decision Processes of Suppliers – CTR No B2"- Rev. 3
/3/
"Demo 2000 – State-of the-art of Multidisiplinary Uncertainty analysis – CTR No B3"- Rev. 3
/4/
"Demo 2000 – Development of Building Blocks and preparation of input for Integrated Uncertainty Analyses - CTR No B4" - Rev. 3
/5/
"Demo 2000 – Standardised method for multidisciplinary uncertainty analysis - CTR No B5"- Rev. 3
/6/
"Demo 2000 - Demonstrator , Results from using the standardised method for multidisplinary analysis uncertainty analysis – CTR No B6"- Rev. 3
/7/
"Demo 2000 - Demonstrator , Guidance on how to use the computer model for integrated uncertainty analysis - CTR No B6" - Rev. 3
- o0o -