b821 block4unit9 credit liquidity and operational risk
TRANSCRIPT
7/28/2019 b821 Block4unit9 Credit Liquidity and Operational Risk
http://slidepdf.com/reader/full/b821-block4unit9-credit-liquidity-and-operational-risk 1/112
B821 Financial Strategy Block 4 Financial Risk Management
Unit 9 Credit, Liquidity and Operational Risk Prepared by the Course Team
Masters

7/28/2019 b821 Block4unit9 Credit Liquidity and Operational Risk
http://slidepdf.com/reader/full/b821-block4unit9-credit-liquidity-and-operational-risk 2/112
This publication forms part of an Open University course B821, Financial Strategy. Details of this and other Open University courses can be obtained from the Student Registration and Enquiry Service, The Open University, PO Box 625, Milton Keynes, MK7 6YG, United Kingdom: tel. +44 (0)1908 653231, email [email protected] Alternatively, you may visit the Open University website at http://www.open.ac.uk where you can learn more about the wide range of courses and packs offered at all levels by The Open University. To purchase a selection of Open University course materials visit http://www.ouw.co.uk, or contact Open University Worldwide, Michael Young Building, Walton Hall, Milton Keynes MK7 6AA, United Kingdom for a brochure. tel. +44 (0)1908 858785; fax +44 (0)1908 858787; email [email protected]
The Open University Walton Hall, Milton Keynes MK7 6AA First published 1998. Second edition 1999. Third edition 2000. Fourth edition 2003. Fifth edition 2006. Reprinted 2007 Copyright # 1998, 1999, 2000, 2003, 2006, 2007 The Open University All rights reserved. No part of this publication may be reproduced, stored in a retrieval system, transmitted or utilised in any form or by any means, electronic, mechanical, photocopying, recording or otherwise, without written permission from the publisher or a licence from the Copyright Licensing Agency Ltd. Details of such licences (for reprographic reproduction) may be obtained from the Copyright Licensing Agency Ltd of 90 Tottenham Court Road, London W1T 4LP. Open University course materials may also be made available in electronic formats for use by students of the University. All rights, including copyright and related rights and database rights, in electronic course materials and their contents are owned by or licensed to The Open University, or otherwise used by The Open University as permitted by applicable law. In using electronic course materials and their contents you agree that your use will be solely for the purposes of following an Open University course of study or otherwise as licensed by The Open University or its assigns. Except as permitted above you undertake not to copy, store in any medium (including electronic storage or use in a website), distribute, transmit or retransmit, broadcast, modify or show in public such electronic materials in whole or in part without the prior written consent of The Open University or in accordance with the Copyright, Designs and Patents Act 1988. Edited and designed by The Open University. Typeset in India by Alden Prepress Services, Chennai. Printed and bound in the United Kingdom by Hobbs the Printers Limited, Brunel Road, Totton, Hampshire SO40 3WX. ISBN 0 7492 1324 8 5.4

7/28/2019 b821 Block4unit9 Credit Liquidity and Operational Risk
http://slidepdf.com/reader/full/b821-block4unit9-credit-liquidity-and-operational-risk 3/112
C O N T E N T S 1 Introduction 52 Credit risk 11
2.1 Introduction 112.2 How big is your exposure? 112.3 How big is your derivatives exposure? 152.4 Settlement risk: what is your exposure on maturity ? 192.5 Summary 21
3 Credit lines 233.1 Introduction 233.2 Getting the credit-rating agencies to do the work 243.3 Basic methods of credit analysis 293.4 More advanced methods of credit analysis 313.5 Turning the analysis into credit lines 353.6 Summary 39
4 Credit-risk management 414.1 Introduction 414.2 Factoring 424.3 Letters of credit and letters of guarantee 424.4 Security against credit exposures 464.5 Credit derivatives 484.6 Summary 54
5 Liquidity risk 555.1 Introduction 555.2 Liquidity management: structuring the balance sheet 575.3 Liquidity management: stress testing 625.4 Summary 64
6 Operational risk 656.1 Introduction 656.2 Operational-risk management 686.3 Summary 73
7/28/2019 b821 Block4unit9 Credit Liquidity and Operational Risk
http://slidepdf.com/reader/full/b821-block4unit9-credit-liquidity-and-operational-risk 4/112
7 Financial-risk management: from theory to practice 757.1 Introduction 757.2 A risk-management template 767.3 Company risk-management policies 807.4 Changing disclosures 867.5 Summary 86
8 Summary and conclusions 89 Answers to exercises 91 Appendix 1 Standard and Poor’s credit ratings 98 Appendix 2 Repo and securitisation: furtheranalysis 102References and further reading 107 Acknowledgements 108

7/28/2019 b821 Block4unit9 Credit Liquidity and Operational Risk
http://slidepdf.com/reader/full/b821-block4unit9-credit-liquidity-and-operational-risk 5/112
1 I N TR OD U C TI ON 1 INTRODUCTION
Take a deep breath and relax! Having learnt about interestrate risk, foreignexchange risk and contingent risk and the methods for managing them we now turn to those financial risks where the analysis and methodology are technically less onerous. That is not to say that the risks are less critical – far from it. Failure to control credit exposure and liquidity levels and the existence of flawed operational controls often spell more than a financial headache. Rather, they can rapidly lead to the demise of an organisation. The work done in Units 7 and 8 will prove to be helpful in studying the subjects in Unit 9, particularly in appreciating the additional complications arising from the interplay between credit, interest and foreignexchange (FX) risks. This unit starts with an analysis of credit risk . Virtually all organisations, whether private or publicsector based, are exposed to credit risk. Once an organisation extends ‘trade terms’ to its suppliers it is faced with the risk that the sums due are not paid or are paid after the time they are due. Financial
organisations
such
as
banks,
investment
funds
and
venturecapital companies are, by the nature of their business, continually exposing themselves to credit risk. Understandably, they therefore commit substantial resources to acquire the information and skills needed to manage this risk soundly. Nonfinancial organisations also need to be alive to credit issues. The majority of companies and publicsector organisations, such as local authorities and charities, have surplus cash – at least periodically – and expose themselves to credit risk when they lend or deposit these funds with banks and other organisations.
Additionally, the cost of funds for all organisations is determined in part by the general credit conditions in the economy and particularly by investors’ perception of the sector of the economy
within which those borrowing operate. There are plenty of recent examples of soundly run companies finding the cost of their funds increasing because investors’ sentiment towards the sector in
which they operate changed adversely. This was the experience in telecommunications sector in 2000 – 2001 and in the automobile sector more recently. An understanding of credit risk is therefore essential for an organisation even if it is not an investor itself.
OU BUSINESS SCHOOL 5

7/28/2019 b821 Block4unit9 Credit Liquidity and Operational Risk
http://slidepdf.com/reader/full/b821-block4unit9-credit-liquidity-and-operational-risk 6/112
UNIT 9 CREDIT, LIQUIDITY AND OPERATIONAL RISK
The section on credit risk explores the following areas. l How the exact extent of credit exposure should be
measured – including the credit exposure arising from derivatives transactions.
l The techniques used by organisations to make decisions about credit
exposure,
including
the
use
of
the
information
and
ratings
supplied by the large creditrating agencies such as Moody ’s, Standard and Poor’s and Fitch.
l The methods that companies can use to contain credit exposure, such as factoring and obtaining security against exposures.
l The facilities that can be used to manage credit risk by those companies engaged in international trade.
l How the emergence of the creditderivatives market in the past decade has given organisations a new set of tools for managing credit risk.
In recent years the credit ‘industry ’ has increased significantly in size. This increase can largely be attributed to the growing realisation of the consequences of poor credit management. The huge losses incurred by United Kingdom’s mortgage lenders in the early 1990s, by investors in Asia and Russia in the mid1990s and by equity investors during the ‘dot.com bubble’ in the late 1990s clearly demonstrated the cost of not doing thorough credit analysis before lending to individuals, organisations, banks and even governments.
BOX 1.1
RUSSIA DEFAULTS AND THE CONSEQUENCES SPREAD FAR AND WIDE
In August 1998 the Russian government defaulted on its debt, triggering panic in the world’s financial markets.
OU BUSINESS SCHOOL 6

7/28/2019 b821 Block4unit9 Credit Liquidity and Operational Risk
http://slidepdf.com/reader/full/b821-block4unit9-credit-liquidity-and-operational-risk 7/112
1 INTRODUCTION
The problems faced by Russia in 1998 were both political and economic. Repeated changes in the Russian government, instigated by President Yeltsin, had already started to unnerve investors and put pressure on Russia’s currency, the rouble. Further problems arose from the sharp fall in oil prices in 1998, since oil is a major source of export earnings for Russia. IMF assistance was forthcoming with a $22.6 billion package of support that was announced in July 1998. This support, however, was largely diverted to attempts by the Russian government to support the value of the rouble. When a request for further support from the IMF was declined and with official reserves reducing by $1 billion a week, the Russian government was given little option in the end but to devalue the currency and freeze repayments of debt. The obvious losers from this development were investors in Russian debt, predominantly the major international banks. Their credit losses were substantial, but the consequences went further. The Russian default – coming so soon after the economic crises experienced in many Asian countries in the mid1990s – prompted a fall in share prices around the world. Given that so many of us are investors in equity markets – if not directly through our own investment portfolios, then indirectly through the investments made by the pension funds of which we are members – the consequences of the Russian default were wider and the number of people who lost out as a result of this credit event were more numerous than is commonly believed.
The unit then examines liquidity risk – the risk that an organisation cannot meet its payment obligations. There is obviously a link here
with credit risk, since one organisation’s liquidity crisis is potentially a source of a credit crisis for those who have invested money in it or are simply owed for supplies to it. The section on liquidity risk will: l examine the circumstances under which liquidity problems
arise; l explain how organisations can arrange their balance
sheets – particularly through the structuring of assets and liabilities – to maintain liquidity at acceptable levels.
The unit then assesses operational risk – the risk to an organisation arising from the failure of people, systems and controls. It could be argued that operational risk alone is not really a risk at all, since if systems and controls do fail it does not necessarily mean that an organisation loses money. For example, if a failure of controls results in Company A lending money to Company B beyond the credit limit imposed by its credit department there is no financial loss until Company B fails to meet its repayment obligations. So although there has been a control failure, no money has actually
OU BUSINESS SCHOOL 7

7/28/2019 b821 Block4unit9 Credit Liquidity and Operational Risk
http://slidepdf.com/reader/full/b821-block4unit9-credit-liquidity-and-operational-risk 8/112
UNIT 9 CREDIT, LIQUIDITY AND OPERATIONAL RISK
been lost. The fact is, though, that the source of losses in respectof all the financial risks we study in this block can very often betraced to operational failures: if the controls had been robust, theactivities which generated the losses would not have beenundertaken.The
section
on
operational
risk
will:
l review the potential areas of operational risk for an
organisation; l explain the procedures that can be introduced to manage these
risks. Having concluded our analysis of the individual categories of financial risk and the interrelationships between them, we then look at how all these risks may be brought under collective control. In doing this we return to the subject of ‘risk mapping’, which we studied at the start of this block. We will devise is a summary report, structured to facilitate the control of risk, where information is presented in a concise and coherent way to enable management and board decisions to be made in an effective manner. Finally, the unit and the block conclude with a review of the policies and practices for managing financial risk employed by some major companies. The examples given demonstrate that the subject matter covered in Block 4 is well and truly embedded in
what goes on in the real world. Indeed, the critical importance of the issues we have covered can be readily gleaned simply by looking at the advertisements for jobs that appear in The Financial Times
. The
salaries
now
being
paid
for
credit
analysts
and
risk
managers show only too clearly how seriously organisations take risk management. So by reading on, perhaps the Open University can help to provide you with a stepping stone to those large salaries!
BOX 1.2 THE OPEN UNIVERSITY IS ‘ON RISK’ As you read through the introduction you may be forming the view that the financial risks to be studied in this unit are really only relevant to banks and other financial institutions. Think again! Take an organisation such as the Open University – an educational organisation in the public sector. It, too, is exposed to all the risks examined in this unit and, indeed, the other units in Block 4. The Open University has surplus funds that it invests via the United Kingdom’s money market. It therefore exposes itself to credit risk through such lending. The business activities of the Open University generate sizeable cash flows. If the income streams weaken and/or costs rise, the
OU BUSINESS SCHOOL 8
7/28/2019 b821 Block4unit9 Credit Liquidity and Operational Risk
http://slidepdf.com/reader/full/b821-block4unit9-credit-liquidity-and-operational-risk 9/112
1 INTRODUCTION
Open University would be faced with liquidity problems like any other business in similar circumstances. The Open University is heavily reliant on systems. If the FirstClass system failed for a prolonged period, the Open University could not deliver key elements of its educational services. News of such an operational failure would have an impact on the ability to retain students and to attract new ones, adversely affecting the Open University’s business. Apply the same analysis to organisations you have worked for and you will soon see how pervasive these risks are.
Learning outcomes By the end of this unit you should be able to: l understand how credit risk is measured and how credit lines
may be determined; l understand the techniques and instruments available to manage
credit exposures; l recognise how liquidity risk arises and how balancesheet
management can help to maintain adequate liquid resources for an organisation;
l understand the forms of operational risk and how this risk can be mitigated;
l devise a riskmeasurement control matrix that could be used by senior management and the board of a company to oversee the management of financial risks;
l analyse the features of the riskmanagement policies of some major organisations.
����������������������������������������
OU BUSINESS SCHOOL 9

7/28/2019 b821 Block4unit9 Credit Liquidity and Operational Risk
http://slidepdf.com/reader/full/b821-block4unit9-credit-liquidity-and-operational-risk 10/112
UNIT 9 CREDIT, LIQUIDITY AND OPERATIONAL RISK
10 OU BUSINESS SCHOOL

7/28/2019 b821 Block4unit9 Credit Liquidity and Operational Risk
http://slidepdf.com/reader/full/b821-block4unit9-credit-liquidity-and-operational-risk 11/112
2 CREDIT RISK
2 C R ED I T R I SK
2 . 1 I N T R O D UC T I O N
The purpose of this section is to:l explain how credit exposure can be measured;l understand the potential interrelationship between credit and
other financial risks (like interestrate risk and foreignexchange risk);
l demonstrate
how
the
credit
exposure
arising
from
derivative
transactions can be measured;
l examine the form of credit exposure known as ‘settlement risk’.
The work on credit risk in this unit builds on the analysis of credit issues you were introduced to in Unit 3.
2 . 2 HOW BI G I S YOU R E X P O S UR E ? If you lend money to an organisation or simply extend trade terms for payment for supplies (typically thirty to sixty days) you immediately have credit exposure to the organisation or supplier. How big is your exposure? This may seem like an odd question. If you lend £1m, your exposure is surely £1m? If you extend trade credit for thirty days to a purchaser for goods valued at E100,000, you are surely only exposed to a maximum of E100,000 if the purchaser defaults?
Well not quite right in fact. A number of additional factors need to be taken into account to measure both the financial risks involved and your true overall exposure. Interest accruals If you have lent money to an organisation on which interest is paid, your exposure rises until the interest payment is due. At an annual rate of 5% p.a. on a longterm loan of £1m, the exposure rises to £1.05m on the date of payment of the annual interest, falling back again to £1m if interest is paid as due on that date. Effective creditexposure measurement requires interest due to be added to principal sums outstanding. This is a major issue for investments in zerocoupon bonds where all the cash value of the return owed to the investor comes on the maturity date. Zerocoupon bonds were
discussed in Unit 7.
OU BUSINESS SCHOOL 11

7/28/2019 b821 Block4unit9 Credit Liquidity and Operational Risk
http://slidepdf.com/reader/full/b821-block4unit9-credit-liquidity-and-operational-risk 12/112
UNIT 9 CREDIT, LIQUIDITY AND OPERATIONAL RISK
Market valuations What if market rates of interest move after you lend money to another organisation? We know from the work undertaken on bond pricing in Unit 7 that if interest rates move, the present value of all future cash flows changes and this alters the market value of an investment. The impact on value is more significant the longer the duration of the investment. This makes longterm, fixedrate investments, for example, in bonds, particularly at risk of changes in valuation. If your credit exposure arises through investing in a fixedrate bond issued by an organisation and interest rates fall after the purchase date, the market value of your bond holding will therefore be higher than the amount you paid. Consequently, your credit exposure to the bond issuer is greater as a consequence. If this exposure exceeds the size of the credit limit or credit ‘line’ (the total amount you are prepared to invest in the organisation) you face an awkward decision. Either you would have to reduce the size of your investment so that your exposure does not exceed the credit line or apply to your credit department for an increased credit line in respect of the bond issuer. The latter may be the more attractive option since otherwise you would be a forced seller of a profitable investment. Time value or opportunity cost
What about the time value of the credit you have extended? If you extend trade credit of E100,000 to an organisation for thirty days,
you have implicitly provided an interestfree loan to that organisation for the thirty days. This is effectively an additional cost to you for allowing credit of E100,000 for thirty days. The extra cost is the money you would have received if you had been paid the E100,000 on day one and invested it for thirty days at the prevailing thirtyday interest rate. If you alter the term of your trade credit to, say, sixty days there is an implicit increased cost to you arising from your new limit for extended credit.
You will recall from Unit 7 that ‘FRA’ means ‘forward rate agreement’
EXERCISE 2.1 You are owed E1m by a customer. Contrary to your normal terms for business, you extend to this customer a credit term of four months rather than one month. The market is quoting 4.5% for the ‘one versus four ’ (1v4) FRA (that is, the three-month rate, one month forward). What is the cost to you of this three-month extended payment period? How could you have mitigated this cost when billing the customer?
12 OU BUSINESS SCHOOL

7/28/2019 b821 Block4unit9 Credit Liquidity and Operational Risk
http://slidepdf.com/reader/full/b821-block4unit9-credit-liquidity-and-operational-risk 13/112
2 CREDIT RISK
The ‘knock-on’ impact on interest-rate risk Think back to the coverage of ‘gap analysis’ in Unit 7. The sums owed to your organisation by debtors are future cash inflows.
When combined with all other cash flows, these generate the aggregate level of interestrate risk being taken by your organisation. If a customer who owes you £5m in one year’s time defaults, you no longer have that cash inflow forthcoming one year forward. This means that your gap position alters and with it the aggregate level of interestrate exposure. What started as a credit issue (the default by your customer) has now potentially become an issue of interestrate risk. The ‘knock-on’ impact on foreign-exchange risk
You will recall the matching approach to managing foreignexchange (FX) risk in Unit 8. The sums owed to you by a debtor may be entirely matched to amounts you owe in the same foreign currency to your creditors. While you are ‘matched’ in this way you have eliminated the exposure to FX risk in the currency in question. If your debtor defaults, however, an FX exposure is opened up – you still need to pay your creditors (unless you intend to default as well!). You are now exposed to the movement in exchange rate that has taken place between the point you used the sum owed by your debtor to match that of your creditors and the point you became aware of the default by your debtor. You can take action in the FX market now to renew your hedge against
your liabilities,
but
you
cannot
recoup
any
movement
in
the
FX rate that has already happened since you put the matching hedge in place.
Gap analysis was covered in Section 5 of Unit 7.
‘Matching’ methods for managing foreign
exchange exposure
were
covered in Unit 8.
BOX 2.1 HOW TO (NEARLY) LOSE MONEY TWICE OVER In February 1995, Barings, a United Kingdom merchant bank, went into liquidation following huge losses on its derivativestrading activities by its Singapore subsidiary. As one United Kingdom financial company assessed its exposure to Barings – and hence its potential credit losses through loans it had extended to the bank – a second dimension to its exposure became clear. The loans had been made in US dollars and these assets matched the financial company’s borrowings in US dollars from the US money market. So the loans to Barings were not only an asset, but also a hedge against movements in the USD/GBP exchange rate. With Barings in liquidation and with the prospect that the loans extended to them would not be repaid, this foreignexchange hedge
was
undone.
As
fate
would
have
it,
the
USD
had
appreciated against GBP since the loans were made to Barings, so putting new USD loans in place (by lending to other banks) was
OU BUSINESS SCHOOL 13

7/28/2019 b821 Block4unit9 Credit Liquidity and Operational Risk
http://slidepdf.com/reader/full/b821-block4unit9-credit-liquidity-and-operational-risk 14/112
UNIT 9 CREDIT, LIQUIDITY AND OPERATIONAL RISK
going to cost more in terms of GBP than the original loans. Consequently, the potential loss arising from the exposure to Barings was more than just the loans themselves and the accrued interest – there was also a foreignexchange related supplement. Fortunately for this and other financial institutions similarly exposed, the Dutch bank ING bought Barings (for £1) and honoured Barings’ senior debts. Consequently neither the credit nor foreignexchange losses materialised from its dealings with Barings ... but an interesting lesson in the wider nature of credit risk had been learnt.
These illustrations show that there is a difference between the original amount owed to an organisation by a borrower or trade debtor and the actual financial exposure that subsequently arises, particularly as market rates change. The latter incorporates the overall exposure to loss that arises if a debtor defaults and does not just focus on the credit extended at the outset. Some additional complications The problems identified above are compounded by the fact that
when a debtor defaults you do not know at that point how much you might recover and when that recovered sum will be paid to you.
As a creditor, you will have a claim on the assets of the organisation and the strength of that claim will depend upon your ranking as a creditor. Look at Figure 2.1. This simplistic but useful block diagram of the balance sheet shows you of where you may stand as a creditor – the higher up in the ‘liability ’ column you are, the better. The figure is drawn up in order of payment in the case of liquidation, which is rather different from the usual balancesheet ordering.
Secured lending is where Clearly, if your loan to the defaulting party was secured against a loan is contractually specific assets of the defaulting organisation you would hope to get linked to specific assets. If the borrower defaults back the money due to you by your claim to those secured assets. the lender can claim the If, on the other hand, you had an unsecured or a subordinated assets and sell them to recover the money owed. position in the creditor ranking you might get back only a small In a liquidation, proportion of the money you advanced. Not knowing how much subordinated debts are you might receive certainly complicates the calculation of your repaid only after actual financial exposure. unsubordinated debts have been repaid.
Summarising these points We shall come back to some of these issues later when we look at recent developments in the field of credit analysis. What we can say here, though, is that many organisations are developing more sophisticated means for setting credit limits, or ‘credit lines’, and for
14 OU BUSINESS SCHOOL

7/28/2019 b821 Block4unit9 Credit Liquidity and Operational Risk
http://slidepdf.com/reader/full/b821-block4unit9-credit-liquidity-and-operational-risk 15/112
2 CREDIT RISK
Currentassets
Assets
Fixedassets
�
Liabilities
�
Figure 2.1 The balance sheet ordered by creditor ranking measuring exposure against them. A more considered assessment of the financial value of credit exposures is being undertaken through: l the regular revaluation (or ‘marking to market’) of credit
exposures; l assessing, prior to establishing credit lines, the probability of
default (Pd) of an organisation; l calculating the loss that would arise on such a default – the loss
given default (Lgd). Such analysis is not only helping to answer the question of how much credit risk you have, but is also assisting organisations in pricing their lending properly. An organisation with a high Pd and Lgd should expect to pay more for borrowing funds or obtaining credit terms than one deemed to have a low Pd and Lgd.
Note that the term ‘recovery rate’ is also widely used when defining the proportion of an investment that is recovered from a defaulting entity. The recovery rate is (1 – Lgd).
HOW BI G I S YOU R D E R I V AT I V E S E X P O S UR E ?
2 . 3 Credit risk does not just arise from lending or providing trade credit. Activities in derivatives (for example in FRAs and swaps) give rise to credit risk. We shall now look at some guiding principles that need to be taken into account when measuring credit exposure arising from derivative transactions and some examples of measuring this exposure.
We already know from Unit 7, by contrast, that with exchange traded derivatives, such as futures, credit risk is virtually eliminated. The only (very minor) risk relates to daily movements in the
OU BUSINESS SCHOOL 15

7/28/2019 b821 Block4unit9 Credit Liquidity and Operational Risk
http://slidepdf.com/reader/full/b821-block4unit9-credit-liquidity-and-operational-risk 16/112
UNIT 9 CREDIT, LIQUIDITY AND OPERATIONAL RISK
The use of margin payments by clearing houses was explained in Box 6.3 in Unit 7. Note that if market movements are particularly volatile, exchanges may require margin payments more than once a day. These are known as ‘intraday’ margin calls.
A counterparty is simply a term to describe an organisation that is a party to a business transaction.
‘Notional principal’ is the nominal value used to calculate the cash flows on derivative transactions. It is not, itself, a cash flow.
market, which require a daily margin call in excess of the initial margin paid into the clearing house at the inception of a transaction. There is also the credit risk to the clearing house itself since, theoretically, it could go into liquidation. Virtually all users of the exchangetraded markets, however, view such a risk to be very small. Indeed, one of the clear attractions of exchange trading is the minimisation of credit risk.
With over-the-counter (OTC) instruments, however, risk arises from the movement in rates after the inception of a deal. Suppose, for example, Company X ceases trading immediately after it has arranged an interestrate swap with Bank Y. Provided swap rates have not moved, Bank Y can arrange a new identical interestrate swap with another organisation at the same rate prevailing in the market. By replacing its swap in this way no loss has been incurred by the default of Company X. The reality is, of course, that market rates do move and as a consequence derivative positions may give rise to credit losses if an organisation with which you have transacted defaults. To value the credit risk on derivative positions requires the assessment of their replacement cost. If the counterparty to a swap, FRA or foreignexchange transaction defaults, you are exposed to the difference between the ‘contract’ rate on the original derivative transaction and the prevailing market rate for the transaction. The financial cost of this difference may be either negative or positive. If the cost is negative, it means that you would not suffer a financial loss if your counterparty defaults – you could replace the derivative position at no financial loss. If the cost is positive, though, a default by your counterparty results in your incurring a financial loss. This cost is, therefore, the credit risk you have to the counterparty through a derivative position. To measure this cost requires the application of the netpresent-
value (NPV) techniques for valuing sets of cash flows with which you are now familiar – but with one important difference: the analysis does not need to include the notional principal sum of the derivative transaction since that is not a cash flow. You therefore measure the difference between the actual cash flows due under the original transaction and those due under a replacement transaction if the original counterparty defaults.
Activity 2.1 provides an example. ACTIVITY 2.1 VALUING THE CREDIT RISK ON A SWAP FNBK Bank enters into a five-year swap with Hope plc. Hope plc pays 7% p.a. annually to receive twelve-month GBP LIBOR on a notional principal of £100m. After exactly two years and immediately after the difference payment has been made at the end of Year 2, Hope plc ceases trading.
16 OU BUSINESS SCHOOL

7/28/2019 b821 Block4unit9 Credit Liquidity and Operational Risk
http://slidepdf.com/reader/full/b821-block4unit9-credit-liquidity-and-operational-risk 17/112
2 CREDIT RISK
The market rate for a three-year swap (the residual term) is now 4.5% p.a. annually against twelve-month LIBOR. What is FNBK Bank ’s exposure with this swap? For the sake of simplicity, assume the zero-rate to be applied to
all
the
cash
flows
is
4.5%
p.a.,
so
the
discount
factors
are
all
based on this rate. As the results in Table 2.1 show, the replacement swap gives FNBK 2.5% p.a. less than the original swap. The replacement cost is therefore 2.5% p.a. for the rest of the life of the swap. The NPV of these flows is £6.87m. Table 2.1 Result (at the end of Year 2) Year 3 Year 4 Year 5 Total Notional principal £100m £100m £100m Difference in fixed rates 2.5% 2.5% 2.5% Difference in variable rates#
0% 0% 0% Cash flow of differences 2.5% 2.5% 2.5% Replacement cost* £2.5m £2.5m £2.5m Discount factor at 4.5%{
0.957 0.916 0.876 NPV of cost £2.39m £2.29m £2.19m Total cost = Exposure £6.87m # There is no difference in the variable rates since the LIBOR on both contracts (twelve-month LIBOR) are matched. * The replacement cost is the sum needed to compensate for negative cash flows. { Note that after two years the remaining years (Years 3, 4 and 5 of the original swap transaction) are, respectively, one, two and three years forward. Consequently, the discount factors reflect these forward periods.
The ‘zerorate’ is the interest rate applying to a specific single cash flow on a defined date. See Box 3.3 in Unit 7.
Even before the demise of Hope plc, FNBK Bank’s credit department should have been regularly revaluing (‘marking to market’) the swap at prevailing market rates. At the point of Hope’s demise the exposure is £6.87m. This may not, of course, be the final loss. Even as an unsecured creditor, FNBK would have a claim on Hope plc and might retrieve some value at an unknown future date. Indeed, FNBK Bank may have an alternative route to recover funds. Depending on the terms of the swap contract entered into by the two parties, FNBK bank may under this ‘event of default’ be able to ‘net off ’ the loss on this The term ‘set off’ is often individual transaction (where the replacement cost is positive) used in the financial
markets when describing against other deals with Hope plc where the replacement cost is netting arrangements. So negative. ‘
set off
’ is
effectively
the
same as ‘net off’.
OU BUSINESS SCHOOL 17
7/28/2019 b821 Block4unit9 Credit Liquidity and Operational Risk
http://slidepdf.com/reader/full/b821-block4unit9-credit-liquidity-and-operational-risk 18/112
UNIT 9 CREDIT, LIQUIDITY AND OPERATIONAL RISK
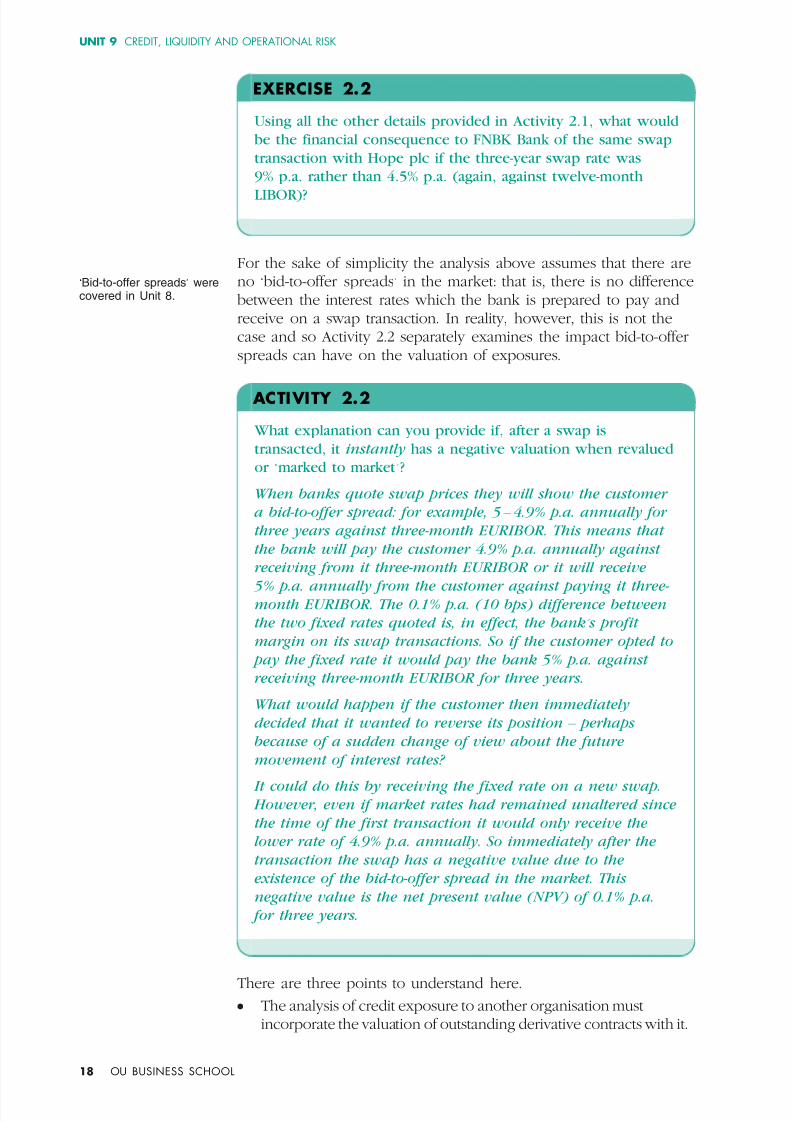
EXERCISE 2.2 Using all the other details provided in Activity 2.1, what would be the financial consequence to FNBK Bank of the same swap transaction with Hope plc if the three-year swap rate was 9% p.a. rather than 4.5% p.a. (again, against twelve-month LIBOR)?
‘Bidtooffer spreads’ were covered in Unit 8.
For the sake of simplicity the analysis above assumes that there are no ‘bidtooffer spreads’ in the market: that is, there is no difference between the interest rates which the bank is prepared to pay and receive on a swap transaction. In reality, however, this is not the case and so Activity 2.2 separately examines the impact bidtooffer spreads can have on the valuation of exposures.
ACTIVITY 2.2 What explanation can you provide if, after a swap is transacted, it instantly has a negative valuation when revalued or ‘marked to market’? When banks quote swap prices they will show the customer a bid-to-offer spread: for example, 5 – 4.9% p.a. annually for three years against three-month EURIBOR. This means that the bank will pay the customer 4.9% p.a. annually against receiving from it three-month EURIBOR or it will receive 5% p.a. annually from the customer against paying it three- month EURIBOR. The 0.1% p.a. (10 bps) difference between the two fixed rates quoted is, in effect, the bank’ s profit margin on its swap transactions. So if the customer opted to pay the fixed rate it would pay the bank 5% p.a. against receiving three-month EURIBOR for three years. What would happen if the customer then immediately decided that it wanted to reverse its position – perhaps because of a sudden change of view about the future movement of interest rates? It could do this by receiving the fixed rate on a new swap. However, even if market rates had remained unaltered since the time of the first transaction it would only receive the lower rate of 4.9% p.a. annually. So immediately after the transaction the swap has a negative value due to the existence of the bid-to-offer spread in the market. This negative value is the net present value (NPV) of 0.1% p.a. for three years.
There are three points to understand here. l The analysis of credit exposure to another organisation must
incorporate the valuation of outstanding derivative contracts with it. 18 OU BUSINESS SCHOOL

7/28/2019 b821 Block4unit9 Credit Liquidity and Operational Risk
http://slidepdf.com/reader/full/b821-block4unit9-credit-liquidity-and-operational-risk 19/112
2 CREDIT RISK
l Derivative positions (unlike assets such as bonds) can have a positive or negative or zero value depending on how market rates have moved since the deals were struck.
l When valuing a derivative, do not include the notional principal sums involved in transactions since these are not cash flows. Only include actual cash flows.
S E T T L E M E N T R I S K : WH AT IS Y OUR E X P O S UR E ON M AT UR I T Y ?
2 . 4 We have looked at how the economic value of the money owed to you by debtors (be it in the form of trade credit or lending) can be measured. We have also examined the credit exposures arising from the use of derivatives. Do these provide a complete measure of the credit exposures arising from business activities? The answer is, ‘
Not quite’!
There is one particular facet of credit risk known as settlement risk . This relates to differences in the timings at which money owed by one organisation to another is paid, or ‘settled’. For example, Company A may consider it has no net credit exposure to Company B since the sums owed from each to the other match, both contractually and in terms of the settlement date. What happens, however, if Company A settles its debts to Company B only to find that Company B goes into liquidation prior to completing its payments to Company A on that same day? This may sound a little far
fetched,
but
it
is
not.
If
companies
cease
trading
they
do
so
at
a
precise point. At that point the company stops making any payments even if they are related to inflows received minutes earlier. This risk principally arises through foreignexchange transactions that result in payments being made and received in different time zones – for example, paying Japanese Yen into an account in Tokyo set against an equivalent sum to be received in US dollars – but in an account in New York. The time difference of fifteen hours could prove costly to the company receiving the US dollars if the company due to pay them ceases trading that day prior to New York opening for business, but after Tokyo has received the Yen.
BOX 2.2 HORRIBLE HERSTATT Banks have always had what they call ‘settlement limits’ for customers and other banks. This is supposed to put a ceiling on how much they will pay to a counterparty on any particular day. Until the 1970s, however, such limits were often treated with scant respect,
especially
for
foreignexchange
trading.
After
all,
by
definition, an exchange involves handing over and receiving equal value in two currencies, so where could there be a risk?
OU BUSINESS SCHOOL 19
7/28/2019 b821 Block4unit9 Credit Liquidity and Operational Risk
http://slidepdf.com/reader/full/b821-block4unit9-credit-liquidity-and-operational-risk 20/112
UNIT 9 CREDIT, LIQUIDITY AND OPERATIONAL RISK
The Herstatt collapse showed rather vividly where the risk comes from. Herstatt was a German bank that ran into trouble and eventually collapsed. Up to the day of disaster its foreignexchange dealers had bought large quantities of deutschmarks (DEM) for US dollars (USD). On the final day the counterparties happily paid over their DEM – but the bank ceased trading in the afternoon which, given the time differential between Frankfurt and New York, was after the bank had received the DEM, but before it had instructed its New York agent to pay the equivalent USD. Oh, how they howled! The counterparty banks tried to claim that the DEM payments were inextricably linked to the USD receipts and so should be repaid. ‘Not so’ said the courts, and the banks were regarded as the same as all other unsecured creditors. They eventually received a few cents on each dollar. Since then settlement risk has been taken seriously.
Recent developments – including the emergence of a system called continuous linked settlement (CLS) – have helped banks to mitigate settlement risk by ensuring that payments truly match in terms of the time of their settlement. Settlement risk is, though, still an issue for many organisations and requires considered management.
BOX 2.3 CONTINUOUS LINKED SETTLEMENT Continuous linked settlement, or CLS, is a realtime system that enables the simultaneous settlement of cash flows globally, irrespective of time zones. It is an ongoing process of: – submitting instructions, where the system receives instructions
for payments of specified currencies from its customers; – funding, where the system settles ‘pairs’ of instructions; – execution, where the system makes payouts in specified
currencies. Settlement is final and irrevocable. Participating banks get realtime settlement information that helps them to manage liquidity more efficiently, reduce credit risks and introduce operational efficiencies. This is all done within a fivehour window (three hours in the Asia Pacific zone) which represents the overlapping business hours of the participating settlement systems. Sourced: www.clsgroup.com (accessed 5/9/05)
20 OU BUSINESS SCHOOL
7/28/2019 b821 Block4unit9 Credit Liquidity and Operational Risk
http://slidepdf.com/reader/full/b821-block4unit9-credit-liquidity-and-operational-risk 21/112
S UM M AR Y 2 . 5 This section has identified the ways in which credit risk arises and the factors that have to be taken into account to measure it properly. Already you may have appreciated that the nuances involved help to warrant the high salaries paid to the best credit analysts – indeed, even the examples used in this section are only modestly complex when compared with the credit exposure arising from investing in the more convoluted financial products.
We now need to look at the process for managing and containing the exposure to credit risk. In short, an organisation can do two things: l Firstly, it should establish a process for determining the size and
characteristics of a credit line for each counterparty with which it wishes to do business. We look at this process in Section 3.
l Secondly, it can employ various methods to mitigate credit exposure. In Section 4 we shall look at a variety of methods that can reduce the exposure to financial loss in the event of default by a counterparty.
����������������������������������������
2 CREDIT RISK
OU BUSINESS SCHOOL 21

7/28/2019 b821 Block4unit9 Credit Liquidity and Operational Risk
http://slidepdf.com/reader/full/b821-block4unit9-credit-liquidity-and-operational-risk 22/112
UNIT 9 CREDIT, LIQUIDITY AND OPERATIONAL RISK
22 OU BUSINESS SCHOOL
7/28/2019 b821 Block4unit9 Credit Liquidity and Operational Risk
http://slidepdf.com/reader/full/b821-block4unit9-credit-liquidity-and-operational-risk 23/112
3 C R ED I T LI N ES 3 CREDIT LINES
I N T R O D UC T I O N3 . 1 In Section 2 we studied the factors that organisations have to take into account in measuring their credit exposure. This section examines the methods that can be employed to determine the size of credit lines.
A credit line is set as the maximum financial exposure an organisation is prepared to allow a counterparty, be they a customer or a borrower. There are a variety of approaches that can be employed to assist in the assessment of the credit standing of counterparties and in the determination of the size of a credit line for them. These approaches may be summarised as follows. l Using the ratings supplied by the creditrating agencies such as
Standard and Poor’s. l Doing analysis using basic methods of credit analysis, including
an analysis of financial ratios. l Undertaking detailed credit research on each potential debtor. These three approaches are not mutually exclusive. Many credit analysts use all three categories of information when fixing the size of their organisation’s credit lines. In addition, the ratings agencies themselves will use ratio analysis to help in their determination of their ratings. For some companies with no published ratings – which is usually the case if a company does not raise funds by issuing securities – there is little else to work on other than the core financial indicators when determining the size of the credit line. By contrast, if credit ratings are available, the credit department may base their credit work entirely on the findings of the agencies and relate the size of credit lines to the quality of the ratings. This, however, has some risks since the assessments of the agencies are not infallible. The most sophisticated credit departments conduct their own detailed analysis of each company and may only use the agency ratings to cross check their own findings.
Whatever method is used, there is no definitive or mathematical link from a credit assessment to an optimum size for a credit line. The process of determining the size of a credit line is subjective. The process may also involve negotiations between the lender and the borrower. As with the other financial risks we have been looking at in this block, the extent of the credit risks taken will also
We looked at how financial ratios can be used to gain an understanding of a customer ’s credit standing in Unit 3.
OU BUSINESS SCHOOL 23

7/28/2019 b821 Block4unit9 Credit Liquidity and Operational Risk
http://slidepdf.com/reader/full/b821-block4unit9-credit-liquidity-and-operational-risk 24/112
UNIT 9 CREDIT, LIQUIDITY AND OPERATIONAL RISK
depend on both the capacity and the appetite for risk of the organisation extending credit. Let us look in a little more detail at the three approaches listed above.
G E T T I N G TH E C R E D I T - R AT I N G A GE NC I E S T O D O T H E WOR K 3 . 2
Credit ratings and the role of the creditrating agencies were introduced in Unit 3.
The majority of large investors will, to some extent, use the major creditrating agencies to help to determine their credit lines. The three largest and most influential agencies in the world currently are Standard and Poor’s (S&P), Moody ’s and Fitch (formerly Fitch IBCA). There are also a number of smaller agencies in various parts of the world that either have a geographic bias (for example, CRISIL in India) or concentrate on smaller companies (for example, Dun and Bradsheet).
BOX 3.1 INTERNATIONAL CREDIT-RATING AGENCIES Three creditrating agencies are recognised worldwide: Standard and Poor ’s, Moody’s Investor Service, Fitch Ratings. Standard and Poor’s (S&P) was established in 1860 by Henry Varnum Poor. The agency’s founding principle was ‘the investor has the right to know’. Moody’s Investor Service was established in New York by John Moody in 1900. Fitch Ratings was founded as the Fitch Publishing Company in 1913 by John Knowles Fitch in New York City and was initially a publisher of financial statistics whose consumers included the New York Stock Exchange.
Shortterm debt is defined as debt that, at the time of issuance, has a maturity of no more than one year.
Each of these agencies provides ratings for issuers of longterm and shortterm debt. In fact, bond issuers will normally have to secure a rating to enable them to be able to issue their bonds in the
world’s financial markets. Table 3.1 provides a summary of the longterm ratings employed by Moody ’s and by Standard and Poor’s. A fuller breakdown and description of the Standard and Poor’s ratings are provided in
Appendix 1. The higher the ratings of an organisation the lower the assessed credit risk of investing in it. A higher rating will, therefore, mean that it should be cheaper for the organisation to raise funds and the greater should be its access to credit lines. There is not, though, a perfect correlation between ratings and the size of credit lines. For example, some organisations are highly
Note that ratings agencies provide credit ratings in respect of both the organisation and the debt issues of the organisation.
24 OU BUSINESS SCHOOL

7/28/2019 b821 Block4unit9 Credit Liquidity and Operational Risk
http://slidepdf.com/reader/full/b821-block4unit9-credit-liquidity-and-operational-risk 25/112
’ ’
3 CREDIT LINES
rated, but may have little need to borrow money. In these circumstances investors may not establish large credit lines for such organisations since they would be unlikely to be well utilised. Table 3.1 Summary of long-term credit ratings for Moody s and for Standard and Poor s
Moody’s Standard & Poor’s
Highest quality Aaa AAA Investment grade
High quality Aa AA Upper medium A A Medium Baa BBB Speculative Ba BB Noninvestment
grade Highly speculative B, Caa B, CCC, CC Default Ca, C D Source: http://personal.fidelity.com (accessed 5 September 2005)
The details in Table 3.1 show a division between what is categorised as investment grade and noninvestment grade ratings. ‘Noninvestment grade’ is also termed ‘speculative’ or ‘junk’. The division between investment grade and noninvestment grade is a critical one. Many institutional investment funds do not hold noninvestment grade assets. So if an organisation’s credit rating falls even one level below investment grade many funds are forced to sell the bonds issued by it. This inevitably puts downward pressure on the market price of these bonds. Once credit ratings are established, can they be altered? The answer is most definitely, ‘ Yes’. The financial performance of credit rated organisations is regularly reviewed and each year a number
will
find
themselves
‘up
rated
’ or
‘down
rated
’. These
movements in ratings are normally signalled ahead of the event by the agencies announcing to the markets that the organisation is under ‘review ’ or on ‘credit watch’ for a possible ratings move. These moves reflect the agencies’ assessment of changes in both the specific performance and financial strength of the organisation and the general business climate for the sector in question. For the organisations that find themselves down rated the consequences can be significant, with funding costs rising. This is virtually inevitable as investors in the organisation seek recompense for the greater credit risk they are now taking. This power over debt issuers leads at times to confrontations between an agency that has cut a rating and the affected
Company pension funds are an example of institutional investment funds.
OU BUSINESS SCHOOL 25

7/28/2019 b821 Block4unit9 Credit Liquidity and Operational Risk
http://slidepdf.com/reader/full/b821-block4unit9-credit-liquidity-and-operational-risk 26/112
UNIT 9 CREDIT, LIQUIDITY AND OPERATIONAL RISK
organisation which disputes the rationale for the move. It has been argued that the agencies are always more ready to cut ratings if performance weakens than to raise them when performance improves.
Note that it is the issuers of debt instruments (such as bonds) that approach – and pay – the agencies for their credit ratings, not the investors .
ACTIVITY 3.1 AGENCY INFLUENCE Read the case studies in the Course Reader entitled ‘ Journey to junk ’ by Jenny Wiggins about General Motors (originally published in The Financial Times ) and ‘ Who rates the raters’ (originally published in The Economist ). The articles tell you a considerable amount about the influence of the rating agencies and identify the impact of the substantial reduction in the quality of its credit ratings on General Motors’ cost of funds. Later, in 2005, Standard and Poor ’s reduced General Motors’ long-term rating to ‘ junk ’ status (BB+, the highest rating for a non-investment grade bond). By contrast, Moody ’s reduced General Motors’ long-term rating to Baa3, one level higher, since this is their lowest rating for an investment grade bond. Having read the articles, what do you think led to the rapid decline in General Motor ’s credit ratings?
Adverse movements in ratings can sometimes occur over a very short time scale. Even organisations once rated AAA have slipped down the ratings table and gone into default – although the incidence of this happening is very small. Certainly many singleA organisations have taken this route. Table 3.2 shows the average ‘transition rates’ over oneyear periods between 1981 and 2004 compiled by Standard and Poor’s. These rates show the historic average outturn of ratings at the end of each oneyear period given a particular rating at the start of the year. The table also shows the incidence of default by the rated organisations. For example, an average of 0.06% of organisations rated AA at the start of a year finished with a noninvestment grade rating of BB. The average default rate within the same period of time was only 0.01%. Unsurprisingly, the incidence of default increases the lower the original rating. For example, the average default rate for organisations originally rated B amounted to 5.71%. Note, though, that some ratings do rise. For example, over a oneyear period an average of 0.05% of A rated companies ended the year at AAA. So beware, an investment originally made in a strongly rated organisation can go wrong and lose you money. Clearly the longer the term of your investment the greater the risk of such an adverse move in credit status – a factor that contributes to the cost of borrowing rising the longer the term to maturity.
26 OU BUSINESS SCHOOL

7/28/2019 b821 Block4unit9 Credit Liquidity and Operational Risk
http://slidepdf.com/reader/full/b821-block4unit9-credit-liquidity-and-operational-risk 27/112
–
3 CREDIT LINES
Table 3.2 Global average one-year transition rates (%) 1981 2004 From/To AAA AA A BBB BB B CCC/C D N.R.* AAA 87.44 7.37 0.46 0.09 0.06 0.00 0.00 0.00 4.59 AA 0.60 86.65 7.78 0.58 0.06 0.11 0.02 0.01 4.21 A 0.05 2.05 86.96 5.50 0.43 0.16 0.03 0.04 4.79 BBB 0.02 0.21 3.85 84.13 4.39 0.77 0.19 0.29 6.14 BB 0.04 0.08 0.33 5.27 75.73 7.36 0.94 1.20 9.06 B 0.00 0.07 0.20 0.28 5.21 72.95 4.23 5.71 11.36 CCC/C 0.08 0.00 0.31 0.39 1.31 9.74 46.83 28.83 12.52 * N.R. means ‘not rated’ at the end of the year – for example, due to the maturity during the year of the bond issues by the organisation that had previously been rated. Source: http://www2.standardandpoors.com/spf/pdf/fixedincome/DefaultUpdate2005Q1.pdf (accessed 1/11/05)
BOX 3.3 JAPANESE BANKS: TUMBLING FROM THE AAA HEIGHTS In the 1980s the largest banks in the world, when measured by size of assets, were Japanese. These banks also had excellent credit ratings: many of them were rated AAA by the rating agencies. The past two decades, however, have seen a swift descent of the Japanese banks from these ratings levels, with even the larger banks falling to BBB status. The cause of this was the rapid decline in the quality of the banks’ assets. The prolonged recession in Japan in the 1990s pushed down land, property and share prices and led to escalating loan losses. The decline in share prices was particularly problematic for the Japanese banks because of the widespread practice of cross
holding of shares among Japanese financial institutions. When the share
price
of
one
bank
fell,
the
market
valuation
of
other
banks
holding those shares fell, therefore putting downward pressure on their share prices: a classic example of a (financial) ‘vicious circle’. In recent years the banks have started slowly to rebuild and improve the credit quality of their balance sheets and bank mergers have also taken place. The expectation is that the coming years will see at least a modest reversal of the decline in the credit ratings levels of the Japanese banks.
OU BUSINESS SCHOOL 27
7/28/2019 b821 Block4unit9 Credit Liquidity and Operational Risk
http://slidepdf.com/reader/full/b821-block4unit9-credit-liquidity-and-operational-risk 28/112
UNIT 9 CREDIT, LIQUIDITY AND OPERATIONAL RISK
Analysis of the agencies’ credit ratings highlights the following characteristics: l a cyclical pattern with reductions in ratings being prevalent
during periods of economic recession and the reverse during economic expansion;
l a
bias
towards
larger
companies
with
these
generally
securing
better ratings than their smaller peers;
l greater movement in the ratings of nonfinancial companies (‘corporates’) compared with those of financial organisations.
The explanation the agencies would probably give for this is that this is all logical! During economic recessions companies are likely to experience falling sales and profitability that weaken their creditworthiness. Larger companies will tend to have, in absolute terms, larger reserves and greater capacity to ‘ride out’ temporary periods of
weak performance, thus making their credit strength greater than their smaller peers. The sales and profitability of ‘corporates’ are normally more volatile during economic cycles compared with financial organisations, making greater volatility in their ratings explicable.
Whatever the contrasting views held about the creditrating agencies, there is no doubt that they are very influential. In fact, this power is being bolstered by new regulations on the capital requirements for investments made by financial organisations. Under
these
regulations,
known
as
Basel
2
(see
Box
3.4),
one
method for determining the risk of an investment and the capital that needs to be set aside to support it is directly related to the ratings levels provided by the agencies. Certainly it is rare to find an institutional investor who does not look at the agency ratings before investing in an organisation. Issuers of debt also know that it is not a question of getting any credit rating, but rather a question of getting a sufficiently good rating from the major agencies before they can get access to funds from many of the financial markets around the world.
BOX 3.4 BASEL 2 Basel 2 is the term for the guidelines on the international capital requirements for banks and other financial institutions. These requirements are scheduled to be applied from 2007. In the European Union their application is supported by an EU directive. Basel 2 replaces the (rather simpler) guidelines laid down in Basel 1, which applied from 1988. The essence of these guidelines is that they determine how much capital financial institutions have to put aside to support their
28 OU BUSINESS SCHOOL

7/28/2019 b821 Block4unit9 Credit Liquidity and Operational Risk
http://slidepdf.com/reader/full/b821-block4unit9-credit-liquidity-and-operational-risk 29/112
lending activities. The riskier the lending, the greater the capital requirement. This capital is the financial cover for loan losses arising from default by borrowers. By applying these guidelines, Basel 2 is intended to ensure that financial institutions remain solvent even if losses on lending are high. In this way, Basel 2 is aiming to reinforce the public’s confidence in financial institutions. Basel 2 is an important development even for nonfinancial companies since it sets the framework for the evaluation and, thereby, the pricing of lending by financial institutions. If Company A and its business sector is assessed as being a ‘higherrisk’ under Basel 2 than Company B then it is very likely that the cost of borrowing money will be higher for Company A than for Company B. For further information on Basel 2, visit the website of the Bank for International Settlements (BIS). A link to this is provided on the course’s website.
BAS I C M E T H O D S O F C R E D I T ANAL YS I S
3 . 3 Many organisations undertake their own credit appraisal of those institutions to which they lend or extend trade credit. This is often needed since many organisations, including medium and small businesses, will not have public credit ratings. Indeed, it is usually only those organisations that borrow in the financial markets that have ratings issued by Moody ’s, Standard and Poor’s or Fitch.
Without the likes of Moody ’s to help you, how should you judge creditworthiness – particularly ‘trade credit’ which is the most common form of exposure if you are doing business with other organisations? The techniques for analysing accounts covered in Units 2 and 3 can be applied here. Most
of
the
time
you
can
expect
to
be
paid
in
the
normal
course
of trade: that is, out of the revenue derived by the organisation to
which you have extended credit when selling goods and services. In other words, as a current liability creditor you should be looking to the quality of your customer’s current assets as your main surety of payment. The information sought should therefore include answers to the following questions. l Are the company ’s sales going well? l Is the inventory current and moving? l What is the length of the operating cycle? l Does the company strip out bad (and doubtful) debts from its
receivables?
3 CREDIT LINES
This section draws on and expands the section dealing with credit analysis in Unit 3.
OU BUSINESS SCHOOL 29
7/28/2019 b821 Block4unit9 Credit Liquidity and Operational Risk
http://slidepdf.com/reader/full/b821-block4unit9-credit-liquidity-and-operational-risk 30/112
UNIT 9 CREDIT, LIQUIDITY AND OPERATIONAL RISK
Note that credit agencies such as Experian or Dun and Bradsheet focus on trade credit. Their focus is, therefore, different from that of the international rating agencies such as Standard and Poor's, which is on the credit standing of organisations raising funds from the financial markets.
l Does the business have sufficient lines of shortterm credit? l What is the customer’s payment record and/or its reputation
for payments within the industry? How can answers to these questions be obtained? It is might be possible to request a credit report from the client’s bank (with the permission of the company). Alternatively, a credit assessment may be available from a business credit agency such as Experian or Dun and Bradstreet. However, care needs to be taken in interpreting the results. It is important to remember that the bank has a duty of care to its customer, though it must not be untruthful, and therefore it is likely to give an undetailed answer that may have limited use for credit analysis. Agencies’ reports are often not much more illuminating, though they should warn of any court proceedings lodged against the prospective customer. Therefore, even if reports from banks or agencies are obtained, these should
not
be
regarded
as
a substitute
for
an
analysis
of
the
customer
’
s
balance sheet and income statement. No client who is serious about maintaining a continuing supplier – customer relationship will object to a request for the published accounts; indeed, many companies see such requests as contributory evidence that the supplier is professional and safe to rely on for the ongoing supply of materials.
An important source of information that is often overlooked is the industry ’s ‘grapevine’ – the information that may be obtained informally about businesses within trade and business organisations, such as the Chambers of Commerce in the United Kingdom. If a business is having trouble, its peers are usually the first to find out, excepting perhaps the unfortunate firm’s bank. Of course, such information is hearsay, perhaps even merely gossip, but it is unwise to ignore such rumours without at least trying to substantiate them.
EXERCISE 3.1 Is the aim of trade credit analysis to reduce bad debts to zero?
Before moving on from this survey of the basics of creditrisk analysis, here is a cautionary tale to show that you need to think through the implications of your methods, especially when introducing new techniques. The story in Box 3.5 is not strictly an example of trade credit, but it is certainly relevant to business debt in a wider sense.
BOX 3.5 NEURAL NETWORKS AND CREDIT ANALYSIS In the past few years, work on ‘
artificial intelligence’ in general and on ‘neural networks’ in particular have developed considerably.
30 OU BUSINESS SCHOOL

7/28/2019 b821 Block4unit9 Credit Liquidity and Operational Risk
http://slidepdf.com/reader/full/b821-block4unit9-credit-liquidity-and-operational-risk 31/112
3 CREDIT LINES
What is a neural network? Briefly, it is a type of computer designed to mimic the workings of a brain. A large amount of data together with the results associated with the data are fed into the computer and, over time, it programs its own internal ‘pathways’ so that input corresponds with appropriate output, in a similar way to how neurons in the brain develop connections and pathways as we learn. When the output from test data reliably matches the expected result, the machine is ready. You then feed it new data to get real results that were not precalculated. What does this have to do with credit analysis? Some financial institutions in the US realised that the type of analysis being done to decide on credit ratings was very amenable to neural network
type programming. Accordingly, neural computers were ‘trained’ with large amounts of data about past credit decisions and the eventual
repayment
outcomes.
When
the
reliability
of
the
results
from the network exceeded the previous scoring methods in predicting whether a particular application should be accepted or rejected, the financial institutions started to use it for making actual lending decisions. Unfortunately, after a while the banks found themselves subject to a number of lawsuits. US law requires banks to give fair and careful consideration to any and all loan proposals. Being turned down in the US for credit can be damaging – embarrassing to an individual and potentially serious to a small business. The crux of the matter was that, while no one (well, not many people) doubted that the neural networks were on average more accurate, it was impossible to prove that in any particular case ‘due consideration’ had been given. With a neural network you just feed in data at the front, say the magic word and use the output from the back. It is the ultimate statistical ‘black box’. Since the banks could not show in a deterministic way why they had turned down the loans, they lost the cases, so now they have gone back to their previous assessment methods. These may be less accurate, but at least the banks can show that A, B and C were done and the answer was F – for ‘Fail’.
MORE AD V ANC E D M E T H O D S OF C R E D I T A NALY SI S
Rather than relying on either simple analysis using core ratios or on the ratings supplied by the external ratings agencies, many organisations that make investments undertake their own bespoke credit analysis. Indeed, many financial institutions now adopt internal ratings systems of their own. These tend to be similar, but not identical, to those of the external ratings agencies.
OU BUSINESS SCHOOL 31
3 . 4
7/28/2019 b821 Block4unit9 Credit Liquidity and Operational Risk
http://slidepdf.com/reader/full/b821-block4unit9-credit-liquidity-and-operational-risk 32/112

7/28/2019 b821 Block4unit9 Credit Liquidity and Operational Risk
http://slidepdf.com/reader/full/b821-block4unit9-credit-liquidity-and-operational-risk 33/112
l
l
3 CREDIT LINES
What is the relationship between the organisation and its subsidiaries – are there credit support obligations from the former to the latter?
BOX 3.7 CREDIT SPREADS AND ‘RISK-FREE ’ YIELDS A credit spread is the difference between the yield on a bond issued by a company and the yield on a ‘riskfree’ bond – normally a high creditquality government bond of equivalent term to maturity. The ‘riskfree’ bond has a probability of default of either zero or close to zero, so the greater the credit risk associated with the company the higher will be the credit spread over the ‘riskfree’ yield, since investors will want returns that are proportionate to the perceived credit risks associated with their investments.
What is the degree of volatility in the market price of the securities issued by the organisation? Volatility analysis is informative of the risks of investing generally in the organisation’s industrial sector and of the sensitivity of the organisation’s performance to trends in the economy as a
whole. Analysis here should include studying the historical ‘credit spreads’ on the organisation’s debt securities. Spreads matter. Even if the organisation you invest in does not default, the valuation of its debt (which is the investor’s asset) will fall if credit spreads widen even if other market conditions remain unchanged. As Figure 3.1 overleaf shows, investors experienced a roller coaster ride in the valuation of their holdings of Ford bonds in 2002 as a result of spread movements – even if their fate was better than those who had invested in WorldCom,
which eventually defaulted. BOX 3.8 CREDIT SPREADS AND BOND VALUES To demonstrate the impact of credit spreads on bond valuations let us look at an example. An organisation issues a fiveyear bond at par at a yield to maturity of 5% p.a. The yield on a ‘riskfree’ bond of equivalent duration at the time of issue is 4%, therefore making the credit spread 5 4% = 1%. Over the next year, credit conditions deteriorate for the organisation. Although the yield on the ‘riskfree’ bond remains at 4% p.a., the credit spread for the organisation widens to 2%, making the yield to maturity on its bond – which now has a residual life of four years – rise to 6% p.a.
OU BUSINESS SCHOOL 33
7/28/2019 b821 Block4unit9 Credit Liquidity and Operational Risk
http://slidepdf.com/reader/full/b821-block4unit9-credit-liquidity-and-operational-risk 34/112
UNIT 9 CREDIT, LIQUIDITY AND OPERATIONAL RISK
In these circumstances the investors will find that the market price of their bond holding has fallen from 100.00 to 96.53 – a loss of 3.47%. Bond pricing and duration
were covered in Unit 7.
ACTIVITY 3.2 Bond valuation was covered in Unit 7 – let’s try some revision here. A company issues a six-year bond at par (100.00) with an annual coupon of 5% p.a. One year later (and after the payment of the coupon at the end of Year 1), the bond has a yield to maturity of 7% p.a. for its residual five-year life as a result of widening credit spreads. What is the price of the bond now, one year after its issue date? You should find that the bond's price has fallen to 91.80 – a loss of 8.2%.
% p . a .
( c r e d i t s p r e a d )
10
9
8
7
6
5
4
3
2
1
0
J a n 0
2
F e b 0
2
M a r 0 2
A p r 0 2
M a y 0
2
J u n 0
2
J u l 0
2
A u g 0
2
D e c 0 2
S e p 0
2
O c t 0
2
N o v 0
2
WorldCom
Ford
IBM
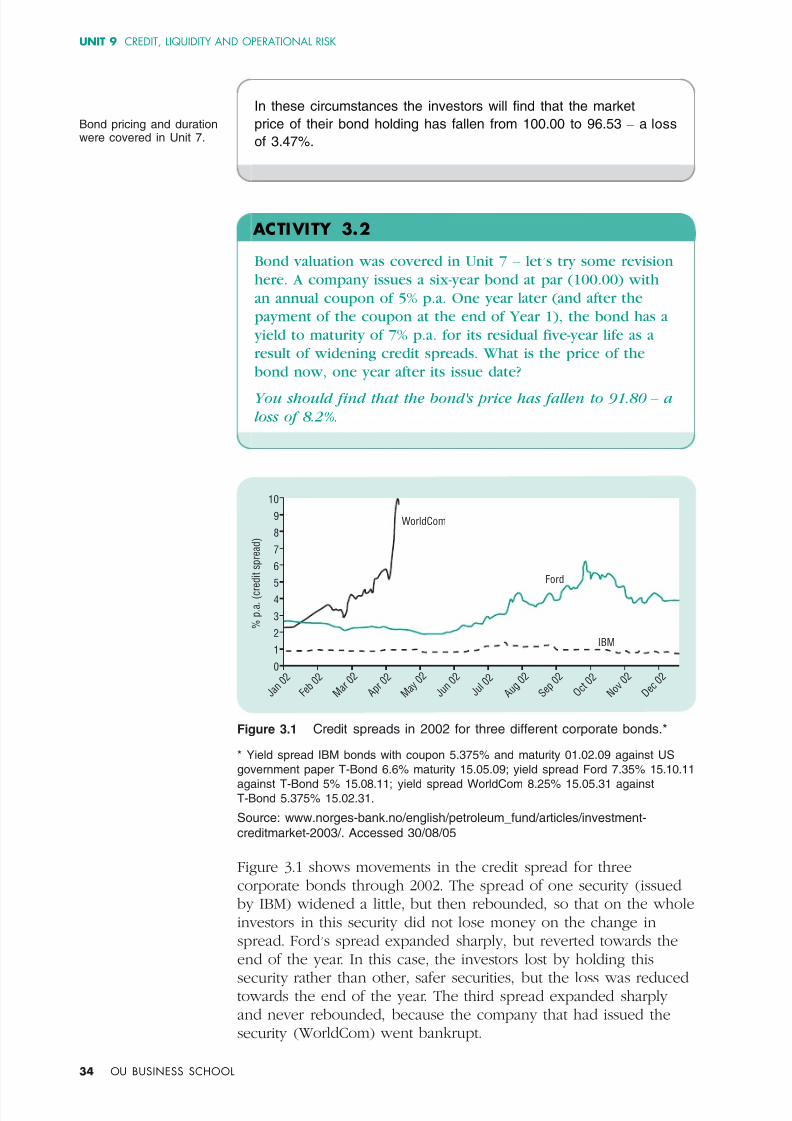
Figure 3.1 Credit spreads in 2002 for three different corporate bonds.* * Yield spread IBM bonds with coupon 5.375% and maturity 01.02.09 against US government paper TBond 6.6% maturity 15.05.09; yield spread Ford 7.35% 15.10.11 against TBond 5% 15.08.11; yield spread WorldCom 8.25% 15.05.31 against TBond 5.375% 15.02.31. Source: www.norgesbank.no/english/petroleum_fund/articles/investment-creditmarket2003/. Accessed 30/08/05 Figure 3.1 shows movements in the credit spread for three corporate bonds through 2002. The spread of one security (issued by IBM) widened a little, but then rebounded, so that on the whole investors in this security did not lose money on the change in spread. Ford’s spread expanded sharply, but reverted towards the end of the year. In this case, the investors lost by holding this security rather than other, safer securities, but the loss was reduced towards the end of the year. The third spread expanded sharply and never rebounded, because the company that had issued the security (WorldCom) went bankrupt.
34 OU BUSINESS SCHOOL
7/28/2019 b821 Block4unit9 Credit Liquidity and Operational Risk
http://slidepdf.com/reader/full/b821-block4unit9-credit-liquidity-and-operational-risk 35/112
EXERCISE 3.2 3 CREDIT LINES
Looking at the information in Figure 3.1, why do you think the price of the Ford bond was more volatile than the IBM bond in 2002? What influence would this differential price volatility have on the attitude of an organisation with surplus funds to invest when considering the setting up of credit lines for buying bonds issued by the two companies?
Having now looked at the various approaches that can be employed to research the credit quality of an organisation how do
we use this analysis to establish the size of the credit line? This is what we now turn to.
T UR N I N G T HE A NALY SI S INTO C R E D I T L I N E S
3 . 5 Whatever route taken to complete the credit analysis of a company, we now reach the tricky bit. How do you convert a series of both ‘hard’ quantitative facts and ‘soft’ qualitative judgements about the creditworthiness of a company into a credit line with a precise cash limit on the maximum to be owed by it? The process will reflect the ‘credit culture’ of the organisation, since two otherwise identical investing institutions may have differing appetites for risk, perhaps simply because of the past experiences of senior management. You will recall from the work on risk mapping in Unit 7 that policy on taking risk reflects the specific circumstances of individual organisations – with some being more averse to risk than others. Parameters to be applied The likelihood, though, is that at least some of the following list of parameters would be applied. Impose a minimum credi t qual i ty There are likely to be minimum ratings criteria (be they creditrating agency or internally based) prior to the establishment of any credit line. For example, the minimum criteria applied by many investors (based on Standard and Poor’s ratings) are AA long term and/or A1 short term. Additionally, the potential size of a credit line is usually positively related to the quality of the credit ratings – although, as noted earlier, this is not a definitive relationship. For example, as some organisations with excellent credit quality do not have a large borrowing requirement, so investors may therefore not set large credit lines for them.
OU BUSINESS SCHOOL 35
7/28/2019 b821 Block4unit9 Credit Liquidity and Operational Risk
http://slidepdf.com/reader/full/b821-block4unit9-credit-liquidity-and-operational-risk 36/112
UNIT 9 CREDIT, LIQUIDITY AND OPERATIONAL RISK
In setting limits for an industrial sector many investors use the internationally adopted Standard Industrial Classifications index or ‘SIC codes’ that identify different types of industry. The term ‘systemic risk’ means the risk of correlated defaults by organisations within a particular sector or country over a short period of time.
Set an absolute maximum for the organisat ion . . . There should be an ultimate maximum on the size of a credit line for any organisation. This could be expressed as a percentage of the investing organisation’s capital base and this ensures that, regardless of credit standing, it is not over exposed to any entity. The
maximum
on
the
size
of
the
credit
line
should
also
be
linked
to the size of the borrower. This could again be expressed as a percentage of its capital base. Of course, if this latter maximum exceeds the ‘ultimate maximum’ defined above, it is the organisation’s ‘ultimate maximum’ that prevails. . . . a maximum for the sector
A maximum should apply to the industrial sector in which the borrowing organisation resides. The economic performance of an individual organisation is correlated to that of its sector and if one organisation is experiencing financial difficulties, it is likely that at least some of its peers are also. This ‘systemic risk’ should be factored into the process of determining the size of credit lines. . . . and for the country There should be a maximum credit limit for each country (with each organisation being assigned to a country in which it is considered domiciled) to avoid over exposure to one economy. This is a common practice, although the globalisation of business activities makes the practice increasingly questionable: for example, to which country would you assign Ford? The answer would almost certainly be the US. This, however, does not reflect the fact that Ford operates globally and its financial wellbeing may be as strongly related to nonUS markets as it is to its ‘home’ US market. Demarcat ions for di f ferent types of exposure Having set the above limits you can apply some demarcations for different types of exposure. Credit lines should be segregated by maturity range. Typical delineations for the residual maturities of exposures are three months, one year, five years and ten years – but there are no definitive rules about these maturity cutoff points. If an organisation only has a shortterm credit rating, however, it should only be assigned a credit line for exposures of up to one year. Owing to its relative simplicity, it is more common for organisations to set limits based on actual maturities rather than by the duration of assets. Some lenders do have segregated credit lines for different instruments like bonds, derivatives and foreign exchange. This helps to ration the use of the aggregate credit line between the different areas of the business. This policy can also help to ensure that those using the credit line are sufficiently expert in the exact type of business that results in credit exposure being generated (for example, the permission to use a credit line for foreignexchange business can be granted only to those who are proficient in foreignexchange transactions).
36 OU BUSINESS SCHOOL
7/28/2019 b821 Block4unit9 Credit Liquidity and Operational Risk
http://slidepdf.com/reader/full/b821-block4unit9-credit-liquidity-and-operational-risk 37/112
3 CREDIT LINES
Decide on the base currency for measuring exposures Lenders will also need to decide on how to accommodate activities in different currencies. The most effective way to do this is decide on the base currency for the credit lines and then to convert, on a daily basis, exposures in other currencies to the base currency at
the
prevailing
spot
foreignexchange
rate.
And f inal ly . . . Separate credit lines could be established for activities where there is mitigation of credit exposure through, for example, the provision of security or guarantees that support the exposure. Obviously the risk on unsecured credit exposure is not the same as it is with exposure that is secured. You still need to have credit lines for business that is secured in case the provider of the security defaults or the security falls in value. The risk of both the original borrower and the credit support both defaulting is, however, smaller than if just relying on the original borrower. Consequently, this reduction in risk should be reflected in the credit lines for secured lending being larger than the lines for unsecured lending to the same organisation. An example of a credit- l ine policy Combining these ground rules enables production of a creditline grid. An example of how this can look is shown in Table 3.3 overleaf. This example draws on many, but not all, of the possible factors for setting credit lines detailed above. In our example the lender, Southern Oil, is using both Standard and Poor’s and their own credit assessment of two companies –
West Baltic Bank and Auto Motors. As far as the internal assessment is concerned, potential borrowers are assigned to one of ten creditquality categories, with Category 1 being the highest quality and Category 10 the lowest quality. The minimum criteria for Southern Oil to provide a credit line are Standard and Poor’s BBB longterm and A2 shortterm ratings and Category 5 for its own internal assessment. As you can see from Table 3.3, Auto Motors only just gets approval for a credit line.
As regards the size of the lines, the Southern Oil’s absolute maximum for each credit line is the lower of 2% of the borrowers’
capital and its own capital of £5bn, as measured at the last balancesheet date. The board can and, in this example, does in the case of Auto Motors apply a limit below the maximum. This reflects the board’s prevailing view of the company. The credit line is then split between the maximum that can be lent long term (1 – 10 years) and the maximum that can be lent short term (0 – 1 year). In our example, the board is only prepared to lend short term to Auto Motors owing to its weak credit status. By contrast,
the
board
is
prepared
to
lend
long
term
to
up
to
£50m
of
the total £100m limit for West Baltic Bank because of its superior credit standing.
OU BUSINESS SCHOOL 37

7/28/2019 b821 Block4unit9 Credit Liquidity and Operational Risk
http://slidepdf.com/reader/full/b821-block4unit9-credit-liquidity-and-operational-risk 38/112
’
UNIT 9 CREDIT, LIQUIDITY AND OPERATIONAL RISK
Finally, Table 3.3 gives the prevailing credit exposures against these limits, showing that all are at levels compliant with the limit framework. If they are not, the board would have to be advised and asked to opine on what action to take in respect of an excess exposure. Table 3.3 Southern Oil s credit-line grid Organisation West Baltic Bank Auto Motors Country Germany United States Sector Banking Car
manufacture Credit ratings
Long term (S&P) AA BBB Short term (S&P) A1 A2 Internal assessment Category 2 Category 5
Company capital base £5.5bn £1.2bn Southern Oil’s capital base £5bn Maximum exposure: (lower of 2% of company and own reserves) £100m £24m Boardapproved maximum, of which £100m £15m
maximum in maturity term 1 – 10 years £50m £0m maximum in maturity term 0 – 1 year
£100m £15m Market value of exposure on 6/9/05 (in GBP or GBP equivalent)
1 – 10 years £25.3m £0m 0 – 1 year £50.6m £12m Total £75.9m £12m
Comments Within agreed limits Within agreed
limits
EXERCISE 3.3 Why do you think Southern Oil’s board approved a credit line for Auto Motors despite its relatively weak credit status? What action do you think the board would take if Standard and Poor ’s short-term credit rating for Auto Motors was immediately reduced to A3?
38 OU BUSINESS SCHOOL

7/28/2019 b821 Block4unit9 Credit Liquidity and Operational Risk
http://slidepdf.com/reader/full/b821-block4unit9-credit-liquidity-and-operational-risk 39/112
3 CREDIT LINES
EXERCISE 3.4 If the board’s limit for West Baltic Bank is £100m, why do the limits for 0 – 1 year exposure (£100m) and 1 – 10 year exposure (£50m) total £150m?
The creditline grid for Southern Oil is only one of a number of possible approaches for converting information on credit quality into credit lines. The clear message, though, is that there should be a linkage between the two. Additionally, there should be consistency in the approach when considering different organisations. In this
way the chances of truly linking risk appetite and risk capacity to risk policy are maximised.
BOX 3.9 A CHECK LIST FOR CREDIT ANALYSIS When assessing an organisation’s creditworthiness for the purpose of establishing a credit line, bankers and analysts employ a number of acronyms to ensure that all relevant factors have been considered. These include: CAMPARI – Character, Ability, Margin, Purpose, Amount,
Repayment, Insurance (that is, security). CCC PARTS – Character, Capital, Capability, Purpose, Amount,
Repayment, Terms, Security. PARSER – Person, Amount, Repayment, Security, Expediency,
Remuneration.
S UM M AR Y 3 . 6 In this section we have looked at the process that can be adopted to establish credit lines.
We looked at how credit analysis can be undertaken solely on the basis of the ratings provided by the external credit agencies. We also examined how this analysis could be augmented or replaced by organisations undertaking their own analysis to produce their own internal ratings of potential counterparties.
We finished the section by looking at one way that credit lines can be drawn up (in our case by the company Southern Oil). The trend in recent years has been for credit analysis to be more detailed than in the past. Many organisations have incurred substantial losses through high and lowprofile corporate failures in
OU BUSINESS SCHOOL 39

7/28/2019 b821 Block4unit9 Credit Liquidity and Operational Risk
http://slidepdf.com/reader/full/b821-block4unit9-credit-liquidity-and-operational-risk 40/112
UNIT 9 CREDIT, LIQUIDITY AND OPERATIONAL RISK
recent years. They are therefore increasingly prepared to invest resources in people and systems to gain a fuller appreciation of the credit quality of the organisations in which they are investing.
Additionally, investing organisations are engaging in activities that manage and mitigate the scale of their credit exposures. It is to these
practices
that
we
now
turn.
����������������������������������������
40 OU BUSINESS SCHOOL

7/28/2019 b821 Block4unit9 Credit Liquidity and Operational Risk
http://slidepdf.com/reader/full/b821-block4unit9-credit-liquidity-and-operational-risk 41/112
4 C R ED I T-R I SK M A N A GEM EN T
4 CREDIT-RISK MANAGEMENT
I N T R O D UC T I O N4 . 1 This section examines some examples of how organisations can manage or contain the extent of credit exposure that arises from their business activities. The examples we look at do not represent the complete list of methods available. They do, however, introduce
you to certain of the different approaches to creditrisk management, ranging from those that may be used by small companies to those employed by multinational companies.
We shall look at four techniques. l Debt factoring is used widely by small and medium sized
organisations to reduce credit exposure to debtors and improve cash flow.
l Letters of credit and letters of guarantee are two methods of containing credit risk for organisations involved in international trade.
l Securing credit exposures or linking lending to specific assets. This includes use of the repurchase (or ‘repo’) market and securitisation. The secured lending market is particularly helpful to organisations of a weak credit status that may have difficulties borrowing on an unsecured basis.
l Credit derivatives can be used to reduce the credit exposure or alter the creditrisk profile on investments.
Each technique either provides the ability to manage the exact nature of the credit risk being taken or it actually reduces the potential risk of loss arising from credit defaults. The counterweight to this latter benefit is that the returns to the investor usually fall in parallel with the simultaneous reduction in credit risk. The options examined in this section are a representative sample of the various ways credit risk can be mitigated: factoring, letters of credit, letters of guarantee and credit derivatives are methods of risk transference. Repo is an example of how collateral can be used to reduce credit risk. Securitisation is where risk is made more transparent (and therefore more certain) by linking lending to defined assets. Some of these techniques for managing credit risk are quite complex. In order to assist the learning process, therefore, their key features are examined in this section while further analysis of their more complicated facets is provided in Appendix 2.
OU BUSINESS SCHOOL 41
7/28/2019 b821 Block4unit9 Credit Liquidity and Operational Risk
http://slidepdf.com/reader/full/b821-block4unit9-credit-liquidity-and-operational-risk 42/112
UNIT 9 CREDIT, LIQUIDITY AND OPERATIONAL RISK
Factoring houses are companies that purchase trade receivables from suppliers (for example, the invoices to buyers) at a discounted price.
F AC T O R I N G4 . 2 Factoring, or debt factoring, is an exercise in creditexposure reduction and cashflow management employed by many small and mediumsized organisations. It involves an organisation entering into an agreement with a factoring house. The house acquires the organisation
’s trade debts – at a discount – as they arise in the course of its business in return for payments to the organisation.
The factoring house then has the right to these trade debts while the organisation has simultaneously reduced its credit exposure to its business customers and improved its cash flow. Typically the factoring house will initially pay up to 80% of the trade debt to the client organisation after deducting its charges. The remaining balance is paid when the organisation’s customer pays the factoring house. By holding back part of the payment to the organisation the factoring house gives itself some protection in the
event
of
a
default
by
the
customer.
While this arrangement means the organisation receives less than if it had chased the customer itself for the full amount due, the attractions are manifest. The organisation gets cash promptly, allowing it to pay its suppliers and providing working capital to continue its business activities. It does not waste time on either the analysis of the creditworthiness of its customers nor engage in the timeconsuming task of chasing payments. These tasks are left to the factoring house, which specialises in these matters and gains a fee for its intervention. Note that there is a difference between ‘recourse factoring
’ and ‘non-recourse factoring’. With recourse factoring, the factoring house will come back to the original supplier in the event of nonpayment by the customer. By contrast , with nonrecourse factoring, the risk of non-payment by the customer is completely transferred to the factoring house. Unsurprisingly, the fees for nonrecourse factoring are higher.
L E T T E R S OF C R E D I T AND L E T T E R S O F G UAR AN T E E
4 . 3
An example of a typical letter of credit is shown in Figure 4.1.
Letters of credit Very important tools for reducing credit risk in international trade are letters of credit, or LC. It is helpful for anyone who may become involved with importing or exporting to have some understanding of these and their various advantages and disadvantages. Given the continuing globalisation of business, it is likely that B821 students will from time to time have to deal with some form of crossborder trade – so what is a letter of credit? In essence, it is a way of reducing risk arising on payments for trade by interposing one or more banks between the supplier and the customer, as shown in Box 4.1.
42 OU BUSINESS SCHOOL

7/28/2019 b821 Block4unit9 Credit Liquidity and Operational Risk
http://slidepdf.com/reader/full/b821-block4unit9-credit-liquidity-and-operational-risk 43/112
4 CREDIT-RISK MANAGEMENT
The first choice that must be made is whether the LC will be LCs are sometimes ‘revocable’ or ‘irrevocable’. This means whether or not the customer referred to as
‘documentary credits’. can, with due notice, cancel the LC before the goods are shipped – strictly, before the documents are received by the advising bank. This does not give much assurance to the supplier, especially if the goods are customised to fit the order, so ‘irrevocable’ LCs are much more common. With irrevocable LCs the supplier can be reassured about receiving the payment due since these can only be amended or cancelled with the beneficiary ’s consent. Once a letter of credit has been set up, the supplier has transferred its credit risk from exposure to the customer to that of the interposed bank. It is worth pointing out, however, that the right to payment under the LC does not remove the supplier’s rights to claim directly from the customer.
BOX 4.1 WHY A LETTER OF CREDIT?
Sales contract
Flow of documentsFlow of money
Advising bank
Supplier Customer
Opening bank
Figure 4.1 A typical letter of credit Suppose an organisation, call it S for ‘supplier ’, is negotiating a significant order with company C, for ‘customer ’, but is concerned about granting credit terms as the two have not dealt with each other
before.
Furthermore,
C
is
based
in
a
country
that
has
periodically had difficulties in terms of foreigncurrency availability. S could remove its credit risk by demanding payment before shipment from C, but that might jeopardise the whole deal, C not being in a position to pay ‘up front’. In any case, C has little knowledge about S’s financial position, so would be reluctant to pay before receipt of goods. How can this be resolved? By using a letters of credit to set up an agreement, goods and funds flow in a way that reassures both C and S. It allows each of them to deal with an entity known to them and (hopefully) one that is regarded as financially sound – usually their own banks. Once C and S have agreed the trade terms of their contract, C requests its bank to open a letter of credit in favour of S.
OU BUSINESS SCHOOL 43
Opening bankAdvising bank
CustomerSupplier

7/28/2019 b821 Block4unit9 Credit Liquidity and Operational Risk
http://slidepdf.com/reader/full/b821-block4unit9-credit-liquidity-and-operational-risk 44/112
UNIT 9 CREDIT, LIQUIDITY AND OPERATIONAL RISK
This will state precisely what funds will be paid, and when, by the bank on their receipt of a specified set of documents. S is thus taking the credit risk of the bank rather than of C, which is usually an improvement in its creditrisk position. Vice versa, C is assured that payment will not be made provided the proper paperwork as required by the buyer has been received by the bank. These details are shown in Figure 4.1.
The supplier and the customer have to pay for the services they receive, but the reduction in uncertainty (and, thereby, risk) is usually perceived to be well worth the banks’ fees. The transfer of goods from supplier to customer inevitably takes time, particularly if the distance travelled is long. Someone has to fund
the
time
lag
and
the
terms
for
so
doing
are
often
specified
as
part of the LC process. The funding requirement can be taken up by any of the four protagonists (the supplier, the customer and the two banks) or split among them. It makes sense for the parties to a contract to arrange funding such that overall the least amount of interest has to be paid. The assurance of payment given by an LC allows this funding decision to be separated from the problem of granting credit.
BOX 4.2 STATE SUPPORT FOR INTERNATIONAL TRADE
Many governments provide support to companies engaged in international trade and those bidding to win overseas contracts. The rationale for this is simple: exports are a major means of generating wealth for a country and maintaining high levels of employment. It is hardly surprising that many governments
44 OU BUSINESS SCHOOL

7/28/2019 b821 Block4unit9 Credit Liquidity and Operational Risk
http://slidepdf.com/reader/full/b821-block4unit9-credit-liquidity-and-operational-risk 45/112
4 CREDIT-RISK MANAGEMENT
therefore provide direct financial support to exporters through, for example, the use of subsidies. Within the European Union the competition regulations inhibit the degree to which governments may interfere in foreign trade, but the provision of insurance against the credit risks arising is permitted. In the United Kingdom this support is provided by the Export Credits Guarantee Department (ECGD). This is the United Kingdom’s official export credit agency. Its role is to assist United Kingdom exporters and investors to trade overseas by providing them with insurance and backing for finance to protect against nonpayment by customers. There are equivalent organisations in a large number of countries (for example, Hermes in Germany). The ECGD’s main operations involve underwriting financial packages to support the sale of capital goods, such as aircraft and machinery, and services and to help United Kingdom companies take part in overseas projects such as the development of hospitals, airports and power stations. The total value of guarantees provided each year is around £4 bn. Sourced from: www.ecgd.gov.uk/index/pi_home.htm (accessed 14/9/05)
ACTIVITY 4.1 While letters of credit reduce the credit risks associated with foreign trade, what financial risks studied earlier in Block 4 may still apply to undertaking business with overseas companies? Unless all business is conducted within the same currency zone (for example, the euro zone), organisations engaged in overseas trade will be exposed to transactional and economic foreign-exchange risk. Additionally, if the organisation has subsidiaries based overseas, it becomes exposed to foreign-exchange translation risk (see Unit 8, Section 2).
Letters of guarantee A cousin of the letter of credit is the letter of guarantee, or LG.This allows for automatic payment if specific terms of a contract arenot fulfilled: for example, failing to supply the goods or supplyinggoods that do not meet set quality criteria.
Just as a supplier is at risk of not receiving payment having fulfilledits side of a contract, so can the purchaser be risking substantialfinancial loss if the seller fails to supply to specification and on
OU BUSINESS SCHOOL 45
7/28/2019 b821 Block4unit9 Credit Liquidity and Operational Risk
http://slidepdf.com/reader/full/b821-block4unit9-credit-liquidity-and-operational-risk 46/112
UNIT 9 CREDIT, LIQUIDITY AND OPERATIONAL RISK
time. For a large project, even before a contract is granted, the client is justified in requesting surety that the bidders are serious and can undertake the work if selected. In such cases the supplier will request its bank to open an LG in favour of the customer. This will state that if certain events occur – for
example,
the
project
is
completed
late
or
the
work
fails
a
safety
inspection – the bank will pay a preset amount to the aggrieved customer. Thus the bank, not the customer, is taking the credit risk. Particularly for large capital projects, an LGtype instrument provides the buyer with assurance of completion in a similar way to the LC assuring the supplier of payment. There are numerous names used for this type of document – ‘bid bond’, ‘performance bond’, ‘completion guarantee’. Legally, these instruments are developments of letters of guarantee, although being more precise about the specific events that can trigger payment. Nevertheless, they are all products of a similar type dealing with similar needs. The use of LCs and LGs has done a great deal in a practical way to encourage the expansion of international trade since the Second
World War. It is not necessary for each manager to be an expert on the peculiarities of the various forms of these financial instruments, but all should have a basic understanding of what they are for and how they are used. Before you claim that you would never have use for such an international instrument, consider how you would deal with an opportunity to supply a large order on 180 days’ credit to a totally new
customer
3000
miles
away?
Or
perhaps
you
wish
to
bid
for
a major contract, but had to provide a ‘bid bond’ along with the offer? LCs and LGs can be helpful in trade contracts and understanding what is available for which situations ought to be part of a modern manager’s knowledge base.
S E C UR I T Y AG AIN ST C R E D I T E X P O S UR E S
4 . 4 We now move on to a range of activities for reducing credit risk that all come under the broad heading of secured lending. Secured lending is where the money borrowed by an organisation is linked to certain of its assets. In the event of a default by the borrower, the lender has a claim to those assets. The lender can then sell them at their market value to obtain the money that it had originally lent to the (now defaulted) borrower. Secured lending should be familiar to many of you. When you take out a mortgage from a bank to buy a property, the bank will retain a claim on the property until you have repaid in full the sum borrowed. The property is the bank’s security. If you default on
your loan the property can be claimed (or ‘repossessed’) by the bank. It can then sell the property and, in this way, the bank can retrieve the money you originally borrowed.
46 OU BUSINESS SCHOOL

7/28/2019 b821 Block4unit9 Credit Liquidity and Operational Risk
http://slidepdf.com/reader/full/b821-block4unit9-credit-liquidity-and-operational-risk 47/112
4 CREDIT-RISK MANAGEMENT
For those borrowing on a secured basis the form of security (or ‘collateral’) provided can take many forms including:l land;l property;l securities or other investments;l guarantees provided by a third party.The lender has to ensure that title to these assets can be secured if the borrower defaults and should also take steps to ensure that the
value of the security at least equals the amount borrowed. Toachieve the latter objective it is common for the value of the security offered to exceed the amount of money borrowed. This allows foran adverse movement in the market value of the security provided.
EXERCISE 4.1 What types of organisation may be forced to borrow on a secured basis? From the borrower ’s perspective, what may be the advantage of borrowing on a secured basis?
To understand secured lending and lending that is linked to specific assets in more detail we shall look at the ‘repo’ and securitisation markets. These markets are summarised below with more details about their technical aspects being provided in
Appendix 2. ‘Repo’ is the internationally accepted abbreviation for a repurchase transaction. The market originated in the US in 1918 and grew rapidly there between the two world wars. Estimates now put the average daily volume of transactions at about USD1,000 bn. After much pressure from participants in the financial markets, the United Kingdom’s repo market got under way in 1996. Fundamentally, repo is a means of borrowing money where borrowers enhances their credit status by providing security to the lender. For some organisations of weak credit standing borrowing
would not be possible without this provision of security. For others, borrowing on an unsecured basis may be possible, but only in smaller volumes and at a higher cost compared with borrowing on a secured basis in the repo market. There are many forms of repo transaction, but in its basic form it is the sale by the borrower of certain of its securities investments for an agreed amount of cash. This is combined with a simultaneous commitment by the borrower to repurchase (or ‘repo’) the securities at a defined point in the future. The securities are normally referred to as the ‘collateral’. The repo transaction therefore enables one party to borrow cash from another, with borrowers using some of their assets (the securities) as collateral.
OU BUSINESS SCHOOL 47

7/28/2019 b821 Block4unit9 Credit Liquidity and Operational Risk
http://slidepdf.com/reader/full/b821-block4unit9-credit-liquidity-and-operational-risk 48/112
UNIT 9 CREDIT, LIQUIDITY AND OPERATIONAL RISK
Further details about repo are provided in Appendix 2. A further means for a lender to obtain greater certainty of the quality of its credit exposures is for the money lent to be linked to the performance of specific assets owned by the organisation borrowing the funds. In these circumstances, rather than being exposed
to
the
organisation,
the
lender
is
then
exposed
to
the
performance of these designated assets – and the performance of the assets may be more predictable than the performance of the organisation. The business activities of an organisation may change, perhaps considerably, during the term of an investment you have in them. These changes may, perhaps radically, alter the extent of the credit risk taken by investing in them. By contrast with investments that are precisely linked to known assets – or asset ‘pools’ – there is less scope for surprises in the credit quality of an investment. This means of managing credit exposure applies to investments in the securitisation markets. In summary securitisation involves borrowing money by the issuance of securities that are specifically linked to defined assets. These assets are usually financial assets, such as mortgages or car loans. The issuance of these ‘asset-backed’ securities provides borrowers with the cash to finance the provision of such mortgages and loans to their customers. For the investor in the assetbacked securities there is the comfort of clarity of the assets to which their investment is linked. For the issuer of the securities – the borrower – the securitisation process provides
an
additional
market
(to
the
unsecured
market)
for
raising
funds. The security offered may also enable the cost of funds to be lower than for unsecured borrowing. The transactions that take place in these markets are quite complex. To learn more about them you can read the analysis of securitisation transactions provided in Appendix 2.
ACTIVITY 4.2 One of the biggest issuers of asset-backed securities is the US Federal Home Loan Mortgage Association. The organisation is better known by the name Freddie Mac. Access the website of this organisation (www.freddiemac.com) to learn more about how it packages mortgage loans into asset pools to sell as asset-backed securities to investors.
C R E D I T D E R I V AT I V E S 4 . 5 The final means of managing credit risk to be discussed is the use of credit derivatives. This product, which only emerged in the 1990s, is transforming the way organisations can manage their credit
48 OU BUSINESS SCHOOL
7/28/2019 b821 Block4unit9 Credit Liquidity and Operational Risk
http://slidepdf.com/reader/full/b821-block4unit9-credit-liquidity-and-operational-risk 49/112
4 CREDIT-RISK MANAGEMENT
exposures. Although the creditderivatives market is dominated by the banks and securities houses, other organisations such as insurance companies, corporates, investment funds and government agencies also use credit derivatives. The outstanding volume of transactions in credit derivatives grew from
virtually
zero
in
1995
to
pass
USD1
trillion
in
2001
and
amounted to over USD12 trillion by mid2005. This growth has parallels with the growth of interestrate swaps in the early 1980s. The term credit derivatives is really the collective name for a
variety of financial instruments the purpose of which is to enable credit risks to be packaged and transferred from those who seek to avoid a particular credit risk to those who are happy to accept the risk. The riskaverse counterparty, unsurprisingly, has to pay a premium to the risktaking counterparty for the transfer of the credit risk. The size of the premium will reflect the assessment of the credit risk that is being transferred. Creditderivative transactions are typically related to bonds issued by organisations. They can be used not only as protection against default by the lender, but can also protect against a deterioration in the credit quality of the bond issuer. This is because a fall in an organisation’s bond price will increase the value of creditderivative insurance bought in respect of the bond. The loss of bond value is therefore hedged by the increase in the value of the credit derivative held. Given that this section is all about how organisations can contain credit
risk,
our
perspective
during
the
analysis
will
be
from
that
of
risk reduction. Note, however, that the counterparty to someone seeking to reduce credit risk is an organisation prepared to take greater credit risk to achieve (if they are correct in their assessment of the risk) higher returns. Additionally, credit derivatives are being
widely used by fund managers to alter the credit composition of their portfolios and to achieve diversification of their investments.
BOX 4.3 CREDIT DERIVATIVES AND CREDIT DIVERSIFICATION: WACHOVIA BANK One of the larger participants in the creditderivatives market is the US regional bank Wachovia. From the early days of the emergence of the creditderivatives market, Wachovia learnt that these instruments could help it manage the credit risks arising from its lending portfolio. The popularity of credit products at Wachovia is partly due to changing lending practices in the US. The bank commented in 1998 that: ‘the trend is for corporate clients to reduce the total number of banks they do business with, so individual credit lines are growing larger and the demands on banks are increasing’.
OU BUSINESS SCHOOL 49

7/28/2019 b821 Block4unit9 Credit Liquidity and Operational Risk
http://slidepdf.com/reader/full/b821-block4unit9-credit-liquidity-and-operational-risk 50/112
UNIT 9 CREDIT, LIQUIDITY AND OPERATIONAL RISK
Wachovia mainly uses creditdefault swaps, which enable it to pass on the credit risks from the loan portfolio, effectively allowing enhanced lending capacity. Sourced from:http://www.financewise.com/public/edit/riskm/crusbanks.htm (accessed 3/11/05)
There is insufficient space in this unit to examine all the different categories of credit derivatives. This would, indeed, take up an entire block at least! We shall therefore concentrate on what is the most common creditderivative structure – the credit-default swap. This structure accounts for nearly 40% of the credit derivatives market.
A creditdefault swap facilitates a reduction in credit risk for the ‘
protection buyer
’ who
pays
a fixed
premium
to
the
‘
protection
seller’ in respect of a defined asset (for example, a bond) issued by a specified organisation (known in the jargon of the financial markets as the ‘reference entity ’). The swap may have a term matching or shorter than the residual maturity of the underlying asset(s). The protection fee can be paid either up front or can be spread over the term of the swap agreement, typically on a quarteryear basis.
What events trigger payments to the protection buyer? There are a number of these and they can be separately negotiated for each transaction. The most commonly used credit events include, but are not limited to, the following. l Bankruptcy of the organisation. l Default on payment (beyond a minimum specified payment
amount – usually USD1 million). The minimum threshold is to prevent the obligations of the ‘protection seller’ arising in spurious situations when the entity fails to undertake a minor payment.
l Restructuring – since a change of corporate status or a takeover can alter the market price of bonds issued, particularly if the restructuring changes the ranking of the debt obligations of the organisation.
If any such credit event occurs, the protection buyer gets compensation, thereby crystallising the insurance against a reduction in credit exposure provided by the purchase of the creditdefault swap. This payment can be: l in cash, with the protection seller providing the buyer with the
difference between the recovery value of the asset (amount of the face value of the bond recovered from the ‘reference entity ’) and par;
l or by the protection buyer physically passing the affected asset to the seller and receiving par value for the bond.
50 OU BUSINESS SCHOOL

7/28/2019 b821 Block4unit9 Credit Liquidity and Operational Risk
http://slidepdf.com/reader/full/b821-block4unit9-credit-liquidity-and-operational-risk 51/112
4 CREDIT-RISK MANAGEMENT
Note that in both cases the compensation is against par value and not the prevailing market price of the bond – be it above or below par – at the time the creditdefault swap is transacted. This reflects the fact that if there is no default and the bond is held to maturity the repayment to the bond holder will be at par. Figure
4.2
shows,
in
summary
form,
the
structure
of
a
creditdefault
swap. Now we know how creditdefault swaps
work let us look at the core factors that will Between trade initiation and default or maturity, the creditprotection buyer makes payments of the default swap premium
determine how they are priced in the to the protection seller.
market. Although referred to as a swap, Protection sellerProtection buyer
Default swapthe arrangement of a creditdefault swap is premium
really akin to an option. We already know from Unit 8 that the price of an option is primarily dictated by three factors: Following a defined credit event, one of the following will
take place.
lthe
term
of
the
contract
– the
longer
the
Cash settlementperiod of ‘cover’ the greater the price to (protection seller compensates buyer for loss on bond)
the protection buyer; Protection sellerProtection buyer
100 (par) minus
l the degree of volatility – the greater recovery rate
the risk the more the buyer has to pay for their protection;
l the strike price of the contract and Physical settlement(protection buyer passes bond to seller and receives par
where this price is relative to the value in exchange)
prevailing market price – the more Protection buyer Protection seller
Bond
‘inthemoney ’ the contract that is being written, the greater the price of 100 (par)
protection. We can, to a degree, apply these three Figure 4.2 Creditdefault swap rules to the pricing of creditdefault swaps. The price will be positively related to the term of the cover and the
volatility in the creditworthiness of the reference entity. Finally, since compensation is paid by reference to par – the more the market price is already below par (reflecting existing credit concerns about the reference entity) the greater is likely to be the cost of credit protection to the buyer. The price of a creditdefault swap is therefore derived, using the principles listed above, by determining the expected credit loss. Having looked at how creditdefault swaps are structured, let us look at an example. Example of a credit-default swap
An organisation has invested part of its liquid assets in a bond issued by Teflon plc. The nominal value of the bond investment is E50m. The market
’s assessment of the probability of default (Pd) of Teflon during the next year is 1%. In other words, it is 99% certain that the
entity will not default over the next year.
OU BUSINESS SCHOOL 51

7/28/2019 b821 Block4unit9 Credit Liquidity and Operational Risk
http://slidepdf.com/reader/full/b821-block4unit9-credit-liquidity-and-operational-risk 52/112
UNIT 9 CREDIT, LIQUIDITY AND OPERATIONAL RISK
In the event of default, the expected pay out to creditors is 60 cents in the euro – therefore representing a 40% loss given default (Lgd) (100 cents less 60 cents). The bond was bought at par and is currently valued at par.
What is the theoretical cost of protection?The expected loss to the holder of this bond over one year is
Nominal value 6 Pd 6 Lgd = E50m 6 1% 6 40% = E200,000
Given that credit protection on E50m (nominal) would be required, the cost would be
E200,000/E50,000,000 = 0.0040 = 40 bps (payable either upfront or spread over the year)
of the nominal amount of the bond holding. Note though that the creditrisk position and, hence, the amount of protection required alter if the bond is not bought at par. If the bond had been bought at 80% of par, the loss on default relative to the purchase cost to the investing organisation buying E50m nominal of the bond at this price is
E50m 6 1% 6 (80 60%) = E100,000 Given that the default swap is based on the par value of the bond, the protection that needs to be bought is only (100,000/200,000) 6 E50m nominal
of
credit
default
cover,
which
is
equal
to
cover
on
E25m
(nominal) still, though, at the asking price of 40 bps. This amount of cover would hedge the entirety of the expected loss on default. If, having bought the bond at a price of 80% of par, default occurs and the pay out to investors is 60% of par, the loss to the investor is 20% of par. That is
E50m 6 20% = E10m The E25m of cover, however, provides a pay out against par (i.e. 100%), which amounts to a pay out of 100 60% = 40% of par
value. This is E25m 6 40% = E10m
The full amount of the credit loss incurred by the investing organisation is therefore E10m, thus proving that E25m of cover provides a full hedge against the credit risk.
EXERCISE 4.2 A year ago Micronet plc invested its liquid resources in a two-year bond issued by Phonetics. $90m was invested in the bond, which was bought at a price of $99. The bond is due to repay on maturity at par ($100).
52 OU BUSINESS SCHOOL

7/28/2019 b821 Block4unit9 Credit Liquidity and Operational Risk
http://slidepdf.com/reader/full/b821-block4unit9-credit-liquidity-and-operational-risk 53/112
4 CREDIT-RISK MANAGEMENT
Since then credit conditions for the company have deteriorated and now, with one year left to maturity, the bond is trading at a market price of $97. The investing company learns that the potential for default (Pd)
over
the
residual
one
year
term
of
the
bond
is
15%
and
the expected loss given default (Lgd) is 30 cents in the dollar. How much would Micronet expect to pay now for credit protection against losses on its bond investment? How much cover (in $m nominal) would it need to buy?
Although the approach to pricing the creditdefault swap based upon expectations of default and losses on default is theoretically sound, in reality it has weaknesses. Firstly, the estimation of the potential for default will vary according to the source of information employed. Additionally, the historical incidence of default within certain sectors, for example the banking sector, is too low to give meaningful information about the potential for future defaults. Finally; the extent of loss given default (par value less the recovery rate) varies significantly both historically and on the type of bond being held. The consequence is that the prices actually paid by those trading creditdefault swaps in the market, although based on the above principles, will also reflect circumstances that are more specific to the parties involved and market dynamics. Since default rates and losses on defaults cannot be assessed with certainty, there is considerable subjectivity about what the fair price for a creditdefault swap should be. The example in Box 4.4 provides an illustration of the impact of these other influences.
BOX 4.4 Bank Maxi is an investor in floatingrate notes and is able to fund its investments by raising funds at a cost of threemonth EURIBOR. The Bank buys a General Computers oneyear floatingrate bond at par at a yield of threemonth EURIBOR + 60 bps. You therefore know, without doing any analysis of Pd and Lgd and so on, that the implied market price of the oneyear creditdefault swap in respect of the General Computers bond is, therefore, 60 bps. Why? If it were 50 bps the bank could invest in General Computers at EURIBOR + 60 bps and buy credit protection at 50 bps and make a return of 10 bps free of any credit risk. This 10 bps is the difference between its funding costs and the investment return on the General Computers bond less the cost of protection.
OU BUSINESS SCHOOL 53

7/28/2019 b821 Block4unit9 Credit Liquidity and Operational Risk
http://slidepdf.com/reader/full/b821-block4unit9-credit-liquidity-and-operational-risk 54/112
UNIT 9 CREDIT, LIQUIDITY AND OPERATIONAL RISK
Bank Maxi would continue to do this trade until its demand for General Computers FRNs had pushed down their yield and/or its demand for credit protection had pushed up the cost of the default swap until the spread equalised the cost of credit protection. At this point the arbitrage opportunity would have been eliminated. This example shows how market dynamics are influential in setting the price of a creditdefault swap.
If you want to learn more about credit derivatives, read the article ‘Credit derivatives’ by Kiff and Morrow in the Course Reader.
The subject matter of credit derivatives is very technical and our coverage only skims the surface of a deep market with a variety of protection structures. The key point to draw from this analysis, though, is that a market in credit derivatives has opened up globally which allows a wide range
of
organisations
to
manage
and,
if
warranted,
reduce
their
credit exposures.
S UM M AR Y 4 . 6 Developments in the financial markets now provide many more options to manage credit exposures than were available even ten
years ago. All managers responsible for measuring and monitoring their credit risks therefore have the capacity to manage their exposures and mitigate those which they believe could result in financial
loss
to
their
organisations.
We have now finished our analysis of credit risk and how it can be managed. l First we looked at how credit exposure can be accurately
measured. l Then we looked at how organisations can determine whether,
and to what extent, they are prepared to have credit exposure to other organisations by examining the process of determining credit lines.
l Finally we looked at some of the ways credit exposures can be managed and reduced.
Remember, virtually all organisations are exposed to some form of credit exposure. Effective risk management therefore requires that, like all other financial risks, it is properly measured and managed.
Additionally, the credit risks taken should, as with other financial risks, reflect each organisation’s capacity and appetite for risk. ����������������������������������������
54 OU BUSINESS SCHOOL

7/28/2019 b821 Block4unit9 Credit Liquidity and Operational Risk
http://slidepdf.com/reader/full/b821-block4unit9-credit-liquidity-and-operational-risk 55/112
5 LI QU I D I TY R I SK 5 LIQUIDITY RISK
I N T R O D UC T I O N5 . 1 Liquidity risk applies to all organisations. It arises where anorganisation cannot meet its financial obligations as they fall due.Such circumstances may signal the termination of the business withthe organisation required to cease trading, wind up the businessand distribute the residual assets to creditors in accordance withtheir ranking. Alternatively, a liquidity crisis could result in a majorrestructuring of the financial base of the company – either throughthe taking on of new debt or through a new share issue.On the reasonable assumption that neither an exit route frombusiness nor an emergency financial reconstruction is desired, weneed to understand what organisations can do to manage theirliquidity position.This section:l reviews the circumstances under which liquidity problems arise;l explains the measures that companies can take to manage their
liquidity position
prudently.
The way liquidity risk can be (or has to be) managed varies between different sectors and may also reflect the size of the organisation. For small organisations, management of liquidity risk often comes down to cashflow management over a fairly short time period. With no longterm debt, such organisations may find that liquidity problems simply arises through mishandling of its trade flows – having to meet obligations to creditors (suppliers) ahead of receipt of payments by customers. Even for larger organisations – particularly those with large daily flows of business and a high number of suppliers, such as supermarkets – there is exposure to the risk of mismanagement of the cash flows arising from business operations. For organisations not using factoring arrangements (described in Section 4.2) or with limited recourse to banking facilities (even simply in the form of a bank overdraft) this cashflow mismatch can prove terminal to the business.
BOX 5.1 Small businesses are particularly vulnerable to late payments by customers. Such companies are less likely to have deep sources of liquidity and many will have only limited borrowing facilities from their bankers.
OU BUSINESS SCHOOL 55
7/28/2019 b821 Block4unit9 Credit Liquidity and Operational Risk
http://slidepdf.com/reader/full/b821-block4unit9-credit-liquidity-and-operational-risk 56/112
UNIT 9 CREDIT, LIQUIDITY AND OPERATIONAL RISK
In the United Kingdom, following pressure from the business community, the government introduced legislation giving suppliers the right to claim an interest penalty from purchasers if payments for goods and services occurred beyond the agreed credit period (typically thirty days). Similar regulations apply elsewhere within the EU. The Late Payment of Commercial Debts (Interest) Act of 1998 initially only gave smaller companies (with up to fifty employees) the right to claim from larger companies (with over fifty employees). In 2000 the Act was extended to enable small businesses to claim from other small businesses. In 2002 the powers under the Act were extended to all organisations – including public sector bodies – enabling any organisation to claim interest for late payment from any other organisation.
For all organisations, though, the mismanagement of cash flows is potentially the precursor to a liquidity crisis and the only difference for larger organisations is that they will normally have a wider range of options to deal with a period of net cash outflow than small companies. Let us look at a cashflow statement. Activity 5.1 below shows
where Flakey plc’s cash flow strains arise. The activity is similar in some ways to ‘gap analysis’, which was covered in Unit 7, since it requires not only the calculation of cash flows, but also the determination of the future time periods in which they occur.
ACTIVITY 5.1 FEELING THE STRAIN The details in Table 5.1 have been extracted from the management accounts and cash-flow forecasts of Flakey plc. First we have the cash-flow forecast from Flakey ’s business operations. The cash flows include interest payments on Flakey ’s debt and interest earnings on its investments. Note that the details just show cash flows and should not be confused
with
accounting
flows.
Comment on the cash flow strains for the company? What courses of action can be taken if Flakey ’s overdraft facility cannot be altered? Clearly the company is forecasting a growing cash outflow. How could this be funded ahead of restructuring its operations?
56 OU BUSINESS SCHOOL
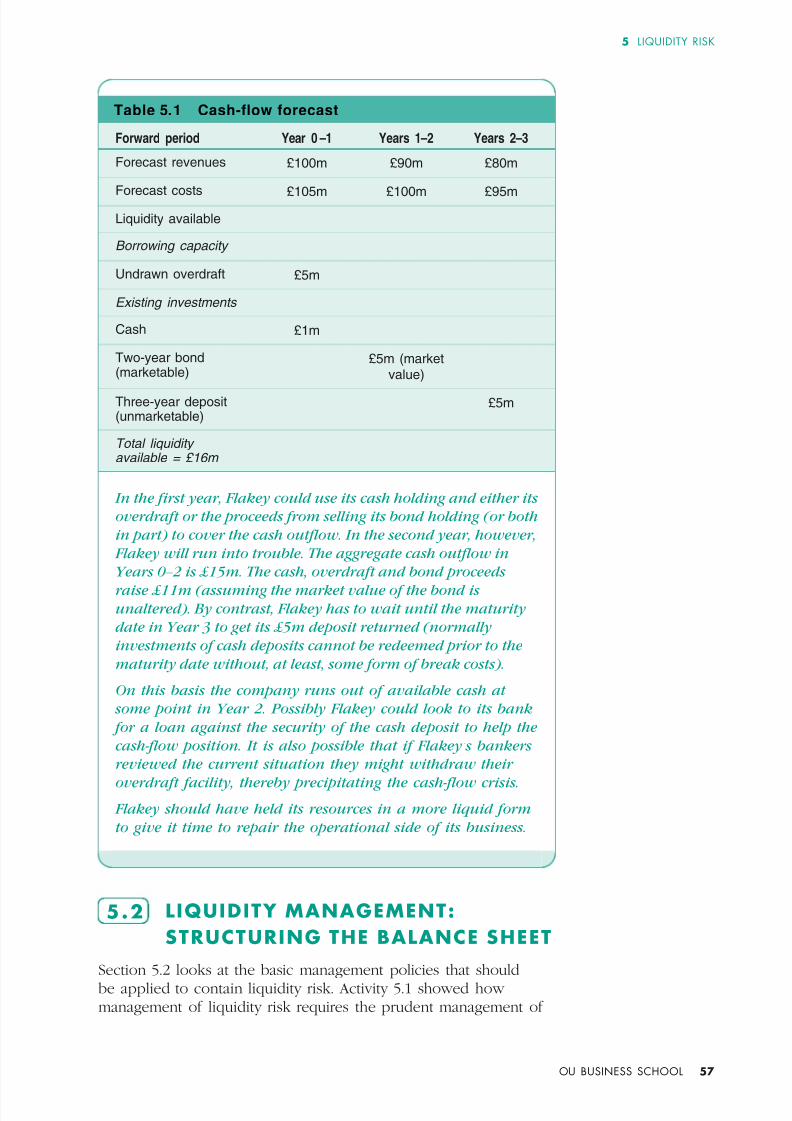
7/28/2019 b821 Block4unit9 Credit Liquidity and Operational Risk
http://slidepdf.com/reader/full/b821-block4unit9-credit-liquidity-and-operational-risk 57/112
5 LIQUIDITY RISK
Table 5.1 Cash-flow forecast Forward period Year 0 – 1 Years 1 – 2 Years 2 – 3 Forecast revenues £100m £90m £80m Forecast
costs
£105m
£100m
£95m
Liquidity available Borrowing capacity Undrawn overdraft £5m Existing investments Cash £1m Twoyear bond (marketable) £5m (market
value) Threeyear deposit (unmarketable) £5m Total liquidity available = £16m In the first year, Flakey could use its cash holding and either its overdraft or the proceeds from selling its bond holding (or both in part) to cover the cash outflow. In the second year, however, Flakey will run into trouble. The aggregate cash outflow in Years 0 – 2 is £15m. The cash, overdraft and bond proceeds raise £11m (assuming the market value of the bond is unaltered). By contrast, Flakey has to wait until the maturity date in Year 3 to get its £5m deposit returned (normally investments of cash deposits cannot be redeemed prior to the maturity date without, at least, some form of break costs). On this basis the company runs out of available cash at some point in Year 2. Possibly Flakey could look to its bank for a loan against the security of the cash deposit to help the cash-flow position. It is also possible that if Flakey’ s bankers reviewed the current situation they might withdraw their overdraft facility, thereby precipitating the cash-flow crisis. Flakey should have held its resources in a more liquid form to give it time to repair the operational side of its business.
L I Q UI D I T Y M AN AG E M E N T : S T R UC T UR I N G T HE BAL AN C E S H E E T
Section 5.2 looks at the basic management policies that should be applied to contain liquidity risk. Activity 5.1 showed how management of liquidity risk requires the prudent management of
OU BUSINESS SCHOOL 57
5 . 2

7/28/2019 b821 Block4unit9 Credit Liquidity and Operational Risk
http://slidepdf.com/reader/full/b821-block4unit9-credit-liquidity-and-operational-risk 58/112
UNIT 9 CREDIT, LIQUIDITY AND OPERATIONAL RISK
Covenants in loan documentation are where a borrower commits to perform to defined criteria. For example, a maximum on gearing or on the debt/EBITDA ratio or on interest cover. By maintaining such performance requirements, the lender gains comfort that
the
borrower
will
remain solvent and capable of repaying its debts.
cash flows and available liquidity resources. Let us look at the principles that should be applied to this vital exercise. Managing sources of funds The last thing any company wants to do when it comes to liquidity management is to go begging to its bankers when a cashflow crisis has already arisen. Under such circumstances the bankers may, in any case, be reluctant to extend additional credit or may only provide it on punitive terms. Therefore, if you were managing
your organisation’s liquidity, what general rules should you apply to the management of its sources of funds? Firstly, you should make projections of the organisation’s forward cash flow. This should be for as long a forward period as is practicable given the nature of the business. At the very least it should cover a period of one year forward. The analysis should not only
identify
in
calendar
terms
(that
is,
at
least
monthly)
when
liquidity is limited, but should also give a measure of the volume of funding sources that need to be available to avoid a cash shortage.
You need to maintain funding capacity that is ideally well in excess of this ‘ worst case’ cashflow scenario. Planning for your funding needs one or more years ahead is sensible, although this may mean that funding sources are established that are not immediately drawn on. Maintaining a prudent maturity profile for funds is necessary. Do not have all the finance maturing at around the same time. Being forced to renegotiate all or a majority of your funding simultaneously is risky. This is particularly the case if the business is performing weakly or if generally credit conditions for raising funds are difficult. Organisations should ideally ensure that the maturities of funds are spread with a proportion being longterm funds: that is, with a residual term to maturity over one year. If the company is large enough, you should seek to fund it from a number of markets rather than just a single market. For example, larger organisations will fund in the United Kingdom, Euro and US markets. This diversification means that if trading conditions become difficult in one market the organisation can switch to drawing additional funds from
other
markets
where
trading
conditions
are
agreeable.
As far as allowed by those lending to your organisation, you should seek optionality or flexibility in the terms or conditions of loan agreements. An example of this is the issue of convertible bonds. Under agreed circumstances these can be converted from bonds to equities, instantly changing the debt structure and the cashflow profile for an organisation. Note, however, that lenders are not stupid: they will seek to do the reverse – by, for example, placing covenants in loan documentation that require defined performance levels by the company at the cost, if not fulfilled, of the early termination of the financing agreement. Finally, while adhering to all the rules above, you should rank the sources of funds available in terms of comparative cost.
58 OU BUSINESS SCHOOL
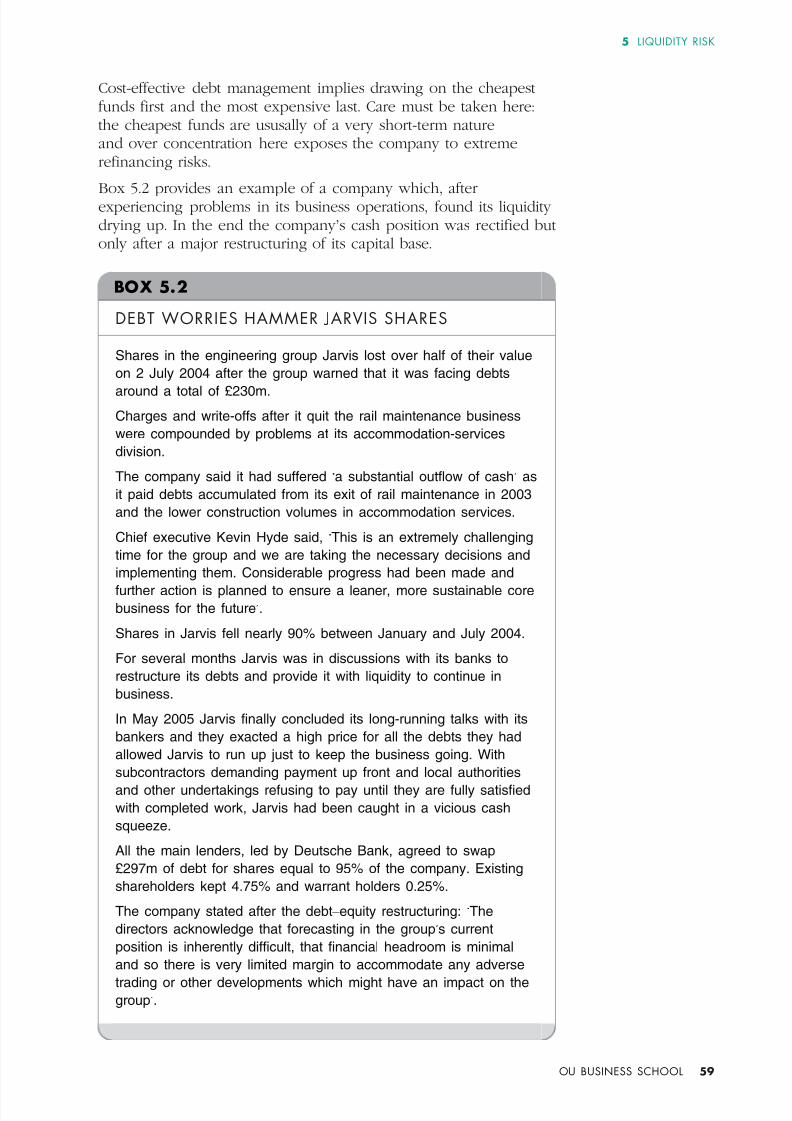
7/28/2019 b821 Block4unit9 Credit Liquidity and Operational Risk
http://slidepdf.com/reader/full/b821-block4unit9-credit-liquidity-and-operational-risk 59/112
5 LIQUIDITY RISK
Costeffective debt management implies drawing on the cheapest funds first and the most expensive last. Care must be taken here: the cheapest funds are ususally of a very shortterm nature and over concentration here exposes the company to extreme refinancing risks. Box
5.2
provides
an
example
of
a
company
which,
after
experiencing problems in its business operations, found its liquidity drying up. In the end the company ’s cash position was rectified but only after a major restructuring of its capital base.
BOX 5.2 DEBT WORRIES HAMMER JARVIS SHARES Shares in the engineering group Jarvis lost over half of their value on 2 July 2004 after the group warned that it was facing debts around a total of £230m. Charges and writeoffs after it quit the rail maintenance business were compounded by problems at its accommodationservices division. The company said it had suffered ‘a substantial outflow of cash’ as it paid debts accumulated from its exit of rail maintenance in 2003 and the lower construction volumes in accommodation services. Chief executive Kevin Hyde said, ‘This is an extremely challenging time for the group and we are taking the necessary decisions and implementing them. Considerable progress had been made and further action is planned to ensure a leaner, more sustainable core business for the future’. Shares in Jarvis fell nearly 90% between January and July 2004. For several months Jarvis was in discussions with its banks to restructure its debts and provide it with liquidity to continue in business. In May 2005 Jarvis finally concluded its longrunning talks with its bankers and they exacted a high price for all the debts they had allowed Jarvis to run up just to keep the business going. With subcontractors demanding payment up front and local authorities and other undertakings refusing to pay until they are fully satisfied with completed work, Jarvis had been caught in a vicious cash squeeze. All the main lenders, led by Deutsche Bank, agreed to swap £297m of debt for shares equal to 95% of the company. Existing shareholders kept 4.75% and warrant holders 0.25%. The company stated after the debt – equity restructuring: ‘The directors acknowledge that forecasting in the group’s current position is inherently difficult, that financial headroom is minimal and so there is very limited margin to accommodate any adverse trading or other developments which might have an impact on the group’.
OU BUSINESS SCHOOL 59

7/28/2019 b821 Block4unit9 Credit Liquidity and Operational Risk
http://slidepdf.com/reader/full/b821-block4unit9-credit-liquidity-and-operational-risk 60/112
UNIT 9 CREDIT, LIQUIDITY AND OPERATIONAL RISK
ACTIVITY 5.2 Having read the Jarvis case study in Box 5.2, who do you think were the winners and losers from the debt – equity restructuring? What does this tell you about the relative credit risks relating to investments in bonds and equities? The debt – equity swap benefited the debt holders at the expense of the shareholders. The price exacted by the debt holders for keeping the company in business was 95% of the company’ s shares. This meant that the existing shareholders’ stake was significantly diluted. It could be argued, however, that the debt – equity swap kept the company in business – and this was a better outcome for existing shareholders than insolvency, which may have left them with a worthless investment. The example reminds us of how shareholders have the most subordinated position as investors in a company. In the event of a liquidation they stand at the back of the queue – and behind bondholders – when it comes to any pay out from the demised company’ s residual assets.
BOX 5.3 STAND-BY CREDIT FACILITIES As part of their liquidity policy, many organisations hold standby credit facilities. These are effectively unused loan facilities that organisations draw on when they are short of funds. When they are drawn, the bank normally charges interest at a margin over Libor (for example, threemonth Libor + 1.5%). When they are undrawn, that is, not used, the bank will still normally charge the organisation a small amount (for example, 0.25%) for having the facility available on ‘standby’.
EXERCISE 5.1 Having read Box 5.3, attempt the following questions. (a) What determines the size of the margin charged over Libor
by the bank for a credit facility? (b) Banks usually like to have the scope to renegotiate
facilities each year. Why do you think this is the case?
60 OU BUSINESS SCHOOL

7/28/2019 b821 Block4unit9 Credit Liquidity and Operational Risk
http://slidepdf.com/reader/full/b821-block4unit9-credit-liquidity-and-operational-risk 61/112
5 LIQUIDITY RISK
Managing investments Capacity to contain liquidity risk arises on the other side of the balance sheet. Organisations may have investments of their own arising from the cash resources they have generated over the years from undistributed profits. If these are not needed for working capital, the company can invest this cash in a number of assets, ranging from shortterm moneymarket investments (for example, depositing the funds with a bank for a onemonth term) or in longerterm investments such as bonds and property. To ensure that these resources can be made available to assist if a liquidity crisis arises, the following practices should be applied.
At least some investments should be made in liquid assets – those assets that can be converted into cash at short notice for a predictable value. This would make investments in cash deposits (other than very shortterm deposits) questionable. As seen in
Activity 5.1, cash deposits are for a fixed term and cannot normally be broken, which is not much help if you want to gain access to the cash. The better alternative may be to invest in ‘negotiable’ moneymarket assets such as certificates of deposit (CDs). Holdings of longterm bonds may, in theory, be sold prior to maturity, but a liquid market can only be assured if the issuers have good credit quality and the bond issue itself is large and regularly traded.
Additionally, as we saw in Unit 7, the volatility of bond prices increases with their duration, giving greater potential uncertainty to the proceeds that may be realised by their sale in the event of a liquidity crisis. Investments in property do not constitute liquid assets since, in a crisis, you may be unable to sell such assets quickly. In short, the composition of the investment portfolio needs care when considering both its maturity profile and its marketability. Care should be taken with the credit quality of the assets held. Indeed, many organisations will not invest their liquid assets in bonds with less than an AA longterm rating. Liquid assets should not be held in bonds of poor credit quality whatever the apparent attractions in terms of their high yields. Such speculative investments are the preserve of sophisticated investment funds – or at least they should be! Even if the issuer of low quality bonds does not go into default, the potential for adverse movements in the bonds’ credit spreads during their life exposes the investor to making a loss on the investment if they are a forced seller at a time
when the bond price has slumped. This is in addition to the previously mentioned risk to the value of a bond holding arising from investing in assets of a long duration. If you need evidence to substantiate this, see Figure 3.1 and read the associated commentary once again. The guidelines provided above about the appropriate way to manage the composition of a portfolio to avoid liquidity issues really amount to commonsense. Maintain deep sources of funding in various markets with an average maturity which is not too
When talking about ‘negotiable’ assets we are referring to assets that can be sold: that is, assets that are ‘marketable’.
OU BUSINESS SCHOOL 61

7/28/2019 b821 Block4unit9 Credit Liquidity and Operational Risk
http://slidepdf.com/reader/full/b821-block4unit9-credit-liquidity-and-operational-risk 62/112
UNIT 9 CREDIT, LIQUIDITY AND OPERATIONAL RISK
short and hold liquid assets in lowrisk investments that can be converted quickly into cash. Making your liquid assets realisable
while putting off the day you need to renegotiate your funding both help to maintain liquidity.
BOX 5.4
A LIQUIDITY FORMULA: UNITED KINGDOM BANKS While corporates are able to establish their own liquidity policies subject to approval by their boards and, perhaps, by their bankers, financialservices companies (certainly those in the European Union) have liquidity requirements defined for them by their regulators. In the United Kingdom this is the Financial Services Authority (FSA). The requirement currently applied to United Kingdom banks, known as ‘Sterling Stock Liquidity’, is a good example of a methodology that
uses
both
(liquid)
assets
and
liabilities
(funding)
to
define
an
acceptable balancesheet structure to contain liquidity risk. The FSA is prescriptive about the techniques used by financialservices companies, since the consequences of liquidity mismanagement could result in the demise of a financial institution. This would have adverse consequences, not just for the shareholders, but also for other investors, who are likely to include members of the public that have placed deposits with the institution. The Sterling Stock Liquidity (SSL) regime requires banks to hold liquid assets to cover 5% of sterling retail deposits falling due for repayment over the next five working days plus the projected wholesale sterling outflow over the next five working days. The assets prescribed as liquid assets for this purpose include such marketable financial assets as:
United Kingdom government securities; cash and deposits held at the Bank of England; shortterm moneymarket assets such as Certificates of Deposit.
We can see two factors interplaying here. Firstly, the SSL measure identifies the degree of exposure to the shortterm loss of funding. The less exposed to such early outflows, the lower the requirement to hold liquid assets. The banks are then required to, at least, match this exposure through holdings of those defined highquality assets that can be turned into cash readily and that have a limited risk of a loss in valuation.
Note that ‘wholesale’ flows arise from borrowing and lending activities between organisations while ‘retail’ flows relate to such flows between organisations and individuals.
L I Q UI D I T Y M AN AG E M E N T : S T R E S S T E S T I N G
5 . 3
Every organisation
should
have
in
place
a contingency
funding
plan – a statement of how it would cope with an adverse movement in cash flows. Table 5.2 provides an outline of how such a contingency funding statement could look.
62 OU BUSINESS SCHOOL

7/28/2019 b821 Block4unit9 Credit Liquidity and Operational Risk
http://slidepdf.com/reader/full/b821-block4unit9-credit-liquidity-and-operational-risk 63/112
5 LIQUIDITY RISK
First, liquidity conditions are measured under both normal and adverse business conditions. In adverse conditions, an organisation
would expect to have lower cash inflows arising from its business activities because of lower sales and/or lower prices than under normal conditions. Additionally, it might expect its access to funds to be reduced under adverse conditions owing to the reduced appetite of lenders to invest in the organisation during an adverse trading environment. For the purposes of this exercise, it is assumed that operating expenditure and holdings of liquid assets are unchanged between the two scenarios. From these data, the organisation can assess how much cover it has from a combination of funding sources and liquid assets relative to its operating net cash flow. The management of the organisation (the board or its equivalent) can then set a minimum acceptable ratio of funding sources plus liquid assets relative to any negative cash flow. The objective would be to ensure that this ratio is sufficiently high to ensure its continued survival during a prolonged period of adverse (or stressed) trading conditions. Table 5.2
Normal trading conditions Stressed trading
conditions Earnings X M (lower than X ) Expenditure Y Y Net cash flow X Y M Y Support from sale of liquid assets A A Support from additional borrowing B C (lower than B) Available cash resources A + B A + C Cash resources/net cash flow (A + B)/(X Y ) (A + C)/(M Y ) Minimum ratio Board to define Board to define
The liquiditymanagement matrix shown in Table 5.2 is only one example of how an organisation can measure its exposure to liquidity risk and, ideally, manage that risk effectively. The example, though, reinforces two important points about liquidity management: firstly, it involves managing the maturity profiles of both assets and liabilities; secondly, there should be a formula approved by the board of an organisation (or its equivalent) to measure liquidity risk on an ongoing basis.
OU BUSINESS SCHOOL 63

7/28/2019 b821 Block4unit9 Credit Liquidity and Operational Risk
http://slidepdf.com/reader/full/b821-block4unit9-credit-liquidity-and-operational-risk 64/112

7/28/2019 b821 Block4unit9 Credit Liquidity and Operational Risk
http://slidepdf.com/reader/full/b821-block4unit9-credit-liquidity-and-operational-risk 65/112

7/28/2019 b821 Block4unit9 Credit Liquidity and Operational Risk
http://slidepdf.com/reader/full/b821-block4unit9-credit-liquidity-and-operational-risk 66/112
UNIT 9 CREDIT, LIQUIDITY AND OPERATIONAL RISK
Sainsbury’s CEO Justin King said the businesstransformation project distracted the company from its ‘customer offer ’ and so he laid out plans to ‘fix the basics’ as part of a £2.5bn ‘salesled’ recovery for the embattled supermarket chain. Sainsbury’s focus was now to be on getting cost savings by simplifying existing IT systems and, in some areas, this meant reintroducing manual processes where systems were failing. Adapted from a story by Andy McCue: published 19 October 2004. Source: http://management.silicon.com/itdirector (accessed 7/9/05).
Arguably the cost to Sainsbury of the IT failures outlined in Box 6.1 was more than the financial writeoffs detailed. The retailer’s competitors, particularly Tesco, were not standing still during this period of Sainsbury ’s difficulties. Unsurprisingly, therefore, this period of operational difficulties saw Sainsbury lose market share to its rivals – and also saw a radical shakeup in the management of the company.
BOX 6.2 LUFTHANSA CANCELS FLIGHTS AFTER COMPUTER FAILURE
Lufthansa had to cancel about sixty European flights and its services around the world were delayed following a computer fault in its checkin system on 24 September 2004. The company’s Star alliance partners (Britain’s bmi, Poland’s LOT and Austrian Airlines) were also affected by the problem. The flight cancellations affected about 6,000 passengers, while short
haul and longhaul departures were delayed by up to two hours. Some freight normally carried by plane had to be moved by truck. At Berlin’s Tegel airport there were long queues as clerks had to write tickets by hand and tell passengers there was no assigned seating.
66 OU BUSINESS SCHOOL

7/28/2019 b821 Block4unit9 Credit Liquidity and Operational Risk
http://slidepdf.com/reader/full/b821-block4unit9-credit-liquidity-and-operational-risk 67/112
6 OPERATIONAL RISK
A Lufthansa clerk said the problem was not caused by a virus, but by the launch of a new computer program overnight, which brought the system down. Unisys said it deeply regretted the failure of its checkin system, which went down following a planned outage. ‘After being rebooted, the operating system and hardware ran smoothly for approximately ninety minutes until a software problem brought the checkin system application down,’ Unisys said. The company had to install new software to fix it. The financial markets reacted to this operational failure, with shares in Lufthansa falling 1.8% to 9.32 euros. Information sourced from http:/www.usatoday.com/travel/news/ 20040924lufthansacancellations_x.htm (accessed 1/11/2005).
The term ‘operational risk’ also extends to the breakdown of controls and procedures within companies – in effect, the processes intended to avoid the adverse consequences of all those other risks
we have looked at in this block. To manage interestrate, foreignexchange and credit risk, we have seen how carefully considered management controls can be applied by organisations. If, however, these controls are not observed – either deliberately through fraudulent activity or simply as a result of incompetence – then an organisation is potentially exposed to financial risks for which it has either no capacity or appetite. It is consequently no surprise, particularly in the financialservices sector, that greater scrutiny is being given to the operational risk being run by organisations. Indeed, the collapse of Barings in 1995 and the highprofile losses arising at the Allied Irish Bank’s US subsidiary
Allfirst in 2001 were both classic examples of the financial mayhem that can arise through the existence of inadequate operational controls or a breach of the preset control procedures. Let us look more closely at both of these episodes in Box 6.3 and Activity 6.1.
BOX 6.3 BARINGS: A VERY SIMPLE (BUT COSTLY) OPERATIONAL FAILURE As related earlier in this unit, the United Kingdom merchant bank Barings collapsed in February 1995 as a result of losses amounting to nearly £800m arising from derivatives trading by its Singapore subsidiary. Much of the media coverage focused on the complex nature of derivatives trading – although in the case of Barings the transactions on which money was lost were mostly simple bets on equity prices that went wrong.
OU BUSINESS SCHOOL 67

7/28/2019 b821 Block4unit9 Credit Liquidity and Operational Risk
http://slidepdf.com/reader/full/b821-block4unit9-credit-liquidity-and-operational-risk 68/112
UNIT 9 CREDIT, LIQUIDITY AND OPERATIONAL RISK
It was not, then, the arcane nature of derivatives that caused the collapse of Barings rather the lack of some basic operational controls. With limited staffing in its Singapore subsidiary, Barings failed to ensure the effective segregation between its trading activities and the recording and accounting of those trades. One trader, Nick Leeson, executed the transactions, took it upon himself to record the financial outcomes of certain of these trades (in a secret account coded 88888) and also managed the movements of funds to support them. This enabled him to start concealing lossmaking transactions and their financial consequences for the bank for several months. Eventually the adverse cashflow consequences of the bets that had gone wrong had to surface as counterparties to the transactions sought their ‘winnings’. Barings collapsed at a spectacular speed and Nick Leeson, after fleeing, was apprehended at Frankfurt airport and returned to Singapore to serve time in prison for his fraudulent activities. The collapse could so easily have been averted by applying a simple operational control. If Nick Leeson had not been able to record his own transactions and move funds to support his trading positions – that is, if the trading activities had been properly segregated from the settlements and accounting function in Singapore – then the lossmaking trades would have been identified and reported (by other staff) at an early stage. This would have prevented the losses from escalating. Barings might have taken a financial loss as it unwound these trading positions, but
it would
have
survived.
Ironically, the number eight is, according to the Chinese, supposed to bring luck. Clearly it failed to do so for Nick Leeson and Barings Bank!
ACTIVITY 6.1 Read the article ‘Currency exchange trading and rogue trader John Rusnak
’ by Sharon Burke in the Course Reader. Make a note of the various control failures at the US bank Allfirst identified by the article. How would it have been possible to prevent the losses through better operational controls?
O P E R AT I O N AL - R I S K M AN AG E M E N T 6 . 2 The facets of operational risk are very wide ranging since they effectively relate to any potential weaknesses in an organisation arising from its processes and staff.
68 OU BUSINESS SCHOOL

7/28/2019 b821 Block4unit9 Credit Liquidity and Operational Risk
http://slidepdf.com/reader/full/b821-block4unit9-credit-liquidity-and-operational-risk 69/112
6 OPERATIONAL RISK
Managing these risks is therefore a process that envelops all parts of an organisation. The list of practices that can be adopted to contain operational risk is therefore huge and will be, to a large degree, specific to the nature of the organisation. Certain generic rules, though, do apply. Let us look at these. People
All organisations are vulnerable when staff levels are inadequate in either number or quality. The success of companies or, indeed, the recovery of failing companies can usually be ascribed not only to the quality of senior management, but the effectiveness of procedures put in place for recruiting, training and retaining good staff. In assessing how well organisations avoid the risk of having inadequate staff resources in place the following should therefore be tested. l What is the staff turnover rate (rate of leavers per staff
complement per annum) and how does it compare with the organisation’s peer group?
l What is the rate of absenteeism and how does it compare with the peer group?
l What procedures does the organisation have for the induction of new staff and for training staff ?
l What percentage of staff positions is vacant and how does this compare with the peer group?
l Is there a succession plan in place for all key and senior staff ? What procedures exist to replace key staff on their departure?
Organisations with high staff turnover, high absenteeism, weak training and development processes, high levels of staff vacancies and vulnerability to the departure of key staff are under prepared to take on competitors with better records in these areas. Even if organisations are not operating in a competitive environment (for example, in government organisations), weaknesses in these areas
will undermine the delivery of the services for which they are responsible. Systems Failure of systems will interrupt business activity and, as with theexample of Sainsbury, can result in large costs being incurred. Inassessing the exposure to operational risk arising from inadequatesystems what should you therefore be looking for if you weredoing a risk audit?
You should include the following key tests.l How often are systems out of operation (or ‘down’)?l What proportion of an organisation’s activities is supported by
existing systems? Is there a high proportion of manual ‘ work arounds’ – for example, analysis and record keeping using ‘homemade’ spreadsheets?
OU BUSINESS SCHOOL 69

7/28/2019 b821 Block4unit9 Credit Liquidity and Operational Risk
http://slidepdf.com/reader/full/b821-block4unit9-credit-liquidity-and-operational-risk 70/112
UNIT 9 CREDIT, LIQUIDITY AND OPERATIONAL RISK
l What backups exist for existing systems? l Are there contingency sites available from which backup
systems can be employed if the location of the main site is impaired, say by fire or flood or other disaster? Are these contingency sites in the right location? (See Box 6.4.)
l Are
all
new
systems
thoroughly
tested
and
run
on
a parallel
basis with existing systems during their launch period?
Again, any weaknesses here spell potential financial trouble for an organisation. Malfunctioning systems mean that organisations may be unable to conduct business. It is hard to identify a greater financial risk than that.
BOX 6.4 THE WRONG PLACE FOR YOUR ‘CONTINGENCY ’ SITE The atrocity of the terrorist attack on the World Trade Centre on 11 September 2001 highlighted an operational risk run by many businesses in Lower Manhattan. To accommodate systems failures and the risk that access to the main site of their business may be prevented, many companies had established ‘contingency’ sites in alternative Manhattan locations. These could then be put into operation, employing backup systems, to ensure the continued operation of business activities. In many cases these sites were shared by businesses on the basis that it was statistically unlikely that more than one business would need access to the contingency site at any one time – and, of course, sharing the sites reduces the cost of retaining and maintaining them in readiness for possible use. The extent of the devastation resulting from 11 September meant that not only was there multiple demand for contingency sites, but also many of these sites were located in areas of Lower Manhattan that were, temporarily at least, closed off to the public after the attack. Consequently, many businesses learnt a lesson in operational risk: yes, you do want a contingency site and, yes, it should be close to the main business location so that staff can relocate to it quickly, but you should not have it so close that access is prevented by the same event that is barring access to your main site.
Controls Finally, operationalrisk management should include the maintenance of an effective set of internal controls with these being documented in an organisation’s procedures manual. This manual, or at least the parts of it relevant to the business area in which staff are employed, should ideally be required to be read by staff at
70 OU BUSINESS SCHOOL

7/28/2019 b821 Block4unit9 Credit Liquidity and Operational Risk
http://slidepdf.com/reader/full/b821-block4unit9-credit-liquidity-and-operational-risk 71/112
6 OPERATIONAL RISK
least once a year to ensure they know the control environment applying to their responsibilities. Compiling and reading a procedures manual may not be the most exciting thing anyone does, but it is an aid to reducing the incidence of operational failures and the financial risks they bring. Control or procedures manuals should at least include details on the following. l The delegation of powers to undertake transactions. These
should detail the limits on the scope of an individual within an organisation to take business decisions.
l The reporting lines of employees to their superiors. l The segregation of responsibilities between different parts of the
business (for example, between the dealing room of a business and its settlements and accounting functions).
l The reporting of business activities – in terms of the timing and regularity of reports and their recipients. This should include ‘exception reporting’ – that is, the reporting of activities that occur only if a predefined limit has been exceeded or an event has taken place.
Applying these controls is the responsibility of managers. Testing the controls (regularly) is the responsibility of the organisation’s auditors.
BOX 6.5 AHOLD AND PARMALAT: OPERATIONAL-RISK FAILURES? In 2003, shockwaves were sent through the financial markets as major accounting irregularities were discovered at two major European companies. The Dutch retailer Ahold, one of the biggest supermarket companies in the world, was forced to admit that it had previously overstated its revenues by E970m. This was largely attributable to an overstatement of profits at Ahold’s US Foodservice division where sales had been allegedly overstated by US$30bn over the previous three years. The overstatement of revenue resulted from accounting irregularities, particularly in respect of promotional programmes in the US. Such overstated earnings clearly misled investors about the financial health of the company and when the scandal first became public Ahold’s share price fell by twothirds. The degree to which these were intentional is difficult to ascertain. The company, though, had to pay $9.9m to avoid criminal prosecution in the Netherlands and only avoided being fined by the US Securities and Exchange Commission (the US financial markets’ regulator) by agreeing not to violate US securities laws in the future.
OU BUSINESS SCHOOL 71

7/28/2019 b821 Block4unit9 Credit Liquidity and Operational Risk
http://slidepdf.com/reader/full/b821-block4unit9-credit-liquidity-and-operational-risk 72/112
UNIT 9 CREDIT, LIQUIDITY AND OPERATIONAL RISK
The year 2003 also saw the collapse of the Italian dairy products company Parmalat. This came after a ‘black hole’ of E14bn was found in the firm’s accounts. The crisis at the company first became public when Parmalat admitted that E3.95bn it claimed to hold with the Bank of America in respect of its Cayman Islands based subsidiary, Bonlat, did not exist. It was subsequently discovered that the company had net debts of E14bn – eight times higher than it had previously admitted. In December 2003, the company was declared insolvent. In 2005, Calistro Tanzi, the founder of Parmalat and fifteen others went on trial in Italy charged with false accounting, market rigging and misleading Italy’s financial markets’ regulator. The scandal also engulfed several financial institutions that allegedly were involved in the company’s financial irregularities. The case is ongoing at the time of writing. The question that many observers have asked is how did Ahold’s and Pamalat’s huge financial misrepresentations escaped notice for so long? Clearly the control environment at both companies was flawed and the auditing process was not sufficiently robust. Further coverage of the collapse of Parmalat can be found in the article by Melis in the Course Reader: ‘Corporate Governance Failures: to what extent is Parmalat a particularly Italian case?’. As both episodes are the subject of continuing developments you will find recent developments relating to each case posted to the course website for Block 4. As time progresses we shall perhaps learn more about exactly why operational failure occurred at both companies and how such failures could have been avoided.
EXERCISE 6.1 One control that appears in many organisations procedures manuals is that employees are required to have at least one period of time off from work each year lasting a minimum of two weeks (or ten working days). Why do you think this control is applied?
72 OU BUSINESS SCHOOL

7/28/2019 b821 Block4unit9 Credit Liquidity and Operational Risk
http://slidepdf.com/reader/full/b821-block4unit9-credit-liquidity-and-operational-risk 73/112
6 OPERATIONAL RISK
S UM M AR Y 6 . 3 This section has looked at the wide ranging issues facing organisations that fall under the heading of operational risk.
We looked at the risks arising from failure by people or systems and those arising from an imperfect control environment and a variety of ways of identifying exposure to these risks were examined. The study of operational risk concludes our analysis of the individual categories of financial risk. In the next section we bring our understanding of each risk category together to compile a composite riskaudit report. ����������������������������������������
OU BUSINESS SCHOOL 73

7/28/2019 b821 Block4unit9 Credit Liquidity and Operational Risk
http://slidepdf.com/reader/full/b821-block4unit9-credit-liquidity-and-operational-risk 74/112

7/28/2019 b821 Block4unit9 Credit Liquidity and Operational Risk
http://slidepdf.com/reader/full/b821-block4unit9-credit-liquidity-and-operational-risk 75/112
7 FI N A N C I A L-R I SK M A N A GEM EN T: F R O M TH EOR Y T O P R A C TI C E
7 FINANCIAL-RISK MANAGEMENT: FROM THEORY TO PRACTICE
I N T R O D UC T I O N7 . 1 We have now studied all the areas of risk that require management by all organisations – be they private or publicly owned and regardless of their size and the nature of their business. l In Unit 7 we looked at interestrate risk. l In Unit 8 we looked at foreignexchange and contingent risk. l
Here, in
Unit
9,
we
have
looked
at
credit,
liquidity
and
operational risk.
As you can appreciate, the management of each of the individual risks is an important task in its own right, and requires staff with specialist skills.
As was noted in Unit 7, however, overall responsibility for risk control – including the determination of which risks to take and to
what extent – lies with the most senior management within an organisation. Within a company this will mean either the board or the responsibility may be delegated to a committee of the board. The issue for managers reporting to the board is how to summarise the riskmanagement exposures being run by the organisation in a manageable form given the detail and complexities involved. To achieve this we go back to the subject of risk mapping that we looked at in Unit 7. The objective, then, is to produce a report that fulfils the following requirements. l Summarises existing risk positions and their potential financial
consequences. As far as possible, a financial measure of the risk should be provided although clearly some risks, as you have seen by studying this block, are more quantifiable in financial terms than others.
l Confirms whether (or not) the positions are within the limits laid down by the organisation.
l Explains the interrelationships between the risks being run. l Highlights particular issues – for example, where the risk being
run is historically high (even if it is still within the limit imposed on it).
l Makes recommendations for policy actions arising from the risk assessment.
The report has to be succinct. If it is too lengthy, the focus on key risk issues may be lost. Those in charge of laying down risk
The committee of a board responsible for risk management is often referred to as the ‘asset and liability committee’, or ALCO. Many organisations also separately delegate responsibility for credit risk to a credit committee.
OU BUSINESS SCHOOL 75

7/28/2019 b821 Block4unit9 Credit Liquidity and Operational Risk
http://slidepdf.com/reader/full/b821-block4unit9-credit-liquidity-and-operational-risk 76/112
UNIT 9 CREDIT, LIQUIDITY AND OPERATIONAL RISK
appetite and risk strategy may get immersed in the detail on risk management rather than doing their job of providing the strategic parameters for managing the financial risks. This is the task we now embark on – the production of a strategic riskmanagement report.
A recent British Foreign Minister used to be known by some of his civil servants as A4! This is because he required all his briefing notes from them – even on the most complicated aspects of foreign policy – to be summarised to fit on one A4 sized sheet of paper. It may be difficult to get our strategic risk report to A4 size, but let us see how we get on.
A R I S K - M AN AG E M E N T T E M P L AT E 7 . 2 Table 7.1 shows a suggested reporting format for a strategic risk
management document. Table 7.1 shows: l the type of balance sheet risk; l the earlywarning indicators if the risk is rising; l the agreed approach adopted by the organisation to measuring/
limiting the risk; l the current exposure or measure of the risk; l a summary score (based on a scale of exposure and derived from
a scoring framework previously approved by the board) of the current importance/threat of the risk to the business according to an assessment by the organisation’s riskmanagement team;
l an average score of the current importance/threat for each category of risk, together with the movement since the last report (to show whether the risk is growing or shrinking);
l an aggregate score for all the risks combined; l a list of recommendations in the light of the findings for
consideration/approval by the board. Note the report uses some of the measures of risk introduced earlier in this block. The board’s limit for interestrate risk is based on the stress testing ‘maxishock’ concept introduced when we looked at gap analysis in Unit 7. The board’s minimum for liquidity is based on the ‘adverse cashflow ’ analysis we looked at in Section 5 of this unit. Also incorporated is a brief reference to legal risks in the event that there is any potential from this source for financial costs to be incurred by the organisation. The precise way this would be drawn up and the weightings to be applied to the different components of risk should be customised for each organisation. While most organisations have, at least to a degree, some exposure to each of these balancesheet risks, the extent of that exposure varies according to an organisation’s activities. For example, a charity providing support to local refugee
76 OU BUSINESS SCHOOL

7/28/2019 b821 Block4unit9 Credit Liquidity and Operational Risk
http://slidepdf.com/reader/full/b821-block4unit9-credit-liquidity-and-operational-risk 77/112
7 FINANCIAL-RISK MANAGEMENT: FROM THEORY TO PRACTICE
groups is less exposed to interest rate and foreignexchange risks than a multinational oil company. Table 7.1 A risk-management matrix Risk Early-warning
indicators Type of measurement and board’s limit
Current results Risk-scale assessment (1 low to 10 high)
Average score for risk
Movement since last report
Interest rate Increase in
market volatility
Record interestrate volatility
Interestrate volatility low when measured against fiveyear average
2
Increase in size of interestrate positions
taken
Monitor daily interestrate exposure against
board
maximum loss of £20m based on ‘maxishock’ 2% rise in interest rates across all maturities
Minimal interestrate position Current exposure on ‘maxishock’ £4.5m loss
3 2.5 Down
Foreign exchange Increase in
market volatility
Record exchangerate volatility
FXmarkets volatile in our core markets
8
Increase
in
size of FXrate positions taken
Monitor daily
FX exposure against board limit of £5m maximum loss on 10% adverse movement of USD/GBP rate and £3m loss on 10% adverse movement of GBP/EUR rate
High
export
volumes generating high FXtransaction risk Loss on 10% adverse movements: USD/GBP £4.5m GBP/EUR £2.5m
9
8.5 Up
Credit Increase in defaults and credit rating downgrades
Number of defaults and ratings downgrades in the past twelve months
Higher than previous twelve months
7
High use of credit lines Percentage
utilisation of available lines
85% (75% in previous twelve months)
8
OU BUSINESS SCHOOL 77

7/28/2019 b821 Block4unit9 Credit Liquidity and Operational Risk
http://slidepdf.com/reader/full/b821-block4unit9-credit-liquidity-and-operational-risk 78/112
UNIT 9 CREDIT, LIQUIDITY AND OPERATIONAL RISK
Weakening credit quality of assets
Average credit rating of debtors A- (A in
previous twelve months)
8 7.5 Up
Weakening economic conditions
Average economic growth rates in economies where business is conducted
1.9% p.a. (2.4% p.a. in previous
twelve
months)
7
Liquidity Increasing funding costs Average cost of
funds Unchanged over twelve months at Libor + 25 bps
2
Scarcity of funding sources and other sources of liquidity
Level of liquidity Minimum access to liquidity: three times assessed adverse annual cash
flow
Satisfactory and largely unchanged over twelve months Sources total 5.5 times
assessed
adverse annual cash flow
2
2 Down
Negative ratingagency comment Monitor rating
agency commentary
Ratings unchanged over twelve months
2
Operational: controls Negative
comment from internal and external auditors
Review of audit reports Satisfactory
No material concerns
3
Negative comment
from
industry regulator
Review of dialogue
with,
and
reports from, regulator
Satisfactory No material concerns
3
2.3 Unchanged Breach of controls and procedures
Measurement of number and materiality of breaches
Breaches 40% down on previous twelve months
2
Fraudulent activity Measure of extent
of discovered fraud
No discovered fraud over past twelve months
1
Operational: systems
Regularity of systems failures Log of systems
failures Below average of past five years
2
Inadequacy of contingency sites Result of
contingencysite tests
Site tested fully and satisfactorily in past six months
1
Insufficiency of systems Percentage of
workload coped with by existing systems
Existing systems can cope with 95% of business activities
3 2 Unchanged
78 OU BUSINESS SCHOOL

7/28/2019 b821 Block4unit9 Credit Liquidity and Operational Risk
http://slidepdf.com/reader/full/b821-block4unit9-credit-liquidity-and-operational-risk 79/112
7 FINANCIAL-RISK MANAGEMENT: FROM THEORY TO PRACTICE
Operational: people High staff
turnover Staff turnover p.a. 17% versus
fiveyear average of 10%
9
Lack of staff with experience and/or relevant qualifications
Record of staff qualifications and years of relevant experience
Increased use of staff with poorer qualifications Average years of experience falling
9
9 Up
Difficulties in recruiting staff Unfilled
vacancies 5% of positions currently unfilled (average for past five years: 2%)
9
Legal Increase in litigious
activities
Log of legal actions
No material litigation
in
progress
1
1 Unchanged Unfavourable outcomes from legal cases
Record of outturn and cost of legal cases
Number and costs of legal actions not material
1
Other Contingent issues Monitored as
they arise None current 1 1 Unchanged Average of all risks (%) 39.8%* Up (from
36.5%) * Total score (35.8) as a % of the maximum score for all categories of 90.
EXERCISE 7.1 The one thing the risk report is lacking is a note on the key issues the board should be considering and recommendations for action by the board in respect of these key issues. Looking at the strategic risk-management report what do you think are the main concerns the board should be addressing and why? By contrast are there reasons to believe that a too cautious approach is being applied in other areas of risk management?
The report should be used for making strategic decisions on risk. For that reason it does not provide lowlevel detail on any of the risk positions. Such powers to manage the individual risks on a daybyday or transactionbytransaction basis should have been delegated to managers below board level.
OU BUSINESS SCHOOL 79

7/28/2019 b821 Block4unit9 Credit Liquidity and Operational Risk
http://slidepdf.com/reader/full/b821-block4unit9-credit-liquidity-and-operational-risk 80/112
UNIT 9 CREDIT, LIQUIDITY AND OPERATIONAL RISK
Under current accounting rules companies are required to undertake ‘risk audits’. Corporate governance issues are examined in Block 5, Unit 10. Sarbanes – Oxley is the term for the corporate governance legislation introduced in the US after the collapse of Enron in 2001 and WorldCom in 2002. The legislation is named after the two congressmen that initiated the legislation.
Finally, note that the riskmanagement report should be viewed as a living document. As new risks are taken on, the report should expand to accommodate the reporting of them. As the nature of the company ’s business changes, perhaps altering the risk features of its balance sheet, then again the report should be updated to mirror the new environment. The contents of the document warrant close scrutiny. Board members have responsibilities of stewardship to their shareholders and are expected to take responsibility for managing risks.
Assuming that it is accurately compiled, this report gives them the ability to meet that responsibility. The alternative of a board member saying after a calamitous risk event that ‘nobody ever told me we were on risk’ never was acceptable and certainly is not now in the Sarbanes – Oxley era of corporate governance.
C O M P AN Y R I S K - M AN AG E M E N T P O L I C I E S 7 . 3 Having explored the array of financial risks, it is time to look at the actual riskmanagement practices adopted by some major companies – Boots and De La Rue, companies you have looked at extensively throughout the course, and BP. The size of BP and the global nature of its business make it a good organisation to examine.
We do not have access to the types of internal riskmanagement documents
used
by
these
companies,
so
we
have
to
rely
on
the
following extracts from their annual reports and accounts to review the approaches taken to manage their balancesheet risks. Read through the following extracts, noting the connections between the coverage of risks in this block and the approaches to managing risk adopted by the three companies. Then do Exercise 7.2. BP Financial - r i sk management The group coordinates certain key activities on a global basis in order to optimise its financial position and performance. These include the management of the currency, maturity and interest rate profile of finance debt, cash, other significant financial risks and relationships with banks and other financial institutions. International oil, natural gas and power trading and risk management relating to business operations are carried out by the group’s oil, natural gas and power trading units. The main financial risks faced by the group through its normal business activities are market risk, credit risk and liquidity risk. These risks and the group’s approach to dealing with them are discussed below. The adoption of IFRS from 1 January 2005 does not fundamentally change BP’s approach to managing financial risk.
80 OU BUSINESS SCHOOL

7/28/2019 b821 Block4unit9 Credit Liquidity and Operational Risk
http://slidepdf.com/reader/full/b821-block4unit9-credit-liquidity-and-operational-risk 81/112

7/28/2019 b821 Block4unit9 Credit Liquidity and Operational Risk
http://slidepdf.com/reader/full/b821-block4unit9-credit-liquidity-and-operational-risk 82/112
7/28/2019 b821 Block4unit9 Credit Liquidity and Operational Risk
http://slidepdf.com/reader/full/b821-block4unit9-credit-liquidity-and-operational-risk 83/112

7/28/2019 b821 Block4unit9 Credit Liquidity and Operational Risk
http://slidepdf.com/reader/full/b821-block4unit9-credit-liquidity-and-operational-risk 84/112

7/28/2019 b821 Block4unit9 Credit Liquidity and Operational Risk
http://slidepdf.com/reader/full/b821-block4unit9-credit-liquidity-and-operational-risk 85/112

7/28/2019 b821 Block4unit9 Credit Liquidity and Operational Risk
http://slidepdf.com/reader/full/b821-block4unit9-credit-liquidity-and-operational-risk 86/112

7/28/2019 b821 Block4unit9 Credit Liquidity and Operational Risk
http://slidepdf.com/reader/full/b821-block4unit9-credit-liquidity-and-operational-risk 87/112

7/28/2019 b821 Block4unit9 Credit Liquidity and Operational Risk
http://slidepdf.com/reader/full/b821-block4unit9-credit-liquidity-and-operational-risk 88/112
7/28/2019 b821 Block4unit9 Credit Liquidity and Operational Risk
http://slidepdf.com/reader/full/b821-block4unit9-credit-liquidity-and-operational-risk 89/112

7/28/2019 b821 Block4unit9 Credit Liquidity and Operational Risk
http://slidepdf.com/reader/full/b821-block4unit9-credit-liquidity-and-operational-risk 90/112

7/28/2019 b821 Block4unit9 Credit Liquidity and Operational Risk
http://slidepdf.com/reader/full/b821-block4unit9-credit-liquidity-and-operational-risk 91/112

7/28/2019 b821 Block4unit9 Credit Liquidity and Operational Risk
http://slidepdf.com/reader/full/b821-block4unit9-credit-liquidity-and-operational-risk 92/112
UNIT 9 CREDIT, LIQUIDITY AND OPERATIONAL RISK
FNBK is actually better off as the swap rates have risen and it can now receive 9% for the residual three years rather than the 7% Hope was paying. Consequently, it does not have any credit exposure to Hope as a result of the swap position. Rather, the position is the other way around – it is negative, since Hope is exposed to FNBK. As a consequence, Hope’s administrators would seek to cancel the existing swap with FNBK at the prevailing market rate of 9% (as the swap position now has value to the company) and recoup its value of £5.05m for the creditors of Hope plc.
EXERCISE 3.1 Not really. While you should strive to be accurate in your analysis about whether or not to provide a credit line, it is important to acknowledge that it is not a precise science. If you have no bad debts over a period of time it is likely that you are applying too harsh a set of criteria for establishing credit lines and are turning away a lot of good business to eliminate all the possible defaulters.
EXERCISE 3.2 Variations in the movement of bond prices between different corporate issuers reflect either sector-specific or company-specific events. In 2002, Ford and other car manufacturers were experiencing difficult trading conditions in the wake of the economic uncertainties that followed the terrorist attack on the World Trade Centre in New York (this affected many businesses in 2002), but also it was experiencing company-specific difficulties owing to fierce competition from other car manufacturers. Both of these factors had an impact on its financial performance and on analysts’ perception of its likely future performance. Consequently, these adverse developments
were reflected in the price of Ford’s bonds as investors ‘priced in’ the deterioration in Ford’s credit status arising from these changing business conditions. The expectation is that lenders may be more prepared to have a credit line in place for IBM than they are for Ford, given the greater credit-risk and bond-price volatility associated with Ford. If a credit line was in place for Ford you would normally expect it to be smaller than that for IBM. This is not the full story, though. Some lenders, particularly those who may be specialists in investing in companies of a weaker credit status,
92 OU BUSINESS SCHOOL

7/28/2019 b821 Block4unit9 Credit Liquidity and Operational Risk
http://slidepdf.com/reader/full/b821-block4unit9-credit-liquidity-and-operational-risk 93/112
ANSWERS TO EXERCISES
may be prepared to have a large credit line for bonds issued by Ford. Provided the investors are sufficiently knowledgable and at ease about Ford’s credit status, such bonds offer the temptation of a high yield. Once again the question of ‘risk appetite’ is relevant here.
EXERCISE 3.3 With a weaker credit status, Auto Motors would have to pay a higher rate of interest than institutions with stronger ratings when borrowing money. This provides Southern Oil with the opportunity to gain a higher return when lending to Auto Motors compared with the return from investments in better rated organisations, although this higher return reflects the higher credit risk Southern Oil becomes exposed to. If Auto Motors’ credit rating moves to A3, however, it falls below the minimum acceptable laid down by the board. Consequently, the credit line should immediately be withdrawn. Southern Oil should ideally write to Auto Motors to advise them of this development. The question then arises of what to do with the existing £12m of exposure to Auto Motors. Southern Oil could choose just to run the investments to maturity. After all, they are short term and have an exposure of no more than a year; even with an A3 rating Standard and Poor ’s is not currently expecting Auto Motors to default on its liabilities. Alternatively, and particularly if Southern Oil is nervous about the weakening credit status of Auto Motors, it could seek to sell those investments in the company that are marketable rather than wait for the investments to mature. This may be difficult though. With Auto Motors’ weakening credit status the investments will only sell at a ‘distressed’ price and Southern Oil is likely to end up incurring a loss on them. The decisions taken
will
reflect
the
risk
appetite
of
the
managers
of
Southern
Oil. If they have a limited appetite they will probably immediately seek to sell those investments that are marketable.
EXERCISE 3.4 The two limits of £100m (0 – 1 year) and £50m (1 – 10 years) show the maximum acceptable exposure in these two maturity periods subject to the total exposure not exceeding £100m. If 0 – 1 year exposure was £75m, only £25m would be left available for exposures in either of the two maturity periods.
OU BUSINESS SCHOOL 93

7/28/2019 b821 Block4unit9 Credit Liquidity and Operational Risk
http://slidepdf.com/reader/full/b821-block4unit9-credit-liquidity-and-operational-risk 94/112

7/28/2019 b821 Block4unit9 Credit Liquidity and Operational Risk
http://slidepdf.com/reader/full/b821-block4unit9-credit-liquidity-and-operational-risk 95/112

7/28/2019 b821 Block4unit9 Credit Liquidity and Operational Risk
http://slidepdf.com/reader/full/b821-block4unit9-credit-liquidity-and-operational-risk 96/112

7/28/2019 b821 Block4unit9 Credit Liquidity and Operational Risk
http://slidepdf.com/reader/full/b821-block4unit9-credit-liquidity-and-operational-risk 97/112
ANSWERS TO EXERCISES
What also comes across is that each company clearly measures the risks it is exposed to and has policies for managing its risks. In terms of differences, the key difference is the more extensive
statement
provided
by
BP
compared
with
those
of
Boots and De La Rue. In part this may be explained by the greater and more diversified (globally) activities of BP. Its greater international exposure and need for finance arguably expose it to larger and more complex financial risks than those facing Boots and De La Rue.
����������������������������������������
OU BUSINESS SCHOOL 97

7/28/2019 b821 Block4unit9 Credit Liquidity and Operational Risk
http://slidepdf.com/reader/full/b821-block4unit9-credit-liquidity-and-operational-risk 98/112
UNIT 9 CREDIT, LIQUIDITY AND OPERATIONAL RISK
A P P E N D I X 1 STA N D A R D A N D P OOR ’ S C R E D I T R A T I NG S
‘Obligor ’ means the organisation that has the obligation to honour its debt(s)
Long-term issuer credit ratings AAA
An obligor rated AAA has extremely strong capacity to meet its financial commitments. AAA is the highest credit rating assigned by Standard and Poor’s. AA
An obligor rated AA has very strong capacity to meet its financial commitments. It differs from the highestrated obligors only to a small degree. A
An obligor rated A has strong capacity to meet its financial commitments, but is somewhat more susceptible to the adverse effects of changes in circumstances and economic conditions than obligors in higherrated categories. BBB
An obligor rated BBB has adequate capacity to meet its financial commitments. Adverse economic conditions or changing circumstances are, however, more likely to lead to a weakened capacity of the obligor to meet its financial commitments. BB, B, CCC and CC Obligors rated BB, B, CCC and CC are regarded as having significant speculative characteristics. BB indicates the least degree of speculation and CC the highest. While such obligors will likely have some quality and protective characteristics, these may be outweighed by large uncertainties or major exposures to adverse conditions. BB
An obligor rated BB is less vulnerable in the near term than other lowerrated obligors. However, it faces major ongoing uncertainties and exposure to adverse business, financial, or economic conditions which could lead to the obligor’s inadequate capacity to meet its financial commitments. B
An obligor rated B is more vulnerable than the obligors rated BB, but
the
obligor
currently
has
the
capacity
to
meet
its
financial
commitments. Adverse business, financial, or economic conditions
will likely impair the obligor’s capacity or willingness to meet its financial commitments.
98 OU BUSINESS SCHOOL

7/28/2019 b821 Block4unit9 Credit Liquidity and Operational Risk
http://slidepdf.com/reader/full/b821-block4unit9-credit-liquidity-and-operational-risk 99/112

7/28/2019 b821 Block4unit9 Credit Liquidity and Operational Risk
http://slidepdf.com/reader/full/b821-block4unit9-credit-liquidity-and-operational-risk 100/112
UNIT 9 CREDIT, LIQUIDITY AND OPERATIONAL RISK
A – 2 An obligor rated A – 2 has satisfactory capacity to meet its financial commitments. It is, however, somewhat more susceptible to the adverse effects of changes in circumstances and economic conditions than obligors in the highest rating category. A – 3
An obligor rated A – 3 has adequate capacity to meet its financial obligations. Adverse economic conditions or changing circumstances are, however, more likely to lead to a weakened capacity of the obligor to meet its financial commitments. B
An obligor rated B is regarded as vulnerable and has significant speculative characteristics. The obligor currently has the capacity to
meet
its
financial
commitments,
but
it
faces
major
ongoing
uncertainties which could lead to the obligor’s inadequate capacity to meet its financial commitments. Ratings of B – 1, B – 2 and B – 3 may be assigned to indicate finer distinctions within the B category. Obligors with a B – 1 shortterm rating have a relatively stronger capacity to meet their financial commitments over the shortterm compared to other speculativegrade obligors. Obligors with a B – 2 shortterm rating have an average speculativegrade capacity to meet their financial commitments over the shortterm compared to other speculativegrade obligors. Obligors with a B
– 3 shortterm rating have a relatively weaker capacity to meet their financial
commitments over the shortterm compared to other speculativegrade obligors. C
An obligor rated C is currently vulnerable to nonpayment and is dependent upon favourable business, financial and economic conditions for it to meet its financial commitments.
R
An obligor rated R is under regulatory supervision owing to its financial condition. During the period of the regulatory supervision the regulators may have the power to favour one class of obligations over others or pay some obligations and not others. Please see Standard and Poor’s issue credit ratings for a more detailed description of the effects of regulatory supervision on specific issues or classes of obligations. SD and D
An obligor
rated
SD
(selective
default)
or
D
has
failed
to
pay
one
or more of its financial obligations (rated or unrated) when it came due. D rating is assigned when Standard and Poor’s believes that the default will be a general default and that the obligor will fail to
100 OU BUSINESS SCHOOL

7/28/2019 b821 Block4unit9 Credit Liquidity and Operational Risk
http://slidepdf.com/reader/full/b821-block4unit9-credit-liquidity-and-operational-risk 101/112

7/28/2019 b821 Block4unit9 Credit Liquidity and Operational Risk
http://slidepdf.com/reader/full/b821-block4unit9-credit-liquidity-and-operational-risk 102/112

7/28/2019 b821 Block4unit9 Credit Liquidity and Operational Risk
http://slidepdf.com/reader/full/b821-block4unit9-credit-liquidity-and-operational-risk 103/112
APPENDIX 2 REPO AND SECURITISATION MARKETS: FURTHER ANALYSIS
The process of providing collateral and employing margining arrangements might appear to eliminate any credit risk to the lender (the organisation doing the reverse repo). This is not quite the case, although the exposure is much reduced relative to unsecured lending. The collateral could deteriorate in value and the lender could default prior to providing variation margin. The borrower and the issuers of the securities acting as collateral could both default – a risk which, although hugely remote, is enhanced if the collateral and the borrower are similar in nature (that is, active in the same business area and having a similar status with the ratings agencies). Additionally, a defaulting counterparty could fail to deliver collateral. Exposure to these limited risks is, though, contained by prescribing the credit quality of the securities used as collateral. The repo market, therefore, essentially provides a means for organisations that have large holdings of securities, but limited cash, to raise funds by using their securities holdings as collateral. It was for this very reason that the repo market was established (and then grew rapidly) in the United States. Legislation introduced by the US government in 1933 (the Glass – Steagall Act), following a large number of banking collapses in the United States during the economic depression, prevented financial institutions, known as ‘securities houses’, from taking deposits of cash from the public. Under these circumstances the repo market provided the liquidity needed for such institutions by allowing them to borrow against their offer of collateral in the form of securities.
A securities house is a financial institution whose main business involves the buying and selling of securities.
OU BUSINESS SCHOOL 103
l
S E C UR I T I S AT I O N AND ASS E T -BAC K E D S E C UR I T I E S
A major area of growth for financing business activity in recent years has been the securitisation market. Securitisation involves an organisation identifying and ‘packaging’ certain of its assets into what is known as a Special Purpose Entity or, simply, SPE. The SPE then raises funds by selling securities to investors. The economic performance of these securities is directly related to the SPE’s assets – giving rise to the term ‘assetbacked securities’, or ABS, which applies to these types of investment. Figure A2.2 overleaf provides a pictorial representation of a securitisation structure. The structure portrays the cashflow relationships among the
various participants in the securitisation. At the top we have the original assets held by the originator (usually a financial institution). The original assets in this case are loans that the originator has previously advanced to customers (here the customers are referred to as the ‘obligators’).

7/28/2019 b821 Block4unit9 Credit Liquidity and Operational Risk
http://slidepdf.com/reader/full/b821-block4unit9-credit-liquidity-and-operational-risk 104/112

7/28/2019 b821 Block4unit9 Credit Liquidity and Operational Risk
http://slidepdf.com/reader/full/b821-block4unit9-credit-liquidity-and-operational-risk 105/112
APPENDIX 2 REPO AND SECURITISATION MARKETS: FURTHER ANALYSIS
to paid by the SPE to the obligator. In this way the obligator secures a profit margin on the assets it took from its balance sheet and sold to its SPE.
Although investments in assetbacked securities provide linkage to specified assets of a defined credit quality, there is normally no recall
to
the
originator
of
those
assets
if
the
SPE
defaults.
Its
benefit
in terms of creditexposure management is that the lending of funds is against known assets. This is in contrast to nonasset-backed lending where investors are lending without such a linkage and to an organisation that may reshape the constitution of its assets (and liabilities) during the term of the investment.
You may think that these complex securitisation structures are only used by the larger and most sophisticated financial institutions, but this is not the case. An array of institutions, including sports clubs and even rock stars such as David Bowie, have used securitisations to raise funds.
What you require to be able to issue ABS are assets that generate (at least, reasonably) predictable future cash flows, which can then passed to the ABS investors. Football clubs can therefore securitise the annual earnings from season tickets and rock stars can securitise future royalty earnings from defined catalogues of songs in much the same way that banks can securitise their income flows from loans and mortgages on properties. The biggest issuers of ABS in recent years have been mortgage associations in the United States – the Federal National Mortgage
Association (nicknamed
‘
Fannie Mae
’
), the
Government
National
Mortgage Association (‘Ginnie Mae’) and the Federal Home Loan Mortgage Association (‘Freddie Mac’). The purpose of these agencies is to promote home ownership in the United States. To do this they purchase mortgages from originators (those companies that have sold mortgage products to the public), thereby freeing the originator’s funds to enable them to sell more mortgages. These mortgages are then packaged into pools (typically of similar characteristics) and mortgagebacked securities (MBS) are issued to investors who then obtain a securitised interest in the pool. The investors can link their credit appetite to the specific credit quality of the pools of mortgages that have been securitised. Those investors with only a conservative appetite for credit risk will select highquality pools with a predictable (and probably relatively short) term to maturity. Those investors with a greater appetite for risk will buy into the higheryielding lowerquality pools with a less certain term to maturity, gaining a greater return for this additional risk profile. The quality of a pool is defined by the rating agencies in the same way that conventional debt is rated – although (as with conventional debt) these ratings can alter over the lifespan of the security if the credit quality of the securitised assets alters.
Mortgagebacked securities (MBS) are just a form of assetbacked securities (ABS).
OU BUSINESS SCHOOL 105

7/28/2019 b821 Block4unit9 Credit Liquidity and Operational Risk
http://slidepdf.com/reader/full/b821-block4unit9-credit-liquidity-and-operational-risk 106/112
UNIT 9 CREDIT, LIQUIDITY AND OPERATIONAL RISK
Investing in ABS (or MBS) is certainly not without its credit risks. If there are defaults on the underlying securitised assets these will feed through to the performance of the ABS – and you are particularly exposed to this if you are holding ABS with a low credit quality. The
attraction
of
investing
in
a securitised
pool,
though,
is
that
the
nature and quality of the underlying assets are defined within parameters known at the outset of the investment. Thus there is a transparency about the quality of assets in which you are investing. ����������������������������������������
106 OU BUSINESS SCHOOL
7/28/2019 b821 Block4unit9 Credit Liquidity and Operational Risk
http://slidepdf.com/reader/full/b821-block4unit9-credit-liquidity-and-operational-risk 107/112
REFERENCES AND FURTHER READING
R EFER EN C ES A N D FU R TH ER R EA D I N G Das, S. (ed.) (1998) Risk Management and Financial Derivatives: A
Guide
to
the
Mathematics,
McGrawHill.
Leeson, N. (1996) Rogue Trader , 1st edn, Little, Brown and Company. O’Kane, D. (2001) Credit Derivatives Explained , Lehman Brothers International (Europe). Rouse, N. (1999) Applied Lending Techniques, 2nd edn, Financial
World Publishing. Rouse, N. (2003) Bankers’ Lending Techniques, Financial World Publishing. Saunders, A. and Allen, L. (2002) Credit Risk Management: New Approaches to Value at Risk and Other Paradigms, 2nd edn, John Wiley.
OU BUSINESS SCHOOL 107

7/28/2019 b821 Block4unit9 Credit Liquidity and Operational Risk
http://slidepdf.com/reader/full/b821-block4unit9-credit-liquidity-and-operational-risk 108/112

7/28/2019 b821 Block4unit9 Credit Liquidity and Operational Risk
http://slidepdf.com/reader/full/b821-block4unit9-credit-liquidity-and-operational-risk 109/112

7/28/2019 b821 Block4unit9 Credit Liquidity and Operational Risk
http://slidepdf.com/reader/full/b821-block4unit9-credit-liquidity-and-operational-risk 110/112

7/28/2019 b821 Block4unit9 Credit Liquidity and Operational Risk
http://slidepdf.com/reader/full/b821-block4unit9-credit-liquidity-and-operational-risk 111/112

7/28/2019 b821 Block4unit9 Credit Liquidity and Operational Risk
http://slidepdf.com/reader/full/b821-block4unit9-credit-liquidity-and-operational-risk 112/112