babbitted bearing health assessment jim allen jack
TRANSCRIPT
Copyright © 2012 by Turbomachinery Laboratory, Texas A&M University
Proceedings of the Forty First Turbomachinery Symposium September 24 – 27, 2012, Houston, Texas
BABBITTED BEARING HEALTH ASSESSMENT
John K. Whalen, P.E. Technical Director
John Crane Bearings Houston, TX 77075
Thomas D. Hess, Jr., P.E.
DuPont Engineering Research & Technology Rotating Machinery Group
Chestnut Run Wilmington, DE 19805
Jim Allen Senior Rotating Equipment Specialist
Engineering Technologist Nova Chemicals Corporation
Joffre, Alberta, Canada
Jack Craighton, CLS DuPont Engineering Chestnut Run Plaza
Wilmington, DE 19805
John K. Whalen is the Technical Director for John Crane Bearings. John is a member of STLE, ASME, and the Vibration Institute and is a past member of the Turbomachinery Symposium Advisory Committee; John is a registered Professional Engineer in the State of Texas.
John received his BSME from the Rochester Institute of Technology in 1981.
He spent 7 years with Dresser Rand in Wellsville, NY where he worked in Large Turbine Engineering and Rotordynamics. John joined Centritech Corp. in 1988 and helped form TCE in 1991.
At John Crane Bearings John has Engineering responsibility for all three John Crane Bearing companies (John Crane Bearing Technology in Germany, Orion in Wisconsin and TCE in Houston). The product range includes babbitted bearings and seals, labyrinth seals, and related products and services.
James “Jim” Allen is a Senior Rotating Equipment Specialist in the Reliability Team for Nova Chemicals, in Red Deer, Alberta.
Jim is responsible for the reliable operation of the Olefins Plants Equipment by supporting operations / Maintenance / Engineering. Prior to joining Nova Chemicals Jim worked for Dow Chemicals
in Fort Saskatchewan, Alberta and Sherritt Gordon Mines, Lynn Lake Manitoba.
Jim is as certified Industrial Mechanic and Engineering Technologist. He is also member of the CMVA, STLE and has been an active member of the world of rotating equipment for over 40 years.
Thomas Hess works in the Rotating Machinery Group for DuPont located in Wilmington, Delaware. He is responsible for plant and capital project support and standards development for DuPont.
Prior to joining DuPont, Mr. Hess worked for Valero at the Delaware City
Refinery, ARCO Chemical in Newtown Square, PA, and Bently Nevada as a field vibration analyst.
Mr. Hess has a BS in Mechanical Engineering from Villanova University. He is also a member of ASME, the Vibration Institute, and is a Registered Professional Engineer in the Commonwealth of Pennsylvania.
John Craighton works in the Rotating Machinery Group for DuPont located in Wilmington, Delaware.
He is a corporate lubrication consultant responsible for plant level support and standards development for DuPont.
Prior to joining DuPont, Mr. Craighton worked for Invensys Operations
Management and Valero Energy Corporation as a Lubrication Specialist.
John is a Certified Lubrication Specialist through the Society of Tribologists and Lubrication Engineers.
ABSTRACT
Within most plants there is often a desire to extend the
time between outages. Several factors determine this but one to consider is the bearings ability to run for the extended time.
This Tutorial will address common bearing failure mechanisms, tools available to diagnose these problems and ways to use that information to make decisions on continued operation. Evaluation consists of analysis of Condition Monitoring information coupled with rotor dynamic analysis and computerized bearing modeling.
A case study will be presented that details the evaluation of a distressed bearing. Analysis allowed the user to determine they could slightly reduce running speed (to limit vibration to a certain level) and continue to run to the scheduled outage date.
There will then be a discussion on bearing robustness and ways to design bearings for long life. A case study will be presented where an Ethylene plant desired to extend the time between outages but the existing bearings prohibited that. The determination was made that upgrading the bearings to a more
Copyright © 2012 by Turbomachinery Laboratory, Texas A&M University
robust design would allow the extended time between outages.
INTRODUCTION Most process plants and power generation facilities are
required to maximize the use of their assets by running for longer periods of time (longer time between outages) and reducing the length of the outage when they are down. Of course equally important are the need to not come down unexpectedly (a forced outage) and the requirement to run efficiently to maximize rates.
Many companies have also been implementing debottlenecking projects throughout their facility and sometimes these result in increased demand from other equipment in the facility. This increased demand could result in a loss of reliability of that equipment which is being pushed harder to make rates.
Plant owners and operators realize it is important to understand which equipment could limit the time between outages and what component of that equipment is most vulnerable. It is understood that there is a tremendous amount of fixed and rotating equipment; any one of which could be the limiting factor when evaluating the length of time required between outages. It is also recognized that with rotating equipment there are several factors which can influence this scheduling. However this tutorial is only going to discuss oil lubricated babbitted bearings (journal and thrust) as found in existing rotating equipment.
To be clear we will be discussing bearings as found in critical un-spared equipment. Machines that should be fully instrumented as per API 670 (2010) as a minimum, and with condition monitoring procedures and processes in place. It is beyond the scope of this presentation to get deeply into condition monitoring practices – it will just be assumed that data is available for analysis.
Several failure mechanisms will be introduced discussing evaluation of the damage mechanism, tools that may help diagnose the problem while running and methods to avoid the particular failure mode. The intent is that understanding common failure modes can lead to design and operation to avoid them; thus pushing the limits of operation.
Coupled with this is the evaluation of running equipment and the need to determine; if the machine can run to the next scheduled outage; if the machine rates (and speed) need to be reduced to ensure successful operation to the outage; if an outage needs to be taken before the scheduled outage; or if the machine needs to be shut down immediately to avoid further damage.
HYDRODYNAMIC BEARING OPERATION
In order to be able to diagnose bearing problems it is
important to have a basic understanding of bearing design and operation. The bearings covered in this presentation include babbitted journal and thrust bearings as found in typical special purpose API turbomachinery. For simplicity, and in order to cover the intended machine population effectively, we will not be discussing bearings lined with materials other than babbitt, anti friction bearings, magnetic bearings, foil bearings, etc.
The definition of hydrodynamic is: “…pertaining to forces
in - or motions of - liquids.” So we have a fluid in motion (oil) that generates forces to separate the stationary (bearing) from the rotating (rotor). This may also be referred to as Fluid Film Lubrication since in operation a film of oil separates the bearing from the rotor.
The study of this phenomena falls under the field of Tribology (Dowson, 1979) – a word that was coined in 1966: “…the science and technology of interacting surfaces in relative motion and the practices related thereto.” Also often referred to as the study of friction, wear and lubrication.
The basic requirement for successful operation of hydrodynamic bearings is the formation of the “wedge.”
The Hydrodynamic Wedge
Figure 1 is a sketch of a journal in a bearing (with greatly
exaggerated clearances). This figure also contains some terms that will be used throughout this presentation.
Figure 1 Hydrodynamic film generation
There is a journal rotating (CCW) inside a journal bearing
and the rotation of this journal drags oil into a converging space. Since oil is incompressible, all of the oil cannot be pulled though this space so a pressure is generated that forces the oil out the axial ends of the bearing. This pressure is depicted by the pressure profiles as shown.
For the sleeve bearing being considered we see that the rotor is displaced down and to the right – since the pressure field starts on the left side of the journal. A line drawn between the journal center and the bearing center is called the “line of centers” and the angle between this line and the applied load is called the “attitude angle.”
The amount the journal is displaced from the center of the bearing is referred to as the eccentricity and the term “eccentricity ratio” is the ratio of this eccentricity to the bearing radial clearance. As such an eccentricity ratio of 1.0 implies the eccentricity equals the clearance and the journal is touching the bearing surface. Likewise an eccentricity ratio of zero indicates the journal is centered in the bearing.
The “minimum oil film thickness” lies on the line of centers and can be defined by the eccentricity ratio and bearing radial clearance. Figure 2 is a drawing of the clearance space
Copyright © 2012 by Turbomachinery Laboratory, Texas A&M University
unwrapped – starting at the point of maximum oil film thickness (opposite the minimum) and continuing 360 degrees though the minimum and back to the maximum. Here the converging and diverging wedges can be more clearly seen.
Figure 2 Unwrapped Clearance Space
Terms that are important to retain from this section include the minimum oil film thickness, “the wedge,” eccentricity ratio and attitude angle.
The Stribeck Curve
As a machine is brought up from zero speed to full speed it
goes though three hydrodynamic lubrication regimes. The Stribeck curve contains these regimes and is presented in Figure 3. The curve plots the coefficient of friction on the vertical axis and ZN/P on the horizontal. In this plot Z is viscosity, N is speed and P is the unit load on the bearing. The best way to first study this curve is to envision a machine coming up in speed, where the viscosity and load are constant.
Figure 3 Stribeck curve At zero speed and at very low speeds there is boundary
lubrication; here the two surfaces are in contact with a relatively low coefficient of friction (~0.15) thanks to the presence of oil and two very good surfaces (babbitt and typically a ground journal). Once the speed is sufficient to pull oil into the wedge hydrodynamic pressure begins to develop and the surfaces begin to separate; hence the drop in friction as speed increases, this regime is referred to as mixed film lubrication. Once the surfaces are fully separated we have a minimum friction (depicted as .001 in the figure) and as speed
increases the friction gradually increases. This increase in coefficient of friction is due to the fact that as the surfaces separate, the film becomes thicker and the shearing of the thicker film increases the coefficient of friction.
Thrust Bearings
Thrust bearings absorb the axial loads present in
turbomachinery. As journal bearings have to support the rotor, thrust bearings must support this axial load.
The hydrodynamic principle is the same since the face of the babbitted bearings must have a converging wedge to support the load. Figure 4 contains a drawing of a taper land thrust plate. In this design the wedge (or taper) is machined into the face of the bearing as noted in the section on the left. The rotation of the thrust collar pulls oil into this converging space and hydrodynamic pressure is generated.
Figure 4 Taper Land Thrust Plate
The taper land bearing is limited in load capacity as that taper can only be machined at a single given angle. In reality thrust bearings must be able to accommodate varying loads and speeds and as such a tilting face would accommodate those variations. For this reason tilting pad thrust bearings are commonly used. As the name implies the individual pads tilt depending on the load capacity required.
Figure 5 Tilting Pad Thrust Bearings
Figure 5 shows two variations of tilting pad thrust bearings. On top is the non-equalized bearing with pad pivots in the circumferential center of the pad and on the bottom is a fully equalized tilting pad thrust bearing. The equalized bearing
Copyright © 2012 by Turbomachinery Laboratory, Texas A&M University
utilizes a set of leveling links or plates under the pads; the links articulate to allow each pad to take an equal share of the load. This bottom drawing also shows the use of an offset pivot which can be utilized to increase load capacity (by allowing the pad to tilt more thereby providing an optimized converging wedge).
Babbitt
Babbitt (or white metal) is typically a tin based material
that lines the bore of journal bearings or the faces of thrust bearings. It was invented in 1839 (by Isaac Babbitt in Boston, MA) and has been used extensively ever since. The desired properties for this material are:
• Compatibility with the journal (non galling) • Embedability – dirt and wear particles • Conformability – account for misalignment, etc. • Strength - must be able to support the load • Corrosion resistance • Low Cost • Availability • Low Coefficient of Friction The main idea is that the bearing is the sacrificial element,
should something happen to cause damage to a turbomachine it is preferred that only the bearings become damaged and the rotor and other components survive intact.
There is an ASTM spec for babbitt: ASTM B23-00 (2010) which specifies compositions and physical properties for several grades (alloys). The most common grade is Alloy 2 which is nominally composed of 89% Tin, 7 ½% Antimony and 3 ½% copper. This grade of babbitt begins to melt at 466 °F and is fully melted at 669 °F. Needless to say as temperature increases above room temperature the babbitt strength drops off.
Figure 6 ASTM B23 Alloy 2 Yield Strength
A plot of babbitt yield strength vs. temperature is presented in Figure 6. This data comes from ASTM B23 and has been extrapolated to 300 °F. The yield strength is also presented based upon a 0.125% offset (0.125% deformation of gage length). Yield data is presented at a 0.2% offset from time to time and of course that results in higher values for the yield strength (i.e. 0.125% offset vales are more conservative).
Oil All bearings covered here are oil lubricated, so a brief
discussion of oil is in order. Oil in critical turbomachinery must:
• Have adequate viscosity to generate the fluid “film” • Move the generated heat so it can be removed • Flush the bearings to keep them clean • Coat steel surfaces to reduce rust and oxidation Viscosity is a measure of a fluids resistance to shear, it
needs to be high enough to support the load with an adequate film thickness but low enough to limit operating temperatures and power loss. The viscosity index (VI) is a measure of an oils viscosity stability (how much it changes with temperature), most oils today have a VI above 110.
Common oil grades are ISO 32 (most common), followed by ISO 46 then ISO 68. The heavier oils (46 and 68) are being used less today in an attempt to standardize on oils and to lower power losses.
Refined oils are classified by their level of refining in groups; with Group I oils being supplanted by Group II oils when used as a turbine oil in the last 15 years or so. The more highly refined Group II oils have much better resistance to oxidation but have introduced varnishing potential which will be discussed later. There are also synthetic turbine oils which are being used more in recent years. Examples of synthetics are Polyalphaolefins (PAO) which is a Group IV oil and Polyalkylene glycols (PAG) in Group V.
Additive packages are also employed with Rust and Oxidation (R&O), anti wear and anti foam packages being widely used. Extreme Pressure (EP) additive packages are being used less in recent years as they have been found to have the potential to “plate out” under high heat.
CONDITION MONITORING
While this tutorial is not about condition monitoring it is
helpful to list the common tools used today. Once listed we will then move onto bearing failures and how these tools may be used to determine if an operating machine is experiencing a bearing failure and how to utilize the information to guard against failure in the future. One important aspect of all of this is understanding what is happening or what happened in an attempt to take steps to increase machine reliability going forward.
Common Condition Monitoring procedures today include: • Proximity probe use – Radial and axial • Oil analysis • Bearing Temperature • Grounding brush discharge monitoring Taking each:
Proximity Probes Proximity (“prox” or eddy current) probes sense the rotors
Copyright © 2012 by Turbomachinery Laboratory, Texas A&M University
location relative to the surface the probe is mounted on (typically somewhere on the machine). They can provide vibration or steady state data. Typically radial probes are located near journal bearings (2 per bearing location) and are situated orthogonal (90 degrees apart) so shaft orbits can be observed. These probes can then be utilized to report subsynchronous, synchronous or supersynchronous vibration.
Shaft centerline plots
Prox probes can also be used to track rotor movements,
such as when a journal comes up on a film of oil; this is referred to as shaft centerline data. This use is often overlooked and when it is desired to analyze shaft centerline data it is useful to know where the journal is in the bearing at zero speed (at the bottom of the bearing) as a reference point. Care must be taken when using data from these probes as thermal affects may alter the probe length and/or the mounting surface location relative to the bearing centerline.
Proximity probes can measure change in radial shaft position with respect to the bearing bore. As such, the data from the probes can be used to detect bearing wear or other changes in condition. It is assumed that when the shaft is not rotating, the shaft is positioned centered in the bottom of the bearing. There are exceptions to this guideline, such as when the coupling end of a light weight pinion in a gear drive is held off the bottom of the bearing by the coupling radial stiffness and possible alignment offset. Or in some overhung machines where the coupling end bearing is uploaded.
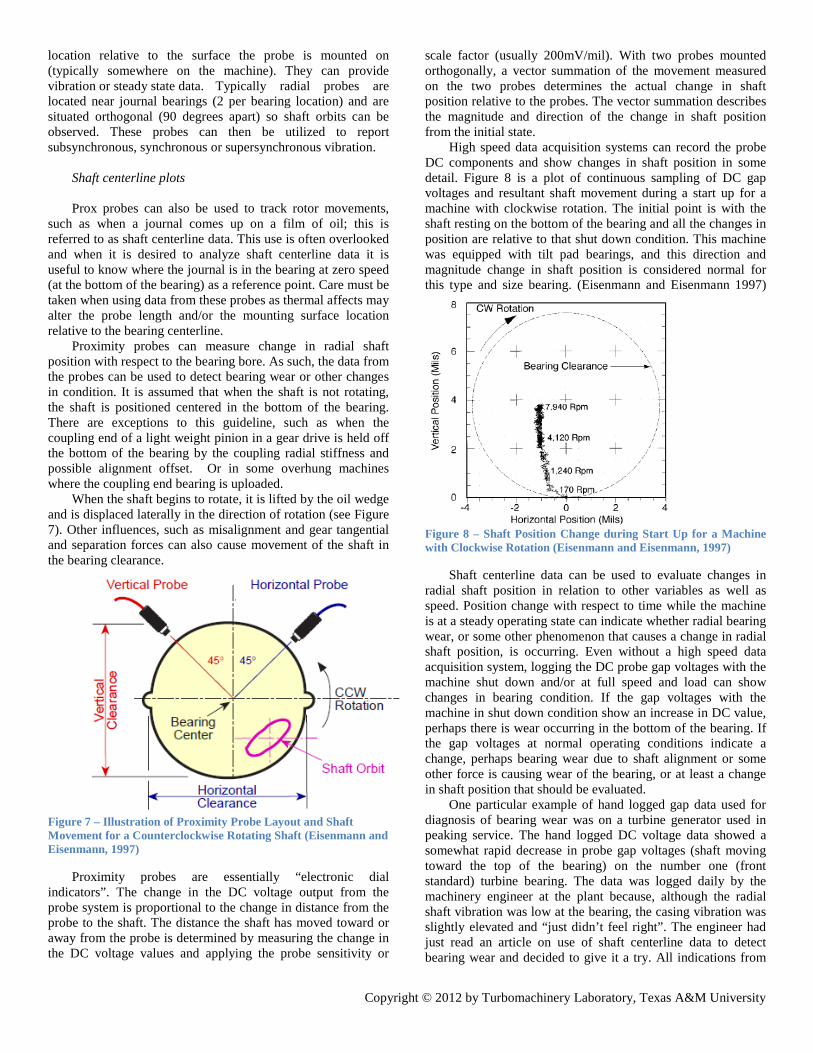
When the shaft begins to rotate, it is lifted by the oil wedge and is displaced laterally in the direction of rotation (see Figure 7). Other influences, such as misalignment and gear tangential and separation forces can also cause movement of the shaft in the bearing clearance.
Figure 7 – Illustration of Proximity Probe Layout and Shaft Movement for a Counterclockwise Rotating Shaft (Eisenmann and Eisenmann, 1997)
Proximity probes are essentially “electronic dial indicators”. The change in the DC voltage output from the probe system is proportional to the change in distance from the probe to the shaft. The distance the shaft has moved toward or away from the probe is determined by measuring the change in the DC voltage values and applying the probe sensitivity or
scale factor (usually 200mV/mil). With two probes mounted orthogonally, a vector summation of the movement measured on the two probes determines the actual change in shaft position relative to the probes. The vector summation describes the magnitude and direction of the change in shaft position from the initial state.
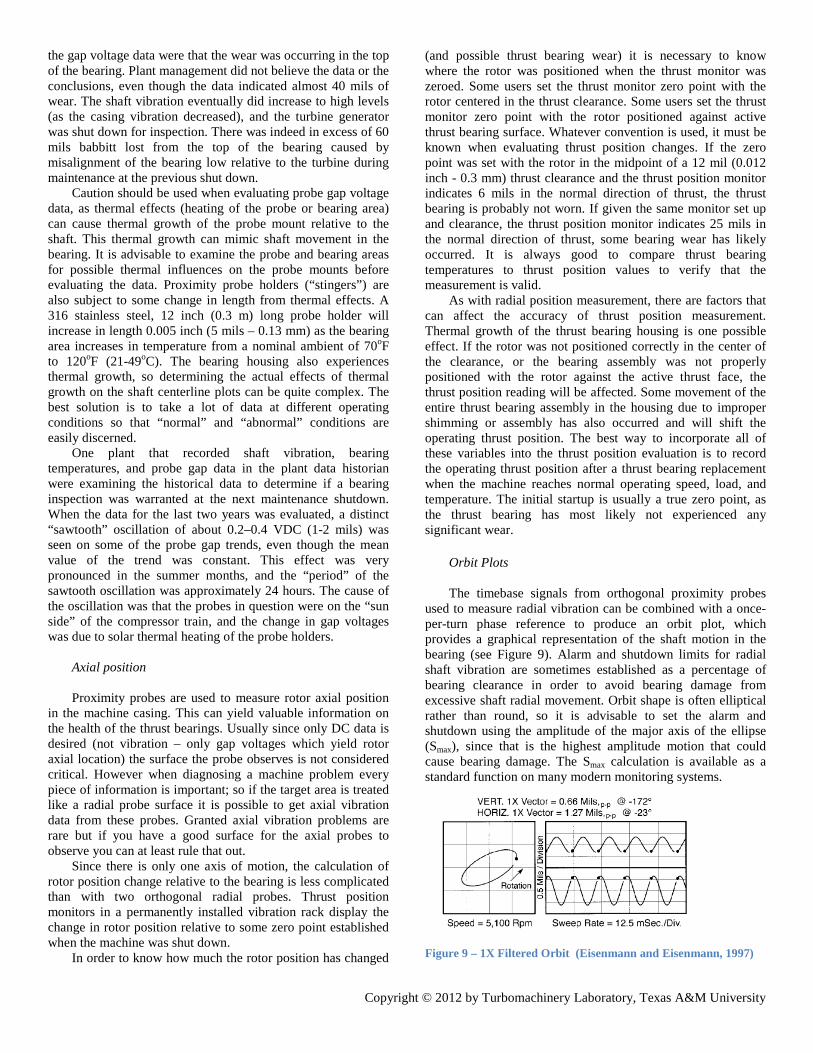
High speed data acquisition systems can record the probe DC components and show changes in shaft position in some detail. Figure 8 is a plot of continuous sampling of DC gap voltages and resultant shaft movement during a start up for a machine with clockwise rotation. The initial point is with the shaft resting on the bottom of the bearing and all the changes in position are relative to that shut down condition. This machine was equipped with tilt pad bearings, and this direction and magnitude change in shaft position is considered normal for this type and size bearing. (Eisenmann and Eisenmann 1997)
Figure 8 – Shaft Position Change during Start Up for a Machine with Clockwise Rotation (Eisenmann and Eisenmann, 1997)
Shaft centerline data can be used to evaluate changes in radial shaft position in relation to other variables as well as speed. Position change with respect to time while the machine is at a steady operating state can indicate whether radial bearing wear, or some other phenomenon that causes a change in radial shaft position, is occurring. Even without a high speed data acquisition system, logging the DC probe gap voltages with the machine shut down and/or at full speed and load can show changes in bearing condition. If the gap voltages with the machine in shut down condition show an increase in DC value, perhaps there is wear occurring in the bottom of the bearing. If the gap voltages at normal operating conditions indicate a change, perhaps bearing wear due to shaft alignment or some other force is causing wear of the bearing, or at least a change in shaft position that should be evaluated.
One particular example of hand logged gap data used for diagnosis of bearing wear was on a turbine generator used in peaking service. The hand logged DC voltage data showed a somewhat rapid decrease in probe gap voltages (shaft moving toward the top of the bearing) on the number one (front standard) turbine bearing. The data was logged daily by the machinery engineer at the plant because, although the radial shaft vibration was low at the bearing, the casing vibration was slightly elevated and “just didn’t feel right”. The engineer had just read an article on use of shaft centerline data to detect bearing wear and decided to give it a try. All indications from
Copyright © 2012 by Turbomachinery Laboratory, Texas A&M University
the gap voltage data were that the wear was occurring in the top of the bearing. Plant management did not believe the data or the conclusions, even though the data indicated almost 40 mils of wear. The shaft vibration eventually did increase to high levels (as the casing vibration decreased), and the turbine generator was shut down for inspection. There was indeed in excess of 60 mils babbitt lost from the top of the bearing caused by misalignment of the bearing low relative to the turbine during maintenance at the previous shut down.
Caution should be used when evaluating probe gap voltage data, as thermal effects (heating of the probe or bearing area) can cause thermal growth of the probe mount relative to the shaft. This thermal growth can mimic shaft movement in the bearing. It is advisable to examine the probe and bearing areas for possible thermal influences on the probe mounts before evaluating the data. Proximity probe holders (“stingers”) are also subject to some change in length from thermal effects. A 316 stainless steel, 12 inch (0.3 m) long probe holder will increase in length 0.005 inch (5 mils – 0.13 mm) as the bearing area increases in temperature from a nominal ambient of 70oF to 120oF (21-49oC). The bearing housing also experiences thermal growth, so determining the actual effects of thermal growth on the shaft centerline plots can be quite complex. The best solution is to take a lot of data at different operating conditions so that “normal” and “abnormal” conditions are easily discerned.
One plant that recorded shaft vibration, bearing temperatures, and probe gap data in the plant data historian were examining the historical data to determine if a bearing inspection was warranted at the next maintenance shutdown. When the data for the last two years was evaluated, a distinct “sawtooth” oscillation of about 0.2–0.4 VDC (1-2 mils) was seen on some of the probe gap trends, even though the mean value of the trend was constant. This effect was very pronounced in the summer months, and the “period” of the sawtooth oscillation was approximately 24 hours. The cause of the oscillation was that the probes in question were on the “sun side” of the compressor train, and the change in gap voltages was due to solar thermal heating of the probe holders.
Axial position
Proximity probes are used to measure rotor axial position
in the machine casing. This can yield valuable information on the health of the thrust bearings. Usually since only DC data is desired (not vibration – only gap voltages which yield rotor axial location) the surface the probe observes is not considered critical. However when diagnosing a machine problem every piece of information is important; so if the target area is treated like a radial probe surface it is possible to get axial vibration data from these probes. Granted axial vibration problems are rare but if you have a good surface for the axial probes to observe you can at least rule that out.
Since there is only one axis of motion, the calculation of rotor position change relative to the bearing is less complicated than with two orthogonal radial probes. Thrust position monitors in a permanently installed vibration rack display the change in rotor position relative to some zero point established when the machine was shut down.
In order to know how much the rotor position has changed
(and possible thrust bearing wear) it is necessary to know where the rotor was positioned when the thrust monitor was zeroed. Some users set the thrust monitor zero point with the rotor centered in the thrust clearance. Some users set the thrust monitor zero point with the rotor positioned against active thrust bearing surface. Whatever convention is used, it must be known when evaluating thrust position changes. If the zero point was set with the rotor in the midpoint of a 12 mil (0.012 inch - 0.3 mm) thrust clearance and the thrust position monitor indicates 6 mils in the normal direction of thrust, the thrust bearing is probably not worn. If given the same monitor set up and clearance, the thrust position monitor indicates 25 mils in the normal direction of thrust, some bearing wear has likely occurred. It is always good to compare thrust bearing temperatures to thrust position values to verify that the measurement is valid.
As with radial position measurement, there are factors that can affect the accuracy of thrust position measurement. Thermal growth of the thrust bearing housing is one possible effect. If the rotor was not positioned correctly in the center of the clearance, or the bearing assembly was not properly positioned with the rotor against the active thrust face, the thrust position reading will be affected. Some movement of the entire thrust bearing assembly in the housing due to improper shimming or assembly has also occurred and will shift the operating thrust position. The best way to incorporate all of these variables into the thrust position evaluation is to record the operating thrust position after a thrust bearing replacement when the machine reaches normal operating speed, load, and temperature. The initial startup is usually a true zero point, as the thrust bearing has most likely not experienced any significant wear.
Orbit Plots
The timebase signals from orthogonal proximity probes
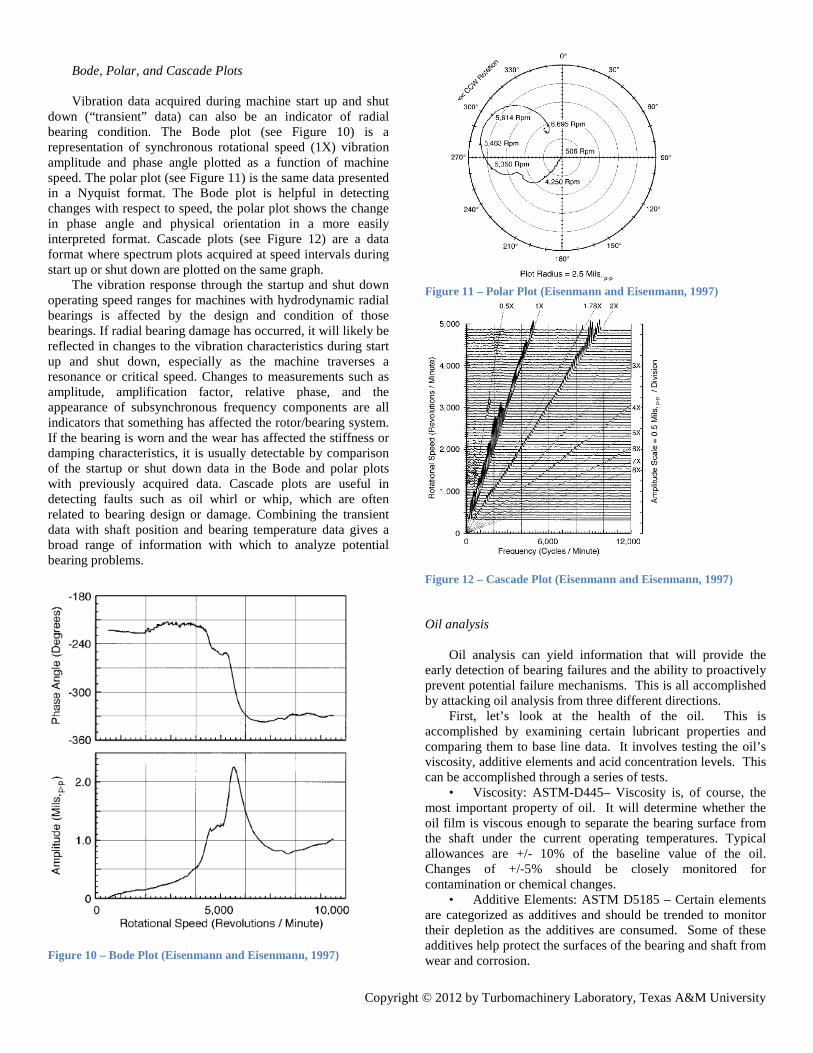
used to measure radial vibration can be combined with a once-per-turn phase reference to produce an orbit plot, which provides a graphical representation of the shaft motion in the bearing (see Figure 9). Alarm and shutdown limits for radial shaft vibration are sometimes established as a percentage of bearing clearance in order to avoid bearing damage from excessive shaft radial movement. Orbit shape is often elliptical rather than round, so it is advisable to set the alarm and shutdown using the amplitude of the major axis of the ellipse (Smax), since that is the highest amplitude motion that could cause bearing damage. The Smax calculation is available as a standard function on many modern monitoring systems.
Figure 9 – 1X Filtered Orbit (Eisenmann and Eisenmann, 1997)
Copyright © 2012 by Turbomachinery Laboratory, Texas A&M University
Bode, Polar, and Cascade Plots
Vibration data acquired during machine start up and shut
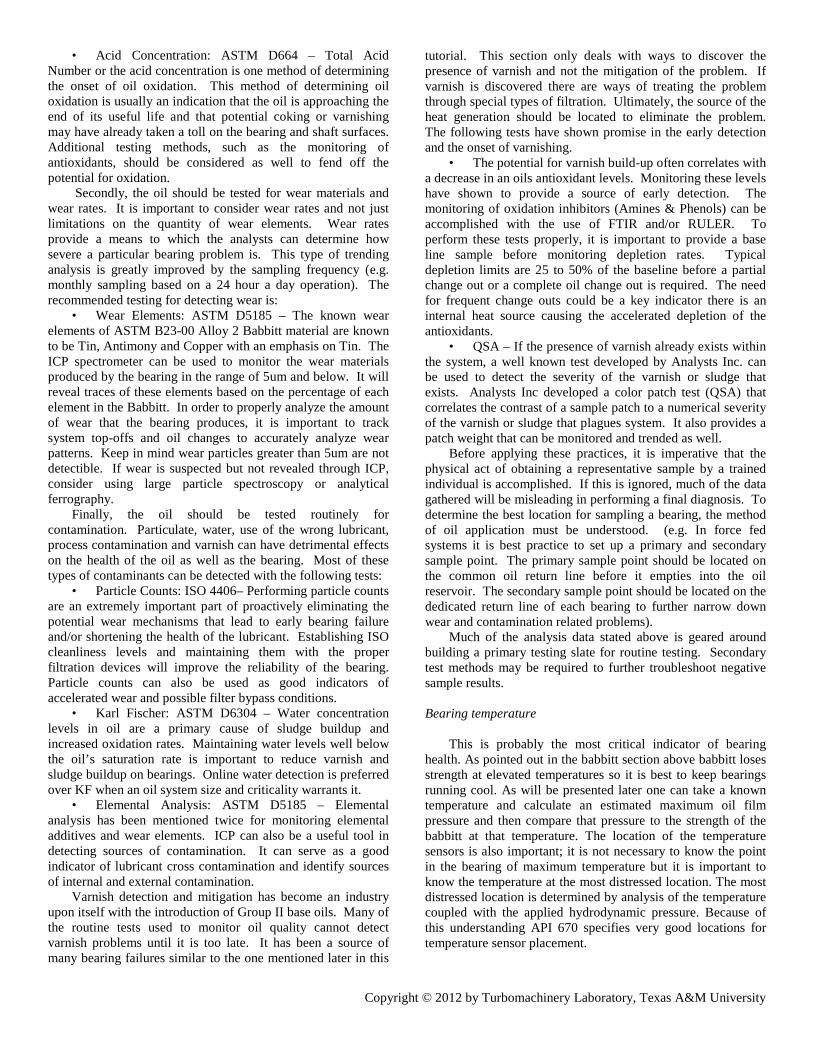
down (“transient” data) can also be an indicator of radial bearing condition. The Bode plot (see Figure 10) is a representation of synchronous rotational speed (1X) vibration amplitude and phase angle plotted as a function of machine speed. The polar plot (see Figure 11) is the same data presented in a Nyquist format. The Bode plot is helpful in detecting changes with respect to speed, the polar plot shows the change in phase angle and physical orientation in a more easily interpreted format. Cascade plots (see Figure 12) are a data format where spectrum plots acquired at speed intervals during start up or shut down are plotted on the same graph.
The vibration response through the startup and shut down operating speed ranges for machines with hydrodynamic radial bearings is affected by the design and condition of those bearings. If radial bearing damage has occurred, it will likely be reflected in changes to the vibration characteristics during start up and shut down, especially as the machine traverses a resonance or critical speed. Changes to measurements such as amplitude, amplification factor, relative phase, and the appearance of subsynchronous frequency components are all indicators that something has affected the rotor/bearing system. If the bearing is worn and the wear has affected the stiffness or damping characteristics, it is usually detectable by comparison of the startup or shut down data in the Bode and polar plots with previously acquired data. Cascade plots are useful in detecting faults such as oil whirl or whip, which are often related to bearing design or damage. Combining the transient data with shaft position and bearing temperature data gives a broad range of information with which to analyze potential bearing problems.
Figure 10 – Bode Plot (Eisenmann and Eisenmann, 1997)
Figure 11 – Polar Plot (Eisenmann and Eisenmann, 1997)
Figure 12 – Cascade Plot (Eisenmann and Eisenmann, 1997)
Oil analysis Oil analysis can yield information that will provide the
early detection of bearing failures and the ability to proactively prevent potential failure mechanisms. This is all accomplished by attacking oil analysis from three different directions.
First, let’s look at the health of the oil. This is accomplished by examining certain lubricant properties and comparing them to base line data. It involves testing the oil’s viscosity, additive elements and acid concentration levels. This can be accomplished through a series of tests.
• Viscosity: ASTM-D445– Viscosity is, of course, the most important property of oil. It will determine whether the oil film is viscous enough to separate the bearing surface from the shaft under the current operating temperatures. Typical allowances are +/- 10% of the baseline value of the oil. Changes of +/-5% should be closely monitored for contamination or chemical changes.
• Additive Elements: ASTM D5185 – Certain elements are categorized as additives and should be trended to monitor their depletion as the additives are consumed. Some of these additives help protect the surfaces of the bearing and shaft from wear and corrosion.
Copyright © 2012 by Turbomachinery Laboratory, Texas A&M University
• Acid Concentration: ASTM D664 – Total Acid Number or the acid concentration is one method of determining the onset of oil oxidation. This method of determining oil oxidation is usually an indication that the oil is approaching the end of its useful life and that potential coking or varnishing may have already taken a toll on the bearing and shaft surfaces. Additional testing methods, such as the monitoring of antioxidants, should be considered as well to fend off the potential for oxidation.
Secondly, the oil should be tested for wear materials and wear rates. It is important to consider wear rates and not just limitations on the quantity of wear elements. Wear rates provide a means to which the analysts can determine how severe a particular bearing problem is. This type of trending analysis is greatly improved by the sampling frequency (e.g. monthly sampling based on a 24 hour a day operation). The recommended testing for detecting wear is:
• Wear Elements: ASTM D5185 – The known wear elements of ASTM B23-00 Alloy 2 Babbitt material are known to be Tin, Antimony and Copper with an emphasis on Tin. The ICP spectrometer can be used to monitor the wear materials produced by the bearing in the range of 5um and below. It will reveal traces of these elements based on the percentage of each element in the Babbitt. In order to properly analyze the amount of wear that the bearing produces, it is important to track system top-offs and oil changes to accurately analyze wear patterns. Keep in mind wear particles greater than 5um are not detectible. If wear is suspected but not revealed through ICP, consider using large particle spectroscopy or analytical ferrography.
Finally, the oil should be tested routinely for contamination. Particulate, water, use of the wrong lubricant, process contamination and varnish can have detrimental effects on the health of the oil as well as the bearing. Most of these types of contaminants can be detected with the following tests:
• Particle Counts: ISO 4406– Performing particle counts are an extremely important part of proactively eliminating the potential wear mechanisms that lead to early bearing failure and/or shortening the health of the lubricant. Establishing ISO cleanliness levels and maintaining them with the proper filtration devices will improve the reliability of the bearing. Particle counts can also be used as good indicators of accelerated wear and possible filter bypass conditions.
• Karl Fischer: ASTM D6304 – Water concentration levels in oil are a primary cause of sludge buildup and increased oxidation rates. Maintaining water levels well below the oil’s saturation rate is important to reduce varnish and sludge buildup on bearings. Online water detection is preferred over KF when an oil system size and criticality warrants it.
• Elemental Analysis: ASTM D5185 – Elemental analysis has been mentioned twice for monitoring elemental additives and wear elements. ICP can also be a useful tool in detecting sources of contamination. It can serve as a good indicator of lubricant cross contamination and identify sources of internal and external contamination.
Varnish detection and mitigation has become an industry upon itself with the introduction of Group II base oils. Many of the routine tests used to monitor oil quality cannot detect varnish problems until it is too late. It has been a source of many bearing failures similar to the one mentioned later in this
tutorial. This section only deals with ways to discover the presence of varnish and not the mitigation of the problem. If varnish is discovered there are ways of treating the problem through special types of filtration. Ultimately, the source of the heat generation should be located to eliminate the problem. The following tests have shown promise in the early detection and the onset of varnishing.
• The potential for varnish build-up often correlates with a decrease in an oils antioxidant levels. Monitoring these levels have shown to provide a source of early detection. The monitoring of oxidation inhibitors (Amines & Phenols) can be accomplished with the use of FTIR and/or RULER. To perform these tests properly, it is important to provide a base line sample before monitoring depletion rates. Typical depletion limits are 25 to 50% of the baseline before a partial change out or a complete oil change out is required. The need for frequent change outs could be a key indicator there is an internal heat source causing the accelerated depletion of the antioxidants.
• QSA – If the presence of varnish already exists within the system, a well known test developed by Analysts Inc. can be used to detect the severity of the varnish or sludge that exists. Analysts Inc developed a color patch test (QSA) that correlates the contrast of a sample patch to a numerical severity of the varnish or sludge that plagues system. It also provides a patch weight that can be monitored and trended as well.
Before applying these practices, it is imperative that the physical act of obtaining a representative sample by a trained individual is accomplished. If this is ignored, much of the data gathered will be misleading in performing a final diagnosis. To determine the best location for sampling a bearing, the method of oil application must be understood. (e.g. In force fed systems it is best practice to set up a primary and secondary sample point. The primary sample point should be located on the common oil return line before it empties into the oil reservoir. The secondary sample point should be located on the dedicated return line of each bearing to further narrow down wear and contamination related problems).
Much of the analysis data stated above is geared around building a primary testing slate for routine testing. Secondary test methods may be required to further troubleshoot negative sample results.
Bearing temperature
This is probably the most critical indicator of bearing
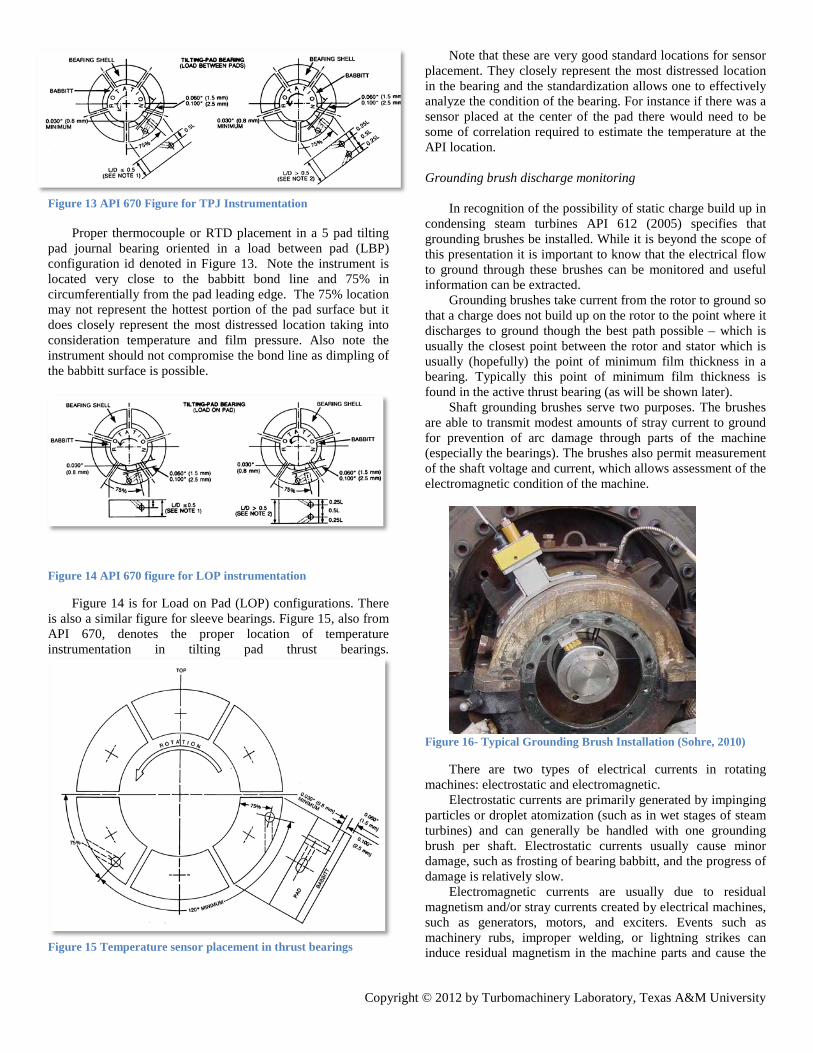
health. As pointed out in the babbitt section above babbitt loses strength at elevated temperatures so it is best to keep bearings running cool. As will be presented later one can take a known temperature and calculate an estimated maximum oil film pressure and then compare that pressure to the strength of the babbitt at that temperature. The location of the temperature sensors is also important; it is not necessary to know the point in the bearing of maximum temperature but it is important to know the temperature at the most distressed location. The most distressed location is determined by analysis of the temperature coupled with the applied hydrodynamic pressure. Because of this understanding API 670 specifies very good locations for temperature sensor placement.
Copyright © 2012 by Turbomachinery Laboratory, Texas A&M University
Figure 13 API 670 Figure for TPJ Instrumentation Proper thermocouple or RTD placement in a 5 pad tilting
pad journal bearing oriented in a load between pad (LBP) configuration id denoted in Figure 13. Note the instrument is located very close to the babbitt bond line and 75% in circumferentially from the pad leading edge. The 75% location may not represent the hottest portion of the pad surface but it does closely represent the most distressed location taking into consideration temperature and film pressure. Also note the instrument should not compromise the bond line as dimpling of the babbitt surface is possible.
Figure 14 API 670 figure for LOP instrumentation
Figure 14 is for Load on Pad (LOP) configurations. There is also a similar figure for sleeve bearings. Figure 15, also from API 670, denotes the proper location of temperature instrumentation in tilting pad thrust bearings.
Figure 15 Temperature sensor placement in thrust bearings
Note that these are very good standard locations for sensor placement. They closely represent the most distressed location in the bearing and the standardization allows one to effectively analyze the condition of the bearing. For instance if there was a sensor placed at the center of the pad there would need to be some of correlation required to estimate the temperature at the API location.
Grounding brush discharge monitoring
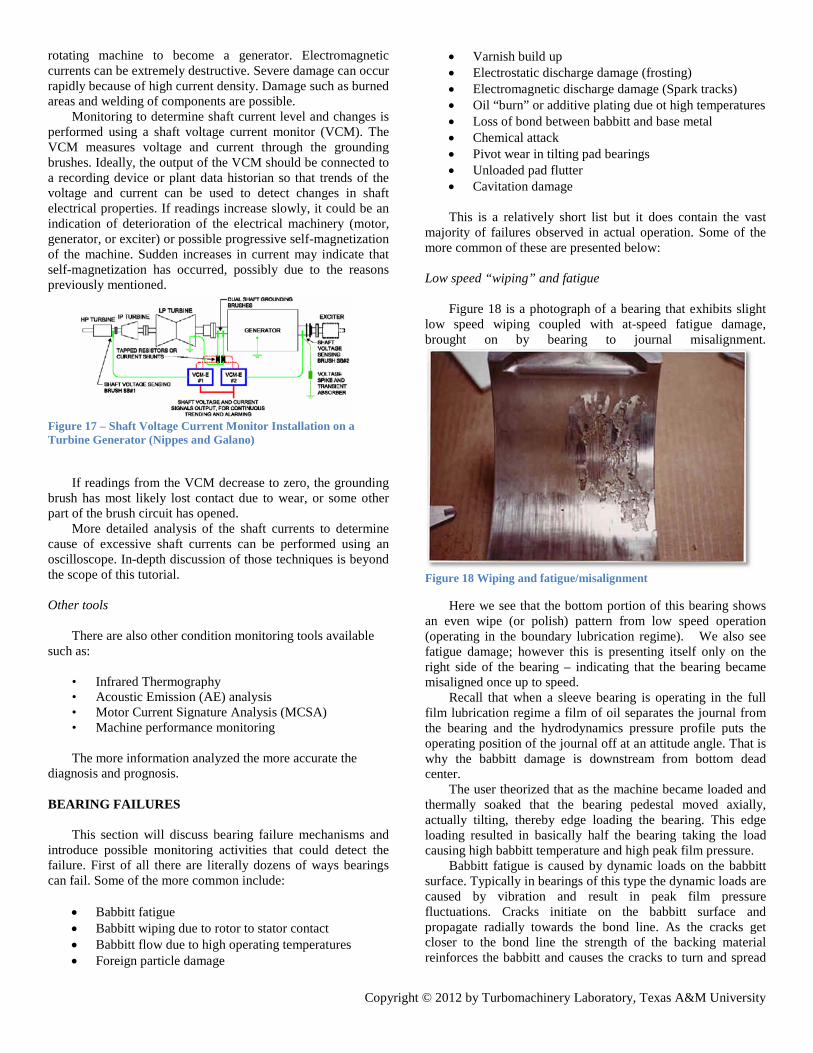
In recognition of the possibility of static charge build up in
condensing steam turbines API 612 (2005) specifies that grounding brushes be installed. While it is beyond the scope of this presentation it is important to know that the electrical flow to ground through these brushes can be monitored and useful information can be extracted.
Grounding brushes take current from the rotor to ground so that a charge does not build up on the rotor to the point where it discharges to ground though the best path possible – which is usually the closest point between the rotor and stator which is usually (hopefully) the point of minimum film thickness in a bearing. Typically this point of minimum film thickness is found in the active thrust bearing (as will be shown later).
Shaft grounding brushes serve two purposes. The brushes are able to transmit modest amounts of stray current to ground for prevention of arc damage through parts of the machine (especially the bearings). The brushes also permit measurement of the shaft voltage and current, which allows assessment of the electromagnetic condition of the machine.
Figure 16- Typical Grounding Brush Installation (Sohre, 2010)
There are two types of electrical currents in rotating machines: electrostatic and electromagnetic.
Electrostatic currents are primarily generated by impinging particles or droplet atomization (such as in wet stages of steam turbines) and can generally be handled with one grounding brush per shaft. Electrostatic currents usually cause minor damage, such as frosting of bearing babbitt, and the progress of damage is relatively slow.
Electromagnetic currents are usually due to residual magnetism and/or stray currents created by electrical machines, such as generators, motors, and exciters. Events such as machinery rubs, improper welding, or lightning strikes can induce residual magnetism in the machine parts and cause the
Copyright © 2012 by Turbomachinery Laboratory, Texas A&M University
rotating machine to become a generator. Electromagnetic currents can be extremely destructive. Severe damage can occur rapidly because of high current density. Damage such as burned areas and welding of components are possible.
Monitoring to determine shaft current level and changes is performed using a shaft voltage current monitor (VCM). The VCM measures voltage and current through the grounding brushes. Ideally, the output of the VCM should be connected to a recording device or plant data historian so that trends of the voltage and current can be used to detect changes in shaft electrical properties. If readings increase slowly, it could be an indication of deterioration of the electrical machinery (motor, generator, or exciter) or possible progressive self-magnetization of the machine. Sudden increases in current may indicate that self-magnetization has occurred, possibly due to the reasons previously mentioned.
Figure 17 – Shaft Voltage Current Monitor Installation on a Turbine Generator (Nippes and Galano)
If readings from the VCM decrease to zero, the grounding
brush has most likely lost contact due to wear, or some other part of the brush circuit has opened.
More detailed analysis of the shaft currents to determine cause of excessive shaft currents can be performed using an oscilloscope. In-depth discussion of those techniques is beyond the scope of this tutorial.
Other tools
There are also other condition monitoring tools available
such as: • Infrared Thermography • Acoustic Emission (AE) analysis • Motor Current Signature Analysis (MCSA) • Machine performance monitoring The more information analyzed the more accurate the
diagnosis and prognosis.
BEARING FAILURES This section will discuss bearing failure mechanisms and
introduce possible monitoring activities that could detect the failure. First of all there are literally dozens of ways bearings can fail. Some of the more common include:
• Babbitt fatigue • Babbitt wiping due to rotor to stator contact • Babbitt flow due to high operating temperatures • Foreign particle damage
• Varnish build up • Electrostatic discharge damage (frosting) • Electromagnetic discharge damage (Spark tracks) • Oil “burn” or additive plating due ot high temperatures • Loss of bond between babbitt and base metal • Chemical attack • Pivot wear in tilting pad bearings • Unloaded pad flutter • Cavitation damage This is a relatively short list but it does contain the vast
majority of failures observed in actual operation. Some of the more common of these are presented below:
Low speed “wiping” and fatigue
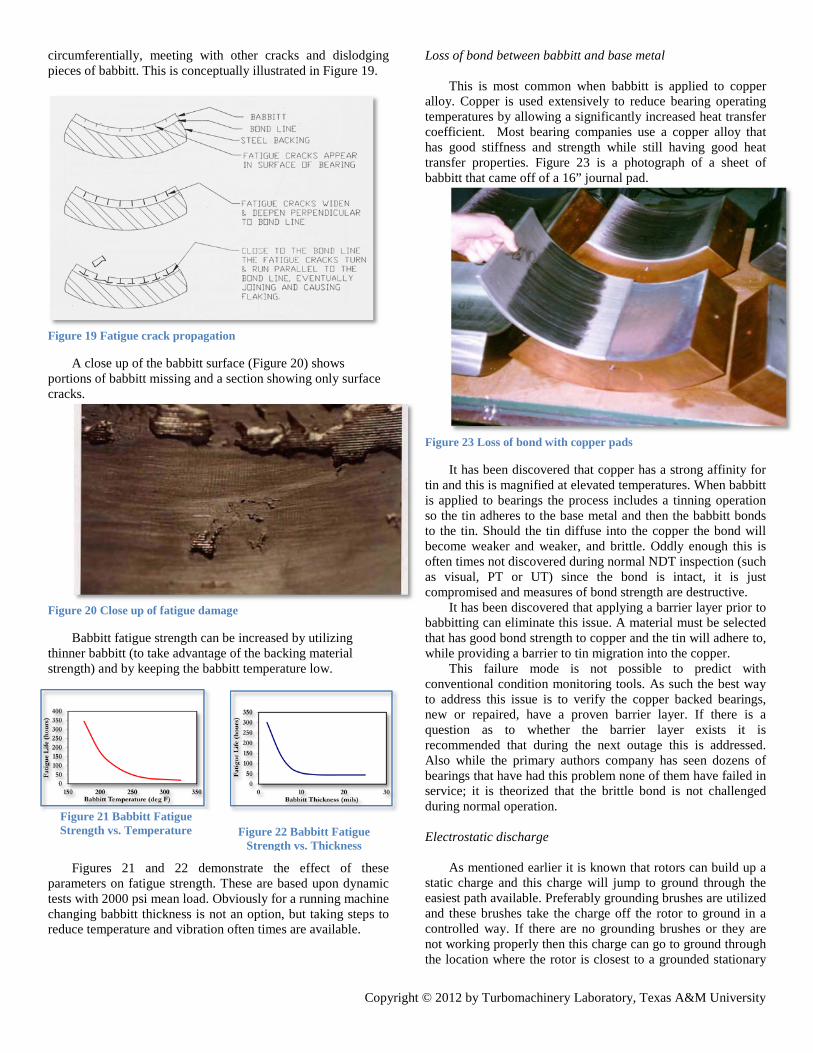
Figure 18 is a photograph of a bearing that exhibits slight
low speed wiping coupled with at-speed fatigue damage, brought on by bearing to journal misalignment.
Figure 18 Wiping and fatigue/misalignment
Here we see that the bottom portion of this bearing shows an even wipe (or polish) pattern from low speed operation (operating in the boundary lubrication regime). We also see fatigue damage; however this is presenting itself only on the right side of the bearing – indicating that the bearing became misaligned once up to speed.
Recall that when a sleeve bearing is operating in the full film lubrication regime a film of oil separates the journal from the bearing and the hydrodynamics pressure profile puts the operating position of the journal off at an attitude angle. That is why the babbitt damage is downstream from bottom dead center.
The user theorized that as the machine became loaded and thermally soaked that the bearing pedestal moved axially, actually tilting, thereby edge loading the bearing. This edge loading resulted in basically half the bearing taking the load causing high babbitt temperature and high peak film pressure.
Babbitt fatigue is caused by dynamic loads on the babbitt surface. Typically in bearings of this type the dynamic loads are caused by vibration and result in peak film pressure fluctuations. Cracks initiate on the babbitt surface and propagate radially towards the bond line. As the cracks get closer to the bond line the strength of the backing material reinforces the babbitt and causes the cracks to turn and spread
Copyright © 2012 by Turbomachinery Laboratory, Texas A&M University
circumferentially, meeting with other cracks and dislodging pieces of babbitt. This is conceptually illustrated in Figure 19.
Figure 19 Fatigue crack propagation
A close up of the babbitt surface (Figure 20) shows portions of babbitt missing and a section showing only surface cracks.
Figure 20 Close up of fatigue damage
Babbitt fatigue strength can be increased by utilizing thinner babbitt (to take advantage of the backing material strength) and by keeping the babbitt temperature low.
Figures 21 and 22 demonstrate the effect of these parameters on fatigue strength. These are based upon dynamic tests with 2000 psi mean load. Obviously for a running machine changing babbitt thickness is not an option, but taking steps to reduce temperature and vibration often times are available.
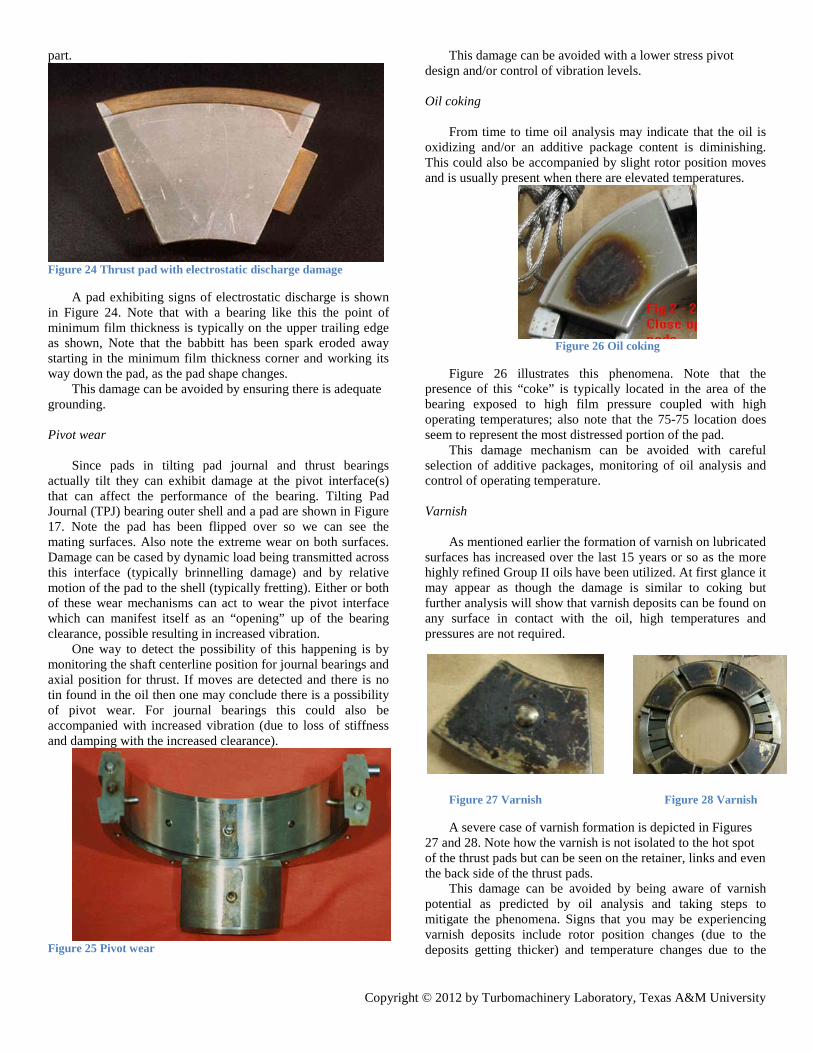
Loss of bond between babbitt and base metal This is most common when babbitt is applied to copper
alloy. Copper is used extensively to reduce bearing operating temperatures by allowing a significantly increased heat transfer coefficient. Most bearing companies use a copper alloy that has good stiffness and strength while still having good heat transfer properties. Figure 23 is a photograph of a sheet of babbitt that came off of a 16” journal pad.
Figure 23 Loss of bond with copper pads
It has been discovered that copper has a strong affinity for tin and this is magnified at elevated temperatures. When babbitt is applied to bearings the process includes a tinning operation so the tin adheres to the base metal and then the babbitt bonds to the tin. Should the tin diffuse into the copper the bond will become weaker and weaker, and brittle. Oddly enough this is often times not discovered during normal NDT inspection (such as visual, PT or UT) since the bond is intact, it is just compromised and measures of bond strength are destructive.
It has been discovered that applying a barrier layer prior to babbitting can eliminate this issue. A material must be selected that has good bond strength to copper and the tin will adhere to, while providing a barrier to tin migration into the copper.
This failure mode is not possible to predict with conventional condition monitoring tools. As such the best way to address this issue is to verify the copper backed bearings, new or repaired, have a proven barrier layer. If there is a question as to whether the barrier layer exists it is recommended that during the next outage this is addressed. Also while the primary authors company has seen dozens of bearings that have had this problem none of them have failed in service; it is theorized that the brittle bond is not challenged during normal operation.
Electrostatic discharge
As mentioned earlier it is known that rotors can build up a
static charge and this charge will jump to ground through the easiest path available. Preferably grounding brushes are utilized and these brushes take the charge off the rotor to ground in a controlled way. If there are no grounding brushes or they are not working properly then this charge can go to ground through the location where the rotor is closest to a grounded stationary
Figure 21 Babbitt Fatigue Strength vs. Temperature Figure 22 Babbitt Fatigue
Strength vs. Thickness
Copyright © 2012 by Turbomachinery Laboratory, Texas A&M University
part.
Figure 24 Thrust pad with electrostatic discharge damage
A pad exhibiting signs of electrostatic discharge is shown in Figure 24. Note that with a bearing like this the point of minimum film thickness is typically on the upper trailing edge as shown, Note that the babbitt has been spark eroded away starting in the minimum film thickness corner and working its way down the pad, as the pad shape changes.
This damage can be avoided by ensuring there is adequate grounding. Pivot wear
Since pads in tilting pad journal and thrust bearings
actually tilt they can exhibit damage at the pivot interface(s) that can affect the performance of the bearing. Tilting Pad Journal (TPJ) bearing outer shell and a pad are shown in Figure 17. Note the pad has been flipped over so we can see the mating surfaces. Also note the extreme wear on both surfaces. Damage can be cased by dynamic load being transmitted across this interface (typically brinnelling damage) and by relative motion of the pad to the shell (typically fretting). Either or both of these wear mechanisms can act to wear the pivot interface which can manifest itself as an “opening” up of the bearing clearance, possible resulting in increased vibration.
One way to detect the possibility of this happening is by monitoring the shaft centerline position for journal bearings and axial position for thrust. If moves are detected and there is no tin found in the oil then one may conclude there is a possibility of pivot wear. For journal bearings this could also be accompanied with increased vibration (due to loss of stiffness and damping with the increased clearance).
Figure 25 Pivot wear
This damage can be avoided with a lower stress pivot design and/or control of vibration levels.
Oil coking
From time to time oil analysis may indicate that the oil is
oxidizing and/or an additive package content is diminishing. This could also be accompanied by slight rotor position moves and is usually present when there are elevated temperatures.
Figure 26 Oil coking
Figure 26 illustrates this phenomena. Note that the presence of this “coke” is typically located in the area of the bearing exposed to high film pressure coupled with high operating temperatures; also note that the 75-75 location does seem to represent the most distressed portion of the pad.
This damage mechanism can be avoided with careful selection of additive packages, monitoring of oil analysis and control of operating temperature. Varnish
As mentioned earlier the formation of varnish on lubricated
surfaces has increased over the last 15 years or so as the more highly refined Group II oils have been utilized. At first glance it may appear as though the damage is similar to coking but further analysis will show that varnish deposits can be found on any surface in contact with the oil, high temperatures and pressures are not required.
Figure 27 Varnish Figure 28 Varnish
A severe case of varnish formation is depicted in Figures 27 and 28. Note how the varnish is not isolated to the hot spot of the thrust pads but can be seen on the retainer, links and even the back side of the thrust pads.
This damage can be avoided by being aware of varnish potential as predicted by oil analysis and taking steps to mitigate the phenomena. Signs that you may be experiencing varnish deposits include rotor position changes (due to the deposits getting thicker) and temperature changes due to the
Copyright © 2012 by Turbomachinery Laboratory, Texas A&M University
insulating behavior of the deposits and the thickness of the deposits resulting in reduced clearances.
Note that even worse side effects could be found where the oil is used for other purposes in the machine (such as servo valves, etc). In these cases the tacky varnish coated surfaces can result in “sticky” operation of the components in question.
ROBUST BEARING DESIGN
Case study 1
This case study involves a large centrifugal compressor in
charge gas service in an ethylene plant. The unit was running fine when a power outage shut the plant down. The train came down fine but when brought back up it was noted that one bearing exhibited high levels of vibration.
This is the low pressure “A” case compressor located between the steam turbine driver and a gearbox which drives the medium pressure “B” case compressor. Alarm and trip levels were set to 3 and 5 mils respectively, and the compressor normally runs around 4750 rpm. The bearing in question is a 6” 5 pad LBP bearing with an L/D ratio of 0.5 loaded to 225 psi.
The low pressure compressor outboard bearing vibration had increased from under 1 mil of vibration pre-outage to over 4 mils vibration after coming back up; this vibration was substantially synchronous, had a forward precession, a round orbit and was speed dependant, there was also a slight phase shift. All of this (and other data, history and condition analysis) pointed to a balance condition change on that end of the machine.
There was a lot of speculation on how the rotor became unbalanced however rotor dynamic analysis indicated only a coupling unbalance (or other similar synchronous forcing function) could cause the vibration levels observed.
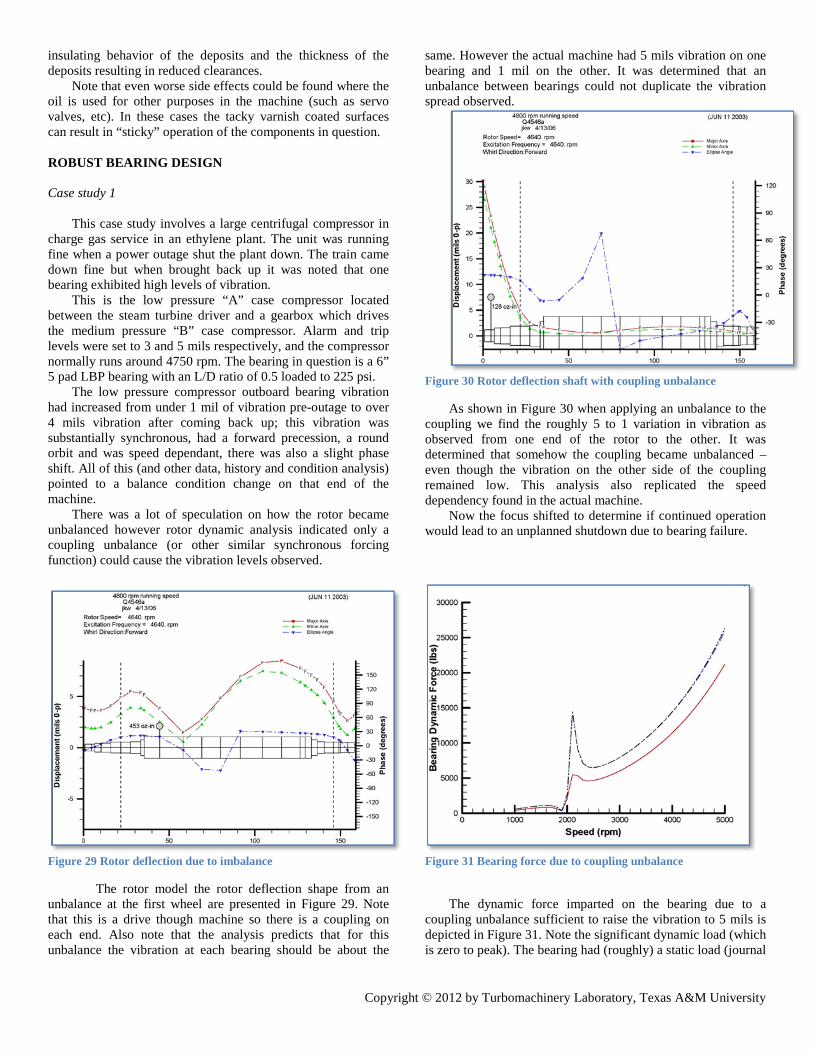
Figure 29 Rotor deflection due to imbalance
The rotor model the rotor deflection shape from an unbalance at the first wheel are presented in Figure 29. Note that this is a drive though machine so there is a coupling on each end. Also note that the analysis predicts that for this unbalance the vibration at each bearing should be about the
same. However the actual machine had 5 mils vibration on one bearing and 1 mil on the other. It was determined that an unbalance between bearings could not duplicate the vibration spread observed.
Figure 30 Rotor deflection shaft with coupling unbalance
As shown in Figure 30 when applying an unbalance to the coupling we find the roughly 5 to 1 variation in vibration as observed from one end of the rotor to the other. It was determined that somehow the coupling became unbalanced – even though the vibration on the other side of the coupling remained low. This analysis also replicated the speed dependency found in the actual machine.
Now the focus shifted to determine if continued operation would lead to an unplanned shutdown due to bearing failure.
Figure 31 Bearing force due to coupling unbalance
The dynamic force imparted on the bearing due to a
coupling unbalance sufficient to raise the vibration to 5 mils is depicted in Figure 31. Note the significant dynamic load (which is zero to peak). The bearing had (roughly) a static load (journal
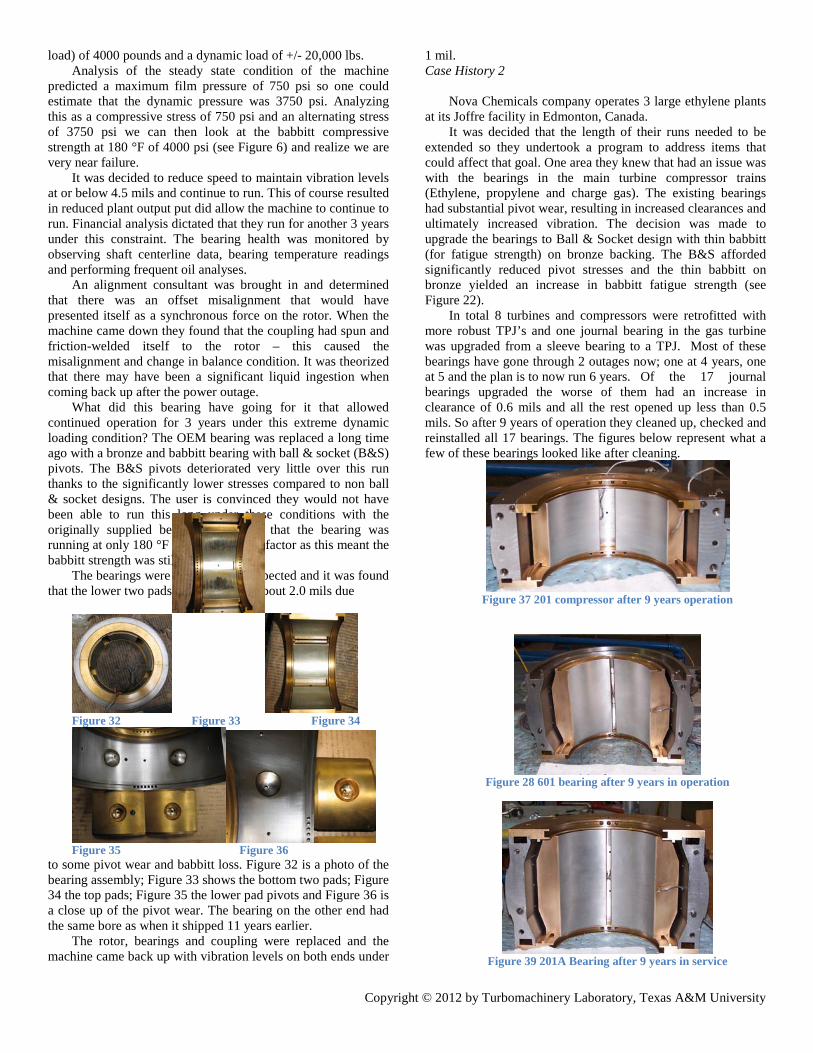
Copyright © 2012 by Turbomachinery Laboratory, Texas A&M University
load) of 4000 pounds and a dynamic load of +/- 20,000 lbs. Analysis of the steady state condition of the machine
predicted a maximum film pressure of 750 psi so one could estimate that the dynamic pressure was 3750 psi. Analyzing this as a compressive stress of 750 psi and an alternating stress of 3750 psi we can then look at the babbitt compressive strength at 180 °F of 4000 psi (see Figure 6) and realize we are very near failure.
It was decided to reduce speed to maintain vibration levels at or below 4.5 mils and continue to run. This of course resulted in reduced plant output put did allow the machine to continue to run. Financial analysis dictated that they run for another 3 years under this constraint. The bearing health was monitored by observing shaft centerline data, bearing temperature readings and performing frequent oil analyses.
An alignment consultant was brought in and determined that there was an offset misalignment that would have presented itself as a synchronous force on the rotor. When the machine came down they found that the coupling had spun and friction-welded itself to the rotor – this caused the misalignment and change in balance condition. It was theorized that there may have been a significant liquid ingestion when coming back up after the power outage.
What did this bearing have going for it that allowed continued operation for 3 years under this extreme dynamic loading condition? The OEM bearing was replaced a long time ago with a bronze and babbitt bearing with ball & socket (B&S) pivots. The B&S pivots deteriorated very little over this run thanks to the significantly lower stresses compared to non ball & socket designs. The user is convinced they would not have been able to run this long under these conditions with the originally supplied bearings. The fact that the bearing was running at only 180 °F was also a major factor as this meant the babbitt strength was still relatively high.
The bearings were removed and inspected and it was found that the lower two pads had opened up about 2.0 mils due
Figure 32 Figure 33 Figure 34
Figure 35 Figure 36
to some pivot wear and babbitt loss. Figure 32 is a photo of the bearing assembly; Figure 33 shows the bottom two pads; Figure 34 the top pads; Figure 35 the lower pad pivots and Figure 36 is a close up of the pivot wear. The bearing on the other end had the same bore as when it shipped 11 years earlier.
The rotor, bearings and coupling were replaced and the machine came back up with vibration levels on both ends under
1 mil. Case History 2
Nova Chemicals company operates 3 large ethylene plants
at its Joffre facility in Edmonton, Canada. It was decided that the length of their runs needed to be
extended so they undertook a program to address items that could affect that goal. One area they knew that had an issue was with the bearings in the main turbine compressor trains (Ethylene, propylene and charge gas). The existing bearings had substantial pivot wear, resulting in increased clearances and ultimately increased vibration. The decision was made to upgrade the bearings to Ball & Socket design with thin babbitt (for fatigue strength) on bronze backing. The B&S afforded significantly reduced pivot stresses and the thin babbitt on bronze yielded an increase in babbitt fatigue strength (see Figure 22).
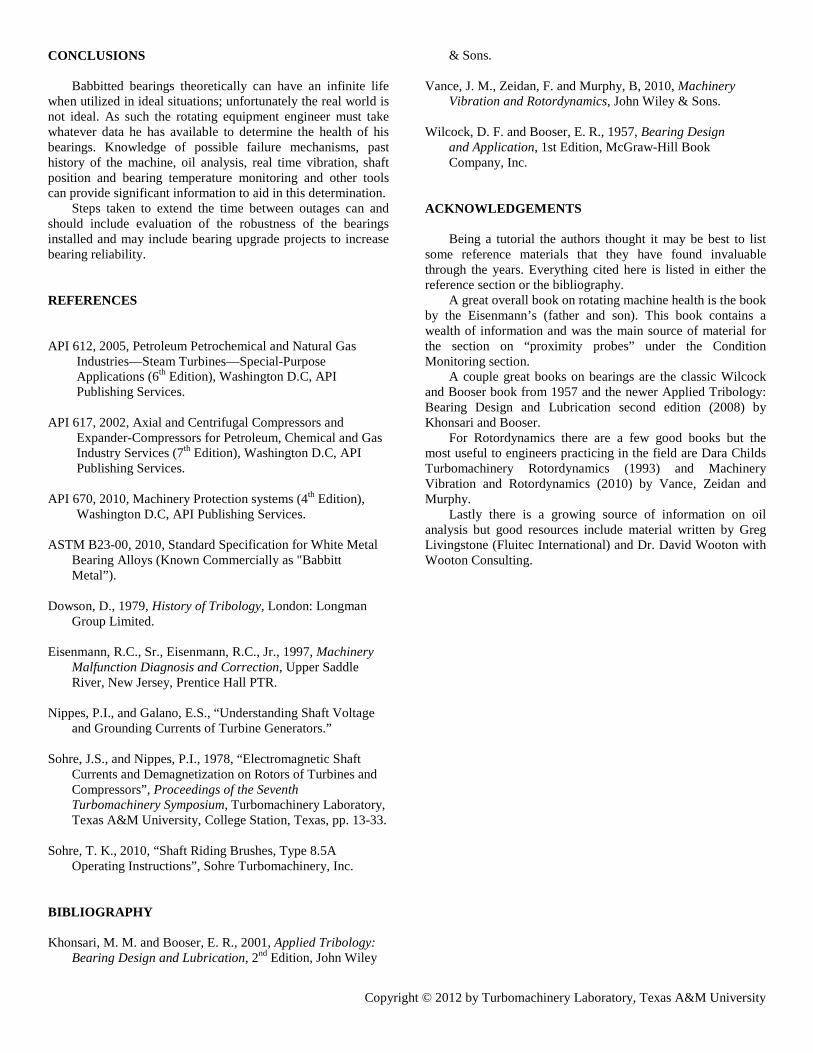
In total 8 turbines and compressors were retrofitted with more robust TPJ’s and one journal bearing in the gas turbine was upgraded from a sleeve bearing to a TPJ. Most of these bearings have gone through 2 outages now; one at 4 years, one at 5 and the plan is to now run 6 years. Of the 17 journal bearings upgraded the worse of them had an increase in clearance of 0.6 mils and all the rest opened up less than 0.5 mils. So after 9 years of operation they cleaned up, checked and reinstalled all 17 bearings. The figures below represent what a few of these bearings looked like after cleaning.
Figure 37 201 compressor after 9 years operation
Figure 28 601 bearing after 9 years in operation
Figure 39 201A Bearing after 9 years in service
Copyright © 2012 by Turbomachinery Laboratory, Texas A&M University
CONCLUSIONS Babbitted bearings theoretically can have an infinite life
when utilized in ideal situations; unfortunately the real world is not ideal. As such the rotating equipment engineer must take whatever data he has available to determine the health of his bearings. Knowledge of possible failure mechanisms, past history of the machine, oil analysis, real time vibration, shaft position and bearing temperature monitoring and other tools can provide significant information to aid in this determination.
Steps taken to extend the time between outages can and should include evaluation of the robustness of the bearings installed and may include bearing upgrade projects to increase bearing reliability. REFERENCES API 612, 2005, Petroleum Petrochemical and Natural Gas
Industries—Steam Turbines—Special-Purpose Applications (6th Edition), Washington D.C, API Publishing Services.
API 617, 2002, Axial and Centrifugal Compressors and
Expander-Compressors for Petroleum, Chemical and Gas Industry Services (7th Edition), Washington D.C, API Publishing Services.
API 670, 2010, Machinery Protection systems (4th Edition),
Washington D.C, API Publishing Services. ASTM B23-00, 2010, Standard Specification for White Metal
Bearing Alloys (Known Commercially as "Babbitt Metal”).
Dowson, D., 1979, History of Tribology, London: Longman
Group Limited. Eisenmann, R.C., Sr., Eisenmann, R.C., Jr., 1997, Machinery
Malfunction Diagnosis and Correction, Upper Saddle River, New Jersey, Prentice Hall PTR.
Nippes, P.I., and Galano, E.S., “Understanding Shaft Voltage
and Grounding Currents of Turbine Generators.” Sohre, J.S., and Nippes, P.I., 1978, “Electromagnetic Shaft
Currents and Demagnetization on Rotors of Turbines and Compressors”, Proceedings of the Seventh Turbomachinery Symposium, Turbomachinery Laboratory, Texas A&M University, College Station, Texas, pp. 13-33.
Sohre, T. K., 2010, “Shaft Riding Brushes, Type 8.5A
Operating Instructions”, Sohre Turbomachinery, Inc. BIBLIOGRAPHY Khonsari, M. M. and Booser, E. R., 2001, Applied Tribology:
Bearing Design and Lubrication, 2nd Edition, John Wiley
& Sons. Vance, J. M., Zeidan, F. and Murphy, B, 2010, Machinery
Vibration and Rotordynamics, John Wiley & Sons. Wilcock, D. F. and Booser, E. R., 1957, Bearing Design and Application, 1st Edition, McGraw-Hill Book
Company, Inc. ACKNOWLEDGEMENTS
Being a tutorial the authors thought it may be best to list some reference materials that they have found invaluable through the years. Everything cited here is listed in either the reference section or the bibliography.
A great overall book on rotating machine health is the book by the Eisenmann’s (father and son). This book contains a wealth of information and was the main source of material for the section on “proximity probes” under the Condition Monitoring section.
A couple great books on bearings are the classic Wilcock and Booser book from 1957 and the newer Applied Tribology: Bearing Design and Lubrication second edition (2008) by Khonsari and Booser.
For Rotordynamics there are a few good books but the most useful to engineers practicing in the field are Dara Childs Turbomachinery Rotordynamics (1993) and Machinery Vibration and Rotordynamics (2010) by Vance, Zeidan and Murphy.
Lastly there is a growing source of information on oil analysis but good resources include material written by Greg Livingstone (Fluitec International) and Dr. David Wooton with Wooton Consulting.