babies across borders: the political economy of ...babies across borders: the political economy of...
TRANSCRIPT
Babies across Borders: The Political Economy ofInternational Child Adoption
Asif Efratú David Leblang† Steven Liao‡ Sonal S. Pandya§
Abstract
This article sheds light on the determinants of international child adoption: a unique flow ofmigrants characterized by considerable transaction costs. We argue that adoption flows areshaped in part by the prospective adoptive parents’ desire to reduce those costs and ensurea successfully completed adoption. Drawing on dyadic panel data over the period 1991-2010,we fit a hurdle model to identify the impact of various influences that may make certainsending countries (un)attractive for prospective parents. Our analysis reveals that a nationalistexecutive deters adoption; so does an international agreement whose safeguards—intendedto ensure the integrity of adoption—might increase transaction costs. By contrast, a highregulatory quality, as well as familiarity with the sending country through colonial or migrantties, increase that country’s appeal. Our analysis advances the understanding of the impact oftransaction costs on transnational exchange and carries important implications for the studyof migration.
úAssistant Professor, Interdisciplinary Center (IDC) Herzliya. E-mail: [email protected].†Professor, Department of Politics, University of Virginia. E-mail: [email protected].‡Ph.D Candidate, Department of Politics, University of Virginia. E-mail: [email protected].§Assistant Professor, Department of Politics, University of Virginia. E-mail: [email protected].
1 IntroductionAmong the strongest bonds between citizens of di�erent countries are the bonds forgedby international child adoption: through adoption, parentless children born in one countryfind a new home in another. For some adoptive parents, international child adoption isa way to expand their families, while for others it fulfills a humanitarian impulse to carefor a child who would otherwise face a harsh and uncertain future in her birth country(Breuning 2013a). International child adoption, however, is emotionally fraught as well aslegally complex. Regardless of their motives, all prospective adoptive parents (PAPs) mustgo through an arduous and often unpredictable bureaucratic process. In the child’s countryof origin, the PAPs will have to interact with a bureaucracy that might be slow, ine�cient,or even corrupt; and they will have to meet the local adoption requirements—requirementsthat could be di�cult to satisfy and are subject to a sudden change. The emotional as well asfinancial costs of the process could run high, as the recent experience of PAPs in Guatemala,Russia, and China attests. The shutdown of international adoption in Guatemala followingevidence of irregularities, the enactment of a ban on the adoption of Russian children byU.S. citizens, and the growing stringency of adoption requirements in China have all madeadoption from these countries more di�cult and uncertain or even impossible (Herszenhorn2012; Swarns 2012; Voigt and Brown 2013).
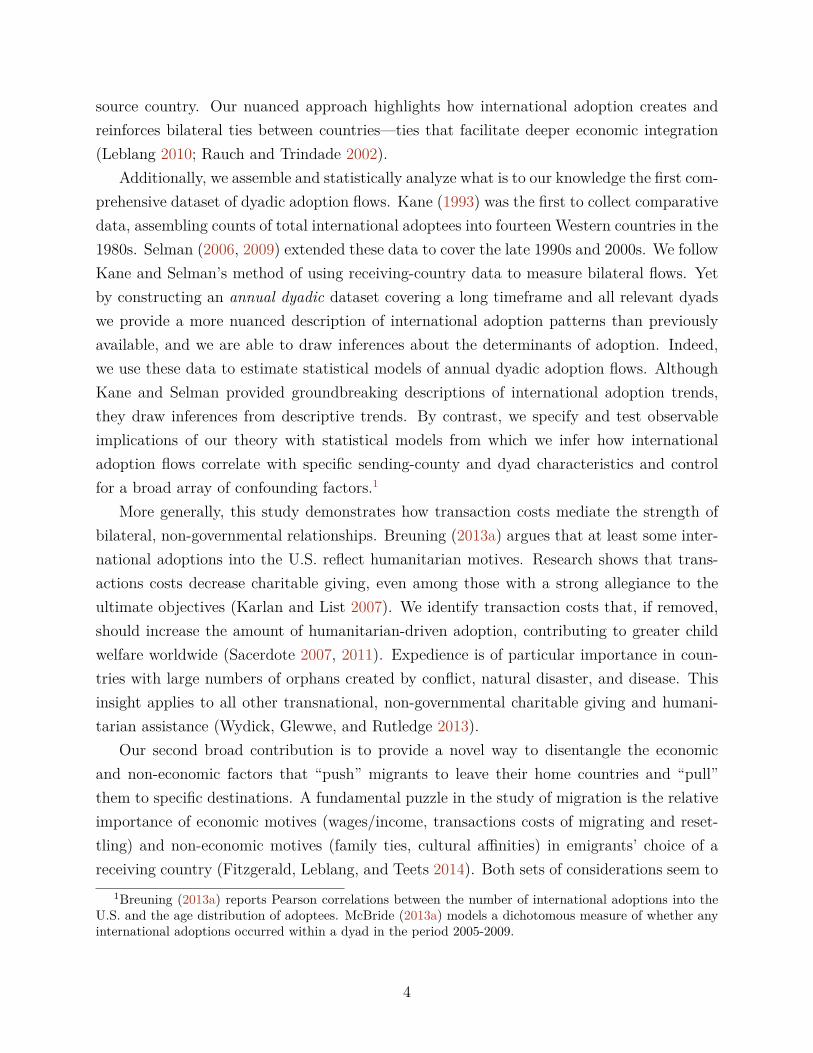
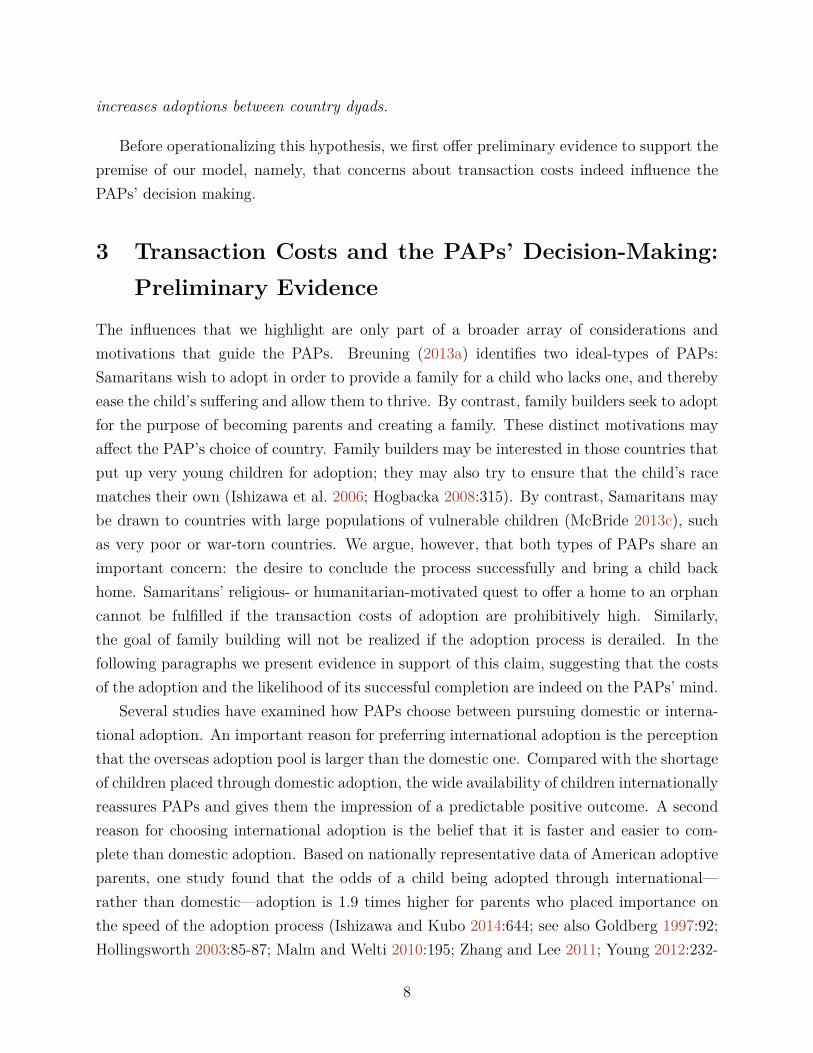
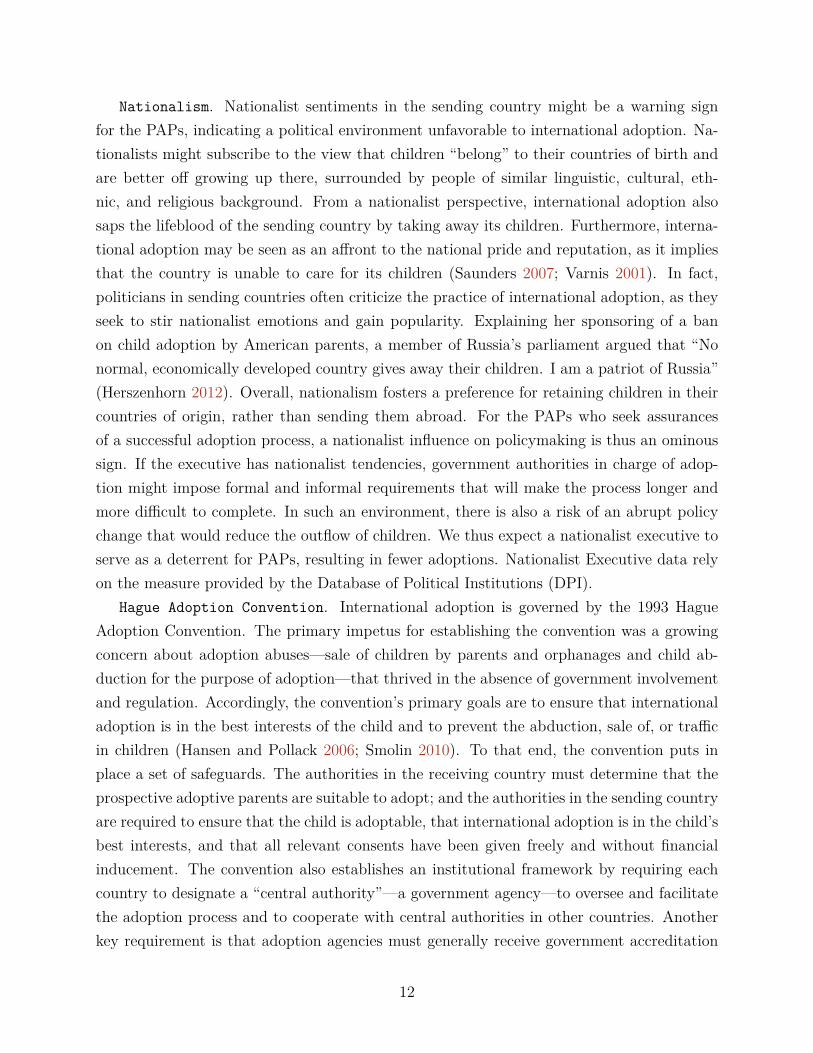
When deciding from which country to adopt, how do PAPs reconcile their decidedlyemotional motives with the significant costs and potentially great uncertainty they often face?International adoption patterns do not suggest a clear answer. Figure 1 illustrates bilateraladoption flows for the U.S., the world’s largest destination for international adoptees. Overthe period 1991-2010, Americans adopted 304,156 children from across 165 countries with thelargest numbers coming from China, Russia, and Guatemala. From these aggregate trendswe cannot parse the relative importance of transaction costs and uncertainty from PAPs’a�nities to certain countries and from sending-country factors that influence the number ofchildren available for adoption.
In this article, we analyze the role of transaction costs and uncertainty in shaping bilat-eral patterns of international adoption. We model adoption flows from the perspective ofthe PAPs, who seek to successfully navigate through the uncertain process of internationaladoption and fulfill their desire to adopt a child. We hypothesize that in selecting a countryfrom which to adopt, the PAPs will seek to reduce the uncertainty surrounding the adoptionprocess and raise the likelihood of success. Our analysis identifies several indicators that mayhelp PAPs dispel some of the uncertainty surrounding international adoption and facilitatethe process. Language commonality, colonial ties, and shorter distance between the sending
1
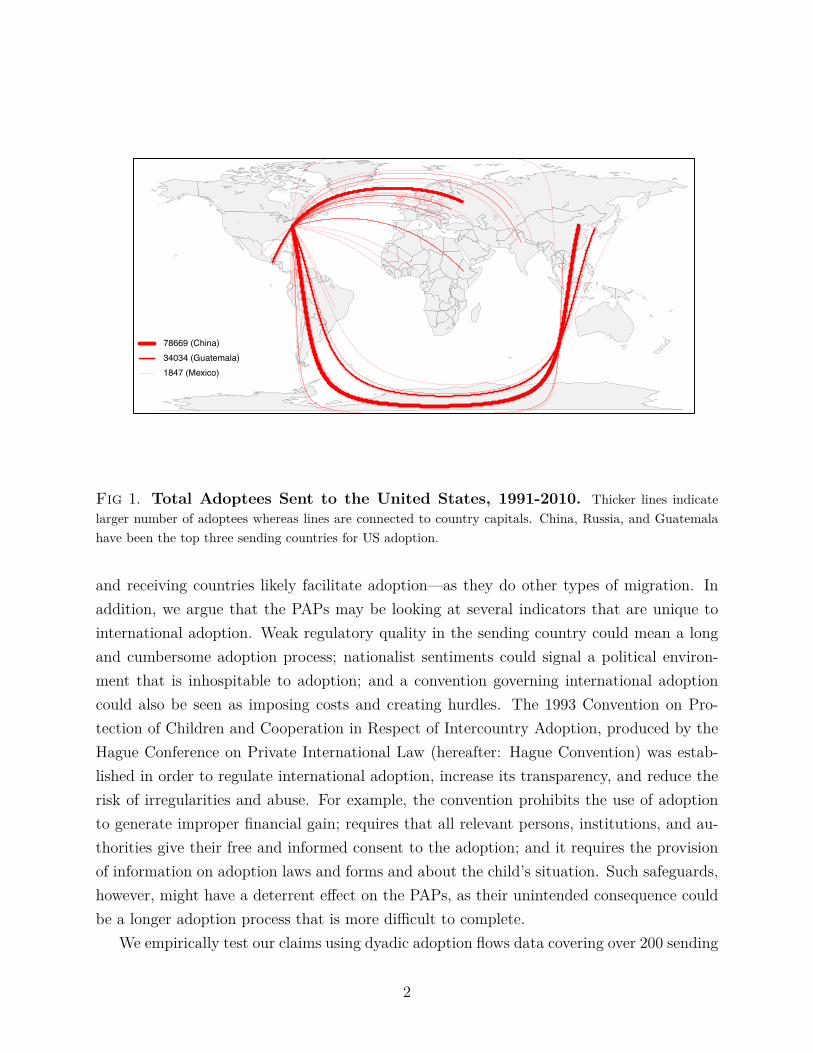
78669 (China)34034 (Guatemala)1847 (Mexico)
Fig 1. Total Adoptees Sent to the United States, 1991-2010. Thicker lines indicatelarger number of adoptees whereas lines are connected to country capitals. China, Russia, and Guatemalahave been the top three sending countries for US adoption.
and receiving countries likely facilitate adoption—as they do other types of migration. Inaddition, we argue that the PAPs may be looking at several indicators that are unique tointernational adoption. Weak regulatory quality in the sending country could mean a longand cumbersome adoption process; nationalist sentiments could signal a political environ-ment that is inhospitable to adoption; and a convention governing international adoptioncould also be seen as imposing costs and creating hurdles. The 1993 Convention on Pro-tection of Children and Cooperation in Respect of Intercountry Adoption, produced by theHague Conference on Private International Law (hereafter: Hague Convention) was estab-lished in order to regulate international adoption, increase its transparency, and reduce therisk of irregularities and abuse. For example, the convention prohibits the use of adoptionto generate improper financial gain; requires that all relevant persons, institutions, and au-thorities give their free and informed consent to the adoption; and it requires the provisionof information on adoption laws and forms and about the child’s situation. Such safeguards,however, might have a deterrent e�ect on the PAPs, as their unintended consequence couldbe a longer adoption process that is more di�cult to complete.
We empirically test our claims using dyadic adoption flows data covering over 200 sending
2
countries and entities and 19 receiving countries for the 1991-2010 period. By fitting a setof hurdle models we model both the probability of any cross-border adoption between twocountries in a given year and, conditional on the presence of adoptions, the annual numberof adoptions. All models include a wide range of controls related to the number and healthof children who are potentially available for adoption.
Consistent with our claims, we find that sending countries with greater nationalist senti-ment, or dyads that have the Hague Adoption Convention in force, are less likely to engagein dyadic adoption and have fewer dyadic adoptions. Dyads with an extensive history ofdyadic adoptions adopt from each other with both higher probabilities and counts. Finally,while regulatory quality increases the probability of dyadic adoptions, we find that it de-creases the total number of dyadic adoptions, suggesting that better regulations may filterout some of the illegitimate adoptions. The results are robust to several alternative models(e.g. Poisson, negative binomial, or zero-inflated negative binomial) and covariate indicators(e.g. governance quality and nationalism).
This research makes two broad scholarly contributions. First, we build on existing schol-arship to conduct the first comprehensive statistical analysis of worldwide dyadic adoptionflows. While there is scholarly interest in international adoption in disciplines like socialwork, sociology, and anthropology (Briggs 2012; Dubinsky 2010; Kim 2010; Roby and Shaw2006), political economy scholarship is limited. With a couple of exceptions (Breuning 2013a;McBride 2013a), extant political economy research focuses on cross-country variation in na-tional policies regarding international adoption rather than patterns in the flows of adoptedchildren across borders. Analyzing the adoption laws of African countries, Breuning andIshiyama (2009) find that a stronger connection with the global economy increases the open-ness to international adoption. Studying adoption legislation worldwide, Breuning (2013b)finds that a large orphan population is associated with greater openness to internationaladoption, whereas women’s participation in political decision-making corresponds with lessopenness. McBride (2013a,b) emphasizes the role of international policy di�usion, amongother factors, in shaping national adoption policies.
Our theoretical and empirical analysis incorporates into a bilateral framework some of thefactors that Breuning, Ishiyama, and McBride included in their above-referenced studies—factors such as the Hague Convention, Islam, and the size of the adoption-relevant popula-tion. Our emphasis on bilateral flows captures a range of salient dyad characteristics (i.e.,both the demand and supply of international adoption) that mediate openness to adoptionoutflows. For instance, as we show, countries with a weak regulatory quality are typicallyless attractive source countries since dealing with them involves high transaction costs; yetoverseas diasporas may be less deterred by these costs, given their deep familiarity with the
3
source country. Our nuanced approach highlights how international adoption creates andreinforces bilateral ties between countries—ties that facilitate deeper economic integration(Leblang 2010; Rauch and Trindade 2002).
Additionally, we assemble and statistically analyze what is to our knowledge the first com-prehensive dataset of dyadic adoption flows. Kane (1993) was the first to collect comparativedata, assembling counts of total international adoptees into fourteen Western countries in the1980s. Selman (2006, 2009) extended these data to cover the late 1990s and 2000s. We followKane and Selman’s method of using receiving-country data to measure bilateral flows. Yetby constructing an annual dyadic dataset covering a long timeframe and all relevant dyadswe provide a more nuanced description of international adoption patterns than previouslyavailable, and we are able to draw inferences about the determinants of adoption. Indeed,we use these data to estimate statistical models of annual dyadic adoption flows. AlthoughKane and Selman provided groundbreaking descriptions of international adoption trends,they draw inferences from descriptive trends. By contrast, we specify and test observableimplications of our theory with statistical models from which we infer how internationaladoption flows correlate with specific sending-county and dyad characteristics and controlfor a broad array of confounding factors.1
More generally, this study demonstrates how transaction costs mediate the strength ofbilateral, non-governmental relationships. Breuning (2013a) argues that at least some inter-national adoptions into the U.S. reflect humanitarian motives. Research shows that trans-actions costs decrease charitable giving, even among those with a strong allegiance to theultimate objectives (Karlan and List 2007). We identify transaction costs that, if removed,should increase the amount of humanitarian-driven adoption, contributing to greater childwelfare worldwide (Sacerdote 2007, 2011). Expedience is of particular importance in coun-tries with large numbers of orphans created by conflict, natural disaster, and disease. Thisinsight applies to all other transnational, non-governmental charitable giving and humani-tarian assistance (Wydick, Glewwe, and Rutledge 2013).
Our second broad contribution is to provide a novel way to disentangle the economicand non-economic factors that “push” migrants to leave their home countries and “pull”them to specific destinations. A fundamental puzzle in the study of migration is the relativeimportance of economic motives (wages/income, transactions costs of migrating and reset-tling) and non-economic motives (family ties, cultural a�nities) in emigrants’ choice of areceiving country (Fitzgerald, Leblang, and Teets 2014). Both sets of considerations seem to
1Breuning (2013a) reports Pearson correlations between the number of international adoptions into theU.S. and the age distribution of adoptees. McBride (2013a) models a dichotomous measure of whether anyinternational adoptions occurred within a dyad in the period 2005-2009.
4
matter, but disentangling them is di�cult because ostensibly non-economic factors influenceeconomic calculations. For example, family and cultural networks furnish information aboutthe costs of migration and local labor market conditions (Massey et al. 1999).
Cross-border child adoption is a unique form of migration that allows us to hold fixed thelabor market motives for migration. The deeply emotional decision to adopt a child is quiteremoved from careful calculations about the child’s future labor market outcomes. Rather,it is a decision that reflects adoptive parents’ emotional and cultural a�nities to specificcountries, and often also social and religious values that inform the choice to adopt. Theinfluence of economic considerations should be the weakest of any form of migration. Cross-border adoption is also unique as a form of migration in that there are no strict visa limitsfor adopted children as is the case for most forms of immigration. By modeling cross-borderadoption flows we can assess the types of a�nities that produce distinct patterns in bilateralmigrant flows. Additionally, we pinpoint how ties between countries globalize the formationof households.
The remainder of this paper is divided into four parts. Section 2 develops our argu-ment related to the e�ect of uncertainty and transaction costs on both the likelihood andthe number of adoptions across country pairs. Section 3 o�ers preliminary evidence thatsupports the importance of transaction costs in PAPs’ decision-making. Section 4 containsour empirical work—descriptions of our variables, data, methods, findings, and robustnesschecks. Section 5 concludes.
2 Modeling Cross-Border Adoption Flows: Overcom-ing the Uncertainty of International Adoption
We model the determinants of international adoption from the point of view of the prospec-tive adoptive parents (PAPs), focusing on their choice of a country from which to adopt. Inthe United States, the typical PAPs are a white, college-educated, financially stable, marriedheterosexual couple (Hellerstedt et al. 2008). As the PAPs seek to adopt a child abroad,they embark on a di�cult process that involves significant transaction costs. Indeed, in-ternational adoption is not a commercial transaction: adoption regulation—at the nationaland international levels—seeks to ensure that adoption does not amount to the sale andpurchase of children. Nonetheless, noncommercial transactions—such as charitable giving—often involve certain ancillary costs (Knowles and Servatka 2013), and this is also the casewith international adoption. Beyond the fees charged by the adoption agency, the PAPs mayhave to incur various transaction costs, such as travel, lodging, and transportation expenses;
5
time spent away from work when traveling to the sending country; fees for the issuance, au-thentication, or translation of documents as well as oral translation services; foreign attorneyfee and foreign-court filing fee; and a required donation to the orphanage. These financialcosts rise the longer the adoption process drags on, and with them rise the emotional costsof the process: the anxiety and frustration of a continued wait.
At the beginning of the adoption process the PAPs are uncertain about the magnitudeof the transaction costs. While in some countries the process is relatively short and easy tonavigate, in others it might be longer and full of hurdles. One cause of this variation is thebureaucratic nature of adoption, which involves much paperwork and repeated contact witho�cials (Bartholet 1996:189-190). The authorities of the receiving country and those of thesending country must determine that the PAPs are suitable for adoption; the sending-countryauthorities must also determine that the child is without parents and thus adoptable. Aftermatching the PAPs with the child, the sending-country authorities carry out the procedurethat will lead to the termination of the birth parents’ rights and the completion of theadoption. The entire process in the sending country can be relatively smooth and e�cientor long and cumbersome, depending on how well-functioning the bureaucracy is. Whenthe bureaucracy is slow or unresponsive, or when the adoption process is poorly regulated,the PAPs will find it more di�cult to understand and satisfy the rules and requirementsof adoption, and the process will likely su�er delays. Additional bureaucratic requirementsimposed by an international agreement (discussed below) could make the process even morecomplex. While the PAPs may wish to ensure a thorough adoption process and a matchwith the “right” child, they are averse to wasteful costs and unnecessarily long waits.
Beyond bureaucratic-regulatory quality and o�cial requirements, the transaction costsof adoption are shaped by an influence that is less easily observable: the hospitability of thepolitical environment in the sending country, that is, whether the authorities are conduciveto international adoption and consider it a legitimate option for children. Certain sendingcountries, even if o�cially open to international adoption, may not, in fact, o�er the PAPsa conducive political environment. In those countries, international adoption may be thesubject of criticism, concern, and controversy for various reasons.
First, international adoption is seen as an admission of the country’s inability to care forits children (ibid.:184). Additionally, anti-adoption sentiments may be fueled by concernsover the care that the children receive in their adoptive homes. A recent example is theRussian outrage over the death of a Russian toddler who was forgotten in the car of his Vir-ginian adoptive father (Barry 2009). Yet another cause for concern is rumors and allegationsof irregularities, abuse, and fraud in international adoption. These can take various forms,such as “child buying,” that is, obtaining a child in exchange for financial rewards to the
6
birth family; obtaining children through pressure or deceit (e.g., promising birth families thatthe children are going away temporarily); and abducting children placed in orphanages andother institutions. Assessments of the overall magnitude of the problem vary tremendously.Critics of international adoption argue that abuses are pervasive and systemic: many, ifnot most, internationally adopted children are illegitimately obtained (Gra� 2008; Smolin2006). By contrast, defenders of international adoption claim that there is no hard evidenceto support such charges (Bartholet 2010). Yet when cases of fraud and abuse are revealed,adoption critics receive fresh ammunition, and the ensuing scandal could make internationaladoption more di�cult.
From the PAPs’ point of view, an inhospitable political environment, where internationaladoption meets resistance, is prone to high transaction costs. In such an environment, the au-thorities might be slow to process the adoption or could impose requirements that will makethe adoption more di�cult to complete. Furthermore, such an environment poses the riskof an abrupt policy change. In response to public criticism or following an adoption-abusescandal, governments might heighten their scrutiny of adoptions, impose various restrictions(such as age, marital, income, or residency requirements), suspend international adoptionor stop it entirely. For the PAPs, such changes to adoption laws and policies could meana longer, more expensive, and more onerous process—or one that cannot be completed. In2008, amid evidence of adoption irregularities and abuse, Guatemala shut down its interna-tional adoption process, leaving some 4000 American PAPs in limbo (Swarns 2012).
Yet the transaction costs of adoption are not only shaped by the capacity and attitude ofthe authorities of the sending country; they are also influenced by the PAPs’ own familiaritywith that country. Access to information about the sending country; a good cultural orlegal understanding of that country; fluency in the local language; and local contacts—allthese can facilitate the PAPs’ interaction with the adoption authorities and intermediaries,reduce the transaction costs of the adoption process, and raise the likelihood of its successfulcompletion. These factors, in fact, are not unique to adoption and may lower the transactioncosts of labor migration as well (e.g., Dustmann and Soest 2002).
In summary, the transaction costs of adoption have far-ranging implications for the PAPs’ability to realize their wish of adopting a child. As they embark on this uncertain process,the PAPs will typically try to lessen the degree of uncertainty and do their utmost to ensure apositive outcome. All else equal, they will prefer to adopt from a country where the adoptionprocess likely involves fewer hurdles and lower costs and where the prospects of its successfulcompletion are brighter. We summarize our hypothesis as follows:
Hypothesis 1: Holding all else equal, lower uncertainty and transaction costs of adoption
7
increases adoptions between country dyads.
Before operationalizing this hypothesis, we first o�er preliminary evidence to support thepremise of our model, namely, that concerns about transaction costs indeed influence thePAPs’ decision making.
3 Transaction Costs and the PAPs’ Decision-Making:Preliminary Evidence
The influences that we highlight are only part of a broader array of considerations andmotivations that guide the PAPs. Breuning (2013a) identifies two ideal-types of PAPs:Samaritans wish to adopt in order to provide a family for a child who lacks one, and therebyease the child’s su�ering and allow them to thrive. By contrast, family builders seek to adoptfor the purpose of becoming parents and creating a family. These distinct motivations maya�ect the PAP’s choice of country. Family builders may be interested in those countries thatput up very young children for adoption; they may also try to ensure that the child’s racematches their own (Ishizawa et al. 2006; Hogbacka 2008:315). By contrast, Samaritans maybe drawn to countries with large populations of vulnerable children (McBride 2013c), suchas very poor or war-torn countries. We argue, however, that both types of PAPs share animportant concern: the desire to conclude the process successfully and bring a child backhome. Samaritans’ religious- or humanitarian-motivated quest to o�er a home to an orphancannot be fulfilled if the transaction costs of adoption are prohibitively high. Similarly,the goal of family building will not be realized if the adoption process is derailed. In thefollowing paragraphs we present evidence in support of this claim, suggesting that the costsof the adoption and the likelihood of its successful completion are indeed on the PAPs’ mind.
Several studies have examined how PAPs choose between pursuing domestic or interna-tional adoption. An important reason for preferring international adoption is the perceptionthat the overseas adoption pool is larger than the domestic one. Compared with the shortageof children placed through domestic adoption, the wide availability of children internationallyreassures PAPs and gives them the impression of a predictable positive outcome. A secondreason for choosing international adoption is the belief that it is faster and easier to com-plete than domestic adoption. Based on nationally representative data of American adoptiveparents, one study found that the odds of a child being adopted through international—rather than domestic—adoption is 1.9 times higher for parents who placed importance onthe speed of the adoption process (Ishizawa and Kubo 2014:644; see also Goldberg 1997:92;Hollingsworth 2003:85-87; Malm and Welti 2010:195; Zhang and Lee 2011; Young 2012:232-
8
233). Overall, these studies reveal that the availability of children and the duration andspeed of the adoption process are of concern for PAPs. These considerations clearly influ-ence the initial choice of adoption type, motivating many of the PAPs to choose internationaladoption. It is thus reasonable to assume that similar concerns also influence the followingchoice, namely, the selection of a specific country from which to adopt. Thus, the distinctivecharacteristics of PAPs who pursue cross-border adoption suggest a special attentiveness totransaction costs.
Additional evidence comes from the State Department’s publicly available information oninternational adoption. The primary intended audience for this information is PAPs who areembarking on the process of adoption. To them, the State Department emphasizes that theprocess of adopting a child from a foreign country can be lengthy, complex, and expensive.Among the hurdles that State highlights is the foreign country’s adoption requirements, thenecessity of spending an extended period in the foreign country awaiting the completion ofthe adoption, the possibility of a sudden change to a country’s adoption laws, and the riskof adoption fraud (US Department of State 2014b). To help the PAPs navigate through theadoption process, the State Department website o�ers detailed, up-to-date information oneach country, including adoption eligibility requirements for the PAPs (such as residency orincome requirements) and an overview of the adoption process (including required documentsand fees and a typical time frame). The information also alerts the PAPs to specific pitfallsin the process and even to the unlikelihood of a successful adoption of in certain countries.For example, the State Department notes that “it is unlikely that a U.S. citizen will be ableto adopt a healthy, single child under the age of 5 years” in Brazil. Furthermore, the StateDepartment provides adoption statistics for each country: the annual number of childrenadopted from that country over the past 15 years.2 This past record allows the PAPs toevaluate the prospects of their own planned adoption. Similar adoption statistics are includedin the annual Intercountry Adoption Report that the State Department submits to Congress;the report also provides data on the average time required for completing an adoption indi�erent Hague-Convention countries and the median fees that such an adoption entails (USDepartment of State 2014a). Overall, the State Department’s publications recognize thatthe choice where to adopt is a key decision facing the PAPs; that the costs, duration, andlikelihood of success of the adoption process are major factors in this decision; and thatthese factors are shrouded with uncertainty. By providing detailed information, the StateDepartment seeks to dispel some of this uncertainty and help the PAPs make an informedchoice.3
2http://adoption.state.gov/index.php
3Some of the information is provided in direct response to PAPs’ queries. For example, the State Depart-ment highlights the di�culty of adopting children from Muslim countries, following “many inquiries from
9
Further evidence suggesting the prominence of costs in the adoption decision is the Adop-tion Tax Credit o�ered by the U.S. government since 1997 and made permanent in 2013: atax credit that adoptive parents may claim for adoption expenses, such as necessary adop-tion fees, court costs, and traveling expenses. This credit—applicable to both domestic andinternational adoptions—is based on the premise that adoption entails high administrativecosts that might act as a hurdle and a disincentive for adopting a child.4 The tax credit aimsto lower this financial disincentive and make adoption viable for more PAPs who might nothave been able to a�ord adoption otherwise.
Finally, the importance of e�ciency-related considerations is reflected in the many onlinesources devoted to international adoption, including websites of adoption agencies. Thesesources often alert PAPs to the significant waiting time and costs that international adoptioninvolves; they o�er information on the availability of children and the timeline to adoptionin di�erent countries and provide advice for easing the financial burden of the process.5
The evidence above suggests that concerns about the costs and duration of the adoptionprocess and the likelihood of its successful completion may indeed figure into the PAPs’choice of country. This does not imply that such concerns are the only or even primaryconsideration: PAPs may well have other reasons for choosing a country. We do argue,however, that all else equal, they will prefer to adopt from a country that o�ers the bestprospects of completing an adoption at an a�ordable cost.
A possible objection to this argument is that the PAPs’ choice of country is not entirelyfree, but guided and limited by adoption agencies. Indeed, PAPs almost always rely on adop-tion agencies as intermediaries that facilitate the adoption. We do recognize the importantintermediary role of adoption agencies, including by providing information and mitigatingthe uncertainty problem that this study highlights. Furthermore, the agencies themselveslower transaction costs through their knowledge, experience, and familiarity with the sendingcountry. Nonetheless, we assume that the PAPs’ choice of country is independent from—andoften precedes—their selection of an adoption agency. This is indeed the assumption madeby the State Department. The State Department identifies the PAPs as the actors choos-ing where to adopt and, as described above, o�ers information to facilitate their choice. InState’s understanding, this choice, in turn, will influence the selection of an adoption agency(US Department of State 2014b). The Department of Health & Human Services holds asimilar assumption: it o�ers PAPs a list of U.S. agencies that provide services in the country
American citizens who wish to adopt orphans from countries in which Shari’a Law is observed.”4“Landrieu Introduces Bill to Make Adoption More A�ordable,” press release issued by Senator Mary
Landrieu, September 21, 2012.5See, for example, http://www.adoption.org/adopt/cost-of-international-adoption.php.
10
from which they wish to adopt.6 Furthermore, adoption agencies share the PAP’s interest inensuring a successful and timely completion of the process. One reason is that the agenciesreceive part of their payment at the end of the process. Another reason is the agencies’reputation and perceived competence. When choosing an adoption agency, PAPs may wishto learn about the agency’s previous adoption placements and the percentage of those thatremained intact. U.S. agencies accredited under the Intercountry Adoption Act are indeedrequired to disclose such information upon the PAPs’ request.7 Adoption agencies thus havetheir own reasons to ensure a successfully completed adoption; if able to influence the choiceof country, they may steer prospective parents toward those countries where such an outcomeis more likely.
4 EmpiricsIn the following sections, we begin with a detailed discussion of adoption-related covariates,operationalization, and data sources. Next, we demonstrate patterns in international adop-tion flows with the dataset we compile, given that international adoption is a phenomenonunfamiliar to most IR scholars. We then discuss the models and methods used to fit ourdata and report the empirical findings. Finally, we discuss how robust our results are toalternative models and indicators.
4.1 Adoption’s Transaction Costs: Covariate Operationalizationand Data Sources
We identify several indicators that PAPs may be relying on in assessing the transactioncosts of adoption. These are divided into two groups: transaction-costs determinants thatare unique to international adoption and those that apply to migration broadly.
4.1.1 Influences Unique to Adoption
Regulatory Quality. Given the bureaucratic hurdles and pitfalls that international adop-tion involves and the risk of long delays, the regulatory quality of the bureaucracy in thesending country is of much concern for the PAPs. We hypothesize that PAPs would preferto adopt from a country with a high bureaucratic-regulatory quality, thereby lowering theexpected transaction costs of the process. Regulatory quality data rely on the indicatorprovided by the Worldwide Governance Indicator (WGI) database.
6https://www.childwelfare.gov/pubs/country_resource_lists.cfm.
722 CFR 96.39 - Information Disclosure and Quality Control Practices.
11
Nationalism. Nationalist sentiments in the sending country might be a warning signfor the PAPs, indicating a political environment unfavorable to international adoption. Na-tionalists might subscribe to the view that children “belong” to their countries of birth andare better o� growing up there, surrounded by people of similar linguistic, cultural, eth-nic, and religious background. From a nationalist perspective, international adoption alsosaps the lifeblood of the sending country by taking away its children. Furthermore, interna-tional adoption may be seen as an a�ront to the national pride and reputation, as it impliesthat the country is unable to care for its children (Saunders 2007; Varnis 2001). In fact,politicians in sending countries often criticize the practice of international adoption, as theyseek to stir nationalist emotions and gain popularity. Explaining her sponsoring of a banon child adoption by American parents, a member of Russia’s parliament argued that “Nonormal, economically developed country gives away their children. I am a patriot of Russia”(Herszenhorn 2012). Overall, nationalism fosters a preference for retaining children in theircountries of origin, rather than sending them abroad. For the PAPs who seek assurancesof a successful adoption process, a nationalist influence on policymaking is thus an ominoussign. If the executive has nationalist tendencies, government authorities in charge of adop-tion might impose formal and informal requirements that will make the process longer andmore di�cult to complete. In such an environment, there is also a risk of an abrupt policychange that would reduce the outflow of children. We thus expect a nationalist executive toserve as a deterrent for PAPs, resulting in fewer adoptions. Nationalist Executive data relyon the measure provided by the Database of Political Institutions (DPI).
Hague Adoption Convention. International adoption is governed by the 1993 HagueAdoption Convention. The primary impetus for establishing the convention was a growingconcern about adoption abuses—sale of children by parents and orphanages and child ab-duction for the purpose of adoption—that thrived in the absence of government involvementand regulation. Accordingly, the convention’s primary goals are to ensure that internationaladoption is in the best interests of the child and to prevent the abduction, sale of, or tra�cin children (Hansen and Pollack 2006; Smolin 2010). To that end, the convention puts inplace a set of safeguards. The authorities in the receiving country must determine that theprospective adoptive parents are suitable to adopt; and the authorities in the sending countryare required to ensure that the child is adoptable, that international adoption is in the child’sbest interests, and that all relevant consents have been given freely and without financialinducement. The convention also establishes an institutional framework by requiring eachcountry to designate a “central authority”—a government agency—to oversee and facilitatethe adoption process and to cooperate with central authorities in other countries. Anotherkey requirement is that adoption agencies must generally receive government accreditation
12
and be subject to supervision (Duncan 2002).What does ratification of the convention mean for the PAPs? Various studies have in-
terpreted international agreements as signaling cooperativeness and a credible commitmentto comply (e.g., Simmons 2000; Long, Nordstrom, and Baek 2007). By ratifying the HagueConvention, the sending country may be signaling its acknowledgment that internationaladoption is a viable option for children. Indeed, the convention’s preamble states that “in-tercountry adoption may o�er the advantage of a permanent family to a child for whoma suitable family cannot be found in his or her State of origin.” Ratification of the con-vention thus signals a political environment conducive to the idea of sending children foradoption abroad. The convention’s safeguards against abuse may further improve the per-ception of adoption in the sending country, increase trust, and reduce the risk of adoptionscandals. These safeguards may also empower pro-adoption forces and provide them witha cover against the charges of adoption critics. The convention can be used to demonstratethat internationally adopted children will be protected from sale and exploitation and thatthe international community considers international adoption as a good option for children(Bartholet 2006; McBride 2013a). Compared to non-Hague-Convention countries, Hague-Convention countries may thus o�er a more hospitable environment for adoption, where thePAPs should expect fewer obstacles.
Yet we argue that this reassuring signal is trumped by the higher costs that might stemfrom the convention’s rules and mechanisms. Indeed, the convention does aim to reducethe delays, complications, and costs of adoption (Duncan 2002). For example, the CentralAuthorities in the sending and receiving countries are required to “facilitate, follow and ex-pedite proceedings with a view to obtaining the adoption.” Nevertheless, various observershave expressed concern that the convention would, in fact, have the opposite e�ect: impos-ing burdens and increasing costs. It has been suggested, for example, that the additionalbureaucratic costs that the Hague process entails would be passed on to the PAPs, makinginternational adoption less a�ordable; the added costs and requirements imposed on adop-tion agencies could have a similar e�ect. Another concern is that the convention enhancesthe role of governments in the adoption process while diminishing the role of other facilita-tors and intermediaries who assist the PAPs in completing the adoption procedures in thesending country (Hansen and Pollack 2006; Kimball 2005; Varnis 2001). A common percep-tion among PAPs is that the Hague adoption process is more bureaucratic, time-consumingand di�cult than the non-Hague process (Eijsink 2011).
Overall, we argue that the PAPs will place greater weight on these costs of the HagueConvention than on the positive implications of ratification. Whereas the costs are tangibleand immediate, the beneficial aspects of the convention are less certain and more remote.
13
Therefore, the PAPs are likely to favor adoption from a non-Hague Convention countryto reduce transaction costs. Note that the the PAPs can make this choice even if theirown country—say, the United States—has ratified the convention: members of the HagueConvention may engage in adoption from non-members. Our expectation of a negativeimpact of the convention follows previous studies that did not identify an adoption-promotinge�ect of the Hague Convention (Breuning 2013b; McBride 2013a). This expectation alsoechos the concern expressed by several authors that the convention might ultimately hinderand reduce international adoption (Dillon 2003; Worthington 2009).
Our Hague Convention variable is coded 1 if both the sending country and the receivingcountry have ratified the convention—only then is the convention in e�ect between them.Ratification and entry data relies on the Hague Conference on Private International Law’so�cial website.
Cumulative Adoption. Past behavior is typically seen as a strong indicator of countries’tendencies and a reliable signal of their future conduct (e.g., Tomz 2007). The numberof adoptees that a sending country previously sent to the receiving country thus carriesinformation about the number of adoptees it is likely to send in the future. A small numberof past adoptees indicates large transaction costs and an environment that is not favorable toadoption; by contrast, a substantial past flow of adoptees indicates that the sending countryis open to international adoption and that its adoption process involves reasonable costs. Assuch, a large flow of adoptees bodes well for the PAPs and should make them more inclinedto adopt from the country in question. We measure cumulative adoption as the cumulativetotal of direct dyad adoptions since the first year receiving country adoption data is available.
4.1.2 Migration-related Influences
We know identify several dyadic influences on the transaction costs of adoption. Theseinfluences are not unique to adoption, but may apply to other flows of migrants.
Language Commonality. Language commonality between sending and receiving coun-tries has been shown to benefit migrants (e.g., Dustmann and Soest 2002) and may alsobe advantageous for international adoption. As part of the adoption process, the PAPs be-come acquainted with the sending country and its laws and policies; they typically travelto that country and interact with the individuals and authorities involved in the adoptionprocess. Fluency in the local language may significantly ease the gathering of informationand the interaction with the authorities and intermediaries in the sending country. PAPsmay thus prefer to adopt from a country whose language they speak in order to facilitate theadoption process and reduce transaction costs. We therefore expect language commonalityto increase the number of adoptions. Language commonality data are from the CEPII’s
14
GeoDist database.Migrant Stock. The stock of migrants from the sending country who reside in the
receiving country has been shown to have a positive e�ect on flows of migrants and investment(Fitzgerald, Leblang, and Teets 2014; Leblang 2010). We expect a similar e�ect on adoptionflows. Migrants may have contacts in their home country as well as a cultural and legalunderstanding of that country. All of these should make it easier for the PAPs to gatherinformation, understand the adoption process, and navigate through it. In addition, membersof the migrant community, like many adoptive parents who are non-migrants, may prefer achild who matches their own race or ethnicity (Ishizawa et al. 2006). Such a preference maymotivate migrants to adopt a child from their country of origin. Furthermore, it is possiblethat the presence of a large migrant community, especially one that is well integrated, maylead nonmembers to adopt from the migrants’ home country. The presence of the communitymay foster a positive image of the home country (Kapur and McHale 2006); it may alsoreassure prospective parents that the child would be quickly assimilated and would not faceracial or ethnic bias. Data on the stock of sending-country migrants in a receiving countryare from Fitzgerald, Leblang, and Teets (2014).
Colonial Ties. Former colonies and colonial powers often have dense ties that last longafter the colonial relations ended. These cultural, economic, and administrative ties facilitatemigration from the former colony to the metropole and ease the adjustment and integrationof migrants (Hooge et al. 2008; Riley and Emigh 2002). The same ties can make it easierand less costly for the PAPs to adopt a child from a country that is a former colony. Theseparents will have access to better information on that country, and the administrative tieswill facilitate the process of adopting the child and bringing them to the receiving country.Colonial Ties is a dichotomous variable assigned a value of 1 if the sending and receivingcountries had a colonial tie in the past and assigned 0 otherwise. Data are from CEPII’sGeoDist database.
Distance. The distance between sending and receiving countries has a negative e�ecton migrant flows: it is more costly to acquire information on remote countries and to travelthere (Mayda 2010). Distance may have a similar e�ect on international adoption, since theprocess requires the PAPs to travel to the sending country—in many cases, multiple times—and to gather information on that country. By adopting from a country close to their own,the PAPs will be able to reduce the transaction costs of adoption. We measure distance askilometers between dyad capitals. Data are from CEPII’s GeoDist database.
15
4.1.3 Additional Influences on Adoption Flows
Our analysis looks at international adoption from the point of view of the PAPs and theirdesire to reduce the transaction costs of international adoption. Yet adoption flows areshaped by additional factors, which we include in the model as controls.
Youth Population. A key factor determining the availability of adoptees in the sendingcountry is the size of that country’s adoption-relevant population: the larger the adoption-relevant population, the greater should be the outflow of children. We thus control for youthpopulation, the number of people younger than 14.8 Data are from the World Bank’s WorldDevelopment Indicators (WDI).
Real GDP per Capita. The outflow of adoptees should also increase as the sendingcountry’s ability to care for its children decreases. This means that poor countries, unableto provide children’s basic needs, are likely to send some of them for adoption abroad. RealGDP per Capita should thus be negatively associated with the outflow of children. Themeasure is constructed based on data from the Penn World Table.
Armed conflict is another cause of demographic pressure that may generate outflows ofadoptees. Conflicts leave many orphans who have lost one or both parents. Members of theextended family, who would normally care for parentless children, may also be gone or unableto support additional children (Roby and Shaw 2006). Dysfunctional or overburdened in theaftermath of war, states’ social services may also struggle to exercise their responsibility tocare for children generally and for orphans specifically. In these conditions, sending childrenfor adoption abroad may relieve some of the burden and o�er the children better prospects.We thus control for major armed conflicts in the sending country using data from the Centerfor Systemic Peace (CSP).
Islamic law. The sending country’s religion could matter as well. In particular, Islamiclaw does not recognize the institution of adoption as it is understood in the West, since theKoran emphasizes lineage and blood ties. Muslim countries therefore use other strategiesand procedures to meet the needs of orphans, such as a guardianship system known askafalah (Breuning and Ishiyama 2009; United Nations 2009:23-27; Breuning 2013b). Thenonrecognition of adoption also means that Shari’a-observing countries are highly restrictivewith regard to international adoption, or do not allow it at all. We thus control for theadoption-reducing e�ect of Islamic law using data from CIA’s World Factbook.
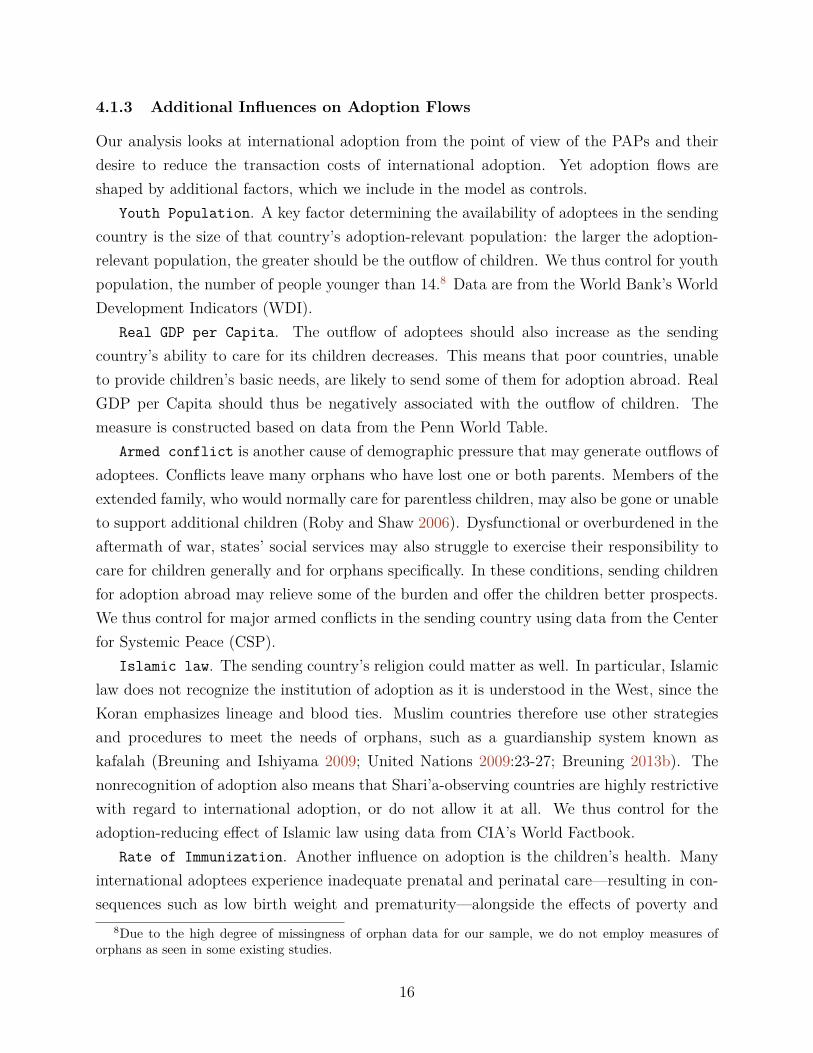
Rate of Immunization. Another influence on adoption is the children’s health. Manyinternational adoptees experience inadequate prenatal and perinatal care—resulting in con-sequences such as low birth weight and prematurity—alongside the e�ects of poverty and
8Due to the high degree of missingness of orphan data for our sample, we do not employ measures oforphans as seen in some existing studies.
16
environmental toxins. Following birth, many of the children live in orphanages, where theymight su�er malnutrition, emotional and physical neglect, and environmental deprivationwhich could adversely a�ect brain development during the critical stage of brain maturation(Jacbos, Miller, and Tirella 2010). As a result, internationally adopted children have anelevated risk of infectious diseases and are more likely to su�er developmental delays andbehavioral problems. Furthermore, the child’s background and health information providedto the PAPs is often incomplete or unreliable (Groza, Ryan, and Cash 2003; Howard andJohn 2014; Ju�er and Ijzendoorn 2005; Miller 2005; Welsh et al. 2007). While some PAPsare willing to adopt special-needs children, and though adoption typically o�ers the childrenimproved environment and opportunities that allow them to recover from their pre-adoptiondeprivation, most PAPs would likely seek to bring into their family a child who is physicallyand mentally healthy (Steltzner 2003). Therefore, we control for the rate of immunizationfor childhood diseases in the sending country as an indicator of healthcare capacity. Immu-nization is an easily observable indicator of physical health; it is also an implicit indicatorof mental and behavioral health, which is di�cult to evaluate directly, especially at a veryyoung age. PAPs are more likely to adopt from a country with a high immunization rate,where children are cared for and are less likely to su�er from physical or behavioral healthproblems. Measles immunization data are from the WDI database.
Details for all variables, their operationalization, sources, and descriptive statistics aresummarized in Appendix B.
4.2 Adoption Data and Patterns
Building on the approach of Kane (1993), Selman (2006), and Selman (2009), we contributeto the literature by compiling a more fine-grained dyad-level international adoption flowdataset that covers 19 receiving countries and up to 209 sending countries/entities, over alonger time period 1991-2010. Table A.1 in the appendix summarizes the adoption datacoverage (years and total sending countries/entities) and data sources for our 19 receivingcountries. Table A.2 in the appendix summarizes extant adoption related datasets. Inthe following, we break down international adoption flows by main receiving and sendingcountries to illuminate variations in our outcome variable of interest.
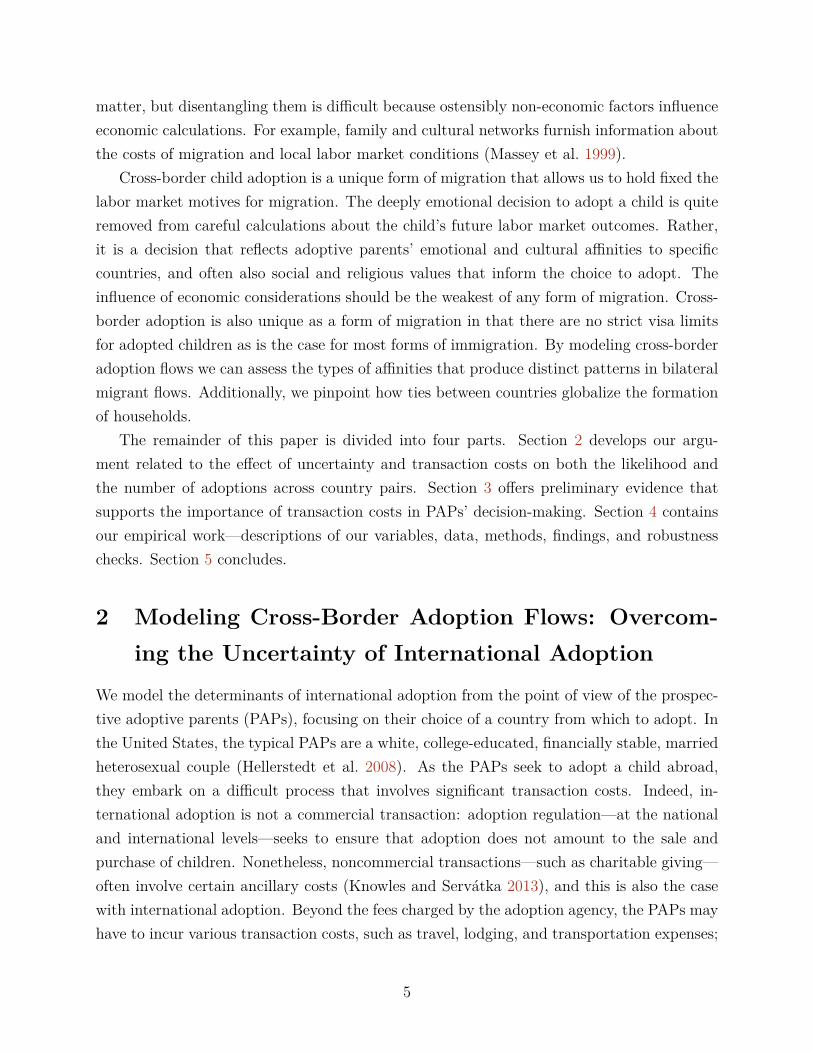
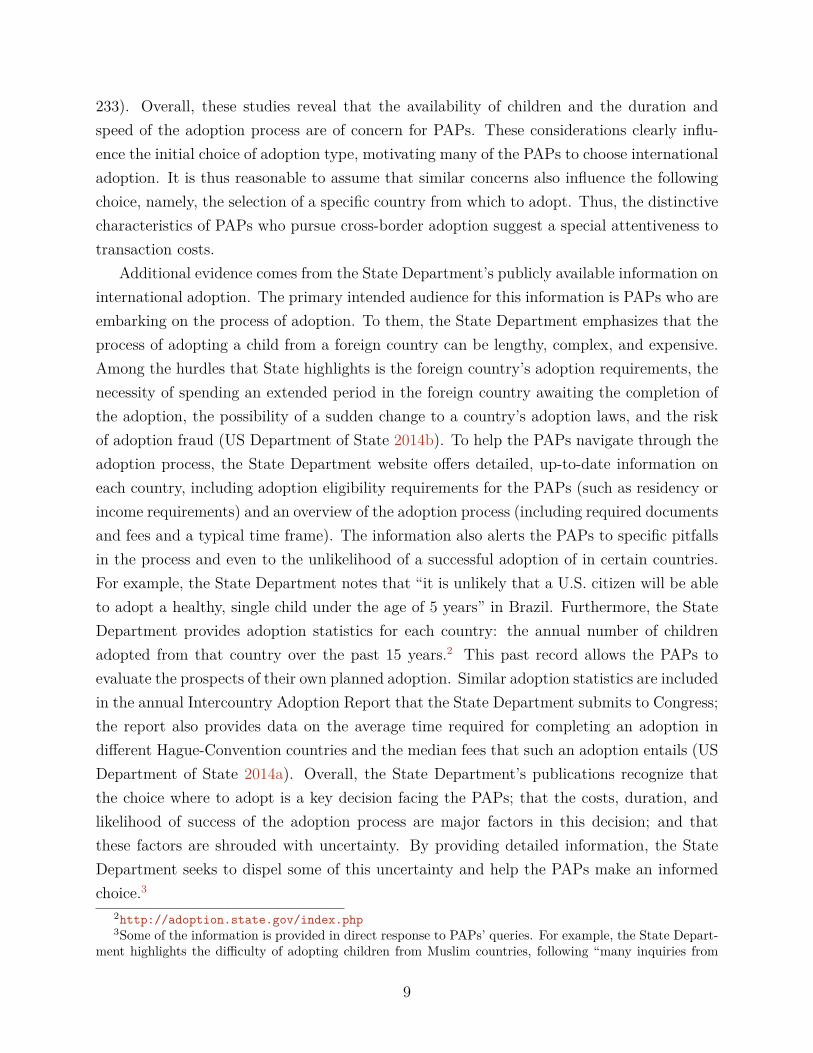
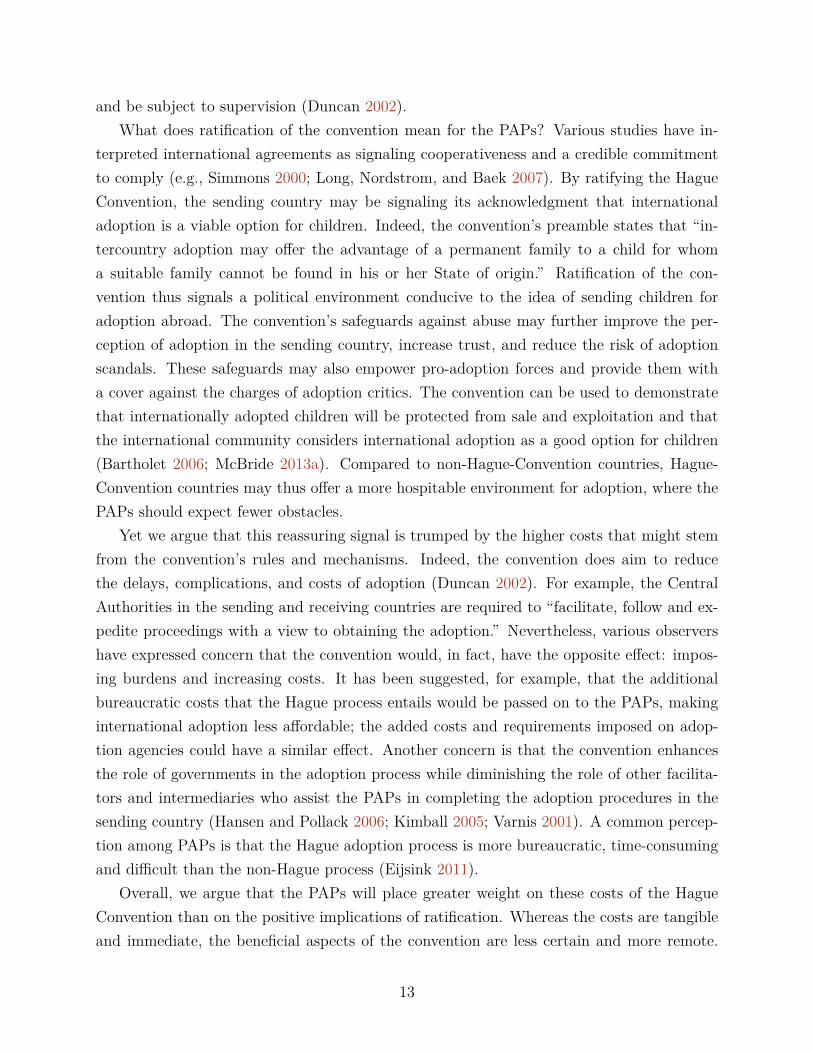
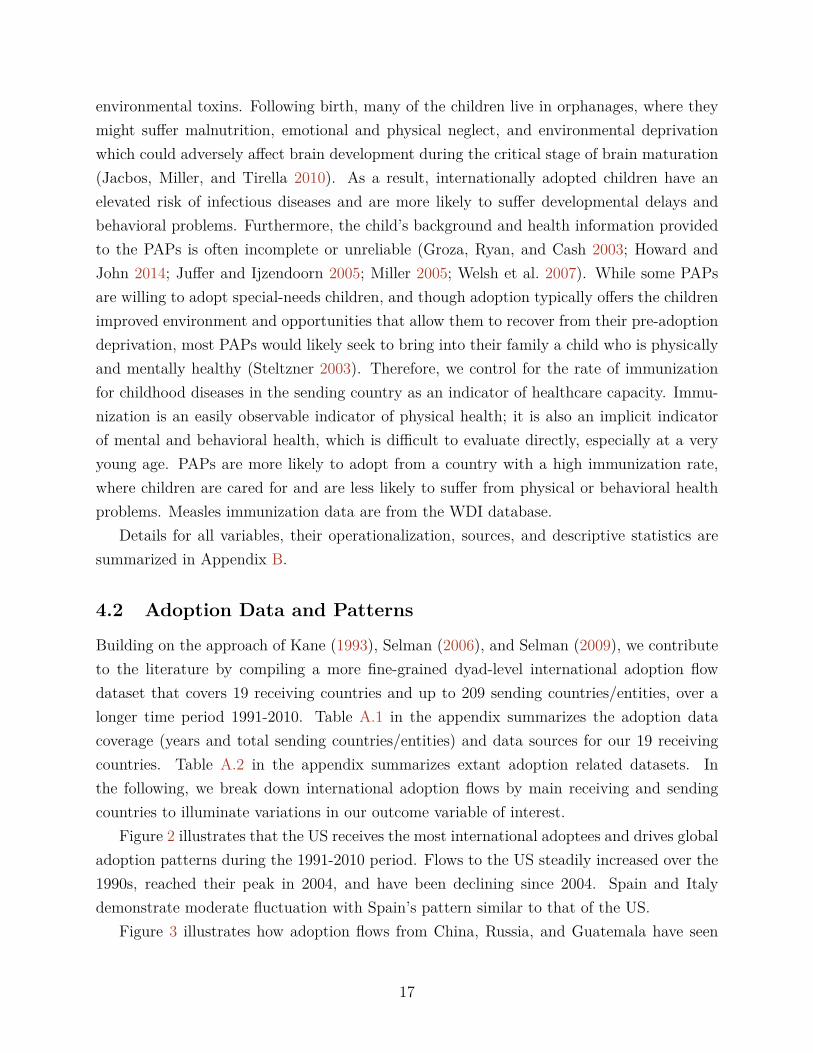
Figure 2 illustrates that the US receives the most international adoptees and drives globaladoption patterns during the 1991-2010 period. Flows to the US steadily increased over the1990s, reached their peak in 2004, and have been declining since 2004. Spain and Italydemonstrate moderate fluctuation with Spain’s pattern similar to that of the US.
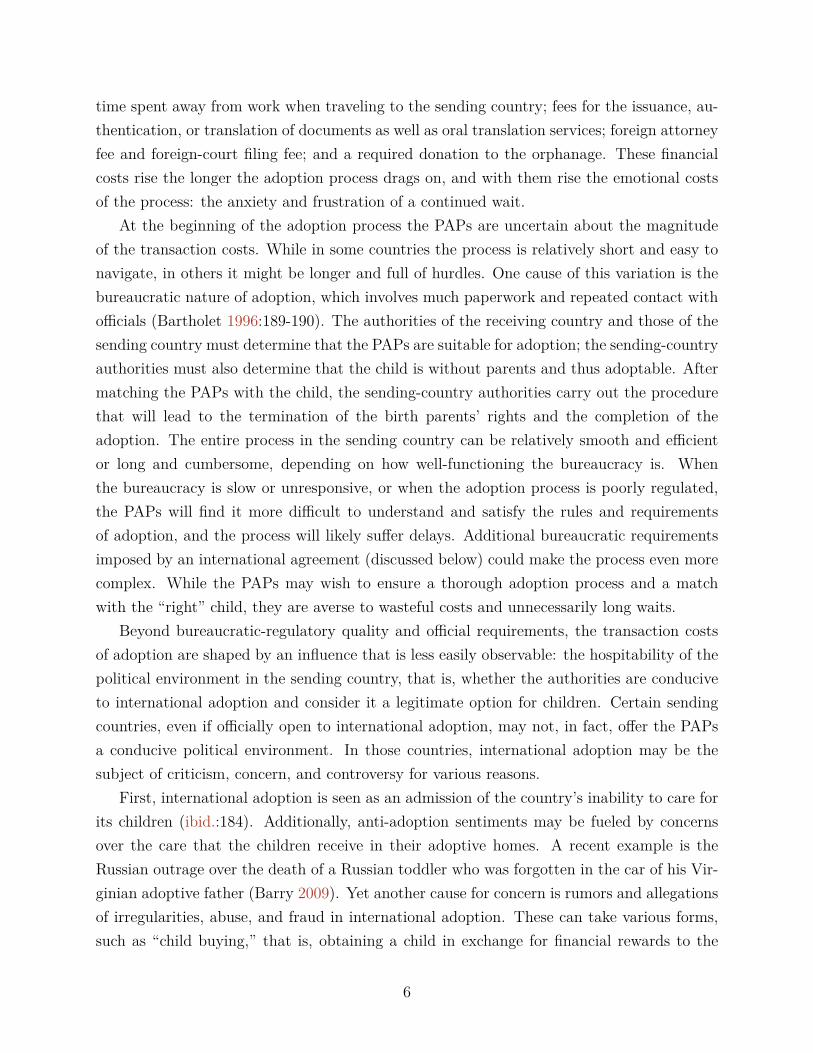
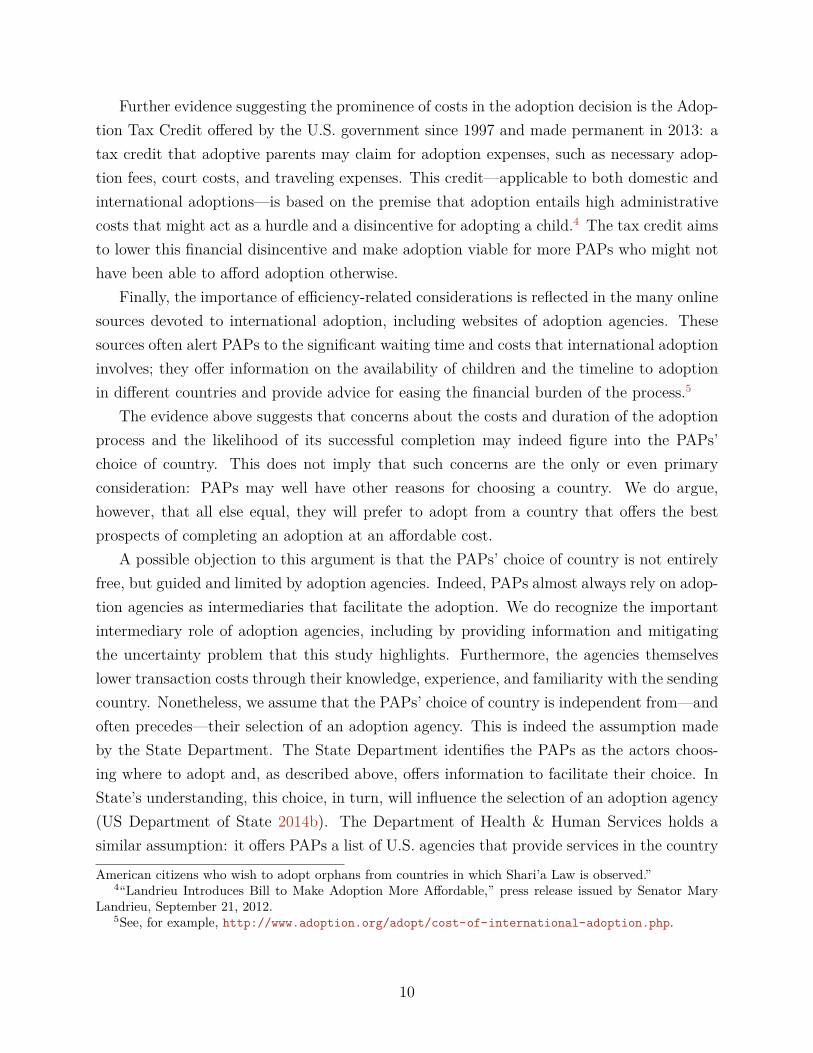
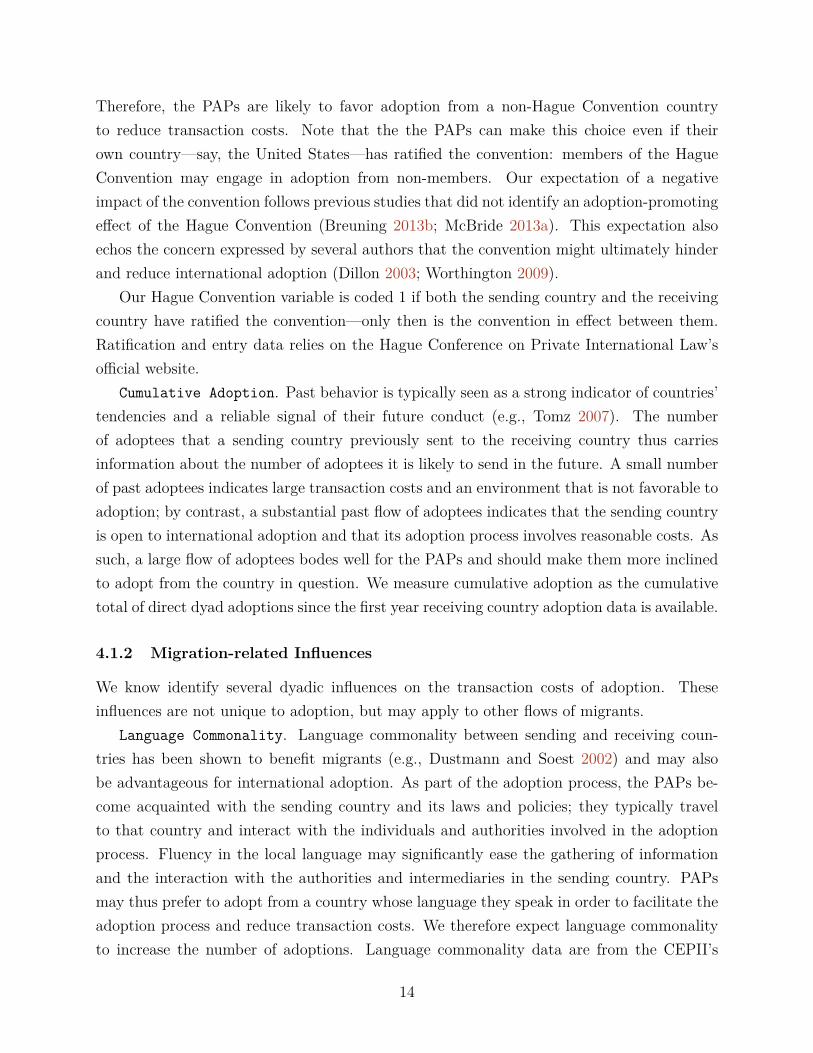
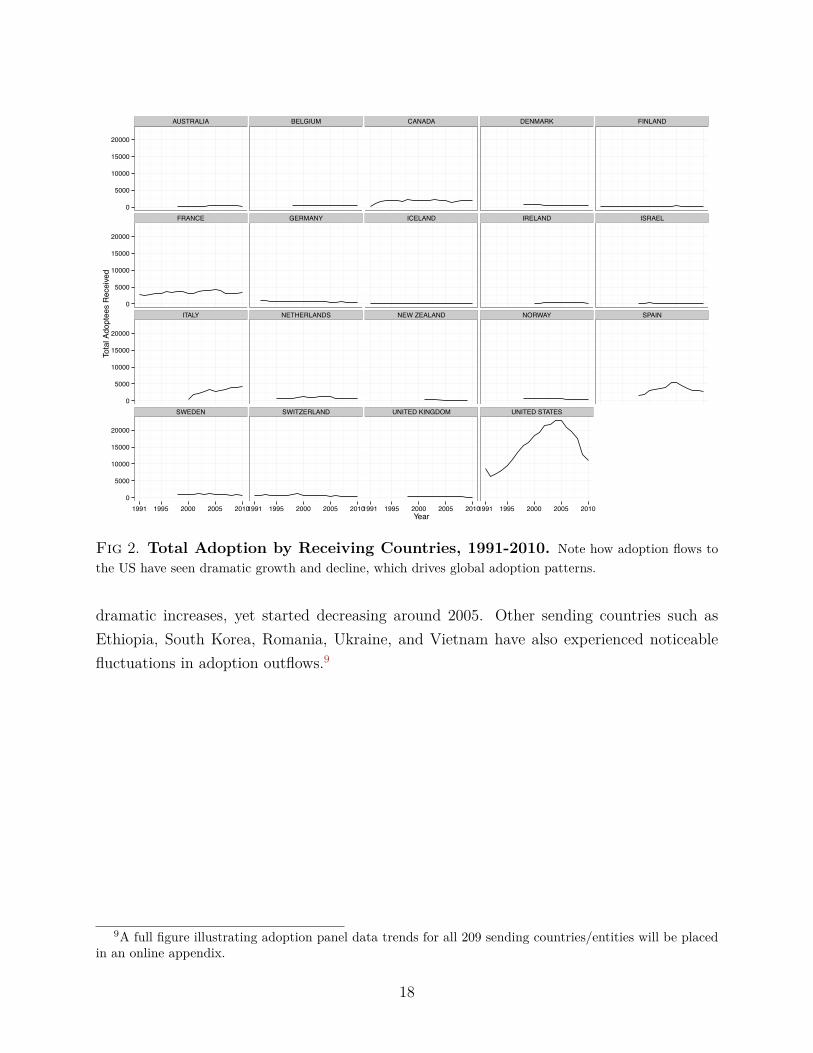
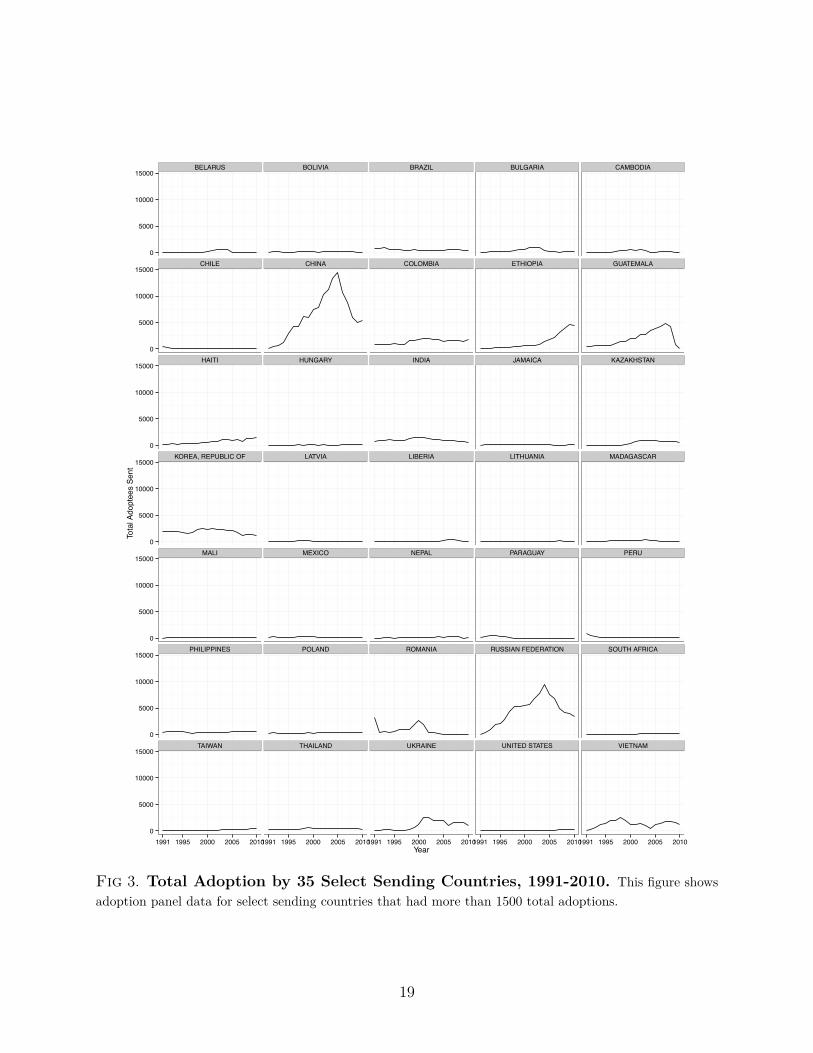
Figure 3 illustrates how adoption flows from China, Russia, and Guatemala have seen
17
AUSTRALIA BELGIUM CANADA DENMARK FINLAND
FRANCE GERMANY ICELAND IRELAND ISRAEL
ITALY NETHERLANDS NEW ZEALAND NORWAY SPAIN
SWEDEN SWITZERLAND UNITED KINGDOM UNITED STATES
0
5000
10000
15000
20000
0
5000
10000
15000
20000
0
5000
10000
15000
20000
0
5000
10000
15000
20000
1991 1995 2000 2005 20101991 1995 2000 2005 20101991 1995 2000 2005 20101991 1995 2000 2005 2010Year
Tota
l Ado
ptee
s R
ecei
ved
Fig 2. Total Adoption by Receiving Countries, 1991-2010. Note how adoption flows tothe US have seen dramatic growth and decline, which drives global adoption patterns.
dramatic increases, yet started decreasing around 2005. Other sending countries such asEthiopia, South Korea, Romania, Ukraine, and Vietnam have also experienced noticeablefluctuations in adoption outflows.9
9A full figure illustrating adoption panel data trends for all 209 sending countries/entities will be placedin an online appendix.
18
BELARUS BOLIVIA BRAZIL BULGARIA CAMBODIA
CHILE CHINA COLOMBIA ETHIOPIA GUATEMALA
HAITI HUNGARY INDIA JAMAICA KAZAKHSTAN
KOREA, REPUBLIC OF LATVIA LIBERIA LITHUANIA MADAGASCAR
MALI MEXICO NEPAL PARAGUAY PERU
PHILIPPINES POLAND ROMANIA RUSSIAN FEDERATION SOUTH AFRICA
TAIWAN THAILAND UKRAINE UNITED STATES VIETNAM
0
5000
10000
15000
0
5000
10000
15000
0
5000
10000
15000
0
5000
10000
15000
0
5000
10000
15000
0
5000
10000
15000
0
5000
10000
15000
1991 1995 2000 2005 20101991 1995 2000 2005 20101991 1995 2000 2005 20101991 1995 2000 2005 20101991 1995 2000 2005 2010Year
Tota
l Ado
ptee
s Se
nt
Fig 3. Total Adoption by 35 Select Sending Countries, 1991-2010. This figure showsadoption panel data for select sending countries that had more than 1500 total adoptions.
19
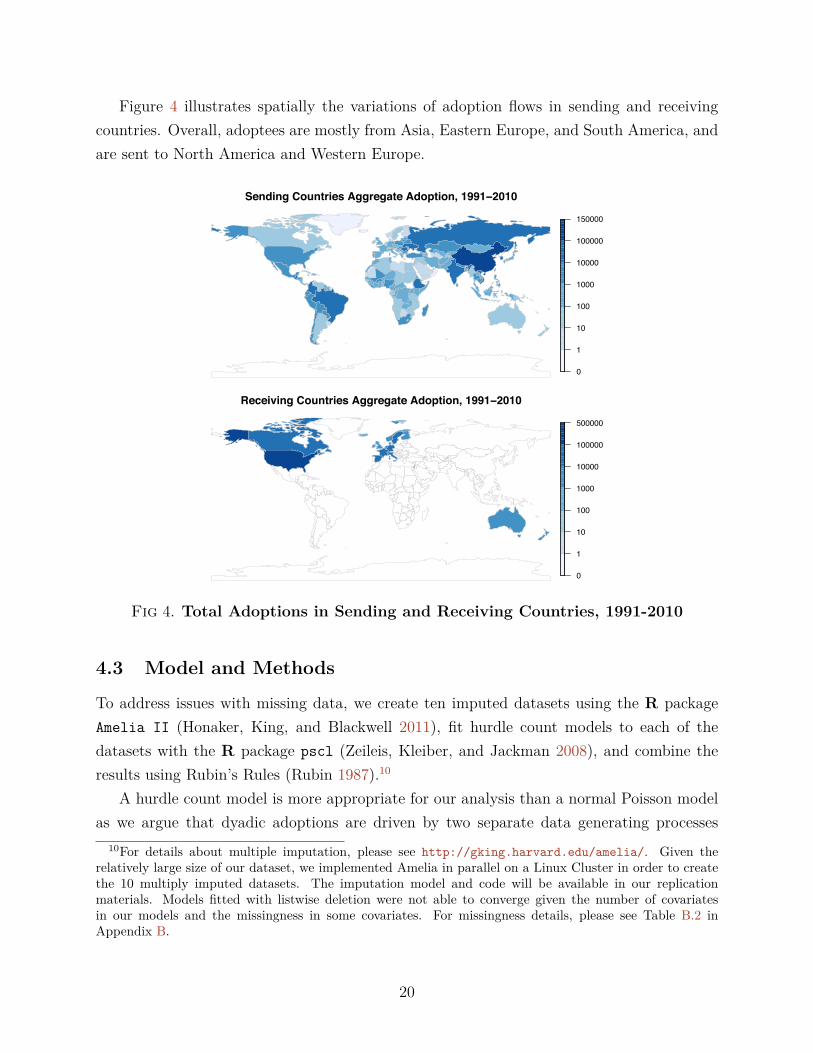
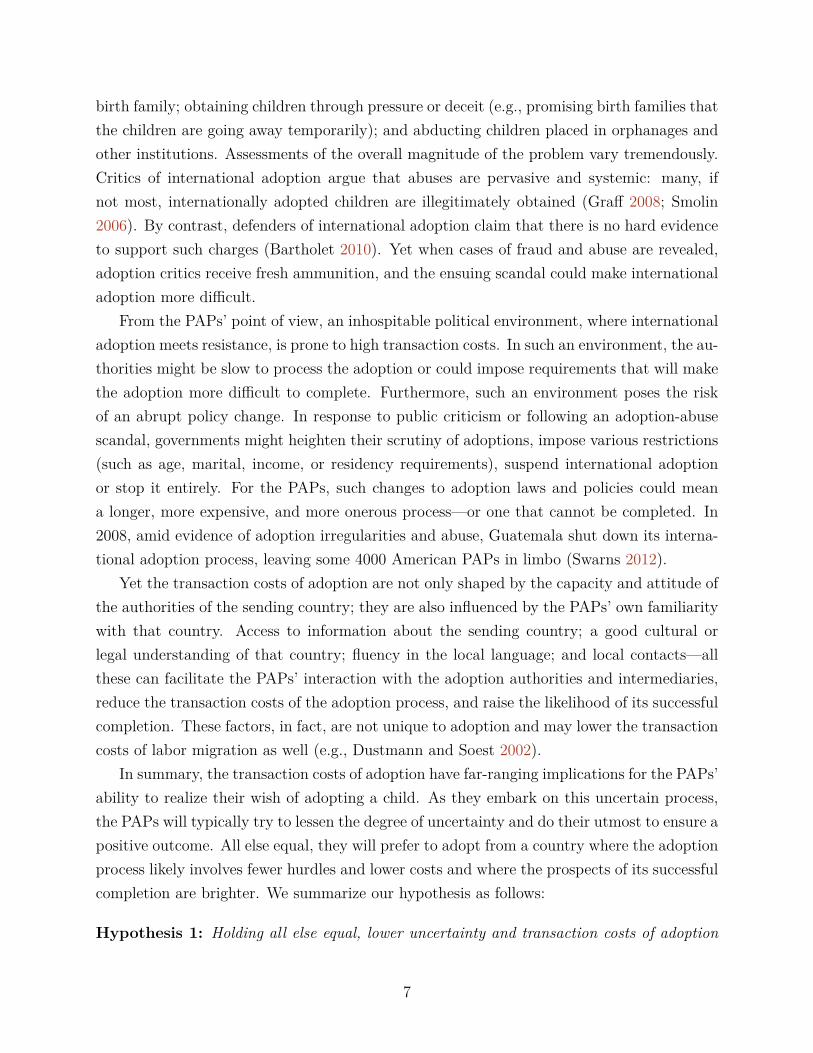
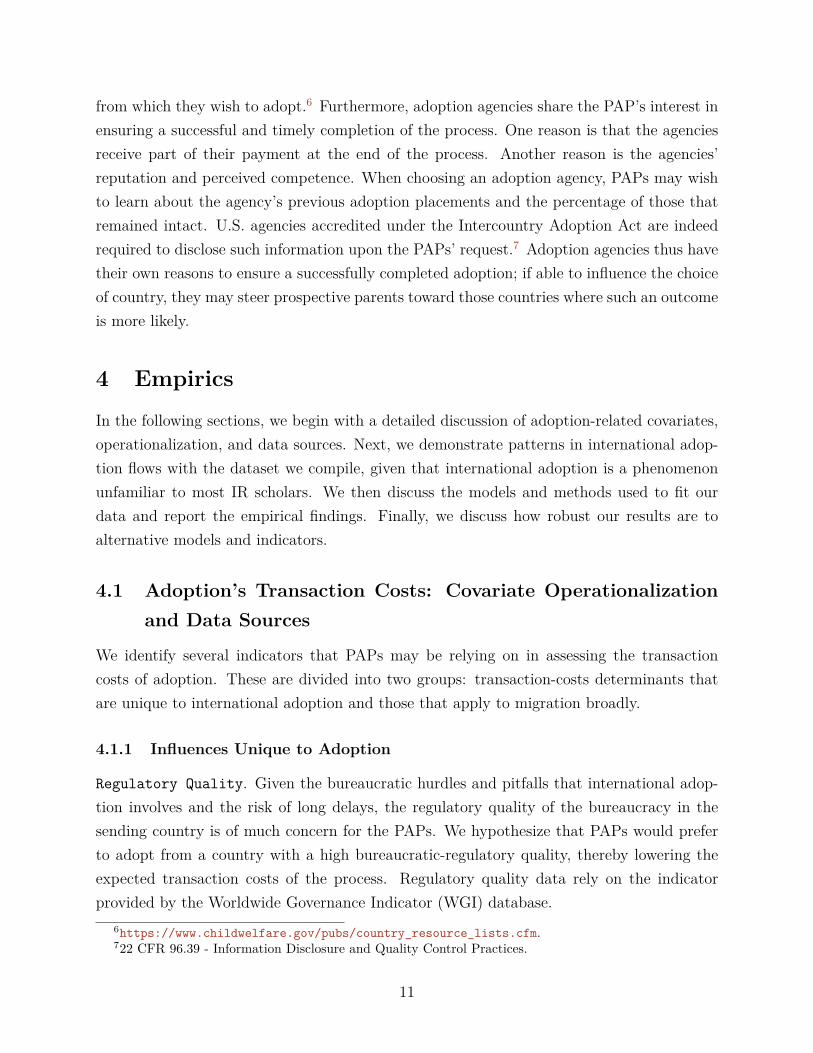
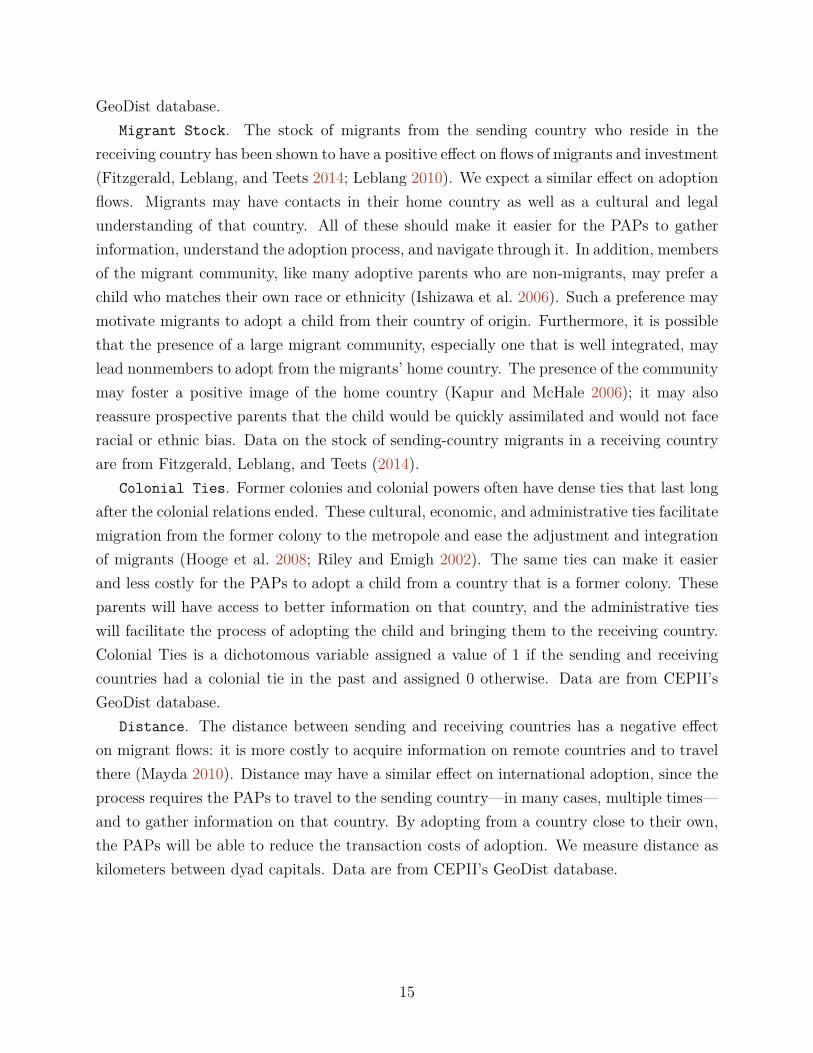
Figure 4 illustrates spatially the variations of adoption flows in sending and receivingcountries. Overall, adoptees are mostly from Asia, Eastern Europe, and South America, andare sent to North America and Western Europe.
Sending Countries Aggregate Adoption, 1991−2010
0
1
10
100
1000
10000
100000
150000
Receiving Countries Aggregate Adoption, 1991−2010
0
1
10
100
1000
10000
100000
500000
Fig 4. Total Adoptions in Sending and Receiving Countries, 1991-2010
4.3 Model and Methods
To address issues with missing data, we create ten imputed datasets using the R packageAmelia II (Honaker, King, and Blackwell 2011), fit hurdle count models to each of thedatasets with the R package pscl (Zeileis, Kleiber, and Jackman 2008), and combine theresults using Rubin’s Rules (Rubin 1987).10
A hurdle count model is more appropriate for our analysis than a normal Poisson modelas we argue that dyadic adoptions are driven by two separate data generating processes
10For details about multiple imputation, please see http://gking.harvard.edu/amelia/. Given therelatively large size of our dataset, we implemented Amelia in parallel on a Linux Cluster in order to createthe 10 multiply imputed datasets. The imputation model and code will be available in our replicationmaterials. Models fitted with listwise deletion were not able to converge given the number of covariatesin our models and the missingness in some covariates. For missingness details, please see Table B.2 inAppendix B.
20
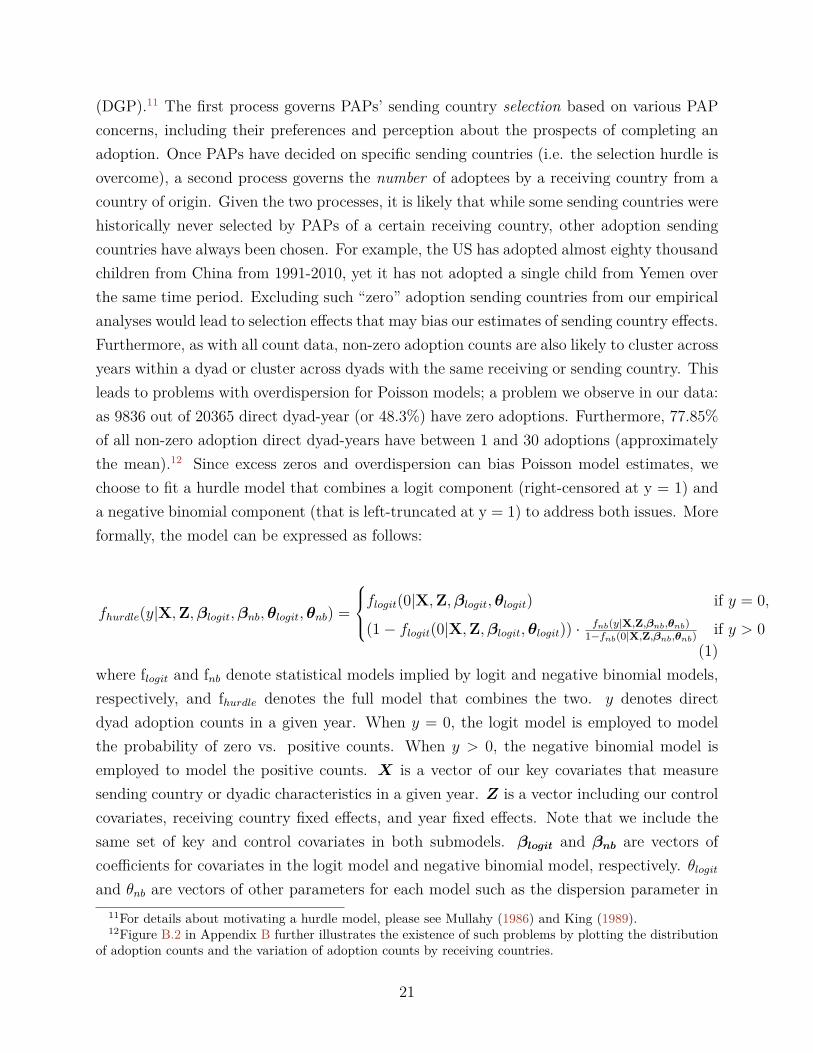
(DGP).11 The first process governs PAPs’ sending country selection based on various PAPconcerns, including their preferences and perception about the prospects of completing anadoption. Once PAPs have decided on specific sending countries (i.e. the selection hurdle isovercome), a second process governs the number of adoptees by a receiving country from acountry of origin. Given the two processes, it is likely that while some sending countries werehistorically never selected by PAPs of a certain receiving country, other adoption sendingcountries have always been chosen. For example, the US has adopted almost eighty thousandchildren from China from 1991-2010, yet it has not adopted a single child from Yemen overthe same time period. Excluding such “zero” adoption sending countries from our empiricalanalyses would lead to selection e�ects that may bias our estimates of sending country e�ects.Furthermore, as with all count data, non-zero adoption counts are also likely to cluster acrossyears within a dyad or cluster across dyads with the same receiving or sending country. Thisleads to problems with overdispersion for Poisson models; a problem we observe in our data:as 9836 out of 20365 direct dyad-year (or 48.3%) have zero adoptions. Furthermore, 77.85%of all non-zero adoption direct dyad-years have between 1 and 30 adoptions (approximatelythe mean).12 Since excess zeros and overdispersion can bias Poisson model estimates, wechoose to fit a hurdle model that combines a logit component (right-censored at y = 1) anda negative binomial component (that is left-truncated at y = 1) to address both issues. Moreformally, the model can be expressed as follows:
f
hurdle
(y|X, Z,�logit
,�nb
,✓logit
,✓nb
) =
Y_]
_[
f
logit
(0|X, Z,�logit
,✓logit
) if y = 0,
(1 ≠ f
logit
(0|X, Z,�logit
,✓logit
)) · fnb(y|X,Z,�nb,✓nb)1≠fnb(0|X,Z,�nb,✓nb) if y > 0
(1)where f
logit
and fnb
denote statistical models implied by logit and negative binomial models,respectively, and f
hurdle
denotes the full model that combines the two. y denotes directdyad adoption counts in a given year. When y = 0, the logit model is employed to modelthe probability of zero vs. positive counts. When y > 0, the negative binomial model isemployed to model the positive counts. X is a vector of our key covariates that measuresending country or dyadic characteristics in a given year. Z is a vector including our controlcovariates, receiving country fixed e�ects, and year fixed e�ects. Note that we include thesame set of key and control covariates in both submodels. �
logit
and �nb
are vectors ofcoe�cients for covariates in the logit model and negative binomial model, respectively. ◊
logit
and ◊
nb
are vectors of other parameters for each model such as the dispersion parameter in11For details about motivating a hurdle model, please see Mullahy (1986) and King (1989).12Figure B.2 in Appendix B further illustrates the existence of such problems by plotting the distribution
of adoption counts and the variation of adoption counts by receiving countries.
21
the negative binomial model. The denominator in the second line of equation (1) scales thedistribution of positive counts to ensure that overall probability sums to one.
4.4 Results
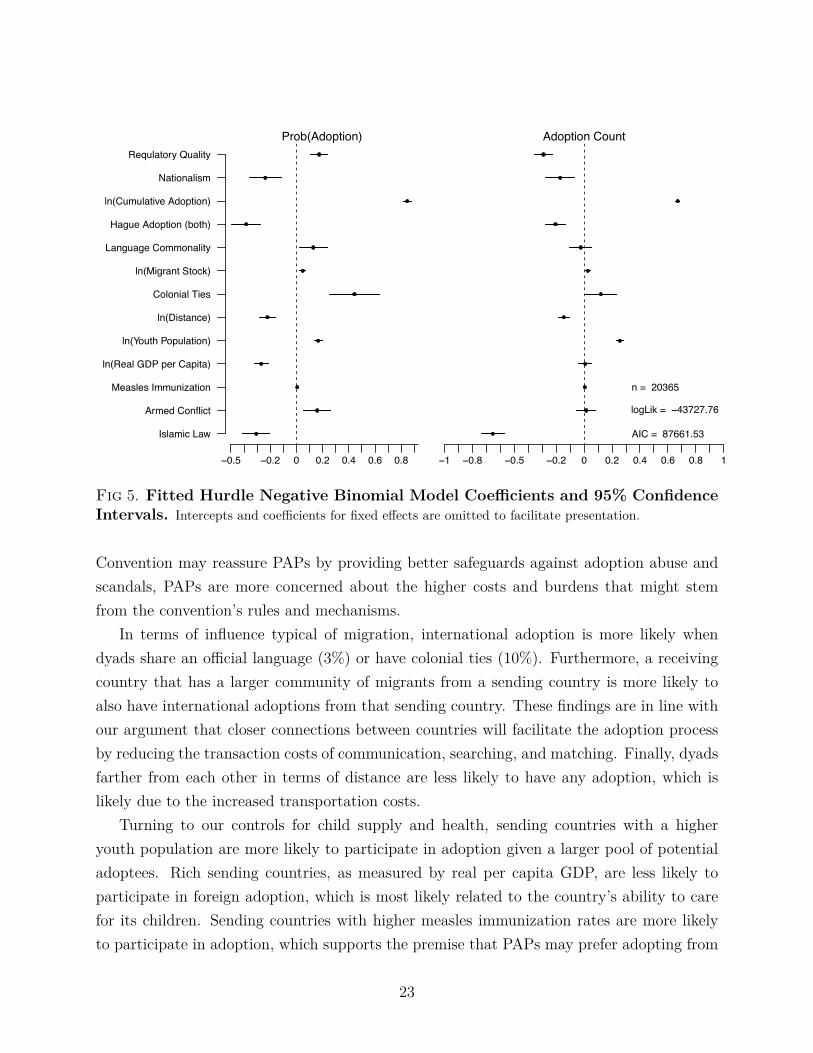
We present hurdle model results in Figure 5 and simulated first di�erences in Figure 6.13
As a hurdle model contains two components—one modeling the factors associated withdyads having adoptions or not and the other modeling the number of children adoptedwithin dyads—we present two sets of coe�cients and associated 95% confidence intervals.Additionally, as with other, more standard, generalized linear models, parameter estimatesare di�cult to interpret so we present first-di�erence probabilities for the first stage logitand first-di�erence expected counts for the second stage negative binomial model, holdingother covariates constant.14
The coe�cients and first di�erences for the logit component, summarized respectively inthe left panel of Figure 5 and Figure 6, are all statistically significant and are consistent withour hypotheses concerning the e�ect of adoption transaction costs on international adoptionwithin a given dyad. In terms of influences unique to adoption, sending countries that havehigher regulatory quality or extensive history of dyadic adoptions have a higher probabilityof being open to international adoption. This supports our argument that PAPs considerthe prospects of adoption completion and that higher regulatory quality or more cumula-tive adoption signals better prospects due to the greater ability of sending governments toformulate and implement regulation, more reliable supply of potential adoptees, and betterinformation for matching PAPs and adoptees. In contrast, sending countries with a greaternationalist sentiment are approximately 6% less likely to have children adopted abroad.Furthermore, dyads that have the Hague Adoption Convention in force are 9% less likely toadopt from each other compared to dyads with the convention in force in only one countryor none. The former supports our argument that nationalist sentiments send a negative sig-nal about adoption completion prospects by indicating longer and more di�cult processes,given that sending governments and citizens see adoption as being harmful to the sendingcountry. The latter finding suggests that while the entry into force of the Hague Adoption
13See Appendix D for further details about parameter estimates (Table D.1) and simulated first di�erences(Table D.2).
14More technically, our first di�erences are calculated as the change in the expected value (probability orcount) when the covariate of interest is changed from zero to one for a dichotomous independent variable,or increased from one standard deviation under the mean to one standard deviation above the mean fora continuous covariate, while holding all other covariates at their mean or mode and setting the receivingcountry to USA and the year as 2000. Unfortunately, the current version of the R package Zelig (Imai, King,and Lau 2007) does not implement first-di�erence simulations for hurdle models. Therefore, we implementfirst di�erences with our own code following King, Tomz, and Wittenberg (2000)’s method.
22
−0.5 −0.2 0 0.2 0.4 0.6 0.8
Islamic Law
Armed Conflict
Measles Immunization
ln(Real GDP per Capita)
ln(Youth Population)
ln(Distance)
Colonial Ties
ln(Migrant Stock)
Language Commonality
Hague Adoption (both)
ln(Cumulative Adoption)
Nationalism
Requlatory QualityProb(Adoption)
−1 −0.8 −0.5 −0.2 0 0.2 0.4 0.6 0.8 1
Adoption Count
n = 20365
logLik = −43727.76
AIC = 87661.53
Fig 5. Fitted Hurdle Negative Binomial Model Coe�cients and 95% ConfidenceIntervals. Intercepts and coe�cients for fixed e�ects are omitted to facilitate presentation.
Convention may reassure PAPs by providing better safeguards against adoption abuse andscandals, PAPs are more concerned about the higher costs and burdens that might stemfrom the convention’s rules and mechanisms.
In terms of influence typical of migration, international adoption is more likely whendyads share an o�cial language (3%) or have colonial ties (10%). Furthermore, a receivingcountry that has a larger community of migrants from a sending country is more likely toalso have international adoptions from that sending country. These findings are in line withour argument that closer connections between countries will facilitate the adoption processby reducing the transaction costs of communication, searching, and matching. Finally, dyadsfarther from each other in terms of distance are less likely to have any adoption, which islikely due to the increased transportation costs.
Turning to our controls for child supply and health, sending countries with a higheryouth population are more likely to participate in adoption given a larger pool of potentialadoptees. Rich sending countries, as measured by real per capita GDP, are less likely toparticipate in foreign adoption, which is most likely related to the country’s ability to carefor its children. Sending countries with higher measles immunization rates are more likelyto participate in adoption, which supports the premise that PAPs may prefer adopting from
23
−0.15 0 0.15 0.3 0.45 0.6 0.75
ln(Distance)
Colonial Ties
ln(Migrant Stock)
Language Commonality
Both Hague
ln(Cumulative Adoption)
Nationalism
Requlatory QualityProb(Adoption)
−5 0 5 10 15 20 25 30 35 40
Adoption Count
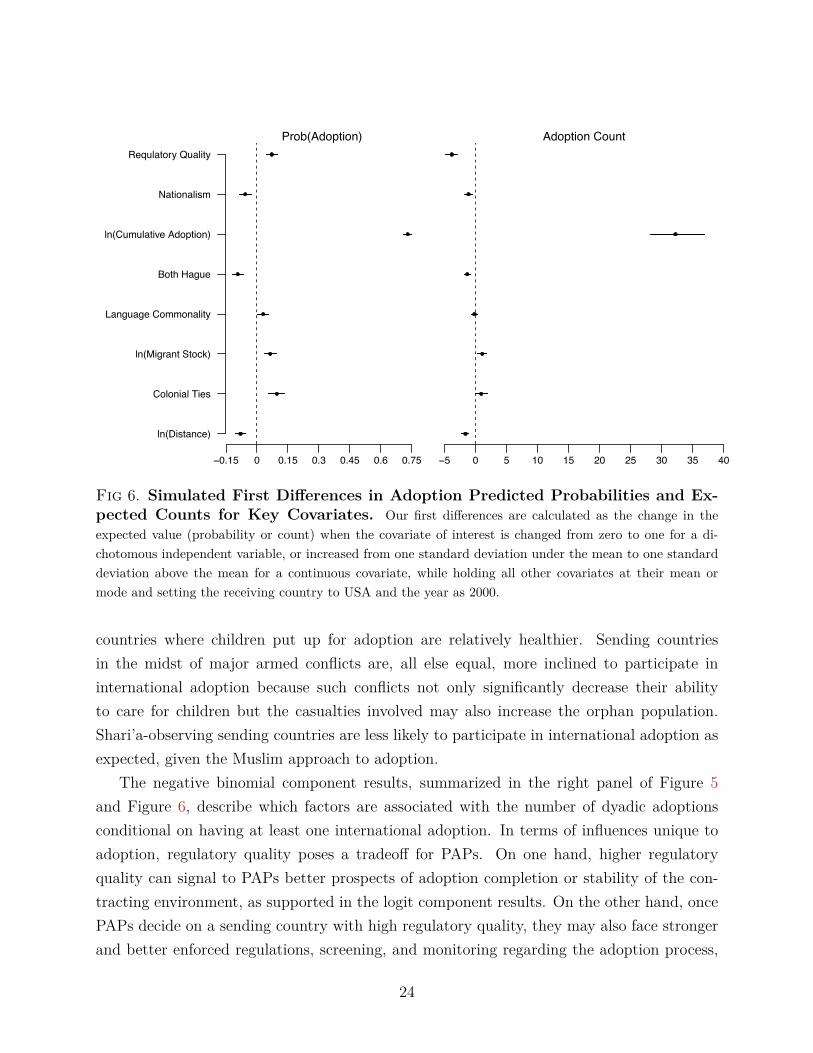
Fig 6. Simulated First Di�erences in Adoption Predicted Probabilities and Ex-pected Counts for Key Covariates. Our first di�erences are calculated as the change in theexpected value (probability or count) when the covariate of interest is changed from zero to one for a di-chotomous independent variable, or increased from one standard deviation under the mean to one standarddeviation above the mean for a continuous covariate, while holding all other covariates at their mean ormode and setting the receiving country to USA and the year as 2000.
countries where children put up for adoption are relatively healthier. Sending countriesin the midst of major armed conflicts are, all else equal, more inclined to participate ininternational adoption because such conflicts not only significantly decrease their abilityto care for children but the casualties involved may also increase the orphan population.Shari’a-observing sending countries are less likely to participate in international adoption asexpected, given the Muslim approach to adoption.
The negative binomial component results, summarized in the right panel of Figure 5and Figure 6, describe which factors are associated with the number of dyadic adoptionsconditional on having at least one international adoption. In terms of influences unique toadoption, regulatory quality poses a tradeo� for PAPs. On one hand, higher regulatoryquality can signal to PAPs better prospects of adoption completion or stability of the con-tracting environment, as supported in the logit component results. On the other hand, oncePAPs decide on a sending country with high regulatory quality, they may also face strongerand better enforced regulations, screening, and monitoring regarding the adoption process,
24
which raises the transaction costs for adoption. This is supported in the negative binomialcomponent results, which shows how higher regulatory quality in the sending country isassociated with lower counts of dyadic adoption. Again, sending countries with a greaternationalist sentiment or dyads that have the Hague Adoption Convention in force are onaverage associated with fewer dyadic adoptions in a given year (1.13 and 1.32 respectively).Meanwhile, dyads with high dyadic adoptions in the previous year (100.261) have on average32.21 more dyadic adoptions in a given year than dyads with low dyadic adoptions in theprevious year (0.9878).
Factors associated with bilateral migration are found to be correlated with adoption inways consistent with our expectations. Larger communities of migrants from the sendingcountry residing in the receiving country is again associated with more dyadic adoptions.Dyads with colonial ties have on average 0.91 more dyadic adoptions in a given year. Dyadsfarther from each other in distance also have fewer dyadic adoptions. Finally, althoughlanguage commonality is associated with higher probabilities of dyadic adoption, once PAPsdecide on an sending country, the commonality of o�cial language is no longer statisticallyassociated with the scale of dyadic adoptions. This finding is not surprising as PAPs whoultimately select to adopt from sending countries with a di�erent o�cial language, maybe either already equipped with su�cient language proficiency or are more determined toovercome the language barrier. Therefore, the e�ect of language on dyadic adoption scale isindeterminate.
Finally, results for controls covariates in the negative binomial component are all similarto the logit component with the exception that real GDP per capita and armed conflict areno longer statistically significant.
4.5 Robustness Checks
We fit several alternative models and substitute in di�erent indicators to examine the ro-bustness of our findings. Robustness results are summarized in the following with detailspresented in Appendix E.
4.5.1 Alternative Models
For robustness, we fit simple Poisson, negative binomial, or zero-inflated negative binomialmodels with the same model specification.15 Note that since the zero component in the
15See Table E.1 for results. The zero-inflated count model is an alternative class to the hurdle count modelfor addressing excess zeros in count data. Similar to the hurdle model, the zero-inflated count model is atwo-component model that augments the count component with a zero component. However, the di�erenceis that zero-inflated count models model the point mass at zero (probability of outcomes equal zero) while
25
zero-inflated negative binomial model models the probability of zeros in contrast to thehurdle model, which models the probability of ones, expected coe�cient signs here shouldbe opposite of those in the zero component of a hurdle model.
Overall, alternative coe�cient signs and statistical significant levels for key transactioncost covariates are all consistent with our main hurdle model results, with the exceptionthat language commonality becomes statistically significant in the simple Poisson or negativebinomial models. Informal log-likelihood and AIC comparisons suggest that the hurdle modelfits the data better than all three alternatives. More formally, likelihood ratio tests showhow the negative binomial model fits the data better than a simple Poisson model with ap-value at virtually zero. The Vuong test shows how the zero-inflated negative binomialmodel fits better than just a simple negative binomial model with a test statistic of 20.39and p-value of again virtually zero. Model fit di�erences between hurdle and zero-inflatednegative binomial models are statistically insignificant. Due to the robustness of the results,we only focus on substantive interpretations for the hurdle model in the paper.
4.5.2 Alternative Indicators
For additional robustness checks, we fit hurdle models with alternative specifications. First,we replace sending country regulatory quality with control of corruption to examine alterna-tive sources of government-induced adoption transaction costs. The results show that highercontrol of corruption is statistically significant and is associated with fewer dyadic adoptionswhile results for all other key covariates are substantively the same.16 Again, this supportsour argument that better control of corruption may lead to stricter enforcement of adoptionregulations, which may reduce adoption abuse but may also increase adoption transactioncosts. However, control of corruption is not systematically related to the probability of hav-ing any dyadic adoption, which suggests that regulatory quality may be a more importantconcern than control of corruption when PAPs select sending countries in the first place.
Second, we replace our original proxy for nationalism (the existence of nationalist chiefexecutive party) with a dichotomous measure of jus soli (Leblang 2014) to examine alter-native measures of nationalism. The argument is that countries with high levels of civicnationalism are more likely to define citizenship by jus soli, i.e. extending citizenship toanyone born in the territory of a state. Results are consistent: jus soli is statistically sig-nificant and negatively correlated with both the probability and count of adoptions, while
also allowing zeros in the count component. In other words, zeros can come from both the point mass andthe count component. Zeileis, Kleiber, and Jackman (2008) discuss how hurdle and zero-inflated count modelsubstantive results are usually very similar, but the hurdle model allows nicer interpretation. We thus chooseto present hurdle model results in the main paper.
16See Column 1-2 of Table E.2 for details.
26
results for all other key covariates are substantively the same.17 Overall, the findings showthat nationalism is associated with lower adoption probabilities and counts regardless of themeasures employed.
5 Concluding RemarksWhat are the determinants of international adoption? In this article we explore this questionwith reference to the choice set of a prospective adoptive parent, arguing that PAPs attemptto minimize the transactions costs associated with adoption. Our empirical analysis identifiesa variety of factors associated with transactions costs and we find statistical support for thehypothesis that these costs decrease bilateral adoptions. The theoretical framework andempirical analysis are an important contribution to a number of literatures. We find thatsome of the same factors that influence international migration—strong social networks,common colonial and linguistic ties, and distance between sending and recipient country—also influence the bilateral flow of adoptees (Fitzgerald, Leblang, and Teets 2014). In futurework it would be useful to see if other “people” flows—such as international marriages andglobal tourism—are influenced by the same sort of transactions costs and whether domesticpolitical institutions can help mitigate these costs.
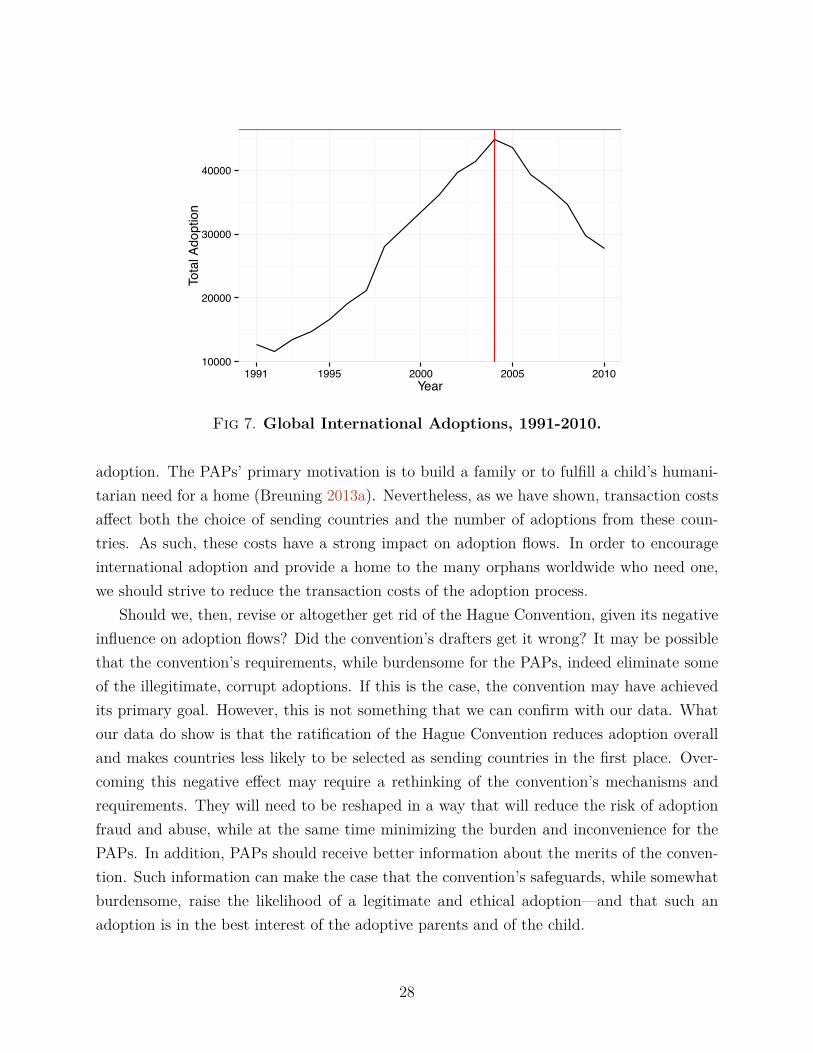
Our analyses and evidence also contribute to the scholarship on nationalism and inter-national law. Consider, for example, the recent decline in global international adoptionsillustrated in Figure 7. After a surge in adoptions, international adoption has declined sig-nificantly in recent years. According to the data we have assembled, 44,836 children wereadopted internationally in 2004; in 2010, the number stood at 27,695, i.e. around 38% de-cline. The data further show that this sharp decline is largely due to three countries—China,Russia, and Guatemala—which have declined as the main source of potential adoptees. Ourmodel sheds light on this trend, as it identifies two important influences that negativelya�ect the flow of children: nationalism and the Hague Convention. In Russia, the declineis likely the result of the growing nationalism of recent years, whereas the United Statessuspended adoption from Guatemala in 2008 due to the latter’s failure to comply with theHague Convention. The declining adoption from China is also, at least in part, a resultof its Hague Convention membership since 2005. More broadly, U.S. o�cials contend thatthe stricter Hague standards create long delays and have become an obstacle to adoption(Swarns 2012; Voigt and Brown 2013). Our systematic analysis supports these assertions.
The normative implication of our study is that transaction costs exert a strong influenceon international adoption. Indeed, these costs are not the sole, or most important, driver of
17See Column 3-4 of Table E.2 for details.
27
10000
20000
30000
40000
1991 1995 2000 2005 2010Year
Tota
l Ado
ptio
n
Fig 7. Global International Adoptions, 1991-2010.
adoption. The PAPs’ primary motivation is to build a family or to fulfill a child’s humani-tarian need for a home (Breuning 2013a). Nevertheless, as we have shown, transaction costsa�ect both the choice of sending countries and the number of adoptions from these coun-tries. As such, these costs have a strong impact on adoption flows. In order to encourageinternational adoption and provide a home to the many orphans worldwide who need one,we should strive to reduce the transaction costs of the adoption process.
Should we, then, revise or altogether get rid of the Hague Convention, given its negativeinfluence on adoption flows? Did the convention’s drafters get it wrong? It may be possiblethat the convention’s requirements, while burdensome for the PAPs, indeed eliminate someof the illegitimate, corrupt adoptions. If this is the case, the convention may have achievedits primary goal. However, this is not something that we can confirm with our data. Whatour data do show is that the ratification of the Hague Convention reduces adoption overalland makes countries less likely to be selected as sending countries in the first place. Over-coming this negative e�ect may require a rethinking of the convention’s mechanisms andrequirements. They will need to be reshaped in a way that will reduce the risk of adoptionfraud and abuse, while at the same time minimizing the burden and inconvenience for thePAPs. In addition, PAPs should receive better information about the merits of the conven-tion. Such information can make the case that the convention’s safeguards, while somewhatburdensome, raise the likelihood of a legitimate and ethical adoption—and that such anadoption is in the best interest of the adoptive parents and of the child.
28

ReferencesBarry, Ellen. (2009) Russian Furor Over U.S. Adoptions Follows American’s Acquittal in
Boy’s Death. New York Times (January 3).Bartholet, Elizabeth. (1996) International Adoption: Propriety, Prospects and Pragmatics.
Journal of the American Academy of Matrimonial Lawyers 13:181–210.— (2006) International Adoption. In: ed. by Lori Askeland. Children and Youth in Adoption,
Orphanages, and Foster Care. Westport, CT: Greenwood Press.— (2010) International Adoption: The Human Rights Position. Global Policy 1(1):91–100.Beck, Thorsten, George Clarke, Alberto Gro�, Philip Keefer, and Patrick Walsh. (2001) New
Tools in Comparative Political Economy: The Database of Political Institutions. WorldBank Economic Review 15(1):165–176.
Breuning, Marijke. (2013a) Samaritans, Family Builders, and the Politics of IntercountryAdoption. International Studies Perspectives 14(4):417–435.
— (2013b) What Explain Openness to Intercountry Adoption? Social Science Quarterly94(1):113–130.
Breuning, Marijke and John Ishiyama. (2009) The Politics of Intercountry Adoption: Ex-plaining Variation in the Legal Requirements of Sub-Saharan African Countries. Per-spectives on Politics 7(1):89–101.
Briggs, Laura. (2012) Somebody’s Children: The Politics of Transracial and TransnationalAdoption. Durham, NC: Duke University Press.
Center for Systemic Peace. (2014) Major Episodes of Political Violence, 1946-2013. url:http://www.systemicpeace.org/warlist.htm.
CEPII. (2011) The GeoDist Database. url: http://www.cepii.fr/anglaisgraph/bdd/distances.htm.
CIA. (2013) The World Factbook, Central Intelligence Agency. url: https://www.cia.gov/library/publications/the-world-factbook/.
CREG. (2014) Composition of Religious and Ethnic Groups (CREG) v1.01, Cline Cen-ter for Democracy. url: http://www.clinecenter.illinois.edu/research/sid-composition.html.
Dillon, Sara. (2003) Making Legal Regimes for Intercountry Adoption Reflect Human RightsPrinciples: Transforming the United Nations Convention on the Rights of the Child withthe Hague Convention on Intercountry Adoption. Boston University International LawJournal 21:179–258.
DMDC. (2014) US Defense Manpower Data Center. url: https://www.dmdc.osd.mil/appj/dwp/index.jsp.
29
Dubinsky, Karen. (2010) Babies without Borders: Adoption and Migration across the Amer-icas. New York: NYU Press.
Duncan, William. (2002) The Hague Convention on Protection of Children and Co-operationin Respect of Intercountry Adoption. In: ed. by Peter Selman. Intercountry Adoption:Developments, Trends, and Perspectives. London: British Agencies for Adoption andFostering:40–52.
Dustmann, Christian and Arthur van Soest. (2002) Language and the Earnings of Immi-grants. Industrial and Labor Relations Review 55(3):473–492.
Eijsink, Lua Janet. (2011) The Hague Convention on Intercountry Adoption: Policy andPublic Decision Making. Chrestomathy 10:27–54.
EM-Dat. (2013) The International Disaster Database. url: http : / / www . emdat . be /database.
Feenstra, Robert C., Robert Inklaar, and Marcel P. Timmer. (2013) The Next Generation ofthe Penn World Table. url: www.ggdc.net/pwt.
Fitzgerald, Jennifer, David Leblang, and Jessica Teets. (2014) Defying the Law of Gravity:The Political Economy of International Migration. World Politics.
Gleditsch, Kristian. (2004) A Revised List of Wars Between and Within Independent States,1816-2002. International Interactions 30(3):32.
Goldberg, Roberta. (1997) Adopting Romanian Children. Marriage & Family Review 25(1):79–98.
Gra�, E J. (2008) The Lie We Love. Foreign Policy 169:59–66.Groza, Victor, Scott D Ryan, and Scottye J Cash. (2003) Institutionalization, Behavior and
International Adoption: Predictors of Behavior Problems. Journal of Immigrant Health5(1):5–17.
Hansen, Mary Eschelbach and Daniel Pollack. (2006) The Regulation of Intercountry Adop-tion. Brandeis Law Journal 45:105–128.
HCCH. (2014) Hague Conference on Private International Law. url: http://www.hcch.net/index\_en.php.
Hellerstedt, Wendy L, Nikki J Madsen, Megan R Gunnar, Harold D Grotevant, Richard MLee, and Dana E Johnson. (2008) The International Adoption Project: Population-basedSurveillance of Minnesota Parents Who Adopted Children Internationally. Maternal andChild Health Journal 12(2):162–171.
Herszenhorn, David M. (2012) Citing Broken System, Critics Fight Russia’s Adoption Ban.New York Times (December 23).
Hogbacka, Riitta. (2008) The Quest for a Child of One’s Own: Parents, Markets, andTransnational Adoption. Journal of Comparative Family Studies 39(3):311–330.
30
Hollingsworth, Leslie Doty. (2003) International Adoption among Families in the UnitedStates: Considerations of Social Justice. Social Work 48(2):209–219.
Honaker, James, Gary King, and Matthew Blackwell. (2011) Amelia II: A Program forMissing Data. Journal of Statistical Software 45(7):1–47.
Hooge, Marc, Ann Trappers, Bart Meuleman, and Tim Reeskens. (2008) Migration to Euro-pean Countries: A Structural Explanation of Patterns, 1980-2004. International MigrationReview 42(2):476–504.
Howard, Cynthia R and Chandy C John. (2014) International Adoption. In: ed. by Gary WBrunette. CDC Health Information for International Travel. New York: Oxford UniversityPress:537–543.
Imai, Kosuke, Gary King, and Olivia Lau. (2007) Zelig: Everyone’s Statistical Software.IMF DOTS. (2010) IMF Direction of Trade Statistics (DOTS).Ishizawa, Hiromi and Kazuyo Kubo. (2014) Factors A�ecting Adoption Decisions: Child and
Parental Characteristics. Journal of Family Issues 35(5):627–653.Ishizawa, Hiromi, Catherine T Kenney, Kazuyo Kubo, and Gillian Stevens. (2006) Con-
structing Interracial Families Through Intercountry Adoption. Social Science Quarterly87(5):1207–1224.
Jacbos, Emma, Laurie C Miller, and Linda G Tirella. (2010) Developmental and BehavioralPerformance of Internationally Adopted Preschoolers: A Pilot Study. Child Psychiatryand Human Development 41(1):15–29.
Ju�er, Femmie and Marinus van Ijzendoorn. (2005) Behavior Problems and Mental HealthReferrals of International Adoptees. JAMA 293(2):2501–2515.
Kane, Saralee. (1993) The Movement of Children for International Adoption: An Epidemio-logic Perspective. Social Science Journal 30(4):323.
Kapur, Devesh and John McHale. (2006) Give Us Your Best and Brightest: The Global Huntfor Talent and Its Impact on the Developing World. Washington, D.C.: Center for GlobalDevelopment.
Karlan, Dean and John A List. (2007) Does Price Matter in Charitable Giving? Evidencefrom a Large-Scale Natural Field Experiment. American Economic Review 97(5):1774–1793.
Kim, Eleana. (2010) Adopted Territory: Transnational Korean Adoptees and the Politics ofBelonging. Durham, NC: Duke University Press.
Kimball, Caeli Eliz. (2005) Barriers to the Successful Implementation of the Hague Conven-tion on Protection of Children and Cooperation in Respect of Intercoutnry Adoption.Denver Journal of International Law and Policy 33:561–584.
31
King, Gary. (1989) Event Count Models for International Relations: Generalizations andApplications. International Studies Quarterly 33(2):123–147.
King, Gary, Michael Tomz, and Jason Wittenberg. (2000) Making the Most of StatisticalAnalyses: Improving Interpretation and Presentation. American Journal of Political Sci-ence 44(2):347.
Knowles, Stephen and Maros Servatka. (2013) Transaction Costs, the Opportunity Cost ofTime and Inertia in Charitable Giving. SSRN Working Paper.
La Porta, Rafael, Florencio Lopez-de Silanes, and Andrei Shleifer. (2008) The EconomicConsequences of Legal Origins. Journal of Economic Literature 46(2):285–332.
Leblang, David. (2010) Familiarity Breeds Investment: Diaspora Networks and InternationalInvestment. American Political Science Review 104(3):584–600.
— (2014) Harnessing the Diaspora: The Political Economy of Migrant Dual Citizenship.Working Paper.
Long, Andrew G, Timothy Nordstrom, and Kyeonghi Baek. (2007) Allying for Peace: TreatyObligations and Conflict between Allies. Journal of Politics 69(4):1103–1117.
Malm, Karin and Kate Welti. (2010) Exploring Motivations to Adopt. Adoption Quarterly13:185–208.
Massey, D S, J Arango, G Hugo, A Kouaouci, and A Pellegrino. (1999) Worlds in Motion:Understanding International Migration at the End of the Millennium: UnderstandingInternational Migration at the End of the Millennium. Oxford University Press.
Mayda, Anna Maria. (2010) International Migration: A Panel Data Analysis of the Deter-minants of Bilateral Flows. Journal of Population Economics 23(4):1249–1274.
McBride, Becca. (2013a) The Coevolution of Child-Flow Networks and Cooperative Behav-ior: A Network Analysis of Intercountry Adoption. Working Paper.
— (2013b) The Di�usion of Intercountry Adoption: Learning in the Global Arena. WorkingPaper.
— (2013c) The Heart and Hands of Christian Mobilization for Orphans: The Theologyof Adoption and Evangelical Protestant Christian Mobilization for Orphan Protection.Working Paper.
Menozzi, Clare and Barry Mirkin. (2007) Child Adoption: Path to Parenthood? Paper pre-sented at the annual meeting of the Population Association of America.
Miller, Laurie C. (2005) International Adoption: Infectious Diseases Issues. Clinical InfectiousDiseases 40(2):286–293.
Mullahy, John. (1986) Specification and Testing of Some Modified Count Data Models.Journal of Econometrics 33(3):341–365.
32
Rauch, James E and Vitor Trindade. (2002) Ethnic Chinese Networks in International Trade.The Review of Economics and Statistics 84(February):116–130.
Riley, Dylan and Rebecca Jean Emigh. (2002) Post-Colonial Journeys: Historical Roots ofImmigration and Integration. Comparative Sociology 1(2):169–191.
Roby, Jini L and Stacey A Shaw. (2006) The African Orphan Crisis and International Adop-tion. Social Work 51(3):199–210.
Rubin, Donald B. (1987) Multiple Imputation for Nonresponse in Surveys. Wiley.Sacerdote, Bruce. (2007) How Large are the E�ects from Changes in Family Environment? A
Study of Korean American Adoptees. The Quarterly Journal of Economics 122(1):119–157.
— (2011) Nature and Nurture E�ects On Children’s Outcomes: What Have We LearnedFrom Studies of Twins And Adoptees? In: ed. by Alberto Bisin Jess Benhabib andMatthew O Jackson B T Handbook of Social Economics. Vol. Volume 1. North-Holland:1–30.
Saunders, Robert A. (2007) Transnational Reproduction and Its Discontents: The Politicsof Intercountry Adoption in a Global Society. Journal of Global Change and Governance1(1):1–23.
Selman, Peter. (2006) Trends in Intercoutnry Adoption: Analysis of Data from 20 ReceivingCountries, 1998-2004. Journal of Population Research 23(2):183–204.
— (2009) The Rise and Fall of Intercountry Adoption in the 21st Century. InternationalSocial Work 52(5):575–594.
Simmons, Beth A. (2000) International Law and State Behavior: Commitment and Com-pliance in International Monetary A�airs. American Political Science Review 94(4):819–835.
Smolin, David M. (2006) Child Laundering: How the Intercountry Adoption System Legit-imizes and Incentivizes the Practices of Buying, Tra�cking, Kidnapping, and StealingChildren. Wayne Law Review 52:113–200.
— (2010) Child Laundering and the Hague Convention on Intercountry Adoption: The Fu-ture and Past of Intercountry Adoption. University of Louisville Law Review 48:441–498.
Steltzner, Donovan M. (2003) Intercountry Adoption: Toward A Regime that Recognizesthe ”Best Interests” of Adoptive Parents. Case Western Reserve Journal of InternationalLaw 35:113–152.
Swarns, Rachel L. (2012) A Family, for a Few Days a Year. New York Times (December 8).Tomz, Michael. (2007) Reputation and International Cooperation: Sovereign Debt across
Three Centuries. Princeton, N.J.: Princeton University Press.
33
UNHCR. (2011) The UN Refugee Agency. url: http://www.unhcr.org/pages/49c3646c4d6.html.
United Nations. (2009) Child Adoption: Trends and Policies. Tech. rep. United Nations.US Department of State. (2014a) FY 2013 Annual Report on Intercountry Adoption.— (2014b) International Adoption from A to Z.USAID. (2010) Greenbook, U.S. Overseas Loans and Grants. url: http : / / gbk . eads .
usaidallnet.gov/.Varnis, Steven L. (2001) Regulating the Global Adoption of Children. Society 38(2):39–46.Voigt, Kevin and Sophie Brown. (2013) International Adoptions in Decline as Number of
Orphans Grows. CNN :September 17.WDI. (2013) World Bank World Development Indicators. url: http://data.worldbank.
org/data-catalog/world-development-indicators.Welsh, Janet A, Andres G Viana, Stephen A Petrill, and Matthew D Mathias. (2007) Inter-
ventions for Internationally Adopted Children and Families: A Review of the Literature.Child and Adolescent Social Work Journal 24(3):285–311.
WGI. (2013) Worldwide Governance Indicator (WGI). url: http://info.worldbank.org/governance/wgi/index.aspx\#home.
Worthington, Rebecca. (2009) The Road to Parentless Children Is Paved with Good Inten-tions: How the Hague Convention and Recent Intercountry Adoption Rules Are A�ectingPotential Parents and the Best Interests of Children. Duke Journal of Comparative andInternational Law 19:559–586.
Wydick, Bruce, Paul Glewwe, and Laine Rutledge. (2013) Does International Child Sponsor-ship Work? A Six-Country Study of Impacts on Adult Life Outcomes. Journal of PoliticalEconomy 121(2):393–436.
Young, Alexandra. (2012) Choosing Intercountry Adoption: An Australian Study of theMotivations and Attitudes of Intending and Recent Adoptive Parents. Australian Journalof Social Issues 47(2):221–241.
Zeileis, Achim, Christian Kleiber, and Simon Jackman. (2008) Regression Models for CountData in R. Journal of Statistical Software 27(8).
Zhang, Yuanting and Gary R Lee. (2011) Intercountry Versus Transracial Adoption: Analysisof Adoptive Parents’ Motivations and Preferences in Adoption. Journal of Family Issues32(1):75–98.
34
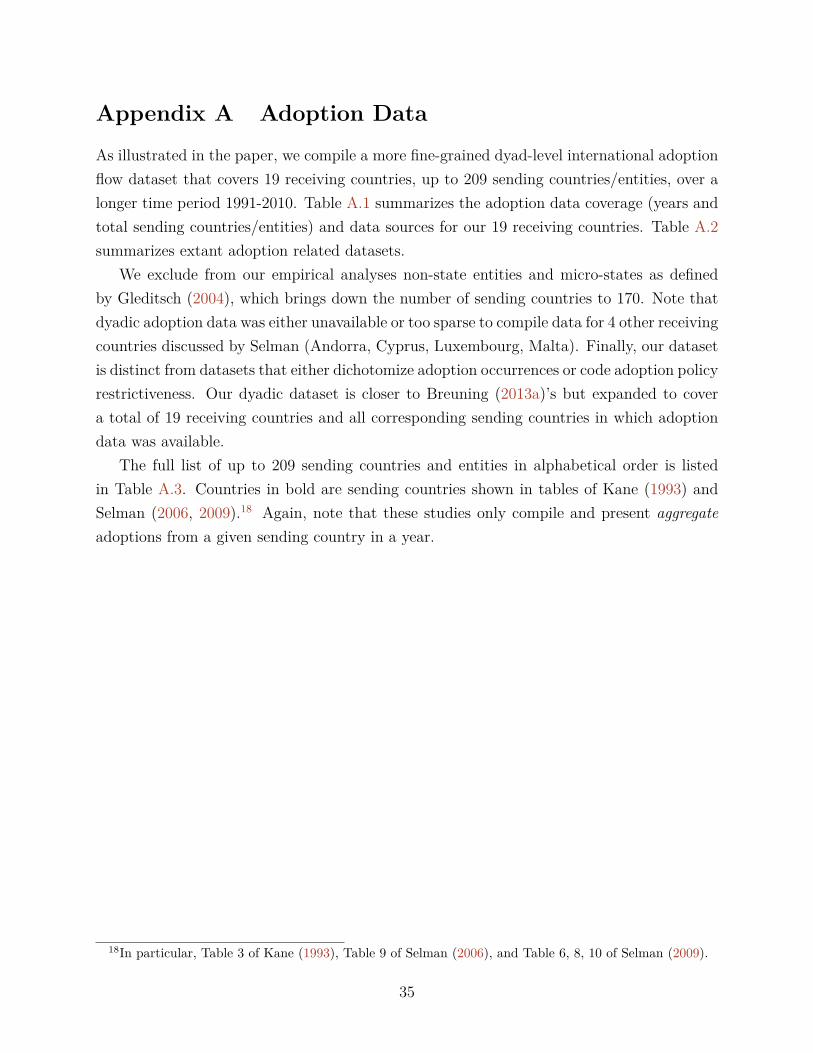
Appendix A Adoption DataAs illustrated in the paper, we compile a more fine-grained dyad-level international adoptionflow dataset that covers 19 receiving countries, up to 209 sending countries/entities, over alonger time period 1991-2010. Table A.1 summarizes the adoption data coverage (years andtotal sending countries/entities) and data sources for our 19 receiving countries. Table A.2summarizes extant adoption related datasets.
We exclude from our empirical analyses non-state entities and micro-states as definedby Gleditsch (2004), which brings down the number of sending countries to 170. Note thatdyadic adoption data was either unavailable or too sparse to compile data for 4 other receivingcountries discussed by Selman (Andorra, Cyprus, Luxembourg, Malta). Finally, our datasetis distinct from datasets that either dichotomize adoption occurrences or code adoption policyrestrictiveness. Our dyadic dataset is closer to Breuning (2013a)’s but expanded to covera total of 19 receiving countries and all corresponding sending countries in which adoptiondata was available.
The full list of up to 209 sending countries and entities in alphabetical order is listedin Table A.3. Countries in bold are sending countries shown in tables of Kane (1993) andSelman (2006, 2009).18 Again, note that these studies only compile and present aggregateadoptions from a given sending country in a year.
18In particular, Table 3 of Kane (1993), Table 9 of Selman (2006), and Table 6, 8, 10 of Selman (2009).
35
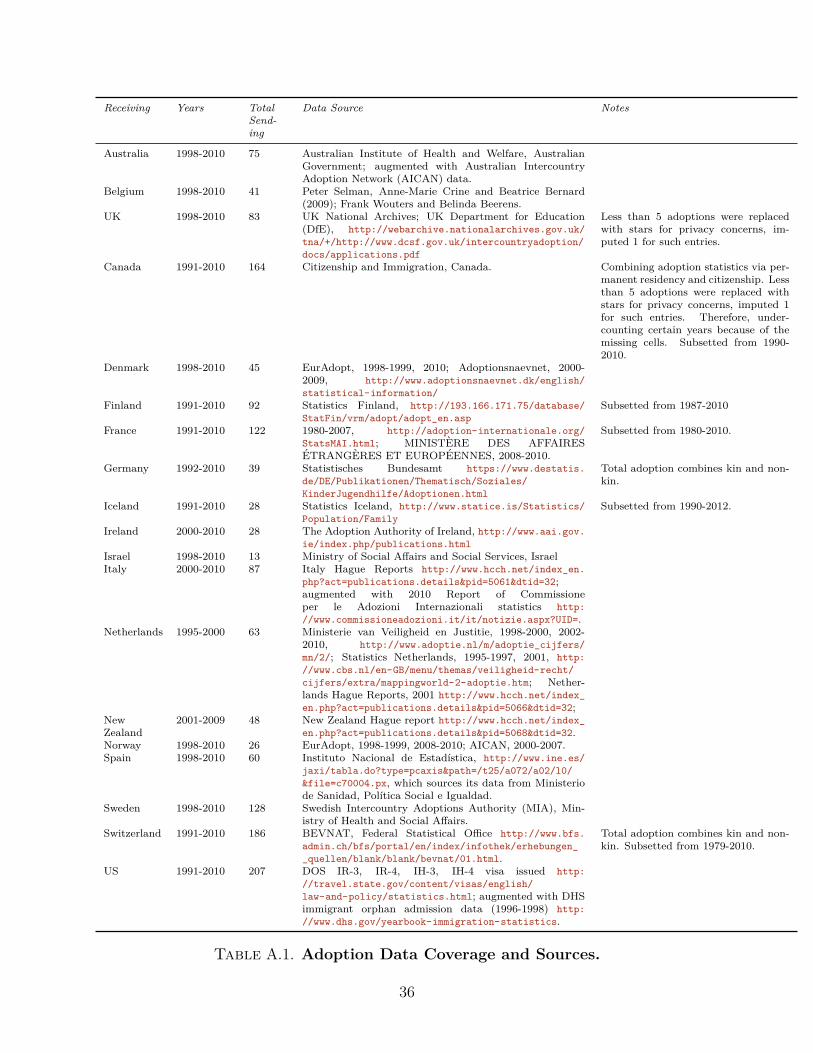
Receiving Years TotalSend-ing
Data Source Notes
Australia 1998-2010 75 Australian Institute of Health and Welfare, AustralianGovernment; augmented with Australian IntercountryAdoption Network (AICAN) data.
Belgium 1998-2010 41 Peter Selman, Anne-Marie Crine and Beatrice Bernard(2009); Frank Wouters and Belinda Beerens.
UK 1998-2010 83 UK National Archives; UK Department for Education(DfE), http://webarchive.nationalarchives.gov.uk/
tna/+/http://www.dcsf.gov.uk/intercountryadoption/
docs/applications.pdf
Less than 5 adoptions were replacedwith stars for privacy concerns, im-puted 1 for such entries.
Canada 1991-2010 164 Citizenship and Immigration, Canada. Combining adoption statistics via per-manent residency and citizenship. Lessthan 5 adoptions were replaced withstars for privacy concerns, imputed 1for such entries. Therefore, under-counting certain years because of themissing cells. Subsetted from 1990-2010.
Denmark 1998-2010 45 EurAdopt, 1998-1999, 2010; Adoptionsnaevnet, 2000-2009, http://www.adoptionsnaevnet.dk/english/
statistical-information/
Finland 1991-2010 92 Statistics Finland, http://193.166.171.75/database/
StatFin/vrm/adopt/adopt_en.asp
Subsetted from 1987-2010
France 1991-2010 122 1980-2007, http://adoption-internationale.org/
StatsMAI.html; MINISTERE DES AFFAIRESETRANGERES ET EUROPEENNES, 2008-2010.
Subsetted from 1980-2010.
Germany 1992-2010 39 Statistisches Bundesamt https://www.destatis.
de/DE/Publikationen/Thematisch/Soziales/
KinderJugendhilfe/Adoptionen.html
Total adoption combines kin and non-kin.
Iceland 1991-2010 28 Statistics Iceland, http://www.statice.is/Statistics/
Population/Family
Subsetted from 1990-2012.
Ireland 2000-2010 28 The Adoption Authority of Ireland, http://www.aai.gov.
ie/index.php/publications.html
Israel 1998-2010 13 Ministry of Social A�airs and Social Services, IsraelItaly 2000-2010 87 Italy Hague Reports http://www.hcch.net/index_en.
php?act=publications.details&pid=5061&dtid=32;augmented with 2010 Report of Commissioneper le Adozioni Internazionali statistics http:
//www.commissioneadozioni.it/it/notizie.aspx?UID=.Netherlands 1995-2000 63 Ministerie van Veiligheid en Justitie, 1998-2000, 2002-
2010, http://www.adoptie.nl/m/adoptie_cijfers/
mn/2/; Statistics Netherlands, 1995-1997, 2001, http:
//www.cbs.nl/en-GB/menu/themas/veiligheid-recht/
cijfers/extra/mappingworld-2-adoptie.htm; Nether-lands Hague Reports, 2001 http://www.hcch.net/index_
en.php?act=publications.details&pid=5066&dtid=32;NewZealand
2001-2009 48 New Zealand Hague report http://www.hcch.net/index_
en.php?act=publications.details&pid=5068&dtid=32.Norway 1998-2010 26 EurAdopt, 1998-1999, 2008-2010; AICAN, 2000-2007.Spain 1998-2010 60 Instituto Nacional de Estadıstica, http://www.ine.es/
jaxi/tabla.do?type=pcaxis&path=/t25/a072/a02/l0/
&file=c70004.px, which sources its data from Ministeriode Sanidad, Polıtica Social e Igualdad.
Sweden 1998-2010 128 Swedish Intercountry Adoptions Authority (MIA), Min-istry of Health and Social A�airs.
Switzerland 1991-2010 186 BEVNAT, Federal Statistical O�ce http://www.bfs.
admin.ch/bfs/portal/en/index/infothek/erhebungen_
_quellen/blank/blank/bevnat/01.html.
Total adoption combines kin and non-kin. Subsetted from 1979-2010.
US 1991-2010 207 DOS IR-3, IR-4, IH-3, IH-4 visa issued http:
//travel.state.gov/content/visas/english/
law-and-policy/statistics.html; augmented with DHSimmigrant orphan admission data (1996-1998) http:
//www.dhs.gov/yearbook-immigration-statistics.
Table A.1. Adoption Data Coverage and Sources.
36
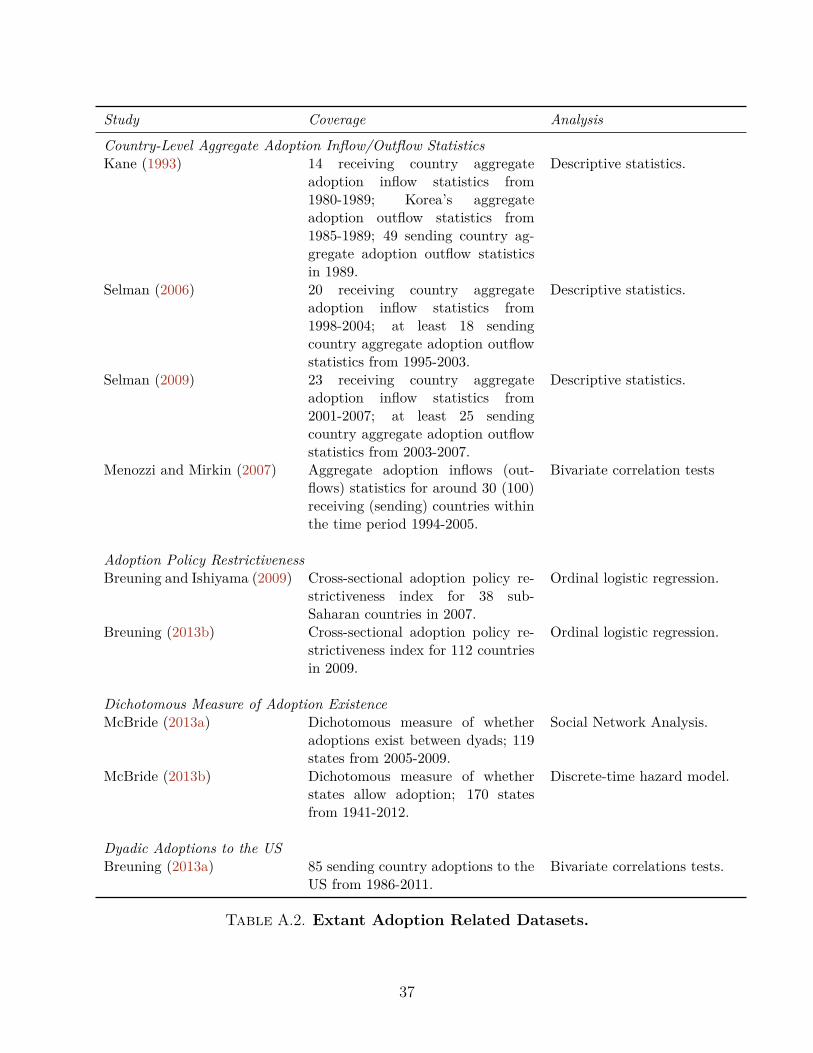
Study Coverage Analysis
Country-Level Aggregate Adoption Inflow/Outflow StatisticsKane (1993) 14 receiving country aggregate
adoption inflow statistics from1980-1989; Korea’s aggregateadoption outflow statistics from1985-1989; 49 sending country ag-gregate adoption outflow statisticsin 1989.
Descriptive statistics.
Selman (2006) 20 receiving country aggregateadoption inflow statistics from1998-2004; at least 18 sendingcountry aggregate adoption outflowstatistics from 1995-2003.
Descriptive statistics.
Selman (2009) 23 receiving country aggregateadoption inflow statistics from2001-2007; at least 25 sendingcountry aggregate adoption outflowstatistics from 2003-2007.
Descriptive statistics.
Menozzi and Mirkin (2007) Aggregate adoption inflows (out-flows) statistics for around 30 (100)receiving (sending) countries withinthe time period 1994-2005.
Bivariate correlation tests
Adoption Policy RestrictivenessBreuning and Ishiyama (2009) Cross-sectional adoption policy re-
strictiveness index for 38 sub-Saharan countries in 2007.
Ordinal logistic regression.
Breuning (2013b) Cross-sectional adoption policy re-strictiveness index for 112 countriesin 2009.
Ordinal logistic regression.
Dichotomous Measure of Adoption ExistenceMcBride (2013a) Dichotomous measure of whether
adoptions exist between dyads; 119states from 2005-2009.
Social Network Analysis.
McBride (2013b) Dichotomous measure of whetherstates allow adoption; 170 statesfrom 1941-2012.
Discrete-time hazard model.
Dyadic Adoptions to the USBreuning (2013a) 85 sending country adoptions to the
US from 1986-2011.Bivariate correlations tests.
Table A.2. Extant Adoption Related Datasets.
37
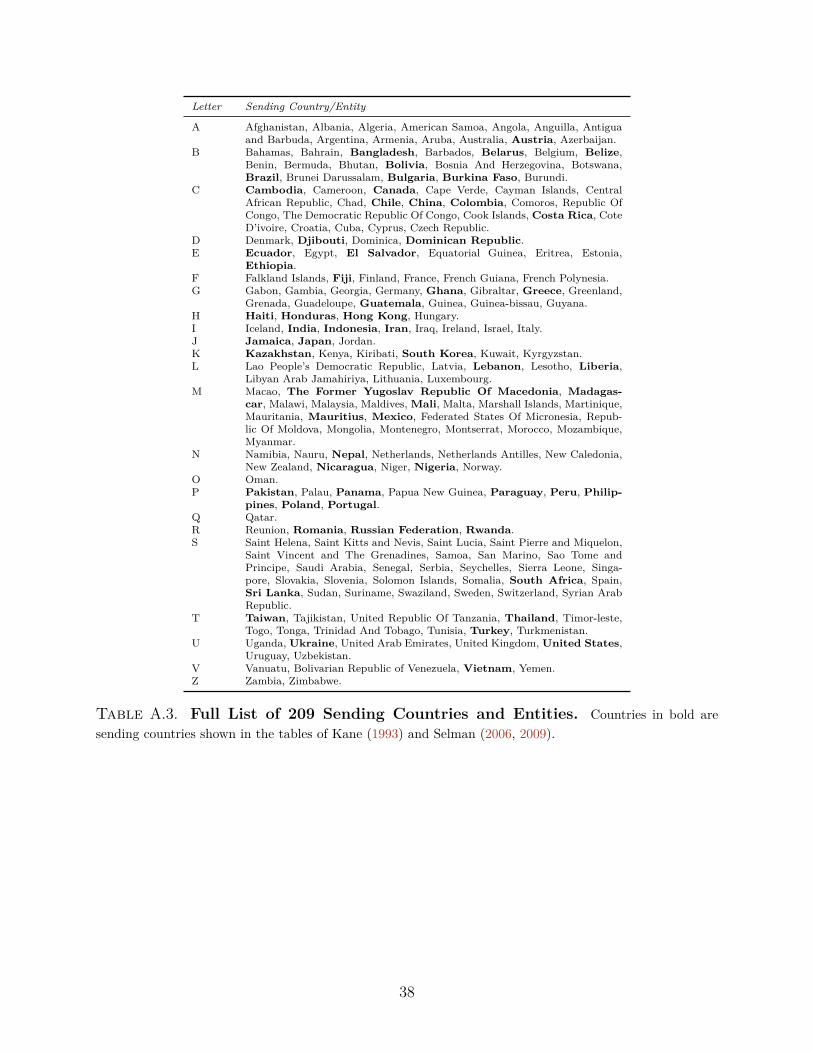
Letter Sending Country/Entity
A Afghanistan, Albania, Algeria, American Samoa, Angola, Anguilla, Antiguaand Barbuda, Argentina, Armenia, Aruba, Australia, Austria, Azerbaijan.
B Bahamas, Bahrain, Bangladesh, Barbados, Belarus, Belgium, Belize,Benin, Bermuda, Bhutan, Bolivia, Bosnia And Herzegovina, Botswana,Brazil, Brunei Darussalam, Bulgaria, Burkina Faso, Burundi.
C Cambodia, Cameroon, Canada, Cape Verde, Cayman Islands, CentralAfrican Republic, Chad, Chile, China, Colombia, Comoros, Republic OfCongo, The Democratic Republic Of Congo, Cook Islands, Costa Rica, CoteD’ivoire, Croatia, Cuba, Cyprus, Czech Republic.
D Denmark, Djibouti, Dominica, Dominican Republic.E Ecuador, Egypt, El Salvador, Equatorial Guinea, Eritrea, Estonia,
Ethiopia.F Falkland Islands, Fiji, Finland, France, French Guiana, French Polynesia.G Gabon, Gambia, Georgia, Germany, Ghana, Gibraltar, Greece, Greenland,
Grenada, Guadeloupe, Guatemala, Guinea, Guinea-bissau, Guyana.H Haiti, Honduras, Hong Kong, Hungary.I Iceland, India, Indonesia, Iran, Iraq, Ireland, Israel, Italy.J Jamaica, Japan, Jordan.K Kazakhstan, Kenya, Kiribati, South Korea, Kuwait, Kyrgyzstan.L Lao People’s Democratic Republic, Latvia, Lebanon, Lesotho, Liberia,
Libyan Arab Jamahiriya, Lithuania, Luxembourg.M Macao, The Former Yugoslav Republic Of Macedonia, Madagas-
car, Malawi, Malaysia, Maldives, Mali, Malta, Marshall Islands, Martinique,Mauritania, Mauritius, Mexico, Federated States Of Micronesia, Repub-lic Of Moldova, Mongolia, Montenegro, Montserrat, Morocco, Mozambique,Myanmar.
N Namibia, Nauru, Nepal, Netherlands, Netherlands Antilles, New Caledonia,New Zealand, Nicaragua, Niger, Nigeria, Norway.
O Oman.P Pakistan, Palau, Panama, Papua New Guinea, Paraguay, Peru, Philip-
pines, Poland, Portugal.Q Qatar.R Reunion, Romania, Russian Federation, Rwanda.S Saint Helena, Saint Kitts and Nevis, Saint Lucia, Saint Pierre and Miquelon,
Saint Vincent and The Grenadines, Samoa, San Marino, Sao Tome andPrincipe, Saudi Arabia, Senegal, Serbia, Seychelles, Sierra Leone, Singa-pore, Slovakia, Slovenia, Solomon Islands, Somalia, South Africa, Spain,Sri Lanka, Sudan, Suriname, Swaziland, Sweden, Switzerland, Syrian ArabRepublic.
T Taiwan, Tajikistan, United Republic Of Tanzania, Thailand, Timor-leste,Togo, Tonga, Trinidad And Tobago, Tunisia, Turkey, Turkmenistan.
U Uganda, Ukraine, United Arab Emirates, United Kingdom, United States,Uruguay, Uzbekistan.
V Vanuatu, Bolivarian Republic of Venezuela, Vietnam, Yemen.Z Zambia, Zimbabwe.
Table A.3. Full List of 209 Sending Countries and Entities. Countries in bold aresending countries shown in the tables of Kane (1993) and Selman (2006, 2009).
38
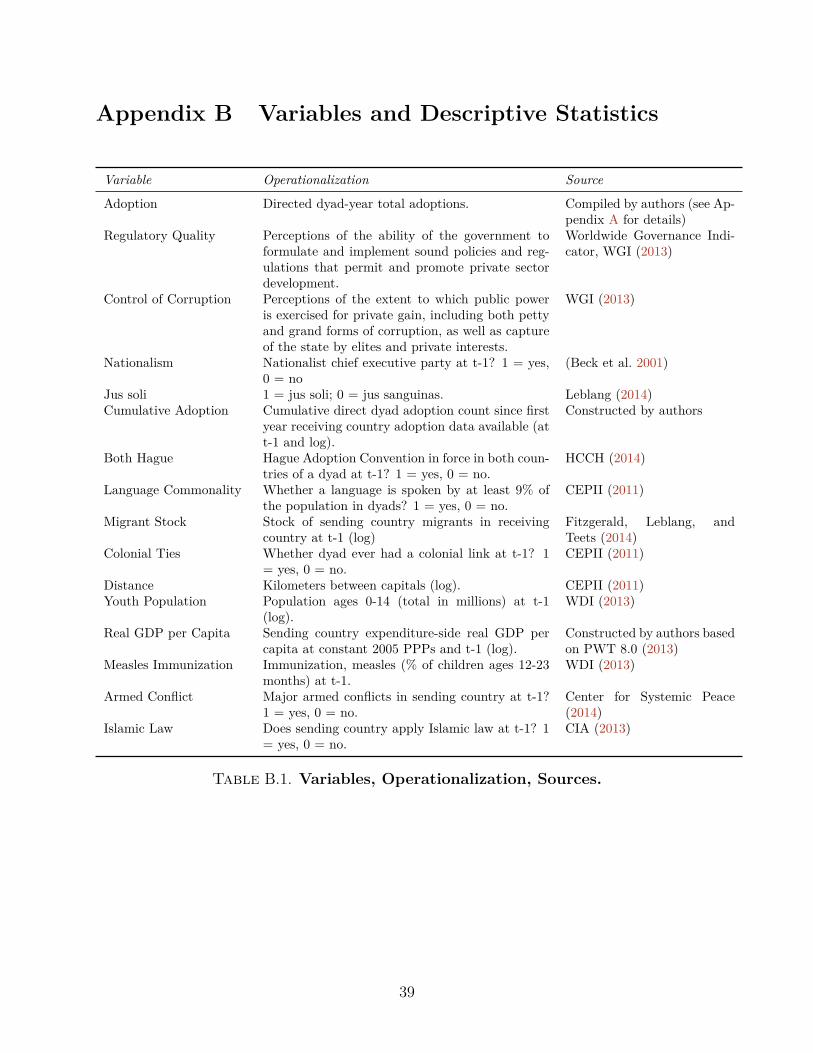
Appendix B Variables and Descriptive Statistics
Variable Operationalization Source
Adoption Directed dyad-year total adoptions. Compiled by authors (see Ap-pendix A for details)
Regulatory Quality Perceptions of the ability of the government toformulate and implement sound policies and reg-ulations that permit and promote private sectordevelopment.
Worldwide Governance Indi-cator, WGI (2013)
Control of Corruption Perceptions of the extent to which public poweris exercised for private gain, including both pettyand grand forms of corruption, as well as captureof the state by elites and private interests.
WGI (2013)
Nationalism Nationalist chief executive party at t-1? 1 = yes,0 = no
(Beck et al. 2001)
Jus soli 1 = jus soli; 0 = jus sanguinas. Leblang (2014)Cumulative Adoption Cumulative direct dyad adoption count since first
year receiving country adoption data available (att-1 and log).
Constructed by authors
Both Hague Hague Adoption Convention in force in both coun-tries of a dyad at t-1? 1 = yes, 0 = no.
HCCH (2014)
Language Commonality Whether a language is spoken by at least 9% ofthe population in dyads? 1 = yes, 0 = no.
CEPII (2011)
Migrant Stock Stock of sending country migrants in receivingcountry at t-1 (log)
Fitzgerald, Leblang, andTeets (2014)
Colonial Ties Whether dyad ever had a colonial link at t-1? 1= yes, 0 = no.
CEPII (2011)
Distance Kilometers between capitals (log). CEPII (2011)Youth Population Population ages 0-14 (total in millions) at t-1
(log).WDI (2013)
Real GDP per Capita Sending country expenditure-side real GDP percapita at constant 2005 PPPs and t-1 (log).
Constructed by authors basedon PWT 8.0 (2013)
Measles Immunization Immunization, measles (% of children ages 12-23months) at t-1.
WDI (2013)
Armed Conflict Major armed conflicts in sending country at t-1?1 = yes, 0 = no.
Center for Systemic Peace(2014)
Islamic Law Does sending country apply Islamic law at t-1? 1= yes, 0 = no.
CIA (2013)
Table B.1. Variables, Operationalization, Sources.
39
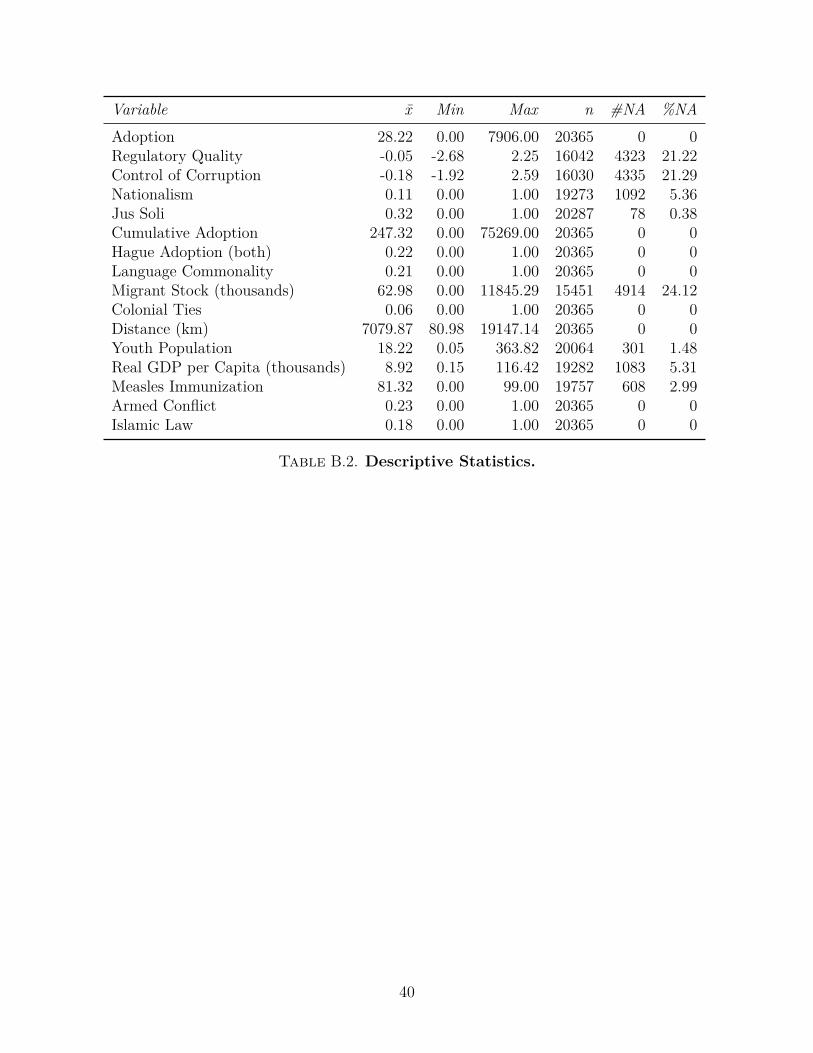
Variable x Min Max n #NA %NAAdoption 28.22 0.00 7906.00 20365 0 0Regulatory Quality -0.05 -2.68 2.25 16042 4323 21.22Control of Corruption -0.18 -1.92 2.59 16030 4335 21.29Nationalism 0.11 0.00 1.00 19273 1092 5.36Jus Soli 0.32 0.00 1.00 20287 78 0.38Cumulative Adoption 247.32 0.00 75269.00 20365 0 0Hague Adoption (both) 0.22 0.00 1.00 20365 0 0Language Commonality 0.21 0.00 1.00 20365 0 0Migrant Stock (thousands) 62.98 0.00 11845.29 15451 4914 24.12Colonial Ties 0.06 0.00 1.00 20365 0 0Distance (km) 7079.87 80.98 19147.14 20365 0 0Youth Population 18.22 0.05 363.82 20064 301 1.48Real GDP per Capita (thousands) 8.92 0.15 116.42 19282 1083 5.31Measles Immunization 81.32 0.00 99.00 19757 608 2.99Armed Conflict 0.23 0.00 1.00 20365 0 0Islamic Law 0.18 0.00 1.00 20365 0 0
Table B.2. Descriptive Statistics.
40
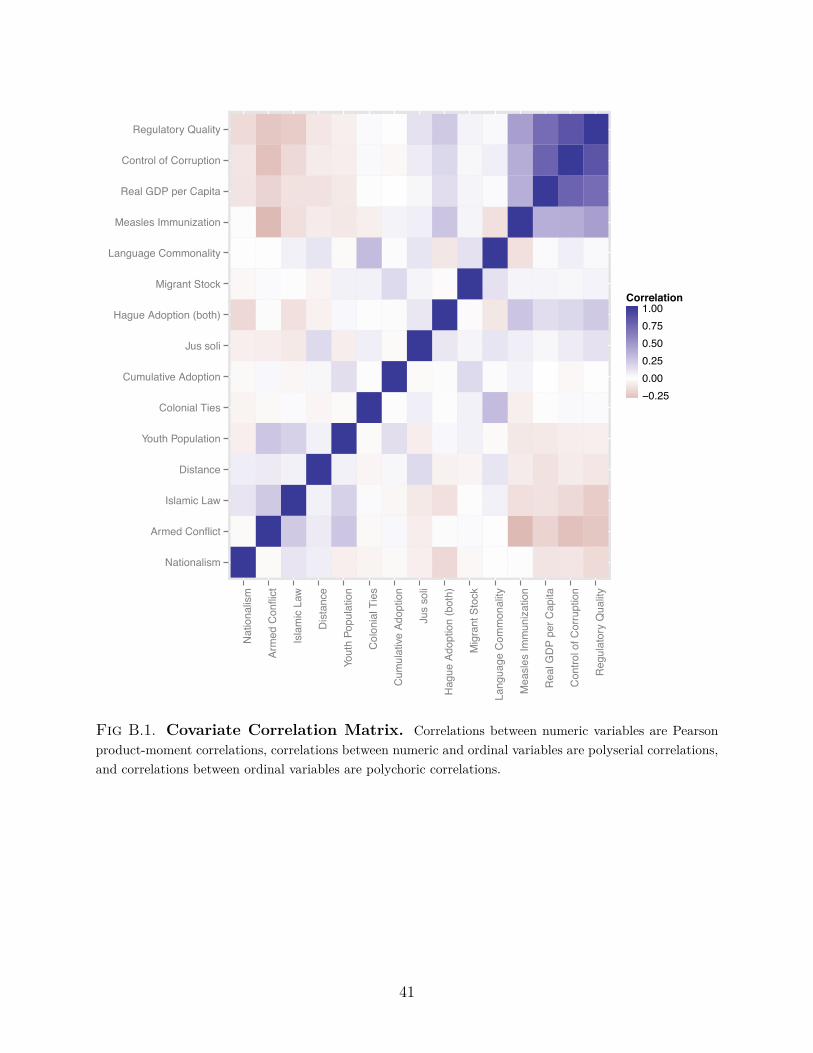
Nationalism
Armed Conflict
Islamic Law
Distance
Youth Population
Colonial Ties
Cumulative Adoption
Jus soli
Hague Adoption (both)
Migrant Stock
Language Commonality
Measles Immunization
Real GDP per Capita
Control of Corruption
Regulatory Quality
Nat
iona
lism
Arm
ed C
onfli
ct
Isla
mic
Law
Dis
tanc
e
Yout
h Po
pula
tion
Col
onia
l Tie
s
Cum
ulat
ive A
dopt
ion
Jus
soli
Hag
ue A
dopt
ion
(bot
h)
Mig
rant
Sto
ck
Lang
uage
Com
mon
ality
Mea
sles
Imm
uniz
atio
n
Rea
l GD
P pe
r Cap
ita
Con
trol o
f Cor
rupt
ion
Reg
ulat
ory
Qua
lity
−0.250.000.250.500.751.00
Correlation
Fig B.1. Covariate Correlation Matrix. Correlations between numeric variables are Pearsonproduct-moment correlations, correlations between numeric and ordinal variables are polyserial correlations,and correlations between ordinal variables are polychoric correlations.
41
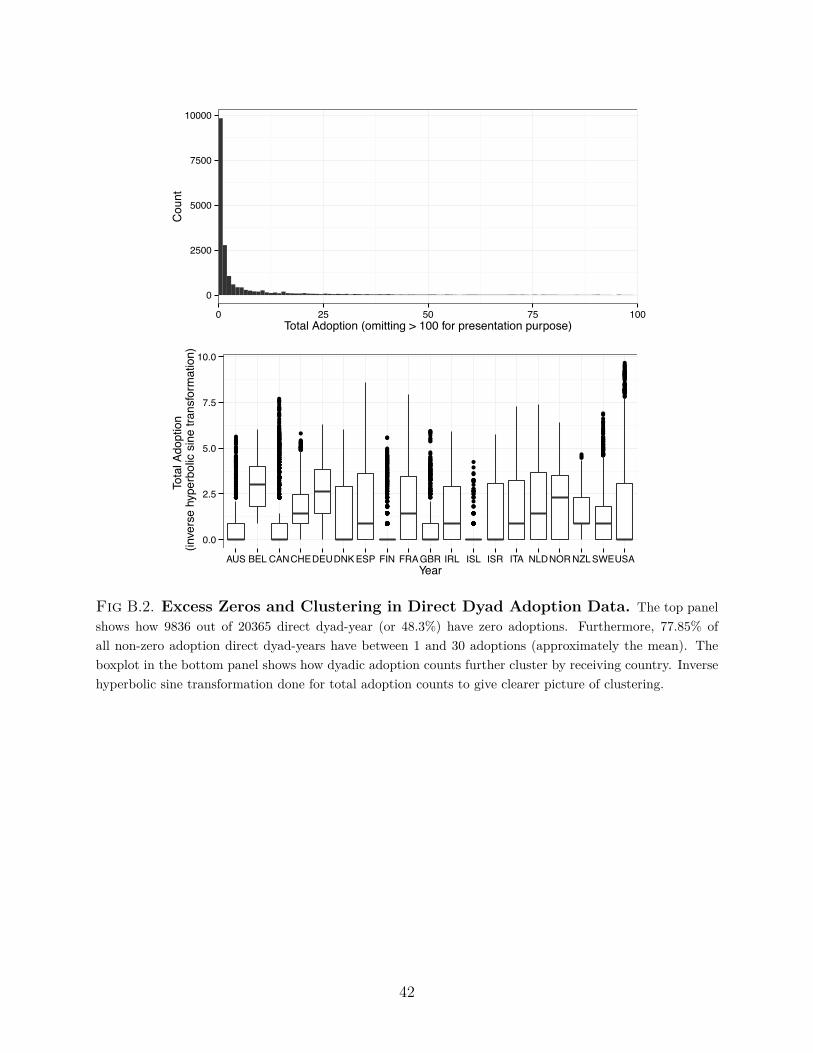
0
2500
5000
7500
10000
0 25 50 75 100Total Adoption (omitting > 100 for presentation purpose)
Cou
nt
0.0
2.5
5.0
7.5
10.0
AUS BEL CANCHEDEUDNK ESP FIN FRA GBR IRL ISL ISR ITA NLDNOR NZL SWEUSAYear
Tota
l Ado
ptio
n (i
nver
se h
yper
bolic
sin
e tra
nsfo
rmat
ion)
Fig B.2. Excess Zeros and Clustering in Direct Dyad Adoption Data. The top panelshows how 9836 out of 20365 direct dyad-year (or 48.3%) have zero adoptions. Furthermore, 77.85% ofall non-zero adoption direct dyad-years have between 1 and 30 adoptions (approximately the mean). Theboxplot in the bottom panel shows how dyadic adoption counts further cluster by receiving country. Inversehyperbolic sine transformation done for total adoption counts to give clearer picture of clustering.
42
Appendix C Imputation ModelOur Amelia multiple imputation model includes adoption count as the dependent variableand 55 covariates additional to the ones in Table B.1. Table C.1 summarizes these addi-tional covariates. A codebook with details on all variables in our empirics and the R codeimplementing the imputation model will be included in our replication materials.19
19Subscript “L1” indicates variable lagged at t-1, subscript “o” indicates origin country characteristic, andsubscript “d” indicates destination country characteristic.
43
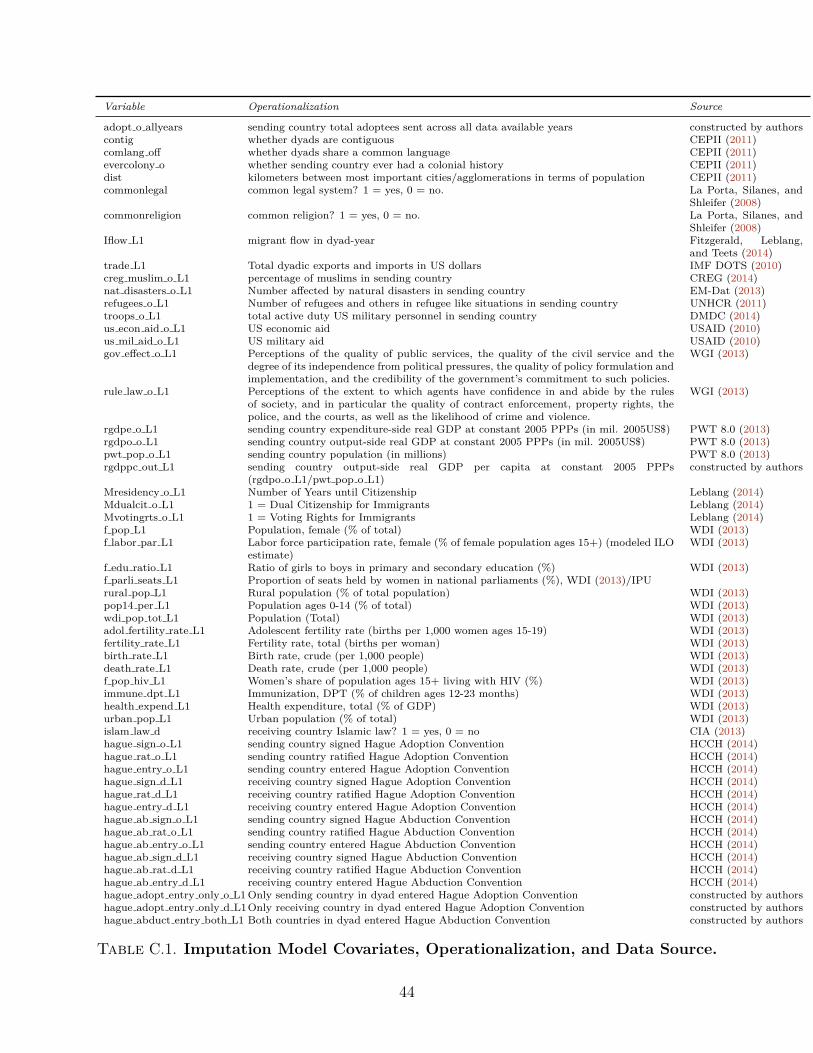
Variable Operationalization Source
adopt o allyears sending country total adoptees sent across all data available years constructed by authorscontig whether dyads are contiguous CEPII (2011)comlang o� whether dyads share a common language CEPII (2011)evercolony o whether sending country ever had a colonial history CEPII (2011)dist kilometers between most important cities/agglomerations in terms of population CEPII (2011)commonlegal common legal system? 1 = yes, 0 = no. La Porta, Silanes, and
Shleifer (2008)commonreligion common religion? 1 = yes, 0 = no. La Porta, Silanes, and
Shleifer (2008)Iflow L1 migrant flow in dyad-year Fitzgerald, Leblang,
and Teets (2014)trade L1 Total dyadic exports and imports in US dollars IMF DOTS (2010)creg muslim o L1 percentage of muslims in sending country CREG (2014)nat disasters o L1 Number a�ected by natural disasters in sending country EM-Dat (2013)refugees o L1 Number of refugees and others in refugee like situations in sending country UNHCR (2011)troops o L1 total active duty US military personnel in sending country DMDC (2014)us econ aid o L1 US economic aid USAID (2010)us mil aid o L1 US military aid USAID (2010)gov e�ect o L1 Perceptions of the quality of public services, the quality of the civil service and the
degree of its independence from political pressures, the quality of policy formulation andimplementation, and the credibility of the government’s commitment to such policies.
WGI (2013)
rule law o L1 Perceptions of the extent to which agents have confidence in and abide by the rulesof society, and in particular the quality of contract enforcement, property rights, thepolice, and the courts, as well as the likelihood of crime and violence.
WGI (2013)
rgdpe o L1 sending country expenditure-side real GDP at constant 2005 PPPs (in mil. 2005US$) PWT 8.0 (2013)rgdpo o L1 sending country output-side real GDP at constant 2005 PPPs (in mil. 2005US$) PWT 8.0 (2013)pwt pop o L1 sending country population (in millions) PWT 8.0 (2013)rgdppc out L1 sending country output-side real GDP per capita at constant 2005 PPPs
(rgdpo o L1/pwt pop o L1)constructed by authors
Mresidency o L1 Number of Years until Citizenship Leblang (2014)Mdualcit o L1 1 = Dual Citizenship for Immigrants Leblang (2014)Mvotingrts o L1 1 = Voting Rights for Immigrants Leblang (2014)f pop L1 Population, female (% of total) WDI (2013)f labor par L1 Labor force participation rate, female (% of female population ages 15+) (modeled ILO
estimate)WDI (2013)
f edu ratio L1 Ratio of girls to boys in primary and secondary education (%) WDI (2013)f parli seats L1 Proportion of seats held by women in national parliaments (%), WDI (2013)/IPUrural pop L1 Rural population (% of total population) WDI (2013)pop14 per L1 Population ages 0-14 (% of total) WDI (2013)wdi pop tot L1 Population (Total) WDI (2013)adol fertility rate L1 Adolescent fertility rate (births per 1,000 women ages 15-19) WDI (2013)fertility rate L1 Fertility rate, total (births per woman) WDI (2013)birth rate L1 Birth rate, crude (per 1,000 people) WDI (2013)death rate L1 Death rate, crude (per 1,000 people) WDI (2013)f pop hiv L1 Women’s share of population ages 15+ living with HIV (%) WDI (2013)immune dpt L1 Immunization, DPT (% of children ages 12-23 months) WDI (2013)health expend L1 Health expenditure, total (% of GDP) WDI (2013)urban pop L1 Urban population (% of total) WDI (2013)islam law d receiving country Islamic law? 1 = yes, 0 = no CIA (2013)hague sign o L1 sending country signed Hague Adoption Convention HCCH (2014)hague rat o L1 sending country ratified Hague Adoption Convention HCCH (2014)hague entry o L1 sending country entered Hague Adoption Convention HCCH (2014)hague sign d L1 receiving country signed Hague Adoption Convention HCCH (2014)hague rat d L1 receiving country ratified Hague Adoption Convention HCCH (2014)hague entry d L1 receiving country entered Hague Adoption Convention HCCH (2014)hague ab sign o L1 sending country signed Hague Abduction Convention HCCH (2014)hague ab rat o L1 sending country ratified Hague Abduction Convention HCCH (2014)hague ab entry o L1 sending country entered Hague Abduction Convention HCCH (2014)hague ab sign d L1 receiving country signed Hague Abduction Convention HCCH (2014)hague ab rat d L1 receiving country ratified Hague Abduction Convention HCCH (2014)hague ab entry d L1 receiving country entered Hague Abduction Convention HCCH (2014)hague adopt entry only o L1 Only sending country in dyad entered Hague Adoption Convention constructed by authorshague adopt entry only d L1Only receiving country in dyad entered Hague Adoption Convention constructed by authorshague abduct entry both L1 Both countries in dyad entered Hague Abduction Convention constructed by authors
Table C.1. Imputation Model Covariates, Operationalization, and Data Source.
44
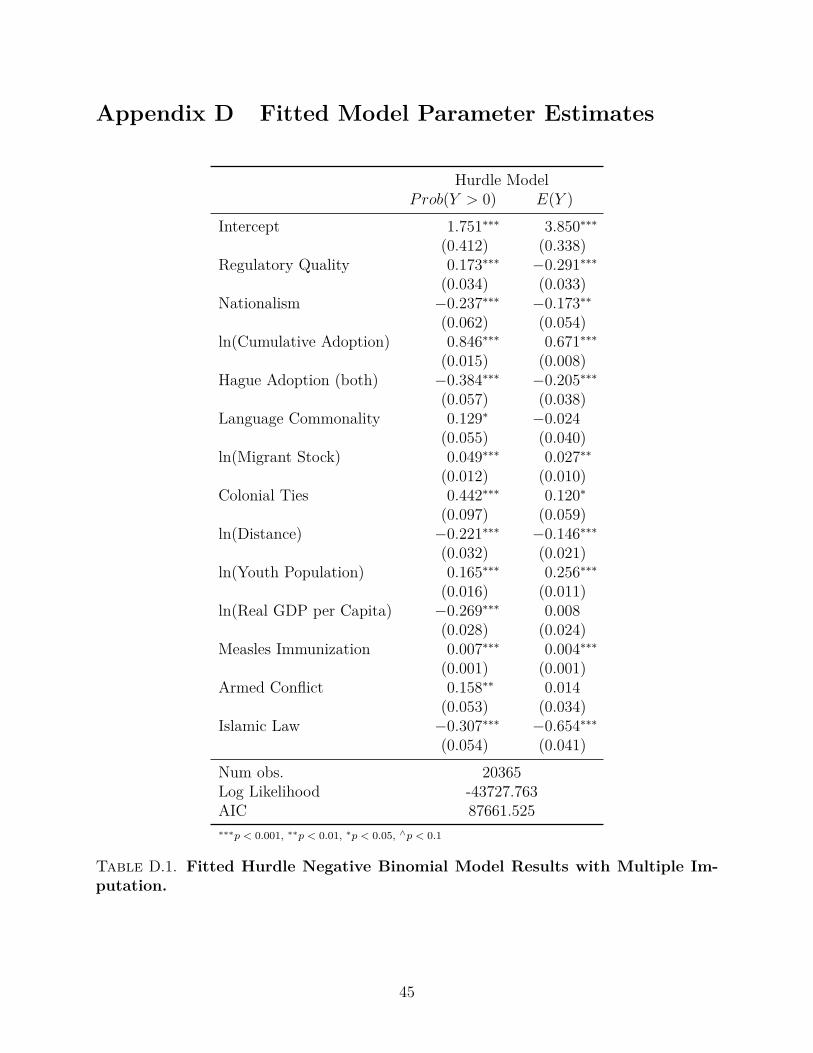
Appendix D Fitted Model Parameter Estimates
Hurdle ModelProb(Y > 0) E(Y )
Intercept 1.751úúú 3.850úúú
(0.412) (0.338)Regulatory Quality 0.173úúú ≠0.291úúú
(0.034) (0.033)Nationalism ≠0.237úúú ≠0.173úú
(0.062) (0.054)ln(Cumulative Adoption) 0.846úúú 0.671úúú
(0.015) (0.008)Hague Adoption (both) ≠0.384úúú ≠0.205úúú
(0.057) (0.038)Language Commonality 0.129ú ≠0.024
(0.055) (0.040)ln(Migrant Stock) 0.049úúú 0.027úú
(0.012) (0.010)Colonial Ties 0.442úúú 0.120ú
(0.097) (0.059)ln(Distance) ≠0.221úúú ≠0.146úúú
(0.032) (0.021)ln(Youth Population) 0.165úúú 0.256úúú
(0.016) (0.011)ln(Real GDP per Capita) ≠0.269úúú 0.008
(0.028) (0.024)Measles Immunization 0.007úúú 0.004úúú
(0.001) (0.001)Armed Conflict 0.158úú 0.014
(0.053) (0.034)Islamic Law ≠0.307úúú ≠0.654úúú
(0.054) (0.041)Num obs. 20365Log Likelihood -43727.763AIC 87661.525úúú
p < 0.001, úúp < 0.01, ú
p < 0.05, ·p < 0.1
Table D.1. Fitted Hurdle Negative Binomial Model Results with Multiple Im-putation.
45
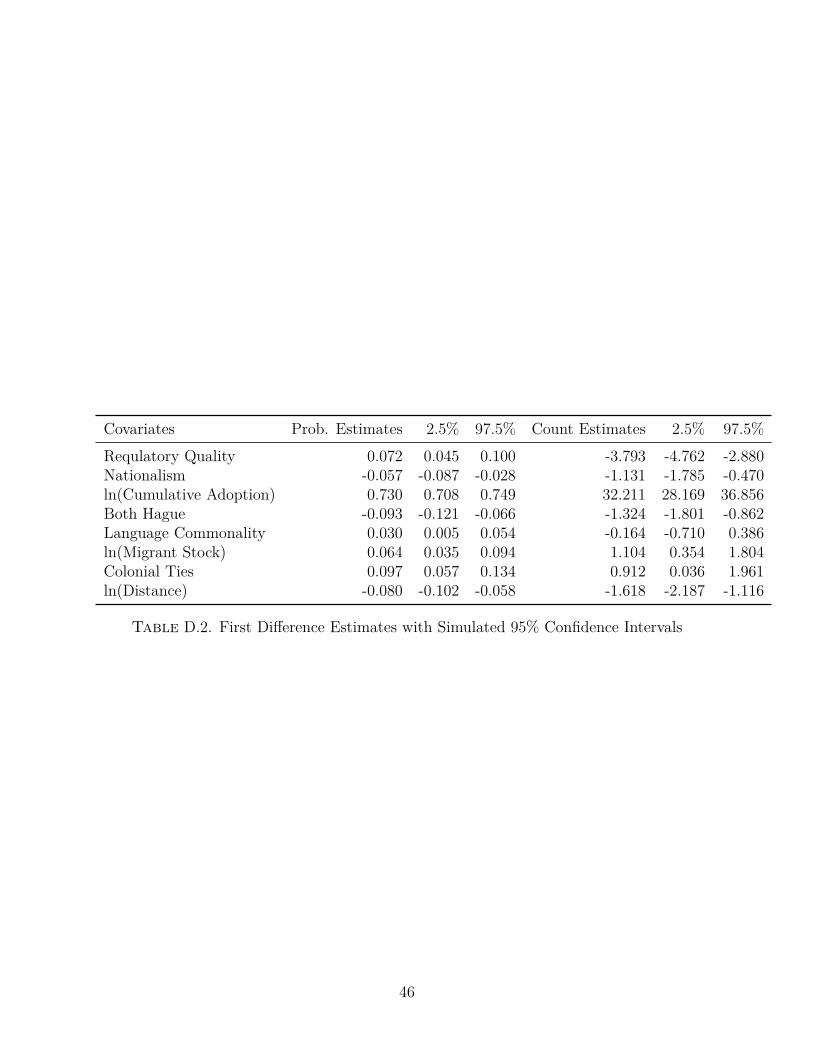
Covariates Prob. Estimates 2.5% 97.5% Count Estimates 2.5% 97.5%Requlatory Quality 0.072 0.045 0.100 -3.793 -4.762 -2.880Nationalism -0.057 -0.087 -0.028 -1.131 -1.785 -0.470ln(Cumulative Adoption) 0.730 0.708 0.749 32.211 28.169 36.856Both Hague -0.093 -0.121 -0.066 -1.324 -1.801 -0.862Language Commonality 0.030 0.005 0.054 -0.164 -0.710 0.386ln(Migrant Stock) 0.064 0.035 0.094 1.104 0.354 1.804Colonial Ties 0.097 0.057 0.134 0.912 0.036 1.961ln(Distance) -0.080 -0.102 -0.058 -1.618 -2.187 -1.116
Table D.2. First Di�erence Estimates with Simulated 95% Confidence Intervals
46
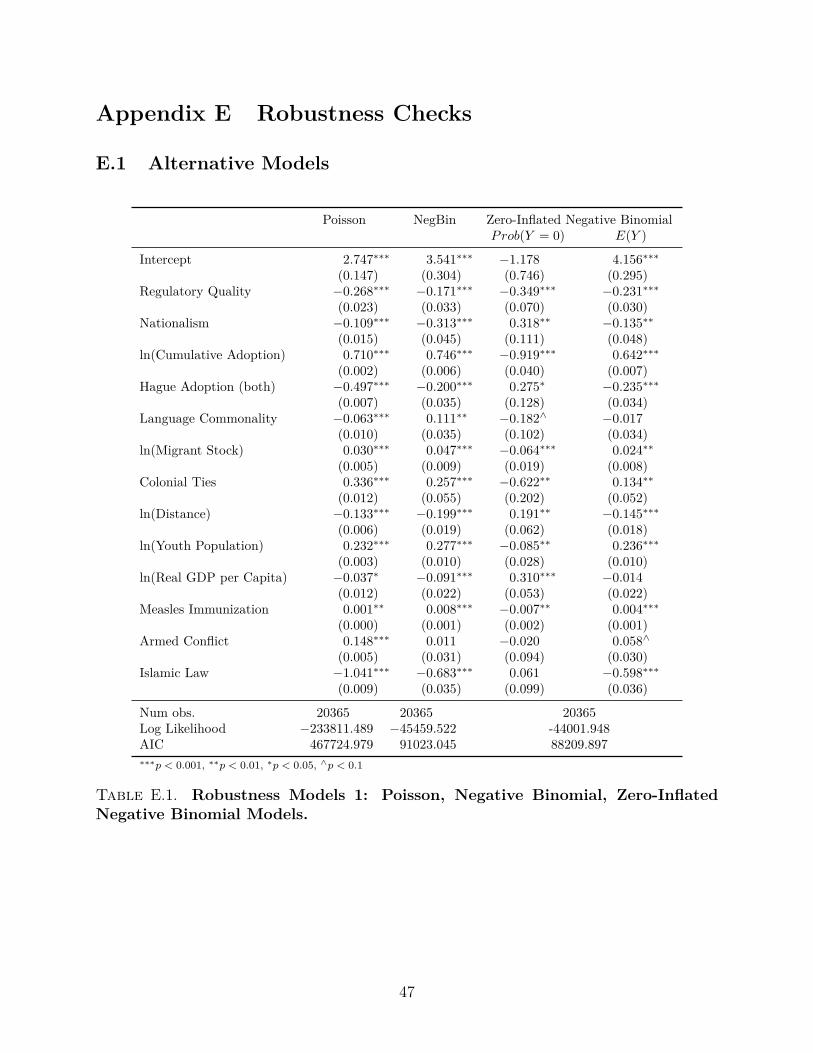
Appendix E Robustness Checks
E.1 Alternative Models
Poisson NegBin Zero-Inflated Negative BinomialProb(Y = 0) E(Y )
Intercept 2.747úúú 3.541úúú ≠1.178 4.156úúú
(0.147) (0.304) (0.746) (0.295)Regulatory Quality ≠0.268úúú ≠0.171úúú ≠0.349úúú ≠0.231úúú
(0.023) (0.033) (0.070) (0.030)Nationalism ≠0.109úúú ≠0.313úúú 0.318úú ≠0.135úú
(0.015) (0.045) (0.111) (0.048)ln(Cumulative Adoption) 0.710úúú 0.746úúú ≠0.919úúú 0.642úúú
(0.002) (0.006) (0.040) (0.007)Hague Adoption (both) ≠0.497úúú ≠0.200úúú 0.275ú ≠0.235úúú
(0.007) (0.035) (0.128) (0.034)Language Commonality ≠0.063úúú 0.111úú ≠0.182· ≠0.017
(0.010) (0.035) (0.102) (0.034)ln(Migrant Stock) 0.030úúú 0.047úúú ≠0.064úúú 0.024úú
(0.005) (0.009) (0.019) (0.008)Colonial Ties 0.336úúú 0.257úúú ≠0.622úú 0.134úú
(0.012) (0.055) (0.202) (0.052)ln(Distance) ≠0.133úúú ≠0.199úúú 0.191úú ≠0.145úúú
(0.006) (0.019) (0.062) (0.018)ln(Youth Population) 0.232úúú 0.277úúú ≠0.085úú 0.236úúú
(0.003) (0.010) (0.028) (0.010)ln(Real GDP per Capita) ≠0.037ú ≠0.091úúú 0.310úúú ≠0.014
(0.012) (0.022) (0.053) (0.022)Measles Immunization 0.001úú 0.008úúú ≠0.007úú 0.004úúú
(0.000) (0.001) (0.002) (0.001)Armed Conflict 0.148úúú 0.011 ≠0.020 0.058·
(0.005) (0.031) (0.094) (0.030)Islamic Law ≠1.041úúú ≠0.683úúú 0.061 ≠0.598úúú
(0.009) (0.035) (0.099) (0.036)
Num obs. 20365 20365 20365Log Likelihood ≠233811.489 ≠45459.522 -44001.948AIC 467724.979 91023.045 88209.897úúú
p < 0.001, úúp < 0.01, ú
p < 0.05, ·p < 0.1
Table E.1. Robustness Models 1: Poisson, Negative Binomial, Zero-InflatedNegative Binomial Models.
47
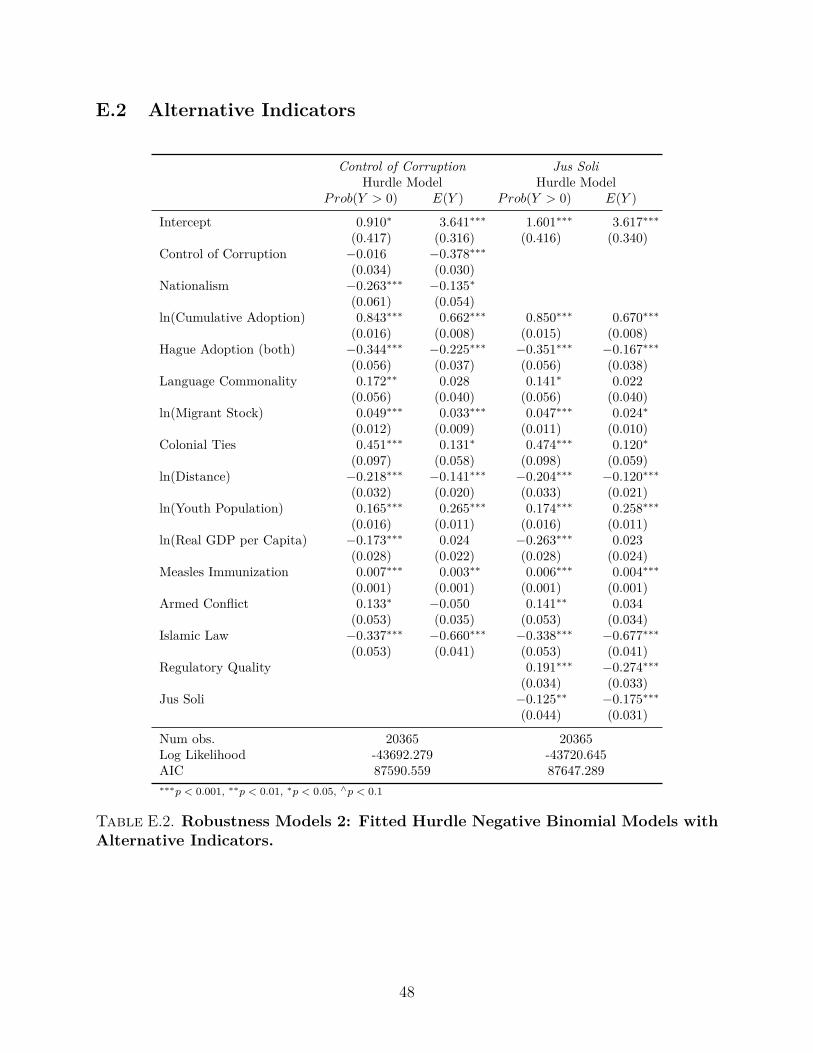
E.2 Alternative Indicators
Control of Corruption Jus SoliHurdle Model Hurdle Model
Prob(Y > 0) E(Y ) Prob(Y > 0) E(Y )
Intercept 0.910ú 3.641úúú 1.601úúú 3.617úúú
(0.417) (0.316) (0.416) (0.340)Control of Corruption ≠0.016 ≠0.378úúú
(0.034) (0.030)Nationalism ≠0.263úúú ≠0.135ú
(0.061) (0.054)ln(Cumulative Adoption) 0.843úúú 0.662úúú 0.850úúú 0.670úúú
(0.016) (0.008) (0.015) (0.008)Hague Adoption (both) ≠0.344úúú ≠0.225úúú ≠0.351úúú ≠0.167úúú
(0.056) (0.037) (0.056) (0.038)Language Commonality 0.172úú 0.028 0.141ú 0.022
(0.056) (0.040) (0.056) (0.040)ln(Migrant Stock) 0.049úúú 0.033úúú 0.047úúú 0.024ú
(0.012) (0.009) (0.011) (0.010)Colonial Ties 0.451úúú 0.131ú 0.474úúú 0.120ú
(0.097) (0.058) (0.098) (0.059)ln(Distance) ≠0.218úúú ≠0.141úúú ≠0.204úúú ≠0.120úúú
(0.032) (0.020) (0.033) (0.021)ln(Youth Population) 0.165úúú 0.265úúú 0.174úúú 0.258úúú
(0.016) (0.011) (0.016) (0.011)ln(Real GDP per Capita) ≠0.173úúú 0.024 ≠0.263úúú 0.023
(0.028) (0.022) (0.028) (0.024)Measles Immunization 0.007úúú 0.003úú 0.006úúú 0.004úúú
(0.001) (0.001) (0.001) (0.001)Armed Conflict 0.133ú ≠0.050 0.141úú 0.034
(0.053) (0.035) (0.053) (0.034)Islamic Law ≠0.337úúú ≠0.660úúú ≠0.338úúú ≠0.677úúú
(0.053) (0.041) (0.053) (0.041)Regulatory Quality 0.191úúú ≠0.274úúú
(0.034) (0.033)Jus Soli ≠0.125úú ≠0.175úúú
(0.044) (0.031)
Num obs. 20365 20365Log Likelihood -43692.279 -43720.645AIC 87590.559 87647.289úúú
p < 0.001, úúp < 0.01, ú
p < 0.05, ·p < 0.1
Table E.2. Robustness Models 2: Fitted Hurdle Negative Binomial Models withAlternative Indicators.
48