bachelor of science in civil engineering...
TRANSCRIPT

UNIVERSITY OF NAIROBI
PRELIMINARY DESIGN OF SIGIRI BRIDGE APPROACH
ROADS.
By Mungu Radiance Rabillo. F16/3964/2011
A project submitted as a partial fulfillment
for the requirement for the award of the degree of
BACHELOR OF SCIENCE IN CIVIL ENGINEERING
2016

1
DEDICATION.
I dedicate this work to my family for their tireless support and contribution to my Education.

2
ACKNOWLEDGEMENT.
This study involved a lot of work that required the help of numerous people and organizations
without which this work could have been almost impossible.
My greatest acknowledgements goes to my supervisor, Mr. Munga of the University of
Nairobi who was able to guide, assist and for cooperation which led to the successful completion
of this study.
I wish also to thank Mr. J. B OGALO of University of Nairobi for his guidance in the course of
my research especially in the Laboratory Works and Material testing Investigations.
Special mention goes to Eng. M. O Ogola for his assistance and guidance as regards to the traffic
study and Data.
I wish also to thank Wallace of Technical University of Kenya for his assistance during
Material and Data collection.
Finally, I wish to thank in a special way my friends, Daisy Atieno, Ken Amollo, Robert Mativo
and Manyara Joel among many others for their moral support and input during the research period.
TO GOD BE THE GLORY.

3
ABSTRACT.
This project covers the design of the Proposed Sigiri Bridge Approach Roads. It aims at explaining
and showing how the construction exercise will be done.
It is organised into seven chapters. The first chapter introduces the reader to the project, its location
as well as the objectives of the study and scope.
The second chapter covers the literature review which entails types of pavements, stress
distribution in Flexible pavements, Traffic loading on Flexible pavements, Pavement materials as
well as the design Methods of which the design would be based on.
Chapter three deals with methodology of data collection as well as materials investigations.
Chapter four deals with analysis of the data and the materials investigation results for both the
alignment soils and for the material sites obtained using the methodology described in chapter
three. Chapter five entails traffic survey.
The sixth chapter deals with the design process of the proposed pavement for the Sigiri Bridge
Approach Roads which will be finally recommended to out in practice.
Chapter seven entails the Discussion, Recommendation and Conclusion.
All these arrangements are aimed at achieving the main objective of the study which targets at
providing a preliminary pavement design for the proposed Sigiri Bridge Approach Roads that will
ensures safe, convenient and economical service to the users.

4
Table of Content.
DEDICATION. ..........................................................................................................................1
ACKNOWLEDGEMENT. .......................................................................................................2
ABSTRACT. ..............................................................................................................................3
List of figures. ............................................................................................................................7
List of tables. ..............................................................................................................................8
ABBREVIATIONS .................................................................................................................10
Chapter One ............................................................................................................................11
Introduction. ...........................................................................................................................11
1.1 Background. .....................................................................................................................11
1.2 Problem statement. ...........................................................................................................11
1.3 Location of the Project Road. ..........................................................................................13
1.4 Condition of Project Road ...............................................................................................13
1.4.1 Drainage ........................................................................................................................14
1.4.2 Topography ...................................................................................................................14
1.4.3 Geology .........................................................................................................................14
1.4.4 Climate ..........................................................................................................................14
1.4.5 Land Use .......................................................................................................................14
1.5 Objective of the study. .....................................................................................................14
1.6 Scope of the study. ...........................................................................................................14
1.7 Methodology. ...................................................................................................................15
1.8 Structure of the project.....................................................................................................15
Chapter Two ............................................................................................................................16
Literature Review...................................................................................................................16
2.1 Pavement. .........................................................................................................................16
2.2 Types of Pavements. ......................................................................................................16
2.2.1 Flexible Pavements. ......................................................................................................16
2.2.2 Rigid Pavements. ......................................................................................................19
2.3 Stress Distribution in Flexible Pavements. ......................................................................19
2.3.1General ...........................................................................................................................19
2.3.2 Boussinesq’s Theory .....................................................................................................19
2.3.3 Barrister’s Theory. ........................................................................................................21
2.3.4 Meyerhof’s Method. .....................................................................................................21
2.3.5 Method OF Equivalent Thicknesses. ............................................................................22
2.4 Traffic Loading On Flexible Pavements. .........................................................................22
2.4.1 General. .........................................................................................................................22
2.5 Pavement Materials. .........................................................................................................26
2.5.1 Subgrade. ......................................................................................................................26
2.5.2 Sub base Materials. .......................................................................................................28
2.5.3 Base Materials. ..............................................................................................................29
2.5.4 Surfacing Materials. ......................................................................................................29
2.6 Pavement Thickness Design ............................................................................................30
2.6.1 General. .........................................................................................................................30
2.6.2 Design Methods. ...........................................................................................................30

5
Chapter Three. ........................................................................................................................37
Methodology. .........................................................................................................................37
3.1 General. ............................................................................................................................37
3.2 Traffic data. ......................................................................................................................37
3.3 Material investigation and testing. ...................................................................................37
3.3.1 General. .........................................................................................................................37
3.3.2 Tests carried out. ...........................................................................................................37
3.3.3 Laboratory Test. ............................................................................................................37
Chapter Four ...........................................................................................................................39
Data Collection and Analysis.................................................................................................39
4.0 ALIGNMENT SOILS ......................................................................................................39
4.1 Field Investigations ..........................................................................................................39
4.2 Test Results ......................................................................................................................39
4.2.1 Particle Size Distribution of Alignment Soils ...............................................................39
4.2.2 MDD and OMC ............................................................................................................39
4.2.3 Alignment Soils CBR ...................................................................................................40
4.2.5 Swell and Plasticity Index .............................................................................................44
4.3 .NATURAL MATERIAL SITES TEST RESULTS. ......................................................44
4.3.1 Description of Material Sites. .......................................................................................44
4.4 Materials Sites Test Results .............................................................................................46
4.4.1 Grading, Plasticity, and CBR ........................................................................................46
4.4.2 CBR Requirements. ......................................................................................................47
4.4.3 Plasticity Index Requirements ......................................................................................47
4.4.4 Plasticity Modulus Requirements .................................................................................48
4.4.5 Materials Requirements before Improvement ..............................................................49
4.5 Conclusion .......................................................................................................................49
4.6 IMPROVED MATERIALS TEST RESULTS. ...............................................................49
4.6.1 Tests on Treated Samples. ............................................................................................49
4.6.2 Selection of type of stabilizer. ......................................................................................50
4.7 Material Requirement Before and After Treatment. ........................................................50
4.8 Material Site 1 ..................................................................................................................51
4.9 Material Site 2 ..................................................................................................................52
4.10 Material Site 3 ................................................................................................................52
4.11 Recommended Treatment for Sub base and Base Material ...........................................52
Chapter Five ............................................................................................................................54
Traffic Studies. .......................................................................................................................54
5.1 Introduction ......................................................................................................................54
5.1.1 Initial studies .................................................................................................................54
5.1.2 Vehicle Classification ...................................................................................................54
5.2 Objectives and Scope of the Traffic Review Study .........................................................55
5.3 Traffic Surveys.................................................................................................................55
5.3.1 Average Annual Daily Traffic ......................................................................................55
5.3.2 Normal Traffic Composition and Characteristics .........................................................55
5.3.4 Pavement Design Traffic Forecast ................................................................................57
5.3.5 Cumulative Number of Standard Axles and Traffic Classes ........................................58
Chapter Six ..............................................................................................................................60

6
Pavement Design. ..................................................................................................................60
6.1 General. ............................................................................................................................60
6.2 Pavement Design Methods. .............................................................................................60
6.3 Road design Manual Part III. ...........................................................................................60
Chapter Seven. .........................................................................................................................63
Discussion, Conclusion and Recommendation. .....................................................................63
7.1 General. ............................................................................................................................63
7.2 Materials. .........................................................................................................................63
7.3 Design. .............................................................................................................................63
7.4 Maintenance. ....................................................................................................................63
Routine Maintenance. ............................................................................................................63
References: ...............................................................................................................................65
APPENDICES. ........................................................................................................................66
Appendix 1: Alignment Soil Test Results. ............................................................................66
Appendix 2 .............................................................................................................................67
Appendix 3: ............................................................................................................................68
Appendix 4: Material Sites Test Results ................................................................................69
Appendix 5: ............................................................................................................................70
Appendix 6: ............................................................................................................................73

7
List of figures.
Figure 2.1: Typical section of a flexible Road Pavement
Figure 2.2: Typical section of a Rigid Road Pavement
Figure 4.1: Alignment soil CBR distribution – Sigiri side
Figure 4.2: Alignment soil CBR – Khainga side
Figure 4.3: Cusum chart for subgrade soils – Sigiri Side
Figure 4.4: Cusum chart for Sub grade soils- Khainga side
Figure 4.5: Material sites View (MS1)
Figure 4.6: Material sites View (MS2)
Figure 4.7: Material sites View (MS3)
Figure 4.8: Suitability of natural gravel for sub base and base material – CBR Criterion
Figure 4.9: Suitability of natural gravel for sub base and base material – PI criterion from M1, 2
and 3
Figure 4.10: Suitability of natural gravel for sub base and base material – PM criterion
Figure 6.1: Figure of pavement structure chosen

8
List of tables.
Table 2.1: Classification of sub grade for concrete road and minimum thickness of sub base
required
Table 2.2: Sub grade Bearing Strength classes
Table 2.3: Classification of Kenya subgrade materials
Table 2.4: Minimum thickness of improved subgrade required
Table 2.5: Traffic classification
Table 2.6: Conversion of measured wheel load into an Equivalent Number of Standard 5000 LBS
wheel loads
Table 4.1: Alignment soil types
Table 4.2: Alignment MDD and OMC
Table 4.3: Subgrade classification (Reproduced from RDM part III)
Table 4.4: Alignment soils CBR classes
Table 4.5: Design CBR – Khainga side
Table 4.6: Design CBR – Sigiri side
Table 4.7: Alignment Soils PI and Swell
Table 4.8: Material Quantities
Table 4.9: Material Test Results Summary
Table 4.10: Material Test Results summary before Treatment
Table 4.11: Summary of Test Results for Criteria of Evaluation of neat Materials
Table 4.12: Criterion adopted for selection of Stabilizer
Table 4.13: Minimum material requirements before and after improvement.
Table 4.14: Material Test results for MS1 after improvement
Table 4.15: Material Test results for MS2 after improvement
Table 4.16: Material Test Results for MS3 Improvement.
Table 4.17: Recommended lime or Cement content for sub base and base material
Table 4.18: Results on hard stone samples for surface dressing
Table 4.19: Results on hard stone samples for Asphalt
Table 4.20: Results on hard stone samples for concrete works
Table 4.21: Results on Water sources
Table 4.22: Results of Sand source
Table 5.1.1: Basic Capacity and Proposed cross- section Type (Initial Design)
Table 5.3.1: Traffic Census stations
Table 5.3.4.1: Average Annual Daily Traffic (AADT) roads D251, C29 and R43
Table 5.3.5.1: Non- motorized traffic across River Nzoia
Table 5.3.6: Summary of O-D sample sizes
Table 5.3.7.1: Kenya’s GDP Growth Rates
Table 5.3.7.2: Traffic Growth Scenarios 2013-2037
Table 5.3.7.3: Percentage of diversion, conversion and induction of traffic for the project road
Table 5.3.8.4: Average Vehicles Equivalence Factors.

9
Table 5.3.8.3: Cumulative Number of Standard Axles and Traffic Classes.
Table 6.1: AADT (2028) and cross section Types

10
ABBREVIATIONS
CBR – California Bearing Ratio
KRDM – Kenya Roads Design Manual
MDD – Maximum Dry Density
TRRL – Transport Road Research Laboratory
UK – United Kingdom
MSA – Million Standard Axles.
AASHTO – American Association of State Highways Officials.
BS – British Standards.
PI – Plastic Index
LL – Liquid Limit
OMC – Optimum Moisture Content.
NMC – Normal Moisture Content.
PL – Plastic Limit.

11
Chapter One
Introduction.
1.1 Background.
The main prerequisite for economic growth and poverty eradication in any country is development
and maintenance of physical infrastructure as this influences the production costs, employment
creation, transportation and access to markets and investments. In Kenya, roads, sea, railways, air
and pipeline transport are the principal passenger and goods transport modes, Road network
contributing the most to the country’s economic development since it is the most common, cheap,
convenient and allows quick movement of people and goods from one location to the other. Road
covers between 80 and 90% of transportation needs in general.
At the moment a lot of investments has been put to road network within the country in line with
VISION 2030 and also with the existence of County Governments which come in handy in
ensuring that the feeder Roads (Rural access roads) are not neglected to ensure that the main
generator in the economy are not marginalized and cut off from the market. With no proper
maintenance this investments are normally eroded impacting negatively on the roads
serviceability.
A road system which is not well maintained increases the operating cost of vehicles.
Some functions of a good road network include:
Safety – the facility should be well designed to carry people and goods safely to their
destination at reasonable speeds.
The facility should provide access to major socio – economic focal points of the
community.
Reliability – the road should be accessible at all times and seasons.
Efficiency – The facility should be congestion free and the capacity of the road at the
design speed should be adequate.
Keen interest should also be put on the environmental effect of a road. Most rural access roads are
usually earth and gravel which affect negatively on the air quality of the environment with Dust.
1.2 Problem statement.
Accessibility of people and goods to various centers is the basic function of a road and is
important for socio – economic activities of the society.
In Sigiri (Busia County) accessibility across river Nzoia is a big challenge to the residence of the
area due to the absence of a bridge and as a result the only mode of transport across the river is
by use of small boats. This largely affect the socio - economic activity in the area due to limited
transportation as shown below.

12
Site for the proposed sigiri bridge
The road in the area is also in very poor state and condition as stated below:
a) Dust – Since the road in the area is not tarmacked, dust is normally a big challenge
affecting the local air quality. (Pollution problem)
b) Missing road furniture – The roads in the area have no signs.
c) Pavement riding surface – it is very rough.
Due to the conditions plans to construct a bridge across the river together with approach roads of
1.5 km from each side of the bridge totaling to 3km approach road is in place.
Structural design of new bitumen surface roads in Kenya earlier was based on combination of
Road note NO.29 and 31 published by the British Transport and Road Research laboratory. These
notes were not specifically tailored to cater for the current needs of roads in Kenya.
Research carried specifically on Kenyan soils, loading and environmental conditions
Culminated in the development of Road Design Manual Part III by the ministry of Public works.
Adoption of the guidelines and standards given in the manual does not necessarily ensure a
serviceable and economic road design, but should be accompanied by a careful consideration and
balancing of the various design controls, criteria and elements.
The design should aim at a pavement system that can offer sufficient stiffness to counter the
deterioration due to overloading while remaining flexible enough to accommodate necessary
deflections without fatigue. Surface deterioration has often lead to much attention drawn
towards road rehabilitation as opposed to construction of new roads.

13
Construction of the Sigiri Bridge and improvement of the road by constructing the approach roads
could put a stop to these major problems and lead to booming economic activities around this area
which in turn would provide returns to the local communities and to potential Investors for the
area.
1.3 Location of the Project Road.
The project road (approach road to Sigiri Bridge) of about 3 km lie in Busia County and about
3Km from Port Victoria Centre. The Sigiri side starts from Bumala-Port Victoria Road (Road D)
to River Nzoia and then extends for another 1.5 Km towards Khahinga. The figure below show
the location of the area.
Figure 1: Location map of the approach roads to Sigiri bridge
1.4 Condition of Project Road
The section of the road connecting Bumala – Port Victoria with the proposed Sigiri bridge is in
poor state with no drainage .It’s however an important road for Lorries harvesting sand from the
river
Start
End

14
1.4.1 Drainage
Drainage condition for the project road is generally poor on Khainga side generally flat on flood
plain. The sides of Sigiri slopes towards the Nzoia River with 2 hills on both sides
1.4.2 Topography
The approach road is flat towards Khahinga Side on the Budalangi flood plains and very steep and
hilly towards the Sigiri Side with the Sigiri Bridge as the only natural barrier.
1.4.3 Geology
Recent deposits in the area include alluviumtalus, black cotton soils, marrum and lateritic earths
and rocks include basement rocks and tertiary volcanic.
1.4.4 Climate
The project area has good climate, with rainfall occurring twice a year i.e. March to June (long
rains) and September to December (short rains). The average rainfall per year is about 1,500mm.
Temperatures range between 17oC and 30oC.
1.4.5 Land Use
Land use activities in the project area mainly include subsistence agriculture, farming,
retail commercial activities as well as residential and institutional developments.
1.5 Objective of the study.
The objectives of the study are:
1. Analyze socio economic structure of the study area in order to obtain a basis for traffic
projections.
2. Analyze the current state of the road by carrying out a condition survey.
3. Analyze the current and future traffic on the road.
4. Produce a pavement design that guarantees pass ability, safety, economy and minimum
negative environmental impacts.
1.6 Scope of the study.
The study is extensive and in order to achieve the above the focus will be on the 3km approach
road. The study will be concentrated data collection in form of:
Soil site investigation reports.
Road Condition Survey.
Socio economic data from the field and records.
Traffic studies.
Finally the study should produce A PRELIMINARY PAVEMENT DESIGN for the upgrading of
this road.

15
1.7 Methodology.
The systematic order in which the study will be carried out is as follows:
1. Material investigation survey to reveal alignment soils properties.
2. Material investigation survey to reveal the material sites properties.
3. Condition survey of the road and its elements.
4. Traffic survey
5. Social and economic aspects of the study area.
6. Environmental impact assessment.
7. Analysis of data Collected.
8. Preliminary design of the pavement.
1.8 Structure of the project.
The project has seven (7) chapters and Six (6) appendices. The content of each chapter is
highlighted below.
Chapter 1: Introduction
Chapter 2: is the Literature Review.
Chapter 3: Methodology.
Chapter 4: gives a detailed description of the alignment soils and material sites sampling, testing
and results. This section also includes an in-depth analysis and discussion of results, in comparison
with specifications for road pavements in accordance with Road Design Manual part III.
Chapter 5: Entails Traffic survey data analysis.
Chapter 6: Pavement Design.
Chapter 7: Discussion, Conclusion and Recommendation.
16
Chapter Two
Literature Review.
2.1 Pavement.
A pavement is the durable surface material laid down on an area intended to sustain vehicular or
foot traffic, such as a road or walkway.
Storm water drainage and environmental conditions are a major concern in the designing of a
pavement. The first of the constructed roads date back to 4000 BC consisted of stone paved streets
or timber roads.
In the past cobblestones and granite setts were extensively used, but these surfaces have mostly
been replaced by asphalt or concrete.
Depending on the type of material used, pavements can be classified into two types:
Flexible Pavement
Rigid Pavements
Presently three aspects of pavement design are considered that is:
Structural design
Functional Design and
Drainage Design
In structural design the stresses due to traffic loading and temperature are estimated and the
thickness of the pavement is designed in such a way that these developed strains are below the
allowable values.
2.2 Types of Pavements.
2.2.1 Flexible Pavements.
Construction of a Flexible Pavements is composed of a bituminous material surface course
normally asphalt and underlying base and sub – base courses.
Under loading, the total pavements structure deflects, or flexes.
A flexible pavement structure is typically composed of several layers of materials each layer
receiving loads from the above layer, spreads them out, and passes on these loads to the next layer
below. Thus the stresses will be reduced, which are maximum at the top layer and minimum on
the top of the sub - grade.
A typical flexible pavement structure consists of the surface course, underlying base course, sub
base course and the soil sub grade. Each of these layers contributes to structural support and
drainage.
When hot mix asphalt (HMA) is used as the surface course, it is the stiffest (as measured by
resilient modulus) and may contribute the most (depending upon thickness) to pavement strength.

17
The underlying layers are less stiff but are still important to pavement strength as well as drainage
and frost protection.
When a seal coat is used as the surface course, the base generally is the layer that contributes most
to the structural stiffness. A typical structural design results in a series of layers that gradually
decrease in material quality with depth.
Figure 2-1 shows a typical section for a flexible pavement.
Fig 2.1: Typical section of a flexible road pavement. (Chakroborty and Das 2003)
Surface Course
This is the top most layer of a pavement structure generally made up of bituminous surfacing.
The functions of this layer is to provide a good, waterproof, safe, comfortable and give smooth
riding surface that is dense and resists pressure exerted by tyres and takes up wear and tear
due to traffic.
Binder course.
This forms the lower layer of pavement surfacing and provides a firm and level course to
receive the wearing course. It is also constructed using bituminous bound materials of
coarser size than the wearing course. The layer is generally only provided when traffic
flows and loadings demand an asphalt concrete layer in excess of 75mm.The combination
of wearing course and binder course contribute to the structural strength of pavement.
Sub base and the Base Courses.
This form the main structural layers of the pavement.
Base course and the sub- base courses are used under flexible pavement primarily to
improve the load supporting capacity by distributing the load through finite thickness.
This layers are normally constructed from bituminous or cement bound granular materials
or from high quality gravels.
The sub base also acts as internal drainage layer for the pavement and also when used in
adequate layer thickness may act as a capping layer to prevent against frost action.

18
Subgrade.
The soil subgrade consists of natural soils prepared to receive the layers of pavement
materials placed over it.
The natural soil can either be insitu within a road alignment or imported from designated
borrow pits in the events that the road insitu soil is not of suitable quality to act as a
foundation to the road pavement.
The subgrade can either be constituted soils without treatment or improved.
Improvement of the soil can be done mechanically by introducing coarser materials to the
sub grade or chemically by use of cement or lime or sometimes bitumen emulsions may
also be used.
The performance of a highway pavement is influenced to a considerable extent by the
quality and engineering characteristics of the subgrade material.
Therefore it is necessary to evaluate the strength properties of soil sub grade.
Tests for measuring strength properties of the soil are:
(1) California bearing Ratio Test
(2) California resistance value Test
(3) Triaxial compression test and
(4) Plate bearing test.
The desired properties of Soil Material as subgrade include; stability, Incompressibility,
Permanency of strength, minimum change in volume and stability under adverse condition of
weather and ground water, Good drainage, and Ease of compaction.
Based on their stiffness and stability against volume change due to moisture variations the sub
grade soils are broadly categorized into:
1. Stiff subgrades – these are subgrades whose CBR is in excess of 30 % and comprise
natural gravels (Laterites, quartzites or coal) or decomposed rock.
2. Average Subgrades – These are the most common subgrades, their CBR range
between 5 and 30 %.
3. Sensitive/Expansive subgrades – These are considered as highly expansive clays of
CBR below 5%. The soils undergo significant volume change when exposed to
moisture variations.
When considering the Subgrade Performance;
-Load Bearing Capacity is affected by degree of compaction, moisture content, and soil type.
-Moisture content affects sub-grade properties like loads bearing capacity, shrinkage and
swelling.
-Influenced by drainage, groundwater table elevation, infiltration, or pavement porosity which
can be assessed by cracks in the pavement
- Shrinkage, Swelling and frost heave will tend to deform and crack any pavement type
constructed over them.

19
2.2.2 Rigid Pavements.
Rigid Pavements are constructed using either reinforced or jointed unreinforced concrete and
comprise of surfacing, concrete base and sub base.
The use of sub base layer may be avoided depending on construction method and quality of
subgrade and alignment soils.
The thickness of the concrete base depends on quality of subgrade and expected traffic loading.
Table 2.1 Classification of sub grade for concrete roads and minimum thickness of sub base
required.
Type Minimum thickness of sub base(mm)
Weak –All subgrade of CBR < 2% 150
Normal – sub grade other than those defined
by the other categories.
80
Very stable – all sub grades of CBR > 5%.This
category includes undisturbed foundations of
old roads.
0
(Source: Highway Engineering Vol. 2 by C.A O’Flaherty, 2nd Edition)
Figure 2.2 below shows a typical section for a rigid pavement.
Typical section of a rigid road pavement. (Chakroborty and Das 2003)
2.3 Stress Distribution in Flexible Pavements.
2.3.1General
There exists different theory that explain stress distribution as discussed below.
2.3.2 Boussinesq’s Theory.
The problem of determining stresses, strain and deflection at any point P at a depth z as a result of
a surface point load was solved by Boussinesq (1885) on the following assumptions:

20
1. The Soil mass is elastic, isotropic, homogeneous and semi-infinite.
2. The soil is weightless.
3. The load is a point load acting on the surface.
Vertical normal stress (σz) directly below the axis of loading is given as
σz = 𝑃𝑐 (1 − 𝑍3 ) ∕ (𝑟2 + 𝑧2)3/2 …………………………………….(2.1)
Where
z = depth at which normal stress is applied from the point of loading
r = radius of circular area through which P is applied.
Pc = Contact pressure = P/Ac
Ac = contact area.
From empirical experiments it has been shown that the actual stress below a sand/asphalt base are
similar to or slightly greater than those computed using Boussinesq theory, while the actual
stresses below a soil or cement are lower than those predicted using Boussinesq theory.(Gichaga
& Parkeker, 1988).
Radial stress σr in the x and y direction directly below the axis of loading is given as
σr = Pc/ 2[(1 + 2µ) – 2(1+ µ ) Z/ (r2+ z2)1/2 + Z3/(r2 + z2)3/2]……………….(2.2)
Where
µ = Poisons ratio ranges between 0.25 and 0.5 for materials, with higher values representing stiffer
materials.
en = Strain perpendicular to the axis of loading
ep = strain parallel to the axis of loading
Maximum shear stress (Φmax) directly below the axis of loading is given as
Φmax = (σz – σr )/ 2 ……………………………………………………………………..(2.3)
Surface deflection (∆s) directly below the axis of loading is given as
∆s = (1 - µ2 ) 2Pcr/E ……………………………………………………………………… (2.4)
Where
E = elastic modules of the homogeneous half space.
The overall strain resulting from the stresses due to surface loading at any depth within the
homogeneous layer is obtained by summing up the effect of each individual stress i.e. strain in x
– direction (ex) is made up of 3 components namely due to σx of σx /E, due to σy of µ(σy/E) in
other words
Overall strain in the x – direction, ex = σx
E− µ(
σy
E+
σz
E)………………………………… (2.5)
Overall strain in the y – direction, ey =σy
E− µ(
σx
E+
σz
E)………………………………… (2.6)
Overall strain in the z – direction, ez =σz
E− µ(
σx
E+
σy
E)………………………………… (2.7)

21
Material stressed as above will also undergo a certain amount of volume change expressed in terms
of volumetric strains.
ev = ex + ey + ez…………………………………………………………………………….(2.8)
Modulus of elasticity defining the volume change, bulk modulus (K) is defined as
K = volumetric stress/Volumetric strain
= (σx + σy + σz) /3(ex + ey + ez) ………………………………………………………… (2.9)
2.3.3 Barrister’s Theory.
This method was developed in 1940s as a further step to Boussinesq’s theory and considers a
granular layer placed in between the point of surface loading and homogeneous half space. The
assumptions are similar to those of Boussinesq with the additional assumption that the two layers
are assumed to be continuous contact therefore full friction is assumed to develop between the two
layers.
Burmister’s theory calculates surface deflection of the pavement structure and determines
thickness of the top layer that would result into deflection less than the pre-cast limiting values for
various pavement types.
∆s = 1.5 Pcr/ E2 (Fw)………………………………………………………………… (2.10)
Where
Fw = Displacement factor which is a function of top layer thickness (h/r) and the ratio (E1/E2) and
is read out of standard charts.
E2 = Elastic modules of homogeneous half space determined either from plate bearing test, CBR
or DCP test.It is generally approximated as 10 * CBR MN/m2
E1 = Elastic modulus of top layer
2.3.4 Meyerhof’s Method.
This is based on Burmister theory and the guiding expression gives the transient deflection as
shown.
∆ = 0.52 W/E2 3√ (nt)…………………………………………………………………. (2.11)
Where
∆ = Transient deflection
W = applied load
t = Pavement thickness
n = E1/E2
E1 = average elastic modulus of the pavement
E2 = elastic modulus of the subgrade

22
2.3.5 Method OF Equivalent Thicknesses.
Ease of calculation of stresses and strains underneath the structure is possible with the development
in computer techniques.
The computer techniques, has made it possible for a multi – layer pavement structure to be
transformed into an equivalent single layer pavement structure for ease of calculations using
Boussinesq’s equations.
The basic assumption in this theory is that stresses, strains and deflections for a given structure
remain the same as stiffness properties of the structure remain unchanged.
Flexural stiffness (FS) of a given layer is a function of moment of inertia (I), stiffness modulus E
and the Poisson’s ratio µ such that
FS = IE / (1 - µ2) = bh3/12E/ (1 - µ2) = kh3/ (1 - µ2) …………………………………… (2.12)
If two pavement layers with layer I having E1, hi, µ1 and layer 2 having E2, µ2 are considered to
have same flexural stiffness, then thickness of layer 2 may be determined from equation below:
Kh13 E1/ (1 - µ12) = Khe13E2/ (1 - µ22)………………………………….. (2.13)
Where
He1 = Thickness of material comprising layer 2 that would have the same flexural stiffness as h1
of layer 1 material given E and µ for the two different materials.
He13= f (1 - µ22/1 − µ12)𝐸1/𝐸2 ∗ ℎ13 ……………………………… (2.14)
Where f = interface correction factor.
The above elastic theories are considered safe enough to use for design of flexible and rigid
pavement structures since they are generally more conservative designs than those based on
empirical considerations.
Also in the road research laboratory – Piezometric pressure gauges have been used to measure the
stress distribution with depth in soil beneath a uniformly loaded circular area at the soil surface.
The measured values of vertical stress compared with the distribution calculated from the
Boussinesq analysis equation and allowing for a small over – registration of the gauges due to the
differences between their elastic modulus and that of the soil, the agreement is close(HMSO 1962).
This suggests that although soils do not strictly behave elastically, elastic theory may be used with
reasonable confidence in the estimation of the stresses.
2.4 Traffic Loading On Flexible Pavements.
2.4.1 General.
The primary contributors to pavement distress is the traffic on the pavement which includes
commercial vehicles and the pedestrians. Pavement design is basically concerned with the
protection of the subgrade from the effects of pressures emanating from this traffic loading.
The pavement properties including; Layer thickness, Pavement materials, Environmental
conditions and Operating conditions will influence the level of damage caused by heavy axles.
Load factors that significantly influence pavement response parameters in terms of deflection,
stress and strains include;

23
1. TYRE PRESSSURE
The contact pressure applied on the surface of the road by a loaded tyre is directly influenced by
the type pressure On average the contact pressure (Pc) is generally higher than tyre inflation
pressure (Pt.) and ranges as in the equation below:
Pc = 1.3 – 1.5 Pt. ……………………………… (2.15)
A pneumatic tyre pressing on road surface forms a contact area that is approximately elliptical.
For a given wheel load, the contact area decreases as the inflation pressure is increased. The extent
of the decrease in any given situation will of course depend on the initial wheel load and the quality
of the tyre itself.
The actual pressure transmitted to the pavement increases in an apparent linear relationship with
the inflation pressure increased. Usually the effects of high inflation pressures are most
pronounced in the upper layers of a pavement and have relatively little differential effects at greater
depths. In other words., for a given wheel load the tyre inflation pressure has little effect on the
depth of pavement required above the sub grade, but it is this pressure which controls the quality
of the materials used in the upper layers.
Usually contact area (Ac) is assumed to be circular and is considered to equal wheel load divided
by the contact pressure. The radius (R) of the assumed circular contact area is given as:
R = √𝑝
𝑃𝑐 𝜋 ----------------------------------- (2.16)
Where;
P – Magnitude of load
Pc – Contact pressure
2. MAGNITUDE OF INDIVIDUAL WHEEL LOAD.
The passage of each individual wheel load on pavement causes the pavement to undergo
visco – elastic deflection, whose extent reflects the magnitude of the wheel load applied. Higher
wheel load causes higher stresses and deflections.
Excessive wheel load results into excessive plastic deformation leading to plastic deformation of
pavement. Also repeated application of any given wheel load leads to accumulation of plastic or
permanent deformation and may also lead to fatigue cracking depending on rigidity of pavement
layers. It is the total wheel load which determines the depth of pavement required to ensure that
the sub grade is not overstressed. Elastic deformation leads to failure by cracks originating from
down the layer while plastic deformation leads to failure by vaulting.
3. WHEEL AND AXLE LOAD CONFIGURATION
Single wheel causes more damage to a road pavement that an equally loaded dual wheel assembly.
Similarly single axle assembly would cause more damage to pavement than multiple axle assembly
carrying the same load. This is due to the fact that in single wheel assembly the load is transmitted
over a small contact area as opposed to a dual wheel assembly where load distribution area is wide.
Theoretically the single wheel load required to reproduce the same maximum stress in a
homogeneous material as are given by dual wheel assembly is given as

24
𝑃𝐸 =𝑃+𝑃𝑍5
(𝑍2+𝑆52)52
…………………………………. (2.17)
Where
𝑃𝐸 = equivalent single wheel load
P = LOAD ON EACH DUAL TYRE
Z = Depth to the plane being stressed
S = Distance between the centers of individual tires.
The above relationship indicates that:
- The calculated stresses at the pavement surface when Z = 0 due to the individual wheels of the
assembly and there are no interacting effects.
-The distance between the tyre centers plays an important part in the stress distribution beneath
the surface.
The maximum stress/vertical at any depth within loading depends on depth below the point of
loading, radius of contact area, contact pressure such that
Log Z = Log K + Log P ……………………………. (2.18)
Where
K = Constant = 𝐶
√(𝑃𝐶𝜋)
𝑃𝐶 = Contact pressure
C = constant =𝑧
𝑟
For a given vertical stress and constant pressure, 𝑧
𝑟 is a constant.
4. SPEED OR RATE OF LOADING
Slow moving loads cause more damage to the pavement than fast moving loads due to the fact that
load is maintained on the same spot over a longer period of time for a fast moving load, this leads
to a faster accumulation of delayed elastic and non-recoverable plastic deformation and may lead
to rutting.
In practice the vehicle speed effect is most noticeable on sections of the road used by the slow
moving heavily loaded commercial vehicles.
Pavement requirements for heavily loaded uphill gradients may be more demanding than for
downhill and level gradients due to increased distress shown by uphill traffic lanes can at least
partly attributed to vehicle speed effect.
When a load is applied on a pavement. There is an instantaneous increase in strain to a certain
level (elastic strain) as the stress is maintained of the period, the pavement suffers a combination
of plastic and elastic deformation. When the load is removed there is an instantaneous recovery of
part of the strain

25
(a).The rest of the strain the pavement suffers a part from the recovered strain is a combination of
delayed strain
(b) Recovered after the load has been removed
(c) Permanent strains that is non recoverable strain that accumulates to cause the pavement failure.
Studies have shown that higher rates of stress application are experienced at speeds lower than 25
km/h such that, (O’ FLAHERTY, VOL 2)
5. NUMBER OF REPETITION OF AXLE LOADING.
Although the effect of material fatigue on highway pavement behavior is little understood at this
time, there is a little doubt it plays a critical role in pavement distress and eventual failure.
On highways, with bituminous surfacing a flexible pavement which fails by fatigue may be
indicated by alligator or map cracking on the surface. This form of cracking may be a result of the
fatigue characteristics of the bituminous material itself of it may reflect the effect of the repeated
loading on the road base, sub base and the subgrade materials.
The effect of the number of the repeated loads obtained during the AASHTO Road test suggest
that for a given axle load, the pavement thickness required to provide a given terminal level of
service is proportional to the logarithm of the number of repetitions of the axle load. Also from
British test road data indicates that pavement deformation is a function of time and the number of
load application. (O’ FLAHERTY, VOL 2).
The surfacing layer can only take a given magnitude of stress beyond which it fails. Repetition of
axle loads leads to a buildup of radial tensile stress at bottom of surfacing layer which may lead to
failure of the asphalt layer by fatigue cracking if the flexural capacity of the layer is exceeded.
Also repeated load effect leads to a buildup of vertical stress at the top of subgrade which leads to
failure by deformation if the bearing capacity of the subgrade is exceeded. The critical/permissible
strain for each pavement layer is dependent on three factors:
-Quality of material – Influences the value of elastic modules (E) and Poisson’s ratio (𝜇), both of
which influence the elastic behavior of the material.
- Thickness of the layer
-Number of application of standard axles such that N = K (𝑖
𝑒) n ------------------------------ (2.16)
Where
N = number of load repetitions K and n are constants depending on material characteristics and
layer thickness.
E = critical strain for a given material that leads to failure if exceeded.
6. POSITION OF LOADING RELATIVE TO THE CROSS- SECTION OF
PAVEMENT.
Maximum deformation takes place when loading is applied along the outer edge of a pavement
due to the discontinuity of pavement and possibility of subgrade softening as water seeps from the
side drains into the outer edges of the subgrade layer. Because of the discontinuity of pavements,
shear failure and lateral displacement of pavement and or sub grade can easily occur. Also from
26
British test road data, it is explained that most deformed portion of the pavement is about 1 m from
the edge of the carriageway i.e beneath the nearside vehicle wheel truck in the slow outer traffic
lanes. The far side traffic lane which primarily serves only overtaking vehicles (mostly cars) is
relatively little distressed.
2.5 Pavement Materials.
All highways have to be founded on the natural soil and all require efficient usage of locally
available materials, for maximum economic benefits. The materials used in the construction of
highways are of interest to the highway engineer particularly with regard to their properties an
engineering characteristics.
This requires not only a thorough understanding of the soil and aggregate properties which affect
pavement stability and durability but also the properties of the binding materials which may be
added to improve natural materials.
2.5.1 Subgrade.
According to Road Design Manual Part III, the most important characteristics of sub grade is its
elastic modulus. It has been proved that there is good correlation between the CBR and elastic
modulus of Kenyan soils. Since CBR test is fairly easy and widely used test, it has been decided
to retain it as the quantitative means of evaluating the sub grade bearing strength.
Classes of Sub Grade Bearing Strength.
A survey of Kenya sub grade soils, described in Materials Branch Report No. 345 has shown that
they can be grouped into the following six bearing strength classes.
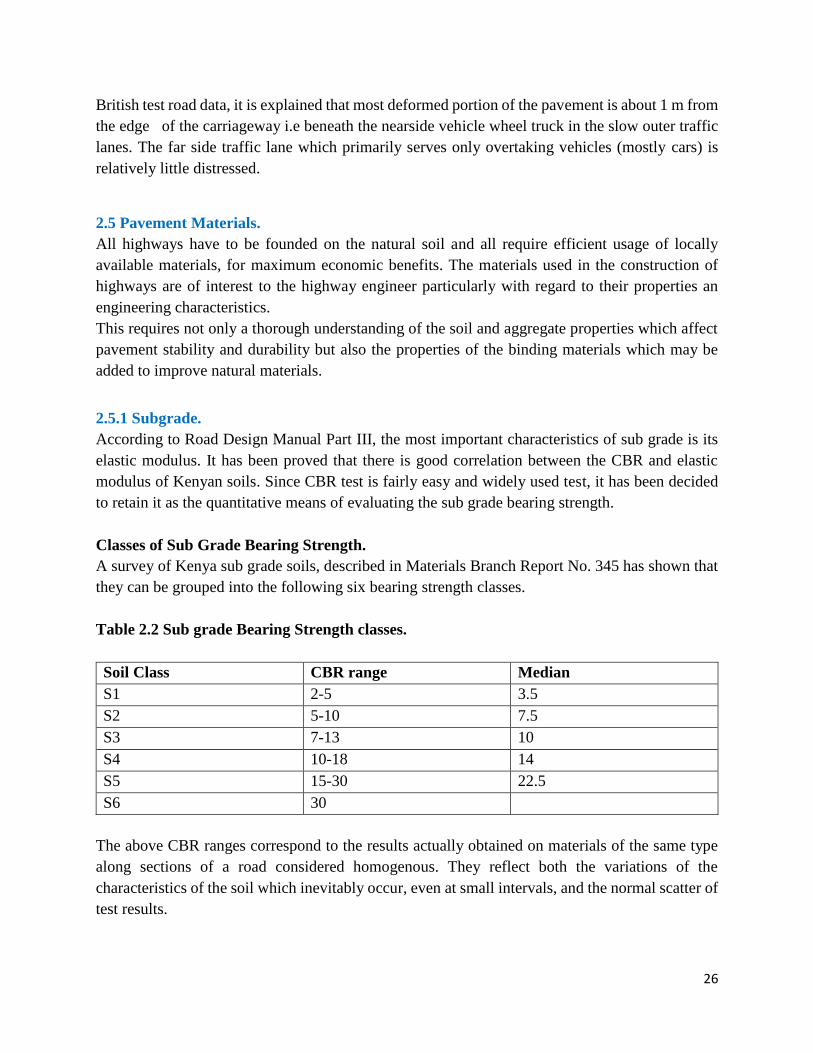
Table 2.2 Sub grade Bearing Strength classes.
Soil Class CBR range Median
S1 2-5 3.5
S2 5-10 7.5
S3 7-13 10
S4 10-18 14
S5 15-30 22.5
S6 30
The above CBR ranges correspond to the results actually obtained on materials of the same type
along sections of a road considered homogenous. They reflect both the variations of the
characteristics of the soil which inevitably occur, even at small intervals, and the normal scatter of
test results.
27
The soils with CBR less than 2 are regarded as weak soils and are Saturated expansive clay,
Saturated fine silts of compressive soils (Mud, Soft clay etc.)
Soil class S1 (CBR 2-5) should be avoided as much as possible. It should be replaced or covered
with sufficient thickness of an improved subgrade material.
Soil class S5 (CBR 15-30) is fairly wide. It consists of gravelly material or well drained granular
soils.
S6 subgrades cover soils with CBR greater than 30 and for which sub base is normally not required.
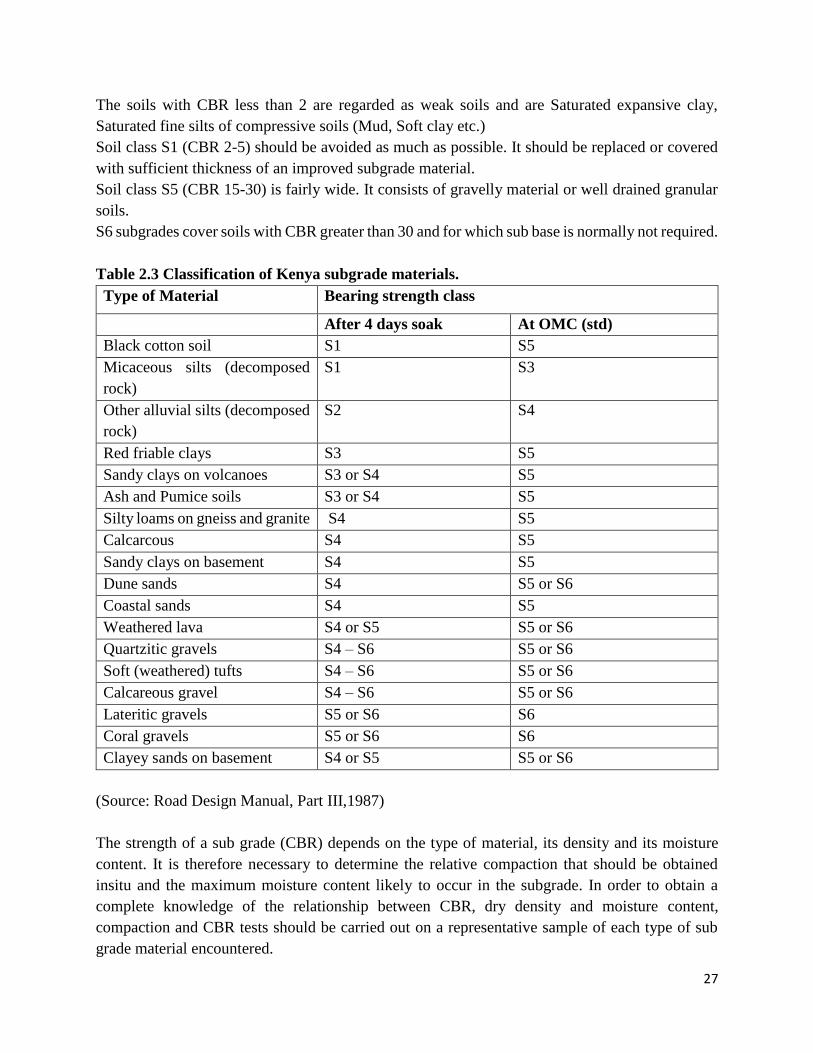
Table 2.3 Classification of Kenya subgrade materials.
Type of Material Bearing strength class
After 4 days soak At OMC (std)
Black cotton soil S1 S5
Micaceous silts (decomposed
rock)
S1 S3
Other alluvial silts (decomposed
rock)
S2 S4
Red friable clays S3 S5
Sandy clays on volcanoes S3 or S4 S5
Ash and Pumice soils S3 or S4 S5
Silty loams on gneiss and granite S4 S5
Calcarcous S4 S5
Sandy clays on basement S4 S5
Dune sands S4 S5 or S6
Coastal sands S4 S5
Weathered lava S4 or S5 S5 or S6
Quartzitic gravels S4 – S6 S5 or S6
Soft (weathered) tufts S4 – S6 S5 or S6
Calcareous gravel S4 – S6 S5 or S6
Lateritic gravels S5 or S6 S6
Coral gravels S5 or S6 S6
Clayey sands on basement S4 or S5 S5 or S6
(Source: Road Design Manual, Part III,1987)
The strength of a sub grade (CBR) depends on the type of material, its density and its moisture
content. It is therefore necessary to determine the relative compaction that should be obtained
insitu and the maximum moisture content likely to occur in the subgrade. In order to obtain a
complete knowledge of the relationship between CBR, dry density and moisture content,
compaction and CBR tests should be carried out on a representative sample of each type of sub
grade material encountered.

28
Where a sufficient thickness of improved sub grade is placed, the overall subgrade bearing strength
is increased to that of a higher class and the sub base thickness may be reduced accordingly. The
table below shows the minimum thickness of each class of improved sub grade required on each
class of natural soil to obtain higher class of sub grade required on each class of natural soil to
obtain higher class of sub grade bearing strength. These minimum thickness have been calculated
taking into account the respective elastic moduli of each class of soil
(Source: Road Design Manual, Part III, 1987)
Table 2.4 Minimum thickness of improved sub grade required.
Strength class of
native sub grade soil
Improved Sub Grade
Material strength
class
Minimum thickness
required(mm)
New class of sub
bearing strength
S1 S2 400 S2
S3 350 S2
425 S3
S4 275 S2
325 S3
450 S4
S2 S3 300 S3
200 S3
S4 350 S4
S4 300 S4
150 S4
S5 350 S5
(Source: Road Design Manual, Part III, 1987)
According to Road design Manual Report Part III, the sub grade will be treated with lime in the
following cases:
1. Where the natural soil are excessively clayed and no better material is economically available,
their treatment with hydrated lime may be the cheapest solution.
2. Where the natural soils are excessively wet and cannot be dried out because of adverse weather
conditions, their treatment with quick lime may allow construction proceed and provide a
markedly stronger sub grade.
2.5.2 Sub base Materials.
A number of many different types of materials are usually used as sub base. Several tests have
been carried out on materials under different loadings conditions and under different climatic
conditions.

29
In Kenya, Road Design Manual Part III gives a variety of materials which can be used for the sub
base design on which the suitability depends on the traffic class/traffic loading.
It further gives the requirements which must be followed in order to achieve a satisfactory strength
which can last for the design life of the pavement. Different materials have different requirements
and guidelines which must be followed during the construction process. The following materials
are commonly used:
I. Natural gravels
II. Clayey and silty sands
III. Cement and lime improved materials
IV. Graded crushed stone
V. Soft stone.
Again for economic design, the selection of any of the materials listed above will depend on the
availability of the material in the project locality and in enough quality and quantity to certify the
design.
Charts are provided for these materials outlining all their requirements.
2.5.3 Base Materials.
The road base being the main structure layer of the pavement, a number of materials have been
selected worldwide to be used as road basseting Kenya the studies which were carried and
compiled in Road Design Manual Part III gives a variety of material which can be used as road
bases. Further the Materials must also certify the standards and specifications for their uses per
Ministry of Transport and Communication standard specifications for roads (1986).
Charts have also been developed outlining the traffic under which any of the materials chosen is
most suitable and all the requirements as pertains the construction and maintenance. materials
commonly used in Kenya are;
Natural gravel
Cement and lime improved materials
Cement stabilized materials
Graded crushed stone
Sand bitumen mixes
Dense bitumen macadam
Dense emulsion macadam
Lean concrete.
2.5.4 Surfacing Materials.
The choice of type of surfacing will be governed by the structural requirements, road safety
requirements, materials availability and cost considerations. For heavy and very heavy traffic
(classes T0,T1 and T2),asphalt concrete type 1 surfacing is normally recommended owing to its
high resistance to deformation, compared to type II which is of relatively lower resistance to
deformation. Asphalt concrete should generally offer better riding surface, better water proofing,

30
better structural strength and better skid resistance than surface dressing, which is a combination
of layers of various single size aggregates bound with bituminous binder such that the upper layer
is of small enough aggregates to fill up spaces between the relatively coarse aggregates of the
lower layer.
2.6 Pavement Thickness Design
2.6.1 General.
The thickness design of highway pavements requires a comprehensive and integrated
consideration of the following factors:-
The magnitude and number of repetitions of applied wheel loads and the contact area
between the tire carrying the load and the road surface.
The stiffness, stability, durability, the elastic and plastic deformation characteristics and
resistance to fatigue loading of the pavement layers.
Volumetric changes in the subgrade due to climatic changes, the deformation of the sub-
soil under load and the ability of the pavement layers to reduce the stress imposed on the
sub soil by the wheel loads.
The severity of impact of external environmental factor.
While considerable progress has been made in the development of structural theory to design of
highway pavements, the complexity of the many factors involved in practical highway design has
resulted in the adoption of many thickness design methods based on experience.
In the case of flexible pavements, the total pavements thickness required has been determined by
a comparison between the compressive strain applied to sub grade and the maximum permissible
strains which varies with material type and quality and depends on the number of load applications.
In the case of bound materials, the thickness required for each individual layer has been determined
by a comparison between the tensile strain at the bottom of the layer and the maximum permissible
strain, as deduced from the fatigue law of the material.
2.6.2 Design Methods.
The design is supposed to cover for 15 years. According to CBR design method, (O’FLAHERTY
volume 2). The design life was derived at after carrying out failure investigation of roads which
had generally been in service for at least 20 years after construction or major maintenance. This is
due to the fact that pavement design and construction is a very expensive process hence the design
life is chosen to justify its construction.
It should be when the materials used during road construction have started deteriorating hence this
is the same procedure which was used in Kenya by Kenya Road Research which is contained in
Road Design Manual Part III. With this in mind, a careful review of internationally and locally
acceptable design methods has been done.
The design methods fall in two categories namely:
Analytical design procedures
Empirical design methods

31
Analytical methods are essentially based on mathematical modeling techniques requiring the use
of proprietary computer software. The accuracy is dependent on the input of specific road building
materials properties, which are most often no readily available.
Being computer generated, the process of arriving at specific pavement structure is not transparent
and therefore not readily appreciated by most engineers.
Empirical methods are very familiar and the process of arriving at a pavement structure is easily
followed by a simple progression through a series of tables and design graphs.
Group Index Methods:
This is an empirical design method developed at the USA, is based on the particle distribution and
plasticity of the subgrade materials. This is an inverse measure of the supporting strength of the
sub grade. The higher the group index the lower is the soil strength. It rudimentarily considers
traffic loading under three groups:
Light traffic – less than 50 commercial vehicles per day
Medium traffic – 50 -300 commercial vehicles per day
Heavy traffic – more than 300 commercial vehicles per day.
The basic consideration in developing this method was that as long as pavement layers above
subgrade are adequately compacted, their thickness may only be influenced by the strength of the
subgrade which depends on moisture content and internal structure of the soil.
G1 = 0.2a + 0.005ac + 0.01bd ------------------------------------------------- (2.24)
Where
G1
a = that portion of the percentage passing the No. 200 sieve which is greater than 35 and which
does not exceed 75..expressed as a positive whole number(0 =40)
bc =the portion of the percentage passing No 200 sieve which is greater than 15 and which does
not exceed 55,expressed as a positive whole number (0-20)
c = that portion of the numerical liquid limit which is greater than 40 and which does not exceed
60, expressed as a positive whole number (0 – 20)
d = that portion of the numerical plasticity index which is greater than 10 and which does not
exceed 30,expresses as appositive whole number (0-20)
G1 ranges between 0 – 20. 0 implies very good material (high Bearing capacity), and GI = 20
imply very poor material (low bearing capacity)
The design charts which are usually provided provides the pavement layer thickness for values of
GI corresponding to different traffic loading levels

32
CBR Design methods:
This was developed by California State Highway Department, involves the determination of the
CBR value of the subgrade as well as that of the sub base and base materials. Pavement layer
thickness are then selected from the charts on the basis of the relevant design wheel load. This
method has since undergone modifications over the years to accommodate varying traffic loading
patterns, as well as different environmental conditions.
Road Note 29 Design Method:
TRRL and UK developed this on the basis of full-scale pavement test on flexible pavement under
sub-tropical and temperate climatic conditions. It is a modification of the original CBR and traffic
loading in terms of equivalent standard axle load over a given design period. It also considers
quality of various road construction materials in terms of their strength, resistance to weathering
and also resistance to frost action.
If T1 represents traffic loading in terms of cumulative number of standard axles at the time of
opening the road for use, then design traffic loading Td may be determined from the expression:-
Td = T1 ((1 + r) 𝑛 − 1)/𝑟 …………………………………… (2.25)
Where:
n = design period in years
r = average annual traffic growth rate
Design charts are then used to determine the pavement type, structure and layer thicknesses given
the availability of materials and the expected cumulative standard axles during the pavement
design life.
Road Note 31 Design Method:
This road note is based principally on research conducted in countries throughout the world by the
Overseas Centre of the Transport Research Laboratory, On behalf of the Overseas Development
Administration. The research was carried out with the collaboration of highway authorities in
many tropical and sub-tropical countries. It was originally limited to design of roads carrying low
traffic volumes up to a maximum of 1500 commercial vehicles per day in both directions, or 2.5
million standard axles over an average design life of 15 years.
The pavement materials and layer thickness are selected on the basis of subgrade and sub base
CBR as well as traffic loading, considered in terms of cumulative number of standard axles over a
pre-determined design life. In its original version, and for rural roads with design loading of over
0.5 million standard axles, RN 31 method allowed construction to be done in two stages.
First stage involved the provision of strong enough structure to carry up to 0.5 MSA and when
traffic loading exceeds 0.5 MSA, provide an overlay or strengthening structure to enable the
pavement carry its ultimate design traffic, as the second stage.

33
In its current version, the road note 31 design method is based on a catalogue of possible structures
for given subgrade class and traffic loading categories.
The traffic is grouped into 8 groups as listed in table 2.5 below:
Table 2.5 Traffic Classification.
T1 < 0.3 MSA
T2 0.3 – 0.7 MSA
T3 0.7 – 1.5 MSA
T4 1.5 – 3.0 MSA
T5 3.0 – 6.0 MSA
T6 6.0 – 10 MSA
T7 10 – 17 MSA
T8 17 – 30 MSA
Sub grade is also classified as in the table 2.2
A suitable pavement type and structure is selected from a catalogue of structures on the basis of
subgrade strength, traffic loading and availability of construction materials, also taking into
account the variability in material properties and construction control, uncertainty in traffic
forecasting, the effects of climate and high axle loads and the overall statistical variability in road
performance.
Ministry of Works Design Method.
This is a design method developed by the Ministry of Works of the Kenya Government on the
basis of extensive research on characteristics of insitu soils, construction materials available in the
country and o traffic loading condition on roads within the country and also drawing from design
standards and procedures already developed and proved by other road authorities worldwide. The
research carried out by the ministry resulted in the publication of the present pavement design
manual with particular reference to the conditions and materials in Kenya.
The design manual adopts an integrated approach in that full details of possible materials for the
pavement layers are given as well as the details as to how these may be combined, and in what
thickness, to form a satisfactory pavement for a given traffic volume. The pavement designs are
given in the form of catalogues. The designer is cautioned that the adoption of the guidelines and
standards given in the manual do not automatically ensure a serviceable and economic road design
and that this can only be achieved through careful consideration and balancing of various controls,
criteria and elements involved.
AASHTO Design Method.
This is based on original findings of AASHO road test done in the USA in the late 1950s and on
functional conditions of pavement accessed over a period of time. The axle load conversion factor
divided from the road test is of the format given

34
F = (Li/8160) 𝑛……………………………………………… (2.26)
Where
n = varies between 3 and 6 for varying conditions, tending more toward 6 for weaker pavement
and subgrade conditions and for uncontrolled axle loading conditions. The lower factor tending
towards 3 is for strong pavement structure, good subgrade conditions and controlled axle loading
conditions.
The design charts developed on the basis of road test results relates traffic strength of pavement in
terms of structural number SN, soil quality in terms of soil support value(s), traffic loading in terms
of equivalent number of standard axle loads and environmental conditions represented by the
regional factor (R) for a given level of pavement serviceability (PSI) or the limiting serviceability
(TSI).
The structural number (SN) ranges in value from 1.0 to 6.0, traffic loading is expressed in terms
of cumulative number standard axle during the design life of the pavement, or in terms of daily
axle applications.
Thus, given the soils support value (which could be defined in terms of the CBR of the group index
of alignment soil) and the traffic loading value (in terms of equivalent daily standard axles), one
obtains the structural number SN. By applying a regional factor, a weighted structural number SN
is obtained. The weighted structural number is used in the design equation.
The design equation
SN = a1D1 + a2D2 +a3D3 ……………………………………………………… (2.27)
Where
D1, D2, D3 are thicknesses of surfacing, base and sub base layer respectively in inches.
a1,a2 and a3 are coefficients depending on quality of surfacing, base and sub base layers
respectively and vary as follows:-
a1 varies from 0.2 to 0.44
a2 varies from 0.07 to 0.3
a3 varies from 0.05 to 0.11
Any combination of layer thickness and material type satisfies the design equation is generally
considered to result into a satisfactory design. It is however important that each layer of pavement
is given adequate cover above to prevent failure of individual layers of pavement. The design is
also supposed to satisfy the economic and other constraints.
Kentucky Design Method
This is a modification of the CBR design method. It converts the measured wheel load into an
equivalent number of standard 5000 lbs. wheel loads.

35
Table 2.6 Conversion of measured wheel load into an Equivalent Number of standard 5000
lbs. wheel loads.
Wheel
load
×10 3 lb
5 6 7 8 9 10 11 12 13
EWC
factor
1 2 4 8 16 32 64 128 256
The design procedure is as follows: -
Determine expected traffic flow(commercial vehicle per day) in one or both directions
depending on the facility, which is being considered for design
Establish the number of commercial vehicle in each weight group from axle load survey
data from which the total design traffic loading in terms of equivalent number of standard
wheel loads is determined.
ESWL /year = number of CVs / wt. group × EWL × 365 in the initial year.
For a given design period, traffic is projected using compound interest formula.
Td = Ti (1 + r) 𝑛………………………………………. (2.28)
Where
Td= design traffic
Ti = initial traffic
r = Growth rate from historical data
n = design life in years
The projected traffic Td is then used to select the appropriate design curve and pavement
thickness is the determined for a standard material of CBR 100 % and the thickness corrected
to allow for use of material with CBR less than 100%using the expression
t1 = t2 √(100/CBRi)…………………………………………… (2.29)
Where
t1 = actual thickness of pavement layer whose CBR is less than 100% represented by CBRi.
t2 = thickness of standard material of 100 % CBR is determined from the design charts
CEBTP pavement Design Method for Tropical Countries:
(Centre Experimental de Recherches et d’Etudes du Batiment et des Travanx Public, Manual de
dimensionnement de chausses pour les pays tropcaux secretariat d’Etat anx Affaires Etrangeres).
This is a common design method in French speaking tropical countries. The subgrade strength is
assessed on the basis of the CBR, and traffic is categorized into four classes. It is essentially a
modification of the original CBR design method. Design involves selection of a pavement
structure from a list of four basic pavements.

36
TRL Laboratory No 1132
This is a research report that summarizes extensive research, stretching back over a thirty – five
year period. As in Road Note 29 design guidelines are based on the measured performance through
full-scale experiments. These have now yielded a much greater quantity of data than at the last
review in the late 1960s, when several major experimental road sections had only recently been
built. There have also been considerable advances in interpreting the behavior of the road
pavement as engineering structures. The result of research on mathematical modeling of pavement
behavior and the simulative testing of road materials and pavement have been used to re-analyze
the behavior of the full-scale experiments. Work has been carried out at the laboratory and at other
centers, both in this country and abroad.
Standard designs developed of pavements with different types of road base constitute the reference
structures to which the design methodology can be applied in order to provide the basis for
accessing improved material and other designs.
Conclusion.
A number of different materials are available for pavement thickness design hence the choice will
be based on materials availability, cost as well as technical attainability. The design method which
takes into consideration of locally available materials at reasonable cost will be considered. In
addition, one design method which was developed under nearly similar condition will be
considered and its results compared with the locally available design method outcome. The choice
of the alternative will be based on the most economical one.
37
Chapter Three.
Methodology.
3.1 General.
This chapter explains how different studies and data collection exercise were taken. This was
necessary since the pavement design problem will be based on data collected as well as the studies
and assessments made on the site conditions.
3.2 Traffic data.
The purpose of traffic count and analysis is to attempt to predict future traffic and hence the extent
of pavement loading.
The data for the traffic count was obtained from the consultant and is attached in the Appendices.
3.3 Material investigation and testing.
3.3.1 General.
In order to determine the pavement profile and the underlying layer, it was important to carry out
trial pit investigation and subjecting the materials to various tests so as to determine the residual
strength of the subgrade which is an important parameter for pavement design.
The test results are attached in the Appendices.
The frequency of trial pits were spaced out along the line of existing roads at intervals of 500
meters although in some instances where poor ground conditions were encountered, the spacing
was reduced so as to obtain a more detailed information as to the quality of the proposed road bed.
Each trial pit were excavated down to a minimum specified depth of one meter.
3.3.2 Tests carried out.
During the course of the trial pit investigation the respective layer of pavement construction were
subjected to visual examination and where possible by insitu testing.
3.3.3 Laboratory Test.
After carrying out the field investigations, samples were collected from trial pits dug to depths
ranging from 1.2m to 1.5m at intervals of 0.1 km and submitted to the laboratory for testing:
I. Natural moisture content determination.
This was carried out in accordance with the procedures given in Test N 1 (BS 1377: 1975
Edition).

38
The samples were weighed and then dried thermostatically controlled oven at a temperature
of 105 ̊ C ± 10 ̊ C for a period of 24 hours prior to re-weighing and determination of the
natural moisture content.
II. Grading to 0.075 mm.
The samples (subgrade) were subjected to particle size analysis in accordance with the
method described in Test No 7A (wet sieving) BS 1377: 1975 Edition.
III. Atterberg limits.
The sub – grade used in the determination of Atterberg limits were obtained by riffling
down the bulk samples in accordance with the methods described in BS 1377; 1975
Edition. The material was air dried and prepared by sieving through a 425 um mesh, to
remove the oversize fractions, thereafter water was added prior to conditioning the material
for a period of 24 hours in an air tight container.
On completion of the initial preparatory sequence, and the soaking period described above,
the samples were re-mixed to the required paste consistency prior to commencing the test.
The procedure are as BS 1377 Test No 2A, 3 and 4 1975.
IV. Maximum density / Optimum moisture content relationship.
A representative fraction from the bulk samples were obtained and air-dried. Water was
added incrementally to the sub samples, to represent the respective range of moisture
content required and allowed to soak for a period of 24 hours prior to commencing the test.
The test were as per BS 1377: Test No 12 1975
V. California Bearing Ratio.
The specimens were prepared by statically compacting the soil to represent 100% of the
maximum dry density as determined from Test No 12 BS 1377: 1975 and then allowed to
soak for a period of 4 days prior to applying an incremental loading in a manner as
described in Test No 16 BS 1377: 1975.
The results that were obtained are attached.
VI. Compaction tests.
- A standard compaction, 2.5 kg rammer was used.

39
Chapter Four
Data Collection and Analysis.
4.0 ALIGNMENT SOILS
4.1 Field Investigations
Samples of alignment soils from trial pits dug to depths ranging from 1.2 m to 1.5 m where no
rock was encountered below existing road were collected at intervals of 0.1 km then subjected to
the following tests;
i. Grading to 0.075 mm
ii. Atterberg Limits
iii. Compaction tests (standard compaction, 2.5 kg rammer)
iv. California Bearing Ratio (CBR) and swell on samples moulded at 100 % MDD (standard
compaction) and OMC (standard compaction). CBR values were determined after 4 days
soak.
4.2 Test Results
Complete alignment test results and logs for investigation pits are presented in Appendix 1 and 2
respectively. The interpretations and analysis is discussed in the subsequent paragraphs.
4.2.1 Particle Size Distribution of Alignment Soils
The alignment soils range from fine grained darkish- blackish Clay soil (Black cotton soil) on
Khahinga side and gravelly to rocky alignment on the sigiri side.
Table 4.1: Alignment Soil Types
Chainage Road Section Soil Type
0-1+500 Khahinga Side Predominantly Blackish Silty Clay
0-0+80 sigiri Predominantly Blackish Silty Clay
0+80-1+200 sigiri Predominantly iron stained Gravel
4.2.2 MDD and OMC
Table 2 gives the range of the Maximum Dry Density (MDD) and the Optimum Moisture Contents
(OMC) for the various road sections.

40
Table 4.2: Alignment MDD and OMC
Road Section MDD(kg/m3 Soil Type
Max. Min. Average
Khainga 1710 1361 1,705 Fine grained soil
Sigiri 2112 1,586 1,800 Gravelly Soils
The MDD ranges between 1361-1710 Kg/m3 with OMC ranging between 13.4 – 29.4% on
Khainga side and 1586 – 2115 Kg/m3 with OMC ranging between 9.1 – 19.3% on Sigiri side.
4.2.3 Alignment Soils CBR
Table 3 is a summary of alignment soils test results classified in accordance with the Kenya Road
Design Manual Part III (RDM III). Graphical presentations are given in Figures 1 to 4.
Table 4.3: Sub Grade Classification (Reproduced from RDM Part III)
SUB GRADE CLASS CBR RANGE
S1 2-5
S2 5-10
S3 7-13
S4 10-18
S5 15-30
S6 >30

41
Table 4.4: Alignment Soils CBR Classes
Chainage
(km)
Towards Sigiri Towards Khahinga
CBR (%) SG Class CBR (%) SG Class
0 + 000
7
S2 7 S2/s3
0+100
19
S5 8 S3
0+200
25
S5 7 S2/s3
0+300
15
S5 7 S2/s3
0+400
24
S5 5 S1/S2
0+500
13
S3/S4 5 S1/S2
0+600
21
S5 7 S2/s3
0+700
17
S5 7 S2/s3
0+800
19
S5 6 S2
0+900
18
S5 7 S2/s3
1+000
21
S5 6 S2
1+100
18
S5 5 S1/S2
1+200
11
S3/S4 6 S2
1+300
- -
5 S1/S2
1+400
- -
7 S2/s3
1+500
- -
5 S1/S2
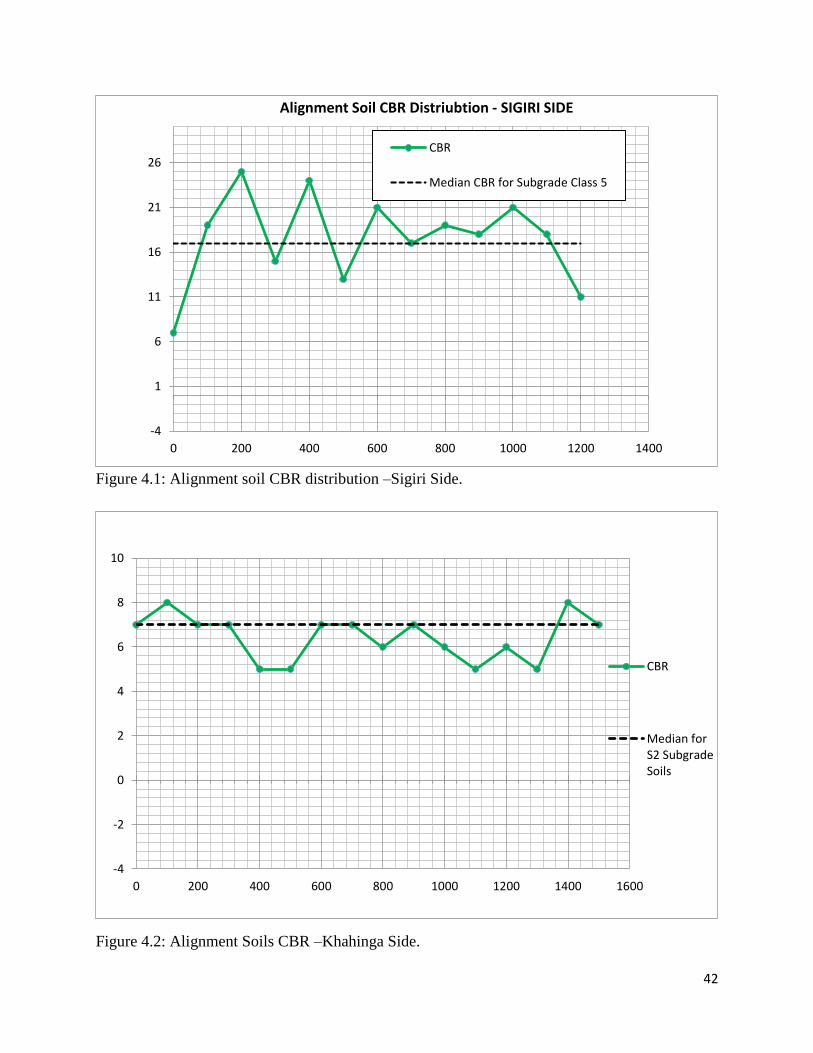
42
Figure 4.1: Alignment soil CBR distribution –Sigiri Side.
Figure 4.2: Alignment Soils CBR –Khahinga Side.
-4
1
6
11
16
21
26
0 200 400 600 800 1000 1200 1400
Alignment Soil CBR Distriubtion - SIGIRI SIDE
CBR
Median CBR for Subgrade Class 5
-4
-2
0
2
4
6
8
10
0 200 400 600 800 1000 1200 1400 1600
CBR
Median forS2 SubgradeSoils
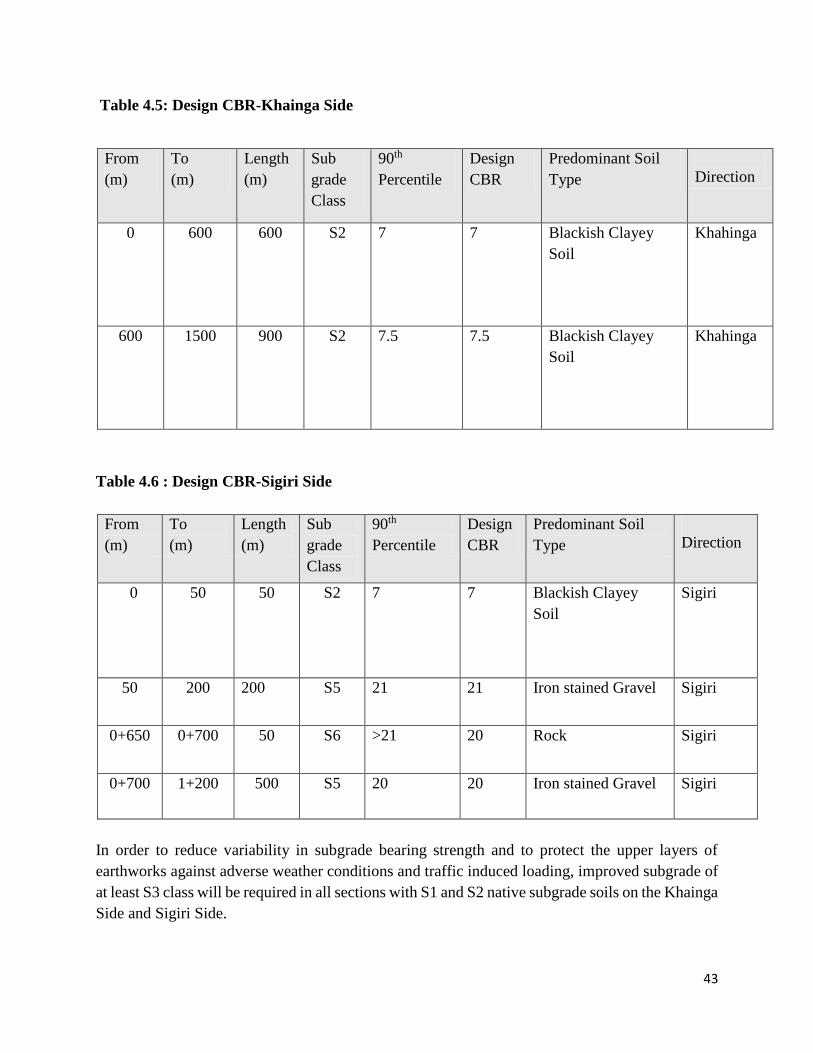
43
Table 4.5: Design CBR-Khainga Side
From
(m)
To
(m)
Length
(m)
Sub
grade
Class
90th
Percentile
Design
CBR
Predominant Soil
Type
Direction
0 600 600 S2 7 7 Blackish Clayey
Soil
Khahinga
600 1500 900 S2 7.5 7.5 Blackish Clayey
Soil
Khahinga
Table 4.6 : Design CBR-Sigiri Side
From
(m)
To
(m)
Length
(m)
Sub
grade
Class
90th
Percentile
Design
CBR
Predominant Soil
Type
Direction
0 50 50 S2 7 7 Blackish Clayey
Soil
Sigiri
50 200 200 S5 21 21 Iron stained Gravel Sigiri
0+650 0+700 50 S6 >21 20 Rock Sigiri
0+700 1+200 500 S5 20 20 Iron stained Gravel Sigiri
In order to reduce variability in subgrade bearing strength and to protect the upper layers of
earthworks against adverse weather conditions and traffic induced loading, improved subgrade of
at least S3 class will be required in all sections with S1 and S2 native subgrade soils on the Khainga
Side and Sigiri Side.

44
4.2.5 Swell and Plasticity Index
The allowable swell (RDM Part III) at 100% MDD and 4-days soak for materials for earthworks
and subgrade are 3% and 2%, respectively. The Plasticity Index (PI) criterion for earthworks
materials is 50%.Table 6, shows that all alignment soils meet this criteria.
Table 4.7: Alignment Soils PI and Swell
Chainage
(km)
Khainga Side Sigiri Side
PI
(%)
Swell
(%)
Remarks PI
(%)
Swell
(%)
Remarks
0 + 000 23 <2 Ok 22 <2 O.K
0+200 26 <2 Ok 22 <2 O.K
0+300 24 <2 Ok 22 <2 O.K
0+400 24 >2 Not Ok 16 <2 O.K
0+500 27 <2 Ok 15 <2 O.K
0+600 23 <2 Ok 18 <2 O.K
0+700 15 <2 Ok 17 <2 O.K
0+800 18 <2 Ok 18 <2 O.K
0+900 36 <2 Ok 24 <2 O.K
1+000 28 <2 Ok 14 <2 O.K
1+100 25 <2 Ok 18 <2 O.K
1+200 26 <2 Ok 15 <2 O.K
1+300 35 >2 Not Ok - <2 O.K
1+400 37 <2 Ok - <2 O.K
1+500 29 <2 Ok - <2 O.K
0+100 33 <2 Ok 20 <2 O.K
All PI values are less than 50% while swell values are less than 2% on the Sigiri Section. High
values of swell greater than 2% were recorded on the Khainga Section
4.3 .NATURAL MATERIAL SITES TEST RESULTS.
4.3.1 Description of Material Sites.
3 potential material sites were identified, sampled and tested for suitability at this preliminary
design stage. Table 7 below gives a summary of their locations, and estimated quantities fig.1-3
shows the general view of the material sites. Detailed description of Material Sites, layout plans,
trial pit logs and test results are given in Appendix 2.
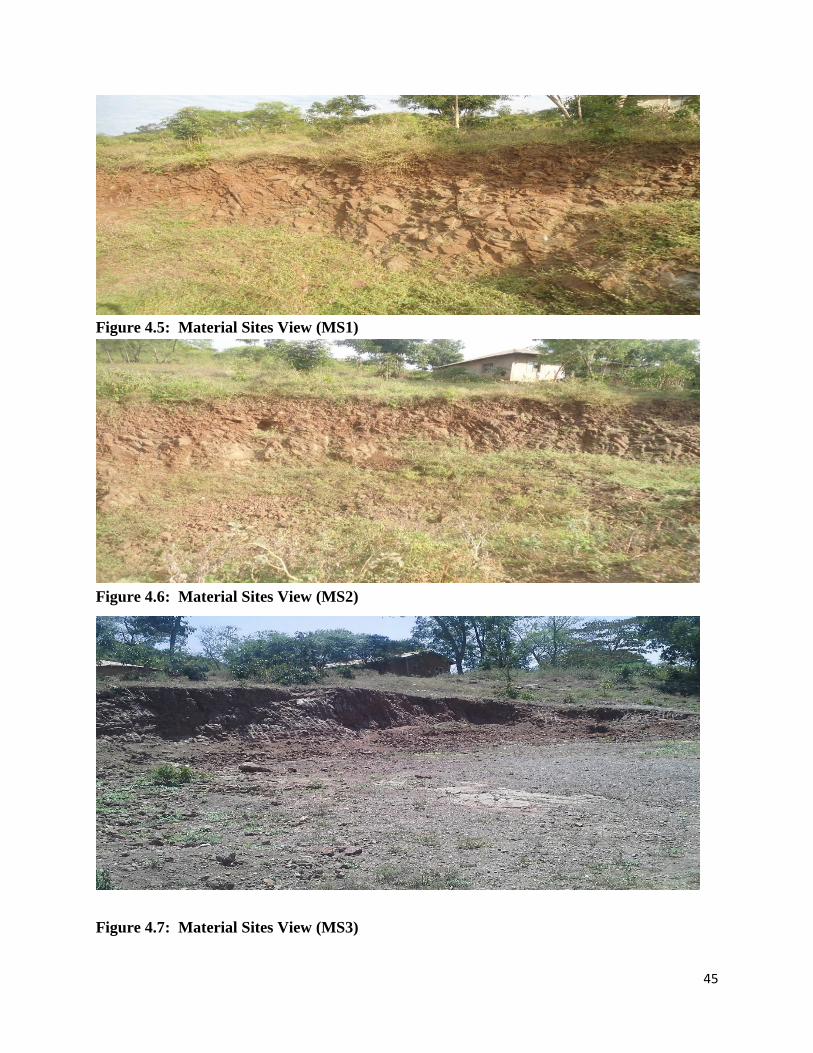
45
Figure 4.5: Material Sites View (MS1)
Figure 4.6: Material Sites View (MS2)
Figure 4.7: Material Sites View (MS3)

46
Table 4.8: Material Quantities
MS
No.
Location
Sigiri
Side
Gravel
Depth(m)
Approximated
Size(m)
Quantity(m3)
Estimated Estimated Total
Requirement
1 0+300L 2 50x30 3,000
2 0+300L 2 50x30 3,000 7,000
3 0+500L 2 50x30 3,000
4.4 Materials Sites Test Results
4.4.1 Grading, Plasticity, and CBR
Trial pits were dug to depths ranging from 1.2 m to 2.0 m. and samples taken and tested for the
following parameters:
i. Grading to 0.075 mm sieve.
ii. Atterberg Limits.
iii. Compaction tests (Heavy compaction: 4.5 kg rammer).
iv. CBR and swell at 4 days soak on specimens moulded at OMC (Heavy compaction) at 95
% MDD.
A summary of test results for three (3) material sites are given in Table 8 and detailed results
are in Appendix 6.
Table 4.9: Material Test Results Summary
MS Ref. Grading PI (%) PM CBR (%)
% Pass
2 mm
% Pass
0.075 mm
1 27-38 14-17 15-17 272-306 31
2 42-51 19-23 13-16 272-330 25
3 20-42 12-18
14-15 322-450 20

47
4.4.2 CBR Requirements.
Test results obtained from the material sites were compared with requirements of RDM III to de-
termine their suitability for pavement layers, based on the CBR, PI, PM, and grading criteria.
RDM III Chapter 7 highlights the general requirements for different types of pavement materials
before and after improvement with lime or cement.
Clause 7.2.1 / 2 / 3 and Chart SB2 cover natural gravels as well as cement and lime improved
Materials for sub-base. Clause 7.3.1/ 2 and Chart B2 cover natural gravels as well as cement
and lime improved materials for base. CBR Requirements
According to Chart SB1 and B1 (RDM III), minimum CBR requirements for natural material for
base and sub base are 80% and 30% respectively. From Figure 6, natural gravel from Material
Sites MS 2 and 3 do meet minimum requirements for sub-base but not base, MS3 marginally meet
minimum for sub base sub base but not for base.
Figure 4.8: Suitability of natural gravel for sub base and base material - CBR criterion
4.4.3 Plasticity Index Requirements
PI results obtained for all the Material Sites were marginal for the three material sites Figures 5
below. Using this criterion alone, improvement with CEMENT to lower plasticity would and
increase strength would be necessary.
0
10
20
30
40
50
60
70
80
90
0 1 2 3
Base Quality
Sub Base Quality
Neat
Evaluation for Neat Samples Based on CBR
Materials Site Ref.
CB
R (
%)

48
Figure 4.9: Suitability of natural gravel for sub base and base material - PI criterion for
M1, 2and 3
4.4.4 Plasticity Modulus Requirements
From Figure 6 below, it can be seen that natural gravels from all the material sites do not meet the
Plasticity Modulus criterion and therefore cannot be used in their natural states as pavement
materials.
Figure 4.10: Suitability of natural gravel for sub base and base material - PM criterion
05
101520253035404550
0 1 2 3
Maximum Passing0.075 mm
Creterion Evaluation of Based on PLASICITY INDEX(% )
Materials Site Ref.
0
50
100
150
200
250
300
350
400
450
500
0 1 2 3 Maximum PM forSub base and Base
Acceptance Creterion for natural gravel Based on Plasticity Modullus
Materials Site Ref.

49
4.4.5 Materials Requirements before Improvement
According to RDM III, gravels for improvement for sub-base and base layers should meet certain
minimum requirements. Test results were checked against these requirements as given on chart
SB2 of RDM III and summarized in subsequent paragraphs.
Table 4.10: Material Test Results Summary before Treatment
MS Ref. CBR PI PM
MS 1 31 16 249
MS2 25 15 300
MS3 20 15 330
Suitability for Sub base MS1 Marginal None
Suitability for Base None Marginal None
4.5 Conclusion
Table 4.10 summarizes the findings of natural gravels from all the three Material Sites. It can be
deduced that they do not meet all the requirements of RDM III and therefore do not qualify for use
as sub-base or base material without some form of improvement.
Table 4.11: Summary of Test Results for Criteria of Evaluation of Neat Materials
MS
Ref.
CBR Criterion PI Criterion PM Criterion
Base Sub base Base Sub base Base Sub base
MS1 Ok Ok Ok ok ok Ok
MS2 Ok Ok Ok ok ok Ok
MS3 Ok Ok Ok ok ok Ok
4.6 IMPROVED MATERIALS TEST RESULTS.
4.6.1 Tests on Treated Samples.
Samples from each trial pit were mixed to produce 0ne large samples. At this stage only one large
sample was subjected to the following tests:
i. M.D.D. Modified AASHTO (T.180)
ii. O.M.C. Modified AASHTO (T.180)
iii. CBR at 7 days cure + 7 days soak on specimens moulded statically at OMC and 95 % MDD
with 2%, 3% and 4% OPC 42.5 cement.
iv. Atterberg Limit tests at each cement content.
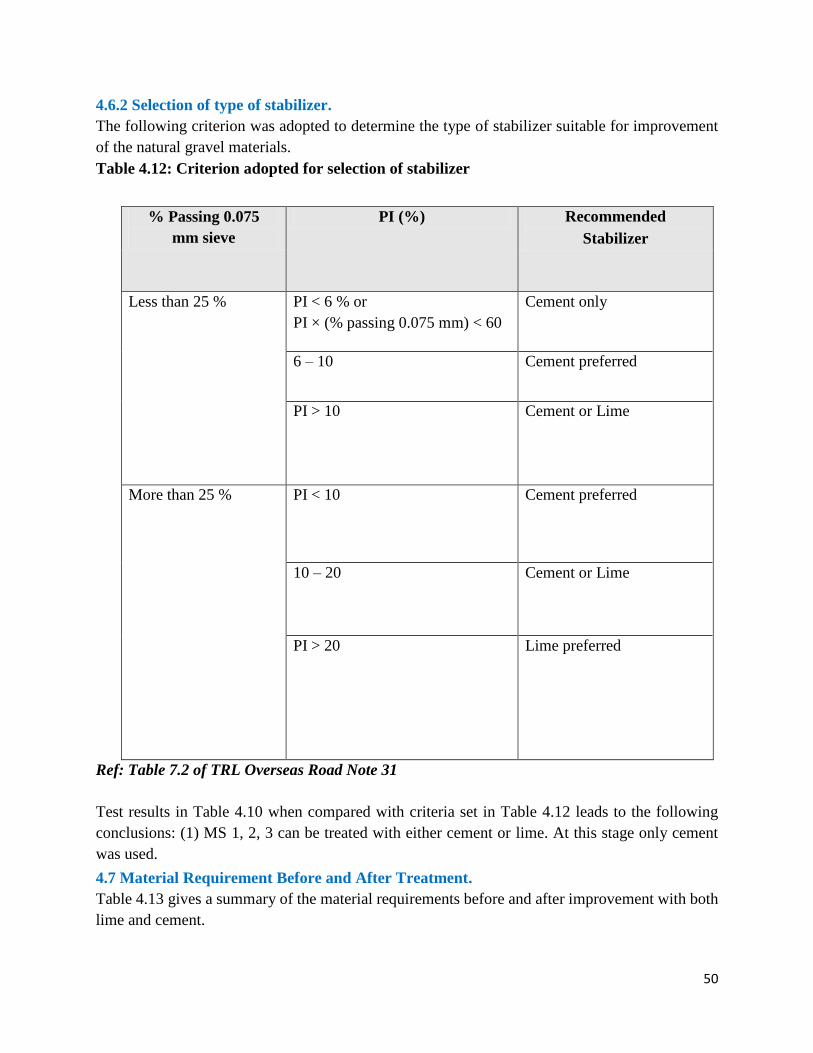
50
4.6.2 Selection of type of stabilizer.
The following criterion was adopted to determine the type of stabilizer suitable for improvement
of the natural gravel materials.
Table 4.12: Criterion adopted for selection of stabilizer
% Passing 0.075
mm sieve
PI (%) Recommended
Stabilizer
Less than 25 % PI < 6 % or
PI × (% passing 0.075 mm) < 60
Cement only
6 – 10 Cement preferred
PI > 10 Cement or Lime
More than 25 % PI < 10 Cement preferred
10 – 20 Cement or Lime
PI > 20 Lime preferred
Ref: Table 7.2 of TRL Overseas Road Note 31
Test results in Table 4.10 when compared with criteria set in Table 4.12 leads to the following
conclusions: (1) MS 1, 2, 3 can be treated with either cement or lime. At this stage only cement
was used.
4.7 Material Requirement Before and After Treatment.
Table 4.13 gives a summary of the material requirements before and after improvement with both
lime and cement.

51
Table 4.13: Minimum material requirements before and after improvement
MS Ref. Pavement Layer
Sub Base Base
Before
Treatment
After
Treatment
Before
Treatment
After
Treatment
Bas
e
Sub
base
Base Sub
base
Base Sub
base
Base Sub
base
Maximum size (mm)
–for Natural Gravel
10 -
15
10 - 15 - 10 -
50
10 –
50
-
Passing 0.075 mm (%)
– for Natural Gravel
Max.
40
Max.
40
- 5 -35 5 -35 -
Passing 0.425 mm (%) Min.
15
- - Min.
15
- -
Plasticity Index (%)
– for Natural Gravel
Min.
10
Max.
30
Max.
15
Min.
10
Max.
25
Max. 6
Plasticity Modulus Max.
2500
Max.
2500
Max.
250
Max.
2000
Max.
2000
Max.
250
Organic matter (%) Max.
2
Max. 2 - Max.
1
Max.
1
-
CBR at 95% MDD
(4 days soak) (%)
- - - Min.
20
Min.
20
CBR at 95% MDD
(7 days cure+7 days soak) (%)
- - Min.
60
- - Min.
160
Source: RDM III Charts SB2 and B2
Having established that the natural gravel from potential Material Sites could not be used as sub-
base and base material in their natural state, the materials were treated with Ordinary Portland
Cement (OPC). Detailed test results are given in Appendices 3 and summarized in Tables 4.14 to
4.16 below.
4.8 Material Site 1
From Table 4.14, material from MS1 met the minimum requirements for use as a base and sub
base material when treated with at least 4% cement and 4% lime respectively.

52
Table 4.14: Material Test Results for MS1 after Improvement
Test Cement Treatment
2% 3% 4%
CBR 90 146 176
PI Non Plastic Non Plastic Non Plastic
PM 0 0 0
Suitability for Sub base ok ok Ok
Suitability for Base Not ok ok Ok
4.9 Material Site 2
MS2 required at least 3% cement to qualify for use as a treated base material and at least 2%
cement to qualify for use as a treated sub base material.
Table 4.15: Material Test Results for MS1 after Improvement
Test Cement Treatment
2% 3% 4%
CBR 110 146 180
PI Non Plastic Non Plastic Non Plastic
PM 0 0 0
Suitability for Sub base ok ok Ok
Suitability for Base Not ok ok Ok
4.10 Material Site 3
Table 4.16: Material Test Results for MS3 after Improvement
Test Cement Treatment
2% 3% 4%
CBR 120 146 180
PI Non Plastic Non Plastic Non Plastic
PM 0 0 0
Suitability for Sub base ok ok Ok
Suitability for Base Not ok ok Ok
4.11 Recommended Treatment for Sub base and Base Material
Table 4.17 contains recommendations on the content of cement for the treatment of sub-base and
base materials from each of the sites identified.

53
Table 4.17: Recommended lime or cement content for sub base and base material
Material Site No. Recommended Treatment for
Sub-base
Recommended
Treatment for Base
1 2% Cement 4% Cement
2 2% Cement 4% Cement
3 2% Cement 4% Cement
Cement treated materials at various contents were found to be suitable for sub base and base.

54
Chapter Five
Traffic Studies.
5.1 Introduction
5.1.1 Initial studies
The traffic studies for this project were carried out in 2009 the study included Origin – Destination
studies conducted over two (2) days. To derive the growth rates, an economic analysis was
conducted and the resulting growth rates arrived at adopted for the design.
The traffic forecasted included the diverted traffic, generated traffic and the normal traffic as
indicated in the ToR. The traffic analysis yielded the year 10 and 20 Average Annual Daily Traffic
(P.C.U) values as indicated below.
Table 5.1.1: Basic Capacity and Proposed Cross – Section Types (initial Design)
Growth Rate AADT (PCU) Cross Section Types
Low 276 IV, V, VII
Medium 289 IV, V, VII
High 301 IV, V, VII
(Source: Traffic Report for the Sigiri Bridge Project by Eng Ogola)
The geometric traffic gave a cross-section type IV. However, given the fact that the design life for
Sigiri Bridge was 50 years, the design recommended a higher cross section type III (modified)
for the R43 road, with provisions for NMT at the bridge. The clear cross section provided therefore
was 9.50 m comprising of 6.5m carriageway and 1.50 m clearance on each side for the cyclists,
pedestrians and parapets.
5.1.2 Vehicle Classification
Traffic classification is necessary to establish the level of utilization, distribution, and supply of
traffic.
To establish the traffic by type and volume the following classes can be adopted, that is compatible
to the input for HDMIV:
Motor cycles, mopeds, scooters
Cars
Pick-up, 4-WD, Utility vehicle

55
Matatus
Light goods vehicles (2 axle, <=1500 kg unladen weight)
Medium goods vehicles (2 axle, >1500 kg unladen weight)
Heavy goods vehicles (3, 4 axle)
Articulated trucks (5+ axle)
Buses
5.2 Objectives and Scope of the Traffic Review Study
1. The primary objective of the study was to determine future traffic that would use the proposed
Sigiri Bridge upon completion. The future traffic will enable the determination of the geometric
features of the upgraded R43 road and the cross-section of the Sigiri Bridge. In addition, the
pavement structure for the R43 would be determined from the expected traffic loading.
2. The second objective was to give an assessment of the likely economic and social benefits and
impacts of the project. The project road carries no traffic currently as the link is severed by R.
Nzoia. Traffic studies was conducted along adjacent roads that form the traffic interface of the
area. These roads can be narrow down to D251 and C29
5.3 Traffic Surveys
Traffic surveys were conducted along the C29 and D251 roads which will be linked by the
proposed Sigiri Bridge. The surveys were also conducted along R43 and at the river crossings.
These roads (C29 and D251) are located approximately 1.5km from the banks of River Nzoia.
5.3.1 Average Annual Daily Traffic
Using the seasonal factor of 1.00, the ADT calculated was factored to give the estimated AADT
for each traffic class and for the entire traffic along the project road.
5.3.2 Normal Traffic Composition and Characteristics
The project road is currently not in use as a through road. This current traffic, along the road R43
was denoted as the normal traffic 2014. Normal traffic in P.C.U was also calculated for the roads
D251 and C29.
The table 5.3.4 below shows the normal traffic along D251, C29 and R43. The traffic is presented
for one direction and for the sum of both directions.

56
Table 5.3.2; Average Annual Daily Traffic (AADT) roads D251, C29 and R43
(Source: Traffic Report for the Sigiri Bridge Project by Eng Ogola)
(Source: Traffic Report for the Sigiri Bridge Project by Eng Ogola)
TOTAL S.F AADT
VEHICLE TYPE A B
MOTORCYCLE 671.2 726.6 1397.8 1.0 1397.8 55.9
CARS 118.2 115.6 233.9 1.0 233.9 9.4
JEEPS, PICK-UPS 17.5 12.9 30.5 1.0 30.5 1.2
MINIBUS 22.2 21.8 43.9 1.0 43.9 1.8
MATATU 10.7 10.1 20.8 1.0 20.8 0.8
LIGHT TRUCKS 0.3 0.1 0.4 1.0 0.4 0.0
MEDIUM TRACKS 12.7 21.1 33.8 1.0 33.8 1.4
HEAVY TRUCKS 0.9 1.9 2.7 1.0 2.7 0.1
ARTICULATED TRUCTS 0.3 0.3 0.6 1.0 0.6 0.0
SMALL BUSES 8.1 8.8 16.9 1.0 16.9 0.7
LARGE BUSE 5.7 10.9 16.5 1.0 16.5 0.7
NON-MOTORISED 372.0 329.9 701.9 1.0 701.9 28.1
103.3 105.0 208.3 1.0 208.3
ONE WAY
Tabla AP3.1: Traffic along road D251 at Bubango station
NORMAL ADT (2014) NORMAL AADT (2014) PERCENTAGE
COMPOSITION
VEHICLE TYPE A B TOTAL S.F AADT
MOTORCYCLE 362.7 355.5 718.2 1.0 718.2 57.6
CARS 6.5 7.6 14.2 1.0 14.2 1.1
JEEPS, PICK-UPS 2.2 34.0 36.2 1.0 36.2 2.9
MINIBUS 16.5 9.6 26.1 1.0 26.1 2.1
MATATU 13.1 10.9 24.0 1.0 24.0 1.9
LIGHT TRUCKS 5.4 4.2 9.6 1.0 9.6 0.8
MEDIUM TRACKS 0.0 0.0 0.0 1.0 0.0 0.0
HEAVY TRUCKS 0.0 0.0 0.0 1.0 0.0 0.0
ARTICULATED TRUCTS 0.0 0.0 0.0 1.0 0.0 0.0
SMALL BUSES 0.0 0.0 0.0 1.0 0.0 0.0
LARGE BUSE 0.0 0.3 0.3 1.0 0.3 0.0
NON-MOTORISED 203.9 215.5 419.4 1.0 419.4 33.6
50.9 53.1 104.0 1.0 104.0
NORMAL ADT (2014) NORMAL AADT (2014) PERCENTAGE
COMPOSITIONADT (2014)
Tabla AP3.2: Traffic along road C29 at Khainga station
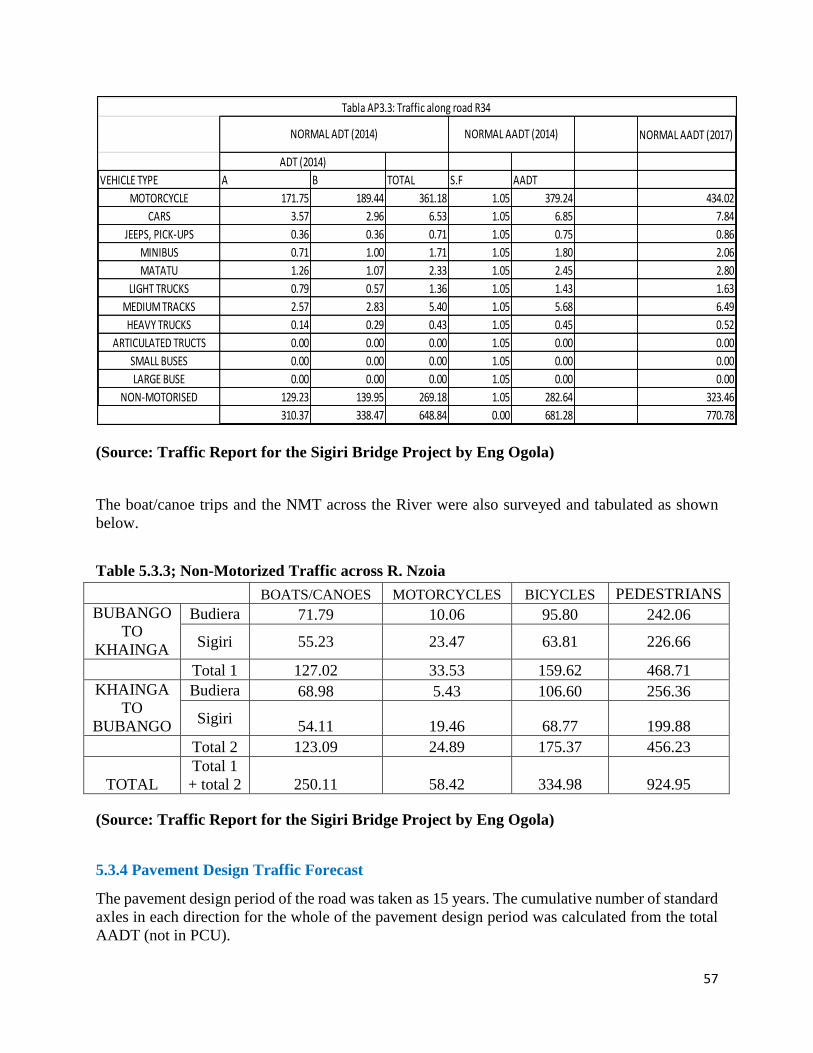
57
(Source: Traffic Report for the Sigiri Bridge Project by Eng Ogola)
The boat/canoe trips and the NMT across the River were also surveyed and tabulated as shown
below.
Table 5.3.3; Non-Motorized Traffic across R. Nzoia
BOATS/CANOES MOTORCYCLES BICYCLES PEDESTRIANS
BUBANGO
TO
KHAINGA
Budiera 71.79 10.06 95.80 242.06
Sigiri 55.23 23.47 63.81 226.66
Total 1 127.02 33.53 159.62 468.71
KHAINGA
TO
BUBANGO
Budiera 68.98 5.43 106.60 256.36
Sigiri 54.11 19.46 68.77 199.88
Total 2 123.09 24.89 175.37 456.23
TOTAL
Total 1
+ total 2 250.11 58.42 334.98 924.95
(Source: Traffic Report for the Sigiri Bridge Project by Eng Ogola)
5.3.4 Pavement Design Traffic Forecast
The pavement design period of the road was taken as 15 years. The cumulative number of standard
axles in each direction for the whole of the pavement design period was calculated from the total
AADT (not in PCU).
NORMAL AADT (2017)
VEHICLE TYPE A B TOTAL S.F AADT
MOTORCYCLE 171.75 189.44 361.18 1.05 379.24 434.02
CARS 3.57 2.96 6.53 1.05 6.85 7.84
JEEPS, PICK-UPS 0.36 0.36 0.71 1.05 0.75 0.86
MINIBUS 0.71 1.00 1.71 1.05 1.80 2.06
MATATU 1.26 1.07 2.33 1.05 2.45 2.80
LIGHT TRUCKS 0.79 0.57 1.36 1.05 1.43 1.63
MEDIUM TRACKS 2.57 2.83 5.40 1.05 5.68 6.49
HEAVY TRUCKS 0.14 0.29 0.43 1.05 0.45 0.52
ARTICULATED TRUCTS 0.00 0.00 0.00 1.05 0.00 0.00
SMALL BUSES 0.00 0.00 0.00 1.05 0.00 0.00
LARGE BUSE 0.00 0.00 0.00 1.05 0.00 0.00
NON-MOTORISED 129.23 139.95 269.18 1.05 282.64 323.46
310.37 338.47 648.84 0.00 681.28 770.78
NORMAL ADT (2014) NORMAL AADT (2014)
ADT (2014)
Tabla AP3.3: Traffic along road R34

58
Average vehicle equivalence factors as per Road Design Manual part III are given below.
Average Vehicles Equivalence Factors as per Road Design Manual:
Vehicle Category E.F.
Motorcycle 0
Cars 0
Jeeps,Pick-Ups 0
Minibus 0.3
Matatu 0.1
Light Trucks 1
Medium Tracks 2
Heavy Trucks 4
Articulated Trucks 4
Small Buses 1
Large Buses 1
Non- motorized 0
The mean Equivalence Factor (EF) values from Road Design Manual were used with data obtained
for road C30 for the conversion of the axle loads to standard axles, and cumulated over the design
period to obtain the Cumulative Number of Standard Axles (CNSA).
5.3.5 Cumulative Number of Standard Axles and Traffic Classes
The Cumulative Number of Standard Axles and recommended Traffic Classes, in accordance to
Road Design Manual Part III, Table 2.5.1 are summarized in Table 5.3.8.5 below for entire
alignment.

59
Table 5.3.5: Cumulative Number of Standard Axles and Traffic Classes
Section; 2033
Bubango - Khainga
Traffic Growth Rates
Low Medium High
Cum. Std.
Axles
(x106)
Traffic
Class
Cum. Std.
Axles
(x106)
Traffic
Class
Cum.
Std.
Axles
(x106)
Traffic
Class
Review (15 year) 0.63 T5 0.71 T5 0.86 T5
Review (20 year) 0.90 T5 1.00 T4 1.3 T4
Initial (20 year) 0.23 T5 0.28 T5 0.34 T5
(Source: Traffic Report for the Sigiri Bridge Project by Eng Ogola)
The recommended traffic class for pavement design is T5 as recommended in the initial design.
Conclusion
The traffic class T5 has been assigned to the road R43 and has been adopted for pavement design.

60
Chapter Six
Pavement Design.
6.1 General.
The purpose of structural design is to limit the stresses induced in the subgrade by traffic to a safe
level at which the subgrade deformation is insignificant. At the same time, it must ensure that the
road pavement layers themselves do not deteriorate to any serious extent within a specified period
of time. The pavement distress is measured primarily in terms of riding quality, rut depth and
cracking, to predetermined values.
6.2 Pavement Design Methods.
The design method chosen should provide an economic pavement design at a reasonable cost. The
MOTC Road Design Manual is commonly used for road designs in Kenya especially for
government – funded projects .It tends to over – economize on its recommended pavement
structure as compared to other design documents like TRRL which is based on a lot of research,
practical and experimental work. Their design tend to be very extravagant, when compared to
Kenya road building standards, but the designs are long lasting due to the layers provided.
Pavement design must incorporate materials depending on their availabity, stability and resistance
to weather effects, cost and technical acceptability.
6.3 Road design Manual Part III.
This is the mostly used method for design of road in the country. It takes into consideration the
use of locally available materials depending on the road location aimed at cost reduction/economic
justifications. The range of materials which are readily available is given in the manual and various
combinations depending on the traffic classes and on the economic justification.
Sigiri Road has a traffic class of T5 (Refer to Table 5.3.5) and, improved subgrade of at least S3
class will be required in all sections with S1 and S2 native subgrade soils on the Khainga Side and
Sigiri side while sections with S3 and above will be sufficient. The pavement types to be
considered for the road design is type 3 (Catalogue attached in the Appendices.)

61
Double surface dressing
o o o o o o
o o o o o o
oooooooooo
oooooooooo
125 mm Cement Improved Base
+ + + + + +
+ + + + + +
+ + + + + +
+ + + + + +
150 mm Cement Improved Sub base
Figure showing various layers thickness as per the Road Design Manual part III
Materials Required.
Surfacing
Double surface Dressing
Base
Cement Improved material
Sub base.
Cement Improved material
Pavement Section.
The recommended road cross-sections, in accordance to Road Design Manual Part I, are as
Summarized below.
Table 6.1; AADT (2028) and Cross Section Types
Section; 2028
Bubango –
Khainga
Traffic Growth Rates (10th Year)
Low Medium High
AADT Cross
Section Type
AADT Cross
Section Type
AADT Cross Sec.
Type
Review Values
(10 year)
1994 III or IV 2281 II or III 2889 II or III
Initial Values
(10 years)
276 IV, V, VII 289 IV, V, VII 301 IV, V, VII
(Source: Traffic and Table 4.2.2, Road Design Manual Part I)

62
From the AADT figures above, the recommended road cross sections for the project road is type
III cross-section. The initial design proposed similar cross-section (Type III modified) for the R43
road, with provisions for NMT at the bridge. The clear cross section of the bridge will therefore
be 9.50 m comprising of 6.5m carriageway and 1.50 m clearance on each side for the cyclists,
pedestrians and parapets.
Conclusion
The cross section Type III provided for in the design is sufficient for design period up to the year
2038.
63
Chapter Seven.
Discussion, Conclusion and Recommendation.
7.1 General.
This chapter talks about the findings of the project in comparison with the Objectives.
7.2 Materials.
Some of the alignment soils on Khainga side was found to be of class S1 and S2.This class is not
suitable to form a good sub grade for the pavement hence the recommendation to improve the class
to S3 through stabilization.
The same applies on the Sigiri side for the sections that are of class S2.
For the three Material Sites the tests showed that the base and sub base will require cement
improved materials as indicated in table 4.17.
7.3 Design.
From the design methods available KRDM part III is the most appropriate because the method
considers locally available materials.
The proposed design consists of
Double surface Dressing.
Cement improved material for base and sub base.
7.4 Maintenance.
It is necessary for a road pavement to be subjected to reasonable level of maintenance in order to
achieve a long Service period.
Maintenance activities consist of recurrent and Periodic Maintenance which are discussed below.
Routine Maintenance.
Routine maintenance entails:
Spot traveling – Fill pot holes and small depressions, reduce roughness, exclude surface
water
Drainage and verge maintenance – Control run off of surface water, reduce erosion and
material loss, improve surfacing and sub grade strength by lowering moisture content.
Unclog locked pipes
Dragging – Redistribute surface gravel, fill minor depressions, and improve safety.

64
Shallow blading – Redistribute surface materials, Fill minor depressions, and reduce
roughness.
Dust control – Control depth of lose fine materials and dust loss.
Periodic Maintenance.
This is required after given interval of several years depending on the traffic volume using the
road under consideration. It involves Resealing, Overlaying, Pavement reconstruction,
Preventive Treatment
Conclusion.
The objective of the study was arrived at since the Pavement Design was developed in accordance
to the Road Designers Manual and specifications for various layers found.
Recommendation.
From the study conducted about the topic, the following are the recommendation with regard to
the above project:
1. The Bridge and hence the Approach Roads should be constructed as this will ease and
increase the movement of people and goods over the river in turn increase of economic
activities.
2. In order to reduce on the cost of construction materials from the locality should be used in
the pavement construction minimize cost that could have been incurred in the process of
material importation.
3. The road in question is not used by a lot of people due to the absence of the bridge although
once the bridge is constructed more people will start using it hence the number of road
users will be increasing with time. Because of this Stage construction approach should be
used hence at no stage will the investment be made in advance of the actual requirement.
4. Maintenance of the constructed facilities should always be undertaken this will increase
the Service span of the Bridge and Road.
5. Road furniture consisting of guardrails on the bridge, signposts, direction markers, as well
as road markings should be adequately provided.
6. Appropriate drainage should be provided in order to remove water from the road surface
which normally results into road damage and also results into loss of skid resistance and
splashing of water to other road users. This is very necessary since the area of study ia
prone to flooding.

65
References:
1. Chakroborty, P. and Das, (2003). A. Principles of Transportation Engineering, Prentice Hall
of India, January.
2. Traffic Report for the proposed Sigiri bridge project by Engineer Ogola
3. Lecture Notes – FCE 545 (2016) Unpublished.
4. Lecture Notes – FCE 546 (2015) Unpublished.
5. Highway design by Gichaga and Parker.(1988)
6. Road Design Manual part 1.
7. Road Design Manual Part III.
8. Road Deign Manual Part IV.
9 BS 1377 – Test Procedures(1975)
10 Salter R.J (1979) Highway Design and Construction, University of Bradford.

66
APPENDICES.
Appendix 1: Alignment Soil Test Results.

67
Appendix 2 Attached on the next page

68
Appendix 3: Attached on the next page
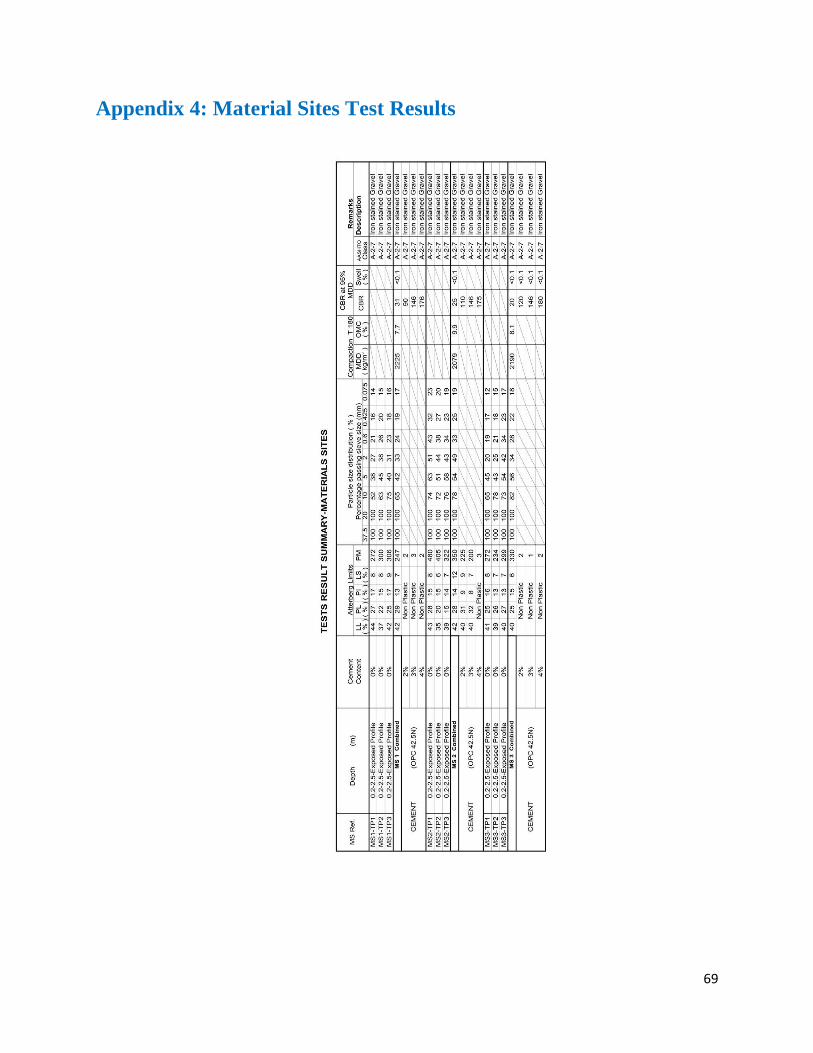
69
Appendix 4: Material Sites Test Results

70
Appendix 5:
Sample Trial Pit.

71
Current Mode of transport across River Sigiri
ppppp

72
Sand harvesting from the river.
Sample testing at the lab

73
Appendix 6: Road Design Manual Part III.