back to the future - changing job profiles...working paper no. 13 02/2018 hanno lorenz, fabian...
TRANSCRIPT

Working PaperNo. 1302/2018
Hanno Lorenz, Fabian Stephany
Ein Working Paper der
Back to the Future - Changing Job Profiles in the Digital Age
– Our results indicate, that while clerical computer- based routine jobs are likely to change in the next decade, professional activities with the processing of complex information are prone to digital change. These disciplines can be regarded as a sustainable choice for future generations seeking job security in unsteady times.
Keywords
– Bayesian, Classification, Employment, GLM, Tech-nological Change.
Abstract– The advances of Machine Learning (ML) and Mobi-
le Robotics (MR) change our life. In light of increa-singly „smarter“ technologies, the future of (hu-man) labour is questioned on a daily basis.
– A study by Frey and Osborne (2013), one of the most recognized contributions in this domain, estimated that half of the US labour force is highly susceptible to computerization in the near future. Their fin-dings have been applied for several follow-up inves-tigations in other countries. However, the transfera-bility of the results is limited by the set-up of the study.
– In contrast to previous investigations, our approach tries to overcome past shortcomings by collecting data on the susceptibility for the Austrian labour market by Austrian experts. Moreover, we use the information of the tasks performed by workers from the OECD’s PIAAC Dataset in order to allow for heterogeneity among workers within the same occupation.
– Additionally, we avert from the term of automation of jobs and focus on how much modern technolo-gies will change existing job-profiles and which pro-fessions show a greater need to adapt in the near future. We show that the diversity in previous fin-dings about the degree of job automation is to a lar-ge extent driven by model selection and not by con-trolling for personal characteristics or tasks.

Back to the Future -Changing Job Profiles in the Digital Age1
Hanno Lorenza, Fabian Stephanyb
aAgenda Austria, Türkenstraße 25, 1090 Vienna,[email protected]
bAgenda Austria and Vienna University of Economics and Business,[email protected]
Abstract
Frey and Osborne (2013) estimate that half of US employment will be automated withinthe next 20 years. Other follow-up studies conclude that only a small fraction of workers willbe replaced by digital technologies. In this paper, we show that the diversity of previous find-ings regarding the degree of job automation is, to a large extent, driven by model selectionand not by controlling for personal characteristics or tasks. In contrast to existing studies, ourapproach tries to overcome several shortcomings, such as transferring the estimations by Freyand Osborne (2013) to other economies. In contrast, we consult Austrian experts in machinelearning and industry professionals on the susceptibility to digital technologies in the Austrianlabour market. Our results indicate that, while clerical computer-based routine jobs are likelyto change in the next decade, professional activities, such as the processing of complex infor-mation, are less prone to digital change.
JEL classification: E24, J 24, J 31, J 62, O 33.Keywords: Classification, Employment, GLM, Technological Change.
1The authors would like to thank Monika Köppel-Turyna, Harald Oberhofer and Wolfgang Nagl for theirsupport and helpful comments.

1. Introduction
Our work examines the degree of future digitalization of job profiles in Austria. Frey and
Osborne (2013) conclude that half of US employment will be automated within the next 20
years. Their estimations are the basis for several follow-up studies in Europe. In order to
circumvent the caveats of applying pre-estimated probabilities, we conduct a survey among
Austrian research and industry experts in order to find out their views on the impact of dig-
ital technologies on the Austria labour market. Our model testing suggests that differences
in previous findings on the automation of jobs are mainly driven by model selection, rather
than heterogeneity among tasks within occupations. Our results indicate that, while clerical
computer-based routine jobs are likely to change in the next decade, professional activities,
such as the processing of complex information, are less prone to digital change.
The motivation behind our work is the discussion about technological unemployment, which
has accompanied technological processes throughout the last 250 years. Machines have both
complemented and competed with human labour in the past. Inventive ideas and creative
destruction, as Schumpeter (1942) puts it, have competed with powerful social and economic
interest over the technological status quo. Various movements, such as the Luddites, who de-
stroyed new machinery in the 18th century textile industry, have tried to deter progress in
times of rising unemployment. However, the Luddite fallacy has found its way into the liter-
ature, as employment has not been eradicated alongside fast technological development, but
instead continued to expanded. Rather than eliminating human labour as such, technological
advancements have changed a number of work profiles and led to the creation of new professions.
Whenever modern society experiences technological advancement, concerns about techno-
logically induced unemployment arise. In recent history, technological progress has often been
linked to a displacement in specific professions (Bresnahan, 1999) or even entire industries
(Charles et al., 2013; Jaimovich and Siu, 2012). However, to date, technological progress has
not caused mass unemployment. We have seen a shift in labour from the agricultural sector
to manufacturing branches, and further into the service sector (Autor, 2015). Overall employ-
ment has been steadily increasing worldwide, despite (or perhaps because of) technological
progress. Hence, new technologies display two opposite effects on employment (Aghion and
Howitt, 1994). On the one hand, technologies substitute human labour in order to decrease
production costs and increase productivity. This displacement effect lowers employment. On
2

the other hand, reduced production costs increase real income and hence demand. The latter
effect fosters production and demand for labour.
According to Goldin and Katz (1998), technological progress led to the simplification of work
processes in the 19th century. A combination of machines and unskilled labour substituted
skilled labour and decreased demand in terms of skills. However, as technologies improved,
technological job displacement shifted away from skilled to unskilled labour. Acemoğlu and
Restrepo (2017) calculate that an increased use of robots in the US economy between 1990 and
2007 had a negative effect on the labour market. According to their calculations, an increase in
the number of industrial robots by one, per 1,000 people employed, reduces the employment-
to-population ratio by 0.18 to 0.34 percentage points.
Similar to signs of competition with rooters for physical work, McAfee and Brynjolfsson
(2014) emphasize that computerization has now started challenging human performance in
cognitive tasks. Beaudry et al. (2016), in an empirical analysis, find evidence that the demand
for skilled labour has been declining in recent years. This is an indication that skills under
pressure of substitution are altering as technological progress persists. Autor and Dorn (2013)
show that the implementation of computer-based technologies has put pressure on wages. As
routine tasks are increasingly automated, displaced workers reallocate to the lower skilled ser-
vice sector with deteriorating wages. According to Goos et al. (2009), this has resulted in the
increased polarization of the labour market in a number of developed economies (see also Dust-
mann et al., 2009). Increasing demand for well-paid jobs in which non-routine cognitive tasks
are performed, as well as non-routine manual work at the lower end of the income distribution,
in combination with the automation of repetitive cognitive skills, is forcing employment away
from the middle of the income distribution (see also Autor et al., 2003; Autor, 2013; Michaels
et al., 2014).
Recent publications, such as Ford (2015), raise concerns that "this time it could be differ-
ent" and there will be no room for creating new jobs. Frey and Osborne (2013) set the starting
point for a series of papers that attempts to calculate the impact of digital technologies on the
demand for human labour. Based on their original data, collected during a workshop involving
machine learning experts, several papers about the susceptibility of jobs have been published.
3
Yet, transferring the data on susceptibility from the US labour market to European economies
is challenging in many respects. Until now, there has been no piece of research that has anal-
ysed the impact of computer automation on the labour market by using newly collected data
from European countries (such as Austria). This approach allows us to correct the short-
comings in transferring the original US data (O*NET) of Frey and Osborne (2013) to the
International Standard Classification of Occupations (ISCO). It also adjusts for regional par-
ticularities in labour markets, for example, differences in regulation or cultural particularities.
Even though technological innovations have become market-ready, customers may hesitate to
substitute them for human interaction. In addition, we analyse the possibility of a non-linear
relationship between education and future digitalization, since both low- and high-skilled jobs
are assumed to be less affected by digital technologies than medium-skilled professions Dust-
mann et al. (2009).
Addressing previous limitations, our study examines the degree of future digitalization of job
profiles in Austria. In order to circumvent the caveats of applying pre-estimated probabilities
by Frey and Osborne (2013), we conduct a survey among Austrian research and industry ex-
perts in order to find out their views on the impact of digital technologies on the Austrian
labour market. Our model references expert opinions on individual data from the OECD’s PI-
AAC data, which in turn allow for heterogeneity among workers within the same occupation.
Our results indicate that, while clerical computer-based routine jobs are likely to change in the
next decade, professional activities with the processing of complex information are less prone
to digital change. The following section 2 describes the methodology and data, followed by the
3 section, which summarizes the results, while the last section concludes the paper.
2. Data and Methods
Frey and Osborne (2013) were the first to attempt to quantify the potential of computer-
based job displacement in the near future. Based on the estimates of robotic experts, the
authors calculated the susceptibility to computerization of different jobs, according to the
O*NET database in the US. They conclude that 47% of the jobs in the US are at a high risk
(>70 % probability) of being replaced due to computerization. Bowles (2014) applies the same
method and transfers the results to European economies using the differences in the sectoral
structure of each country. He concludes that 54% of jobs in Austria have a high risk of being
displaced by computers.
4

Arntz et al. (2016) emphasize that the method used by Frey and Osborne (2013) overstates
the share of jobs susceptible to computerization. As Frey and Osborne (2013) do allow for het-
erogeneity in tasks between different jobs, they do not allow for alterations in the tasks within
one occupation. According to Arntz et al. (2016), one profession may contain different sets of
tasks, and thus the risk of computerization could vary within this profession. Using PIAAC
survey data, they combine information about the composition of tasks within each job profile
with information from robotic experts on the susceptibility of jobs for the US labour market.
They further transfer the results to other OECD member countries, indicating that 9% of US
workers and 12% of Austrian workers are at high risk due to computerization.2 Among OECD
countries, Austria, as well as Germany, displays the highest share of the workforce at a high
risk of computerization.
For the German labour market, Dengler and Matthes (2015) relate the risk of job automa-
tion to the tasks that are characteristic of each profession. They compute the share of tasks
that can be classified as routine based, according to the classification by Spitz-Oener (2006).
According to their findings, 15% of German workers are employed in jobs with a high risk of
automation. Likewise, for Austria, Peneder et al. (2016) find that 12% of Austrian workers
primarily perform routine-based tasks.
Similar to the approach by Frey and Osborne (2013), we begin our analysis with expert
opinions. Between 7th December 2017 and 7th January 2018, we consulted Austrian industry
experts and machine learning professionals. The final data set contained 35 individual experts’
opinions, with 14 individuals representatives of Austrian companies in the fields of construc-
tion, consulting, insurance, investment, media, real estate and retail, and 21 responses were
from industry and academic experts in machine learning and AI. Experts from both groups
were individually requested to participate in an online survey. In comparison, the expert work-
shop by Frey and Osborne (2013), which was held in 2013 at Oxford University’s Engineering
Sciences Department, included 70 machine learning experts (Brandes and Wattenhofer, 2016).
Together with their team of experts, Frey and Osborne (2013) initially labelled 70 out of 703
2Bonin et al. (2015) use a similar approach for Germany, Pajarinen et al. (2014) for Finland, and Nagl et al.(2017) for the Austrian economy. According to Nagl et al. (2017), 9% of Austrian workers have a high risk ofbeing automated.
5
US jobs. These binary labels were then used to predict risks of automation for all US profes-
sions. The resulting estimations formed the basis of the aforementioned studies in a European
context. However, for the estimation of impacts of digital technologies on the Austria labour
market, our expert opinions are better suited than the opinions stemming from the Oxford
seminar. Machine learning experts are familiar with the scientific principles of the technologies
disrupting the labour market, but they may not be fully aware of the social environments in
which smart technologies could be implemented. For example, even when chatbots in the fi-
nancial service sector become market-ready, from a technological point of view, some customers
will still prefer interaction with a human. In addition, the gap between technological readiness
and implementation varies to a sizeable extent between countries and cultural backgrounds.
In order to address this aspect of the application of new technologies, we consulted Austrian
experts from the field of machine learning/AI and professionals from various industry domains.
The participants in our survey were asked about their opinion on the 100 most common
professions in Austria, as listed in Table 1. In contrast to the focus on the susceptibility
to computerization (Frey and Osborne, 2013), we asked our experts: "Do you think that the
tasks, which are characteristic of this profession today, will be substituted, to a significant de-
gree within the next 10 years, by algorithmic technologies (such as machine learning, computer
vision and natural language processing) or mobile robotics?" (Yes=1/No=0). This question
analyses the degree to which the nature of certain professions is going to change due to techno-
logical advancement. Answers to this question do not necessarily reflect the risk of occupations
being fully substituted by technologies.
Experts were allowed to avoid answering the question in relation to as many jobs as they
wished. However, in the end, only a small minority of jobs remained unlabelled. In order to
extract an indicator of future digitalization that is unique to each profession, we calculated
three measures: the mean and mode of all expert opinions, as well as an indicator of the
experts’ consensus on each profession. The consensus is equivalent to the mode, but only for
those professions to which at least 75% of all experts attributed the same label. With this
definition of consensus, 45 professions remained and received a binary label, as shown in Table
1.
TABLE 1 ABOUT HERE
6

In the second step, the profession labels were matched with profession groups from the
Austrian and German samples of the 2015 OECD survey of the PIAAC. The PIAAC survey
supplied our analysis with individual characteristics, as well as job- and firm-level indicators.
In addition, the survey contains information about the frequency of specific tasks performed by
interviewed individuals during their average working routine. These tasks, as listed in Table 2,
include human interaction, IT usage, physical work, problem-solving, reading or understanding,
and writing or calculating. As the individuals provided answers about the frequency by which
they undertake a given task, we normalized the answers according to the value of the working
hours as follows: ’on a daily basis’ (value=1), ’less than daily, but more than once a week’
(value=1/2), ’less than once a week, but more than once a month’ (value=1/7), ’less than once
a month’ (value=1/30), or ’never’ (value=0). This labelling is likewise applied by Arntz et al.
(2016), since it reflects the differences in scale between days, weeks and months.
TABLES 2 ABOUT HERE
Thirdly, the expert opinions about the future change of professions are related with the
PIAAC data. These opinions about professions are matched via the ISCO-08 classification for
each individual’s job3. The PIAAC survey is conducted in a way that it contains a representa-
tive sample of the population. However, not all observations within the survey contain answers
to all questions. Thus, the specification of the model leads to a loss in observations due to
non-responses. There is no reason to assume that the loss in observation systematically changes
the sample. We perform a mean imputation for the non-response values, which increases the
model’s sample size by 55%, but does not lead to a significant difference in results. Compared
to the 2012 labour force survey, our sample displays a slight shift towards younger age groups.
Furthermore, the sample shows a higher share of female employees (for details, see Table 3).
Nevertheless, the impact of technological change on job profiles stays unchanged.
In order to relate the above-mentioned characteristics to the given expert opinions about
the individual’s job, we test three inferential models. The consensus indicator serves as the
dependent variable, while various combinations of personal-, job- and firm-level controls, as
well as task frequencies, are included in the model (Table 3). The correlation analysis in Table
6 across all characteristics only indicates a sizeable association between the three test score
3Only the German PIAAC sample contains the respective ISCO-08 Level 4 job classifications. Hence, thefitting of the inferential models is performed only with the labelled subset of the German employees.
7

variables. All measures are considered at the individual level with a sample of 507. The ex-
trapolated sample contains 4,438 individuals: 2,051 from Austria and 2,387 from Germany. In
a first round, we apply a logit model. This stepwise procedure is illustrated in Columns (1)-
(6) in Table 4. The Akaike information criterion indicates that Model (6), with all controls,
yields the best model fit. In the second round of the model selection, we test a linear dis-
criminant analysis (LDA) with a Bayesian estimation of the dependent variable (James et al.,
2013, Chapter 4)4, which is similar to the approach chosen by Frey and Osborne (2013). In
order to compare the logit and LDA models, we apply a cross-validation method (40% training
sample). The comparison of the in-sample predictions shows that the logit model (area under
the curve (AUC)5: 0.94) slightly outperforms the LDA model (AUC: 0.92). The estimations
of the LDA model are very similar to the results of the logit model, as summarized in Table
5. Lastly, we compare the results of the logit model with a fractional response model (Papke
and Wooldridge, 1993)6. In this model, the mean of the experts’ opinions is considered as the
dependent variable. Accordingly, the fractional model refers to a larger sample size. However,
the results in Table 4, Columns (6) and (7), show that the logit model still yields a significantly
better model fit.
TABLE 3 AND 4 ABOUT HERE
After identifying the appropriate model environment, the logit model (1) is used to predict
the digitalization probabilities, P(y=1|X), for all individuals in the sample, based on their set
of characteristics (β′X). Here, individuals with professions, which have not been judged by our
experts, also obtain a probability. The average estimated probabilities of future digitalization
are shown in Figure 2, and are aggregated for ISCO-08-Level 1 (Figure 3) and ISCO-08 Level
2 (Figure 4) professions in Austria.
P (y = 1|X) = 11+e−(β′X) , β′X = β0 + β1x1 + · · ·+ βkxk (1)
Based on the consensus of our experts, we are able to specify a degree of future digitaliza-
tion for 47 occupations. More than 75% of our experts agreed that the characteristic tasks of
4The probability of belonging to class k, given characteristics X, is described by P (Y = k|X = x) =fk(x)πkP (X=x)
,, while fk(x) describes the probability of X = x, given that Y = k, while πk is the prior probability of observingY = k.
5The AUC measures the area under the receiver operating characteristics (ROC) curve. The AUC is ameasure of prediction accuracy, since the ROC curve plots the true positive rate against the false positive rateof a prediction model.
6E(y|X) = e(β′X)
1+e(β′X)
, , while β′X = β0 + β1x1 + · · ·+ βkxk
8

these professions will change to a significant degree with the development of digital technologies
and mobile robotics. With the use of the PIAAC data set, we are able to relate the degree of
digitalization to personal characteristics and occupation-specific tasks. Based on this relation-
ship, we estimate the degree of digitalization for all professions in the data set. In contrast
to the work by Frey and Osborne (2013), we apply local experts’ opinions and perform our
estimations on the basis of individual characteristics.
3. Results
For some tasks we see a clear relationship with the consensus of our experts. In Figure
1, the frequencies of the 39 tasks are compared to the consensus of our experts. On aver-
age, some tasks, such as coding (itusage_code), are, on average, performed less than once
a month, while others, such as sharing information with others (human_share), are carried
out on an almost daily basis. For some activities, prevalence does not differ significantly be-
tween the two consensus job groups, for example, itusage_code or human_share. However,
for most of the activities, a clear separation between the consensus groups is visible. Activity
involving long physical work (physical_long) is less commonly performed in professions that
are expected to change during digitalization, according to our experts. Other activities show
the exact opposite pattern. Calculating (wricalc_calculator) or the use of computer software
Excel (itusage_excel), for example, is much more prevalent in professions that are expected to
change. This observation, confirmed by the findings of the inferential model, is a first indica-
tion that professions with a high degree of computer-based office routines are more likely to
change in light of digital technologies.
FIGURE 1 ABOUT HERE
In addition to the 39 tasks, individual-, job- and firm-specific characteristics can help ex-
plain the consensus opinions of our experts, as shown in Table 4. The final and full model
(6) indicates that, apart from work activities, education, firm sector, job responsibility and
training are related to the degree of future digitalization. Individuals with a high level of ed-
ucation, who work in a job that requires training or responsibility, are typically less likely to
be employed in an occupation that is going to change significantly. Interestingly, our results
indicate a non-linear relationship with education. Individuals with a medium level of schooling
are employed in jobs with a higher level of future digitalization than workers with high or low
9
levels of education.
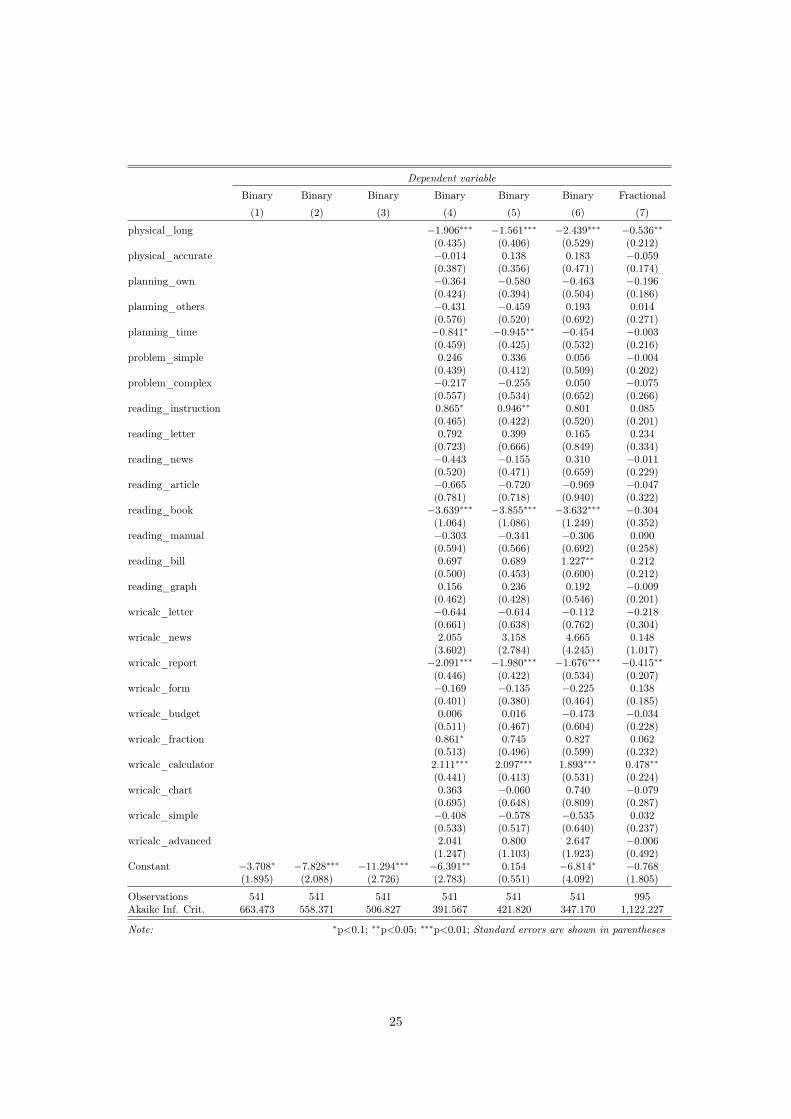
Our model indicates that certain work activities are strongly related to the degree of digi-
tal change in the workplace. Tasks such as extracting complex information by reading books
(reading_book) or writing non-routine content (wricalc_report) are related to professions with
a low degree of technological change. On the other hand, activities such as calculations
(wricalc_calculator) or extracting simple information (wricalc_news) are associated with a
stronger change in the job profile in the near future. McAfee and Brynjolfsson (2014), for
example, show that news stations have begun implementing algorithms that are able to write
simple pieces in the context of sports or weather forecasts. Moreover, for professions that
predominantly rely on physical labour, impacts of technological change are also low.
FIGURE 2 ABOUT HERE
Among occupations, there is a clear trend (Figures 3 and 4): clerical support workers,
who perform simple computer-based office routines, are highly susceptible to technological
changes. This is in line with previous findings. On the other hand, professionals, who work with
complex and unstructured information, and skilled workers in agricultural fields, who perform
physical work, are less likely to experience major changes in their job profile. Professional
occupations involving teaching and healthcare within legal, social or cultural environments
(Figure 4) exhibit particularly low probabilities of digital transformation. This finding is
consistent for individuals working in a job that requires an academic degree, as well as for
those without such a qualification. On average, most occupations show a probability of change
between 40% and 60%.
FIGURES 3 and 4 ABOUT HERE
When comparing our model findings, clear differences emerge with regard to the degree of
susceptibility in employment to digital technologies. However, our model testing suggests that
these difference are mainly driven by model selection, rather than heterogeneity among tasks
within occupations. Table 5 compares the set-ups of our research and previous studies.
TABLE 5 ABOUT HERE
Two types of model settings are prevalent. Frey and Osborne (2013) start with binary
opinions of experts and extrapolate them via a classification model for all occupations. Bowles
(2014) directly transfers these estimations to European labour markets. Both studies conclude
10

that a high share of workers (47% in the US and 54% in Austria) share a high risk of comput-
erization. Arntz et al. (2016) and Nagl et al. (2017), on the other hand, begin with discrete
probabilities and apply a fractional model in order to extrapolate. In comparison, they show
that only about 12% and 9%, respectively, have an automation risk of more than 70%. In light
of these contradictory findings, our model testing suggests that the different estimations are
mainly due to the choice of model. Binary models yield a bimodal distribution of predicted
probabilities with large high-risk groups. Fractional models lead to a bell-shaped distribution
of probabilities with relatively low levels of high-risk individuals. Our own estimations for
a fractional model (Figure 5) confirm this assumption. The ranking of occupational classes
does not change significantly after the fractional model (Figure 6) has been used. However,
predicted probabilities converge towards the mean.
FIGURES 5 AND 6 ABOUT HERE
When comparing the outcome of the binary and fractional model, the results of the latter
contain a lower number of covariates, which are statistically relevant to the degree of digitaliza-
tion. The fractional model, however, does not show any statistical significance concerning the
covariates that have not been relevant in the binary model. In the fractional model, education
and job responsibility show no statistical significance. Likewise, the tasks of speaking in front
of humans, reading books, using words, and coding are not significant in the case of the frac-
tional model environment. This general observation is not surprising from a statistical point
of view, since the formally strict binary outcome in a small sample has now been changed to
a smooth continuous scale in a sample twice the original size. However, it becomes clear that
some covariates, such as physical work, writing reports, performing calculations or firm char-
acteristics, are still aligned with the distribution of the fractional model. The distribution of
other covariates has been polarized by the truncation of the binary model. The unconditional
distributions of the binary and fractional models are shown in Figures 7 and 8.
FIGURES 7 AND 8 ABOUT HERE
Similarly, when moving the threshold of consensus from our final value towards 0.5, the
outcome of the binary model starts to slightly approach the results of the fractional model.
However, no significant changes appear, except for a deterioration in statistical significance.
11

4. Conclusion
Our model explicitly diverges from the approach taken in previous contributions to this
field. We rely on local expert opinions about near-term changes in occupations. This is a sig-
nificant conceptual improvement in contrast to prior investigations (Arntz et al., 2016; Bowles,
2014), which studies rely on the judgement of machine learning experts concerning the US
labour market, stemming from the workshop organized by Frey and Osborne (2013). However,
the authors do not allow for heterogeneity within the same profession. This limitation is ruled
out by our model approach. Past findings are, in part, contradictory. 47% of jobs in the US
(54% in Austria) share a high risk of automation, according to Frey and Osborne (2013) and
Bowles (2014), while Arntz et al. (2016) and Nagl et al. (2017) estimate this share to be 12%
and 9%, respectively, for Austria. Our findings show that these differences are mainly driven
by the selection of the model, and not so much by controlling for personal characteristics or
tasks.
Our findings show that the tasks that humans perform during their typical working day
are of significant importance when determining the impact of digital technologies on the future
workspace. Activities such as extracting complex information by reading books or writing
non-routine content reduce the impact of technologies. On the other hand, tasks such as calcu-
lations or extracting simple information will lead to a stronger change in job profiles in the next
decade. Furthermore, as the current generation of technological progress has a stronger impact
on cognitive and routine tasks than on physical labour, the extent of physical work within a
job profile reduces the effect of digital change. Although the future of work will most likely be
a complementary partnership between humans and computers, workers performing computer-
related routine activities, such as spreadsheet calculations or Internet usage, are under stronger
pressure to adapt. Our findings about the "inverse U-shaped" relationship between education
and digitalization support previous hypotheses about the skill-based polarization of the labour
market (Goos et al., 2009). This suggests further polarization in the near future.
Our results indicate that some jobs can expect to change more than others during the
current phase of digital progress. This is surely not the first time in history that this has
happened. During the Industrial Revolution, technological advancements made manufactur-
ing jobs less intensive in terms of monotonous physical labour. In contrast to the age of the
steam engine, today’s technologies, such as algorithms, unfold their potential in disciplines that
12

require routine cognitive effort. Typical computer-backed office tasks, such as in the clerical
professions, are more exposed to digital transformation than occupations marked by physical
labour. Likewise, jobs in which complex information is processed and that require a high level
of education and training are less prone to digital change in the near future. Teaching and
healthcare professionals working within in legal, social or cultural environments belong to occu-
pations with the lowest level of technological pressure. In the near future, these disciplines can
be regarded as a sustainable choice for future generations seeking job security in unsteady times.
In addition, while most research focuses on human labour that can be replaced by technol-
ogy, little attention has been given to the effect that digital technologies have on job creation.
As our findings improve the understanding of the displacement effect of technologies, more
research should be conducted in order to incorporate the effect of job creation, and in turn
appreciate the full impact of the technological change on the labour market.
13

References
Acemoğlu, D., Restrepo, P., 2017. Robots and jobs: Evidence from us labor markets.
Aghion, P., Howitt, P., 1994. Growth and unemployment. The Review of Economic Studies 61 (3), 477–494.
Arntz, M., Gregory, T., Zierahn, U., 2016. The risk of automation for jobs in oecd countries: A comparative
analysis. OECD Social, Employment, and Migration Working Papers (189).
Autor, D., 2013. The" task approach" to labor markets: an overview. Tech. rep., National Bureau of Economic
Research.
Autor, D., 2015. Why are there still so many jobs? the history and future of workplace automation. Journal of
Economic Perspectives 29 (3), 3–30.
Autor, D., Dorn, D., 2013. The growth of low-skill service jobs and the polarization of the us labor market.
American Economic Review 103 (5), 1553–97.
Autor, D., Levy, F., Murnane, R. J., 2003. The skill content of recent technological change: An empirical
exploration. The Quarterly Journal of Economics 118 (4), 1279–1333.
Beaudry, P., Green, D. A., Sand, B. M., 2016. The great reversal in the demand for skill and cognitive tasks.
Journal of Labor Economics 34 (S1), S199–S247.
Bonin, H., Gregory, T., Zierahn, U., 2015. Übertragung der studie von frey/osborne (2013) auf deutschland.
Tech. rep., ZEW Kurzexpertise.
Bowles, J., 2014. The computerisation of european jobs–who will win and who will lose from the impact of new
technology onto old areas of employment. Bruegel Blog 17.
Brandes, P., Wattenhofer, R., 2016. Opening the frey/osborne black box: Which tasks of a job are susceptible
to computerization? arXiv preprint arXiv:1604.08823.
Bresnahan, T. F., 1999. Computerisation and wage dispersion: an analytical reinterpretation. The Economic
Journal 109 (456), 390–415.
Charles, K. K., Hurst, E., Notowidigdo, M., 2013. Manufacturing decline, housing booms, and non-employment.
Dengler, K., Matthes, B., 2015. Folgen der digitalisierung für die arbeitswelt: Substituierbarkeitspotenziale von
berufen in deutschland. Tech. rep., IAB-Forschungsbericht.
Dustmann, C., Ludsteck, J., Schönberg, U., 2009. Revisiting the german wage structure. The Quarterly Journal
of Economics 124 (2), 843–881.
Ford, M., 2015. Rise of the Robots: Technology and the Threat of a Jobless Future. Basic Books.
Frey, C. B., Osborne, M., 2013. The future of employment. How susceptible are jobs to computerisation.
Goldin, C., Katz, L. F., 1998. The origins of technology-skill complementarity. The Quarterly Journal of Eco-
nomics 113 (3), 693–732.
14

Goos, M., Manning, A., Salomons, A., 2009. Job polarization in europe. American economic review 99 (2),
58–63.
Jaimovich, N., Siu, H. E., 2012. The trend is the cycle: Job polarization and jobless recoveries. Tech. rep.,
National Bureau of Economic Research.
James, G., Witten, D., Hastie, T., Tibshirani, R., 2013. An introduction to statistical learning. Vol. 112.
Springer.
McAfee, A., Brynjolfsson, E., 2014. The second machine age. WW Norton.
Michaels, G., Natraj, A., Van Reenen, J., 2014. Has ict polarized skill demand? evidence from eleven countries
over twenty-five years. Review of Economics and Statistics 96 (1), 60–77.
Nagl, W., Titelbach, G., Valkova, K., 2017. Digitalisierung der arbeit: Substituierbarkeit von berufen im zuge
der automatisierung durch industrie 4.0; endbericht.
Pajarinen, M., Rouvinen, P., et al., 2014. Computerization threatens one third of finnish employment. ETLA
Brief 22 (13.1), 2014.
Papke, L. E., Wooldridge, J., 1993. Econometric methods for fractional response variables with an application
to 401 (k) plan participation rates.
Peneder, M., Bock-Schappelwein, J., Firgo, M., Fritz, O., Streicher, G., 2016. Österreich im Wandel der Digi-
talisierung. WIFO, Österreichisches Institut für Wirtschaftsforschung.
Schumpeter, J., 1942. Creative destruction. Capitalism, socialism and democracy 825.
Spitz-Oener, A., 2006. Technical change, job tasks, and rising educational demands: Looking outside the wage
structure. Journal of labor economics 24 (2), 235–270.
15

Figure 1: Tasks at work : Of the 39 tasks, some are performed on a daily basis, while others are carried outonly once a month. Some of the activities vary significantly between jobs with a high and low degree of futuredigitalization.
Figure 2: Future digitalization: Jobs in Austria are polarized between high and low levels of future digitalization.The distribution of individual levels of future digitalization mirrors the initial estimation of our experts.
16

Figure 3: ISCO Level 1 : For the top level of occupations, clerical professions have, by far, the highest risk offuture digitalization. Professionals are at the lower end of the scale.
Figure 4: ISCO Level 2 : Professional occupations involving teaching and healthcare, within legal, social orcultural environments, exhibit particularly low probabilities of digital transformation.
17

Figure 5: Fractional model : Similar to the work by Arntz et al. (2016) and Nagl et al. (2017), the applicationof a fractional model (Papke and Wooldridge, 1993) yields a bell-shaped distribution of predicted probabilities.
Figure 6: ISCO Level 1 : The ranking of occupational classes does not change for the fractional model. However,predicted probabilities converge to the mean.
18

Figure 7: Initial binary distribution: Initially, in the logit model, slightly more individuals are labelled with aconsensus outcome of 0.
Figure 8: Initial fractional distribution: The initial distribution of the dependent variable in the fractionalmodel is slightly skewed towards the lower values.
19
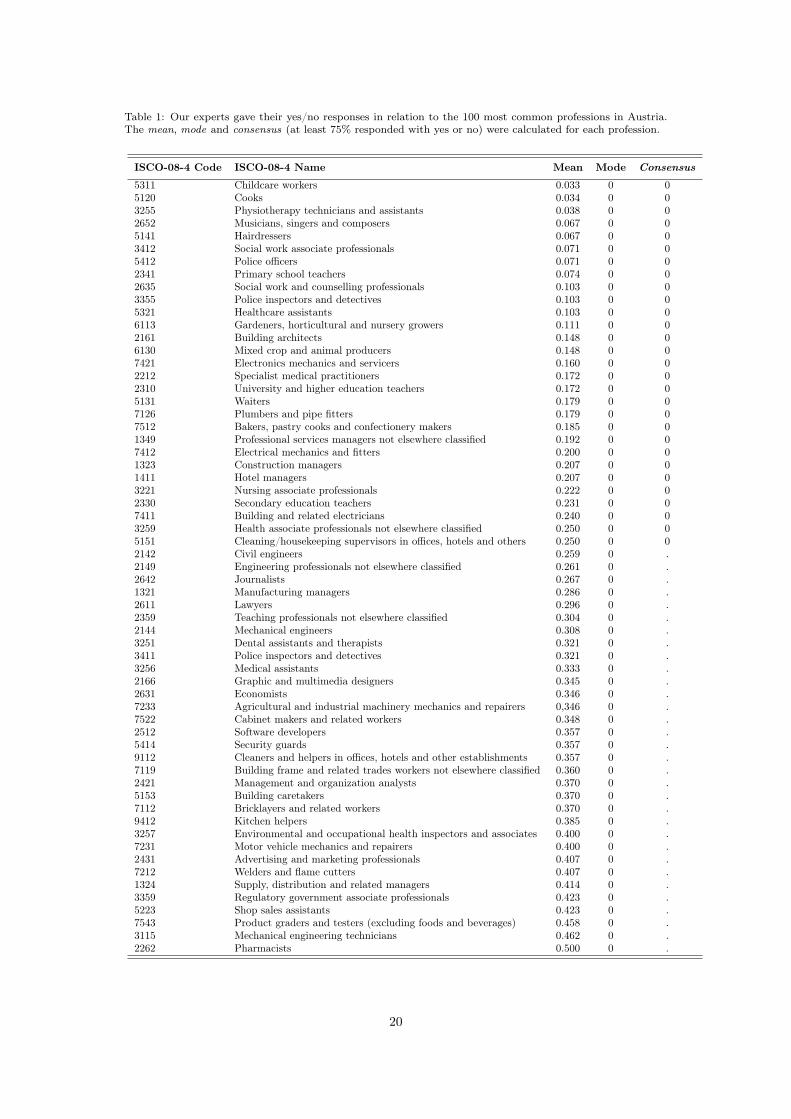
Table 1: Our experts gave their yes/no responses in relation to the 100 most common professions in Austria.The mean, mode and consensus (at least 75% responded with yes or no) were calculated for each profession.
ISCO-08-4 Code ISCO-08-4 Name Mean Mode Consensus
5311 Childcare workers 0.033 0 05120 Cooks 0.034 0 03255 Physiotherapy technicians and assistants 0.038 0 02652 Musicians, singers and composers 0.067 0 05141 Hairdressers 0.067 0 03412 Social work associate professionals 0.071 0 05412 Police officers 0.071 0 02341 Primary school teachers 0.074 0 02635 Social work and counselling professionals 0.103 0 03355 Police inspectors and detectives 0.103 0 05321 Healthcare assistants 0.103 0 06113 Gardeners, horticultural and nursery growers 0.111 0 02161 Building architects 0.148 0 06130 Mixed crop and animal producers 0.148 0 07421 Electronics mechanics and servicers 0.160 0 02212 Specialist medical practitioners 0.172 0 02310 University and higher education teachers 0.172 0 05131 Waiters 0.179 0 07126 Plumbers and pipe fitters 0.179 0 07512 Bakers, pastry cooks and confectionery makers 0.185 0 01349 Professional services managers not elsewhere classified 0.192 0 07412 Electrical mechanics and fitters 0.200 0 01323 Construction managers 0.207 0 01411 Hotel managers 0.207 0 03221 Nursing associate professionals 0.222 0 02330 Secondary education teachers 0.231 0 07411 Building and related electricians 0.240 0 03259 Health associate professionals not elsewhere classified 0.250 0 05151 Cleaning/housekeeping supervisors in offices, hotels and others 0.250 0 02142 Civil engineers 0.259 0 .2149 Engineering professionals not elsewhere classified 0.261 0 .2642 Journalists 0.267 0 .1321 Manufacturing managers 0.286 0 .2611 Lawyers 0.296 0 .2359 Teaching professionals not elsewhere classified 0.304 0 .2144 Mechanical engineers 0.308 0 .3251 Dental assistants and therapists 0.321 0 .3411 Police inspectors and detectives 0.321 0 .3256 Medical assistants 0.333 0 .2166 Graphic and multimedia designers 0.345 0 .2631 Economists 0.346 0 .7233 Agricultural and industrial machinery mechanics and repairers 0,346 0 .7522 Cabinet makers and related workers 0.348 0 .2512 Software developers 0.357 0 .5414 Security guards 0.357 0 .9112 Cleaners and helpers in offices, hotels and other establishments 0.357 0 .7119 Building frame and related trades workers not elsewhere classified 0.360 0 .2421 Management and organization analysts 0.370 0 .5153 Building caretakers 0.370 0 .7112 Bricklayers and related workers 0.370 0 .9412 Kitchen helpers 0.385 0 .3257 Environmental and occupational health inspectors and associates 0.400 0 .7231 Motor vehicle mechanics and repairers 0.400 0 .2431 Advertising and marketing professionals 0.407 0 .7212 Welders and flame cutters 0.407 0 .1324 Supply, distribution and related managers 0.414 0 .3359 Regulatory government associate professionals 0.423 0 .5223 Shop sales assistants 0.423 0 .7543 Product graders and testers (excluding foods and beverages) 0.458 0 .3115 Mechanical engineering technicians 0.462 0 .2262 Pharmacists 0.500 0 .
20

ISCO-08-4 Code ISCO-08-4 Name Mean Mode Consensus
9629 Elementary workers not elsewhere classified 0.500 0 .7214 Structural metal preparers and erectors 0.520 1 .7523 Woodworking machine tool setters and operators 0.520 1 .8219 Assemblers not elsewhere classified 0.538 1 .3353 Government social benefits officials 0.556 1 .3352 Government tax and excise officials 0.571 1 .8212 Electrical and electronic equipment assemblers 0.577 1 .9332 Drivers of animal-drawn vehicles and machinery 0.577 1 .7223 Metal working machine tool setters and operators 0.583 1 .3322 Commercial sales representatives 0.593 1 .3323 Buyers 0.593 1 .3334 Real estate agents and property managers 0.607 1 .4120 Secretaries (general) 0.607 1 .2411 Accountants 0.633 1 .7321 Pre-press technicians 0.640 1 .9329 Manufacturing labourers not elsewhere classified 0.640 1 .9333 Freight handlers 0.652 1 .8160 Food and related products machine operators 0.667 1 .9334 Shelf fillers 0.692 1 .9621 Messengers, package deliverers and luggage porters 0.692 1 .3118 Draughtspersons 0.720 1 .3313 Accounting associate professionals 0.731 1 .4110 General office clerks 0.750 1 18322 Car, taxi and van drivers 0.759 1 18131 Chemical products plant and machine operators 0.792 1 18332 Heavy truck and lorry drivers 0.793 1 18121 Metal processing plant operators 0.800 1 18122 Metal finishing, plating and coating machine operators 0.800 1 14321 Stock clerks 0.828 1 14412 Mail carriers and sorting clerks 0.862 1 13324 Trade brokers 0.867 1 14322 Production clerks 0.875 1 14312 Statistical, finance and insurance clerks 0.897 1 15230 Cashiers and ticket clerks 0.897 1 13321 Insurance representatives 0.900 1 14222 Contact centre information clerks 0.900 1 14323 Transport clerks 0.926 1 14311 Accounting and bookkeeping clerks 0.933 1 1
21

Table 2: The PIAAC survey asked employees in Austria and Germany about how frequently they undertakethe following 39 tasks at work.
Task Description Task Group PIAAC CodeSharing work-related information with co-workers Human Interaction human_shareInstructing, training or teaching people, individually or in groups Human Interaction human_trainMaking speeches or giving presentations in front of five or more people Human Interaction human_speechSelling a product or selling a service Human Interaction human_sellAdvising people Human Interaction human_advisePersuading or influencing people Human Interaction human_influenceNegotiating with people either inside or outside one’s firm or organization Human Interaction human_negotiateUsing email IT Usage itusage_emailUsing the Internet in order to better understand issues related to one’s work IT Usage itusage_internetConducting transactions over the Internet, e.g., buying or selling IT Usage itusage_buyUsing spreadsheet software, for example, Excel IT Usage itusage_excelUsing a word-processing package, for example, Word IT Usage itusage_wordUsing a programming language to program or write computer code IT Usage itusage_codeParticipating in real-time discussions over the Internet, e.g., online conferences IT Usage itusage_discussWorking physically for a long period Physical Work physical_longUsing skill or accuracy with hands or fingers Physical Work physical_accuratePlanning one’s own activities Planning planning_ownPlanning the activities of others Planning planning_othersOrganizing one’s own time Planning planning_timeSolving simple problems, which require no more than 5 min of attention Problem-solving problem_simpleSolving complex problems, which require at least 30 min of attention Problem-solving problem_complexReading directions or instructions Reading and Understanding reading_instructionReading letters, memos or emails Reading and Understanding reading_letterReading articles in newspapers, magazines or newsletters Reading and Understanding reading_newsReading articles in professional journals or scholarly publications Reading and Understanding reading_articleReading books Reading and Understanding reading_bookReading manuals or reference materials Reading and Understanding reading_manualReading bills, invoices, bank statements or other financial statements Reading and Understanding reading_billReading diagrams, maps or schematics Reading and Understanding reading_graphWriting letters, memos or emails Writing and Calculating wricalc_letterWriting articles for newspapers, magazines or newsletters Writing and Calculating wricalc_newsWriting reports Writing and Calculating wricalc_reportFilling in forms Writing and Calculating wricalc_formCalculating prices, costs or budgets Writing and Calculating wricalc_budgetUsing or calculating fractions, decimals or percentages Writing and Calculating wricalc_fractionUsing a calculator(either hand-held or computer- based) Writing and Calculating wricalc_calculatorPreparing charts, graphs or tables Writing and Calculating wricalc_chartUsing simple algebra or formulas Writing and Calculating wricalc_simpleUsing more advanced mathematics or statistics, such as calculus, Writing and Calculating wricalc_advancedcomplex algebra, trigonometry, or using of regression techniques
22

Table 3: Summary of characteristics
Name ObservationsAge Group"<16-19" 104"20-24" 195"25-29" 255"30-34" 255"35-39" 273"40-44" 309"45-49" 267"50-54" 242"55-59" 119">60" 32
GenderMale 1,002Female 1,049
Firm - Sector"Public or NGO" 668"Private" 1,383
Firm - Size"1-10" 458"11-50" 607"51-250" 480"251-1000" 326">1000" 180
Job - ResponsibilityYes 1,182No 869
Job - Experience"<1 month" 585"1 to 6 months" 282"7 to 11 months" 157"1 or 2 years" 472"3 years or more" 555
Job - Education"<ISCED 3" 252"ISCED 3-4" 1,169"ISCED 5+" 630
Min. 25% Mean 75% Max.Education"Years in Full-time Education" 4.00 13.00 14.29 16.00 20.00
SkillsProblem-solving 168.1 268.1 290.1 313.6 404.3Numeracy 160.4 269.6 294.8 321.7 409.7 2Literacy 156.8 263.6 285.8 310.5 396.2
23

Table 4: The logit model (6) with personal/firm-/job-level characteristics and tasks shows the best model fit.
Dependent variable
Binary Binary Binary Binary Binary Binary Fractional
(1) (2) (3) (4) (5) (6) (7)
PersonalAge Group 0.069∗ 0.106∗∗ 0.175∗∗∗ 0.105 0.141 0.025
(0.040) (0.046) (0.057) (0.068) (0.094) (0.037)Gender −0.021 0.466∗∗ 0.565∗∗ 0.130 0.183 0.051(Ref. male) (0.192) (0.225) (0.253) (0.337) (0.419) (0.166)Education 0.952∗∗∗ 0.723∗∗ 1.005∗∗∗ 1.411∗∗∗ 1.489∗∗∗ 0.133(Years) (0.283) (0.305) (0.355) (0.419) (0.495) (0.230)Education2 −0.050∗∗∗ −0.038∗∗∗ −0.049∗∗∗ −0.071∗∗∗ −0.070∗∗∗ −0.008
(0.011) (0.012) (0.014) (0.017) (0.020) (0.008)
FirmFirm - Sector 2.300∗∗∗ 2.170∗∗∗ 1.695∗∗∗ 0.522∗∗∗(Ref. public) (0.240) (0.263) (0.454) (0.188)Firm - Size 0.085 0.129 0.408∗∗ 0.104∗(0-4) (0.090) (0.100) (0.168) (0.061)
JobJob - Responsibility −0.200 −0.979∗∗ −0.039(Ref. no responsibility) (0.264) (0.486) (0.178)Job - Experience 0.151∗ −0.006 −0.006(0-4) (0.087) (0.151) (0.055)Job - Education −1.293∗∗∗ −1.919∗∗∗ −0.483∗∗∗(0-2) (0.230) (0.424) (0.148)Skill - Problem-solving −0.0003 −0.018∗ −0.001(Test Score) (0.006) (0.010) (0.004)Skill - Numeracy 0.021∗∗∗ 0.008 0.003(Test score) (0.007) (0.011) (0.005)Skill - Literacy −0.006 0.009 −0.003(Test score) (0.008) (0.013) (0.005)Cooperate with Humans −0.360 −0.307 −0.167(Frequency) (0.342) (0.589) (0.225)
Taskshuman_share 0.769 0.730 0.880 0.083
(0.507) (0.480) (0.619) (0.254)human_train −0.263 −0.483 0.183 −0.090
(0.550) (0.522) (0.688) (0.249)human_speech −2.445∗∗ −3.299∗∗∗ −2.562∗∗ −0.257
(1.020) (0.966) (1.188) (0.357)human_sell 0.765∗ 0.847∗∗ 0.966∗ 0.117
(0.455) (0.411) (0.550) (0.214)human_advise −0.507 −0.560 −0.622 −0.109
(0.443) (0.419) (0.519) (0.216)human_influence −1.236∗∗∗ −1.081∗∗ −0.886 −0.249
(0.474) (0.429) (0.559) (0.212)human_negotiate 0.478 0.369 0.891 0.115
(0.555) (0.494) (0.660) (0.236)itusage_email 0.870 0.808 1.134 0.255
(0.621) (0.572) (0.763) (0.284)itusage_internet 0.688 0.422 0.727 0.044
(0.515) (0.468) (0.600) (0.229)itusage_buy 0.573 1.428∗∗ 0.052 0.198
(0.632) (0.624) (0.711) (0.270)itusage_excel 0.612 0.717∗ 1.080∗ 0.224
(0.471) (0.430) (0.565) (0.226)itusage_word −0.886∗ −0.714 −1.117∗ 0.028
(0.517) (0.479) (0.641) (0.228)itusage_code −1.780∗∗ −1.282∗ −2.234∗∗ −0.251
(0.795) (0.771) (0.910) (0.423)itusage_discuss 2.559 2.909∗ 3.612∗ −0.163
(1.604) (1.654) (1.939) (0.505)
24
Dependent variable
Binary Binary Binary Binary Binary Binary Fractional
(1) (2) (3) (4) (5) (6) (7)
physical_long −1.906∗∗∗ −1.561∗∗∗ −2.439∗∗∗ −0.536∗∗(0.435) (0.406) (0.529) (0.212)
physical_accurate −0.014 0.138 0.183 −0.059(0.387) (0.356) (0.471) (0.174)
planning_own −0.364 −0.580 −0.463 −0.196(0.424) (0.394) (0.504) (0.186)
planning_others −0.431 −0.459 0.193 0.014(0.576) (0.520) (0.692) (0.271)
planning_time −0.841∗ −0.945∗∗ −0.454 −0.003(0.459) (0.425) (0.532) (0.216)
problem_simple 0.246 0.336 0.056 −0.004(0.439) (0.412) (0.509) (0.202)
problem_complex −0.217 −0.255 0.050 −0.075(0.557) (0.534) (0.652) (0.266)
reading_instruction 0.865∗ 0.946∗∗ 0.801 0.085(0.465) (0.422) (0.520) (0.201)
reading_letter 0.792 0.399 0.165 0.234(0.723) (0.666) (0.849) (0.334)
reading_news −0.443 −0.155 0.310 −0.011(0.520) (0.471) (0.659) (0.229)
reading_article −0.665 −0.720 −0.969 −0.047(0.781) (0.718) (0.940) (0.322)
reading_book −3.639∗∗∗ −3.855∗∗∗ −3.632∗∗∗ −0.304(1.064) (1.086) (1.249) (0.352)
reading_manual −0.303 −0.341 −0.306 0.090(0.594) (0.566) (0.692) (0.258)
reading_bill 0.697 0.689 1.227∗∗ 0.212(0.500) (0.453) (0.600) (0.212)
reading_graph 0.156 0.236 0.192 −0.009(0.462) (0.428) (0.546) (0.201)
wricalc_letter −0.644 −0.614 −0.112 −0.218(0.661) (0.638) (0.762) (0.304)
wricalc_news 2.055 3.158 4.665 0.148(3.602) (2.784) (4.245) (1.017)
wricalc_report −2.091∗∗∗ −1.980∗∗∗ −1.676∗∗∗ −0.415∗∗(0.446) (0.422) (0.534) (0.207)
wricalc_form −0.169 −0.135 −0.225 0.138(0.401) (0.380) (0.464) (0.185)
wricalc_budget 0.006 0.016 −0.473 −0.034(0.511) (0.467) (0.604) (0.228)
wricalc_fraction 0.861∗ 0.745 0.827 0.062(0.513) (0.496) (0.599) (0.232)
wricalc_calculator 2.111∗∗∗ 2.097∗∗∗ 1.893∗∗∗ 0.478∗∗(0.441) (0.413) (0.531) (0.224)
wricalc_chart 0.363 −0.060 0.740 −0.079(0.695) (0.648) (0.809) (0.287)
wricalc_simple −0.408 −0.578 −0.535 0.032(0.533) (0.517) (0.640) (0.237)
wricalc_advanced 2.041 0.800 2.647 −0.006(1.247) (1.103) (1.923) (0.492)
Constant −3.708∗ −7.828∗∗∗ −11.294∗∗∗ −6.391∗∗ 0.154 −6.814∗ −0.768(1.895) (2.088) (2.726) (2.783) (0.551) (4.092) (1.805)
Observations 541 541 541 541 541 541 995Akaike Inf. Crit. 663.473 558.371 506.827 391.567 421.820 347.170 1,122.227
Note: ∗p<0.1; ∗∗p<0.05; ∗∗∗p<0.01; Standard errors are shown in parentheses
25

Table 5: When comparing the outcome reported in past contributions with our findings, the choice of modelclearly dictates the resulting probabilities. Models with a binary dependent variable lead to bimodal distribu-tions with large high-risk groups. Fractional models yield a normal distribution with small high-risk shares.
Author Initial Input Model Type PredictedDistribution
High Risk Country
Frey and Osborne (2013) Binary (0/1) Classification Bimodal 47% US
Bowles (2014) transfer of Frey and Osborne (2013) Bimodal 54% ATArntz et al. (2016) Discrete (0-1) Fractional Normal 12% ATNagl et al. (2017) Discrete (0-1) Fractional Normal 9% AT
Own calculations Binary (0/1) Logit Bimodal 45% ATOwn calculations Discrete (0-1) Fractional Normal 12% ATOwn calculations Binary (0/1) LDA Bimodal 46% AT
26

Tab
le6:
The
correlationmatrixshow
sthat
thereareno
sign
ificant
correlations
across
variab
les,
except
inthecase
ofthetest
scores
forprob
lem-solving
(PS),nu
meracyan
dliteracy.
Age
Group
Gende
rEdu
cation
Edu
cation
2Firm
-Sector
Firm
-Size
Skills-PS
Skills-Num
eracy
Skills-Literacy
Job-Resp.
Job-Edu
cation
Job-Exp
erience
Age
Group
1-0.031
0.120
0.108
-0.153
0.014
-0.298
0.018
-0.110
0.167
0.242
0.244
Gender
-0.031
10.001
-0.001
-0.134
-0.169
-0.122
-0.183
-0.051
-0.220
-0.013
-0.196
Edu
cation
0.120
0.001
10.992
-0.177
0.101
0.316
0.418
0.424
0.138
0.581
0.197
Edu
cation
20.108
-0.001
0.992
1-0.185
0.104
0.312
0.414
0.421
0.135
0.576
0.194
Firm
-Se
ctor
-0.153
-0.134
-0.177
-0.185
1-0.082
0.088
0.019
-0.025
0.021
-0.198
0.126
Firm
-Size
0.014
-0.169
0.101
0.104
-0.082
10.158
0.116
0.123
0.071
0.113
0.108
Skills-PS
-0.298
-0.122
0.316
0.312
0.088
0.158
10.744
0.810
0.024
0.209
0.064
Skills-Num
eracy
0.018
-0.183
0.418
0.414
0.019
0.116
0.744
10.865
0.096
0.358
0.141
Skills-Literacy
-0.110
-0.051
0.424
0.421
-0.025
0.123
0.810
0.865
10.058
0.337
0.105
Job-Resp.
0.167
-0.220
0.138
0.135
0.021
0.071
0.024
0.096
0.058
10.161
0.302
Job-Edu
cation
0.242
-0.013
0.581
0.576
-0.198
0.113
0.209
0.358
0.337
0.161
10.300
Job-Exp
erience
0.244
-0.196
0.197
0.194
0.126
0.108
0.064
0.141
0.105
0.302
0.300
1
27