background effective health care program
TRANSCRIPT

1
Comparative Effectiveness Review Number 83
Biomarkers for Assessing and Managing Iron Deficiency Anemia in Late-Stage
Chronic Kidney Disease
Executive Summary
BackgroundChronic kidney disease (CKD) is the gradual, progressive deterioration of kidney function, and a condition that affects an estimated 26 million American adults. A common complication of CKD is anemia, which results from inadequate erythropoietin or from iron deficiency as a result of inadequate absorption or mobilization. The management of anemia in CKD patients must strike an appropriate balance between stimulating generation of erythroblasts (erythropoiesis) and maintaining sufficient iron levels for optimum hemoglobin (Hb) production.1 Erythropoietic stimulating agents (ESAs) mobilize iron stores in promoting erythropoiesis; however, decreased iron stores or iron availability are the most common reasons for resistance to the effect of ESAs. Thus, most patients who receive ESA treatment will require supplemental (oral or intravenous) iron to ensure an adequate response with erythropoietic agents. Iron management (iron status assessment and iron treatment), therefore, is an essential part of the treatment of anemia associated with CKD,1 as there remain outstanding
Effective Health Care Program
The Effective Health Care Program was initiated in 2005 to provide valid evidence about the comparative effectiveness of different medical interventions. The object is to help consumers, health care providers, and others in making informed choices among treatment alternatives. Through its Comparative Effectiveness Reviews, the program supports systematic appraisals of existing scientific evidence regarding treatments for high-priority health conditions. It also promotes and generates new scientific evidence by identifying gaps in existing scientific evidence and supporting new research. The program puts special emphasis on translating findings into a variety of useful formats for different stakeholders, including consumers.
The full report and this summary are available at www.effectivehealthcare.ahrq.gov/reports/final.cfm.
concerns regarding the adverse effects associated with elevated doses of ESAs2 and supplemental iron.3
Effective Health Care
Effective Health Care Program

2
Assessing iron status is integral to both iron and anemia managements in CKD patients. Bone marrow iron stores are often regarded as the best indicator of iron status (although this is not universally accepted);1 however, taking a bone marrow sample is invasive and involves risks of infection or bleeding at the biopsy site.4 Other classical iron status tests, of which ferritin and transferrin saturation (TSAT) are the most widely used, reflect either the level of iron in tissue stores or the adequacy of iron for erythropoiesis. Serum ferritin reflects storage iron—iron that is stored in liver, spleen, and bone marrow reticuloendothelial cells. The TSAT percentage value reflects iron that is readily available for erythropoiesis. Guidelines on monitoring iron status stipulate that hemodialysis (HD) patients receiving erythropoietin should have their iron status monitored every 3 months, and maintain a transferrin saturation (TSAT) >20 percent and a serum ferritin level >100 ng/mL (>200 ng/mL for CKD patients on HD).5,6 The National Kidney Foundation guidelines have been widely adopted in dialysis centers across the United States.
Though widely used, classical laboratory biomarkers of iron status are not without drawbacks when used in CKD patients: CKD is a pro-inflammatory state, and the biological variability of serum iron, transferrin saturation, and ferritin is known to be large in the context of underlying inflammation.7-9 In an attempt to find alternative methods to assess iron status in the setting of CKD, several novel biomarkers of iron status have been proposed:
• The hemoglobin (Hb) content of reticulocytes (CHr)/Reticulocyte hemoglobin equivalent (RetHe): CHr and RetHe measurements are functionally equivalent,10 but the two measurements are performed by different analyzers. CHr/RetHe, which examines both the precursors and mature red cells, provides an opportunity to detect and monitor acute and chronic changes in cellular hemoglobin status. CHr/RetHe measurement is a function of the amount of iron in the bone marrow that is available for incorporation into reticulocytes (immature red blood cells);11 decreased levels of CHr/RetHe indicate iron deficiency.
• The percentage of hypochromic erythrocytes (%HYPO): %HYPO is a measurement of Hb in red blood cell (RBC), which factors in the absolute Hb content as well as the size of the RBC.12 This can be used to measure functional iron deficiency. If iron supply is low in the face of ESA therapy, then there is lesser amount of Hb being incorporated into each RBC, and as a result, %HYPO levels are high.
• Erythrocyte zinc protoporphyrin (ZPP): ZPP is a measure of iron incorporation in heme. When iron levels are low, zinc is used instead of iron in the formation of heme, a protein component of Hb. As a result, ZPP levels increase, indicating iron deficiency.13
• Soluble transferrin receptor (sTfR): sTfR measures the availability of iron in the bone marrow. When the bone marrow is stimulated by erythropoiesis stimulating agents (ESAs), it results in increased expression of transferrin receptors on the surface of erythroblasts, the precursors of RBC. If iron supply is low, then levels of transferrin containing iron are low, and there is a mismatch between the numbers of transferrin receptors and the transferrin-iron complexes to bind with them. Some of the transferrin receptors that are not bound by iron-containing transferrin then get detached and can be detected in the blood. Increased concentration of sTfRs in the blood is an indicator of iron deficiency.
• Hepcidin: Hepcidin is a peptide produced by the liver that regulates both iron absorption in the intestine as well as release of iron from macrophages. Increased levels of hepcidin have indeed been associated with a decrease in available iron.14
• Superconducting QUantum Interference Device (SQUID) is a noninvasive method for the detection and quantification of liver iron content,15 because of the paramagnetic properties of iron, magnetic resonance signal diminishes in liver as iron concentration increases.
Although a number of international guidelines have examined the use of both classical and new serum iron biomarkers, their recommendations differ. Across guidelines, it is agreed that the optimal management of anemia in HD patients depends on diagnosis and management of iron deficiency. However, a number of questions remain without consensus, including: Which combination of iron biomarkers is required? Should the newer biomarkers be used as a replacement for or in addition to classical markers?
In view of the considerable clinical uncertainty, the high biological variability associated with laboratory biomarkers, and the need for frequent assessment of iron status to guide treatment for anemia, a systematic review of the relevant literature is a priority.
ObjectivesThe purpose of this review is to evaluate the impact on patient-centered outcomes of the use of newer versus

3
classical laboratory biomarkers of iron status as part of the management strategy for anemia in patients with CKD stages 3–5, that is, nondialysis or dialysis patients with CKD or kidney-transplant patients.
Key Questions and Analytic Framework (Figure A) As test results have little direct impact on patient-relevant outcomes, the utility of a medical test is usually determined by its indirect effect on outcomes, that is, through its influence on therapeutic decision making and subsequently on patient outcomes. Although studies that assess the overall impact of tests on the clinical management process would provide the most direct evidence for this CER, they are often challenging or infeasible to conduct. Because we expected to find little of such evidence, the question of overall impact (Key Question 1, see below for full descriptions of all Key Questions) was broken out into three component Key Questions (Key Questions 2 to 4). Combining evidence gathered to address these three component Key Questions can thus inform the conclusions for this review’s primary, overarching question.
Key Question 1
What is the impact on patient-centered outcomes of using newer laboratory biomarkersa as a replacement for or an add-on to the older laboratory biomarkers of iron statusb for the assessing of iron status and management of iron deficiency in stages 3–5 CKD patients (nondialysis and dialysis), and in patients with a kidney transplant?
Key Question 2
What is the test performance of newer markers of iron statusa as a replacement for or an add-on to the older markersb in stages 3–5 nondialysis and dialysis patients with CKD, and in patients with a kidney transplant?
a. What reference standards are used for the diagnosis of iron deficiency in studies evaluating test performance?
b. What are the adverse effects or harms associated with testing using newer and/or older markers of iron status?
Key Question 3
In stages 3–5 nondialysis and dialysis CKD patients with iron deficiency, what is the impact of managing iron status
based on newer laboratory biomarkers either alone or in addition to older laboratory biomarkers on intermediate outcomes (e.g., improvement in Hb levels, dose of erythropoiesis-stimulating agents, time in target Hb range), compared with managing iron status based on older laboratory biomarkers alone?
a. What are the adverse effects or harms associated with the treatments guided by tests of iron status?
Key Question 4
What factors affect the test performance and clinical utility of newer markers of iron status, either alone or in addition to older laboratory biomarkers, in stages 3–5 (nondialysis and dialysis CKD patients with iron deficiency)? For example:
• Biological variation in diagnostic indices
• Use of different diagnostic reference standards
• Type of dialysis (i.e., peritoneal or hemodialysis)
• Patient subgroups (i.e., age, sex, comorbid conditions, erythropoiesis-stimulating agent resistance, protein energy malnutrition secondary to an inflammatory state, hemoglobinopathies [e.g., thalessemia and sickle cell anemia])
• Route of iron administration (i.e., oral or intravenous)
• Treatment regimen (i.e., repletion or continuous treatment)
• Interactions between treatments (i.e., patients treated with or without erythropoiesis-stimulating agents, patients treated with or without iron-replacement therapy)
• Other factors (based on additional information in the reviewed papers).
Methods
Data Sources and Selection
We conducted literature searches of studies in MEDLINE® (from inception to May 2012) and the Cochrane Central Register of Controlled Trials (through the first quarter of 2012). Studies published in any language with adult human subjects were screened to identify articles relevant to each Key Question. We also consulted a Technical Expert Panel, and screened the reference lists of related
aContent of hemoglobin [Hb] in reticulocytes, percentage of hypochromic red blood cells, erythrocyte zinc protoporphyrin, soluble transferrin receptor, hepcidin, and superconducting quantum interference devices. bBone marrow iron stores, serum iron, transferrin saturation, iron-binding capacity, and ferritin.

4
Stag
es3-
5no
ndia
lysi
san
d di
alys
ispa
tient
sw
ith C
KD
(bot
h ad
ult
& p
edia
tric
patie
nts)
Dia
gnos
is o
fir
onde
ficie
ncy
anem
ia
Man
agem
ent
stra
tegi
es fo
r ir
onde
ficie
ncy
anem
ia
Inte
rmed
iate
outc
ome
(cha
nges
in ir
onst
atus
, Hb
orE
SA d
osin
g)
Clin
ical
and
patie
nt c
ente
red
outc
omes
(mor
talit
y,m
orbi
dity
&qu
ality
of l
ife)
Test
of i
ron
stat
us w
ithne
wer
bio
mar
kers
- Hb
cont
ent i
n re
ticul
ocyt
es- %
of h
ypoc
hrom
ic R
BC
s- E
ryth
rocy
te z
inc
prot
opor
phyr
in- S
olub
le tr
ansf
errin
rece
ptor
- Hep
cidi
nSu
perc
ondu
ctin
g qu
antu
min
terf
eren
ce d
evic
es
and/
or o
lder
biom
arke
rs- B
one
mar
row
iron
stor
es- S
erum
iron
- Tra
nsfe
rrin
satu
ratio
n- I
ron-
bind
ing
capa
city
- Fer
ritin
KQ 2b
KQ 3
KQ
2; 2
a
KQ 1
Adv
erse
eve
nts
rela
ted
to la
bte
stin
gA
dver
se e
vent
sre
late
d to
m
anag
emen
tst
rate
gies
KQ 3a
KQ 4
Influ
enci
ng fa
ctor
s:--
: Bio
logi
cal v
aria
tion,
pat
ient
subg
roup
s, ty
pe o
f dia
lysi
s, di
ffer
ent
refe
renc
e st
anda
rds
--: D
ialy
sis t
ype,
pat
ient
subg
roup
s, E
SA r
esis
tanc
e,
hem
oglo
bino
path
ies,
adm
inis
trat
ion
rout
e
Figure
A.
Analy
tic
fram
ework
CK
D=c
hron
ic k
idne
y di
seas
e; E
SA=e
ryth
ropo
iesi
s-st
imul
atin
g ag
ents
; Hb=
hem
oglo
bin
leve
l; K
Q =
Key
Que
stio
n
5
guidelines and selected narrative reviews and primary articles for additional articles. For all Key Questions, we excluded studies with fewer than 10 patients with CKD. The eligibility criteria for study populations for all Key Questions included pediatric and adult nondialysis patients with stage 3, 4, or 5 CKD; patients with CKD undergoing dialysis (HD or PD); and patients with a kidney transplant. For interventions, eligible studies were those involving the newer laboratory biomarkers (see the list in the Key Questions section above) to diagnose and manage iron deficiency either as a replacement for classical markers or in addition to classical biomarkers. For comparators, eligible studies were those involving classical laboratory biomarkers (see the list in the Key Questions section) to diagnose and manage iron deficiency.
Key Question 1 outcomes included mortality, morbidity, quality of life measured using standardized scales, or adverse effects or harms associated with testing and associated treatments. Key Questions 2 and 4 outcomes included measures of test performance comparing newer markers with classical markers of iron status. We accepted any “reference standard” used in the original studies for the analyses of sensitivity and specificity, including functional iron deficiency as defined by response or nonresponse to treatment. For Key Questions 3 and 4, the intermediate outcomes included increase in Hb or hematocrit, more consistent maintenance of Hb or hematocrit, use of ESAs for maintenance of Hb, or adverse effects or harms associated with different management strategies.
For Key Question 2, we included any study design. For Key Question 3, we included only randomized controlled trials (RCTs), as well as non-RCTs and observational studies with concurrent comparison groups. Studies could have any length of followup or any setting. Data were extracted into standard forms. We extracted bibliographic data, eligibility criteria, and enrollment years for all studies. We also extracted population characteristics such as basic demographic data—age, sex, and race or ethnic group—as well as sample size, study design, descriptions of the test and reference standard, analytic details, and outcomes.
Quality (Risk of Bias) Assessment of Individual Studies
We assessed the risk of bias (methodological quality) for each study using the Agency for Healthcare Research and Quality’s Methods Guide for Effectiveness and Comparative Effectiveness Review (from here on referred to as the Methods Guide).16 Briefly, we rated each study as
being at a high, medium, or low risk of bias on the basis of adherence (Yes, No, or Unclear/Not reported) to well-accepted standard methodologies (Quality Assessment of Diagnostic Accuracy Studies [QUADAS] tool for studies of diagnostic performance, and the Cochrane risk of bias tool for intervention studies) and assessed and reported each methodological quality item for all qualifying studies. We also considered the clarity and consistency in reporting as part of the overall judgment of risk of bias. Grading was outcome-specific, such that a given study that reported its primary outcome well but conducted an incomplete analysis of a secondary outcome would be graded as having a different quality rating for each of the two outcomes. Studies of different study designs were graded within the context of their study design; RCTs and observational studies were graded separately to be at a high, medium, or low risk of bias. Only RCTs and prospective cohort studies could be rated as being at a low risk of bias.
Data Synthesis
We summarized all included studies in narrative form as well as in summary tables that condense the important features of the study populations, design, anemia and iron status indices, laboratory tests, reference standards, background treatment, intervention, outcomes, and results. We used summary tables to succinctly report measures of the main outcomes evaluated and additional information to assist their interpretation.
The synthesis of data for Key Question 2 was complicated by the lack of generally accepted reference standard tests for determining iron deficiency in the context of CKD.1 Thus, we accepted any “reference standard” used by the authors of the included primary studies for the analyses of test performance of newer or classical laboratory biomarkers of iron status. Based on our post hoc observation of this body of literature, we separated studies into two distinct groups. Specifically, current studies used two distinct methods to operationalize a reference standard for assessing test performance: (1) a response to intravenous (IV) iron treatment, often referred to as “functional iron deficiency”; and (2) classical laboratory biomarkers, alone or in combination with each other, often referred to as “absolute iron deficiency.”
When a study used a response to IV iron treatment as the reference standard for iron deficiency, it allowed us to directly compare the test performances of classical versus newer biomarkers in predicting a response. To facilitate the interpretation of study results, the reported sensitivity and specificity of both newer and classical laboratory

6
biomarkers were visually depicted in receiver operating characteristic (ROC) space. We did not conduct meta-analyses, because there was a high degree of heterogeneity across studies in the definitions of reference standard (a response to IV iron treatment), baseline iron status of the study populations, and background treatment.
When a study used classical laboratory biomarkers (alone or in combination with each other) as the reference standard for iron deficiency, we were prevented from comparing the test performance of classical biomarkers with newer biomarkers. For the purpose of our review, this approach is analogous to assessing the concordance between classical and newer biomarkers of iron status. Since concordance cannot tell us which test is better and which is worse—both may be equally bad or equally good for defining “iron deficiency”—and cannot answer Key Question 2, these studies were only included for subquestion 2a (What reference standards are used for the diagnosis of iron deficiency in studies evaluating test performance?).
Test Performance Terms and Definitions
• Receiver operating characteristic curve: ROC curves compare sensitivity with specificity across a range of values for the ability to predict a dichotomous outcome (in this case, defined as the reference standard). The ROC curve graphically displays the trade-off between sensitivity and specificity, and is useful in assigning the best cutoffs for clinical use.
• Overall test accuracy: Overall accuracy of a test is expressed as area under the ROC curve (AUC). The AUC provides another useful parameter for comparing test performance between, for example, classical and newer laboratory biomarkers of iron status. The AUC summarizes the ROC curve in a single number but loses information about the trade-offs between sensitivity and specificity.
• Test accuracy: Test accuracy refers to sensitivity (true positive rate) and specificity (true negative rate) of a test. For any test, there is usually a trade-off between sensitivity and specificity. For example, a test may be exhibit a high sensitivity and a low specificity, or vice versa.
• Diagnostic odds ratio (DOR): The DOR is a single indicator of test performance that combines the strengths of sensitivity and specificity.17 The DOR offers advantages when logistic regression is used with diagnostic problems, because the DOR is equivalent to the regression coefficient, after exponentiation. DORs
are conditional: They depend on the other variables that have been used in the model. Consequently, the conditional DOR of each test variable, adjusted for the other variable (e.g., inflammation markers), can be estimated.
Grading the Body of Evidence
We followed the Methods Guide in evaluating the strength of the body of evidence for each Key Question with respect to four domains: risk of bias, consistency, directness, and precision.16 The body of evidence was rated on a four-level scale—high, moderate, low, and insufficient—on the basis of our degree of confidence that the evidence reflected the true effect for the major comparisons of interest. Briefly, a high level of evidence indicates a high confidence that the evidence reflects the true effect, and that further research is unlikely to change our confidence in the estimate of effect. A moderate level of evidence indicates a moderate confidence that the evidence reflects the true effect, and that further research may change our confidence in the estimate, or may change the estimate. A low level of evidence indicates a low confidence that the evidence reflects the true effect, and that further research is likely to change our confidence in the estimate of effect and to change the estimate.
The rating of the strength of the body of evidence was based on the consensus of all team investigators. We evaluated the applicability of included studies to each patient population of interest, that is, nondialysis patients with stage 3, 4, or 5 CKD, patients with CKD undergoing HD or PD, and patients with a kidney transplant. We evaluated and summarized studies of pediatric, adult, and elderly adults separately.
ResultsThe results of our literature searches are presented first, followed by the results of our syntheses in order by Key Questions. The majority of the included studies were related to test performance (Key Question 2), and they addressed many different laboratory markers and reference standard pairs. Thus, we organized studies included in Key Question 2 by types of test performance outcomes (predictive ability or test agreement).
Literature Search
Our literature search yielded 6,407 citations. From these, 694 articles were retrieved for full-text screening on the basis of abstracts and titles. Full-text articles were screened on the basis of study eligibility criteria. A total of 664 articles were rejected on double, independent full-text

7
screening because they did not meet one or more of the population, intervention, comparator, outcome (PICO) criteria for a particular Key Question. At the conclusion, a total of 30 articles were accepted, including 1 Polish- and 1 Japanese-language publication. Twenty-seven articles reported data on the test performance of newer markers of iron status compared with classical markers (Key Question 2),10,18-43 two reported intermediate outcomes comparing iron management guided by newer laboratory markers with iron management guided by classical markers (Key Question 3),42,44 and three (in two articles) reported data on factors affecting test performance comparing newer with classical laboratory markers of iron status (Key Question 4).45,46 Most studies enrolled only adult CKD patients undergoing HD. The main findings of this comparative effectiveness review are presented below.
Key Question 1. Comparative Effectiveness of Newer Versus Older Markers of Iron Status for the Diagnosis and Management of Iron Deficiency AnemiaNo study reported on patient-centered outcomes (mortality, morbidity, quality of life, and adverse effects) when using newer laboratory markers as a replacement for or an add-on to the classical laboratory markers for assessing iron status and management of iron deficiency in stages 3–5 CKD nondialysis and dialysis patients, or in patients with a kidney transplant.
Key Question 2. Test Performance of Newer Markers Compared With the Older Markers of Iron Status2a. Reference Standards for the Diagnosis of Iron Deficiency
A total of 27 studies were included for Key Question 2. Reviewed studies used two distinct methods to operationalize a reference standard for assessing test performance: (1) a response to intravenous (IV) iron treatment; and (2) classical laboratory biomarkers, alone or in combination. However, there were large variations across studies in the definitions of these reference standards.
Of the 27 included studies, 15 used classical markers of iron status to define “iron deficiency” as the reference standard in calculating the test accuracy (sensitivity and specificity) of newer markers of iron status;10,18-20,24,25,27,29-33,36,39,42 These studies used the following definitions for iron deficiency: (1) TSAT ≤ 15 percent;24 (2) TSAT ≤ 20 percent;18-20,29,33,39,42 (3) ferritin ≤100 ng/mL;20 (4) TSAT ≤20 percent and ferritin ≤100 ng/mL;25,27,29-31,39 (5) TSAT ≤20 percent or ferritin ≤100 ng/mL;27,32,36,42 (6) serum
iron < 40 µg/dL, TSAT<20 percent, ferritin <100 ng/mL, and Hb <11 g/dL;10 (7) TSAT<20 percent, ferritin 100–800 ng/mL, and Hb <11 g/dL;10 and (8) TSAT <16 percent and ferritin <12 ng/mL.30 The remaining 12 studies investigated the test performance of newer or classical markers of iron status, using a response to IV iron treatment as the reference standard for diagnosis of iron deficiency.21-23,26,28,34,35,37,38,40,41,43 (As described in Methods, these 12 studies, which used a response to IV iron treatment as the reference standard for iron deficiency, allowed us to directly compare the test performance of classical versus newer biomarkers in predicting a response. Thus, the results from these studies were synthesized to answer Key Question 2.)
However, there existed a large heterogeneity in the reference standards used in these studies as well. The most commonly used definition for a response to IV iron treatment was an increase in Hb concentration ≥1 g/dL after a (variable) period of IV iron treatment.21,22,38,40,43 Other reference standards included a ≥ 15 percent increase in Hb,37 an increase in Hct of ≥3 percent and/or a ≥ 30 percent reduction in erythropoietin (EPO) dose,23 >1 point increase in corrected reticulocyte index,28 and 5 percent increase in Hct or a decrease in EPO dose of >2,000 units per treatment.41 It should be noted that there was no uniform regimen of IV iron in terms of dosage or iron formulation across these studies. IV iron treatment duration also varied widely. The potential impact of IV iron treatment regimen on the test performance of newer or classical laboratory markers of iron status is not known.
Comparisons of test performance of newer versus classical markers of iron status to predict a response to intravenous iron treatment. Twelve studies (10 prospective cohorts, 1 retrospective cohort, and 1 cohort study of unknown directionality) investigated the test performance of newer or classical markers of iron status, using a response to IV iron treatment as the reference standard for diagnosis of iron deficiency.21-23,26,28,34,35,37,38,40,41,43 Of these, eight reported comparative data between five of the newer markers (no studies addressed SQUID) and the classical markers (although not all studies performed formal statistical testing for the comparisons). Seven of the eight enrolled adult hemodialysis (HD CKD) patients,21,22,28,34,35,37,38 and one study enrolled adult nondialysis (ND CKD) patients.40 The remaining four studies investigated the test performance of newer laboratory markers alone. Of these four, three enrolled adult HD CKD patients,23,28,43 and one enrolled adult peritoneal dialysis (PD CKD) patients.26

8
None of the reviewed studies enrolled pediatric CKD patients, and we did not include studies evaluating the test performance of classical markers alone.
Content of hemoglobin in reticulocytes (CHr)/reticulocyte hemoglobin equivalent. Eight cohort studies, enrolling 533 adult HD CKD patients,21-23,28,34,35,37,38 1 cohort study enrolling 23 PD CKD patients,26 and 1 cohort study enrolling 95 ND CKD patients40 evaluated the test performance of CHr to predict a response to IV iron treatment. Of the eight studies in HD CKD patients, six compared the test performance of CHr with that of classical markers of iron status (TSAT or ferritin, alone or in combination with each other), and two studies reported the test performance of CHr alone. Of these studies, one was rated as being at low risk of bias, four at a medium risk of bias, and three at a high risk of bias. Studies enrolled primarily older patients who received maintenance ESA treatment; however, maintenance ESA doses varied across studies. Baseline iron status (based on mean serum ferritin and TSAT concentrations) also varied across studies.
Overall, there is a low level of evidence that CHr has similar or better overall test performance compared with classical markers (TSAT or ferritin) to predict a response to IV iron treatment among HD CKD patients. Four different definitions of a response to IV iron treatment were used among these eight studies. Studies examined the sensitivities and specificities at different cutoff values of CHr, ranging from <26 to <32 pg, to predict iron deficiency, but the available data did not allow us to assess threshold effect, due to the heterogeneity in the definitions of reference standards. Additional heterogeneity, such as the variable iron status of the study populations and background treatment across studies, further limited our ability to make comparisons across studies.
Only two studies reported the sensitivities and specificities of classical markers (TSAT <20 or ferritin <100 ng/mL) to predict iron deficiency, and data suggest that CHr (with cutoff values of <27 or <28 pg) provides a better sensitivity and specificity in predicting iron deficiency than classical markers (TSAT <20 or ferritin <100 ng/mL).21,35 Only one study performed multivariate analyses to predict a response to IV iron treatment (defined as an increase in Hct of ≥3 percent and/or a ≥ 30 percent reduction in EPO dose), and reported that CHr (with cutoff of <28 pg) had much higher diagnostic odds ratio than serum ferritin (with cutoff of <300 ng/mL).23
The strength of evidence is insufficient to draw conclusions regarding the test performance of CHr compared with that of classical markers of iron status among PD or ND CKD patients. We did not identify any study that evaluated the test performance of CHr to predict a response to IV iron treatment among pediatric CKD patients.
Percent hypochromic red blood cells. Six cohort studies, enrolling a total of 365 adult HD CKD patients, evaluated the test performance of %HYPO to predict a response to IV iron treatment.21,22,28,37,38,43 One study was rated as being at a low risk of bias, two at a medium risk, and three at a high risk of bias. Studies enrolled primarily older patients who received maintenance ESA treatment; however, maintenance ESA doses varied across studies. Baseline iron status (based on mean serum ferritin and TSTA concentrations) also varied across studies.
Overall, there is a low level of evidence that %HYPO has similar or better overall test accuracy compared with classical markers (TSAT or ferritin) to predict a response to IV iron treatment among HD CKD patients. Three different definitions of a response to IV iron treatment were used among these six studies. Studies examined the sensitivities and specificities of %HYPO, with a cutoff value of either >6 percent or >10 percent, to predict iron deficiency. Data suggest that %HYPO (with cutoff values of >6 percent or >10 percent) has a better sensitivity and specificity in predicting iron deficiency than classical markers (TSAT <20 or ferritin <100 ng/mL). In addition, two studies (from the same group of investigators) performed a multivariate regression analysis and showed that %HYPO was the only significant predictor of a response to IV iron treatment among all other markers included in the model.37,38
We did not identify any study evaluated the test performance of %HYPO to predict a response to IV iron treatment among adult PD or ND CKD patients, or among pediatric CKD patients.
Soluble transferrin receptor. Two cohort studies, enrolling a total of 157 adult HD CKD patients, evaluated the test performance of sTfR to predict a response to IV iron treatment.21,37 Both studies also compared the test performance of sTfR with that of classical laboratory markers (TSAT or ferritin). One study was rated as being at a high risk of bias,37 and one at a medium risk of bias.21 The response to IV iron treatment was defined differently in the two studies, either as an increase in Hb

9
concentration ≥1g/dL after intravenous iron treatment,21 or as an increase in Hb >15 percent from baseline.37
Overall, there is a low level of evidence that sTfR has similar overall test accuracy compared with classical markers (TSAT or ferritin) to predict a response to IV iron treatment (although defined differently in the two studies) among HD CKD patients. We did not identify any study that evaluated the test performance of sTfR to predict a response to IV iron treatment among adult PD or ND CKD patients, or among pediatric CKD patients.
Erythrocyte zinc protoporphyrin. Two cohort studies, enrolling a total of 187 adult HD CKD patients, evaluated the test performance of ZPP in predicting a response to IV iron treatment.37,41 Both studies also compared the test performance of ZPP with that of classical laboratory markers (TSAT or ferritin). However, because the reference standards (Hb versus Hct/decrease in EPO dose) were not comparable, the two studies were evaluated separately. Therefore, the strength of evidence is insufficient to draw conclusions regarding the overall test performance or test accuracy of ZPP compared with that of classical laboratory markers (TSAT or ferritin).
We did not identify any study that evaluated the test performance of ZPP to predict a response to IV iron treatment among adult PD or ND CKD patients, or among pediatric CKD patients.
Hepcidin. One prospective cohort study evaluated the test performance of both isoforms of hepcidin (hepcidin-20 and hepcidin-25) to predict iron deficiency among 56 older adult HD CKD patients who were on maintenance ESA treatment. The study was rated as being at a low risk of bias. The strength of evidence is insufficient to draw conclusions regarding the test performance of hepcidin-20 or hepcidin-25 comparing with that of classical markers of iron status among adult HD CKD patients.
We identified no study evaluating the test performance of hepcidin to predict a response to IV iron treatment among adult PD or ND CKD patients, or among pediatric CKD patients.
2b. Adverse Effects or Harms Associated With Testing
Only 7 of the 27 identified studies reported information on harms.23,26,35,40-43 Specifically, three studies reported no adverse events associated with iron therapy during the study periods. A total of five deaths were reported across two studies. Studies did not attribute these deaths to either
testing or treatment. However, iron testing itself is unlikely to cause deaths, and most of the reported harms were attributed to iron therapy (if reported).
Key Question 3. Intermediate Outcomes Comparing the Iron Management Guided by the Newer Laboratory Markers With That Guided by the Older Laboratory MarkersTwo short-term RCTs (4 and 6 months), enrolling a total of 354 adult CKD patients (mean age 60 years old) undergoing HD, compared the intermediate outcomes of iron management guided by classical markers of iron status (TSAT and/or ferritin) with those of iron management guided by a newer marker of iron status (CHr). It should be noted that the two trials (one in the United States and one in Japan) employed different protocols for initiating intravenous iron therapy and anemia management, which affect the applicability of the trial findings.
The two trials showed different findings in terms of the doses of epoetin required to maintain hematocrit (Hct) targets. Specifically, the U.S. trial showed that guiding iron management via CHr resulted in similar epoetin dosing compared with iron management guided by ferritin or TSAT. In contrast, the Japanese trial found the doses of epoetin were significantly decreased (lower by 36 percent) in the group guided by TSAT, but did not change significantly in the group guided by CHr. However, it should be noted that the Hct target was higher in the U.S. trial, which may explain why the U.S. trial used much higher doses of epoetin than the Japanese trial during the trial period. Despite the differences in the protocols for initiating intravenous iron therapy, both trials reported a significant decrease in the intravenous iron doses administered to patients whose iron management was guided by CHr compared with those guided by TSAT or ferritin. Only the Japanese trial specifically monitored the adverse events associated with study medication; no differences in the hospitalization or infection rates between the two iron management groups were reported.
There is a low level of evidence for a reduction in the number of iron status tests and resulting intravenous iron treatments needed to maintain target hematocrit in patients whose iron management was guided by CHr compared with those guided by TSAT or ferritin, with similar or lower ESA use. Both RCTs reported that Hct remained in the targeted ranges (an indication for the adequacy of anemia management) throughout the study period in all randomized arms, although the Hct target was higher in the

10
U.S. trial than the Japanese trial. We identified no study comparing iron management guided by classical markers with that guided by newer markers (%HYPO, sTfR, Ret-He, ZPP, or hepcidin).
Key Question 4. Factors Affecting Test Performance and Clinical UtilityOnly a single study or indirect comparisons across studies provided data on the potential impacts of some factors (e.g., interactions between iron and ESA treatment, route of iron administration, and treatment regimen) on the test performance of newer or classical laboratory markers of iron status. Therefore, the strength of evidence is insufficient to draw conclusions regarding factors that may affect the test performance or clinical utility of laboratory markers of iron status.
Interactions Between Iron and ESA Treatment
One trial randomized 134 HD CKD patients to either no IV iron or IV iron (1 gram of ferric gluconate).45 This trial was rated as being at a medium risk of bias and enrolled a special population of HD CKD patients with high ferritin (500-1200 ng/mL) and low TSAT levels (≤ 25 percent), possibly due to functional iron deficiency. Baseline epoetin doses were raised by 25 percent in both groups, starting with the first hemodialysis session of week 1 and then maintained for the entire study until the first hemodialysis session of week 6.
Within the no-intravenous-iron group (25 percent epoetin dose increase alone), the sensitivity and specificity pairs for a TSAT cutoff of ≥19 percent and a ferritin cutoff of ≥726 ng/mL were 29 and 70 percent, and 27 and 69 percent, respectively. The sensitivity and specificity pairs for a CHr cutoff of ≥31.2 pg and a sTfR cutoff of ≥5.9 mg/L were 27 and 69 percent, and 35 and 77 percent, respectively.
In contrast, in the intravenous iron group, a cutoff of CHr of ≥31.2 pg had a higher sensitivity (64 percent) and specificity (75 percent) in predicting treatment response. However, the test accuracies were lower for sTfR, TSAT, and ferritin.
Use of Different Diagnostic Reference Standards
Included in Key Question 2a, one study examined the test performance of RetHe using two different reference standards, and showed that the test performance of RetHe was less favorable for assessing “functional iron deficiency” (TSAT<20 percent, ferritin 100-800 ng/mL, and Hb <11 g/dL) than for assessing “traditional parameters for iron deficiency” (serum iron
<40 µg/dL, TSAT<20 percent, ferritin <100 ng/mL, and Hb <11 g/dL) in HD CKD patients.10 The heterogeneity in the definitions for the reference standard (a response to IV iron treatment) may explain the differences in study findings.
Discussion
Key Findings and Strength of Evidence
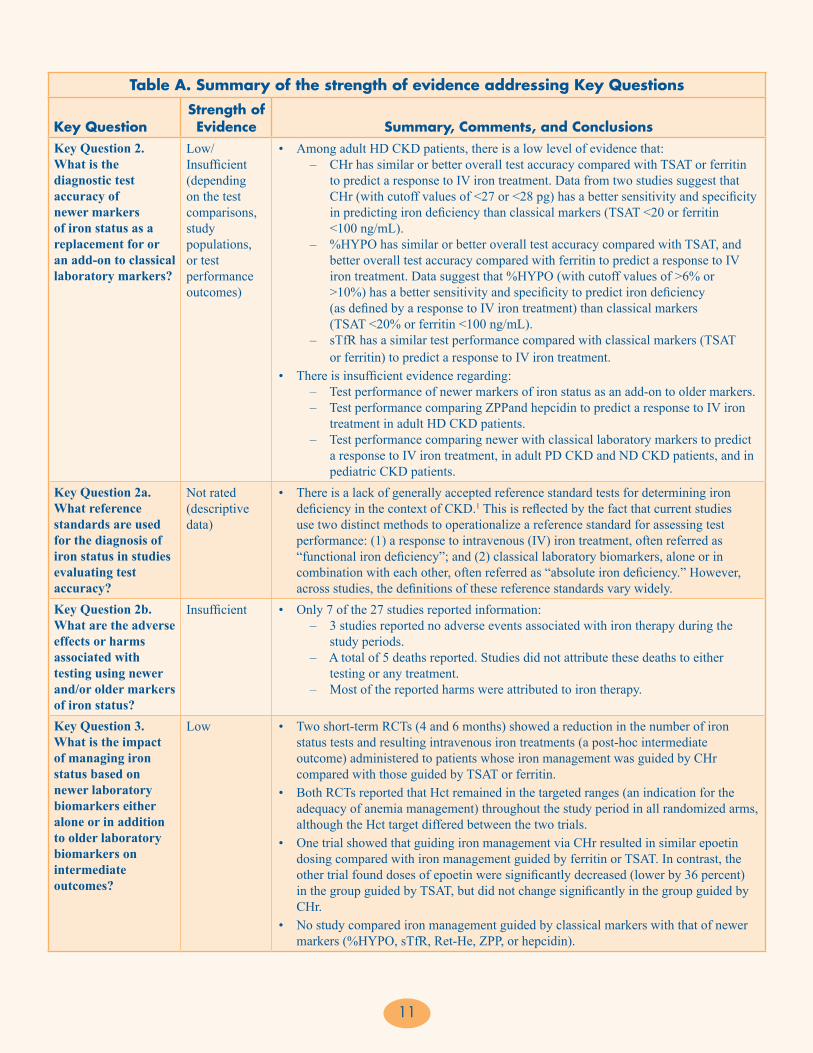
We did not identify any study that provided data directly addressing our overarching question regarding the impact on patient-centered outcomes (mortality, morbidity, quality of life, and adverse effects) of using newer laboratory biomarkers. In the absence of direct evidence, the overarching question could be answered by the component questions (Key Questions 2, 3, and 4). A number of studies addressing these component questions were identified. A summary of the strength of evidence addressing each Key Question is provided in Table A.
Findings in Relationship to What Is Already Known
Our findings are consistent with the recommendations in the Kidney Disease Outcome Quality Initiative (KDOQI) and the National Institute for Health and Clinical Excellence (NICE) guidelines for anemia management in CKD.1,6 These guidelines recommend that the initial assessment of iron deficiency anemia include ferritin to assess iron stores, and serum TSAT or CHr (KDOQI) or %HYPO (NICE) to assess adequacy of iron for erythropoiesis. We found that there is a low level of evidence that both CHr and %HYPO have a similar or better overall test accuracy compared with classical markers (TSAT or ferritin) to predict a response to IV iron treatment among HD CKD patients. Our confidence in the totality of evidence was limited by the heterogeneity and potential risk of bias in the body of literature (see “Limitation of the Evidence Base” for more details). In addition, many important questions remain unanswered, such as the test performance of newer markers of iron status as an add-on to older markers and factors that may affect the test performance or clinical utility of laboratory markers of iron status.
We identified one study showing an improvement in the test performance by using a combination of laboratory biomarkers, such as the combination of %HYPO >6 with TSAT≤20 percent, the combination of %HYPO >6 percent with CHr ≤29 pg, and the combination of %HYPO >6 with ZPP >52 µmol/mol.37 However, there are potentially a large number of test combinations to be
11
Table A. Summary of the strength of evidence addressing Key Questions
Key QuestionStrength of Evidence Summary, Comments, and Conclusions
Key Question 2. What is the diagnostic test accuracy of newer markers of iron status as a replacement for or an add-on to classical laboratory markers?
Low/Insufficient (depending on the test comparisons, study populations, or test performance outcomes)
• Among adult HD CKD patients, there is a low level of evidence that: – CHr has similar or better overall test accuracy compared with TSAT or ferritin to predict a response to IV iron treatment. Data from two studies suggest that CHr (with cutoff values of <27 or <28 pg) has a better sensitivity and specificity in predicting iron deficiency than classical markers (TSAT <20 or ferritin <100 ng/mL). – %HYPO has similar or better overall test accuracy compared with TSAT, and
better overall test accuracy compared with ferritin to predict a response to IV iron treatment. Data suggest that %HYPO (with cutoff values of >6% or >10%) has a better sensitivity and specificity to predict iron deficiency (as defined by a response to IV iron treatment) than classical markers
(TSAT <20% or ferritin <100 ng/mL). – sTfR has a similar test performance compared with classical markers (TSAT or ferritin) to predict a response to IV iron treatment.
• There is insufficient evidence regarding: – Test performance of newer markers of iron status as an add-on to older markers. – Test performance comparing ZPPand hepcidin to predict a response to IV iron treatment in adult HD CKD patients. – Test performance comparing newer with classical laboratory markers to predict a response to IV iron treatment, in adult PD CKD and ND CKD patients, and in pediatric CKD patients.
Key Question 2a. What reference standards are used for the diagnosis of iron status in studies evaluating test accuracy?
Not rated (descriptive data)
• There is a lack of generally accepted reference standard tests for determining iron deficiency in the context of CKD.1 This is reflected by the fact that current studies use two distinct methods to operationalize a reference standard for assessing test performance: (1) a response to intravenous (IV) iron treatment, often referred as “functional iron deficiency”; and (2) classical laboratory biomarkers, alone or in combination with each other, often referred as “absolute iron deficiency.” However, across studies, the definitions of these reference standards vary widely.
Key Question 2b. What are the adverse effects or harms associated with testing using newer and/or older markers of iron status?
Insufficient • Only 7 of the 27 studies reported information: – 3 studies reported no adverse events associated with iron therapy during the study periods. – A total of 5 deaths reported. Studies did not attribute these deaths to either testing or any treatment. – Most of the reported harms were attributed to iron therapy.
Key Question 3. What is the impact of managing iron status based on newer laboratory biomarkers either alone or in addition to older laboratory biomarkers on intermediate outcomes?
Low • Two short-term RCTs (4 and 6 months) showed a reduction in the number of iron status tests and resulting intravenous iron treatments (a post-hoc intermediate outcome) administered to patients whose iron management was guided by CHr compared with those guided by TSAT or ferritin.
• Both RCTs reported that Hct remained in the targeted ranges (an indication for the adequacy of anemia management) throughout the study period in all randomized arms, although the Hct target differed between the two trials.
• One trial showed that guiding iron management via CHr resulted in similar epoetin dosing compared with iron management guided by ferritin or TSAT. In contrast, the other trial found doses of epoetin were significantly decreased (lower by 36 percent) in the group guided by TSAT, but did not change significantly in the group guided by CHr.
• No study compared iron management guided by classical markers with that of newer markers (%HYPO, sTfR, Ret-He, ZPP, or hepcidin).

12
evaluated, and without a widely accepted reference standard for the diagnosis of iron deficiency in the context of CKD, new studies are unlikely to significantly contribute to what is already known or change existing clinical practice.
Applicability and Implications for Clinical and Policy Decisionmaking
We assessed the applicability of the included studies by organizing them according to each patient population of interest, that is, nondialysis patients with stage 3, 4, or 5 CKD, patients with CKD undergoing HD or PD, or patients with a kidney transplant. A majority of this review’s findings are applicable to only adult HD CKD
patients. Whether test performance and clinical utility of newer or classical markers of iron status vary by different CKD populations are not known.
We identified two RCTs that compared intermediate outcomes of iron management guided by CHr with those of iron management guided by classical markers of iron status (TSAT and/or ferritin).42,44 These two trials (one conducted in the United States and one in Japan) employed different protocols for initiating IV iron therapy and anemia management. These differences may reflect differences in the healthcare systems of their respective countries, and should be considered as part of clinical decisionmaking.
Table A. Summary of the strength of evidence addressing Key Questions (continued)
Key QuestionStrength of Evidence Summary, Comments, and Conclusions
Key Question 3a. What are the adverse effects or harms associated with the treatments guided by tests of iron status?
Insufficient • Only 1 RCT explicitly monitored the adverse events: – There were a total of three deaths (2 patients in the CHr group; 1 patient in the TSAT group) due to bacterial pneumonia (at week 4 in the CHr group), sudden death by unknown cause (at week 16 in the CHr group), and liver tumor (at week 7 in the TSAT group). – One patient in the TSAT group dropped out because of massive bleeding due to a femoral bone fracture and need for blood transfusion. – There were no significant differences in the hospitalization or infection rates of the two iron management groups.
Key Question 4. What factors affect the test performance and clinical utility of newer markers of iron status?
Insufficient • Only single study or indirect comparisons across studies provided data on the potential impacts of some factors on the test performance of newer or classical laboratory markers of iron status: – One RCT found an interaction between iron and ESA treatment on test accuracy of CHr. A higher baseline CHr predicted greater likelihood of a response to anemia and iron treatment only in the IV iron (plus epoetin) treatment group, but not in the no IV iron (epoetin only) treatment group. – One study showed that the test accuracy of RetHe was lower for assessing “functional iron deficiency” (TSAT<20%, ferritin 100-800 ng/mL, and Hb <11 g/dL) than for assessing “traditional parameters for iron deficiency” (serum iron < 40 µg/dL, TSAT<20%, ferritin <100 ng/mL, and Hb <11 g/dL) in HD CKD patients. – Indirect comparisons across studies suggested potential impacts of route of iron administration and treatment regimen on the test accuracy of newer and classical laboratory markers of iron status.
• No study performed analyses by patient subgroups.• No study examined the impacts of biological variation or type of dialysis in diagnostic
indices on the test performance or clinical utility of laboratory markers of iron status.
%HYPO = percent hypochromic red blood cells; CHr = content of hemoglobin in reticulocytes; CKD = chronic kidney disease; ESA = erythropoiesis-stimulating agents; Hb = hemoglobin; HD = hemodialysis; IV = intravenous; ND = nondialysis; PD = peritoneal dialysis; RCT = randomized controlled trial; sTfR = soluble transferring receptor; RetHe = reticulocyte hemoglobin equivalent; TSAT = transferrin saturation; ZPP = erythrocyte zinc protoporphyrin

13
Limitations of the Evidence Base
The available data are very limited due to a high degree of heterogeneity. There exist many definitions of a response to IV iron treatment as the reference standard for iron deficiency. Moreover, there is a lack of a uniform regimen for intravenous iron treatment across studies in terms of dosage, iron formulation, treatment frequency, and followup duration for the iron challenge test (to define a response).
In addition to heterogeneity of the evidence base, many studies included in our review were rated as being at a high risk of bias, limiting their utility in informing clinical practice.
Research Gaps
The most directly applicable study designs for clinical decisionmaking would be studies that compare two or more iron and anemia management strategies, follow the patients through decisions and treatments, and then report on patient outcomes. However, it is unlikely
such studies can be conducted, due to the large number of patients and resource requirements. Typically, the assessment of diagnostic tests follows the Fryback approach,47 progressing from the establishment of technical and clinical validity, to the assessment of test impact on clinicians’ diagnostic thinking and therapeutic decisionmaking, as well as clinical outcomes. Finally, a global assessment of the test from a societal perspective can be performed. Thus, we suggest that future research address the gaps that we identified for each of the component questions in this review. We also identified several cross-cutting methodological issues that affect all of the Key Questions and should be addressed. Ultimately, when a reference standard of iron deficiency is finally established, and test performance data are sufficient and reliable, decision analysis could be used to assess how employing combinations of different markers to guide iron management strategies might influence clinical outcomes.
A summary of the research gaps we identified, as well as our suggestions for future research, are provided in Table B.
Table B. Research gaps and suggestions for future research
Key Question Research Gaps Suggestions for Future ResearchKey Question 2. What is the diagnostic test accuracy of newer markers of iron status as a replacement for or an add-on to classical laboratory markers?
Insufficient evidence for the test performance of newer markers of iron status as an add-on to older markers
• It is important to use an independent reference standard when assessing the test performance. See “Cross-cutting issues” for the research gaps for establishing a reference standard for iron deficiency.
Many existing studies are at a high risk of bias, limiting their utility in informing clinical practice
• General principles for the design of studies of diagnostic tests include the use of an appropriate reference standard, adequate description of the index and reference tests, blinded interpretation of test results, and independence of the index and reference standard tests.48
• Studies assessing diagnostic accuracy should instead aim to enroll patients representative of the spectrum of disease typically seen in clinical practice.
• Future studies should provide details about the study base and sampling methods.
Key Question 3. What is the impact of managing iron status based on newer laboratory biomarkers either alone or in addition to older laboratory biomarkers on intermediate outcomes?
There is no uniform iron management algorithms across studies
• Future observational studies should assess the outcomes of different iron management algorithms or test-and-treat protocols, considering differences in CKD populations, clinical settings, and potential harms or burden to the patients.
• Assessing impact of the most promising iron management algorithms on both intermediate and patient outcomes through prospective observational studies or RCTs.

14
Table B. Research gaps and suggestions for future research (continued)
Key Question Research Gaps Suggestions for Future ResearchKey Question 4. What factors affect the test performance and clinical utility of newer markers of iron status?
Insufficient evidence to draw conclusions regarding factors that may affect the test performance or clinical utility of laboratory markers of iron status
• Future studies are need to evaluated the following factors, suggested by the experts: – Biological variation in diagnostic indices – Use of different diagnostic reference standards – Type of dialysis (i.e., peritoneal or hemodialysis) – Patient subgroups (i.e., age, sex, comorbid conditions, erythropoiesis-stimulating agent resistance, protein energy malnutrition secondary to an inflammatory state, hemoglobinopathies [e.g., thalessemia and sickle cell anemia]) – Route of iron administration (i.e., oral or intravenous) – Treatment regimen (i.e., repletion or continuous treatment) – Interactions between treatments (i.e., patients treated with versus without ESA, patients treated with vs. without iron-replacement therapy)
Whether test performance and clinical utility of newer or classical markers of iron status vary by different CKD populations are not known
• Almost all existing studies enrolled only single CKD population (ND, HD, or PD CKD patients). Future studies should include wider CKD populations, and plan for subgroup analyses.
• Power calculations should be performed to take into account for the planed subgroup analyses.
Cross-cutting issues (for Key Questions 2, 3, and 4)
There is no reference standard for determining iron deficiency in CKD patients
• A response to IV iron treatment is considered by many clinicians as the reference method for diagnosing iron deficiency but future research is needed to establish a standardized definition for appropriate CKD populations, and a standardized testing protocol specifying the regimen of IV iron challenge in terms of dosage and iron formulation and proper duration of iron challenge testing.
Existing studies were underpowered leading to imprecise estimates
• Future studies should be larger, ideally designed based on power calculations, to be able to reliably detect plausible effect sizes and provide precise estimates of diagnostic accuracy.49
There is no decision analysis to assess how using combinations of different markers to guide iron management strategies might influence clinical outcomes
• Patient outcomes of interest are: – Mortality – Morbidity (e.g., cardiac or liver toxicity and infection) – Quality of life, measured using standardized scales, including: Kidney Disease Quality of Life (KDQOL), Health Related Quality of Life (HRQOL), Medical Outcomes Study Short Form-36 (SF-36), and Pediatric Quality of Life Inventory (PQLI) – Adverse effects or harms associated with testing and associated treatments (e.g., test-related anxiety, adverse events secondary to venipuncture, effects of iron overload with iron treatments, and cardiovascular complications from use of erythropoietin at higher Hb levels)
• For studies assessing clinical outcomes, blinding to test results to the outcome assessors is essential to avoid bias.48,50
CKD = chronic kidney disease; HD = hemodialysis; IV = intravenous

15
ConclusionsCombining the evidence addressing Key Questions 2, 3, and 4, we can conclude that all currently available laboratory biomarkers of iron status (either newer or classical markers) do not demonstrate an ideal predictive ability when they were used singly to determine iron deficiency as defined by a response to iron challenge test. Furthermore, there is insufficient evidence to determine the test performance of the combinations of newer biomarkers, or combinations of newer and classical biomarkers, for diagnosing iron deficiency. However, it may be that CHr and %HYPO have better predictive ability for a response to IV iron treatment than classical markers (TSAT <20% or ferritin <100 ng/mL) in HD CKD patients. In addition, results from two RCTs showed a reduction in the number of iron status tests and resulting IV iron treatments administered to patients whose iron management was guided by CHr compared with those guided by TSAT or ferritin. These results suggest that CHr may reduce potential harms from IV iron treatment by lowering the frequency of iron testing, although the evidence for the potential harms associated with testing or test-associated treatment is insufficient.
Nevertheless, the strength of evidence supporting these conclusions is low and there remains considerable clinical uncertainty regarding the use of newer markers in the assessment of iron status and management of iron deficiency in stages 3–5 CKD patients (both nondialysis and dialysis). In addition, factors that may affect the test performance and clinical utility of newer laboratory markers of iron status remain largely unexamined.
References1. Anaemia Management in Chronic Kidney Disease—Rapid Update
2011. National Clinical Guideline Centre; 2011.
2. Eckardt KU. Chronic kidney disease: Are elevated doses of ESAs associated with adverse outcomes? Nat Rev Nephrol. 2010 Oct;6(10):566-68.
3. Hayat A. Safety issues with intravenous iron products in the management of anemia in chronic kidney disease. Clin Med Res. 2008 Dec;6(3-4):93-102.
4. Bain BJ. Bone marrow biopsy morbidity: review of 2003. J Clin Pathol. 2005 Apr;58(4):406-08.
5. IV. NKF-K/DOQI Clinical Practice Guidelines for Anemia of Chronic Kidney Disease: update 2000. Am J Kidney Dis. 2001 Jan;37(1 Suppl 1):S182-S238.
6. KDOQI Clinical Practice Guidelines and Clinical Practice Recommendations for Anemia in Chronic Kidney Disease. 2006.
7. Winkel P, Statland BE, Bokelund H. Factors contributing to intra-individual variation of serum constituents: 5. Short-term day-to-day and within-hour variation of serum constituents in healthy subjects. Clin Chem. 1974 Dec;20(12):1520-27.
8. Winkel P, Statland BE, Bokelund H. The effects of time of venipuncture on variation of serum constituents. Consideration of within-day and day-to-day changes in a group of healthy young men. Am J Clin Pathol. 1975 Oct;64(4):433-47.
9. Wish JB. Assessing iron status: beyond serum ferritin and transferrin saturation. Clin J Am Soc Nephrol. 2006 Sep;1 Suppl 1:S4-S8.
10. Brugnara C, Schiller B, Moran J. Reticulocyte hemoglobin equivalent (Ret He) and assessment of iron-deficient states. Clin Lab Haematology. 2006 Oct;28(5):303-08.
11. Braun J, Lindner K, Schreiber M, et al. Percentage of hypochromic red blood cells as predictor of erythropoietic and iron response after I.V. iron supplementation in maintenance haemodialysis patients. Nephrol Dial Transplant. 1997 Jun;12(6):1173-81.
12. Macdougall IC, Cavill I, Hulme B, et al. Detection of functional iron deficiency during erythropoietin treatment: a new approach. Br Med J. 1992 Jan 25;304(6821):225-26.
13. Braun J. Erythrocyte zinc protoporphyrin. Kidney Int Suppl. 1999 Mar;69:S57-S60.
14. Babitt JL, Lin HY. Molecular mechanisms of hepcidin regulation: implications for the anemia of CKD. Am J Kidney Dis. 2010 Apr;55(4):726-41.
15. Gandon Y, Olivie D, Guyader D, et al. Non-invasive assessment of hepatic iron stores by MRI. Lancet. 2004 Jan 31;363(9406):357-62.
16. Agency for Healthcare Research and Quality. Methods Reference Guide for Effectiveness and Comparative Effectiveness Reviews, Version 1.0. 2010.
17. Glas AS, Lijmer JG, Prins MH, et al. The diagnostic odds ratio: a single indicator of test performance. J Clin Epidemiol. 2003 Nov;56(11):1129-35.
18. Baldus M, Walter H, Thies K, et al. Transferrin receptor assay and zinc protoporphyrin as markers of iron-deficient erythropoiesis in end-stage renal disease patients. Clin Nephrol. 1998 Mar;49(3):186-92.
19. Bhandari S, Norfolk D, Brownjohn A, et al. Evaluation of RBC ferritin and reticulocyte measurements in monitoring response to intravenous iron therapy. Am J Kidney Dis. 1997 Dec;30(6):814-21.
20. Bhandari S, Turney JH, Brownjohn AM, et al. Reticulocyte indices in patients with end stage renal disease on hemodialysis. J Nephrol. 1998 Mar;11(2):78-82.

16
21. Bovy C, Gothot A, Delanaye P, et al. Mature erythrocyte parameters as new markers of functional iron deficiency in haemodialysis: sensitivity and specificity. Nephrol Dial Transplant. 2007 Apr;22(4):1156-62.
22. Buttarello M, Pajola R, Novello E, et al. Diagnosis of iron deficiency in patients undergoing hemodialysis. Am J Clin Pathol. 2010 Jun;133(6):949-54.
23. Chuang CL, Liu RS, Wei YH, et al. Early prediction of response to intravenous iron supplementation by reticulocyte haemoglobin content and high-fluorescence reticulocyte count in haemodialysis patients. Nephrol Dial Transplant. 2003 Feb;18(2):370-77.
24. Cullen P, Soffker J, Hopfl M, et al. Hypochromic red cells and reticulocyte haemglobin content as markers of iron-deficient erythropoiesis in patients undergoing chronic haemodialysis. Nephrol Dial Transplant. 1999 Mar;14(3):659-65.
25. Daschner M, Mehls O, Schaefer F. Soluble transferrin receptor is correlated with erythropoietin sensitivity in dialysis patients. Clin Nephrol. 1999 Oct;52(4):246-52.
26. Domrongkitchaiporn S, Jirakranont B, Atamasrikul K, et al. Indices of iron status in continuous ambulatory peritoneal dialysis patients. Am J Kidney Dis. 1999 Jul;34(1):29-35.
27. Eguchi A, Tsuchiya K, Tsukada M, et al. [Clinical usefulness of reticulocyte hemoglobin equivalent (RET-He) in patients at the pre-dialysis stage and in patients on peritoneal dialysis]. [Japanese]. Nippon Jinzo Gakkai Shi. 2010;Japanese(2):132-40.
28. Fishbane S, Galgano C, Langley RC, Jr., et al. Reticulocyte hemoglobin content in the evaluation of iron status of hemodialysis patients. Kidney Int. 1997 Jul;52(1):217-22.
29. Fusaro M, Munaretto G, Spinello M, et al. Soluble transferrin receptors and reticulocyte hemoglobin concentration in the assessment of iron deficiency in hemodialysis patients. J Nephrol. 2005 Jan;18(1):72-79.
30. Gupta M, Kannan M, Gupta S, et al. Contribution of iron deficiency to anemia in chronic renal failure. Indian J Pathol Microbiol. 2003 Oct;46(4):563-64.
31. Hukic F, Nuhbegovic S, Brkic S, et al. Biochemical markers of iron status in hemodialysis patients. Medicinski Arhiv. 2010;64(4):219-22.
32. Kim JM, Ihm CH, Kim HJ. Evaluation of reticulocyte haemoglobin content as marker of iron deficiency and predictor of response to intravenous iron in haemodialysis patients. Int J Lab Hematol. 2008 Feb;30(1):46-52.
33. Matuszkiewicz-Rowinska J, Ostrowski G, Niemczyk S, et al. [Red cell zinc protoporphyrin and its ratio to serum ferritin (ZPP/logSF index) in the detection of iron deficiency in patients with end-stage renal failure on hemodialysis]. [Polish]. Polskie Archiwum Medycyny Wewnetrznej. 2003 Jul;110(1):703-10.
34. Mitsuiki K, Harada A, Miyata Y. Assessment of iron deficiency in chronic hemodialysis patients: investigation of cutoff values for reticulocyte hemoglobin content. Clin Exp Nephrol. 2003 Mar;7(1):52-57.
35. Mittman N, Sreedhara R, Mushnick R, et al. Reticulocyte hemoglobin content predicts functional iron deficiency in hemodialysis patients receiving rHuEPO. Am J Kidney Dis. 1997 Dec;30(6):912-22.
36. Miwa N, Akiba T, Kimata N, et al. Usefulness of measuring reticulocyte hemoglobin equivalent in the management of haemodialysis patients with iron deficiency. Int J Lab Hematol. 2010 Apr;32(2):248-55.
37. Tessitore N, Solero GP, Lippi G, et al. The role of iron status markers in predicting response to intravenous iron in haemodialysis patients on maintenance erythropoietin. Nephrol Dial Transplant. 2001 Jul;16(7):1416-23.
38. Tessitore N, Girelli D, Campostrini N, et al. Hepcidin is not useful as a biomarker for iron needs in haemodialysis patients on maintenance erythropoiesis-stimulating agents. Nephrol Dial Transplant. 2010 Dec;25(12):3996-4002.
39. Tsuchiya K, Okano H, Teramura M, et al. Content of reticulocyte hemoglobin is a reliable tool for determining iron deficiency in dialysis patients. Clin Nephrol. 2003 Feb;59(2):115-23.
40. Van Wyck DB, Roppolo M, Martinez CO, et al. A randomized, controlled trial comparing IV iron sucrose to oral iron in anemic patients with nondialysis-dependent CKD. Kidney Int. 2005 Dec;68(6):2846-56.
41. Fishbane S, Lynn RI. The utility of zinc protoporphyrin for predicting the need for intravenous iron therapy in hemodialysis patients. Am J Kidney Dis. 1995 Mar;25(3):426-32.
42. Kaneko Y, Miyazaki S, Hirasawa Y, et al. Transferrin saturation versus reticulocyte hemoglobin content for iron deficiency in Japanese hemodialysis patients. Kidney Int. 2003 Mar;63(3):1086-93.
43. Silva J, Andrade S, Ventura H, et al. Iron supplementation in haemodialysis—practical clinical guidelines. Nephrol Dial Transplant. 1998 Oct;13(10):2572-77.
44. Fishbane S, Shapiro W, Dutka P, et al. A randomized trial of iron deficiency testing strategies in hemodialysis patients. Kidney Int. 2001 Dec;60(6):2406-11.
45. Singh AK, Coyne DW, Shapiro W, et al. Predictors of the response to treatment in anemic hemodialysis patients with high serum ferritin and low transferrin saturation. Kidney Int. 2007 Jun;71(11):1163-71.
46. Ahluwalia N, Skikne BS, Savin V, et al. Markers of masked iron deficiency and effectiveness of EPO therapy in chronic renal failure. Am J Kidney Dis. 1997 Oct;30(4):532-41.
47. Fryback DG, Thornbury JR. The efficacy of diagnostic imaging. Med Decis Making. 1991 Apr;11(2):88-94.
48. Bossuyt PM, Reitsma JB, Bruns DE, et al. Towards complete and accurate reporting of studies of diagnostic accuracy: The STARD Initiative. Ann Intern Med. 2003 Jan 7;138(1):40-44.
49. Rothman K, Greenland S. Modern Epidemiology. Lippincott Williams and Wilkins; 1998.
50. Whiting P, Rutjes A, Reitsma J, et al. The development of QUADAS: a tool for the quality assessment of studies of diagnostic accuracy included in systematic reviews. BMC Med Res Methodol. 2003;3(1):25. PMID: 10.1186/1471-2288-3-25.

17
Full ReportThis executive summary is part of the following document: Chung M, Moorthy D, Hadar N, Salvi P, Iovin RC, Lau J. Biomarkers for Assessing and Managing Iron Deficiency Anemia in Late-Stage Chronic Kidney Disease. Comparative Effectiveness Review No. 83. (Prepared by the Tufts Evidence-based Practice Center under Contract No. 290-2007-10055-I.) AHRQ Publication No. 12(13)-EHC140-EF. Rockville, MD: Agency for Healthcare Research and Quality. October 2012. www.effectivehealthcare.ahrq.gov/reports/final.cfm.
For More CopiesFor more copies of Biomarkers for Assessing and Managing Iron Deficiency Anemia in Late-Stage Chronic Kidney Disease: Comparative Effectiveness Review Executive Summary No. 83 (AHRQ Pub. No. 12(13)-EHC140-1), please call the AHRQ Publications Clearinghouse at 1-800-358-9295 or email [email protected].


19

AHRQ Pub. No. 12(13)-EHC140-1October 2012