background paper 1: about indigenous australian students · students with results in the band...
TRANSCRIPT
ABOUT INDIGENOUS AUSTRALIAN STUDENTS 1
Background paper 1 About Indigenous Australian students
Key points • This background paper provides some information about Indigenous Australian primary
school students based on de-identified data provided to the Commission by the Australian Curriculum, Assessment and Reporting Authority (ACARA).
– The data include test results from the National Assessment Program — Literacy and Numeracy (NAPLAN). The data cover all students across Australia in Years 3 and 5 in 2013 and 2014. For brevity, this paper focuses only on students in Year 5 in 2014 and mainly discusses the results of the NAPLAN reading test.
• The paper describes how student scores vary with a range of student demographics and school characteristics. These descriptions should not be used to attribute causation.
• There were 14 620 Indigenous students in Year 5 in 2014, representing five per cent of all Year 5 students nationally.
• Indigenous students make up a large proportion of all students at schools in remote and very remote regions, particularly in the Northern Territory.
• But this is not where most Indigenous students go to school — eighty per cent of all Indigenous students attend schools in metropolitan and provincial regions. More than half attend schools in the metropolitan and provincial regions of New South Wales and Queensland.
• Regardless of location, Indigenous students tend to perform less well on NAPLAN tests than non-Indigenous students.
– Indigenous students are both underrepresented among high-achieving students and overrepresented among underachieving students.
• Indigenous students tend to have parents with less formal education, who work in less-skilled occupations or who are not part of the paid workforce.
– Students with parents who have less formal education or who work in less-skilled occupations tend to have lower NAPLAN test scores.
• Indigenous students attend schools that tend to have lower student attendance rates.
– Students at schools with lower student attendance rates tend to have lower test scores.
• Half of all Indigenous students go to schools where Indigenous students make up less than 15 per cent of the total student enrolment. A considerable minority of Indigenous students (11 per cent) go to schools where Indigenous students make up more than 95 per cent of the total student enrolment.
• Across all remoteness categories, Indigenous students tend to perform better at schools where Indigenous students make up a small proportion of the total student enrolment.
2 INDIGENOUS PRIMARY SCHOOL ACHIEVEMENT
1 Introduction
This background paper presents some information about Indigenous Australian primary school students to provide context for the analysis in the body of the report.1 It describes the demographic background of Indigenous students, some characteristics of the schools they attend and the results they obtained in the National Assessment Program — Literacy and Numeracy (NAPLAN) (box 1). For perspective, information is presented for both Indigenous and non-Indigenous students.
The paper is based on a de-identified dataset provided to the Commission by the Australian Curriculum, Assessment and Reporting Authority (ACARA). This dataset was provided on an ‘as is’ basis and ACARA takes no responsibility for its accuracy, quality or fitness for purpose. All analysis contained herein was undertaken by the Commission and has not been validated by ACARA.
The dataset includes all students who were in Year 3 or Year 5 in 2013 and 2014, including those who did not sit NAPLAN tests. For brevity, the analysis is restricted to students who were in Year 5 in 2014 and mainly refers to results from the reading test. The Commission’s unpublished analysis suggests the broad conclusions in this paper also hold across tests, year levels (Year 3 and Year 5) and years (2013 and 2014).
1 Throughout this paper, references to ‘schools’ refer to primary schools and references to ‘students’ refer
to primary school students.
ABOUT INDIGENOUS AUSTRALIAN STUDENTS 3
Box 1 About NAPLAN The National Assessment Program — Literacy and Numeracy (NAPLAN) is an annual assessment of the literacy and numeracy skills of students in Years 3, 5, 7 and 9. NAPLAN assessments take place over three days in the second full week of May and cover four domains: reading, writing, language conventions (spelling and grammar and punctuation) and numeracy.
The Australian Curriculum, Assessment and Reporting Authority has responsibility for the development and central management of NAPLAN. In each state and territory, a Test Administration Authority (usually the Department of Education or a related body) is responsible for the administration of the tests. All states and territories administer the tests according to nationally agreed protocols.
NAPLAN results are scaled so that student scores across year levels and across test years can be presented on the same assessment scale. Five assessment scales are used — one each for reading, writing, spelling, grammar and punctuation, and numeracy. Students from all year levels participating in NAPLAN are represented on these same five scales.
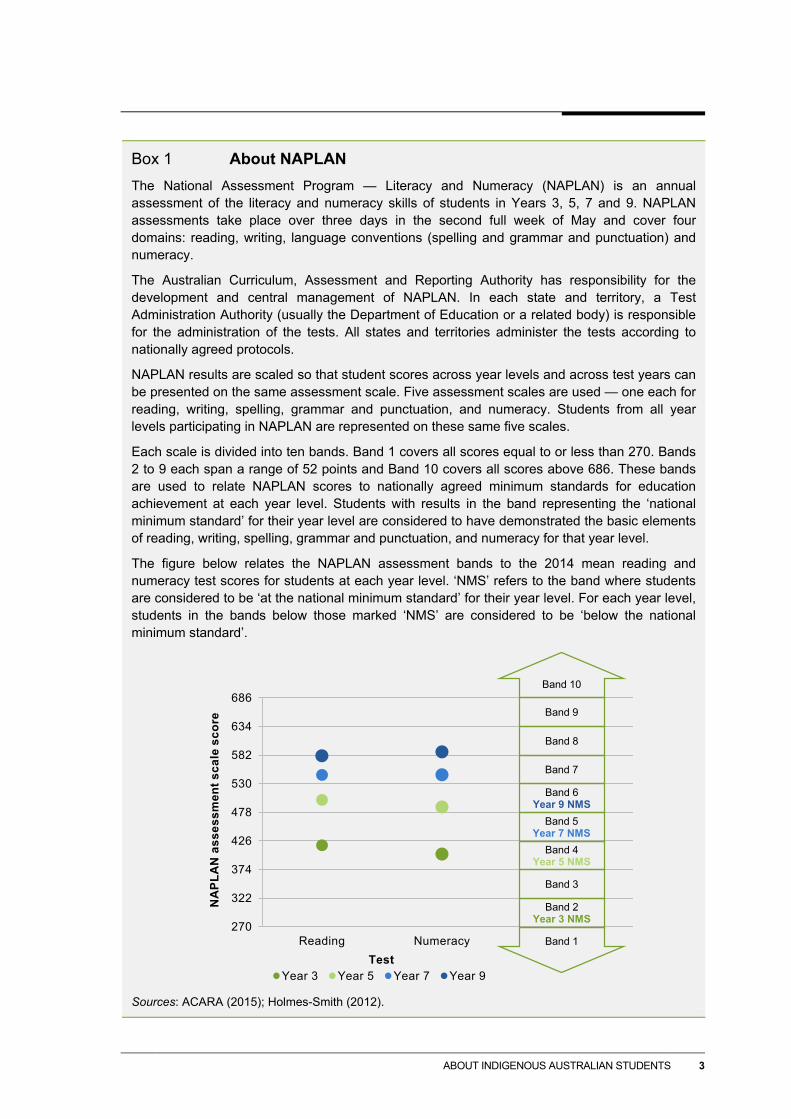
Each scale is divided into ten bands. Band 1 covers all scores equal to or less than 270. Bands 2 to 9 each span a range of 52 points and Band 10 covers all scores above 686. These bands are used to relate NAPLAN scores to nationally agreed minimum standards for education achievement at each year level. Students with results in the band representing the ‘national minimum standard’ for their year level are considered to have demonstrated the basic elements of reading, writing, spelling, grammar and punctuation, and numeracy for that year level.
The figure below relates the NAPLAN assessment bands to the 2014 mean reading and numeracy test scores for students at each year level. ‘NMS’ refers to the band where students are considered to be ‘at the national minimum standard’ for their year level. For each year level, students in the bands below those marked ‘NMS’ are considered to be ‘below the national minimum standard’.
Sources: ACARA (2015); Holmes-Smith (2012).
270
322
374
426
478
530
582
634
686
Reading Numeracy
NA
PLA
N a
sses
smen
t sca
le s
core
TestYear 3 Year 5 Year 7 Year 9
Band 10
Band 1
Band 2 Year 3 NMS
Band 3
Band 4 Year 5 NMS
Band 5 Year 7 NMS
Band 6Year 9 NMS
Band 7
Band 8
Band 9
4 INDIGENOUS PRIMARY SCHOOL ACHIEVEMENT
2 The Indigenous student population In 2014, there were 282 585 Year 5 students in Australia, 5 per cent of whom (14 620) were Indigenous. This section provides some information about these students — where they go to school (box 2), their family backgrounds and the kinds of schools they attend.
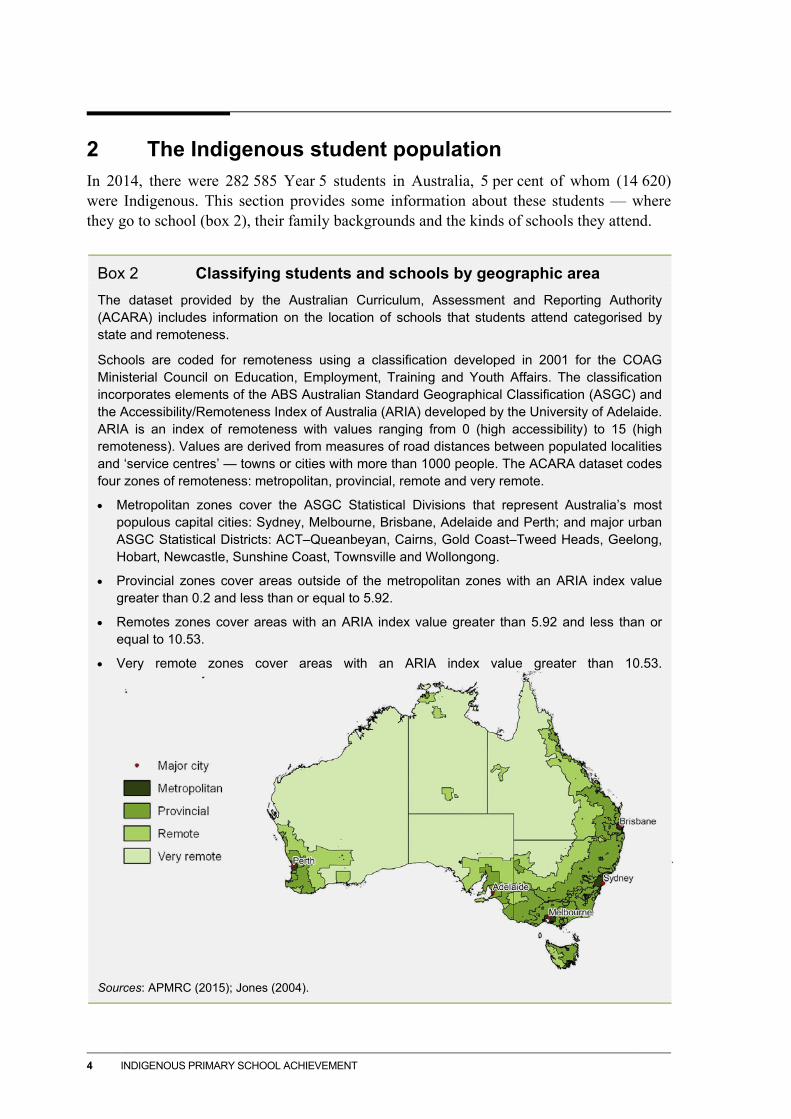
Box 2 Classifying students and schools by geographic area The dataset provided by the Australian Curriculum, Assessment and Reporting Authority (ACARA) includes information on the location of schools that students attend categorised by state and remoteness.
Schools are coded for remoteness using a classification developed in 2001 for the COAG Ministerial Council on Education, Employment, Training and Youth Affairs. The classification incorporates elements of the ABS Australian Standard Geographical Classification (ASGC) and the Accessibility/Remoteness Index of Australia (ARIA) developed by the University of Adelaide. ARIA is an index of remoteness with values ranging from 0 (high accessibility) to 15 (high remoteness). Values are derived from measures of road distances between populated localities and ‘service centres’ — towns or cities with more than 1000 people. The ACARA dataset codes four zones of remoteness: metropolitan, provincial, remote and very remote.
• Metropolitan zones cover the ASGC Statistical Divisions that represent Australia’s most populous capital cities: Sydney, Melbourne, Brisbane, Adelaide and Perth; and major urban ASGC Statistical Districts: ACT–Queanbeyan, Cairns, Gold Coast–Tweed Heads, Geelong, Hobart, Newcastle, Sunshine Coast, Townsville and Wollongong.
• Provincial zones cover areas outside of the metropolitan zones with an ARIA index value greater than 0.2 and less than or equal to 5.92.
• Remotes zones cover areas with an ARIA index value greater than 5.92 and less than or equal to 10.53.
• Very remote zones cover areas with an ARIA index value greater than 10.53.
Sources: APMRC (2015); Jones (2004).
ABOUT INDIGENOUS AUSTRALIAN STUDENTS 5
Where do Indigenous students go to school?
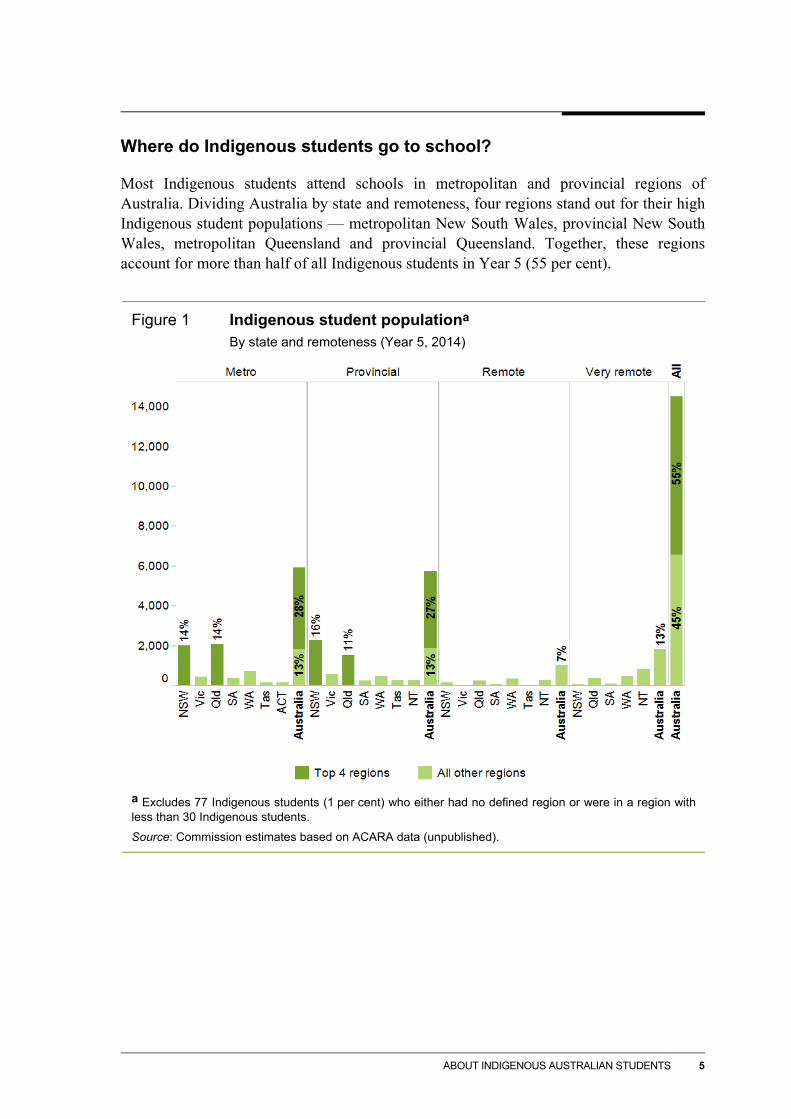
Most Indigenous students attend schools in metropolitan and provincial regions of Australia. Dividing Australia by state and remoteness, four regions stand out for their high Indigenous student populations — metropolitan New South Wales, provincial New South Wales, metropolitan Queensland and provincial Queensland. Together, these regions account for more than half of all Indigenous students in Year 5 (55 per cent).
Figure 1 Indigenous student populationa
By state and remoteness (Year 5, 2014)
a Excludes 77 Indigenous students (1 per cent) who either had no defined region or were in a region with less than 30 Indigenous students.
Source: Commission estimates based on ACARA data (unpublished).

6 INDIGENOUS PRIMARY SCHOOL ACHIEVEMENT
Indigenous students represent a high proportion of the population in remote and very remote regions. Across Australia (as noted above), Indigenous students represent 5 per cent of all Year 5 students, but 25 per cent of all Year 5 students in remote areas, and 66 per cent of all Year 5 students in very remote areas. Of all regions, Indigenous students are most strongly represented in very remote Northern Territory where they account for 88 per cent of all Year 5 students.
Figure 2 Indigenous students as a proportion of all students within a
regiona By state and remoteness (Year 5, 2014)
a Excludes 77 Indigenous students (1 per cent) who either had no defined region or were in a region with less than 30 Indigenous students.
Source: Commission estimates based on ACARA data (unpublished).
ABOUT INDIGENOUS AUSTRALIAN STUDENTS 7
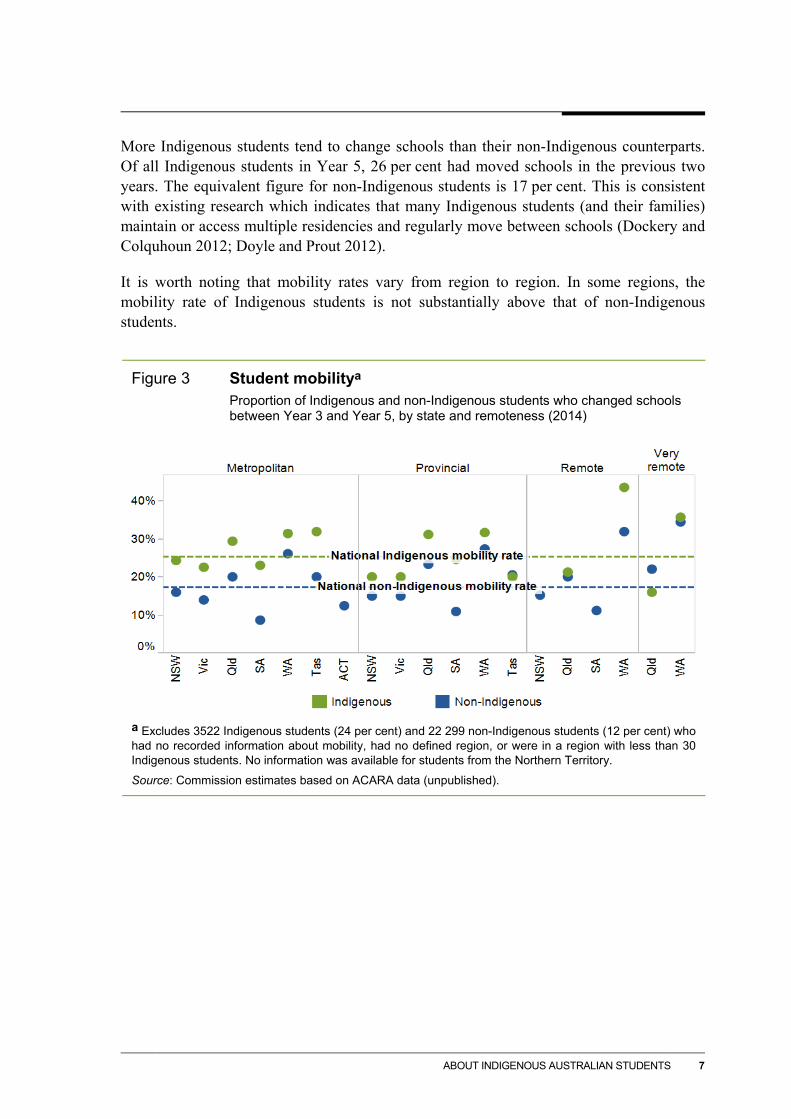
More Indigenous students tend to change schools than their non-Indigenous counterparts. Of all Indigenous students in Year 5, 26 per cent had moved schools in the previous two years. The equivalent figure for non-Indigenous students is 17 per cent. This is consistent with existing research which indicates that many Indigenous students (and their families) maintain or access multiple residencies and regularly move between schools (Dockery and Colquhoun 2012; Doyle and Prout 2012).
It is worth noting that mobility rates vary from region to region. In some regions, the mobility rate of Indigenous students is not substantially above that of non-Indigenous students.
Figure 3 Student mobilitya
Proportion of Indigenous and non-Indigenous students who changed schools between Year 3 and Year 5, by state and remoteness (2014)
a Excludes 3522 Indigenous students (24 per cent) and 22 299 non-Indigenous students (12 per cent) who had no recorded information about mobility, had no defined region, or were in a region with less than 30 Indigenous students. No information was available for students from the Northern Territory.
Source: Commission estimates based on ACARA data (unpublished).
8 INDIGENOUS PRIMARY SCHOOL ACHIEVEMENT
What family backgrounds do Indigenous students have?
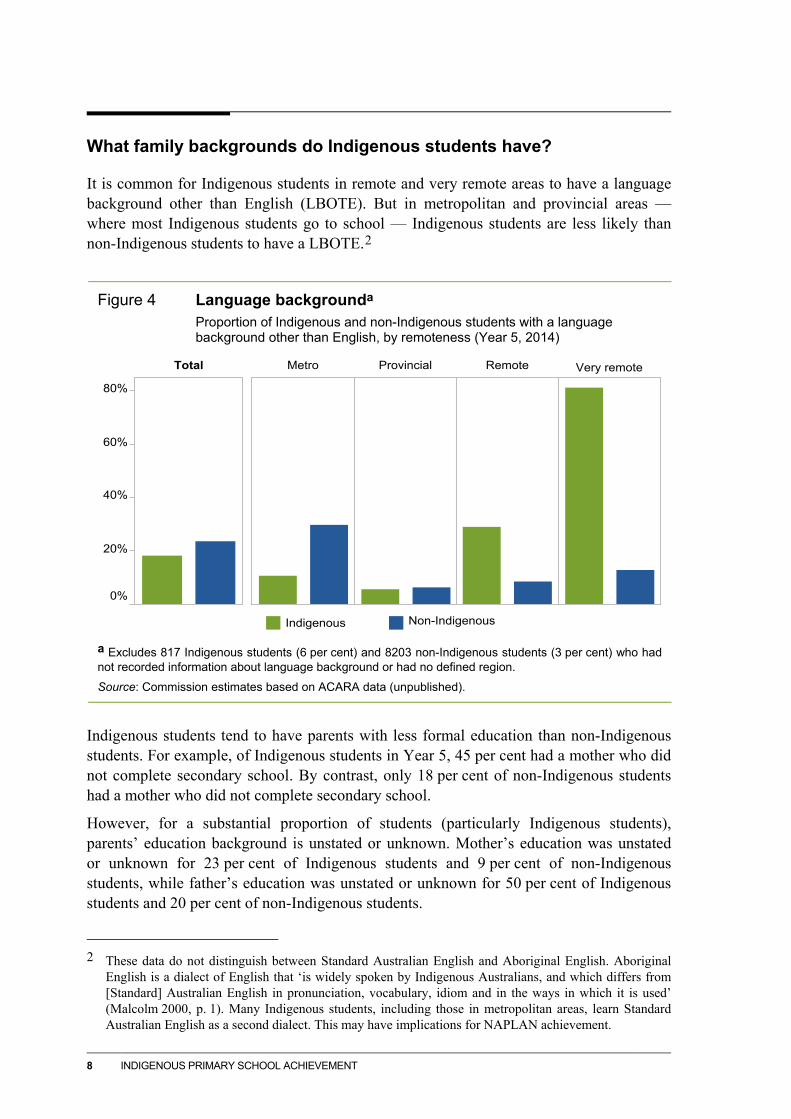
It is common for Indigenous students in remote and very remote areas to have a language background other than English (LBOTE). But in metropolitan and provincial areas — where most Indigenous students go to school — Indigenous students are less likely than non-Indigenous students to have a LBOTE.2
Figure 4 Language backgrounda
Proportion of Indigenous and non-Indigenous students with a language background other than English, by remoteness (Year 5, 2014)
a Excludes 817 Indigenous students (6 per cent) and 8203 non-Indigenous students (3 per cent) who had not recorded information about language background or had no defined region.
Source: Commission estimates based on ACARA data (unpublished).
Indigenous students tend to have parents with less formal education than non-Indigenous students. For example, of Indigenous students in Year 5, 45 per cent had a mother who did not complete secondary school. By contrast, only 18 per cent of non-Indigenous students had a mother who did not complete secondary school.
However, for a substantial proportion of students (particularly Indigenous students), parents’ education background is unstated or unknown. Mother’s education was unstated or unknown for 23 per cent of Indigenous students and 9 per cent of non-Indigenous students, while father’s education was unstated or unknown for 50 per cent of Indigenous students and 20 per cent of non-Indigenous students.
2 These data do not distinguish between Standard Australian English and Aboriginal English. Aboriginal
English is a dialect of English that ‘is widely spoken by Indigenous Australians, and which differs from [Standard] Australian English in pronunciation, vocabulary, idiom and in the ways in which it is used’ (Malcolm 2000, p. 1). Many Indigenous students, including those in metropolitan areas, learn Standard Australian English as a second dialect. This may have implications for NAPLAN achievement.
Metro Provincial Remote Very remote
Indigenous Non-Indigenous
Total
0%
20%
40%
60%
80%

ABOUT INDIGENOUS AUSTRALIAN STUDENTS 9
Figure 5 Parental educationa
Proportion of Indigenous and non-Indigenous students by parent’s high school completion rate and highest level of education attained (Year 5, 2014)a
a Figures relating to mothers exclude 3334 Indigenous students (23 per cent) and 23 650 non-Indigenous students (9 per cent) for whom information on mother’s education is unavailable. Figures relating to fathers exclude 7328 Indigenous students (50 per cent) and 52 604 non-Indigenous students (20 per cent) for whom information on father’s education is unavailable.
Source: Commission estimates based on ACARA data (unpublished).
The Commission’s econometric analysis in background paper 2 suggests that students whose mother’s formal education is unstated achieved similar NAPLAN results, holding all else constant, to students with mothers who had a level of formal education of ‘Year 9 or below’. Consequently, the numbers presented here may actually understate the difference in formal education levels between the parents of Indigenous students and those of non-Indigenous students.
Degree Diploma
Year 9 or below

10 INDIGENOUS PRIMARY SCHOOL ACHIEVEMENT
Low levels of formal education among the parents of Indigenous students are more common in remote areas and less common in metropolitan areas. For example, excluding students for whom mother’s education background was unstated or unknown, the proportion of Indigenous students with mothers who did not complete secondary school is 39 per cent in metropolitan areas, but 66 per cent in very remote areas. Again, however, this may understate the disparity as the proportion of Indigenous students for whom mother’s education was unstated or unknown increases with remoteness (33 per cent in metropolitan areas compared with 58 per cent in very remote areas).
Figure 6 Mothers who did not complete secondary schoola
Proportion of Indigenous and non-Indigenous students, by remoteness (Year 5, 2014)
a Excludes 3370 Indigenous students (23 per cent) and 23 807 non-Indigenous students (9 per cent) who either had no defined region or did not state their mother’s education.
Source: Commission estimates based on ACARA data (unpublished).
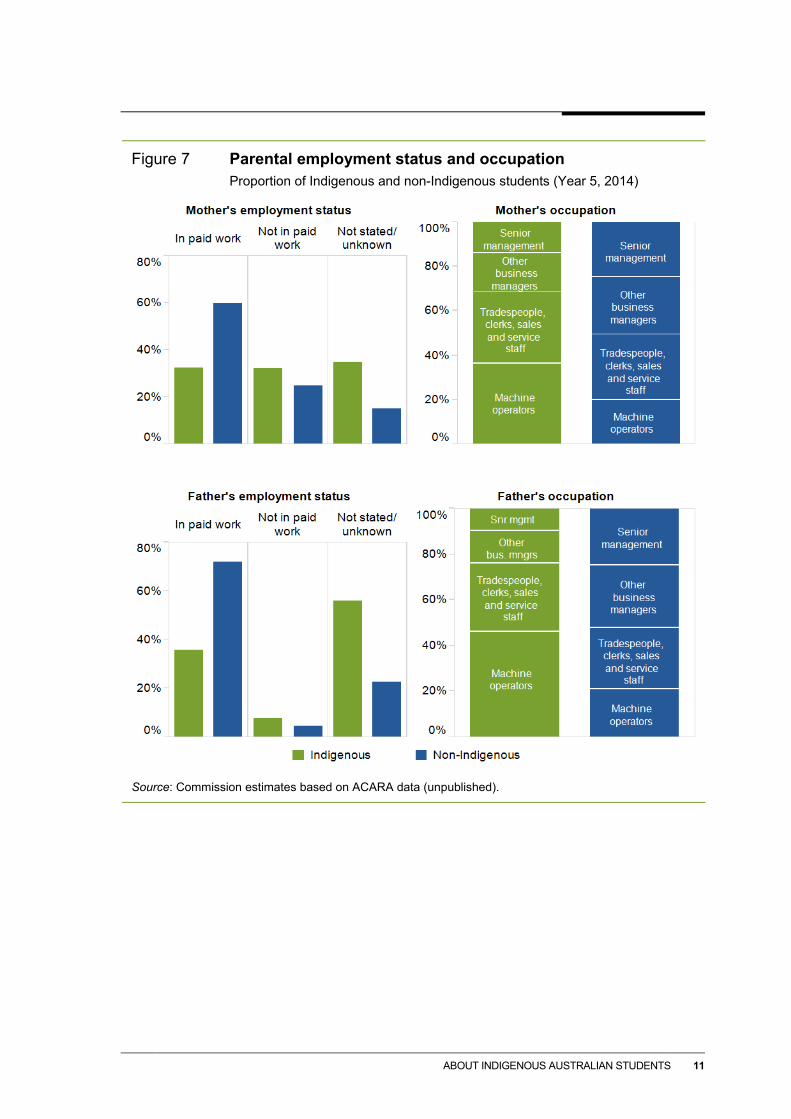
The parents of Indigenous students are more likely than their non-Indigenous counterparts to have parents that are not in paid employment. Of those in the paid workforce, most are employed in less-skilled occupations. Again, the high proportion of students for whom parent’s employment status is unstated or unknown is worthy of note. (Father’s occupation is unknown or unstated for 56 per cent of Indigenous students and 23 per cent of non-Indigenous students. Mother’s occupation is unknown or unstated for 35 per cent of Indigenous students and 15 per cent of non-Indigenous students.)
Total
0%
20%
40%
60%
80%
Metro Provincial Remote Very remote
Indigenous Non-Indigenous
ABOUT INDIGENOUS AUSTRALIAN STUDENTS 11
Figure 7 Parental employment status and occupation
Proportion of Indigenous and non-Indigenous students (Year 5, 2014)
Source: Commission estimates based on ACARA data (unpublished).
12 INDIGENOUS PRIMARY SCHOOL ACHIEVEMENT
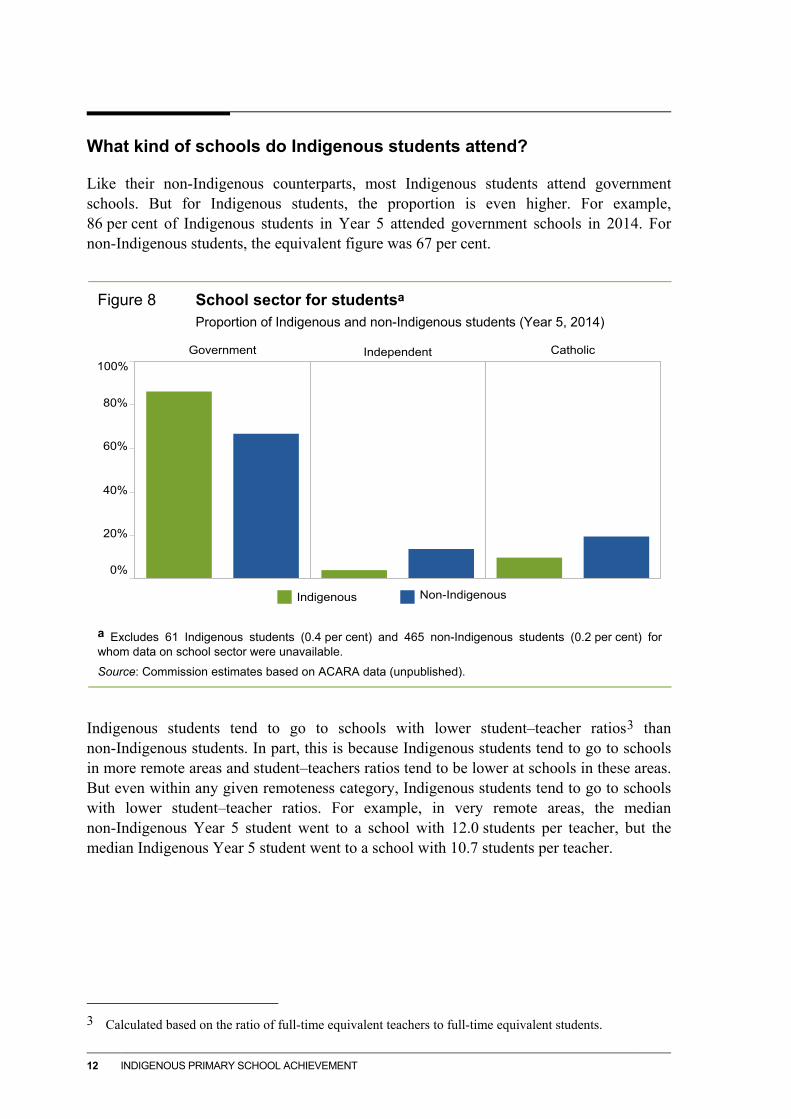
What kind of schools do Indigenous students attend?
Like their non-Indigenous counterparts, most Indigenous students attend government schools. But for Indigenous students, the proportion is even higher. For example, 86 per cent of Indigenous students in Year 5 attended government schools in 2014. For non-Indigenous students, the equivalent figure was 67 per cent.
Figure 8 School sector for studentsa
Proportion of Indigenous and non-Indigenous students (Year 5, 2014)
a Excludes 61 Indigenous students (0.4 per cent) and 465 non-Indigenous students (0.2 per cent) for whom data on school sector were unavailable.
Source: Commission estimates based on ACARA data (unpublished).
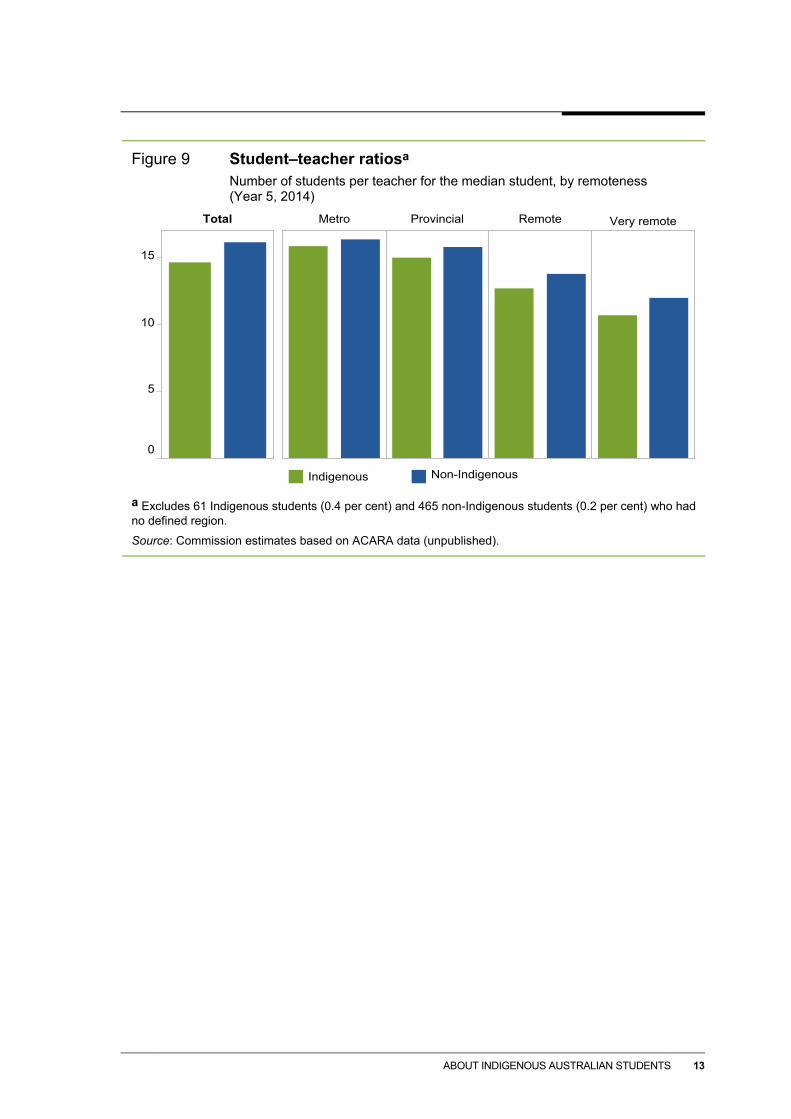
Indigenous students tend to go to schools with lower student–teacher ratios3 than non-Indigenous students. In part, this is because Indigenous students tend to go to schools in more remote areas and student–teachers ratios tend to be lower at schools in these areas. But even within any given remoteness category, Indigenous students tend to go to schools with lower student–teacher ratios. For example, in very remote areas, the median non-Indigenous Year 5 student went to a school with 12.0 students per teacher, but the median Indigenous Year 5 student went to a school with 10.7 students per teacher.
3 Calculated based on the ratio of full-time equivalent teachers to full-time equivalent students.
Government Independent Catholic
0%
20%
40%
60%
80%
100%
Indigenous Non-Indigenous
ABOUT INDIGENOUS AUSTRALIAN STUDENTS 13
Figure 9 Student–teacher ratiosa
Number of students per teacher for the median student, by remoteness (Year 5, 2014)
a Excludes 61 Indigenous students (0.4 per cent) and 465 non-Indigenous students (0.2 per cent) who had no defined region.
Source: Commission estimates based on ACARA data (unpublished).
Total
0
5
10
15
Metro Provincial Remote Very remote
Indigenous Non-Indigenous

14 INDIGENOUS PRIMARY SCHOOL ACHIEVEMENT
Half of all Indigenous students go to schools where Indigenous students make up less than 15 per cent of all students, but a considerable minority of Indigenous students (11 per cent) go to schools where Indigenous students make up at least 95 per cent of all students.
Figure 10 Indigenous student enrolmentsa
Indigenous students by Indigenous enrolment rate (Year 5, 2014)
a Excludes 69 Indigenous students (0.4 per cent) for whom data on Indigenous enrolments were unavailable.
Source: Commission estimates based on ACARA data (unpublished).
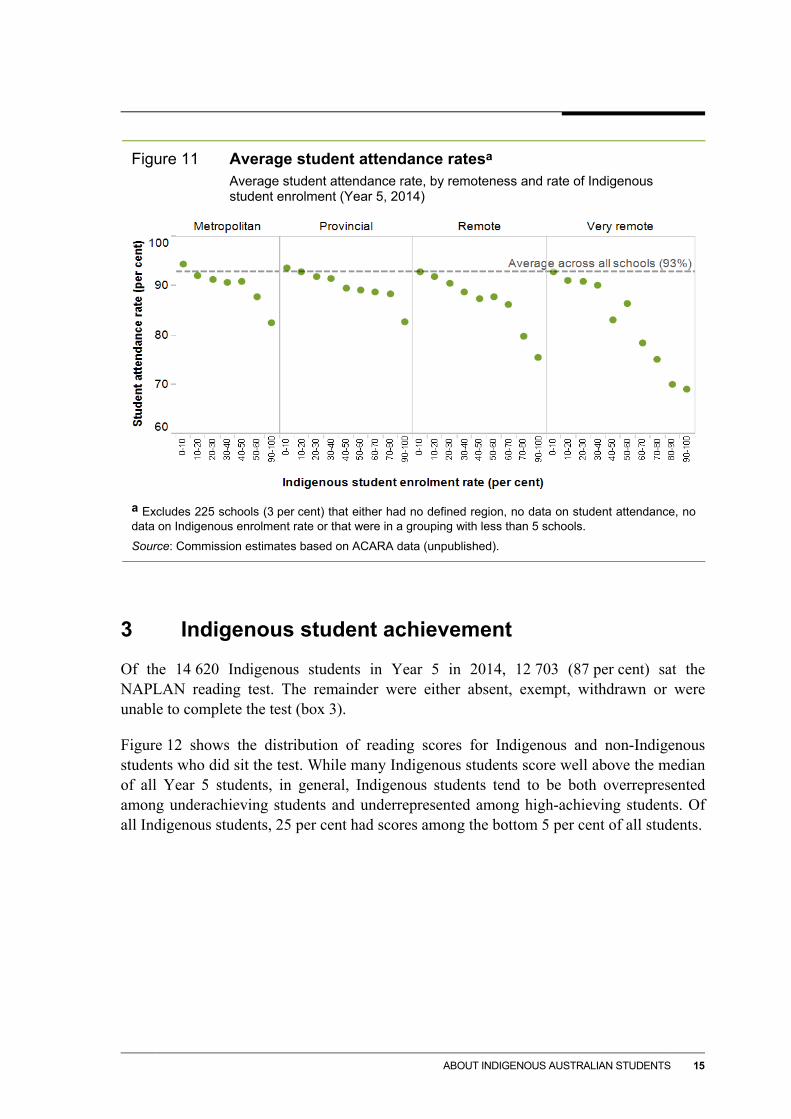
Another indicator that would be useful to examine is student attendance rates. Unfortunately, attendance rate data at the level of individual students (while collected) were unavailable for this report (chapter 1). Nonetheless, school-level student attendance rates are still informative. By plotting school-level student attendance rates against the proportion of Indigenous students in a school it is possible to get an indirect sense of how attendance rates are related to having an Indigenous background.
On average, schools with a high proportion of Indigenous students tend to have lower overall student attendance rates, particularly in very remote areas. For example, in very remote areas, of schools where less than 10 per cent of students are Indigenous, the student attendance rate of the average school is 93 per cent, in line with the average across all schools in the sample. By contrast, of very remote schools where greater than 90 per cent of students are Indigenous, the student attendance rate of the average school is 69 per cent.
ABOUT INDIGENOUS AUSTRALIAN STUDENTS 15
Figure 11 Average student attendance ratesa
Average student attendance rate, by remoteness and rate of Indigenous student enrolment (Year 5, 2014)
a Excludes 225 schools (3 per cent) that either had no defined region, no data on student attendance, no data on Indigenous enrolment rate or that were in a grouping with less than 5 schools.
Source: Commission estimates based on ACARA data (unpublished).
3 Indigenous student achievement
Of the 14 620 Indigenous students in Year 5 in 2014, 12 703 (87 per cent) sat the NAPLAN reading test. The remainder were either absent, exempt, withdrawn or were unable to complete the test (box 3).
Figure 12 shows the distribution of reading scores for Indigenous and non-Indigenous students who did sit the test. While many Indigenous students score well above the median of all Year 5 students, in general, Indigenous students tend to be both overrepresented among underachieving students and underrepresented among high-achieving students. Of all Indigenous students, 25 per cent had scores among the bottom 5 per cent of all students.

16 INDIGENOUS PRIMARY SCHOOL ACHIEVEMENT
Box 3 Who does not participate in NAPLAN? Indigenous students are less likely to participate in NAPLAN than non-Indigenous students. In 2014, 13 per cent of Indigenous students in Year 5 did not participate in the NAPLAN reading test compared with 6 per cent of non-Indigenous students. Differences in non-participation rates between Indigenous and non-Indigenous students are similar across tests, years (2013 and 2014) and year levels (Year 3 and Year 5).
Non-participation rates are particularly high for Indigenous students in very remote areas. In 2014, 23 per cent of Indigenous Year 5 students in very remote areas did not participate in the reading test. By contrast, the non-participation rate for Indigenous students in metropolitan areas was 11 per cent and the non-participation rate for non-Indigenous students in very remote areas was 7 per cent.
Most Indigenous students (54 per cent) who did not participate in the reading test were absent when the test was administered. Twenty-three per cent were withdrawn by a parent or carer, 22 per cent were exempt for reasons such as disability or English language proficiency, and 1 per cent abandoned the test due to illness or injury. By contrast, non-Indigenous students who did not participate were less likely to be absent (34 per cent), more likely to be withdrawn (33 per cent) or exempt (32 per cent) and about as likely to abandon the test (less than 1 per cent).
In very remote areas, Indigenous students who did not participate were much more likely to be absent and much less likely to be withdrawn or exempt.
Source: Commission estimates based on ACARA data (unpublished).

ABOUT INDIGENOUS AUSTRALIAN STUDENTS 17
Figure 12 Distribution of reading test scores
Histograms for Indigenous and non-Indigenous students (Year 5, 2014)
Percentiles for all studentsa
a The percentiles define the percentage proportion of scores in the distribution of all students that a specific score is greater than or equal to.
Source: Commission estimates based on ACARA data (unpublished).
This section explores how Indigenous student achievement varies by location, family background and the characteristics of the schools that students attend. The information presented in this section is intended to be descriptive. The indicators discussed do not necessarily represent causal factors that can explain differences in student scores.
A common chart format is used throughout this section. Each chart shows the median reading test score (the middle score when students are sorted by score) for Indigenous and non-Indigenous students in Year 5 in 2014. For reference, each chart also includes lines that indicate the reading scores at given percentiles for all Year 5 students in 2014. Percentiles define the percentage of scores in a distribution that a specific score is greater than or equal to.
18 INDIGENOUS PRIMARY SCHOOL ACHIEVEMENT
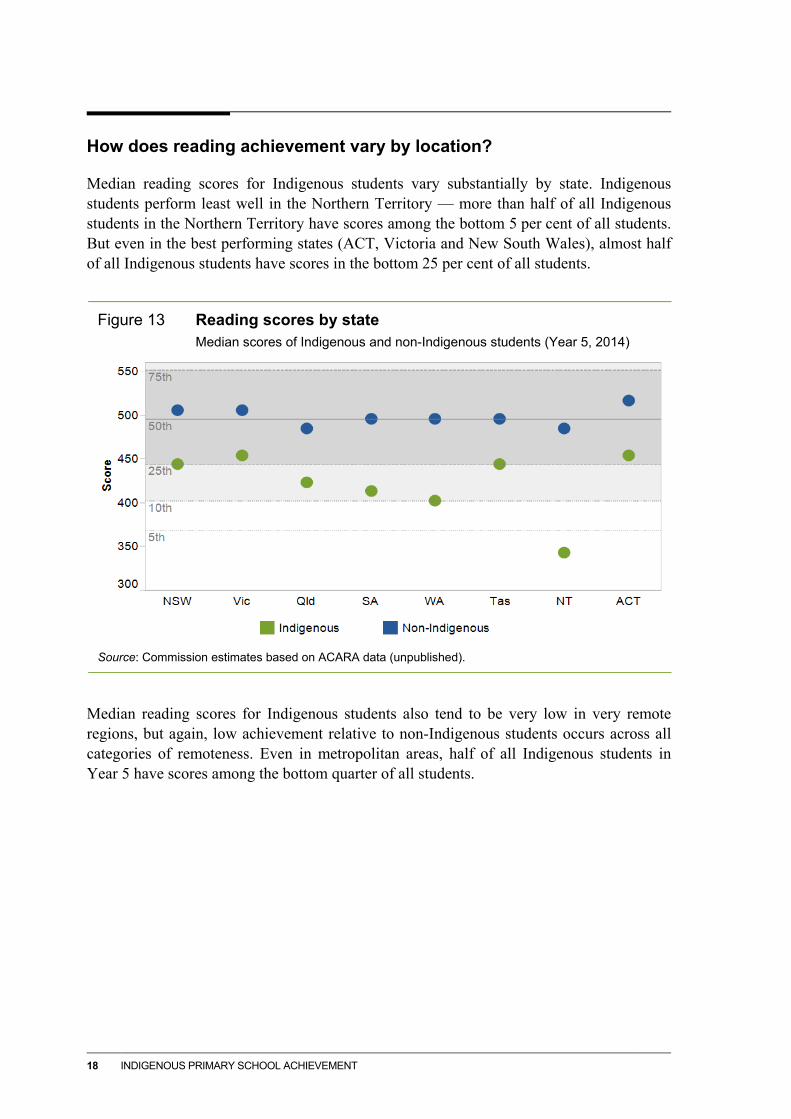
How does reading achievement vary by location?
Median reading scores for Indigenous students vary substantially by state. Indigenous students perform least well in the Northern Territory — more than half of all Indigenous students in the Northern Territory have scores among the bottom 5 per cent of all students. But even in the best performing states (ACT, Victoria and New South Wales), almost half of all Indigenous students have scores in the bottom 25 per cent of all students.
Figure 13 Reading scores by state
Median scores of Indigenous and non-Indigenous students (Year 5, 2014)
Source: Commission estimates based on ACARA data (unpublished).
Median reading scores for Indigenous students also tend to be very low in very remote regions, but again, low achievement relative to non-Indigenous students occurs across all categories of remoteness. Even in metropolitan areas, half of all Indigenous students in Year 5 have scores among the bottom quarter of all students.

ABOUT INDIGENOUS AUSTRALIAN STUDENTS 19
Figure 14 Reading scores by remotenessa
Median scores of Indigenous and non-Indigenous students (Year 5, 2014)
a Excludes 58 Indigenous students (0.5 per cent) and 246 non-Indigenous students (0.1 per cent) who had no defined region.
Source: Commission estimates based on ACARA data (unpublished).
How does reading achievement vary by family background?
Students with an English language background tend to perform better on the NAPLAN reading test than those with a LBOTE.4 However, the difference in scores between English and non-English background students is larger for Indigenous students than non-Indigenous students.
In part, this is because a larger proportion of Indigenous students go to school in remote and very remote regions where the difference in scores between English background and non-English background students is largest. However, across all regions, the difference between English and non-English background Indigenous students is larger than the difference between English and non-English background non-Indigenous students. For example, in metropolitan regions, the difference in scores between English and non-English background Indigenous students was 21 points. The equivalent figure for non-Indigenous students was 11 points.
4 This is one finding that does not hold across tests for non-Indigenous students. On the numeracy test,
non-Indigenous students with an English background score about the same as non-Indigenous students with a non-English background. However, for Indigenous students, the gap between English and non-English background students is about the same across tests.

20 INDIGENOUS PRIMARY SCHOOL ACHIEVEMENT
Figure 15 Reading scores by language background and remotenessa
Median scores of Indigenous and non-Indigenous students (Year 5, 2014)
a Excludes 684 Indigenous students (5 per cent) and 7412 non-Indigenous students (3 per cent) who did not state their language background or had no defined region.
Source: Commission estimates based on ACARA data (unpublished).
Students (both Indigenous and non-Indigenous) who have parents with more formal education tend to perform substantially better on reading tests than those who have parents with little formal education. For example, Indigenous Year 5 students with mothers who have a university degree had a median score on the reading test 83 points above Indigenous students who had mothers who completed year 9 or below only. This is the difference between a median score at the 10th percentile of all students and a median score at the 45th percentile of all students. (The difference is similar for father’s education.)

ABOUT INDIGENOUS AUSTRALIAN STUDENTS 21
Unlike previous figures, the figure below includes scores for students who did not state or did not know their mother’s highest level of formal education. This group accounted for a large proportion of all Indigenous students (23 per cent) and these students tended to achieve particularly low scores on the reading test.
Figure 16 Reading scores by mother’s formal education
Median scores of Indigenous and non-Indigenous students by mother’s highest level of formal education (Year 5, 2014)
Source: Commission estimates based on ACARA data (unpublished).
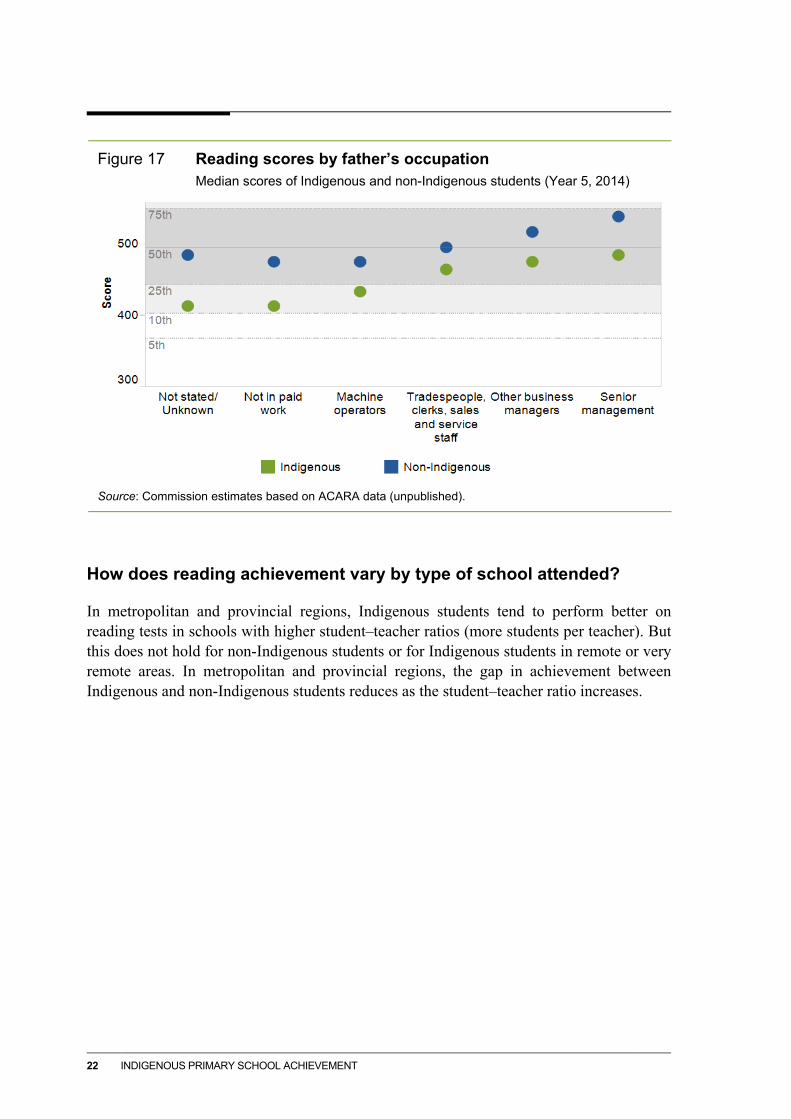
Students (both Indigenous and non-Indigenous) with parents in more skilled occupations also tend to do substantially better on the reading test than those who have parents in less-skilled occupations or who are not in paid work. For example, Indigenous Year 5 students with fathers employed in senior management had a median score on the reading test 72 points above Indigenous students who had a father who was not in paid work. (The difference is similar for mother’s occupation.)
The figure below also includes scores for students who did not state or did not know their father’s occupation. This group accounted for the majority of all Indigenous students (56 per cent). The median score for this group was similar to that of Indigenous students with fathers who were not in paid work.
22 INDIGENOUS PRIMARY SCHOOL ACHIEVEMENT
Figure 17 Reading scores by father’s occupation
Median scores of Indigenous and non-Indigenous students (Year 5, 2014)
Source: Commission estimates based on ACARA data (unpublished).
How does reading achievement vary by type of school attended?
In metropolitan and provincial regions, Indigenous students tend to perform better on reading tests in schools with higher student–teacher ratios (more students per teacher). But this does not hold for non-Indigenous students or for Indigenous students in remote or very remote areas. In metropolitan and provincial regions, the gap in achievement between Indigenous and non-Indigenous students reduces as the student–teacher ratio increases.

ABOUT INDIGENOUS AUSTRALIAN STUDENTS 23
Figure 18 Reading scores by student–teacher ratio and remotenessa
Median scores of Indigenous and non-Indigenous students (Year 5, 2014)
a Excludes 144 Indigenous students (1 per cent) and 408 non-Indigenous students (0.2 per cent) for whom data on student–teacher ratio and/or remoteness were unavailable.
Source: Commission estimates based on ACARA data (unpublished).
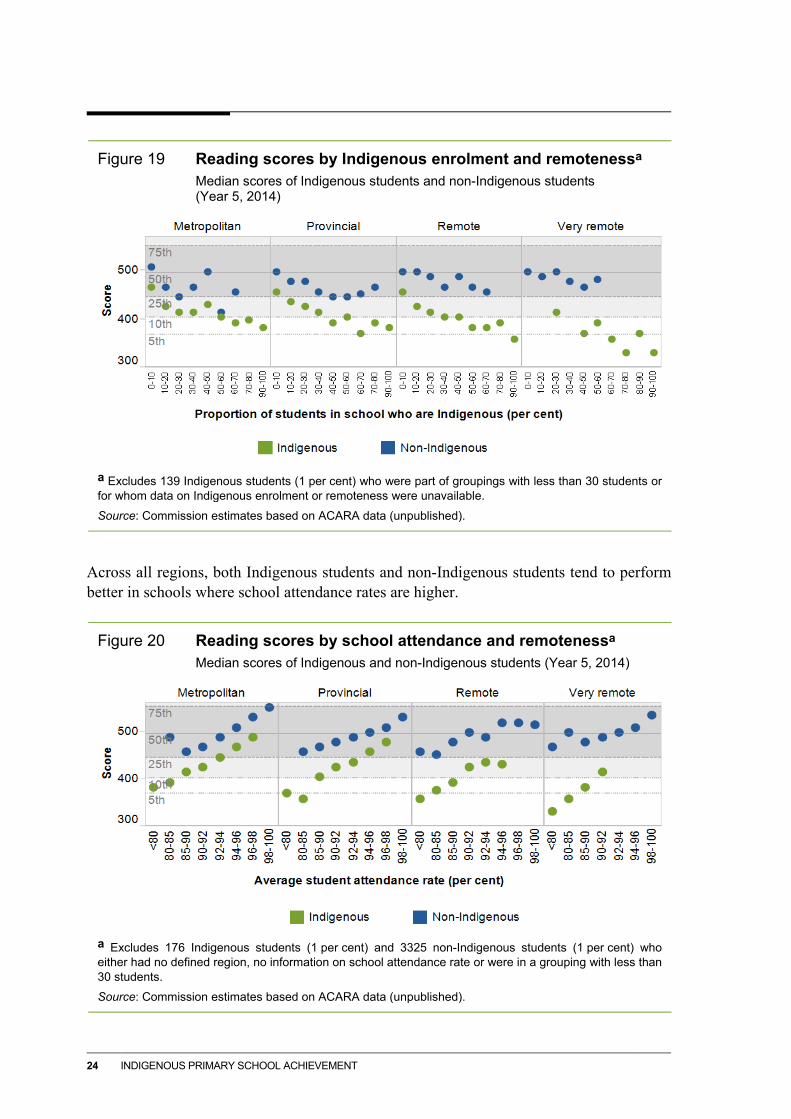
Across all remoteness categories, Indigenous students tend to perform better at schools where Indigenous students are a relatively small proportion of the total student population. The achievement of non-Indigenous students also tends to be higher at schools with a small proportion of Indigenous students.
24 INDIGENOUS PRIMARY SCHOOL ACHIEVEMENT
Figure 19 Reading scores by Indigenous enrolment and remotenessa
Median scores of Indigenous students and non-Indigenous students (Year 5, 2014)
a Excludes 139 Indigenous students (1 per cent) who were part of groupings with less than 30 students or for whom data on Indigenous enrolment or remoteness were unavailable.
Source: Commission estimates based on ACARA data (unpublished).
Across all regions, both Indigenous students and non-Indigenous students tend to perform better in schools where school attendance rates are higher.
Figure 20 Reading scores by school attendance and remotenessa Median scores of Indigenous and non-Indigenous students (Year 5, 2014)
a Excludes 176 Indigenous students (1 per cent) and 3325 non-Indigenous students (1 per cent) who either had no defined region, no information on school attendance rate or were in a grouping with less than 30 students.
Source: Commission estimates based on ACARA data (unpublished).
ABOUT INDIGENOUS AUSTRALIAN STUDENTS 25
References
ACARA (Australian Curriculum, Assessment and Reporting Authority) 2015, 2015 National Protocols for Test Administration, www.nap.edu.au/ verve/_resources/National_protocols_for_test_administration_2015_-_web _version.PDF (accessed 16 November 2015).
APMRC (Australian Population and Migration Research Centre) 2015, ARIA (Accessibility/Remoteness Index of Australia), www.adelaide.edu.au/apmrc/research/ projects/category/about_aria.html (accessed 17 February 2016).
Dockery, A.M. and Colquhoun, S. 2012, ‘Mobility of Aboriginal and Torres Strait Islander people: A literature review’, CRC-REP Working Paper CW004 Alice Springs: Ninti One Limited, www.crc-rep.com.au/resource/CW004_MobilityOfAboriginalandTorres StraitIslanderPeople_ALiteratureReview.pdf (accessed 20 April 2016).
Doyle, T. and Prout, S. 2012, ‘Indigenous student mobility, performance and achievement: Issues of positioning and traceability’, International Journal of Educational Research, vol. 54, pp. 41–49.
Holmes-Smith, P. 2012, Using NAPLAN Summative Data to Identify Instructional Successes and Challenges, School Research Evaluation and Measurement Services, www.sreams.com.au/naplan.html (accessed 16 November 2015).
Jones, R. 2004, Geolocation Questions and Coding Index, A technical report submitted to the Performance Measurement and Reporting Taskforce of the Ministerial Council on Education, Employment, Training and Youth Affairs, Quantitative Evaluation and Design, www.scseec.edu.au (accessed 17 February 2016).
Malcolm, I. 2000, A Submission on Aboriginal English and Urban Dwelling Aboriginal and Torres Strait Islander People, Report to the Inquiry into the Needs of Urban Dwelling Aboriginal and Torres Strait Islander Peoples conducted by the House of Representatives Standing Committee on Aboriginal and Torres Strait Islander Affairs, Submission no. 31.