background: power and energy - american institute of...
TRANSCRIPT

EES 207 Sustainable Energy Laboratory
Updated: 11/17/2015 7:40 AM
Background: Power and Energy Learning Objectives. In this lab session you will learn to measure power, use power units, calculate energy from power, use energy units, convert between energy units, use powers of ten, and use significant figures properly.
Equipment. Light bulbs, Kill-A-Watt meter, ruler, calculator Powers of Ten In this lab you will need to use powers of ten for some calculations. The following are examples of powers of ten: 333,000 = 3.33 x10⁵ 333 = 3.33 x10² 0.00333 = 3.33 x10⁻³ Significant Figures In this lab you are required to express the answer to all calculations using three significant figures (when possible or when specified). The following are examples of numbers with three significant figures: 333000, 3330, 333, 33.3, 3.33, 0.333, 0.0333, 0.00333, 3.33 x 10² Energy and Power (Note that the capitalization is important!) • Power is the rate of consuming energy. • Power is measured in Watts (W). • Energy and power are related: Energy = Power x Time • Energy is measured in Watt-hours (Wh) or kilowatt hours (kWh). • Energy is also measured in British Thermal Units (Btu), Joules (J), and kiloJoules (kJ) Conversion between Energy Units To convert from Wh to kWh multiply by 0.001 kWh/Wh or 1.00 x 10⁻³ kWh/Wh To convert from kWh to Wh multiply by 1000 Wh/kWh or 1.00 x 10³ Wh/kWh To convert from kWh to Btu multiply by 3413 Btu/kWh or 3.413 x 10³ Btu/kWh To convert from Btu to Wh multiply by 0.293 Wh/Btu To convert from Btu to kWh multiply by 2.93 x 10⁻⁴ kWh/Btu To convert from kWh to kJ multiply by 3600 kJ/kWh or 3.60 x 10³ kJ/kWh To convert from kWh to J multiply by 3.60 x 10⁶ J/kWh To convert from kJ to J multiply by 1000 J/kJ or 1.00 x 10³ J/kJ To convert from J to kJ multiply by 0.001 kJ/J or 1.00 x 10⁻³ kJ/J To convert from kJ to kWh multiply by 2.78 x 10⁻⁴ kWh/kJ To convert from Btu to kJ multiply by 1.05 kJ/Btu To convert from kJ to Btu multiply by 0.948 Btu/kJ Note: 1000 Btu = 1.00 kBtu, 1000 J = 1.00 kJ, 1000 kJ = 1.00 MJ Energy Calculation Examples • A 100 watt light bulb is on for 2 hours, the energy consumed by this bulb equals: 100 W x 2 hours = 200 Wh = 200 Wh x 0.001 kWh/Wh = 0.200 kWh • Convert this energy to Btu: 0.200 kWh x 3413 Btu/kWh = 683 Btu • Convert this energy to J and kJ: 0.200 kWh x 3.60 x 106 J/kWh = 7.20 x 10⁵ J = 7.2 x 10² kJ or 720 kJ
EES 207 Sustainable Energy Laboratory
11/17/2015 7:41 AM 1
Lab: Power and Energy
Date:
Name: Lab Meeting Day/Time:
Partner(s):
Exercise 1. Measuring Power
Use the Kill-A-Watt meter to measure the power consumed by the incandescent light bulb.
Record this measured value in the box below. Include units.
Power Consumed by incandescent light bulb =
Use the Kill-A-Watt meter to measure the power consumed by the compact fluorescent light (CFL).
Record this measured value in the box below. Include units.
Power Consumed by CFL =
Exercise 2. Calculating Energy
Using the measured value of power, calculate the energy used by the incandescent bulb if it were lit for 150 hours (5 hours a day for 30 days). Express your answer in Wh.
Show this calculation in the box below. Show all steps, not just the answer. Include units and be sure to use 3 significant figures in your result. Use powers of ten (e.g. 8.78x10³).
Energy used by the incandescent bulb =
Using the measured value of power, calculate the energy used by the CFL if it were lit for 150 hours (5 hours a day for 30 days). Express your answer in Wh.
Show this calculation in the box below. Show all steps, not just the answer. Include units and be sure to use 3 significant figures in your result. Use powers of ten (e.g. 2.23x10³).
Energy used by the CFL =

EES 207 Sustainable Energy Laboratory
2
Exercise 3. Converting Units
Use the appropriate conversion factor to calculate the energy consumed by the incandescent bulb during 150 hours of operation in kWh units. Show all steps not just the answer. Include units and use 3 significant figures in your result (powers of ten are not necessary).
Energy used by the incandescent bulb =
Use the appropriate conversion factor to calculate the energy consumed by the incandescent bulb during 150 hours of operation in Btu units. Show all steps not just the answer. Include units and use 3 significant figures in your result (powers of ten are not necessary).
Energy used by the incandescent bulb =
Use the appropriate conversion factor to calculate the energy consumed by the incandescent bulb during 150 hours of operation in kJ units. Show all steps not just the answer. Include units and use 3 significant figures in your result (powers of ten are not necessary).
Energy used by the incandescent bulb =
Have your instructor check over this lab report before you hand it in.
Your instructor will be looking for the following:
The power measurements are reasonable.
All calculations have units.
Answers have 3 significant figures.
Powers of ten are used correctly.
All calculations are shown.
You are now ready to take the quiz on Blackboard.
You may use the Background sheet and this Lab Report sheet during the quiz.
You are required to take the quiz solo (i.e., without the assistance of anyone! Honor System Rules!)
Hand in the Lab Report when you are done. Keep the Background sheet for future reference. Your Lab Report will be graded and returned to you during the next lab meeting; you might then add it to your Lab Notebook and use it as a guide for the Power & Energy Quiz on Blackboard. See you next week!

EES 207 Sustainable Energy Laboratory
6/9/2016 11:15 AM 1
Electric Energy Audit
Take Home Lab
Bring your completed Electric Energy Audit (on reverse) to lab next week.
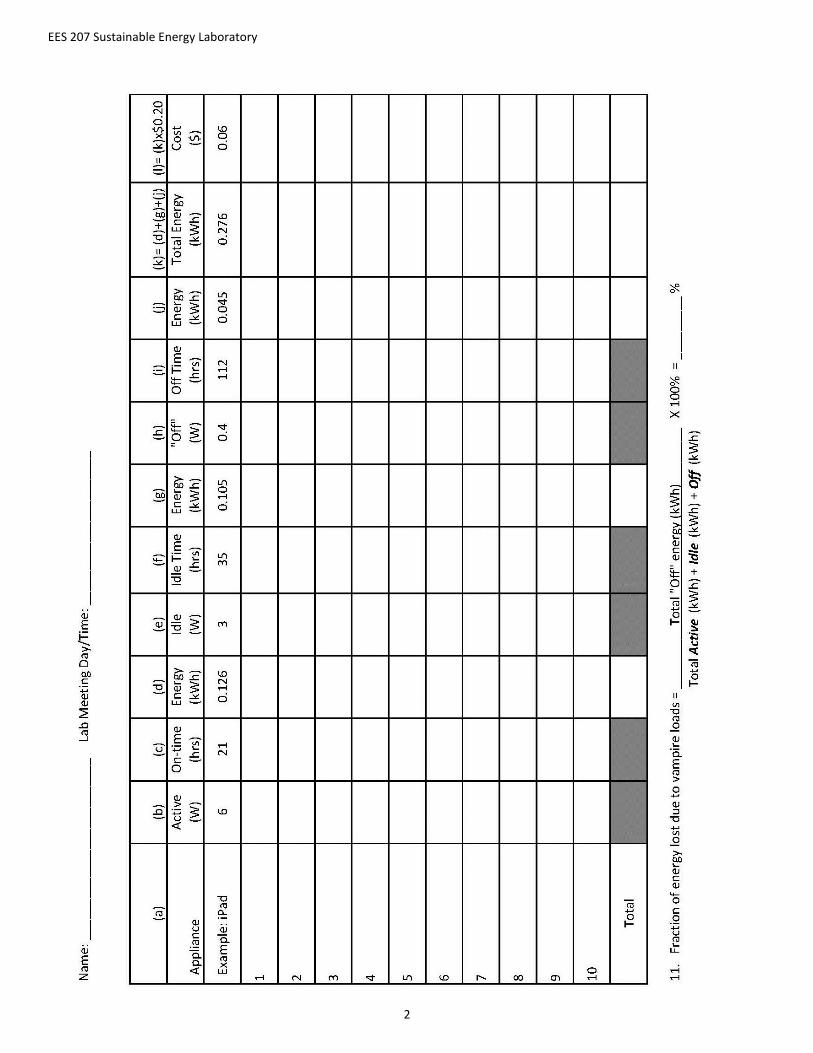
Learning Objectives: You will learn about your personal use of electric energy. Background Information: The accompanying sheet lists the power consumed by typical appliances. Instructions: 1. Using the table on the reverse side, fill in the power consumption in Watts for active (or charging:
column b), idle (energy save mode for the device: column e), and off (maintaining a vampire load:
column h) for 10 appliances where you live.
2. Write in the number of hours per week that the appliance is active (column c), idle (column f), or off
(column i). If the device is unplugged, DO NOT include that in the “off” hours. The number of hours in a
week is 168.
3. Calculate the energy in kWh consumed by every appliance for each of its states of operation during a
week. (For example: multiply column b by column c to get column d, Energy (kWh)).
4. Sum each of the energy columns, specifically:
5. Add the total energy consumed (in kWh) by all the appliances in their active state (column d).
6. Add the total energy consumed (in kWh) by all the appliances in their idle state (column g).
7. Add the total energy consumed (in kWh) by all the appliances in their off state (column j).
8. Add the previous three energy totals to calculate total energy consumed by the appliance in all states
(column k).
9. Energy consumed by appliances in their “off” state is wasted and could be eliminated by unplugging the
appliance or by putting it on a power strip with an off-switch.
10. Calculate the cost of the energy used (column l) by multiplying column k by $0.20/kWh (i.e., the cost of
electricity in Connecticut).
11. Calculate the fraction (expressed as a percent) of the energy consumed by all of your appliances
(together) that is wasted (use the equation below the table).
Be prepared to share this data during the next lab session.
EES 207 Sustainable Energy Laboratory
2
EES 207 Sustainable Energy Laboratory
3
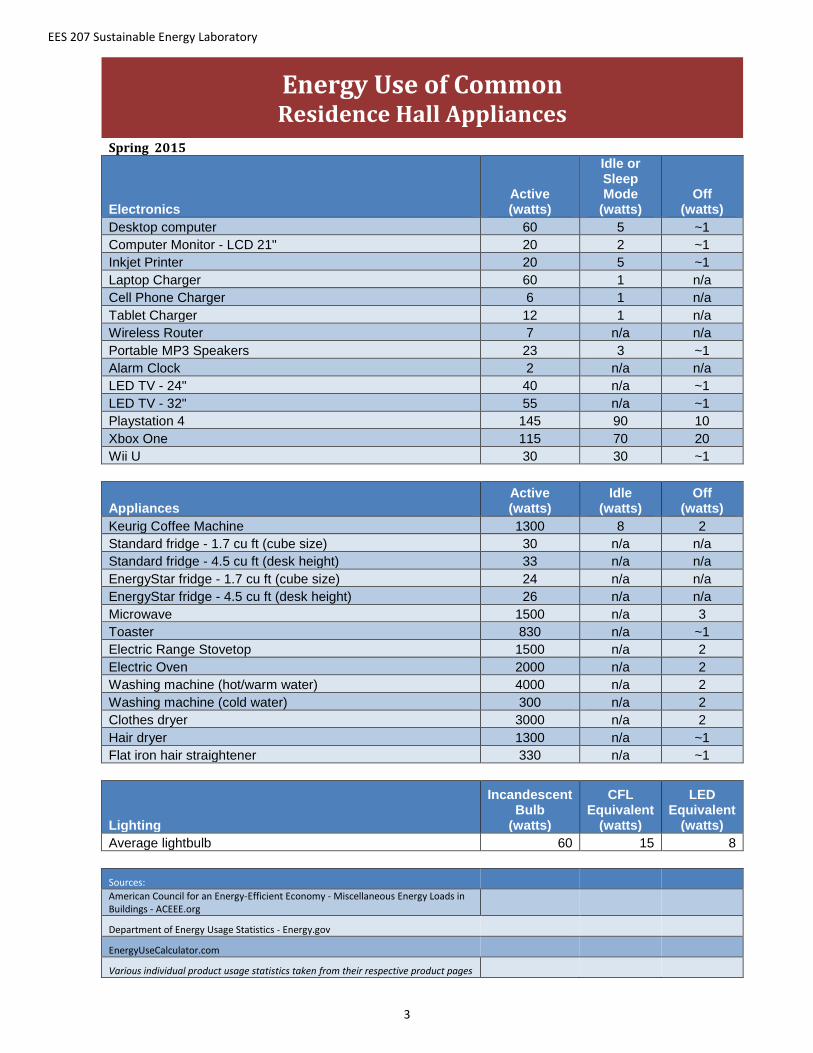
Energy Use of Common Residence Hall Appliances
Spring 2015
Electronics Active (watts)
Idle or Sleep Mode
(watts) Off
(watts)
Desktop computer 60 5 ~1
Computer Monitor - LCD 21" 20 2 ~1
Inkjet Printer 20 5 ~1
Laptop Charger 60 1 n/a
Cell Phone Charger 6 1 n/a
Tablet Charger 12 1 n/a
Wireless Router 7 n/a n/a
Portable MP3 Speakers 23 3 ~1
Alarm Clock 2 n/a n/a
LED TV - 24" 40 n/a ~1
LED TV - 32" 55 n/a ~1
Playstation 4 145 90 10
Xbox One 115 70 20
Wii U 30 30 ~1
Appliances Active (watts)
Idle (watts)
Off (watts)
Keurig Coffee Machine 1300 8 2
Standard fridge - 1.7 cu ft (cube size) 30 n/a n/a
Standard fridge - 4.5 cu ft (desk height) 33 n/a n/a
EnergyStar fridge - 1.7 cu ft (cube size) 24 n/a n/a
EnergyStar fridge - 4.5 cu ft (desk height) 26 n/a n/a
Microwave 1500 n/a 3
Toaster 830 n/a ~1
Electric Range Stovetop 1500 n/a 2
Electric Oven 2000 n/a 2
Washing machine (hot/warm water) 4000 n/a 2
Washing machine (cold water) 300 n/a 2
Clothes dryer 3000 n/a 2
Hair dryer 1300 n/a ~1
Flat iron hair straightener 330 n/a ~1
Lighting
Incandescent Bulb
(watts)
CFL Equivalent
(watts)
LED Equivalent
(watts)
Average lightbulb 60 15 8
Sources:
American Council for an Energy-Efficient Economy - Miscellaneous Energy Loads in Buildings - ACEEE.org
Department of Energy Usage Statistics - Energy.gov
EnergyUseCalculator.com
Various individual product usage statistics taken from their respective product pages
EES 207 Sustainable Energy Laboratory
Updated: 11/18/2015 7:59 AM
Background: Basic Electricity
Equipment. Pasco Xplorer GLX data logger, Voltage-Current probe, battery power supply, two light bulbs, ruler, calculator, lab notebook
Learning Objectives. This lab will introduce you to basic DC circuits, how to measure current and voltage, and how to calculate electric power.
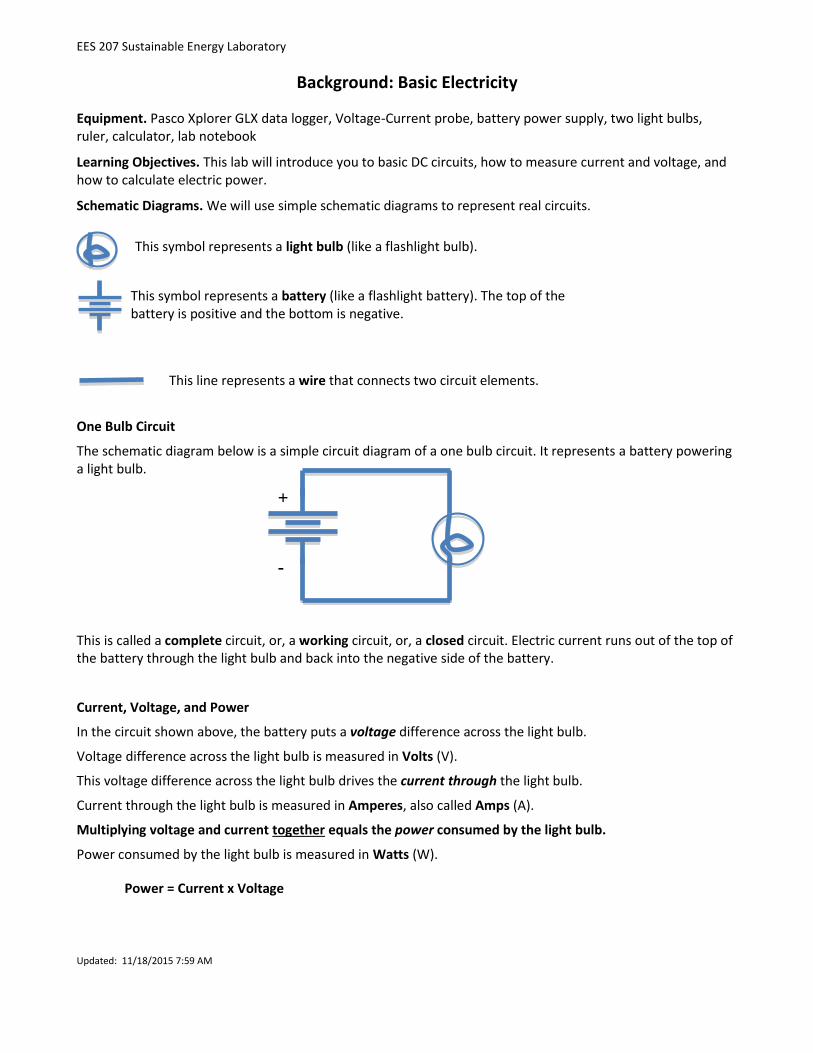
Schematic Diagrams. We will use simple schematic diagrams to represent real circuits.
One Bulb Circuit
The schematic diagram below is a simple circuit diagram of a one bulb circuit. It represents a battery powering a light bulb.
This is called a complete circuit, or, a working circuit, or, a closed circuit. Electric current runs out of the top of the battery through the light bulb and back into the negative side of the battery.
Current, Voltage, and Power
In the circuit shown above, the battery puts a voltage difference across the light bulb.
Voltage difference across the light bulb is measured in Volts (V).
This voltage difference across the light bulb drives the current through the light bulb.
Current through the light bulb is measured in Amperes, also called Amps (A).
Multiplying voltage and current together equals the power consumed by the light bulb.
Power consumed by the light bulb is measured in Watts (W).
Power = Current x Voltage
This symbol represents a light bulb (like a flashlight bulb).
+
-
This symbol represents a battery (like a flashlight battery). The top of the battery is positive and the bottom is negative.
This line represents a wire that connects two circuit elements.
+
-
EES 207 Sustainable Energy Laboratory
2
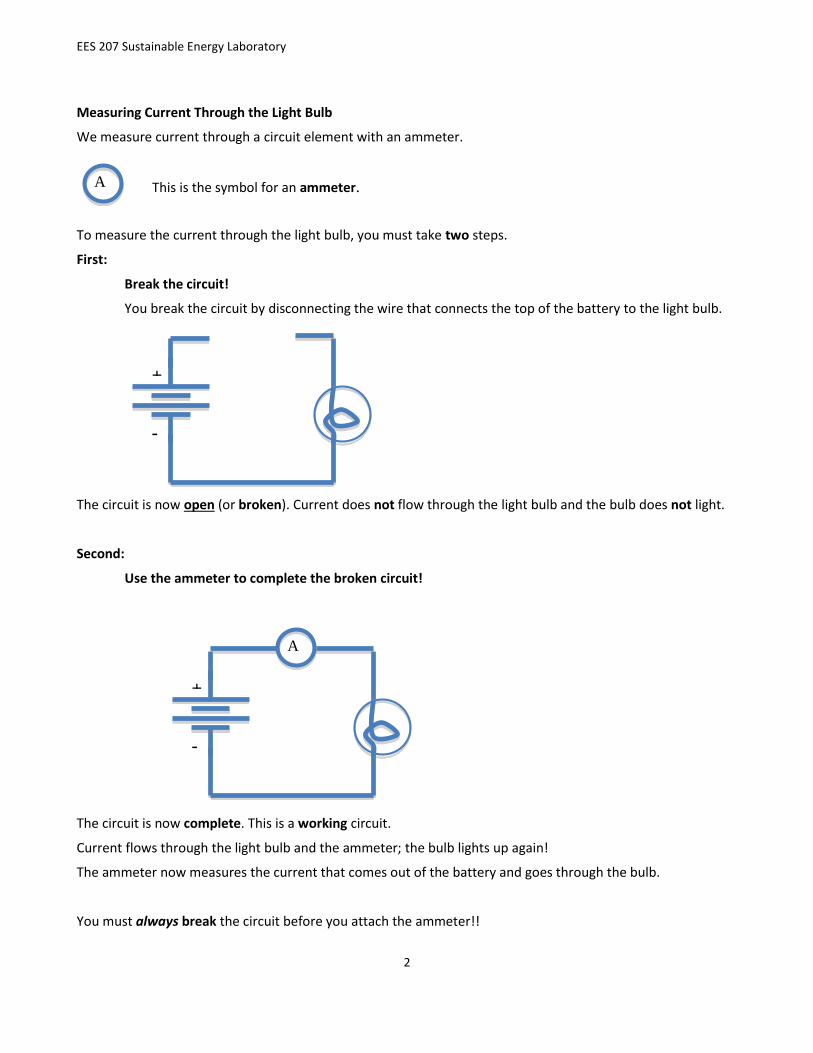
Measuring Current Through the Light Bulb
We measure current through a circuit element with an ammeter.
To measure the current through the light bulb, you must take two steps.
First:
Break the circuit!
You break the circuit by disconnecting the wire that connects the top of the battery to the light bulb.
The circuit is now open (or broken). Current does not flow through the light bulb and the bulb does not light.
Second:
Use the ammeter to complete the broken circuit!
The circuit is now complete. This is a working circuit.
Current flows through the light bulb and the ammeter; the bulb lights up again!
The ammeter now measures the current that comes out of the battery and goes through the bulb.
You must always break the circuit before you attach the ammeter!!
+
-
A
+
-
A
This is the symbol for an ammeter.
EES 207 Sustainable Energy Laboratory
3
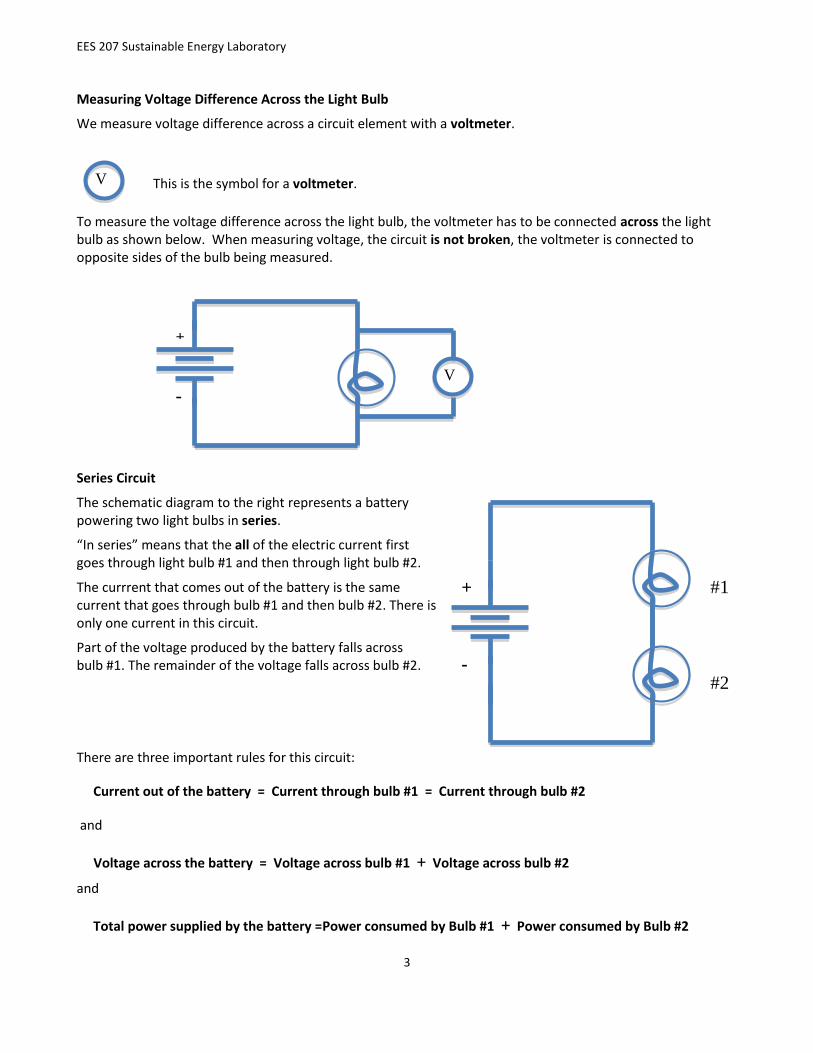
Measuring Voltage Difference Across the Light Bulb
We measure voltage difference across a circuit element with a voltmeter.
To measure the voltage difference across the light bulb, the voltmeter has to be connected across the light bulb as shown below. When measuring voltage, the circuit is not broken, the voltmeter is connected to opposite sides of the bulb being measured.
Series Circuit
The schematic diagram to the right represents a battery powering two light bulbs in series.
“In series” means that the all of the electric current first goes through light bulb #1 and then through light bulb #2.
The currrent that comes out of the battery is the same current that goes through bulb #1 and then bulb #2. There is only one current in this circuit.
Part of the voltage produced by the battery falls across bulb #1. The remainder of the voltage falls across bulb #2.
There are three important rules for this circuit:
Current out of the battery = Current through bulb #1 = Current through bulb #2
and
Voltage across the battery = Voltage across bulb #1 + Voltage across bulb #2
and
Total power supplied by the battery =Power consumed by Bulb #1 + Power consumed by Bulb #2
+
-
V
+
-
#1
#2
V
This is the symbol for a voltmeter.

EES 207 Sustainable Energy Laboratory
4
Parallel Circuit
The schematic diagram below represents a battery powering two light bulbs in parallel.
“In parallel” means that the electric current goes through bulb #1 and bulb #2 at the same time.
The current coming out of the battery splits: part of the current goes through bulb #1. The remainder of the current goes through bulb #2.
There are three important rules for this circuit:
Current out of the battery = Current through bulb #1 + Current through bulb #2
and
Voltage across the battery = Voltage across bulb #1 = Voltage across bulb #2
and
Total power supplied by the battery =Power consumed by Bulb #1 + Power consumed by Bulb #2
+
-
#1 #2

EES 207 Sustainable Energy Laboratory
11/18/2015 8:04 AM
Lab: Basic Electricity
Date:
Name: Lab Meeting Day/Time:
Partners:
Exercise 1. One-Bulb Circuit
Connect one light bulb across the battery power supply so that the bulb lights.
Measure the voltage difference across the bulb and record this value. Be sure to use the correct units.
Voltage Difference =
Measure the current through the bulb and record this value. Be sure to use the correct units.
Remember to break the circuit before you insert the ammeter!
Current =
USE A RULER (!) to carefully draw a schematic diagram that represents the battery, the bulb, the voltmeter, and the ammeter for the one bulb circuit.
Use the measured values of current and voltage to calculate the power consumed by the bulb. Be sure to use the correct units and significant figures. Show your work.
Power =

EES 207 Sustainable Energy Laboratory
2
Exercise 2. Series Circuit
Connect two light bulbs in series across the battery power supply so that both bulbs light.
Make 3 measurements: measure the voltage differences across the battery and across each of the bulbs. Record these three values. Be sure to use the correct units.
Battery Voltage Difference =
Bulb #1 Voltage Difference =
Bulb #2 Voltage Difference =
Using the three measured voltage values, test the rule that the voltage difference across the battery equals the voltage difference across the bulb #1 plus the voltage difference across bulb #2. Be careful with units and significant figures.
Measure the current that comes out of the battery and goes through the bulb #1 and then through bulb #2. Record the value of this current. Be sure to use the correct units. Remember to break the circuit before you insert the ammeter!
Current =
Use the measured values of current and voltage for each of the bulbs to calculate the power consumed by each of the bulbs and the power supplied by the battery. Be careful with units and significant figures.
Power consumed by Bulb #1 =
Power consumed by Bulb #2 =
Total power supplied by the battery =
(Multiply the current through the battery by the voltage difference across the battery)

EES 207 Sustainable Energy Laboratory
3
USE A RULER (!) to carefully draw a schematic diagram that represents the battery, voltmeter, bulbs, and ammeter in a two bulb series circuit. Your diagram should show how you measure the voltage difference across bulb #1 while you simultaneously measure the current in this circuit.
Exercise 3. Parallel Circuit
Connect two light bulb in parallel across the battery power supply so that both bulbs light.
Measure the voltage difference across the battery and record this value.
Voltage Difference =
Measure the current that comes out of the battery, the current that goes through bulb #1 and the current that goes through bulb #2. Record these three current values. Remember to break the circuit before you insert the ammeter to make a measurement! When the ammeter is correctly inserted into the circuit, the circuit should light the bulbs!
Current out of the battery =
Current through bulb #1 =
Current through bulb #2 =
Using the three measured current values, test the rule that the current out of the battery equals the current through bulb #1 plus the current through bulb #2. Be careful with units and significant figures.
EES 207 Sustainable Energy Laboratory
4
Use the measured values of current and voltage for each of the bulbs to calculate the power consumed by each of the bulbs and the power supplied by the battery. Be careful with units and significant figures.
Power consumed by Bulb #1 =
Power consumed by Bulb #2 =
Total power supplied by the battery =
(Multiply the current through the battery by the voltage difference across the battery)
USE A RULER (!) to carefully draw a schematic diagram that represents the battery, voltmeter, bulbs, and ammeter in a parallel circuit. Your diagram should show how you measure the voltage difference across the battery while you simultaneously measure the current through bulb #1.
EES 207 Sustainable Energy Laboratory
11/18/2015 8:17 AM 1
Background: Solar Electric Power
Equipment: Pasco Xplorer GLX data logger, current and voltage probe, solar pyranometer, solar simulator, solar ventilator system, solar cell, small electric motor, ruler
Learning Objectives. This lab will introduce you to solar cells, solar intensity, solar modules, solar power systems, cell efficiency, peak power point, and operating point.
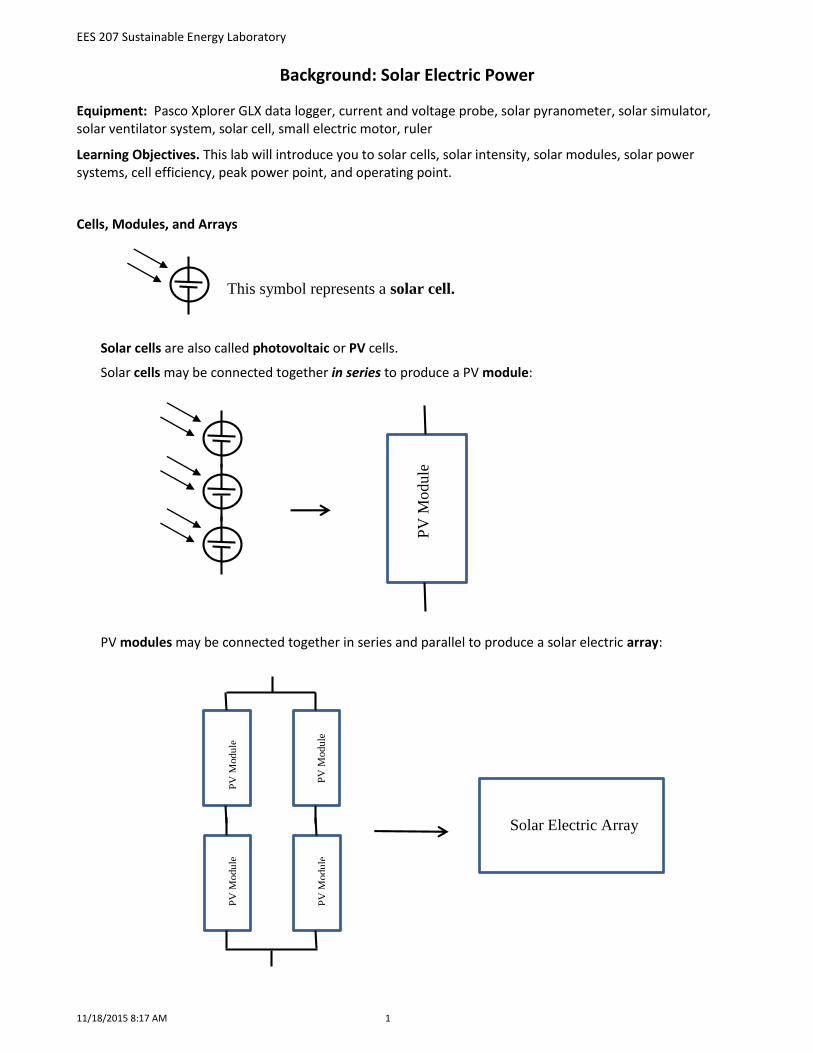
Cells, Modules, and Arrays
Solar cells are also called photovoltaic or PV cells.
Solar cells may be connected together in series to produce a PV module:
PV modules may be connected together in series and parallel to produce a solar electric array:
This symbol represents a solar cell.
PV
Module
PV
Modu
le
PV
Modu
le
PV
Modu
le
PV
Modu
le
Solar Electric Array

EES 207
2
Current-Voltage Curve
Open-Circuit Voltage. If you put a PV cell in bright sunshine with solar intensity equal to 1000 W/m2 and measure the voltage difference across the PV cell, you will measure the cell’s open-circuit voltage. This is the largest voltage difference that the cell produces at this solar intensity.
“Open-circuit” means that the current equals zero.
Short-Circuit Current. If you put a PV cell in bright sunshine with solar intensity equal to 1000 W/m2 and measure the current flowing out of the PV cell, you will measure the cell’s short-circuit current. This is the largest current that the cell produces at this solar intensity.
“Short-circuit” means that the voltage difference across the cell equals zero.
These two points can be placed on a Current vs. Voltage graph, as shown in the figure below. The open-circuit voltage point (with current equal to zero) is on the lower right. The short-circuit current point (with voltage equal to zero) is on the upper left.
Peak Power Point. The point on the upper right is the peak power point. The voltage at this point is the peak power voltage and the current at this point is the peak power current. The product of the peak power voltage and the peak power current is the peak power rating of the cell, the largest power that the cell can produce. The Excel program: PV_Cell, will show you this current-voltage curve.
Operating Point. If we use a PV cell to supply power to a motor or other device, it is most efficient for the system to run at the peak power point, but the operating point may not coincide with the peak power point.
0.00
0.05
0.10
0.15
0.20
0 0.1 0.2 0.3 0.4 0.5 0.6
Cu
rre
nt
Fro
m C
ell
(Am
ps)
Voltage Difference Across Cell (Volts)
Current vs Voltage For a Solar Cell
Measuring open-circuit voltage
V
M
Measuring short-circuit current A
Solar cell supplying power to a motor.
Peak Power Point (Volts x Current = Max Power or Peak Power Rating)
Peak Power Voltage
Peak Power Current Open-Circuit Voltage, Voc (Volts x Current = Zero Power)
Short-Circuit Current, Isc (Volts x Current = Zero Power)
EES 207 Sustainable Energy Laboratory
11/18/2015 8:18 AM
Lab: Solar Electric Power
Date:
Name: Lab Meeting Day/Time:
Partner(s):
Exercise 1. Solar Power System
An ESX-1 PV module is composed of 36 PV cells connected together in series. The peak power rating of each PV cell equals 4.0 W.
Calculate the peak power rating of the ESX-1 PV module. Show this calculation below. Express your answer in Watts.
Peak Power Rating of the ESX-1 PV Module =
A solar PV array for a PV power system is built by connecting together 30 ESX-1 PV modules.
Calculate the peak power rating of the PV array. Show this calculation and result below. Express your answer in Watts and then convert to kW.
Peak Power Rating of PV Array =
The efficiency of the inverter and other elements of the solar power systems is 92.6%.
Calculate the peak power rating of the complete PV power system. Show this calculation and result below. Express your answer in kW.
Peak Power Rating of System =
Assume this PV power system has been erected in Willimantic where the average solar intensity incident on the array is equivalent to 5.0 hours of peak solar intensity per day.
Calculate the electric energy produced by this PV power system during an average day. Show this calculation and result below. Express your answer in kWh.
Electric Energy per Day =
EES 207
2
Exercise 2. Solar Ventilator
For the module used with the solar ventilator, acquire the open-circuit voltage, the short-circuit current, the peak power voltage, and the peak power current.
Use the peak power voltage and the peak power current values to calculate the peak power rating of the module. Record these values and show this calculation below.
Module Open-Circuit Voltage = Module Short-Circuit Current =
Module Peak Power Voltage = Module Peak Power Current =
Module Peak Power Rating (Power Out) =
Count the number of PV cells in the module and determine how they are connected.
Number Cells =
How are the cells connected, in series or parallel?
Do the cell voltages add together?
Do the cell currents add together?
Based on your answers to the previous questions, calculate the open-circuit voltage, the short-circuit current, the peak power voltage, the peak power current, and the peak power rating for a cell in the module. Show your calculations and results below.
Cell Open-Circuit Voltage = Cell Short-Circuit Current =
Cell Peak Power Voltage = Cell Peak Power Current =
Cell Peak Power Rating (Power Out) =
Measure the dimensions of a cell in this module. Use these measurements to calculate the cell area and use this area to calculate cell efficiency. Remember: at peak power, the solar intensity equals 1000 W/m2. Show your work below.
Cell Width (meters) = Cell Height (meters) =
Cell Area (meters2) =
Solar Power Into Cell (Watts) =
Electrical Power Out of Cell (when operating at peak power) =
Power Out Cell Efficiency = ---------------- x 100% = Power In
EES 207
3
Exercise 3. Solar Cell Operating Point
Adjust the height of the light source (the solar simulator) so that the light intensity at the table-top level equals 1000 W/m2 (+/– 50 W/m2). Use the solar pyranometer to measure the light intensity.
Place the solar cell under the light source, at the same position where you used the solar pyranometer. Now measure the open-circuit voltage and short-circuit current. Record these values below.
Open-Circuit Voltage =
Short-Circuit Current =
Open the Excel spreadsheet: PV_Cell.
Enter your open-circuit voltage and the short-circuit current values into the spreadsheet.
Do Not Change These Values After You Enter Them In The Spreadsheet!
The spreadsheet will calculate the peak power current and peak power voltage values and plot the peak power point onto the graph. Type your name and your partner’s name into the spreadsheet
For your team, print one copy of the graph and staple it to one of your worksheets.
Record the peak power current and voltage values below. Use these values to calculate the peak power rating (i.e. the power). Include units and be careful with significant figures.
Peak Power Voltage =
Peak Power Current =
Peak Power Rating =
Connect the PV cell so that it drives the small motor with the spinner.
Measure the operating voltage supplied by the PV cell to run the small motor. Record this value below.
Operating voltage =
Use a ruler to draw a schematic diagram that shows how you measured the voltage supplied by the PV cell to run the small motor.

EES 207
4
Use the chart graphed by the Excel spreadsheet to determine the operating current corresponding to the operating voltage.
Record the operating current and operating voltage below.
Calculate the operating power. Be careful with units and significant figures.
Operating voltage = (From page 3; you measured this number using the voltmeter)
Operating current = (First, find the operating voltage (above) on the x-axis of your graph. Then, note where this value intersects the current-voltage curve. Last, read across to the y-axis to find the operating current.)
Operating power =
Compare the operating power to the peak power. (Write something like: “The operating power equals 80% of the peak power.”)
Does the PV cell with the small motor operate close to the peak power point of the cell?
EES 207 Sustainable Energy Laboratory
11/20/2015 7:32 AM 1
Background: Solar Collector
Equipment: Solar thermal flat plate collector, tape measure
Learning Objectives: This lab will introduce you to flat plate collectors used in solar water-heating systems.
Theory
Solar Energy Intensity
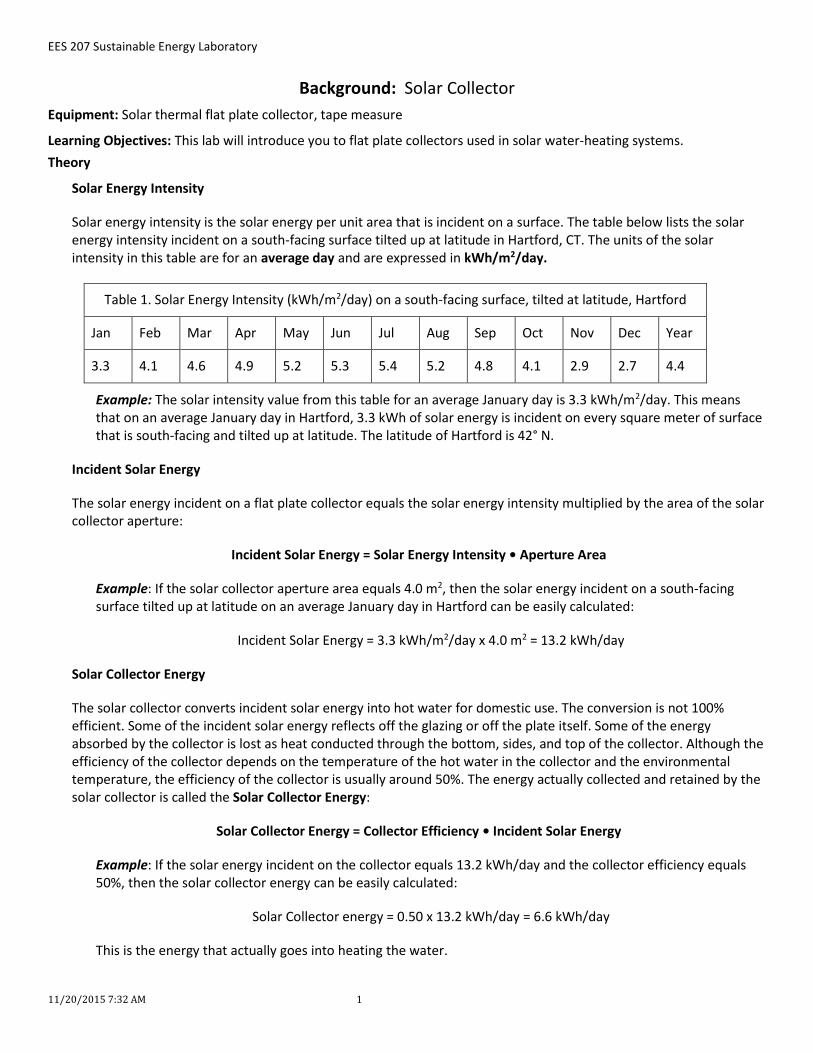
Solar energy intensity is the solar energy per unit area that is incident on a surface. The table below lists the solar energy intensity incident on a south-facing surface tilted up at latitude in Hartford, CT. The units of the solar intensity in this table are for an average day and are expressed in kWh/m2/day.
Example: The solar intensity value from this table for an average January day is 3.3 kWh/m2/day. This means that on an average January day in Hartford, 3.3 kWh of solar energy is incident on every square meter of surface that is south-facing and tilted up at latitude. The latitude of Hartford is 42° N.
Incident Solar Energy
The solar energy incident on a flat plate collector equals the solar energy intensity multiplied by the area of the solar collector aperture:
Incident Solar Energy = Solar Energy Intensity • Aperture Area
Example: If the solar collector aperture area equals 4.0 m2, then the solar energy incident on a south-facing surface tilted up at latitude on an average January day in Hartford can be easily calculated:
Incident Solar Energy = 3.3 kWh/m2/day x 4.0 m2 = 13.2 kWh/day
Solar Collector Energy
The solar collector converts incident solar energy into hot water for domestic use. The conversion is not 100% efficient. Some of the incident solar energy reflects off the glazing or off the plate itself. Some of the energy absorbed by the collector is lost as heat conducted through the bottom, sides, and top of the collector. Although the efficiency of the collector depends on the temperature of the hot water in the collector and the environmental temperature, the efficiency of the collector is usually around 50%. The energy actually collected and retained by the solar collector is called the Solar Collector Energy:
Solar Collector Energy = Collector Efficiency • Incident Solar Energy
Example: If the solar energy incident on the collector equals 13.2 kWh/day and the collector efficiency equals 50%, then the solar collector energy can be easily calculated:
Solar Collector energy = 0.50 x 13.2 kWh/day = 6.6 kWh/day
This is the energy that actually goes into heating the water.
Table 1. Solar Energy Intensity (kWh/m2/day) on a south-facing surface, tilted at latitude, Hartford
Jan Feb Mar Apr May Jun Jul Aug Sep Oct Nov Dec Year
3.3 4.1 4.6 4.9 5.2 5.3 5.4 5.2 4.8 4.1 2.9 2.7 4.4
EES 207 Sustainable Energy Laboratory
2
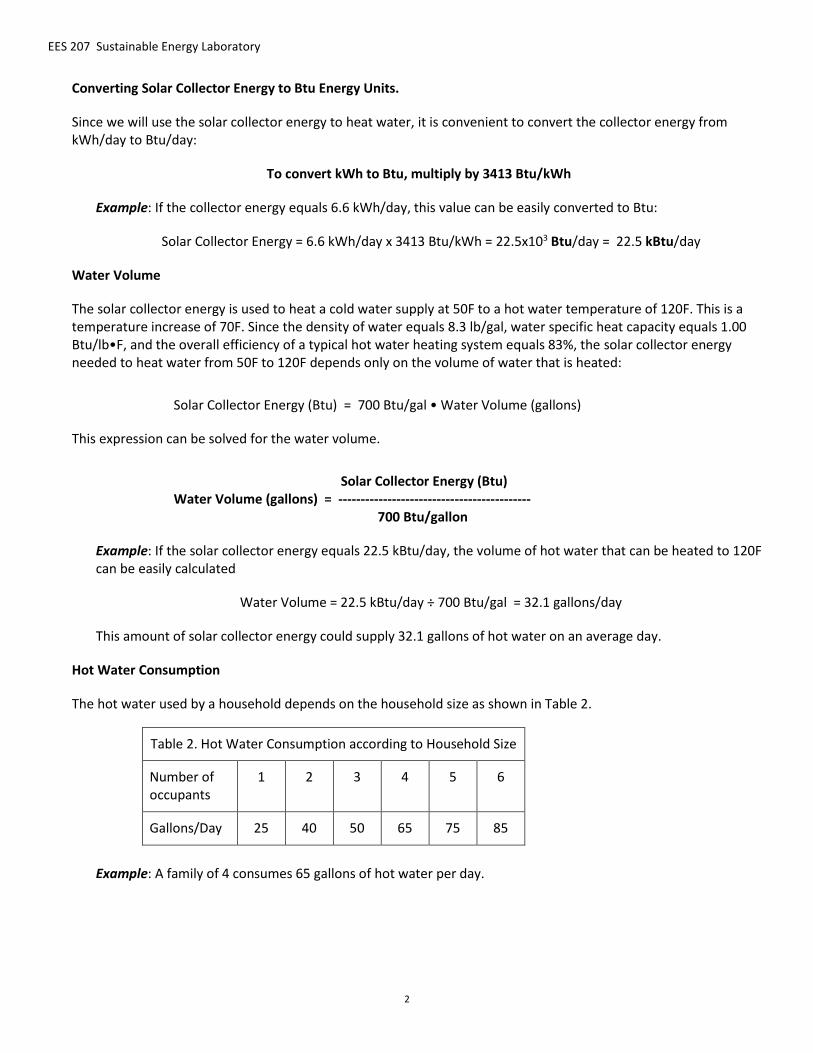
Converting Solar Collector Energy to Btu Energy Units.
Since we will use the solar collector energy to heat water, it is convenient to convert the collector energy from kWh/day to Btu/day:
To convert kWh to Btu, multiply by 3413 Btu/kWh
Example: If the collector energy equals 6.6 kWh/day, this value can be easily converted to Btu:
Solar Collector Energy = 6.6 kWh/day x 3413 Btu/kWh = 22.5x10³ Btu/day = 22.5 kBtu/day
Water Volume
The solar collector energy is used to heat a cold water supply at 50F to a hot water temperature of 120F. This is a temperature increase of 70F. Since the density of water equals 8.3 lb/gal, water specific heat capacity equals 1.00 Btu/lb•F, and the overall efficiency of a typical hot water heating system equals 83%, the solar collector energy needed to heat water from 50F to 120F depends only on the volume of water that is heated:
Solar Collector Energy (Btu) = 700 Btu/gal • Water Volume (gallons)
This expression can be solved for the water volume.
Solar Collector Energy (Btu) Water Volume (gallons) = ------------------------------------------- 700 Btu/gallon
Example: If the solar collector energy equals 22.5 kBtu/day, the volume of hot water that can be heated to 120F can be easily calculated
Water Volume = 22.5 kBtu/day ÷ 700 Btu/gal = 32.1 gallons/day
This amount of solar collector energy could supply 32.1 gallons of hot water on an average day.
Hot Water Consumption
The hot water used by a household depends on the household size as shown in Table 2.
Example: A family of 4 consumes 65 gallons of hot water per day.
Table 2. Hot Water Consumption according to Household Size
Number of occupants
1 2 3 4 5 6
Gallons/Day 25 40 50 65 75 85
EES 207 Sustainable Energy Laboratory
11/20/2015 7:41 AM 1
Lab: Solar Collector
Date:
Name: Lab Meeting Day/Time:
Partners:
Exercise 1. Solar Collector Performance
Using a ruler, make a careful drawing of the front and side of the flat-plate solar thermal collector used in this lab. You should include the flat plate, the glazing, the insulation, the cold water inlet, and the hot water outlet.
Carefully label each of these elements.
Figure 1. Solar Flat Plate Collector
Measure the dimensions of the solar collector aperture (i.e. the flat plate) in inches.
Convert these measurements to feet and record them below.
Length =
Width =
Calculate the area of the collector aperture in feet squared (Ft2); then convert this area to meters squared (m2).
To convert from Ft2 to m2, multiply by 0.0929 m2/Ft2
Area =
EES 207
2
Assume that the collector: will be mounted on a roof in central Connecticut, will face south, and will be tilted up at latitude (42°). Find the appropriate solar energy intensity incident on the collector surface during an average July day. Express in kWh/m2/day.
Solar energy intensity on a July day =
Calculate the solar energy incident on the collector during an average July day. Express in kWh/day.
Incident solar energy on a July day =
Assume the collector efficiency is 60%. Calculate the energy transferred to the hot water that passes through the collector in an average July day. Express the solar collector energy in kWh/day.
Solar Collector Energy on a July day =
Express the collector energy in Btu/day.
Solar Collector Energy on a July day =
Calculate the volume of hot water that could be heated from 50F to 120F by the solar collector energy produced by the solar collector on an average July day. Express your answer in gallons/day.
Volume of hot water produced on a July day =
Calculate the number of these solar collectors that would be required to provide all the hot water needed by a family of four on an average July day. Note: You can’t buy a fraction of a collector and it’s better to have too little collector area rather than too much collector area.
Number of solar collectors required =
Explain why this solar water-heating system would not provide all the hot water needed by the family in December.

EES 207 Sustainable Energy Laboratory
11/27/2015 7:17 AM
Background: R-Value and Heat Loss
Equipment: Insulated Box, light bulb, 2 temperature probes, power meter, data logger
Learning Objectives: This lab will introduce you to the concepts of R-value and heat loss.
Theory:
Heat Loss Rate. The rate of heat loss, Q, through a wall may be easily calculated:
A ∙ T Q = ---------- (1) R
where
Q = heat loss rate through the wall, expressed in Btu per hour
A = area of the wall, expressed in square feet (Ft2)
T = (inside temperature minus outside temperature), expressed in degrees Fahrenheit (°F)
R = the “R-value” of the wall
Heat Loss. Heat Loss = heat loss rate ∙ time = Q ∙ time
Insulated Box. If a small heater is put inside an insulated and sealed box, the temperature inside the box will rise. However, the temperature will stop increasing when the heat loss rate through the walls of the box, Q, equals the rate at which heat is generated inside the box (i.e. the power (P) used by the heater). When this situation occurs, P = Q, and the heat loss equation may be rewritten as:
A ∙ T P = ---------- R
This equation can be solved for the R-value:
A ∙ T R = ---------- (2) P
where
P = the power used by the heater to heat the box, expressed in Btu per hour
A = inside surface area of the 6 walls of the box, expressed in square feet (ft2)
T = (inside temperature minus outside temperature), expressed in degrees Fahrenheit (°F)
R = the “R-value” of the walls of the box
We will use Equation 2 to measure the R-value of the foam insulation used as the walls of a box.
Conversions
To convert from Watt to Btu/hour multiply by 3.413 Btu/hour per Watt
To convert from Btu/hour to Watt multiply by 0.293 Watt per Btu/hour
EES 207 Sustainable Energy Laboratory
11/27/2015 7:24 AM 1
Lab: R-Value and Heat Loss
Date:
Name: Lab Meeting Day/Time:
Partners:
Exercise 1. Measuring R-Value
Use a ruler to carefully draw the apparatus used to measure the R-value of the foam insulation. Include the box, the light bulb heater, the two temperature probes, the Xplorer data logger, and the power meter.
Carefully label each of these elements.
Figure 1. Apparatus used to measure R-value of insulation
Turn on the heater inside the box
Allow the inside temperature to reach its maximum value.
Measure and record the inside temperature and the outside temperature in degrees Fahrenheit.
Calculate T, the difference between the inside temperature and the outside temperature.
Inside temperature =
Outside temperature =
T =
EES 207 Sustainable Energy Laboratory
2
Measure the power used by the heater in Watts.
Convert the power in Watts to Btu/hour. Show units and show all your calculations.
P (in Watts) =
P (in Btu/hour) =
Measure the three dimensions of the box interior. Measure in inches and then divide by 12 inches/foot to express the dimensions in feet.
Calculate the area of each of the 6 walls of the box in square feet (ft2).
Sum the 6 areas to get the total area in square feet (ft2).
Total Area =
Use Equation 2 (on the background sheet) to calculate the R-value.
Include the correct units for the R-value
R =
Compare the measured R-value to the standard R-value. Calculate the difference between the measured value and the standard value and calculate the difference as a fraction (expressed as a percent) of the standard value (e.g. 5%).
EES 207 Sustainable Energy Laboratory
3
Exercise 2. Measuring Heat Loss
In this exercise, you will measure the heat loss through the south wall and south-facing windows of the laboratory. We will use the heat loss rate equation to calculate the heat loss rate:
A ∙ T Q = ---------- R
Windows. First we will measure the heat loss rate through the south-facing windows.
The R-value for the windows equals 3.0 Ft2∙°F / Btu/hour (R = 3).
Measure the dimensions of the windows in feet and use these measurements to calculate the total area of the windows. Express this area in square feet (ft2).
Total area of south-facing windows =
Measure and record the room temperature and the outdoor temperature in degrees Fahrenheit.
Calculate T.
Room temperature =
Outdoor temperature =
T =
Calculate the heat loss rate through the windows in Btu/hour.
Qwindows =
Express the heat loss rate through the windows in Watts.
Qwindows =
Walls. Now we will measure the heat loss rate through the south-facing wall.
The R-value for the wall equals 39 ft2∙°F / Btu/hour (R-39).
Measure the dimensions of the total south side of the room in feet and use these measurements to calculate the total south side area in ft2. (Note: South side = south wall + all south windows)
Subtract the area of all the windows from the total south side area to determine the south wall area in ft2.

EES 207 Sustainable Energy Laboratory
4
Area of south wall =
Calculate the heat loss rate through the south wall in Btu/hour.
Qwall =
Express the heat loss rate through the wall in Watts.
Qwall =
Discussion
Calculate the total heat loss rate through the south side of the room in Watts
Qtotal =
Calculate the fraction of the total heat loss that goes through the windows. Write your answer as a percent (%).
Window fraction =
If the current heat loss rate didn’t change for a full day (24 hours), calculate the corresponding heat loss though
the south side of the room during that full day. Express your answer in kWh.
Heat Loss =
EES 207 Sustainable Energy Laboratory
11/27/2015 10:29 AM 1
Background: Heat Capacity
Equipment: Coffee pot, temperature probes, power meter, data logger
Learning Objectives: You will learn about specific heat capacity, measure the heat capacity of water, compare measured values to standard values, and use the heat capacity of water to calculate the energy required to heat water.
Theory:
Specific Heat Capacity
The specific heat capacity of a substance is defined by the equation below
Heat Energy C = --------------------------- M • ∆T
Where: M = the mass of the substance Heat = the heat energy added to the mass ∆T = the change in temperature of the mass
The units of specific heat capacity are: J/gm∙°C or Btu/lb∙°F.
For example, the specific heat capacity of aluminum is 0.902 J/gm∙°C.
The following conversion factor will be useful:
To convert J/gm∙°C to Btu/lb∙°F multiply by 0.239 (Btu/lb∙°F)/(J/gm∙°C)
The heat energy needed to raise the temperature of an object depends on the specific heat capacity:
Heat Energy = M ∙ C ∙ ∆T
For example, the heat energy required to heat 200 grams of aluminum from 20°C to 50°C equals
200 gm x 0.902 J/gm∙°C x 30 °C = 5,412 J = 5.41 kJ
Comparing a measured value to a standard
The simplest way to compare a measured value to the standard is to calculate the percent difference:
Measured - Standard Percent difference = -------------------------------- x 100%
Standard
For example, if the known distance to Hartford is 30 miles and we measure the distance to be 27 miles, then the percent difference is ((27 miles – 30 miles) ÷ 30 miles) x 100% = -10%. So our measurement is 10% less than the standard distance.

EES 207
2
Heat Capacity of Water
In today’s lab exercise we will measure the heat capacity of water.
The standard value for the heat capacity of water is 4.19 J/gm∙°C or 4.186 x 0.239 = 1.00 Btu/lb∙°F.
Energy and Power (Remember: Energy and Power are related to each other by time! See below.)
Watt = Joule/second
and
Joule = Watt ∙ second = W∙s = J
For example, a 100 Watt light bulb that is on for 1 minute (60 seconds) consumes
100 Watts x 60 seconds = 6000 Joules = 6.00 x 10³ Joules = 6.00 kJ
Density of Water
The density of water is 1000 gm/L or 8.3 lb/gallon.
For example, 10 gallons of water has a mass equal to 8.3 lb/gallon x 10 gallons = 83 lb.
EES 207 Sustainable Energy Laboratory
11/27/2015 10:30 AM 1
Lab: Heat Capacity
Date:
Name: Lab Meeting Day/Time:
Partners:
Exercise 1. Measuring Heat Capacity
Using a ruler, make a careful drawing of the apparatus used to measure the heat capacity of water. Include the coffee pot, the water, the two temperature probes, the Xplorer data logger, and the power meter.
Carefully label each of these elements.
Apparatus used to measure heat capacity of water
Record the mass of the water in the coffee pot. Express this value in grams (gm).
Mass =
Record the initial temperature of the water in the coffee pot. Express this value in °C.
Initial Temperature =
Turn on the coffee pot heater (and begin timing how long the coffee pot is on).

EES 207 Sustainable Energy Laboratory
11/27/2015 10:30 AM 2
Record the power used to heat the water in the coffee pot. Express this value in Watts.
Power =
Record the temperature of the water in the coffee pot after 300 seconds (5 minutes) with the heater on. Express this value in °C.
Final Temperature =
Calculate the change in temperature (∆T) of the water. Express this value in °C.
∆T =
Calculate the heat energy generated by the heater in the coffee pot during 300 seconds. Express this value in Joules (J). Hint: Energy = Power ∙ time. Thus, Joule = Watt ∙ second (Be careful with units, significant figures and powers of ten.)
Heat Energy =
Use the water mass value, the value of ∆T, and the value of heat energy to calculate the heat capacity value for the water in the coffee pot. Express the heat capacity in J/gm∙°C units.
Heat Capacity =
Express the heat capacity in Btu/lb∙°F units.
Heat Capacity =
Compare the measured heat capacity to the standard heat capacity value using English units.
The standard specific heat capacity value for water = The measured heat capacity value is within ______________ % of the standard value.

EES 207 Sustainable Energy Laboratory
11/27/2015 10:30 AM 3
Exercise 2. Water Heater
A typical residential electrical hot water heater holds 40 gallons of water. Calculate the corresponding mass of water in pounds. Hint: The density of water equals 8.3 lb/gallon. Use English units.
Mass of water in a 40 gallon water heater =
Calculate the heat energy in Btus that is required to heat the water in the water tank from ground water temperature (50°F) to hot water temperature (120°F). Hint: Heat Energy = M ∙ C ∙ ∆T. Use the standard specific heat capacity value.
(Be careful with units, significant figures and powers of ten.)
Heat Energy (Btu) =
An electric water heater uses electricity to heat the water in the hot water tank. Express the Heat Energy value in terms of kWh. (Be careful with units, significant figures and powers of ten.)
Heat Energy (kWh) =
Calculate the electrical energy required to heat the water in the hot water tank. The overall efficiency of a typical hot water heater is about 0.80 (80%).
Hint: heat energy = efficiency ∙ electrical energy. So, electric energy = heat energy ÷ efficiency.
(Be careful with units, significant figures and powers of ten.)
Electrical Energy (kWh) =
EES 207 Sustainable Energy Laboratory
11/27/2015 10:44 AM 1
Background: Cooling Rate
Equipment: Coffee pot, temperature probes, data loggers, insulated cups, Microsoft Excel.
Learning Objectives: In this lab exercise you will measure the temperature of hot water in an insulated cup, use those measurements to determine the cooling rate of the water in the cup, and use the cooling rate to calculate the heat loss rate from the water. In the process you will be introduced to computer graphing, linear fit, and heat loss rate.
Heat Loss Rate and Cooling Rate
A hot object cools by losing heat energy. The relationship between heat loss rate from the object and the cooling rate of the object is described by Equation 1:
Heat Loss Rate = M ∙ C ∙ Cooling Rate (1)
where Heat Loss Rate (i.e., power)= rate of heat (energy) loss from the object, measured in Watts
Cooling Rate = rate of temperature decrease of the object, measured in °C/second
M = mass of the object, measured in grams
C = specific heat capacity of the object, measured in J/g∙°C
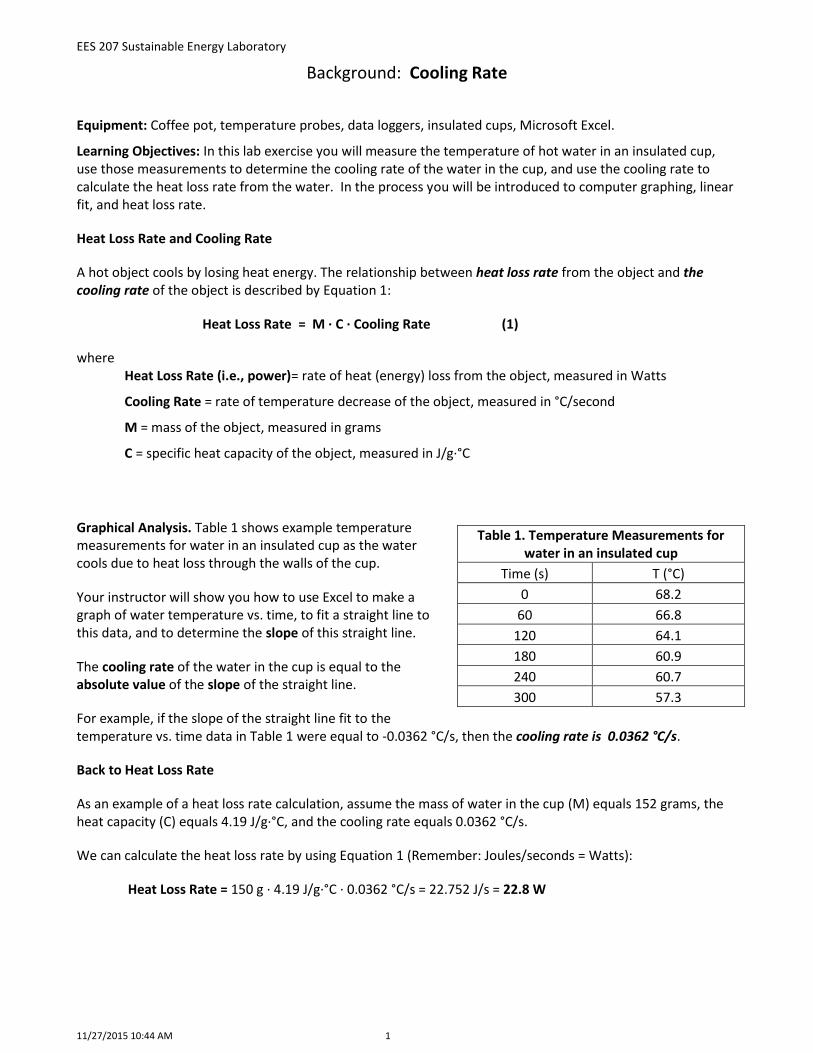
Graphical Analysis. Table 1 shows example temperature measurements for water in an insulated cup as the water cools due to heat loss through the walls of the cup.
Your instructor will show you how to use Excel to make a graph of water temperature vs. time, to fit a straight line to this data, and to determine the slope of this straight line.
The cooling rate of the water in the cup is equal to the absolute value of the slope of the straight line.
For example, if the slope of the straight line fit to the temperature vs. time data in Table 1 were equal to -0.0362 °C/s, then the cooling rate is 0.0362 °C/s.
Back to Heat Loss Rate
As an example of a heat loss rate calculation, assume the mass of water in the cup (M) equals 152 grams, the heat capacity (C) equals 4.19 J/g∙°C, and the cooling rate equals 0.0362 °C/s.
We can calculate the heat loss rate by using Equation 1 (Remember: Joules/seconds = Watts):
Heat Loss Rate = 150 g ∙ 4.19 J/g∙°C ∙ 0.0362 °C/s = 22.752 J/s = 22.8 W
Table 1. Temperature Measurements for water in an insulated cup
Time (s) T (°C)
0 68.2
60 66.8
120 64.1
180 60.9
240 60.7
300 57.3

EES 207 Sustainable Energy Laboratory
11/27/2015 10:42 AM 1
Lab: Cooling Rate
Date:
Name: Lab Meeting Day/Time:
Partners:
Exercise 1. Cooling rate
In this experiment, you will measure the cooling rate of hot water in an insulated cup.
Measure and record the mass in grams (g) of your empty cup. Be sure the lid is on the cup.
Mass of empty cup (with lid) =
Add hot water to your cup. The water temperature should be greater than 70°C.
Measure and record the mass in grams (g) of your cup plus water. Be sure the lid is on the cup.
Subtract the mass of the empty cup (with lid) to determine the mass of hot water in your cup.
Express these values in grams (g). Be careful with significant figures.
Mass of cup plus hot water (with lid) =
Mass of hot water in the cup =
Measure and record the temperature of the hot water in your cup in Table 1.
Take a reading every 60 seconds (every minute).
Enter these temperature values into the table in the Excel spreadsheet “Cooling_Rate”.
Excel will display a chart with a plot of temperature vs. time.
Add a linear trendline to the chart.
Choose to display the equation and the R-squared value.
In the space below write the equation for the trendline.
Write Temp. in place of y and time in place of x.
Include units with the numerical values. Be careful with significant figures.
Table 1. Temperature of Water in the Insulated
Cup
Time (s) T (oC)
0
60
120
180
240
300
EES 207
2
Write the value for the slope of the straight line fit to the data.
Include units and sign. Be careful with significant figures
Slope of the straight line fit to the data =
Write the cooling rate value for the water in the insulated cup.
Include units. Be careful with significant figures
Cooling Rate =
Write the R-squared value for the linear trendline.
R2 =
Explain the meaning and significance of the R2 value.
Exercise 2. Heat Loss Rate
Use your measured value for the mass of water in the cup, the standard value for the specific heat of water, and the cooling rate value to calculate the rate of heat loss (the heat loss rate) from the water in the cup.
Show your work.
Express the heat loss rate in Watts.
Include units and be careful with significant figures.
Heat Loss Rate =
Type your name and the name of your partner into your Excel chart.
For your team, print one copy of the graph and staple it to one of your worksheets.

EES 207 Sustainable Energy Laboratory
11/18/2015 7:49 AM 1
Shower Time
Name: _______________________________ Lab Meeting Day/Time:_______
Complete this lab at home and bring it back to your next lab meeting.
Show all math and be prepared to share your results with your classmates
Learning Objectives. You will learn how to reduce the energy you use while taking a shower.
Background Information: In this lab, you will measure the energy that is consumed to heat your shower water. The energy needed to heat the water in your shower can be calculated by using this familiar equation:
Heat Energy = Mass ∙ C ∙ ∆T = Volume ∙ Density ∙ C ∙ ∆T (Equation 1)
We heat shower water from ground temperature (~50°F) to a comfortable shower temperature (100°F); so, ∆T = 50°F. Density = 8.3 lb/gallon and C = 1.00 Btu/lbs∙F. Thus, equation 1 can be written as:
Flow Rate ∙ Shower Time ∙ Heat Capacity ∙ 50°F Shower Energy = -----------------------------------------------------------------
Hot Water Heater Efficiency
Using 8.34 Btu/gal∙F for heat capacity and 83% for heater efficiency, the equation reduces to:
Shower Energy = 500 Btu/gal ∙ Flow Rate ∙ Shower Time (Equation 2)
Exercise 1. Shower Energy
The next time you take a shower, use the following procedure to measure the energy needed to heat your shower water. You will need a stopwatch and a gallon container (a zip-lock bag).
Get in the shower and adjust the water flow rate.
Place the gallon zip-lock bag over the shower head so the bag captures all the shower water.
Measure and record the time in seconds it takes to fill the zip-lock bag with one gallon of water.
Fill Time = ___________________ (seconds)
Express the fill time in minutes by dividing the value in seconds by 60.
Fill Time = ____________________( minutes)
Calculate the shower’s water flow rate by dividing 1 gallon by the fill time in minutes.
Flow Rate = __________________ (gallons per minute)
Measure the duration of your normal shower (shower time) in seconds, convert to decimal minutes.
Shower Time = ________________(minutes)
Use your values of Shower Time and Flow Rate with Equation 2 to calculate Shower Energy, the energy used to heat the water for your shower. Express your answer in Btus.
Shower Energy = __________________ (use Btus)
EES 207 Sustainable Energy Laboratory
2
Exercise 2. Energy Conservation
The next time you take a shower, reduce the flow rate and the duration of the shower. Then recalculate the energy used to heat the shower water.
Fill Time = ______________________ (record seconds)
Fill Time = ________________________(converted to minutes)
Flow Rate = ______________________ (calculate gallons per minute)
Shower Time = ___________________ (record seconds, then convert to decimal minutes)
Shower Energy = __________________ (use BTUs)
Calculate the shower energy saved by subtracting the energy used during your second shower (in which you decreased the flow rate and shower time) from the energy used during your first shower.
Reduction in Shower Energy = ________________________________________________ (use Btus)
Estimate the number of showers you take each year.
Showers per year = ______________________
Assume that for the next year, you will take showers with the reduced flow rate and reduced shower time, calculate the reduction in shower energy for a year. Then, divide your answer by 1 million to express your result in millions of Btu (MMBtu) units.
Annual Reduction in Shower Energy = _____________________________________________ (MMBtus)
The cost of heating water is about $60 per MMBtu.
Calculate the annual cost savings corresponding to this reduction in shower energy.
Annual Cost Savings = ________________________________________________ (use $)
EES 207 Sustainable Energy Laboratory
11/24/2015 12:04 PM
Background: Lighting Energy
Equipment: Incandescent bulb, compact fluorescent bulb, LED bulb, light meter, power meter, and photometric sensor.
Learning Objectives
This lab will introduce you to illuminance, lux unit, lighting efficiency, and daylighting. The lab will also reinforce your skills in using power meters, light meters, and energy calculations.
Photometric Measurement
This week we will use the light meter with a different sensor: a photometric sensor. The photometric sensor has the same spectral response as the human eye and will measure the brightness of light in terms of its perceived brightness to the human eye. We call this brightness measurement the illuminance and the unit of illuminance is the lux. Photometric sensors are used to measure lighting conditions where the eye is the primary receiver, such as illumination of work areas, interior lighting, television screens, etc.
The lux is the photometric equivalent of W/m2 , a unit that we have used in several lab exercises.
Be sure that your light meter has been set to display the illuminance in lux units.
Lighting Energy Intensity
In this lab, we define “lighting energy intensity” of a light bulb as the ratio of the power consumed by the bulb to the illuminance produced by the bulb on the desktop:
Power (in Watt) Lighting Energy Intensity (in Watt/Lux) = --------------------------- Illuminance (in lux)
This ratio tells us how much electric power is required to produce a certain level of lighting.
Note: This is a non-standard measure of lighting efficiency and is only useful for comparing two bulbs located at the same distance from the desktop.
Illuminance Correction
Since illuminance from the windows or the room lights may contribute to the total illuminance on the desktop, it is necessary to “correct” our measurements. We do this by measuring the illuminance due to the background light and subtracting it from the illuminance measured under the light bulb; this gives us the illuminance for the bulb alone. We call the result of this subtraction the “corrected” illuminance.
EES 207 Sustainable Energy Laboratory
11/24/2015 12:06 PM 1
Lighting Energy
Date:
Name: Lab Meeting Day/Time:
Partners:
Exercise 1. Lighting Efficiency Comparison
Begin this lab by shutting off all the room lights and closing the blinds ! Incandescent Bulb
Use the Kill-A-Watt to measure the power (in Watts) used by the incandescent bulb.
Power used by incandescent bulb =
Use the light meter to measure the illuminance (in lux) under the incandescent bulb with the power on.
Use the light meter to measure the illuminance (in lux) under the incandescent bulb with the power off.
Calculate the corrected illuminance (power on value minus power off value), expressed in lux.
Illuminance under incandescent bulb with power on =
Illuminance under incandescent bulb with power off =
Corrected illuminance under incandescent bulb =
Calculate the energy intensity (in Watt/lux) for the incandescent bulb as the ratio of the power consumed by the bulb to the corrected illuminance
Energy Intensity for incandescent bulb =
EES 207 Sustainable Energy Laboratory
2
Compact Fluorescent Bulb
Use the Kill-A-Watt to measure the power (in Watts) used by the compact fluorescent light (CFL) bulb.
Power used by CFL bulb =
Use the light meter to measure the illuminance (in lux) under the CFL bulb with the power on.
Use the light meter to measure the illuminance (in lux) under the CFL bulb with the power off.
Calculate the corrected illuminance (power on value minus power off value), expressed in lux.
Illuminance under CFL bulb with power on =
Illuminance under CFL bulb with power off =
Corrected illuminance under CFL bulb =
Calculate the energy intensity (in Watt/lux) for the CFL bulb as the ratio of the power consumed by the bulb to the corrected illuminance
Energy Intensity for CFL bulb =
LED Bulb
Use the Kill-A-Watt to measure the power (in Watts) used by the LED bulb.
Power used by LED bulb =
Use the light meter to measure the illuminance (in lux) under the LED bulb with the power on.
Use the light meter to measure the illuminance (in lux) under the LED bulb with the power off.
Calculate the corrected illuminance (power on value minus power off value), expressed in lux.
Illuminance under LED bulb with power on =
Illuminance under LED bulb with power off =
Corrected illuminance under LED bulb =

EES 207 Sustainable Energy Laboratory
3
Calculate the energy intensity (in Watt/lux) for the LED bulb as the ratio of the power consumed by the bulb to the corrected illuminance
Energy Intensity for LED bulb =
Comparison
Enter the energy intensity values into Table 1.
Calculate the energy intensity ratio by dividing the energy intensity of the incandescent bulb by the energy intensity of the CFL bulb. Repeat this calculation using the energy intensity of the LED bulb. Enter these values into Table 1 below.
Table 1. Energy Intensity Comparison for Three Light Bulbs
Incandescent Bulb Compact Fluorescent LED
Energy Intensity
Energy Intensity Ratio 1
Which of the three bulbs will uses the most energy to produce lighting? Which uses the least?
Exercise 2. Lights and Daylighting
Measure the illuminance level (in lux) in the lab with all the room lights off and all the blinds closed.
Turn all the lights on and measure the illuminance level.
Subtract the off value from the on value to determine the lighting value due to the room lights.
Illuminance level with all lights off and blinds closed =
Illuminance level with all lights on and blinds closed =
Illuminance level due to the room lights =
EES 207 Sustainable Energy Laboratory
4
Measure the illuminance level (in lux) in the lab with all the room lights off and all the blinds open.
Illuminance level with all lights off and blinds open =
Describe how the illuminance level with daylighting alone compares to the illuminance level with the room lights alone. Does your data indicate that daylighting could replace electric lighting during some hours of the day in this room?
Exercise 3. Lighting Energy
The laboratory lighting fixtures are called luminaires. There are four high-efficiency 25 W T-5 fluorescent bulbs in each luminaire; so, each fixture uses 100 W of electric power.
How many luminaires are installed in this lab?
Number of luminaires =
Calculate the electrical power used by all the luminaires in the lab. Express your answer in Watts (W).
Total power of lab lighting =
Assuming these lights (both rows) are on 8 hours per day, 5 days per week, 30 weeks per year, calculate the annual lighting energy used in this lab and calculate the cost of that lighting assuming electricity costs the university $0.15/kWh. Express your answer in $.
Cost of annual lighting energy used in this lab =

EES 207 Sustainable Energy Laboratory
11/27/2015 8:39 AM 1
Background: Wind Power
Equipment: Model Wind Turbine, Xplorer, wind probe, two digital multimeters, fan, electric load (motor), ruler
Learning Objectives: You will learn about wind power and wind turbine efficiency.
Background
Wind Power Density. The power of the wind is expressed by the wind power density. The wind power density is similar to solar intensity and like solar intensity, it is measured in Watts per square meter (W/m2). As shown in the Wind Power Density graph, the wind power density is a strong function of wind speed: it is proportional to the wind speed cubed.
You can use this graph to determine the wind power density for any wind speed.
Example 1. Determine the wind power density corresponding to wind speed equal to 9.0 mph. Using the Wind Power Density graph, the wind power density corresponding to 9.0 mph is 40.0 W/m2.
Wind Turbine Area. The area swept out by the blades of the turbine equals the area of a circle with radius r, where r is the distance from the tip of the turbine blade to the center point of rotation. The distance r is equal to ½ the diameter of a circle swept out by the blades. The equation for the area of a circle is:
Area = r2
Example 2. If the length of a turbine blade equals 2.00 m, then the swept out area can be easily calculated:
Area = (3.14) x (2.00 m)2 = (3.14) x (4.00 m2) = 12.6 m2
0
20
40
60
80
100
120
140
160
180
200
0 5 10 15
Win
d P
ow
er
De
nsi
ty (
W/m
2)
Wind Speed (mph)
Wind Power Density
EES 207 Sustainable Energy Laboratory
2
Power input. The power input (Pin) into a wind turbine equals the product of the wind power density and the area swept out by the wind turbine blades:
Pin = (Area, m2) x (Wind Power Density, W/m2)
Example 3. If the area swept out by the turbine blades equals 12.6 m2 and the wind power density equals 40.0 W/m2. Then the power input can be easily calculated:
Pin = (12.6 m2) x (40.0 W/m2) = 503 W
Power Output. The power output (Pout ) from a wind turbine is the mechanical or electric power produced by the wind turbine.
Pout (Watts) = Current (amps) x Voltage (volts)
Example 4. The wind turbine illustrated in the previous examples produces 151 Watts of electric power; so, Pout = 151 W
Efficiency. The efficiency of a wind turbine is the ratio of the power output to the power input.
Pout efficiency = ------- x 100% Pin
The maximum theoretical efficiency for a wind power system is 59%. This is called the Betz limit.
Example 5. If the input power to a wind turbine is 503 W (Pin = 503 W) and the output power from a wind turbines is 151 W (Pout = 151 W), then the efficiency can be easily calculated:
efficiency = (151 W / 503 W) x 100% = 30.0 %
Circuit Symbol. Use the following for symbol to represent Wind Turbines in schematic diagrams.
EES 207 Sustainable Energy Laboratory
6/9/2016 11:23 AM 1
Wind Power
Date:
Name: Lab Meeting Day/Time:
Partners:
Exercise 1. Wind Speed and Wind Power Density
Turn the fan on.
Attach the wind speed probe to the data logger.
Select the measurement unit for wind speed to be mph (miles per hour).
Using the wind speed sensor with the data logger, measure the wind speed at the following 4 points:
1 10 cm to the right of the rotation axis
2 10 cm to the left of the rotation axis
3 10 cm above the rotation axis
4 10 cm below the rotation axis.
Record these values below and then calculate the average value of these 4 wind speed values. This spatially averaged value represents the wind speed input to the wind turbine.
Record the 4 wind speed measurements in mph. Include units, show your math, and be careful with significant figures.
1.
2.
3.
4.
Wind speed input (average of 4 values) =
Use the Wind Power Density graph to determine the wind power density corresponding to the wind speed input to the wind turbine. Write that value below. Include units and be careful with significant figures.
Wind Power Density =
This result represents the power that the wind has at the location of the wind turbine.
EES 207 Sustainable Energy Laboratory
2
Exercise 2. Power Input
Turn the fan off.
Measure the length of each of the three blades, measured from the rotation axis to the tip of the blade. Express these lengths in meters. Then calculate the average of these three values.
Use the average blade length value to calculate the area swept out by the turbine blades.
Record these measurements and calculation results below.
Record the 3 blade length measurements. Express in meters and be careful with significant figures.
1.
2.
3.
Average blade length =
Area swept out by turbine blades =
(Show your calculation and include units. Be careful with significant figures.)
Use the area swept out by the turbine blades and the wind power density to calculate the Power Input, Pin , to the turbine.
Pin =
(Show your calculation and include units. Be careful with significant figures.)
This result represents the actual wind power input (Pin) into the model wind turbine.

EES 207 Sustainable Energy Laboratory
3
Exercise 3. Power Output
Turn the fan on.
Attach the electric load (motor) to the output wires from the wind turbine generator.
Attach the data logger so that it measures the voltage output from the wind turbine and the current flowing out of the turbine into the load.
Draw a circuit schematic showing the wind turbine, the electric load, the voltmeter, and the ammeter. Hint: look at the background sheet for the Basic Electricity lab.
Use a ruler to draw a neat schematic diagram.
Have your instructor check your circuit and your schematic diagram.
Do not proceed until your instructor has checked this circuit.
Measure the output voltage and current.
From these values calculate the power output of the wind turbine.
Voltage out =
Current out =
Pout =
(Show calculation, include units, and be careful with significant figures.)

EES 207 Sustainable Energy Laboratory
4
Exercise 4. Efficiency
Use the value of power output that you measured in Exercise 3 and the value of power input that you measured in Exercise 1 to calculate the turbine efficiency.
Pout =
Pin =
Efficiency =
(Show all calculations, include units and be careful with significant figures. Express efficiency as a percent.)
Exercise 5. Efficiency of a Real Wind Turbine
Real wind turbines are much more efficient than our model turbine.
The real wind turbine available in the lab (Southwest AIR-X) produces 20.0 watts of output power when the wind speed equals 14.0 mph.
After making an appropriate measurement of the wind turbine dimensions, use this data to calculate the efficiency of this wind turbine.
Show your work below. Include units and be careful with significant figures.
AIR-X Turbine
Wind Speed Input =
Wind Power Density =
Blade Length =
Area =
Pin =
Pout =
Efficiency =
EES 207 Sustainable Energy Laboratory
11/27/2015 9:09 AM 1
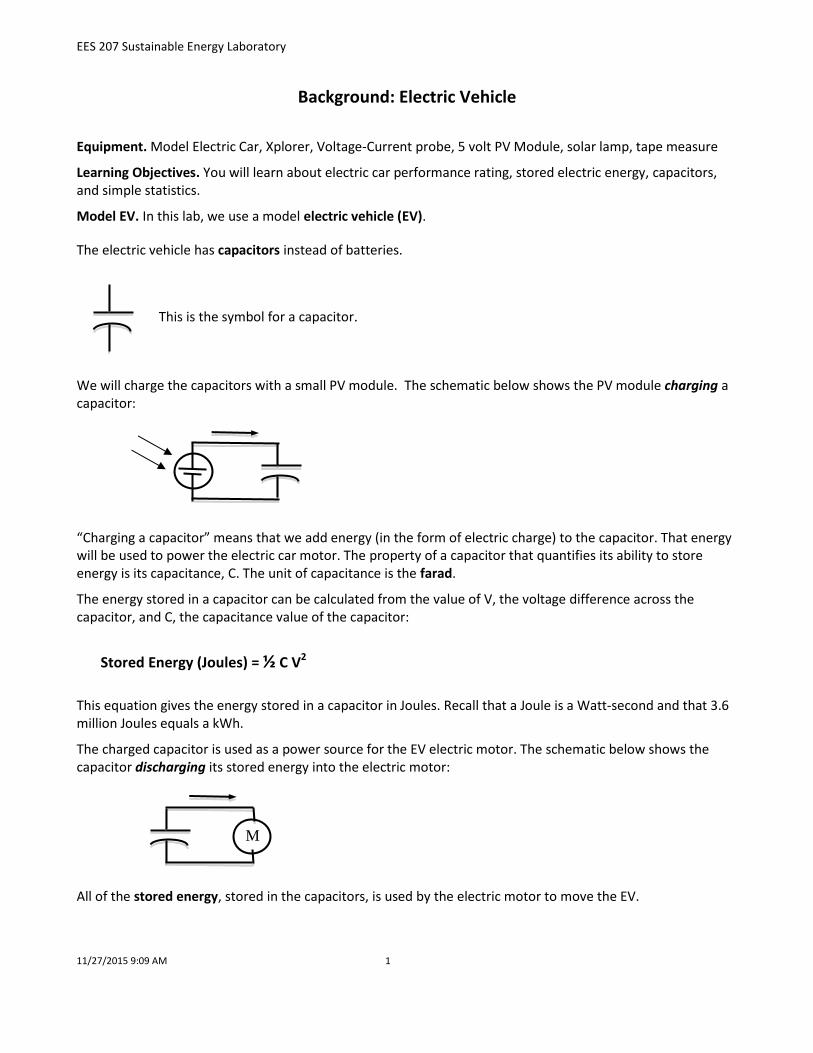
Background: Electric Vehicle
Equipment. Model Electric Car, Xplorer, Voltage-Current probe, 5 volt PV Module, solar lamp, tape measure
Learning Objectives. You will learn about electric car performance rating, stored electric energy, capacitors, and simple statistics.
Model EV. In this lab, we use a model electric vehicle (EV).
The electric vehicle has capacitors instead of batteries.
We will charge the capacitors with a small PV module. The schematic below shows the PV module charging a capacitor:
“Charging a capacitor” means that we add energy (in the form of electric charge) to the capacitor. That energy will be used to power the electric car motor. The property of a capacitor that quantifies its ability to store energy is its capacitance, C. The unit of capacitance is the farad.
The energy stored in a capacitor can be calculated from the value of V, the voltage difference across the capacitor, and C, the capacitance value of the capacitor:
Stored Energy (Joules) = ½ C V2
This equation gives the energy stored in a capacitor in Joules. Recall that a Joule is a Watt-second and that 3.6 million Joules equals a kWh.
The charged capacitor is used as a power source for the EV electric motor. The schematic below shows the capacitor discharging its stored energy into the electric motor:
All of the stored energy, stored in the capacitors, is used by the electric motor to move the EV.
This is the symbol for a capacitor.
M
EES 207 Sustainable Energy Laboratory
2
Performance Rating. For gasoline-powered vehicles, the important fuel rating parameter is miles per gallon (mpg), but for electric vehicles (EVs) the important performance rating parameter is miles per kWh (mpk). This is the ratio of distance travelled (in miles) to the electric energy (in kWh) needed to charge the vehicle’s batteries. The performance rating of modern electric cars is between 3 and 5 miles per kWh.
You will measure the performance rating of the model electric vehicle in feet per Joule (fpj).
Then, to convert from feet per Joule (fpj) to miles per kWh (mpk), multiply by 682 mpk/fpj.
Statistical Analysis. In this lab, we will introduce some statistical analysis.
We will use the Excel worksheet STATS to calculate the average value and standard deviation for all the performance rating values measured by all the groups in lab.
With these two values, we can express the results of our measurements in standard notation:
Measured Value = Average ± Standard Deviation.

EES 207 Sustainable Energy Laboratory
11/27/2015 9:10 AM 1
Lab: Electric Vehicle Date:
Name: Lab Meeting Day/Time: _________________
Partners: _____________________________
Exercise 1. Performance Rating for the Model Electric Car
Record the total capacitance (in Farads) of the capacitors used in the model car.
C =
Connect the voltmeter so that you are measuring the voltage across the capacitors.
Charge the model car capacitors using the small PV module and the solar light.
When the voltage reaches 3.0 volts, shut off the solar light and disconnect the solar panel.
Record the capacitor voltage.
V =
Disconnect the electric car from the voltmeter and bring it to the starting line.
When you are ready, close the switch that connects the capacitor to the motor and release the vehicle.
Measure the distance (in feet) that the car travels.
Record the distance value below. Include units.
Distance =
Calculate the energy (in joules) that was stored in the capacitors before the car was released.
Stored Energy = ½ C V2 =
Calculate the Performance Rating in feet per Joules (fpj) units.
Performance Rating (fpj) = Distance in feet ÷ Stored Energy in Joules
Performance Rating =
Have your instructor check this result.
This measurement was a trial run.
Now, you are ready for the measurements that you will keep.

EES 207 Sustainable Energy Laboratory
2
Second Measurement Set
Connect the voltmeter so that you are measuring the voltage across the capacitors.
Charge the model car capacitors using the small PV module.
When the voltage reaches about 3.0 volts, shut off the solar light and disconnect the solar panel.
Record the capacitor voltage.
V =
Disconnect the electric car from the voltmeter and bring it to the starting line.
When you are ready, close the switch that connects the capacitor to the motor and release the vehicle.
Measure the distance (in feet) that the car travels.
Record the distance value below. Include units.
Distance =
Calculate the energy (in joules) that was stored in the capacitors before the car was released.
Stored Energy = ½ C V2 =
Calculate the Performance Rating in feet per Joules (fpj) units.
Performance Rating (fpj) =
Use the above measurement and ignore the trial run.
This is your measured value!
Convert the Performance Rating from fpj units to miles per kWh (mpk) units
Performance Rating =

EES 207 Sustainable Energy Laboratory
3
Exercise 2. Statistical Analysis
Collect all of the Performance Rating values measured (in mpk units) by all groups and list them below.
1. 5.
2. 6.
3. 7.
4. 8.
Use the Excel spreadsheet STATS to calculate the average and standard deviation of the measured performance rating values. Include units for each value.
Average of Performance Rating Values =
Standard Deviation of Performance Rating Values =
Express the results of this analysis in the following format: Average ± Standard Deviation.
Performance Rating =
Exercise 3. Performance Rating of a Real Electric Car
The Tesla model S is a high-end electric sports car. The model S travels 245 miles after its batteries have been fully charged with 73.5 kWh of electric energy.
Calculate the Performance Rating of this vehicle. Express your result in miles per kWh.
Tesla Performance Rating =

EES 207 Sustainable Energy Laboratory
11/27/2015 10:04 AM 1
Take Home Lab: Electric Cars, the Nissan LEAF Name: Lab Meeting Day/Time: Complete this lab at home and bring it back to your next lab meeting. Show all math and be prepared to share your results with your classmates
Exercise 1. Your Driving Carbon Footprint
What model car do you drive? (If you don’t have a car, do this lab for a family member’s car.)
What is the fuel efficiency of this car? Express your answer in miles per gallon (mpg). You can get this information at http://www.fueleconomy.gov/ or http://www.fueleconomy.gov/feg/findacar.htm
How far do you drive annually? Express your answer in miles.
Calculate the gallons of gasoline your car consumes annually. (Divide your annual driving distance by your fuel efficiency.)
Assuming gasoline costs $3.00/gallon; calculate the annual amount that you spend on gasoline.
20 lb of CO2 is emitted into the atmosphere for each gallon of gasoline consumed.
Calculate the annual weight (in pounds, lbs) of the CO2 emitted by your car.
Convert this weight of CO2 in lbs to metric tons by dividing by 2,200 lb/ton.
This result is your personal driving carbon footprint. An average footprint is 6.0 tons of CO2. How does the size of your driving footprint compare to the average?
EES 207 Sustainable Energy Laboratory
2
Exercise 2. The Nissan LEAF
Go to http://www.nissanusa.com/leaf-electric-car/ to learn about the Nissan LEAF.
What is the LEAF’s range (i.e., the distance in miles that the LEAF will travel on a full charge)?
To fully charge the LEAF, the user must add 25 kWh of electricity to the car’s batteries. Divide the range in miles by 25 kWh to calculate the performance rating (miles/kWh).
Divide your annual driving distance in miles by the LEAF performance rating to calculate the electric energy in kWh that would be required if you used a LEAF for all your driving needs.
Electricity costs $0.20/kWh. Calculate your annual electric “fuel” cost, if you drove a LEAF
Generating grid electricity to charge your LEAF emits 1.0 lb CO2 per kWh generated. Calculate the CO2 emitted annually to charge your LEAF by multiplying the electric energy in kWh by 1.0 lb CO2/kWh, and then dividing by 2200 lb/ton to get CO2 emissions in metric tons.
Exercise 3. Comparison
Complete the table shown below with the results of your calculation.
Your Gasoline-Fueled Car Nissan Electric Car
Annual Fuel Cost ($)
Annual CO2 Emissions (tCO2)
If the electric vehicle had the same purchase price as your gasoline-fueled vehicle, which vehicle would you prefer to purchase and drive? Explain your preference.
EES 207 Sustainable Energy Laboratory
11/27/2015 9:44 AM 1
CO2 & IR
Date:
Name: Lab Meeting Day/Time:
Partners:
Background
Equipment. Xplorer data logger, temperature probes, CO2 sensor, IR camera
Learning Objectives. This lab will introduce you to atmospheric CO2 concentration, IR radiation, and techniques for measuring CO2 concentration and IR radiation
Background
Atmospheric CO2 concentration
Atmospheric CO2 concentration is nearly 400 ppm.
‘ppm’ means parts per million: there are about 400 CO2 molecules out of every 1,000,000 air molecules or 1 out of 2500.
CO2 is an important greenhouse gas because IR (infrared radiation) is absorbed by the CO2 in the atmosphere.
We measure CO2 concentration indirectly by using a device that measures the amount of IR absorbed by CO2.
IR radiation
UV (ultraviolet) light has shorter wavelength and higher energy than visible light.
Near IR (infrared) light has longer wavelength and lower energy than visible light.
Far IR (infrared) or thermal radiation has longer wavelength and lower energy than near IR radiation.
When we take a picture with a normal camera, we record light from the sun or an artificial light source that is reflected off of the objects in the picture.
When we take a picture with an IR camera, we record light (IR thermal radiation) that is radiated from the object itself.
IR cameras reveal important information about the distribution of thermal energy.
An IR camera is an essential tool for carrying out an energy audit of a home or business.
Measuring Temperature
One degree of Celsius equals 1.8 degrees of Fahrenheit. Kelvin is an absolute temperature scale. The scale begins at absolute zero (which is zero in the Kelvin scale). Note 1°C = 1 K.

EES 207 Sustainable Energy Laboratory
2
Exercise 1. Atmospheric CO2 concentration
Measure the CO2 concentration in air of the lab and record this value below.
Express your measurement in ppm.
CO2 Concentration of lab air =
Collect a sample of outside air.
Measure the CO2 concentration of this air sample.
Record this value below.
Express your measurement in ppm.
CO2 Concentration of outside air =
Measure the CO2 concentration of your exhaled breath.
Record this value below.
Express your measurement in ppm.
CO2 Concentration of your breath =
Explain why the CO2 concentration in your exhaled breath is so much higher than the outside air.
Explain why the CO2 concentration in the room air is higher than the concentration in outside air.
Explain why the CO2 concentration in room air doesn’t keep rising until it equals the concentration of CO2 in your exhaled breath.

EES 207 Sustainable Energy Laboratory
3
Exercise 2. Temperature Measurements
Disconnect the CO2 sensor and connect the temperature sensor.
Measure and record the classroom air temperature using the Celsius (°C), Fahrenheit (°F), and Kelvin (K) scales on the Xplorer. Be sure you are able to switch these scales by yourself. Include units!
Classroom Air Temperature on the Celsius scale:
Classroom Air Temperature on the Fahrenheit scale:
Classroom Air Temperature on the Kelvin scale:
Measure and record the outdoor temperature using the Celsius (°C), Fahrenheit (°F), and Kelvin (K) scales on the Xplorer. Be sure you are able to switch these scales by yourself. Include units!
Outdoor Air Temperature on the Celsius scale:
Outdoor Air Temperature on the Fahrenheit scale:
Outdoor Air Temperature on the Kelvin scale:
Using the measured temperature values, calculate the temperature difference between the classroom air temperature and the outside air temperature on the Celsius (°C), Fahrenheit (°F), and Kelvin (K) scales. Include units!
Temperature difference on the Celsius scale:
Temperature difference on the Fahrenheit scale:
Temperature difference on the Kelvin scale:
If the measured temperature difference between the classroom and outside air were 10°C, calculate this temperature difference on the Fahrenheit (°F) and Kelvin (K) scales. Include units!
Temperature difference on the Celsius scale: 10°C
Temperature difference on the Fahrenheit scale:
Temperature difference on the Kelvin scale:

EES 207 Sustainable Energy Laboratory
4
Exercise 3. Skin Temperature
Use the surface temperature sensor to measure the classroom wall temperature and the temperature at 5 points on your lab partner’s skin surface. Use the Celsius scale.
Classroom Air Temperature (from previous page):
Classroom Wall Temperature:
Wrist:
Fingertips:
Forehead:
Nose:
(Other) __________________:
Use the IR camera to measure the classroom wall temperature and the temperature at 5 points on your lab partner’s skin surface.
Classroom Wall Temperature:
Wrist:
Fingertips:
Forehead:
Nose:
(Other) __________________:
Do the IR camera measurements match the measurements made with the surface temperature sensor?
Is the wall temperature equal to the air temperature?
Explain why some skin surface points are cooler than other points.