background report reference - us epa report reference ap-42 section number: 9.10.1.1 ... emission...
TRANSCRIPT

Background Report Reference
AP-42 Section Number: 9.10.1.1
Background Chapter: 4
Reference Number: 2
Title: Emission Compliance Tests, Char Dust Collector #I and #4 ACM Mill Exhaust, Domino Sugar Corporation, Chalmette Refinery, Arabi, LA
Emission Testing Service
Emission Testing Service
January 1997

-~ I
I I I I I I I I I I I I I I 1 I I I I
DOMINO SUGAR CORPORATION CHALMETTE REFINERY
7417 NORTH PETERS STREET ARABI, LOUISIANA 70032
EMISSION COMPLIANCE TESTS
CHAR DUST COLLECTOR #1 and #4 ACM MILL EXHAUST
JANUARY 27-28,1997
Testing conducted by :
E T S EMISSION TESTING SERVICES, INC.
P.O. BOX 15075
BATON ROUGE, LOUISIANA 70895
(504) 925-8405
File : 97010
i
State of Louisiana Department of Environmental Quality
h1.J. "MIKE" FOSTER, JR. GOVERNOR
J. DALE GIVENS SECRBIARY
h4r. Dallas Safieit US EPAMD14 Research Triangle Park, North Carolina 2771 1
RE: Compliance Test, Domino Sugar, Louisiana
Dear Mi. Safreit:
The Louisiana Department of Environmental Quality received a request from you to forward a copy of the test report from Domino Sugar to include in your study. Enclosed in that copy. If you have any questions, please feel free to contact me at 504-765-0168.
Sincerely,
Engineering Section
JC/eaa
0 recycled Paper
OFFICE OF AIR OUALITY P.O. BOX 82135 BATON ROUGE, LOUISIANA 708842135
AN EOUAL OPPORTUNIlY EMPLOYER

I I I I
EMISSION TEST REPORT CERTIFICATION
for
DOMINO SUGAR CORPORATION
CHALMETTE REFINERY
I I
I I
EMISSION COMPLIANCE TESTS
CHAR DUST COLLECTOR #1 and #4 ACM MILL EXHAUST
JANUARY 27-28. 1997
Testing conducted by :
EMISSION TESTING SERVICES, INC.
I certify that I have personally examined and am familiar with the information submitted herein, and based on my inquiries of those individuals immediately responsible for obtaining the information, I believe the submitted information is true, accurate, and complete.
I
- Terry Kdin ThibodeaT 7 Domino Sugar Corporation Plant Representative
Emission Testing Services, Inc.
inL&7y~ I ' I I I I I
ii

CONTACT REPORT-MRI Project No. 4604-04
Brian Shrager, Environmental Engineering Department
May 8, 1997
From:
Date of Contact:
Contacted by: Telephone
Company/Agency: Domino Sugar Corporation 7417 North Peters Sneet Arabi, LA 70032-1598
Telephone Number: (504) 271-5331
Mr. Terry King
I
CONTACT.SUMMARY: ivlr. King was initially contacted in April 1997 to obtain process data for a test report that was supplied to EPA by the State of Louisiana Department of Environmental Quality. During the initial conversation with Mr. Tom Lapp of MRI, Mr. King stated that process data are not available for one of the sources, the confectioners sugar mill, that was tested. He also stated that he may be able to track down process data for the char dust collector emission test. Mr. King left a voice mail today shting that during the emission test, 15401.1 l b h of char went past the char dust collector. I called Mr. King
amount of char (that has come out of the kiln) transferred from a bucket elevator to a belt conveyor. The process that was tested is basically a conveyor transfer point, and does not include any kiln emissions. The belt conveyor conveys the char back to the filters that are used in decolorization.
1
I back for clarification of the process and process rate, and he stated that the process rate represents the I

I I I I I I I I I I I
I I I 1 I I I
i1 I
I.
11.
TII.
IV.
V.
VI.
VII.
, . . .
DOMINO SUGAR CORPORATION
CHALMEnE REFINERY
EMISSION COMPLIANCE TESTS
CHAR DUST COLLECTOR #1 and #4 ACM MILL EXHAUST
JANUARY 27-28, 1997
TABLE of CONTENTS
Introduction .................................................................... Summary
Test Results Summary .................................................. Quality AssurancdQuality Control ................................... Process Descnphon ......................................................
Procedure ......................................................................
. .
Analytical Technique ........................................................ Chain of Custody ............................................................. Test Data and Calculations ..................................................
Char Dust Collector #1 EPA Method 1 (sample point location and traverse layout) ............... EPA Methods 2-4 (stack gas flow rate, moisture, mole wt.)
EPA Method 5 (particulate) Test Data & Calculations, Runs 1-3 ......................... Data Summary & Calculations, Runs 1-3 ................... Laboratory Data, Runs 1-3 ....................................
#4 ACM Mill Exhaust EPA Method 1 (sample point location and traverse layout) ............... EPA Methods 2-4 (stack gas flow rate, moisture, mole wt.)
EPA Method 5 (particulate) Test Data & Calculations, Runs 1-3 ......................... Data Summary & Calculations, Runs 1-3 ................... Laboratory Data, Runs 1-3 ....................................
Resumes of Test Personnel ............................................. Test Equipment Calibrations ...........................................
Appendix .......................................................................
1 . 1
2.1 2.4 2.5
3.1
4.1
5.1
6.0.1
6.1.1
6.1.2
6.1.11 6.1.17
6.2.1
6.2.2
6.2.8 6.2.14
7.0.1 7.1.1 7.2.1
iii

I I I I I I I I I I I I I I I I I I I
.,.,, c
LIST of TABLES
I. Emission Test Results Summary,
11. Emission Test Results Summary,
Char Dust Collector #1 ..................................................
#4 ACM Mill Exhaust ...................................................
2.2
2.3
LIST
I. Emission Test Results Summary, Char Dust Collector #1 ............
of FIGURES
..................................... 2.6
11. Emission Test Results Summary, #4 ACM Mill Exhaust ................................................... 2.7
iv

FJ
I I I I I I I I I I I I I I I I I I I
I. INTRODUCTION
Emission Testing Services, Inc. (ETS) was contracted by Domino Sugar Corporation to
conduct emission testing at Domino Sugar Corporation's Chalmette Refinery. Emissions from
the Char Dust Collector #1, source ID 028-74; and #4 ACM Mill Exhaust, source ID 016-74
were tested to determine the rate of particulate emissions. Tests were conducted to
demonstrate compliance with permit number 2500-00009-03 issued by the Louisiana
Department of Environmental Quality (LDEQ).
Particulate emission rates were tested using EPA Method 5. EPA Methods 1 - 4 were
used to determine the number and location of sample points, and the velocity, moisture,
molecular weight, and volumetric flow rate of the stack gas.
The emission test team consisted of Kevin Thibodeaux, project leader, and a test crew
consisting of Ryan Deaville and Jeff Savoie. Terry King represented Domino Sugar
Corporation and coordinated testing with plant operations. The LDEQ was not represented on-
site during the tests.
Emission tests on the Char Dust Collector #1 were conducted on January 27, 1997.
Emission tests on the #4 AChI Mill Exhaust were conducted on January 28, 1997. Three, 1-hr
test runs were conducted on each source.
1.1

I I I I I I I I I I I I I I I I I I I
II. SUMMARY
Emission tests were conducted on the Char Dust Collector #1 on January 27, 1997.
Results of the tests indicate that particulate emissions are in compliance with permit limits.
Particulate emissions averaged 2.000 lblhr which is lower than the permit limit of 2.2 lblhr.
Test results are presented in Tdble I.
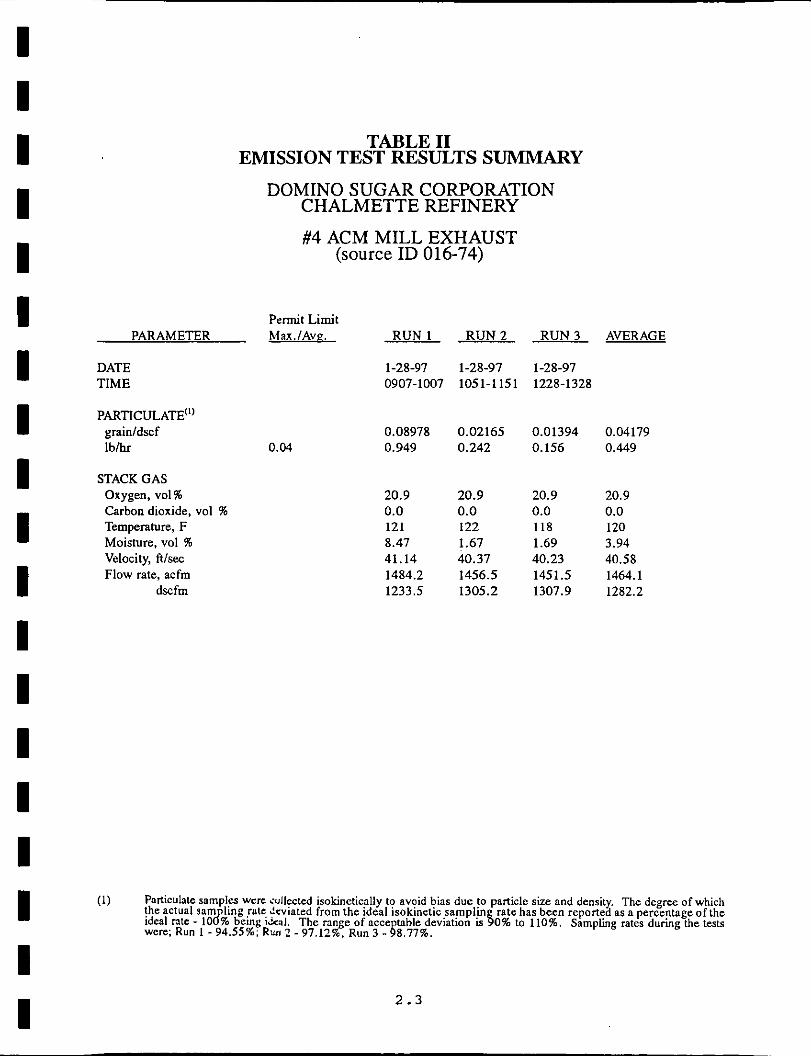
The #4 ACM Mill Exhaust was tested on January 28, 1997. Results of the tests
indicate that particulate emissions are not in compliance with permit limits. Particulate
emissions averaged 0.449 lb/hr which exceeds the permit limit of 0.04 lblhr. A summary of
test results is presented in Tdble 11.
During tests on the #4 ACM Mill Exhaust, test personnel noted a residue buildup on the
inside walls of the stack which reduced the stack ID. This did not have an affect on the
particulate emission tests. A physical obstruction blocked one test port however, which
resulted in a modification of the test method. Samples were collected from only one test port
with samples collected from four traverse points while traversing into the stack and then from
four points while traversing out of the stack.
EPA methods were used to determine all pollutant and stack gas data. All deviations
from the test methods and unusual conditions have been noted above.
2.1

I I I I I I I I I I I I I I I I
I I
(1) Particulate sarnplcs We= cullccted isokinetically 10 avoid bias due to particle size and density. The degree of which the actual sam ling rnlc deviated from the ideal isokinetic samplin rate has been reported as a percentage ofthe ideal rate - I d % being ideal. The range of acce table deviation is 50% to 110%. Sampling rates during the tests were; Run I - 89.43%; Run 2 - 98.92%, Run 3 - ~ 6 . 5 1 % . I
2 . 2
TABLE I EMISSION TEST RESULTS SUMMARY
DOMINO SUGAR CORPORATION CHALMETTE REFINERY
CHAR DUST COLLECTOR #1 (source ID 028-74)
PARAMETER
DATE TIME
PARTICULATE") grainldscf I b h
STACK GAS Oxygen, vol % Carbon dioxide, vol % Temperature, F Moisture, vol % Velocity, ftlsec Flow rate, acfm
dscfm
Permit Limit Max.1Av-z. RUN 1 RUN2 RUN3 AVERAGE
1-27-97 1-21-91 1-27-97 1102-1205 1241-1342 1415-1517
2.312.2 0.00533 0.02928 0.33309 0.12257 0.083 0.459 5.458 2.000
20.9 20.9 20.9 20.9 0.0 0.0 0.0 0.0 74 74 78 75 2.24 2.23 1.78 2.08 10.13 10.26 10.72 10.37 1869.6 1894.3 1979.0 1914.3 1812.5 1827.1 1911.5 1850.4
I I I I I I I I I I I I I I I I I I I
TABLE I1 EMISSION TEST RESULTS SUMMARY
DOMINO SUGAR CORPORATION CHALMETTE REFINERY
#4 ACM MILL EXHAUST (source ID 016-74)
PARAMETER
DATE TIME
PARTICULATE(^) grainldscf l b h
STACK GAS Oxygen, vol % Carbon dioxide, vol % Temperature, F Moisture, vol % Velocity, ftlsec Flow rate, achn
dscfm
Permit Limit M a x . IAvg. RUN 1 RUN 2 R U N 3 AVERAGE
1-28-97 1-28-97 1-28-97 0907-1007 1051-1151 1228-1328
0.08978 0.02165 0.01394 0.04179 0.04 0.949 0.242 0.156 0.449
20.9 20.9 20.9 20.9 0.0 0.0 0.0 0.0 121 122 118 120 8.47 1.67 1.69 3.94
1484.2 1456.5 1451.5 1464.1 41.14 40.37 40.23 40.58
1233.5 1305.2 1307.9 1282.2
2 . 3

I I I I I I I I I I I I I I I I I I I
QUALITY ASSURANCE/ QUALITY CONTROL
Test results have been validated by following rigorous quality assurance (QA) and
quality control (QC) programs. These programs ensure that the test data are representative of
the source conditions by verifying the completeness, accuracy, and precision of the test data.
QAlQC functions cover all aspects of the test including field testing, sampling, and analysis,
sample transport and laboratory analysis, and data processing and reporting.
Emission testing at Domino Sugar Corporation included a series of QC functions. All
QC functions were completed satisfactorily within the required limits.
Emission Testing Services's QA program includes participation in EPA's quarterly
audits. Results of the audits, applicable to the test methods applied during testing at Domino
Sugar Corporation, were within acceptable limits.
2 . 4

I I I I I I I I I I I I I I I I I
PROCESS DESCRIPTION DOMINO SUGAR COWORATION
CHALMEITE REFINERY
Domino Sugar Corporation's Chalmette Refinery currently produces refined granulated sugar,
confectionery sugar, blackstrap molasses, and several specialty products. Raw cane sugar, received by
ship, barge, truck, and rail, is stored in sheds until processed. Raw sugar is refined through the
processes of affination, carbonotation, press filtration, bone char decolorization, crystallization, and
centrifugation. The drying operation of countercurrent flows of hot air and sugar creates dust which is
recovered by cyclonic gravimetric separation and wet scrubbing.
Powdered sugars are produced by pulverizing granulated sugar along with cornstarch (or, in the
case of a specialty product, mako-dextrin) in a rotary mill. The product is collected in a modified
baghouse which also acts as an emissions control device.
Boilers No. 1 and 7 are natural gas tired boilers with maximum heat inputs of 78.2 MMBtuhr
and 151.3 MMBtuhr respectively. The High Pressure Boilers, which exhaust to atmosphere through a
common stack, are five identical natural gas fired boilers having a maximum heat input of 56.9
MMBtuhr each. During normal operation, only four of the five boilers are fired.
The Char Kilns North are 18 identical kilns, each having a maximum heat input of 1.7
MMBtuhr. During normal operation, only 14 of the 18 kilns are fired. The Char Kilns South are 6
identical kilns, each having a maximum heat input of 1.7 MMBtuhr. During normal operation, only 4
of the 6 kilns are fired.
Following are schematics and brief process descriptions for the Char Dust Collector #1 (Figure
I) and #4 ACM Mill (Figure 11).
I I
2.5

I I I
I I I I I I
Domino Sugar Corporation Process Descriptions
Char Dust Collector #1
The char dust collectors are gravity collectors that are 80-95% efficient. They remove dust from bucket elevators utilized to transport char from the lst floor of the filter to the 8" floor.
c
I Belt Convevor
I Bell conveyor
I I
FIGURE 1
2.6

I I I I I I I I I I I I I I I I I I I
#4 ACM Mill
The ACM Mills me used to make and collect confectioner’s, or powdered, sugar by employing a hammer-mill and fabric filters. The emissions are from the baghouse that collects the sugar. It is a product recovery system.
roducl Collector
Hammer-mill
Product 10 Packaging
FIGURE I 1
2.7

I I I I I I I I I I I I I I I I I I I
III. PROCEDURE
Emissions tests were conducted following EPA methods documented in Title 40 of the
Code of Federal Regulations, Part 60, Appendix A. A brief description of each method used
follows.
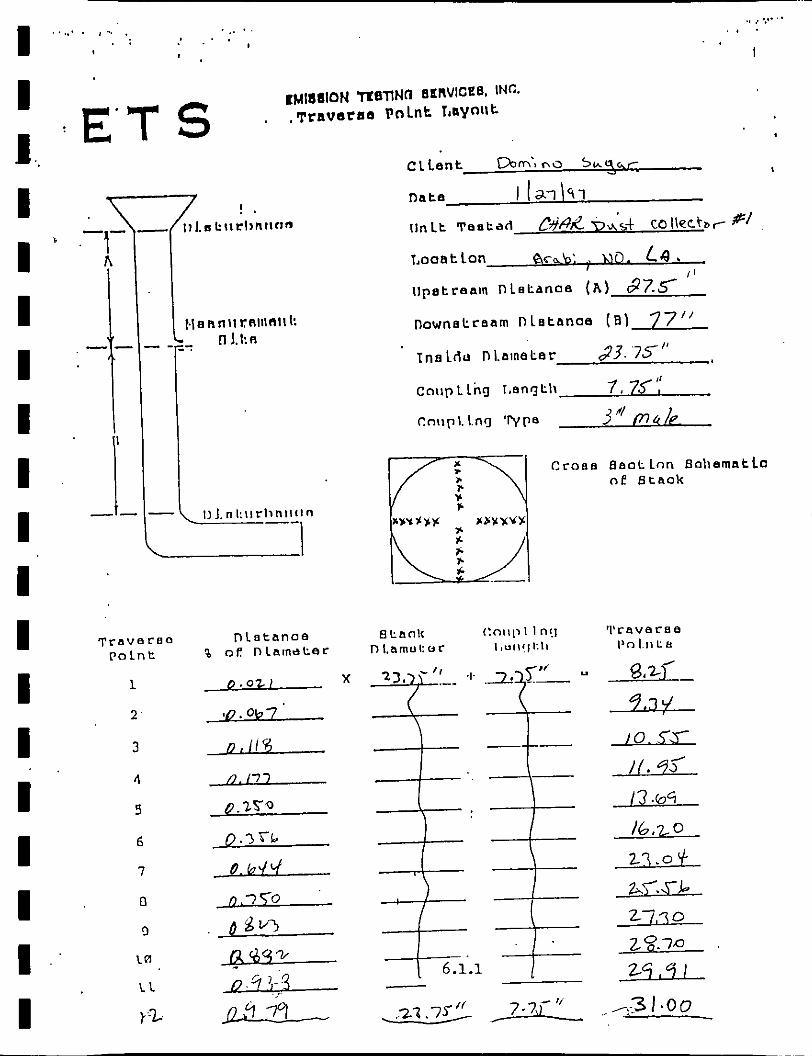
EPA METHOD 1 : SAMPLE and VELOCITY TRAVERSES for STATIONARY SOURCES
Method 1 is applicable to stacks having a diameter greater than 12 in. T h e method recommends that sampling points be located 8 diameters downstream and 2 diameters upstream from the nearest flow disturbances; however, any distances greater than the minimum 2 diameters downstream and 0.5 diameters upstream are acceptable. These distances help insure the collection of a representative sample i n the absence of cyclonic flow. Cyclonic flow is detected by measuring the stack gas flow Yaw angle at each test point. The average yaw angle is required to be less than 20 degrees.
The Char Dust Collector # I has a stack diameter of 23.75 in. The sampling point was located 3.24 stack diameters downstream and 1.16 stack diameters upstream from the nearest flow disturbances. Based on the upstream and downstream position of the sampling plane, 24 sample points were selected and laid-out on 2 perpendicular traverses (diameters) of the stack - 12 points per traverse. Access to the sample points was obtained via 2 ports through the stack wall. Cyclonic flow was not detected.
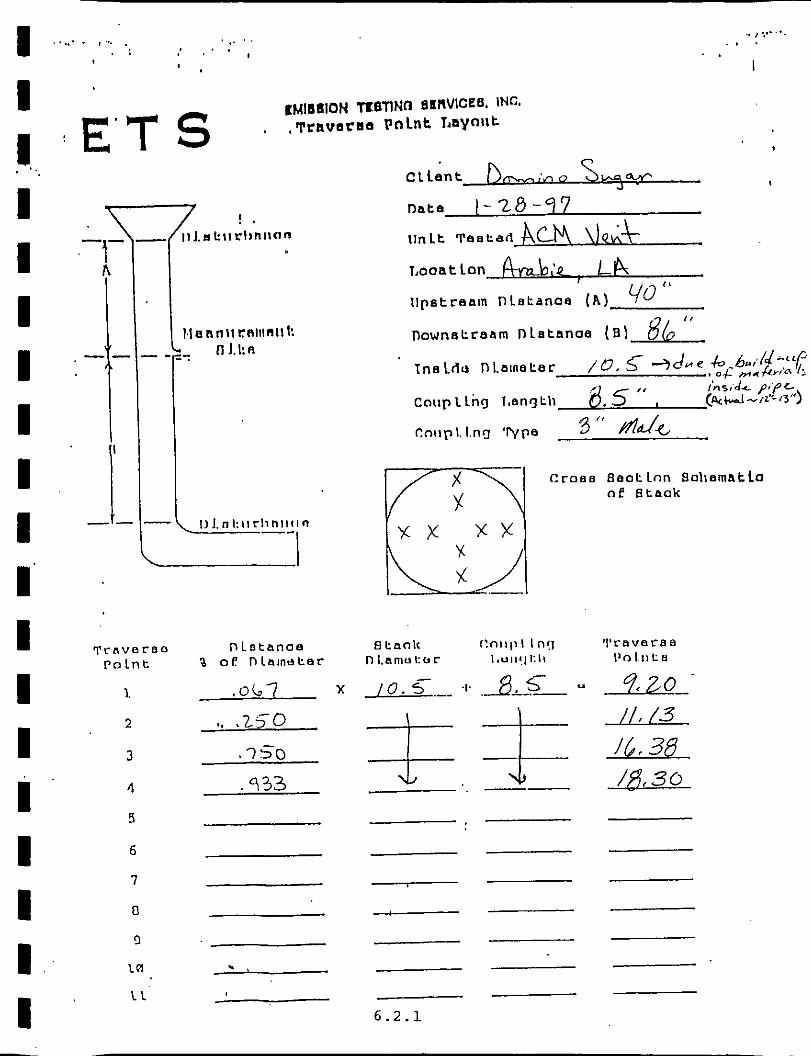
EPA METHOD 1A: SAMPLE and VELOCITY TRAVERSES for STATIONARY SOURCES with SMALL STACKS or DUCTS
Method 1A is applicable to stacks with a diameter greater than 4 in. and less than 12 in. The method recommends that sampling points be located 8 diameters downstream and 2 diameters upstream from the nearest flow disturbances; however, any distances greater than the minimum 2 diameters downstream and 0.5 diameters upstream are acceptable. These distances help insure the collection of a representative sample in the absence of cyclonic flow. Cyclonic flow is detected by measuring the stack gas flow Yaw angle at each test point. Average yaw angle is required to be less than 20 degrees.
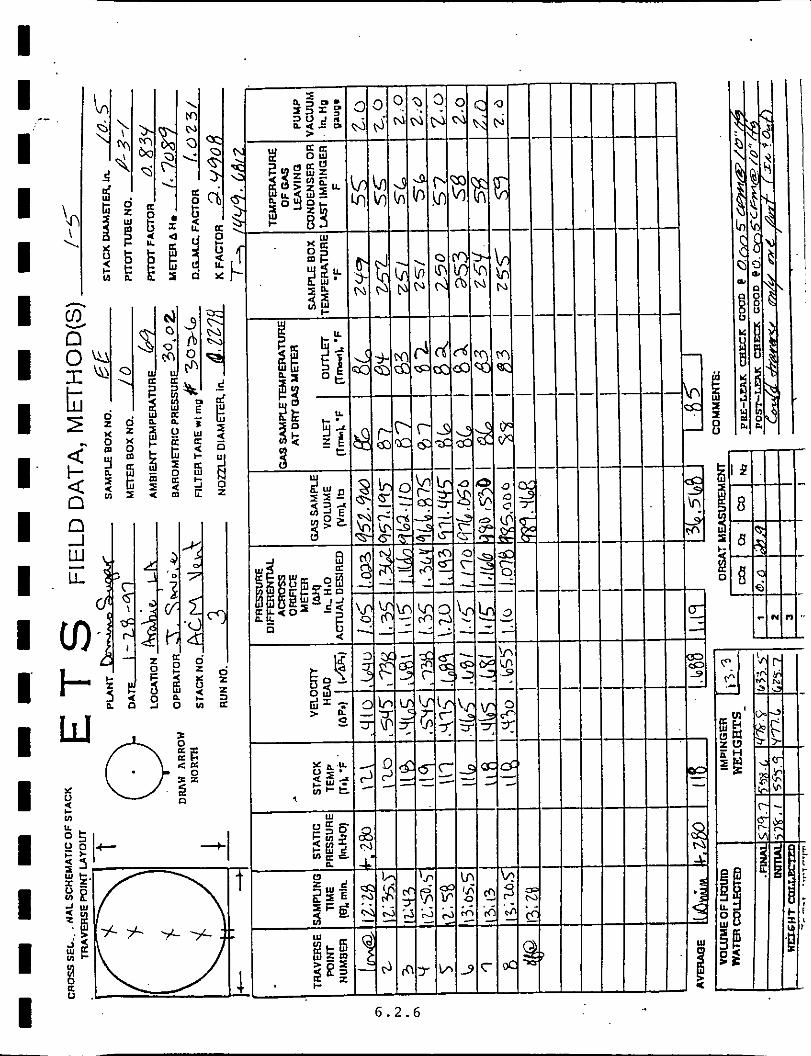
The #4 ACM Mill Exhaust has a stack diameter of 10.5 in. The sampling point was located 8.19 stack diameters downstream and 3.81 stack diameters upstream from the nearest flow disturbances. Based on the upstream and downstream position of the sampling plane, 8 sample points were selected 2nd laid-out on 2 perpendicular traverses (diameters) of the stack - 4 points per traverse. Access to the sample points was obtained via 1 ports through the stack wall. The other port was physically obstructed. Tests were conducted by sampling four points in and four points out. Cyclonic flow was not detected.
3.1

I I I I I I I I I I I I I I I I I I I
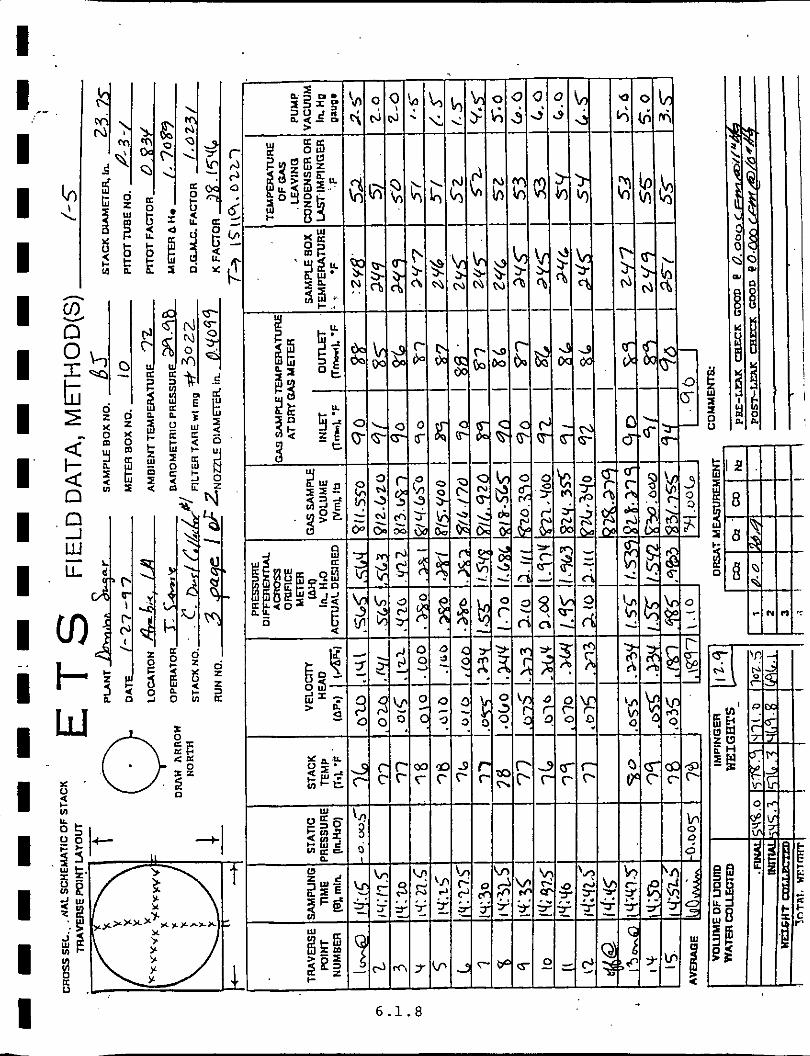
EPA METHOD 2: DETERMINATION of STACK GAS VELOCITY and VOLUMETRIC FLOW RATE ( Type S pitot tube )
The average gas velocity in the stack was determined from the gas molecular weight, moisture content, and the average velocity head measured using a type S pitot tube. Volumetric flow rate was determined from the velocity and stack cross-sectional area.
EPA METHOD 3: GAS ANALYSIS FOR CARBON DIOXIDE, OXYGEN, EXCESS AIR, and DRY MOLECULAR WEIGHT
The dry molecular weight of the stack gas was determined using an Orsat analyzer which measured the concentration of oxygen, carbon monoxide, and carbon dioxide. The remaining gas components were assumed to be nitrogen. A gas sample was removed from the centroid of the stack using a stainless steel probe fitted with a particulate filter. The probe, sample lines, and Orsat were purged sufficiently to obtain a representative grab sample for analysis.
EF'A METHOD 4: DETERMINATION of MOISTURE CONTENT in STACK GASES
A gas sample was extracted from the stack using a heated glass probe fitted with a particulate filter. Sample gas passed from the probe, through a series of four impingers immersed in an ice bath. The first two impingers contained known weights of water, the third was empty, and the fourth contained a known weight of silica gel. Any water vapor in the gas stream was condensed and trapped in the impingers.
EPA METHOD 5: DETERMINATION of PARTICULATE EMISSIONS F R O M STATIONARY SOURCES
Par t icu la te s amples were col lected f rom the s o u r c e i sokine t ica l ly to in su re that a representative sample of particulate was collected without bias due t o par t ic le s ize or density. During ideal isokinetic sampling conditions, the velocity o f the gas entering the probe nozzle equals the velocity of the stack gas . T h e degree at which the actual sampling ra te deviated from the ideal sampling rate was calculated as a percentage of the ideal isokinetic sampling rate with 100% being ideal. T h e range of acceptable sampling rates is 90 - 110% of the ideal isokinetic rate.
Sample gas was collected from the source us ing a heated p robe and was transferred through a sample line to a heated glass fiber filter. The filter collected particulate and any o ther mater ia l which condensed a t o r above t h e f i l t r a t ion tempera ture . After filtration, the gas passed through an impinger train immersed in an ice bath. The train consisted of two impingers containing known weights of DI water, one empty impinger, and one impinger packed with a known weight of si l ica gel. Sample f low rate was established using a diaphragm pump and was controlled using a valve. A calibrated dry gas meter was used to determine the total gas sample volume.
After sampling, the filter was recovered from the fi l ter holder. T h e front half of the filter holder and prohe were washed and the washings were collected as the probe wash sample. Sample containers were labeled and sealed for shipment to the laboratory for analyses.
3.2

I I I I I I I I I I I I I I I I I I I
IV. ANALYTICAL TECHNIQUE
All sample analyses were conducted following EPA methodology. Presented below are
brief descriptions o f each method used.
EPA METHOD 5: DETERMINATION o f PARTICULATE EMISSIONS F R O M STATIONARY SOURCES
T h e par t iculate fi l ter was oven conditioned at 350 F and weighed before and after sampling. T h e filter weight gain represented the particulate catch on the filter. The probe wash sample was analyzed for total solids content by gravametric analyses. An aliquot of the sample was placed into a tared flask and evaporated to dryness. The weight of the residue, corrected for sample volume and wash blank, represented the probe wash catch.
4.1

I I I I I 1 I I I I I I I I I I I I I
V. CHAIN of CUSTODY
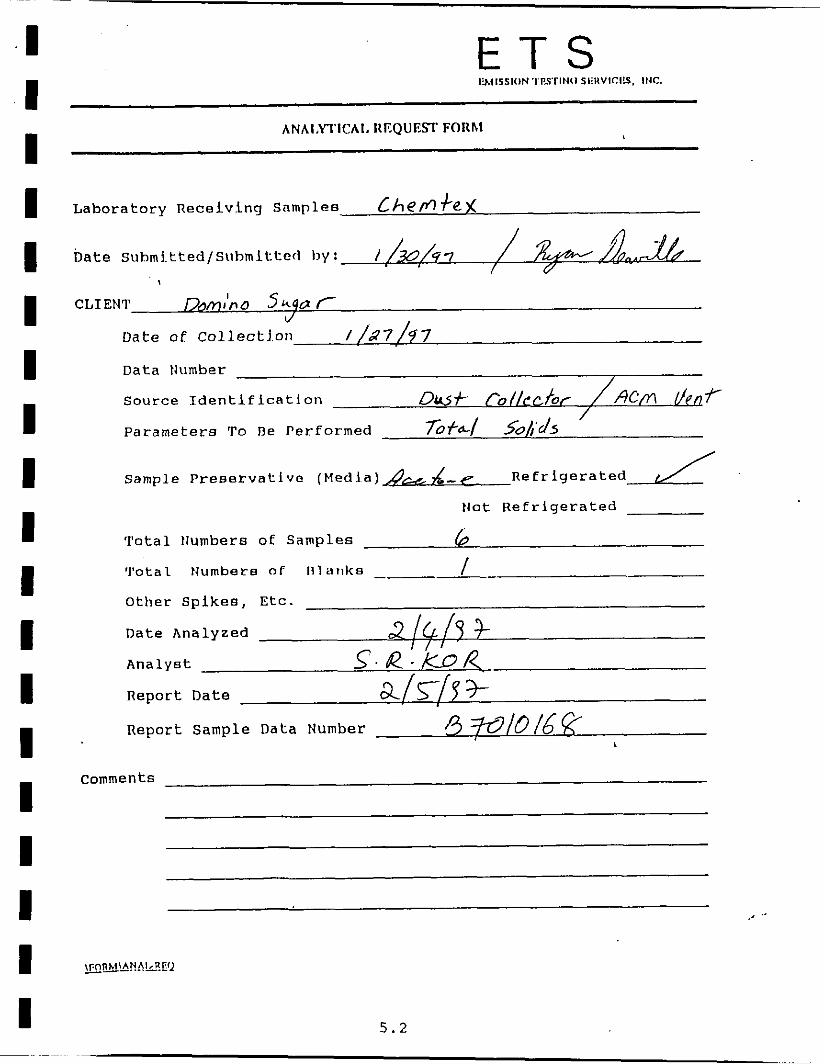
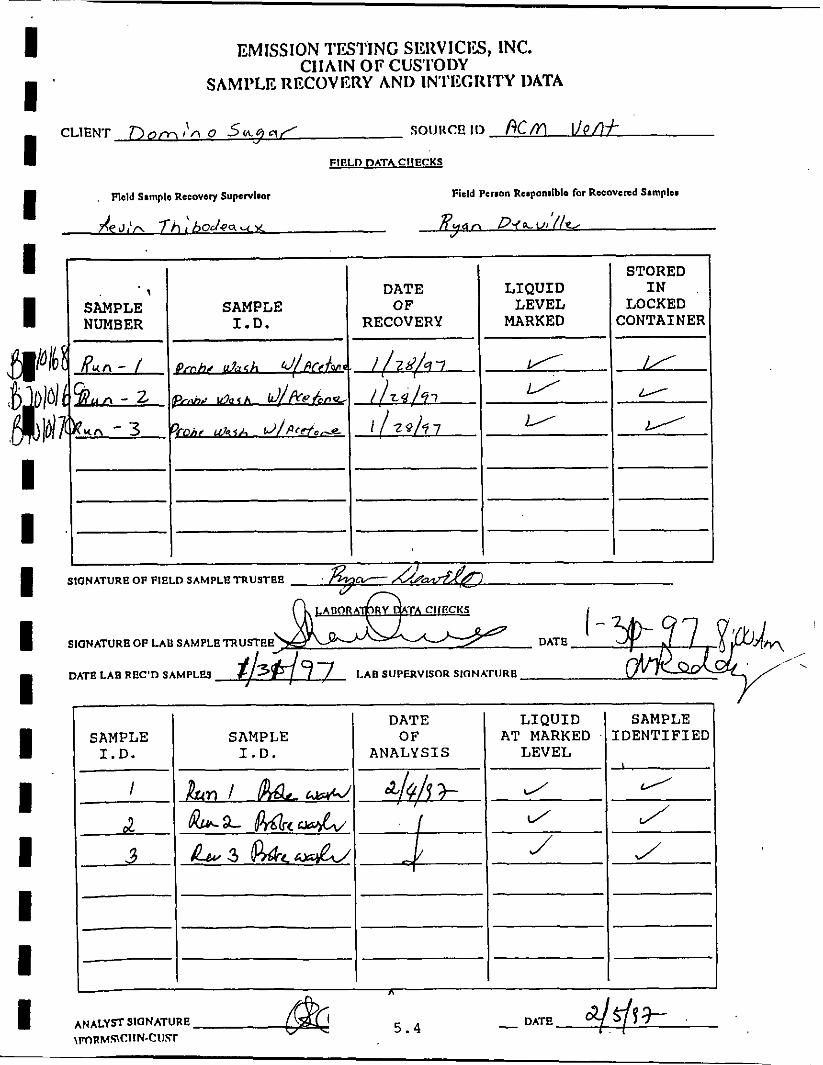
For all samples transported to the laboratory for analyses, a Chain of Custody form was
prepared during the sample recovery process. The sample ID, number of samples, liquid level
when applicable, name of the sample recovery supervisor, name of the person responsible for
sample recovery, and the signature of the sample trustee were recorded on the form.
During all subsequent handling, the custody form accompanied the samples. As
personnel relinquished responsibility for the samples, the receiving sample trustee verified the
number and integrity of the samples and signed the custody form.
Upon receipt at the analytical laboratory, the lab sample trustee verified the number,
type, and integrity of the samples. These data were recorded on the custody form along with
the date of receipt and lab sample trustee's signature.
At the time of analyses, the laboratory analyst recorded the analyses date and the
laboratory supervisors name on the custody form. The analyst signed the custody form and
attached it to the analytical results.
Chain of Custody forms for samples collected during testing are presented on the
following pages along with the Analytical Request forms.
~~
-I I I I I I I I I I I I I I I I I I I
E T S I!J.41SSION'I PSTINlI SliUVICI!S, IIiC.
ANAl,YI'lCAl. ItEQUISl' FORhl
Laboratory Receivinq Samples L h e m k ) (
CLIENT D b M , ' l r O Srqo r Date of COl~eCt~OIl I /a7/97
Data Number
Source Identiflcatlon
Parameters To Be Performed
D u t - r o / / c ~ , h c / AC/n I/Pa 7-
Sample Preservatlve (Medla)/-d & p Refrigerated
Not Hefrigerated
Total tlumbers of Samples 6 T o t a l Numbers of n l a t l k s - I Other Spikes, Etc.
Date Analyzed
Analyst
Report Date dqh 3- Report Sample Data Number 4 w/o/m
comments
5 . 2

:I I*
EMISSION 'I'FSTING SIIRVICIS, INC. Cl lAlN OP CUS'I'0I)Y
SAMPLE RITCOVITRY ANI) IN'I'ICGRITY DATA
DATE OF
RECOVERY
, !
SAMPLE NUMBER
STORED
L E V E L LOCKED L I Q U I D I N
MARKED CONTAINER SAMPLE
I . D .
I
I I I I I I I I I I
~
1 A
SICINATURC OP PICLD SAMPLU T R V S T U U Z U n/& h
SAMPLE [ D E N T I F I E D SAMPLE
I . D .
L I Q U I D AT MARKED
L E V E L
DATE OF
ANALYSIS
I J a
3 i J J
J I/ Y
5 . 3
I I '
' 1 DATE L I Q U I D SAMPLE SAMPLE O F LEVEL NUMBER I . D . RECOVERY MARKED
L/
frn - 3
EMISSION TJ2Y'JNG SlCRVIClS, INC. CIIAIN OF CUS'I'ODY
SAMPLE. RECOVERY ANI) IN'I'ECRITY DATA
STORED I N
LOCKED CONTAINER
z /
LI
CLlENT : f l o scA9q/ souim i i ) /3CM UP A+
I FIP.LD PATA CllECKS
I I
I I I I I I I I I I I
I
SIONATURE OP FIELD SAMPLE TRUSTEE - bADORAlbRY &TA CllECKS
,J .. , SIONATURE OF LAU SAMPLETRUSTEE
DATE LAB R E c m S A M P L ~ O LAB SUPERVISOR SIONKTIIRE
SAMPLE I . D .
I
d. 3
SAMPLE I . D .
DATE OF
A N A L Y S I S
-A&=- * L I Q U I D
AT MARKED LEVEL
J
c/
J
~
SAMPLE I DENT1 F I ED
L/
J J

~~
.I I I I I I I I I I I I I I I I I I I
DATE OF
RECOVERY
L 5 1
CIlAlN O F CUS'I'0I)Y SAMIXE ItECOVERY ANI) IN'I'EGRITY DATA
L I Q U I D LEVEL
MARKED SAMPLE NUMBER
SAMPLE I . D .
STORED I N
LOCKED CONTAINER
I I I I
SIONATUREOP FIELD SAMPLETRUSTEE
I . A B O R A ~ R Y DATA C l l w
SICJNATURE OF LAB SAMPLE TRUSTEE 7 A B 4 DATE /-7ddy7
DATE LAB REC'D S M P L E S LAB SUPERVISOR SJONATURE
DATE
A N A L Y S I S SAMPLE O F SAMPLE
NUMBER
x
I I
LIQUID A T MARKED
LEVEL
SAMPLE I D E N T I F I E D
ANALYST SIGNATURE DATE Z - / d d , w
\POIIhlS\CIIN-CUST
5.5

I I I I I I I I I I I I I I I I I I I -
L I Q U I D LEVEL
MARKED
EMISSION IFSTING SEItVIClS, INC. CllAlN OF CUS'I'0I)Y
SAMI'IX RECOVERY ANI) IN'I'EGRITY DATA
STORED I N
LOCKED CONTAINER
SAMPLE NUMBER
SAMPLE I . D .
am & I/@ J + /f Yf
DATE OF
RECOVERY
I
SIONATURE OP FIELD SAhIPLETRUSTEe
) ,ABORATnRY DATA CllECKS
SIC3NATWRE OF LAD SAMPLE TRUSTEE D A T E - f 7 DATE LAB REC'D ShMPLUi /- 3 O - 9 7 LAB SUPERVISOR SIONATURE
w
I
DATE OF
ANALYSIS
L-/ d-f 1
-4-
L I Q U I D AT MARKED
LEVEL
SAMPLE I D E N T I F I E D
I
ANALYST SIONATURE DATE 2-/6-$'7 \POI~MS\CIIN.CUSl'
5.6

I I I I I I I I I I I I I I I I I I I
VI. TEST DATA and CALCULATIONS
All emission test field data, unit operations data, and laboratory data are presented in
this section along with the associated data reduction calculations.
Data from the field data forms were manually input into a computer for data processing
and calculations. Integrity of data input is maintained by using a double entry system. The
computer performed all calculations and produced the calculations and results summary pages.
Input data accuracy were further verified by comparison of raw field data to the computer data
printed on the summary pages. Computer program integrity and calculations verification are
validated by processing a known set of data. Further controls on the computer program are
conducted by comparison of manual spot calculations of the raw data input to computer
calculations results.
6.0.1
. .. . , . . . . . . .. . . I '". . . . I I .
I I I I I I I I I I I I I I I I
ii r h n l l c l n
---I
T r a v a r e o Po Ln t
1
2
3
4
5
6
I
0
9
Ln
L L
).%
Croea 8 0 0 ~ tnn BoliematLc n € B t a o k
I U / l

I r -
I I I I I I I I I I I I I I I I I
-.
* U
6.1.2

I
I I I I 6.1.3

I I I I I I I I I I I I I I I I I I I
E T S Emission Tcning Services, Ine
Client : DOMINO Source : CHAR DUST COLLECTOR Test Date : 1-27-97 Run No. : 1
DETERMINATION of STACK GAS MOISTURE. MOLECULAR WEIGHT, VELOCITY, and VOLUMETRIC FLOW RATE
A -Cmrlaiooal-ofthc~tnck.Rt
Acf - Stnck EM flow rate. aclul. acfm
BW - ShCk gM mOkDJE fmCti00. %/loo
Cp - Pilot Dvbc cocmsicnt
dH
dP
FI
Kp - Pilot ~vbccooatmt. 85.49
MCOZ - Molcculu wsight of C02. 44.01 Ibl Ib mole
Md
MHZO - M o l m h weight of water. 18.02 lNlb mole
MN2 . Molrcvlrr weight of N2. 28.01 lbllb inok
MOZ - Molrcvh weight of 02, 12.00 lbllb mole
M. - Suck IM molceulr weight, wct lbllb mole
- Mer orifiss p-um diffcsrmthl. in. H 2 0
-Suck g u vclociry hcnd. in. HZO - Caovcnioo fmckr. 13.6 in. HZOl in. HI
- Stnck gm molccuhr weight, dry Ib/lb m ~ l c
Pbnr F% k kld
Qd R Tm TS
T d
I ( V i + V i i + V i i i + Viv ) R Tstd
( 453.6 glib P s t d nH2O
. Bnmmcuic p-w. in. Hg - Sloek gm smtic p-w. in. HZO . Stack E"I abaoluts Q-UE. in. Hg
Slnndad ebaoluts p-m. 29.92 in. Hg
. Smck gaa volumcvic flow rats. dry r f m
. Ida1 gm coorfnnt, 21.85
. Mrkr tempern-. R
.Sack gm tempsmm. R - S d m d tcmpcra~uc. 528 R
( 4.3 + 2.4 + .4 + 7.0 )( 21.85 )( 528 ) ] = .M514 =I ( 453.6 )( 29.92 18.02 )
= 28.97078 I ( 30.030 + .7975/13.6 528
( 29.92 ( 550 = ( 29.329 )( 1.0231 ) I ( Pb + dH/ F 1 ) Tstd
Pstd Tm
= .0224 ( .66514 )
Vmstd = Vm Y
B u s = { VU } = { Vw + Vmstd ( .M514 + 28.97078 )
Md 3 ( MCO2 )( YL02 ) + ( H02 )( M 2 1 + ( MN2 !4N2 1 = ( 44.01 )( ,000 ) f ( 32.00 )( .209 ) + ( 28.01 ) ( .791 ) = 28.844
Ms = Hd ( 1 - Bus ) + ( "20 Bus ) E ( 28.844 >( 1 - .0224 + ( 18.02 .0224 1 = 28.601
= 10.1282 ( 534 1
( 30.030 28.601 ) Vs = Kp Cp ( dP ) = ( 85.49 )( ,8340 .1801 )
Acf = ( M) seclmin )( Vs A ) ( 60 ) ( 10.1282 )( 3.0765 ) = 1869.6
Tstd Ps Qsd = ( 3600 sec/hr ) ( 1 . Bur ) ( Vs A 1 - { 1s Pstd ]
108752.8 dscf/hr ( 534 )( 29.92 ) 1812.5 dscf/min
( 528 )( 30.030 ) = ( 3600 )( 1 - .0224 ) ( 10.1282 ) ( 3.0765 )
6.1.4

I ., I *-
I I I I I I I I I I I I I I I I I
_.
W Y 0 $ 0 0 4 L .~ In
6.1.5

I .,
I _-
I v \ .
6.1.6

I I I I I I I I I I I I I I I I I I I
.E T S Emission Testing Services, Inc,
Client : DOMINO Source : CHAR DUST COLLECTOR Test Date : 1-21-91 Run No. : 2
DETERMINATION of STACK GAS MOISTURE, MOLECULAR WEIGHT, VELOCITY, and VOLUMETRIC FLOW RATE
A - C r a c . e e t i o d m o f t h c a m c k . N
A d
Bwi
.smell gM flow me. ncuml. d m
. Smck g~ moiaum fmction. %llW
c p . Pitot mbc mlficicnt
dH dP
FI Kp
M C 0 2 . M o l a v h weight of COZ. 44.01 Ibl Ib mole
Md M H 2 0 - Molacvkr weight of wmter. 18.02 lWIb -le
MNZ . Molt~darweight of NZ. 28.01 lbllb m l c
M02 . Molcsuluwvcighiof 02. 32.00 lhlm mok
M# . Smsk g u molecuhirwcighl. wet Ibllb mok
. Mslcr orifice prcuurs diffefcrmrinl. in. H 2 0
. Smck ga# vclocity h d . in. HZO
. Convrnion haor. 13.6 in. HZOI in. HI
. Pilot mbc co~mt. 85.49
- S W gru molsshr weight. dy lbflb mok
- Bnmmctris p-mn. in. Hg . Smck gru mtic p m - . in. H20 . Stack gru nbdute p w u r s . in. H g
Smndard nbsolueprcaaurr. 29.92 in. Hg
- Smck gru vo lvmc~c flow mlc. dry scfm
. I d 4 8ruSonrtnnr. 21.85 - M c e r lunpcmm. R - S m k g u tempcmmn. R - S - d d tcmpcmfurc. 528 R
( 5.0 + 3.9 + 1.4 + 5.3 )( 21.85 )( 528 ) ] = .73590 I =I ( 453.6 29.92 )( 18.02
( Vi + V i i + V i i i + Viv 1 R Tstd
( 453.6 g l l b ) Psfd HH2O vu = {
= 32.30350 ( 30.010 + 1.0121/13.6 ) ( 528
( 29.92 ) ( 549 ) = ( 32.622 )( 1.0231 )
( Pb + dH/ F 1 ) Tstd
Pstd Tm Vmstd = Vm I
= ,0223 I B u s = { vu } = { ( .73590 )
Vu + Vmstd ( ,73590 t 32.30350 )
Md = ( MC02 xC02 ) + ( M02 )( M2 ) + ( MN2 )( xIl2 )
Ms I Md ( 1 - Bus ) + ( MHZO Bus ) = ( 28.844 1 - .0223 1 + < 18.02 )( .0223 1 28.603
I ( 44.01 ) ( .OOO ) + ( 32.00 ) ( .209 ) + ( 28.01 ) ( .75'1 ) = 28.844
= 10.2625 ( 537 )
( 30.010 )( 28.603 ) Vs = Kp Cp ( dP 1% - = ( 85.49 .8340 .1820 ) { P r M s 1 Acf = ( 60 seclmin Vs A 1 = ( 60 )( 10.2625 ) ( 3.0765 ) = 1894.3
Tstd Ps Osd = ( 3600 seclhr )( 1 - Buu Vs A ) - { Ts Pstd ]
= 109627.8 dscf/hr ( 537 )( 29.92 ) I =
( 528 30.010 )
1827.1 dscf/min = ( 3600 ) ( 1 - .0223 ) ( 10.2625 3.0765 )
6.1.7
I I I I I I I I I I I I I I I I
_ .
I 6.1.8

I I ;-
in
6.1.9
I I I I I I I I I I I I I I I I I I I
E T S Emiasion Testing Services, Inc.
Client : DOMINO Source : CHAR DUST COLLECTOR Test Date : 1-27-97 Run No. : 3
DETERMINATION of STACK GAS MOISTURE, MOLECULAR WEIGHT, VELOCITY, and VOLUMETRIC FLOW RATE
A
Acf
Bwi
Cp . Piml u b e socllieicnt
dH dP FI Kp MCOZ . Malccvlnr weight af COZ. 44.01 lb/ 0 mk
Md
MHZO- Molwulnr wvcighlof wmr, 18.02 blm mole
MN2 . Molmlnr weight of NZ. 28.01 lbllb &
MOZ . Molmlnrwucigblof 02. 32.W lblb olo(L
hh - Shck p a molmlnr wcigbl. wet Ibm onk
. C - d o d um of the nbck. N - Smck gna flow milc. a d a d . acfm
. Sbck gns m o h m fmdoo. X l l W
. M a r otilisc prururs differcntiol. in. HKI - Stock g u vclosiry bed. in. HZO
. Cowsmion factor. 13.6 in. H201 in. Ht
. timl DIbc conaunt. 85.49
. Sbck gw molmlw weight. d y lb/b rmk
. Bommuric p-w. io. Hg
. Sbck gw sbtic p-urc. in. HZO
. Stock g~ absolutr p m . in. Hg
Stnndnd abaolutr prarrwt. 29.92 in. Hg
- Stock gm volumclric flow mtr, dry acfm
. Ideal 8' comtnnt. 21.85
. Mctrr tcmpcmhm, R - Stock gna trmpsmm. R - S d s d ilcmpcmhm. 528 R
Vi vi v i Vi" Vm
Voutd . Gu m a r -PIC volume. dry @Id. f!3
Vs Vw Y
%COZ - Sbsk gw CO conccnhtion. XIIW
%N2 Stock gm N2 cooccnhtion. W l W
0 2 . Stock 8 - 0 2 sonccntmtion. W1W
. Wtrr vapor condmaad. impingsr I. g
. Wtrr Y a p ' c o o i d . impingsr 2. 8
. Wlcr Yapor codmaad. impingcr 3. g
. wtrr vapor c o d e d . impingcr 4. g
. Gm mctrr -PIC voIumc. d y N
. Sbck gw vclociry, R/.FE
. Told wakr vapor codmsad, N - Dy 8' mcter calbntion factor
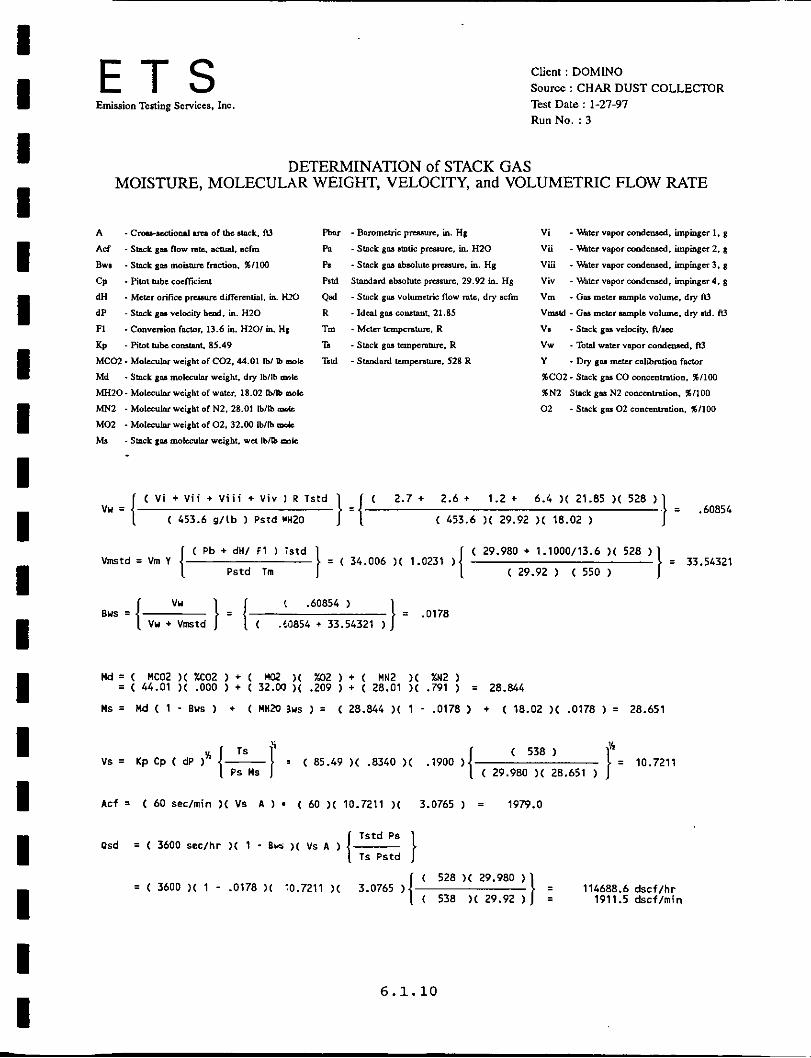
( 2.7 + 2.6 + 1.2 + 6.4 )( 21.85 )( 528 ) ] = .60854 ( 453.6 g l l b Pscd wH20 ( 453.6 29.92 )( 18.02 )
( V i + V i i + V i i i + Viv I R Tstd vu = {
= 33.54321 I ( 29.980 + 1.1000/13.6 )( 528 )
( 29.92 ) ( 550 ) = ( 34.006 )( 1.0231 ) 1 ( Pb + dH/ F 1 ) Ystd
Pstd Tn Vmscd = Vm V
= ,0178 B u s = { vu } = [ ,60854 )
Vu + Vmstd ( .'A854 + 33.54321
Md = ( MCO2 )( XCOZ f ( mY ) ( xO2 ) + ( MN2 xN2 )
Ms = Md ( 1 - Bus ) t ( M H X l aus ) = ( 28.844 )( 1 - .0178 ) + ( 18.02 )( .0178 = 28.651
= ( 44.01 )( .OOO ) + ( 32.00 )( .209 ) + ( 28.01 )( .791 ) = 28.844
= 10.7211 ( 538 1
( 29.980 28.651 ) Vs = Kp Cp ( dP ) - ( 85.49 )( .E340 )( ,1900 ) ' { P:'Ms 1 Acf = ( 60 seclmin )( Vs A ) - ( 60 10.7211 )( 3.0765 = 1979.0
Tstd Ps Qsd = ( 3600 s e c l h r )( 1 . Bur )( Vs A ) - [ Ts Pstd 1
= 114688.6 dscf/hr ( 538 )( 29.92 ) I =
( 528 )( 29.980 )
1911.5 dscflmin = ( 3600 )( 1 - .0178 ) ( 10.7211 )( 3.0765 )
6.1.10

I I I I I I I I I I I I I I I I I I I
E T S Emission Testing Services, Inc.
Client : DOMINO Source : CHAR DUST COLLECMR Test Date : 1-27-97 Run No. : 1
DETERMINATION OF PARTICULATE EMISSIONS page 1 of 2
dH - Average pressure differential, meter orifice, in-H20 Pbar - Barometric pressure at the sampling site, in Hg Pstd - Standard absolute pressure, 29.92 in Hg Tm - Average dry gas meter temperature, deg R Tstd - Standard absolute temperature, 528 deg R Vm - Volume of gas sample, actual dry ft3 Vmstd - Volume of gas sample, dry, Std. cond., DSCF Y - Dry gas meter calibration factor
Tstd Pbar + dHl13.6
Tm Pstd Vmstd = Vm y -__-____ -------___________
( 528 ) ( 30.03 + ( .7975/13.6)) 1
( 550. ) ( 29.92 I Vmstd ( 29.329 ) ( 1.0231 )(--------)(-----------------------
Vmstd = 28.97078
An - Cross-sectional area of nozzle, ft2 PS - Absolute stack gas pressure, in Hg Qsd - Dry volumetric stack gas flow rate, dscflhr St - Total sampling time, min Ts - Absolute stack gas temperature, deg R vs - Average stack gas velocity, ftlsec
ISOKINETIC SAMPLING RATE ----- ----- Ts Vmstd Pstd 100
Tstd Vs An St Ps ( 60 ) ( 1-Bws ) 1 = ..................................
I = 89.43
6.1.11

I I I
I I I I I I
E T S Emission Testing Services, Inc.
Client : DOMINO Source : CHAR DUST COLLECTOR Test Date : 1-27-97 Run No. : 1
DETERMINATION OF PARTICULATE EMISSIONS page 2 of 2
Ep - Particulate emission rate, lb/hr Css - Concentration of particulate, grain/DSCF Ca -Particulate concentration, blank DI water, mg/l Mf -Particulate catch on filter, mg Mn -Total particulate collected, mg Mp -particulate in probe wash, mg Vp -Volume, probe wash,ml
---- Solids, probe wash ---- Mp = ( Mp ) - ( Ca Vp ) = ( 7.71) -(.OOO ) ( 35.0 ) = 7.710
---- Solids, filter ---- Mf = 2.3
---- Total Solids collected ---- Mn = Mp + Mf
= ( 7.710 ) + ( 2.3 ) = 10.010
-------- CONCENTRATION and EMISSION RATE -------- Css = (Mn/Vmstd)(0.01543 grainjmg)
= ( 10.010/ 28.97078)(0.01543)
= .00533
Ep = ( Mn ) ( 2.2046 X 10⁻⁶ lb/mg ) ( Qsd ) / Vmstd
= ( 10.010) ( 2.2046 X 10⁻⁶ ) ( 108752.8 ) / ( 28.97078 )
.083 - -
6.1.12

I I I I I I I I I I I I I I I I I I I
E T S Emission Testing Services, Inc.
Client : DOMINO Source : CHAR DUST COLLECTOR Test Dale : 1-21-91 Run No. : 2
DETERMINATION OF PARTICULATE EMISSIONS page 1 of 2
dH Pbar Pstd Tm Tstd Vm Vmstd Y
Average pressure differential, meter orifice, in-H20 Barometric pressure at the sampling site, in Hg Standard absolute pressure, 29.92 in Hg Average dry gas meter temperature, deg R Standard absolute temperature, 528 deg R Volume of gas sample, actual dry ft3 Volume of gas sample, dry, Std. cond., DSCF Dry gas meter calibration factor
An - Cross-sectional area of nozzle, ft2 PS - Absolute stack gas pressure, in Hg Qsd - Dry volumetric stack gas flow rate, dscf/hr St - Total sampling time, min Ts - Absolute stack gas temperature, deg R vs - Average stack gas velocity, ft/sec
I = 98.92
6.1.13

I I I I I I I I I I I I I I I I I I I -
E T S. Emi~ioe Testing Services, Inc
Client : DOMINO Source : CHAR DUST COLLECTOR Test Date : 1-27-97 Run No. : 2
DETERMINATION OF PARTICULATE EMISSIONS page 2 of 2
Ep - Particulate emission rate, lb/hr Css - Concentration of particulate, grain/DSCF Ca -Particulate concentration, blank DI water, mg/l Mf -Particulate catch on filter, mg Mn -Total particulate collected, mg Mp -particulate in probe wash, mg Vp -Volume, probe wash,ml
---- Solids, probe wash ---- Mp =( Mp ) - ( Ca Vp ) = ( 39.60) -(.OOO ) ( 40.0 ) = 39.600
___- Solids, filter ---- Mf = 21.7
---- Total Solids collected ---- Mn = Mp + Mf
= ( 39.600 ) + ( 21.7 ) = 61.300
CONCENTR4TION and EMISSION RATE -------- -------- Css = (Mn/Vmstd)(0.01543 grainlmg)
= ( 61.3001 32.30350)(0.01543)
= .02928
Ep = Mn ) ( 2.2046 X 10⁻⁶ lb/mg ) ( Qsd ) 1 Vmstd
61.300) ( 2.2046 X 10⁻⁶ ) ( 109627.8 ) 1 ( 32.30350 )
.459
- - - -
6.1.14

I I I I I I I I I I I I I I I I I I I
E T S Emission Testing Services, Inc.
Client : DOMINO Source : CHAR DUST COLLECTOR Test Date : 1-27-97 Run No. : 3
DETERMINATION OF PARTICULATE EMISSIONS page 1 of 2
dH - Average pressure differential, meter orifice, in-H20 Pbar - Barometric pressure at the sampling site, in Hg Pstd - Standard absolute pressure, 29.92 in Hg Tm - Average dry gas meter temperature, deg R Tstd - Standard absolute temperature, 528 deg R Vm - Volume of gas sample, actual dry ft3 Vmstd - Volume of gas sample, dry, Std. cond., DSCF Y - Dry gas meter calibration factor -
Tstd Pbar f dH/13.6
Tm Pstd Vmstd = Vm y _ _ _ _ _ _ _ _ _ _ _ _ _ _ _ _ _ _ _ _ _ _ _ _ _ _
( 528 ) ( 29.98 + (1.1000/13.6)) Vmstd = ( 34 006 ) ( 1 0231 )(--------)(-----------------------)
( 550. 1 ( 29.92 1
Vmstd = 33.54321
Cross-sectional area of nozzle, ft2 Absolute stack gas pressure, in Hg Dry volumetric stack gas flow rate, dscf/hr Total sampling time, min Absolute stack gas temperature, deg R Average stack gas velocity, ftlsec
ISOKINETIC SAMPLING RATE ----- -----
I = 86.57
6.1.15

I I I I I I I I I I I I I I I I I I I
E T S Emiuion Testing Services. Inc
Client : DOMINO Source : CHAR DUST COLLECTOR Test Date : 1-27-97 Run No. : 3
DETERMINATION OF PARTICULATE EMISSIONS page 2of 2
Ep - Particulate emission rate, lb/hr Css - Concentration of particulate, grain/DSCF Ca -Particulate concentration, blank DI water, mg/l Mf -Particulate catch on filter, mg Mn -Total particulate collected, mg Mp -particulate in probe wash, mg Vp -Volume, probe wash,ml
---_ Solids, probe wash ---- Mp =( Mp ) - ( Ca Vp ) = ( 298.80) -(.OOO ) ( 90.0 ) = 298.800
---_ Solids, filter ---- Mf = 425.3
Total Solids collected ---- ---- Mn = Mp + Mf
= ( 298.800 ) + ( 425.3 ) = 724.100
CONCENTRATION and EMISSION RATE -------- - - - - - - - - Css = (Mn/Vmstd)(0.01543 grainfmg)
= ( 724.100/ 33.54321) (0.01543)
= .33309
Ep = ( Mn ) ( 2.2046 X 10⁻⁶ lb/mg ) ( Qsd ) / Vmstd
= ( 724.100)( 2.2046 X 10⁻⁶ ) ( 114688.6 ) / ( 33.54321 )
5.458 - -
6.1.16

I I I I I I I I I I I I I I I I I I I
During sampling, particulate was collected in the probe wash and on the filter. The
probe wash sample was transported to Chemtex's laboratory in Baton Rouge, Louisiana for
analysis of total solids. The filter sample was transported to ETS' laboratory in Baton Rouge,
Louisiana for analysis of total mass gain. Results of these analysis are presented on the
following pages.
6.1.17

I I I I I I I 1
CHEMTEX- Environmental & Industrial Hygiene Scwiccs
Client: E T S Inc. 10461 Mammoth Dr. Baton Rouge, LA 70814
16550 Highland Road, Baton Rouge, Louisiana 70810 (504) 752-5100 FAX (504) 753-1782
Report Date: 2/6/97 Sample Source: lmpingers Date Collected: 1/27&28/97 Collected By: KT/RD Date Received: 1/31/97 CHEMTEX FILE #: 87020168
RESULTS OF ANALYSIS
CLIENT: DOMINO SUGAR
Source Identification: ACM Vent & .C Dust Collector
Sample Volume Concentration Results CHEMTEX # Sample Identification Parameter - ml a mqlsample
87010168 Run-I Probe Wash Total Solids 165 644 106.26 w/Acetone (1/28/97)
w/Acetone (1/28/97) 87010169 Run-2 Probe Wash Total Solids 165 228 37.62
B7010170 Run-3 Probe Wash Total Solids 125 198 24.75 w/Acetone (1/28/97)
I 87010171 Run-I Probe Wash Total Solids 35 220 7.71 w/Acetone (1/27/97)
I B7010172 Run-2 Probe Wash Total Solids 40 990 39.6 .'3.i' .\ wlAcetone (1/27/97) .\ OFL.
b\\e' 1 B7010173 Run-3 Probe Wash Total Solids 90 3,320 298.8 w/Acetone (1/27/97)
1 B7010174 Blank Total Solids ___ < 2 -----
I Obtained Value -- True Value -- QC-Check Sample
Tstal Solids (mgll) 50 48/46'
* Duplicate Analysis
1 Parameter Method Reference - Date AnalvzedlAnalvsts
EPA Method 160.3 2/4/97 KR
QvdLJA i pap/CNR
I Y Dr. C. N. Reddy, Ph.D, CIH, ASP
Director
I
1 Accredited Facilities are also available at:
--.as 77642 (409) 9834575 FAX (409) 982- 1522 :hixi. Teras 78408 (512)299-9900 FAX (512) 299-1 I55 lr. Louiriana70663 (318)625-8898 FAX (318)625-5582
organic, Wet Chemical Oinlc~gicnl .md I~PIII~ ,0*7,<,h Q,,--. D^_. ....... and Industrial HYBicncSaVln. 6.1.18 Chemical A n r l y ~ r for Multi-media Environu?cnlrl
I

E T S EMISSION TESTING SERVICES, INC.
FILTER WEIGHTS
CLIENT &
UNIT ID
Filter Number
3d2/ 3522
Filter Sample Number ID
Initial Weight
Final Weight
Weight Gained
8 -27 ANALYSIS DATE 2 -/ ANALYST
FILE C:\ETS\H)RMS\FILT-PS
6.1.19
I I
I I I I I I I I' I I I i I I I I
. I ...
..".'.''. . I . , .. , .
. . . . , . ... . , ... . .
' * I
nlatanae a o f n l a i n a k e r
. O b 7 x
I. ,250 .3 5 0
.133
nl.arnul:rrr
10.5- 4.
1% 3 6
ne B t a o k
6.2.1

6.2.2
I I I
I I I I I I
E T S Emission Testing Services, Inc
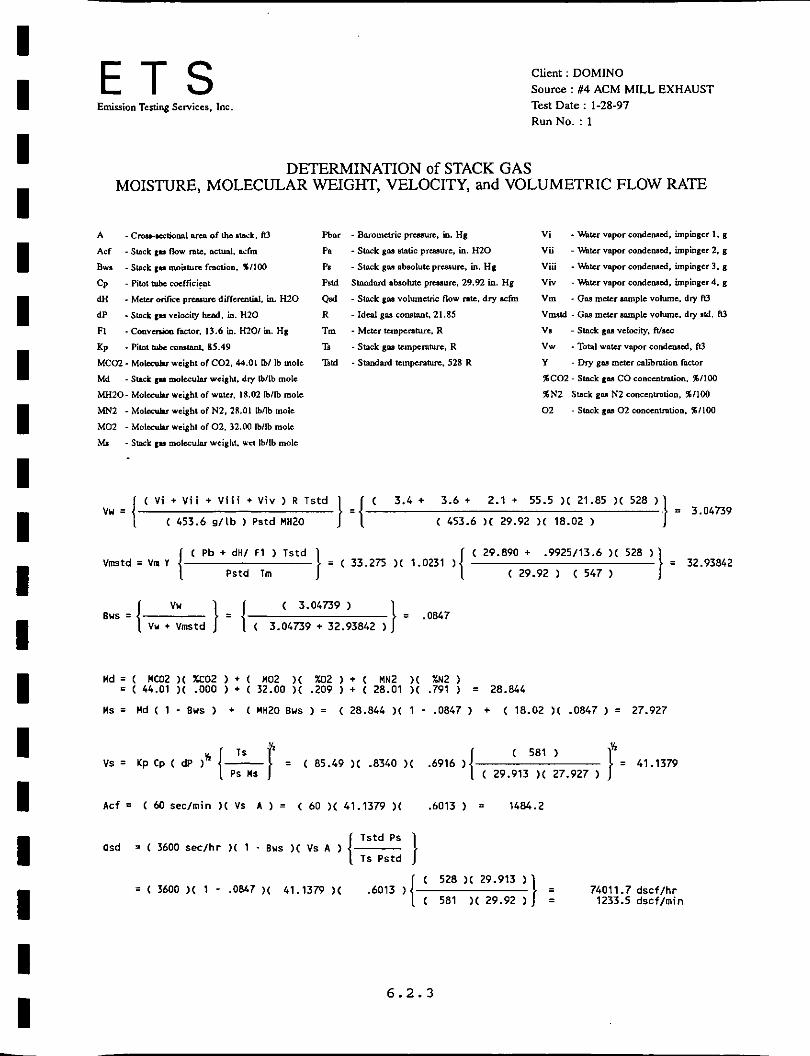
Client : DOMINO Source : #4 ACM MILL EXHAUST Test Date : 1-28-97 Run No. : 1
DETERMINATION of STACK GAS MOISTURE, MOLECULAR WEIGHT, VELOCITY, and VOLUMETRIC FLOW RATE
A
Acf
Bw.
. C m r r r k m l o m of ula .tack. P3
. Stack p Omr mu. actul. mfm
-Suck p mokmn fmdon. XllW
cp - Pilot Iul.8 m C f f i C i C l n
dH - M c t u p - w differmbl, in. HZO dP
FI
Kp
MCOZ . M O W weight of COZ. 44.01 01 Ib mole
Md
MHZO- Mol& wright of walcr, 18.02 lbllb molt
MN2 - M O W weight of NZ. 28.01 lbllb mole
MOZ - Mol& weight of 02. 12.W bllb mole
M. - S w k p molccvlnr weight. ~ ' c t Ibllb mob
. Stack p vrlaciy h d , in. H 2 0
. Conra*m factor. 13.6 in. H201 in. HE
. Pilot o h cons.tnnt. 85.49
. S u s t p moleeulv wci8hL dry lbllb mol^
( 3.4 + 3.6 + 2.1 + 55.5 )( 21.85 )( 528 )
( 453.6 ) < 29.92 )( 18.02 ) ] = 3.04739 1 = I ( V i + V i i + V i i i + Viv ) R Tstd
( 453.6 g/(b ) Pstd MH2O
( Pb + dH/ F l ) Tstd
Pstd Tm
v u = [
B u s = [ V W } = [ = 32.93842 I ( 29.890 + .9925/13.6 )( 528 )
( 29.92 ) ( 547 ) = ( 33.275 ) ( 1.0231 ) 1
= .a847 ( 3.04739
Vmstd = Vn I
Vu + Vmstd ( 3.04739 + 32.93842 )
Md = ( MW2 ) ( XED2 ) + ( M02 )( M 2 1 + ( MN2 )( XN2 ) = ( 44.01 ) ( .OOO ) + ( 32.00 )( .209 1 + ( 28.01 )( ,791 ) = 28.844
Ms = Rd ( 1 ~ Bus ) + ( MH2O Bus ) = ( 28.844 )( 1 - .OB47 ) + ( 18.02 ) ( .0847 1 = 27.927
= 41.1379 ( 581 ) I ( 29.913 )( 27.927 )
Vs = Kp CP ( dP 1' [&/ = ( 85.49 )( .8340 )( .6916 )
Acf = ( 60 sec/min )( Vs A = ( 60 )( 41.1379 )( .6013 ) = 1484.2
Tstd Ps asd = ( 3600 sec/hr ) ( 1 . Bus )( Vs A 1 - [ 1s Pstd ]
C 528 )( 29.913 ) 74011.7 dscf/hr I ( 581 )( 29.92 1 I = = 1233.5 dscf/min
= ( 3600 1 - .ON7 41.1379 .6013 )
6.2.3

I I
r-
I I I I I I I I I I I I I I I I I
- .
-
\
U
6.2.4
!
I I I I I I I I I I I I I I I I I I I
E T S Emission Testing Services, Inc
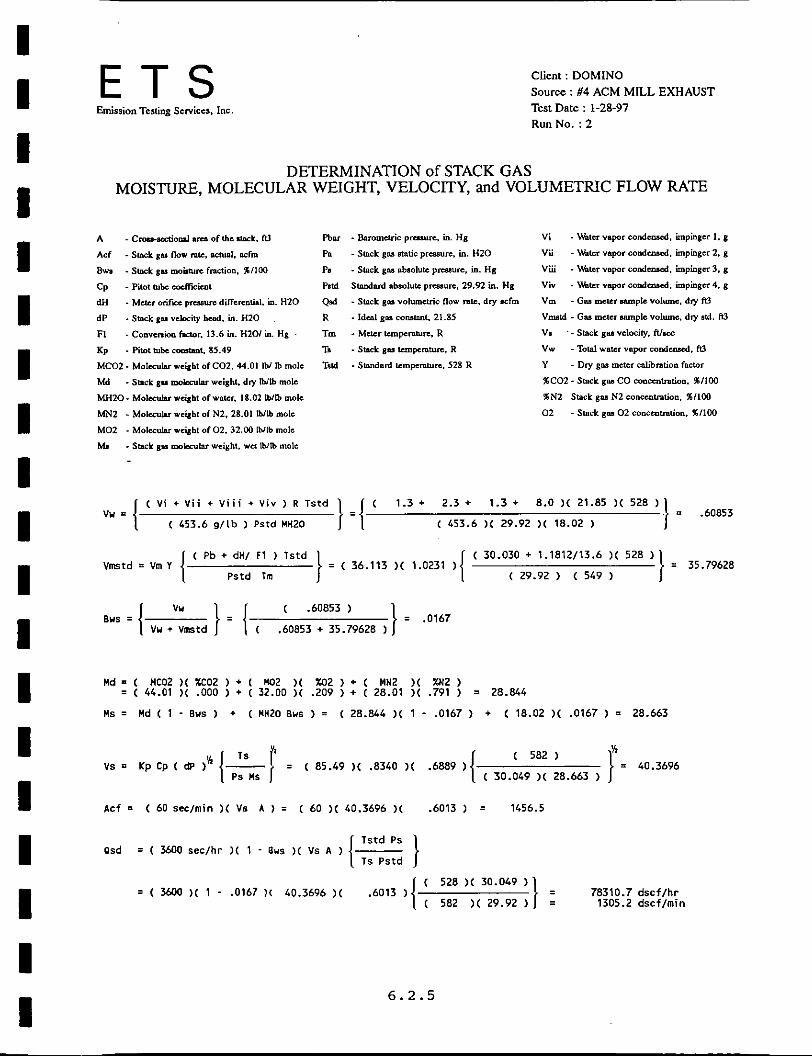
Client : DOMINO Source : #4 ACM MILL EXHAUST Test Date : 1-28-97 Run No. : 2
DETERMINATION of STACK GAS MOISTURE, MOLECULAR WEIGHT, VELOCITY, and VOLUMETRIC FLOW RATE
A
A d
Bun
- C m u d o d .1c1 of Ibe swk. N
.Sur gm Ilm m~c, xmnl, usfm
- Slnck g~ m o b fmdon. W l W
c p - Pitot rnk 4 & n t
dkl
dP
FI Rp . titotrnk -1. 85.49
MCOZ . M a l 4 w e h t of COZ. 44.01 Ib/ Ib mole
Md MHZO- M o L N h T w ~ h t ofwnter. 18.02 Wlb mole
MNZ - Molcsvhr wucjht of NZ. 28.01 W 0 male
MOZ . MolcsuLrw+hl of 02 .32 .W Wlb mob
. S w k g~ mohlnrwcight. w e W 0 mole
. M&r d r c -urcdiNennthl. h. HZO
. Stack EY velocity h d . in. HZO
. ConvsnaO hrtor. 13.6 in. HZO! in. HE
-Suck g~ mohlnrwcighl. dry W0 mole
( 1.3 + 2.3 + 1.3 + 8.0 )( 21.85 )( 528 )
( 453.6 )( 29.92 )( 18.02 ) ] = .60853
( V i + V i i + V i i i + V i v ) R Tstd
( 453.6 g / lb ) P s t d MH2O
( Pb + dH/ F 1 1 Tstd
Pstd Tm
vu = {
I B u s = { vu } = [
= 35.79628 1 ( 30.030 + 1.1812/13.6 ) ( 528 1
( 29.92 ) ( 549 ) I = ( 36.113 )( 1.0231 1 = .0167
( .60853 )
Vmstd = Vm Y
Vu + Vmtd ( .60853 + 35.79628 >
)Id = ( MC02 )( 7202 ) + ( M2 )( rO2 ) + ( MN2 )( ZN2 )
Ms = Md ( 1 - Bus ) + ( MHZO BYS ) = ( 28.844 1 - .0167 ) + ( 18.02 )( ,0167 ) = 28.663
= ( 44.01 ) ( .OOO ) + ( 32.00 )( .209 ) + ( 28.01 )( .791 ) = 28.844
r= 40.3696 ( 582 )
( 30.049 )( 28.663 )
1s
PS us V s = KpCp(&' ,"{ - l ' - - ( 85.49 )( .e340 .6889 )
Acf = ( 60 sec/min )( Vs A ) = ( 60 )( 40.3696 )( .6013 ) = 1456.5
Tstd Ps Psd = ( Moo seclhr 1 - Bus ) ( Vs A ) - [ 1s Pstd 1
( 528 )( 30.049 ) 78310.7 dscf/hr I ( 582 ) ( 29.92 ) I = = 1305.2 dscf/min
= ( Mw ) ( 1 - ,0167 I ( 40.3696 ) ( .6013 )
6.2.5
I I I I I I I I I. I I I I I I
_-
I I I I 6.2.6

I I I I I I I I I I I I
E T S Emission Testing Services, Inc.
Clicnt : D O M I N O Source : #4 A C M MILL EXHAUST Test Date : 1-28-97 Run No. : 3
DETERMINATION of STACK GAS MOISTURE, MOLECULAR WEIGHT, VELOCITY, and VOLUMETRIC FLOW RATE
A
Acf
Bun
. C - d d a m of tbc .trick. IU
. Slnck EY flaw ne. d. d m
. Smk EY mois- friction. SI IW
c p . Pitot mba uxmcicnt
dH
dP
FI
- Mar arilisc p m u n diffcnntid. in. HZO
- Stack g u velocity bcad. in. HZO
- Convcnim factor. 13.6 in. HZOI in. HE
- Pitot tuba S o m s 85.49 Kp MCOZ - Mo,lssu!m weight ofCOZ. 44.01 IN Ib mole
Md MH20- Molcculuwcight ofuntcr. 18.02 lblb mole
MNZ - Molcsu!m wcight of NZ. 28.01 lNb mole
MOZ - Molcsulu wcigbt of 02. 32.00 lNlb mole
M. - SDck g' molccvlv vcighl. wct INIb mob
- Stack gts rnolsfuh wcight. dry lblb mole
( 1.6 + 2.7 + 1.2 + 7.8 )( 21.85 )( 528 ) } = .62740 1 = I ( 453.6 29.92 18.02 )
( V i + V i i + V i i i + Viv ) R Tstd
( 453.6 g/tb 1 Pstd " 2 0 vu = [
= 36.48100 ( 30.020 + 1.1875/13.6 )( 528 ) I Pstd Tm I ( 29.92 ) ( 545 )
= ( 36.568 )( 1.0231 I ( Pb + dH/ F 1 ) Tstd Vmstd = Vm I
= .0169 B u s = { vu } = [ ( .62740 )
Vu + Vmstd ( .62740 + 36.48100 )
Md = ( MCO2 X 0 2 ) + ( M02 )( m 2 1 + ( MN2 )( %N2 )
Hs = Md ( 1 - Bus ) + ( MH2O Bus ) = ( 28.844 )( 1 - ,0169 ) + ( 18.02 )( .0169 ) = 28.661
= ( 44.01 )( .OOO ) + ( 32.00 ) ( .209 ) i ( 28.01 )( .791 ) = 28.844 I = 40.2299
( 578 ) I ( 30.041 28.661 )
1s
Ps Hs Vs = Kp Cp ( dP )' I-, ' - - ( 85.49 )( .E340 )( .6884 )
I Acf = ( 60 seclmin Vs A = ( 60 )( 40.2299 )( .6013 = 1451.5 I asd = ( 3600 sec/hr
( 528 )( 30.041
( 578 )( 29.92 ) I = = 78473.5 dscflhr
1307.9 dscflmin = ( 3600 )( 1 - ,0169 ) ( 40.2299 ) ( .6013 1
I I I I
6 . 2 . 7

I I I I I I I I I I I I I I I I I I I
I
E T S Emiwion Testing Services, Inc
Client : DOMINO Source : #4 ACM MILL EXHAUST Test Date : 1-28-97 Run No. : 1
DETERMINATION OF PARTICULATE EMISSIONS page 1 of 2
dH - Average pressure differential, meter orifice, in-H20 Pbar - Barometric pressure at the sampling site, in Hg Pstd - Standard absolute pressure, 29.92 in Hg Tm - Average dry gas meter temperature, deg R Tstd - Standard absolute temperature, 528 deg R Vm - Volume of gas sample, actual dry ft3 Vmstd - Volume of gas sample, dry, Std. cond., DSCF Y - Dry gas meter calibration factor
Tstd Pbar + dHl13.6 Tm Pstd
Vmstd = Vm y _ _ _ _ _ _ _ _ _-_--------______-
( 528 ) ( 29.89 + ( .9925/13.6)) Vmstd = ( 33 275 ) ( 1 0231 )(--------)(-----------------------)
( 547. ) ( 29.92 1
Vmstd = 32.93842
An - Cross-sectional area of nozzle, ft2 PS - Absolute stack gas pressure, in Hg Qsd - Dry volumetric stack gas flow rate, dscflhr St - Total sampling time, min Ts - Absolute stack gas temperature, deg R vs - Average stack gas velocity, ft/sec
I = 94.55
6.2.8

I I I I I I I I I I I I I I I I I I I
E T S Emission Testing Services, Inc.
Client : DOMINO Source ; #4 ACM MILL EXHAUST Test Date ; 1-28-97 Run No. : 1
DETERMINATION OF PARTICULATE EMISSIONS page 2 of 2
Ep - Particulate emission rate, lblhr Css - Concentration of particulate, grain/DSCF Ca -Particulate concentration, blank DI water, mg/l Mf -Particulate catch on filter, mg Mn -Total particulate collected, mg Mp -particulate in probe wash, mg Vp -Volume, probe wash,ml
---- Solids, probe wash ---- Mp =( Mp ) - ( Ca Vp ) = ( 106.26) -(.OOO ) ( 165.0 ) = 106.260
---- Solids, filter ---- Mf = 85.4
---- Total Solids collected ---- Mn = Mp i Mf
= ( 106.260 ) + ( 85.4 ) = 191.660
CONCENTRATION and EMISSION RATE -------- - - - - - -- - Css = (Mn/Vmstd)(0.01543 grain/mg)
= ( 191.6601 32.93842)(0.01543)
= .08978
Ep = ( Mn ) ( 2.2046 X 10⁻⁶ lb/mg ) ( Qsd ) 1 Vmstd
= ( 191.660)( 2.2046 X 10⁻⁶ ) ( 74011.7 ) 1 ( 32.93842 )
.949 - -
6.2.9

I I I I I I I I I I I I I I I I I I I
E T S Emission Testing Services, Inc.
Client ; DOMINO Source ; #4 ACM MILL EXHAUST Test Date : 1-28-97 Run No. ; 2
DETERMINATION OF PARTICULATE EMISSIONS page 1 of 2
dH - Average pressure differential, meter orifice, in-H20 Pbar - Barometric pressure at the sampling site, in Hg Pstd - Standard absolute pressure, 29.92 in Hg Tm - Average dry gas meter temperature, deg R Tstd - Standard absolute temperature, 528 deg R Vm - Volume of gas sample, actual dry ft3 Vmstd - Volume of gas sample, dry, Std. cond., DSCF Y - Dry gas meter calibration factor
Tstd Pbar + dHl13.6 Tm Pstd
Vmstd = Vm y _ _ _ _ _ _ _ _ _ _ _ _ _ _ _ _ _ _ _ _ _ _ _ _ _ _
An - Cross-sectional area of nozzle, ft2 PS - Absolute stack gas pressure, in Hg Qsd - Dry volumetric stack gas flow rate, dscflhr St - Total sampling time, min Ts - Absolute stack gas temperature, deg R vs - Average stack gas velocity, ft/sec
I = 97.12
6.2.10

I I I I I I I I I I I I I I I I I
E T S Emission Testing Scrvicss, Inc.
Client : DOMINO Source : #4 ACM MILL EXHAUST Test Date : 1-28-97 Run No. : 2
DETERMINATION OF PARTlCULATE EMISSIONS page 2 of 2
Ep - Particulate emission rate, lb/hr Css - Concentration of particulate, grain/DSCF Ca -Particulate concentration, blank DI water, mg/l Mf -Particulate catch on filter, mg Mn -Total particulate collected, mg Mp -particulate in probe wash, mg Vp -Volume, probe wash,ml
---- Solids, probe wash ---- Mp =( Mp ) - ( Ca Vp ) = ( 37.62) - ( . O O O ) ( 165.0 ) = 37.620
---- Solids, filter ---- Mf = 12.6
---- Total Solids collected ---- Mn = Mp + Mf
= ( 37.620 ) + ( 12.6 ) = 50.220
- - - - - - - - CONCENTRATION and EMISSION RATE -------- Css = (Mn/Vmstd) (0.01543 grain/mg)
= ( 50.220/ 35.79629) (0.01543)
= .02165
Ep = ( Mn ) ( 2.2046 X 10⁻⁶ lb/mg ) ( Qsd ) / Vmstd
= ( 50.220)( 2.2046 X 10⁻⁶ ) ( 78310.7 ) / ( 35.79629 )
.242 - -
6.2.11

I I I
I I I I I I I
E T S Emiaaion T d n g Services, In$.
Client : DOMINO Source : #4 ACM MILL EXHAUST Test Date : 1-28-97 Run No. : 3
DETERMINATION OF PARTICULATE EMISSIONS page 1 of 2
dH Pbar Pstd Tm Tstd Vm Vmstd Y
- Average pressure differential, meter orifice, in-H20 - Barometric pressure at the sampling site, in Hg - Standard absolute pressure, 29.92 in Hg - Average dry gas meter temperature, deg R - Standard absolute temperature, 528 deg R - Volume of gas sample, actual dry ft3 - Volume of gas sample, dry, Std. cond., DSCF - Dry gas meter calibration factor
An - Cross-sectional area of nozzle, ft2 PS - Absolute stack gas pressure, in Hg Qsd - Dry volumetric stack gas flow rate, dsc€/hr St - Total sampling time, min Ts - Absolute stack gas temperature, deg R vs - Average stack gas velocity, ft/sec
----- ISOKINETIC SAMPLING RATE -----
I = 98.77
6.2.12

I I I I I I I I I I I I I I I I I I I
E T S Emission Testing Services, Inc,
Client ; DOMINO Source : #4 ACM MILL EXHAUST Test Date ; 1-28-97 Run No. ; 3
DETERMINATION OF PARTICULATE EMISSIONS page 2of 2
Ep - Particulate emission rate, lb/hr Css - Concentration of particulate, grain/DSCF Ca -Particulate concentration, blank DI water, mg/l Mf -Particulate catch on filter, mg Mn -Total particulate collected, mg Mp -particulate in probe wash, mg Vp -Volume, probe wash,ml
---- Solids, probe wash ---- Mp =( Mp ) - ( Ca Vp ) = ( 24.75) - ( . O O O ) ( 125.0 ) E 24.750
---- Solids, filter ---- Mf = 8.2
---- Total Solids collected ---- Mn = Mp + Mf
= ( 24.750 ) + ( 8.2 ) = 32.950
CONCENTRATION and EMISSION RATE -------- - - - - - - - - Css = (Mn/Vmstd) (0.01543 grainjmg)
= ( 32.950/ 36.48100) (0.01543)
= .01394
Ep = ( Mn ) ( 2.2046 X 10⁻⁶ lb/mg ) ( Qsd ) / Vmstd
= ( 32.950)( 2.2046 X 10⁻⁶ ) ( 78473.5 ) / ( 36.48100 )
.156 - -
6.2.13

I I I I I I I I I I I I I I I I I I I
During sampling, particulate was collected in the probe wash and on the filter. The
probe wash sample was transported to Chemtex's laboratory in Baton Rouge, Louisiana for
analysis of total solids. The filter sample was transported to ETS' laboratory in Baton Rouge,
Louisiana for analysis of total mass gain. Results of these analysis are presented on the
following pages.
6.2.14

I I I I I I I I
CHEMTEX Environmental & Induslrial Hygiene Scrvtces
Client: ET S Inc. 10461 Mammoth Dr. Baton Rouge, LA 70814
16550 Highland Road, Baton Rouge. Louisiana 70810 (504) 752-5100 FAX (504) 753-1782
Report Date: 2/6/97 Sample Source: lmpingers Date Collected: 1/27&28/97 Collected By: KT/RD Date Received: 1/31/97 CHEMTEX FILE #: 87020168
RESULTS OF ANALYSIS
CLIENT: DOMINO SUGAR
Source Identification: ACM Vent B BC Dust Collector
Sample Volume Concentration Results CHEMTEX @ Sample Identlflcation Parameter - ml rnalsarnple
67010168 Run-1 Probe Wash Total Solids 165 644 106.26 w/Acetone (1128197)
67010169 Run-2 Probe Wash Total Solids 165 220 37.62 w/Acetone (1/28197)
w/Acetone (1/28/97) 67010170 Run-3 Probe Wash Total Solids 125 198 24.75
I - - __ . __ ____ . . , , .
b u n - 1 Probe Wash Total Solids 35 220 7.71 w/Acetone (1127197)
I 67010172 Run-2 Probe Wash Total Solids 40 990 39.6 " \
1 87010174 Blank Total Solids -__ < 2
w/Acetone (1127197) .lo+ Lo\\e' I 67010173 Run-3 Probe Wash Total Solids 90 3,320 298.8
w/Acetone (1127197)
Obtained Value -- True Value QCCheck Sample
Total Solids (rngll) 50 48/46'
* Oupllcale Analysis
--
1 Parameter Method Reference - Date AnalvzedlAnalvsts
I Total
paplCNR I
EPA Method 160.3 2/4/97 KR
Y ~~
Dr. C. N. Reddy, Ph.D, CIH, ASP Director

E T S FMISSION TESTING SFXVICES. mc.
FILTER WEIGHTS
CLIENT M
Sample ID
Initial Weight
Final Weight
Weight Gained
Filter Number
ma 302 3 ?O..z
Filter Number
Final Weight
Weight Gained
Sample ID
L L 2 7
ANALYST ANALYSIS DATE 2 -/‘-fl FILE: C:\ETS\FORMS\RLT-II
6.2.16

I I I
VII. APPENDIX
The following appendices are presented as supporting documentation to the emission
test report.
7.1.1 Resumes of Test Personnel
7.2.1 Test Equipment Calibrations
7.0.1
I I I I I I I I I I I I I I I I I I I
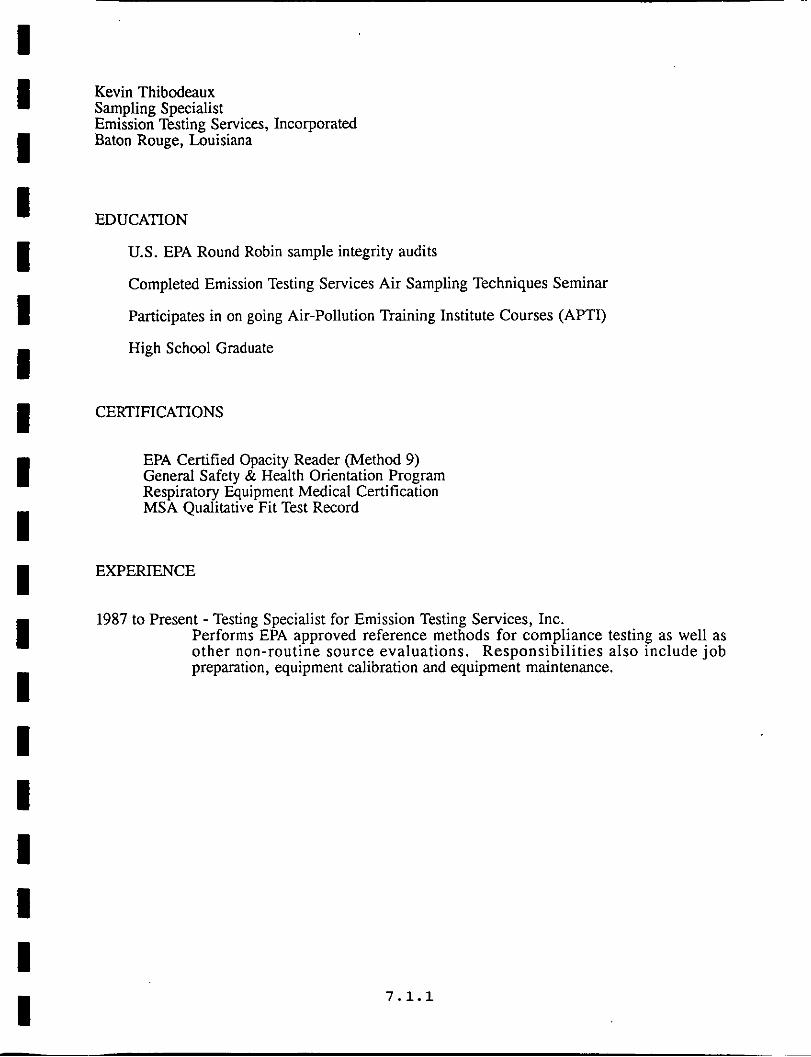
Kevin Thibodeaux Sampling Specialist Emission Testing Services, Incorporated Baton Rouge, Louisiana
EDUCATION
U.S. EPA Round Robin sample integrity audits
Completed Emission Testing Services Air Sampling Techniques Seminar
Participates in on going Air-Pollution Training Institute Courses (APTI)
High School Graduate
CERTIFICATIONS
EPA Certified Opacity Reader (Method 9) General Safety & Health Orientation Program Respiratory Equipment Medical Certification MSA Qualitative Fit Test Record
EXPERIENCE
1987 to Present - Testing Specialist for Emission Testing Services, Inc. Performs EPA approved reference methods for compliance testing as well as other non-routine source evaluations. Responsibilities also include job preparation, equipment calibration and equipment maintenance.
7.1.1

Ryan Deaville Sampling Technician Trainee Emission Testing Services. Incorporated Baton Rouge, Louisiana
I I
CERTIFICATIONS
EDUCATION
I High School Graduate
I I I I I I I I I I I I I I I
General Safety & Health Orientation Program Respiratory Equipment Medical Certification MSA Qualitative Fit Test Record
EXPERIENCE
06/96 to Present - Testing trainee technician for Emission Testing Services, Inc. Supports in performing EPA approved reference methods for compliance testing as well as other non-routine source evaluations. Responsibilities also include job preparation. equipment calibration and eqyipment maintenance.
7.1.2

I I I I I I I I I I I I I I I I I I I
Jeff M. Savoie Sampling Technician Trainee Emission Testing Services, Incorporated Baton Rouge, Louisiana
EDUCATION
Louisiana State University B.S. -- Environmental Management Systems
CERTIFICATIONS
EPA Certified Opacity Reader (Method 9) General Safety & Health Orientation Program Respiratory Equipment Medical Certification MSA Qualitative Fit Test Record
EXPERIENCE
10/95 to Present - Testing trainee technician for Emission Testing Services, Inc. Supports in performing EPA approved reference methods for compliance testing as well as other non-routine source evaluations. Responsibilities also include job preparation, equipment calibration and equipment maintenance.
7.1.3

I
Orifice wci Test Dry G a s Meter Readings Hclta H Mclcr Selling Reading Initial Final To131
! (W VJ W4h (V'A (v,$ in. H,O I1 J I1 J It' 11'
I I I I I I I I I I I I I I I
Wcl Terl Dry Gar Melcr R u n Mclcr lnlcl O U l l C l Avg l i m e
Reading
CrJ. Cr,J Cr,$ FA (OX 'F 'F 'F *F Mi".
ETS W S S I O N l"G SWVICC. INC.
M m E R BOX CALIBRATION DATA AND CALCULATION FORM (English Units) .-
Leak Check Good @: ,(? rt3
Barometric Pres., P,: in. Hg
Meter Box Number: /o Date Calibrated: ) - jb - ,y7
i, I
AH V- P, ' F,, + 460)
13.6
- y.'-
V,, * (P, + F,) * (I, + 460)
0 . 0 3 1 7 ' N l ( T - + 4 6 0 ) ' 0 '
. [ v_ ] Ni@ = P, * (1,. + 460)
Y= Ratio of reading of wet test meter to dry test meter; tolurance for individual values z 0.02 from average.
and 29.92 inches of mercury, in. H,O tolerance for individual values 2 0.20 from average.
AH@= Orifice pressure differential t ha t equates to 0.75 cfm of air @ 68 O F
\
Calibrated by: Lc&,c\ r % I - L Q - i k h
' \
7 . 2 . 1

E T S EMISSION TESTING SERVICES, INC.
I
I I I
I' I I
THERMOCOUPLE CALIBRATION FORM
I
CALIBRATED BY: t r R $ q 2 5A Ah-n DATE: /-jk-??
METER BOX NUMBER: 0 BAROMETRIC PRESSURE: 140.5 3 > \
TRIAL
1
2
3
AVG
THERMOMETER ICE BATH
(Tf) 1 0 -30
.7 'r)
THERMOCOUPLE THERMOMETER THERMOCOUPLE ICE BATH BOILING WATER BOILING WATER (TCf) (Tb) (TCb)
a-IC A 4 0
- - Tb - TCb
0 % ERROR @ BOILING POINT = x 100 = \.o /o p r c nl(
- - Tf - TCf
% ERROR @ FREEZING P O I N T = x 100 = -.@aJ/g e r r p r
OKAY IF -1.5% < % ERROR < + 1.5%
REFERENCE METHOD 2 SECTION 4.3
b I
7 . 2 . 2
-

I ETS EMlSSlON TEIESIING SFRVICB. INC
I-, PITOT TUBE CALIBRATION FORM
I I I I I I I -I
I I I I I
Pitot Tube Number: - 3 - \ Calibrated By: SPyu-0 ( 4 ,
Stardard "s" Type Pitot M , in H,O
Number Pitot M Impact Static Point
(in. H,O) Side Side
L O W 0. I O 5 0 . ( O 0. / s o Mid 0. 5x5 0.8 2 0. g / s High I I / Q 1.55 b / S . r
CALCULATIONS
A P(',d,
A P(S,
(Impact Side or Static Side)
i CP,, = cP(scd,
- Deviation = CP@) - c p
Avg. Dev. =
3 c I CP(,, - CPI I (Impact Side or Static Side)
3
Impact Side Static Side
Deviation cp (0 Denation cp (4 0 . R Z R 0. 0. 0.00d 0.83d 0 . 0 0 3 ucf!L (3.065 0. %\q O . O O \ 0. k3L( 0 .OO b -
cP= 0 . %33 G= n.V.74
I (Static Side) - 5 (Impact Side) I = 0. ao\ (Must be 5 0.01) I Avgerage Deviation (Impact Side) - - 0.003 (Must be 5 0.01)
Avgerage Deviation (Static Side) - - 0. 004 (Must be 5 0.01)
I, ""'Cp = (Static Side) + (Impact Side) (Should be 0.80 5 Cp 5 0.85) = 0.g3q I 2
I 7 . 2 . 3