background to the uk national annexes tobackground to uk national annexes to en 1990 annexa2 and...
TRANSCRIPT

Background to the UK National Annexes to EN1990: Basis of Structural Design -
Annex A2 : Application for Bridges
EN1991-2: Traffic Loads on Bridges
Report prepared by Atkins Highways and Transportation
On behalf of The Highways Agency
Notice
This document and its contents have been prepared and are intended solely for Highways Agency’s information and use in relation to the Eurocode Commission.
Atkins Highways and Transportation assumes no responsibility to any other party in respect of or arising out of or in connection with this document and/or its contents.
JOB NUMBER: 4184274 DOCUMENT REF: 4184274.014/MM/R2/02
1 Draft for comment NS,MM MM - IKR March 2003
2 2nd
Draft For Comment NS,MM NS RDB IKR April 2004
Final Updated to Include Centrifugal Comparison
NS,MM NS RDB IKR Jan 2005
Originated Checked Reviewed Authorised Date
Revision Purpose Description

BACKGROUND TO UK NATIONAL ANNEXES TO
EN 1990 AnnexA2 and EN1991-2
4184274.014\MM\R2\Issue 2 i Jan 2004
Contents Section Page
1 Introduction 1
2 Objectives 1
3 Review of the Basis of Type HA Loading 2
3.1 Static Loading 2 3.2 Dynamic Amplification Factors 5
3.3 Combined Static and Dynamic Loading 5
4 Derivation of -factors for Traffic Loading 7
4.1 Load Model 1 7 4.2 Factors Influencing Calibration 7
4.3 Calibration of -factors 10
4.4 Loaded Length up to 1600m 17
5 Derivation of Load Partial Factors 19
5.1 Reliability Implicit in BD37 20
5.2 Choice of Target Reliability Index 22 5.3 Calibration of Load Partial Factors 22
5.3.1 Partial Factor for Wind Actions 25 5.4 Serviceability Limit State Partial Factors 25
6 Combination, frequent and infrequent factors 25
6.1 Traffic Combined with Wind Actions 26 6.2 Frequent and Infrequent Representative Traffic Action 27 6.3 Quasi-Permanent Traffic Action 28
7 Calibration of Load Model 3 29
8 Centrifugal forces 31
9 Discussion and Conclusions 32
10 References 34

BACKGROUND TO UK NATIONAL ANNEXES TO
EN 1990 AnnexA2 and EN1991-2
4184274.014\MM\R2\Issue 2 ii Jan 2004
List of Tables
Table 1: Comparison of -factors ............................................................................. 11
Table 2: Comparison of Factored load intensities for ULS ....................................... 11
Table 3: Comparison of Factored load intensities for SLS ....................................... 12
Table 4: Calibrated Partial Factors for ULS .............................................................. 23
Table 5: Calibrated Partial Factors for SLS .............................................................. 25
Table 6: Calibrated Combination, Frequent and Infrequent Factors ......................... 26
Table 7 Ratio of NA to BD86 Load Effects for Special Vehicles (LM3)................ 30
List of Figures
Figure 1: Comparison of extreme static load effects from different sources ............... 4
Figure 2: Comparison of Dynamic Amplification Factors for single lane..................... 5
Figure 3: Comparison of nominal load effects ............................................................ 6
Figure 4: Eurocode Load Model 1 for normal traffic ................................................... 7
Figure 5: Comparison of lane width and number of lanes .......................................... 8
Figure 6: Comparison of ULS load effects: Shear, 3.0m Lane Width ....................... 13
Figure 7: Comparison of ULS load effects: Moment, 3.0m Lane Width .................... 13
Figure 8: Comparison of ULS load effects: Shear, 3.65m Lane Width ..................... 14
Figure 9: Comparison of ULS load effects: Moment, 3.65m Lane Width .................. 14
Figure 10 Moment Comparison with BD37 ......................................................... 16
Figure 11 Moment Comparison with BD37 ......................................................... 17
Figure 12 Moment Comparison with BD37- 3m Lane – Longer Spans ............... 18
Figure 13 Shear Comparison with BD37- 3m Lane – Longer Spans .................. 18
Figure 14: Reliability Implicit in BD37: Lane 1+2 Bending ........................................ 21
Figure 15: Reliability Implicit in BD37: Lane 1+2 Shear ........................................... 21
Figure 16: Results for National Annex: Bending, Lanes 1+2 .................................... 24
Figure 17: Results for National Annex: Shear, Lanes 1+2 ....................................... 24
Figure 18 Variable Action Combination Rule Comparison .................................. 27

BACKGROUND TO UK NATIONAL ANNEXES TO
EN 1990 AnnexA2 and EN1991-2
4184274.014\MM\R2\Issue 2 1 Jan 2004
1 INTRODUCTION
This report has been prepared by Atkins Highways and Transportation on behalf of the Highways Agency as part of the Framework Contract for the Implementation of Eurocodes for bridges in the UK.
A proposal for the derivation of load partial factors and load combination factors was presented in [Atkins, 2002(a)].
Phase I of the project, completed in July 2002 [Atkins, 2002(b)], compared reliability levels implicit in DMRB (Design Manual for Roads and Bridges) and the two formats for combination of actions given in EN1990, represented by equations (6.10) or (6.10-a and 6.10-b). Given the small difference in reliability between the two combination formats, the report recommended that format given by Eq. (6.10) be adopted for the sake of simplicity.
This report presents preliminary results of Phase II of the project for the derivation of load partial factors. It also presents the work carried out for the
derivation of load adjustment factors (Qi and qi) for the traffic load model LM1
for use in the National Annex for EN1991-2: Traffic Loads on Bridges. The -factors have a direct influence on reliability and need to be finalised along with the load partial factors.
2 OBJECTIVES
Phase II of the project has the following objectives:
1. Review of the basis of the Type HA loading model given in BD37
2. Derivation of -factors for Load Model 1 by deterministic calibration against BD37 loading
3. Derivation of load partial factors by reliability based calibration against BD37
4. Derivation of load combination factors by reliability based calibration against BD37
This preliminary report covers only the first three of the above objectives and is limited to load combinations involving self weight and highway traffic.

BACKGROUND TO UK NATIONAL ANNEXES TO
EN 1990 AnnexA2 and EN1991-2
4184274.014\MM\R2\Issue 2 2 Jan 2004
3 REVIEW OF THE BASIS OF TYPE HA LOADING
The Type HA loading model given in BD37 was first introduced in 1988. The model comprises a uniformly distributed load (udl), the intensity of which varies with loaded length, and a constant Knife Edge Load (KEL) of 120 kN. The lane factors for different lanes account for the simultaneity of loading in adjacent lanes as a function of loaded length.
The model for spans up to 50m was derived using a deterministic method by evaluating the extreme load effects caused by single, tandem and multiple vehicles over bridge influence lines and fitting an udl and KEL model to envelope these effects. The loading for spans > 50m was derived from probabilistic simulation of extreme traffic effects using a Monte Carlo approach.
The basis of the short span loading model is reviewed below in the light of new information available at the present time on:
Increased legal limits of vehicle weights
Levels of overloading above legal limits observed from weigh-in-motion measurements
Dynamic effects of traffic loading on bridges
3.1 Static Loading
In deriving the BD37 short span loading model the following factors were considered based on the information available at the time:
Static load effects due to heavy goods vehicles with gross vehicle weights of up to 38 tonnes for C&U and AW vehicles and 44 tonnes for STGO Category 1 vehicles moving in single, tandem or in convoy within a traffic lane
An overloading factor of 1.4 based on vehicle weights from road side surveys measured using a static weigh bridge. The overload factor was reduced linearly from 1.4 at 10m to unity at 60m loaded length
An impact factor of 1.8 on the worst effective axle based on TRRL Report LR722
A bunching factor of 3.65/2.5=1.46 to account for the possible increase in loading caused by three vehicles bunching side-by-side into two lanes of 3.65m standard lane width. The bunching factor was reduced linearly to unity as the loaded length increased from 20m to 40m. The bunching factor was corrected for notional lanes of widths less than 3.65m using the lane factors for loaded lengths less than 40m
The extreme load effect determined as above considering worst credible values for the different factors was considered to correspond to the “design load” and hence was divided by 1.5 (partial factor for traffic loading) to obtain the “nominal loading”
An allowance of 10% was made for future increases in loading.

BACKGROUND TO UK NATIONAL ANNEXES TO
EN 1990 AnnexA2 and EN1991-2
4184274.014\MM\R2\Issue 2 3 Jan 2004
With the introduction of European Lorries into the UK, the legal limits of AW vehicles have increased for axle loads from 10.5 tonnes to 11.5 tonnes and for gross vehicle weights from 38 tonnes to 40 tonnes. This is likely to increase the loading marginally for most loaded lengths.
Extensive data on vehicle weights of commercial vehicle has become available in recent years with the introduction of weigh-in-motion stations across the country. Analysis of this data has shown that some 5% of vehicles during a 2-3 week period can have gross vehicle weights in excess of legal limits. The worst overloading factor is now considered to be of the order of 1.6 compared to the value of 1.4 used in the derivation of Type HA loading. Furthermore, for freely flowing traffic, the extreme load effects are governed by single vehicles in the span range 10m to 20m and hence are likely to be influenced by full overloading.
Recent research carried out as part of the derivation of the revised short span assessment live load in BD21 (see Cooper, 1997) showed that free-flow traffic with high speed impact and without lateral bunching is the most onerous condition for short span bridges up to 50m loaded length. Therefore it is not appropriate to apply the bunching factor and this was subsequently removed in deriving the assessment live load in BD21.
Recent studies into the dynamic behaviour of bridges in supporting moving traffic have provided better understanding on the Dynamic Amplification Factors to be applied to static load effects (see Section 3.2).
Probabilistic simulation studies carried out by Flint & Neill Partnership, Atkins and the background research for the development of the Eurocode loading
model show that the ultimate load (i.e. 1.5HA) given in BD37 has a lower return period than the 200,000 years assumed in the derivation of Type HA loading. This suggests that the approach of dividing the worst vehicle effects by 1.5 to obtain the nominal load may not be appropriate.
In the light of the above findings it was considered appropriate to repeat the process used in the derivation of the Type HA loading for short spans but with revised considerations as discussed above. For expediency only loaded lengths up to 20m were considered where the worst load effect is caused by single vehicles or groups of axles. The vehicle configurations given in Annex D of BD21 were used for this exercise.
The static moment effects (excluding impact and dynamic effects) derived from the above approach (denoted “Annex D Vehicle-Static”) are compared in Figure 1 against those from the following sources:
1. Static load effect implicit in BD37 (removing the effect of the impact factor of 1.8 on the worst axle), denoted “BD37-Static”.
2. The static load effect implicit in the Eurocode Load Model 1 which is based on a return period of 1000 years. This was calculated by dividing the EN 1991 nominal load effect by the effective dynamic amplification factor for bending provided in the background to EN 1991 [Calgaro, 1997], denoted “EN1991-Static”.

BACKGROUND TO UK NATIONAL ANNEXES TO
EN 1990 AnnexA2 and EN1991-2
4184274.014\MM\R2\Issue 2 4 Jan 2004
3. Target static load effect with a return period of 1000 years derived from probabilistic simulation for congested conditions [Calgaro, 1997], denoted “EN1991-Congested Target”.
4. Static load effect with a return period of 1000 years derived from the probabilistic load model given in [Cooper, 1997] which forms the basis of the revised short span assessment loading in BD21, denoted “Cooper-1000 Year Static”.
5. Static load effect with a return period of 1000 years derived from the probabilistic load model derived by Atkins for Midland Links viaducts using weigh-in-motion vehicle data. This model covers the effects of free-flowing abnormal vehicles up to 100 tonnes and hence could be regarded as an upper bound to the loading from AW vehicles.
Lane 1 Moment Effect
0.0
0.2
0.4
0.6
0.8
1.0
1.2
1.4
1.6
1.8
2.0
0 5 10 15 20 25 30 35 40 45 50
Span (m)
Rati
o t
o B
D37 N
om
inal
BD37 Nominal BD37 Static EN 1991 Static
Annex D Vehicles - Static Cooper 1000 Year Static MLMV 1000 Year Static
EN1991 Congested Target
Figure 1: Comparison of extreme static load effects from different sources
The following observations can be made from the above figure:
The static load effects from the EN1991 LM1 model and those from the background studies for congested condition appear to be similar to those from Midland Links loading which includes abnormal loads up to 100 tonne. This is clearly seen to be conservative for UK traffic conditions.
The extreme static effects from the transit of Annex D vehicles are only marginally higher than the static effects which form the basis of BD37 and are broadly in line with the simulation results reported by Cooper.

BACKGROUND TO UK NATIONAL ANNEXES TO
EN 1990 AnnexA2 and EN1991-2
4184274.014\MM\R2\Issue 2 5 Jan 2004
3.2 Dynamic Amplification Factors
Recent research indicates that dynamic loading caused by the movement of vehicles over bridges is a combination of direct impact from axles and the dynamic response of the bridge. It is appropriate to model the dynamic effects through a Dynamic Amplification Factor (DAF), defined as the ratio of dynamic effect to static effect, applied to the total static load effect from a vehicle.
The DAF from different sources are compared in Figure 2 below.
1.00
1.20
1.40
1.60
1.80
2.00
2.20
2.40
0 5 10 15 20 25
Span (m)
DA
F
Equivalent BD37 Vehicle DAF
Cooper's Characteristic DAF
Calgaro, 1997 (exc. Local impact)
EN1991 DAF
Figure 2: Comparison of Dynamic Amplification Factors for single lane
The DAF values used in EN1991 LM1 model include a local impact factor for spans less than 15 m to account for discontinuities in the road such as due to a cracked expansion joint. The DAF’s excluding this local impact are given in [Calgaro, 1997] which show significantly lower values. These values seem to correlate well with the DAF implicit in the use of an impact factor of 1.8 on the worst axle as used in the derivation of BD37.
3.3 Combined Static and Dynamic Loading
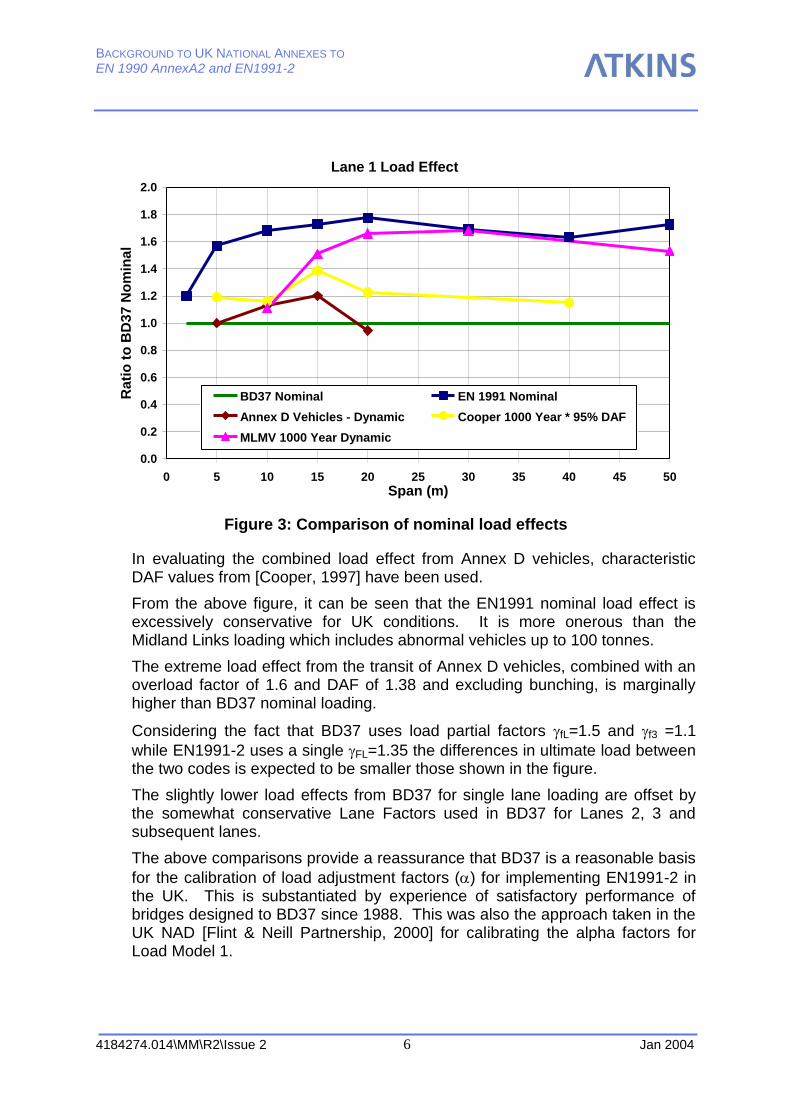
The nominal load effect combining static and dynamic effects for the cases discussed above are compared in Figure 3.
BACKGROUND TO UK NATIONAL ANNEXES TO
EN 1990 AnnexA2 and EN1991-2
4184274.014\MM\R2\Issue 2 6 Jan 2004
Lane 1 Load Effect
0.0
0.2
0.4
0.6
0.8
1.0
1.2
1.4
1.6
1.8
2.0
0 5 10 15 20 25 30 35 40 45 50
Span (m)
Rati
o t
o B
D37 N
om
inal
BD37 Nominal EN 1991 Nominal
Annex D Vehicles - Dynamic Cooper 1000 Year * 95% DAF
MLMV 1000 Year Dynamic
Figure 3: Comparison of nominal load effects
In evaluating the combined load effect from Annex D vehicles, characteristic DAF values from [Cooper, 1997] have been used.
From the above figure, it can be seen that the EN1991 nominal load effect is excessively conservative for UK conditions. It is more onerous than the Midland Links loading which includes abnormal vehicles up to 100 tonnes.
The extreme load effect from the transit of Annex D vehicles, combined with an overload factor of 1.6 and DAF of 1.38 and excluding bunching, is marginally higher than BD37 nominal loading.
Considering the fact that BD37 uses load partial factors fL=1.5 and f3 =1.1
while EN1991-2 uses a single FL=1.35 the differences in ultimate load between the two codes is expected to be smaller those shown in the figure.
The slightly lower load effects from BD37 for single lane loading are offset by the somewhat conservative Lane Factors used in BD37 for Lanes 2, 3 and subsequent lanes.
The above comparisons provide a reassurance that BD37 is a reasonable basis
for the calibration of load adjustment factors () for implementing EN1991-2 in the UK. This is substantiated by experience of satisfactory performance of bridges designed to BD37 since 1988. This was also the approach taken in the UK NAD [Flint & Neill Partnership, 2000] for calibrating the alpha factors for Load Model 1.
BACKGROUND TO UK NATIONAL ANNEXES TO
EN 1990 AnnexA2 and EN1991-2
4184274.014\MM\R2\Issue 2 7 Jan 2004
4 DERIVATION OF -FACTORS FOR TRAFFIC LOADING
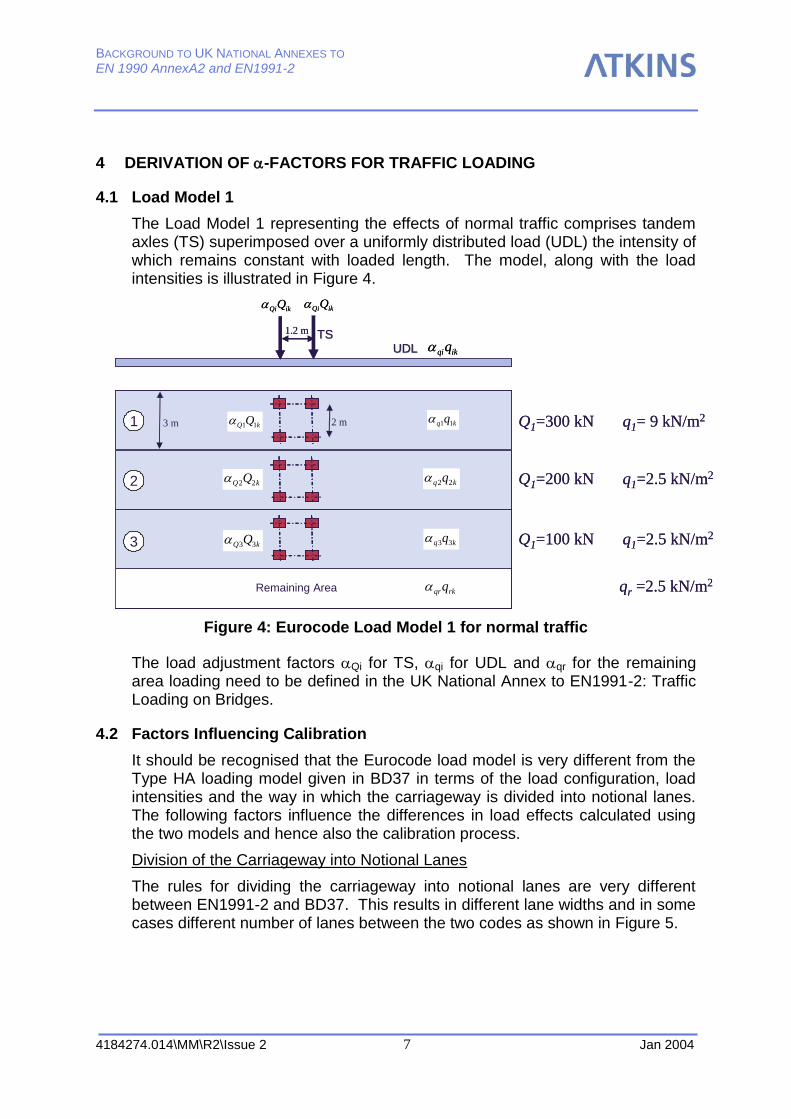
4.1 Load Model 1
The Load Model 1 representing the effects of normal traffic comprises tandem axles (TS) superimposed over a uniformly distributed load (UDL) the intensity of which remains constant with loaded length. The model, along with the load intensities is illustrated in Figure 4.
kq q11
ikQiQ
ikqiq
1.2 m
ikQiQ
TSTS
UDLUDL
1
2
3
Remaining Area
kq q33
kq q22
kq q11
kQ Q33
kQ Q22
kQ Q11
rkqrq
Q1=300 kN q1= 9 kN/m2
Q1=200 kN q1=2.5 kN/m2
Q1=100 kN q1=2.5 kN/m2
qr =2.5 kN/m2
2 m3 m
kq q11
ikQiQ
ikqiq
1.2 m
ikQiQ
TSTS
UDLUDL
1
2
3
Remaining Area
kq q33
kq q22
kq q11
kQ Q33
kQ Q22
kQ Q11
rkqrq
Q1=300 kN q1= 9 kN/m2
Q1=200 kN q1=2.5 kN/m2
Q1=100 kN q1=2.5 kN/m2
qr =2.5 kN/m2
2 m3 m
Figure 4: Eurocode Load Model 1 for normal traffic
The load adjustment factors Qi for TS, qi for UDL and qr for the remaining area loading need to be defined in the UK National Annex to EN1991-2: Traffic Loading on Bridges.
4.2 Factors Influencing Calibration
It should be recognised that the Eurocode load model is very different from the Type HA loading model given in BD37 in terms of the load configuration, load intensities and the way in which the carriageway is divided into notional lanes. The following factors influence the differences in load effects calculated using the two models and hence also the calibration process.
Division of the Carriageway into Notional Lanes
The rules for dividing the carriageway into notional lanes are very different between EN1991-2 and BD37. This results in different lane widths and in some cases different number of lanes between the two codes as shown in Figure 5.

BACKGROUND TO UK NATIONAL ANNEXES TO
EN 1990 AnnexA2 and EN1991-2
4184274.014\MM\R2\Issue 2 8 Jan 2004
2.0
2.2
2.4
2.6
2.8
3.0
3.2
3.4
3.6
3.8
4.0
4 6 8 10 12 14 16 18 20 22
Carriageway Width (m)
No
tio
na
l L
an
e W
idth
(m
)
BD37
EN1991-2
1
1
2
2
3
2
3
3
2.0
2.2
2.4
2.6
2.8
3.0
3.2
3.4
3.6
3.8
4.0
4 6 8 10 12 14 16 18 20 22
Carriageway Width (m)
No
tio
na
l L
an
e W
idth
(m
)
BD37
EN1991-2
1
1
2
2
3
2
3
3
Figure 5: Comparison of lane width and number of lanes
For carriageway widths between 7.5m and 9.0m BD37 introduces 3 notional lanes while EN has only 2 notional lanes combined with remaining area. This also happens for a narrow range between 5.0m and 5.4m where BD37 has 2 lanes while EN has one lane. Similar differences in number of lanes between the two codes also occur at higher carriageway widths over a narrow range but these differences have only marginal influence since the intensity of loading remains the same for Lane 4 and subsequent lanes in both BD37 and EN1991.
In EN1991-2 the notional lane width is constant at 3.0m except for a small range of carriageway width between 5.4m and 6.0m when the lane width varies from 2.7m to 3.0m. In BD37 the notional lane width varies typically between 2.5m and 3.65m depending on the carriageway width. The influence of this difference in lane width is offset to some extent by the varying lane factors for Lane 1 and Lane 2 used to correct the effect of bunching over spans up to 40m. For longer spans and for cases involving loading from three lanes, the difference in lane width causes differences in total loading between the two codes. The loading contributed by Lane 4 and subsequent lanes is not affected by lane width as the intensity of loading for these lanes remains constant in both BD37 and EN1991-2.
For two lane roads the carriageway width is typically in the range 6m to 8m and in this range there will be significant differences in loading dependent on the loaded length between the two codes. However, for dual two-lane carriageways and for most trunk roads and motorways the carriageway is wider

BACKGROUND TO UK NATIONAL ANNEXES TO
EN 1990 AnnexA2 and EN1991-2
4184274.014\MM\R2\Issue 2 9 Jan 2004
than 12m and the difference in number of lanes has little effect. For these cases the notional lane width in BD37 varies between 3.0m and 3.65m. This has considerable effect on longitudinal elements which are governed by loading from typically 2 to 3 lanes. For short span bridges with good transverse distribution characteristics the loading is governed by several lanes and the influence of different lane widths should be smaller.
In view of the above, the lane widths of 3.0m and 3.65m have been selected as the limiting cases for the calibration of the alpha factors against BD37 loading. Between these two cases, higher weighting has been given to 3.0m lane width as this is more close to the width over which vehicle loading is distributed in reality. The BD37 loading is more conservative for 3.65m lane width cases for loaded lengths up to 40m in view of the maximum bunching factor.
Load Intensities
In BD37 the loading is primarily due to the udl component while the Knife Edge Load has only a marginal contribution for loaded lengths beyond 10m. In EN1991-2, the tandem axles govern the loading for loaded lengths up to 40m while the UDL component has the dominant effect at longer lengths.
In BD37 the intensity of the udl reduces rapidly as the loaded length increases to about 40m and gradually thereafter. In EN1991-2, the load intensity for both the Tandem System and the UDL remains constant with loaded length.
The above factors introduce differences between the two codes that vary with loaded length. It makes it difficult to get a good fit between the two codes by using a single set of alpha factors which are independent of loaded length.
Lane Distribution of Loading
In BD37 the loading in Lane 2 is of the same intensity as Lane 1 for loaded lengths up to 50m. Thereafter, the Lane Factor for lane 2 reduces linearly with loaded length to a value of 0.67 at a loaded length of 110m and remains constant thereafter. The Lane Factors for Lane 3 and subsequent lanes have a constant value of 0.6 for most of the loaded lengths.
In EN1991-2, the loading in Lane 2 relative to that in Lane 1 reduces gradually from 0.6 at 5m to 0.35 at 200m loaded length. The Lane 3 loading is about 0.3 times the Lane 1 loading for most of the loaded length while the loading in subsequent lanes is even lower relative to the Lane 1 loading.
The above differences in lane distribution of loading makes the BD37 more onerous for multi-lane cases compared to single and two lane cases relative to EN1991-2. Again this makes it difficult to achieve a good fit to BD37 for cases involving different lane combinations.
Partial Factors
BD37 uses load partial factors for traffic live load of fL=1.5 and f3=1.1 for ultimate limit state while the recommended value in EN1990 Annex A2 is a
single load partial factor of FL=1.35. These differences impact on the ultimate load effect from the two codes and hence the alpha factors.

BACKGROUND TO UK NATIONAL ANNEXES TO
EN 1990 AnnexA2 and EN1991-2
4184274.014\MM\R2\Issue 2 10 Jan 2004
4.3 Calibration of -factors
As discussed previously, the Type HA loading given in BD37 provides a reasonable basis for the calibration of alpha factors for Load Model 1 in EN1991-2 for use in the UK.
The alpha factors derived in [Flint & Neill Partnership, 2000] for use in the UK National Application Document (NAD) were also based on calibration to BD37. An error minimisation approach was used to derive the initial values of alpha factors which were then adjusted manually. Standard carriageway widths of 7.3m, 10.95m, 14.6m, 18.25m and 21.9m and a number of non-standard carriageway widths were considered. Higher weighting was given to loaded lengths in the range 10m to 100m with the greatest weighting for loaded lengths in the range 20m to 60m.
A similar approach was used in the present study. Bending moment and shear load effects for simply supported line beam influence lines were computed for the different carriageway widths, loaded lengths and for different lane combinations using trial values of alpha factors on EN1991-2 load model and compared with those calculated using BD37. Higher reliance was placed on cases with 3.0m notional lane width and also on shear load effect as it governs the loading at shorter spans of up to 50m.
The reliability analyses from the Phase I study indicated that reliability levels implicit in BD37 designs were very high for bridges with loaded lengths less than 20m. To compensate for this, and in an attempt to produce more consistent reliabilities with span, the alpha factors on Tandem axles were adjusted to produce a loading slightly lower than BD37 in this span range.
The use of a constant intensity of UDL in all lanes across the carriageway offers considerable simplicity in the analysis of bridges to determine critical load effects and this has been achieved in the NA proposal. The same approach was taken in the NAD. It was observed that the NAD factored ULS design value of 5.4 kN/m2 was unconservative relative to BD37 in a majority of the cases considered at loaded lengths greater than 40m which is typically governed by UDL. Hence the ULS design UDL has been increased to 7.425 kN/m2 in the NA proposal. The higher ULS design tandem axle loading of 280 kN in Lane 1 made the NAD excessively conservative relative to BD37 at short spans. This has been corrected in the NA.
The resulting values of -factors proposed for use in the UK National Annex (NA) are compared in Table 1 below against EN1991-2 and NAD values. The resulting factored design load intensities for TS and UDL in different lanes are tabulated in Table 2 and Table 3 for Ultimate Limit State and Serviceability Limit State respectively.

BACKGROUND TO UK NATIONAL ANNEXES TO
EN 1990 AnnexA2 and EN1991-2
4184274.014\MM\R2\Issue 2 11 Jan 2004
Table 1: Comparison of -factors
Lane EN1991-2 NAD National Annex
TS
kN
UDL
kN/m2
TS
kN
UDL
kN/m2
TS
kN
UDL
kN/m2
Lane 1 1.0 1.0 0.844 0.40 1.0 0.6111
Lane 2 1.0 1.0 1.267 1.44 1.0 2.2
Lane 3 1.0 1.0 1.267 1.44 1.0 2.2
Other - 1.0 - 1.44 - 2.2
Remaining Area
1.0 - 1.44 - 2.2
Table 2: Comparison of Factored load intensities for ULS
Lane EN1991-2 NAD National Annex
TS
kN
UDL
kN/m2
TS
kN
UDL
kN/m2
TS
kN
UDL
kN/m2
Lane 1 405 12.15 380 5.4 405 7.425
Lane 2 270 3.375 380 5.4 270 7.425
Lane 3 135 3.375 191 5.4 135 7.425
Other - 3.375 - 5.4 - 7.425
Remaining Area
3.375 - 5.4 - 7.425

BACKGROUND TO UK NATIONAL ANNEXES TO
EN 1990 AnnexA2 and EN1991-2
4184274.014\MM\R2\Issue 2 12 Jan 2004
Table 3: Comparison of Factored load intensities for SLS
Lane EN1991-2 NAD National Annex
TS
kN
UDL
kN/m2
TS
kN
UDL
kN/m2
TS
kN
UDL
kN/m2
Lane 1 300 9.0 278 3.96 300 5.5
Lane 2 200 2.5 278 3.96 200 5.5
Lane 3 100 2.5 140 3.96 100 5.5
Other - 2.5 - 3.96 - 5.5
Remaining Area
2.5 - 3.96 - 5.5
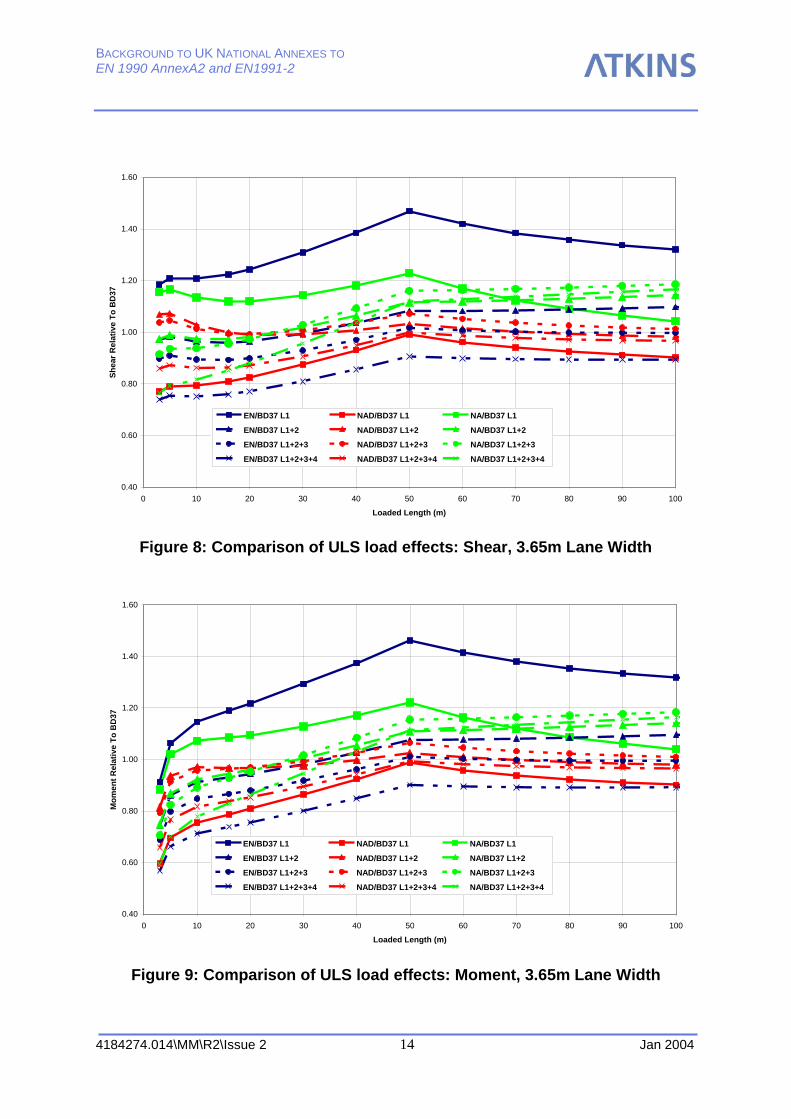
The ultimate moment and shear effects calculated using the EN1991-2, NAD
and NA values of -factors for 3.0m and 3.65 m lane widths for combinations involving Lane 1, Lanes 1+2, Lane 1+2+3 and Lanes 1+2+3+4 are compared in the following figures. These are based on unit lane factors for each All the results are normalised by BD37 ULS load effects. The NAD values are based
on FL=1.5 and the NA values on FL=1.35.
For the sake of clarity, values are plotted for loaded lengths up to 100m. The trend between 60m and 100m continues beyond 100m in all cases.
From these figures it can be seen that the proposed -factors for National Annex provide very good fit to BD37 for 3.0m lane width cases. For 3.65m lane width, the NA loading would be slightly unconservative for loaded length below 40m while slightly over conservative for higher loaded lengths relative to BD37. This is a result of the maximum bunching factor included in BD37 for loaded lengths up to 40m which considerably increases the loading for 3.65m lanes.
The NAD values give broadly similar results to NA with slightly more conservative loading for loaded lengths less than 40m and somewhat unconservative for higher loaded lengths relative to BD37.
It is interesting to note that while the EN1991-2 loading is some 40% higher for single lane loading, the three and four lane loading is lower than BD37. This is a result of the differences in lane distribution of loading (i.e. Lane Factors) between the two codes.

BACKGROUND TO UK NATIONAL ANNEXES TO
EN 1990 AnnexA2 and EN1991-2
4184274.014\MM\R2\Issue 2 13 Jan 2004
0.40
0.60
0.80
1.00
1.20
1.40
1.60
0 10 20 30 40 50 60 70 80 90 100
Loaded Length (m)
Sh
ear
Rela
tive T
o /B
D37
EN/BD37 L1 NAD/BD37 L1 NA/BD37 L1
EN/BD37 L1+2 NAD/BD37 L1+2 NA/BD37 L1+2
EN/BD37 L1+2+3 NAD/BD37 L1+2+3 NA/BD37 L1+2+3
EN/BD37 L1+2+3+4 NAD/BD37 L1+2+3+4 NA/BD37 L1+2+3+4
Figure 6: Comparison of ULS load effects: Shear, 3.0m Lane Width
0.40
0.60
0.80
1.00
1.20
1.40
1.60
0 10 20 30 40 50 60 70 80 90 100
Loaded Length (m)
Mo
men
t R
ela
tive T
o B
D37
EN/BD37 L1 NAD/BD37 L1 NA/BD37 L1
EN/BD37 L1+2 NAD/BD37 L1+2 NA/BD37 L1+2
EN/BD37 L1+2+3 NAD/BD37 L1+2+3 NA/BD37 L1+2+3
EN/BD37 L1+2+3+4 NAD/BD37 L1+2+3+4 NA/BD37 L1+2+3+4
Figure 7: Comparison of ULS load effects: Moment, 3.0m Lane Width
BACKGROUND TO UK NATIONAL ANNEXES TO
EN 1990 AnnexA2 and EN1991-2
4184274.014\MM\R2\Issue 2 14 Jan 2004
0.40
0.60
0.80
1.00
1.20
1.40
1.60
0 10 20 30 40 50 60 70 80 90 100
Loaded Length (m)
Sh
ear
Re
lati
ve T
o B
D3
7
EN/BD37 L1 NAD/BD37 L1 NA/BD37 L1
EN/BD37 L1+2 NAD/BD37 L1+2 NA/BD37 L1+2
EN/BD37 L1+2+3 NAD/BD37 L1+2+3 NA/BD37 L1+2+3
EN/BD37 L1+2+3+4 NAD/BD37 L1+2+3+4 NA/BD37 L1+2+3+4
Figure 8: Comparison of ULS load effects: Shear, 3.65m Lane Width
0.40
0.60
0.80
1.00
1.20
1.40
1.60
0 10 20 30 40 50 60 70 80 90 100
Loaded Length (m)
Mo
men
t R
ela
tive T
o B
D37
EN/BD37 L1 NAD/BD37 L1 NA/BD37 L1
EN/BD37 L1+2 NAD/BD37 L1+2 NA/BD37 L1+2
EN/BD37 L1+2+3 NAD/BD37 L1+2+3 NA/BD37 L1+2+3
EN/BD37 L1+2+3+4 NAD/BD37 L1+2+3+4 NA/BD37 L1+2+3+4
Figure 9: Comparison of ULS load effects: Moment, 3.65m Lane Width

BACKGROUND TO UK NATIONAL ANNEXES TO
EN 1990 AnnexA2 and EN1991-2
4184274.014\MM\R2\Issue 2 15 Jan 2004
A comparison between BD37 and EN1991-2 load effect is made in Figure 10 and Figure 11 where the ratio between BD37 and EN factored design traffic action is plotted as a function of total carriageway width for loaded length ranging from 3m to 200m. The plots show bending and shear action effects calculated using simply supported beam influence lines. Lane influence factors for the moment/shear effect based on influence factors for a realistic case are used. These are tabulated below:
Lane 1 2 3 4 5 6 7 8
Influence 1.0 0.6 0.4 0.2 0.2 0.2 0.2 0.2
For the majority of the range of span and carriageway width range considered, the proposed NAD factored design values lie between +/- 20% of the BD37 values. There are, however several regions where the NAD values are less than 80% of the BD37 values.
A. Carriageway width between 5m-5.4m.
Both BD37 HA and EN1991-2 LM1 traffic action models have a significant increase in load at the transition from one to two notional lanes of traffic. This occurs for a carriageway width of 5.0-m for BD37 and 5.4m for EN 1991-2. Between 5.0m and 5.4m carriageway width, BD37 has two notional lanes of traffic and EN1991-2 has one notional lane. The EN1 1991-2 design traffic action is about 50 to 60% of the BD37 action for the range of carriageway widths between 5.0 and 5.4m. This is purely a result of the different notional lane definition of the two codes.
B. Loaded Length 50-200m, Carriageway width less than 5.4m.
For loaded length between 50 and 200m and for carriageway width of less than 5.4m, the EN 1991-2 bending load effect is between 50-80% of the BD37 load effect. This configuration corresponds to a bridge of one notional lane with an effective loaded length of 50m, requiring a 50m or greater span. This is considered to be an unrealistic configuration.
C. Bending Effect for 3m Loaded Length.
The EN1991-2 LM1 bending effect for loaded length of 3m and carriageway width greater than 5m is about 70% the BD37 bending effect over this range. These spans would be expected for culverts. For a bridge/culvert of such a short span, the structural element actions will be influenced by local lane loading only, and it is unlikely that a structural element needs to be designed for the cumulative effect of more than two or three lanes.
In these cases the bending moment is primarily influenced by single axle loading. BD37 uses a very high udl (161 kN/m) combined with a relatively low single knife edge load (120kN). The EN 1991-2 loading is influenced principally

BACKGROUND TO UK NATIONAL ANNEXES TO
EN 1990 AnnexA2 and EN1991-2
4184274.014\MM\R2\Issue 2 16 Jan 2004
by the 300 kN axle of the tandem system, with the udl contributing a relatively smaller amount.
The factored LM1 single axle loads for the first three lanes are:
Lane 1 40.5 Te Lane 2 27.0 Te Lane 3 23.6 Te
This compares with the maximum 11.5 Te axle load which, with a DAF of 1.8 and overload factor of 1.5 gives an axle load of 31.1 Te. The LM1 axle load is therefore sufficient to cover lanes 1 and 2. On the basis of these arguments, the very short span loading model provided by EN 1991 is adequately conservative despite the higher loading values given by BD37.
Bending Effect
Lane Influence Factors: 1.0 0.6 0.4 0.2 0.2 0.2 0.2 0.2
0.4
0.5
0.6
0.7
0.8
0.9
1
1.1
1.2
1.3
1.4
0 5 10 15 20 25 30
Carriageway width
NA
/BD
37
3
5
10
15
21
30
50
100
160
200
1 2 3 4 5 6 7 8 EN 1991-2
1 2 3 4 5 6 7 BD37
Lanes
Figure 10 Moment Comparison with BD37

BACKGROUND TO UK NATIONAL ANNEXES TO
EN 1990 AnnexA2 and EN1991-2
4184274.014\MM\R2\Issue 2 17 Jan 2004
Shear Effect
Lane Influence Factors: 1.0 0.6 0.4 0.2 0.2 0.2 0.2 0.2
0.4
0.5
0.6
0.7
0.8
0.9
1
1.1
1.2
1.3
1.4
0 5 10 15 20 25 30
Carriageway width
NA
/BD
37
3
5
10
15
21
30
50
100
160
200
1 2 3 4 5 6 7 8 EN 1991-2
1 2 3 4 5 6 7 BD37
Lanes
Figure 11 Moment Comparison with BD37
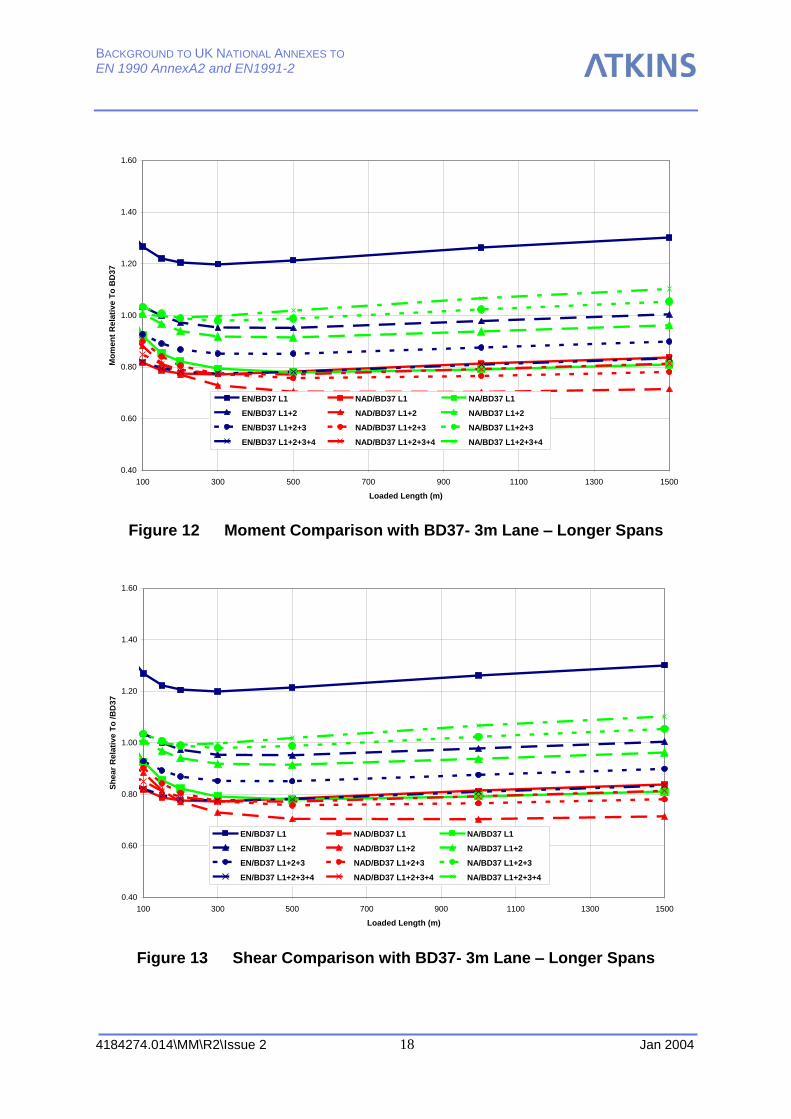
4.4 Loaded Length up to 1600m
The BD37 HA loading applies for loaded length up to 1600m whereas EN 1991 LM1 only applies to loaded length up to 200m. Figure 12 and Figure 13 show the National Annex ULS design bending and shear effects normalised to BD37 for spans between 100 and 1500m. As can be seen, the LM1 effects are within the acceptable range for spans up to 1500m. It can be concluded that, assuming the BD37 HA loading is suitable for long span bridges, application of the Eurocode LM1 is appropriate for bridges up to 1500m loaded length.
BACKGROUND TO UK NATIONAL ANNEXES TO
EN 1990 AnnexA2 and EN1991-2
4184274.014\MM\R2\Issue 2 18 Jan 2004
0.40
0.60
0.80
1.00
1.20
1.40
1.60
100 300 500 700 900 1100 1300 1500
Loaded Length (m)
Mo
men
t R
ela
tive T
o B
D37
EN/BD37 L1 NAD/BD37 L1 NA/BD37 L1
EN/BD37 L1+2 NAD/BD37 L1+2 NA/BD37 L1+2
EN/BD37 L1+2+3 NAD/BD37 L1+2+3 NA/BD37 L1+2+3
EN/BD37 L1+2+3+4 NAD/BD37 L1+2+3+4 NA/BD37 L1+2+3+4
Figure 12 Moment Comparison with BD37- 3m Lane – Longer Spans
0.40
0.60
0.80
1.00
1.20
1.40
1.60
100 300 500 700 900 1100 1300 1500
Loaded Length (m)
Sh
ear
Rela
tive T
o /B
D37
EN/BD37 L1 NAD/BD37 L1 NA/BD37 L1
EN/BD37 L1+2 NAD/BD37 L1+2 NA/BD37 L1+2
EN/BD37 L1+2+3 NAD/BD37 L1+2+3 NA/BD37 L1+2+3
EN/BD37 L1+2+3+4 NAD/BD37 L1+2+3+4 NA/BD37 L1+2+3+4
Figure 13 Shear Comparison with BD37- 3m Lane – Longer Spans

BACKGROUND TO UK NATIONAL ANNEXES TO
EN 1990 AnnexA2 and EN1991-2
4184274.014\MM\R2\Issue 2 19 Jan 2004
5 DERIVATION OF LOAD PARTIAL FACTORS
Partial factors for the following loads were derived:
Traffic live load,
Concrete self weight,
Steel self weight,
Superimposed dead load,
Surfacing.
The procedure for establishing the partial factors comprised the following steps:
1. Selection of basic design scenarios
2. Establishment of target reliability based on DMRB implicit reliability
3. Calculation of partial factors required to achieve target for each design configuration
4. Verification of reliability implicit in proposed partial factors
The following design configurations, chosen to be representative of typical concrete and composite bridges were considered for the partial factor calibration:
Bridge Type
Reinforced Concrete Slab Bridges,
Steel-RC Composite Bridges.
Lane Loading
Lanes 1+2
Loaded Length
5m, 10m, 16m, 20m, 30m, 40m and 50m
Carriageway width (Lane 1+2 loading)
6m and 7.3m.
Load Effect
Mid-span bending of a simply supported span,
Shear at support of a simply supported span.
Resistance Model
Generic resistance model with the following characteristics:
Bending: COV = 10%, Nominal resistance = 97.5%ile Value
Shear: COV = 15%, Nominal resistance = 97.5%ile Value
The above resistance distributions are considered to provide bounding values for a range of limit states and element types.

BACKGROUND TO UK NATIONAL ANNEXES TO
EN 1990 AnnexA2 and EN1991-2
4184274.014\MM\R2\Issue 2 20 Jan 2004
As explained in the Phase I Report [Atkins, 2002], the modelling of resistance was simplified for reasons of expediency and since the work is primarily intended to calibrate load partial factors. The simplified resistance models use equivalent partial factors to represent the effect of separate material partial factors for concrete, reinforcement and steel strength. The equivalent partial factors were determined for typical concrete and composite bridges designed to BD44. Similarly, the resistance distribution parameters represent the overall variability in the underlying material properties and the bias and uncertainty in the strength models used in the code. Since the same resistance distributions are used for the derivation of target reliability levels and calibration of partial factors, the likely error in the use of simplified models is minimised.
The probability distributions for traffic loading and permanent loads are based on BD79 (draft) and [Cooper, 1997] and are described in the Phase I report.
Although the calibration is performed using the above range of design scenarios, the resulting reliability levels should be verified for a wider range of structures of practical interest covering single lane and multi-lane loading.
5.1 Reliability Implicit in BD37
The reliability levels implicit in BD37 loading models and the associated load partial factors for ultimate limit state were determined using generic resistance distributions as mentioned above. Results of annual reliability indices for concrete and composite bridges with 3.0m and 3.65m notional lane widths are shown in Figure 14 for bending moment and in Figure 15 for shear load effect. The reliability analyses were limited to loaded lengths of up to 50m as a probabilistic traffic load model is not available for longer loaded lengths.
The figures show that the BD37 load partial factors result in considerably higher reliability for loaded lengths below 20m. The difference in reliability index of 2.0 corresponds to about 7 orders of magnitude in failure probability. For loaded lengths greater than 20m the reliability becomes more or less constant with loaded length.
The 3.65m lane width cases have considerably greater reliability than the 3.0m lane width. This reflects the higher nominal traffic loading in BD37 for the wider lanes which arise from the maximum bunching factor included for loaded lengths less than 40m. Probabilistic traffic load model given in [Cooper, 1997] is based on free flowing traffic subject to dynamic effects and overloading but no bunching. For loaded lengths of 40m or more, the bunching allowance is removed in BD37 and the intensity of udl also remains broadly constant. This results in constant reliability with loaded length beyond 40m.
The reliability levels for shear are significantly lower than those for bending because of the higher variability in shear resistance.

BACKGROUND TO UK NATIONAL ANNEXES TO
EN 1990 AnnexA2 and EN1991-2
4184274.014\MM\R2\Issue 2 21 Jan 2004
5
6
7
8
9
10
0 5 10 15 20 25 30 35 40 45 50
Loaded Length (m)
An
nu
al
Re
lia
bil
ity
In
de
x f
or
Be
nd
ing
BD37 3m Composite BD37 3.65m Composite
BD37 3m Concrete BD37 3.65m Concrete
Figure 14: Reliability Implicit in BD37: Lane 1+2 Bending
4
5
6
7
8
9
0 5 10 15 20 25 30 35 40 45 50
Loaded Length (m)
An
nu
al
Re
lia
bil
ity
In
de
x f
or
Sh
ea
r
BD37 3m Composite
BD37 3.65m Composite
BD37 3m Concrete
BD37 3.65m Concrete
Figure 15: Reliability Implicit in BD37: Lane 1+2 Shear

BACKGROUND TO UK NATIONAL ANNEXES TO
EN 1990 AnnexA2 and EN1991-2
4184274.014\MM\R2\Issue 2 22 Jan 2004
5.2 Choice of Target Reliability Index
The Annex B of EN1990 recommends a minimum target reliability index for bridges of medium consequence of failure (Class 2) of 3.8 for 50 year service life or 5.2 per annum. It is not appropriate to adopt this value directly as this has no relation to the reliability levels implicit in current UK design practice. Furthermore, in view of the uncertainties involved in the probability distributions for the various load and resistance variables due to lack of adequate data, it is important that target reliability is strictly linked to the probability distributions used for the underlying variables.
The introduction of Eurocodes represents a major change to the current UK practice for the design of bridges. For reasons of safety and economy, it is important to ensure that the Eurocodes, along with their National Annexes, result broadly in the same level of overall reliability as is implicit in BS 5400/DMRB. This opportunity should also be taken to rationalise reliability levels and to remove any inconsistencies or anomalies within the UK practice for different structure/material types. The target reliability used for the calibration of load partial factors should therefore be based on the reliability implicit within BD37.
On the basis of the results of reliability indices implicit in BD37 and the observations made in the previous section about the variation in reliability with bridge type, lane width, loaded length and load effect, it is considered that the calibration should be based on the reference case of 3m lane width and for loaded length greater than 20m. For loaded lengths less than 20m the reliability in the National Annex can be permitted to be lower than that implicit in BD37 as the high reliability in BD37 is a result of bunching allowance which is not considered to be representative of governing loading conditions in reality.
The average reliability index implicit in BD37 for 3m lane width and for loaded lengths greater than 20m is 6.3 for bending and 5.3 for shear. It is necessary that the load partial are the same for difference material types and limit states. Therefore an average target reliability index of 5.8 has been adopted for the calibration of load partial factors for use in the UK National Annex.
5.3 Calibration of Load Partial Factors
The following load effect partial factors have been considered for calibration:
Traffic loading
Concrete self-weight
Steel self-weight
Super-imposed dead load
Surfacing weight

BACKGROUND TO UK NATIONAL ANNEXES TO
EN 1990 AnnexA2 and EN1991-2
4184274.014\MM\R2\Issue 2 23 Jan 2004
The calibration procedure comprised the following steps:
1. Reliability analysis for the reference cases using the National Annex loading model with the original partial factors given in EN1990: Annex A2 was performed using the SORM (Second Order Reliability Method),
2. For each design scenario, the partial factors required to reach the required target reliability index of 5.8 were derived using the “design point” method in which the design point values of variables are scaled in proportion to their sensitivity factors to reach target beta point. The revised partial factors are worked out from the coordinates of the new design point without the need to repeat reliability analysis,
3. The target partial factors for the different design scenarios were rationalised to achieve a single set of factors applicable in all design scenarios which provide a more uniform reliability close to the target value,
4. Reliability analysis of the National Annex model with the rationalised set of load partial factors was performed to check their consistency with the target.
The calibrated partial factors for the ultimate limit state condition are tabulated in Table 4.
Table 4: Calibrated Partial Factors for ULS
Action Partial Factor
Traffic Live Load 1.35
Concrete Self Weight 1.35
Steel Self Weight 1.20
Super-Imposed Dead Load 1.20
Surfacing 1.20
Wind 1.70(1)
(1) Preliminary Value based on 50 year return period nominal wind, pending National Annex to EN1991-1-4
The reliability implicit in the proposed National Annexe design model for combined permanent and traffic actions are illustrated in Figure 16 and Figure 17 where they are compared against the reliability implicit in the DMRB. The National Annexe reliability shows good agreement with the proposed target value of 5.8 for loaded lengths above 20m. For loaded lengths below 20m the

BACKGROUND TO UK NATIONAL ANNEXES TO
EN 1990 AnnexA2 and EN1991-2
4184274.014\MM\R2\Issue 2 24 Jan 2004
reliability is still high broadly in line with BD37. The NA is lower than BD37 for than 3.0m span and higher for the 3.65m span.
5
5.5
6
6.5
7
7.5
8
8.5
9
9.5
0 5 10 15 20 25 30 35 40 45 50
Loaded Length (m)
An
nu
al
Re
lia
bil
ity
In
de
x f
or
Be
nd
ing
BD37 Composite 3.0m Lane BD37 Concrete 3.0m Lane
BD37 Composite 3.65m Lane BD37 Concrete 3.65m Lane
NA Concrete 3.0m & 3.65m Lane NA Composite 3.0m & 3.65m Lane
Figure 16: Results for National Annex: Bending, Lanes 1+2
4
4.5
5
5.5
6
6.5
7
7.5
8
0 5 10 15 20 25 30 35 40 45 50
Loaded Length (m)
An
nu
al
Re
lia
bil
ity
In
de
x f
or
Be
nd
ing
BD37 Composite 3.0m Lane BD37 Concrete 3.0m Lane
BD37 Composite 3.65m Lane BD37 Concrete 3.65m Lane
NA Concrete 3.0m & 3.65m Lane NA Composite 3.0m & 3.65m Lane
Figure 17: Results for National Annex: Shear, Lanes 1+2

BACKGROUND TO UK NATIONAL ANNEXES TO
EN 1990 AnnexA2 and EN1991-2
4184274.014\MM\R2\Issue 2 25 Jan 2004
5.3.1 Partial Factor for Wind Actions
For wind combined with dead plus superimposed dead actions and for
members primarily resisting dead loads, BD37 specifies a partial factor FL of
1.4. An additional partial safety factor, f3 = 1.1 is also required. The nominal basic wind action in BD37 is defined in terms of a basic hourly mean wind velocity with a return period of 120 years. The 120 year basic wind velocity is 5% greater than a 50 year return period wind velocity, making the 120 year wind force 10% greater then the 50 year wind force.
The partial factor for wind loading will depend on the definition of nominal value to be specified in the National Annex to EN 1991-1-4. In order to match the EN 1991-1-4 ultimate limit state design load with the BD37 ultimate limit state
design load a partial factor on wind load of Q = 1.7 is required, given that the nominal wind load has a 50 year return period.
5.4 Serviceability Limit State Partial Factors
The partial factors for the serviceability limit state check are tabulated in Table 5. The loading levels for the serviceability limit state are derived to fit the BD37 serviceability limit state loading. The traffic model was calibrated to ensure that it is suitable for the serviceability check with unit partial factors.
Table 5: Calibrated Partial Factors for SLS
Action Partial Factor
Traffic Live Load 1.00
Concrete Self Weight 1.00
Steel Self Weight 1.00
Super-Imposed Dead Load 1.00
Surfacing 1.00
6 COMBINATION, FREQUENT AND INFREQUENT FACTORS
The combination, frequent and infrequent factors for the National Annex to EN 1990 Annex A2 are given in Table 6. A commentary on the rationale behind the choice of these factors is provided in the following subsections.

BACKGROUND TO UK NATIONAL ANNEXES TO
EN 1990 AnnexA2 and EN1991-2
4184274.014\MM\R2\Issue 2 26 Jan 2004
Table 6: Calibrated Combination, Frequent and Infrequent Factors
Action Factor
Traffic Combination Factor 0 0.75
Wind Combination Factor 0 0.50
Traffic Frequent Factor 1freq 0.75
Traffic Infrequent Factor 1infq 0.80
Traffic Quasi Permanent Factor 2 0.00
6.1 Traffic Combined with Wind Actions
The combination factors for wind and traffic given in the National Annex are:
0 traffic = 0.75
0 wind = 0.50
A discussion behind the rationale for these values is presented in the following
The combination rules for variable actions utilised by BD37 and EN1990 Annex A2 have very different formats. The BD37 traffic and wind design live load combination rule is:
Wind
WindTraff
Traff
Des
Q
Q
Q
4.1
1.125.1
5.1
max
Whereas the EN1990 Annex A2 design variable action effect for combined wind and traffic, (EN1990 Annex A2 eq. 6.10) is:
WindWindTraffQTraffTraff
WindWindWindTraffQTraff
Des QQ
QQQ
0
0max
The two combination rules are compared in Figure 18. This shows the envelopes for code specified safe design implied by the two combination rules. The traffic and wind actions have been normalised by their respective factored design values and the plot is a direct comparison of the difference in variable action combination rule. It can be seen from the figure that use of the EN National Annex load combination will consistently provide a more conservative design case than BD37. This comparison is purely in terms of the combined
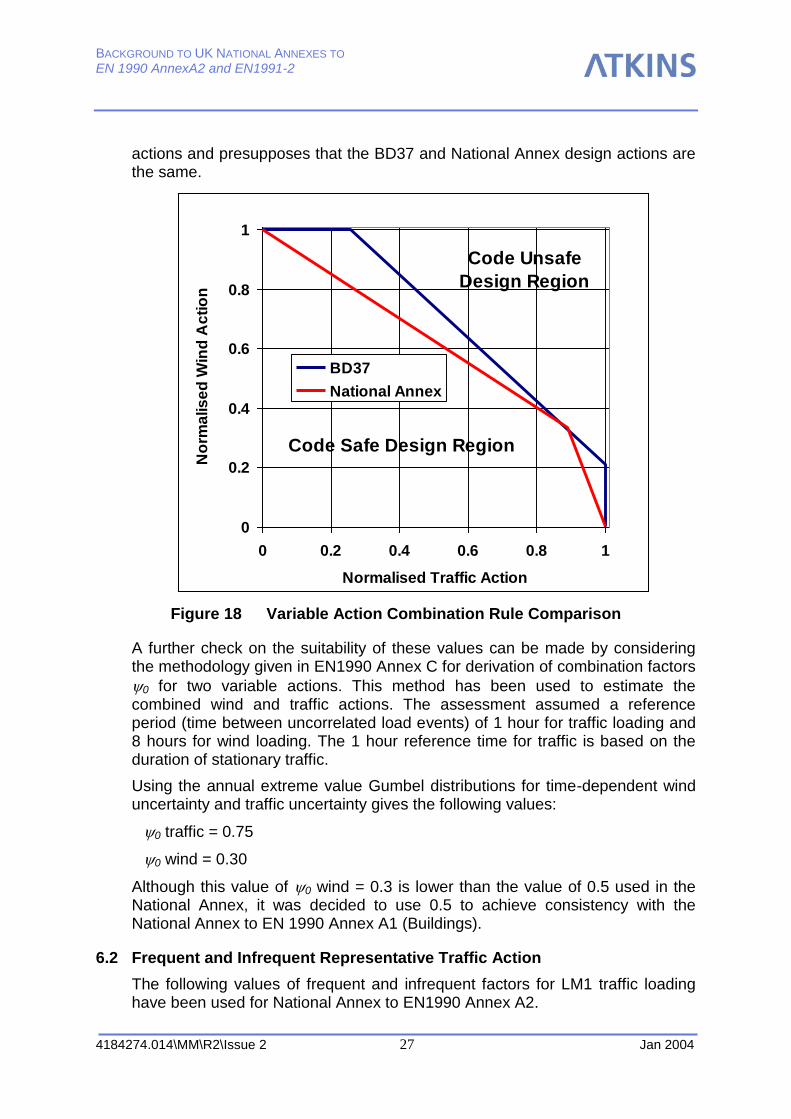
BACKGROUND TO UK NATIONAL ANNEXES TO
EN 1990 AnnexA2 and EN1991-2
4184274.014\MM\R2\Issue 2 27 Jan 2004
actions and presupposes that the BD37 and National Annex design actions are the same.
0
0.2
0.4
0.6
0.8
1
0 0.2 0.4 0.6 0.8 1
Normalised Traffic Action
No
rma
lis
ed
Win
d A
cti
on
BD37
National Annex
Code Safe Design Region
Code Unsafe
Design Region
Figure 18 Variable Action Combination Rule Comparison
A further check on the suitability of these values can be made by considering the methodology given in EN1990 Annex C for derivation of combination factors
0 for two variable actions. This method has been used to estimate the combined wind and traffic actions. The assessment assumed a reference period (time between uncorrelated load events) of 1 hour for traffic loading and 8 hours for wind loading. The 1 hour reference time for traffic is based on the duration of stationary traffic.
Using the annual extreme value Gumbel distributions for time-dependent wind uncertainty and traffic uncertainty gives the following values:
0 traffic = 0.75
0 wind = 0.30
Although this value of 0 wind = 0.3 is lower than the value of 0.5 used in the National Annex, it was decided to use 0.5 to achieve consistency with the National Annex to EN 1990 Annex A1 (Buildings).
6.2 Frequent and Infrequent Representative Traffic Action
The following values of frequent and infrequent factors for LM1 traffic loading have been used for National Annex to EN1990 Annex A2.

BACKGROUND TO UK NATIONAL ANNEXES TO
EN 1990 AnnexA2 and EN1991-2
4184274.014\MM\R2\Issue 2 28 Jan 2004
Frequent Factor 1freq = 0.75
Infrequent Factor 1infq = 0.80
These factors have been derived using the following definitions:
years
week
freqQ
Q
1000
1
1
years
year
infqQ
Q
1000
1
1
Where Q1week, Q1year and Q1000years are traffic action with 1 week, 1 year and 1000 year return periods respectively, The characteristic traffic load has a notional return period of 1000 years.
These values were derived using the time dependent static component of Cooper’s random traffic load model. It should be noted that the actual nominal loads defined in the National Annexe to EN 1991-2 have return periods which are considerably more than 1000 years at smaller spans. The frequent and infrequent values are therefore greater than their return period definition at lower spans.
6.3 Quasi-Permanent Traffic Action
The quasi-permanent traffic action is taken to be zero to be consistent with the original EN1990 Annex A2.

BACKGROUND TO UK NATIONAL ANNEXES TO
EN 1990 AnnexA2 and EN1991-2
4184274.014\MM\R2\Issue 2 29 Jan 2004
7 CALIBRATION OF LOAD MODEL 3
The LM3 special vehicles SV80, SV100 are defined with the same basic geometry and axle loads as the equivalent BD86 vehicles. The NA SV196 has greater axle loads than the BD86 SV train.
The calibration of LM3 calibration has been performed by comparison of the maximum ultimate design load effects given by:
f3 x fL x(BD86 x DAF x OL+ HA) BD86 Special Vehicles
QTraff x (LM3 x DAF + freq x LM1). National Annex Load Model 3
The factors are as follows:
NA
QTraff = 1.35
05.110
7.1
15.0
kaqDAF (=1.12 for SV100 axle load of 165 kN)
freq = 0.75
BD86
f3 = 1.1
fL = 1.1
05.110
7.1
15.0
kaqDAF (=1.12 for SV100 axle load of 165 kN)
OL = 1.2 on critical axle; 1.1 on all other axles
BD86 requires a dynamic impact factor of 1,1 to all axles apart from the most critically loaded axle which requires an impact factor of 1.2. The effect of the additional 1.2 factor applied to the critical axle as compared to a uniformly applied overload factor of 1.1 is marginal adding less than 2% to the total load effects. For shorter spans, governed by single or double axle effects, the design is governed by the heavier axles of the LM1 tandem system.
The combined factor on SV100 vehicle, ignoring the additional overload factor on the critical axle are:
NA: 1.35 x 1.12 = 1.51
BD86: 1.1 x 1.1 x 1.12 x 1.1 = 1.49
BACKGROUND TO UK NATIONAL ANNEXES TO
EN 1990 AnnexA2 and EN1991-2
4184274.014\MM\R2\Issue 2 30 Jan 2004
The LM3 factor is slightly greater than the BD86 loads. The additional overload on the critical BD86 axle makes a slight additional contribution which is compensated by the higher overall NA factor.
The same results also apply for the ultimate design load effects for the individual contributions of the other SV vehicles.
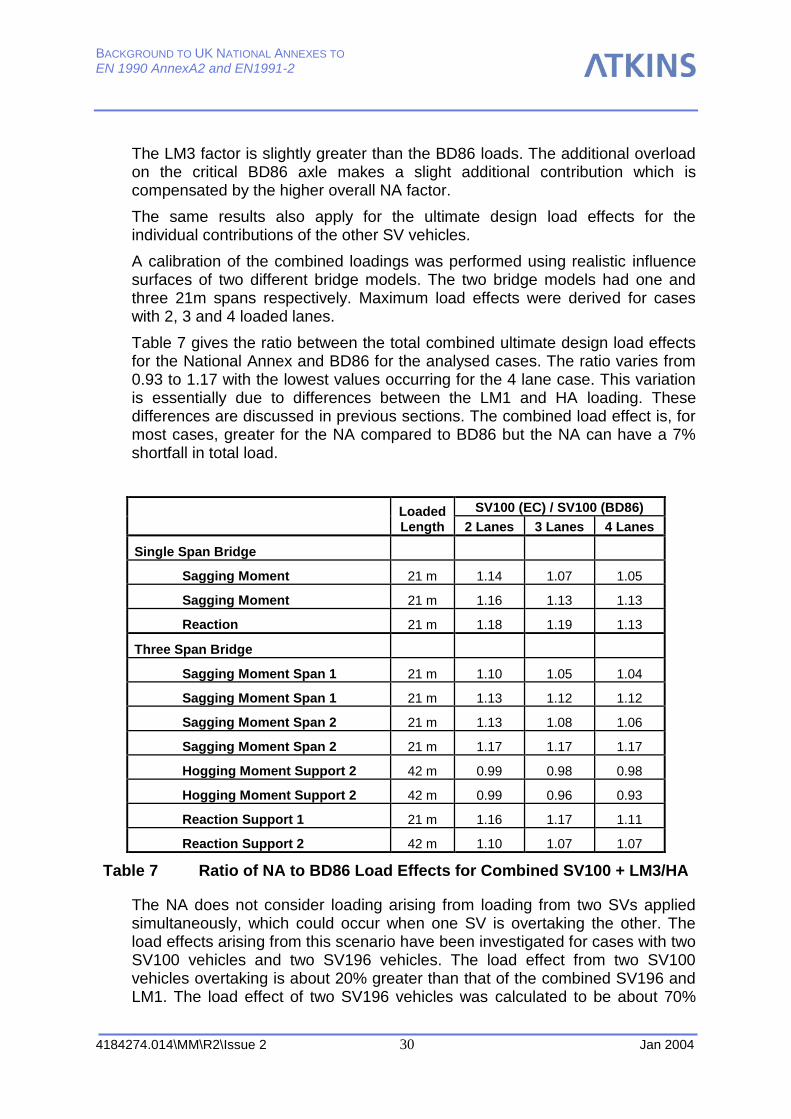
A calibration of the combined loadings was performed using realistic influence surfaces of two different bridge models. The two bridge models had one and three 21m spans respectively. Maximum load effects were derived for cases with 2, 3 and 4 loaded lanes.
Table 7 gives the ratio between the total combined ultimate design load effects for the National Annex and BD86 for the analysed cases. The ratio varies from 0.93 to 1.17 with the lowest values occurring for the 4 lane case. This variation is essentially due to differences between the LM1 and HA loading. These differences are discussed in previous sections. The combined load effect is, for most cases, greater for the NA compared to BD86 but the NA can have a 7% shortfall in total load.
Loaded Length
SV100 (EC) / SV100 (BD86)
2 Lanes 3 Lanes 4 Lanes
Single Span Bridge
Sagging Moment 21 m 1.14 1.07 1.05
Sagging Moment 21 m 1.16 1.13 1.13
Reaction 21 m 1.18 1.19 1.13
Three Span Bridge
Sagging Moment Span 1 21 m 1.10 1.05 1.04
Sagging Moment Span 1 21 m 1.13 1.12 1.12
Sagging Moment Span 2 21 m 1.13 1.08 1.06
Sagging Moment Span 2 21 m 1.17 1.17 1.17
Hogging Moment Support 2 42 m 0.99 0.98 0.98
Hogging Moment Support 2 42 m 0.99 0.96 0.93
Reaction Support 1 21 m 1.16 1.17 1.11
Reaction Support 2 42 m 1.10 1.07 1.07
Table 7 Ratio of NA to BD86 Load Effects for Combined SV100 + LM3/HA
The NA does not consider loading arising from loading from two SVs applied simultaneously, which could occur when one SV is overtaking the other. The load effects arising from this scenario have been investigated for cases with two SV100 vehicles and two SV196 vehicles. The load effect from two SV100 vehicles overtaking is about 20% greater than that of the combined SV196 and LM1. The load effect of two SV196 vehicles was calculated to be about 70%
BACKGROUND TO UK NATIONAL ANNEXES TO
EN 1990 AnnexA2 and EN1991-2
4184274.014\MM\R2\Issue 2 31 Jan 2004
greater than a single SV196 combined with LM1. This event would severely overload a bridge which has been designed to resist a single SV196.
8 CENTRIFUGAL FORCES
Provision for lateral centrifugal forces is provided in BD37/01 clause 6.9 and and EN1991-2 section 4.4.2. The centrifugal force is applied as lateral point loads in the appropriate lanes.
BD37/01 applies lateral point loads in any of two lanes at 50m longitudinal spacing. Thus if the bridge has a span of less than 50m a lateral point load is applied in each of any two lanes. The magnitude of the point loads is a function of the horizontal radius of curvature of the bridge.
EN1991-2 applies a lateral point load which is a proportion of the tandem system in each lane. This proportion is a related to the bridge radius of curvature.
The lateral centrifugal force for the SV196 vehicle has been calculated as a function of the radius of curvature and assuming its velocity is the lesser of 50 mph and the vehicle velocity for a given radius of curvature defined in BD21/01.
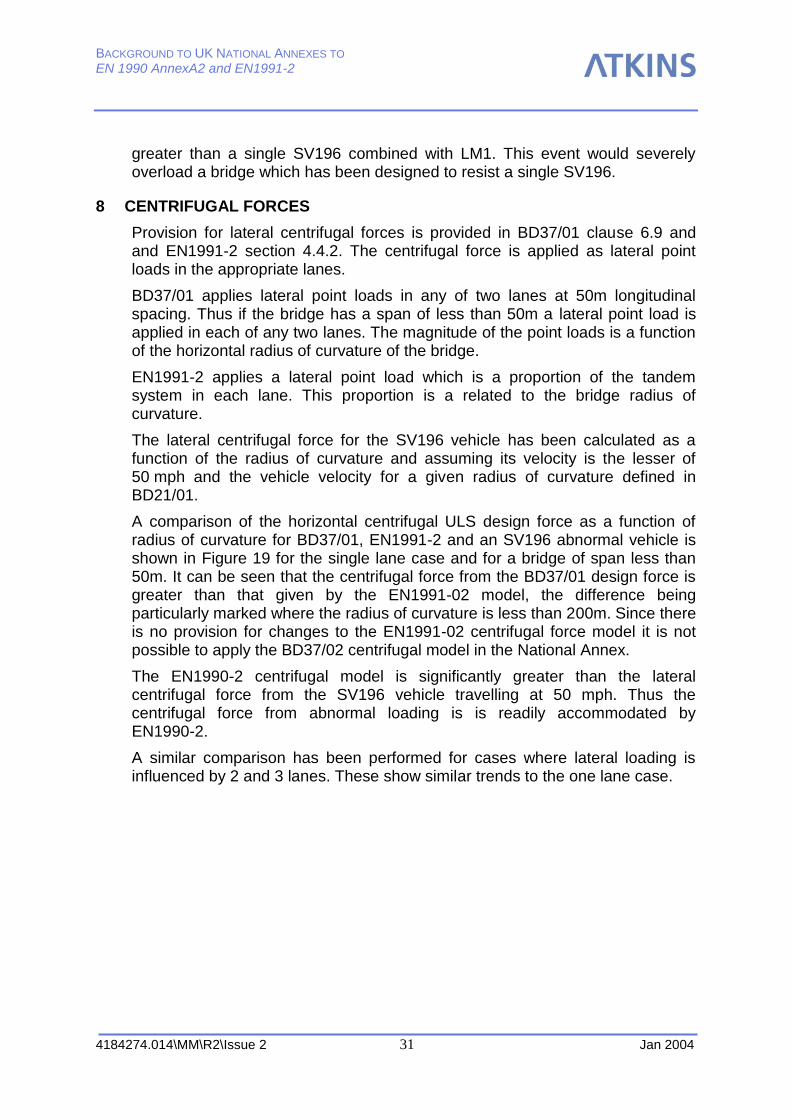
A comparison of the horizontal centrifugal ULS design force as a function of radius of curvature for BD37/01, EN1991-2 and an SV196 abnormal vehicle is shown in Figure 19 for the single lane case and for a bridge of span less than 50m. It can be seen that the centrifugal force from the BD37/01 design force is greater than that given by the EN1991-02 model, the difference being particularly marked where the radius of curvature is less than 200m. Since there is no provision for changes to the EN1991-02 centrifugal force model it is not possible to apply the BD37/02 centrifugal model in the National Annex.
The EN1990-2 centrifugal model is significantly greater than the lateral centrifugal force from the SV196 vehicle travelling at 50 mph. Thus the centrifugal force from abnormal loading is is readily accommodated by EN1990-2.
A similar comparison has been performed for cases where lateral loading is influenced by 2 and 3 lanes. These show similar trends to the one lane case.

BACKGROUND TO UK NATIONAL ANNEXES TO
EN 1990 AnnexA2 and EN1991-2
4184274.014\MM\R2\Issue 2 32 Jan 2004
Centrifugal Forces ULS
1 Lane Span<50m
0.00
50.00
100.00
150.00
200.00
250.00
300.00
0 200 400 600 800 1000 1200 1400 1600 1800 2000
Radius of Curvature (kN)
La
tera
l C
en
trif
ug
al
Fo
rce
(k
N)
EN1991-2
BD37/01
SV196
Figure 19 Lateral Centrifugal Forces in Lane 1 for Ultimate Limit State
9 DISCUSSION AND CONCLUSIONS
This report has presented the derivation of -factors for Load Model 1 for use in the National Annex to EN1991-2: Traffic Loads on Bridges and reliability based calibration of load partial factors for use in the National Annex to EN1990 Annex A2: Application for Bridges.
The deterministic procedure used for the derivation of the Type HA loading model given in BD37 for short spans was repeated with revised values for vehicle and axle loads, overload factor and Dynamic Amplification Factor. The effect of bunching was removed but the maximum values of load effects were not divided by 1.5 as in the previous derivation. This resulted in load effects about 10% to 20% higher than BD37 for single lane loading in the range of loaded lengths up to 20m. This result, substantiated by satisfactory performance of bridges designed to BD37 provides the reassurance for using BD37 as a basis for calibrating the Eurocode model for use in the UK.
The -factors for Load Model 1 were derived by deterministically fitting the nominal and design load effects to those resulting from BD37. Two lane widths of 3.0m and 3.65m and load combinations involving Lane 1, Lanes 1+2, Lanes 1+2+3 and Lanes 1+2+3+4 were considered. Reasonably good fit was obtained with BD37.

BACKGROUND TO UK NATIONAL ANNEXES TO
EN 1990 AnnexA2 and EN1991-2
4184274.014\MM\R2\Issue 2 33 Jan 2004
Comparison with EN1991-2 and NAD loading models shows that NAD model gives broadly comparable results to the proposed National Annex model being slightly conservative at short spans and unconservative at longer spans relative to BD37. The EN1991-2 ultimate load for Lane 1 is some 40% greater than BD37 but for Lanes 1+2 the loads are broadly comparable between the two models. For loading from four lanes the EN1991-2 loading is significantly lower than BD37. This is a result of conservative values of Lane Factors used in BD37.
The target reliability levels implicit in BD37 load model and load partial factors were determined for concrete and composite bridges for shear and bending limit states. Based on this a target reliability index of 5.8 was chosen for the calibration of load partial factors. The resulting values of partial factors to achieve the target reliability index were determined which obviously vary for the different cases considered. These values were rationalised to select a single set of partial load factors (given in Table 2). The resulting reliability indices with
the use of the proposed -factors and partial factors was verified for the cases considered and were found to be reasonably close to the target value.
Further rationalisation of -factors and partial factors is possible should this be considered necessary.
The LM1 traffic partial factor is also applicable to LM3 vehicles and will give
parity with BD86 loading accounting for f3, fL and the axle overload factor. There is no need for the NA to EN1991-2 to specify any additional dynamic impact factor over and above that applied to all the axles.
The situation where two special vehicles might be overtaking each other is not considered either in BD86 or the NA. This situation could lead to severe overloading and work is required to appraise the likelihood of such a scenario.

BACKGROUND TO UK NATIONAL ANNEXES TO
EN 1990 AnnexA2 and EN1991-2
4184274.014\MM\R2\Issue 2 34 Jan 2004
10 REFERENCES
Atkins, 2002(a), “Proposal for drafting the National Annex for EN1990: Annex A2: Application for Bridges”, Document Ref. 4184274.014\EN1990-A2 National Annex Proposal, Issue 2 March 2002”, Prepared for Highways Agency.
Atkins, 2002(b), “Drafting of National Annex for EN1990: Annex A2 – Application for Bridges, Selection of Action Combination Format”, Document Ref. 4184274.014\MM\R1\00 Issue 1 July 2002, Prepared for Highways Agency.
BD 21 – The Assessment of Highway Bridges and Structures (DMRB 3.4.3)
BD37/01 “Loads for highway bridges”, in Design Manual for Roads and Bridges, Volume 1, Section 3, The Highways Agency.
BD79 – Level 4 and Level 5 Assessment for Bridges (draft).
BD86/01 – The assessment of highway bridges and structures for effects of Special Types General Order (STGO) and Special Order (SO) vehicles.
Calgaro, J.A., 1997, “Road Traffic Loads – Calibration of the Main Loading System: Background Studies to ENV 1991-2: Traffic Loads on Bridges”
Cooper, D.I. 1997, “Development of short-span bridge-specific assessment live loading”, in Safety of Bridges, ed. P. Das, pp. 64-89Thomas Telford, London 1997.
DMRB – Design Manual for Roads and Bridges, The Highways Agency.
Flint & Neill Partnership, 2000, “Draft Background Report on the Development of the Quantitative Provisions in the National Application Document”, Document Ref. 724/8/11/00, prepared for the Highways Agency.
prEN 1990: Eurocode: Basis of structural design, Final Draft, July 2001
prEN 1990: Annex A2 – Eurocode: Basis of structural design Annex A2 : Application for Bridges (Normative), November, 2002
prEN 1991-2: Eurocode 1: Actions on Structures – Part 2: Traffic Loads on Bridges.