bacon, t. j., seiler, c., wolny, m., hughes, r., watson, p...
TRANSCRIPT

Bacon, T. J., Seiler, C., Wolny, M., Hughes, R., Watson, P., Schwabe, J., ...Peckham, M. (2015). Histone deacetylase 3 indirectly modulates tubulinacetylation. Biochemical Journal, 472(3), 367-377. DOI:10.1042/BJ20150660
Publisher's PDF, also known as Version of record
License (if available):CC BY
Link to published version (if available):10.1042/BJ20150660
Link to publication record in Explore Bristol ResearchPDF-document
This is the final published version of the article (version of record). It first appeared online via Portland Press athttp://www.biochemj.org/content/472/3/367.article-info. Please refer to any applicable terms of use of thepublisher.
University of Bristol - Explore Bristol ResearchGeneral rights
This document is made available in accordance with publisher policies. Please cite only the publishedversion using the reference above. Full terms of use are available:http://www.bristol.ac.uk/pure/about/ebr-terms

Biochem. J. (2015) 472, 367–377 doi:10.1042/BJ20150660 367
Histone deacetylase 3 indirectly modulates tubulin acetylationTravis Bacon*, Caroline Seiler*, Marcin Wolny*, Ruth Hughes*, Peter Watson†, John Schwabe†, Ronald Grigg‡ andMichelle Peckham*1
*School of Molecular and Cellular Biology, Faculty of Biological Sciences, University of Leeds, Leeds LS2 9JT, U.K.†Department of Molecular and Cell Biology, Henry Wellcome Laboratories of Structural Biology, University of Leicester, Lancaster Road, Leicester LE1 9HN, U.K.‡School of Chemistry, Faculty of Maths and Physical Sciences, University of Leeds, Leeds LS2 9JT, U.K.
Histone deacetylase 3 (HDAC3), a member of the Class Isubfamily of HDACs, is found in both the nucleus and thecytoplasm. Its roles in the nucleus have been well characterized,but its cytoplasmic roles are still not elucidated fully. We foundthat blocking HDAC3 activity using MI192, a compound specificfor HDAC3, modulated tubulin acetylation in the human prostatecancer cell line PC3. A brief 1 h treatment of PC3 cells with MI192significantly increased levels of tubulin acetylation and ablated thedynamic behaviour of microtubules in live cells. siRNA-mediatedknockdown (KD) of HDAC3 in PC3 cells, significantly increased
levels of tubulin acetylation, and overexpression reduced it.However, the active HDAC3–silencing mediator of retinoicand thyroid receptors (SMRT)–deacetylase-activating domain(DAD) complex did not directly deacetylate tubulin in vitro.These data suggest that HDAC3 indirectly modulates tubulinacetylation.
Key words: acetylation, histone deacetylase 3, microtubules,tubulin.
INTRODUCTION
Histone deacetylases (HDACs) comprise a family of enzymesthat remove acetyl groups from proteins, with the first familymembers isolated over 40 years ago [1]. Although these enzymeswere first found to deacetylate nuclear histone proteins, hencethe name ‘histone’ deacetylase [2], more recently HDACs havealso been shown to act on non-histone proteins includingcytoplasmic proteins in some cases [3]. In mammals, fourclasses of HDAC exist [4,5], with classification based onsequence homology to the original yeast enzymes and domainorganization. Class I HDACs include HDAC1–HDAC3 andHDAC8, and, with the exception of HDAC3, localize primarilyto the nucleus, although HDAC8 additionally localizes tothe cytoplasm in smooth muscle cells [6]. Class II HDACscan be divided into two subclasses: IIa (HDAC4, HDAC5,HDAC7 and HDAC9), which are found in both the nucleus and thecytoplasm and IIb (HDAC6 and HDAC10), which are primarilycytoplasmic in their localization. Of the Class III HDACs (sirtuins,SIRT1–SIRT7) SIRT1, SIRT6 and SIRT7 localize to the nucleus,SIRT2 to the cytoplasm and SIRT3, SIRT4 and SIRT5 tomitochondria, with SIRT3 also localizing to the nucleus. Thesole member of the Class IV family (HDAC11) is found in boththe nucleus and the cytoplasm.
The functions of HDAC3 in the nucleus have been welldescribed. For example, HDAC3 forms a well-characterizedprotein complex with the nuclear receptor co-repressor (NCoR)or the homologous SMRT (silencing mediator of retinoic andthyroid receptors) complex in the nucleus [7] where it interactswith a conserved deacetylase-activating domain (DAD) withinNCoR/SMRT, which activates the complex [8–10]. The complexis recruited to specific promoters, where HDAC3 deacetylates thehistones, leading to gene silencing. This complex and HDAC3
have been shown to be essential for maintenance of chromatinstructure and genome stability [11]. Ins(1,4,5,6)P4 regulates theinteraction of HDAC3 with SMRT and has been suggested toregulate other HDAC3–protein complexes [12].
HDAC3 is involved in a wide range of other interactions thatare less well characterized. It can interact with Class II HDACs(HDAC4, HDAC5, HDAC7 and HDAC9) via the transcriptionalco-repressor NCoR/SMRT ([13,14] and reviewed in [15]). Itcan bind to, and be activated by, the nuclear envelope proteinemerin [16], which regulates expression and localization ofmuscle transcription factors during myogenesis [17]. It can bindto and deacetylate nuclear factor-κB (NF-κB), playing a role ininterleukin-1 (IL-1) expression and the inflammatory response[18]. Normal huntingtin protein binds to and sequesters HDAC3primarily in the nucleus [19], but mutant huntingtin does not,exposing neurons to HDAC3’s neurotoxic effect [20]. HDAC3also binds to the ataxin–1NCoR–SMRT complex and plays a rolein other polyglutamine-repeat diseases such as spinocerebellarataxia (reviewed in [15]).
In addition to its nuclear roles, HDAC3 has roles in thecytoplasm, as it is found in both the cytoplasm and the nucleusand can shuttle between them [21]. Although the nuclear rolesof HDAC3 have been well established, its cytoplasmic roles areless well characterized, whereas roles in signal transduction, andparticularly in inflammatory signalling, have been established.For example, HDAC3 binds to IκBα (inhibitor of NF-κBα) inthe cytoplasm, and breakdown of IκBα following stimulationby tumour necrosis factor-α (TNF-α) results in the nucleartranslocation of HDAC3 [22]. Conversely, deacetylation of RelA(p65) by HDAC3 in the nucleus, allows the nuclear export ofthe NF-κB complex [23]. Its ability to bind to and deacetylatemembers of the signal transducer and activator of transcription(STAT) proteins STAT1 [24] and STAT3 [25] may play a role in
Abbreviations: DAD, deacetylase-activating domain; EB1, end-binding 1; ERK, extracellular-signal-regulated kinase; HDAC, histone deacetylase; HEK,human embryonic kidney; IκBα, inhibitor of NF-κB α; IL, interleukin; KD, knockdown; NCoR, nuclear receptor co-repressor; NF-κB, nuclear factor-κB;SAHA, suberoylanilide hydroxamic acid; SMRT, silencing mediator of retinoic and thyroid receptors; STAT, signal transducer and activator of transcription;TBL1, transducing-β-like protein 1; TNF, tumour necrosis factor.
1 To whom correspondence should be addressed (email [email protected]).
c© 2015 Authors. This is an open access article published by Portland Press Limited and distributed under the Creative Commons Attribution License 3.0.

368 T. Bacon and others
the cytoplasmic retention of these proteins. HDAC3 can localizeto the plasma membrane in a subpopulation of cells, where itforms a complex with c-Src, implicating c-Src (a tyrosine kinase)in HDAC3 regulation [21]. HDAC3 has been shown to localize tomuscle sarcomeres, and deacetylate the myosin heavy chain [26].Finally, in mitosis, a complex of HDAC3, NCoR1, transducing-β-like protein 1 (TBL1) and TBL1-related proteins has been reportedto localize to and maintain the structure of the mitotic spindle [27].
Selectively inhibiting HDAC3 has been suggested to holdpromise in treating a range of diseases, from inflammation, toneuro-protective effects [15] and cancer therapy [28]. Severalspecific HDAC3 inhibitors have been described (reviewed in [15]).One of these, MI192, is highly selective for HDAC3, and hasbeen shown to inhibit TNF and IL-6 production in peripheralblood mononuclear cells [29] as well as promote apoptosis inacute myeloid leukaemic cell lines [30]. In common with otherClass I HDAC selective inhibitors, such as MGCD0103, which isselective for both HDAC1 and HDAC2, but 30-fold less activeagainst HDAC3, and MS-275, which is highly active againstHDAC1, but much less active against HDAC2 and HDAC3 [14],MI192 has the same terminal benzamide structure that chelatesthe Zn2 + ion at the HDAC active site. MI192 is less effective atinhibiting HDAC3 than trichostatin A (TSA), but it is selectivefor Class I HDACS, and has a greatly enhanced activity againstHDAC3 compared with HDAC1 within this subgroup. Thuswe speculated that this HDAC3 inhibitor should be useful inprobing for its other, as yet uncharacterized, cytoplasmic roles.In particular, we were interested in determining whether HDAC3was able to modulate α-tubulin acetylation, in common with twoother HDACs found in the cytoplasm, HDAC6 and SIRT2 [10,31–33]. We followed up our findings with the inhibitor with siRNA-mediated knockdown (KD) and overexpression experiments.Taken together our results suggest that HDAC3 may also be ableto modulate α-tubulin acetylation as one of its cytoplasmic roles.
MATERIALS AND METHODS
Cell lines, antibodies and expression constructs
Immortalized human prostate cancer (PC3) cells, obtainedfrom the A.T.C.C. (Manassas, VA, U.S.A.), were used inthese experiments. They were cultured in RPMI 1640 mediumcontaining GlutaMAXTM (Gibco), supplemented with 10%heat-inactivated FBS, 1% penicillin and 1 % streptomycin.Antibodies used in staining and/or Western blotting were:anti-acetylated α-tubulin (Sigma), anti-α-tubulin (Serotec), anti-HDAC3 (rabbit, Santa Cruz Biotechnology), anti-HDAC6 (rabbit,Santa Cruz Biotechnology) and anti-total extracellular-signal-regulated kinase (ERK; p44/42 mitogen-activated protein kinase,Cell Signaling Technology). Secondary antibodies were used atthe following dilutions: anti-mouse, 1:250 [Alexa Fluor 647 IgG(H + L), Molecular Probes, A21235]; anti-rat, 1:250 [Alexa Fluor488 IgG (H + L), Molecular Probes, A21208]. Additional markersused were 546 phalloidin (actin, 1:100 dilution), DAPI (nuclear,1:500 dilution). Note that, although we routinely used anti-totalERK as our loading control in the data shown here, reprobingthe same blots with glyceraldehyde-3-phosphate dehydrogenase(GAPDH) showed similar results, and checks on the equivalentSDS gels, also confirmed similar protein loading on each of ourgels and blots.
Human HDAC3 clones were obtained from Professor EdwardSeto [34]. The HDAC3–GST bacterial expression construct wasobtained from Professor Edward Seto [34], and subcloned intopEGFPC1 to generate a GFP-fusion protein. The entire eGFP–HDAC3 cDNA was then excised and subcloned into the pDC315
adenoviral plasmid (Microbix). This plasmid was used to makeadenovirus as described in [35]. To infect cells, 1 μl of purifiedvirus was diluted in 500 μl of RPMI 1640 medium beforeslowly adding to the cells (multiplicity of infection of ∼10) andincubating for 24 h at 37 ◦C with 5% CO2.
Immunostaining
Cells were grown on glass coverslips, fixed with 2%paraformaldehyde in PBS and stained using standard procedures[36]. Cells were imaged using a Deltavision Deconvolutionmicroscope or a Zeiss 880 Confocal with AiryScan (Figure 5).Images used for quantification (Figure 5) were captured usingthe Deltavision system, using the same exposure settings. Thefluorescence intensity of a 75 pixels × 75 pixels square wasmeasured using ImageJ (NIH), for nine cells, from at least twoseparate experiments. Images for mitotic cells were captured usingthe Deconvolution microscope using the ×100 objective, 1 × 1binning and a stack size of 20 over a total of 4 μm. The size ofthe spindles and the area was measured from the final maximumintensity projection image for the total stack, using ImageJ.
HDAC3 inhibitor
The cells were treated with the HDAC3-selective inhibitor MI192at a range of concentrations, for 0.5–24 h. MI192 was producedby Ronald Griggs (Department of Chemistry, University ofLeeds) and tested using MS and micro-analyses to confirm itspurity. MI192 was solubilized in DMSO (Sigma), and all MI192concentrations in the experiments described here were delivered in0.1% DMSO. Control cells were treated with 0.1 % DMSO only.
HDAC activity assay
A colorimetric HDAC activity assay kit (BioVision) was usedto assess HDAC activity in protein samples extracted fromtreated PC3 cells. Sample protein (50 μg) was incubated witha colorimetric acetylated lysine-containing substrate for 1 h at37 ◦C in 5% CO2. Lysine developer was then added, followed byan additional 30-min incubation. The deacetylated lysine residuesreact with the lysine developer, releasing a chromophore from thesubstrate, which was measured spectroscopically at 405 nm usinga colorimetric plate reader (POLARstar, Optima).
Western blotting
Cells were lysed (30 min, 4 ◦C) in lysis buffer [150 mM NaCl,0.05 M Tris/HCl (pH 8), 1% Triton X-100, 1 mM EDTA (pH 8)with protease inhibitor cocktail (Thermo Scientific)]. Lysateswere clarified by centrifugation, protein content quantified byBCA assay, then samples mixed with 2 × Laemmli buffer foruse in protein gels and blots (30 μg was added to each well).If required, membranes were stripped using Restore WesternBlot Stripping Buffer (Thermo Scientific) and then re-probed.ImageJ was used to quantify protein expression from the Westernblots. ERK1/2 was used as a loading control in all the blots, tocompensate for any differences in protein loading.
RNAi
siGENOME SMARTpool siRNA (GE Healthcare Dharmacon)for HDAC3 and HDAC6 was used to KD their expression.Cells were seeded at a density of 30 000 cells/ml in growthmedium, allowed to adhere and grow overnight. Lipofectamine®
c© 2015 Authors. This is an open access article published by Portland Press Limited and distributed under the Creative Commons Attribution License 3.0.
HDAC3 modulates tubulin acetylation 369
RNAiMAX Reagent (Invitrogen, Life Technologies) was used fortransfections. Maximum KD (>80%) was achieved after 72 h.
Microtubule dynamics
To visualize microtubule dynamics in live cells, cells wereinfected with an adenovirus for eGFP–end-binding 1 (EB1),and cells were imaged by time-lapse imaging on a Deltavisiondeconvolution microscope, fitted with an incubator set to atemperature of 37◦C, and using the ×63 oil objective. Prior toimaging, cells were treated for 1 h with increasing concentrationsof MI192. Images of eGFP–EB1-labelled microtubule tips weretaken every 2 s, and movement of the EB1 fluorescent spots weresubsequently tracked using the MTrackJ plug-in in ImageJ.
Flow cytometry
MI192 cytotoxicity was assessed with flow cytometry using anannexin V and propidium iodide Apoptosis Detection Kit (BDPharmingen) to quantify the proportion of healthy, apoptoticand necrotic cells following 24 h of control (0.1% DMSO) ormaximal (10 μM) M192 treatment.
HDAC3–SMRT 350–480 complex deacetylation activity
The HDAC3–SMRT 350–480 complex was expressed andpurified from human embryonic kidney (HEK)-293 cells asdescribed in [37]. HDAC activity assays were carried out in a black96-well plate. In a final volume of 50 μl, 50 nM HDAC3–SMRT350–480 [with or without 100 μM suberoylanilide hydroxamicacid (SAHA) as required] was incubated with 100 μMt-butoxycarbonyl-lysine-7-amino-4-methylcoumarin (BOC-Lys-AMC) substrate for 30 min at 37 ◦C in 50 mM Tris/HCl,pH 7.5, and 50 mM NaCl. Reactions were developed by theaddition of 50 μl of 2 mM trichostatin A, 10 mg/ml trypsin,50 mM Tris/HCl, pH 7.5, and 100 mM NaCl. Fluorescence wasthen measured at 335/460 nm using a Victor X5 plate reader(PerkinElmer).
Tubulin was polymerized in general tubulin buffer (80 mMPIPES, pH 7.0, 2 mM MgCl and 0.5 mM EGTA) plus 1 mMGTP and 20 μM taxol at 35 ◦C for 20 min. HDAC3–SMRT 350–480 complex (11.3 μM) was incubated with 0.2 nM microtubulesfor up to 2 h at 37 ◦C. Solution containing microtubules onlywas used as a control. Samples were collected every 0.5 hand immediately mixed with Laemmli buffer. Samples weresubjected to SDS/PAGE and transferred on to a nitrocellulosemembrane. Anti-acetylated microtubule antibody was used toassess deacetylation efficiency and anti-β-tubulin antibody wasused as a loading control.
Microtubule-binding assay
A microtubule-binding assay was carried out using the Micro-tubule Binding Protein Spin-down Assay Kit (Cytoskeleton),following the recommended protocol. Microtubule-associatedprotein and BSA were used as a positive and negative controlsrespectively. Amounts of 2 μg (0.6 μM) and 5 μg (1.6 μM) ofthe HDAC3–SMRT complex were used as test samples. Sampleswere incubated at room temperature for 30 min and spun downat 100000 g for 40 min at room temperature. Binding of controlproteins was assessed by SDS/PAGE, whereas binding of HDAC3,was assessed by Western blotting using anti-HDAC3 antibodies,as it is similar in size to tubulin.
Data and statistical analysis
Microsoft Excel was used to quantify sample proteinconcentrations and HDAC activity, as well as EB1 traffickingspeed, before statistical analyses were performed on GraphPadPrism 6. ImageJ was used to analyse immunoblots and digitizedimages of immunostained cells. GraphPad Prism 5.0 wasused to prepare graphs and analyse data. Data are presentedas means +− S.E.M., for at least three separate experiments(n � 3). A two-way ANOVA was used to compare differencesbetween groups and statistical significance was accepted forP � 0.05.
RESULTS
MI192 inhibits HDAC3 and alters tubulin acetylation in PC3 cells
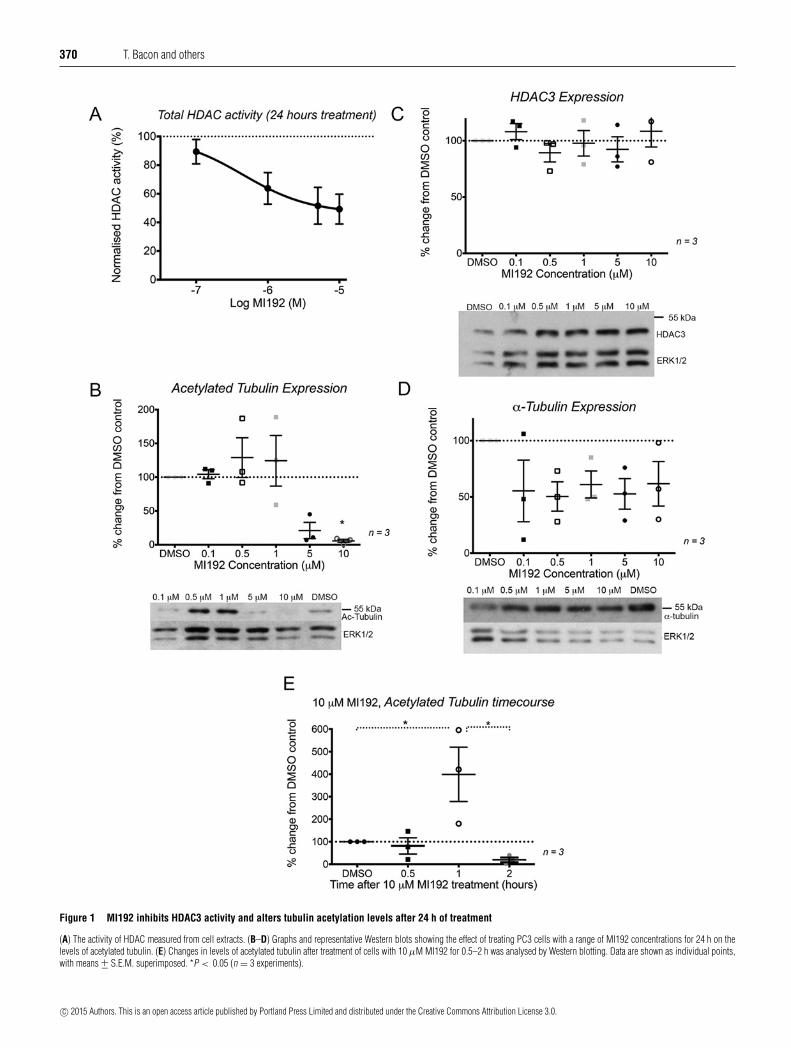
MI192 is able to inhibit HDAC3 activity in PC3 cells, as shown byan HDAC activity assay (Figure 1A). MI192 reduced total HDACactivity by 49 +− 9% at a concentration of 10 μM after 24 h oftreatment, with an IC50 value of 0.45 μM. This value is similar tothat measured previously for HeLa cell nuclear extracts [30].
MI192 inhibition of HDAC3 had a complex effect on tubulinacetylation levels. Continued treatment of PC3 cells for 24 hat low (0.5 or 1 μM) MI192 concentrations slightly increasedtubulin acetylation levels, but at higher concentrations (5 or10 μM), levels of tubulin acetylation decreased. This decreasewas significantly different from control cells for 10 μM MI192(Figure 1B). These effects were not due to changes in HDAC3expression levels (Figure 1C). Moreover, total levels of α-tubulindid not change (Figure 1D). In contrast, treating PC3 cells forjust 1 h with 10 μM MI192 significantly increased the levels ofacetylated tubulin (Figure 1E). The levels of acetylated tubulinwere 4-fold higher than those in control cells at the same timepoint (399 +− 98%, P � 0.05) (Figure 1E). After treating cells for2 h with 10 μM MI192, levels of acetylated tubulin had alreadybegun to decrease to below the levels found in untreated cells(20 +− 9%) (Figure 1E). Thus, treatment with 10 μM MI192results in an acute increase in tubulin acetylation levels at 1 h,followed by a rapid fall which is maintained over the next24 h.
Imaging of cells fixed and stained for actin, tubulin andacetylated tubulin, after treatment with MI192, also showedthese changes in acetylated tubulin levels (Figure 2). After1–2 h of treatment with 10 μM MI192, actin and α-tubulinexpression and organization does not appear to change, butnumbers of acetylated microtubules first increase (at 1 h) thendecrease (at 2 h) (Figure 2A). After 24 h, we found that therewere fewer microtubules present in the cells treated with 10 μMMI192, compared with cells treated with 0.1 % DMSO or 1 μMMI192 (Figure 2B). Actin organization was not affected. Thus,treating PC3 cells with 10 μM MI192 initially increases levels ofacetylated tubulin (within the first 1 h) and then decreases levels.Although levels of tubulin remain unaltered (by Western blotting),the rapid fall in tubulin acetylation is associated with significanttubulin depolymerization.
MI192 significantly reduces microtubule dynamics
The effects of MI192 on levels of acetylated tubulin wereassociated with alterations in microtubule dynamics, as assessedby monitoring the dynamics of eGFP-conjugated EB1, a proteinthat binds to growing microtubule tips. Microtubule dynamicswere reduced in a MI192 concentration-dependent manner incells expressing eGFP–EB1 after 1 h of treatment (Figure 3). At
c© 2015 Authors. This is an open access article published by Portland Press Limited and distributed under the Creative Commons Attribution License 3.0.
370 T. Bacon and others
Figure 1 MI192 inhibits HDAC3 activity and alters tubulin acetylation levels after 24 h of treatment
(A) The activity of HDAC measured from cell extracts. (B–D) Graphs and representative Western blots showing the effect of treating PC3 cells with a range of MI192 concentrations for 24 h on thelevels of acetylated tubulin. (E) Changes in levels of acetylated tubulin after treatment of cells with 10 μM MI192 for 0.5–2 h was analysed by Western blotting. Data are shown as individual points,with means +− S.E.M. superimposed. *P < 0.05 (n = 3 experiments).
c© 2015 Authors. This is an open access article published by Portland Press Limited and distributed under the Creative Commons Attribution License 3.0.

HDAC3 modulates tubulin acetylation 371
Figure 2 Immunostaining shows changes to acetylated tubulin organizationafter a short (1 h) and longer (24 h) exposure to high levels of MI192 (10 μM)
(A) Representative images of PC3 cells stained for actin, α-tubulin and acetylated (Ac) tubulinat 1 h (control DMSO), 1 h of treatment with 10 μM MI192 and 2 h of treatment with 10 μMMI192. (B) Representative images of PC3 cells stained for actin (red), α-tubulin (green) andacetylated tubulin (Ac-tubulin, blue) after treatment for 24 h with 0.1 % DMSO (control), 1 or10 μM MI192.
10 μM MI192, no dynamic microtubule behaviour was observed,and EB1 did not preferentially bind to the microtubule tipsbut bound non-specifically along the microtubules (Figure 3A).As EB1 normally recognizes and preferentially binds to GTP-positive microtubule ends [38], this suggests the potential loss ofGTP-positive microtubule caps in MI192-treated cells. Reducingthe concentration of MI192 to 1 μM significantly reducedmicrotubule dynamics, although in this case eGFP–EB1 didlabel growing microtubule tips (Figure 3A). The speed of EB1-labelled microtubule tips in cells treated with 1 μM MI192 for 1 hwas significantly slower (0.14 +− 0.01 μm · s− 1) compared withcontrols (0.23 +− 0.02 μm · s− 1; P � 0.01, n=7) (Figure 3B).At the lowest MI192 concentration tested (0.1 μM), microtubuledynamics were slightly reduced, but were not significantlydifferent from controls (Figure 3B).
Figure 3 MI192 affects microtubule dynamics
(A) Images of cells expressing eGFP–EB1, after treatment with 0.1, 1 or 10 μM MI192 for 1 h.Images were captured every 2 s, for a total of 40 s (a total of 20 frames). The images shown weregenerated from the image sequences using ImageJ Fiji, and the temporal-colour code plug, toshow the lengths of the tracks and how they vary between the different conditions. The colourcode reference is shown below the images. (B) Speed of EB1 spots, tracked for seven cells.Means +− S.E.M. are shown. **P < 0.01. (C) Flow cytometry analysis using FITC–annexinV and propidium iodide to estimate apoptosis (live and dead cells) and necrotic cells with orwithout 10 μM MI192 treatment.
MI192 induces pro-apoptotic mechanisms in prostate cancer cells
Given the marked effects of MI192 on tubulin, we additionallytested whether high levels of MI192 could induce apoptosis(Figure 3C). After 24 h of treatment with 10 μM MI192, we found
c© 2015 Authors. This is an open access article published by Portland Press Limited and distributed under the Creative Commons Attribution License 3.0.
372 T. Bacon and others
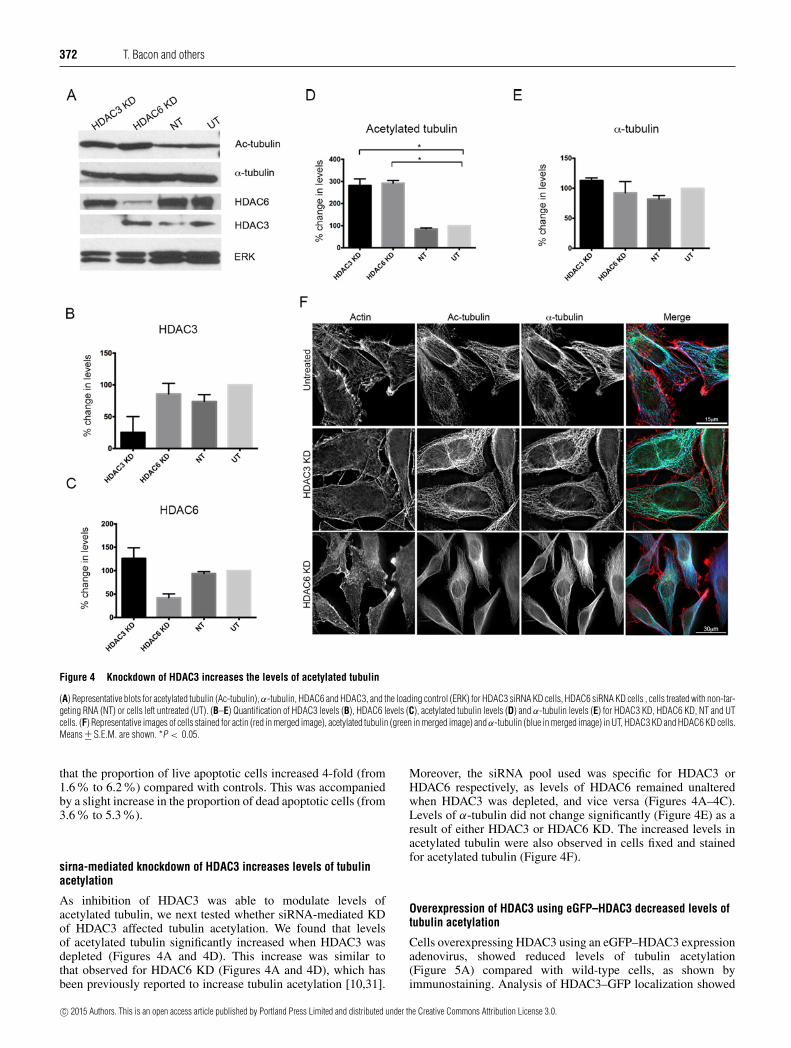
Figure 4 Knockdown of HDAC3 increases the levels of acetylated tubulin
(A) Representative blots for acetylated tubulin (Ac-tubulin), α-tubulin, HDAC6 and HDAC3, and the loading control (ERK) for HDAC3 siRNA KD cells, HDAC6 siRNA KD cells , cells treated with non-tar-geting RNA (NT) or cells left untreated (UT). (B–E) Quantification of HDAC3 levels (B), HDAC6 levels (C), acetylated tubulin levels (D) and α-tubulin levels (E) for HDAC3 KD, HDAC6 KD, NT and UTcells. (F) Representative images of cells stained for actin (red in merged image), acetylated tubulin (green in merged image) and α-tubulin (blue in merged image) in UT, HDAC3 KD and HDAC6 KD cells.Means +− S.E.M. are shown. *P < 0.05.
that the proportion of live apoptotic cells increased 4-fold (from1.6% to 6.2%) compared with controls. This was accompaniedby a slight increase in the proportion of dead apoptotic cells (from3.6% to 5.3%).
sirna-mediated knockdown of HDAC3 increases levels of tubulinacetylation
As inhibition of HDAC3 was able to modulate levels ofacetylated tubulin, we next tested whether siRNA-mediated KDof HDAC3 affected tubulin acetylation. We found that levelsof acetylated tubulin significantly increased when HDAC3 wasdepleted (Figures 4A and 4D). This increase was similar tothat observed for HDAC6 KD (Figures 4A and 4D), which hasbeen previously reported to increase tubulin acetylation [10,31].
Moreover, the siRNA pool used was specific for HDAC3 orHDAC6 respectively, as levels of HDAC6 remained unalteredwhen HDAC3 was depleted, and vice versa (Figures 4A–4C).Levels of α-tubulin did not change significantly (Figure 4E) as aresult of either HDAC3 or HDAC6 KD. The increased levels inacetylated tubulin were also observed in cells fixed and stainedfor acetylated tubulin (Figure 4F).
Overexpression of HDAC3 using eGFP–HDAC3 decreased levels oftubulin acetylation
Cells overexpressing HDAC3 using an eGFP–HDAC3 expressionadenovirus, showed reduced levels of tubulin acetylation(Figure 5A) compared with wild-type cells, as shown byimmunostaining. Analysis of HDAC3–GFP localization showed
c© 2015 Authors. This is an open access article published by Portland Press Limited and distributed under the Creative Commons Attribution License 3.0.

HDAC3 modulates tubulin acetylation 373
Figure 5 Overexpression of HDAC3 reduces levels of tubulin acetylation
(A) Cells expressing eGFP–HDAC3, co-stained for tubulin and acetylated tubulin. Arrows indicate regions where there is some co-localization between eGFP–HDAC3 and acetylated tubulin. (B)Cells stained for acetylated tubulin (Ac-tubulin) in HDAC3 KD cells, control [untreated (UT) cells] and in cells expressing eGFP–HDAC3 (as in A). (C and D) Changes in levels of acetylated tubulinassessed from fluorescent images for eGFP–HDAC3 expression and HDAC3 KD experiments. (E) Assessment of total tubulin expression from fluorescent images for KD experiments. n = 9 cells,data shown as means +− S.D. ***P < 0.001.
that levels of GFP–HDAC3 were approximately 2-fold higher inthe nucleus than in the cytoplasm. Acetylated microtubules werestill present in the cytoplasm, but commonly more fragmented.Staining for α-tubulin showed that microtubules were stillabundant (Figure 5A), and thus the lack of staining for acetylatedtubulin is not due to a loss of microtubules overall. eGFP–HDAC3 could occasionally be found associated with microtubulesin these overexpressing cells in the immunofluorescence images(Figure 5A). Directly comparing the staining pattern for acetylated
tubulin between HDAC3 KD cells, wild-type and eGFP–HDAC3-expressing cells showed the abundant levels of acetylated tubulinin KD cells, compared with the fragmented appearance ofacetylated tubulin in eGFP–HDAC3-expressing cells (Figure 5B).Quantification of the fluorescence levels for acetylated tubulin inHDAC3 KD and eGFP–HDAC3-overexpressing cells comparedwith untreated controls, or cells infected with an adenovirusexpressing an unrelated eGFP-fusion protein (MEGF10–GFP)showed that levels of acetylated tubulin were significantly
c© 2015 Authors. This is an open access article published by Portland Press Limited and distributed under the Creative Commons Attribution License 3.0.
374 T. Bacon and others
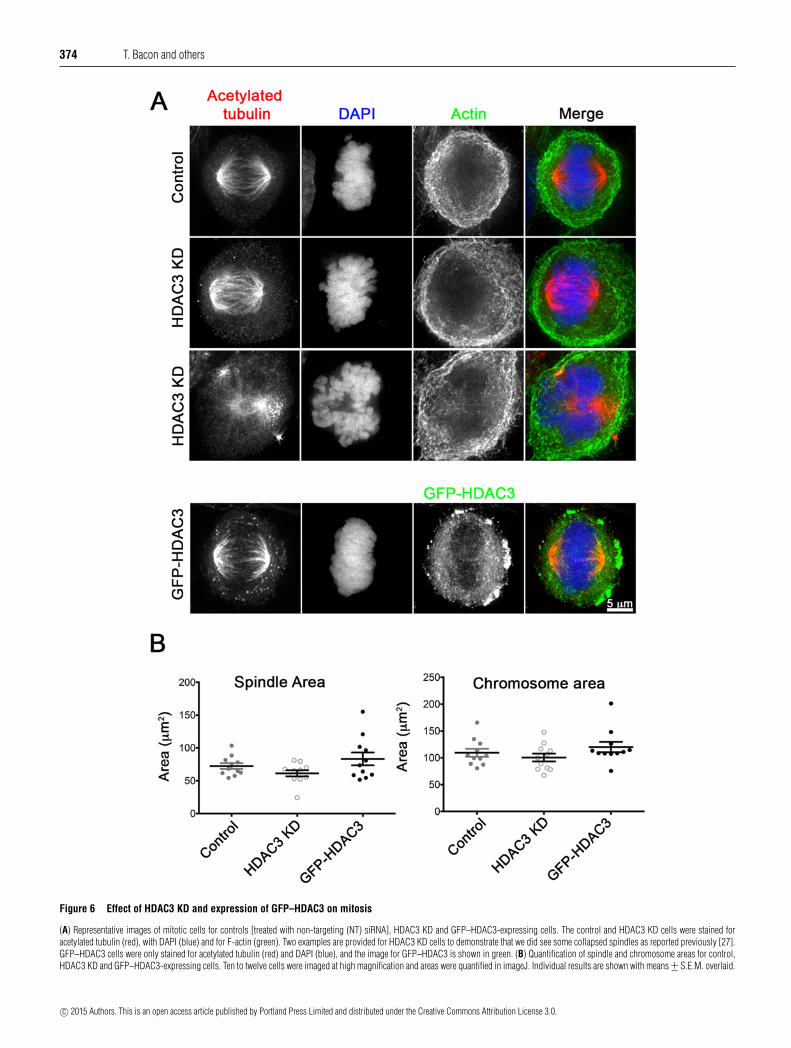
Figure 6 Effect of HDAC3 KD and expression of GFP–HDAC3 on mitosis
(A) Representative images of mitotic cells for controls [treated with non-targeting (NT) siRNA], HDAC3 KD and GFP–HDAC3-expressing cells. The control and HDAC3 KD cells were stained foracetylated tubulin (red), with DAPI (blue) and for F-actin (green). Two examples are provided for HDAC3 KD cells to demonstrate that we did see some collapsed spindles as reported previously [27].GFP–HDAC3 cells were only stained for acetylated tubulin (red) and DAPI (blue), and the image for GFP–HDAC3 is shown in green. (B) Quantification of spindle and chromosome areas for control,HDAC3 KD and GFP–HDAC3-expressing cells. Ten to twelve cells were imaged at high magnification and areas were quantified in imageJ. Individual results are shown with means +− S.E.M. overlaid.
c© 2015 Authors. This is an open access article published by Portland Press Limited and distributed under the Creative Commons Attribution License 3.0.

HDAC3 modulates tubulin acetylation 375
Figure 7 Effect of active HDAC3–SMRT–DAD complex on tubulin acetylationand tubulin association in vitro
(A) The HDAC3–SMRT 350–480 complex is enzymatically active and can be readily inhibitedby the HDAC inhibitor SAHA. (B) Representative Western blots for acetylated tubulin, and forβ-tubulin (as a control for total amount of tubulin) in the absence (Control) and presence of theHDAC3 complex following incubation for different lengths of time. (C). Representative Westernblot for a microtubule-binding assay at two different HDAC3 complex concentrations, in thepresence or absence of microtubules.
reduced in HDAC3-overexpressing cells compared with controls(Figure 5C), and significantly increased in HDAC3 KD cellscompared with controls (Figure 5D), whereas levels of unmodifiedtubulin remained the same (Figure 5E).
Exogenous expression of eGFP–HDAC3 or knockdown of HDAC3had minor effects on mitosis
We also examined the effects of expressing eGFP–HDAC3 orreducing expression levels of HDAC3 by siRNA on mitosis.Previously, it has been reported that HDAC3 is recruited tothe mitotic spindle, where it is required for kinetochore–microtubule attachment, and that KD of HDAC3 reduced thewidth of the spindle, and could result in a ‘dome’-shapedchromosome organization [27]. We found that the metaphase
spindle area was slightly reduced in KD cells, and increasedin eGFP–HDAC3-expressing cells, but this difference was notsignificant (Figures 6A and 6B). Similar changes were observedfor the area of the chromosomes. We did not find that eGFP–HDAC3 was strongly associated with the mitotic spindle inmetaphase as reported previously, for metaphase spindles stainedfor endogenous HDAC3 [27]. Metaphase spindles did nothave obvious changes in levels of acetylated tubulin betweencontrol, KD and eGFP–HDAC3-expressing cells (Figure 6A),suggesting that, whereas HDAC3 may play a role in deacetylationof microtubules in interphase cells, it may not have markedeffects on acetylated tubulin levels in the metaphase spindle.We also observed a small but significant increase in thenumbers of cells undergoing cytokinesis in both KD and eGFP–HDAC3-expressing cells from 1.3 +− 0.4% of cells under controlconditions, to 3.4 +− 0.4% in KD cells and 4.9 +− 0.6% in eGFP–HDAC3-expressing cells.
The effect of HDAC3 on tubulin acetylation is indirect
Finally, we tested whether HDAC3 can directly deacetylatemicrotubules in vitro, using a purified active HDAC3–SMRTcomplex, purified from mammalian cells [37]. Although HDAC3can be expressed in bacteria, it is unclear whether the purifiedprotein is active, as it is not able to interact with SMRT [39]. Thepurified HDAC3–SMRT complex was first shown to be active(Figure 7A). Incubating the active complex with purified tubulindid not affect levels of tubulin acetylation (Figure 7B). Moreover,spin-down assays with tubulin–HDAC3 complexes failed toco-precipitate the HDAC3 complex with tubulin (Figure 7C).Therefore the effects on tubulin acetylation we observed in thecell following inhibition or KD of HDAC3 are likely to be throughan indirect mechanism.
DISCUSSION
Our results provide evidence that HDAC3 indirectly modulateslevels of tubulin acetylation in cells. HDAC3 is widely expressed,suggesting that HDAC3 may modulate tubulin acetylation in manycells. Treatment with high levels (10 μM) of MI192, a specificinhibitor of HDAC3, showed an acute increase in acetylatedtubulin after 1 h of treatment, followed by a sharp decrease upto 24 h later. The decrease in levels of acetylated tubulin levels at24 h was associated with a reduction in polymerized microtubules.Treatment for 24 h at lower levels of MI192, close to its IC50
(500 nM), modestly increased levels of acetylated tubulin. siRNA-mediated KD of HDAC3 also increased levels of acetylatedtubulin. In contrast, expression of eGFP–HDAC3 reduced levels,staining for acetylated tubulin showed a more highly fragmentedpattern, and eGFP–HDAC3 appeared to be partly associatedwith acetylated microtubules. In mitosis, exogenous expressionof eGFP–HDAC3 had a small effect on spindle formationand chromosomal organization, and acetylated tubulin was stillobserved in the spindle microtubules. In vitro experiments failedto show a direct association of eGFP–HDAC3 with microtubulesor to show any changes in tubulin acetylation. Taken together,our results suggest that HDAC3 may play a modulatory role fortubulin acetylation particularly in interphase cells, through anindirect route.
HDAC3, unlike the two other Class I HDAC members, HDAC1and HDAC2, is found in both the nucleus and the cytoplasm, andits cytoplasmic roles are largely unexplored. Our results suggestthat it has a novel cytoplasmic role; modulation of levels oftubulin acetylation. Broad-spectrum HDAC inhibitors including
c© 2015 Authors. This is an open access article published by Portland Press Limited and distributed under the Creative Commons Attribution License 3.0.

376 T. Bacon and others
TSA (which inhibits Class I HDACs [40]) and valproic acid(which inhibits Class I/II HDACs [41]) have been shown tomodulate levels of tubulin acetylation, and these were suggestedto mediate their effects by inhibiting HDAC6, which is wellknown to modulate tubulin acetylation [10,31]). However, ourresults with the highly selective HDAC3 inhibitor MI192 suggestthat these broad-spectrum inhibitors may additionally inhibit thedeacetylation of tubulin by HDAC3. The exact mechanism bywhich MI192-mediated inhibition of HDAC3 results in an acute4-fold increase in tubulin acetylation followed by a rapid reductionin in tubulin acetylation levels, is unclear. However, siRNA KDof HDAC3 also increased levels of tubulin acetylation, and thisincrease was similar to that resulting from siRNA-mediated KDof HDAC6, which is well established as being able to deacetylatetubulin [10,31]. Moreover, overexpression of HDAC3 reducedtubulin acetylation. Thus, it seems likely that HDAC3 is involvedin modulating tubulin acetylation in cells, although the exactmechanism by which it does so now needs to be established, asour in vitro experiments suggest that an active HDAC3 complexis unable to do this directly.
The novel benzamide derivative compound MI192 haspreviously been shown to act as a potent and selective Class IHDAC inhibitor, with slower on/off binding kinetics (and thuslonger-lasting effects), and greater overall activity than relatedinhibitors [30]. Its measured IC50 in HeLa cells was higher(1.5 μM [30]) than measured here in PC3 cells (450 nM; totalHDAC activity) suggesting that MI192 may have a slightlyincreased potency in PC3 cells. However, this will dependon the total levels of HDAC3 in PC3 compared with HeLacells. It is worth noting that elevated HDAC3 levels are acommon hallmark of tumour cells. Gliomas [42] and coloncancer cells [43] have both been shown to have elevated levelsof HDAC3. An analysis of a wide range of human cancersshowed that HDAC3 was expressed at high levels in manycancerous tissues and cell lines, including PC3 cells [44]. Afurther study shows that HDAC3 is strongly expressed in over90% of prostate cancer samples tested [45]. Thus MI192 haspotential for use as a therapeutic in prostate cancer throughits ability to affect microtubule acetylation, polymerization anddynamics.
As well as microtubule depolymerization, the reduction inacetylated tubulin induced by MI192 also appeared to stimulateapoptosis. MI192 was shown to induce apoptosis in leukaemiacell lines, although the effect was variable among the three celllines tested [30]. MI192 may activate a conserved pathway forapoptosis in multiple cancer cell lines. The tumour-suppressorgene p53, one of the most commonly mutated genes in cancercells, is important for stimulating apoptosis. Post-translationalacetylation of p53 up-regulates its activity [46], and HDAC1,HDAC2 and HDAC3 are all capable of down-regulating p53activity by deacetylation [47]. However, this is unlikely to bethe explanation for the effect of MI192 in our experiments, asPC3 cells do not express p53 [48].
HDAC3 was previously reported to localize to the mitoticspindle in prophase but not in metaphase, in HeLa cells, HEK-293cells and mouse 3T3 fibroblasts, and KD of HDAC3 was reportedto reduce the width of the spindle [27]. In our experiments, wealso found some spindles that were smaller, and collapsed inthe HDAC3 KD cells and chromosomal organization in thosecells was aberrant. We also found that the spindle size increasedin eGFP–HDAC3-expressing cells, and that cytokinesis wasapparently delayed in both HDAC3 KD and eGFP–HDAC3-expressing cells. The cytoplasmic bridge connecting the twodaughter cells is rich in acetylated tubulin, although it is stillunclear why this is the case. Acetylation of tubulin does not
apparently change its structure [49]. One suggestion is thatacetylated tubulin may be important for new membrane formationduring cytokinesis [50]. Thus, altering tubulin acetylation levelsby KD or overexpression of HDAC3 might be expected to delaycytokinesis. In contrast with our results, KD of HDAC3 did notapparently alter levels of tubulin acetylation in a previous report[27], but this report focused on mitosis only and did not showimages for microtubules in interphase cells. Moreover, they wereunable to determine the exact mechanism by which HDAC3 hadeffects on spindle organization in metaphase.
In conclusion, our data using a targeted inhibitor (MI192) forHDAC3 and complimentary HDAC3 KD experiments suggest thatHDAC3 is involved in regulating tubulin acetylation levels, as oneof its cytoplasmic roles, through an indirect route. Moreover, theinhibitor MI192 may exert some of its phenotypic effects on cellsthrough this mechanism.
AUTHOR CONTRIBUTION
Travis Bacon performed the experiments with the HDAC3 inhibitor. Caroline Seilerperformed the KD experiments. Marcin Wolny performed the in vitro HDAC3 assays,and helped to supervise Travis Bacon and Caroline Seiler and advise on the experiments.Ruth Hughes helped to supervise Travis Bacon and Caroline Seiler. Peter Watson andJohn Schwabe provided the active HDAC3 complex, advised on the in vitro experiments,and helped to write the paper. Michelle Peckham wrote the paper and performed some ofthe imaging and subsequent analysis. All of the authors commented on the paper.
FUNDING
This work was supported by the University of Leeds [Footsteps fund (to T.B.)]; the WellcomeTrust [grant numbers WT104918MA and WT100237 (to J.S.)]; and the Biotechnology andBiological Sciences Research Council [grant number BB/I007423/1 (to M.P and M.W.)].Ruth Hughes is a Medical Research Council (MRC) Ph.D. student. John Schwabe is aRoyal Society Wolfson Merit Award holder and a Wellcome Trust Senior Investigator.
REFERENCES
1 Brownell, J.E., Zhou, J., Ranalli, T., Kobayashi, R., Edmondson, D.G., Roth, S.Y. and Allis,C.D. (1996) Tetrahymena histone acetyltransferase A: a homolog to yeast Gcn5p linkinghistone acetylation to gene activation. Cell 84, 843–851 CrossRef PubMed
2 Kuo, M.H. and Allis, C.D. (1998) Roles of histone acetyltransferases and deacetylases ingene regulation. BioEssays 20, 615–626 CrossRef PubMed
3 Glozak, M.A., Sengupta, N., Zhang, X. and Seto, E. (2005) Acetylation and deacetylationof non-histone proteins. Gene 363, 15–23 CrossRef PubMed
4 Abbas, A. and Gupta, S. (2008) The role of histone deacetylases in prostate cancer.Epigenetics 3, 300–309 CrossRef PubMed
5 Walkinshaw, D.R., Tahmasebi, S., Bertos, N.R. and Yang, X.J. (2008) Histonedeacetylases as transducers and targets of nuclear signaling. J. Cell. Biochem. 104,1541–1552 CrossRef PubMed
6 Waltregny, D., De Leval, L., Glenisson, W., Ly Tran, S., North, B.J., Bellahcene, A., Weidle,U., Verdin, E. and Castronovo, V. (2004) Expression of histone deacetylase 8, a class Ihistone deacetylase, is restricted to cells showing smooth muscle differentiation innormal human tissues. Am. J. Pathol. 165, 553–564 CrossRef PubMed
7 Karagianni, P. and Wong, J. (2007) HDAC3: taking the SMRT-N-CoRrect road torepression. Oncogene 26, 5439–5449 CrossRef PubMed
8 Guenther, M.G., Barak, O. and Lazar, M.A. (2001) The SMRT and N-CoR corepressors areactivating cofactors for histone deacetylase 3. Mol. Cell. Biol. 21, 6091–6101CrossRef PubMed
9 Wen, Y.D., Perissi, V., Staszewski, L.M., Yang, W.M., Krones, A., Glass, C.K., Rosenfeld,M.G. and Seto, E. (2000) The histone deacetylase-3 complex contains nuclear receptorcorepressors. Proc. Natl. Acad. Sci. U.S.A. 97, 7202–7207 CrossRef PubMed
10 Zhang, Y., Li, N., Caron, C., Matthias, G., Hess, D., Khochbin, S. and Matthias, P. (2003)HDAC-6 interacts with and deacetylates tubulin and microtubules in vivo. EMBO J. 22,1168–1179 CrossRef PubMed
11 Bhaskara, S., Knutson, S.K., Jiang, G., Chandrasekharan, M.B., Wilson, A.J., Zheng, S.,Yenamandra, A., Locke, K., Yuan, J.L., Bonine-Summers, A.R. et al. (2010) Hdac3 isessential for the maintenance of chromatin structure and genome stability. Cancer Cell18, 436–447 CrossRef PubMed
c© 2015 Authors. This is an open access article published by Portland Press Limited and distributed under the Creative Commons Attribution License 3.0.

HDAC3 modulates tubulin acetylation 377
12 Millard, C.J., Watson, P.J., Celardo, I., Gordiyenko, Y., Cowley, S.M., Robinson, C.V.,Fairall, L. and Schwabe, J.W. (2013) Class I HDACs share a common mechanism ofregulation by inositol phosphates. Mol. Cell 51, 57–67 CrossRef PubMed
13 Fischle, W., Dequiedt, F., Hendzel, M.J., Guenther, M.G., Lazar, M.A., Voelter, W. andVerdin, E. (2002) Enzymatic activity associated with class II HDACs is dependent on amultiprotein complex containing HDAC3 and SMRT/N-CoR. Mol. Cell 9, 45–57CrossRef PubMed
14 Hudson, G.M., Watson, P.J., Fairall, L., Jamieson, A.G. and Schwabe, J.W. (2015) Insightsinto the Recruitment of Class IIa histone deacetylases (HDACs) to the SMRT/NCoRtranscriptional repression complex. J. Biol. Chem. 290, 18237–18244 CrossRef PubMed
15 Thomas, E.A. (2014) Involvement of HDAC1 and HDAC3 in the pathology ofpolyglutamine disorders: therapeutic implications for selective HDAC1/HDAC3 inhibitors.Pharmaceuticals 7, 634–661 CrossRef PubMed
16 Demmerle, J., Koch, A.J. and Holaska, J.M. (2012) The nuclear envelope protein emerinbinds directly to histone deacetylase 3 (HDAC3) and activates HDAC3 activity. J. Biol.Chem. 287, 22080–22088 CrossRef PubMed
17 Demmerle, J., Koch, A.J. and Holaska, J.M. (2013) Emerin and histone deacetylase 3(HDAC3) cooperatively regulate expression and nuclear positions of MyoD, Myf5, andPax7 genes during myogenesis. Chromosome Res. 21, 765–779 CrossRef PubMed
18 Ziesche, E., Kettner-Buhrow, D., Weber, A., Wittwer, T., Jurida, L., Soelch, J., Muller, H.,Newel, D., Kronich, P., Schneider, H. et al. (2013) The coactivator role of histonedeacetylase 3 in IL-1-signaling involves deacetylation of p65 NF-kappaB. Nucleic AcidsRes. 41, 90–109 CrossRef PubMed
19 Mano, T., Suzuki, T., Tsuji, S. and Iwata, A. (2014) Differential effect of HDAC3 oncytoplasmic and nuclear huntingtin aggregates. PLoS One 9, e111277 CrossRef PubMed
20 Bardai, F.H., Verma, P., Smith, C., Rawat, V., Wang, L. and D’Mello, S.R. (2013)Disassociation of histone deacetylase-3 from normal huntingtin underlies mutanthuntingtin neurotoxicity. J. Neurosci. 33, 11833–11838 CrossRef PubMed
21 Longworth, M.S. and Laimins, L.A. (2006) Histone deacetylase 3 localizes to the plasmamembrane and is a substrate of Src. Oncogene 25, 4495–4500 CrossRef PubMed
22 Gao, Z., He, Q., Peng, B., Chiao, P.J. and Ye, J. (2006) Regulation of nuclear translocationof HDAC3 by IkappaBalpha is required for tumor necrosis factor inhibition of peroxisomeproliferator-activated receptor gamma function. J. Biol. Chem. 281, 4540–4547CrossRef PubMed
23 Chen, L., Fischle, W., Verdin, E. and Greene, W.C. (2001) Duration of nuclear NF-kappaBaction regulated by reversible acetylation. Science 293, 1653–1657 CrossRef PubMed
24 Kramer, O.H., Knauer, S.K., Greiner, G., Jandt, E., Reichardt, S., Guhrs, K.H., Stauber,R.H., Bohmer, F.D. and Heinzel, T. (2009) A phosphorylation–acetylation switch regulatesSTAT1 signaling. Genes Dev. 23, 223–235 CrossRef PubMed
25 Yuan, Z.L., Guan, Y.J., Chatterjee, D. and Chin, Y.E. (2005) Stat3 dimerization regulated byreversible acetylation of a single lysine residue. Science 307, 269–273 CrossRef PubMed
26 Samant, S.A., Courson, D.S., Sundaresan, N.R., Pillai, V.B., Tan, M., Zhao, Y., Shroff,S.G., Rock, R.S. and Gupta, M.P. (2011) HDAC3-dependent reversible lysine acetylationof cardiac myosin heavy chain isoforms modulates their enzymatic and motor activity. J.Biol. Chem. 286, 5567–5577 CrossRef PubMed
27 Ishii, S., Kurasawa, Y., Wong, J. and Yu-Lee, L.Y. (2008) Histone deacetylase 3 localizesto the mitotic spindle and is required for kinetochore-microtubule attachment. Proc. Natl.Acad. Sci. U.S.A. 105, 4179–4184 CrossRef PubMed
28 Balasubramanian, S., Verner, E. and Buggy, J.J. (2009) Isoform-specific histonedeacetylase inhibitors: the next step? Cancer Lett. 280, 211–221 CrossRef PubMed
29 Gillespie, J., Savic, S., Wong, C., Hempshall, A., Inman, M., Emery, P., Grigg, R. andMcDermott, M.F. (2012) Histone deacetylases are dysregulated in rheumatoid arthritisand a novel histone deacetylase 3-selective inhibitor reduces interleukin-6 production byperipheral blood mononuclear cells from rheumatoid arthritis patients. Arthritis Rheum.64, 418–422 CrossRef PubMed
30 Boissinot, M., Inman, M., Hempshall, A., James, S.R., Gill, J.H., Selby, P., Bowen, D.T.,Grigg, R. and Cockerill, P.N. (2012) Induction of differentiation and apoptosis inleukaemic cell lines by the novel benzamide family histone deacetylase 2 and 3 inhibitorMI-192. Leuk. Res. 36, 1304–1310 CrossRef PubMed
31 Hubbert, C., Guardiola, A., Shao, R., Kawaguchi, Y., Ito, A., Nixon, A., Yoshida, M., Wang,X.F. and Yao, T.P. (2002) HDAC6 is a microtubule-associated deacetylase. Nature 417,455–458 CrossRef PubMed
32 North, B.J., Marshall, B.L., Borra, M.T., Denu, J.M. and Verdin, E. (2003) The human Sir2ortholog, SIRT2, is an NAD + -dependent tubulin deacetylase. Mol. Cell 11, 437–444CrossRef PubMed
33 Yoshida, M., Matsuyama, A., Komatsu, Y. and Nishino, N. (2003) From discovery to thecoming generation of histone deacetylase inhibitors. Curr. Med. Chem. 10, 2351–2358CrossRef PubMed
34 Yang, W.M., Yao, Y.L., Sun, J.M., Davie, J.R. and Seto, E. (1997) Isolation andcharacterization of cDNAs corresponding to an additional member of the human histonedeacetylase gene family. J. Biol. Chem. 272, 28001–28007CrossRef PubMed
35 Wolny, M., Colegrave, M., Colman, L., White, E., Knight, P.J. and Peckham, M. (2013)Cardiomyopathy mutations in the tail of beta-cardiac myosin modify the coiled-coilstructure and affect integration into thick filaments in muscle sarcomeres in adultcardiomyocytes. J. Biol. Chem. 288, 31952–31962 CrossRef PubMed
36 Swailes, N.T., Colegrave, M., Knight, P.J. and Peckham, M. (2006) Non-muscle myosins2A and 2B drive changes in cell morphology that occur as myoblasts align and fuse. J.Cell Sci. 119, 3561–3570CrossRef PubMed
37 Watson, P.J., Fairall, L., Santos, G.M. and Schwabe, J.W. (2012) Structure of HDAC3bound to co-repressor and inositol tetraphosphate. Nature 481, 335–340PubMed
38 Zanic, M., Stear, J.H., Hyman, A.A. and Howard, J. (2009) EB1 recognizes the nucleotidestate of tubulin in the microtubule lattice. PLoS One 4, e7585 CrossRef PubMed
39 Guenther, M.G., Yu, J., Kao, G.D., Yen, T.J. and Lazar, M.A. (2002) Assembly of theSMRT-histone deacetylase 3 repression complex requires the TCP-1 ring complex. GenesDev. 16, 3130–3135 CrossRef PubMed
40 Blagosklonny, M.V., Robey, R., Sackett, D.L., Du, L., Traganos, F., Darzynkiewicz, Z., Fojo,T. and Bates, S.E. (2002) Histone deacetylase inhibitors all induce p21 but differentiallycause tubulin acetylation, mitotic arrest, and cytotoxicity. Mol. Cancer Ther. 1, 937–941PubMed
41 Catalano, M.G., Poli, R., Pugliese, M., Fortunati, N. and Boccuzzi, G. (2007) Valproic acidenhances tubulin acetylation and apoptotic activity of paclitaxel on anaplastic thyroidcancer cell lines. Endocr.-Relat. Cancer 14, 839–845 CrossRef PubMed
42 Liby, P., Kostrouchova, M., Pohludka, M., Yilma, P., Hrabal, P., Sikora, J., Brozova, E.,Kostrouchova, M., Rall, J.E. and Kostrouch, Z. (2006) Elevated and deregulatedexpression of HDAC3 in human astrocytic glial tumours. Folia Biol. (Praha) 52, 21–33PubMed
43 Spurling, C.C., Godman, C.A., Noonan, E.J., Rasmussen, T.P., Rosenberg, D.W. andGiardina, C. (2008) HDAC3 overexpression and colon cancer cell proliferation anddifferentiation. Mol. Carcinog. 47, 137–147 CrossRef PubMed
44 Nakagawa, M., Oda, Y., Eguchi, T., Aishima, S., Yao, T., Hosoi, F., Basaki, Y., Ono, M.,Kuwano, M., Tanaka, M. and Tsuneyoshi, M. (2007) Expression profile of class I histonedeacetylases in human cancer tissues. Oncol. Rep. 18, 769–774 PubMed
45 Weichert, W., Roske, A., Gekeler, V., Beckers, T., Stephan, C., Jung, K., Fritzsche, F.R.,Niesporek, S., Denkert, C., Dietel, M. and Kristiansen, G. (2008) Histone deacetylases 1,2 and 3 are highly expressed in prostate cancer and HDAC2 expression is associated withshorter PSA relapse time after radical prostatectomy. Br. J. Cancer 98, 604–610CrossRef PubMed
46 Gu, W. and Roeder, R.G. (1997) Activation of p53 sequence-specific DNA binding byacetylation of the p53 C-terminal domain. Cell 90, 595–606 CrossRef PubMed
47 Juan, L.J., Shia, W.J., Chen, M.H., Yang, W.M., Seto, E., Lin, Y.S. and Wu, C.W. (2000)Histone deacetylases specifically down-regulate p53-dependent gene activation. J. Biol.Chem. 275, 20436–20443 CrossRef PubMed
48 Carroll, A.G., Voeller, H.J., Sugars, L. and Gelmann, E.P. (1993) p53 oncogene mutationsin three human prostate cancer cell lines. Prostate 23, 123–134CrossRef PubMed
49 Howes, S.C., Alushin, G.M., Shida, T., Nachury, M.V. and Nogales, E. (2014) Effects oftubulin acetylation and tubulin acetyltransferase binding on microtubule structure. Mol.Biol. Cell 25, 257–266 CrossRef PubMed
50 Danilchik, M.V., Funk, W.C., Brown, E.E. and Larkin, K. (1998) Requirement formicrotubules in new membrane formation during cytokinesis of Xenopus embryos. Dev.Biol. 194, 47–60 CrossRef PubMed
Received 8 June 2015/7 October 2015; accepted 8 October 2015Accepted Manuscript online 8 October 2015, doi:10.1042/BJ20150660
c© 2015 Authors. This is an open access article published by Portland Press Limited and distributed under the Creative Commons Attribution License 3.0.