bagasse gasification in a 100 kw steam-oxygen blown ... · the micro-gc provided the separation of...
TRANSCRIPT

Bagasse gasification in a 100 kWth steam-oxygen blown circulating fluidized bed gasifier with catalytic and non-catalytic upgrading of the syngas using ceramic filters
M. Fantini1, M. Nacken2, S. Heidenreich2, M. Siedlecki1, G. Fornasari3, P. Benito3, M. A. Haikal Leite4 & W. de Jong1 1Department of Process and Energy, Delft University of Technology, The Netherlands 2Pall Filtersystems GmbH, Werk Schumacher, Germany 3“Toso Montanari”, Bologna University, Italy 4Petrobras Research and Development Centre, Rio de Janeiro, Brazil
Abstract
Gasification of pelletized sugar cane bagasse, the waste residue from sugar cane, was carried out using an atmospheric pressure 100 kWth steam-oxygen blown circulating fluidized bed gasifier (CFBG). The purification of the syngas produced was carried out using a high temperature filter unit which contains 3 rigid ceramic candles with an outer diameter of 60 mm and a length of 1500 mm. Keeping the gasification temperature in the range of 800°–860°C and using magnesite M85 as the bed material, the effects of operational conditions (e.g. steam to biomass ratio (SBR) and oxygen to biomass stoichiometric ratio (ER)) and of catalytic and non-catalytic filtration on the composition distribution of the product gas and tar formation were investigated. Higher temperature and SBR values were favorable for increasing the mole ratio H2 to CO and decreasing the tar compound (PAH) concentration on dry basis, measured via solid phase adsorption (SPA) sampling and subsequent GC analysis varying from approximately 2 to 6 g/mn
3. At the same operational conditions, in the downstream filter, the conversion of tar content obtained using catalytic filter candles increased by a factor of 2.8 compared to the one with non-catalytic filter elements. The specification and distribution of major ash forming elements were investigated by SEM-EDS.
Energy Production and Management in the 21st Century, Vol. 2 1079
www.witpress.com, ISSN 1743-3541 (on-line) WIT Transactions on Ecology and The Environment, Vol 190, © 2014 WIT Press
doi:10.2495/EQ141012

Experimental results showed that bagasse is an interesting fuel for syngas production via the gasification process, both from a gas composition and from a tar production point of view. Keywords: gasification, bagasse, tar, ceramic candles, high temperature.
1 Introduction
More strict requirements to reduce the global CO2 emissions and the finite resources of crude oil have stimulated activities to use biomass as a practically CO2 neutral feedstock for electricity and biofuels production. Biomass gasification provides true opportunities for developing cost-effective high quality syngas production plants for small to medium-scale applications, adapted to the economic context of most regions in the world. The most promising avenue consists of integrating several functionalities into suitable fluidized bed gasifiers based systems, such as particle removal combined with catalytic tar cracking/reforming, CO2 sequestration, H2 separation and the elimination of other contaminants. In a fluidized bed gasifier using steam, steam and oxygen or oxygen and air as gasifying agents, the formation of several undesired contaminants cannot be completely prevented. Their content must be controlled to avoid plugging and damaging of downstream equipment as well as pollution. As the major hurdle in successfully applying gasification is the elimination of tar and particles, a combination of hot gas filtration with catalytic tar reforming would be a cost effective way to remove particles and tars from syngas. In this way, the high temperature of the raw syngas can be exploited for the endothermic tar reforming reactions and no cost intensive reheating is necessary. Ceramic filter candles make this possible and give additional advantages like the erosion and corrosion resistance and the possibility to remove multiple contaminants. This paper gives an overview of the results obtained during an experimental campaign on steam-oxygen gasification of bagasse and hot gas filtration system cleaning. The campaign was performed with multiple aims; here also the effect of two different types of filter candles after a steam-O2 biomass gasification process is analysed. After giving an overview of the methodology including a description of both, the gasification test rig and the filtration set up, the results are presented and discussed. The discussion focuses on the gas composition of the product gas, the amount and the kind of tar measured and converted during the experiments and the effect of the main process parameters on the yield of the combustible species produced. In the last part of the paper general conclusions of this work are summarized.
2 Experimental
2.1 Experimental set up
The gasification set up at TUD is constructed according to the circulating fluidised bed (CFB) principle. The unit consists of a steam/O2 blown 100_kWth
1080 Energy Production and Management in the 21st Century, Vol. 2
www.witpress.com, ISSN 1743-3541 (on-line) WIT Transactions on Ecology and The Environment, Vol 190, © 2014 WIT Press

atmospheric circulating fluidized-bed gasifier (CFBG), operated at temperatures up to ~875°C, including two cyclones and a hot gas filter vessel with a length of 404 cm, having an internal diameter of 33 cm. The filter vessel contains three ceramic candles supplied by Pall Filtersystems, Werk Schumacher (Germany). A picture of the unit is shown in Figure 1.
Figure 1: Integrated 100 kWth CFB test rig, including hot gas filtration units.
The regeneration of the candles is done using the Coupled Pressure Pulse (CPP) cleaning [1], a method developed and patented by Karlsruhe Institute of Technology (KIT) in cooperation with Pall. With this system each candle is directly connected to the re-cleaning gas tank by means of a valve and nitrogen is used to pulse the candles. The frequency with which each candle is backpulsed, the opening time (pulse time) of the blow back (BB) valves and pressure of the pulse are defined cleaning parameters. Pressure drop and absolute pressure are continuously monitored with differential pressure and pressure sensors, respectively (Endress-Hauser type). The filter unit is equipped with a data acquisition system manufactured by Siemens which is connected to the CFBG data system, an in-house implemented Supervision, Control, And Data Acquisition (SCADA) package coupled to a Programmable Logical Controller (PLC). In this way, all the parameters are logged in one file with a frequency of 0.1Hz. The facility is also equipped with another filtration unit provided by Bayerische Wollfilzfabriken Textil GmbH & Co. KG (BWF) and connected downstream of the CFBG in parallel to the Pall filter. That filter vessel contains four filter elements made of woven ceramic fibre material. The maximum temperature at which the BWF filter can operate is 450°C. The BWF filter was used during start-up of an experiment before switching to the Pall filter. A more detailed description of the test-rig was given by Siedlecki and de Jong [2]. Two types of filter candles were used during the filtration tests: Dia-Schumalith N (a trademark of Pall Corporation) and catalytic candles referred to
Energy Production and Management in the 21st Century, Vol. 2 1081
www.witpress.com, ISSN 1743-3541 (on-line) WIT Transactions on Ecology and The Environment, Vol 190, © 2014 WIT Press

as DS and CC respectively. The Dia-Schumalith N are special surface filter elements based on silicon carbide that are suitable for the filtration of hot gases. The combination of the support body and membrane guarantees a low differential pressure at high filtration efficiency. Regarding the catalytic candles, Al2O3 based ceramic foam was used as additionally integrated ceramic support for the catalytic effect of the candles.
2.2 Gas and tar analysis
During operation sample flows of the product gas are extracted continuously from the main stream just downstream of the gas outlet of the first cyclone and of the outlet of the filter. The gas analysis probes point into the direction of the flow to avoid the coarsest particles from penetrating the line. The gas sampling lines were heated using a trace heating cable (Horst type HSS-450°C). Additionally, the particle filter vessel located downstream the cyclone was heated using a heating jacket (Tyco IJ-GL glass silk heating jacket). The gas is then cooled down through two condensation steps: a primary condenser to remove the condensables with the highest boiling point and two impinge bottles filled with silica gel beads. The dried gas was characterized using a micro gas chromatograph (Varian 4900 micro-GC). One column (type COX, length 1m) of the micro-GC provided the separation of the main gas components (H2, CO, CO2, CH4 and N2), with subsequent quantification using a TCD detector, while a second column (type CP-Sil 5CB, length 4 m) was used for BTX (benzene, toluene and xylenes) separation and quantitative analysis using an FID detector. Gas composition was available every three minutes. Water concentration was determined gravimetrically. For particle measurement a cascade impactor (Pilat MarkV) heated to ~400°C, a temperature that avoids both the cracking and the condensation of the tars, was used. The particle distribution is determined upstream and downstream of the high temperature ceramic filter. The sampling is carried out in accordance with ISO 9096:2003, so as to assure sampling took place at isokinetic sampling conditions. Off-line measurements of the tar compound (three samples at a time) were sampled according to the solid phase adsorption method (SPA, see Brage [3]) and sent to the Energy Research Centre of the Netherlands (ECN, Petten, The Netherlands) for analysis. Sometimes a modified sampling device consisting of amino-phase sorbent and an activated coconut charcoal cartridge positioned in series was tested for sampling tar in order to measure tar compounds ranging also in molecular weight of BTX compounds according to Osipovs [4].
2.3 Fuel and bed material
Pelletized bagasse was used as fuel and magnesite as bed material. Bagasse is a residue of the sugar cane extraction process that produces sugar and subsequently ethanol via fermentation. It is widely available in Brazil and its composition is comparable to the one of the “classic” woody fuels used in biomass gasification tests carried out before, namely A-wood, B-wood and Miscanthus tested in the past using our test rig (Siedlecki and de Jong [2]).
1082 Energy Production and Management in the 21st Century, Vol. 2
www.witpress.com, ISSN 1743-3541 (on-line) WIT Transactions on Ecology and The Environment, Vol 190, © 2014 WIT Press

composition of the bagasse had been analysed by ALS (Scandinavia AB),
the one of the other biomass fuels by Forschungszentrum
Jülich
(DE).
The
results
are reported in Table 1.
Table 1: Composition of bagasse compared to other gasification biomass fuels.
Type of fuel: Bagasse A wood B wood Miscanth.
Proximate analysis, as received, raw data, in % w/w moisture 6.2 8.1 6.2 6.8 volatile matter 73.1 fixed carbon 14.5 ash 6.2 Ultimate analysis, as received, normalized, in % w/w C 43.3 47.0 47.9 45.7 H 6.0 6.1 6.0 5.9 N 0.26 0.20 0.75 0.68 S 0.03 0.02 0.05 0.11 O 44.2 46.3 44.2 44.0
Cl 0.03 0.012 0.042 0.225 SiO2 4.435 0.039 0.215 1.2 Al2O3 0.635 0.000 0.055 0.097 Fe2O3 0.872 0.000 0.085 0.046 CaO 0.136 0.118 0.224 0.184 MgO 0.100 0.015 0.057 0.129 Na2O 0.017 0.000 0.022 0.038 K2O 0.259 0.035 0.046 0.877 P2O5 0.065 0.000 0.014 0.179 Total ash (analyzed) 6,2 0,344 0,983 3,33 Total fractions 100 100 100 100 LHV a.r. [MJ/kg] calc. 14.0 15.7 16.7 15.6
The content of carbon and hydrogen on a dry, and ash-free basis is quite similar for all four fuels. However, major differences can be observed in the ash amounts and compositions. A high amount of silica, potassium and chlorine normally causes agglomeration-related problems during the operation of the fluidized bed. To allow comparison between different fuels, various correlations between the ash constituents have been proposed in literature. According to Visser [5], there are two “agglomeration indicators” that can be used to estimate
Energy Production and Management in the 21st Century, Vol. 2 1083
www.witpress.com, ISSN 1743-3541 (on-line) WIT Transactions on Ecology and The Environment, Vol 190, © 2014 WIT Press
The chemical

the risk of agglomeration. If both are larger than 1, then they predict a high potential of alkali induced agglomeration in combination with SiO2(-rich) bed material at temperature 800°C. Following the ash composition given in Table 1, both agglomeration indicators exceed the value of one for miscanthus. For bagasse fuel only one indicator is larger than one and the other one is not far from the unit value. Nevertheless, during experiments no additives were needed. The beneficent effect of the bed material is undisputed, as shown by Siedlecki [2], but it has also to be stressed that those indicators are purely empirical. The bed material used is “Magnesite85”. This is a mineral consisting mainly of MgCO3 (MgO in case of calcined magnesite), and of smaller fractions of CaO, Fe2O3 and silica. Its low silica content and acceptable price makes it an attractive bed material, as it should be more resistant to the formation of agglomerates. Its value as a bed material for a fluidized bed has been successfully demonstrated by Siedlecki and de Jong [2]. A high amount of metal oxides in magnesite make it
also
a
potential catalyst in the gasification process.
2.4 Gasification and filtration conditions
The experimental campaign scheduled included 17 CFB test runs (2 factorial 3 test series in duplo plus a selected set point to run using catalytic candles). The stoichiometric oxygen ratio () target was chosen between three values: 0.25, 0.325 and 0.4 and the steam to biomass ratio (SB) target between 0.5, 0.75 and 1. For a deeper description of these parameters see Siedlecki and de Jong [2]. A summary of the process values can be found in Table 2.
Table 2: Summary of relevant process conditions.
Parameter Range [-] 0.25 0.4 SB [-] 0.5 1.1 Temperature [°C] 800 860 Fluidization velocity [m s -1] 3.5 4.6
The filter was heated up to 800°C before starting the experimental campaign and kept at this temperature until the end of it, with the exception of the moment of changing the candles that required to cool down the unit. The BB (blow back) parameters were set before start. During the first experiments their settings were modified and then not changed anymore in order to not complicate the interpretation of the pressure drop behaviour. For some experiments the BB frequency was changed within the same experiments due to the increase of the pressure drop. Two types of filter candles were used during the filtration tests: DIA-SCHUMALITH N candles of type 10-20 (DSN10-20) and catalytic candles type N280612.1 (CC). The physical properties of the candle’s material are given in Table 3.
1084 Energy Production and Management in the 21st Century, Vol. 2
www.witpress.com, ISSN 1743-3541 (on-line) WIT Transactions on Ecology and The Environment, Vol 190, © 2014 WIT Press

Table 3: Filter candles properties.
Property DSN10-20 CC Dimension (do/di/L) [mm] 60/10/1500 60/15.2/1500 Support material of candle SL N 20 Al2O3 Membrane material DIA 10
Mullite grains Al2O3
Porosity of filter candle support [vol %] 35 39.5 Material density of filter candle [g/cm3] 1.85 2.3 Expansion coefficient of filter candle [10-6 K-1] 5.1 8.5 Specific permeability of catalytic filter candle (without catalytic ceramic foam) [10-13 m2]
55 23.7
3 Results and analysis
3.1 Gas characterization
Among the seventeen gasification-filtration experiments performed, six were selected, one for each set point tested and the one performed with the catalytic candles. Table 4 shows an overview of the results. Variables that were logged continuously (input flows, temperatures, pressures, main gas components except H2O, and BTX) are presented as averages determined during the evaluation period indicated for each experiment in the top part of the table. Water concentration in the product gas, the minor components analysed, and measured tar except BTX have been quantified as discrete samples taken during the steady-state operation of the gasifier, and preferably within the evaluation period reported. Process parameters and process benchmarks have been calculated using the averages obtained during data evaluation; carbon conversion and CGE were calculated from the mole balance. Two values for the lambda value () are given, the targeted one and the achieved. Regarding CO2 and CO, this table shows the expected results, i.e. the concentration of carbon dioxide increases when more oxygen is available for the reactions, while the concentration of carbon monoxide is decreasing simultaneously. The process temperature is decreasing with decreasing . This is caused by the fact that at lower value the endothermic reactions prevail, and at the same time the energy supplied to the system by electrical heating is not enough to compensate for the losses to the surroundings. The concentration of H2 in the gas received a lot of attention during the experiments. Based on the data shown above we can state that, according to the literature, the increase of SB from approximately 0.8 to up to about 1.2 – 1.5 will still lead to increased conversion of tar (and therefore increased hydrogen yield). Keeping this value of SB ratio, the hydrogen content slightly increases with lambda for low lambda values and it then decreases for lambda higher than 0.3. Gas composition quality is enhanced by the PALL filter using both catalytic and non-catalytic candles. As shown in Table 5 the hydrogen content
Energy Production and Management in the 21st Century, Vol. 2 1085
www.witpress.com, ISSN 1743-3541 (on-line) WIT Transactions on Ecology and The Environment, Vol 190, © 2014 WIT Press

Table 4: Main results overview.
General information Test 16 Test 12 Test 10 Test 9 Test 11 Test 17
date [dd-mm-yyyy]: 04/07/2012 20/06/2012 14/06/2012 12/06/2012 18/06/2012 24/07/2012
Total duration of the run: 10:00 10:20 09:19 09:53 09:18 13:30 Duration of the evaluation period: 08:15 07:50 05:02 07:05 06:34 12:18
Input flows [kg/h]
Steam ( primary) 10.36 14.7 11.4 9.56 14.42 11.23
Oxygen (primary) 6.18 4 5.97 6.35 6.33 5.98 N2 Air (L-valve recirculation) 1.43 1.48 1.47 1.48 1.46 1.46
Nitrogen (purge flows) 0.65 0.65 0.65 0.63 0.63 0.65
Biomass 19.13 14.39 14.69 14.78 14.73 15.54
Temperatures [°C]
Riser (average of 7 TCs) 864 826 883 873 876 887
Riser el. heating (average) 841 815 844 845 844 813
Gas inlet 360 360 360 360 360 360
Process parameters
Fluidization velocity [m/s] 3.58 4.22 3.92 3.44 4.72 3.99
Target (λ) w/w 0.25 0.25 0.325 0.4 0.4 0.325
Real (λ) w/w 0.27 0.23 0.34 0.36 0.36 0.32
Target SB ratio w/w 0.5 1 0.75 0.5 1 0.75
Real SB ratio w/w 0.5 1 0.8 0.6 1 0.7 Main gas components [%vol]
H2 dnf 29.2 31.9 26.5 25.5 26.2 27.1
CO dnf 18.6 15.9 16.2 14.5 14.1 17.9
CH4 dnf 6.7 6.4 6.3 5.8 6 6.4
CO2 dnf 41.7 40.8 47.3 47.4 49.5 45.2
N2 dry 14 20 21.4 19.6 19.6 16.5
H2O wet 40 58 60 56 61 51
Measured tar [g/mn3]
BTX dnf, dw CFBG 8.48 7.7 7.44 6.91 7.2 7.92
BTX dnf, dw PALL 4.42 5.93 2.71 6.44 3.47 1.66
PAH raw dw CFBG 4.43 4.02 3.54 2.94 3.15 5.31
PAH raw dw PALL 3.8 3.38 2.85 3.04 2.36 2.22
Phenolics raw, dw CFBG 0.411 0.551 0.219 0.129 0.257 0.53
Phenolics raw, dw PALL 0.106 0.204 0.055 0.017 0.053 0.02
1086 Energy Production and Management in the 21st Century, Vol. 2
www.witpress.com, ISSN 1743-3541 (on-line) WIT Transactions on Ecology and The Environment, Vol 190, © 2014 WIT Press
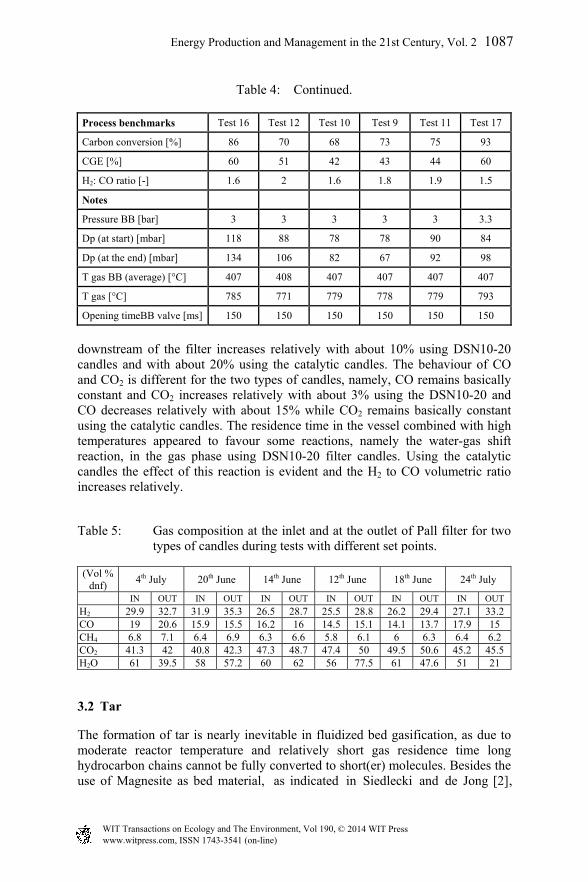
Table 4: Continued. Process benchmarks Test 16 Test 12 Test 10 Test 9 Test 11 Test 17
Carbon conversion [%] 86 70 68 73 75 93
CGE [%] 60 51 42 43 44 60
H2: CO ratio [-] 1.6 2 1.6 1.8 1.9 1.5
Notes
Pressure BB [bar] 3 3 3 3 3 3.3
Dp (at start) [mbar] 118 88 78 78 90 84
Dp (at the end) [mbar] 134 106 82 67 92 98
T gas BB (average) [°C] 407 408 407 407 407 407
T gas [°C] 785 771 779 778 779 793
Opening timeBB valve [ms] 150 150 150 150 150 150
downstream of the filter increases relatively with about 10% using DSN10-20 candles and with about 20% using the catalytic candles. The behaviour of CO and CO2 is different for the two types of candles, namely, CO remains basically constant and CO2 increases relatively with about 3% using the DSN10-20 and CO decreases relatively with about 15% while CO2 remains basically constant using the catalytic candles. The residence time in the vessel combined with high temperatures appeared to favour some reactions, namely the water-gas shift reaction, in the gas phase using DSN10-20 filter candles. Using the catalytic candles the effect of this reaction is evident and the H2 to CO volumetric ratio increases relatively.
Table 5: Gas composition at the inlet and at the outlet of Pall filter for two types of candles during tests with different set points.
(Vol % dnf) 4th July 20th June 14th June 12th June 18th June 24th July
IN OUT IN OUT IN OUT IN OUT IN OUT IN OUT H2 29.9 32.7 31.9 35.3 26.5 28.7 25.5 28.8 26.2 29.4 27.1 33.2 CO 19 20.6 15.9 15.5 16.2 16 14.5 15.1 14.1 13.7 17.9 15 CH4 6.8 7.1 6.4 6.9 6.3 6.6 5.8 6.1 6 6.3 6.4 6.2 CO2 41.3 42 40.8 42.3 47.3 48.7 47.4 50 49.5 50.6 45.2 45.5 H2O 61 39.5 58 57.2 60 62 56 77.5 61 47.6 51 21
3.2 Tar
The formation of tar is nearly inevitable in fluidized bed gasification, as due to moderate reactor temperature and relatively short gas residence time long hydrocarbon chains cannot be fully converted to short(er) molecules. Besides the use of Magnesite as bed material, as indicated in Siedlecki and de Jong [2],
Energy Production and Management in the 21st Century, Vol. 2 1087
www.witpress.com, ISSN 1743-3541 (on-line) WIT Transactions on Ecology and The Environment, Vol 190, © 2014 WIT Press

catalytic candles proved to be suitable to reduce the amount of tar produced.
Tars
concentrations measured upstream and downstream the filter,
are
shown
in
Figure 2 for five different set points and for the experiment with the
catalytic
candles. Regarding the non-catalytic candles, the effect on tar
concentration
is
due to the high temperature and to the residence time in the vessel. The
most
promising set point seems to be the one of Test 9, namely lambda
0.36
and
SB
ratio 0.6. We can conclude that the beneficent effect of magnesite and the catalytic process performed by the candles seem to be the
best
combination
for
the tar conversion.
Figure 2: Tar concentrations upstream and downstream Pall filter for
selected set points
3.3 SEM-EDS
A Pilat MarkV impactor was used upstream and downstream of the filter to investigate the particle distribution and characterization. For a more detailed description of the device see Simeone [6]. When analysing the SEM-EDS particle composition results upstream of the filter, a clear distinction is noticeable among selected particles sections. There are particles containing relatively high amounts of carbon and particles containing low amounts of carbon. No significant differences in particle topography are noticed, however particle sections containing high amount of carbon generally are dark with uniform, flat shaped, relatively sharp edges. The analysed samples show that not all particles collected on a stage have a uniform size. Particles containing low amount of carbon contain relatively higher amount of magnesium. The most probable explanation of such composition is the presence of bed material’s particles on the impactor substrates. A decrease in particle sizes with stages containing smaller nozzles is clearly visible. The substrates present a high content of magnesium and some percentage of iron, thus indicating the presence of magnesite. Some of these particles appear to be an agglomeration of finer material, containing calcium, silicon, potassium and phosphorus. An example of the main composition from the stage with short-cut diameter of 5.7m of Test 7 is shown in Figure 3.
1088 Energy Production and Management in the 21st Century, Vol. 2
www.witpress.com, ISSN 1743-3541 (on-line) WIT Transactions on Ecology and The Environment, Vol 190, © 2014 WIT Press
et al.
the use of the

Figure 3: SEM-EDS of upstream impactor measurement from set-point at 0.25 and SB = 1); stage with aerodynamic cut-off diameter of 5.7mm. Elemental composition in wt%.
SEM-EDX results derived from the sampling with the cascade impactor of the particles load downstream of the filter for Test 12 (same set point of Test 7) are given in Figure 4. As shown, the main components present here are salts, indicating the presence of alkali passed through the filter in vapour phase and condensed then as salts, and magnesite, indicating transport of the magnesite to the filter during experiments.
Figure 4: SEM-EDS of downstream impactor measurement from set-point at = 0.25 and SB = 1; stage with aerodynamic cut-off diameter of 1m. Elemental composition in wt%.
4 Conclusions
The steam-oxygen blown CFB gasification experiments using bagasse as fuel have been carried out successfully and both bagasse pellets and ceramic candles proved to play a crucial role in the biomass gasification product gas characteristics. During the experiments gas compositions were measured using on-line gas analysers and micro-GC. Tars were always been sampled using the SPA method and the results show that increasing the steam-to-biomass ratio
Energy Production and Management in the 21st Century, Vol. 2 1089
www.witpress.com, ISSN 1743-3541 (on-line) WIT Transactions on Ecology and The Environment, Vol 190, © 2014 WIT Press

from approximately 0.7 to about 1.2 will contribute to tar reduction and increased H2 yield. The use of the “modified” SPA using a charcoal cartridge added to the regular SPA tube showed a better detection of the BTX and can be a valid alternative if the use of a micro-GC would not be possible. The filter, heated at 800°C, was used with two types of candles. Dia-Schumalith candles were operated for around 100 hours in total. During most of the experiments the filter elements showed steady pressure drop behaviour, thus indicating that stable filtration can be achieved under these conditions. Both types of candles used showed to be suited to work at high temperatures, with biomass pellets fuel, as well as fine bed material as magnesite. Different regeneration intervals and pressures were tested, and stable filtration was achieved at the very first tests. Blow back pressure around 3 bar and frequent pulsing provided promising results. The filter candles provided a very high filtration efficiency (close to 100%). Due to the high temperatures and the residence time in the vessel, the filtration process had also an effect on the gas and tars composition of the incoming raw product gas flow. Hydrogen content increased relatively with about 10% (dry basis) and the heavier tars appeared to be converted into lighter chains, such as naphthalene, of which the concentration increased. Hydrogen content increased by 20% points (dry basis) for catalytic candles. The conversion of tar compounds by using catalytic filter candles was increased by a factor of 2.8 compared to the one with non-catalytic filter elements.
References
[1] Mai R., Leibold H., Seifert H., Heidenreich S., Haag W., Walch A., Coupled pressure pulse (CPP) recleaning system for ceramic hot-gas filters with an integrated safety filter. Chem Eng Technol, 26(5):577-9, 2003.
[2] Siedlecki M., de Jong W., Biomass gasification as the first hot step in clean syngas production process – gas quality optimization and primary tar reduction measures in a 100 kW thermal steam-oxygen blown CFB gasifier. Biomass Bioenerg 35, S40-S62, 2011.
[3] Brage C., Yu Q., Chen G., Sjöström K., Use of amino phase adsorbent for biomass tar sampling and separation. Fuel 76(2), 137-42, 1997.
[4] Sergejs Osipovs, Use of two different adsorbents for sampling tar in gas obtained from peat gasification. International Journal of Environmental Analytical Chemistry, 89:8-12, 871-880, 2009.
[5] Visser H., The influence of fuel composition on agglomeration behavior in fluidized bed combustion. Tech. Rep. ECN-C-04-054, 2004.
[6] Simeone E. et al., Filtration performance at high temperatures and analysis of ceramic filter elements during biomass gasification. Biomass Bioenerg 35, S87-S104, 2011.
1090 Energy Production and Management in the 21st Century, Vol. 2
www.witpress.com, ISSN 1743-3541 (on-line) WIT Transactions on Ecology and The Environment, Vol 190, © 2014 WIT Press