balance of payments 2004
TRANSCRIPT

ISSN 1990-8849
2004

Published by:
The Central Bank of Trinidad and Tobago Eric Williams Plaza Independence Square Port of Spain P.O. Box 1250 Trinidad and Tobago
Copyright 2004
Data from tables may be reproducedwith acknowledgements from source

i
PREFACE
This report highlights the Balance of Payments transactions of Trinidad and Tobago for the year 2004. For
analytical purposes the years 1998-2003 are included. In addition, the Report contains an overview of the economic
situation and policies in 2004 and a summary analysis of the Balance of Payments position. This publication was
prepared by the Statistics Section of the Research and Policy Department of the Central Bank in close collaboration
with the Central Statistical Office.
The Bank began preparation of Quarterly Balance of Payments statements as of the first quarter of 1989.
These statements have been published in the Bank’s Quarterly Economic Bulletin since the June 1990 issue.
Consequently, the Balance of Payments Report for 2004 has been compiled from a consolidation of the quarterly data
for the year.
The Balance of Payments Report for 2004 conforms, as closely as possible, with the new methodology
recommended by the International Monetary Fund in the fifth edition of the Balance of Payments Manual. For
consistency, data for 1998 to 2003 have been revised to conform to the new methodology, and accordingly, may differ
from data presented in previous publications.
The Research and Policy Department wishes to express its appreciation to all suppliers of data, both in the
public and private sectors, for their cooperation, without which the publication of this report would not have been
possible. Criticisms and suggestions for improvement of both the database and the analysis would be welcomed
and any communication of this sort should be directed to:
The ManagerResearch and Policy DepartmentCentral Bank of Trinidad and TobagoP.O. Box 1250PORT OF SPAIN
ATTN: BOP Statistics
Director of Statistics ManagerCentral Statistical Office Research and Policy Department
Central Bank of Trinidad & Tobago

ii
THE BALANCE OF PAYMENTS OFTRINIDAD AND TOBAGO, 2004
TABLE OFCONTENTS
STATISTICAL TABLES
1A Standard Presentation 18-19
1B Analytic Summary Table 20
1C Analytic Summary Table 21
2 Merchandise Transactions 22
3 Transportation 23
4 Travel 24
5A Investment Income 25
TEXT TABLES:
1 Selected Economic Indicators
2 Prices of Selected
3 Summary of Balance of Commodities Payments
4 Selected Direct Investment Abroad 2004
5 Selected Direct Investment Abroad 2003
6 Selected Direct Investment Abroad 2002
7 Major Foreign Direct Investment in the EnergySector
8 International Investment Position as at December 2004
9 International Investment Position as at December 2003
10 International Investment Position as at December 2002
BOXES
BOX I Effective Exchange Rates
Preface i
Overview of Economic Developments 1
Balance of Payments: Summary Analysis 3
2
4
5
6
6
6
7
8
8
9
9

iii
TABLE OF CONTENTS
APPENDICES
1 Imports (c.i.f.) by S.I.T.C. Sections
2 Exports (f.o.b.) by S.I.T.C. Sections
3 Direction of Trade – Unadjusted Imports(c.i.f.) Net u.p.a.
4 Direction of Trade – Unadjusted Exports(f.o.b.) Net u.p.a.
5 Imports by sections and Major Trading Partners
6 Export by sections and Major Trading Partners
LIST OF CHARTS
Chart No.
1 Debt Service Ratio
2 Foreign Reserves
3A Current Account
3B Capital Account
4 Private Sector Capital Outflows
Explanatory Notes
Sources of Data
5B Private Sector – Investment Income ofDirect Investment Enterprises in 26-27Trinidad and Tobago by Sector of Activity
6 Other Government 28
7 Other Services 29
8 Unrequited Transfers: Private 30
9 Unrequited Transfers: Government 31
10A Direct Investment Capital in Private Sector 32Enterprises by Sector of Activity
10B Direct Foreign Investment by Country of Origin 33
10C Components of Direct Foreign Investment 33
11 Public Sector External Debt 34
12 Foreign Reserves 35
13 Commercial Banks: Foreign Assets and Liabilities 36
14 Exchange Rates for Selected Currencies 37
15 Regional Bonds Issued 38-40
43
44
45
46
47
48
13
13
14
14
15
49
55

iv
NOTES
1. Symbols used in this report:
0.0 - means negligible or nil
- - means nilp - means provisional datar - means revised data
... - means not available
2. The figures in some tables are rounded off to the nearest final digit and hence totals may not agree with the addition of components.
3. The following Exchange Rates were used for converting to $US:
1997: US$1 = TT$6.251998 : US$1 = TT$6.281999: US$1 = TT$6.272000: US$1 = TT$6.282001: US$1 = TT$6.202002: US$1 = TT$6.212003: US$1 = TT$6.262004: US$1 = TT$6.27
TABLE OF CONTENTS

Overview of Economic Developments 1
The Balance of Payments of Trinidad and Tobago, 2004
REVIEW OF THE NATIONAL ECONOMYOverview of Economic Developments
This section was reprinted from the Annual Economic Survey, 2004with the appropriate revisions in the external sector accounts.
uring 2004, the Trinidad and Tobagoeconomy maintained its path of robusteconomic growth with real GDP increasing
the containment in inflation, there was a modestimprovement in external competitiveness, as measuredby the real effective exchange rate.
During 2004, the Central Bank pursued anaccommodating monetary stance directed towardssupporting the growth of the non-energy sector,consistent with the maintenance of low inflation. Asregards fiscal policy, central government operationsled to a modest overall surplus in FY03/04. However,notwithstanding the repayment of a US$150 millionCentral Government loan, the operations of some stateenterprises and quasi-government bodies contributedto maintaining total public debt at around 50 per centof GDP as at end 2004.
Over the past two years, the Government has beenimplementing an intensive programme of institutional
reform geared to upgradingthe macro-economicframework and setting thestage for sustainable growthand development. In mid-2004, the Governmentadopted a White Paper onfinancial sector reform. Inline with the reform strategy,
work has started on the modernization of the legal,regulatory and supervisory framework governing thefinancial sector, and on upgrading the capital marketinfrastructure. Legislative amendments have nowbrought the insurance industry and private pensionfunds under the regulatory purview of the CentralBank. Amendments to the current FinancialInstitutions Act (1993), to bring the legislation more inline with international best practice, are now beingfinalized for presentation to Parliament.
The financial system infrastructure was recentlystrengthened by the introduction of a Real Time GrossSettlement System (RTGS) for the processing of largetime-sensitive payments and by an electronicGovernment Securities Settlement system. Also, in2004, the Government unveiled an auction system forlong term Government securities while, in the first halfof 2005, electronic trading commenced on the T&T StockExchange.
Dby 6.5 per cent (see Table 1). While economic growthcontinued to be led by the energy sector, the scope ofthe sector has continued to expand resulting in reduceddependence on oil exploration and greaterdiversification towards natural gas andpetrochemicals. In 2004, the sector saw the start-up ofoperations of two new petrochemical plants and theongoing construction work on a major expansion inthe LNG sector (Atlantic LNG, Train IV). The growthof the non-energy sector remained modest in 2004,though it contributed to a strong increase inemployment and a reduction in the unemployment rate.Inflation was kept under control for most of the yearbut in the last quarter, inflationary pressures emergedlargely as a result of agricultural supply shocks.
Higher volume andbuoyant energy pricescontributed to a significantincrease in energy exports.Non-energy exports, whichmainly comprise food andmanufactured exports tothe CARICOM region, roseby 10.6 per cent in 2004. Imports also rose sharply in2004 by 25 per cent partly reflecting capital goodsimports for the Atlantic Train IV project. The externalcurrent account surplus increased to 13.5 per cent ofGDP in 2004, from 9.2 per cent of GDP in 2003.
On the capital account, a significant increase in foreigndirect investment (23.7 per cent) in the energy sectorwas partly offset by increased investments abroad bydomestic firms as well as capital outflows through bondplacements by regional sovereigns and corporations.The balance of payments recorded a rise in officialexternal reserves to US$3 billion as at end 2004. Thishealthy external reserves position, together with thecountry’s low external debt, has greatly reduced theeconomy’s vulnerability to possible external shocksfrom the volatility in oil prices.The strong balance of payments position has alsofacilitated the maintenance of stability in the exchangerate. However, because of the depreciation of the TTdollar against the pound sterling and the euro, and
"....the scope of the sector has continuedto expand resulting in reduceddependence on oil exploration andgreater diversification towards naturalgas and petrochemicals."
2 Overview of Economic Developments
The Balance of Payments of Trinidad and Tobago, 2004
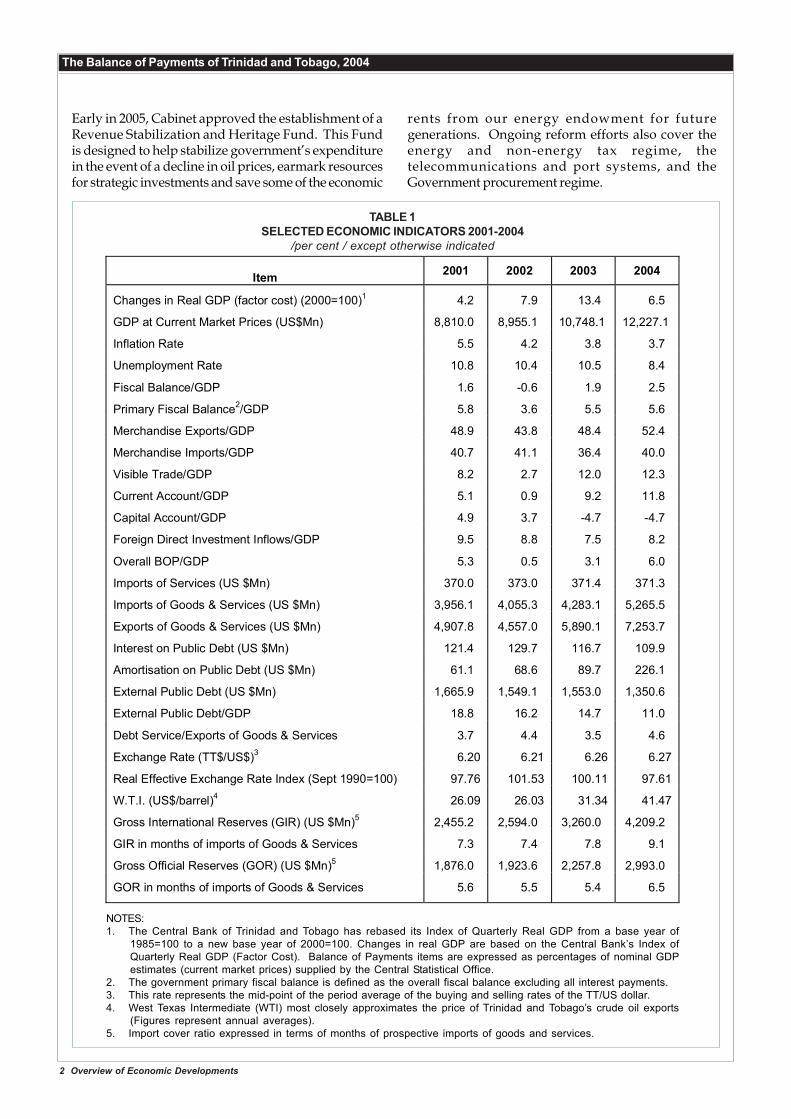
Early in 2005, Cabinet approved the establishment of aRevenue Stabilization and Heritage Fund. This Fundis designed to help stabilize government’s expenditurein the event of a decline in oil prices, earmark resourcesfor strategic investments and save some of the economic
rents from our energy endowment for futuregenerations. Ongoing reform efforts also cover theenergy and non-energy tax regime, thetelecommunications and port systems, and theGovernment procurement regime.
Item 2001 2002 2003 2004
Changes in Real GDP (factor cost) (2000=100)1 4.2 7.9 13.4 6.5
GDP at Current Market Prices (US$Mn) 8,810.0 8,955.1 10,748.1 12,227.1
Inflation Rate 5.5 4.2 3.8 3.7
Unemployment Rate 10.8 10.4 10.5 8.4
Fiscal Balance/GDP 1.6 -0.6 1.9 2.5
Primary Fiscal Balance2/GDP 5.8 3.6 5.5 5.6
Merchandise Exports/GDP 48.9 43.8 48.4 52.4
Merchandise Imports/GDP 40.7 41.1 36.4 40.0
Visible Trade/GDP 8.2 2.7 12.0 12.3
Current Account/GDP 5.1 0.9 9.2 11.8
Capital Account/GDP 4.9 3.7 -4.7 -4.7
Foreign Direct Investment Inflows/GDP 9.5 8.8 7.5 8.2
Overall BOP/GDP 5.3 0.5 3.1 6.0
Imports of Services (US $Mn) 370.0 373.0 371.4 371.3
Imports of Goods & Services (US $Mn) 3,956.1 4,055.3 4,283.1 5,265.5
Exports of Goods & Services (US $Mn) 4,907.8 4,557.0 5,890.1 7,253.7
Interest on Public Debt (US $Mn) 121.4 129.7 116.7 109.9
Amortisation on Public Debt (US $Mn) 61.1 68.6 89.7 226.1
External Public Debt (US $Mn) 1,665.9 1,549.1 1,553.0 1,350.6
External Public Debt/GDP 18.8 16.2 14.7 11.0
Debt Service/Exports of Goods & Services 3.7 4.4 3.5 4.6
Exchange Rate (TT$/US$)3 6.20 6.21 6.26 6.27
Real Effective Exchange Rate Index (Sept 1990=100) 97.76 101.53 100.11 97.61
W.T.I. (US$/barrel)4 26.09 26.03 31.34 41.47
Gross International Reserves (GIR) (US $Mn)5 2,455.2 2,594.0 3,260.0 4,209.2
GIR in months of imports of Goods & Services 7.3 7.4 7.8 9.1
Gross Official Reserves (GOR) (US $Mn)5 1,876.0 1,923.6 2,257.8 2,993.0
GOR in months of imports of Goods & Services 5.6 5.5 5.4 6.5
NOTES:1. The Central Bank of Trinidad and Tobago has rebased its Index of Quarterly Real GDP from a base year of
1985=100 to a new base year of 2000=100. Changes in real GDP are based on the Central Bank’s Index ofQuarterly Real GDP (Factor Cost). Balance of Payments items are expressed as percentages of nominal GDPestimates (current market prices) supplied by the Central Statistical Office.
2. The government primary fiscal balance is defined as the overall fiscal balance excluding all interest payments.3. This rate represents the mid-point of the period average of the buying and selling rates of the TT/US dollar.4. West Texas Intermediate (WTI) most closely approximates the price of Trinidad and Tobago’s crude oil exports
(Figures represent annual averages).5. Import cover ratio expressed in terms of months of prospective imports of goods and services.
TABLE 1SELECTED ECONOMIC INDICATORS 2001-2004
/per cent / except otherwise indicated

Summary Analysis 3
The Balance of Payments of Trinidad and Tobago, 2004
BALANCE OF PAYMENTS SUMMARY ANALYSIS 2004
Unless otherwise stated ‘dollar’ refers to UnitedStates Dollar (US$). See Text Table 1 for the relevant
exchange rates used in conversion.
n account of the robust performance of theenergy sector, Trinidad ad Tobagorecorded its twelfth consecutive balance
of payments surplus for the year 2004. The overallsurplus amounted to $735.2 million (6 per cent of GDP),more than twice the surplus ($334.2 million) postedfor 2003. The external current account improvedsignificantly, reflecting net earnings on themerchandise account of $1.5 billion while the capitalaccount recorded a deficit. This positive overalloutcome meant that gross official reserves once againimproved and at year’s end stood at $2,993 million,equivalent to 6.5 months of prospective imports of goodsand non factor services. In other developments,Trinidad and Tobago continues to maintain its ‘Baa3’investment grade ratings from Moody’s while Standardand Poor’s raised the country’s ratings from ‘BBB’ in2003 to ‘BBB+’ in 2004.
Current AccountThe external current account recorded a surplus of$1,447.1 million or 11.8 per cent of GDP in 2004,compared with $984.7 million or 9.2 per cent of GDP in2003. Total exports increased by 23 per cent, reflectinghigher prices and volumes of energy exports whilecapital imports associated with new investmentprojects in the energy sector, particularly the ALNGTrain IV, were mainly responsible for the rise of almost25 per cent of Trinidad and Tobago’s total imports in2004.
Merchandise TradeTrinidad and Tobago recorded a merchandise tradesurplus of $1.5 billion in 2004, $215.5 million morethan the surplus recorded for 2003. This led to a visibletrade surplus of 12.3 per cent of GDP, compared with asurplus of 12 per cent of GDP in the previous year.
ImportsImports increased by over 25 per cent in 2004 to $4,894.2million. This was reflected mainly in the imports ofmachinery and transport equipment which increasedby $539.2 million to $1,795.9 million in 2004. Theincrease in refinery activity was reflected in the valueof imports of mineral fuels and lubricants which roseby $114.2 million from $1,053.2 million in 2003.
O Manufactured imports also increased from $538.1million in 2003 to $809.2 million in 2004.The United States continues to be the largest supplierof Trinidad and Tobago’s imports. In 2004, importsfrom that country increased by $482.5 million to$1,662.2 million. This represented 34 per cent of totalimports compared with 30.2 per cent of the total in2003. The second largest source of imports for Trinidadand Tobago was the Latin American region whichaccounted for 17.6 per cent of total imports, comparedwith over 20 per cent in the previous years.
ExportsTotal exports increased by $1,198 million to $6,402.9million in 2004, the highest level on record. This wasas a result of an increase in the export value of mineralfuels and lubricants by just under 10 per cent.International crude oil prices (WTI) climbed by justover 30 per cent to average $41.47 per barrel in 2004.Exports of chemicals amounted to $1,521.6 million,$615 million more than in 2003. This is in response toincreased prices for urea, ammonia and methanol. Inaddition, exports of manufactured goods increased by28.3 per cent, following a decline of 6.1 per cent in2003.
The United States continued to be the country’s mainexport market with the share of total exports to thatdestination increasing to 70.4 per cent in 2004. Themain export products to the United States were crudeoil ($3,001.6 million) and chemicals ($1,222.3 million).Trinidad and Tobago’s share of total exports toCARICOM have been decreasing in recent yearsreaching a low of 12.5 per cent in 2004 from 18.8 percent in 2003. This was mainly attributed to a declinein the value of total exports to the CARICOM region ofalmost 20 per cent. Exports to Central and SouthAmerica amounted to 4 per cent of total exports.
IncomeAs the terms of trade improved during the year, therewas generally increased profitability in the energysector and net factor payments abroad reached $597.3million in 2004. Income accruing to foreigners fromtheir investments locally amounted to $663.5 million,compared with $759.1 million in the previous year.
4 Review of the Balance of Payments
The Balance of Payments of Trinidad and Tobago, 2004
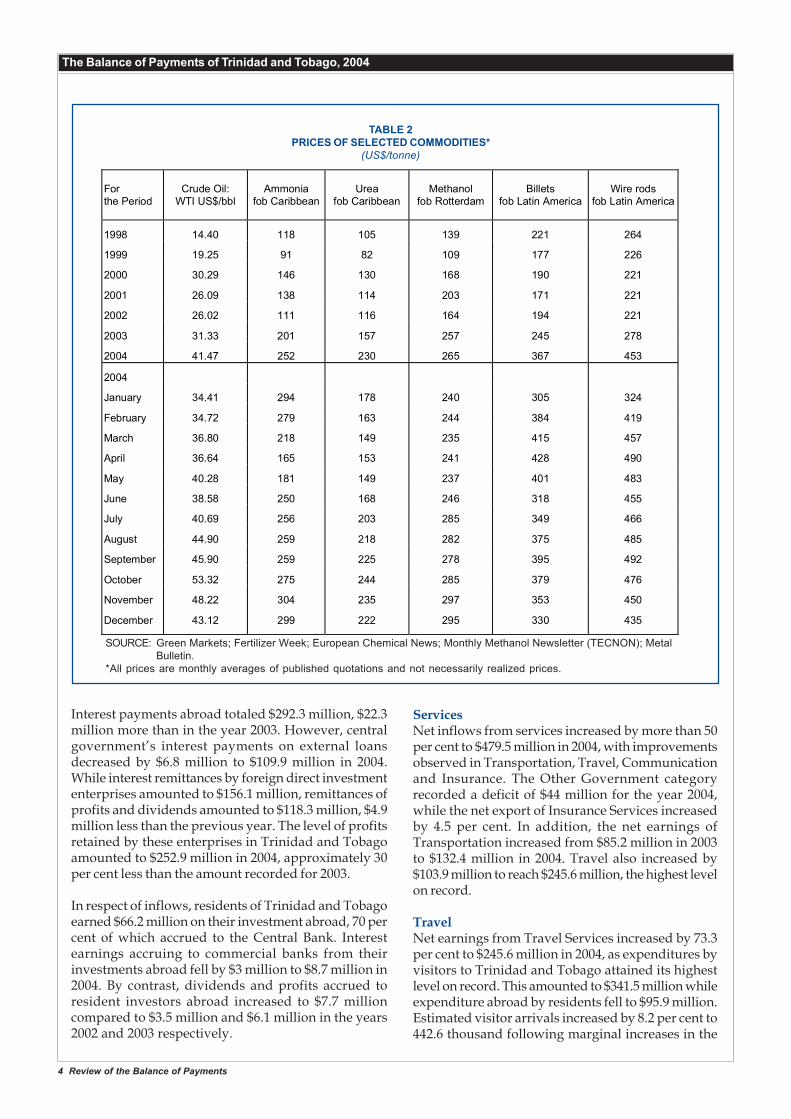
For the Period
Crude Oil:
WTI US$/bbl
Ammonia
fob Caribbean
Urea
fob Caribbean
Methanol
fob Rotterdam
Billets
fob Latin America
Wire rods
fob Latin America
1998 14.40 118 105 139 221 264
1999 19.25 91 82 109 177 226
2000 30.29 146 130 168 190 221
2001 26.09 138 114 203 171 221
2002 26.02 111 116 164 194 221
2003 31.33 201 157 257 245 278
2004 41.47 252 230 265 367 453
2004
January 34.41 294 178 240 305 324
February 34.72 279 163 244 384 419
March 36.80 218 149 235 415 457
April 36.64 165 153 241 428 490
May 40.28 181 149 237 401 483
June 38.58 250 168 246 318 455
July 40.69 256 203 285 349 466
August 44.90 259 218 282 375 485
September 45.90 259 225 278 395 492
October 53.32 275 244 285 379 476
November 48.22 304 235 297 353 450
December 43.12 299 222 295 330 435
TABLE 2PRICES OF SELECTED COMMODITIES*
(US$/tonne)
SOURCE: Green Markets; Fertilizer Week; European Chemical News; Monthly Methanol Newsletter (TECNON); MetalBulletin.
*All prices are monthly averages of published quotations and not necessarily realized prices.
Interest payments abroad totaled $292.3 million, $22.3million more than in the year 2003. However, centralgovernment’s interest payments on external loansdecreased by $6.8 million to $109.9 million in 2004.While interest remittances by foreign direct investmententerprises amounted to $156.1 million, remittances ofprofits and dividends amounted to $118.3 million, $4.9million less than the previous year. The level of profitsretained by these enterprises in Trinidad and Tobagoamounted to $252.9 million in 2004, approximately 30per cent less than the amount recorded for 2003.
In respect of inflows, residents of Trinidad and Tobagoearned $66.2 million on their investment abroad, 70 percent of which accrued to the Central Bank. Interestearnings accruing to commercial banks from theirinvestments abroad fell by $3 million to $8.7 million in2004. By contrast, dividends and profits accrued toresident investors abroad increased to $7.7 millioncompared to $3.5 million and $6.1 million in the years2002 and 2003 respectively.
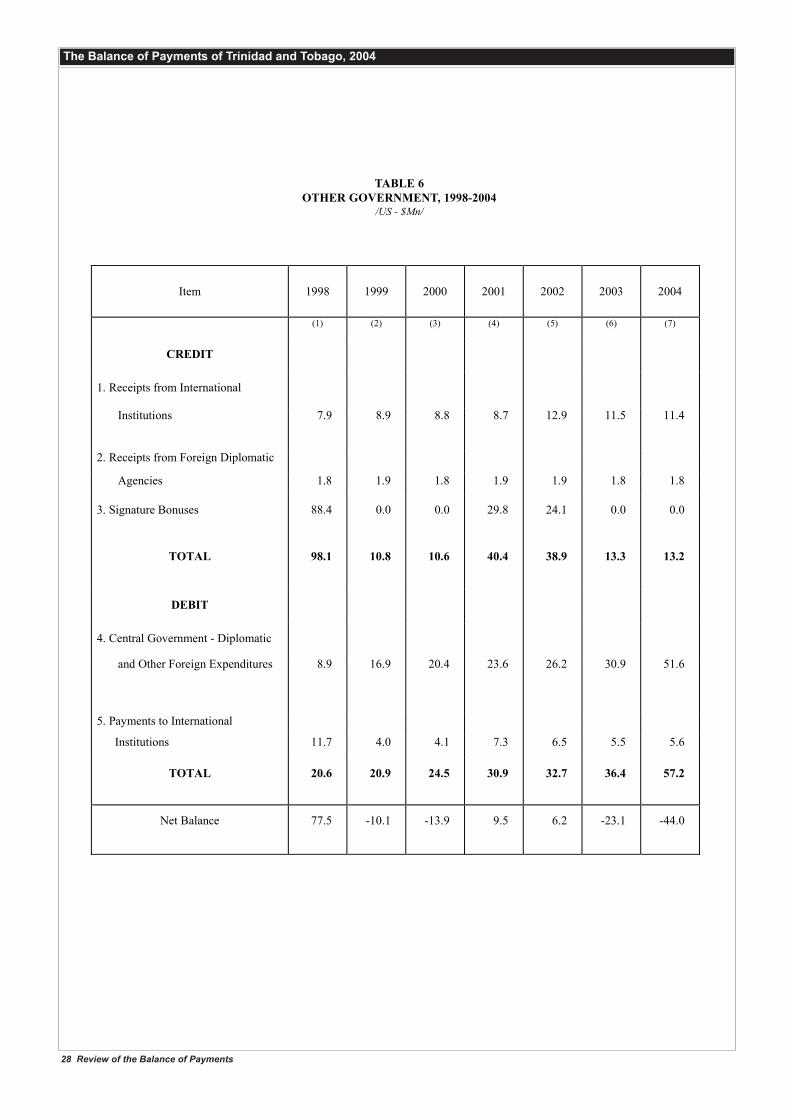
ServicesNet inflows from services increased by more than 50per cent to $479.5 million in 2004, with improvementsobserved in Transportation, Travel, Communicationand Insurance. The Other Government categoryrecorded a deficit of $44 million for the year 2004,while the net export of Insurance Services increasedby 4.5 per cent. In addition, the net earnings ofTransportation increased from $85.2 million in 2003to $132.4 million in 2004. Travel also increased by$103.9 million to reach $245.6 million, the highest levelon record.
TravelNet earnings from Travel Services increased by 73.3per cent to $245.6 million in 2004, as expenditures byvisitors to Trinidad and Tobago attained its highestlevel on record. This amounted to $341.5 million whileexpenditure abroad by residents fell to $95.9 million.Estimated visitor arrivals increased by 8.2 per cent to442.6 thousand following marginal increases in the
Summary Analysis 5
The Balance of Payments of Trinidad and Tobago, 2004
previous three years. Expenditure by private homevisitors, which have been the dominant category ofvisitor expenditure, increased from $138.6 million to$218.6 million in 2004. In addition, hotel visitorexpenditure more than doubled to reach $66.3 millionin 2004 as promotion efforts by the country’s tourismagency bear fruit. By contrast, the level of businessexpenditure fell from $68.1 million in 2003 to $41.6million in 2004.
TransportationTrinidad and Tobago’s net earnings from the provisionof transportation and related services rose by 55.4 percent to $132.4 million in 2004. Income obtained frompassenger fares increased by $39.8 million to $227.4million in 2004. In addition, earnings from the provisionof port services increased by 13.9 per cent to $58 million,mainly on account of increased cargo charges.Expenditure by local carriers in foreign ports fell to $86.9million in 2004 while other miscellaneous payments(including passenger fares) increased marginally.
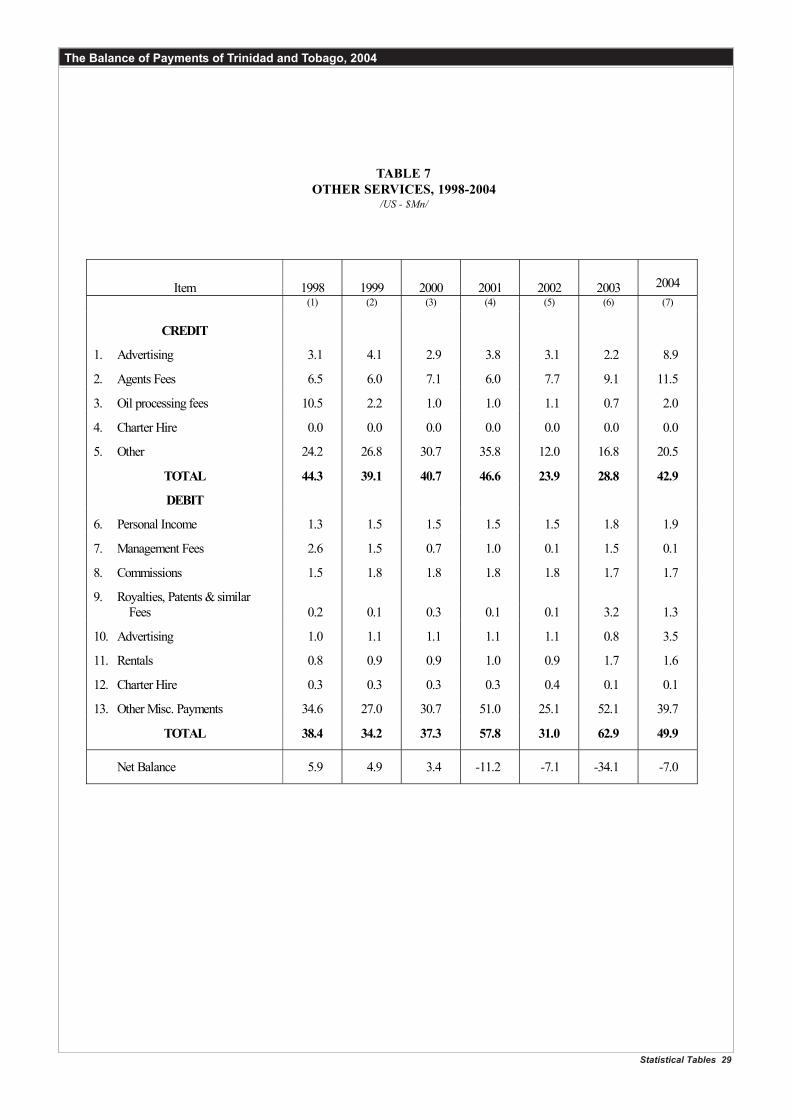
Other ServicesThe Other Services account recorded its fourthsuccessive deficit in 2004, amounting to $7 million. Thesale of services to foreigners by direct investmentcompanies increased by $3.7 million to $20.5 million in2004. Advertising agencies earned $6.7 million morethan 2003, while agents for foreign businesses earned$11.5 million, $2.4 million higher than that recordedfor the previous year. Meanwhile, fees earned from theprocessing of crude oil at the national refinery increasedmarginally to $2 million.
Unrequited TransfersBoth Government and Private Unrequited Transfersachieved surpluses for the eight consecutive year in
2004. Net private transfers recorded a surplus of $51.3million, $1.1 million more than the surplus recordedin 2003. Total transfers from abroad to local residentsincreased by $0.5 million to $89.1 million in 2004. Thereverse flows, however, decreased by $0.6 million to$37.8 million. Government’s unrequited transfersresulted in a surplus of $4.9 million, $3.5 million belowthe surplus recorded in the previous year. This declinewas largely as a result of the 23.3 per cent fall inreceipts from withholding taxes to $9.2 million in 2004.
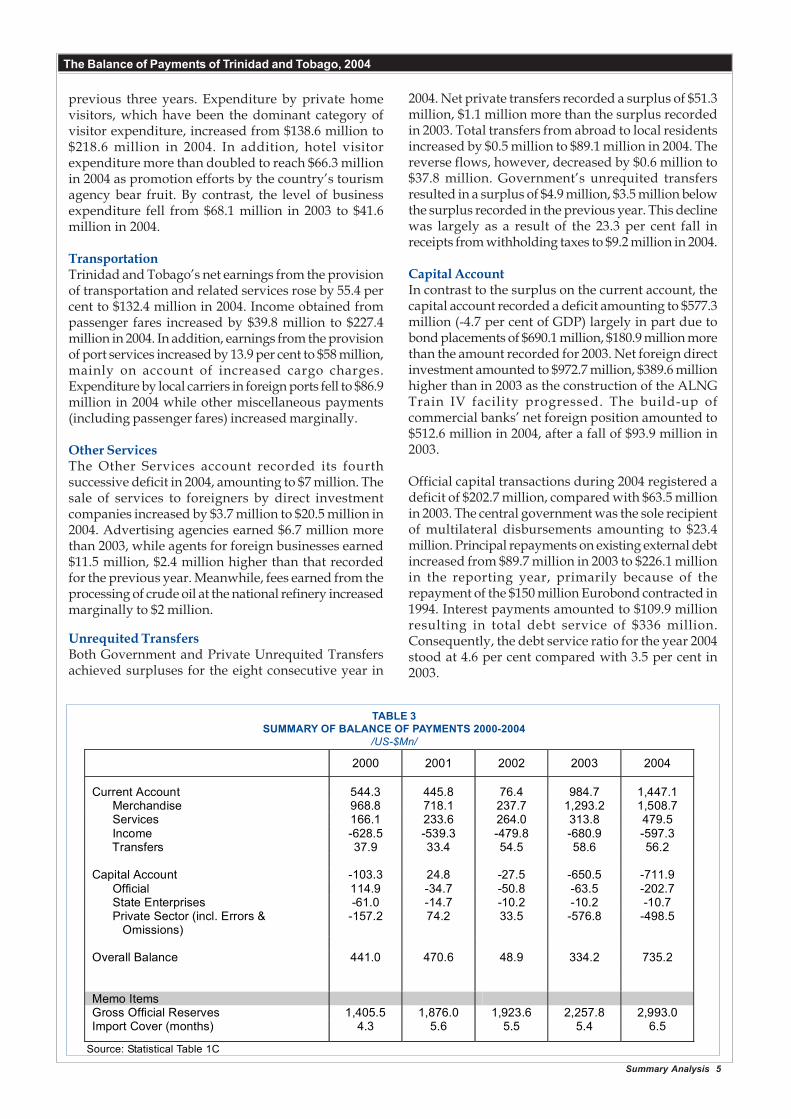
Capital AccountIn contrast to the surplus on the current account, thecapital account recorded a deficit amounting to $577.3million (-4.7 per cent of GDP) largely in part due tobond placements of $690.1 million, $180.9 million morethan the amount recorded for 2003. Net foreign directinvestment amounted to $972.7 million, $389.6 millionhigher than in 2003 as the construction of the ALNGTrain IV facility progressed. The build-up ofcommercial banks’ net foreign position amounted to$512.6 million in 2004, after a fall of $93.9 million in2003.
Official capital transactions during 2004 registered adeficit of $202.7 million, compared with $63.5 millionin 2003. The central government was the sole recipientof multilateral disbursements amounting to $23.4million. Principal repayments on existing external debtincreased from $89.7 million in 2003 to $226.1 millionin the reporting year, primarily because of therepayment of the $150 million Eurobond contracted in1994. Interest payments amounted to $109.9 millionresulting in total debt service of $336 million.Consequently, the debt service ratio for the year 2004stood at 4.6 per cent compared with 3.5 per cent in2003.
2000 2001 2002 2003 2004
Current Account 544.3 445.8 76.4 984.7 1,447.1 Merchandise 968.8 718.1 237.7 1,293.2 1,508.7 Services 166.1 233.6 264.0 313.8 479.5 Income -628.5 -539.3 -479.8 -680.9 -597.3 Transfers 37.9 33.4 54.5 58.6 56.2 Capital Account -103.3 24.8 -27.5 -650.5 -711.9 Official 114.9 -34.7 -50.8 -63.5 -202.7 State Enterprises -61.0 -14.7 -10.2 -10.2 -10.7 Private Sector (incl. Errors & Omissions)
-157.2 74.2 33.5 -576.8 -498.5
Overall Balance 441.0 470.6 48.9 334.2 735.2 Memo Items Gross Official Reserves 1,405.5 1,876.0 1,923.6 2,257.8 2,993.0 Import Cover (months) 4.3 5.6 5.5 5.4 6.5
TABLE 3SUMMARY OF BALANCE OF PAYMENTS 2000-2004
/US-$Mn/
Source: Statistical Table 1C

6 Review of the Balance of Payments
The Balance of Payments of Trinidad and Tobago, 2004
Foreign Direct InvestmentNet foreign investment flows increased from $583.1 million in 2003 to $972.7 million in 2004. On a gross basis, direct investment inflows amounted to $998.1 million, 23.5 per cent more than in 2003. The largest recipient was the petroleum sector which accounted for over 90 per cent of total investment infl ows. Trinidad and Tobago continues to be the largest recipient
of foreign investment in the Caribbean. Over the last six years there has been a tendency toward investment outflows particularly in the CARICOM region. Acquisitions of foreign business by Trinidad and Tobago companies totaled over $700 million in the last six years.
TABLE 4SELECTED DIRECT INVESTMENT ABROAD, 2004
/ US$- Mn /
Source: Central Bank of Trinidad and Tobago
TABLE 5SELECTED DIRECT INVESTMENT ABROAD, 2003
/ US$- Mn /
TABLE 6 SELECTED DIRECT INVESTMENT ABROAD, 2002
/US-$Mn/
Local Company Overseas Company Date of Investment Value of Investment
RBTT Limited Caribbean Commercial Jun – 04 $25.4 million Bank Limited
Source: Central Bank of Trinidad and Tobago
Local Company Overseas Company Date of Investment Value of Investment
Republic Bank Limited Barbados National Bank Mar - 03 $109.4 million
National Insurance Board Purchase of shares in Neal and Massy by Barbados Sep - 03 $32.0 million Shipping RBTT Bank Limited Ernst and Young Trust Sep - 03 $3.0 million Company, Barbados Republic Bank Limited Funds injected to capitalize Banco Mercantil, Dominican Oct - 03 $35.5 million Republic NEM / Guardian Holdings Purchase of two underwriting. Nov - 03 $36.9 million fi rms in the UK Republic Bank Limited East Caribbean Financial Holding Company Limited Dec - 03 $8.4 million (ECFH), St. Lucia
Source: Central Bank of Trinidad and Tobago.
Local Company Overseas Company Date of Investment Value of Investment
Ansa McAl Limited Grenada Brewers Limited Feb-02 $0.45 million
Readymix (West Indies) Limited Premix and Precast Con- crete Inc., Barbados Aug-02 $0.42 millionAngostura Holdings/ CL Burn Stewart, London Dec-02 $55.50 millionFinancial Holdings Guardian Holdings ING Fatum, Aruba Dec-02 $50.00 million
Summary Analysis 7
The Balance of Payments of Trinidad and Tobago, 2004
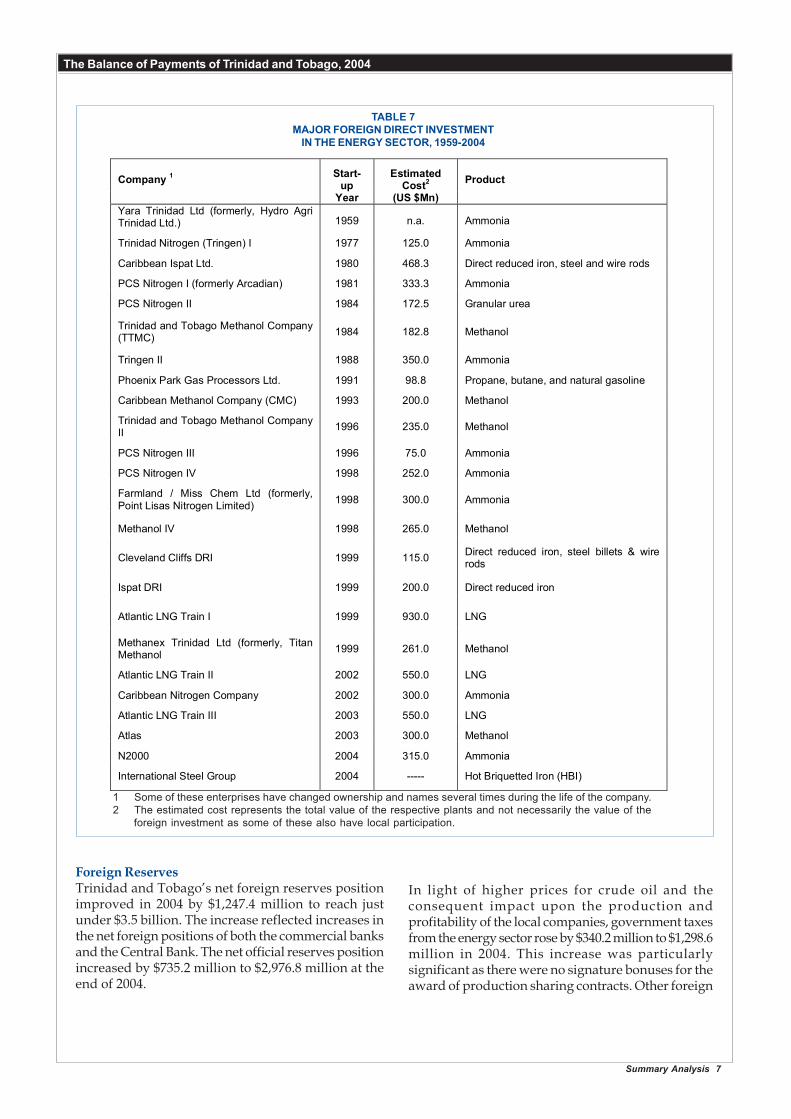
TABLE 7MAJOR FOREIGN DIRECT INVESTMENT
IN THE ENERGY SECTOR, 1959-2004
Company 1 Start-up
Estimated Cost2 Product
Year (US $Mn) Yara Trinidad Ltd (formerly, Hydro Agri Trinidad Ltd.) 1959 n.a. Ammonia
Trinidad Nitrogen (Tringen) I 1977 125.0 Ammonia
Caribbean Ispat Ltd. 1980 468.3 Direct reduced iron, steel and wire rods
PCS Nitrogen I (formerly Arcadian) 1981 333.3 Ammonia
PCS Nitrogen II 1984 172.5 Granular urea
Trinidad and Tobago Methanol Company (TTMC) 1984 182.8 Methanol
Tringen II 1988 350.0 Ammonia
Phoenix Park Gas Processors Ltd. 1991 98.8 Propane, butane, and natural gasoline
Caribbean Methanol Company (CMC) 1993 200.0 Methanol
Trinidad and Tobago Methanol Company II 1996 235.0 Methanol
PCS Nitrogen III 1996 75.0 Ammonia
PCS Nitrogen IV 1998 252.0 Ammonia
Farmland / Miss Chem Ltd (formerly, Point Lisas Nitrogen Limited) 1998 300.0 Ammonia
Methanol IV 1998 265.0 Methanol
Cleveland Cliffs DRI 1999 115.0 Direct reduced iron, steel billets & wire rods
Ispat DRI 1999 200.0 Direct reduced iron
Atlantic LNG Train I 1999 930.0 LNG
Methanex Trinidad Ltd (formerly, Titan Methanol 1999 261.0 Methanol
Atlantic LNG Train II 2002 550.0 LNG
Caribbean Nitrogen Company 2002 300.0 Ammonia
Atlantic LNG Train III 2003 550.0 LNG
Atlas 2003 300.0 Methanol
N2000 2004 315.0 Ammonia
International Steel Group 2004 ----- Hot Briquetted Iron (HBI)
1 Some of these enterprises have changed ownership and names several times during the life of the company.2 The estimated cost represents the total value of the respective plants and not necessarily the value of the
foreign investment as some of these also have local participation.
Foreign ReservesTrinidad and Tobago’s net foreign reserves positionimproved in 2004 by $1,247.4 million to reach justunder $3.5 billion. The increase reflected increases inthe net foreign positions of both the commercial banksand the Central Bank. The net official reserves positionincreased by $735.2 million to $2,976.8 million at theend of 2004.
In light of higher prices for crude oil and theconsequent impact upon the production andprofitability of the local companies, government taxesfrom the energy sector rose by $340.2 million to $1,298.6million in 2004. This increase was particularlysignificant as there were no signature bonuses for theaward of production sharing contracts. Other foreign

8 Review of the Balance of Payments
The Balance of Payments of Trinidad and Tobago, 2004
amortization and interest payments of $336 million, $129.6 million higher than in 2003. Meanwhile, efforts to smooth supply irregularities in the foreign exchange market led to the net sales of $400 million to the commercial banks compared with $572.9 million in 2003.
Trinidad and Tobago’s gross foreign assets amounted to $4,209.2 million at the end of 2004, an increase of $948.9 million from the end of the previous year and the highest level of reserves since 1981. This represented an estimated import cover of 9.1 months,
compared with 7.8 months at the end of 2003.
International Investment PositionAt the end of December 2004, the level of private sector external debt (PSED)1 for Trinidad and Tobago was estimated at $2,366.3 million, $312.3 million below the level recorded for 2003.This represented 19.4 per cent of GDP with over 30 per cent of this stock comprising commercial banks’ foreign liabilities.
2 Private sector external debt includes intra company loans, trade credits, private sector loans as well as the foreign liabilities of commercial banks.
TABLE 8INTERNATIONAL INVESTMENT POSITION
AS AT DECEMBER, 30 2004/US$Mn/
TABLE 9INTERNATIONAL INVESTMENT POSITION
AS AT DECEMBER, 30 2003/US$Mn/
Source: Central Bank of Trinidad and Tobago
Components External Liabilities %Total ExternalAssets %Total
Direct Investment 1,690.4 36.1 25.4 0.6 Equity Capital 723.1 16.2 25.4 0.6 Intra Company Loans 886.3 19.9 0.0 0.0 Portfolio Investment 2.4 0.1 23.0 0.5 Equity Securities 2.3 0.1 21.6 0.5 Debt Securities 0.1 0.0 1.4 0.0 Other Investment 2,830.6 63.5 1,227.1 28.7 Trade Credit 198.1 4.4 10.9 0.2 Private Loans 538.3 12.1 0.0 0.0 Government Loans 1,350.6 30.3 0.0 0.0 Commercial Banks 743.6 16.7 1,216.2 28.5 Central Bank Reserves 16.2 0.3 2,993.0 70.1 Government Reserves 0.0 0.0 0.0 0.0 Total 4,458.6 100.0 4,268.6 100.0
Components External Liabilities %Total ExternalAssets %Total
Direct Investment 1,684.3 34.2 225.2 6.3 Equity Capital 685.5 13.9 225.2 6.3 Intra Company Loans 998.8 20.3 0.0 0.0 Portfolio Investment 9.6 0.2 22.3 0.6 Equity Securities 0.3 0.0 13.3 0.4 Debt Securities 9.3 0.2 9.0 0.2 Other Investment 3,206.0 65.2 1,061.4 29.8 Trade Credit 113.0 2.3 38.2 1.1 Private Loans 524.6 10.7 21.0 0.6 Government Loans 1,526.2 31.0 0.0 0.0 Commercial Banks 1,042.2 21.2 1,002.2 28.1 Central Bank Reserves 16.2 0.4 2,257.9 63.3 Government Reserves 0.0 0.0 0.1 0.0 Total 4,916.1 100.0 3,566.9 100.0

Summary Analysis 9
The Balance of Payments of Trinidad and Tobago, 2004
Effective Exchange Rates
During 2004, there was an improvement in Trinidadand Tobago’s external competitiveness as measuredby the trade weighted real effective exchange rateindex (TWREER). The TWREER index rose by anaverage rate of 2.5 per cent compared with 1.4 percent in 2003. This improvement followed a loss incompetitiveness between the years, 1997 and 2002when there were successive increases in the TWREER.
The depreciation of the TWREER index occurredlargely on account of movements in relative exchangerates as measured by the nominal effective exchangerate index (TWNEER). This latter index fell by 1.8 percent in 2004 following the weakening of the US dollaragainst the major currencies (the Euro, Pound Sterlingand the Yen) which translated into an indirectdepreciation of the TT dollar against these currencies.
Complementing the exchange rate effect was theeffective inflation rate which is represented by changesin domestic inflation rates relative to the country’smajor trading partners. In 2004, Trinidad andTobago’s average inflation rate was 3.7 per cent,which was higher than that of the rate in the UnitedStates (2.7 per cent), the United Kingdom (1.4 per cent),and Japan (-0.8 per cent). Nevertheless, the overall
BOX IEFFECTIVE EXCHANGE RATES
The Nominal Effective Exchange Rate Index (1990=100) is calculated as a geometric average of bilateralexchange rates between the Trinidad and Tobago dollar and other currencies, weighted by non-oil merchandisetrade shares. The Real Effective Exchange Rate Index is similarly constructed but also takes into accountrelative inflation rates using consumer price indices. An increase in the value of indices represents a loss ofcompetitiveness, while, a decrease represents a gain in competitiveness. The trade-weighted real effectiveexchange rate (TWREER) index is the main indicator of international price competitiveness of domesticexports, and local goods that face competition from imports in the domestic market.
inflation differential was lower by 0.7 per cent,attributable to the double digit inflation ratesexperienced by Venezuela (21.9 per cent) and Jamaica(13.7 per cent).
While the annual data suggest an acceleration of thedecline in the real effective exchange rate, this maskedintra-year changes. During the second quarter, theUS dollar strengthened against the Euro and thePound by 3.7 per cent and 1.8 per cent, respectively.Indirectly, this resulted in a slowing of the depreciationof the real effective exchange rate, despite the favorableprice effect which partially offset the loss ofcompetitiveness.
The trend was reversed in the third and fourthquarters as once more the US dollar declined sharplyagainst the major currencies, with the sharpest falloccurring towards the end of the last quarter. At thesame time however, there was a widening in theinflation rate differential between Trinidad andTobago and the country’s major trading partners. Thiswidening outweighed the exchange rate effect whichled to the slower rate of increase in the internationalprice competitiveness of locally produced goods.
Trade-Weighted Export-Weighted Effective Inflation Rate
TWREER TWNEER XWREER XWNEER Trade-Weighted Export-Weighted
2000 91.48 145.34 88.57 108.40 62.94 81.71 2001 97.76 152.07 93.65 112.41 64.28 83.32 2002 101.53 156.40 97.11 115.93 64.92 83.77 2003 100.11 155.06 96.90 117.21 64.56 82.67 2004 97.61 152.30 94.34 116.94 64.10 80.68
Percentage Changes
2000 2.68 3.01 3.41 4.03 -0.33 -0.60 2001 6.86 4.63 5.74 3.70 2.13 1.97 2002 3.86 2.84 3.68 3.12 0.99 0.55 2003 -1.40 -0.86 -0.22 1.12 -0.55 -1.32 2004 -2.49 -1.78 -2.64 -0.23 -0.72 -2.40
TABLE 10EFFECTIVE EXCHANGE RATES, 2000 – 2004
(Index (1990=100)
Source: Central Bank of Trinidad and Tobago
CHARTS
Charts 11
The Balance of Payments of Trinidad and Tobago, 2004

CHART 1 DEBT SERVICE RATIO/EXPORT EARNINGS/
DEBT OUTSTANDING, 1997 - 2004
0
1,000
2,000
3,000
4,000
5,000
6,000
7,000
1997 1998 1999 2000 2001 2002 2003 2004
US$ Million
0
2
4
6
8
10
12
14
16
18Per cent
Export Earnings External Debt Outstanding Debt Service ratio %
CHART 2FOREIGN RESERVES, 1997-2004
0
500
1000
1500
2000
2500
3000
3500
4000
4500
1997 1998 1999 2000 2001 2002 2003 2004
US$Million
0
1
2
3
4
5
6
7
8
9
10Months of import cover
Gross International Reserves(GIR) GIR in months of import cover
13 Review of the Balance of Payments
The Balance of Payments of Trinidad and Tobago, 2004
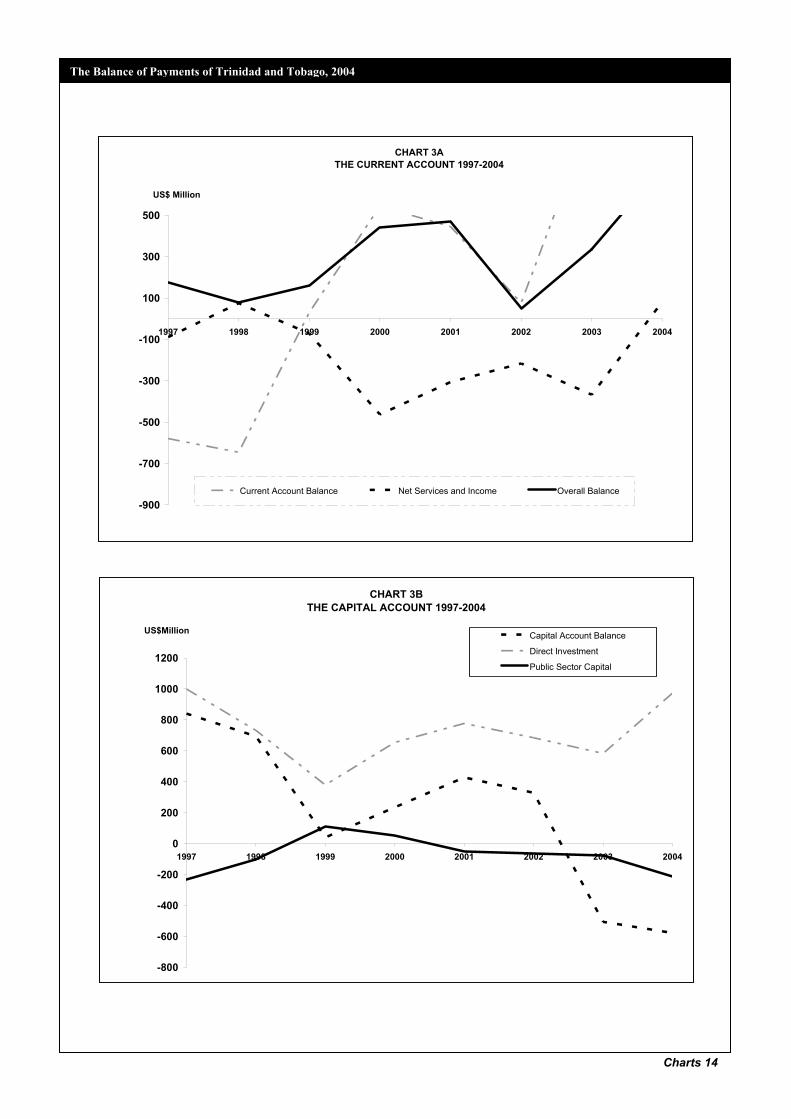
CHART 3A THE CURRENT ACCOUNT 1997-2004
-900
-700
-500
-300
-100
100
300
500
1997 1998 1999 2000 2001 2002 2003 2004
US$ Million
Current Account Balance Net Services and Income Overall Balance
CHART 3B THE CAPITAL ACCOUNT 1997-2004
-800
-600
-400
-200
0
200
400
600
800
1000
1200
1997 1998 1999 2000 2001 2002 2003 2004
US$Million Capital Account Balance
Direct Investment
Public Sector Capital
The Balance of Payments of Trinidad and Tobago, 2004
Charts 14

CHART 4 PRIVATE SECTOR CAPITAL OUTFLOWS 2000-2004
0
100
200
300
400
500
600
700
800
2000 2001 2002 2003 2004
YEAR
US$
Mn
Direct Investment Outflows Regional Bonds Issued
15 Review of the Balance of
The Balance of Payments of Trinidad and Tobago, 2004

The Balance of Payments of Trinidad and Tobago, 2004
Statistical Tables 17
STATISTICALTABLES

The Balance of Payments of Trinidad and Tobago, 2004
18 Review of the Balance of Payments
1 9 9 8 1 9 9 9 2 0 0 0 2 0 0 1 Item Credit Debit Credit Debit Credit Debit Credit Debit
(1) (2) (3) (4) (5) (6) (7) (8)
A. CURRENT ACCOUNT 3,061.1 3,706.4
3,556.1
3,525.5
4,988.9
4,444.6
5,080.5
4,634.7
Goods
1. Merchandise 2,264.6 3,007.6 2,815.8 2,752.2 4,290.3 3,321.5 4,304.2 3,586.1
Services 673.7 256.0 603.1 274.0 553.8 387.7 603.6 370.0 2. Transportation 202.4 124.2 204.4 123.6 207.6 173.2 207.3 116.6 3. Travel 201.2 67.2 209.6 82.8 212.8 147.1 200.9 151.0 4. Communication 97.3 5.4 111.4 8.6 36.3 5.5 29.8 5.6 5. Insurance 30.4 0.3 27.9 3.9 45.8 0.1 78.6 8.1 6. Other Government 98.1 20.6 10.8 20.9 10.6 24.5 40.4 30.9 7. Other Services 44.3 38.4 39.1 34.2 40.7 37.3 46.6 57.8
Income 8. Investment Income 64.2 406.5 68.3 468.2 80.9 709.4 108.7 648.0
Current Unrequited Transfers 58.6 36.3 68.9 31.2 63.9 26.0 64.0 30.6 9. Private 47.9 32.0 56.2 28.6 40.6 22.3 49.3 25.5 10. Government
10.7 4.2 12.7 2.6 23.3 3.7 14.7 5.1
B. CAPITAL (Exc. Reserves & Related Items)
1,111.9
417.5
1,155.6
1,115.2
1,077.2
842.5
1,119.9
691.8
Private Sector 1,042.5 242.7 857.6 927.1 690.8 510.0 1,093.4 615.9 11. Direct Investment 731.9 0.0 643.3 264.1 679.5 25.2 834.9 58.1 12. Commercial Banks 12.6 62.3 73.7 0.0 0.0 86.1 257.1 0.0 13. Regional Bonds Issued 0.0 0.0 0.0 177.5 0.0 30.0 0.0 206.2 14. Other Private 298.0 180.4 140.6 485.5 11.3 368.7 1.4 351.6
Official Sector 69.4 174.8 298.0 188.1 386.4 332.5 26.5 75.9
15. Official Borrowing 58.8 164.5 295.2 170.8 383.6 268.7 26.5 61.2 16. Official Loans 0.0 0.0 0.0 0.0 0.0 0.0 0.0 0.0 17. State Enterprises Sector 0.0 5.7 0.0 4.9 2.8 63.8 0.0 14.7 18. Other Assets 10.6 4.6 2.8 12.4 0.0 0.0 0.0 0.0 19. Other Liabilities
0.0 0.0 0.0 0.0 0.0 0.0 0.0 0.0
C. NET ERRORS & OMISSIONS
31.5 0.0 91.2 0.0 0.0 338.0 0.0 403.3
D. COUNTERPART ITEMS
20. Allocation of S.D.R.
0.0 0.0 0.0 0.0 0.0 0.0 0.0 0.0
E. FINANCING – Change In Reserves
0.0
80.6
0.0
162.2
0.0
441.0
0.0
470.6
21. Government 0.0 0.3 0.0 0.0 3.8 0.3 0.0 0.0 22. Central Bank
22.1 Reserve Assets 0.0 80.3 0.0 162.2 59.6 504.0 0.0 470.5 22.2 I.M.F. Reserve Tranche 0.0 0.0 0.0 0.0 0.0 0.0 0.0 0.0 22.3 S.D.R. Holdings
0.0 0.0 0.1 0.0 0.0 0.1 0.0 0.1
TOTAL
4,204.5 4,204.5 4,802.9 4,802.9 6,066.1 6,066.1 6,200.4 6,200.4
TABLE 1ASTANDARD PRESENTATION 1998-2004
/US - $Mn/

The Balance of Payments of Trinidad and Tobago, 2004
Statistical Tables 19
2 0 0 2 2 0 0 3 2 0 0 4 Credit Debit Credit Debit Credit Debit Item
(9) (10) (11) (12) (13) (14)
4,716.9 4,640.5 6,069.1 5,084.4 7,418.5 5,971.4 A. CURRENT ACCOUNT
Goods 3,920.0 3,682.3 5,204.9 3,911.7 6,402.9 4,894.2 1. Merchandise
637.0 373.0 685.2 371.4 850.8 371.3 Services 202.5 117.4 246.5 161.3 294.7 162.3 2. Transportation 242.0 186.3 248.9 107.2 341.5 95.9 3. Travel 29.9 5.4 39.5 3.5 45.3 5.8 4. Communication 99.8 0.2 108.2 0.1 113.2 0.2 5. Insurance 38.9 32.7 13.3 36.4 13.2 57.2 6. Other Government 23.9 31.0 28.8 62.9 42.9 49.9 7. Other Services
Income 63.7 543.5 78.2 759.1 66.2 663.5 8. Investment Income
96.2 41.7 100.8 42.2 98.6 42.4 Current Unrequited Transfers 81.0 36.6 88.6 38.4 89.1 37.8 9. Private 15.2 5.1 12.2 3.8 9.5 4.6 10. Government
1,065.9
732.2
1,309.2
1,814.9
1,121.4
1,698.7 B. CAPITAL (Exc. Reserves & Related Items)
1,048.1 658.4 1,283.0 1,715.0 1,098.0 1,461.9 Private Sector 790.7 106.4 808.3 225.2 998.1 25.4 11. Direct Investment 256.1 335.4 425.7 331.8 0.0 512.6 12. Commercial Banks
0.0 70.1 0.0 509.2 0.0 690.1 13. Regional Bonds Issued 1.3 146.5 49.0 648.8 99.9 233.8 14. Other Private
17.8 78.8 26.2 99.9 23.4 236.8 Official Sector
17.8 68.6 26.2 89.7 23.4 226.1 15. Official Borrowing 0.0 0.0 0.0 0.0 0.0 0.0 16. Official Loans 0.0 10.2 0.0 10.2 0.0 10.7 17. State Enterprises Sector 0.0 0.0 0.0 0.0 0.0 0.0 18. Other Assets 0.0 0.0 0.0 0.0 0.0 0.0 19. Other Liabilities
0.0 356.2 0.0 144.8 0.0 134.6 C. NET ERRORS & OMISSIONS
D. COUNTERPART ITEMS
0.0 0.0 0.0 0.0 0.0 0.0 20. Allocation of S.D.R..
0.0
48.9
0.0
334.2
0.0
735.2 E. FINANCING – Change in Reserves
0.0 0.0 0.0 0.0 0.0 0.0 21. Government 22. Central Bank
0.0 48.6 0.0 333.5 0.0 734.4 22.1 Reserve Assets 0.0 0.0 0.0 0.0 0.0 0.0 22.2 I.M.F. Reserve Tranche 0.0 0.3 0.0 0.7 0.0 0.8 22.3 S.D.R. Holdings
5,782.8 5,782.8 7,378.3 7,378.3 8,539.9 8,539.9 TOTAL
TABLE 1A (CONT’D)STANDARD PRESENTATION 1998-2004
/US - $Mn/
The Balance of Payments of Trinidad and Tobago, 2004
20 Review of the Balance of Payments
Item 1998 1999 2000 2001 2002 2003 2004 (1) (2) (3) (4) (5) (6) (7)
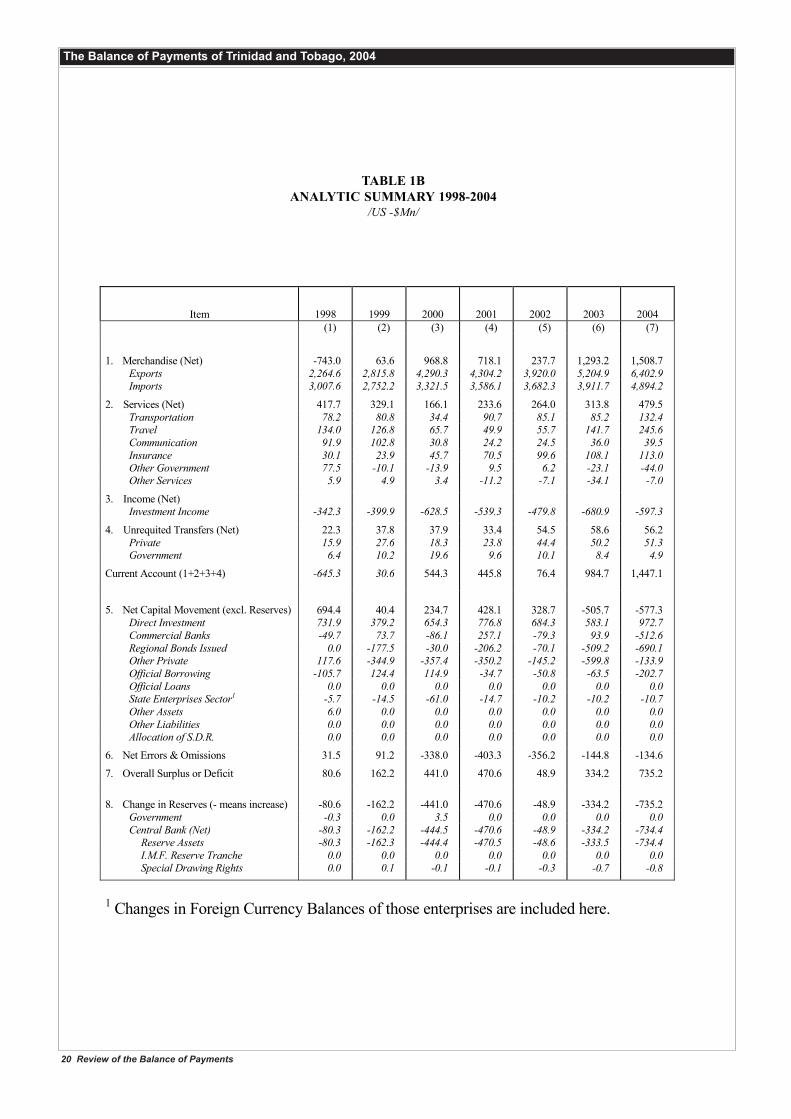
1. Merchandise (Net) -743.0 63.6 968.8 718.1 237.7 1,293.2 1,508.7 Exports 2,264.6 2,815.8 4,290.3 4,304.2 3,920.0 5,204.9 6,402.9 Imports 3,007.6 2,752.2 3,321.5 3,586.1 3,682.3 3,911.7 4,894.2
2. Services (Net) 417.7 329.1 166.1 233.6 264.0 313.8 479.5 Transportation 78.2 80.8 34.4 90.7 85.1 85.2 132.4 Travel 134.0 126.8 65.7 49.9 55.7 141.7 245.6 Communication 91.9 102.8 30.8 24.2 24.5 36.0 39.5 Insurance 30.1 23.9 45.7 70.5 99.6 108.1 113.0 Other Government 77.5 -10.1 -13.9 9.5 6.2 -23.1 -44.0 Other Services 5.9 4.9 3.4 -11.2 -7.1 -34.1 -7.0
3. Income (Net) Investment Income -342.3 -399.9 -628.5 -539.3 -479.8 -680.9 -597.3
4. Unrequited Transfers (Net) 22.3 37.8 37.9 33.4 54.5 58.6 56.2 Private 15.9 27.6 18.3 23.8 44.4 50.2 51.3 Government 6.4 10.2 19.6 9.6 10.1 8.4 4.9
Current Account (1+2+3+4) -645.3 30.6 544.3 445.8 76.4 984.7 1,447.1
5. Net Capital Movement (excl. Reserves)
694.4
40.4
234.7
428.1
328.7
-505.7
-577.3 Direct Investment 731.9 379.2 654.3 776.8 684.3 583.1 972.7 Commercial Banks -49.7 73.7 -86.1 257.1 -79.3 93.9 -512.6 Regional Bonds Issued 0.0 -177.5 -30.0 -206.2 -70.1 -509.2 -690.1 Other Private 117.6 -344.9 -357.4 -350.2 -145.2 -599.8 -133.9 Official Borrowing -105.7 124.4 114.9 -34.7 -50.8 -63.5 -202.7 Official Loans 0.0 0.0 0.0 0.0 0.0 0.0 0.0 State Enterprises Sector1 -5.7 -14.5 -61.0 -14.7 -10.2 -10.2 -10.7 Other Assets 6.0 0.0 0.0 0.0 0.0 0.0 0.0 Other Liabilities 0.0 0.0 0.0 0.0 0.0 0.0 0.0 Allocation of S.D.R. 0.0 0.0 0.0 0.0 0.0 0.0 0.0
6. Net Errors & Omissions 31.5 91.2 -338.0 -403.3 -356.2 -144.8 -134.6
7. Overall Surplus or Deficit 80.6 162.2 441.0 470.6 48.9 334.2 735.2
8. Change in Reserves (- means increase)
-80.6
-162.2
-441.0
-470.6
-48.9
-334.2
-735.2 Government -0.3 0.0 3.5 0.0 0.0 0.0 0.0 Central Bank (Net) -80.3 -162.2 -444.5 -470.6 -48.9 -334.2 -734.4 Reserve Assets -80.3 -162.3 -444.4 -470.5 -48.6 -333.5 -734.4 I.M.F. Reserve Tranche 0.0 0.0 0.0 0.0 0.0 0.0 0.0 Special Drawing Rights 0.0 0.1 -0.1 -0.1 -0.3 -0.7 -0.8
1 Changes in Foreign Currency Balances of those enterprises are included here.
TABLE 1BANALYTIC SUMMARY 1998-2004
/US -$Mn/

The Balance of Payments of Trinidad and Tobago, 2004
Statistical Tables 21
ITEM 1998 1999 2000 2001 2002 2003 2004 (1) (2) (3) (4) (5) (6) (7)
CURRENT ACCOUNT -645.3 30.6 544.3 445.8 76.4 984.7 1,447.1
Trade Account -743.0 63.6 968.8 718.1 237.7 1,293.2 1,508.7 Exports, f.o.b. 2,264.6 2,815.8 4,290.3 4,304.2 3,920.0 5,204.9 6,402.9
o/w: Petroleum 941.6 1,286.5 2,244.7 2,125.9 2,332.3 2,373.5 3,859.3 Chemicals 500.9 536.0 743.5 815.2 647.1 906.8 1,521.6
Imports, c.i.f. 3,007.6 2,752.2 3,321.5 3,586.1 3,682.3 3,911.7 4,894.2
Services (net) 417.7 329.1 166.1 233.6 264.0 313.8 479.5
Income (net) -342.3 -399.9 -628.5 -539.3 -479.8 -680.9 -597.3 Interest -153.6 -156.3 -247.2 -165.4 -188.4 -197.9 -233.8 Other -188.7 -243.6 -381.3 -373.9 -291.4 -483.0 -363.5
Transfers 22.3 37.8 37.9 33.4 54.5 58.6 56.2
CAPITAL ACCOUNT 725.9 131.6 -103.3 24.8 -27.5 -650.5 -711.9 Public Sector Capital -105.4 109.9 53.9 -49.4 -61.0 -73.7 -213.4
Disbursements 58.7 295.2 383.6 26.6 17.7 26.2 23.4 Amortization -170.2 -175.7 -270.3 -61.1 -68.6 -89.7 -226.1 Other 6.1 -9.6 -59.4 -14.9 -10.1 -10.2 -10.7
Direct Investment 731.9 379.2 654.3 776.8 684.3 583.1 972.7
Regional Bonds Issued 0.0 -177.5 -30.0 -206.2 -70.1 -509.2 -690.1 Other Private Sector Capital (incl. Errors & Omissions) 99.4 -180.1 -781.5 -496.4 -580.7 -650.7 -781.1
OVERALL BALANCE 80.6 162.2 441.0 470.6 48.9 334.2 735.2
FINANCING -80.6 -162.2 -441.0 -470.6 -48.9 -334.2 -735.2 Change in Gross Off. Res. ( - = increase)1
-76.1
-162.2
-444.5
-470.6
-48.9
-334.2
-735.2
Use of Fund Credit -4.2 0.0 0.0 0.0 0.0 0.0 0.0 Central Government -0.3 0.0 3.5 0.0 0.0 0.0 0.0
1.Refers to change in Gross Reserves for Central Bank (net of liab. Except Fund Reserves)
TABLE 1CANALYTIC SUMMARY 1998-2004
/US - $Mn/

The Balance of Payments of Trinidad and Tobago, 2004
22 Review of the Balance of Payments
Item 1998 1999 2000 2001 2002 2003 2004 (1) (2) (3) (4) (5) (6) (7)
CREDIT
EXPORTS
Total exports f.o.b. 2,171.7 2,755.3 4,228.8 4,233.9 3,868.7 5,081.1 6,341.1
Goods for Processing 65.8 33.1 15.2 13.2 10.5 9.2 12.1
Stores and Bunkers 27.2 27.4 46.3 57.1 40.8 114.6 49.7
Repairs on Goods 0.0 0.0 0.0 0.0 0.0 0.0 0.0
Non-Monetary Gold 0.0 0.0 0.0 0.0 0.0 0.0 0.0
1. Total adjusted exports f.o.b. 2,264.6 2,815.8 4,290.3 4,304.2 3,920.0 5,204.9 6,402.9
DEBIT
IMPORTS
Total imports c.i.f. 2,912.8 2,731.9 3,305.5 3,576.4 3,672.5 3,899.0 4,880.5
Goods for Processing 94.8 20.3 16.0 9.7 9.8 12.7 13.7
Stores and Bunkers 0.0 0.0 0.0 0.0 0.0 0.0 0.0
Repairs on Goods 0.0 0.0 0.0 0.0 0.0 0.0 0.0
Adjustments1 0.0 0.0 0.0 0.0 0.0 0.0 0.0
Non-Monetary Gold 0.0 0.0 0.0 0.0 0.0 0.0 0.0
2. Total adjusted imports c.i.f. 3,007.6 2,752.2 3,321.5 3,586.1 3,682.3 3,911.7 4,894.2
Trade Balance -743.0 63.6 968.8 718.1 237.7 1,293.2 1,508.7
1 Crude purchased by PETROTRIN from UPA agreements
TABLE 2MERCHANDISE TRANSACTIONS, 1998-2004
/US - $Mn/

The Balance of Payments of Trinidad and Tobago, 2004
Statistical Tables 23
Item 1998 1999 2000 2001 2002 2003 2004 (1) (2) (3) (4) (5) (6) (7)
CREDIT
1. Passenger Fares 154.5 154.7 158.2 160.2 159.8 187.6 227.4
2. Port Disbursements 41.8 43.8 43.3 40.8 41.3 50.9 58.0 2.1 Port Charges 8.5 9.5 8.4 5.2 5.0 6.7 4.2 2.2 Airport Charges 2.1 1.5 1.8 2.3 2.2 1.6 1.9 2.3 Pilotage 1.0 1.1 1.1 1.1 1.0 1.0 0.7 2.4 Cargo Charges 29.8 31.3 31.8 28.1 28.3 38.7 50.9 2.5 Other Port Disbursements 0.4 0.4 0.2 4.1 0.1 2.9 0.3
3. Sale of Consignment Notes 4.7 4.7 4.7 4.7 4.7 6.7 8.4
4. Sale of Consignment Notes on behalf of foreign airlines 0.2 0.2 0.2 0.2 0.2 0.4 0.4
5. Other Miscellaneous Receipts 1.2 1.0 1.1 1.4 1.2 0.9 0.5 5.1 Mail 0.4 0.4 0.4 0.4 0.4 0.3 0.3 5.2 Other 0.8 0.6 0.7 1.0 0.8 0.6 0.2
TOTAL 202.4 204.4 207.6 207.3 202.5 246.5 294.7
DEBIT
6. Passenger Fares 24.7 23.1 42.8 21.0 21.8 35.7 45.0
7. Port Disbursements 62.6 63.1 83.1 60.9 60.6 93.1 86.9
8. Other Miscellaneous Payments 36.9 37.4 47.3 34.7 35.0 32.5 30.4
TOTAL 124.2 123.6 173.2 116.6 117.4 161.3 162.3
Net Balance 78.2 80.8 34.4 90.7 85.1 85.2 132.4
TABLE 3TRANSPORTATION, 1998-2004
/US - $Mn/

The Balance of Payments of Trinidad and Tobago, 2004
24 Review of the Balance of Payments
ITEM 1998 1999 2000 2001 2002 2003 2004
(1) (2) (3) (4) (5) (6) (7)
CREDIT
1. Hotel visitors 36.3 38.1 39.4 35.3 37.9 26.4 66.3
2. Business visitors 46.0 42.9 49.8 46.9 46.8 68.1 41.6
3. Private home and others 103.1 112.3 107.1 102.8 142.7 138.6 218.6
4. Students 14.4 14.8 15.3 14.8 13.7 14.7 13.9
5. Advances to crew 1.4 1.5 1.2 1.1 0.9 1.1 1.1
TOTAL 201.2 209.6 212.8 200.9 242.0 248.9 341.5
DEBIT
6. Advances to crew 8.6 8.6 8.7 8.8 8.6 7.5 2.9
7. Students 14.1 11.9 38.3 9.0 6.5 6.4 3.6
8. Government officials 1.5 0.5 1.0 0.9 0.3 0.4 0.2
9. Tourists and other travelers 43.0 61.8 99.1 132.3 170.9 92.9 89.2
TOTAL 67.2 82.8 147.1 151.0 186.3 107.2 95.9
Net Balance 134.0 126.8 65.7 49.9 55.7 141.7 245.6
TABLE 4TRAVEL, 1998-2004
/US - $Mn/

The Balance of Payments of Trinidad and Tobago, 2004
Statistical Tables 25
Item 1998 1999 2000 2001 2002 2003 2004 (1) (2) (3) (4) (5) (6) (7)
CREDIT INTEREST (i) Central Government - Interest
earned on external securities
0.2
0.2
0.2
0.2 0.2 0.2
0.1 (ii) Central Bank - Interest earned on
investments abroad
45.1
45.7
60.9
88.1 37.9 57.1
46.3 (iii) Commercial Banks - Interest on
foreign investment
10.7
18.4
15.8
16.4 15.8 11.7
8.7 (iv) Other 8.2 4.0 4.0 4.0 6.3 3.1 3.4
DIVIDENDS AND PROFITS .. .. .. .. 3.5 6.1 7.7
TOTAL 64.2 68.3 80.9 108.7 63.7 78.2 66.2 DEBIT
INTEREST 217.8 224.6 328.1 274.1 248.6 270.0 292.3 (i) Central government - Interest paid
on external loans
114.8
96.2
113.6
121.4 129.7 116.7
109.9 (ii) State Enterprises - Interest paid on
external loans
3.6
2.3
1.7
1.4 1.4 1.4
1.4 (iii) Direct Foreign Investment -
Interest paid on external loans
90.8
108.2
163.6
106.3 98.8 125.4
156.1 (iv) Other 8.8 18.0 49.2 45.0 18.7 26.5 24.9
DIVIDENDS AND PROFITS 103.0 92.1 235.5 206.3 130.3 123.2 118.3 RETAINED PROFITS 85.7 151.5 145.8 167.6 164.6 365.9 252.9
TOTAL
406.5
468.2
709.4
648.0 543.5 759.1
663.5
Net Balance -342.3 -399.9 -628.5 -539.3 -479.8 -680.9 -597.3
TABLE 5AINVESTMENT INCOME, 1998-2004
/US - $Mn/
The Balance of Payments of Trinidad and Tobago, 2004
26 Review of the Balance of Payments
REMITTANCES ABROAD Item Total Total Dividends Interest Profits
Estimated Retained
Profit 1 9 9 7
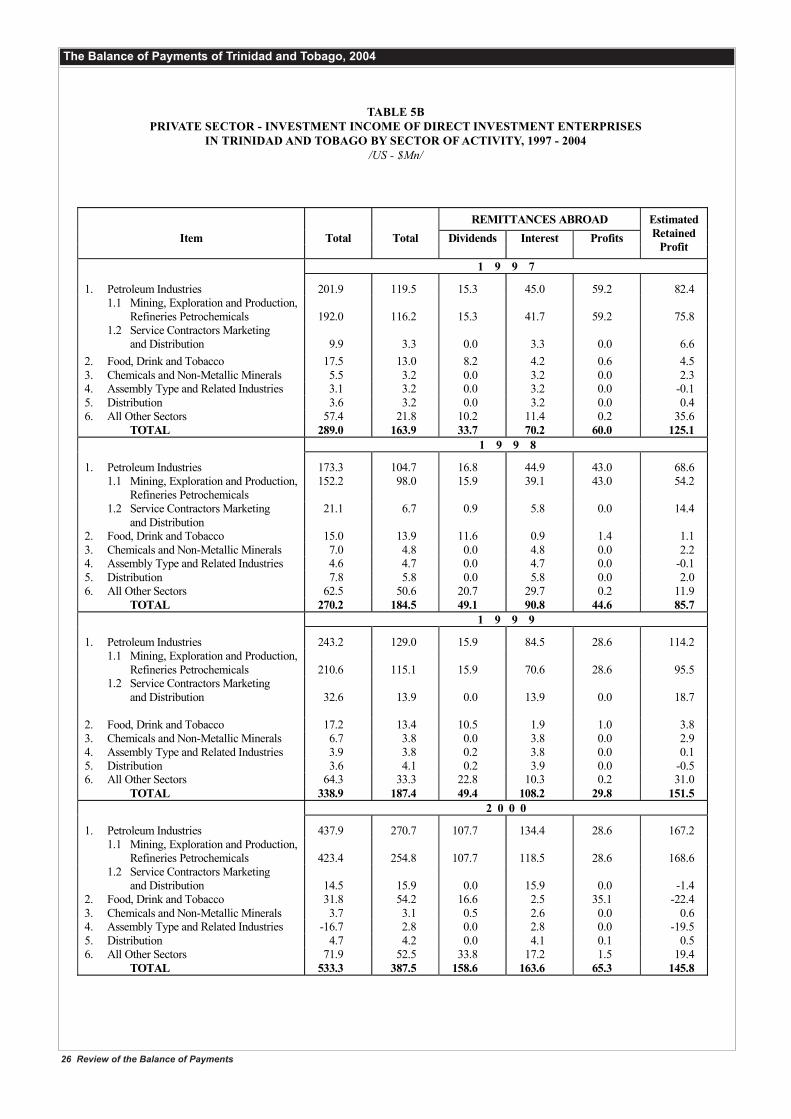
1. Petroleum Industries 201.9 119.5 15.3 45.0 59.2 82.4 1.1 Mining, Exploration and Production,
Refineries Petrochemicals
192.0
116.2
15.3
41.7
59.2
75.8 1.2 Service Contractors Marketing and Distribution
9.9
3.3
0.0
3.3
0.0
6.6
2. Food, Drink and Tobacco 17.5 13.0 8.2 4.2 0.6 4.5 3. Chemicals and Non-Metallic Minerals 5.5 3.2 0.0 3.2 0.0 2.3 4. Assembly Type and Related Industries 3.1 3.2 0.0 3.2 0.0 -0.1 5. Distribution 3.6 3.2 0.0 3.2 0.0 0.4 6. All Other Sectors 57.4 21.8 10.2 11.4 0.2 35.6 TOTAL 289.0 163.9 33.7 70.2 60.0 125.1 1 9 9 8
1. Petroleum Industries 173.3 104.7 16.8 44.9 43.0 68.6 1.1 Mining, Exploration and Production,
Refineries Petrochemicals 152.2 98.0 15.9 39.1 43.0 54.2
1.2 Service Contractors Marketing and Distribution
21.1 6.7 0.9 5.8 0.0 14.4
2. Food, Drink and Tobacco 15.0 13.9 11.6 0.9 1.4 1.1 3. Chemicals and Non-Metallic Minerals 7.0 4.8 0.0 4.8 0.0 2.2 4. Assembly Type and Related Industries 4.6 4.7 0.0 4.7 0.0 -0.1 5. Distribution 7.8 5.8 0.0 5.8 0.0 2.0 6. All Other Sectors 62.5 50.6 20.7 29.7 0.2 11.9 TOTAL 270.2 184.5 49.1 90.8 44.6 85.7 1 9 9 9
1. Petroleum Industries 243.2 129.0 15.9 84.5 28.6 114.2 1.1 Mining, Exploration and Production,
Refineries Petrochemicals
210.6
115.1
15.9
70.6
28.6
95.5 1.2 Service Contractors Marketing and Distribution
32.6
13.9
0.0
13.9
0.0
18.7
2. Food, Drink and Tobacco 17.2 13.4 10.5 1.9 1.0 3.8 3. Chemicals and Non-Metallic Minerals 6.7 3.8 0.0 3.8 0.0 2.9 4. Assembly Type and Related Industries 3.9 3.8 0.2 3.8 0.0 0.1 5. Distribution 3.6 4.1 0.2 3.9 0.0 -0.5 6. All Other Sectors 64.3 33.3 22.8 10.3 0.2 31.0 TOTAL 338.9 187.4 49.4 108.2 29.8 151.5 2 0 0 0
1. Petroleum Industries 437.9 270.7 107.7 134.4 28.6 167.2 1.1 Mining, Exploration and Production,
Refineries Petrochemicals
423.4
254.8
107.7
118.5
28.6
168.6 1.2 Service Contractors Marketing and Distribution
14.5
15.9
0.0
15.9
0.0
-1.4
2. Food, Drink and Tobacco 31.8 54.2 16.6 2.5 35.1 -22.4 3. Chemicals and Non-Metallic Minerals 3.7 3.1 0.5 2.6 0.0 0.6 4. Assembly Type and Related Industries -16.7 2.8 0.0 2.8 0.0 -19.5 5. Distribution 4.7 4.2 0.0 4.1 0.1 0.5 6. All Other Sectors 71.9 52.5 33.8 17.2 1.5 19.4 TOTAL 533.3 387.5 158.6 163.6 65.3 145.8
TABLE 5BPRIVATE SECTOR - INVESTMENT INCOME OF DIRECT INVESTMENT ENTERPRISES
IN TRINIDAD AND TOBAGO BY SECTOR OF ACTIVITY, 1997 - 2004/US - $Mn/

The Balance of Payments of Trinidad and Tobago, 2004
Statistical Tables 27
REMITTANCES ABROAD Estimated Item Total Total Dividends Interest Profits Retained
Profit 2 0 0 1
1. Petroleum Industries 412.5 209.7 87.0 93.6 29.1 202.8 1.1 Mining, Exploration and Production,
Refineries Petrochemicals
383.2
203.8
87.0
87.7
29.1
179.4 1.2 Service Contractors Marketing and Distribution
29.3
5.9
0.0
5.9
0.0
23.4
2. Food, Drink and Tobacco 20.0 38.9 16.7 1.7 20.5 -18.9 3. Chemicals and Non-Metallic Minerals 1.0 0.7 0.5 0.0 0.2 0.3 4. Assembly Type and Related Industries 12.2 6.6 6.6 0.0 0.0 5.6 5. Distribution 0.0 0.0 0.0 0.0 0.0 0.0 6. All Other Sectors 22.1 44.3 31.9 11.0 1.4 -22.2 TOTAL 467.8 300.2 142.7 106.3 51.2 167.6 2 0 0 2
1. Petroleum Industries 295.3 142.6 34.9 92.2 15.5 152.7 1.1 Mining, Exploration and Production,
Refineries Petrochemicals 241.1 125.9 34.9 75.5 15.5 115.2
1.2 Service Contractors Marketing and Distribution
54.2 16.7 0.0 16.7 0.0 37.5
2. Food, Drink and Tobacco 36.4 33.1 20.4 3.6 9.1 3.3 3. Chemicals and Non-Metallic Minerals 17.9 18.2 12.6 0.0 5.6 -0.3 4. Assembly Type and Related Industries 9.5 2.3 1.6 0.0 0.7 7.2 5. Distribution 7.4 10.4 6.7 0.8 2.9 -3.0 6. All Other Sectors 7.2 22.5 14.0 2.2 6.3 4.7 TOTAL 393.7 229.1 90.2 98.8 40.1 164.6 2 0 0 3
1. Petroleum Industries 536.6 195.4 58.7 111.5 25.2 341.2 1.1 Mining, Exploration and Production,
Refineries Petrochemicals
403.3
155.1
39.8
98.2
17.1
248.2 1.2 Service Contractors Marketing and Distribution
133.3
40.3
18.9
13.3
8.1
93.0
2. Food, Drink and Tobacco 0.3 0.0 0.0 0.0 0.0 0.0 3. Chemicals and Non-Metallic Minerals 2.9 7.8 5.5 0.0 2.3 -4.9 4. Assembly Type and Related Industries 19.7 22.8 12.9 4.2 5.7 -3.1 5. Distribution 15.0 9.2 6.4 0.0 2.8 5.8 6. All Other Sectors 40.0 13.4 2.8 9.7 0.9 26.6 TOTAL 614.5 248.6 86.3 125.4 36.9 365.9 2 0 0 4
1. Petroleum Industries 456.3 223.7 41.3 155.1 27.3 232.6 1.1 Mining, Exploration and Production,
Refineries Petrochemicals
361.2
180.4
34.6
125.4
20.4
180.8 1.2 Service Contractors Marketing and Distribution
95.1
43.3
6.7
29.7
6.9
51.8
2. Food, Drink and Tobacco 0.8 0.8 0.0 0.0 0.8 0.0 3. Chemicals and Non-Metallic Minerals 5.4 5.4 1.3 0.2 3.9 0.0 4. Assembly Type and Related Industries 14.4 11.5 9.7 0.0 1.8 2.9 5. Distribution 6.7 5.2 0.0 0.6 4.6 1.5 6. All Other Sectors 43.7 27.8 14.7 0.2 12.9 15.9 TOTAL 527.3 174.4 67.0 156.1 51.3 252.9
TABLE 5B (CONT’D)PRIVATE SECTOR - INVESTMENT INCOME OF DIRECT INVESTMENT ENTERPRISES
IN TRINIDAD AND TOBAGO BY SECTOR OF ACTIVITY, 1997 - 2004/US - $Mn/
The Balance of Payments of Trinidad and Tobago, 2004
28 Review of the Balance of Payments
Item 1998 1999 2000 2001 2002 2003 2004
(1) (2) (3) (4) (5) (6) (7)
CREDIT
1. Receipts from International
Institutions 7.9 8.9
8.8 8.7 12.9 11.5 11.4
2. Receipts from Foreign Diplomatic
Agencies 1.8 1.9 1.8 1.9 1.9 1.8 1.8
3. Signature Bonuses 88.4 0.0 0.0 29.8 24.1 0.0 0.0
TOTAL 98.1 10.8 10.6 40.4 38.9 13.3 13.2
DEBIT
4. Central Government - Diplomatic
and Other Foreign Expenditures 8.9 16.9 20.4 23.6 26.2 30.9 51.6
5. Payments to International
Institutions 11.7 4.0 4.1 7.3 6.5 5.5 5.6
TOTAL 20.6 20.9 24.5 30.9 32.7 36.4 57.2
Net Balance 77.5 -10.1 -13.9 9.5 6.2 -23.1 -44.0
TABLE 6OTHER GOVERNMENT, 1998-2004
/US - $Mn/
The Balance of Payments of Trinidad and Tobago, 2004
Statistical Tables 29
Item 1998 1999 2000 2001 2002 2003
2004 (1) (2) (3) (4) (5) (6) (7)
CREDIT
1. Advertising 3.1 4.1 2.9 3.8 3.1 2.2 8.9
2. Agents Fees 6.5 6.0 7.1 6.0 7.7 9.1 11.5
3. Oil processing fees 10.5 2.2 1.0 1.0 1.1 0.7 2.0
4. Charter Hire 0.0 0.0 0.0 0.0 0.0 0.0 0.0
5. Other 24.2 26.8 30.7 35.8 12.0 16.8 20.5
TOTAL 44.3 39.1 40.7 46.6 23.9 28.8 42.9
DEBIT
6. Personal Income 1.3 1.5 1.5 1.5 1.5 1.8 1.9
7. Management Fees 2.6 1.5 0.7 1.0 0.1 1.5 0.1
8. Commissions 1.5 1.8 1.8 1.8 1.8 1.7 1.7
9. Royalties, Patents & similar Fees 0.2 0.1 0.3 0.1 0.1 3.2 1.3
10. Advertising 1.0 1.1 1.1 1.1 1.1 0.8 3.5
11. Rentals 0.8 0.9 0.9 1.0 0.9 1.7 1.6
12. Charter Hire 0.3 0.3 0.3 0.3 0.4 0.1 0.1
13. Other Misc. Payments 34.6 27.0 30.7 51.0 25.1 52.1 39.7
TOTAL 38.4 34.2 37.3 57.8 31.0 62.9 49.9
Net Balance 5.9 4.9 3.4 -11.2 -7.1 -34.1 -7.0
TABLE 7OTHER SERVICES, 1998-2004
/US - $Mn/

The Balance of Payments of Trinidad and Tobago, 2004
30 Review of the Balance of Payments
Item 1998 1999 2000 2001 2002 2003 2004 (1) (2) (3) (4) (5) (6) (7)
CREDIT
1. Migrants Transfers 1.1 1.1
1.1 1.1 1.1 1.1 1.1
2. Remittances to Institutions 0.4 0.7
1.4 7.3 0.8 0.7 1.1
3. Remittances to Individuals 46.4 54.4
38.1 40.9 79.1 86.8 86.9
TOTAL 47.9 56.2
40.6 49.3 81.0 88.6 89.1
DEBIT
4. Remittances Abroad 32.0 28.4
22.1 25.3 36.5 38.3 37.6
4.1 Maintenance 1.1 1.3
1.3 1.5 1.3 1.3 1.3
4.2 Gifts and Donations 18.1 12.7
6.8 6.9 7.8 5.9 1.8
4.3 Emigrants Transfers 3.8 4.0
4.9 6.2 5.3 7.9 5.0
4.4 Legacies and Settlements of Trust
2.2
2.6
2.6
2.5
2.7
2.6
2.6
4.5 Other Remittances 6.8 7.8
6.5 8.2 19.4 20.6 26.9
5. Payments to Foreign Diplomatic Agencies (Visas)
n.a.
0.2
0.2
0.2
0.2
0.1
0.2
TOTAL 32.0 28.6
22.3 25.5 36.6 38.4 37.8
Net Balance
15.9
27.6
18.3
23.8 44.4 50.2
51.3
TABLE 8UNREQUITED TRANSFERS: PRIVATE, 1998-2004
/US - $Mn/

The Balance of Payments of Trinidad and Tobago, 2004
Statistical Tables 31
Item 1998 1999 2000 2001 2002 2003 2004 (1) (2) (3) (4) (5) (6) (7)
CREDIT 1. Withholding taxes 10.6 12.5
23.1 14.5 15.0 12.0 9.2
2. Remittances by other Gov'ts 0.1 0.2
0.2 0.2 0.2 0.2 0.3
TOTAL 10.7 12.7 23.3 14.7 15.2 12.2 9.5
DEBIT
4. Contributions to international institutions
3.3
1.7
2.5
3.8
3.9
2.6
3.3
4.1 United Nations Organizations 0.8 0.6 0.2 0.2 0.2 0.4 0.0
4.2 Regional Bodies 1.7 0.5 1.9 3.1 3.4 1.7 2.8
4.3 Organization of American States
0.1
0.1
0.1
0.1
0.0
0.0
0.0
4.4 Commonwealth Bodies 0.4 0.3 0.2 0.3 0.3 0.2 0.0
4.5 Other international institutions 0.3 0.2 0.2 0.1 0.1 0.3 0.5
5. Pensions paid abroad 1.0 0.9 1.2 1.3 1.3 1.2 1.3 6. Other miscellaneous grants 0.0 0.0 0.0 0.0 0.0 0.0 0.0
TOTAL 4.3 2.6 3.7 5.1 5.1 3.8 4.6 Net Balance
6.4
10.2
19.6
9.6 10.1 8.4
4.9
TABLE 9UNREQUITED TRANSFERS: GOVERNMENT, 1998-2004
/US - $Mn/

The Balance of Payments of Trinidad and Tobago, 2004
32 Review of the Balance of Payments
ITEM 1998 1999 2000 2001 2002 2003 2004 (1) (2) (3) (4) (5) (6) (7)
1. Petroleum Industries 599.7 467.7 613.7 816.3 738.2 738.5 913.4
1.1 Mining, Exploration and Production, Refineries, Petrochemicals
585.3
449.0
613.9
787.2
694.8
710.3
892.6
1.2 Service Contractors, Marketing and Distribution
14.4
18.7
-0.2
29.1
43.4
28.2
46.2
2. Food, Drink and Tobacco 9.1 3.8 -21.3
-18.1 3.6 4.8 5.8
3. Chemicals and Non-Metallic Minerals
2.2 2.9 1.8 -0.3 1.5 1.9 2.3
4. Assembly Type and Related Industries
-0.1 0.1 -18.4 5.5 8.1 5.3 8.7
5. Distribution 2.0 -0.5 1.7
0.5 -0.7 2.2 2.7
6. All Other Sectors 119.0 169.3 102.0
31.0 40.0 55.6 39.8
TOTAL 731.9 643.3 679.5
834.9 790.7 808.3 998.1
TABLE 10 ADIRECT FOREIGN INVESTMENT IN PRIVATE
SECTOR ENTERPRISES BY SECTOR OF ACTIVITY,1998- 2004/US - $Mn/
“All other sectors”, includes textiles, printing, publishing and paper convertors, miscellaneous manufacturing, construction, hotels,transportation and business services, etc., commercial banks, insurance companies and other financial institutions.

The Balance of Payments of Trinidad and Tobago, 2004
Statistical Tables 33
TABLE 10 BDIRECT FOREIGN INVESTMENT BY COUNTRY OF ORIGIN, 1998 - 2004
/US - $Mn/
TABLE 10 CCOMPONENTS OF DIRECT FOREIGN INVESTMENT, 1998 - 2004
/US - $Mn
Country 1998 1999 2000 2001 2002 2003 2004(1) (2) (3) (4) (5) (6) (7)
U.S.A. 524.8 274.6 315.9 372.3 352.7 375.8 697.5
U.K. 99.6 232.1 254.7 307.1 290.9 297.4 169.9
Canada 10.9 9.3 1.8 7.1 7.2 11.7 12.6
Japan 0.0 0.1 0.0 0.1 0.1 0.2 0.1
India 34.0 57.0 11.1 20.8 19.8 20.1 24.2
Other 50.7 62.7 82.0 91.1 85.2 67.5 51.3
TOTAL 731.9 643.3 679.5 834.9 790.7 808.3 998.1
Item 1998 1999 2000 2001 2002 2003 2004(1) (2) (3) (4) (5) (6) (7)
Direct Investment 731.9 643.3 679.5 834.9 790.7 808.3 998.1
Equity Capital 611.1 488.5 549.2 715.6 639.8 451.2 856.9
Reinvested Earnings 85.7 151.5 145.8 167.6 164.6 365.9 152.9
Divestment 6.0 5.0 5.0 0.0 0.0 0.0 0.0
Other 29.1 -1.7 -20.5 -48.3 -13.7 -8.8 -11.7

The Balance of Payments of Trinidad and Tobago, 2004
34 Review of the Balance of Payments
*Once rescheduled, the external debt of the state enterprises becomes the external liability of the central government. 1 External debt of state enterprises and public utilities guaranteed by the government. 2 Non-guaranteed debt of state enterprises and public utilities. 3A portion of this debt is no longer defined as government – guaranteed debt.
END OF PERIOD
SECTOR 1998 1999 2000r 2001r 2002r 2003r 2004r CENTRAL GOVERNMENT
(1) (2) (3) (4) (5) (6) (7)
Receipts 58.7 294.3 401.9 52.5 42.8 86.5 23.4 of which: Leases 0.0 0.0 0.0 0.0 0.0 0.0 0.0 Amortization 163.6 170.6 268.9 61.1 68.6 89.7 226.1 of which: Leases 9.4 11.1 5.8 0.0 0.0 0.0 0.0 Debt Conversion 0.0 0.0 0.0 0.0 0.0 0.0 0.0 Rescheduling 0.0 0.0 0.0 0.0 0.0 0.0 0.0 Valuation Adjustment 20.7 -2.5 -16.9 -6.2 7.9 6.0 0.0 Balance Outstanding 1,313.2 1,434.4 1,532.2 1,517.4 1,499.5 1,502.3 1,299.6 of which: Leases 79.7 50.9 0.0 0.0 0.0 0.0 0.0 Interest 114.8 96.2 107.4 121.4 129.7 116.7 109.9 GOVERNMENT GUARANTEED1 Receipts 0.0 0.0 0.0 0.0 0.0 0.0 0.0 Amortization 6.0 4.9 1.4 0.0 0.0 0.0 0.0 Rescheduling* 0.0 0.0 0.0 0.0 0.0 0.0 0.0 Balance Outstanding 52.6 45.3 42.6 41.6 42.6 42.5 43.0 Interest 1.7 0.8 0.4 0.0 0.0 0.0 0.0 NON-GOVERNMENT GUARANTEED2 Receipts 0.0 0.0 0.0 0.0 0.0 0.0 0.0 Amortization 0.0 0.0 0.0 0.0 0.0 0.0 0.0 Balance Outstanding 103.9 103.8 103.8 103.73 3.8 3.8 4.0 Interest 0.0 0.0 0.0 0.0 0.0 0.0 0.0 CENTRAL BANK Receipts 0.0 0.0 0.0 0.0 0.0 0.0 0.0 Amortization 5.0 0.2 0.0 0.0 0.0 0.0 0.0 Balance Outstanding 1.6 1.3 0.0 0.0 0.0 0.0 0.0 Interest 0.0 0.0 0.0 0.0 0.0 0.0 0.0 TOTAL Receipts 58.7 294.3 383.6 26.6 17.7 26.2 23.4 Amortization 174.6 175.7 270.3 61.1 68.6 89.7 226.1 of which: Debt Conversion 0.0 0.0 0.0 0.0 0.0 0.0 0.0 Rescheduling 0.0 0.0 0.0 0.0 0.0 0.0 0.0 Valuation Adjustment 22.2 -4.9 -18.3 7.3 9.0 7.1 0.3 Balance Outstanding 1,471.1 1,584.8 1,680.4 1,665.9 1,549.1 1,553.0 1,350.6 Interest 116.5 97.0 107.8 121.4 129.7 116.7 109.9
r-revised
TABLE 11PUBLIC SECTOR EXTERNAL DEBT, 1998-2004
/US - $Mn/

The Balance of Payments of Trinidad and Tobago, 2004
Statistical Tables 35
CENTRAL BANK of which
END OF PERIOD
Foreign Assets
IMF Reserve Tranche Position
SDR
Holdings
Foreign
Liabilities
International
Reserves (1-4)
Central
Government
Net Official Reserves
(5+6) (1) (2) (3) (4) (5) (6)
(7)
1997 702.9 0.0 0.1 21.3 681.6 3.3 684.8 1998 779.4 0.0 0.1 17.5 761.9 3.6 765.5 1999 964.0 0.0 0.0 17.8 946.2 3.6 949.8 2000 1,405.4 0.0 0.1 17.5 1,387.8 0.1 1,387.9 2001 1,875.9 0.0 0.2 17.5 1,858.4 0.1 1,858.5 2002 1,923.5 0.0 0.3 16.2 1,907.3 0.1 1,907.4 2003 2,257.7 0.0 1.1 16.2 2,241.5 0.1 2,241.6 2004 2,992.9 0.0 1.9 16.2 2,976.7 0.1 2,976.8
COMMERCIAL BANKS
END OF PERIOD
Foreign Assets
Foreign
Liabilities
Net Foreign
Position (8-9)
Gross Foreign Assets
(1+6+8)
Total Foreign
Liabilities (4+9)
Net Foreign
Position (11-12)
(8) (9) (10) (11) (12) (13)
1997 414.1 244.6 169.5 1,120.2 265.9 854.3 1998 401.5 182.2 219.3 1,184.5 199.7 984.8 1999 422.3 276.7 145.6 1,389.9 294.5 1,095.4 2000 504.2 272.5 231.7 1,909.7 290.0 1,619.7 2001 579.2 604.6 -25.4 2,455.2 622.1 1,833.1 2002 670.4 616.5 53.9 2,594.0 632.6 1,961.4 2003 1,002.2 1,042.2 -39.9 3,260.3 1,058.3 2,202.0 2004 1,216.2 743.6 472.6 4,209.2 759.8 3,449.4
TABLE 12FOREIGN RESERVES, 1998- 2004
/US-$Mn

The Balance of Payments of Trinidad and Tobago, 2004
36 Review of the Balance of Payments
Item 1998 1999 2000 2001 2002 2003 2004 (1) (2) (3) (4) (5) (6) (7)
ASSETS
1. Foreign Notes & Coins 10.8 15.3 13.3 11.0 11.1 11.5 13.4
2. Balances due from
Banks abroad 166.3 138.0 247.4 279.6 322.6 406.3 430.5
3. Investments 105.5 169.5 150.0 193.0 179.2 266.0 237.6
4. Loans to Non-residents 25.8 54.9 39.5 52.3 78.3 60.9 145.3
5. Other 93.1 44.6 54.0 43.3 79.2 257.5 389.4
TOTAL 401.5 422.3 504.2 579.2 670.4 1,002.2 1,216.2
LIABILITIES
7. Balances due to Banks abroad 109.4 205.6 201.1 382.5 362.7 490.6 362.9
8. Non-residents' deposits 50.9 45.4 51.9 84.1 147.2 370.8 173.3
9. Other 21.9 25.7 19.5 138.0 106.6 180.8 207.4
SUB-TOTAL 182.2 276.7 272.5 604.6 616.5 1,042.2 743.6
10. Foreign Share Capital 0.0 0.0 0.0 0.0 0.0 0.0 0.0
TOTAL 182.2 276.7 272.5 604.6 616.5 1,042.2 743.6
Net Balance 219.3 145.6 231.7 -25.4 53.9 -40.0 472.6
TABLE 13COMMERCIAL BANKS - FOREIGN ASSETS
AND LIABILITIES, 1998 - 2004/US - $Mn/

The Balance of Payments of Trinidad and Tobago, 2004
Statistical Tables 37
Period United States Dollar
Canadian Dollar UK Pound Sterling Japanese Yen Euro2
Buying Selling Buying Selling Buying Selling Buying Selling Buying Selling (1) (2) (3) (4) (5) (6) (7) (8) (9) (10)
1998 6.2606 6.2982 4.2003 4.3398 10.3213 10.6453 0.0481 0.0485 3.5149 3.6610 1999 6.2457 6.2997 4.1701 4.3332 10.0375 10.3680 0.0552 0.0557 3.3572 3.4999 2000 6.2503 6.2998 4.1599 4.3188 9.3961 9.7412 0.0581 0.0587 2.8972 3.0426 2001 6.1679 6.2314 3.9397 4.0916 8.7703 9.1134 0.0544 0.0534 5.4881 5.6632 2002 6.1746 6.2473 3.8622 4.0202 9.1236 9.4925 0.0494 0.0501 5.7305 5.9724 2003 6.2314 6.2952 4.3681 4.5563 9.9840 10.4060 0.0538 0.0545 6.8813 7.2050 2004 6.2440 6.2990 4.7107 4.9058 11.1953 11.6742 0.0575 0.0583 7.5991 7.9244 January 6.2342 6.2997 4.6947 4.9163 11.1068 11.6117 0.0586 0.0593 7.7029 8.0356 February 6.2336 6.2998 4.6031 4.8075 11.4113 11.9249 0.0586 0.0592 7.7228 8.0878 March 6.2468 6.2998 4.5919 4.7930 11.2068 11.6536 0.0574 0.0581 7.4859 7.8154
QTR1 6.2386 6.2997 4.6306 4.8397 11.2327 11.7192 0.0582 0.0589 7.6305 7.9709
April 6.2457 6.2947 4.5588 4.7418 10.9970 11.4811 0.0579 0.0586 7.3319 7.6561 May 6.2381 6.2995 4.4444 4.6267 10.9223 11.3802 0.0555 0.0560 7.3367 7.6526 June 6.2513 6.2993 4.5013 4.6909 11.2025 11.6454 0.0570 0.0576 7.4110 7.7368 QTR2 6.2451 6.2979 4.5015 4.6865 11.0432 11.5046 0.0568 0.0574 7.3607 6.6827
July 6.2452 6.2976 4.6416 4.8149 11.2439 11.7345 0.0570 0.0576 7.4907 7.8303 August 6.2410 6.2990 4.6597 4.8493 11.1153 11.5977 0.0565 0.0572 7.4622 7.7558 September 6.2523 6.2996 4.7411 4.9380 10.9626 11.4106 0.0541 0.0573 7.4954 7.7686 QTR3 6.2461 6.2987 4.6795 4.8657 11.1116 11.5859 0.0559 0.0574 7.4830 7.7863
October 6.2419 6.2997 4.8968 5.1039 11.0431 11.4960 0.0573 0.0579 7.6330 7.9529 November 6.2429 6.2994 5.1294 5.3329 11.3593 11.8545 0.0596 0.0603 7.9305 8.2471 December 6.2542 6.2998 5.0425 5.2327 11.7458 12.2742 0.0601 0.0609 8.1664 8.5343 QTR4 6.2465 6.2996 5.0215 5.2216 11.3888 11.8816 0.0597 0.0593 7.9137 8.2493
TABLE 14T &T DOLLAR EXCHANGE RATES FOR SELECTED CURRENCIES1
1 Monthly, Quarterly, and Annual rates are averages for the respective month, quarter, and year.2 From January 2002 the Deutsche Mark, became the Euro currency.

The Balance of Payments of Trinidad and Tobago, 2004
38 Review of the Balance of Payments
Period Issued Borrower Amount Period of Interest
(face value) US $Mn.
Maturity Rates
2 0 0 0 March Government of Grenada 30.00 12 yrs. 9.50% (fixed)
2 0 0 1 January Government of St. Kitts – Nevis 13.14 10 yrs. 10.50% (fixed)
April Government of St. Lucia 7.19 15 yrs. 9.90% (fixed)
May St. Christopher Air and Sea Port 7.90 15 yrs. 10.00% (fixed)
Government of St. Kitts – Nevis 12.00 10 yrs. 10.50% (fixed)
June Jamaica Public Services Corporation 50.00 5 yrs. 11.00% (fixed)
Nevis Island Administration 10.00 10 yrs. 10.50% (fixed)
August Jamaica Public Services Corporation 50.00 5 yrs. 10.75% (fixed)
November BET Building Joint Venture 8.74 10 yrs. 9.00% (fixed)
December Government of St. Kitts – Nevis 7.28 12 yrs. 9.00% (fixed)
Development Finance Corporation of
Belize
40.00 3 yrs. 10.75% (fixed)
2 0 0 2 March Government of St Christopher/Nevis 30.00 10 yrs. 9.00% (fixed)
August Government of St. Lucia 5.05 15 yrs. 7.25% (fixed)
Government of St. Lucia 25.00 10 yrs. 7.75% (fixed)
Government of Grenada 10.00 10 yrs. 9.25% (fixed)
TABLE 15PRIMARY BOND MARKET ACTIVITYREGIONAL BONDS ISSUED 2000-2004

The Balance of Payments of Trinidad and Tobago, 2004
Statistical Tables 39
Period Issued Borrower Amount Period of Interest
(face value) US $Mn.
Maturity Rates
2 0 0 3 February Government of St. Lucia 15.00 10 yrs. 7.75% (fixed)
March EGE Haina (Dominican Republic) 104.00 7 yrs. 10.00% (fixed)
Government of St. Lucia 41.00 10 yrs. 7.25% (fixed)
Government of St. Kitts/Nevis 47.90 10 yrs. 7.50% (fixed)
Housing Authority of Grenada 17.36 1 yr. 11.00% (fixed)
SETAR N.V. of Aruba 50.30 10 yrs. 7.00% (fixed)
April JPSCO of Jamaica 30.00 7 yrs. 10.50% (fixed)
May Mossel Jamaica Limited 15.00 7 yrs. Floating rate of weighted-
average T-Bill Yield +2.5%
June St. Vincent and the Grenadines 17.36 10 yrs. 7.40% (fixed)
St. Georges University, Grenada 10.00 10 yrs. 8.75% (fixed)
July GEO F. Huggins & Co. Grenada 10.00 8 yrs. 10.50% (fixed)
Government of Belize 25.00 10 yrs. 8.95% (fixed)
September Digicell Eastern Caribbean Enterprise 10.00 7 yrs. Not Available
Port St. Charles Resort 11.75 5 yrs. 7.20% (fixed)
(Barbados) 24.25 5 yrs. 7.10% (fixed)
October Government of Jamaica 50.29 5 yrs. 8.00% (fixed)
December St. Kitts/Nevis Anguilla National
Bank
10.00 10 yrs. 8.00% (fixed)
Nevis Island Administration 10.00 5 yrs. 8.00% (fixed)
Hidroelectrica Platanar SA 10.00 6 yrs. 7.48% (fixed)
TABLE 15 (CONT’D)PRIMARY BOND MARKET ACTIVITYREGIONAL BONDS ISSUED 2000-2004
The Balance of Payments of Trinidad and Tobago, 2004
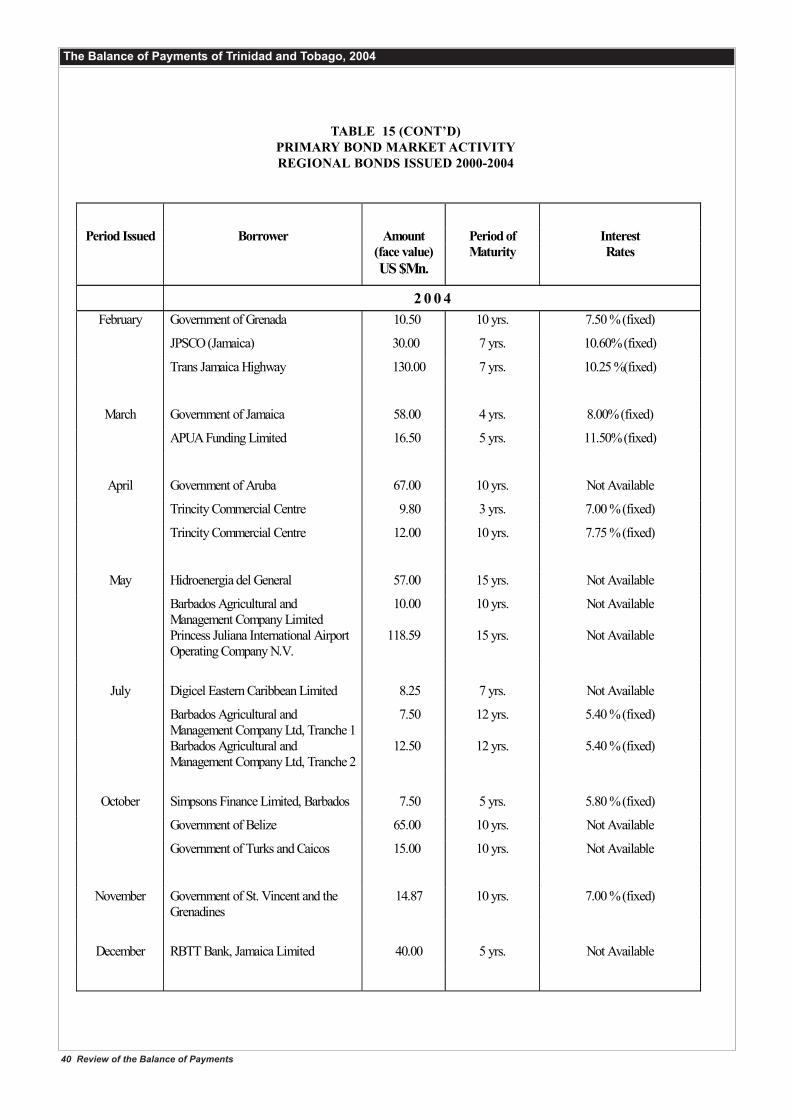
40 Review of the Balance of Payments
Period Issued Borrower Amount Period of Interest
(face value) US $Mn.
Maturity Rates
2 0 0 4 February Government of Grenada 10.50 10 yrs. 7.50 % (fixed)
JPSCO (Jamaica) 30.00 7 yrs. 10.60% (fixed)
Trans Jamaica Highway 130.00 7 yrs. 10.25 %(fixed)
March Government of Jamaica 58.00 4 yrs. 8.00% (fixed)
APUA Funding Limited 16.50 5 yrs. 11.50% (fixed)
April Government of Aruba 67.00 10 yrs. Not Available
Trincity Commercial Centre 9.80 3 yrs. 7.00 % (fixed)
Trincity Commercial Centre 12.00 10 yrs. 7.75 % (fixed)
May Hidroenergia del General 57.00 15 yrs. Not Available
Barbados Agricultural and Management Company Limited
10.00 10 yrs. Not Available
Princess Juliana International Airport Operating Company N.V.
118.59 15 yrs. Not Available
July Digicel Eastern Caribbean Limited 8.25 7 yrs. Not Available
Barbados Agricultural and Management Company Ltd, Tranche 1
7.50 12 yrs. 5.40 % (fixed)
Barbados Agricultural and Management Company Ltd, Tranche 2
12.50 12 yrs. 5.40 % (fixed)
October Simpsons Finance Limited, Barbados 7.50 5 yrs. 5.80 % (fixed)
Government of Belize 65.00 10 yrs. Not Available
Government of Turks and Caicos 15.00 10 yrs. Not Available
November Government of St. Vincent and the Grenadines
14.87 10 yrs. 7.00 % (fixed)
December RBTT Bank, Jamaica Limited 40.00 5 yrs. Not Available
TABLE 15 (CONT’D)PRIMARY BOND MARKET ACTIVITYREGIONAL BONDS ISSUED 2000-2004

The Balance of Payments of Trinidad and Tobago, 2004
Appendices 41
APPENDICES
The Balance of Payments of Trinidad and Tobago, 2004
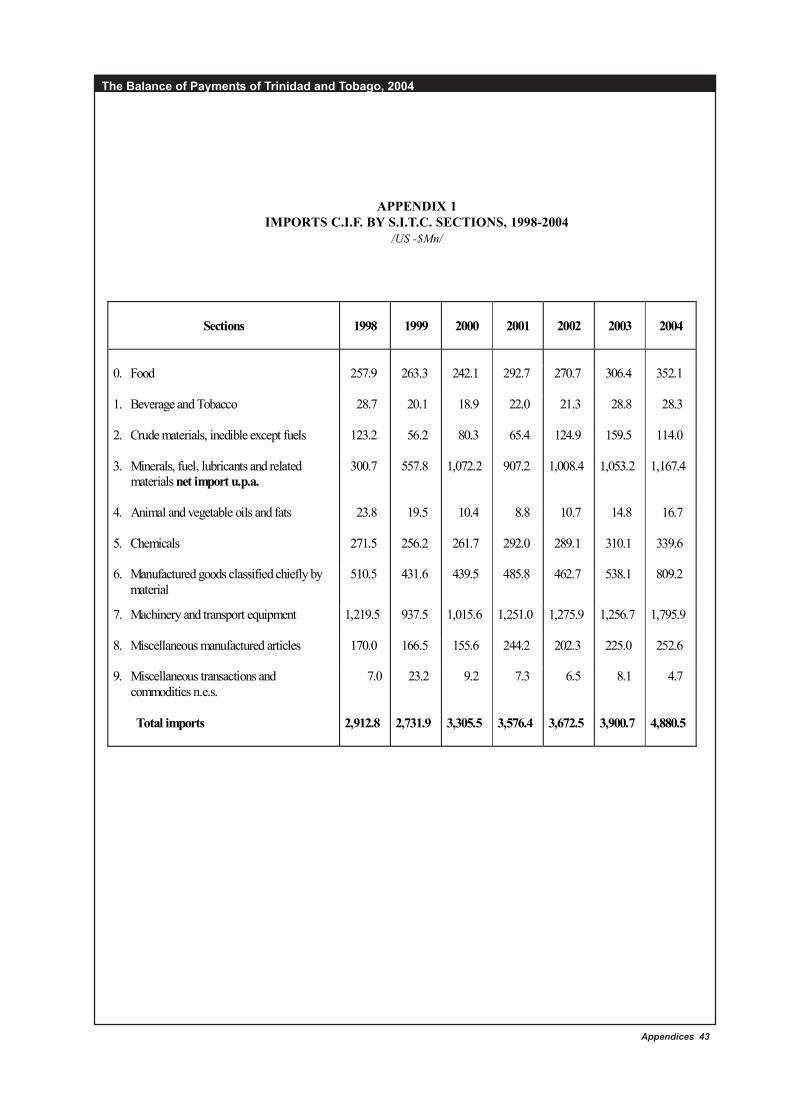
Appendices 43
Sections
1998
1999
2000
2001
2002
2003
2004
0. Food 257.9 263.3 242.1 292.7 270.7 306.4 352.1
1. Beverage and Tobacco 28.7 20.1 18.9 22.0 21.3 28.8 28.3
2. Crude materials, inedible except fuels 123.2 56.2 80.3 65.4 124.9 159.5 114.0
3. Minerals, fuel, lubricants and related
materials net import u.p.a.
300.7 557.8 1,072.2 907.2 1,008.4 1,053.2 1,167.4
4. Animal and vegetable oils and fats 23.8 19.5 10.4 8.8 10.7 14.8 16.7
5. Chemicals 271.5 256.2 261.7 292.0 289.1 310.1 339.6
6. Manufactured goods classified chiefly by material
510.5 431.6 439.5 485.8 462.7 538.1 809.2
7. Machinery and transport equipment 1,219.5 937.5 1,015.6 1,251.0 1,275.9 1,256.7 1,795.9
8. Miscellaneous manufactured articles 170.0 166.5 155.6 244.2 202.3 225.0 252.6
9. Miscellaneous transactions and commodities n.e.s.
7.0 23.2 9.2 7.3 6.5 8.1 4.7
Total imports 2,912.8 2,731.9 3,305.5 3,576.4 3,672.5 3,900.7 4,880.5
APPENDIX 1IMPORTS C.I.F. BY S.I.T.C. SECTIONS, 1998-2004
/US -$Mn/

The Balance of Payments of Trinidad and Tobago, 2004
44 Review of the Balance of Payments
Sections
1998
1999
2000
2001
2002
2003
2004
0. Food 151.2 149.6 153.3 145.0 144.6 125.2 141.0
1. Beverage and Tobacco 88.1 78.3 85.6 94.6 101.1 101.1 83.1
2. Crude materials, inedible except fuels 7.8 6.5 6.7 9.1 9.4 11.7 15.6
3. Minerals, fuel, lubricants and related materials net export u.p.a. 914.0 1,462.7 2,739.1 2,549.9 2,318.9 3,459.4 3,800.3 of which exports of crude 386.7 366.5 573.2 451.8 601.4 442.9 821.6 of which exports u.p.a. 65.8 33.1 15.2 9.7 9.8 11.0 10.2
4. Animal and vegetable oils and fats 9.2 5.6 3.6 5.0 5.9 6.0 7.3
5. Chemicals 500.9 536.0 743.5 815.2 647.1 906.6 1,521.6
6. Manufactured goods classified chiefly
by material
372.9 349.4 381.5 435.9 477.5 448.2 575.2
7. Machinery and transport equipment 68.7 104.1 51.1 75.2 93.9 72.1 129.7
8. Miscellaneous manufactured articles 58.4 62.7 63.7 103.8 66.8 63.1 66.7
9. Miscellaneous transactions and commodities n.e.s.
0. 5 0.2 0.7 0.2 0.3 0.6 0.6
Total Exports 2,171.7 2,755.3 4,228.8 4,233.9 3,865.5 5,194.0 6,341.1
APPENDIX 2EXPORTS F.O.B. BY S.I.T.C. SECTIONS, 1998-2004
/US- $Mn/

The Balance of Payments of Trinidad and Tobago, 2004
Appendices 45
AREAS
1998
1999
2000
2001
2002
2003
2004 A. United States of America 1,344.2 1,096.6 1,163.6 1,315.9 1,236.5 1,179.7 1,662.2
B. Commonwealth Non-Caribbean Countries 166.6 196.6 150.3 150.9 256.7 310.8 215.1
1. Australia 23.3 24.4 23.5 26.5 17.4 27.9 19.2 2. New Zealand 7.8 7.5 8.8 11.4 10.5 13.2 17.1 3. Canada 105.1 134.2 86.8 91.7 104.1 116.9 107.9 4. Other *1 30.4 30.5 31.2 21.3 124.7 152.8 70.9
C. Caricom Countries 106.5 131.9 125.7 121.1 92.4 92.2 97.7
1. Jamaica 17.8 18.2 19.5 20.1 17.4 16.8 14.2 2. Guyana 10.7 11.9 14.8 16.3 15.8 22.4 26.0 3. Barbados 24.1 38.2 36.4 23.4 30.7 22.2 22.7 4. Belize 5.0 2.8 3.1 16.1 3.5 5.6 9.8 5. Other *2 48.9 60.8 51.9 45.2 25.0 25.2 25.0
D. Other Commonwealth Caribbean Countries *3 0.0 0.0 0.1 0.0 0.0 0.0 0.0
E. Non-Commonwealth Caribbean Countries *4 62.4 21.5 65.0 29.1 24.4 37.3 108.3
F. European Economic Community *5 412.0 339.1 350.6 642.2 586.7 697.1 1,080.2
G. European Free Trade Association *6 51.0 22.7 30.3 25.6 40.3 40.7 37.6
H. Latin American Free Trade 572.8 605.0 1,061.3 849.9 739.8 824.9 859.4
1. Venezuela 214.8 328.7 610.7 438.1 399.2 264.5 153.5 2. Brazil 82.2 39.1 97.8 200.2 210.2 352.5 511.1 3. Other *7 275.8 237.2 352.9 211.6 130.4 207.9 169.2
I. Central American Common Market *8 15.3 21.6 25.9 27.3 25.6 23.5 21.6
J. Rest of Latin America *9 1.8 1.8 1.6 2.7 3.7 5.4 4.0
K. Rest of the World *10 275.0 315.4 347.1 421.4 676.2 700.1 808.1
Total All Countries 3,007.6 2,752.2 3,321.5 3,586.1 3,682.3 3,911.7 4,894.2
APPENDIX 3DIRECTION OF TRADE
UNADJUSTED IMPORTS (C.I.F.) 1998-2004/US -$Mn

The Balance of Payments of Trinidad and Tobago, 2004
46 Review of the Balance of Payments
AREAS
1998
1999
2000
2001
2002
2003
2004
A. United States of America 826.4 1,097.1 1,849.2 1,779.1 1,803.5 2,785.2 4,471.8
B. Commonwealth Non-Caribbean Countries 20.2 43.6 71.4 110.9 99.7 124.0 112.0
1. Australia 0.9 0.7 1.1 0.9 1.3 2.1 1.8
2. New Zealand 0.0 0.0 0.2 0.1 0.0 19.2 0.0
3. Canada 18.4 42.5 56.4 98.6 92.4 95.4 83.8
4. Other *1 0.9 0.4 13.7 11.3 6.0 7.3 26.4
C. Caricom Countries 656.8 726.7 970.0 1,034.7 770.8 959.0 791.6
1. Jamaica 234.0 242.9 332.7 353.7 294.2 353.6 245.6
2. Guyana 78.5 72.2 93.1 88.4 83.0 149.9 122.4
3. Barbados 122.1 147.1 202.3 267.6 179.5 203.7 213.8
4. Belize 4.9 3.7 5.8 7.4 9.9 6.8 5.0
5. Other *2 216.5 260.8 336.1 317.6 204.2 245.0 204.8
D. Other Commonwealth Caribbean Countries *3 11.8 6.6 22.9 25.8 20.9 78.5 22.0
E. Non-Commonwealth Caribbean Countries *4 270.8 369.2 602.5 572.4 453.5 507.0 448.1
F. European Economic Community *5 140.4 210.2 389.1 230.3 259.4 214.9 223.2
G. European Free Trade Association *6 9.2 6.1 0.2 8.1 5.1 2.3 0.6
H. Latin American Free Trade 217.4 124.4 74.9 134.4 109.5 183.4 191.7
1. Venezuela 54.4 32.1 35.1 51.1 24.1 42.2 17.9 2. Brazil 7.0 15.9 39.6 13.7 18.5 30.8 36.9
3. Other *7 156.0 76.4 0.3 69.6 66.9 110.4 136.9
I. Central American Common Market *8 63.0 106.4 181.3 161.9 114.8 138.3 45.1
J. Rest of Latin America *9 13.6 89.0 12.8 21.6 33.5 42.4 16.1
K. Rest of the World *10 7.8 9.1 69.7 167.9 208.5 55.3 31.0
Total All Countries 2,237.4 2,788.4 4,244.0 4,247.1 3,879.2 5,090.3 6,353.2 Stores/Bunkers for Ships & Aircraft 27.2 27.4 46.3 57.1 40.8 114.6 49.7
GRAND TOTAL 2,264.6 2,815.8 4,290.3 4,304.2 3,920.0 5,204.9 6,452.4
APPENDIX 4DIRECTION OF TRADE
UNADJUSTED EXPORTS (F.O.B.) 1998-2004/US -$Mn/

The Balance of Payments of Trinidad and Tobago, 2004
Appendices 47
1998
1999
2000
2001
2002
2003
2004
CATEGORIES
UNITED STATES OF AMERICA
0. Food and Live Animals 111.1 102.3 83.4 109.0 108.0 114.3 137.7 1. Beverages and Tobacco 1.9 1.6 1.6 2.3 2.4 2.5 3.1 2. Crude Materials inedible except fuels 45.0 30.7 25.5 38.8 39.1 34.1 39.8 3. Minerals, fuel, lubricants & related
materials 23.8 42.6 7.5 31.8 8.0 10.1 52.5 4. Animal and vegetable oils and fats 5.7 5.6 6.0 4.1 5.2 6.7 4.2 5. Chemicals 141.4 129.7 133.9 152.9 146.2 152.9 180.5 6. Manufactured goods classified by
materials 240.8 164.7 162.9 173.9 163.6 166.9 365.6 7. Machinery and transport equipment 682.6 514.8 647.2 683.2 657.2 591.0 772.3 8. Miscellaneous manufactured articles 89.4 86.8 91.1 109.7 103.4 97.8 104.1 9. Miscellaneous transactions and
commodities 2.5 17.8 4.5 10.2 3.4 3.4 2.4
Total All Sections 1,344.2 1,096.6 1,163.6 1,315.9 1,236.5 1,179.7 1,662.2
COMMONWEALTH CARIBBEAN COUNTRIES 0. Food and Live Animals 25.8 22.4 26.2 32.6 31.6 35.5 41.5 1. Beverages and Tobacco 2.3 2.1 3.1 1.8 2.1 5.4 5.4 2. Crude Materials inedible except fuels 2.0 3.0 4.6 10.8 4.7 16.0 15.1 3. Minerals, fuel, lubricants & related
materials 6.7 23.0 23.3 22.2 27.0 11.0 12.9 4. Animal and vegetable oils and fats 0.8 1.6 0.5 0.4 1.2 0.5 0.5 5. Chemicals 13.7 14.5 12.7 12.1 14.6 13.2 11.7 6. Manufactured goods classified by
materials 12.5 10.7 11.1 20.5 6.9 6.7 6.9 7. Machinery and transport equipment 3.7 1.1 0.3 1.1 1.2 0.8 0.4 8. Miscellaneous manufactured articles 4.1 2.8 2.8 3.0 2.6 2.8 3.3 9. Miscellaneous transactions and
commodities 34.9 50.7 41.2 16.6 0.5 0.3 0.0
Total All Sections 106.5 131.9 125.8 121.1 92.4 92.2 97.7
UNITED KINGDOM 0. Food and Live Animals 8.4 10.4 8.9 9.1 10.3 11.3 10.4 1. Beverages and Tobacco 3.9 4.3 5.8 6.9 6.7 8.5 7.2 2. Crude Materials inedible except fuels 0.7 0.5 0.9 1.6 0.7 1.3 1.1 3. Minerals, fuel, lubricants & related
materials 0.1 4.0 4.0 35.1 0.0 0.3 31.2 4. Animal and vegetable oils and fats 0.4 0.6 0.3 0.1 0.0 0.0 0.0 5. Chemicals 35.7 28.8 27.1 22.1 22.7 27.7 35.8 6. Manufactured goods classified by
materials 23.6 18.5 21.8 23.3 16.4 19.5 28.0 7. Machinery and transport equipment 56.6 46.6 36.8 46.1 55.7 49.7 128.1 8. Miscellaneous manufactured articles 18.2 14.1 12.6 13.6 17.7 21.7 23.2 9. Miscellaneous transactions and
commodities 0.6 0.9 0.9 0.7 1.1 0.9 2.9
Total All Sections 148.2 221.8 119.1 158.7 131.3 140.9 244.7
APPENDIX 5IMPORTS BY SECTIONS AND
MAJOR TRADING PARTNERS, 1998-2004/US -$Mn/

The Balance of Payments of Trinidad and Tobago, 2004
48 Review of the Balance of Payments
CATEGORIES 1998
1999
2000
2001
2002
2003
2004
UNITED STATES OF AMERICA
0. Food and Live Animals 19.6 16.0 16.2 13.7 14.7 10.6 9.5 1. Beverages and Tobacco 4.1 5.3 5.9 6.3 6.9 5.7 5.8 2. Crude Materials inedible except fuels 1.2 2.0 2.1 2.7 1.9 1.8 2.3 3. Minerals, fuel, lubricants & related
materials 382.4 583.2 1,216.3 1,007.5 1,155.5 2,010.0 3,001.6 4. Animal and vegetable oils and fats 0.0 0.0 0.0 0.0 0.0 0.0 0.0 5. Chemicals 303.7 353.7 500.5 585.9 428.2 657.0 1,222.3 6. Manufactured goods classified by
materials 90.0 99.9 89.2 124.6 136.3 61.6 178.5 7. Machinery and transport equipment 19.8 31.0 12.3 26.7 49.7 32.3 44.5 8. Miscellaneous manufactured articles 5.5 5.9 6.2 11.6 10.0 6.0 7.0 9. Miscellaneous transactions and
commodities 0.1 0.1 0.5 0.1 0.3 0.2 0.3
Total All Sections 826.4 1,097.1 1,849.2 1,779.1 1,803.5 2,785.2 4,471.8
COMMONWEALTH CARIBBEAN COUNTRIES
0. Food and Live Animals 83.0 85.4 82.7 92.3 86.9 83.4 86.4 1. Beverages and Tobacco 50.2 51.4 57.5 76.3 68.7 65.7 56.8 2. Crude Materials inedible except fuels 2.1 2.0 1.7 1.3 1.7 1.5 1.8 3. Minerals, fuel, lubricants & related
materials 269.8 322.7 552.4 635.6 392.5 600.0 416.6 4. Animal and vegetable oils and fats 8.9 5.4 3.3 4.2 5.2 5.4 6.7 5. Chemicals 47.7 41.2 46.1 49.7 47.3 46.2 57.4 6. Manufactured goods classified by
materials 121.4 115.4 110.8 130.7 128.9 100.4 124.5 7. Machinery and transport equipment 15.3 16.8 15.7 22.1 16.8 15.7 18.5 8. Miscellaneous manufactured articles 39.2 44.1 46.4 48.2 43.6 44.0 44.7 9. Miscellaneous transactions and
commodities 31.0 48.9 76.3 0.1 0.1 75.2 0.2
Total All Sections 668.6 733.3 992.9 1,060.5 791.7 1,037.5 813.6
UNITED KINGDOM
0. Food and Live Animals 28.1 26.2 26.7 20.7 18.8 13.1 28.9 1. Beverages and Tobacco 1.0 1.4 1.2 1.2 1.0 1.6 1.5 2. Crude Materials inedible except fuels 0.7 0.5 0.5 0.5 0.6 0.5 0.4 3. Minerals, fuel, lubricants & related
materials 0.5 0.3 0.3 0.0 0.8 0.0 8.7 4. Animal and vegetable oils and fats 0.0 0.0 0.0 0.0 0.0 0.0 0.0 5. Chemicals 9.9 20.2 42.1 36.9 29.5 37.3 58.4 6. Manufactured goods classified by
materials 1.4 0.3 0.3 0.3 0.1 1.4 0.3 7. Machinery and transport equipment 2.2 15.8 0.5 2.7 2.6 1.7 2.9 8. Miscellaneous manufactured articles 1.2 23.9 0.4 1.3 3.5 1.3 0.5 9. Miscellaneous transactions and
commodities 0.0 0.6 0.0 0.0 0.0 0.0 0.0
Total All Sections 45.0 89.2 72.0 63.6 56.9 56.9 101.6
APPENDIX 6EXPORTS BY SECTIONS AND
MAJOR TRADING PARTNERS, 1998-2004/US -$Mn/

The Balance of Payments of Trinidad and Tobago, 2004
Explanatory Notes 49
EXPLANATORY NOTES
This Balance of Payments report has been designed, as far as possible,along the lines recommended by the International Monetary Fund (IMF) inits manuals and other documents. As such the IMF’s concept of Balanceof Payments is employed as a base from which springs the whole systemappearing in this report.
The IMF, in its Balance of Payments Manual (Fifth Edition - 1993) definesBalance of Payments as “a statistical statement, covering a given period,that is intended to record systematically:
(a) Transactions in goods, services and income between an economyand the rest of the world;
(b) Changes of ownership and other changes in that economy’s monetarygold, special drawing rights, and claims on and liabilities to the restof the world;
(c) Unrequited transfers and counterpart entries that are needed tobalance, in the accounting sense, any entries for the foregoingtransactions and changes which are not mutually offsetting.”
This report highlights the economic transactions occuring between theresidents of Trinidad and Tobago and the rest of the world for the year2004. For analytical purposes, the time series 1998-2003 has also beenpresented. The data presented have been recorded on a calendar year basis.However, information emanating from the private sector has in someinstances been accepted on a financial year basis, no attempt being made atadjustment.
The Balance of Payments system of accounts covers the economic andfinancial transactions of residents of Trinidad and Tobago with the rest ofthe world or non-residents over a given period of time. In this report a non-resident is generally defined as a person or company whose normal placeof residence (or registered office) is outside of Trinidad and Tobago.
Branches and subsidiaries of foreign-owned enterprises, including foreign-owned commercial banks and insurance companies, are regarded as residentinstitutions. Therefore, transactions between such institutions and theirhead offices or parent companies abroad are included as balance of paymentstransactions. Non-resident institutions include local offices of Internationalinstitutions such as the United Nations Organization, foreign diplomaticagencies, and other similar regional institutions and agencies, as thoseoperated by foreign-owned carriers.
In the case of direct investment transactions, a direct investment enterpriseis defined as an enterprise (branch or subsidiary) in which 10% or more ofthe voting stock is held or controlled by non-residents.
In Table 1A - the summary is presented in the form of a set of double entryaccounts, where both sides of each transaction are recorded, one as acredit and the other as a debit. However, as a result of different sources ofdata and inadequate coverage, there will be discrepancies between the two
Period
Definition
Coverage
Summary Tables

The Balance of Payments of Trinidad and Tobago, 2004
50 Explanatory Notes
sides of any transaction. In order to deal with this problem, an item “NetErrors and Omissions” is included to maintain balance between the debitand credit sides. In the case of countries like Trinidad and Tobago, withlarge inflows and outflows of capital emanating primarily from the privatesector, this item “Net Errors and Omissions” may also include unidentifiedflows of private capital. It should be noted that as an empirical rule ofthumb the methodology considers the “Net Errors and Omissions” as largewhen it exceeds the equivalent of 5% of the sum of the gross debit andcredit entries for merchandise.
Table 1B - the Analytic Summary table has been compiled using one versionof the overall balance in which the net foreign position of the commercialbanks is included as international reserves. The rationale behind the use ofthis measure of balance is that the foreign assets held by the commercialbanks are subject to the authorities direct and effective control. However,from 1993 and onwards the commercial banks are classified as part ofprivate sector capital following the change in the Exchange Rate regime inApril 1993.
A. GOODS, SERVICES AND UNREQUITED TRANSFERS
Data on exports f.o.b. (credit) and imports c.i.f. (debit), shown in thisreport, were obtained from a publication of the Central Statistical Office -the Overseas Trade Report, which is compiled from the trade documentsof the Customs Division. Following the IMF stipulation the exports ofcrude petroleum are valued at market prices.
In order to maintain conformity with the IMF’s definition of merchandisetransactions for Balance of Payments purposes, certain adjustments haveto be made to the trade data. The value of ships’ stores and bunkers isincluded in total exports whereas it was previously included in OtherTransportation.
The second adjustment to be made to the trade data to maintain conformitywith the IMF’s definition of merchandise is the deduction of returned exports/imports, of personal baggage and household effects of travellers. Therationale behind this treatment is that no change of ownership has beeneffected and hence these are not exports/imports per se.
The final adjustment reflects an exception to the change of ownershipprinciple above. Exports and imports of crude petroleum and petroleumproducts traded under processing agreements are included in goods althoughno change of ownership has been effected, and only the processing feeaccrues to nationals as a service payment. This fee is recorded in Item A7- Other Services.
Passenger fares (credit) cover the passenger fares and excess baggagereceipts by Trinidad and Tobago (BWIA International) Airways Corporationfrom non-residents.
Passenger fares (debit) cover the passenger fares and excess baggagepayments made by residents to foreign-owned carriers.
Port disbursements (credit) cover all port and cargo receipts from non-resident carriers excluding stores and bunkers which are included inmerchandise.
Item A2 - Transportation
Item A1 - Merchandise

The Balance of Payments of Trinidad and Tobago, 2004
Explanatory Notes 51
Port disbursements (debit) cover all operating expenditure abroad of Trinidadand Tobago (BWIA International) Airways Corporation.
The Credit entries reflect estimated expenditures in Trinidad and Tobago byforeign visitors including students. The estimated expenditure of non-residenttravellers are derived from surveys conducted by the travel section of theC.S.O. and are applied to the number of departing travellers. The numberof foreign students enrolled at UWI and other colleges is applied to theirestimated expenditure obtained from the respective schools. Advances tocrew which were previously taken into account in “Other Transportation”are now classified as “Travel”.
This item includes Trinidad and Tobago's receipts and payments forinternational communications services. Estimates are based on surveys ofthe main providers and from banking records.
Included here are entries for merchandise and non-merchandise insurance.Non-merchandise insurance credits represent foreign premium income andforeign receipts in settlement of re-insurance claims. Non-merchandisedebits are sourced from banking records.
According to IMF specifications, this item covers “Other Government”transactions abroad, that is, transactions of the resident and foreigngovernments and international bodies not included elsewhere. The creditentries record the receipts of residents of Trinidad and Tobago frominternational institutions and diplomatic agencies, while the debit entries reflectthe payments by residents of Trinidad and Tobago to international institutionsand diplomatic agencies. In the corresponding detailed table, (Table 6),data on Item 3: Debit “Central Government - diplomatic and other foreignexpenditures” are sourced from the Comptroller of Accounts.
This item, like the aforementioned “Other Government” is a residual category,comprising flows not recorded elsewhere. Item 3: “Oil Processing Fees”on the credit side of Table 7, represents the service income accruing toresidents from the processing of crude petroleum imported under theprocessing agreement.
Inflows of investment income have been identified as accruing to the CentralBank, the commercial banks, the Central Government and State Enterprisein the form of interest on investments, deposits and Foreign CurrencyAccount balances held abroad.
Outflows of investment income represent interest accruing to foreignersfor loans made to the Central Government, Central Bank, State Enterprises,Commercial Banks, Direct investment firms and other private sectorenterprises.
Substantial outflows of investment income emanate from direct investmententerprises in the form of repatriated dividends, interests, profits and retainedearnings. Profits here refer to sums actually remitted, while retained earningsrefer to sums payable to non-resident shareholders on the basis of theirpercentage shareholding in the company. Data on actual remittances ofdividends, interest and profits are reported by the companies in the Surveyof Direct Foreign Investment Enterprises, while retained earnings arecalculated as the companies’ net profit after tax payable to non-residentsless profits and dividends remitted. The Methodology assumes that these
Item A3 - Travel
Item A8 - Investment Income
Item A5 - Insurance
Item A6 - Other Government
Item A7 - Other Services
Item A4 - Communications

The Balance of Payments of Trinidad and Tobago, 2004
52 Explanatory Notes
retained earnings are remitted abroad (Table 5A - Retained Profits) only tobe reinvested in the company as a capital inflow.
These tables have been designed to provide a counterpart to flows of goods,services and income provided to or received from the rest of the worldwithout any quid pro quo, in an effort to conform to the system of doubleentry bookkeeping. The necessary information has been extracted from theExchange Control records, the records of the Postmaster General, theComptroller of Accounts, Survey of Private Non-profit Institutions, andSurvey of International Organizations.
From 1985, the University of the West Indies has not been treated as anInternational Institution.
B. CAPITAL (EXCLUDING RESERVES AND RELATED ITEMS)
The capital account has been divided into the monetary and non-monetarysectors, each of which has been further disaggregated: the non-monetarysector into the public and private sectors and the monetary sector into thecentral monetary institutions and other institutions. The monetary sectorhas been recorded separately, since these transactions play a prominent rolein the settlement of international transactions.
C. NON-MONETARY SECTOR
Item B11 - Direct Investment in Trinidad and TobagoThe documentation of capital movements, particularly from direct investmententerprises, is of great importance to a developing country like Trinidad andTobago. Note that a direct investment enterprise is defined as an enterprise(branch or subsidiary) in which 10% or more of the voting stock is held orcontrolled by non-residents.
Item B12 - Other Private Sector CapitalThese entries cover loan drawdowns and repayments by direct investmentfirms, other private capital flows identified from the direct foreign investmentsurvey and the survey of local companies.
Item B14 - Loans ReceivedItem B12 reflects the international capital transactions of the Governmentof Trinidad and Tobago in the form of loan drawdowns and repayments onthe external debt, brought to account in the consolidated Fund of theComptroller of Accounts, Investment Division.
Item B15 - Loans to Other Caribbean GovernmentThe debit entries of this item reflect Trinidad and Tobago’s position, inkeeping with the Caribbean policy of regional co-operation, to extend loansdirectly to other Caribbean Governments and indirectly to them via loans toInternational Institutions. On the credit side, the repayments are recorded.These loans are considered as non-reserve assets.
Item B16 - State Enterprises BorrowingThe credit and debit entries are drawings and repayments on external loansby State Enterprises and Statutory Boards. These items were included inPrivate sector capital but are now shown separately for analytical purposes.
Private Sector
Public Sector
Item A9 & A10 - Unrequited Trans-fers Private & Government
The Balance of Payments of Trinidad and Tobago, 2004
Explanatory Notes 53
Item B17 - Other Official Sector AssetsThe entries record changes in the sinking fund investments held againstexternal loans and changes in the public sector’s assets as a result of thenationalization of private enterprises.
Item B18 - Other LiabilitiesThe short-term liabilities of the Central Government comprise increases inliabilities to international institutions mainly in the form of Trinidad andTobago dollars, and issued by the Government in payment of its membershipsubscriptions. Also included are any short term debts incurred by theGovernment as a result of its acquisition of private enterprise.
D. COUNTERPART ITEMSItem D19 - Allocation of Special Drawing RightsThe Special Drawing Rights Account is a facility established within theframework of the IMF in the late 1960’s to provide a supplement to existingreserve assets as and when needed. An agreed amount of Drawing Rightsis issued and allocated to members in proportion to the size of their quotasin the IMF. An allocation is reflected as a credit entry in the capital accountof the Balance of Payments while changes in Special Drawing Right holdings,or the usage of Special Drawing Rights are reflected in the monetary sectionof the table as changes in the official reserves of the country. On January 1,1970 Trinidad and Tobago made its first allocation of $14.8 million and itssecond of $13.48 million on January 1, 1971.
E. FINANCINGAs stated above, the monetary sector, which reflects official transactions,has been recorded separately, since only these transactions are recognizedas accommodating, that is, acting in response to movements in theautonomous transactions. In this report, the reserves of the country includethe foreign balances of (a) the Central Monetary Authority - the CentralBank, (b) the Central Government and (c) the Commercial Banks. However,from 1993 the foreign assets of the commercial banks are no longerconsidered as reserve assets and are therefore reflected in the non-monetarysector. (See Tables 1A and 1B)
The Central Bank performs the functions of (1) custodian of the nation’sreserves and (2) banker of the Government. As such its foreign balancescomprise its reserves assets, held in form of balances and securities, IMFGold Tranche Position and SDR Holdings. IMF Gold Tranche Positionmeasures the extent to which Trinidad and Tobago may draw on the availablegold reserves held by the IMF to finance balance of payments deficits. Thisfigure is regulated by the Articles of the Fund and relates to the Fund quotacontribution of the country. A member’s purchases of currency from theFund must be repaid by repurchases or by the purchase of that member’scurrency by another member. The repayment period is specified. SDRHoldings, as stated above were designed to meet the need, as and when itarises, for a supplement to existing reserve assets.
The Central Government’s foreign balances consists of its investments ofsinking funds and of other funds, for example Special and Trust funds, aswell as cash balances abroad and external investments of the Post OfficeSavings Bank.
1. Change in Reserves

The Balance of Payments of Trinidad and Tobago, 2004
54 Explanatory Notes
The reserve position of the commercial banks (Item B13) is computed asthe change in their net foreign asset position. The liabilities of these bankscomprise the deposits of non-residents, foreign share capital and the netbalances due to head offices and to other banks abroad by Trinidad andTobago banks. The assets cover the net balances held by Trinidad andTobago banks with their head offices and other banks abroad, holdings offoreign notes and coins, foreign securities, commercial bills and loans andadvances made to non-residents.
F. APPENDICES 3 AND 4 - DIRECTION OF TRADE
*1 Includes India, Hong Kong, Ghana, Nigeria, Zimbabwe, Malaysia, Singapore,Pakistan, Sri Lanka, Cyprus, Malta, British Africa, Tanzania, Zambia, Kenya,Uganda, Myanmar, Botswana, Lesotho, Fiji, Bangladesh, Western Samoa,Tonga, Nauru and dependencies of Commonwealth Countries.
*2 Includes St. Lucia, Grenada and Grenadines, Dominica, Antigua, St. Kitts,Nevis, Anguilla, Montserrat, St. Vincent, Belize and Bahamas.
*3 Includes British Virgin Islands, Barbuda, Cayman Islands, Turks and CaicosIslands and Bermuda.
*4 Includes Puerto Rico and U.S. Virgin Islands, Haiti, Dominican Republic,Cuba, Martinique, Guadeloupe and French Guiana, Netherlands Antilles,Suriname, Aruba and Curacao.
*5 Includes Netherlands, Greece, Portugal, United Kingdom, France, Germany,Spain, Belgium/Luxembourg, Italy, Ireland and Denmark.
*6 Includes Norway, Sweden, Switzerland, Finland, Austria, Iceland and FaroeIslands.
*7 Includes Argentina, Chile, Colombia, Mexico Ecuador, Bolivia, Uruguay,Paraguay and Peru.
*8 Includes Nicaragua, Honduras, Costa Rica, El Salvador and Guatemala.
*9 Includes Panama Canal Zone and Panama Republic.
*10 Includes Japan, Iran, Libya, Spain and Possessions, Indonesia, Saudi Arabiaand other foreign countries.
Source: Overseas Trade Reports.
The Balance of Payments of Trinidad and Tobago, 2004
Explanatory Notes 55
ITEM SOURCE OF DATA
TABLE 2 Merchandise 1. Overseas Trade Report
TABLE 3 Other Transportation
Credit
Item 1. Passenger Fares 1. Trinidad and Tobago (BWIA International) AirwaysCorporation
Item 2 Time Charters 1. Trinidad and Tobago (BWIA International)AirwaysCorporation
2. Survey of Foreign Airlines
Item 3. Port Disbursements3.1 Port Charges Port Authority3.2 Airport Charges Airports Authority3.3 Pilotage Trinidad Pilots’ and Berthing Masters Association3.4 Cargo Charges 1. Port Authority
2. Survey of Foreign Airlines3. PLIPDECO4. Airports Authority5. PLIPDECOSurvey of Shipping Agents
3.5 Other Port Disbursements 1. Port Authority
Item 4. Other Miscellaneous Receipts4.1 Mail Trinidad and Tobago (BWIA International) Airways
Corporation)4.2 Other Receipts 1. Survey of Shipping Agents
2. Survey of Foreign Airlines3. Trinidad and Tobago (BWIA International)
Airways CorporationDebit
Item 5. Passenger Fares 1. Survey of Foreign Airlines2. Survey of Shipping Agents
Item 6. Time Charters 1. Survey of Foreign Airlines2. Trinidad and Tobago (BWIA International) Airways
Corporation
Item 7. Port Disbursements 1. Trinidad and Tobago (BWIA International) AirwaysCorporation
Item 8. Other Miscellaneous Payments 1. Trinidad and Tobago (BWIA International) AirwaysCorporation
TABLE 4. Travel
Credit
Items 1.,2.,3. 1. Various Surveys of Foreign Visitors by the CSO
Item 4. Students 1. University of the West Indies, St. Augustine2. Eastern Caribbean Institute of Agriculture and Forestry3. Caribbean Union College
Item 5.Advances to Crew 1. Survey of Shipping Agents2. Survey of Foreign Airlines
SOURCES OF DATA

The Balance of Payments of Trinidad and Tobago, 2004
56 Explanatory Notes
SOURCES OF DATA
ITEM SOURCE OF DATA
DebitItem 4. Business Travellers Returns from Commercial BanksItem 5. Students Same as Item 4Item 6. Government Officials Comptroller of AccountsItem 7. Tourists and Other Travellers Same as Item 4
TABLE 5A. Investment Income
CreditItem 1. Central Bank - Interest Central BankItem 2. Commercial Banks - Interest Returns from Commercial BanksItem 3. Central government - Interest Investment Division, Ministry of Finance
DebitItem 4. Central Government - Interest Debt Monitoring Unit, Central Bank
Public Enterprises - Interest Debt Monitoring Unit, Central BankDirect Foreign Investment - Interest Survey of Direct Foreign Investment
Item 5. Direct Foreign Investment - Dividends Survey of Direct Foreign InvestmentOther - Dividends Returns from Commercial Banks
Item 6. Direct Foreign Investment - Profits Survey of Direct Foreign InvestmentOther - Dividends Central Bank Exchange Control Records
Item 7. Retained Profits Survey of Direct Foreign Investment
TABLE 6. Other Government
CreditItem 1. Receipts from International Institutions Survey of International InstitutionsItem 2. Receipts from Foreign Diplomatic Agencies Survey of Foreign Diplomatic Agencies
DebitItem 3. Central Government - Diplomatic and Other Comptroller of Accounts
Foreign Expenditures
Item 4. Payments to International Institutions Survey of International Institutions
TABLE 7. Other Services
CreditItem 1. Advertising 1. Survey of Advertising Establishments
2. Trinidad and Tobago Television Co. Ltd.3. Trinidad Publishing Co. Ltd.4. 610 Radio5. Radio Trinidad6. Caribbean Communications Network (CCN)
Item 2. Agents’ Fees 1. Survey of Foreign Airlines2. Survey of Shipping Agents
Item 3. Oil Processing Fees Trinidad and Tobago Oil Company Limited
Item 4. Non-Merchandise Insurance Survey of Insurance Companies
DebitAll Items Returns from Commercial Banks

The Balance of Payments of Trinidad and Tobago, 2004
Explanatory Notes 57
ITEM SOURCE OF DATA
SOURCES OF DATA
TABLE 8. Unrequited Transfers - Private
CreditItem 1. Migrants’ Transfers Overseas Trade Report/C.S.O.
Item 2. Remittances to Institutions Survey of Private Non-Profit Institutions
Item 3. Remittances to Individuals 1. Postmaster General2. Survey of Private Companies
DebitItem 4. Remittances Abroad 1. Returns from Commercial Banks
2. Postmaster General
Item 5. Payments to Foreign Diplomatic Agencies Survey of Foreign Diplomatic Agencies
TABLE 9. Unrequited Transfers - Government
CreditItem 1. Withholding Taxes Survey of Direct Foreign Investment
Item 2. Remittances by Other Governments Survey of Foreign Students
DebitItem 3. Contributions to International Institutions Comptroller of Accounts
Item 4. Pension Paid Abroad 1. Comptroller of Accounts - Pension Branch2. Police Service3. Fire Services4. Defence Force5. Ministry of Works
Item 5. Other Miscellaneous Grants Comptroller of Accounts
TABLE 10. Private Sector - Direct Investment Capital Survey of Direct Foreign Investment
TABLE 11. Public Sector - External Debt Operations Debt Monitoring Unit, Central Bank
TABLE 12. Financing - Change in Reserves
Item 1. Commercial Banks Returns from Commercial Banks
Item 2. Central Government - Security Holdingsand Cash Balances Investment Division - Ministry of Finance
Item 3. Post Office Savings Bank - ExternalSecurities Investment Division - Ministry of Finance
`Item 4. Central Bank - External Balances Central Bank
Item 5. I.M.F. Gold Tranche Central Bank
Item 6. S.D.R. Holdings Central Bank
TABLE 13. Commercial Banks Foreign Assets and Liabilities Returns from Commercial Banks