balancing/calibrating the chromira printers and chromira ... · chromira prolab or selab the...
TRANSCRIPT

1
Balancing/Calibrating the Chromira Printers and
Chromira ProLab or SELab
The balancing or calibrating of a printer will be performed using the Chromira Expert Pro
software.
Chromira Expert Pro software is designed to calibrate the output of the LEDs in the print
head, as well as report problems to ZBE.
The software has three sections:
Scan the test image
Linearize the 17 step gray scale
Send Incident reports to ZBE
Using the Chromira Expert Pro software
Launch the program by clicking on the Expert Pro icon

2
The software application must recognize the printer before it can be used.
If the Printer is not shown in the Selected Printer winddow, Click the:
1. Add/Remove button, then
2. Click the New(Insert) button in the Add/Remove Printers window.
Click the Browse button

3
Browse to the C drive on the Chromira Printer computer and open the
Chromira Lab folder, (for Chromira Labs)or
Chromira Printer folder (for roll to roll printers)
Click the Chromira.pr file and click the Open button

4
Click the OK button
Select the printer by clicking on the printer name in the window, then click OK

5
The Chromira Expert Pro window will now display:
Selected Printer - Printer name,
Current Print Media - Media that is loaded in the printer (Info from emu file in printer)
Manufacturer - Manufacturer of media (info from emu file in printer)
Material Type - Media surface (info from emu file in printer)
Comment – this info comes from the Comment section of the emu file in the printer.

6
Prepare the Calibration Image for Scanning
For the Chromira roll to roll printers, trim the test print for scan analysis as
described. The center area of the calibration print must be prepared for scanning
by trimming to the red lines on the print. Red lines are on the print and can be
seen in the example below. If balancing Trans materials using an Epson scanner,
additional preperation is necessary. SEE APPENDIX.

7
For the Chromira SE LAB, trim the test print for scan analysis as described. The
center area of the calibration print must be prepared for scanning by trimming to
the red lines on the print. Red lines are on the print and can be seen in the
example above. If balancing Trans materials using an Epson scanner, additional
preperation is necessary. SEE APPENDIX.

8
Scan Calibration
For the Chromira Pro Lab, the center section of the test image will be cut to size
and ready for scanning when using paper media. If balancing Trans, Clear, or
Flex material the test image must be cut as described in the Chromira SE LAB
section above. If balancing Trans materials using an Epson scanner, additional
preperation is necessary. SEE APPENDIX.
With the test image set properly in the scanner, click the Scan Calibration icon.

9
The Setting window will display. Verify that the scanner you have connected to the
printer computer is listed in the drop down menu. Click the Setting button.
The Balance Gains should be set to Automatic. Do not change setting unless directed to
by ZBE.
Click OK.

10
Click Scan
The scanner will scan the image twice. Once at low resolution to check the position and
condition of the image. The second time it will scan at 1200 dpi to read the actual pixel
lines. The progress of the scanning will be displayed as shown below.

11
When the scanning is complete the window will display data about the quality of the test
image as shown below.
The A: number indicates the difference between the desired drum advance and the
actual advance. This number can be ignored unless a drum advance error is displayed.
The D: number is the delta factor of the drum advance difference. This number can be
ignored unless a drum advance error is displayed.
The Q: number indicates the quality of the printed test image. This number should be
below 500 when a good quality print has been produced.
Click the Finish button. If the Q number was above 500 and banding is visable in the
print, reprint the test image and repeat the scan function.
12
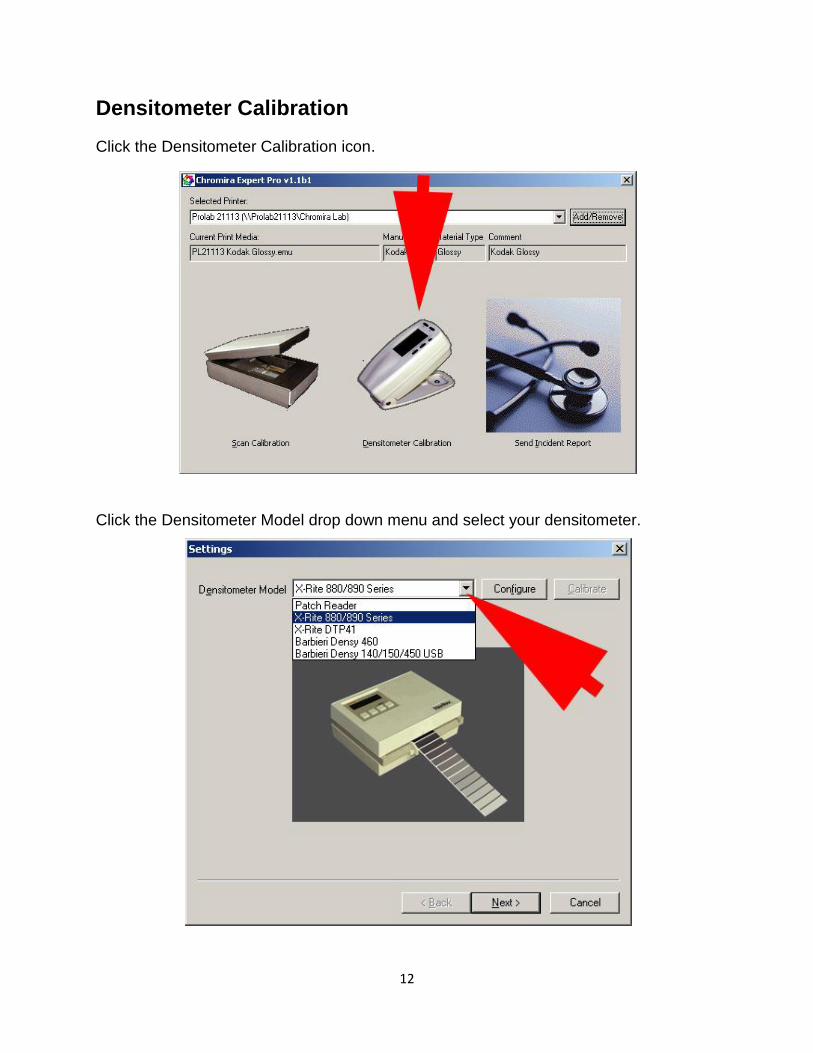
Densitometer Calibration
Click the Densitometer Calibration icon.
Click the Densitometer Model drop down menu and select your densitometer.

13
Click the Configure button

14
Check the settings:
Com Port – This should match the com port in the device manager on the computer
Baud Rate – must match the setting in the densitometer (default 9600)
Data Bits: must match the setting in the densitometer (default 8)
Parity: set at None
Stop Bits: set at 1
Curve Gamma: set at 1.8
Error Tolerance is set to default 2 unless High Precision Mode is selected. This is the
acceptable toleranace of the densitometer readings. Most densitometers have a plus or
minus 0.02 tolerance.
Click OK.

15
Click Next.
When you click the next button for the first time in a day, you will see a window
reminding you to calibrate the densitometer.

16
Calibrate the densitometer and click OK.
The Densitometer reading window will display.

17
Densitometer Readings section:
Patch = the patch which will be read next
Gamma = This is the Gamma curve set in the densitometer settings
Cyan, Meganta, Yellow blank windows = the actual reading for the patch will display here Patch Aims = these are the aim points for the individual patches
Clear Patch button = used to clear the readings from an individual patch

18
Dmax Targets
Set the dmax targets here for the media. Targets must be entered prior to reading with the densitometer
Grey Correction
This selection can be used to adjust the overall look of a greys in an image. Example: black and white images look too green – add a positive value to the Magenta box prior to reading with the densitometer.

19
Target values for each patch. The individual values are automatically calculated using the dmax targets and the paper white. (Read in patch 16) Actual values for each patch. The values are the readings from the densitometer.
Error. This is the difference between the Target values and the Actual values.
Begin reading the grey patches with the densitometer, and be sure the readings are recording in the Actual line for each color. In the case of strip reader the values will populate in rapid succession as the data transmits from the densitometer.
If the error values are greater than plus or minus .02 ,(.01 for High Precision mode) they will be displayed in red. If the values are within the tolerance range, they will be displayed in green. After completing the densitometer readings , if there are any red numbers in the error lines, click the Apply Changes button, print the test image again and repeat the densitometer reading procedure.
If all the values are green, click the Apply Changes button. You have completed the calibration of the Chromira.

20
Send Incident Reports
Click the Send Incident Report icon
Fi l l in the f ields for User Group Information, Contact Informatio n, and
select the best way to contact you. Then click Next.

21
Select the number of days,weeks, or months the problem has been
occuring.
Select the Severity of the problem, High, Medium or Low
Enter a discript ion of the problem.
Enter the Steps neede to reproduce the problem.
Click next.

22
Fi l l in the Problem Detai ls, then cl ick Next.
If there are f i les that may help ZBE understand the problem, click the Add
Additional File button and browse to the f i le.
To scan a print that shows the problem, place the print on the scanner
and click the Scan Print button.
The Current Attachments box wil l display those f i les and scans that were
added. Click Next.

23
Click the Submit button and allow the software to collect the information
from the printer and send it via the internet to ZBE. If internet is not
available on the printer computer, the software wil l not ify you that the f i le
has not been sent and to send it via email. The location of the incident
report wil l be displayed for the user to copy and paste to the email.

24
Appendix
Epson Scanner and Transparent media, trim instructions:
Additional material must be removed from the print when using an Epson scanner and balancing transparent media.
The base of transparent material is not clear; this causes an exposure problem with the Epson scanner druing scan calibration. When trimming the calibration image, cut to red lines as indicated on pages 6 and 7. In addition CUT AWAY THE AREA MARKED WITH RED X’s in the illustration below. The red lines are printed on the calibration image. The red X’s in the illustration will not be printed on the calibration image.
5x Calibration Image sample; trim to red lines and cut away red X material

25
1x Calibration Image sample; trim to red lines and cut away red X material.
Illustration of Trans material on Epson Scanner. The illustration below shows the area that must be trimmed away, at the top of the calibration image. Also note that the image alignment point is in the upper right hand corner. This reference point is used to align the calibration image on the face of the scanner.

26
IMPORTANT:
Remove the cover on the bottom side of the lid to expose the transmission lamp when
scanning Trans or Clear materials.
Remember to replace the cover before scanning any reflective media.