balsa blanca: experimental site field guidedigital.csic.es/bitstream/10261/84063/1/438892.pdf ·...
TRANSCRIPT
BALSA BLANCA: EXPERIMENTAL SITE
FIELD GUIDE

The following persons have participated in the elaboration of this field site guide:
Eva Arnau (EEZA‐CSIC)
Yolanda Cantón (Univ. Almería‐UAL)
Sonia Chamizo (EEZA‐CSIC)
Francisco Domingo (EEZA‐CSIC; Univ. Almería‐UAL)
Mónica Ladrón de Guevara (EEZA‐CSIC)
Roberto Lázaro (EEZA‐CSIC)
Isabel Molina (EEZA‐CSIC)
Laura Morillas (EEZA‐CSIC)
Albert Solé (EEZA‐CSIC)
Emilio Rodríguez (EEZA‐CSIC)
Olga Uclés (EEZA‐CSIC)
Alfredo Durán, Ivan Ortiz and Ashraf Afana helped us with technical field work and other details.
Index
1. GENERAL FEATURES OF THE STUDY AREA 1
2. EXPERIMENTAL SET‐UP 4
2.1. Multi‐scale process‐based research on water limited ecosystem: water and carbon use and exchanges 4
2.1.1 Net balance at ecosystem scale 4
(i) DIRECT MEASUREMENTS: Eddy Covariance technique for H2O and CO2 fluxes.
(ii) EVAPOTRANSPIRATION MODEL: Upscaling approach
(iii) EVAPOTRANSPITATION ESTIMATION BY RADIOMETRIC
TECHNIQUES: Downscaling approach
(iv) DEWFALL: measurement and modelling
2.1.2 Ground‐level H2O and CO2 fluxes measurements at plot scale 18
(i) ACTIVE GROUND COMPONENTS IN FLUX EXCHANGE: Vegetation ‐ Soil ‐ Biological Soil Crusts
(ii) EFFECTS OF BIOLOGICAL SOIL CRUSTS ON THE WATER BALANCE
2.1.3 Water re‐distribution at hillslope scale: spatially distribution runoff plots and soil moisture 26
2.2 Vegetation response to climate change under different rainfall regime scenarios 31
2.2.1 Rainfall patterns manipulation experiment at plot scale 31
2.2.2 Ecosystem response to climate change scenarios: Evapotranspiration balance 34
3. REFERENCES 35
4. SCIENTIFIC PRODUCTION RELATIVE TO BALSA BLANCA
4.1 Publications 36
4.2 Conference contributions 38
5. FUNDING PROJECTS 40
1
1. GENERAL FEATURES OF THE STUDY AREA
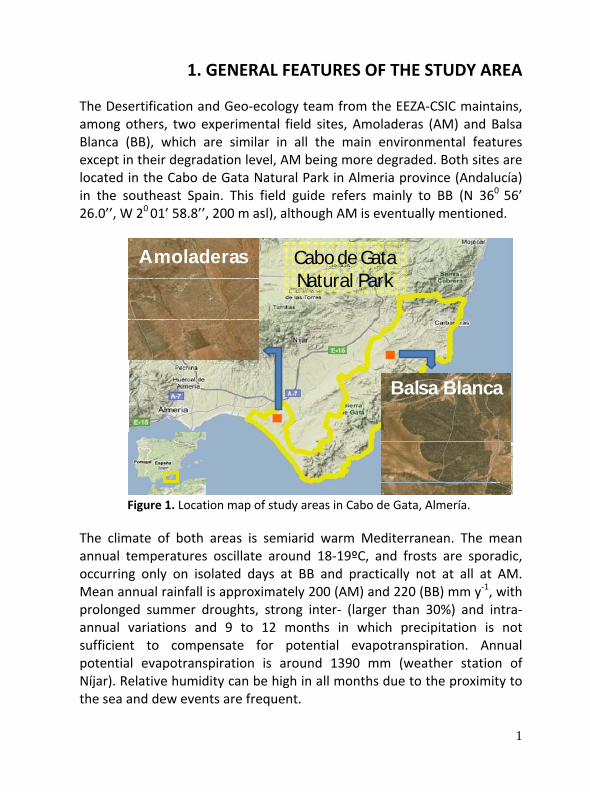
The Desertification and Geo‐ecology team from the EEZA‐CSIC maintains, among others, two experimental field sites, Amoladeras (AM) and Balsa Blanca (BB), which are similar in all the main environmental features except in their degradation level, AM being more degraded. Both sites are located in the Cabo de Gata Natural Park in Almeria province (Andalucía) in the southeast Spain. This field guide refers mainly to BB (N 360 56’ 26.0’’, W 20 01’ 58.8’’, 200 m asl), although AM is eventually mentioned.
Cabo de Gata Natural Park
Amoladeras
Balsa Blanca
Cabo de Gata Natural Park
Amoladeras
Balsa Blanca
Figure 1. Location map of study areas in Cabo de Gata, Almería.
The climate of both areas is semiarid warm Mediterranean. The mean annual temperatures oscillate around 18‐19ºC, and frosts are sporadic, occurring only on isolated days at BB and practically not at all at AM. Mean annual rainfall is approximately 200 (AM) and 220 (BB) mm y‐1, with prolonged summer droughts, strong inter‐ (larger than 30%) and intra‐annual variations and 9 to 12 months in which precipitation is not sufficient to compensate for potential evapotranspiration. Annual potential evapotranspiration is around 1390 mm (weather station of Níjar). Relative humidity can be high in all months due to the proximity to the sea and dew events are frequent.
2
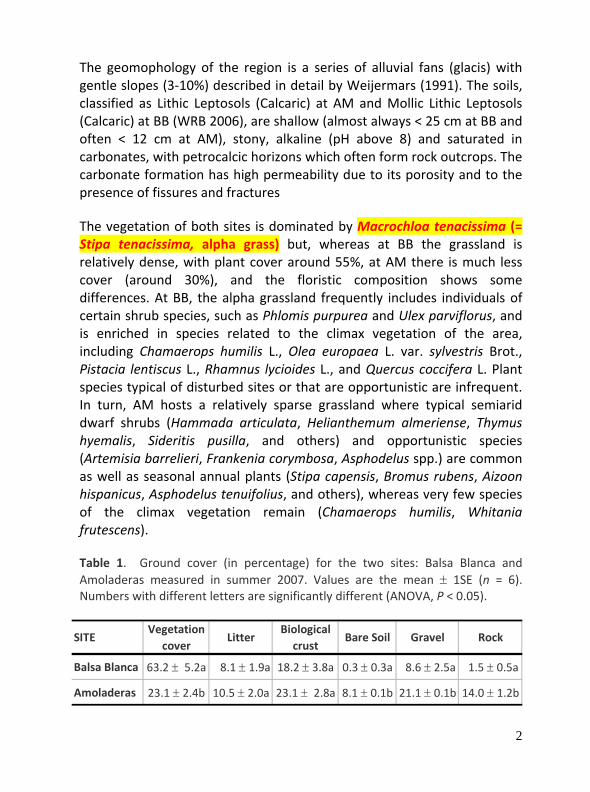
The geomophology of the region is a series of alluvial fans (glacis) with gentle slopes (3‐10%) described in detail by Weijermars (1991). The soils, classified as Lithic Leptosols (Calcaric) at AM and Mollic Lithic Leptosols (Calcaric) at BB (WRB 2006), are shallow (almost always < 25 cm at BB and often < 12 cm at AM), stony, alkaline (pH above 8) and saturated in carbonates, with petrocalcic horizons which often form rock outcrops. The carbonate formation has high permeability due to its porosity and to the presence of fissures and fractures
The vegetation of both sites is dominated by Macrochloa tenacissima (= Stipa tenacissima, alpha grass) but, whereas at BB the grassland is relatively dense, with plant cover around 55%, at AM there is much less cover (around 30%), and the floristic composition shows some differences. At BB, the alpha grassland frequently includes individuals of certain shrub species, such as Phlomis purpurea and Ulex parviflorus, and is enriched in species related to the climax vegetation of the area, including Chamaerops humilis L., Olea europaea L. var. sylvestris Brot., Pistacia lentiscus L., Rhamnus lycioides L., and Quercus coccifera L. Plant species typical of disturbed sites or that are opportunistic are infrequent. In turn, AM hosts a relatively sparse grassland where typical semiarid dwarf shrubs (Hammada articulata, Helianthemum almeriense, Thymus hyemalis, Sideritis pusilla, and others) and opportunistic species (Artemisia barrelieri, Frankenia corymbosa, Asphodelus spp.) are common as well as seasonal annual plants (Stipa capensis, Bromus rubens, Aizoon hispanicus, Asphodelus tenuifolius, and others), whereas very few species of the climax vegetation remain (Chamaerops humilis, Whitania frutescens).
Table 1. Ground cover (in percentage) for the two sites: Balsa Blanca and Amoladeras measured in summer 2007. Values are the mean ± 1SE (n = 6). Numbers with different letters are significantly different (ANOVA, P < 0.05).
SITEVegetation
coverLitter
Biological crust
Bare Soil Gravel Rock
Balsa Blanca 63.2 ± 5.2a 8.1 ± 1.9a 18.2 ± 3.8a 0.3 ± 0.3a 8.6 ± 2.5a 1.5 ± 0.5a
Amoladeras 23.1 ± 2.4b 10.5 ± 2.0a 23.1 ± 2.8a 8.1 ± 0.1b 21.1 ± 0.1b 14.0 ± 1.2b
3
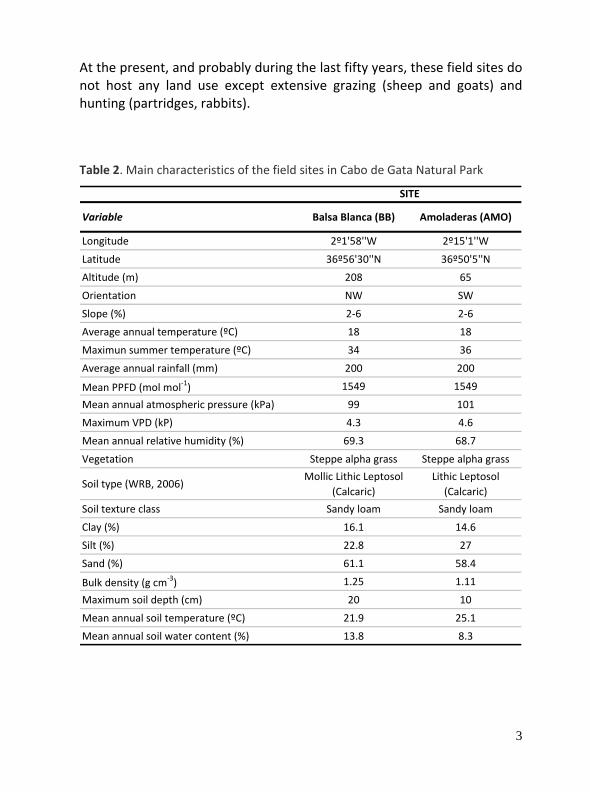
At the present, and probably during the last fifty years, these field sites do not host any land use except extensive grazing (sheep and goats) and hunting (partridges, rabbits).
Table 2. Main characteristics of the field sites in Cabo de Gata Natural Park
Variable Balsa Blanca (BB) Amoladeras (AMO)
Longitude 2º1'58''W 2º15'1''W
Latitude 36º56'30''N 36º50'5''N
Altitude (m) 208 65
Orientation NW SW
Slope (%) 2‐6 2‐6
Average annual temperature (ºC) 18 18
Maximun summer temperature (ºC) 34 36
Average annual rainfall (mm) 200 200
Mean PPFD (mol mol‐1) 1549 1549
Mean annual atmospheric pressure (kPa) 99 101
Maximum VPD (kP) 4.3 4.6
Mean annual relative humidity (%) 69.3 68.7
Vegetation Steppe alpha grass Steppe alpha grass
Soil type (WRB, 2006)Mollic Lithic Leptosol
(Calcaric)Lithic Leptosol
(Calcaric)
Soil texture class Sandy loam Sandy loam
Clay (%) 16.1 14.6
Silt (%) 22.8 27
Sand (%) 61.1 58.4
Bulk density (g cm‐3) 1.25 1.11
Maximum soil depth (cm) 20 10
Mean annual soil temperature (ºC) 21.9 25.1
Mean annual soil water content (%) 13.8 8.3
SITE
4
2. EXPERIMENTAL SET‐UP
The current research lines carried out by of the Desertification and Geoecology Research Group on the Cabo de Gata area are related to ecosystem functioning in terms of use and exchange of water and carbon at different spatio‐temporal scales.
The response of the ecosystem carbon balance to changes in temperature and the water balance is still very uncertain, and yet essential to understanding the role of the biosphere in the future global carbon budget. Because carbon and water cycles are strongly linked, mainly through photosynthesis and respiration, changes in the water balance will produce changes in the carbon cycle determining the CO2 source/sink behaviour of ecosystems. Initial climate forecasts for the Mediterranean point to a decrease in net precipitation and number of events, and an increase in intensity. This would diminish water availability in already water‐limited Mediterranean ecosystems sensitive to desertification, especially semiarid regions such as SE Spain. In these semiarid ecosystems, the link between the carbon and water cycles is expected to tighten as the growing period shortens due to drought.
2.1. Multi‐scale process‐based research on water limited ecosystem: water and carbon use and exchanges
2.1.1 Net balance at ECOSYSTEM scale
Although the “flux community” has widened knowledge of the carbon cycle, nascent research has focused mainly on forest and cropland ecosystems, and continental‐scale integrations have thus far neglected the functional behaviour of sparse shrubland ecosystems in Mediterranean climates.
5
(i) DIRECT MEASUREMENTS: Eddy Covariance technique for H2O and CO2 fluxes.
INSTRUMENTATION
Micrometeorological measurements
The following micrometeorological variables are measured: relative humidity (RH) and air temperature (Tair) (HMP45C Vaisala Inc., Helsinki, Finland) at 4 m above the ground, net radiation (Rnet) with a net radiometer (NRLite, Kipp and Zonen, Delfi, Netherlands) located at 2 m height on a separated mast, photosynthetically active radiation (PAR) (LI‐190SA, Li‐Cor Inc, Nebraska, USA), and precipitation (PPT) with a tipping‐bucket rain gauge (model 785 M, Davis Instruments Corp., Hayward, CA, USA) placed at 1 m height. Data are averaged every 30 min intervals from observations made every 10 s and stored in a datalogger (CR23X, Campbell Scientific Inc., UK). The equipment is powered by a 12 VDC cycle battery that is charged by a solar panel.
Four soil heat flux plates (HFP01SC, REBS Inc.) are placed at 4 cm depth, two under plant and two under bare soil and are connected to a multiplexer connected to the datalogger. Soil heat flux at the surface is determined by adding the measured heat flux at 4 cm (G) to the energy stored in the layer above the heat plate using soil temperature and soil moisture measured at 4 cm. Soil temperature is measured using soil thermocouples (TCAV) at the same locations at 2 and 6 cm depth adjacent to the heat flux plates. Reference temperature is measured with a TCRT10. All sensors are connected to a datalogger (CR10, Campbell Scientific, UK). Soil volumetric water content (SWC) is measured by time domain reflectometry (CS616, located at 4 cm in each set of heat flux plates). Soil measurements made every 10 s are stored as 15 min averages.
Eddy covariance measurements
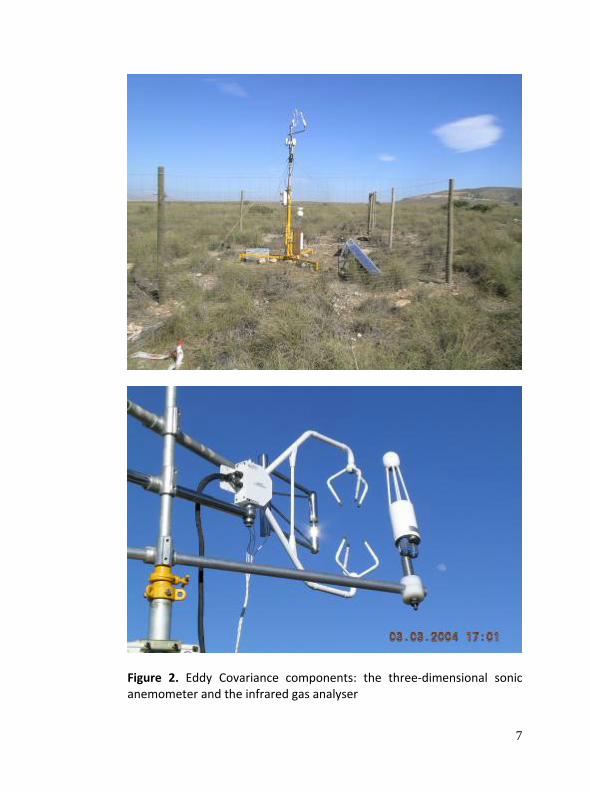
In May 2006 an eddy covariance flux tower was installed and instrumented for continuous measurements of micrometeorological variables and net exchange of CO2, H2O and energy between the alpha grass ecosystem and the atmosphere. A fast response three‐axis sonic

6
anemometer (CSAT‐3, Campbell Scientific, UK) measures the three components of the wind velocity vector and sonic temperature. An open‐path gas analyser (IRGA) (Li‐Cor 7500, Li‐Cor, NE, USA) measures fluctuations in CO2 and H2O densities. Both equipments are mounted on a 3.5 m mast above the ground. Calibration is carried out once a month
using a gas standard of 479 μmol mol–1 CO2 and a dew point generator for
water vapour (Li‐610, Li‐Cor, NE, USA). The sensor is clean frequently on a regular basis. The eddy flux system is powered by another 12 VDC cycle battery that is charged by a solar panel.
The mean covariance between fluctuations in the vertical wind speed and CO2 densities is determined and used to calculate the flux density of CO2. Averaged 15 min values are calculated as mean voltages and converted to densities using a datalogger in‐house program (CR10X, Campbell Scientific, UK). Mean, variances, and co‐variances of 10 Hz data are calculated and stored every 15 min. Eddy flux corrections for density fluctuations and two coordinate rotation (McMillen 1988) are carried out in post‐processing, as is the conversion to half‐hour means following Reynolds’ decomposition technique (Moncrieff et al. 1997). Data processing is done as described by Aubinet et al. 2000 following FLUXNET standard procedures. For convention, fluxes of CO2 towards the vegetation surface (photosynthesis) are negative, and fluxes away from the surface to the atmosphere (respiration) are positive. The cumulative amount of carbon over time is calculated in grams of carbon per unit area.
Dominant winds are on average coming from the east during the day and the west at night because of the diurnal changes in sea breezes. For this reason we placed the main tower with the eddy covariance equipment to the west to minimise flow distortion. Results on footprint analysis show that the footprint of the eddy tower is within a 100 m radius, and therefore it is well within the fetch of the ecosystem studied.
7
Figure 3. Eddy Covariance system and meteorological installation
Figure 2. Eddy Covariance components: the three‐dimensional sonic anemometer and the infrared gas analyser
8
RESULTS for hydrological years 2006‐2007 to 2008‐2009
Seasonal and interannual variability in micrometeorological conditions
The total annual rainfall was: 210, 251 and 294 mm for the year 2006/2007, 2007/2008, and 2008/2009, respectively. The three years had similar mean annual temperature (ca 17 oC), mean annual maximum relative humidity (ca 88%) and similar irradiance (ca 81 W m‐2). The main climatic conditions of the three years are presented in Table 1. Annual average soil volumetric water content under bare soil (measured at 3.5 cm depth) was 30% and 46% higher in the year 2007/2008 and 2008/2009 than in the first year, respectively.
The environmental variables showed also strong seasonality. Seasonal means varied slightly among the years of the study. Minimum daily average Rnet on a monthly basis was observed in December in all years: varying between 95.3 and 93.5 W m‐2. Maximum daily average Rnet was observed in May 2006 and June 2008 reaching 240.6 W m‐2. The seasonal change in average daily air temperatures was remarkably similar ranging from a minimum of 10.0oC‐11.3oC (December) to a maximum of 25.4oC reached in July 2006. Average daily air temperatures varied from a minimum of 7.8oC in December 2008 to a maximum of 33.4oC in July 2007. Maximum monthly soil temperatures (bare soil) ranged from 50oC in August to 19.4oC in January showing large seasonal variation of more than 20oC. Strong diurnal variation in soil temperature was also observed reaching up to 30oC over the summer. Mean SWC ranged from 31% in December to 3% in July and August. Maximum vapour pressure deficit (VPD) varied between 50.8 HPa in June and 10.5 HPa in February over the three years. Air relative humidity (RH) (%) at the height of the tower was also very similar between years with an average daily value of 68% (Table 1) and exhibited a similar seasonal pattern in all years (Table 2).
9
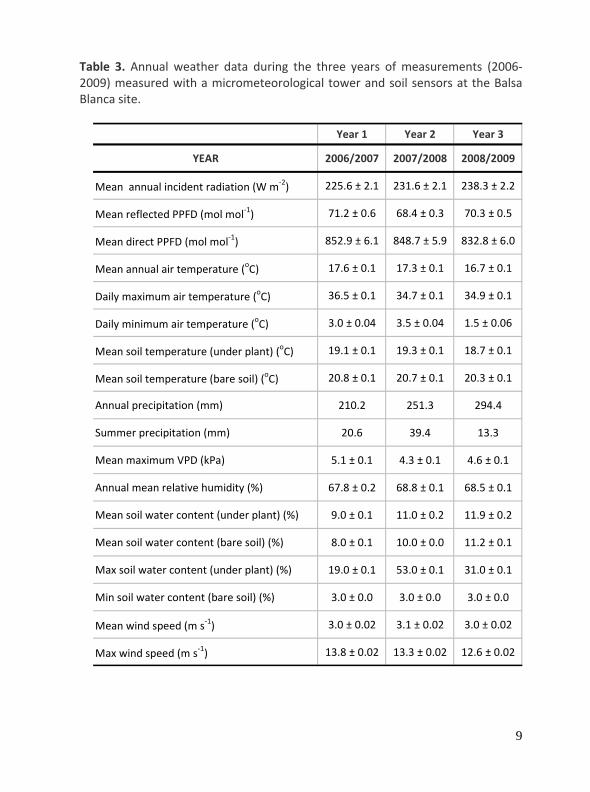
Table 3. Annual weather data during the three years of measurements (2006‐2009) measured with a micrometeorological tower and soil sensors at the Balsa Blanca site.
Year 1 Year 2 Year 3
YEAR 2006/2007 2007/2008 2008/2009
Mean annual incident radiation (W m‐2) 225.6 ± 2.1 231.6 ± 2.1 238.3 ± 2.2
Mean reflected PPFD (mol mol‐1) 71.2 ± 0.6 68.4 ± 0.3 70.3 ± 0.5
Mean direct PPFD (mol mol‐1) 852.9 ± 6.1 848.7 ± 5.9 832.8 ± 6.0
Mean annual air temperature (oC) 17.6 ± 0.1 17.3 ± 0.1 16.7 ± 0.1
Daily maximum air temperature (oC) 36.5 ± 0.1 34.7 ± 0.1 34.9 ± 0.1
Daily minimum air temperature (oC) 3.0 ± 0.04 3.5 ± 0.04 1.5 ± 0.06
Mean soil temperature (under plant) (oC) 19.1 ± 0.1 19.3 ± 0.1 18.7 ± 0.1
Mean soil temperature (bare soil) (oC) 20.8 ± 0.1 20.7 ± 0.1 20.3 ± 0.1
Annual precipitation (mm) 210.2 251.3 294.4
Summer precipitation (mm) 20.6 39.4 13.3
Mean maximum VPD (kPa) 5.1 ± 0.1 4.3 ± 0.1 4.6 ± 0.1
Annual mean relative humidity (%) 67.8 ± 0.2 68.8 ± 0.1 68.5 ± 0.1
Mean soil water content (under plant) (%) 9.0 ± 0.1 11.0 ± 0.2 11.9 ± 0.2
Mean soil water content (bare soil) (%) 8.0 ± 0.1 10.0 ± 0.0 11.2 ± 0.1
Max soil water content (under plant) (%) 19.0 ± 0.1 53.0 ± 0.1 31.0 ± 0.1
Min soil water content (bare soil) (%) 3.0 ± 0.0 3.0 ± 0.0 3.0 ± 0.0
Mean wind speed (m s‐1) 3.0 ± 0.02 3.1 ± 0.02 3.0 ± 0.02
Max wind speed (m s‐1) 13.8 ± 0.02 13.3 ± 0.02 12.6 ± 0.02
10
The seasonal distribution of rainfall was markedly different between years. In all years, precipitation occurred mostly during the autumn/winter period with minimum and small rainfall events during the summer months (Table 2). Whereas in the first year spring was the period with more rain (ca 130 mm), in the second and third year the amount received in autumn was highest with more than doubled the amount received in 2006 over the same period (133 mm and 170 mm in 2007 and 2008, respectively). In the second year, the first moderate event after the summer drought was of 19.4 mm and then in October there was a large rainfall event with 66 mm precipitation in one day (DOY 291). This single event was enough to recharge the soil profile for the whole winter and raised soil water content from 9.6% to over 50%. This year (2007/2008) for the whole winter, SWC was kept at more than 20%. During the third year, it rained above average during the autumn months reaching 170 mm evenly distributed across September and December 2008.
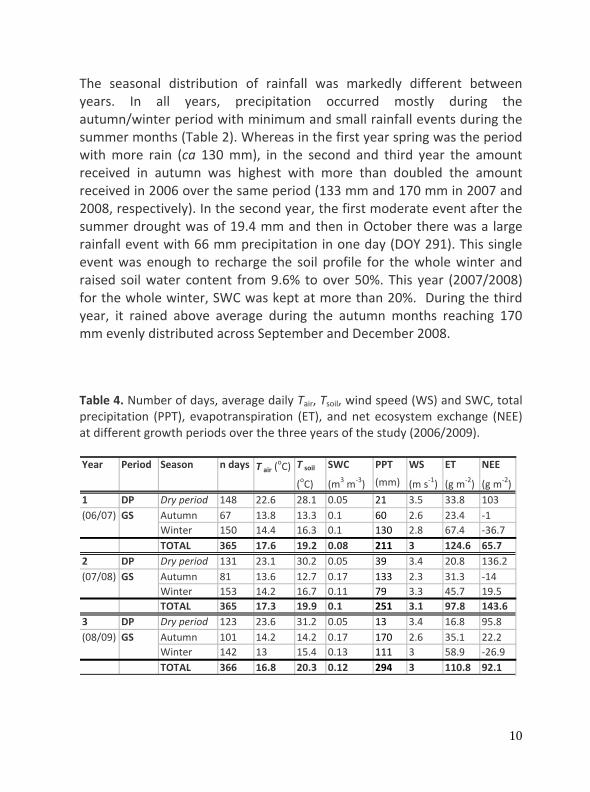
Table 4. Number of days, average daily Tair, Tsoil, wind speed (WS) and SWC, total precipitation (PPT), evapotranspiration (ET), and net ecosystem exchange (NEE) at different growth periods over the three years of the study (2006/2009).
T soil SWC PPT WS ET NEE
(oC) (m3 m‐3) (mm) (m s‐1) (g m‐2) (g m‐2)1 DP Dry period 148 22.6 28.1 0.05 21 3.5 33.8 103(06/07) GS Autumn 67 13.8 13.3 0.1 60 2.6 23.4 ‐1
Winter 150 14.4 16.3 0.1 130 2.8 67.4 ‐36.7TOTAL 365 17.6 19.2 0.08 211 3 124.6 65.7
2 DP Dry period 131 23.1 30.2 0.05 39 3.4 20.8 136.2(07/08) GS Autumn 81 13.6 12.7 0.17 133 2.3 31.3 ‐14
Winter 153 14.2 16.7 0.11 79 3.3 45.7 19.5TOTAL 365 17.3 19.9 0.1 251 3.1 97.8 143.6
3 DP Dry period 123 23.6 31.2 0.05 13 3.4 16.8 95.8(08/09) GS Autumn 101 14.2 14.2 0.17 170 2.6 35.1 22.2
Winter 142 13 15.4 0.13 111 3 58.9 ‐26.9TOTAL 366 16.8 20.3 0.12 294 3 110.8 92.1
T air (oC)Year Period Season n days
11
Seasonal and interannual variability in NEE
There was a strong seasonal variation in NEE with some similar patterns each year. The ecosystem was a net source of CO2 most of the dry period when large CO2 fluxes to the atmosphere were observed (up to 10.0 mol m‐2 s‐1 or 4.8 g C m‐2 day‐1). The dry period lasted almost five months: from June through the end of October (148, 131 and 123 days the first, second and third year, respectively). In all years, the amount of carbon loss during the dry period was much more than the amount of carbon fixed the rest of the year (Table 1) and Fig 3. As a result, the ecosystem behaved as a carbon source to the atmosphere. The cumulative amount of carbon released to the atmosphere was 65.7, 136.8 and 90.7 g in the year 1, 2 and 3, respectively. The ecosystem absorbed some carbon during the growing season (autumn/winter months) but the negative fluxes were always much smaller than the positive ones observed during the dry period (maximum rates in winter 2008 of up to ‐1.85 g C m‐2 day‐1). The vegetation seemed to be most active in the winter (from January through March). During the autumn it behaved as a slight sink in the first two years but NEE was near 0 during the third year in this period (Table 2).
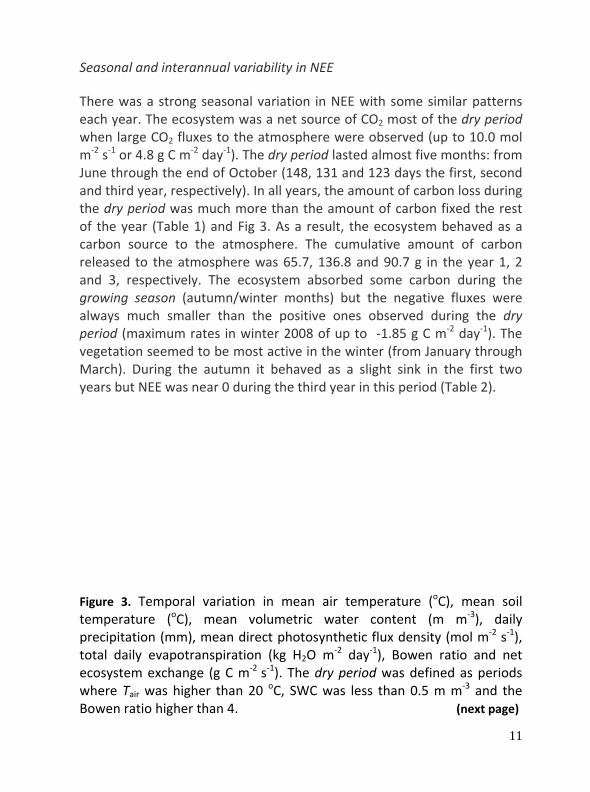
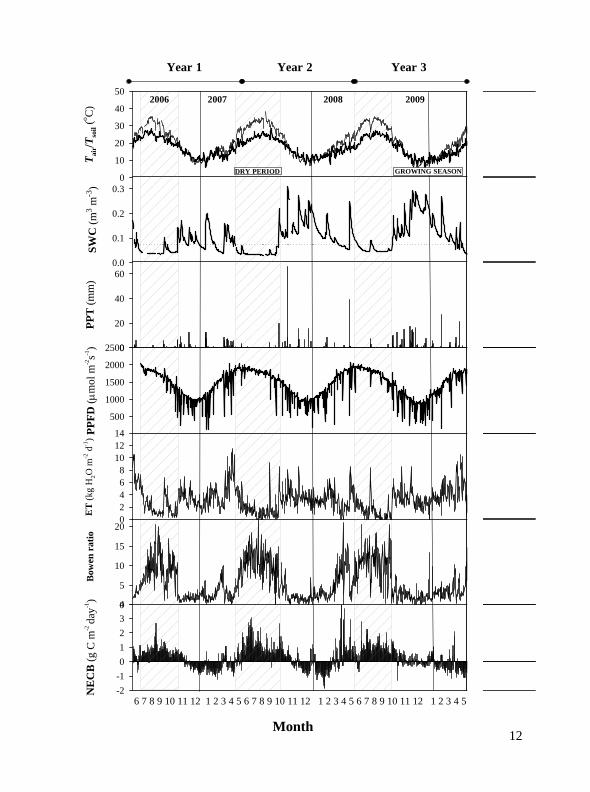
Figure 3. Temporal variation in mean air temperature (oC), mean soil temperature (oC), mean volumetric water content (m m‐3), daily precipitation (mm), mean direct photosynthetic flux density (mol m‐2 s‐1), total daily evapotranspiration (kg H2O m
‐2 day‐1), Bowen ratio and net ecosystem exchange (g C m‐2 s‐1). The dry period was defined as periods where Tair was higher than 20
oC, SWC was less than 0.5 m m‐3 and the Bowen ratio higher than 4. (next page)
12
6 7 8 9 10 11 12 1 2 3 4 5 6 7 8 9 10 11 12 1 2 3 4 5 6 7 8 9 10 11 12 1 2 3 4 5 6 7
2006 2007 2008 2009T ai
r/ Tso
il (o C
)
0
10
20
30
40
50N
EC
B (g
C m
-2 da
y-1)
-2-101234
Bow
en r
atio
0
5
10
15
20
SWC
(m3 m
-3)
0.0
0.1
0.2
0.3
PPFD
(μm
ol m
-2s-1
)
500
1000
1500
2000
2500
ET
(kg
H2O
m-2
d-1
)
02468
101214
PPT
(mm
)
0
20
40
60
Month
DRY PERIOD GROWING SEASON
Year 1 Year 2 Year 3
13
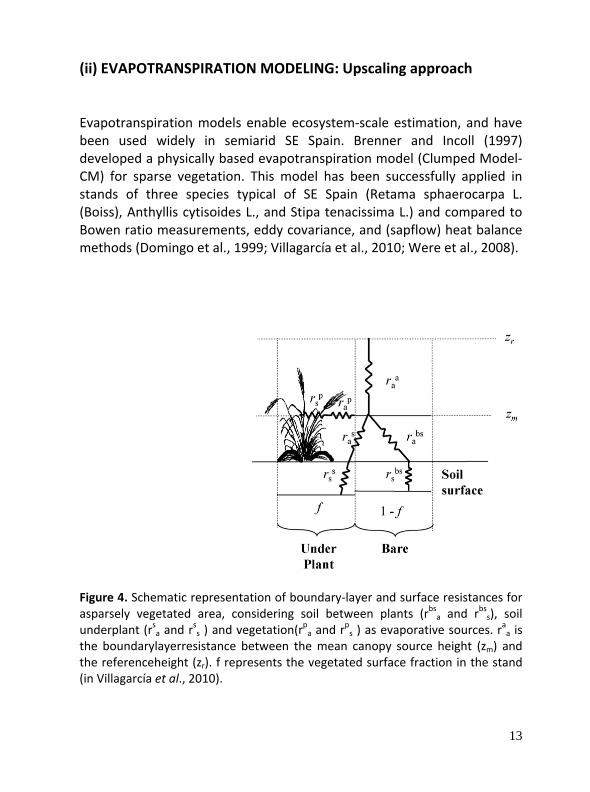
(ii) EVAPOTRANSPIRATION MODELING: Upscaling approach Evapotranspiration models enable ecosystem‐scale estimation, and have been used widely in semiarid SE Spain. Brenner and Incoll (1997) developed a physically based evapotranspiration model (Clumped Model‐CM) for sparse vegetation. This model has been successfully applied in stands of three species typical of SE Spain (Retama sphaerocarpa L. (Boiss), Anthyllis cytisoides L., and Stipa tenacissima L.) and compared to Bowen ratio measurements, eddy covariance, and (sapflow) heat balance methods (Domingo et al., 1999; Villagarcía et al., 2010; Were et al., 2008).
Figure 4. Schematic representation of boundary‐layer and surface resistances for asparsely vegetated area, considering soil between plants (rbsa and r
bss), soil
underplant (rsa and rss ) and vegetation(r
pa and r
ps ) as evaporative sources. r
aa is
the boundarylayerresistance between the mean canopy source height (zm) and the referenceheight (zr). f represents the vegetated surface fraction in the stand (in Villagarcía et al., 2010).
14
(iii) EVAPOTRANSPITATION ESTIMATION BY RADIOMETRIC TECHNIQUES: Downscaling approach
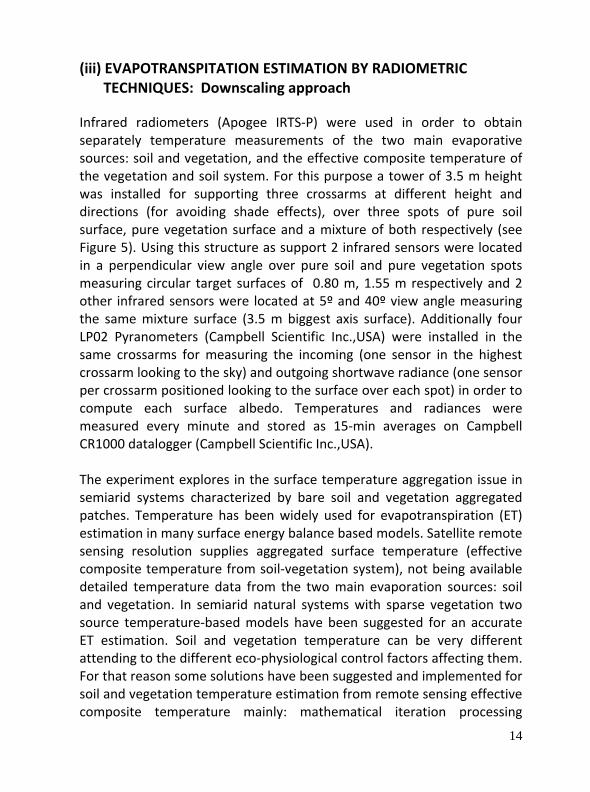
Infrared radiometers (Apogee IRTS‐P) were used in order to obtain separately temperature measurements of the two main evaporative sources: soil and vegetation, and the effective composite temperature of the vegetation and soil system. For this purpose a tower of 3.5 m height was installed for supporting three crossarms at different height and directions (for avoiding shade effects), over three spots of pure soil surface, pure vegetation surface and a mixture of both respectively (see Figure 5). Using this structure as support 2 infrared sensors were located in a perpendicular view angle over pure soil and pure vegetation spots measuring circular target surfaces of 0.80 m, 1.55 m respectively and 2 other infrared sensors were located at 5º and 40º view angle measuring the same mixture surface (3.5 m biggest axis surface). Additionally four LP02 Pyranometers (Campbell Scientific Inc.,USA) were installed in the same crossarms for measuring the incoming (one sensor in the highest crossarm looking to the sky) and outgoing shortwave radiance (one sensor per crossarm positioned looking to the surface over each spot) in order to compute each surface albedo. Temperatures and radiances were measured every minute and stored as 15‐min averages on Campbell CR1000 datalogger (Campbell Scientific Inc.,USA). The experiment explores in the surface temperature aggregation issue in semiarid systems characterized by bare soil and vegetation aggregated patches. Temperature has been widely used for evapotranspiration (ET) estimation in many surface energy balance based models. Satellite remote sensing resolution supplies aggregated surface temperature (effective composite temperature from soil‐vegetation system), not being available detailed temperature data from the two main evaporation sources: soil and vegetation. In semiarid natural systems with sparse vegetation two source temperature‐based models have been suggested for an accurate ET estimation. Soil and vegetation temperature can be very different attending to the different eco‐physiological control factors affecting them. For that reason some solutions have been suggested and implemented for soil and vegetation temperature estimation from remote sensing effective composite temperature mainly: mathematical iteration processing
15
(Norman et al., 1995) and two angle surface measurements (Kustas and Norman, 1997).
In this context the Alb‐IRT tower experiment allows to evaluate the effectiveness of these soil and vegetation temperature estimation methods in sparse vegetation semiarid systems and to analyse scaling down remote sensed temperature process.
Figure 5. Low‐height remote sensing of albedo and surface temperature, as training area to understand satellite images from data of pure surface elements and surface elements aggregation.
16
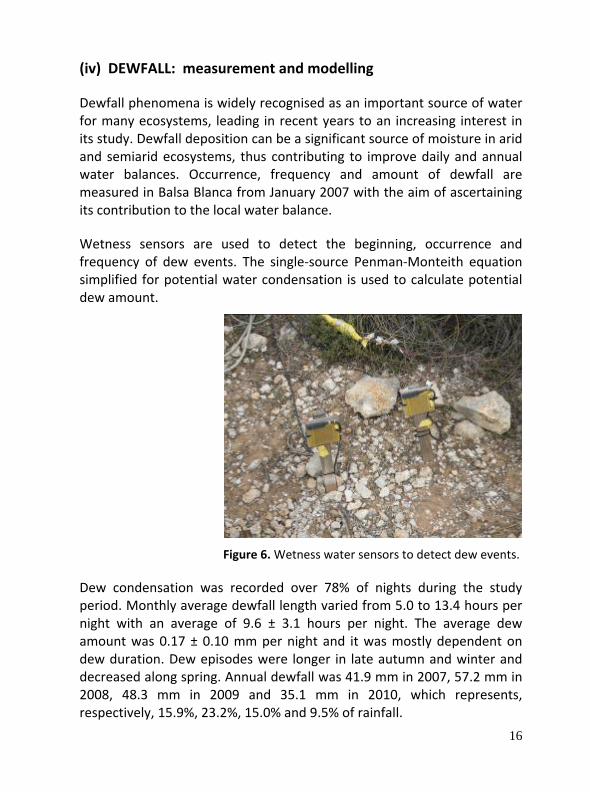
(iv) DEWFALL: measurement and modelling
Dewfall phenomena is widely recognised as an important source of water for many ecosystems, leading in recent years to an increasing interest in its study. Dewfall deposition can be a significant source of moisture in arid and semiarid ecosystems, thus contributing to improve daily and annual water balances. Occurrence, frequency and amount of dewfall are measured in Balsa Blanca from January 2007 with the aim of ascertaining its contribution to the local water balance.
Wetness sensors are used to detect the beginning, occurrence and frequency of dew events. The single‐source Penman‐Monteith equation simplified for potential water condensation is used to calculate potential dew amount.
Figure 6. Wetness water sensors to detect dew events.
Dew condensation was recorded over 78% of nights during the study period. Monthly average dewfall length varied from 5.0 to 13.4 hours per night with an average of 9.6 ± 3.1 hours per night. The average dew amount was 0.17 ± 0.10 mm per night and it was mostly dependent on dew duration. Dew episodes were longer in late autumn and winter and decreased along spring. Annual dewfall was 41.9 mm in 2007, 57.2 mm in 2008, 48.3 mm in 2009 and 35.1 mm in 2010, which represents, respectively, 15.9%, 23.2%, 15.0% and 9.5% of rainfall.
17
0
0.1
0.2
0.3
0.4
0.5
0.6
0.7
0.8
0.9
1
1 3 5 7 9 11 1 3 5 7 9 11 1 3 5 7 9 11 1 3 5 7 9 11months
dew
(mm
nig
ht-1
)
-1
0
1
2
3
4
5
6
7
8
9
dew
(mm
)
2008 20092007 2010
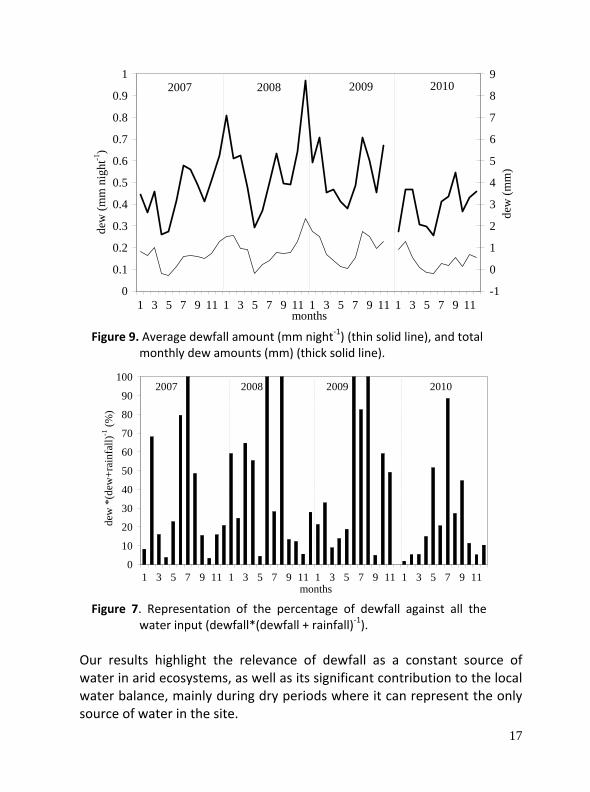
Figure 9. Average dewfall amount (mm night‐1) (thin solid line), and total
monthly dew amounts (mm) (thick solid line).
0
10
20
30
40
50
60
70
80
90
100
1 3 5 7 9 11 1 3 5 7 9 11 1 3 5 7 9 11 1 3 5 7 9 11months
dew
*(d
ew+r
ainf
all)-1
(%)
2007 2008 2009 2010
Figure 7. Representation of the percentage of dewfall against all the
water input (dewfall*(dewfall + rainfall)‐1). Our results highlight the relevance of dewfall as a constant source of water in arid ecosystems, as well as its significant contribution to the local water balance, mainly during dry periods where it can represent the only source of water in the site.
18
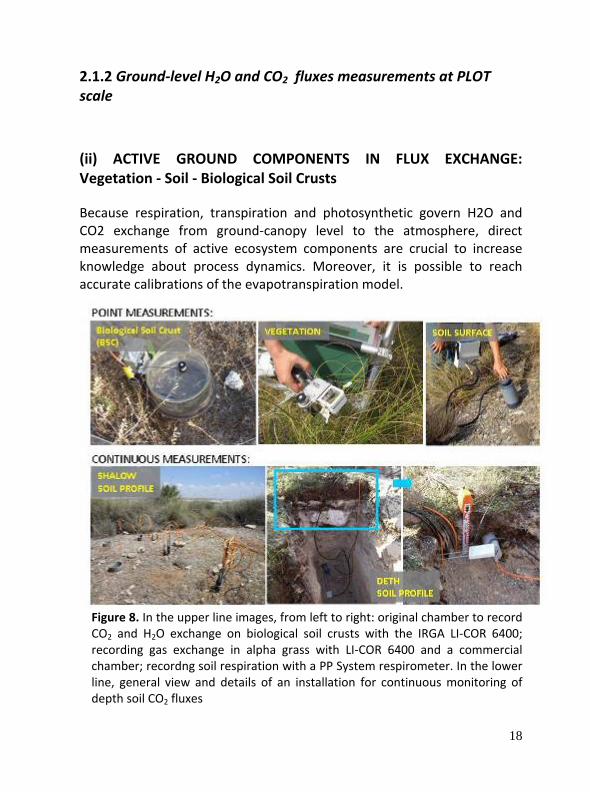
2.1.2 Ground‐level H2O and CO2 fluxes measurements at PLOT scale
(ii) ACTIVE GROUND COMPONENTS IN FLUX EXCHANGE: Vegetation ‐ Soil ‐ Biological Soil Crusts
Because respiration, transpiration and photosynthetic govern H2O and CO2 exchange from ground‐canopy level to the atmosphere, direct measurements of active ecosystem components are crucial to increase knowledge about process dynamics. Moreover, it is possible to reach accurate calibrations of the evapotranspiration model.
Figure 8. In the upper line images, from left to right: original chamber to record CO2 and H2O exchange on biological soil crusts with the IRGA LI‐COR 6400; recording gas exchange in alpha grass with LI‐COR 6400 and a commercial chamber; recordng soil respiration with a PP System respirometer. In the lower line, general view and details of an installation for continuous monitoring of depth soil CO2 fluxes

19
Measurements of H2O and CO2 flux at leaf scale on Stipa tenacissima (dominant plant specie) enables assessment of stomata conductance (respiration) and photosynthetic dynamics of the vegetation component. In addition, a customized gas exchange chamber has been designed to investigate Biological Soil Crusts (BSC) fluxes. For these purposes a portable IRGA (Infrarred Gas Analyser, LICOR‐6400) is used. All of these are point measurements in time over different field measurement campaigns depending on specific research interest. Moreover, soil CO2 exchange is conducted by (i) point measures of soil respiration mainly in relation with seasonal and rainfall event response and (ii) recently monitored in continuous registration by CO2 concentration sensors on a shallow (to asses diffusivity mechanisms) and a depth soil profile (to asses abiotic and biotic contribution to soil CO2 emissions).
20
(iii) EFFECTS OF BIOLOGICAL SOIL CRUSTS ON THE WATER BALANCE
One objective of the Geoecology and Desertification Research Group is to analyze the effects of Biological Soil Crusts (BSCs) on the water balance at different spatial scales. BSCs are an association of soil particles with cyanobacteria, algae, microfungi, liverworts, bryophytes and lichens that cover the uppermost millimetres of the soil surface in most arid and semi‐arid ecosystems and are one of the most conspicuous and important biotic components of these areas. They are found worldwide, occurring in hyperarid, arid, semi‐arid, sub‐humid, alpine and polar regions. In these regions, BSCs usually occupy places without vascular plants as well as intershrub spaces and they can cover up to 70 % of soil surface (Maestre el al., 2011). BSCs influence many soil parameters like cohesivity, soil stability, porosity and surface roughness that affect how water moves in the soil, and therefore, critically influence water availability and vegetation distribution patterns in semi‐arid areas. We are studying the influence of BSCs on the different components of the water balance (infiltration‐runoff, evaporation, soil moisture and dew) at small scale in three ecosystems representative of two key spatial distributions of soil crusts in semi‐arid areas:
A badlands area (El Cautivo, in Tabernas) over gypsiferous marls with silty soils where crusts occupy full landforms of the landscape and also the intershrubs spaces for landforms dominated by vascular plants, and
Two ecosystems in Cabo de Gata (Las Amoladeras and Balsa Blanca) over coarser soils where crusts occupy the open areas in between the shrubs. We selected these two sites as representative of two distinctive degradation stages based on a previous hierarchical classification of the ecosystems.
21
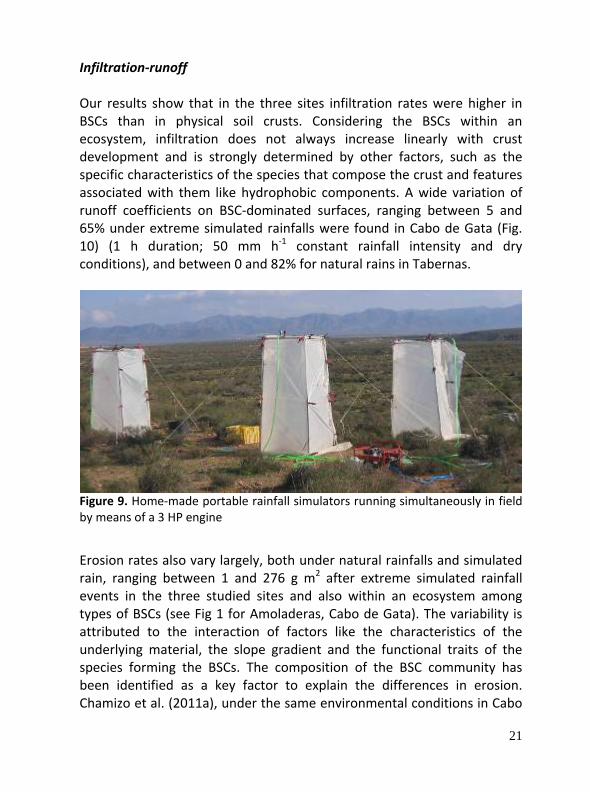
Infiltration‐runoff Our results show that in the three sites infiltration rates were higher in BSCs than in physical soil crusts. Considering the BSCs within an ecosystem, infiltration does not always increase linearly with crust development and is strongly determined by other factors, such as the specific characteristics of the species that compose the crust and features associated with them like hydrophobic components. A wide variation of runoff coefficients on BSC‐dominated surfaces, ranging between 5 and 65% under extreme simulated rainfalls were found in Cabo de Gata (Fig. 10) (1 h duration; 50 mm h‐1 constant rainfall intensity and dry conditions), and between 0 and 82% for natural rains in Tabernas.
Figure 9. Home‐made portable rainfall simulators running simultaneously in field by means of a 3 HP engine
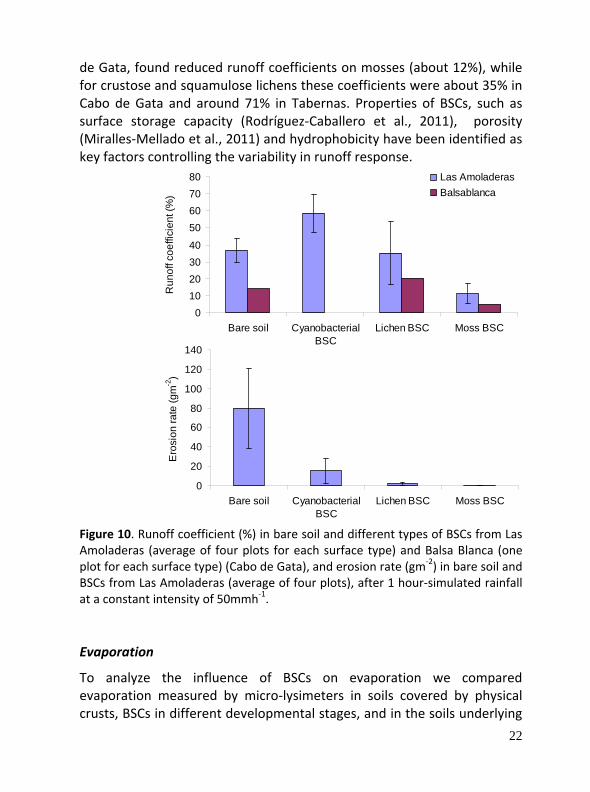
Erosion rates also vary largely, both under natural rainfalls and simulated rain, ranging between 1 and 276 g m2 after extreme simulated rainfall events in the three studied sites and also within an ecosystem among types of BSCs (see Fig 1 for Amoladeras, Cabo de Gata). The variability is attributed to the interaction of factors like the characteristics of the underlying material, the slope gradient and the functional traits of the species forming the BSCs. The composition of the BSC community has been identified as a key factor to explain the differences in erosion. Chamizo et al. (2011a), under the same environmental conditions in Cabo
22
de Gata, found reduced runoff coefficients on mosses (about 12%), while for crustose and squamulose lichens these coefficients were about 35% in Cabo de Gata and around 71% in Tabernas. Properties of BSCs, such as surface storage capacity (Rodríguez‐Caballero et al., 2011), porosity (Miralles‐Mellado et al., 2011) and hydrophobicity have been identified as key factors controlling the variability in runoff response.
0
20
40
60
80
100
120
140
Bare soil CyanobacterialBSC
Lichen BSC Moss BSC
Ero
sion
rate
(gm
-2)
010203040
50607080
Bare soil CyanobacterialBSC
Lichen BSC Moss BSC
Run
off c
oeffi
cien
t (%
)Las AmoladerasBalsablanca
Figure 10. Runoff coefficient (%) in bare soil and different types of BSCs from Las Amoladeras (average of four plots for each surface type) and Balsa Blanca (one plot for each surface type) (Cabo de Gata), and erosion rate (gm‐2) in bare soil and BSCs from Las Amoladeras (average of four plots), after 1 hour‐simulated rainfall at a constant intensity of 50mmh‐1. Evaporation
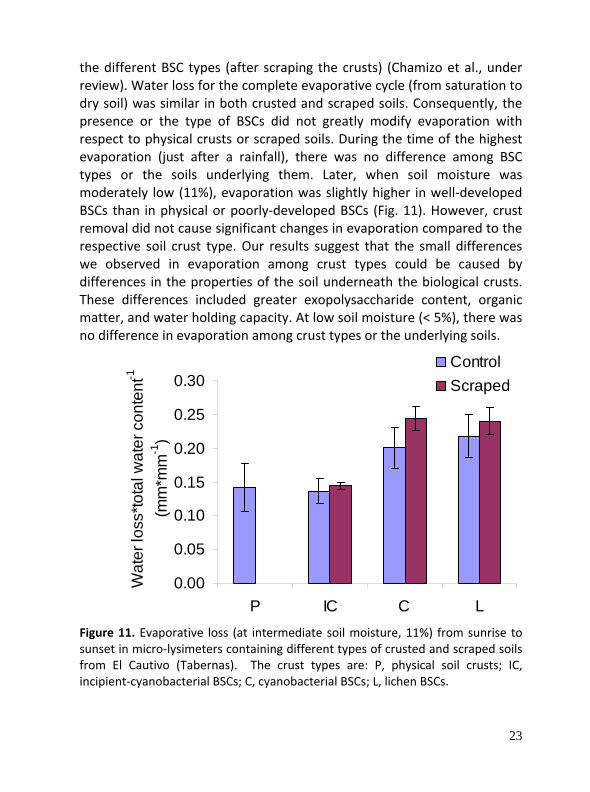
To analyze the influence of BSCs on evaporation we compared evaporation measured by micro‐lysimeters in soils covered by physical crusts, BSCs in different developmental stages, and in the soils underlying
23
the different BSC types (after scraping the crusts) (Chamizo et al., under review). Water loss for the complete evaporative cycle (from saturation to dry soil) was similar in both crusted and scraped soils. Consequently, the presence or the type of BSCs did not greatly modify evaporation with respect to physical crusts or scraped soils. During the time of the highest evaporation (just after a rainfall), there was no difference among BSC types or the soils underlying them. Later, when soil moisture was moderately low (11%), evaporation was slightly higher in well‐developed BSCs than in physical or poorly‐developed BSCs (Fig. 11). However, crust removal did not cause significant changes in evaporation compared to the respective soil crust type. Our results suggest that the small differences we observed in evaporation among crust types could be caused by differences in the properties of the soil underneath the biological crusts. These differences included greater exopolysaccharide content, organic matter, and water holding capacity. At low soil moisture (< 5%), there was no difference in evaporation among crust types or the underlying soils.
0.00
0.05
0.10
0.15
0.20
0.25
0.30
P IC C L
Wat
er lo
ss*to
tal w
ater
con
tent
-1
(mm
*mm
-1)
ControlScraped
Figure 11. Evaporative loss (at intermediate soil moisture, 11%) from sunrise to sunset in micro‐lysimeters containing different types of crusted and scraped soils from El Cautivo (Tabernas). The crust types are: P, physical soil crusts; IC, incipient‐cyanobacterial BSCs; C, cyanobacterial BSCs; L, lichen BSCs.
24
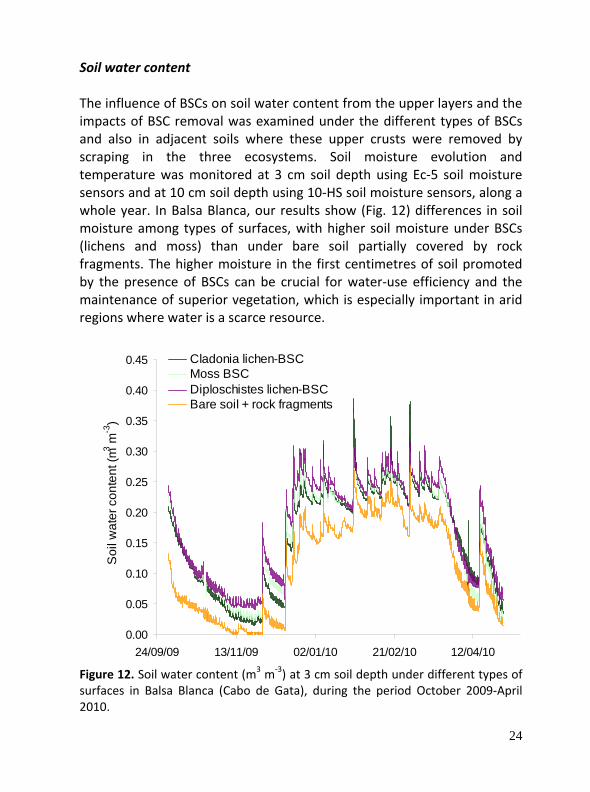
Soil water content The influence of BSCs on soil water content from the upper layers and the impacts of BSC removal was examined under the different types of BSCs and also in adjacent soils where these upper crusts were removed by scraping in the three ecosystems. Soil moisture evolution and temperature was monitored at 3 cm soil depth using Ec‐5 soil moisture sensors and at 10 cm soil depth using 10‐HS soil moisture sensors, along a whole year. In Balsa Blanca, our results show (Fig. 12) differences in soil moisture among types of surfaces, with higher soil moisture under BSCs (lichens and moss) than under bare soil partially covered by rock fragments. The higher moisture in the first centimetres of soil promoted by the presence of BSCs can be crucial for water‐use efficiency and the maintenance of superior vegetation, which is especially important in arid regions where water is a scarce resource.
0.00
0.05
0.10
0.15
0.20
0.25
0.30
0.35
0.40
0.45
24/09/09 13/11/09 02/01/10 21/02/10 12/04/10
Soi
l wat
er c
onte
nt (m
3 m-3
)
Cladonia lichen-BSCMoss BSCDiploschistes lichen-BSCBare soil + rock fragments
Figure 12. Soil water content (m3 m‐3) at 3 cm soil depth under different types of surfaces in Balsa Blanca (Cabo de Gata), during the period October 2009‐April 2010.
25
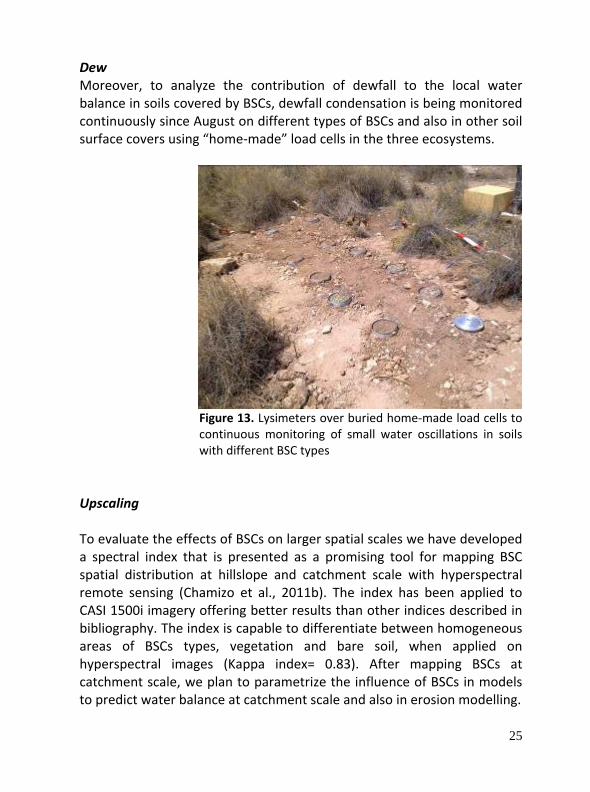
Dew Moreover, to analyze the contribution of dewfall to the local water balance in soils covered by BSCs, dewfall condensation is being monitored continuously since August on different types of BSCs and also in other soil surface covers using “home‐made” load cells in the three ecosystems.
Figure 13. Lysimeters over buried home‐made load cells to continuous monitoring of small water oscillations in soils with different BSC types
Upscaling To evaluate the effects of BSCs on larger spatial scales we have developed a spectral index that is presented as a promising tool for mapping BSC spatial distribution at hillslope and catchment scale with hyperspectral remote sensing (Chamizo et al., 2011b). The index has been applied to CASI 1500i imagery offering better results than other indices described in bibliography. The index is capable to differentiate between homogeneous areas of BSCs types, vegetation and bare soil, when applied on hyperspectral images (Kappa index= 0.83). After mapping BSCs at catchment scale, we plan to parametrize the influence of BSCs in models to predict water balance at catchment scale and also in erosion modelling.
26
2.1.3 Water re‐distribution at HILLSLOPE scale: spatially distributed runoff plots and soil moisture
Semiarid Mediterranean ecosystems have complex eco‐hydrologic relationships because of their general variable and limited water conditions. Surface water redistribution during rainfall events has the first modulating effect on the resulting water availability for plant use. High spatial heterogeneity in semiarid contexts promotes a complex and non‐linear hydrological response. Therefore, increasing knowledge on response thresholds and hydrological connectivity becomes critical to deal with the ecosystems functioning. For this purpose, a promising approach is to consider spatial‐pattern distribution of vegetation and bare‐surface components, supported by the conceptual model of discontinuous overland flow at hillslope scale (i.e. source‐sink mosaic). The general aim of the study is to investigate the influence of vegetation patterns on overland‐flow connectivity at hillslope scale. We analyze: (i) precipitation threshold conditions for runoff generation (trigger‐conditions) and (ii) characteristic runoff response of discrete spatial configuration features.
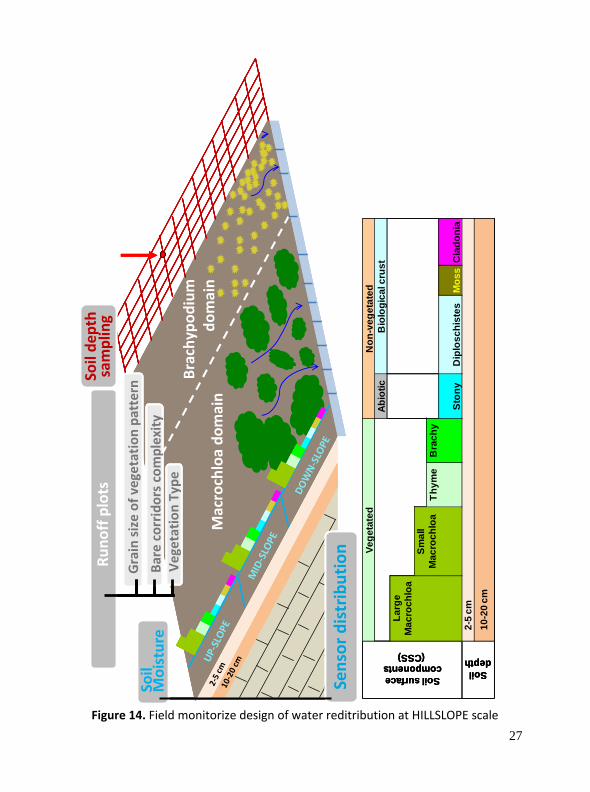
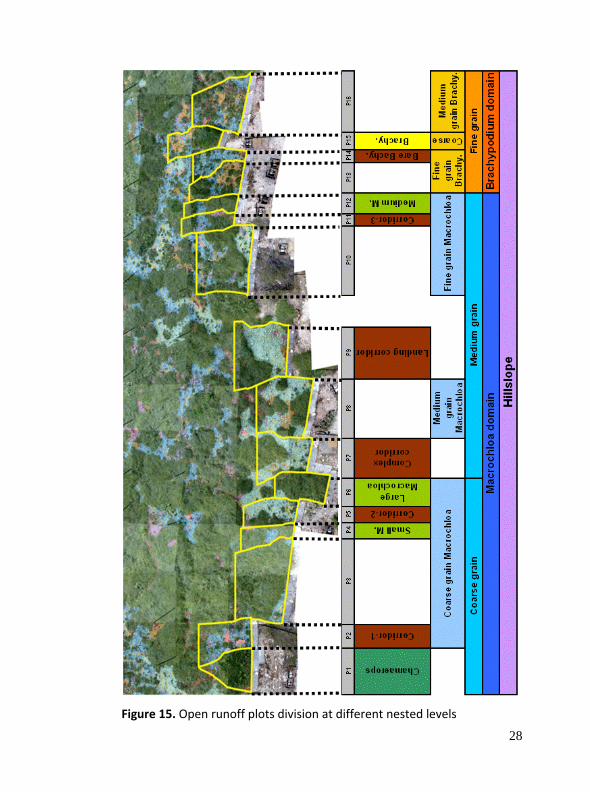
An experimental set‐up of 16 contiguous open runoff plots along a hillslope base 30 m wide has been applied. The collector plots were split using three criteria: (I) grain‐size of the vegetation pattern; (II) vegetation typology and (III) degree of complexity in the bare soil patches (Figure 14 and 15). This type of plot configuration allows for grouping of adjacent plot responses in the analytical process, and expanding interpretative options over spatial configuration. In addition, soil moisture is measured over a wide range of soil surface components (SSC) in order to complement knowledge of water redistribution processes on rainfall event and drying times. Soil depth will be sampled at a regular grid (0.5 m) across the whole longitudinal hillslope profile (Figure 14).
Runoff functioning
As expected, significant differences exist in individual behaviour between bare and vegetated surfaces with a great runoff production on bare corridors. In general terms, runoff response increases as bare corridor complexity increases, and Brachypodium corridor has the highest runoff response.
27
Soilsurfacecomponents
(CSS)
Vege
tate
dN
on-v
eget
ated
Abio
ticB
iolo
gica
l cru
stLa
rge
Mac
roch
loa
Smal
l M
acro
chlo
aTh
yme
Bra
chy
Ston
yD
iplo
schi
stes
Mos
sC
lado
nia
Soil depth
2-5
cm10
-20
cm
Soil
Moisture
Macrochloado
main
Brachypo
dium
do
main
2‐5 cm
10‐20 cmU
P‐SLOPE
MID‐SLOPE
DOWN‐SLOPE
Soil de
pth
sampling
Grain size of vegetation pa
ttern
Runo
ff plots
VegetationType
Bare
corridorscomplexity
Sensor
distribu
tion
Soilsurfacecomponents
(CSS)
Vege
tate
dN
on-v
eget
ated
Abio
ticB
iolo
gica
l cru
stLa
rge
Mac
roch
loa
Smal
l M
acro
chlo
aTh
yme
Bra
chy
Ston
yD
iplo
schi
stes
Mos
sC
lado
nia
Soil depth
2-5
cm10
-20
cm
Soil
Moisture
Soil
Moisture
Macrochloado
main
Brachypo
dium
do
main
2‐5 cm
10‐20 cmU
P‐SLOPE
MID‐SLOPE
DOWN‐SLOPE
Soil de
pth
sampling
Soil de
pth
sampling
Grain size of vegetation pa
ttern
Runo
ff plots
VegetationType
Bare
corridorscomplexity
Grain size of vegetation pa
ttern
Grain size of vegetation pa
ttern
Runo
ff plots
VegetationType
Bare
corridorscomplexity
Runo
ff plots
Runo
ff plots
VegetationType
VegetationType
Bare
corridorscomplexity
Bare
corridorscomplexity
Sensor
distribu
tion
Sensor
distribu
tion
Figure 14. Field monitorize design of water reditribution at HILLSLOPE scale
28
Figure 15. Open runoff plots division at different nested levels
29
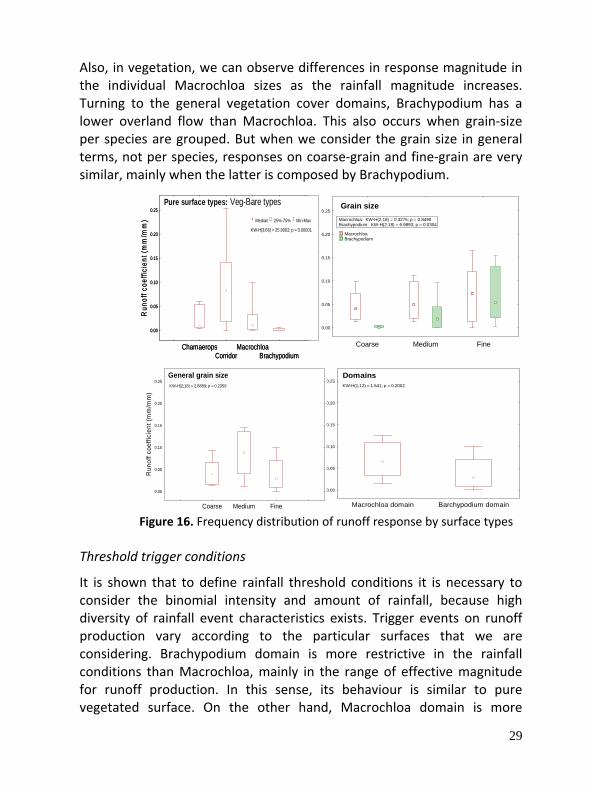
Also, in vegetation, we can observe differences in response magnitude in the individual Macrochloa sizes as the rainfall magnitude increases. Turning to the general vegetation cover domains, Brachypodium has a lower overland flow than Macrochloa. This also occurs when grain‐size per species are grouped. But when we consider the grain size in general terms, not per species, responses on coarse‐grain and fine‐grain are very similar, mainly when the latter is composed by Brachypodium.
Macrochloa domain Barchypodium domain
0.00
0.05
0.10
0.15
0.20
0.25
Run
off c
oeffi
cien
t (m
m/m
m)
KW-H(1;12) = 1.641; p = 0.2002
Domains
Coarse Medium Fine
0.00
0.05
0.10
0.15
0.20
0.25
Run
off c
oeffi
cien
t (m
m/m
m) Macrochloa: KW-H(2;18) = 0.3275; p = 0.8490
Brachypodium: KW-H(2;18) = 6.9893; p = 0.0304
Macrochloa Brachypodium
Grain size
ChamaeropsCorridor
MacrochloaBrachypodium
0.00
0.05
0.10
0.15
0.20
0.25
Run
off c
oeffi
cien
t (m
m/m
m)
KW-H(3;66) = 25.9002; p = 0.00001
Pure surface types: Veg-Bare types
Median 25%-75% Min-Max
Coarse Medium Fine
0.00
0.05
0.10
0.15
0.20
0.25
Run
off c
oeffi
cien
t (m
m/m
m)
KW-H(2;18) = 2.8889; p = 0.2359
General grain size
Macrochloa domain Barchypodium domain
0.00
0.05
0.10
0.15
0.20
0.25
Run
off c
oeffi
cien
t (m
m/m
m)
KW-H(1;12) = 1.641; p = 0.2002
Domains
Macrochloa domain Barchypodium domain
0.00
0.05
0.10
0.15
0.20
0.25
Run
off c
oeffi
cien
t (m
m/m
m)
KW-H(1;12) = 1.641; p = 0.2002
Domains
Coarse Medium Fine
0.00
0.05
0.10
0.15
0.20
0.25
Run
off c
oeffi
cien
t (m
m/m
m) Macrochloa: KW-H(2;18) = 0.3275; p = 0.8490
Brachypodium: KW-H(2;18) = 6.9893; p = 0.0304
Macrochloa Brachypodium
Grain size
ChamaeropsCorridor
MacrochloaBrachypodium
0.00
0.05
0.10
0.15
0.20
0.25
Run
off c
oeffi
cien
t (m
m/m
m)
KW-H(3;66) = 25.9002; p = 0.00001
Pure surface types: Veg-Bare types
Median 25%-75% Min-Max
Coarse Medium Fine
0.00
0.05
0.10
0.15
0.20
0.25
Run
off c
oeffi
cien
t (m
m/m
m)
KW-H(2;18) = 2.8889; p = 0.2359
General grain size
Coarse Medium Fine
0.00
0.05
0.10
0.15
0.20
0.25
Run
off c
oeffi
cien
t (m
m/m
m)
KW-H(2;18) = 2.8889; p = 0.2359
General grain size
Figure 16. Frequency distribution of runoff response by surface types
Threshold trigger conditions
It is shown that to define rainfall threshold conditions it is necessary to consider the binomial intensity and amount of rainfall, because high diversity of rainfall event characteristics exists. Trigger events on runoff production vary according to the particular surfaces that we are considering. Brachypodium domain is more restrictive in the rainfall conditions than Macrochloa, mainly in the range of effective magnitude for runoff production. In this sense, its behaviour is similar to pure vegetated surface. On the other hand, Macrochloa domain is more
30
sensitive to a wide range of rainstorm situations, obtaining runoff with low intensity and intermediate rainfall events. Its pattern is similar to the bare corridors plots.
Eco‐hydrlogical implications
Macrochloa domain shows a better water efficiency use, because vegetation cover reaches higher percentages than Brachypodium domain even with lower inflitration rate. We attribute this to the internal functioning as “source‐sink mosaic of the vegetation patterns. Hillslope spatial distribution
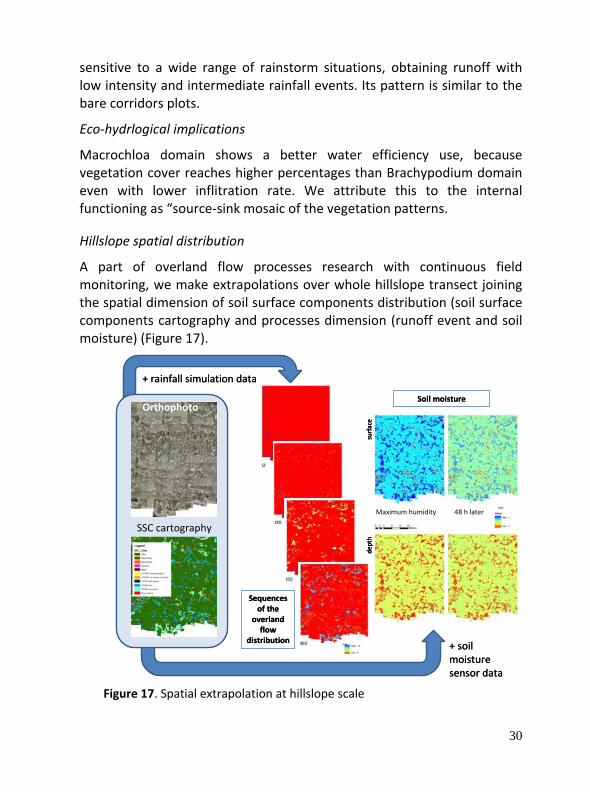
A part of overland flow processes research with continuous field monitoring, we make extrapolations over whole hillslope transect joining the spatial dimension of soil surface components distribution (soil surface components cartography and processes dimension (runoff event and soil moisture) (Figure 17).
Orthophoto
Sequences of the
overland flow
distribution
Soil moisture
mm
Maximum humidity 48 h later
surface
depth
SWC
+ rainfall simulation data
+ soil moisture sensor data
SSC cartography
Orthophoto
Sequences of the
overland flow
distribution
Soil moisture
mm
Maximum humidity 48 h later
surface
depth
SWC
Maximum humidity 48 h later
surface
depth
SWC
+ rainfall simulation data
+ soil moisture sensor data
SSC cartography
Figure 17. Spatial extrapolation at hillslope scale
31
2.2 Vegetation response to climate change under different rainfall regime scenarios
2.2.1 Rainfall patterns manipulation experiment
The ongoing Climatic Change has led not only a global increase of temperatures but also changes in rainfall regimens, which are expected to be different according to the regions. For western Mediterranean region, a decrease in the total annual rainfall is forecasted, along with a reduction in the number of raindays, generating longer drought periods. Little information is available about the effects of these changes on natural vegetation. These effects could be critical in semiarid Mediterranean environments, where water availability is a limiting factor. By means of this installation, our aim is to study the effect of both the rainfall amount and the number of rainy days reduction on ecophysiological responses (photosynthetic rate, stomatal conductance, intrinsic water use efficiency (WUE) and chlorophyll fluorescence, Fv/Fm) in Macrochloa tenacissima (=Stipa tenacissima; ‘alpha grass’), which is the most representative plants of Mediterranean semi‐arid ecosystems.
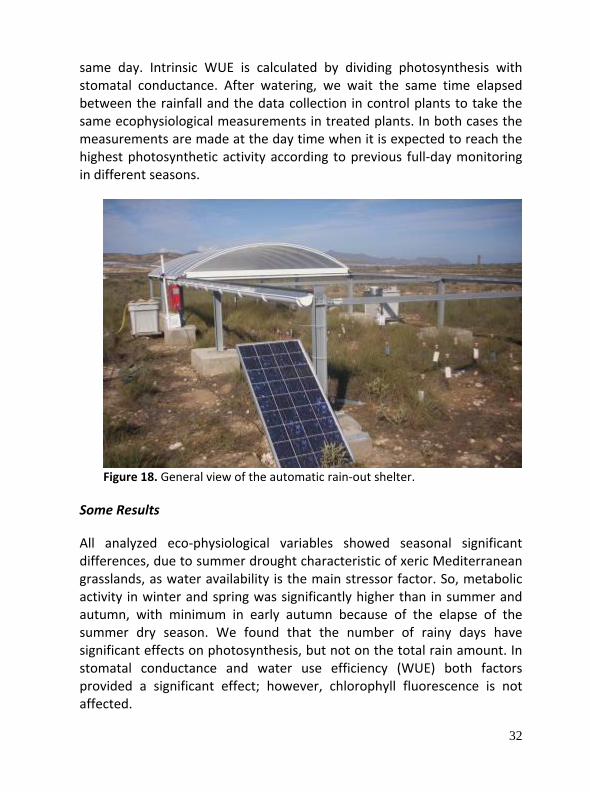
A transparent polycarbonate mobile shelter with a rain sensor has been designed to cover 27 plots of Macrochloa tenacissima with rainfall, and uncover them the rest of the time to avoid micro‐climatic changes (Figure 18). Two factors are being factorially tested by differential watering: the amount of rain water and number of rain days, both with three levels: 100, 75 and 50% of the natural average values of rain amount or number of raindays. Waterings are calculated as the difference between two pluviometers (outside and under the shelter), taking into account the surface of each plot, and are applied using the rainwater, which is collected by the shelter. Another 10 plants outside the shelter (under natural rainfall conditions) are used as control. Irrigations are made by intervals of 1 to 3 days after a rain, and photosynthesis and stomatal conductance (IRGA model Licor‐6400) and leaves fluorescences (Hansatech fluorometer Handy PEA) are recorded in control plants at the
32
same day. Intrinsic WUE is calculated by dividing photosynthesis with stomatal conductance. After watering, we wait the same time elapsed between the rainfall and the data collection in control plants to take the same ecophysiological measurements in treated plants. In both cases the measurements are made at the day time when it is expected to reach the highest photosynthetic activity according to previous full‐day monitoring in different seasons.
Figure 18. General view of the automatic rain‐out shelter.
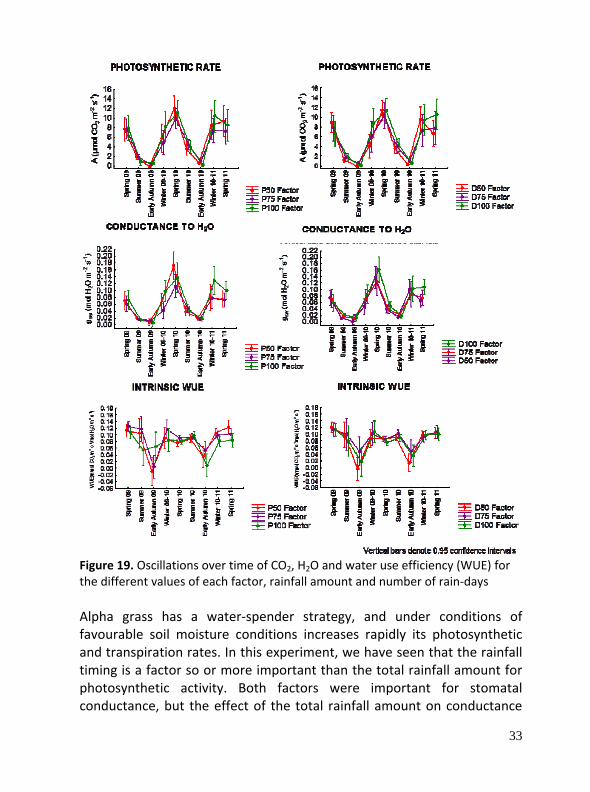
Some Results All analyzed eco‐physiological variables showed seasonal significant differences, due to summer drought characteristic of xeric Mediterranean grasslands, as water availability is the main stressor factor. So, metabolic activity in winter and spring was significantly higher than in summer and autumn, with minimum in early autumn because of the elapse of the summer dry season. We found that the number of rainy days have significant effects on photosynthesis, but not on the total rain amount. In stomatal conductance and water use efficiency (WUE) both factors provided a significant effect; however, chlorophyll fluorescence is not affected.
33
Figure 19. Oscillations over time of CO2, H2O and water use efficiency (WUE) for the different values of each factor, rainfall amount and number of rain‐days Alpha grass has a water‐spender strategy, and under conditions of favourable soil moisture conditions increases rapidly its photosynthetic and transpiration rates. In this experiment, we have seen that the rainfall timing is a factor so or more important than the total rainfall amount for photosynthetic activity. Both factors were important for stomatal conductance, but the effect of the total rainfall amount on conductance
34
depends on its annual magnitude. In early autumn, intrinsic WUE suffered a significantly decline, due to a lag between photosynthesis and conductance responses to the first water pulses during recovery after summer (dry season). We haven’t found any effect of the implemented factors on Fv/Fm variable, probably because this species is tolerant to water stress and has different chemical and physical mechanisms to prevent damages in this photosynthetic system.
2.2.2 Ecosystem response to the climate change scenarios: Evapotranspiration balance
The Evapotranspiration Clumped Model (CM) validated with Eddy covariance (EC) measurements allowed us to asses the behaviour under different climate change scenarios of ecosystem. The different climate change scenarios were imposed by 9 different irrigation treatments from the above explained rainfall exclusion experiment.
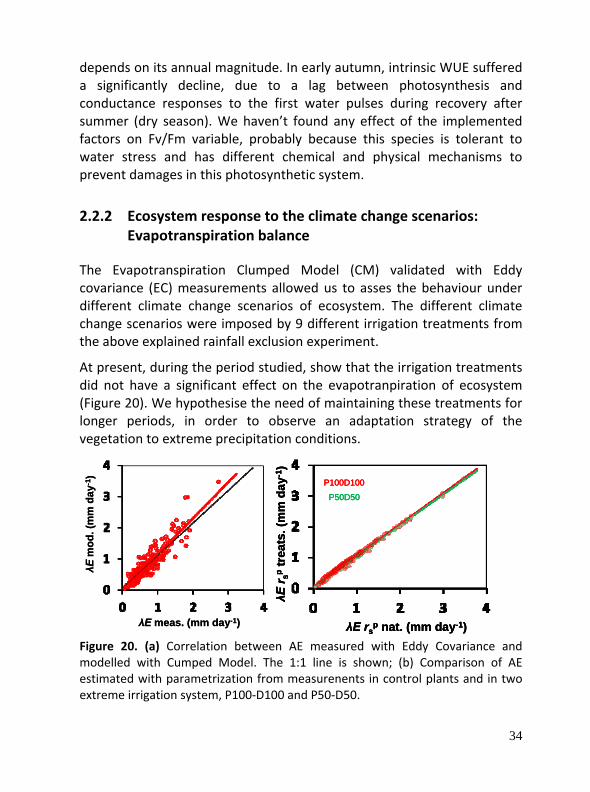
At present, during the period studied, show that the irrigation treatments did not have a significant effect on the evapotranpiration of ecosystem (Figure 20). We hypothesise the need of maintaining these treatments for longer periods, in order to observe an adaptation strategy of the vegetation to extreme precipitation conditions.
Figure 20. (a) Correlation between AE measured with Eddy Covariance and modelled with Cumped Model. The 1:1 line is shown; (b) Comparison of AE estimated with parametrization from measurenents in control plants and in two extreme irrigation system, P100‐D100 and P50‐D50.
λEr s
ptr
eats
. (m
m d
ay-1
)
λE rsp nat. (mm day-1)
P100D100
P50D50
λEr s
ptr
eats
. (m
m d
ay-1
)
λE rsp nat. (mm day-1)
λEr s
ptr
eats
. (m
m d
ay-1
)
λE rsp nat. (mm day-1)
P100D100
P50D50
P100D100
P50D50
λEm
od. (
mm
day
-1)
λE meas. (mm day-1)
λEm
od. (
mm
day
-1)
λE meas. (mm day-1)
35
3. REFERENCES
Brenner, A.J., Incoll, L.D., (1997) The effect of clumping and stomatal response on evaporation from sparsely vegetated shrublands. Agricultural and Forest Meteorology 84 (3‐4): 187‐205.
Chamizo, S., Cantón, Y., Lázaro, R., Solé‐Benet, A., Domingo, F. (2011a) Crust composition and disturbance drive infiltration through biological soil crusts in semiarid ecosystems. Ecosystems, accepted.
Chamizo, S., Cantón, Y., Domingo, F., Belnap, J. Evaporative losses from soils covered by physical and different types of biological soil crusts. Hydrological processes, under review.
Chamizo, S., Stevens, A., Cantón, Y. Miralles, I. Domingo, F., van Wesemael, B. (2011b) Discriminating soil crust type, development stage and degree of disturbance in semi‐arid environments from their spectral characteristics. European Journal of Soil Science, accepted.
Domingo, F., Villagarcía, L., Brenner, A.J., Puigdefábregas, J. (1999) Evapotranspiration model for semi‐arid shrub‐lands tested against data from SE Spain. Agricultural and Forest Meteorology 95 (2): 67‐84.
Kustas, W. P. &Norman, J. M. (1997). A two‐source approach for estimating turbulent fluxes using multiple angle thermal infrared observations. Water Resources Research 33 (6): 1495‐1508.
Maestre, F.T., Bowker, M.A., Cantón, Y., Castillo‐Monroy, A.P, Cortina, J., Escolar, C. et al. (2011) Ecology and functional roles of biological soil crusts in semi‐arid ecosystems of Spain. Journal of Arid Environments, in press, doi: 10.1016/j.jaridenv.2010.12.008.
McMillen, R.T. (1988) An eddy correlation technique with expected applicability to non‐simple terrain. Boundary‐Layer Meteorology, 43 (3): 231‐245.
Miralles, I., Cantón, Y., Solé‐Benet, A. (2011) Two‐dimensional porosity of crusted silty soils: indicators of soil quality in semiarid rangelands? Soil Science Society of America Journal, 75: 1289–1301.
36
Moncrieff J.B.a e , Massheder, J.M.a , De Bruin, H.b , Elbers, J.c , Friborg, T.d , Heusinkveld, B.b , Kabat, P.c , Scott, S.a , Soegaard, H.d , Verhoef, A.b 1997 A system to measure surface fluxes of momentum, sensible heat, water vapour and carbon dioxide. Journal of Hydrology, 188‐189, Issue 1‐4, February 1997, Pages 589‐611
Norman, J. M., Kustas, W. P. & Humes, K. S. (1995). Source approach for estimating soil and vegetation energy fluxes in observations of directional radiometric surface temperature. Agricultural and Forest Meteorology 77(3‐4): 263‐293.
Rodríguez‐Caballero, E., Cantón, Y., Chamizo, S., Afana, A., Solé‐Benet, A. (2011) Is microtopography induced by BSCs a key parameter for runoff and erosion? Geomorphology, accepted.
Villagarcía, L., Were, A., García, M., Domingo, F. (2010) Sensitivity of a clumped model of evapotranspiration to surface resistance parameterisations: application in a semi‐arid environment. Agricultural and Forest Meteorology 150 (7‐8): 1065‐1078.
Were, A., Villagarcia, L., Domingo, F., Moro, M.J., Dolman, A.J. (2008) Aggregating spatial heterogeneity in a bush vegetation patch in semi‐arid SE Spain: a multilayer model versus a single‐layer model. Journal of Hydrology 349 (1‐2): 156‐167.
4. SCIENTIFIC PRODUCTION RELATIVE TO BALSA BLANCA
4.1 Publications
Chamizo, S., Cantón, Y., Lázaro, R., Solé‐Benet, A., Domingo, F. (2011) Crust composition and disturbance drive infiltration through biological soil crusts in semiarid ecosystems. Ecosystems, accepted.
Chamizo, S., Stevens, A., Cantón, Y. Miralles, I. Domingo, F., van Wesemael, B. (2011) Discriminating soil crust type, development stage and degree of disturbance in semi‐arid environments from their spectral characteristics. European Journal of Soil Science, accepted.
37
Chamizo, S., Cantón, Y., Domingo, F., Belnap, J. Evaporative losses from soils covered by physical and different types of biological soil crusts. Hydrological processes, under review.
Domingo, F., Serrano‐Ortiz, P., Were, A., Villagarcía, L., García, M., Ramírez, D.A., Kowalski, A. S., Moro, M.J., Rey, A. & Oyonarte, C. (2011) A review of carbon and water exchange studies in semiarid ecosystems in SE Spain. Journal of Arid Environments, in press. doi: 10.1016/j.jaridenv.2011.06.018.
Maestre, F.T., Bowker, M.A., Cantón, Y., Castillo‐Monroy, A.P, Cortina, J., Escolar, C. et al. (2011) Ecology and functional roles of biological soil crusts in semi‐arid ecosystems of Spain. Journal of Arid Environments, in press. doi: 10.1016/j.jaridenv.2010.12.008.
Miralles, I., Cantón, Y., Solé‐Benet, A. (2011) Two‐dimensional porosity of crusted silty soils: indicators of soil quality in semiarid rangelands?. Soil Science Society of America Journal, 75: 1289‐1301.
Rey A., Pegoraro E., Oyonarte C., Were A., Escribano P., Raimundo J. (2011) Impact of land degradation on soil respiration in a steppe ecosystem in the SE of Spain. Soil Biology and Biochemistry 43, 393‐403.
Rey, A., Belelli‐Marchesini, L., Were, A., Serrano‐Ortiz, P., Etiope, G., Papale, D., Domingo, F. & Pegoraro, E. (2011) Wind as a main driver of the net ecosystem carbon balance of a semiarid Mediterranean steppe in the South East of Spain. Global Change Biology, in press. doi: 10.1111/j.1365‐2486.2011.02534.x.
Rodríguez‐Caballero, E., Cantón, Y., Chamizo, S., Afana, A., Solé‐Benet, A. Is microtopography induced by BSCs a key parameter for runoff and erosion? Geomorphology, accepted.
38
4.2 Conference contribution
Congreso Internacional sobre Desertificación en memoria del profesor John B. Thornes. Universidad de Murcia; SEG. Murcia, 16‐18 Seotember 2009.
‐ Chamizo, S., Miralles, I., Cantón, Y., Lázaro, R., Solé‐Benet, Domingo, F. Physico‐chemical and spectral characteristics of soil crusts in semiarid areas. An ecosystem condition index?
‐ Morillas, L, García, M., Zarco‐Tejada, P., Ladrón de Guevara, M., Villagarcía, L., Were, A. & Domingo. Derivation of the canopy conductance from surface temperature and spectral indices for estimating evapotranspiration in semiarid vegetation.
‐ Moro, M.J., Were, A., Morillas, L., Villagarcía, L., Cantón, Y., Lázaro, R., P. Serrano‐Ortiz, Kowalski, A.S. & Domingo, F. Dew contribution to the water balance in a semiarid coastal steppe ecosystem.
IX Congreso de la Asociación Española de Ecología Terrestre (AEET).
Úbeda (Jaén), October 2009.
‐ Ladrón de Guevara, M., Lázaro, R., Arnau, E., Domingo, F. Diseño y primeros resultados de un experimento de exclusión de lluvias en un ecosistema semiárido mediterráneo.
XI Reunión Nacional de Geomorfología. Sociedad Española de Geomorfología (SEG). Solsona (Lérida), September 2010.
‐ Arnau‐Rosalén, E., Lázaro‐Suau, R., Calvo‐Cases, A., Ladrón de Guevara, M., Boix‐Fayos, C. Efecto de la distribución espacial de la vegetación en la escorrentía mediante un nuevo diseño de parcelas.
V Simposio Nacional sobre Degradación y Uso Sostenible del Suelo
(CDUSS). Murcia, 27‐30 Juny 2011
‐ Arnau Rosalén, E., Boix Fayos, C., Molina Sanchís, I., Lázaro Suau, R., Calvo Cases, A. Identificación de procesos de movilización de sedimento a escala de ladera relacionados con los patrones de distribución espacial de componentes superficiales en un gradiente climático.
39
12th European Ecological Federation Congress. Asociación Española de Ecología Terrestre (AEET). Ávila (Spain), 25‐29 September 2011
‐ Chamizo, Sonia. Rodríguez‐Caballero, Emilio. Cantón, Yolanda. Domingo, Francisco. Escudero, Adrián. Relationship among biological soil crusts, rainfall characteristics and runoff at plot and hillslope scales.
‐ Contreras, Sergio. Serrano‐Ortiz, Penélope. Morillas, Laura. Uclés, Olga. Sánchez‐Cañete, Enrique P. Enhanced Vegetation Index from MODIS and rainfall as predictors of actual evapotranspiration in two dryland sites at SE Spain.
‐ Ucles Ramos, Olga Maria. Villagarcia Saiz, Luis. Cantón Castilla, Yolanda. Lazaro Suau, Roberto. Domingo Poveda, Francisco. Dewfall deposition on contrasted slope aspects in a badlands ecosystem in SE Spain.
‐ Arnau‐Rosalén, Eva. Molina‐Sanchis, Isabel. Lázaro‐Suau, Roberto. Ladrón de Guevara, Mónica. Boix‐Fayos, Carolina, Calvo‐Cases, Adolfo. Runoff‐driven soil water redistribution on the basis of eco‐hydrological relationships.
‐ Molina, Isabel. Lázaro, Roberto. Cayuela, Luís. Arnau, Eva. Calvo, Adolfo. Ladrón de Guevara, Monica. Effect of the definition of rainfall event on runoff analysis.
‐ Morillas, Laura. Uclés, Olga. P. Sanchez‐Cañete, Enrique. García, Mónica. Villagarcía, Luis. Domingo, Francisco. Improving evapotranspiration estimates in semiarid ecosystems: the role of soil evaporation.
‐ Rodríguez Caballero, Emilio. Chamizo, Sonia. Cantón, Yolanda. Lazaro, Roberto. Escudero, Adrian. Runoff and Erosion in semiarid ecosystems depend on complex interactions among some features of Biological Soil Crusts and rainfall .
‐ Villagarcía, Luis. Ladrón de Guevara, Mónica. Morillas, Laura. Chamizo, Sonia. Were, Ana. Serrano, Penélope. Domingo, Francisco. Lázaro, Roberto. Effect on evapotranspiration of the change in precipitation patterns on a semiarid ecosystem from SE Spain.
40
‐ Ladrón de Guevara, Mónica. Lázaro, Roberto. Arnau, Eva. Domingo, Francisco. Molina, Isabel. Mora, Juan Luis. Changes in Macrochloa tenacissima activity after undergoing an altered rainfall regime in natural environment (SE Spain).
‐ Lázaro, Roberto. Ladrón de Guevara, Mónica. Quero, José Luis. Ochoa, Victoria. Escolar, Cristina. Molina, Isabel. Arnau, Eva. Mora, Juan Luis. Maestre, Fernando. Do Climatic Change affect Biological Soil Crust functions?.
‐ Sánchez‐Cañete, E. P., Serrano‐Ortiz, P., Kowalski, A. S., Oyonarte, C., Domingo, F. Main drivers controlling subterranean CO2 exchanges in a semiarid ecosystem of SE Spain.
5. FUNDING PROJECTS
Medida y modelización de flujos de carbono y agua en ecosistemas semiáridos del sureste español ‐ Integración de técnicas micrometeorológicas y espectrales. Plan Nacional de I+D+i, Programa Nacional de Atmósfera, Clima y Cambio Global (Ref.: CGL2011‐27493), convotoria de 2011. 3 years. Francisco Domingo (EEZA‐CSIC).
Efectos de las costras físicas y biológicas del suelo sobre el balance de agua y la erosión en ambientes semiáridos (COSTRAS). Proyecto de Excelencia de la Junta de Andalucía including ERDF funds (Ref.: RNM 3614). January 2009 ‐ January 2013. Yolanda Cantón (Univ. de Almería).
Greenhouse gas management in European land use systems. European Commission (FP7), Call FP7‐ENV‐2009‐1.1.3.1, Project Code 244122. January 2010 – Juny 2014. Annette Freibauer (Johann. H. von Thuenen‐Institute, Braunschweig, Alemania), Francisco Domingo (EEZA‐CSIC).
Diseño experimental de indicadores y metodología del programa de seguimiento de los efectos del cambio global en zonas áridas y semiáridas del levante andaluz (GLOCHARID)‐ SUBPROYECTO ATMÓSFERA: BALANCES DE CARBONO Y AGUA Junta de Andalucía. Juny 2010 ‐ December 2012. Cecilio Oyonarte (Univ. de Almería) y Francisco Domingo (EEZA‐CSIC).
41
Balance de carbono en ecosistemas carbonatados: discriminación entre procesos bióticos y abióticos (GEOCARBO). Proyecto de Excelencia de la Junta de Andalucía (Ref.: RNM 3721). January 2009 ‐ January 2013. Francisco Domingo (EEZA‐CSIC).
Balance de carbono en costras biologicas de ecosistemas semiaridos (BACARCOS). Plan Nacional de I+D+i, Subprograma de Proyectos de Investigación Fundamental no orientada including ERDF funds. Convocatoria 2011. (Ref.: CGL2011‐29429), convotoria de 2011. 3 years. Yolanda Cantón (Univ. de Almería).
Consecuencias de cambios experimentales en el patrón de las precipitaciones sobre la vegetación en el mediterráneo semiárido, incluyendo el modelado espacialmente distribuido del agua disponible (PREVEA). Plan Nacional de I+D+i, Programa Nacional de Biodiversidad, Ciencias de la Tierra y Cambio Global (Ref.: CGL2007‐63258/BOS).October 2007 – September 2010. Roberto Lázaro Suau (EEZA‐CSIC).
Procesos y balances hidrológicos y de sedimentos a diferentes escalas espaciales en ambientes mediterráneos: Efectos de las fluctuaciones climáticas y los cambios de uso del suelo (PROBASE). M.E.C. (Proyecto Eje C‐Consolider, Ref.: CGL2006‐11619/HID). Oct 2006 HASTA: Sep 2011. F. Gallart (IJA‐CSIC), Francisco Domingo (EEZA‐CSIC).
Efecto del cambio global sobre la biodiversidad y el funcionamiento ecosistémico mediante la identificación de áreas sensibles de referencia en el SE peninsular (CAMBIO). Proyecto de Excelencia de la Junta de Andalucía (Ref.: RNM 1280): April 2006‐ Marzo 2010. Javier Cabello (Universidad de Almería).
Balance de carbono y agua en ecosistemas de matorral mediterráneo: predicción de su respuesta al cambio climático (BACAEMA). Proyecto de Excelencia de la Junta de Andalucía (Ref.: RNM 332). Abril 2006 HASTA: Marzo 2010. Andrew Kowalski (Universidad de Granada).

