baltic countries overview
DESCRIPTION
Baltic countries overviewTRANSCRIPT
Confidential and Proprietary Copyright © 2010 The Nielsen Company
1
May, 2010
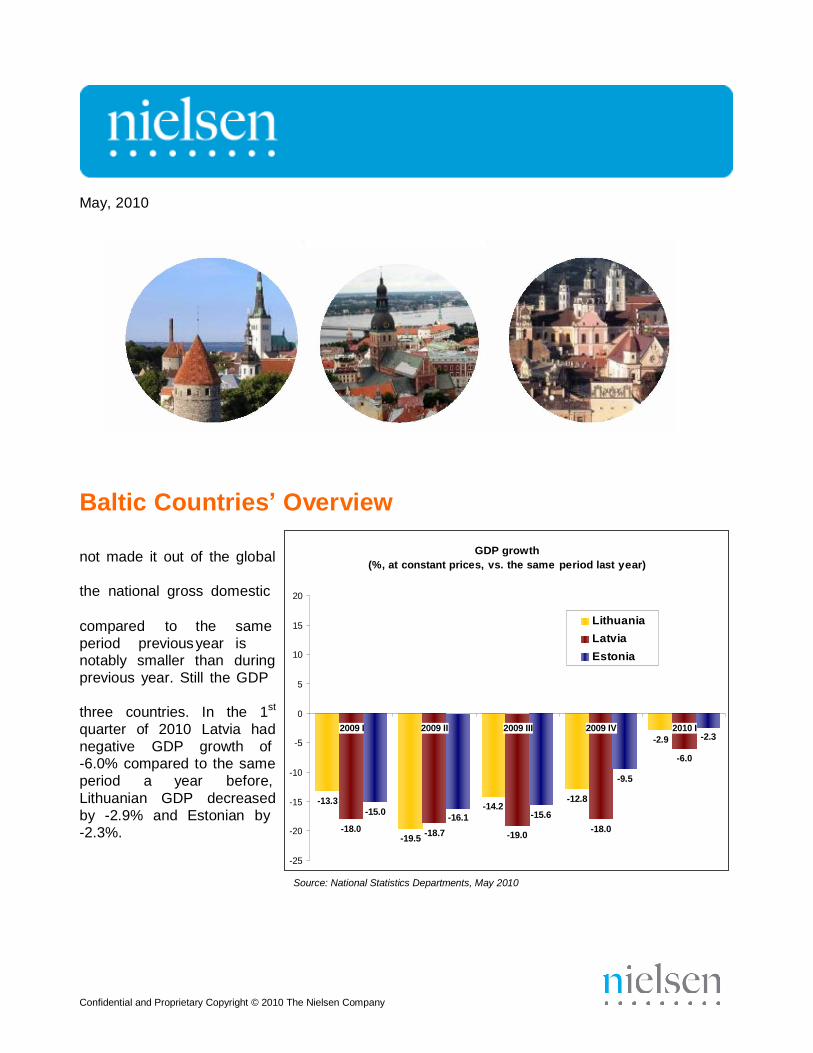
Baltic Countries’ Overview
not made it out of the global
the national gross domestic
compared to the same
period previous year is notably smaller than during
previous year. Still the GDP
three countries. In the 1st
quarter of 2010 Latvia had
negative GDP growth of -6.0% compared to the same
period a year before,
Lithuanian GDP decreased
by -2.9% and Estonian by
20
15
10
5
0
-5
-10
-15
-13.3
GDP growth
(%, at constant prices, vs. the same period last year)
Lithuania
Latvia
Estonia
2009 I 2009 II 2009 III 2009 IV 2010 I
-2.9
-6.0
-9.5
-12.8
-15.0 -14.2
-16.1 -15.6
-2.3
-2.3%. -20 -18.0 -19.5
-18.7 -19.0 -18.0
-25
Source: National Statistics Departments, May 2010

Confidential and Proprietary Copyright © 2010 The Nielsen Company
2
-3%
Latv
ia
Lithuania
Esto
nia
Hungary
Czech
Rep.
Irela
nd
Fin
land
Gre
ece
Port
ugal
Sw
itzerland
Neth
erlands
Italy
Slo
vakia
Denm
ark
Spain
Germ
any
Austr
ia
Belg
ium
Fra
nce
UK
Pola
nd
Sw
eden
Norw
ay
Turk
ey
Q1 2010 growth rates per country (versus Q1 2009)
20%
1% 1% 1% 2% 2% 2% 2% 2% 3%
9%
4% 5% 7%
21%
3% -25%% -1% -14%%% 02%% 1%
1% 4%
1% 3% 1% 3% 2% 1% 1% 2% 4%
2% 1% 2% 1% 2%
-0.8% 0% 0% -01%
-3%
0% -32% 1%
-2% 0% -1% 1% -1%
-3.8% -5.4% -3% -3% -6-2%% -7% -4%
-11.0% -4.1%
-12.3%
-4% -3%
-9.5% -11.8%
-16.2%
Unit value change Volume growth Value Growth
Source: Nielsen Growth Reporter, May, maitinimo kedutes
The estimated nominal value growth for total Europe was +4.1% for the 1st quarter of 2010
compared to the same quarter of 2009. The estimated nominal value growth in the FMCG sector
was still negative for all Baltic countries, in Latvia -16.2%, Lithuania -11.8% and the lowest in Estonia -9.5% in the 1st quarter of 2010.
The estimated volume change for Latvia was -12.3%, followed by -11.0% in Lithuania and -4.1%
in Estonia in the 1st quarter of 2010. The volume change in total Europe was +1.3% in 1st quarter
of 2010 compared to same period last year. Volume change for the 4th quarter of 2009 was 1.6%.
In the first half of 2010 the consumer confidence index decreased in Estonia reaching 62 points
(66 in the 2nd half of 2009) and in Lithuania to 46 points (54 points in the 2nd half of 2009). In
Latvia the index grew to 53 points from 49 in the 2nd
half of 2009. The index is based on responses to three questions regarding perceptions of local job prospects, personal finances and whether or not it’s a good time to buy things that people need and want, all over a timeframe of
the next 12 months. For Europe the average consumer confidence index in the 1st half of 2010
was 78 (76 in the 2nd half of 2009). The global average consumer confidence index for the 1st
quarter in 2010 was 92 points which has increased constantly from its lowest point of 77 in the 1st
quarter of 2009.
95% of Latvians and 93% of Lithuanians believe that their country is in recession. 87% of
Estonians also thinks so. All Baltic nations are rather pessimistic about the recession ending
during the next year. 15% of Estonians and 13% of Lithuanians who said that their country is
currently in recession believe that it will be out of the recession in the next 12 months. Just 7% of
Latvians, who answered that their country is in recession, feel the same way.
Confidential and Proprietary Copyright © 2010 The Nielsen Company
3
Lithuania
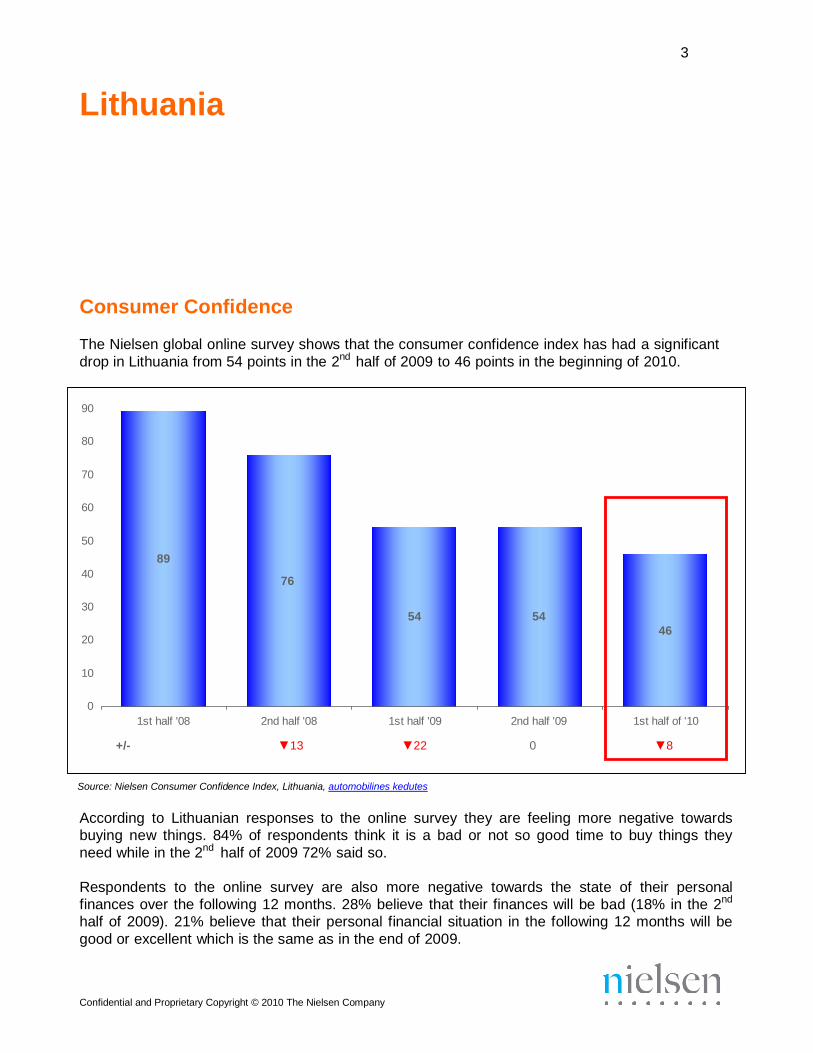
Consumer Confidence
The Nielsen global online survey shows that the consumer confidence index has had a significant
drop in Lithuania from 54 points in the 2nd half of 2009 to 46 points in the beginning of 2010.
90
80
70
60
50
89
40 76
30 54 54
46 20
10
0
1st half '08 2nd half '08 1st half '09 2nd half '09 1st half of '10
+/- ▼13 ▼22 0 ▼8
Source: Nielsen Consumer Confidence Index, Lithuania, automobilines kedutes
According to Lithuanian responses to the online survey they are feeling more negative towards
buying new things. 84% of respondents think it is a bad or not so good time to buy things they
need while in the 2nd half of 2009 72% said so.
Respondents to the online survey are also more negative towards the state of their personal
finances over the following 12 months. 28% believe that their finances will be bad (18% in the 2nd
half of 2009). 21% believe that their personal financial situation in the following 12 months will be
good or excellent which is the same as in the end of 2009.
4
Confidential and Proprietary Copyright © 2010 The Nielsen Company
Lithuanians’ perception of the local job market has slightly improved, but is still very negative in
the 1st
half of 2010 as 93% of respondents think that the prospects of a local job are either bad or
not so good in the following 12 months (in the 2nd
half of 2009 97% said the same). Just 4% think
that their prospects are good.
In the 1st
half of 2010, 93% of respondents think that Lithuania is currently in recession.
Nevertheless, the existence of recession in their country hit Lithuanians later than both Estonians
and Latvians. In the 2nd half of 2008 86% thought the country was in economic recession, while in
Estonia and Latvia 93% of respondents said the same in the corresponding period. The highest
number of Lithuanian respondents believed that the country is in economic recession in the 1st
half of 2009 when 98% of respondents said so, in Estonia and Latvia also the highest number of
people believed that their country is in recession during that period.
At the moment, 13% of respondents who said that Lithuania is currently in recession believe that
the recession will be over in the next 12 months. In the 2nd
half of 2009 11% believe it and in the 1st half of 2009 just 7% said so. Compared to other Baltic countries just 7% of Latvians believe
that their recession will be over in the next 12 months, but 15% of Estonians are that optimistic and think that Estonian economy will recover during the year.
5
Confidential and Proprietary Copyright © 2010 The Nielsen Company
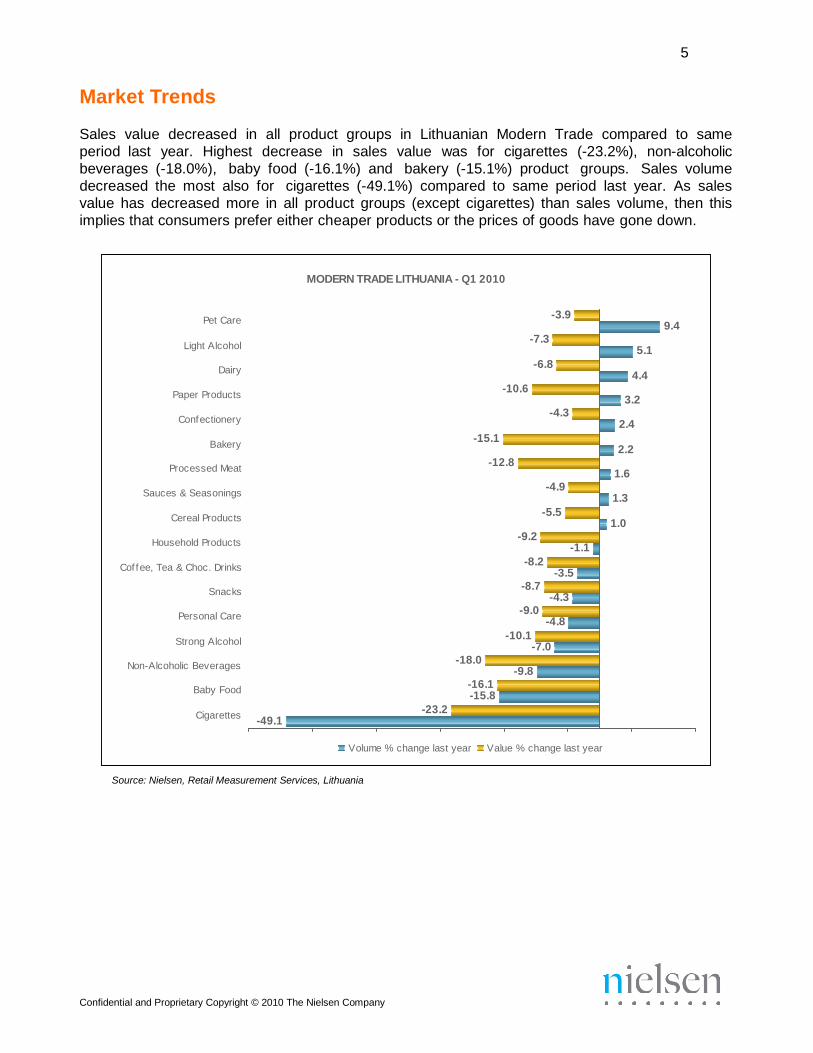
Market Trends Sales value decreased in all product groups in Lithuanian Modern Trade compared to same
period last year. Highest decrease in sales value was for cigarettes (-23.2%), non-alcoholic
beverages (-18.0%), baby food (-16.1%) and bakery (-15.1%) product groups. Sales volume
decreased the most also for cigarettes (-49.1%) compared to same period last year. As sales
value has decreased more in all product groups (except cigarettes) than sales volume, then this
implies that consumers prefer either cheaper products or the prices of goods have gone down.
MODERN TRADE LITHUANIA - Q1 2010
Pet Care
Light Alcohol
-7.3
-3.9
5.1
9.4
Dairy
Paper Products
Conf ectionery
Bakery
-15.1
-10.6
-6.8
-4.3
4.4
3.2 2.4 2.2
Processed Meat
Sauces & Seasonings
Cereal Products
Household Products
-12.8 -9.2
-4.9
-5.5
-1.1
1.6 1.3 1.0
Cof f ee, Tea & Choc. Drinks
Snacks
Personal Care
-8.2
-8.7
-9.0 -10.1
-3.5
-4.3
-4.8
Strong Alcohol
Non-Alcoholic Beverages
Baby Food
Cigarettes
-49.1
-23.2
-18.0
-16.1 -15.8
-7.0
-9.8
Volume % change last year Value % change last year
Source: Nielsen, Retail Measurement Services, Lithuania
6
Confidential and Proprietary Copyright © 2010 The Nielsen Company
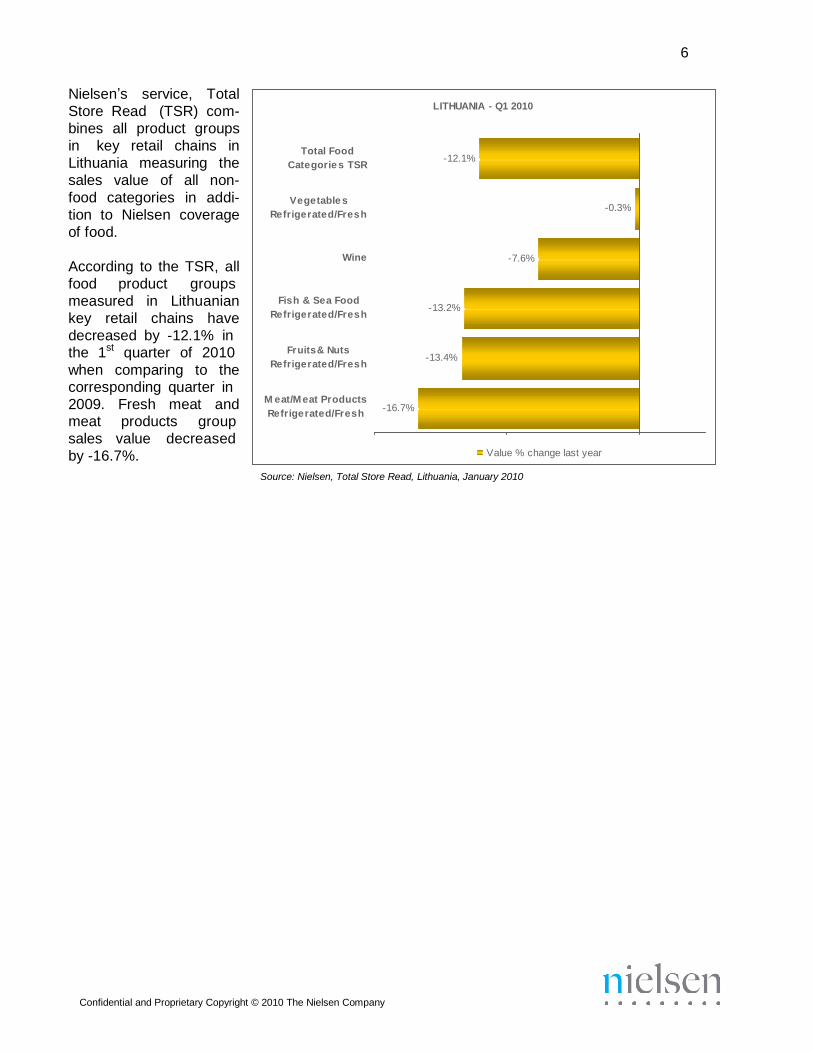
Nielsen’s service, Total
Store Read (TSR) com-
bines all product groups
in key retail chains in
Lithuania measuring the
sales value of all non-
food categories in addi-
tion to Nielsen coverage
of food.
Total Food
Cate gorie s TSR
Ve ge table s
Re frige r ate d/Fr e s h
LITHUANIA - Q1 2010
-12.1%
-0.3%
According to the TSR, all
food product groups
measured in Lithuanian
key retail chains have
decreased by -12.1% in the 1st quarter of 2010
when comparing to the corresponding quarter in
2009. Fresh meat and meat products group
sales value decreased
by -16.7%.
Wine
Fis h & Se a Food
Re frige r ate d/Fr e s h
Fr uits & Nuts
Re frige r ate d/Fr e s h
M e at/M e at Products
Re fr ige rate d/Fre s h
-16.7%
-13.2% -13.4%
-7.6%
Value % change last year
Source: Nielsen, Total Store Read, Lithuania, January 2010
7
Confidential and Proprietary Copyright © 2010 The Nielsen Company
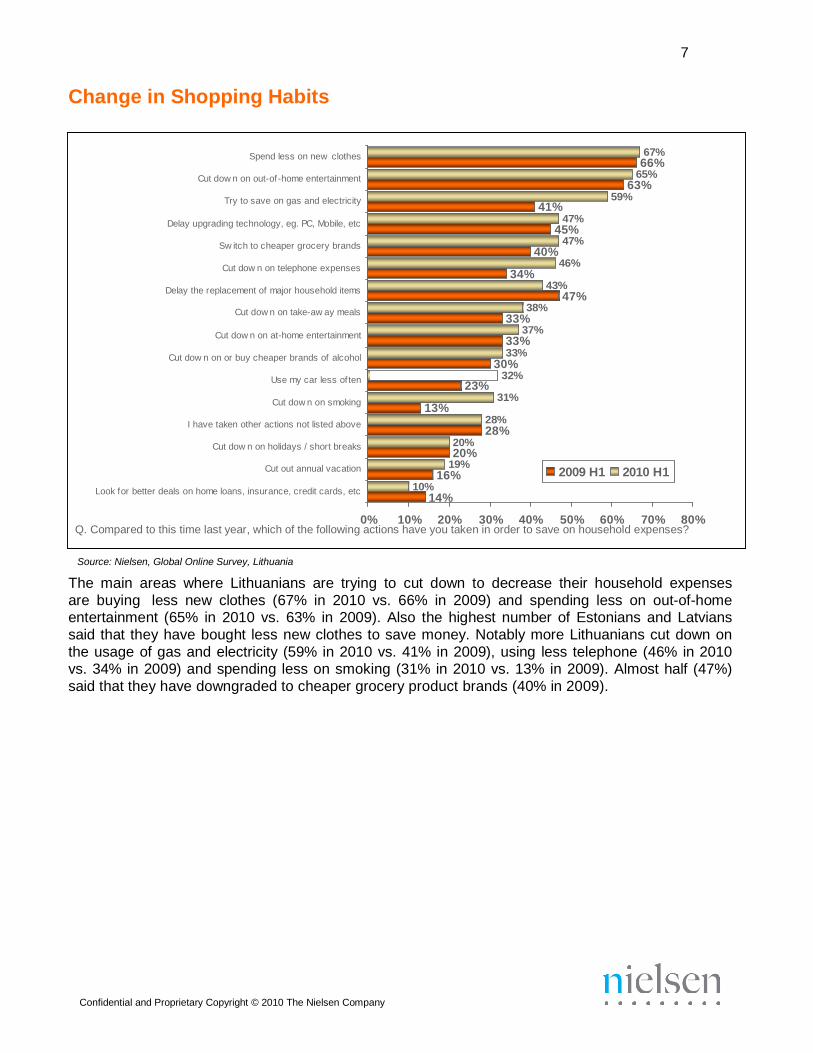
Change in Shopping Habits
Spend less on new clothes
Cut dow n on out-of -home entertainment
Try to save on gas and electricity
Delay upgrading technology, eg. PC, Mobile, etc
Sw itch to cheaper grocery brands
Cut dow n on telephone expenses
Delay the replacement of major household items
41%
47% 45%
47% 40%
46% 34%
43% 47%
67% 66%
65% 63%
59%
Cut dow n on take-aw ay meals
Cut dow n on at-home entertainment
Cut dow n on or buy cheaper brands of alcohol
Use my car less of ten
Cut dow n on smoking
13%
23%
38% 33%
37% 33% 33%
30% 32%
31%
I have taken other actions not listed above
Cut dow n on holidays / short breaks
Cut out annual vacation
Look f or better deals on home loans, insurance, credit cards, etc
10%
20% 20%
19% 16%
28% 28%
2009 H1 2010 H1
14%
0% 10% 20% 30% 40% 50% 60% 70% 80% Q. Compared to this time last year, which of the following actions have you taken in order to save on household expenses?
Source: Nielsen, Global Online Survey, Lithuania
The main areas where Lithuanians are trying to cut down to decrease their household expenses
are buying less new clothes (67% in 2010 vs. 66% in 2009) and spending less on out-of-home entertainment (65% in 2010 vs. 63% in 2009). Also the highest number of Estonians and Latvians
said that they have bought less new clothes to save money. Notably more Lithuanians cut down on
the usage of gas and electricity (59% in 2010 vs. 41% in 2009), using less telephone (46% in 2010 vs. 34% in 2009) and spending less on smoking (31% in 2010 vs. 13% in 2009). Almost half (47%)
said that they have downgraded to cheaper grocery product brands (40% in 2009).
8
Confidential and Proprietary Copyright © 2010 The Nielsen Company
Vo
lum
e %
CH
G L
Y
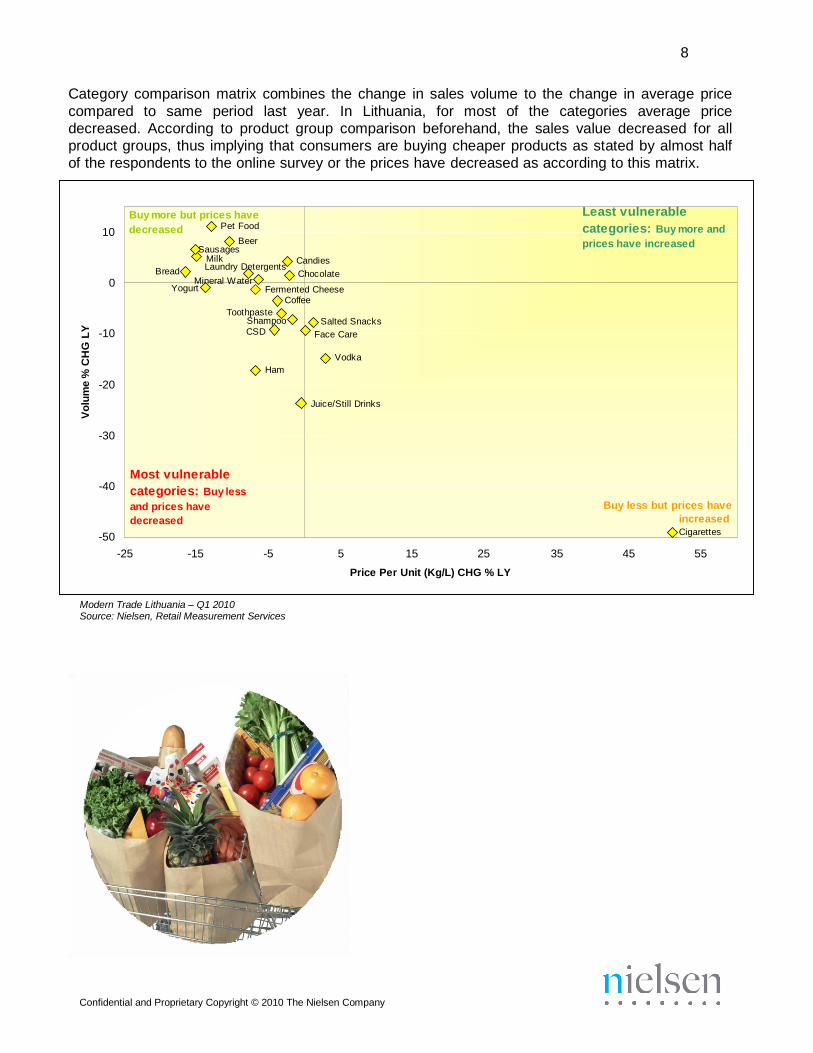
Category comparison matrix combines the change in sales volume to the change in average price
compared to same period last year. In Lithuania, for most of the categories average price
decreased. According to product group comparison beforehand, the sales value decreased for all
product groups, thus implying that consumers are buying cheaper products as stated by almost half
of the respondents to the online survey or the prices have decreased as according to this matrix.
Buy more but prices have Least vulnerable
10 decreased Pet Food
Beer Sausages
Milk Laundry Detergents
Candies
categories: Buy more and
prices have increased
Bread Chocolate
0 Mineral Water Yogurt Fermented Cheese
Coffee
Toothpaste Shampoo Salted Snacks
-10 CSD Face Care
-20
Ham
Vodka
Juice/Still Drinks
-30
-40
-50
Most vulnerable
categories: Buy less
and prices have
decreased
Buy less but prices have
increased
Cigarettes
-25 -15 -5 5 15 25 35 45 55
Price Per Unit (Kg/L) CHG % LY
Modern Trade Lithuania – Q1 2010 Source: Nielsen, Retail Measurement Services
9
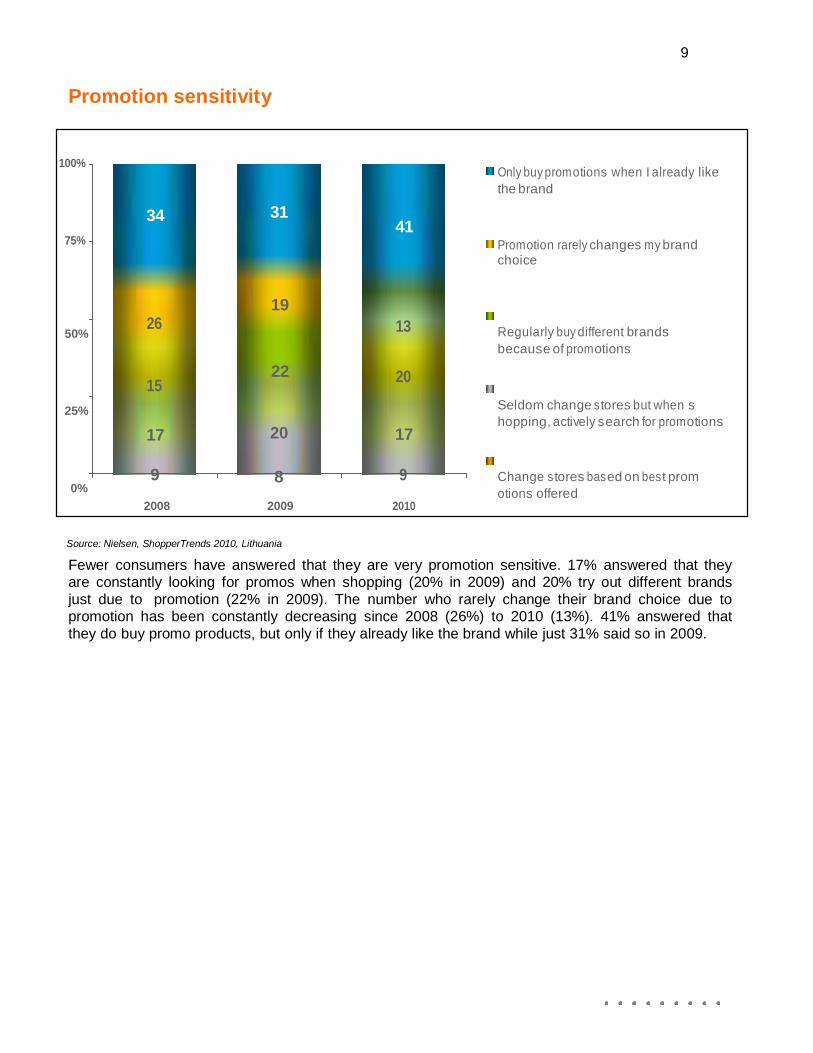
Promotion sensitivity
100%
75%
34 31
Only buy prom otions when I already like
the brand
41
Prom otion rarely changes m y brand choice
26
50%
15
25%
19
13
22 20
Regularly buy different brands
because of prom otions
Seldom change s tores but when s
hopping, actively search for prom otions 17 20 17
9 8 9
0%
2008 2009 2010
Change s tores bas ed on bes t prom
otions offered
Source: Nielsen, ShopperTrends 2010, Lithuania
Fewer consumers have answered that they are very promotion sensitive. 17% answered that they are constantly looking for promos when shopping (20% in 2009) and 20% try out different brands
just due to promotion (22% in 2009). The number who rarely change their brand choice due to promotion has been constantly decreasing since 2008 (26%) to 2010 (13%). 41% answered that
they do buy promo products, but only if they already like the brand while just 31% said so in 2009.
10
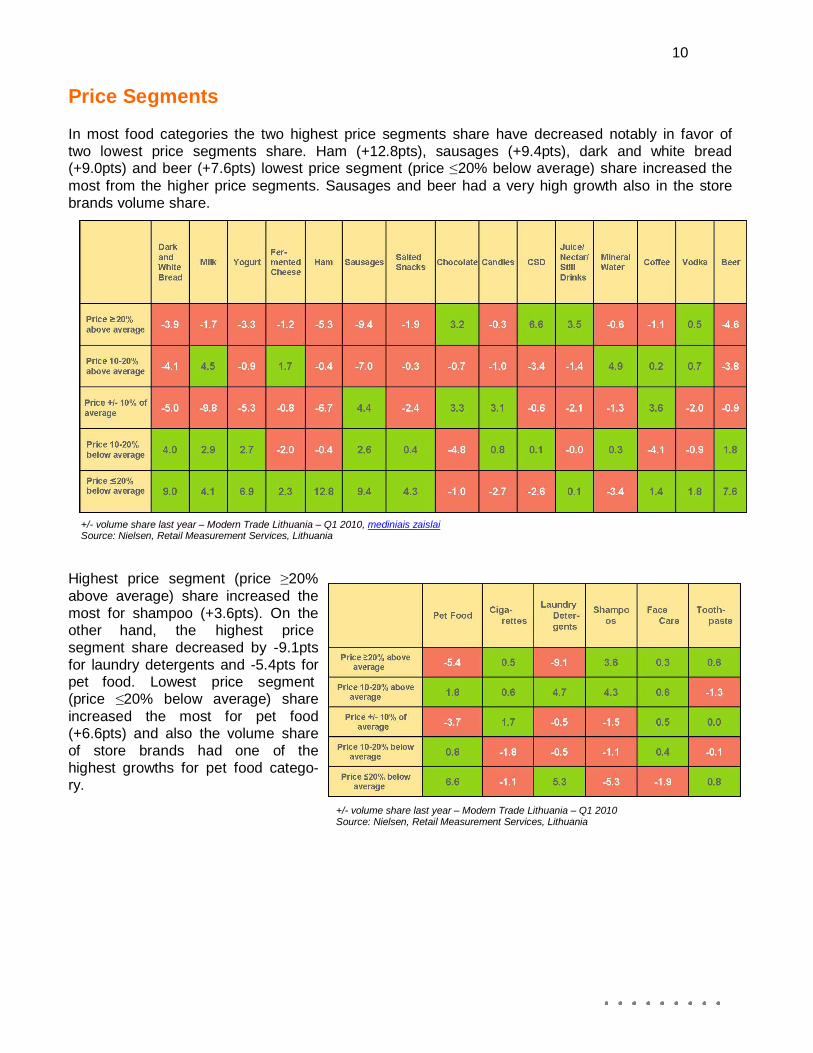
Price Segments In most food categories the two highest price segments share have decreased notably in favor of
two lowest price segments share. Ham (+12.8pts), sausages (+9.4pts), dark and white bread (+9.0pts) and beer (+7.6pts) lowest price segment (price ≤20% below average) share increased the
most from the higher price segments. Sausages and beer had a very high growth also in the store
brands volume share.
+/- volume share last year – Modern Trade Lithuania – Q1 2010, mediniais zaislai Source: Nielsen, Retail Measurement Services, Lithuania
Highest price segment (price ≥20%
above average) share increased the
most for shampoo (+3.6pts). On the other hand, the highest price
segment share decreased by -9.1pts
for laundry detergents and -5.4pts for pet food. Lowest price segment (price ≤20% below average) share
increased the most for pet food (+6.6pts) and also the volume share
of store brands had one of the
highest growths for pet food catego- ry.
+/- volume share last year – Modern Trade Lithuania – Q1 2010 Source: Nielsen, Retail Measurement Services, Lithuania
11
Price awareness
100% All respondents Low income Medium income High income
10 8 8 6 10 8 8 12
80%
45
60%
37
41 40 41
38
50 50
Don’t know or notice prices
Don’t know all prices but do
notice when prices change
40%
35 29
20%
26 37
31 35
30
27
Know prices of most items
and notice when price
changes
Know all the prices of items
bought regularly
16 16
0%
25 20 18 19
12 11
2009 2010 2009 2010 2009 2010 2009 2010
Source: Nielsen Consumer Confidence Index, Lithuania
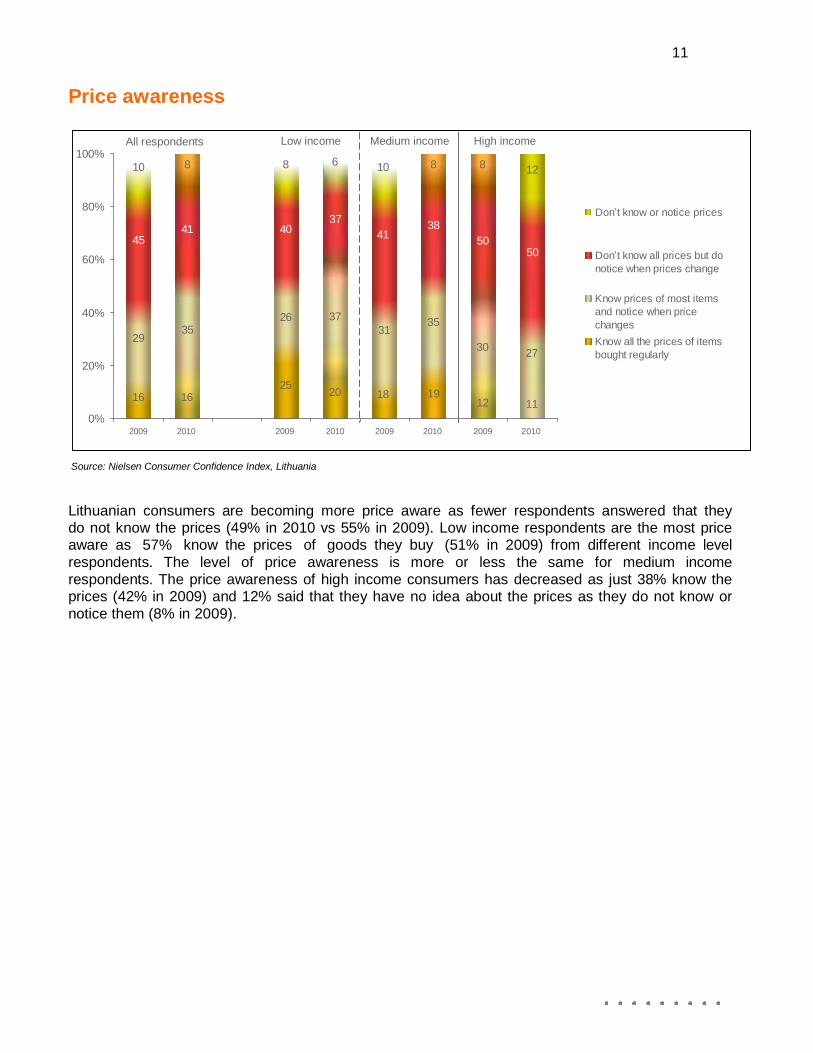
Lithuanian consumers are becoming more price aware as fewer respondents answered that they do not know the prices (49% in 2010 vs 55% in 2009). Low income respondents are the most price aware as 57% know the prices of goods they buy (51% in 2009) from different income level
respondents. The level of price awareness is more or less the same for medium income
respondents. The price awareness of high income consumers has decreased as just 38% know the prices (42% in 2009) and 12% said that they have no idea about the prices as they do not know or
notice them (8% in 2009).
12
Package Size Preferences
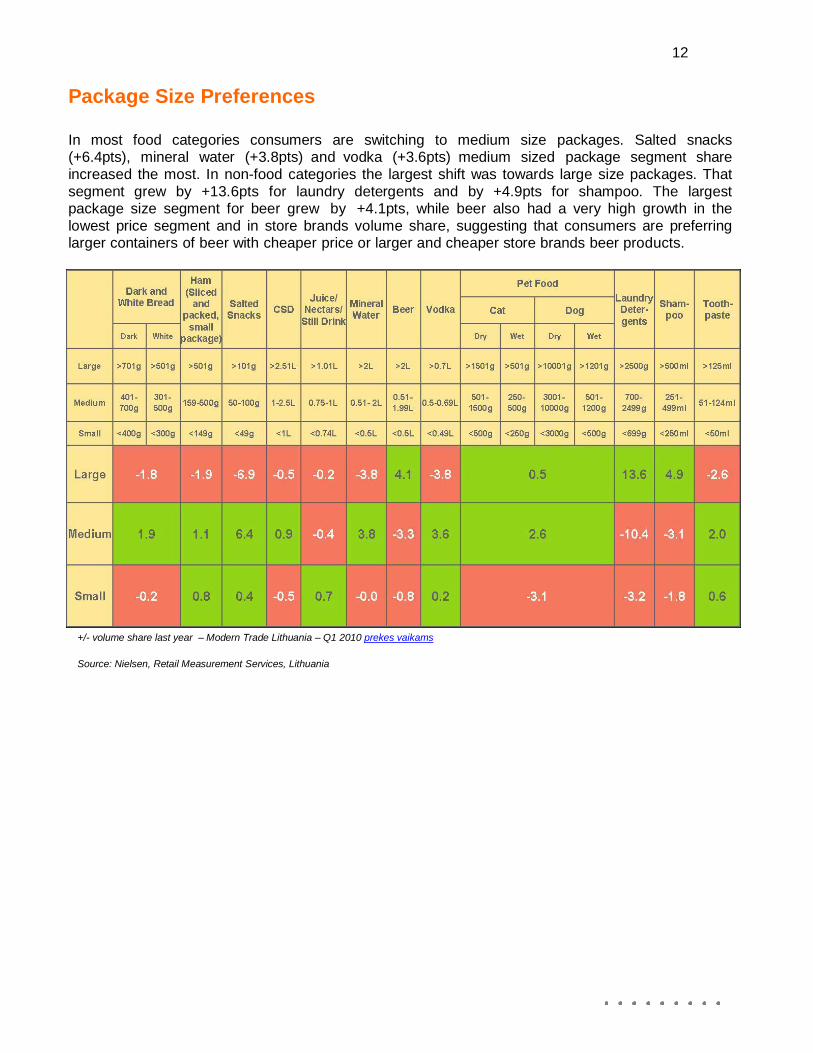
In most food categories consumers are switching to medium size packages. Salted snacks (+6.4pts), mineral water (+3.8pts) and vodka (+3.6pts) medium sized package segment share
increased the most. In non-food categories the largest shift was towards large size packages. That
segment grew by +13.6pts for laundry detergents and by +4.9pts for shampoo. The largest package size segment for beer grew by +4.1pts, while beer also had a very high growth in the
lowest price segment and in store brands volume share, suggesting that consumers are preferring larger containers of beer with cheaper price or larger and cheaper store brands beer products.
+/- volume share last year – Modern Trade Lithuania – Q1 2010 prekes vaikams
Source: Nielsen, Retail Measurement Services, Lithuania
13
DA
RK
AN
D W
HIT
E
BR
EA
DS
MIL
K
FE
RM
EN
TE
D C
HE
ES
E
YO
GU
RT
HA
M
SA
US
AG
ES
SA
LT
ED
SN
AC
KS
CH
OC
OLA
TE
S
CA
ND
Y
CS
D
JU
I CE
/NE
CT
AR
S/ S
TIL
L
DR
INK
S
MIN
ER
AL W
AT
ER
CO
FF
EE
VO
DK
A
BE
ER
PE
T F
OO
D
CIG
AR
ET
TE
S
LA
UN
DR
Y
DE
TE
RG
EN
TS
SH
AM
PO
OS
FA
CE
CA
RE
TO
OT
HP
AS
TE
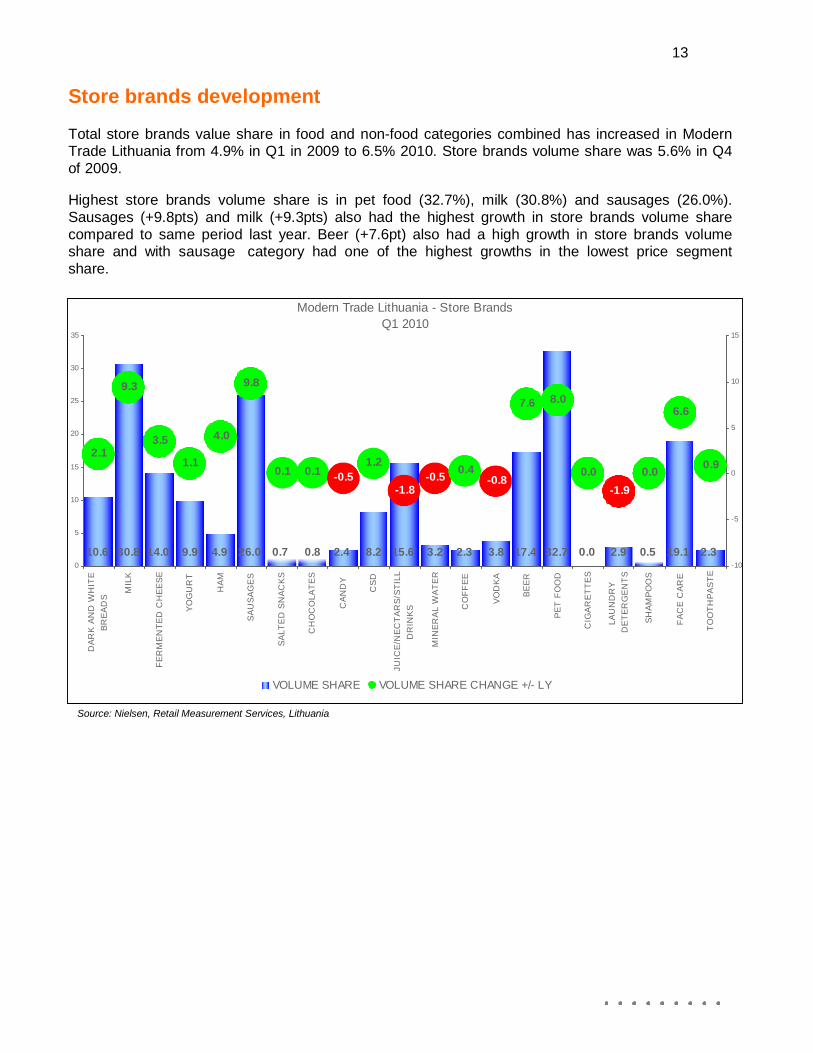
Store brands development Total store brands value share in food and non-food categories combined has increased in Modern Trade Lithuania from 4.9% in Q1 in 2009 to 6.5% 2010. Store brands volume share was 5.6% in Q4
of 2009.
Highest store brands volume share is in pet food (32.7%), milk (30.8%) and sausages (26.0%).
Sausages (+9.8pts) and milk (+9.3pts) also had the highest growth in store brands volume share
compared to same period last year. Beer (+7.6pt) also had a high growth in store brands volume share and with sausage category had one of the highest growths in the lowest price segment
share.
Modern Trade Lithuania - Store Brands
Q1 2010 35 15
30
25
20
2.1 15
10
9.3
3.5 4.0
1.1
9.8
0.1
0.1
1.2
-0.5 -0.5 0.4
-0.8 -1.8
7.6 8.0
0.0
-1.9
0.0
6.6
10
5
0.9
0
5
10.6 30.8 14.0 9.9 4.9 26.0 0.7 0.8 2.4 8.2 15.6 3.2 2.3 3.8 17.4 32.7 0.0 2.9 0.5 19.1 2.3 0
-5
-10
VOLUME SHARE VOLUME SHARE CHANGE +/- LY
Source: Nielsen, Retail Measurement Services, Lithuania
14
Confidential and Proprietary Copyright © 2010 The Nielsen Company
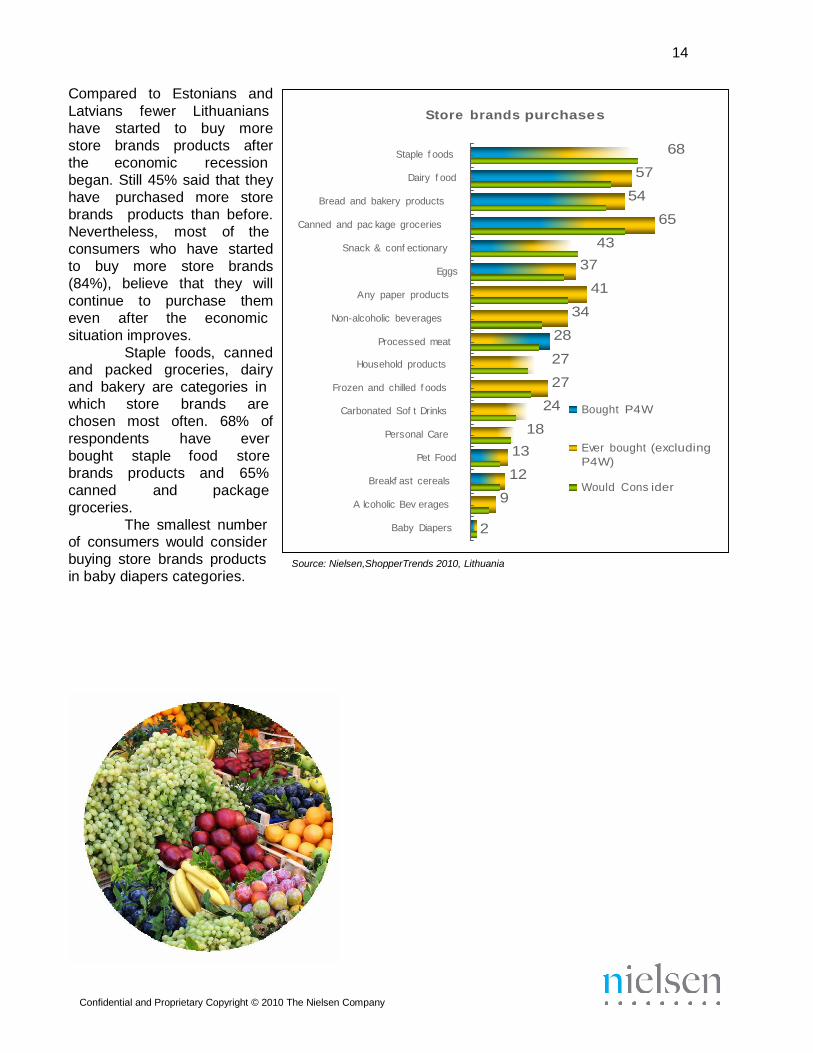
Compared to Estonians and
Latvians fewer Lithuanians
have started to buy more
store brands products after
the economic recession
began. Still 45% said that they
have purchased more store
brands products than before.
Nevertheless, most of the
consumers who have started
to buy more store brands
(84%), believe that they will
continue to purchase them
even after the economic
situation improves.
Staple foods, canned and packed groceries, dairy
and bakery are categories in
Store brands purchase s
Staple f oods 68
Dairy f ood 57
Bread and bakery products 54
Canned and pac kage groceries 65
Snack & conf ectionary 43
Eggs 37
Any paper products 41
Non-alcoholic beverages 34
Processed meat 28
Household products 27
Frozen and chilled f oods 27
which store brands are
chosen most often. 68% of
respondents have ever
bought staple food store
brands products and 65%
canned and package
groceries.
The smallest number of consumers would consider
Carbonated Sof t Drinks 24
Personal Care 18
Pet Food 13
Breakf ast cereals 12
A lcoholic Bev erages 9
Baby Diapers 2
Bought P4W Ever bought (excluding
P4W) Would Cons ider
buying store brands products
in baby diapers categories.
Source: Nielsen,ShopperTrends 2010, Lithuania
15
Confidential and Proprietary Copyright © 2010 The Nielsen Company
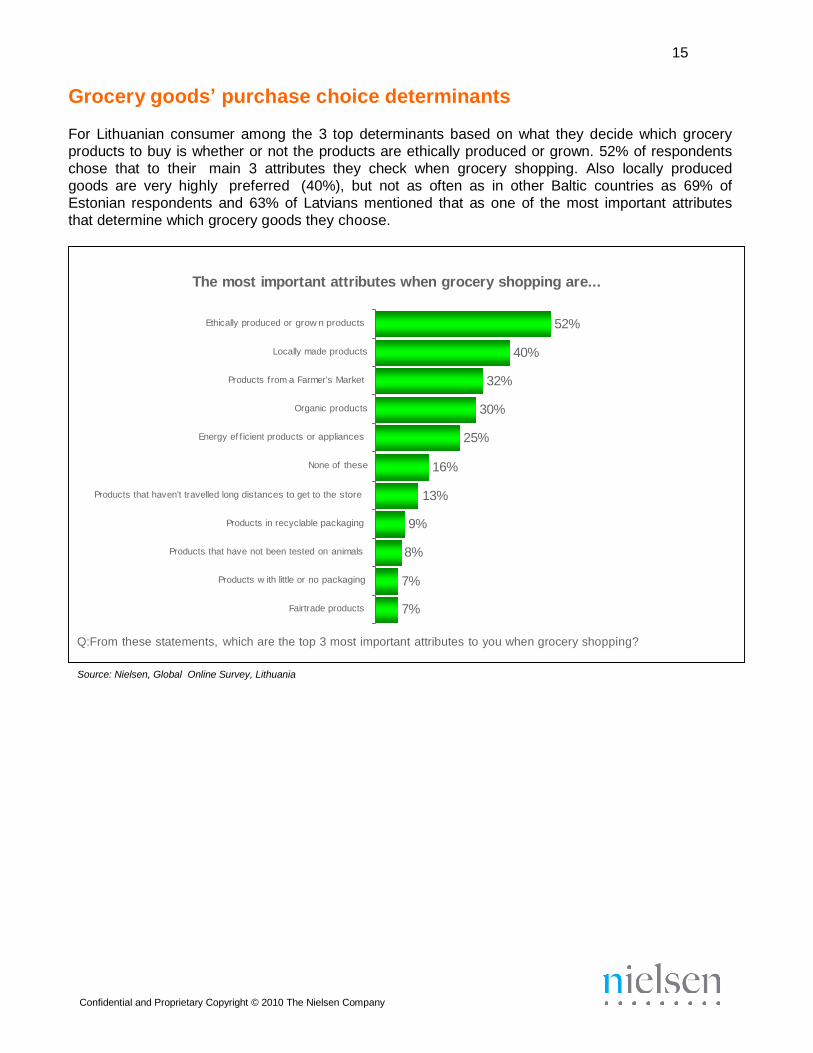
Grocery goods’ purchase choice determinants For Lithuanian consumer among the 3 top determinants based on what they decide which grocery
products to buy is whether or not the products are ethically produced or grown. 52% of respondents
chose that to their main 3 attributes they check when grocery shopping. Also locally produced
goods are very highly preferred (40%), but not as often as in other Baltic countries as 69% of
Estonian respondents and 63% of Latvians mentioned that as one of the most important attributes
that determine which grocery goods they choose.
The most important attributes when grocery shopping are...
Ethically produced or grow n products 52%
Locally made products 40%
Products f rom a Farmer's Market 32%
Organic products 30%
Energy ef f icient products or appliances 25%
None of these 16%
Products that haven't travelled long distances to get to the store 13%
Products in recyclable packaging 9%
Products that have not been tested on animals 8%
Products w ith little or no packaging 7%
Fairtrade products 7%
Q:From these statements, which are the top 3 most important attributes to you when grocery shopping?
Source: Nielsen, Global Online Survey, Lithuania
16
Confidential and Proprietary Copyright © 2010 The Nielsen Company
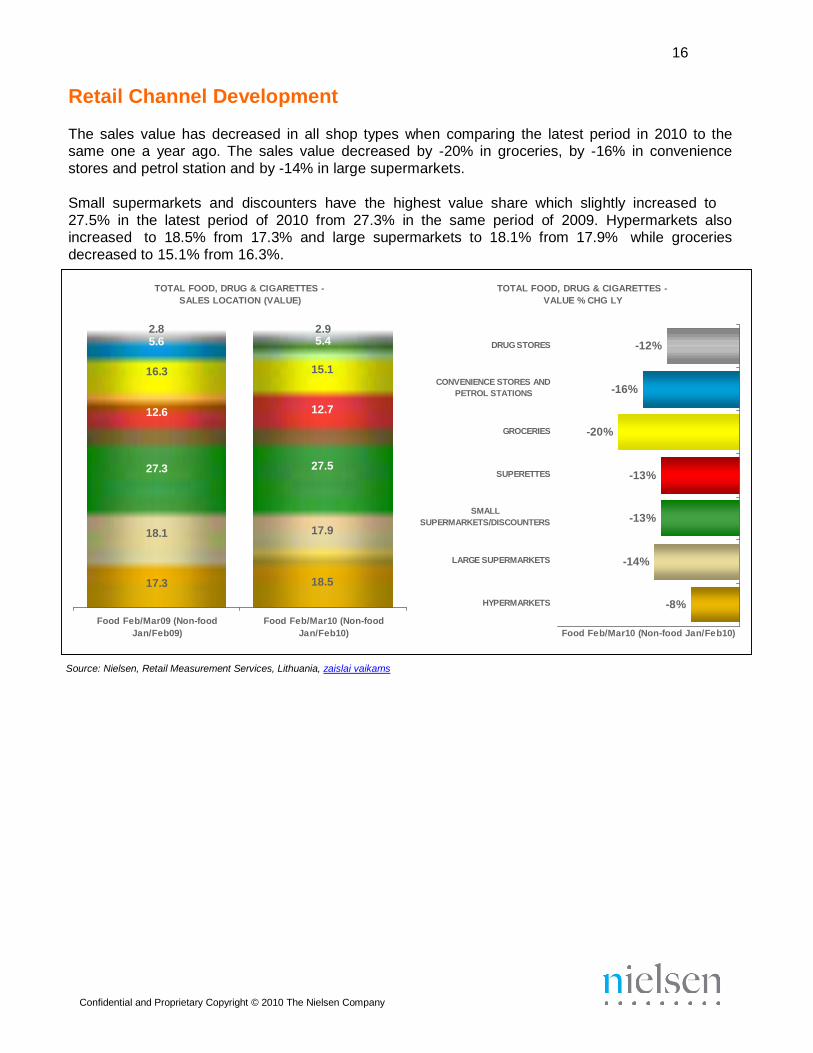
Retail Channel Development
The sales value has decreased in all shop types when comparing the latest period in 2010 to the same one a year ago. The sales value decreased by -20% in groceries, by -16% in convenience
stores and petrol station and by -14% in large supermarkets.
Small supermarkets and discounters have the highest value share which slightly increased to
27.5% in the latest period of 2010 from 27.3% in the same period of 2009. Hypermarkets also increased to 18.5% from 17.3% and large supermarkets to 18.1% from 17.9% while groceries
decreased to 15.1% from 16.3%.
TOTAL FOOD, DRUG & CIGARETTES -
SALES LOCATION (VALUE)
TOTAL FOOD, DRUG & CIGARETTES -
VALUE % CHG LY
2.8 2.9 5.6 5.4
16.3 15.1
12.6 12.7
DRUG STORES
CONVENIENCE STORES AND
PETROL STATIONS
GROCERIES
-12%
-16%
-20%
27.3 27.5
SUPERETTES
-13%
18.1 17.9
SMALL
SUPERMARKETS/DISCOUNTERS
-13%
17.3 18.5
LARGE SUPERMARKETS
HYPERMARKETS
-14%
-8%
Food Feb/Mar09 (Non-food
Jan/Feb09)
Food Feb/Mar10 (Non-food
Ja n/Feb10)
Food Fe b/Mar10 (Non-food Jan/Fe b10)
Source: Nielsen, Retail Measurement Services, Lithuania, zaislai vaikams
17
Confidential and Proprietary Copyright © 2010 The Nielsen Company
+1
Ma
xim
a X
XX
Ma
xim
a X
X
Ma
xim
a X
Iki
Ikiu
ka
s
Ce
nto
Hyp
er
No
rfa
No
rfa X
XL
No
rfa X
L
No
rfa L
No
rfa S
Rim
i H
yp
erm
ark
et
Rim
i
Su
pe
rne
tto
Pri
sm
a
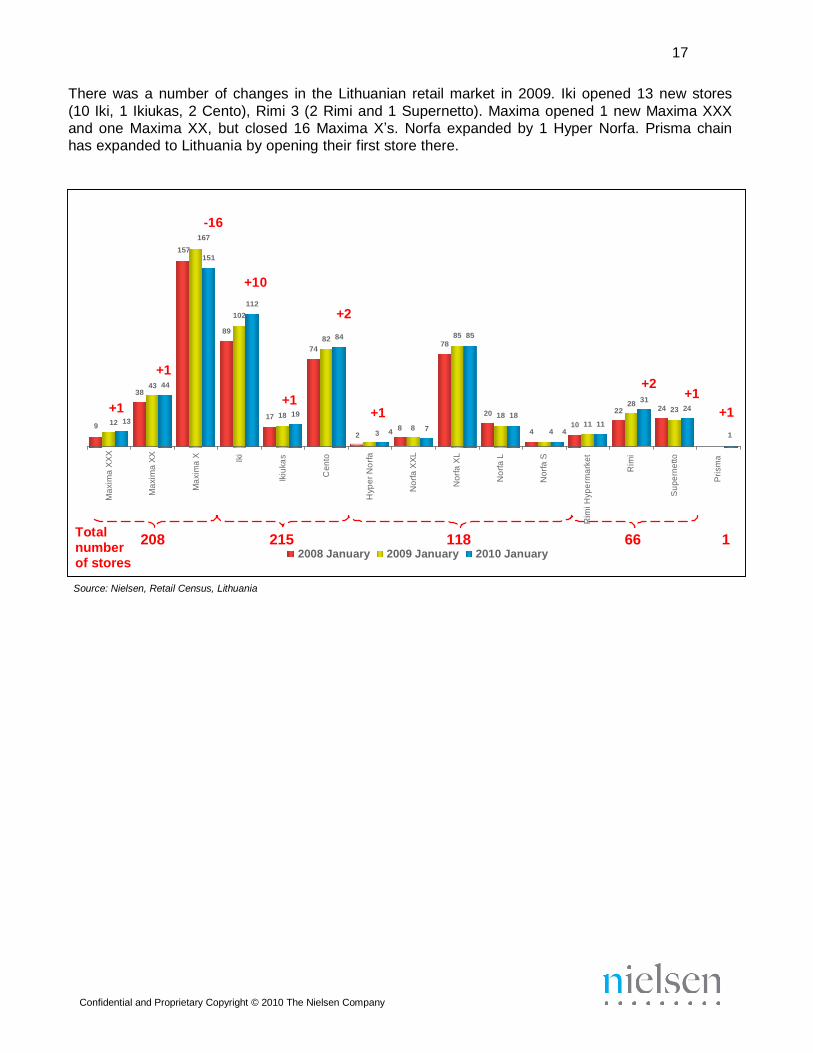
There was a number of changes in the Lithuanian retail market in 2009. Iki opened 13 new stores
(10 Iki, 1 Ikiukas, 2 Cento), Rimi 3 (2 Rimi and 1 Supernetto). Maxima opened 1 new Maxima XXX
and one Maxima XX, but closed 16 Maxima X’s. Norfa expanded by 1 Hyper Norfa. Prisma chain
has expanded to Lithuania by opening their first store there.
157
-16 167
151
+10
+1
43 44 38
112
102 89
+2
82 84
74
85 85
78
+2 +1
+1 +1
17 18 19
9 12 13 8 8
20 18 18
10 11 11
28 31
22
24 23 24 +1
2 3 4 7 4 4 4 1
Total number of stores
208 215 118 66 1 2008 January 2009 January 2010 January
Source: Nielsen, Retail Census, Lithuania

18
Confidential and Proprietary Copyright © 2010 The Nielsen Company
Store Visit Triggers
Most of the Lithuanian shoppers are also triggered simply by habit when shopping. In 2010, slightly more shoppers have stated that they choose where to shop out of habit or just go to the store that
is physically the closest to them. However at the same time, the importance of flyers and coupons
is increasing. More consumers have started to experiment with the choice of store to visit than last year.
HABIT
I shopped at the same store I always do
80%
75%
I just went to the closest store
I shopped at a store that a colleague, friend or relative had
recommended
I checked the newspaper or flyers for coupons and went
to the store with the attractive deals
5%
4%
17%
13%
64%
74%
I chose the store that I'd seen advertised recently
I heard of a new store and decided to try it
I was visiting friends/ family and went to a store that they
8%
5%
6%
5%
18%
2010
2009
usually shop at
I was passing a store that caught my attention and tried it
EXPERIMENTING
11%
14%
9%
Source: Nielsen, ShopperTrends 2010, Lithuania
19
Confidential and Proprietary Copyright © 2010 The Nielsen Company
Methodology and Design
ShopperTrends Research Design
• City Coverage:
– Estonia: Tallinn, Tartu, Pärnu, Narva
– Lavia: Riga, Daugavpils, Liepaja
– Lithuania: Vilnius, Kaunas, Klaipeda, Siauliai, Panevezys
• Target Respondent: Males/females aged 15-65 years, both main grocery
buyers and influencers;
• Interview Methodology: FtF interviews;
• Sampling Method: Random sampling with quotas for age and gender
• Sample Size: Estonia (n=550), Latvian (n=620), Lithuania (n=720)
• Fieldwork Period: 12th January – 12th February 2010
• Questionnaire length: ~60 minutes
• Weighting variables: Data weighted proportional to national ‘main grocery
shopper’ statistics based on age / gender / location
Global Online Survey
• Method and interviewing process: online interviews
• Geography: all areas of Estonia, Latvia and Lithuania – targeted at below
quotas
• Target audience:
– Males and females
– Aged 15+
• Sample size: Estonia (n=501), Latvia (n=501), Lithuania (n=503)
• Data weighted proportionally to total national population
• Timing: 8th
– 26th
of March
Confidential and Proprietary Copyright © 2010 The Nielsen Company
20
Retail Measurement Services
• Markets covered:
o Modern Trade Estonia: Selver, RIMI, Säästumarket, Maxima, Prisma, Kaubamaja, ETK
(hypers, large/small supers, superettes), Stockmann, Comarket, Statoil*,
Olerex*, R-Kiosk*, Watson*, Laminto*, Rosalind*, L’Cosmetics*,
Kaubamaja*, Koduextra*, Apotheca*, ILU* Latvia: Maxima, RIMI, Supernetto, Prisma, IKI, LeaderPrice/Cento, Mego,
Elvi, Nelda, Drogas, Statoil*, Plus Punkts*, Narvessen*, Tabakas Nams*, Kollonna*, Euroaptieka*, SentorPharm*, Multilukss*
Lithuania: Maxima, RIMI, Supernetto, Norfa, Prisma, IKI, LeaderPrice,
Lukoil*, Statoil*, Lietuvos Spauda*, R-kiosk*, Kauno Spauda*, Drogas*,
Sarma*, Kosmada*, Eurovaistines*, Eurokos*, Ermitazas* * not for all categories due to low importance
• Categories covered:
o Baby Food - Infant Milk, Jarred Baby Food, Porridges o Bakery - Dark Bread, White Bread o Cereal Products - Breakfast Cereals, Flakes
o Cigarettes
o Coffee, Tea & Cocoa Drinks
o Confectionery – Assortments, Caramels, Chewing Candies, Chewing Gum, Chocolate Bars, Chocolate Countlines, Pastilles, Small Bites
o Dairy - Butter & Margarine, Fresh and Processed Cheese, Cottage Cheese
(EE,LT), Fermented Cheese, Fresh Cream, Curd Countlines, Kefir, Milk, Milk Desserts, Quark Curd Desserts, Quark Curd Pastes (EE, LV), Sour Cream, Yogurt, Ice Cream
o Frozen Food (EE, LV) - Minced Meat Products, Deep Frozen Potatoes
o Household Products - Laundry Detergents, Dishwashing Detergents, Household Cleaning, Fabric Softeners, Toilet Blocks, Air Fresheners, Laundry
Bleaches, Toilet Cleaners, Water Softeners, Stain Removers, Laundry Bar Soaps
o Light Alcohol – Beer, Beer Cocktails, Ciders and Long Drinks
o Non-Alcoholic Ready-to-drink Beverages - Carbonated Soft Drinks, Energy and Sport Drinks, Ice Tea, Juice, Nectars, Still Drinks, Mineral Water
o Paper Products - Toilet Paper, Baby Diapers, Sanitary Protection, Kitchen Rolls, Serviettes
o Personal Care - Face Skin Care, Shampoos, Toothpaste, Hair Colorants,
Shower Gel, Decorative Cosmetics, Blades, Deodorants, Hair Conditioners, Toothbrushes, Skin Care, Soaps, Razors, Hair Treatments, Depilatories,
o Pet Care - Cat Food, Dog Food, Cat Litter
o Processed Meat – Boiled & Cooked Sausages, Ham, Meat Jellies (EE), Meat Marinade (EE, LV), Pastes (EE), Meal Sausages, Smoked Sausages
o Sauces & Seasonings – Bouillons, Soups, Dehydrated Seasonings, Dressings,
Ketchup, Mayonnaise, Tomato Sauces o Snacks – Sweet Biscuits, Chips & Extruders, Salted Nuts, Salted Biscuits
o Strong Alcohol – Brandy & Cognac (LV, LT), Nastoyka/Nalivka (EE, LT), Sparkling Wine & Champagne (EE, LT), Vermouth, Whisky, Vodka