baltimore city strategic transportation safety plan - … · baltimore city strategic...
TRANSCRIPT

Baltimore City
Strategic Transportation
Safety Plan
May 20, 2014 2014 Annual Meeting
ITE Mid-Colonial District & Mid-Atlantic Section
Presented By: Valorie LaCour, RLA, LEED AP, Chief Transportation Planning Division
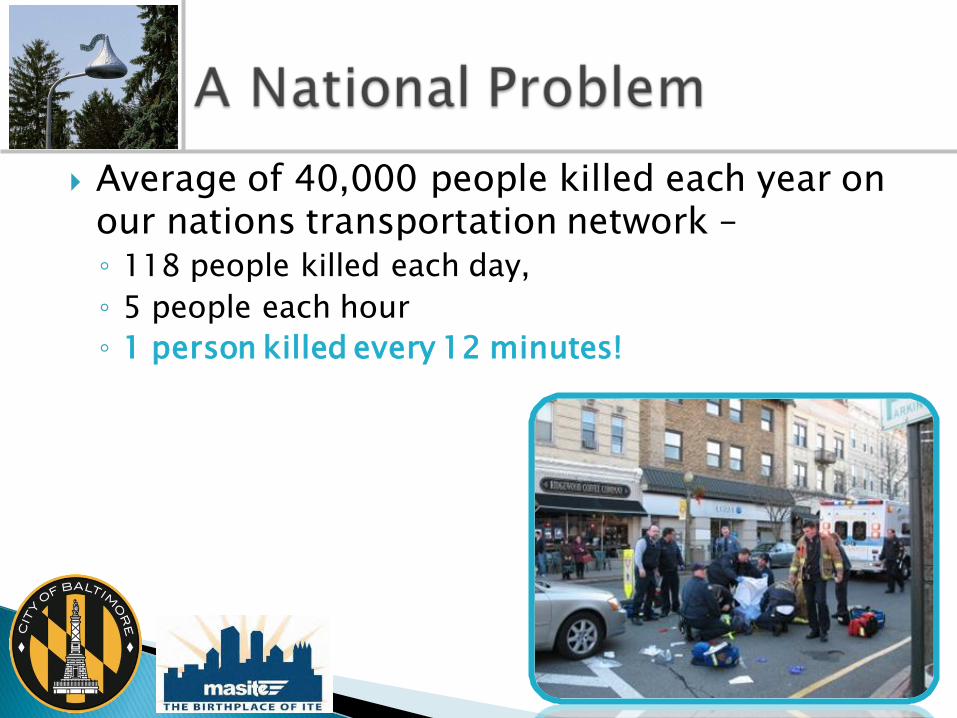
Average of 40,000 people killed each year on our nations transportation network – ◦ 118 people killed each day,
◦ 5 people each hour
◦ 1 person killed every 12 minutes!

Nearly 3 million people a year are injured in traffic crashes,
1 injury every 11 seconds!
Traffic crashes are a leading cause of death for people under 35 years old.
Economic losses due to motor vehicle crashes cost
$230.6 Billion annually
$1.35 Billion metro region, non-recurring congestion
45 million gallons of wasted fuel. (source: Texas Transportation Institute
Mobility Report)
51% of Time stuck in traffic is caused by non-recurring congestion – i.e. incidents. (source: Texas Transportation Institute Mobility Report)

$147 Billion annual cost of obesity.
Translates into $1,250 per household – paid mostly through taxes and insurance premiums. (source: Health Affairs 2010)

• Vehicle Crashes: Average 19,300 per year • 41 fatalities
• 5,000 injuries
• Pedestrian Crashes: Average 1,225 injured per year • 40% crash fatalities.
• Bicycle Crashes: Average 176 crashes per year

Over the past 10 years Baltimore City has taken many steps to make streets safer for travel.
BUT
BC Remains over-represented with 15% of the
State’s and 31% of the metropolitan region’s injury crashes.

• Nearly twice as many traffic fatalities as NYC per 100,000 population

• Traffic safety (disobeying traffic laws) 6th most critical issue. • 57% consider the
problem serious
• 46% believe problem is getting worse
• 2011 Baltimore City Citizen Survey by the University of Baltimore
Traffic safety is a quality of life issue shared across all demographics.
• Grow Baltimore City 10,000 families over 10 years.
• Act boldly and be strategic on transportation safety
• Drastically reduce traffic crashes and pedestrian deaths over the next decade
• Increase safety for all roadway users including children, elderly, handicapped
• Increase safety for all modes of travel - particularly the most vulnerable: walkers, bicyclists and transit users

Outline way to reduce crashes and reduce risk
Integrate safety into the City’s transportation system ◦ planning, operations, design and maintenance
Raise public awareness
Improve quality of life in the City ◦ residents, visitors and workers
Reduce costs ◦ City government, residents, visitor, workers,
businesses

Key Focus areas:
Implementing localized engineering solutions at high-crash locations
Perform road safety audits
Implement proactive deferred maintenance
Compile and evaluate better crash data – target specific crash types and causes
Update roadway design standards
Public outreach – awareness and education

Mission
Prioritize safety in daily activities to reduce overall injuries and fatalities by 50% in next 8 years.
Goals the five ‘E’s ◦ Engineering
◦ Enforcement
◦ Education
◦ Encouragement
◦ Evaluation

• Improve signing
• Street markings
• Street and pedestrian lighting
• Adequate signal timing
• Intersection geometry
• Bicycle infrastructure

Conduct highly visible and targeted enforcement of traffic and bicycle safety laws.
Special Traffic Enforcement Officers (STEO)
• Speeding
• Red Light Running
• Parking
• DUI
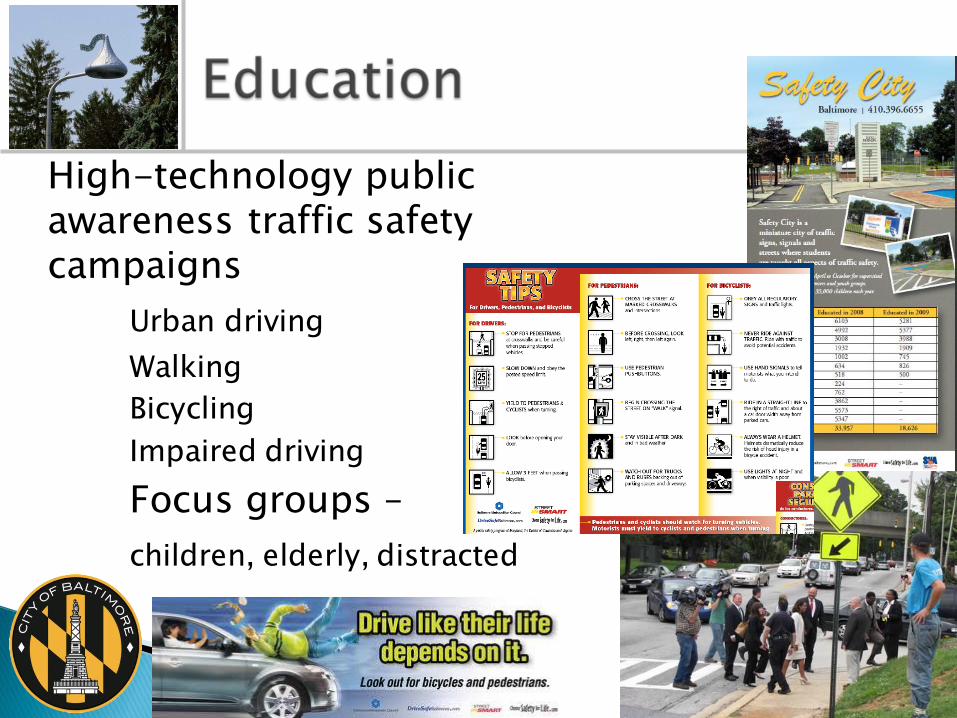
High-technology public awareness traffic safety campaigns
Urban driving
Walking
Bicycling
Impaired driving
Focus groups –
children, elderly, distracted


Engineering Enforcement Education EMS Evaluation
Pedestrians
Bicyclists
Drivers 65+
Impaired Drivers
Distracted/ Aggressive Drivers
Improved Data/Analysis and Organizational Coordination
Focus on High-Crash Locations & Corridors
Strategies
& Partnerships
What is the data showing
Trends
Annual Reporting
Measure progress toward reducing overall injuries/fatalities by 50% in 8 years

0
10
20
30
40
50
60
2002
2003
2004
2005
2006
2007
2008
2009
2010
2011
Baltimore City Traffic Fatalities
Baltimore City Pedestrian Fatalities
200
400
600
800
1,000
1,200
2002 2003 2004 2005 2006 2007 2008 2009 2010 2011
Ped Crashes
Injury Ped Crashes
Fatal Ped Crashes
Linear (Ped Crashes)
Linear (Injury Ped Crashes)
Pedestrian 2002 2003 2004 2005 2006 2007 2008 2009 2010 2011 TOTAL AVG. Change
Ped Crashes 1,007 1,030 940 934 972 973 874 837 892 820 4,396 879 -19%
Injury Ped Crashes 810 816 745 742 771 772 704 668 682 641 3,467 693 -21%
Fatal Ped Crashes 12 15 14 12 16 17 11 16 9 8 61 12 -33%

50
100
150
200
250
2002 2003 2004 2005 2006 2007 2008 2009 2010 2011
Bike Crashes
Bike Injury Crashes
Bicycle 2002 2003 2004 2005 2006 2007 2008 2009 2010 2011 TOTAL AVG. Change Bike Crashes 243 215 232 210 180 170 192 170 168 168 868 174 -31%
Bike Injury Crashes 176 157 161 150 124 123 137 125 118 128 631 126 -27% Bike Fatal Crashes 1 1 1 0 1 2 1 0 4 1 -100%

0
10
20
30
40
50
60
2002
2003
2004
2005
2006
2007
2008
2009
2010
2011
Baltimore City Traffic Fatalities
2,000
4,000
6,000
8,000
10,000
12,000
14,000
16,000
18,000
20,000
2002 2003 2004 2005 2006 2007 2008 2009 2010 2011
Total Crashes
Injury Crashes
All Crashes 2002 2003 2004 2005 2006 2007 2008 2009 2010 2011 TOTAL AVG. Change Total Crashes 19,041 19,660 19,309 18,633 19,168 19,394 19,061 19,798 19,068 19,518 96,839 19,368 3% Injury Crashes 5,348 5,424 5,291 5,202 5,114 5,043 5,050 4,949 4,475 4,649 24,166 4,833 -13% Fatal Crashes 39 34 39 33 41 41 47 39 37 17 181 36 -56%

• Not all crashes reported to police
• Different databases – police, DOT, MTA
• Not all causes honestly reported
• No mechanism for logging risky conditions
• Data interpretation – high crash locations not always correlated to unsafe conditions

• Study 2011/2012 • Review/approval 2013
• DOT
• City Agencies
• Stakeholders
• Mayor’s Office
• Published 2013
• DOT website
• Implementation 2014
• Action Plan
• Reporting
• Monitoring

Valorie LaCour , RLA, LEED AP
City of Baltimore
Department of Transportation
Division Chief, Planning
443-984-4092