banana exports major countries 2008 - 2010 banana thousand ... · ccp:ba/tf 11/ crs1 food and...
TRANSCRIPT
CCP:BA/TF 11/ CRS1
FOOD AND AGRICULTURE ORGANIZATION OF THE UNITED NATIONS
ORGANISATION DES NATIONS UNIES POUR L'ALIMENTATION ET L'AGRICULTURE
ORGANIZACION DE LAS NACIONES UNIDAS PARA LA ALIMENTACION Y LA AGRICULTURA
BANANA
STATISTICS
2011
BANANO
ESTADÍSTICAS
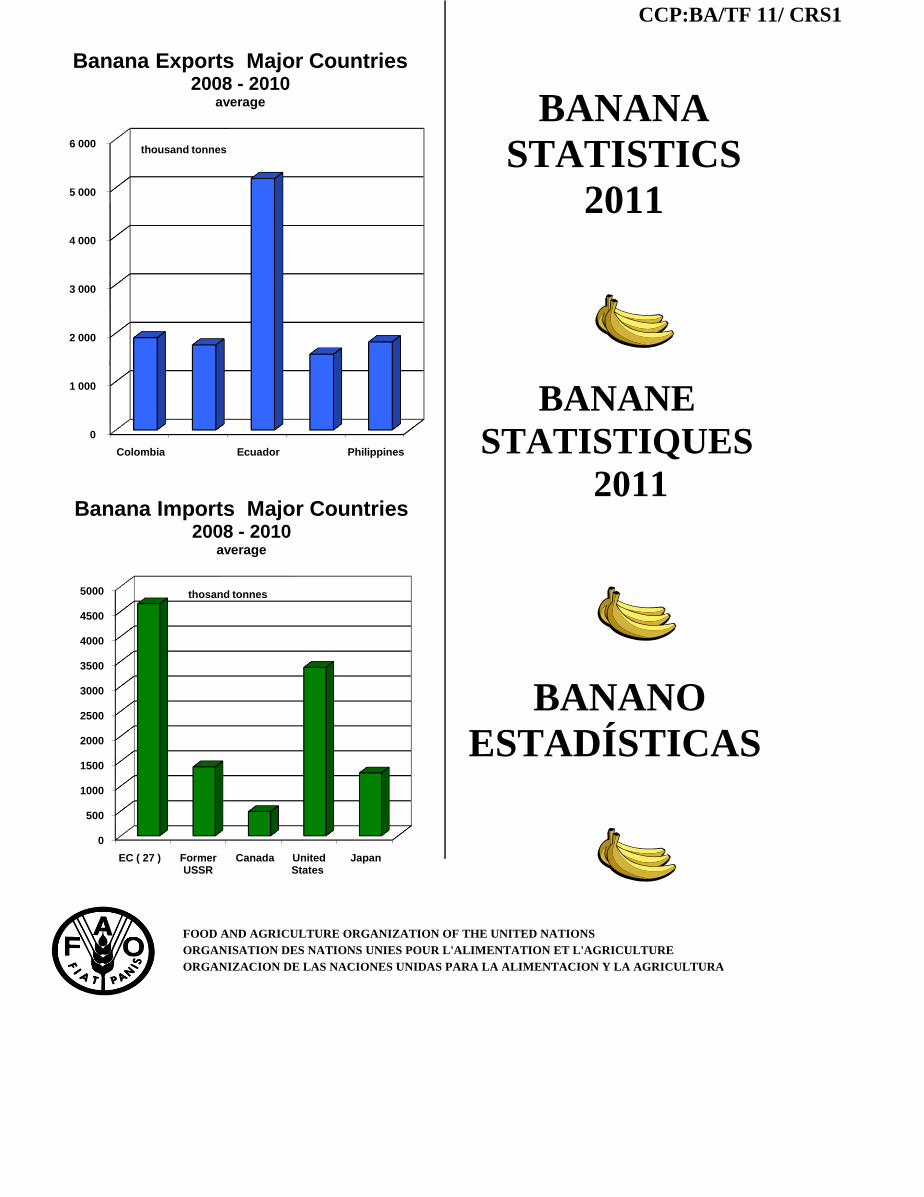
Banana Exports Major Countries2008 - 2010
average
Banana Imports Major Countries2008 - 2010
average
BANANE
STATISTIQUES
2011
0
1 000
2 000
3 000
4 000
5 000
6 000
Colombia Ecuador Philippines
thousand tonnes
0
500
1000
1500
2000
2500
3000
3500
4000
4500
5000
EC ( 27 ) Former USSR
Canada United States
Japan
thosand tonnes

April 2011
This report is issued on an annual basis to Members and Observersof the Sub-Group
on Bananas of the Intergovernmental Group on Bananas and Tropical Fruits.
It is prepared by the Trade and Market Division, FAO, Rome, and the tables
contained bring together the information available to FAO, supplemented by data
obtained from other sources in particular with regard to preliminary estimates. The
report is available at the following FAO Web site:
http://www.fao.org/economic/est/en/
Contents
Table 1 - World gross exports by country
Table 2 - World re-exports by country
Table 3(a) - World net imports by country
Table 3 (b) - EC: Total supply of bananas and per caput supply
Table 4 - Per caput net imports by country
Table 5 - Exports by countries of destination
Table 6 - Gross Imports by countries of origin
Table 7 - Import prices in selected countries, monthly
Table 8 - Wholesalers' selling prices in selected countries, monthly
Table 9 - Retail prices in selected countries, monthly

Avril 2011
Ce document est publié chaque année à l’intention des Membres et Observateurs du
sous-groupe sur la banane du Groupe intergouvernemental sur la banane et les fruits
tropicaux. Il a été réalisé par la Division du commerce international et marchés
de la FAO, Rome. Les tableaux présentés rassemblent les informations dont dispose
la FAO au moment de la rédaction, complétées par des données provenant d’autres
sources en particulier pour les estimations préliminaires. Ce document peut être
téléchargé à partir du site de la FAO :
http://www.fao.org/economic/est/fr/
Table des matières
Tableau 1 - Exportations brutes mondiales par pays
Tableau 2 - Réexportations mondiales par pays
Tableau 3(a) - Importations nettes mondiales par pays
Tableau 3 (b) - CE: L' offre totale de banane et l' offre par habitant
Tableau 4 - Importations nettes par habitant par pays
Tableau 5 - Exportations par pays de destination
Tableau 6 - Importations brutes par pays d'origine
Tableau 7 - Prix à l'importation mensuels dans certains pays
Tableau 8 - Prix de vente en gros mensuels dans certains pays
Tableau 9 - Prix mensuels au detail dans certains pays

Abril 2011
Este informe se publica una vez por año y está destinado a Miembros y observadores
del Subgrupo sobre el Banano del Grupo Intergubernamental sobre el Banano y las
Frutas Tropicales. El mismo es realizado por la Dirección de Comercio y Mercados
de la FAO, Roma. Los cuadros contienen un resumen de la información
disponible en FAO al momento de su redacción, que se complementa de datos de
otras fuentes fundamentalmente para las estimaciones primarias. El informe está
disponible en el siguiente sitio:
http://www.fao.org/economic/est/es/
Indice
Cuadro 1 - Exportaciones brutas mundiales por país
Cuadro 2 - Reexportaciones mundiales por país
Cuadro 3(a) - Importaciones netas mundiales por país
Cuadro 3(b) - CE: Oferta total de banano y oferta por habitante
Cuadro 4 - Importaciones netas por habitante por país
Cuadro 5 - Exportaciones por países de destino
Cuadro 6 - Importaciones brutas por países de origen
Cuadro 7 - Precios mensuales de importación en algunos países
Cuadro 8 - Precios mensuales de venta al por mayor en algunos países
Cuadro 9 - Precios mensuales al por menor en algunos países

Table 1 - World gross exports by country
Tableau 1 - Exportations brutes mondiales par pays
Cuadro 1 - Exportaciones brutas mundiales por país
1999 2000 2001 2002 2003 2004 2005 2006 2007 2008 2009 2010 2011
(forecast)
( ... thousand tonnes / milliers de tonnes / miles de toneladas ... )
Latin America & Caribbean 9 904.0 9 723.9 9 443.3 9 933.1 10 471.5 10 436.7 10 620.1 11 260.8 12 133.3 12 174.8 12 492.9 11 543.2
Latin America 9 716.3 9 559.3 9 312.5 9 789.0 10 352.7 10 324.5 10 538.5 11 155.8 12 055.7 12 099.4 12 405.1 11 497.8
Belize 56.2 65.8 50.1 43.0 74.9 80.5 76.3 73.0 61.1 82.7 81.8 79.2 83.7
Brazil 81.2 71.8 105.1 241.0 220.8 188.1 212.2 194.3 185.7 130.9 143.9 139.0
Colombia 1 818.3 1 680.2 1 516.3 1 570.4 1 423.2 1 470.9 1 621.5 1 697.4 1 749.2 1 798.3 2 101.8 1 802.6
Costa Rica 2 112.6 1 883.3 1 739.3 1 622.6 1 901.3 1 792.5 1 614.5 1 961.1 2 159.2 1 872.6 1 587.5 1 795.6 1 868.4
Dominican Republic 58.0 80.2 130.2 114.7 126.7 102.0 167.1 205.6 212.0 178.7 263.4 323.2
Ecuador 3 935.2 3 939.5 3 990.4 4 199.2 4 671.2 4 537.0 4 653.9 4 797.8 5 057.1 5 132.8 5 473.1 4 945.0
Guatemala 623.4 801.3 873.8 971.7 933.3 1 013.8 1 046.3 982.6 1 330.4 1 576.4 1 627.0 1 480.6
Honduras 119.6 375.3 431.8 441.4 443.4 527.7 501.1 516.2 570.1 605.7 519.7 246.0
Mexico 129.2 45.5 37.4 35.8 39.9 41.6 70.2 66.6 41.6 86.2 159.1 174.1
Nicaragua 57.2 45.5 44.1 40.8 40.9 44.9 45.5 37.7 38.9 37.8 34.9 20.1
Panama 593.4 489.3 321.1 418.5 410.2 398.0 348.3 431.1 438.6 366.6 183.0 240.5
Peru 0.9 8.0 19.1 18.1 27.3 42.9 57.1 65.5 78.2 83.3
Suriname 39.5 35.4 28.7 28.0 0.1 21.4 39.6 47.4 56.2 65.4 57.0 79.1
Venezuela 82.0 36.1 23.3 26.5 20.3 36.0 45.6 11.7 10.6 1.4 0.1
Others: 10.5 9.4 12.9 16.5 28.4 42.7 53.6 76.2 79.5 85.8 89.4 89.4
Caribbean 187.7 164.6 130.7 144.1 118.8 112.2 81.6 104.9 77.6 75.4 87.7 45.4
Jamaica 52.2 42.0 43.1 39.9 41.8 28.7 11.6 31.9 17.4 0.04 0.0
Former Windward I. 135.4 122.6 87.7 104.2 77.1 83.5 70.0 73.1 60.2 75.4 87.7 45.4
Dominica 29.5 28.8 19.1 17.5 13.4 16.1 14.1 14.1 9.6 12.2 36.5 4.2
Grenada 0.6 0.7 0.6 0.6 0.4 0.4 - 0.3 0.2 0.5
Saint Lucia 65.8 50.1 34.7 49.3 34.8 43.1 30.7 34.9 25.6 41.2 33.2 23.2
St. Vincent & Grenadines 39.5 43.0 33.3 36.9 28.5 24.0 25.2 23.8 24.8 21.4 18.1 18.1
Far East 1 512.0 1 703.8 1 689.6 1 785.3 1 944.3 1 904.7 2 169.3 2 410.3 2 312.1 2 305.7 1 857.4 1 780.8
China 57.3 50.2 39.2 39.7 53.0 41.6 38.8 22.8 20.9 15.1 13.2
Malaysia 35.9 31.1 30.2 27.9 24.6 21.1 33.8 26.8 27.1 30.1 20.0
Pakistan 0.0 2.1 1.4 3.7 7.2 6.0 8.5 10.9 7.9 13.0 86.7
Philippines 1 319.6 1 599.4 1 600.7 1 685.0 1 829.4 1 797.3 2 024.3 2 311.5 2 217.7 2 192.6 1 664.1 1 590.1
Thailand 6.8 5.8 5.5 5.2 6.3 17.7 41.8 20.3 21.4 22.8 25.6 23.3
Vietnam 10.0 4.5 4.2 14.6 12.6 7.2 3.9 2.1 1.6 2.6 1.7
Others: 82.4 10.7 8.4 9.2 11.1 13.8 18.1 15.9 15.4 29.6 46.2
India 6.3 8.6 8.1 8.7 10.9 12.6 14.4 11.5 13.0 27.6 45.8
Africa 409.6 494.1 488.9 532.9 565.1 556.8 504.5 605.7 580.1 611.4 568.2 569.7
Cameroon 165.0 238.2 254.1 258.8 313.7 294.9 265.5 256.6 232.3 268.7 255.5 232.8
Côte d'Ivoire 217.6 217.3 224.4 256.0 242.4 252.4 234.4 286.4 290.8 264.3 257.0 244.3
Ethiopia 0.8 0.5 0.3 0.9 1.3 2.9 0.0 0.5 2.6 2.0 2.8 3.6
Others: 6.6 9.3 4.8 10.7 7.7 6.5 4.6 62.1 54.4 76.4 52.8 88.9
Ghana 2.8 3.9 3.3 3.0 1.3 1.9 1.9 57.5 52.1 69.8 47.6 83.7
Oceania 0.3 0.3 0.1 0.1 0.1 0.1 0.1 0.1 0.1 0.1 0.1 0.1
WORLD 11 825.8 11 922.1 11 621.8 12 251.4 12 981.0 12 898.2 13 294.0 14 276.8 15 025.5 15 092.0 14 918.6 13 893.7

Table 2 - World re-exports by country
Tableau 2 - Réexportations mondiales par pays
Cuadro 2 - Reexportaciones mundiales por país
1999 2000 2001 2002 2003 2004 2005 2006 2007 2008 2009 2010
( ... thousand tonnes / milliers de tonnes / miles de toneladas ... )
DEVELOPING COUNTRIES 50.3 37.7 50.6 15.7 17.3 15.8 21.6 17.5 15.6 16.2 21.5
Far East 11.2 4.6 3.2 5.7 7.8 13.8 15.6 16.9 15.3 16.2 21.5
Hong Kong 11.2 4.6 3.2 5.7 6.5 11.9 14.9 16.3 14.7 15.9 21.5
China-Macao
Korea Rep. 1.0 1.8 0.7 0.6 0.6 0.3
DEVELOPED COUNTRIES 457.9 440.0 443.3 441.4 463.4 477.6 470.0 470.5 492.7 555.8 558.4 516.7
EC (15) 1/ 27.4 34.3 34.3 35.3 6.0 5.6
EC ( 25 ) 1/ 27.4 34.3 34.3 35.3 6.0 5.6 4.5 8.3
EC ( 27 ) 1/ 31.1 30.7 30.1 12.3 12.8 10.2 5.2 8.4 9.3 10.0 7.9 8.4
Other Europe 0.1 1.8 0.0 0.9 3.0 0.4
Former Yugoslavia 0.1 1.8 0.0 0.9 3.0 0.4
Bosnia Herzgovina 2.8 0.3
Croatia 0.1 1.8 0.0 0.0 0.1 0.1
Former USSR 7.5 6.9 5.9 10.8 19.1 16.7 13.4 15.7 22.7 20.5 11.8 4.8
Armemia 0.6 3.1 2.3
Belarus 3.8 3.4 0.4 1.7 2.6 2.4 0.1
Georgia 1.4 0.1 0.6 0.7 1.2 2.1
Russian Fed. 3.7 3.5 5.5 9.2 15.0 14.2 12.1 12.0 19.0 18.2 11.5 4.8
North America 419.2 400.6 407.4 417.1 428.5 450.3 451.1 446.4 460.5 524.6 538.3 503.5
Canada 0.4 0.4 0.5 0.4 0.4 1.7 0.0 1.9 0.0 0.0 0.2
United States 418.8 400.2 406.9 416.8 428.1 448.6 451.1 444.5 460.5 524.5 538.2 503.5
WORLD 508.1 477.7 493.9 457.1 480.7 493.4 491.6 488.0 508.3 572.0 579.9
1/ Source: EUROSTAT

Table 3(a) - World net imports by country
Tableau 3(a) - Importations nettes mondiales par pays
Cuadro 3(a) - Importaciones netas mundiales por país
1999 2000 2001 2002 2003 2004 2005 2006 2007 2008 2009 2010(preliminary)
( ... thousand tonnes / milliers de tonnes / miles de toneladas ... )
DEVELOPING COUNTRIES 1 956.2 2 251.6 1 939.8 1 957.8 2 331.9 2 465.1 2 696.3 2 935.2 2 962.0 3 319.9 2 592.4 2 805.3
Latin America 551.7 636.0 603.1 500.6 559.1 562.6 600.5 562.4 598.3 622.5 614.3
Argentina 312.8 340.0 330.1 229.5 286.4 303.3 302.2 295.7 318.9 346.8 344.1
Chile 154.9 192.6 147.5 149.1 157.8 159.7 195.3 168.9 178.2 175.0 179.3
El Salvador 34.2 59.0 61.2 61.4 56.6 51.5 53.1 49.1 53.8 52.7 43.5
Uruguay 47.1 33.0 48.9 43.8 41.1 43.7 47.3 44.6 42.0 43.0 41.6
Others 2.7 11.5 15.4 16.7 17.1 4.3 2.5 4.1 5.4 5.0 5.8 0.6
Near East 682.3 705.3 511.7 559.6 775.7 942.9 1 188.2 1 415.2 1 387.3 1 738.8 857.0
Iran 200.0 200.0 75.6 150.7 271.0 270.9 450.9 372.8 447.7 751.6 47.6
Saudi Arabia 159.0 186.9 181.0 176.5 199.4 211.5 233.2 235.1 248.1 256.7 252.4
Syria 62.7 68.7 53.0 47.8 70.4 93.9 111.6 322.7 192.7 219.6 183.7
Turkey 150.5 124.2 41.6 64.6 91.9 110.2 151.0 168.6 224.3 219.1 182.4
United Arab Emirates 67.8 68.5 79.6 68.3 70.7 157.6 174.8 207.5 122.9 126.7
Others 8.7 24.2 30.8 25.5 23.8 20.1 29.9 39.7 53.1 68.5 64.0 85.2 Egypt 5.2 5.3 5.9 2.6 1.2 1.1 2.8 6.1 4.7 3.0 2.5 10.1
Jordan 3.6 5.3 2.9 2.2 1.5 2.1 6.3 9.3 20.2 33.0 25.6 39.6
Bahrain 0.0 4.0 12.6 10.2 9.8 10.0 7.8 9.5 10.1 11.1 14.4 13.8
Far East 676.1 868.7 701.9 626.0 736.3 680.6 703.2 762.8 732.1 717.4 850.3
China 431.7 593.5 414.0 347.8 421.2 380.9 355.7 387.8 331.9 362.3 491.3 665.2
China - Hong Kong SAR 36.5 47.1 51.8 51.8 57.9 54.5 57.2 56.5 53.4 56.6 60.1 81.7 China-Macao 1.5 1.7 1.9 1.7 2.0 1.8 1.2 2.3 2.0 2.0 2.2 2.3
Korea Rep. 167.8 184.2 194.5 187.2 220.0 208.3 253.3 279.7 307.7 258.1 257.0
Singapore 38.6 42.3 39.8 37.6 35.2 35.0 35.7 36.5 37.1 38.4 39.7
Africa 46.0 41.5 123.0 271.6 260.9 279.1 204.5 194.7 244.3 241.1 270.7
Algeria 0.0 0.0 85.4 231.5 223.3 204.6 157.1 147.2 162.6 163.9 179.6
Morocco 12.2 0.0 2.8 1.4 1.1 2.2 4.9 5.4 17.2 18.7 26.7 26.7 Senegal 9.6 7.1 10.5 12.1 12.3 14.1 15.0 15.7 16.6 16.9 16.8 16.5 Tunisia 10.6 15.5 11.0 16.3 13.8 54.3 20.8 20.3 41.0 33.5 37.1 Burkina Faso 5.5 7.6 3.4 2.4 1.2 0.5 0.8 0.5 1.2 1.2 3.0
Others 8.2 11.3 9.7 8.0 9.1 3.4 5.9 5.7 5.6 6.9 7.6 9.3
DEVELOPED COUNTRIES 9 217.6 9 271.6 9 026.7 9 242.9 9 495.4 9 683.0 10 211.3 10 741.3 11 507.0 11 767.9 11 061.0 11 650.2
EC ( 27 ) 3 908.2 3 890.1 3 771.8 3 886.8 4 023.0 4 001.0 3 923.0 4 367.6 4 682.4 4 873.8 4 507.9 4 560.5
Other Europe 240.8 220.9 260.2 322.5 284.7 347.9 322.2 331.1 357.2 370.8 334.0
Albania 8.8 17.8 8.5 18.7 22.7 17.2 16.8 16.8 20.2 17.4 17.2 17.5
Iceland 3.5 3.5 3.7 4.0 4.1 4.6 4.7 5.4 5.5 5.6 5.7 5.7
Norway 64.6 59.9 60.9 59.8 63.4 66.2 73.2 74.6 78.5 83.5 81.2 78.5
Switzerland 74.6 72.3 73.4 74.3 72.2 73.5 74.2 74.1 78.2 82.1 80.8
Former Yugoslavia 89.3 67.3 113.8 165.6 122.4 186.3 153.2 160.2 174.9 182.2 149.0 151.5
Bosnia Herzgovina 0.1 0.5 0.6 0.3 41.4 46.2 44.9 37.8 38.3 40.8 37.1 37.0
Croatia 47.3 41.9 43.2 45.1 50.6 50.8 54.0 51.5 54.8 57.0 52.1 49.4
Macedonia Former YR 7.6 5.1 2.0 7.8 15.3 20.8 17.6 15.1 16.1 15.4 16.7 16.7
Serbia Monte 34.4 19.8 67.9 112.5 15.1 68.5 36.7 55.8 65.7 68.9 43.1 48.4
Former USSR 459.6 608.4 693.4 755.6 925.3 977.3 1 185.1 1 244.7 1 379.4 1 396.0 1 325.0 1 420.7
Armemia 1.6 1.6 1.0 1.8 1.3 3.9 7.6 5.5 14.9 8.3 8.4 8.5
Azerbaijan 3.6 3.2 1.1 0.3 1.6 4.7 7.7 9.1 13.9 15.1 18.4 18.4
Belarus 17.3 31.1 17.3 16.1 20.9 23.5 28.7 29.4 33.2 41.7 36.7 36.7
Kazakhstan 4.1 4.6 5.3 9.3 15.3 19.5 21.5 25.2 34.5 38.0 46.4 46.6 Moldova Rep. 0.8 1.6 1.7 1.5 3.1 4.9 7.0 7.7 11.2 12.9 11.7 10.5
Russian Fed. 374.2 499.5 606.7 640.8 787.0 842.7 852.8 883.5 959.7 988.5 969.4 1 063.8
Ukraine 52.2 59.5 55.5 79.1 87.0 67.6 249.4 272.0 297.5 278.1 227.3 227.3
North America 4 291.8 4 028.9 3 838.7 3 907.2 3 873.8 3 864.9 3 822.3 3 851.6 4 015.1 3 930.9 3 542.9 4 107.5
Canada 419.2 398.4 404.9 417.0 422.8 440.6 449.0 456.7 471.8 477.6 481.9 496.1
United States 3 872.6 3 630.4 3 433.8 3 490.2 3 451.1 3 424.2 3 373.3 3 395.0 3 543.3 3 453.4 3 061.0 3 611.4
Others 1 055.1 1 148.8 1 065.3 1 005.4 1 055.2 1 094.9 1 149.3 1 137.4 1 073.0 1 196.3 1 351.2 1 227.4
Japan 983.2 1 078.7 990.6 936.3 986.6 1 026.0 1 066.9 1 043.6 970.6 1 092.7 1 252.6 1 109.6
New Zealand 69.5 67.6 72.2 67.3 67.2 66.1 77.5 80.9 80.5 80.0 76.3 81.2 South Africa 2.4 2.6 2.6 1.8 1.4 2.8 5.0 12.9 21.9 23.6 22.2 36.7
WORLD 11 173.9 11 523.1 10 966.5 11 200.6 11 827.4 12 148.1 12 907.7 13 676.5 14 469.0 15 087.7 13 653.3 14 455.5

Table 3 (b) - EC: Total supply of bananas and per caput supply
Tableau 3 (b) - CE: Offre totale de banane et offre par habitant
Cuadro 3 (b) - CE: Oferta total de banano y oferta por habitante
1999 2000 2001 2002 2003 2004 2005 2006 2007 2008 2009
( ... thousand tons/ milliers de tonnes / miles de toneladas ... )
France: 342.0 358.9 322.8 358.9 329.2 305.3 280.5 268.6 167.3 171.6 235.8
Guadeloupe 83.5 87.6 89.0 95.1 85.5 59.1 54.2 47.8 38.0 46.7 55.6
Martinique 258.5 271.3 233.7 263.9 243.7 246.2 226.2 220.8 129.3 124.9 180.2
Spain 362.2 397.6 420.9 407.3 400.9 418.4 345.0 348.2 361.4 371.3 352.0
Greece 3.3 3.3 2.9 2.4 2.7 2.9 2.9 2.9 2.9 2.7 2.6
Cyprus 13.5 8.5 9.8 10.5 11.2 10.5 5.8 6.5 6.0 4.2 3.2
Portugal 21.8 22.5 20.7 21.9 21.4 21.2 14.2 15.3 17.2 17.8 14.5
Production 742.8 790.7 777.1 801.1 765.4 758.2 648.4 641.6 554.7 567.0 567.0
Net Imports
EC (27) 3 908.2 3 890.1 3 771.8 3 886.8 4 023.0 4 001.0 3 923.0 4 367.6 4 682.4 4 873.8 4 507.9
Supply 4 651.0 4 680.7 4 548.9 4 687.9 4 788.4 4 759.2 4 571.4 5 009.2 5 237.1 5 440.8 5 074.9
Per caput supply 10.31 10.35 10.02 10.29 10.46 10.36 9.91 10.18 10.61 10.99 10.22
Source: EC Commission.

Table 4 - Per caput net imports by country
Tableau 4 - Importations nettes par habitant par pays
Cuadro 4 - Importaciones netas por habitante por país
1999 2000 2001 2002 2003 2004 2005 2006 2007 2008 2009
( ... thousand tonnes / milliers de tonnes / miles de toneladas ... )
DEVELOPING COUNTRIES 1.11 1.25 1.07 1.07 1.27 1.33 1.44 1.56 1.56 1.73 1.26
Latin America 8.15 9.32 8.75 7.19 7.95 7.93 8.38 7.77 8.19 8.44 8.25
Argentina 8.55 9.21 8.86 6.10 7.54 7.90 7.80 7.56 8.07 8.69 8.54
Chile 10.31 12.49 9.46 9.45 9.89 9.91 11.99 10.26 10.71 10.41 10.57
El Salvador 5.55 9.93 10.25 10.24 9.41 8.53 8.77 8.07 8.81 8.59 7.05
Uruguay 14.22 9.94 14.72 13.17 12.37 13.15 14.23 13.39 12.57 12.85 12.38
Others 0.41 1.73 2.28 2.43 2.45 0.61 0.35 0.55 0.73 0.66 0.76
Near East 2.46 2.47 1.75 1.88 2.56 3.06 3.79 4.46 4.26 5.25 2.09
Iran 2.99 3.01 1.13 2.24 3.99 3.95 6.49 5.31 6.18 10.25 0.64
Saudi Arabia 7.61 8.98 8.47 8.05 8.87 9.18 9.88 9.72 10.05 10.18 9.81
Syria 3.99 4.16 3.13 2.74 3.94 5.11 5.91 16.63 9.40 10.34 8.39
Turkey 2.30 1.82 0.60 0.92 1.29 1.53 2.07 2.34 3.07 2.96 2.44
United Arab Emirates 28.27 21.10 23.26 18.96 18.70 39.93 42.58 48.84 28.15 28.25 0.00
Others: 0.12 0.32 0.40 0.32 0.29 0.24 0.35 0.46 0.60 0.76 0.43 Egypt 0.08 0.07 0.08 0.04 0.02 0.02 0.04 0.08 0.06 0.04 0.03
Jordan 0.73 1.10 0.59 0.44 0.29 0.38 1.14 1.62 3.40 5.37 4.06
Bahrain 0.00 6.21 18.98 15.08 14.17 14.06 10.71 12.91 13.33 14.25 14.23
Far East 23.68 25.55 25.76 24.32 26.04 24.73 24.67 27.24 26.63 25.86 26.68
China 0.34 0.46 0.32 0.27 0.32 0.29 0.27 0.29 0.25 0.27 0.37
China - Hong Kong SAR 5.37 6.92 7.51 7.42 8.50 7.96 8.32 8.17 7.68 8.11 8.56 China-Macao 3.41 3.71 4.09 3.65 4.25 3.92 2.53 4.59 4.01 3.80 4.06
Korea Rep. 3.61 3.94 4.13 3.96 4.63 4.37 5.29 5.85 6.42 5.36 5.32
Singapore 10.96 10.52 9.71 9.02 8.34 8.18 8.26 8.33 8.27 8.31 8.37
Africa 7.89 9.49 10.82 14.89 14.71 14.95 11.54 11.03 13.86 13.73 15.00
Algeria 0.00 0.00 2.76 7.37 7.00 6.32 4.78 4.41 4.80 4.77 5.15
Morocco 0.44 0.00 0.10 0.05 0.04 0.07 0.16 0.17 0.55 0.59 0.83 Senegal 1.04 0.69 0.99 1.11 1.10 1.23 1.27 1.36 1.40 1.39 1.34 Tunisia 1.12 1.62 1.14 1.66 1.39 5.43 2.06 1.98 4.07 3.30 3.61 Burkina Faso 0.47 0.64 0.28 0.19 0.10 0.04 0.06 0.04 0.08 0.08 0.19
Others 4.82 6.55 5.55 4.51 5.07 1.86 3.20 3.06 2.95 3.61 3.88
DEVELOPED COUNTRIES 7.36 7.35 7.12 7.27 7.44 7.55 7.93 8.11 8.66 8.82 8.26
EC ( 27 ) 8.67 8.60 8.31 8.53 8.79 8.71 8.50 8.88 9.49 9.85 9.08
Other Europe 6.66 6.10 7.17 8.91 7.87 9.61 8.89 9.11 9.82 10.17 9.14
Albania 2.82 5.79 2.74 6.03 7.29 5.47 5.33 5.31 6.44 5.53 5.46
Iceland 12.54 12.46 12.86 14.06 14.19 15.78 16.02 17.78 17.91 17.62 17.78
Norway 14.54 13.35 13.49 13.16 13.84 14.37 15.79 15.99 16.62 17.52 16.88
Switzerland 10.15 9.96 10.07 10.15 9.81 9.95 10.00 9.90 10.41 10.89 10.67
Former Yugoslavia 4.26 3.19 5.39 7.91 5.87 8.97 7.39 7.74 8.45 8.80 7.20
Bosnia Herzgovina 0.02 0.14 0.16 0.07 10.93 12.23 11.88 9.99 10.15 10.81 9.86
Croatia 10.57 9.29 9.60 10.09 11.35 11.42 12.14 11.60 12.36 12.90 11.80
Macedonia Former YR 3.76 2.54 1.01 3.83 7.55 10.22 8.65 7.40 7.89 7.55 8.18
Serbia Monte 3.23 1.83 6.33 10.55 1.43 6.52 3.51 5.34 6.29 6.59 4.11
Former USSR 1.62 2.16 2.47 2.70 3.32 3.51 4.26 4.49 4.98 5.04 4.79
Armemia 0.46 0.52 0.33 0.60 0.44 1.29 2.52 1.80 4.84 2.68 2.72
Azerbaijan 0.47 0.39 0.13 0.04 0.19 0.56 0.93 1.08 1.61 1.73 2.08
Belarus 1.68 3.09 1.73 1.62 2.11 2.38 2.93 3.01 3.42 4.31 3.81
Kazakhstan 0.25 0.31 0.35 0.62 1.02 1.29 1.41 1.65 2.24 2.45 2.97 Moldova Rep. 0.18 0.40 0.42 0.37 0.79 1.28 1.86 2.07 3.06 3.55 3.26
Russian Fed. 2.54 3.39 4.13 4.41 5.44 5.86 5.96 6.20 6.76 6.99 6.88
Ukraine 1.03 1.22 1.15 1.65 1.83 1.43 5.32 5.84 6.43 6.05 4.97
North America 13.98 12.77 12.04 12.13 11.90 11.75 11.51 11.38 11.75 11.40 10.17
Canada 13.58 12.98 13.07 13.32 13.37 13.79 13.91 14.00 14.32 14.36 14.35
United States 14.02 12.74 11.93 12.00 11.74 11.54 11.25 11.11 11.48 11.08 9.73
Others 6.07 6.52 6.01 5.65 5.90 6.10 6.39 6.31 5.94 6.60 7.44
Japan 7.77 8.49 7.78 7.34 7.73 8.03 8.34 8.19 7.62 8.58 9.85
New Zealand 18.16 17.55 18.51 17.06 16.79 16.31 18.91 19.47 19.19 18.90 17.89 South Africa 0.05 0.05 0.06 0.04 0.03 0.06 0.10 0.26 0.45 0.48 0.44
WORLD 3.70 3.77 3.56 3.61 3.79 3.87 4.09 4.26 4.48 4.64 4.12

Table 5 - Exports by countries of destination 1/
Tableau 5 - Exportations par pays de destination 1/
Cuadro 5 - Exportaciones por países de destino 1/
2000 2001 2002 2003 2004 2005 2006 2007 2008 2009 2010
(preliminary)
( ... thousand tonnes / milliers de tonnes / miles de toneladas ... )
BELIZE
TO:
United Kingdom 65.8 50.1 43.0 74.9 80.5 76.3 73.0 60.9 66.2 61.4 55.4
Ireland 16.5 20.5 23.8
Others 0.0 0.0 0.0
TOTAL 65.8 50.1 43.0 74.9 80.5 76.3 73.0 61.1 82.7 81.8 79.2
BRAZIL
TO:
Argentina 30.0 60.9 163.1 129.7 91.4 97.9 56.1 58.3 33.9 52.2 38.5
Italy 20.8 23.4 17.1 19.1 12.8 8.6 7.0
Uruguay 23.3 27.3 39.5 40.1 42.3 47.8 42.9 39.3 38.8 36.4 37.2
United Kingdom 9.8 16.0 30.1 25.9 30.6 36.1 54.6 40.0 16.5 19.0 12.0
Others 8.6 0.9 8.4 25.1 3.0 6.9 23.6 29.0 29.0 27.6 44.3
TOTAL 71.8 105.1 241.0 220.8 188.1 212.1 194.3 185.7 130.9 143.9 139.0
COLOMBIA
TO:
Belgium-Lux. 476.8 506.4 566.9 476.3 570.7 624.6 604.8 502.3 612.2 519.4 416.2
United States 635.1 506.2 568.2 486.9 463.4 525.9 480.2 476.7 488.4 676.5 547.8
U.K. 26.4 276.3
Italy 159.0 162.6 122.6 119.3 112.0 100.6 72.1 99.1 114.7 180.1 212.2
Russian Federation 31.4 18.7 14.7 17.7 50.1 31.1 18.4 21.5 . . . 5.2 0.4
China 70.4 33.1 19.1 - - - - - - . . . . . .
Saudi Arabia 23.9 23.0 0.5 6.6 2.7 - - - . . . - . . .
Germany 142.8 237.0 206.4 192.9 135.1 161.5 208.6 369.8 288.2 290.9 218.1
Others 140.8 29.3 72.0 123.5 136.9 177.8 313.3 279.8 294.8 403.2 131.6
TOTAL 1 680.2 1 516.3 1 570.4 1 423.2 1 470.9 1 621.5 1 697.4 1 749.2 1 798.3 2 101.8 1 802.6

Table 5 - Exports by countries of destination 1/
Tableau 5 - Exportations par pays de destination 1/
Cuadro 5 - Exportaciones por países de destino 1/
2000 2001 2002 2003 2004 2005 2006 2007 2008 2009 2010
(preliminary)
( ... thousand tonnes / milliers de tonnes / miles de toneladas ... )
COSTA RICA
TO:
North America 1 074.8 1 006.3 809.3 927.6 854.8 791.1 950.5 1 038.2 855.7 656.9 807.2
Europe 770.4 732.2 813.3 973.3 937.6 807.3 946.2 954.1 911.2 813.5 786.8
Russian Federation 15.4 69.3 30.3 40.9
Asia 38.2 0.3 28.9
Others 0.0 0.8 0.0 0.4 0.1 16.1 49.0 167.0 36.4 86.5 204.6
TOTAL 1 883.3 1 739.3 1 622.6 1 901.3 1 792.5 1 614.5 1 961.1 2 159.2 1 872.6 1 587.5 1 868.4
CÔTE D'IVOIRE
TO:
France 157.4 181.7 174.0 128.8 120.1 143.2 123.8 99.8 81.3 133.3 91.6
U.K. 10.6 5.7 6.4 19.8 22.8 30.6 42.0 40.2 41.8 51.0 71.7
Germany 0.1 - -
Italy 0.9 - 0.3
Belgium - Luxembourg 91.7 42.2 95.0 121.8 107.7 37.5 73.6
Senegal 10.1 13.4 14.0 13.1 14.4 14.9 20.0 21.3 21.4 17.9
Others 39.1 23.6 61.6 80.5 3.4 3.5 5.5 7.8 11.0 17.3 7.2
TOTAL 217.3 224.4 256.0 242.2 252.4 234.4 286.4 290.8 264.3 257.0 244.3
DOMINICA
TO:
United Kingdom 27.2 17.8 16.4 13.4 13.3 11.8 11.8 7.2 10.5 36.4 3.9
Others 1.6 1.2 1.0 0.0 2.8 2.3 2.3 2.4 1.7 0.1 0.4
TOTAL 28.8 19.1 17.5 13.4 16.1 14.1 14.1 9.6 12.2 36.5 4.2
DOMINICAN REP.
TO:
Belgium-Lux. 14.1 24.4 29.0 47.2 21.5 21.3 26.2 29.8 35.0 56.5 67.4
Italy 6.7 8.5 7.9 5.3 6.2 7.1 10.7 5.7 1.4 0.4 0.1
United Kingdom 30.0 50.4 56.2 60.4 62.7 127.1 127.4 158.5 120.5 154.5 190.6
United States 6.8 7.9 3.4 2.6 4.1 3.3 7.2 1.7 0.4 1.7 1.2
Others 22.6 39.0 18.2 11.2 7.5 8.4 34.1 16.3 21.4 50.4 63.9
TOTAL 80.2 130.2 114.7 126.7 102.0 167.1 205.6 212.0 178.7 263.4 323.2

Table 5 - Exports by countries of destination 1/
Tableau 5 - Exportations par pays de destination 1/
Cuadro 5 - Exportaciones por países de destino 1/
2000 2001 2002 2003 2004 2005 2006 2007 2008 2009 2010
(preliminary)
( ... thousand tonnes / milliers de tonnes / miles de toneladas ... )
ECUADOR
TO:
United States 839.1 957.0 1 128.4 938.2 924.6 956.2 942.5 729.7 880.5 1 144.5 1 000.1
Italy 480.0 556.7 933.7 1 175.2 1 174.5 1 131.7 945.5 916.3 943.9 1 004.3 840.1
Germany 398.2 387.3 501.8 523.2 469.1 520.0 424.7 320.2 532.4 525.0 447.3
Belgium-Lux. 263.8 259.8 203.6 214.0 220.5 168.6 200.4 263.3 390.4 318.9 347.2
Russian Federation 548.2 517.6 874.2 976.6 1 031.0 1 143.9 989.3 910.3 1 394.7 1 315.1 1 062.4
Argentina 271.1 205.8 39.4 109.5 141.9 122.7 105.3 112 215.6 195.5 181.3
Chile 192.1 102.8 167.8 219.5 184.7 184.0 189.3 142.1 185.7 197.7 207.6
Japan 219.3 158.6 170.8 155.2 133.0 98.2 92.3 44.6 53.2 66.4 44.7
New Zealand 74.0 60.3 61.9 39.7 41.8 38.4 31.0 23.9 30.3 32.2 31.3
Poland 84.9 85.9 41.0 . . . 4.8 - 6.7 - 4.2 22.5 17.2
China 235.9 26.7 16.8 . . . 10.8 3.9 . . . 0.4 4.5 1.0 1.9
Iran - - - - - 3.9 - - - 1.0 2.1
Others 331.6 671.8 59.7 320.1 200.4 282.3 870.6 1 594.3 421.7 308.8 1 290.0
TOTAL 3 939.5 3 990.4 4 199.2 4 671.2 4 537.0 4 653.9 4 797.8 5 057.1 5 132.8 5 473.1 4 945.0
GRENADA
TO:
United Kingdom 0.7 0.6 0.6 0.4 0.4 0.3 0.2 0.5
TOTAL 0.7 0.6 0.6 0.4 0.4 - 0.3 0.2 0.5 . . . . . .
GUATEMALA
TO:
United States 309.4 801.5 825.9 925.1 861.7 889.4 921.6 600.1 1 221.5 1 363.8 1 265.2
United Kingdom 0.4 0.5 - - - 0.4 1.0 1.0 5.1 1.5 1.1
Italy - - - - - 0.3 4.6 0.4 - 0.1 2.3
El Salvador 61.6 44.3 3.1 2.8 31.5 49.3 41.6 21.3 95.2 24.3 87.5
Others 429.8 27.6 142.7 5.4 120.6 107.0 13.8 707.6 254.6 237.3 124.5
TOTAL 801.3 873.8 971.7 933.3 1 013.8 1 046.3 982.6 1 330.4 1 576.4 1 627.0 1 480.6
HONDURAS
TO:
United States 294.5 319.2 391.3 391.5 498.4 453.5 456.9 458.6 565.6 482.9
Belgium-Lux. 0.3 2.0 15.5 8.4 18.3 22.6 21.2 21.5 12.2 7.3
Germany - 11.3
Italy - 13.4 0.9
United Kingdom 74.2 70.7 1.3 4.6 0.7
Others 6.3 15.2 32.4 43.6 11.0 25.0 38.1 90.0 23.3 28.8
TOTAL 375.3 431.8 441.4 443.4 527.7 501.1 516.2 570.1 605.7 519.7

Table 5 - Exports by countries of destination 1/
Tableau 5 - Exportations par pays de destination 1/
Cuadro 5 - Exportaciones por países de destino 1/
2000 2001 2002 2003 2004 2005 2006 2007 2008 2009 2010
(preliminary)
( ... thousand tonnes / milliers de tonnes / miles de toneladas ... )
JAMAICA
TO:
United Kingdom 42.0 43.1 39.9 41.8 28.7 11.6 31.9 17.4 0.04 0.03 0.08
Others 0.0 0.0 0.0 0.0 0.0 0.0 0.0 0.0 0.0 0.0 0.0
TOTAL 42.0 43.1 39.9 41.8 28.7 11.6 31.9 17.4 0.04 0.03 0.08
MEXICO
TO:
United States 27.4 31.8 33.4 27.7 36.3 37.9 42.9 36.7 70.9 123.8 157.3
Japan 5.4 4.7 3.7
Spain 0.1 5.6 6.4
Russian Fed. - 0.1 2.3 0.9
Others 18.1 5.6 2.4 12.2 5.3 32.3 23.7 4.9 9.7 22.7 5.7
TOTAL 45.5 37.4 35.8 39.9 41.6 70.2 66.6 41.6 86.2 159.1 174.1
PANAMA
TO:
Germany 23.6 82.0 16.2 13.1 16.6 2.2 11.8 0.1 4.6 - 2.8
United States 30.9 7.1 - - 0.6 5.9 17.5 13.6 26.6 4.7 28.1
Belgium-Lux. 128.1 125.1 120.1 88.8 73.9 57.8 76.5 71.6 9.1 3.0 7.8
Portugal 105.6 103.1 81.7 43.0 41.5 43.8 10.1 6.5 11.3
Sweden 199.5 105.9 174.3 178.5 209.3 192.2 212.9 233.1 231.5 138.5 185.5
Italy 58.9 - - - 6.6 11.6 16.0 8.8 49.0 5.7 4.9
Others 48.3 1.0 2.2 26.7 9.3 35.6 54.9 67.6 35.8 24.7 0.1
TOTAL 489.3 321.1 418.5 410.2 398.0 348.3 431.1 438.6 366.6 183.0 240.5
PHILIPPINES
TO:
Japan 950.6 864.0 847.7 884.0 915.2 918.2 909.5 914.2 1 106.5 913.8
Iran 9.3 30.4 169.9 223.4 372.7 428.7 401.3 250.6
Saudi Arabia 6.2 11.5 50.7 0.1 10.2 18.7 6.5 21.7 12.0
China 370.6 380.4 378.8 415.6 330.9 351.2 381.5 203.4 181.5 98.3
China, Hong Kong SAR 11.8 3.1 0.4 24.3 20.1 19.9 15.2 19.0 38.3 22.3
Korea, Rep. of 140.8 147.2 151.9 158.8 138.6 234.1 264.9 275.6 186.6 132.1
United Arab Emirates 98.0 125.9 209.2 200.2 157.6 179.9 207.5 167.2 71.1 57.2
Others 21.3 68.8 37.0 116.1 65.0 87.4 141.5 203.1 185.7 177.8
TOTAL 1 599.4 1 600.7 1 685.0 1 829.4 1 797.3 2 024.3 2 311.5 2 217.7 2 192.6 1 664.1 1 590.1

Table 5 - Exports by countries of destination 1/
Tableau 5 - Exportations par pays de destination 1/
Cuadro 5 - Exportaciones por países de destino 1/
2000 2001 2002 2003 2004 2005 2006 2007 2008 2009 2010
(preliminary)
( ... thousand tonnes / milliers de tonnes / miles de toneladas ... )
PERU
TO:
United States 11.2 13.5 12.2 23.1 26.4 17.9 23.9 19.8
Belgium 3.9 2.2 6.1 9.2 10.0 4.8 7.2 3.8
Netherlands 0.3 0.2 4.7 5.9 11.5 27.7 32.0 43.2
Germany 3.3 - 0.4 0.4 4.4 6.7 5.7 3.4
Japan 0.1 3.4 4.2 4.4 7.9 7.3 10.1
Others 0.9 8.0 0.3 2.0 0.4 0.1 0.4 0.5 2.2 3.0
TOTAL 0.9 8.0 19.1 18.1 27.3 42.9 57.1 65.5 78.2 83.3
SAINT LUCIA
TO:
United Kingdom 50.1 34.7 49.3 34.8 41.7 30.0 34.1 23.9 39.3 33.2 23.2
Others 0.0 0.0 0.0 0.0 1.4 0.7 0.8 1.7 1.9 0.0 0.0
TOTAL 50.1 34.7 49.3 34.8 43.1 30.7 34.9 25.6 41.2 33.2 23.2
ST.VINCENT & GRENADINES
TO:
United Kingdom 41.5 31.4 34.4 28.5 24.0 20.4 18.0 18.2 11.4 5.6
Others 1.4 1.8 2.5 0.0 0.0 4.8 5.8 6.6 10.0 12.5
TOTAL 43.0 33.3 36.9 28.5 24.0 25.2 23.8 24.8 21.4 18.1
SURINAME
TO:
United Kingdom 35.4 28.7 28.0 - 4.7 9.8 1.1
France 6.2 25.7 45.4 56.2 65.4 57.0
Others 0.0 0.0 0.0 10.4 4.0 0.9 0.0 0.0 0.0
TOTAL 35.4 28.7 28.0 0.1 21.4 39.6 47.4 56.2 65.4 57.0 79.1
1/ As declared by exporting countries; Comme declaré par les pays exportateurs; De acuerdo a lo declarado por los países exportadores.

Table 6 - Gross Imports by countries of origin 1/
Tableau 6 - Importations brutes par pays d'origine 1/
Cuadro 6 - Importaciones brutas por países de origen 1/
2000 2001 2002 2003 2004 2005 2006 2007 2008 2009 2010
(preliminary)
( ... thousand tonnes / milliers de tonnes / miles de toneladas ... )
ARGENTINA
FROM:
Ecuador 299.1 257.1 47.1 116.8 160.0 141.5 165.8 184.0 214.9 197.3
Brazil 35.0 62.1 164.8 129.3 90.3 98.1 56.1 58.3 33.8 52.3
Bolivia 5.8 5.8 14.6 24.9 40.7 55.7 64.1 64.7 70.6 78.0
Others 0.1 5.1 3.1 15.3 12.3 7.0 9.7 11.9 27.5 16.5
TOTAL 340.0 330.1 229.5 286.4 303.3 302.2 295.7 318.9 346.8 344.1
CANADA
FROM:
Costa Rica 114.4 105.7 88.1 119.6 106.1 92.7 88.1 125.3 115.4 71.0 105.83
Ecuador 127.6 108.0 128.2 104.8 82.1 78.0 94.2 100.3 121.0 164.2 147.22
Colombia 102.1 105.0 120.2 114.9 129.7 163.7 174.1 137.9 121.8 128.9 114.52
Honduras 12.7 32.2 31.0 28.7 35.3 20.6 10.1 23.5 29.2 17.5 29.52
Mexico 9.8 11.9 11.1 10.2 4.7 1.0 2.0 1.5 2.8 1.6 1.37
Guatemala 23.2 32.2 31.0 42.9 78.2 85.5 79.4 75.4 81.4 93.1 29.71
Panama 7.1 0.6 0.1 0.0 - 1.9 5.3 3.9 2.9 2.5 3.72
Dominican Rep. 0.4 0.7 0.2 0.1 0.7 0.1 0.6 0.4 0.1 0.2 0.1
Others 1.6 9.1 7.5 1.7 5.6 5.5 4.2 3.6 3.1 3.1 64.1
TOTAL 398.9 405.5 417.4 422.8 442.3 449.0 458.0 471.8 477.6 482.0 496.1
CHILE
FROM:
Ecuador 191.9 146.4 147.2 156.9 158.5 167.0 163.0 169.8 165.9 173.0
Others 0.7 1.1 1.9 2.0 1.8 28.3 5.9 8.4 9.1 6.3
TOTAL 192.6 147.5 149.1 158.9 160.2 195.3 168.9 178.2 175.0 179.3
CHINA
FROM:
Philippines 294.0 266.7 266.5 311.1 285.8 303.8 343.4 303.8 317.8 352.1
Ecuador 226.6 80.0 28.4 28.5 24.1 15.4 . . . 4.2 3.0 7.0
Indonesia 0.3 - - - 0.1 . . . 0.7 . . .
Vietnam 3.1 39.6 42.4 79.8 65.2 26.8 29.2 10.0 21.7 19.2
Thailand 0.6 0.6 0.6 1.8 5.7 9.6 . . . 13.8 15.2 17.6
Others 68.9 27.1 9.9 0.1 0.0 0.0 14.4 0.2 4.7 95.4
TOTAL 593.5 414.0 347.8 421.2 380.9 355.7 387.8 331.9 362.3 491.3 665.2

Table 6 - Gross Imports by countries of origin 1/
Tableau 6 - Importations brutes par pays d'origine 1/
Cuadro 6 - Importaciones brutas por países de origen 1/
2000 2001 2002 2003 2004 2005 2006 2007 2008 2009 2010
(preliminary)
( ... thousand tonnes / milliers de tonnes / miles de toneladas ... )
EC (27) 2/
FROM:
Ecuador 1 097.1 1 116.3 1 157.0 1 148.8 1 120.8 1 239.2 1 199.3 1 185.8 1 330.6 1 343.1 1 262.0
Colombia 753.5 751.6 768.0 799.2 766.5 882.4 951.4 1 156.1 1 278.2 1 240.8 1 201.2
Costa Rica 718.4 689.7 746.3 802.0 856.4 634.5 834.0 971.4 895.1 757.2 779.6
Panama 435.8 418.3 396.2 381.5 370.8 281.6 313.0 354.1 294.6 185.1 134.4
Cote d'Ivoire 208.3 226.6 216.7 207.4 210.8 183.8 221.8 189.4 216.6 229.2 244.3
Cameroon 212.0 225.4 236.5 298.5 261.2 252.9 252.7 221.8 279.5 249.7 243.1
Saint Lucia 72.6 34.7 49.3 32.5 42.9 28.2 36.7 30.5 38.5 33.3 23.2
Jamaica 40.9 43.0 40.6 41.8 28.7 11.7 31.9 18.4 . . . . . . 0.1
Honduras 112.3 115.2 34.5 25.2 21.2 23.1 21.8 31.6 24.0 8.5 15.2
Saint Vincent & the Grenadines 42.9 30.8 32.5 20.9 24.0 15.9 17.2 13.8 9.0 7.5 4.1
Guatemala 39.2 3.2 1.0 6.9 2.2 3.0 30.7 18.8 14.3 4.9 3.3
Dominica 28.4 18.1 17.5 10.5 12.2 12.8 13.3 7.3 10.3 36.9 4.2
Dominican Rep. 59.9 85.9 97.3 111.9 101.3 144.7 176.8 206.4 170.5 228.3 303.6
Others 70.3 5.5 104.1 143.8 193.6 211.9 275.4 286.4 322.8 191.3 350.8
TOTAL 3 891.5 3 764.3 3 897.5 4 031.0 4 012.5 3 925.7 4 376.0 4 691.7 4 883.8 4 515.7 4 568.9
2/ Source: European Community
JAPAN
FROM:
Philippines 811.0 781.4 743.5 795.6 869.6 944.5 910.6 879.0 1 019.3 1 159.1 1 035.5
Ecuador 210.8 170.6 157.0 145.6 122.7 91.1 101.3 52.1 46.2 61.8 46.3
China 45.7 30.9 25.1 33.5 18.2 15.1 15.9 18.9 9.0 0.7 0.6
Indonesia 2.4 0.2 - - - - - - - - -
Others 8.8 7.3 10.6 12.0 15.4 16.2 15.8 20.7 18.2 31.0 27.2
TOTAL 1 078.7 990.6 936.3 986.6 1 026.0 1 066.9 1 043.6 970.6 1 092.7 1 252.6 1 109.6
NEW ZEALAND
FROM:
Ecuador 60.0 62.4 56.2 30.8 29.1 35.4 32.6 30.8 27.3 25.8 28.77
Philippines 7.2 9.1 11.0 36.0 35.6 41.9 48.1 49.3 52.6 50.0 52.39
Panama 0.3 0.6 - - 1.4 0.1 0.1
Others 0.1 0.1 0.1 0.3 0.1 0.0 0.0 0.4 0.0 0.4 0.0
TOTAL 67.6 72.2 67.3 67.2 66.1 77.5 80.9 80.5 80.0 76.3 81.2
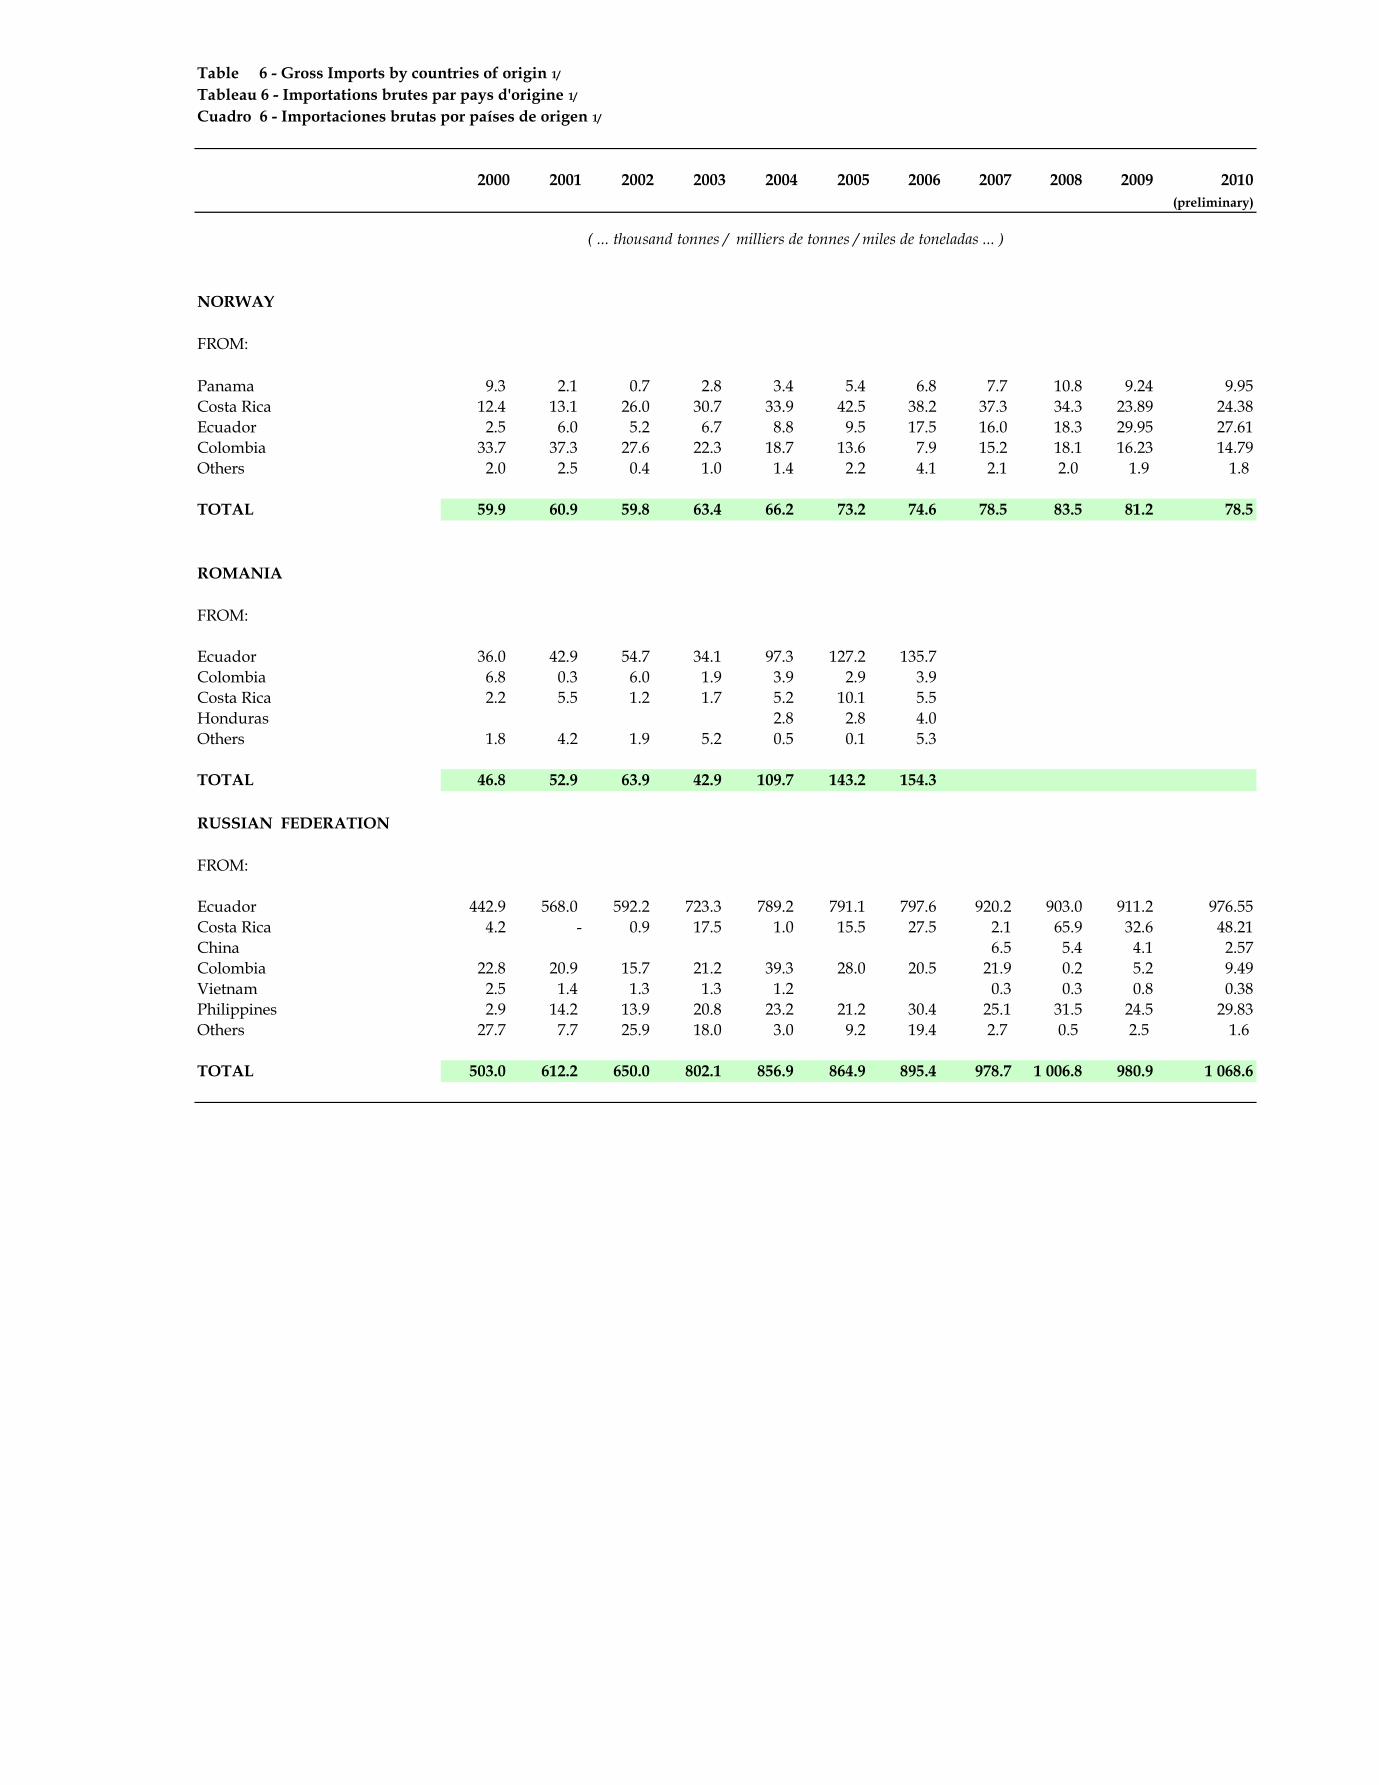
Table 6 - Gross Imports by countries of origin 1/
Tableau 6 - Importations brutes par pays d'origine 1/
Cuadro 6 - Importaciones brutas por países de origen 1/
2000 2001 2002 2003 2004 2005 2006 2007 2008 2009 2010
(preliminary)
( ... thousand tonnes / milliers de tonnes / miles de toneladas ... )
NORWAY
FROM:
Panama 9.3 2.1 0.7 2.8 3.4 5.4 6.8 7.7 10.8 9.24 9.95
Costa Rica 12.4 13.1 26.0 30.7 33.9 42.5 38.2 37.3 34.3 23.89 24.38
Ecuador 2.5 6.0 5.2 6.7 8.8 9.5 17.5 16.0 18.3 29.95 27.61
Colombia 33.7 37.3 27.6 22.3 18.7 13.6 7.9 15.2 18.1 16.23 14.79
Others 2.0 2.5 0.4 1.0 1.4 2.2 4.1 2.1 2.0 1.9 1.8
TOTAL 59.9 60.9 59.8 63.4 66.2 73.2 74.6 78.5 83.5 81.2 78.5
ROMANIA
FROM:
Ecuador 36.0 42.9 54.7 34.1 97.3 127.2 135.7
Colombia 6.8 0.3 6.0 1.9 3.9 2.9 3.9
Costa Rica 2.2 5.5 1.2 1.7 5.2 10.1 5.5
Honduras 2.8 2.8 4.0
Others 1.8 4.2 1.9 5.2 0.5 0.1 5.3
TOTAL 46.8 52.9 63.9 42.9 109.7 143.2 154.3
RUSSIAN FEDERATION
FROM:
Ecuador 442.9 568.0 592.2 723.3 789.2 791.1 797.6 920.2 903.0 911.2 976.55
Costa Rica 4.2 - 0.9 17.5 1.0 15.5 27.5 2.1 65.9 32.6 48.21
China 6.5 5.4 4.1 2.57
Colombia 22.8 20.9 15.7 21.2 39.3 28.0 20.5 21.9 0.2 5.2 9.49
Vietnam 2.5 1.4 1.3 1.3 1.2 0.3 0.3 0.8 0.38
Philippines 2.9 14.2 13.9 20.8 23.2 21.2 30.4 25.1 31.5 24.5 29.83
Others 27.7 7.7 25.9 18.0 3.0 9.2 19.4 2.7 0.5 2.5 1.6
TOTAL 503.0 612.2 650.0 802.1 856.9 864.9 895.4 978.7 1 006.8 980.9 1 068.6

Table 6 - Gross Imports by countries of origin 1/
Tableau 6 - Importations brutes par pays d'origine 1/
Cuadro 6 - Importaciones brutas por países de origen 1/
2000 2001 2002 2003 2004 2005 2006 2007 2008 2009 2010
(preliminary)
( ... thousand tonnes / milliers de tonnes / miles de toneladas ... )
SWITZERLAND
FROM:
Costa Rica 27.4 32.7 38.3 36.7 29.4 27.8 24.0 26.4 18.4 17.2
Panama 10.8 10.0 7.0 4.0 4.0 6.5 9.8 12.5 20.4 15.5
Colombia 23.4 15.7 13.1 12.6 17.5 13.3 12.9 8.7 9.6 13.1
Ecuador 2.9 5.1 5.5 7.4 13.6 18.0 20.7 23.9 25.0 25.0
Honduras ... 1.5 0.1 0.6 0.6 0.1 . . . - - . . .
Others 7.8 8.4 10.4 10.9 8.4 8.5 6.7 6.8 8.7 10.0
TOTAL 72.3 73.4 74.3 72.2 73.5 74.2 74.1 78.2 82.1 80.8
SLOVAKIA
FROM:
Ecuador 15.6 21.4 5.8 6.3 1.5
Costa Rica 6.9 4.9 13.5 19.5 7.7
Colombia 12.1 8.4 16.3 16.1 6.0
Panama 5.4 14.2 11.9 8.9 3.5
Others 7.3 2.2 1.2 2.5 31.2
TOTAL 47.3 51.1 48.7 53.3 49.9
TUNISIA
FROM:
Cameroon 0.5 1.1 0.5 - 0.2 - - 0.1 0.5 -
Côte D'Ivoire 0.1 - - - 0.7 2.1 3.8 5.1 . . . 0.1
Colombia - 2.5 2.4 - 3.0 1.1 0.2 4.6 1.1 -
Costa Rica 3.5 - - - 1.0 0.6 - - 0.1 1.8
Ecuador 10.0 7.1 13.3 13.8 49.1 16.9 16.1 28.9 31.3 34.9
Others 1.4 0.4 0.0 0.0 0.3 0.2 0.1 2.3 0.5 0.4
15.5 11.0 16.3 13.8 54.3 20.8 20.3 41.0 33.5 37.1

Table 6 - Gross Imports by countries of origin 1/
Tableau 6 - Importations brutes par pays d'origine 1/
Cuadro 6 - Importaciones brutas por países de origen 1/
2000 2001 2002 2003 2004 2005 2006 2007 2008 2009 2010
(preliminary)
( ... thousand tonnes / milliers de tonnes / miles de toneladas ... )
UNITED STATES
FROM:
Costa Rica 1 361.4 1 082.1 901.5 976.1 865.3 822.7 927.4 1 036.9 874.4 562.9 853.6
Ecuador 976.0 946.6 1 021.8 972.5 918.9 904.3 994.3 929.2 830.3 957.6 981.8
Honduras 275.6 381.5 449.2 432.1 507.9 453.0 422.9 482.7 505.6 388.7 435.7
Guatemala 688.4 832.1 925.2 934.1 1 020.8 1 029.3 912.9 1 093.4 1 188.7 1112.2 1151.8
Colombia 602.8 473.8 506.4 469.3 464.6 513.7 473.8 377.2 450.8 421.6 461.1
Mexico 85.1 63.8 42.3 35.2 33.6 33.8 38.6 31.5 66.3 105.2 145.6
Panama 28.7 16.2 0.3 0.2 0.6 2.0 7.5 0.5 8.0 5.4 29.0
Nicaragua 1.9 28.2 29.7 41.6 41.5 38.1 30.5 32.8 31.1 24.9 36.0
Peru 0.3 5.7 23.2 13.8 12.4 22.3 25.1 17.8 22.5 19.7 20.1
Venezuela 3.9 3.3 3.7 1.9 2.0 0.7 0.3 - - - -
Dominican Rep. 6.4 7.4 3.6 2.1 5.2 4.4 6.2 1.7 0.1 1.0 0.1
Others 0.0 0.0 0.1 0.2 0.0 0.0 0.0 0.0 0.0 0.0 0.0
TOTAL 4 030.6 3 840.6 3 907.0 3 879.2 3 872.8 3 824.4 3 839.5 4 003.8 3 977.9 3599.2 4114.9
URUGUAY
FROM:
Brazil 18.6 31.6 40.8 40.2 43.0 45.7 42.4 38.4 38.2 32.1
Ecuador 14.4 17.2 2.8 0.1 0.3 1.6 1.9 3.5 4.8 4.2
Others 0.0 0.1 0.2 0.7 0.4 0.0 0.4 0.1 0.0 5.3
TOTAL 33.0 48.9 43.8 41.1 43.7 47.3 44.6 42.0 43.0 41.6
1/ Figures may differ from those shown in Table 3 (a), which exclude re-exports.
1/ Les chiffres dans ce tableau peuvent differer des chiffres du Tableau 3 (a) qui ne comprennent pas les réexportations.
1/ Las cifras pueden diferir de las del Cuadro 3 (a), las cuales excluyen las reexportaciones.

Table 7 - Import prices in selected countries, monthly
Tableau 7 - Prix à l'importation mensuels dans certains pays
Cuadro 7 - Precios mensuales de importación en algunos países
FRANCE
1999 2000 2001 2002 2003 2004 2005 2006 2007 2008 2009 2010 2011
( Euro / tonnes )
January 755 564 572 547 620 474 623 630 620 - 658 524 794
February 749 662 636 723 628 500 753 770 700 780 720 623 923
March 854 576 865 733 698 640 798 690 700 843 962 720 755
April 649 616 795 608 600 603 810 640 698 820 878 680
May 508 596 652 546 528 568 860 608 633 593 715 686
June 473 335 580 478 476 615 888 585 594 588 668 755
July 381 386 565 340 360 485 498 380 565 605 528 624
August 543 434 550 488 298 480 664 510 608 658 490 610
September 509 457 615 537 460 430 753 510 338 650 563 590
October 418 433 530 407 383 383 673 490 - 583 538 505
November 348 363 410 320 410 553 723 590 - 568 527 550
December 479 534 460 580 490 660 716 620 - 610 545 700
YEAR 555 496 603 525 496 533 730 585 606 663 649 631 824
US $ / ton 592 457 539 494 560 661 907 734 829 972 902 835 1 113
JAPAN
1999 2000 2001 2002 2003 2004 2005 2006 2007 2008 2009 2010 2011
( Yen / tonnes )
January 45 000 43 000 44 700 54 800 54700 52700 54900 46400 57700 55300 68100 55300
February 57 000 50 000 49 100 66 000 60000 56600 56600 58200 64200 58400 69900 60900
March 66 000 58 000 50 700 71 600 62700 65900 64600 58200 66400 63800 72600 67800
April 60 000 61 000 54 000 83 200 66800 76400 66800 62900 79300 79100 82100 76800
May 62 000 57 000 60 500 84 400 72800 70200 61600 64600 78700 82600 88300 75600
June 67 000 51 000 54 400 80 100 68800 70900 65700 63600 73100 80800 88100 72700
July 76 000 47 000 53 800 78 700 66400 64300 61900 63600 65000 83500 85500 69900
August 69 000 47 000 56 500 64 000 68300 52800 60400 61200 64100 84300 81200 68200
September 61 000 61 000 60 600 65 900 69200 56500 60900 64600 72000 90900 74300 68200
October 59 000 53 000 53 500 63 700 58200 55100 57000 65100 65700 85600 64200
November 53 000 46 000 48 700 54 400 51600 55600 49500 60600 59000 80400 58100
December 43 000 45 000 48 900 50 800 49100 56100 47900 55300 56500 67100 52100
YEAR 59 833 51 583 52 950 68 133 62 383 61 092 58 983 60 358 66 808 75 983 73 708 68 378
US $ / ton 495 479 436 543 538 565 535 519 567 735 788 779

Table 7 - Import prices in selected countries, monthly (cont.)
Tableau 7 - Prix à l'importation mensuels dans certains pays (cont.)
Cuadro 7 - Precios mensuales de importación en algunos países (cont.)
UNITED STATES
1999 2000 2001 2002 2003 2004 2005 2006 2007 2008 2009 2010 2011
( US$ / tonnes )
January 471 482 535 427 561 427 589 686 639 689 820 785 892
February 514 579 687 517 462 496 891 854 655 792 944 720 1002
March 450 482 541 572 486 513 792 825 648 1027 909 838
April 463 477 551 544 384 529 593 730 648 967 890 825
May 448 415 637 626 296 556 618 926 689 923 830 799
June 422 392 610 648 308 604 486 655 779 868 854 962
July 412 307 698 537 296 61 401 560 734 722 827 985
August 412 334 683 420 286 548 405 542 697 799 834 899
September 396 422 572 486 312 539 594 544 665 803 818 880
October 299 382 484 544 328 496 630 549 659 807 810 916
November 395 368 496 396 408 492 589 598 651 903 834 908
December 305 448 506 625 370 496 646 658 648 830 796 900
YEAR 416 424 583 529 375 480 603 677 676 844 847 868 947
HUNGARY
1999 2000 2001 2002 2003 2004 2005 2006 2007 2008 2009 2010 2011
(Forint / tonnes )
January 41 000 40 000 74 000 115 000 105 000 62 000 181 000 181 000 186 000 191 000 156000
February 49 000 39 000 76 000 119 000 109 000 171 000 189 000 189 000 210 000 225 000 170000
March 47 000 39 000 83 000 122 000 105 000 179 000 185 000 178 000 226 000 272 000 192000
April 45 000 40 000 105 000 137 000 112 000 164 000 190 000 174 000 200 000 244 000 178000
May 42 000 39 000 112 000 104 000 176 000 180 000 176 000 160 000 160 000 207 000 198000
June 41 000 37 000 108 000 108 000 157 000 184 000 177 000 151 000 149 000 210 000 216000
July 39 000 47 000 76 000 105 000 137 000 136 000 129 000 138 000 142 000 189 000 172000
August 40 000 45 000 81 000 90 000 104 000 140 000 148 000 151 000 161 000 182 000 158000
September 39 000 46 000 104 000 76 000 123 000 152 000 147 000 178 000 165 000 166 000 158000
October 37 000 47 000 93 000 98 000 159 000 149 000 145 000 159 000 160 000 154 000 153000
November 37 000 61 000 86 000 88 000 242 000 164 000 175 000 160 000 164 000 158 000 168000
December 38 000 76 000 92 000 96 000 245 000 163 000 167 000 174 000 181 000 155 000 194000
YEAR 41 250 46 333 90 833 104 833 147 833 153 667 167 417 166 083 175 333 196 083 176 083
US $ / ton 146 162 352 467 729 770 796 904 1 019 969 847
Table 7 - Import prices in selected countries, monthly (cont.)

Tableau 7 - Prix à l'importation mensuels dans certains pays (cont.)
Cuadro 7 - Precios mensuales de importación en algunos países (cont.)
NEW ZEALAND
1999 2000 2001 2002 2003 2004 2005 2006 2007 2008 2009 2010 2011
( New Zealand Dollar / tonnes )
January 540 821 938 958 796 507 598 611 758 842 869 824.5
February 594 846 931 1 141 715 517 542 557 709 918 844
March 588 785 880 879 706 574 571 644 793 949 868
April 590 818 902 867 720 629 570 603 800 965 874
May 604 834 951 853 739 555 553 643 812 1 045 857
June 503 816 827 695 773 543 497 772 740 1 037 864
July 577 869 780 747 667 534 489 733 743 1 103 802
August 572 622 867 790 558 534 479 742 683 1 094 736
September 524 579 912 712 608 551 619 755 768 1 047 774
October 582 715 892 850 639 577 720 782 840 931 861
November 653 735 938 865 561 574 718 753 830 923 818
December 902 868 1 010 788 549 562 709 742 888 929 895
YEAR 602 776 902 845 669 555 589 695 780 982 838 825
US $ / ton 276 326 419 492 444 391 382 511 548 614 604 630
POLAND
1999 2000 2001 2002 2003 2004 2005 2006 2007 2008 2009 2010 2011
( Zlotis / tonnes )
January 1 820 1 610 1 710 1 890 1 660 1 800 2 220 2 380 2 200 2420 1970 3000
February 1 870 1 470 1 900 1 730 1 790 19 300 2 540 2 490 2 470 2850 2110 2850
March 1 560 2 020 2 230 2 080 2 390 24 900 2 350 2 490 2 960 3680 2530
April 1 750 2 050 2230 2 040 2 140 24 800 2 700 2 490 2 520 2900 2600
May 1 470 1 420 1 600 1 750 2 070 21 000 2 490 2 300 1 880 2720 2740
June 1 330 1 680 1 620 1 760 1 920 27 200 2 590 2 180 1 940 2890 2730
July 1 170 1 580 1 530 1 760 1 650 15 700 1 590 1 940 1 700 2310 2400
August 1 230 1 540 2 070 1 260 1 200 19 500 1 850 2 040 1 980 2140 2350
September 1 650 1 830 1 870 1 340 1 460 18 600 1 830 2 390 2 030 2250 2390
October 1 400 1 620 1 540 1 220 1 360 2 050 2 070 2 310 1 940 2180 2030
November 1 400 1 490 1 420 1 330 1 690 2 390 2 320 2 660 2 030 3050 2320
December 1 730 1 660 2 030 1 370 1 910 2 190 2 390 2 270 2 240 2500 3020
YEAR 1 532 1 664 1 813 1 628 1 770 14 953 2 245 2 328 2 158 2 658 2 433 2 925
US $ / ton 352 406 444 466 445 547 4 818 811 966 691 881 840

Table 7 - ( cont.)
Tableau 7 - ( cont. )
Cuadro 7 - ( cont. )
Source : United States: official data. Japan: Monthly Bulletin of Banana Statistics. Japan Banana Importers' Association. France: Marchés Européens
des Fruits et Légumes, Revue d' Information Economique.
Source: Etat -Unis: données officielles. Japon: Bulletin mensuel de statistiques bananières. Japan Importers' Association. France: Marchés
européens des fruits et légumes, revue d'information économique.
Fuentes: Estado -Unidos: datos oficiales. Japón: Boletin mensual de estadisticas sobre el banano. Japan Banana Importers' Association.
Francia: Marchés européens des fruits et légumes, revue d'information économique.
1/ Martinique, f.o.r. french ports. Martinique, franco wagon, ports français. Martinica, f.o.r. en los puertos franceses.
2/ Philippines: c.i.f. value, excluding cost of cartons. Philippines, valeur c.a.f., non compris le coût des cartons. Filipinas: valor c.I.f. sin incluir el costo de
las cajas de cartón.
3/ Green, first class, tropical pack, 40 lb box; from Central and South America, f.o.r. importer to wholesaler, New York.
Verte, première categorie, emballage tropical, caisse de 40 lb; en provenance d'Amerique centrale et du Sud, franco wagon, de l'importateur au grossiste,
New York.
Verde, primera clase, embalaje tropical, caja de 40 libras; de América Central y América del Sud, f.o.r. del importador al mayorista, Nueva York.

Table 8 - Wholesalers' selling prices in selected countries, monthly
Tableau 8 - Prix de vente en gros mensuels dans certains pays
Cuadro 8 - Precios mensuales de venta al por mayor en algunos países
JAPAN
1999 2000 2001 2002 2003 2004 2005 2006 2007 2008 2009 2010 2011
( Yen /kgs )
January 90 104 81 117 107 106 103 96 120 129 160 126
February 144 115 98 135 133 109 115 122 142 145 157 144
March 162 124 101 146 130 139 132 120 157 155 151 146
April 135 128 123 155 133 149 123 117 167 159 162 142
May 145 122 128 154 144 140 119 126 163 154 165 140
June 145 103 103 153 131 138 122 122 145 153 160 142
July 135 92 112 148 128 119 115 115 135 152 149 141
August 107 87 106 116 125 101 112 115 134 150 140 135
September 131 116 113 130 126 108 115 128 138 158 137 129
October 131 94 101 128 117 113 107 134 132 178 130 120
November 121 62 102 102 98 113 98 123 128 164 122
December 97 86 97 95 98 109 80 111 125 151 116
YEAR 129 103 105 132 123 120 112 119 141 154 146 137
US $ / kg 1.13 0.95 0.87 1.05 1.06 1.11 1.01 1.02 1.20 1.49 1.56 1.56
UNITED STATES
1999 2000 2001 2002 2003 2004 2005 2006 2007 2008 2009 2010 2011
( US$ /kgs )
January 0.61 0.67 0.62 0.64 0.64 0.60 0.59 0.69 0.80 0.75 1.18 0.92 1.01
February 0.70 0.84 0.72 0.60 0.64 0.64 0.64 1.01 0.80 0.99 1.12 0.99 1.12
March 0.61 0.76 0.77 0.66 0.70 0.55 0.82 1.02 0.79 1.36 1.10 1.01
April 0.59 0.70 0.74 0.67 0.67 0.58 0.69 0.90 0.74 1.33 1.09 1.01
May 0.59 0.66 0.85 0.68 0.62 0.59 0.73 1.04 0.82 1.28 1.05 0.99
June 0.56 0.63 0.70 0.72 0.59 0.66 0.74 0.88 0.84 1.06 1.04 1.06
July 0.54 0.56 0.83 0.65 0.61 0.56 0.58 0.65 0.78 0.96 1.01 1.18
August 0.53 0.54 0.81 0.61 0.58 0.48 0.49 0.61 0.74 0.93 1.01 0.99
September 0.51 0.53 0.80 0.61 0.57 0.47 0.61 0.67 0.82 0.94 0.99 0.88
October 0.50 0.54 0.67 0.56 0.56 0.48 0.66 0.69 0.79 0.96 0.94 0.99
November 0.55 0.51 0.58 0.54 0.55 0.46 0.61 0.65 0.72 0.93 0.91 0.94
December 0.58 0.56 0.63 0.61 0.57 0.55 0.73 0.72 0.69 0.93 0.90 0.96
YEAR 0.57 0.63 0.73 0.63 0.61 0.55 0.66 0.79 0.78 1.04 1.03 0.99 1.07

Table 8 - Wholesalers' selling prices in selected countries, monthly (cont.)
Tableau 8 - Prix de vente en gros mensuels dans certains pays (cont.)
Cuadro 8 - Precios mensuales de venta al por mayor en algunos países (cont.)
FRANCE
1999 2000 2001 2002 2003 2004 2005 2006 2007 2008 2009 2010 2011
(Euro / kg )
January 1.01 0.74 0.84 0.79 0.93 0.81 1.00 0.98 0.90 0.90 0.85 0.81
February 0.99 0.93 0.93 0.95 0.97 0.82 1.12 1.07 0.97 1.05 0.94 0.85
March 1.08 0.87 1.15 1.07 1.03 0.97 1.20 1.03 0.99 1.13 1.22 0.95
April 0.96 0.87 1.15 1.03 0.94 0.93 1.14 0.94 0.97 1.04 1.10 0.96
May 0.79 0.81 0.99 0.90 0.79 0.93 1.12 0.91 0.90 0.81 0.96 0.95
June 0.73 0.61 0.86 0.78 0.80 0.94 1.26 0.94 0.86 0.81 0.91 0.99
July 0.61 0.57 0.92 0.69 0.63 0.82 0.89 0.71 0.78 0.81 0.80 0.88
August 0.76 0.61 0.81 0.73 0.59 0.74 0.98 0.68 0.81 0.85 0.75 0.82
September 0.72 0.69 0.86 0.80 0.78 0.77 1.06 0.73 0.94 0.84 0.79 0.83
October 0.64 0.67 0.81 0.68 0.76 0.75 0.97 0.74 0.82 0.79 0.81
November 0.67 0.61 0.75 0.62 0.74 0.85 0.97 0.86 0.75 0.77 0.76
December 0.72 0.79 0.74 0.82 0.76 1.05 1.02 0.90 0.85 0.81 0.83
YEAR 0.81 0.73 0.90 0.82 0.81 0.86 1.06 0.87 0.88 0.88 0.89 0.89
US $ / kg 0.86 0.67 0.81 0.77 0.91 1.07 1.32 1.09 1.18 1.21 1.24 1.18
POLAND
1999 2000 2001 2002 2003 2004 2005 2006 2007 2008 2009 2010 2011
(Zlotis / kg )
January 2.51 2.45 2.65 2.40 3.75 3.74 3.65 3.55 3.71 3.40 4.11
February 2.32 2.48 2.59 2.49 3.58 3.88 3.64 4.70 4.44 3.39 4.77
March 2.69 2.90 2.74 3.08 4.06 3.85 3.74 4.39 5.72 3.94 4.52
April 2.79 3.16 2.84 3.20 4.19 3.93 3.77 4.26 5.72 3.46
May 2.27 3.06 2.78 3.40 4.62 3.85 3.73 3.30 4.37 4.02
June 2.32 2.61 2.51 3.55 4.83 3.70 3.49 3.19 4.59 4.32
July 2.41 2.30 2.53 3.39 3.75 3.08 3.21 2.88 4.15 4.02
August 2.35 2.50 2.29 2.69 3.76 2.94 3.31 3.12 3.79 3.67
September 2.56 2.78 1.96 2.72 4.09 2.80 3.49 3.09 3.65 3.62
October 2.55 2.43 2.07 2.64 4.12 2.97 3.53 3.12 3.62 3.28
November 2.28 2.25 2.04 3.08 4.04 3.21 3.35 3.21 3.51 3.49
December 2.31 2.51 2.34 3.38 3.87 3.60 3.37 3.35 3.60 3.84
YEAR 2.45 2.62 2.45 3.00 4.06 3.46 3.52 3.51 4.24 3.70 4.47
US $ / ton 0.60 0.64 0.67 0.67 0.93 1.31 1.25 1.46 1.13 1.41 1.28

Table 8 - Wholesalers' selling prices in selected countries, monthly (cont.)
Tableau 8 - Prix de vente en gros mensuels dans certains pays (cont.)
Cuadro 8 - Precios mensuales de venta al por mayor en algunos países (cont.)
BANANA ORGANIC
USA
2008 2009 2010 2 011
( US $ / kg )
January 1.12 1.38 1.31 1.27
February 1.12 1.38 1.27 1.40
March 1.54 1.38 1.28
April 1.60 1.38 1.27
May 1.47 1.38 1.35
June 1.52 1.38 1.38
July 1.37 1.38 1.34
August 1.36 1.34 1.38
September 1.38 1.25 1.12
October 1.38 1.29 1.38
November 1.38 1.34 1.33
December 1.34 1.31 1.27
YEAR 1.38 1.35 1.31 1.34

Table 8 - ( cont.)
Tableau 8 - ( cont. )
Cuadro 8 - ( cont. )
Source: United States: USDA, C. & M.S., Fruit and Vegetablr Division, Market News, daily reports.
Germany: Marktbeicht, Obst-Gemüse-Südfrüchte, Bundesausgabe A. ZMP - Bonn. Japan: Monthy Bulletin of Banana Statistics.
Japan Banana Importers, Association.
Source: Etats-Unis : USDA, C. & M.S., Fruit and Vegetablr Division, Market News, daily reports.
Allemagne: Marktbeicht, Obst-Gemüse-Südfrüchte, Bundesausgabe A. ZMP - Bonn. Japon: Bulletin Mensuel de statistiques
bananières. Japan Banana Importers, Association.
Fuentes: Estados Unidos: USDA, C. & M.S., Fruit and Vegetablr Division, Market News, daily reports.
Alemania: Marktbeicht, Obst-Gemüse-Südfrüchte, Bundesausgabe A. ZMP - Bonn. Japón: Boletin Mensual de Estadisticas bananeras
Japan Banana Importers, Association.
1/ Ripe banana average prices at whosale markets located in major cities and middle cities.
Prix moyens des bananes mûres sur les marchés de gros situés dans des villes de grande et moyenne importance.
Precios medios del banano maduro en los mercados al por mayor de las principales ciudades y otras ciudades menos importantes.
2/ New York
3/ Onkel Tuca, Del Monte

Table 9 - Retail prices in selected countries, monthly
Tableau 9 - Prix mensuels au detail dans certains pays
Cuadro 9 - Precios mensuales al por menor en algunos países
FRANCE
1999 2000 2001 2002 2003 2004 2005 2006 2007 2008 2009 2010 2011
(Euro / kg )
January 1.60 1.43 1.50 1.51 1.62 1.50 1.63 1.73 1.60 1.65 1.60 1.56 1.70
February 1.66 1.57 1.57 1.64 1.67 1.52 1.78 1.76 1.63 1.72 1.64 1.56 1.85
March 1.71 1.58 1.69 1.81 1.71 1.56 1.82 1.77 1.66 1.79 1.75 1.64
April 1.73 1.59 1.85 1.82 1.74 1.62 1.85 1.72 1.68 1.88 1.90 1.69
May 1.55 1.56 1.80 1.77 1.62 1.58 1.93 1.69 1.68 1.76 1.79 1.67
June 1.53 1.43 1.71 1.71 1.62 1.61 2.03 1.69 1.65 1.69 1.74 1.73
July 1.35 1.41 1.74 1.48 1.51 1.58 1.87 1.63 1.63 1.69 1.68 1.73
August 1.45 1.45 1.62 1.45 1.44 1.47 1.65 1.54 1.57 1.68 1.58 1.66
September 1.41 1.36 1.61 1.55 1.43 1.38 1.72 1.52 1.63 1.65 1.55 1.62
October 1.38 1.34 1.58 1.44 1.43 1.43 1.69 1.47 1.66 1.63 1.57 1.59
November 1.31 1.33 1.51 1.39 1.40 1.40 1.68 1.54 1.60 1.58 1.54 1.57
December 1.33 1.41 1.45 1.41 1.47 1.61 1.74 1.57 1.63 1.58 1.53 1.63
YEAR 1.50 1.46 1.64 1.58 1.56 1.52 1.78 1.64 1.64 1.69 1.66 1.64 1.78
US $ / kg 1.60 1.34 1.46 1.49 1.76 1.89 2.22 2.05 2.24 2.48 2.30 2.17 2.40
HUNGARY
1999 2000 2001 2002 2003 2004 2005 2006 2007 2008 2009 2010 2011
(Forint / kg )
January 221 251 263 293 251 309 345 329 338 348 323 374
February 234 239 263 283 249 313 339 334 348 364 323 421
March 225 246 280 283 261 340 339 326 392 421 338
April 221 284 312 286 276 343 345 338 410 468 357
May 221 247 302 270 289 347 345 336 361 431 349
June 209 221 288 264 310 376 356 319 332 406 371
July 189 257 247 248 303 343 340 314 311 389 377
August 181 239 248 249 281 317 327 316 313 351 362
September 206 252 272 252 258 324 328 329 319 340 361
October 207 244 253 250 258 325 302 338 318 331 326
November 203 229 233 234 254 345 316 326 303 320 330
December 234 245 252 232 294 339 320 320 307 309 350
YEAR 213 246 268 262 274 335 334 327 338 373 347 398
US $ / ton 0.75 0.86 1.04 1.17 1.35 1.68 1.59 1.78 1.96 1.84 1.67 1.96

Table 9 - Retail prices in selected countries, monthly (cont.)
Tableau 9 - Prix mensuels au detail dans certains pays (cont.)
Cuadro 9 - Precios mensuales al por menor en algunos países (cont.)
UNITED STATES
1999 2000 2001 2002 2003 2004 2005 2006 2007 2008 2009 2010 2011
( US $ / kg )
January 1.04 1.08 1.08 1.12 1.16 1.13 1.07 1.08 1.11 1.15 1.39 1.29 1.31
February 1.08 1.12 1.16 1.11 1.12 1.11 1.11 1.12 1.12 1.19 1.41 1.29 1.38
March 1.05 1.12 1.14 1.14 1.13 1.10 1.12 1.12 1.12 1.32 1.40 1.27
April 1.13 1.06 1.12 1.11 1.13 1.11 1.11 1.12 1.14 1.38 1.39 1.28
May 1.12 1.08 1.12 1.14 1.11 1.08 1.10 1.13 1.11 1.39 1.37 1.26
June 1.12 1.11 1.12 1.13 1.15 1.10 1.09 1.13 1.13 1.40 1.39 1.27
July 1.17 1.09 1.13 1.14 1.13 1.12 1.09 1.12 1.12 1.38 1.36 1.29
August 1.08 1.08 1.08 1.10 1.13 1.12 1.07 1.08 1.12 1.40 1.35 1.27
September 1.05 1.06 1.08 1.10 1.09 1.08 1.07 1.06 1.11 1.39 1.33 1.26
October 1.04 1.04 1.09 1.11 1.08 1.07 1.08 1.08 1.12 1.38 1.32 1.28
November 1.06 1.06 1.06 1.11 1.10 1.03 1.06 1.08 1.14 1.38 1.24 1.28
December 1.09 1.09 1.07 1.11 1.11 1.04 1.06 1.10 1.16 1.36 1.26 1.29
YEAR 1.08 1.08 1.10 1.12 1.12 1.09 1.09 1.10 1.13 1.34 1.35 1.28 1.35
JAPAN
1999 2000 2001 2002 2003 2004 2005 2006 2007 2008 2009 2010 2011
( Yen / kg )
January 218 225 235 232 243 222 236 217 224 235 243
February 224 239 241 249 239 230 236 226 235 235 249
March 237 260 243 248 242 240 238 229 238 245 246
April 237 257 241 257 238 251 244 226 255 245 250
May 262 262 242 260 245 250 240 226 252 248 247
June 282 258 229 262 250 253 240 231 248 243 233
July 278 254 229 262 252 246 229 232 240 244 233
August 308 246 219 261 241 229 232 232 241 237 234
September 295 257 229 257 240 230 232 231 239 248 229
October 279 259 230 259 239 235 227 228 238 285 223
November 255 260 223 245 231 231 222 221 236 266 221
December 233 241 220 237 220 230 219 221 233 243 216
YEAR 259 252 232 252 240 237 233 227 240 248 235
US $ / kg 1.98 2.21 2.17 2.01 2.07 2.19 2.11 1.95 2.05 2.40 2.52

Table 9 - Retail prices in selected countries, monthly (cont.)
Tableau 9 - Prix mensuels au detail dans certains pays (cont.)
Cuadro 9 - Precios mensuales al por menor en algunos países (cont.)
NEW ZEALAND
1999 2000 2001 2002 2003 2004 2005 2006 2007 2008 2009 2010 2011
(New Zealand Dollar / kg )
January 2.01 2.35 2.40 2.46 2.31 2.12 1.94 2.36 2.38 2.64 2.88 2.82
February 2.02 2.38 2.58 2.50 2.35 2.15 1.79 2.48 2.36 2.74 2.86 2.85
March 1.96 2.38 2.57 2.34 2.29 2.06 1.81 2.37 2.39 2.81 2.87
April 1.92 2.27 2.53 2.14 2.25 2.07 1.82 2.34 2.44 2.97 2.79
May 1.93 2.32 2.46 2.16 2.12 1.95 1.59 2.36 2.43 2.89 2.63
June 2.00 2.24 2.51 2.21 1.75 2.00 1.77 2.29 2.37 2.92 2.60
July 2.02 2.24 2.53 2.26 1.77 1.84 1.59 2.29 2.35 2.78 2.77
August 2.08 2.29 2.58 2.35 2.15 1.88 1.83 2.29 2.43 2.79 2.79
September 2.23 2.31 2.53 2.28 1.98 1.86 2.32 2.40 2.43 2.86 2.81
October 2.28 2.35 2.47 2.24 1.69 1.82 2.48 2.37 2.58 2.80 2.86
November 2.30 2.28 2.48 2.30 1.90 1.85 2.48 2.41 2.73 2.72 2.75
December 2.28 2.34 2.39 2.24 1.94 1.89 2.40 2.38 2.71 2.83 2.80
YEAR 2.09 2.31 2.50 2.29 2.04 1.96 1.99 2.36 2.47 2.81 2.78 2.84
US $ / ton 0.96 0.97 1.16 1.33 1.35 1.38 1.29 1.74 1.73 1.76 2.01 2.16
POLAND
1999 2000 2001 2002 2003 2004 2005 2006 2007 2008 2009 2010 2011
(Zlotis / kg )
January 5.00 4.58 4.55 4.60 4.58
February 5.09 4.68 4.90 5.21 4.61
March 5.01 4.68 5.27 6.72 4.88
April 5.05 5.47 5.47 7.09 5.01
May 5.01 4.76 4.76 5.85 4.95
June 4.89 4.29 4.29 5.75 5.28
July 4.33 4.07 4.07 5.44 5.21
August 3.98 4.00 4.00 4.93 4.94
September 3.96 4.04 4.04 4.82 4.83
October 3.89 4.08 4.08 4.73 4.49
November 4.25 4.12 4.12 4.66 4.52
December 4.41 4.28 4.28 4.62 4.85
YEAR 4.57 4.42 4.49 5.37 4.85
US $ / ton 1.47 1.65 1.83 1.44 1.78