banca ubae s.p.a....6 statement by the supervisory board (art. 73, para. 4 of the consolidated...
TRANSCRIPT

1
BANCA UBAE S.p.A.
Profit Results as at 31 December 2010
Thirty-Eighth Financial Year
Report on Assets, Liabilities and

2
Share Capital: Euro 151,060,800.00 (full paid-up)
Reserves (as at 30th April 2010): Euro 42,406,660.00
(*) Libyan Foreign Bank, Tripoli
UniCredit SpA, Rome 10.79%
Eni Adfin SpA (ENI Group), Rome 5.39%
Banque Centrale Populaire, Casablanca 4.66%
Banque Marocaine du Commerce Extérieur, Casablanca 4.34%
Sansedoni Siena SpA (Fondazione Monte dei Paschi di Siena), Siena 3.67%
Intesa Sanpaolo SpA, Turin 1.80%
Telecom Italia SpA, Milan 1.80%
ROME MILAN
Address: Via Quintino Sella, 2 – Piazza A. Diaz, 7 –
00187 Rome, Italy 20123 Milan, Italy
P.O. Box: 290 --
Telephone: +39 06 423771 +39 02 7252191
Cable: UBAE ROMA UBAE MILANO
Fax: +39 06 4204641 +39 06 42045415
Swift: UBAI IT RR UBAI IT RR MIL
Website: www.bancaubae.it
Dealing room telephone: +39 06 42046301-4
Reuters: UBAE
TRIPOLI (Libya)
Representative Office
Omar Mukhtar Street – Omar Mukhtar Investment Complex
Telephone: +218 21 4446598 / 4447639
Fax: +218 21 3340352
67.55%
(*) Libyan Foreign Bank acquired the 17.62% stake held by National Société Générale Bank,
Cairo in October 2010
3
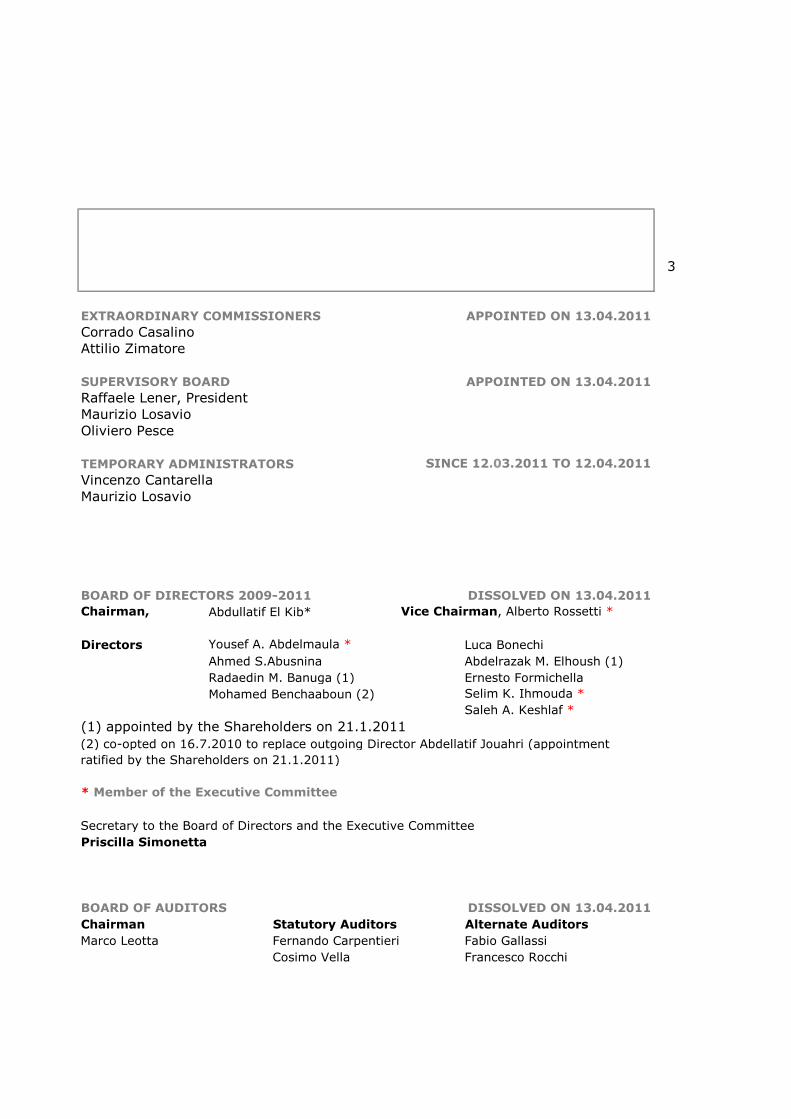
EXTRAORDINARY COMMISSIONERS APPOINTED ON 13.04.2011
Corrado CasalinoAttilio Zimatore
SUPERVISORY BOARD APPOINTED ON 13.04.2011
Raffaele Lener, PresidentMaurizio LosavioOliviero Pesce
TEMPORARY ADMINISTRATORS SINCE 12.03.2011 TO 12.04.2011
Vincenzo CantarellaMaurizio Losavio
BOARD OF DIRECTORS 2009-2011 DISSOLVED ON 13.04.2011
Chairman, Abdullatif El Kib* Vice Chairman, Alberto Rossetti *
Directors Yousef A. Abdelmaula * Luca Bonechi
Ahmed S.Abusnina Abdelrazak M. Elhoush (1)
Radaedin M. Banuga (1) Ernesto Formichella
Mohamed Benchaaboun (2) Selim K. Ihmouda *
Saleh A. Keshlaf *
(1) appointed by the Shareholders on 21.1.2011
* Member of the Executive Committee
Secretary to the Board of Directors and the Executive Committee
Priscilla Simonetta
BOARD OF AUDITORS DISSOLVED ON 13.04.2011
Chairman Statutory Auditors Alternate Auditors
Marco Leotta Fernando Carpentieri Fabio Gallassi
Cosimo Vella Francesco Rocchi
(2) co-opted on 16.7.2010 to replace outgoing Director Abdellatif Jouahri (appointment
ratified by the Shareholders on 21.1.2011)

4
MANAGEMENT
General Manager, Biagio Matranga
Deputy General Manager, Jamal R. Elbenghazi
Assistant General Manager, Administration, Marcello Fontana
Assistant General Manager, Operational, Adel Aboushwesha
Manager of the Bank’s Representative Office in Tripoli, Mahmud A. Elesawi

5
Extraordinary Commissioners’ Report
(art. 73, para. 4 of the Consolidated Banking Law)
Acting on a recommendation from Banca d’Italia, the Minister of Economy and Financedecreed on 8 April 2011 that the Board of Directors, the Executive Committee and theBoard of Auditors of Banca UBAE SpA should be dissolved and the institution placed in"extraordinary administration".
The decree followed an earlier resolution - adopted by Banca d’Italia on urgent groundson 12 March 2011 - whereby the Bank was placed in "temporary administration" in thewake of international measures freezing assets traceable to the Libyan regime, includingthose belonging to Libyan Foreign Bank, which holds 67.55% of UBAE’s share equity.
On 13 April 2011, Banca d’Italia appointed the bodies responsible for the governance ofBanca UBAE SpA in amministrazione straordinaria, i.e., two ExtraordinaryCommissioners, Messrs. Corrado Casalino and Attilio Zimatore, and a three-memberSupervisory Board comprising Messrs. Raffaele Lener, Maurizio Losavio and OlivieroPesce. Mr. Lener was later designated to chair the Supervisory Board.
Thus composed, both bodies were formally installed on 18 April 2011.
The Extraordinary Commissioners replaced the administrators whom Banca d’Italia hadappointed to conduct the Bank’s affairs on a temporary basis pursuant to art. 76 of theCBL.
Upon taking office we, the Extraordinary Commissioners, demanded to see an abstract ofthe Bank’s accounts. Shortly afterwards, the General Manager presented us with a draftcopy of the 2010 financial statements that had been all but completed by the competentdepartments and had gone through extensive internal checks. The draft had alreadybeen submitted to the independent auditors charged with certifying Banca UBAE’saccounts in previous periods, and had come back free of any comments liable to castdoubt on the accuracy and fairness of its contents.
The Board of Directors and Board of Auditors of Banca UBAE SpA having been dissolvedby government decree (pursuant to art. 70 of the CBL) as mentioned, the draft financialstatements cannot of course be finalized and then submitted to a shareholders’ meetingfor approval.
That said we believe - on the basis of the information available to us - that the currentdraft constitutes a fair and accurate representation of the Bank’s assets, liabilities,revenues and expenses, providing a detailed account of all banking activities pursuedover the course of 2010 and of Banca UBAE’s profit results.
In order to offer third parties the best possible perspective on Banca UBAE’sbalancesheet and performance data we have resolved, pursuant to and for the purposesof art. 73 of the CBL, to file this report with the Registrar of Companies on theunderstanding that the figures contained in the draft 2010 financial statements carry ourendorsement.
Rome, 20 June 2011
THE EXTRAORDINARY COMMISSIONERSCorrado CasalinoAttilio Zimatore

6
Statement by the Supervisory Board
(art. 73, para. 4 of the Consolidated Banking Law)
Comprising Messrs. Raffaele Lener, Maurizio Losavio and Oliviero Pesce, the SupervisoryBoard of Banca UBAE SpA in amministrazione straordinaria took office on 18 April 2011. Onthe same day, the body appointed Mr. Lener to act as chairman.
The procedure known as "extraordinary administration" replaced an earlier arrangement,temporary administration, which Banca d’Italia had imposed on 12 March 2011 after theinternational community had frozen the assets of entities with ties to the Libyan regime, oneof which was Banca UBAE’s controlling shareholder Libyan Foreign Bank.
The Supervisory Board had the opportunity to examine a rundown of UBAE’s accounts as ithad been produced for the Extraordinary Commissioners (Messrs. Corrado Casalino andAttilio Zimatore) in conformity with the provisions of art. 73, para. 1 of the ConsolidatedBanking Law.
A draft version of the 2010 financial statements, which the General Manager had thensubmitted to the Extraordinary Commissioners, was also viewed by the Supervisory Boardand was subsequently discussed with the Commissioners.
Most recently, the Supervisory Board read the report issued by independent auditors BDOSpA, whom the Bank had charged with certifying its accounts in previous years (cf. articles14 and 16 of Legislative Decree 39/2010).
Delivered on 6 June 2011, the report cannot be taken as a formal audit of UBAE’s draftfinancial statements for the year to 31 December 2010, yet contains no indication that suchstatements are deficient or inaccurate in any substantive way. Indeed BDO insisted that what(limited) mistakes they did find remained below the individual and aggregate thresholds formaterial accounting errors as defined for official audit purposes.
In this light and taken account, inter alia, of the favourable comments that were made by theCommissioners within the bounds of their own competence, the Supervisory Board hasresolved, pursuant to and for the purposes of art. 73, para. 4 of the CBL, to release thisstatement and hereby confirms its impression that the draft accounts provide a fair andaccurate description of Banca UBAE’s assets, liabilities, financial position and profit results forthe period.
Rome, 22 June 2011
THE SUPERVISORY BOARDRaffaele Lener (Chairman)Maurizio LosavioOliviero Pesce

7
DRAFT FINANCIAL STATEMENTS
THIRTY-EIGHTH FINANCIAL YEAR

8
ANNUAL REPORT
FINANCIAL YEAR 2010

9
SUMMARY OF BUSINESS ACTIVITIES
FINANCIAL YEAR 2010

10
EUR/mn
5,161 8,031 4,423 5,678 5,585 7,496
451 3,685 367 3,841 455 5,226
2,315 3,430 2,033 2,558 2,329 2,948
3,811 3,389 2,907 2,750 3,429 3,091
1,888 2,936 1,422 2,617 2,247 2,906
7,904 2,872 6,041 2,598 8,597 3,008
11,838 2,705 10,156 2,451 17,390 2,639
3,090 2,675 2,009 2,451 4,231 3,314
2,973 2,513 2,025 2,176 3,037 2,607
4,673 2,061 1,969 2,023 3,921 2,170
529 1,430 422 1,374 609 1,689
1,134 1,168 421 717 818 1,030
248 1,076 218 1,002 249 1,161
28 1,038 19 767 35 774
1,500 940 315 1,216 44 1,534
89 760 37 719 122 1,067
108 734 76 628 151 738
489 568 423 605 495 543
3,047 446 2,535 579 3,936 209
62 421 43 404 57 426
77 307 42 321 16 414
536 252 447 176 433 167
361 159 320 137 305 162
7 156 8 165 20 258
112 142 36 166 77 222
8 124 5 116 28 122
0 22 0 39 0 17
109 20 132 26 117 30
52,548 44,060 38,851 38,300 58,733 45,968
2,377 2,064 4,974 2,148 5,069 1,8644.52 4.68 12.80 5.61 8.63 4.05
12) SYRIA13) MALTA
8) SAUDI ARABIA9) SOUTH KOREA10) IRAN11) MOROCCO
EXPORTS
BREAKDOWN OF ITALIAN IMPORTS/EXPORTS AND
UBAE’S SHARE OF YEARLY TOTALS
2009 2008
EXPORTS IMPORTS EXPORTS IMPORTS
2010
20) JORDAN
IMPORTSCOUNTRIES
1) TURKEY2) UAE3) TUNISIA4) INDIA5) EGYPT6) ALGERIA7) LIBYA
21) OMAN
24) SUDAN
18) PAKISTAN19) IRAQ
14) LEBANON15) QATAR16) CYPRUS17) KUWAIT
25) BAHRAIN26) YEMEN
22) BANGLADESH23) SRI LANKA
UBAE'S SHARE%
27) CHAD28) MAURITANIA
TOTAL

11
BANKING OPERATIONS
Loans and Advances to Customers
SUMMARY OF OPERATIONS
FINANCIAL YEAR 2010
The focus of activity at Banca UBAE is the provision of financial assistance tocorporate clients engaged in import/export business or contract works in targetcountries (with retail credit playing only a marginal role). In line with the Bank’sbusiness strategy, operations in this department remained on significant levelsthroughout 2010; what little variability emerged over the course of the year wasmostly a reflection of adjustments in individual customers’ demands
Financing and Securities Trend
0
200
400
600
800
1.000
1.200
Jan-08 Mar-08 May-08 Jul-08 Sep-08 Nov-08 Jan-09 Mar-09 May-09 Jul-09 Sep-09 Nov-09 Jan-10 Mar-10 May-10 Jul-10 Sep-10 Nov-10
MN
Financings to Customers Financings to Banks Securities
Given their riskiness, their low yield and above all their extraneousness to theBank's core business, the extension of short-term loans to corporate clients forpurposes other than trade finance is kept to a minimum and is restricted toparties who do business with the Bank on a regular basis.
Credit risk is generally modest.
Commercial Operations on Foreign Markets
In 2010 as in previous years, most of the Bank's efforts were directed atdeveloping trade-linked business in its core markets. As it turned out, BancaUBAE coped brilliantly with a series of challenges on different markets at a timewhen the banking sector was still going through an extremely serious crisis. Insuch a climate of acute uncertainty, targeted marketing campaigns enabled it toface down competition from rival institutions and preserve its market share in anumber of countries.

EUR/000
Value / no. +/- % Value / no. +/- % Value / no. +/- %
4,731 -15.06 5,570 19.17 4,674 2.28
2,064,160 -3.94 2,148,905 15.79 1,855,883 36.78
2,377,180 -52.21 4,974,327 -36.92 7,885,640 n/a
5.78 6.91 5.11
5.35 15.19 9.94
Commissions accrued 15,572 -9.31 17,171 -3.01 17,703 42.87
EUR/000
Value +/- % Value +/- % Value +/- %
339,156 -32.07 499,281 254.18 140,968 -47.5
466,250 -6.11 496,598 63.22 304,259 -0.92
4,379 5.19 4,163 37.80 3,021 51.2
12
2 0 0 82 0 1 0
% of total exports
2 0 0 9
Letters of credit: Number
Non Oil Letters of Credit: Value
Oil Letters of credit: Value
2 0 1 0 2 0 0 9 2 0 0 8
Commissions received
% of total imports
Guarantees issued in year
Guarantees: Outstanding at EoY
While falling short of the levels attained before the financial crisis that erupted inlate 2008, the Bank managed sustained and in many instances increasedturnover as trade between Italy and the countries in its traditional region ofinterest picked up. Growth in business with several Asian countries constitutesanother positive note. By contrast, the freeze on new initiatives in some areaswhere UBAE boasts a long-standing presence led to a decline in the number andvalue of letters of credit opened during the year.
Activity on the Libyan market witnessed further growth, in both direct dealingsand indirect business (banking assistance to domestic exporters for the mostpart), which outstripped the growth rate in overall bilateral trade.
In the oil sector, shifts in some customers’ business strategy resulted in asmaller volume of imports being assisted by L/Cs. Even so, and despite thedecline in oil sales that was caused by the global downturn, the Bank processed asubstantial amount of oil business in 2010, with profit margins to match.
Turnover in guarantees diminished somewhat in 2010, though the rise incommitments outstanding at year-end attests to increased stability in this areaas well as Banca UBAE’s successful drive to steer business opportunitiestowards Italian firms. Even as the volume of guarantees issued fell from thelevel recorded in 2009, however, commission revenue marked (modest)growth, reflecting market prices for the higher -risk commitments which theBank gave during the year.

Financial Market Operations
Value +/- % Value +/- % Value +/- % Value +/- %
2,711,802 31.37 3,119,288 15.026 3,178,523 1.90 2,809,578 -11.6
A monthly breakdown is provided in the following chart:
13
First quarter Second quarter Third quarter Fourth quarter
F U N D I N G 2 0 1 0
EUR/000
Throughout 2010, Banca UBAE endeavoured to find the most profitable waysto employ funding from institutional counterparties as well as cash flowgenerated by oil sales.
The former grew strongly in the early months of the year. In spite of multipleproblems linked to the financial turmoil experienced by some states andenduring doubts about the credibility of the entire financial system, the Bankwas consistently appreciated as a safe depository for surplus liquidity bymajor credit institutions in its region of interest, including a number of centralbanks. Funding remained quite substantial in the second half, with minimalfluctuations in the third quarter and only a modest dip in the fourth.
Business from companies operating in the oil sector was satisfactory ascustomary in terms of both cash flow management and the Bank’s ability toattract deposits.
Total funding (i.e., liabilities to banks and customers plus funds at customers’disposal), is quantified in the table below, which shows the average for eachquarter and the relevant variation.
0
500
1.000
1.500
2.000
2.500
3.000
3.500
4.000
4.500
Jan-
09
Feb-
09
Mar-
09
Apr-
09
May-
09
Jun-
09
Jul-
09
Aug-
09
Sep-
09
Oct-
09
Nov-
09
Dec-
09
Jan-
10
Feb-
10
Mar-
10
Apr-
10
May-
10
Jun-
10
Jul-
10
Aug-
10
Sep-
10
Oct-
10
Nov-
10
Dec-
10
EUR/000
Banche Clientela Oil CustomersBanks Customers

Managing Financial Assets
14
Portfolio activity increased in 2010. Trading was sustained, the basic criterionbeing not so much the renewal of issues as they came to maturity as an ongoingsearch for yields in line with or higher than those afforded by other types ofearning assets. The financial climate in general and the recurrent crises certaincountries had gone through prompted the Bank to screen its counterparties andassess margins carefully, yet also encouraged trading activity, which sought toseize profitable market opportunities wherever they could be found. The volumeof securities held to maturity (HTM) was stabilized, while the trading (HFT)portfolio nearly doubled in size from the previous year.
Financial assets at year-end consisted mostly of bonds, whose average residuallife was 2.0 years for the HFT portfolio and 2.8 years for the HTM portfolio. Theuse of derivatives to mitigate interest rate risk resulted in average durations of 3months for the HFT and 1 month for the HTM portfolio.
It has been the Bank’s policy to avoid equity markets other than where bothcurrent and prospective risks could be monitored closely, and to limit thepurchase of adjustable-rate bond issues so as to contain the risk associated withinterest rate fluctuations.
After a strong recovery of previous losses in 2009 and despite problems seen inthe market, results show that the Bank has managed to produce a satisfactoryprofit level while maintaining a limited risk profile for the HFT portfolio by hedgingagainst exchange rate and interest rate risk and simultaneously by considerablyincreasing the volume of securities dealt in and managed. It should be noted thatgiven the results achieved the Board of Directors had resolved to forgo the optionit had approved in 2008 of moving issues from the HFT to the HTM portfolio.
Additional software refinements enabled the Bank to keep its securities positionunder even more stringent control, in harmony with a strong emphasis on theclose monitoring of portfolio performance as well as risks.
Dealings in securities and certificates of deposit on behalf of third parties in 2010showed a similar trend to that seen in the previous year and turnover was aroundEUR 57 mn. This activity level was mainly influenced by customers' preference towait for financial markets to stabilize.
Below are the agreed guidelines for purchase of securities.
Investment portfolio (issues held to maturity/available for sale):
- adjustable rate issues with a substantial spread, resulting in yields higherthan the interbank rate;
- fixed or adjustable rate issues from entities resident in the Bank'sgeographical areas of interest;
- fixed rate, short-term issues.
HFT portfolio (issues held for trading):
- fixed or adjustable rate issues chosen based on expectations of a yield ofshort-term capital gains;
- shares in top-tier domestic and international companies.
On the whole the securities portfolio was not negatively affected by theeconomic trend and events associated with turbulence in financial markets,thanks to which the Bank managed to achieve a satisfactory result. Given thefinancial market situation and indications from customers, the Bank decided todefer use of new formulas and novel instruments (such as harmonized financialproducts and OICRs) for proprietary trading purposes.

15
Furthermore, to ensure optimal support for non-proprietary trading the Bankfurther revised the architecture of its finance departments and IT resourcesunderpinning all business, operational and risk management activity in thisarea.
Interbank Transactions
Problems in financial markets worldwide, including in the US and Asia, plusdifficulties that emerged on interbank markets, certainly had an impact ondollar and euro interest rates. The Bank made a successful shift in treasurymanagement strategy as a result of which interbank activity increased duringthe early months of the year and then remained at a high level.
Short-term treasury transactions and short and medium-term loans to foreignbanks continued to be quite substantial. Total funds administered for moneymarket purposes in the major currencies were consistently above the EUR 3 bnmark, mostly the result of short-term funding from overseas correspondentsand liquidity from clients operating in the maritime sector.
To support current and prospective medium and long-term investment levelsthe Bank has taken steps to consolidate its sources of funds - marketuncertainties permitting - by obtaining extensions for the term of depositsmade by certain counterparties. For the medium-term the Bank is evaluatingtargeted borrowing to supplement the subordinated loan which began to bedrawn at the end of 2008.
Year-End Results
Despite a conservative policy adopted by the Board of Directors whenestablishing provisions, the net result for 2010 (EUR 8,400,896) shows afurther improvement over 2009 and 2008, confirming the Bank’s ability tostabilize earnings through growth in both commercial and non-commercialoperations.
At EUR 30,715,596 (-9.9% on 2009) the gross operating result reflects adecline in interest margins (-8.0%) compared to the previous year, mainly dueto the depletion in revenues from the administration of "oil" deposits, partiallyoffset by taking advantage of various market opportunities as well as optimalhandling of administered (non-oil) funds. Net non-interest income rose slightly(+0.9%), which reflects the positive result seen in the securities sector, with avery satisfactory and almost stable earnings from fees and commissions.
The decrease in gross operating profit was caused by an increase inadministrative costs, mainly due to lower expense recoveries from customers(+14.0%) and higher personnel costs (+4.4%), which, however, include certainextraordinary items.
Net write-downs and provisions were essentially stable (-1,5%), the result ofthe aggregate impact of higher amortization of intangibles for the newsoftware and larger loan write-downs offset by lower provisions for contingentliabilities. In the wake of problems afflicting the international credit sector,different lump-sum provisions were made for exposure to the banking sector,based on the country and counterparty concerned.
Income tax for the year amounted to EUR 6,194,333, down 35.9% from 2009

ORGANIZATION AND PERSONNEL
16
Personnel
Reorganization of the workforce continued during the year in line with the Bank'smarket objectives for the coming years, which involved both a recruitment policygeared to strengthening core processes and ensuring a healthy generationalturnover. This led to the hiring of 4 people (1 senior executive, 3 executive cadres)while 9 people (1 senior executive, 4 executive cadres and 4 other staff members)left the Bank's service, for a total staff of 159 at year-end.
Several initiatives, as indicated below, were implemented to optimize thedevelopment and management of UBAE’s human resources.
Maintaining and updating the performance management system in order tobetter understand/assess professional performance.
Consolidation of a career enhancement policy supported by actions to promoteinternal mobility and professional career paths - this means the promotionsystem (in economic/career terms) has been enhanced by elements linked tothe Bank's human resources.
Consolidation of a reward system based on performance and results.
Consolidation of an integrated on-the-job training system that builds on thesteps first taken by the Bank in 2008, when it began to design and implementcompetence-enhancement opportunities supported by industry-wide funds forworkers in the credit and insurance sectors, as well as an ad hoc path conceivedto give new recruits a sense of the Bank’s working processes. Those activitiespursued two complementary (and mutually reinforcing) objectives:
promote motivation, responsibility, self-improvement and other valuesinstrumental to successful role fulfilment;
provide the knowledge and skills needed for a fruitful bank-client relationshipin the context of the Bank’s core processes (L/Cs, credit, accounts andbudgeting) and in the light of recent regulatory developments (MiFID, Basel2), so as ultimately to create value for both sides.
In addition to mandatory training intended to keep staff abreast of shifting rulesin such areas as personal data, safety and security in the workplace and moneylaundering prevention, during 2010 new training programmes were introducedcovering specialist and managerial aspects (leadership, HR management anddevelopment ) and productivity enhancement (managing time, teamwork, etc.).
Furthermore, other training initiatives were launched during the year aimedmainly at providing support for specific technical/professional skills required inthe various roles.

17
Internal Organization
In 2010 Internal Organization activity focused mainly on TEMENOS projectdevelopment for the Bank's new software package, in addition to correctivemaintenance and development of the existing SEC Servizi system. Certain projectsinvolved all internal departments, both as regards planned activities, their laterintroduction and final implementation. Salient accomplishments include activitiesindicated below.
- Pillar 2: UBAE continued to follow the Basel 2, Pillar 2 project and wasspecifically involved in defining and establishing parameters for the ERMASsystem for preparation of periodic stress test reporting within the frameworkof Pillar 3. In concert with other departments, the task of analysis got underway to establish operating liquidity as prescribed by Banca d'Italia instructionsissued in November 2010, especially the analysis of imbalances highlightedby departments. Furthermore, the analysis phase was also launched to allowspecific and explicit indication of the fund transfer rate in ICAAP reporting asrequested by the Board of Directors.
- An analysis was made and approval given for a new Forex operatingprocedure based on software created and released by BNP-Paribas. TheContinuous Linked Settlement (CLS) system will be used to carry out andregulate Forex transactions in the CLS bank circuit (run by BNP-Paribas) inwhich risk of delivery is almost zero.
- Preparations and application tests were completed for software and regulatoryupdates concerning implementation of Sepa and PSD directives and newSWIFT standards (Rulebook 4 came into force on 1 November 2010).
- Testing was completed and approval given for release of the application foroperational management, accounting and reporting of syndicated bankingtransactions as regards contingent transactions, while the analysis phase forcash transactions was completed and the relevant functional specificationsreleased.
- Contract terms with Thomson-Reuters were reviewed in concert with SystemsDepartment and Treasury Division in order to update the technologicalstructure for receiving and management of market data and Reuter News. Theproject also covered optimization of Xtra3000 (EIKON product) managementand infrastructure costs required to feed operations desks and the MasterFinance integrated treasury platform with market data and news.
- Parameters were established for the CAD procedure (Securities) concerningthe correct operating approach for securities as regards customers, in relationto trading for own account, order receipt and transmission.
- Testing was completed and replacement began of the Creationonline platformwith DB-Direct for direct transmission of security orders to the counterparty,so overcoming the need to send SWIFT messages.
- As regards the Fastcheck product (OFAC, PEP, etc. lists), testing wascompleted and the database set-up phase for the online check function wentlive. This automatically checks counterparties as part of the fight againstmoney laundering and terrorism, in line with domestic and internationalregulations. Parameters were also established for the abnormal eventsprocedure covering signalling of suspicious parties and blocking of thetransactions concerned.

18
- TEMENOS project: summer 2010 saw the completion of the pre -trainingphase and workshops, during which model bank procedures were analysedand differences with the Bank's current operations highlighted. Analysis ofthe TEMENOS platform system tables was completed and the necessarystudies got under way. Later, a basic version was installed for systemoperational testing and staff training courses began and will continuethroughout 2011. The forecast is that final parameters will be establishedand the definitive version in the UBAE environment created in June 2011.
- Additional databases were defined and loaded into the DBMS and Sadassystems, followed by internal courses covering optimal utilization of theavailable data.
- Business continuity testing for Treasury areas and payments was carried outand, in concert with the Systems and Legal Departments, contracts weresigned with a banking counterparty for business continuity testing in theevent of a scenario in which the Bank is "completely out of action". A reviewof business continuity manuals also began while in December a newapplication was analysed covering the semi-automatic management ofbusiness continuity.
Marketing
Marketing activity focused on four broad areas in 2010.
1) Strategic marketing activities in support of General Management :
- analysis of UBAE business trends over the past ten years;
- analysis of the Italian export market with a view to the possibleopening of new branch offices;
- country presentations covering opportunities offered by newcountries;
- study to define a customer service platform;
- brainstorming with Financial Institutions and Corporate Divisions.
2) Business development activities in support of business divisions :
- organization of the fourth edition of the Trade Banking Semin ar, heldat Head Office and this year aimed at five major Algerian banks;
- sponsorship of the volume "Banca e Finanza Islamica (Islamic Bankingand Finance)" by Prof. Claudio Porzio, published by Bancaria Editrice,with a contribution from Banca UBAE;
- organization in collaboration with ABI and Bancaria Editrice of theround table "Islamic Finance: business, regulatory and fiscal aspectsfor a rapid integration within Italy". Attendees were given acomplimentary copy of the volume "Banca e Finanza Islamica";
- sponsorship of the annual Tripoli Exhibition;
- contribution to the publication "Guida agli Investimenti in Libia (Guidefor Investments in Libya)" prepared by Italy's Associazione AvvocatiAssociati;
- monitoring and analysis of costs for promotional activi ties and returnsfor these by individual country.

19
3) Institutional marketing activities in support of General Management:
- management of relations with associations of which the Bank is amember;
- support provided to General Management for preparation ofpresentations made during banking conferences covering issuesrelated to the Bank's business and countries in which it operates;
- management of external communication and preparation of thecommunication plan. Coordination of the press office with issue ofpress releases, articles and interviews by UBAE management indailies, specialist publications and on television, including Corrieredella Sera, Il Sole 24 Ore, Il Giornale, Milano Finanza,Italia Oggi,Bloomberg;
- monitoring and regular updating of the Bank’s corporate website.
4) Operational aspects:
- creation, management and updating of marketing material: financialstatements, institutional and operational brochures, interim results,articles of association, dealers' calender.
IT Systems
Throughout 2010 the Bank worked to adapt its systems and applications asrequired by new rules and operating procedures introduced during the yearto mitigate operational risks that arise from the use of informationtechnology. In particular:
- technological upgrading continued with replacement of the Rome and Milanstorage devices and communications infrastructure between them, togetherwith new backup technologies - the so-called Virtual Tape Library (VTL) - inorder to improve systems reliability and business continuity. These actionsconsolidated the Bank's highly reliable systems infrastructure platform;
- it ensured that data protection systems were constantly updated both tofilter message flows and to block unauthorized access from outside andminimize risks of infection by malware;
- migration of the Head Office/branch intranet/internet communicationsinfrastructure to an MPLS (private) network, also adopting tools to reinforceprotection of remote connections by VPN or SSL service via web, each usingan OTP key for remote connections with suppliers, technicians and otherparties;
- continuous updating of tools made available to staff for the widespread,customized use of the Bank's considerable database and ensuring that, inaddition to being accessible, all data are extracted from the same datawarehouse;
- IT resources were kept up-to-date and well aligned with ongoing changes intechnology and procedures. Studies were launched concerning the typicalworkstation for technological updating of IT systems in use, in line withrequirements of the new TEMENOS software package, which will have to beintegrated with applications in use with the outsourcer, SEC Servizi;
At the same time, the Bank continued to survey the market for, and evaluate,potential alternatives to its IT set-up in an ongoing drive to improve onexisting performance levels.

20
Risk Management
Over the past few years appropriate tools were acquired and used to detect,analyse and monitor the Bank’s risks.
Alignment with the new, more stringent Basel rules was carefully analysed bythe Risk Management unit and the results obtained by simulations and actualmeasurements were presented in quarterly reports to Senior Management andthe Board of Directors.
For the purposes of Basel 2, Pillar II risk measurement methods in particular,Banca UBAE is a Class 3 credit institution, which means it may adopt simplifiedmethods for quantifiable risks and risk mitigating policies and procedures fornon-quantifiable risks.
From an organizational standpoint, the review process is based on the ICAAPOperating Manual, which not only defines the roles and duties accruing to thevarious units involved in the process but also provides guidance for managingeach type of risk (measurable or otherwise), calculating the internal capitalrequirement (if a risk is quantifiable), and choosing the correct stress testmethodology.
Furthermore, pursuant to the supervisory regulations governing risks thatcannot be quantified and therefore are not susceptible to specific capitalabsorption, the Bank has adopted detailed internal policies for managingliquidity risk and reputational risk, as well as a contingency plan to deal withliquidity risk. Policies are reviewed and updated to cater for changes in theregulatory/operational context within which the Bank operates.
The supervisory review process has helped the Bank pursue several objectives:
raise the governing bodies’ awareness of risk and capital planning-relatedissues;
improve understanding of UBAE’s exposure to the various types of riskassociated with its business operations;
quantify previously unquantified risks (credit concentration risk, interestrate risk in the banking book) and bolster organizational safeguards andrisk management tools for others (liquidity, reputational, strategic risks);
emphasize the need to acquire ever-more efficient and adequate riskmeasuring and risk monitoring tools;
expand the time frame for internal (forward-looking) analyses and stresstesting;
improve the strategic planning process by introducing capitalizationpolicies strictly linked to the Bank’s risk profile, i.e., to the resultsemerging from the ICAAP as it was performed.
The ICAAP report relating to the situation as at 31.12.2010 will be forwarded toBanca d’Italia by 30.4.2011 at the latest.
As far as disclosure to the public is concerned, the Bank will post the qualitativeand quantitative information called for in Pillar III on its website under"Financials" within the same time frame as applies to the publication of itsannual financial statements.
21
Market Risk
Business conducted by the Treasury Division and compliance with theoperational limits set out in the Internal Regulations are monitored constantlyby those charged with first, second and third-order controls, which relyextensively on the Master Finance front-office platform.
Reports are produced daily, may be consulted on the corporate intranet and aretraceable to the desks that generated them. They are concerned with portfoliocomposition, with daily, monthly and yearly performance, and with movementsin risk indicators (potential loss, BPV, duration, VaR, stop loss, etc.).
Conformity with internal operating limits is monitored on a daily basis and anybreaches are reported without delay to allow for prompt remedial action and/orthe start of the relevant approval process in accordance with the Bank’s internalrules.
The Risk Management unit submits a quarterly report to the Risk Committee oncontrols performed, exceptions found and the outcome of its assessments.
The Bank does not intend to apply for recognition of any internal models forcalculating its capital requirement against market risks.
Credit and Counterparty Risk
Principles of sound and prudent risk management underpin the granting,monitoring and review of credit facilities. Safeguards for different phases of thelending process include:
- systematic assignment of a "credit access score" to both bank and corporateborrowers;
- daily monitoring of loan performance and recording of any breach of internallimits (overruns) or external anomalies (CRB data);
- periodic stress testing.
Aside from the observance of approved borrowing limits, which is monitored bya dedicated unit within the Credit Division, exposure to credit risk is tracked bythe Risk Management unit in terms of the deterioration of portfolio quality andthus capital absorption. In particular, Risk Management produces regularreports for the Risk Committee and the Board of Directors on the distribution ofloans across the Bank’s region of interest.
For ICAAP purposes, furthermore, Risk Management monitors creditconcentration risk and carries out scenario analyses by simulating the impact ofcertain information shocks such as sovereign debt defaults or economicdownturns on the capital requirement against credit risk.
As for counterparty risk (which is primarily associated with exposures to sellersof OTC derivatives for the HFT portfolio), Risk Management works with theTreasury Division to monitor positions daily on a mark-to-market basis.

22
Operational Risks
Though it chose the Basic Indicator Approach for determining its capitalrequirement against operational risks under the supervisory authorities’ newrules, Banca UBAE is implementing a dedicated operational risk managementsystem to evaluate and monitor exposure to operational risks and the lossesthese might entail.
At the end of 2010, a self-risk assessment was performed with support from aspecialized consulting firm in order to map the Bank's processes, the type ofoperational risks to which it is exposed and a qualitative evaluation of thevarious adverse events. Self risk assessment files are periodically brought upto date in the light of organizational and operational changes and are thensubmitted to the pertinent process owners for their validation and aqualitative judgement on the frequency and severity of adverse events.Analysis of all self risk assessment files completes the qualitative evaluationphase, while the ensuing reports to Management enable the latter todetermine what organizational and procedural steps are most likely tomitigate the risks concerned.
Other Risks
Liquidity risk
Exposure to this risk is subject to constant monitoring by the TreasuryDepartment, whereas Risk Management is responsible for weekly checks oncompliance with internal operating limits.
In the course of 2010, the management guidelines given in the internal policyand contingency liquidity plan were reviewed based on recent updatesintroduced as regards prudent rules concerning liquidity. Internal operatingsystem limits and stress tests were refined to bring them into line withregulatory provisions. The concept of a risk tolerance threshold wasintroduced and the series of early-warning indicators (systemic and one-off),which define events to be submitted to the Treasury Division and RiskManagement unit, was expanded.
The Bank’s tools in this domain include an online maturity ladder forming partof the Master Finance platform plus an ALM product (ERMAS) that is feddirectly from the accounting ledgers and is used quarterly to generate theBank’s maturity ladder and supply a database for stress testing.
Credit concentration risk
In introducing an additional capital requirement, Pillar II places a specialemphasis on credit concentration risk associated with individual counterpartiesor groups of related counterparties in the corporate loan portfolio. SEC Servizihas equipped Banca UBAE with a tool for quantifying internal capital by thesimplified method foreseen by Banca d’Italia and conducts simulations toevaluate the impact of any changes of a strategic or operational nature.
As far as "single name" concentration risk from bank counterparties isconcerned, as requested by Banca d'Italia in 2009 the Bank has implementeda set of internal operating limits in order to contain its exposure.
Credit concentration risk by business sector and geographical area does notneed to be quantified at the moment, so the Bank has opted for a strictlyqualitative assessment. At the same time, staff members regularly attendindustry-body courses and conferences in a bid to gain new insights foranalysis and methodological approaches.
23
Interest rate risk in the banking book
Using the integrated treasury product, Master Finance, on a monthly basis theRisk Management unit monitors compliance with the internal operating limit,which has been set below the regulatory threshold as a measure of precaution.
For ICAAP purposes the Bank uses an ALM product (ERMAS) fed directly fromthe accounting ledgers, which generates a maturity ladder and exposure tointerest rate risk, both by the simplified method permitted by Banca d’Italia andby the full evaluation method. The same tool is also used for stress testingagainst hypothetical parallel and non-parallel shifts in the interest rate curve.
Reputational and strategic risks
These risks, which complete the Bank’s risk profile, are especially tricky toquantify and are best addressed through qualitative evaluations, risk mitigationpolicies and above all risk avoidance measures.
During the year the Bank adopted an internal policy for managing reputationalrisk that defines the role and duties of each unit potentially concerned, draws amodel of adverse events, sets out mitigation policies aimed at forestalling theoccurrence or limiting the consequences of such events and establishes astrategy for coping with a "reputation crisis".
As regards strategic risk, the Bank is in the process of establishing a procedureto formulate necessary scenarios for preparation of the budget and three-yearplan, and to measure fluctuations in gross operating income, taken as being anapproximation of this risk.
Management Information Reports
The Bank has continued to refine its reporting tools, which supplement theAccounting Department’s monthly statement and information inflows from othersystems. Full use of available IT tools has led to an increase and improvementin daily data concerning positions and income, and has provided faster andmore detailed comprehensive reports both by period and as regards trends foreach area of activity.
Security Blueprint
Pursuant to art. 34 of Legislative Decree 196/2003, the Bank's securityblueprint for 2010 was revised as set out in section 19 of the Decree’s TechnicalGuidelines for Minimum Security Standards.
Logistics
In addition to normal maintenance activities, a number of improvements weremade at the Bank's offices in Rome and Milan to ensure space was optimallyexploited. In particular, improvements were made at Head Office to create anopen-space facility for 12 new workstations providing more appropriate workingconditions for the Overseas Portfolio Department staff transferred to this newarea. A new training room was also created in the area concerned.
Targeted extraordinary maintenance was carried out in the archives to ensureproper upkeep of the premises and the safety of any personnel and third partiespresent there.Certification of technological systems at the Milan office was updated byspecialized technicians and in agreement with the Technical unit responsible forall the branch's ordinary and extraordinary maintenance carried out by localfirms.

24
216 341 -125 -36.66%
210,275 168,104 42,171 25.09%
2,897,838 2,106,310 791,528 37.58%
94,605 85,335 9,270 10.86%
24,982 25,671 -689 -2.68%
2,219 348 1,871 537.64%
28,647 20,819 7,828 37.60%
3,374,299 2,474,799 899,500 36.35%
761,550 123,593 637,957 516.18%
2,380,598 2,119,506 261,092 12.32%
2,595 2,922 -327 -11.19%
23,273 28,158 -4,885 -17.35%
193,914 185,381 8,533 4.60%
8,401 8,085 316 3.91%3,374,299 2,474,799 899,500 36.35%
[1] Inclusive of financial assets HTM and AFS[2] Inclusive of tax assets and other assets[3] Inclusive of staff severance fund and provisions for risks and charges[4] Inclusive of tax liabilities and other liabilities
-Capital and reserves
-Net profit for the year
Total liabilities
Other liabilities [4]
Financial liabilities held for
trading
Shareholders’ equity
LIABILITIES
Earmarked provisions [3]
3,968 7,154
Accounts payable
-to customers
-to banks
ASSETS
Cash and cash equivalents
Loans and advances
Financial assets held for
trading
- to customers
- to banks
RECLASSIFIED BALANCE SHEET
EUR/000
Amount %
Balance as at : Change
31.12.2010 31.12.2009
115,517 67,871
Fixed assets
- financial [1]
- tangible
- intangible
Other assets [2]
Total assets
47,646 70.20%
-3,186 -44.53%

25
25,225 27,424 -2,199 -8.02%
52,368 54,328 -1,960 -3.61%
-15,300 -14,649 -651 4.44%
30,715 34,107 -3,392 -9.95%
-6,194 -9,660 3,466 -35.88%
8,401 8,085 316 3.91%[1] Inclusive of net commissions, dividends and net trading income[2] Inclusive of other administration expenses and other operating income[3] Inclusive of net impairment adjustments and net provisioning for risk and charges
Net profit for the year
Provisioning, write-downs and
write-ups [3]
Net adjustments to tangible
and intangible fixed assets
Income tax for the year
Gross operating result
Net profit from continuing
operations
Pre-tax profit from
continuing operations
Net non-interest
income [1]
Other administration expenses
and operating charges [2]
Personnel expenses
RECLASSIFIED INCOME STATEMENT
31.12.2010 31.12.2009 Amount %
EUR/000
Net interest income
Gross operating income
Balance as at :
-517 51.75%
Change
27,143 26,904 239 0.89%
-1,516 -999
-14,604 -15,363 759 -4.94%
Net result from non-continuing
operations
14,595 17,745 -3,150 -17.75%
-6,353 -5,572 -781 14.02%
8,401 8,085 316 3.91%

26
COMMENTS ON BALANCE SHEET ITEMS
Loans and advances
EUR/000
Amount %
185,028 149,718 35,310 23.58%
25,247 18,386 6,861 37.32%
1,769,781 1,047,588 722,193 68.94%1,128,057 1,058,722 69,335 6.55%
3,108,113 2,274,414 833,699 36.66%
Loans and advances to Customers
Loans and advances to
banks:
Variation
Total
§ In euros
§ In other currencies
§ In euros
COMMENTS ON BALANCE SHEET ITEMS
§ In other currencies
Loans and advances to
customers:
31.12.2010 31.12.2009
Balance as at :
Non-bank loans rose by 25.9%, mainly due to a resumption in corporate lendingas the Bank sought to spread risk in the light, inter alia, of more stringent limitsfor individual borrowers. The loans’ main purpose, regardless of whether they aregranted directly by UBAE or through syndicated facilities arranged by majorlending institutions, is to support domestic clients engaged in trade withcountries in the Bank’s region of interest.
Loans are shown at face value net of individual or collective adjustments.Valuation criteria are reviewed in the Notes to the Financial Statements.
Non-performing items accounted for 0.04% of total loans and advances tocustomers.
The value of outstanding loans was written down by EUR 314,385 representinganticipated loan losses plus the portion of non-performing debt that was judgedrecoverable to a marginal extent at best. Write-backs amounted to EUR 101,537
Loans and advances to Banks
EUR/000
31.12.2010 31.12.2009 Amount %
115,517 67,871 47,646 70.20
-3,968 -7,154 3,186 -44.53
3,504 2,502 1,002 40.05
91,101 82,833 8,268 9.98206,154 146,052 60,102 41.15
27
§ Assets available for sale
§ Assets held to maturity
Total
Variation
§ Assets held for trading
§ Liabilities held for trading
Balance as at :
Financial assets
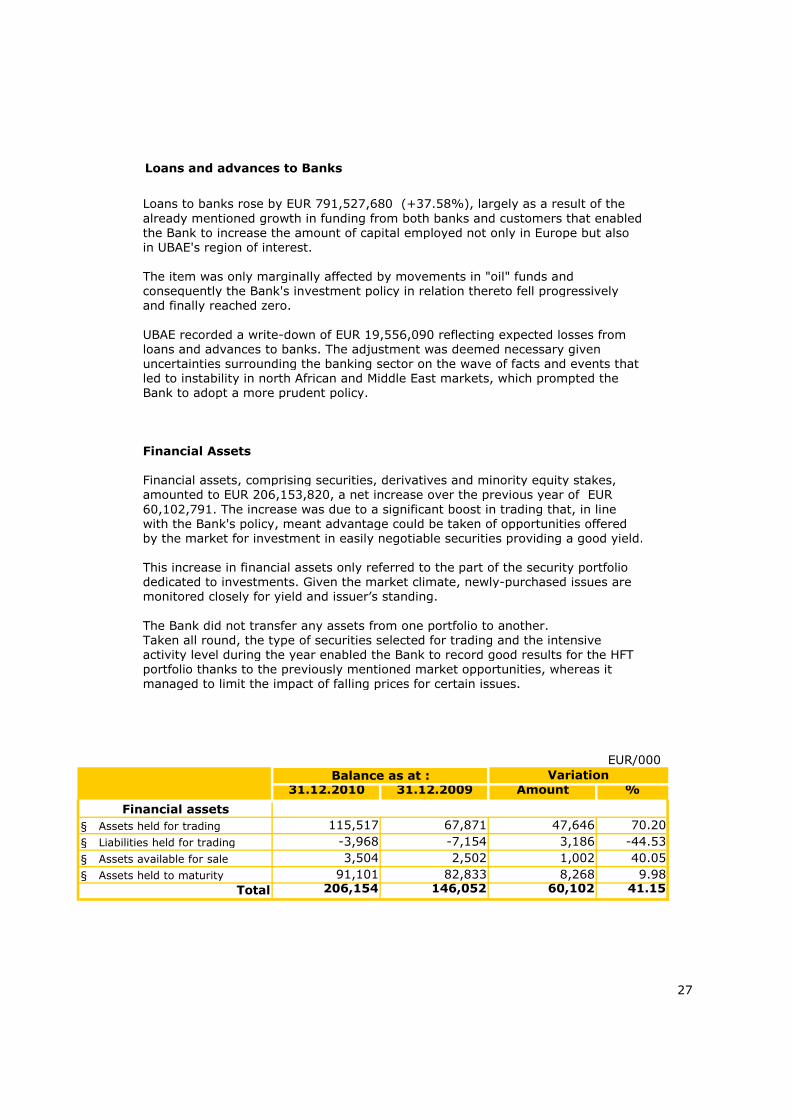
Loans to banks rose by EUR 791,527,680 (+37.58%), largely as a result of thealready mentioned growth in funding from both banks and customers that enabledthe Bank to increase the amount of capital employed not only in Europe but alsoin UBAE's region of interest.
The item was only marginally affected by movements in "oil" funds andconsequently the Bank's investment policy in relation thereto fell progressivelyand finally reached zero.
UBAE recorded a write-down of EUR 19,556,090 reflecting expected losses fromloans and advances to banks. The adjustment was deemed necessary givenuncertainties surrounding the banking sector on the wave of facts and events thatled to instability in north African and Middle East markets, which prompted theBank to adopt a more prudent policy.
Financial Assets
Financial assets, comprising securities, derivatives and minority equity stakes,amounted to EUR 206,153,820, a net increase over the previous year of EUR60,102,791. The increase was due to a significant boost in trading that, in linewith the Bank's policy, meant advantage could be taken of opportunities offeredby the market for investment in easily negotiable securities providing a good yield.
This increase in financial assets only referred to the part of the security portfoliodedicated to investments. Given the market climate, newly-purchased issues aremonitored closely for yield and issuer’s standing.
The Bank did not transfer any assets from one portfolio to another.Taken all round, the type of securities selected for trading and the intensiveactivity level during the year enabled the Bank to record good results for the HFTportfolio thanks to the previously mentioned market opportunities, whereas itmanaged to limit the impact of falling prices for certain issues.

EUR/000
31.12.2010 31.12.2009 Amount %
700,571 102,116 598,455 586.05
60,979 21,476 39,503 183.94
1,292,281 976,137 316,144 32.39
1,088,317 1,143,369 -55,052 -4.813,142,148 2,243,098 899,050 40.08
28
Payable to banks
§ In euros
§ In other currencies
Total
Payable to customers
§ In euros
§ In other currencies
VariationBalance as at :
The criteria followed for valuing securities and for assigning issues to theinvestment or trading portfolio are discussed in the Notes to the FinancialStatements (pp. 54-56).The value of assets held for trading and that of derivatives is aligned with marketprices; other securities were valued at amortized cost.
Accounts Payable
Accounts payable to banks and customers are shown at amortized cost.The table below gives a breakdown of changes in funding from banks andcustomers in euros and other currencies.
As already mentioned, funding from institutional counterparties fell in 2009 butthen showed a partial recovery in 2010 as regards positions in euros, whereasnon-euro funding remained essentially stable. Instead funding from customersincreased considerably - 5 times the amount recorded in 2009 - and was mainlyseen in countries of interest to the Bank.

29
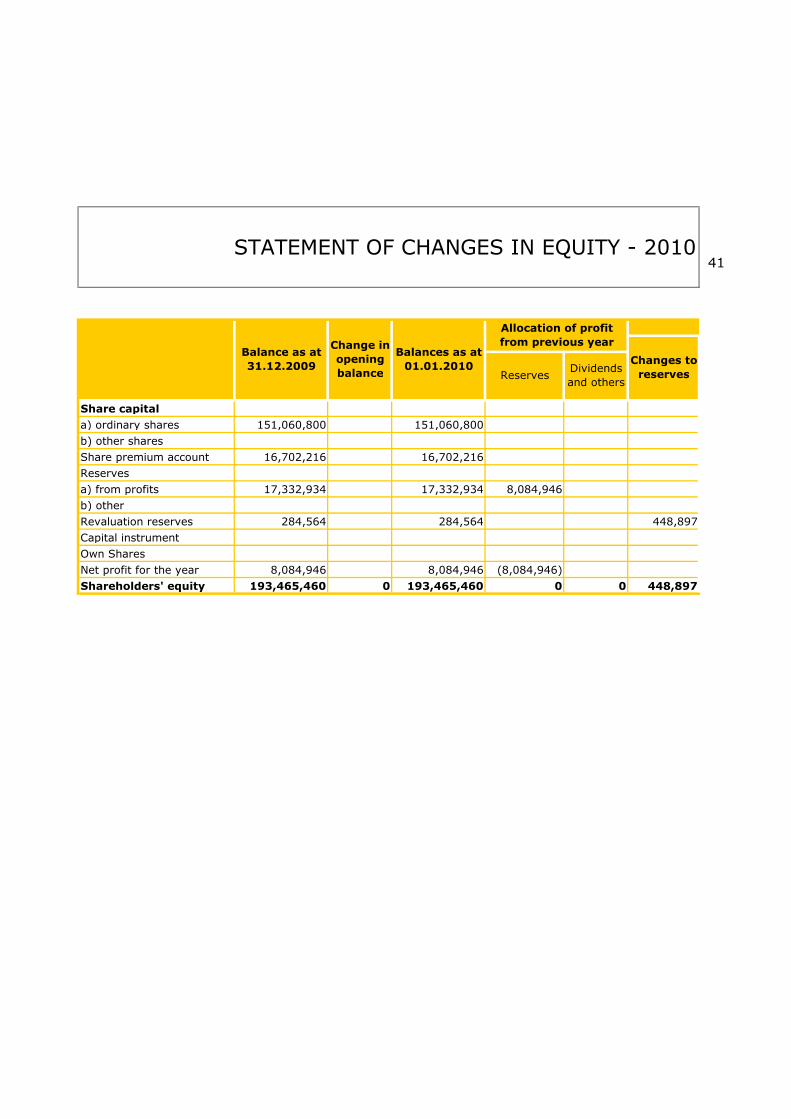
Shareholders' Equity
Movements in shareholders' equity may be represented as follows.
EUR/000
Share
premium
151,060 16,702 17,618 0 8,085 193,465
405 7,680 -8,085 0
0
448 448
8,401 8,401151,060 16,702 18,471 7,680 8,401 202,314
Shares
Subordinated Loan
31.12.2010
ReservesRetained
profit
31.12.2009
Net profit TotalCapital
§ Net profit
2010 Movements:
§ Appropriation of 2009 profit
§ Bonus capital increase
§ Valuation reserve
Following approval of the 2009 Financial Statements an increase was made to the
legal reserve while the remaining profit was carried forward. Certain transfers of
shares took place in 2010: the Moroccan Central Bank was replaced by Morocco's
Banque Centrale Populaire, whereas Egypt's National Société Générale Bank's
shareholding was taken up by Libyan Foreign Bank, which now holds 67.55%.
As of 31 December 2010 share capital amounted to EUR 151,060,800 divided into
1,373,280 common shares of EUR 110 each. Following the exercise of some rights
in the course of 2005, warrants (2001-2011) still in circulation amounted to EUR
97,680,440.
In line with the recapitalization goals set out in the three-year strategic plan, in
2008 the Bank finalized a new ten-year subordinated loan agreement for a total of
EUR 100,000,000, in addition to the residual portion of the existing loan of EUR
70,000,000 that will expire in 2011.
The amount subscribed in the previous year plus the residual portion of the old
loan amounting to EUR 7,800,000 makes for a total of EUR 77,800,000 as at 31
December 2010.

30
COMMENTS ON THE ITEMS IN THE PROFIT AND LOSS ACCOUNT
Net Interest Income
EUR/000
Amount %
22,584 -65.14
-2,199 -8.02
Net Non-Interest Income
The breakdown of non-interest income is as follows:
EUR/000
Amount %
-1,350 -5.15
1,298 -30.06
-52 -0.24
304 6.08
-802 -2.70
20. Interest charges
Net interest income
10. Interest income and
related revenue
2010
-12,084 -34,668
27,424
2009
Variation
30. Dividends and other
proceeds
Low interest rates, particularly for euros and US dollars (with the latter
approaching zero), accounted in part for the low amount of total interest
compared to the previous year.
2010 2009
40. Commissions received
Variation
24,849 26,199
50. Commissions paid -3,020 -4,318
80. Trading assets 5,305 5,001
Net commissions 21,829 21,881
Net non-interest income 28,955 29,757
190. Other operating
proceeds 1,821 2,875
-24,783 -39.91
9 22 -13 -59.09
25,225
37,309 62,092
-1,054 -36.66
Despite the general fall in market rates during the year and therefore a reduction
in negotiation room, the modest decline in net interest income (-8.02% compared
to the prior year) attests to the Bank’s enduring ability to diversify earning assets
so as to secure the highest possible returns, on the one hand, and to preserve a
good spread between assets and liabilities, mainly by focusing on the interbank
market or companies with a high credit standing. By virtue of the sizeable volume
of funds administered over the period, these opportunities made for a most
satisfying result.

31
Net income from commissions confirmed the excellent trend seen inrecent years, with a negligible decrease from 2009 of 0.24%.Further to the adjustment made two years ago, a change wasintroduced during the year as regards administration of oil fundsthat led to a reduction in relevant income.
Letters of credit remained at sustained levels in spite of theinternational crisis and progressive reduction of the quota linked tooil flows. On the other hand, levels for traditional businessremained high as evidenced by both net income and the non-oilletter of credit volume negotiated during 2010. This confirms thatthe Bank is an important player in the general trend for tradebetween countries in its region of interest. Income from guaranteesshowed a slight improvement despite the reduction in totalturnover.
Results for financial trading were extremely positivenotwithstanding the ongoing effects of the international financialcrisis. In that context, it must be recognized that low interest ratesand the sluggish oil trade led customers to diversify their forexoperations, with a resulting higher turnover and a significantincrease in relevant margins.
Other net operating income refers to amounts recouped on costsincurred for commercial transactions, which reflects an increase incommission income and also includes the net balance ofextraordinary income and charges.

Administration Expenses
EUR/000
Amount %
256 2.90
27 4.25
160 9.89
497 3.67
169 18.25
-15 -8.43
378 1.64
32
2010 2009
a) Personnel expenses:
§ wages and salaries 9,081 8,825
2,466§ social security
contributions 2,520
§ staff severance payments 663 636
§ other expenses 1,778 1,618
14,042 13,545
§ Administrators 1,095 926
Total employee expenses
178
Total personnel expenses 15,300 14,649
§ Non-staff associates 163
b) other administration
expenses 8,174
54 2.19
Variation
8,447 -273 -3.23
651 4
Total 23,474 23,096
Total personnel expenses increased by 4.44%. The net change wasthe result of an increase in wages and salaries reflecting a reductionin clerical staff and increase for senior executives and executivecadres, only partially offset by personnel who left the Bank's serviceduring the year. Reduced outlays for voluntary early-retirementpackages paid out contributed significantly to limit other personnelexpenses but this was offset by a considerable increase forseconded personnel, with the result that the total expense washigher than in 2009.
For purposes of greater clarity amounts paid to Directors andassociates not on the Bank's payroll are entered under personnelcosts as required by new accounting principles.
Other administration expenses fell by 3.23%. This confirms theBank's ability to limit operating expenses and keep overheadsunder control while managing available resources in the most cost-effective manner.

Composition of the Year-end Net Result
EUR/000
30,715 34,107
-19,646 -7,790
1,180 -396
30 -507
3,984 -6,419
-152 -251
-14,604 -15,363
14,595 17,745
-6,194 -9,660
8,401 8,085
33
-1,516
§ to other financial operations
- Net adjustments to tangible and intangible
fixed assets
- Profit before tax
- Income tax for the year
Net profit
- Net impairment adjustments:
- Gross operating profit
-999
total
§ to loans
§ to financial assets available for sale
§ to financial assets held to maturity
§ net provisioning for risks and charges
2010 2009
Variations in net interest income (-8.02%), net non-interest income (+0.88%) and
administrative expenses (+7.08%) resulted in a reduction in gross operating profit
from EUR 34,107,154 to EUR 30,715,596 in 2010.
The following table indicates the composition of net profit for 2010 compared to
2009.
More information on these figures is provided in the Notes to the Financial
Statements (Part C: Additional Income Statement Data), whereas proposals for
allocating net profit are submitted in the section Profit Allocation
Results

SIGNIFICANT POST-YEAR-END EVENTS
34
Civil disorder and subsequent events causing various impacts in north
African and Middle Eastern countries have forced UBAE to adopt a
cautious assessment and control policy as regards open positions. In
addition, the Bank is faced with objective difficulties in carrying out
normal business operations.
In particular, events in Libya and positions taken by international
organizations have affected UBAE and all European banks that find
themselves in a similar position. In Italy, on 12 March 2011 this led to
temporary administration of the Bank by Banca d'Italia and later, to
extraordinary administration as prescribed by decree on 8 April 2011,
with the consequence that the Bank's Board of Directors, Board of
Statutory Auditors and Executive Committee were dissolved.
As a result of this measure Banca d'Italia appointed two Extraordinary
Commissioners and a Supervisory Board comprising three members to
ensure financial markets that the Bank's operations are conducted in an
entirely transparent and correct manner in accordance with Italian,
European and international regulations.
And so the Bank is fully operational and continues to conduct business in
an entirely efficient manner.
New scenarios in markets in the Bank's region of interest, especially in
Libya, require constant and careful monitoring of open positions and
import/export transactions under way. The aims are to make sure
commercial and attendant financial transactions are conducted correctly
and to check and ensure compliance with international directives, which
are constantly being updated.
On the risk front as regards credit facilities granted and deposits,
including all outstanding contingent facilities (guarantees and letters of
credit ), the Bank has intensified its first and second level internal
controls and checks made by the Compliance unit.
Given the Bank's current overall position, compared to the situation atyear-end there is no need to create further provisions for financial andbusiness risks. In fact the valuation of balance sheet items and specificprovisions already made took into account overall risks in the Bank'svarious markets. In the specific case of Libya, the level of funds ondeposit with the Bank, commitments counter-guaranteed by Italian orEuropean banks and restrictive international measures encumberingbeneficiaries of the majority of guarantees issued means that the existingrisk level is limited and as such is reflected in the balance sheetevaluation.

ADDITIONAL INFORMATION
The Bank does not conduct research and development activity.
The Bank does not hold any treasury stock.
35
Information regarding the Bank's dealings with related parties may be found in the
relevant section of the Notes to the Financial Statements.

36
1. Approval of the Accounts for the Financial Year Ended 31 December 2010
Gentlemen:
2. Appropriation of Net Profit
Profit for the year is allocated as follows
Euro
Euro
Euro
Euro
Euro
Euro
Euro
Euro
Euro
Euro2005 IAS
Euro
If the scheme is approved, shareholders' equity will amount to EUR 212,315,253.26
and will be composed as follows
15,660,416.23
151,060,800.00
- Carry-forward
- Share capital
202,315,253.26
- Share premium
- Reserves and profit carried forward
16,702,216.29
34,246,997.59
- IAS FTA reserve and carry-forward 305,239.38
- Net profit
- Retained profit 7,980,396.00
8,400,896.00
- 5% to Legal Reserve (art. 30.a) of the Articles of
Association)
420,044.80
PROFIT ALLOCATION
Based on regulations governing Extraordinary Administration it is not possible to distribute
the profit for 2010 reported in the Bank's Financial Statements, therefore the entire result is
allocated in part, for the mandatory portion, to the Legal Reserve while the remainder is
carried forward
7,680,020.23
15,660,416.23

36
(amounts in euros)
FINANCIAL STATEMENTS

37
10 Cash and cash equivalents 216,394 340,899
20 Financial assets held for trading 115,517,036 67,871,003
40 Financial assets available for sale 3,503,653 2,501,915
50 Financial assets held to maturity 91,100,706 82,832,563
60 Loans and advances to bank 2,897,837,929 2,106,310,249
70 Loans and advances to customers 210,275,496 168,104,001
110 Tangible fixed assets 24,981,933 25,671,143
120 Intangible fixed assets, 2,219,484 347,700
of which: goodwill
130 Tax assets 27,249,518 19,758,988
a) current 17,428,059 15,170,994
b) deferred 9,821,459 4,587,994
150 Other assets 1,396,185 1,060,690
3,374,298,334 2,474,799,151
BALANCE SHEET:
ASSETS
Assets 2010 2009
Total assets

38
10 Accounts payable to banks 2,380,597,369 2,119,506,551
20 Accounts payable to customers 761,550,250 123,592,793
40 Financial liabilities held for trading 3,967,575 7,154,452
80 Tax liabilities 11,706,382 11,728,810
a) current 11,617,617 11,616,666
b) deferred 88,765 112,144
100 Other liabilities 11,566,817 16,428,960
110 Staff severance fund 2,128,847 2,446,298
120 Provisions for risks and charges 465,841 475,827
a) pensions and similar 0
b) other 465,841 475,827
130 Valuation Reserves 733,461 284,564
160 Reserves 25,417,880 17,332,934
170 Share premium reserve 16,702,216 16,702,216
180 Share capital 151,060,800 151,060,800
190 Treasury stock 0
200 Net profit for the year 8,400,896 8,084,946
Total liabilities and shareholders' equity 3,374,298,334 2,474,799,151
BALANCE SHEET:
LIABILITIES
Liabilities 2010 2009

39
2010 2009
10 Interest and similar income 37,309,436 62,091,943
20 Interest charges and similar expenses (12,083,877) (34,668,143)
30 Net interest income 25,225,559 27,423,800
40 Commission income 24,849,395 26,199,469
50 Commission expense (3,020,333) (4,317,765)
60 Net commissions 21,829,062 21,881,704
70 Dividends and similar income 8,500 21,846
80 Net trading income 5,305,315 5,000,781
120 Gross operating income 52,368,436 54,328,131
130 Net impairment adjustments: (14,452,406) (15,112,001)
a) to loans and advances (19,646,429) (7,789,994)
b) to financial assets available for sale 1,180,503 (396,352)
c) to financial assets held-to-maturity 29,879 (507,087)
d) to other financial assets 3,983,641 (6,418,568)
140 Net income from financial operations 37,916,030 39,216,130
150 Administration expenses: (23,473,498) (23,096,411)
a) personnel (15,299,582) (14,649,154)
b) other (8,173,916) (8,447,257)
160 Net provisioning for risks and charges (152,292) (251,376)
170
180
190 Other operating income / charges 1,820,658 2,875,434
200 Operating charges (23,320,801) (21,470,904)
250
260
270
290 Net profit for the year 8,400,896 8,084,946
(817,334)
(698,335)
14,595,229
(6,194,333)
INCOME STATEMENT
Profit from continuing operations
before tax
Net profit from continuing
operations
Income tax for the year on continuing
operations
Items
8,400,896
(830,588)
Net adjustments to tangible fixed
assets
Net adjustments to intangible fixed
assets (167,963)
17,745,226
(9,660,280)
8,084,946

40
10 Net profit (loss) 8,400,896 8,084,946
20 Financial assets available for sale 302,707 192,600
30 Tangible assets
40 Intangible assets
50 Hedging of foreign investments
60 Hedging of financial flows
70 Forex differentials
80
90
100
110 Other sources of income, after tax 302,707 192,600
120 Comprehensive Net Income 8,703,603 8,277,546
Items 2010 2009
Non-current assets earmarked for disposal
Actuarial profit (loss) on defined-benefit
plans
Share of valuation reserves booked to
shareholders’ equity
COMPREHENSIVE NET INCOME DETAIL
41
Share capital
a) ordinary shares 151,060,800 151,060,800
b) other shares
Share premium account 16,702,216 16,702,216
Reserves
a) from profits 17,332,934 17,332,934 8,084,946
b) other
Revaluation reserves 284,564 284,564 448,897
Capital instrument
Own Shares
Net profit for the year 8,084,946 8,084,946 (8,084,946)
Shareholders' equity 193,465,460 0 193,465,460 0 0 448,897
Changes to
reserves
Allocation of profit
from previous year
Reserves
STATEMENT OF CHANGES IN EQUITY - 2010
Balance as at
31.12.2009
Change in
opening
balance
Balances as at
01.01.2010 Dividends
and others

42
151,060,800
16,702,216
25,417,880
733,461
8,400,896 8,400,896
8,400,896 202,315,253
New Shares
issued
Changes to Equity
Stock
options
2010
Net Profit
Shareholders'
Equity as at
31.12.2010Extraordinary
dividends paid
Changes to
capital
instruments
Derivatives
on treasury
stock
Intervening variations
Treasury
stock
bought

43
Share capital
a) ordinary shares 143,624,470 143,624,470
b) other shares
Share premium account 16,702,216 16,702,216
Reserves
a) from profits 16,944,611 16,944,611 7,824,653
b) other
Revaluation reserves 284,564
Capital instrument
Own Shares
Net profit for the year 7,824,653 7,824,653 (7,824,653)
Shareholders' equity 185,095,950 0 185,095,950 284,564
Balance as at
31.12.2008
STATEMENT OF CHANGES IN EQUITY - 2009
Change in
opening
balance
Balances as at
01.01.2009
Allocation of profit
from previous year
ReservesDividends
and others
Changes to
reserves
44
7,436,330 151,060,800
16,702,216
(7,436,330) 17,332,934
284,564
8,084,946 8,084,946
8,084,946 193,465,460
Derivatives
on treasury
stock
Stock
options
New Shares
issued
Treasury
stock
bought
Intervening variations
Extraordinary
dividends paid
Changes to
capital
instruments
Shareholders'
Equity as at
31.12.2009
Changes to Equity
2009 Net
Profit

45
A OPERATING ACTIVITIES
1 Operations 16,428,601 23,456,531
Net profit for the year 8,400,896 8,084,946
Capital gains (losses) on hedging assets
Net impairment adjustments 14,452,406 15,112,001
Unsettled taxes and duties (7,512,958) (1,642,732)
Other adjustments 448,897 284,564
2
Financial assets held for trading 46,779,710 (23,996,196)
Financial assets carried at fair value
Financial assets available for sale 1,001,738 (206,636)
Loans and advances to banks: demand 791,527,680 (1,154,269,593)
Loans and advances to banks: other
Loans and advances to customers 56,623,901 (17,443,046)
Other financial assets 335,495 (375,696)
3
Account payable to banks: demand 261,090,818 (1,477,080,863)
Account payable to banks: other
Account payable to customers 637,957,457 57,235,905
Outstanding securities
Financial liabilities held for trading (3,186,877) (13,996,781)
Financial liabilities carried at fair value
Other financial liabilities (5,179,594) (55,784,782)
Liquidity generated (absorbed)
by financial assets
998,551
(9,986) 208,473
1,515,669
896,268,524 (1,196,291,167)
Net liquidity generated (absorbed) by
operating activities
Liquidity generated (absorbed) by financial
liabilities
10,841,881
410,728
(1,489,626,521)890,681,804
(269,878,823)
(866,323)
Capital gains (losses) on financial assets held for
trading and financial assets/liabilities carried at fair
value
Net adjustments to tangible and intangible
assets
Net provisions for risks and charges and Other
revenues (costs)
Net post tax adjustments to groups of assets
earmarked for disposal
CASH FLOW STATEMENT
Indirect Method 2010 2009

46
B INVESTMENT/DIVESTMENT ACTIVITIES
1 Liquidity generated by: 0 0
Disposal of equity investments
Dividends received on equity investments
Disposal of financial assets held to maturity
Disposal of tangible fixed assets
Disposal of intangible assets
Disposal of business units
2 Liquidity absorbed by: 10,966,386 36,340,579
Purchase of equity investments
Purchase of financial assets held to maturity 8,268,143 36,234,747
Purchase of tangible fixed assets 128,124 86,625
Purchase of intangible assets 2,570,119 19,207
Purchase of business units
(10,966,386) (36,340,579)
C FUNDING 0
Issue (purchase) of treasury stock 0 7,436,330
Issue (purchases) of capital instruments 0
Distribution of dividends and other 0 (7,436,330)
(124,505) (306,219,402)
Reconciliation
2010 2009
340,899 306,560,301
(124,505) (306,219,402)
216,394 340,899
0 0
Cash and cash equivalents at start of year
Net liquidity generated (absorbed) by funding
activities
NET LIQUIDITY GENERATED (ABSORBED) DURING
THE YEAR
Net liquidity generated (absorbed) by
investment/divestment activities
Net liquidity generated/absorbed during the year
Cash and cash equivalents at the year end
Cash and cash equivalents: effect of exchange rate
variations

47
SUPPLEMENTARY NOTE

48
A.1 GENERAL PART
PART A
ACCOUNTING POLICIES
Section 1 – Compliance with international accounting standards
The 2010 financial statements have been prepared in conformity with the accountingprinciples issued by the IASB and certified by the European Commission pursuant to ECRegulation 1606 of 19 July 2002. Reference was also made to the IFRS Framework forthe preparation and presentation of financial statements.
Section 2 – General principles for preparation
In preparing the financial statements, particularly as regards the format for the BalanceSheet, the Income Statement and the Notes, the Bank followed the instructions set outin Banca d’Italia’s circular directive 262 of 22 December 2005. Additional information isprovided as required to meet International Accounting Standards and wherever it wasjudged appropriate from the standpoint of relevance or meaningfulness. Amounts in theBalance Sheet and Income Statement are expressed in whole euros, while figures inthe Notes are represented in thousands of euros.
The financial statements were drafted to reflect: the Bank's continuity over time; accrual-basis accounting; the relevance and meaningfulness of the information provided; the primacy of economic substance over legal form; the same classification and presentation criteria from one year to the next; no offsetting of any assets, liabilities, revenues or costs unless required or
allowed by the Principles, the Interpretations or Banca d’Italia's circular directive; departures from the previous year's results.
The financial statements comprise items and classes of items, each of which issignificant and homogeneous by nature and/or destination.
Section 3 – Events Occurring After the End of the Financial Year
The Annual Report indicates events that have taken place at the end of the financialyear, no adjustments to the Financial Statements are deemed necessary in the light ofthese event.

49
Section 2 – Other aspects
Statement of comprehensive income
The Statement of Comprehensive Income, introduced in financial year 2010 andprepared in accordance with changes made to IAS 1, includes revenue and cost itemsthat, in conformity with international accounting principles, are not shown in theIncome Statement but are recorded in shareholders' equity.
Therefore comprehensive income includes changes in shareholders' equity during theyear, both as a result of transactions contributing to the effective profit for the yearplus other transactions net of the relevant tax effect. The latter comprise changes inthe value of financial assets available for sale, tangible and intangible fixed assets,hedging of foreign investments and financial flows, forex translation adjustments andactuarial profits or losses on defined employee benefit plans recorded in shareholders'equity based on a specific accounting principle.
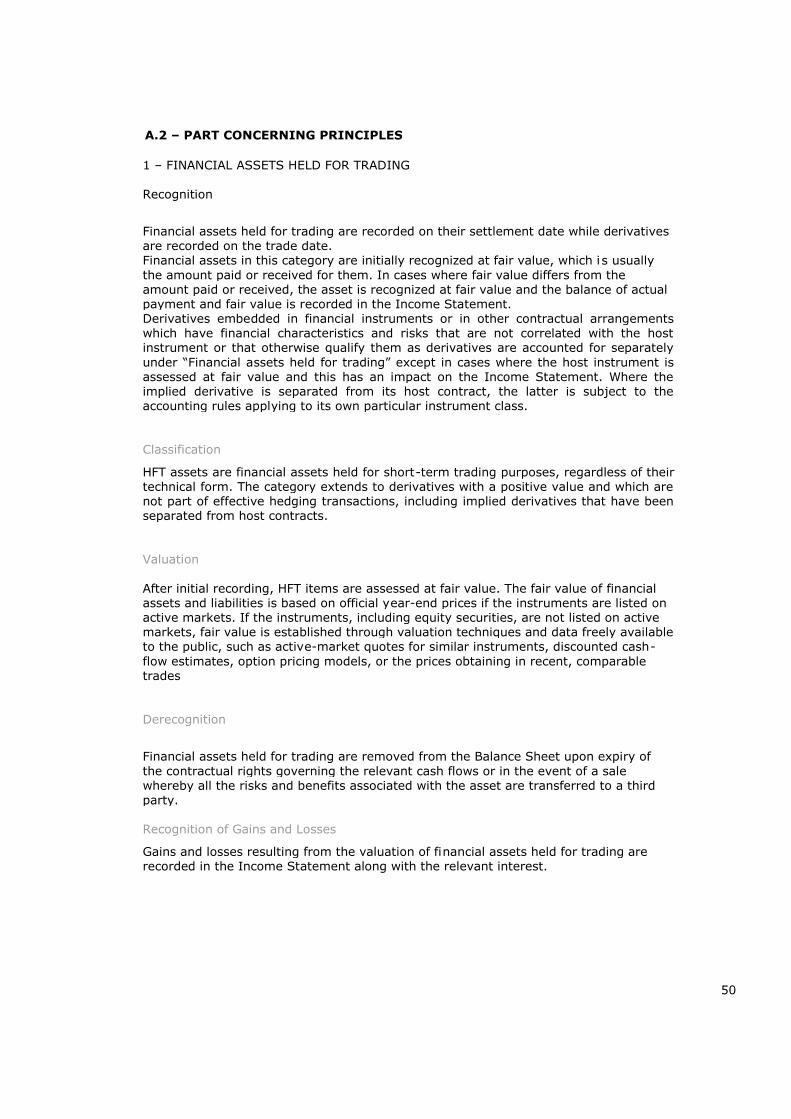
A.2 – PART CONCERNING PRINCIPLES
50
1 – FINANCIAL ASSETS HELD FOR TRADING
Recognition
Financial assets held for trading are recorded on their settlement date while derivativesare recorded on the trade date.Financial assets in this category are initially recognized at fair value, which is usuallythe amount paid or received for them. In cases where fair value differs from theamount paid or received, the asset is recognized at fair value and the balance of actualpayment and fair value is recorded in the Income Statement.Derivatives embedded in financial instruments or in other contractual arrangementswhich have financial characteristics and risks that are not correlated with the hostinstrument or that otherwise qualify them as derivatives are accounted for separatelyunder “Financial assets held for trading” except in cases where the host instrument isassessed at fair value and this has an impact on the Income Statement. Where theimplied derivative is separated from its host contract, the latter is subject to theaccounting rules applying to its own particular instrument class.
Classification
HFT assets are financial assets held for short-term trading purposes, regardless of theirtechnical form. The category extends to derivatives with a positive value and which arenot part of effective hedging transactions, including implied derivatives that have beenseparated from host contracts.
Valuation
After initial recording, HFT items are assessed at fair value. The fair value of financialassets and liabilities is based on official year-end prices if the instruments are listed onactive markets. If the instruments, including equity securities, are not listed on activemarkets, fair value is established through valuation techniques and data freely availableto the public, such as active-market quotes for similar instruments, discounted cash-flow estimates, option pricing models, or the prices obtaining in recent, comparabletrades
Derecognition
Financial assets held for trading are removed from the Balance Sheet upon expiry ofthe contractual rights governing the relevant cash flows or in the event of a salewhereby all the risks and benefits associated with the asset are transferred to a thirdparty.
Recognition of Gains and Losses
Gains and losses resulting from the valuation of financial assets held for trading arerecorded in the Income Statement along with the relevant interest.

51
2 – FINANCIAL ASSETS AVAILABLE FOR SALE
Recognition
Financial assets available for sale are recognized on their settlement date. They arefirst recorded at fair value, which is usually the amount paid or received for them. Incases where fair value differs from the amount paid or received, the asset is recognizedat fair value and the balance of actual payment and fair value is recorded in the IncomeStatement.The amount recorded initially will include any accessory charges or income relating tothe transaction.
Classification
The available-for-sale category refers to non-derivative assets which are not classifiedin the Balance Sheet as financial assets held for trading, financial assets held at fairvalue, financial assets held to maturity, loans and advances to banks, or loans andadvances to customers.The item includes equity holdings which do not qualify as controlling, jointly controllingor connected stakes, and which are not held for trading purposes.
Valuation
After their initial recording, financial assets available for sale are assessed at fair value.Fair value is established by the method described in the section concerned withfinancial assets held for trading. If a plausible fair-value figure for equities cannot beobtained by technical assessments, these will be recorded at cost and adjusted forimpairment losses if and as applicable.
Derecognition
Financial assets available for sale are removed from the Balance Sheet upon expiry ofthe contractual rights governing the relevant cash flows or in the event of a salewhereby all the risks and benefits associated with the asset are transferred to a thirdparty.
Recognition of Gains and Losses
Gains and losses arising from changes in fair value are recorded in an ad hoc reservewithin shareholders' equity and are kept there until the asset is reversed out.Furthermore, these changes are recorded in the Statement of Comprehensive Income.If there is evidence of an impairment loss at the end of the financial year, the loss isreversed out of shareholders' equity and charged to the Income Statement for anamount equal to the difference between purchase cost and fair value, after deductingany pre-existing impairment losses in the Income Statement.If fair value should rise again after an impairment loss was recorded, the gain isentered in the Income Statement if the item is a debt instrument, though not if it is anequity.Besides impairment losses, cumulative gains or losses in the shareholders' equityreserve are recorded in the Income Statement at the time of disposal of the assetconcerned as indicated above. Interest reckoned by the actual interest rate method isrecorded in the Income Statement. Dividends on financial assets available for sale arerecorded in the Income Statement when the right to receive payment matures

52
3 – FINANCIAL ASSETS HELD TO MATURITY
Recognition
Financial assets held to maturity are recognized on their settlement date. They are firstrecorded at fair value, which is usually the amount paid or received. In cases where fairvalue differs from the amount paid or received, the asset is recognized at fair value andthe balance of actual payment and fair value is recorded in the Income Statement.The amount recorded initially will include any accessory charges or income relating tothe transaction.
Classification
The HTM category comprises financial assets, other than derivatives, involving specifiedor specifiable contractual payments and a fixed maturity, in relation to which there isboth a genuine intention and the ability to hold them to maturity. It includes listedbonds though not complex structured bond issues with embedded derivatives thatcannot be unbundled.
Valuation
After initial recording, financial assets held to maturity are assessed at their amortizedcost and are later checked for possible impairment losses.The amortized cost of a financial asset is the value initially recorded, net of anyprincipal reimbursed, plus or minus cumulative amortization as reckoned by the actualinterest rate method on any difference between the initial value and value on maturityand net of any write-down (either direct or made by drawing on provisions) due toimpairment or outright uncollectability.The amortized-cost method is not used for short-term financial assets, as applying itwould not produce meaningful results; such assets are recorded at cost.
Derecognition
HTM assets are derecognized upon expiry of the contractual rights governing therelevant cash flows or in the event of a sale whereby all the risks and benefitsassociated with the asset are essentially transferred to a third party.
Recognition of Gains and Losses
Gains and losses are entered in the Income Statement at the time the HTM assets areremoved from the Balance Sheet. Interest is reckoned by the amortized-cost methodbased on actual interest rates.If evidence points to an impairment loss at the end of the financial year, this is enteredin the Income Statement as the difference between the asset's book value and thepresent value of future estimated cash flows, discounted by using the original actualinterest rate.If the reasons that gave rise to the impairment loss should cease to subsist after theloss was recognized, a write-back is recorded in the Income Statement. The gain cannotresult in a higher book value than that which the asset’s amortized cost would haveexhibited if no impairment loss had been recorded.

53
4 – LOANS AND ADVANCES, GUARANTEES ISSUED
Recognition
Loans and advances are recorded in the Balance Sheet on the date they are disbursed(for debt instruments, on the settlement date). The value recorded initially is theamount disbursed or subscription price, including marginal costs and income directlyattributable to the transaction and quantifiable at the date of recognition, even if paidlater.The initial value cannot include costs that will be reimbursed by the borrower, nor anyportions of internal administrative costs.The initial value of any loans disbursed at other than market rates should equal the fairvalue of such loans as established using valuation techniques; any difference betweenfair value and the amount disbursed or subscription pr ice is recorded in the IncomeStatement.Carry-over contracts and repurchase or resale agreements are recorded in the BalanceSheet as borrowing or lending transactions; spot sales and forward repurchases arerecorded as liabilities for the spot amount received, whereas spot purchase and forwardresale transactions are recorded as receivables for the spot amount paid.Contingent liabilities, which include guarantees and commitment carrying credit risk,are designated at the fair value of the commitment given.Financial guarantees are initially recognized at fair value, which is represented by thefee initially received and subsequently at the higher of the amount determined inaccordance with IAS 37 and the amount initially recognized (less, where appropriat e,cumulative amortization calculated on a straight-line basis).
Classification
Loans and advances that are disbursed directly or acquired from third parties, that arenot listed on active markets and involve fixed, specifiable payments are classified u nder“L&As to Banks” or “L&As to Customers” save for those classified as financial assetsheld for trading, financial assets designated at fair value, or financial assets availablefor sale. Any instruments whose characteristics make them similar to loans are alsotreated as L&As, as are operating loans and repurchase agreements.
Valuation
After initial recognition, L&As are valued at their amortized cost as described abovewith reference to financial assets held to maturity.The amortized cost method is not applied to short-term loans, to loans carrying anunspecified maturity, or to open-ended loans, as applying the amortized cost methodwould not be meaningful in such cases; all three types of loans are assessed at cost.The loan portfolio is reviewed at the end of each financial year and checked for anyinstances of impairment that may lead to losses.Bad debts, standstill positions, restructured debts and positions that are overdue by, ordisplay overruns extending for, more than 180 days are considere d impaired loans.Impairment losses are only recorded in the accounts when, after initial recognition ofthe loan, there is objective evidence of events likely to cause a reduction in the loan'svalue such that future estimated cash flows will be affected.

54
Bad debts, standstill positions or restructured debts that show a reduction in valuebased on objective evidence of impairment are valued individually. The loss iscalculated as the difference between the asset's book value and the present value ofestimated cash flows, discounted by using the original actual interest rate. Valuationtakes into account:
the “maximum collectable amount”, which represents the best possible estimateof future cash flows from the loan and related interest: when collection is judgedlikely this also includes default interest and the realizable value of any collateral,net of collection costs;
estimated time to collection based on contractual due dates, if such exist, or elseon reasonable estimates;
the discounting-back rate, which is the original actual interest rate; with respectto impaired loans existing at the transition date which proved too difficult toquantify, reasonable estimates are used, such as the average rate for loansduring the year in which the loan was classified as a bad debt, or therestructuring rate.
For the purposes of valuation, cash flows estimated to occur over the short term arenot discounted to present value. The original actual rate for each loan remains thesame over time, even when restructuring has introduced a change in the contractuallyagreed rate or the loan no longer bears interest.Loans that show no objective evidence of impairment (typically, performing loans tobanks and customers, including loans to counterparties resident in countries consideredas being at risk) and impaired loans with overdue positions in excess of 180 days, areassessed collectively by means of creating groups of positions with a similar risk profile.The write-down is based on historical trends for losses on each group of positions; forthis purpose, individually valued positions are left out of the loan population.Adjustments determined collectively in this way are recorded in the Income Statement.Recoveries in value (if any) are calculated differentially by reference to the entireportfolio of loans in a given class.Contingent liabilities are also subject to review for impairment using methods similar tothose adopted for loans valued individually and collectively.Any write-downs are recorded in the Income Statement and the contra-item enteredunder Other Liabilities.The amount recognized as a provision in accordance with IAS 37 represents the bestestimate of the expenditure required to settle the liability existing at the Balance Sheetdate in connection with the financial guarantee valued individually or collectively.
Derecognition
Under the terms of IAS 39, the transfer of financial assets only leads to derecognitionwhen basically all risks and benefits associated with the assets are transferred to athird party. If the Bank has not basically transferred all the risks and benefitsassociated with an asset and retains control over it, the Bank's “continuinginvolvement” in the asset (i.e., the amount representing its exposure to changes in thevalue of the asset transferred) remains in the Balance Sheet.
Recognition of Gains and Losses
Gains and losses are entered in the Income Statement at the time a loan isderecognized as a result of impairment loss and by amortization of the differencebetween the book value and the amount to be repaid at maturity, the latter beingrecorded in the Income Statement as interest.Impairment losses as defined above in the section on loan valuation, are recorded inthe Income Statement.

55
If the reasons that gave rise to the impairment loss should cease to subsist after theloss was recognized, a write-back is recorded in the Income Statement. The gaincannot result in a higher book value than that which the asset’s amortized cost wouldhave exhibited if no impairment loss had been recorded.Write-backs linked to the passing of time, corresponding to interest accrued over theyear on the basis of the original actual interest rate previously used to calculateimpairment losses, are recorded under Net impairment write-downs.Risks and charges relating to contingent liabilities are recorded in the IncomeStatement and the contra-entry under Other liabilities.
5 – FINANCIAL ASSETS CARRIED AT FAIR VALUE
There are no items in this category.
6 – HEDGING TRANSACTIONS
There are no items in this category.
7 – EQUITY INVESTMENTS
There are no items in this category.
8 – TANGIBLE FIXED ASSETS
Recognition
Tangible fixed assets are recognized in the Balance Sheet when their cost can bereasonably determined and it is likely that the relevant future economic benefits willaccrue to the Bank, regardless of the formal transfer of ownership.Tangible fixed assets are recognized initially at cost, including all directly related costsfor the purchase and installation of the assets. Extraordinary maintenance expensesthat lead to an increase in a fixed asset's future useful life are recorded as an increasein the value of the asset concerned, whereas ordinary maintenance costs are recordedin the Income Statement.
Classification
This line item includes fixed assets used in the production and supply of goods andservices, or for administrative purposes, and that are intended to be used for a numberof years. Tangible fixed assets include land, buildings, technical systems, furniture,fixtures and equipment.
Valuation
Tangible fixed assets are valued at cost less depreciation and losses for reductions invalue.Depreciation is calculated systematically on a straight-line basis over the residual usefullife of the asset. Land included in the value of wholly-owned buildings is notdepreciated.

56
Derecognition
A tangible fixed asset is derecognized at the time of its disposal or when it has beenwithdrawn permanently from use and no future benefits are expected as a result of itsdisposal.
Recognition of Gains and Losses
Depreciation is recorded in the Income Statement. If there is any indication of apotential reduction in the value of a tangible fixed asset, a comparison is madebetween the book value and the “recoverable value”, the latter being the greater of theasset’s use value, i.e., the present value of future cash flows originating from the asset,and its fair value reckoned net of disposal costs. Any shortfall in book value relative torecoverable value is entered in the Income Statement. If the reasons for the write-down should cease to subsist, a write-back is entered in the Income Statement. Thewrite-back cannot result in a higher book value than that which the asset would haveexhibited, after depreciation, if no reduction in value had occurred.
9 – INTANGIBLE FIXED ASSETS
Recognition
Intangible fixed assets are non-monetary assets identifiable by virtue of legal orcontractual rights. They have no physical form, are held for use over a number of yearsand are recognized in the Balance Sheet insofar as they are expected to generatefuture economic benefits. Intangible fixed assets are initially entered at cost.
Classification
The Bank’s intangible fixed assets consist mostly of software.
Valuation
Intangible fixed assets are recorded at cost and are amortized on a straight-line basis.
Derecognition
Intangible fixed assets are removed from the Balance Sheet at the time of theirdisposal or when no future economic benefit is expected from their use or disposal.
Recognition of Gains and Losses
Amortization is recorded in the Income Statement. If there is any indication of apotential reduction in the value of an intangible fixed asset, a test is performed toassess the loss, and any shortfall in the asset’s book value relative to recoverable valueis entered as a write-down in the Income Statement. Should the reasons for the write-down of an intangible fixed asset other than goodwill cease to subsist, a correspondingwrite-back is entered in the Income Statement. The write-back cannot result in ahigher book value than that which the asset would have exhibited, net of amortization,if no reduction in value had occurred.

57
10 – NON-CURRENT ASSETS FOR WHICH DISPOSAL IS UNDERWAY
There are no items in this category.
11 –TAX ASSETS AND LIABILITIES
Recognition
Income tax charges comprise current and deferred tax.Prepaid tax assets are recognized to the extent that it is probable that future taxableincome will be available against which such assets can be utilized. Deferred taxes arerecognized in all cases in which the relevant liability is likely to arise.
Classification
Prepaid and deferred taxes are recorded in the Balance Sheet as open balances and arenot offset; the former are recorded under Tax assets, the latter under Tax liabilities.
Valuation
When the results of transactions are recorded under shareholders' equity directly, taxesare recorded under shareholders' equity too.Assets and liabilities representing prepaid and deferred taxes respectively areperiodically reviewed to take account of any changes in regulations, tax rates or thelikelihood that a tax benefit will no longer be realized.
Recognition of Gains and Losses
Income tax is recorded in the Income Statement by the same method used to recordrevenues and costs, except - as mentioned - those items debited or credited directly toshareholders' equity. Income tax for the year is calculated on the taxable result for theyear, using the tax rates applying at year-end and any adjustments for taxes payableon previous years’ income. Deferred tax assets and liabilities are measured at the taxrates that are expected apply when the assets are cashed in or the liabilities aresettled, based on the rates applying at the Balance Sheet date. Deferred and prepaidincome tax is reckoned on the temporary differences obtaining between assets andliabilities recorded in the Balance Sheet and the corresponding values recognized fortax purposes.
12 – STAFF SEVERANCE FUND
Recognition and classification
The Staff severance fund is recognized by the actuarial method prescribed in IAS 19 forstaff defined-benefit programmes. Therefore, the liability recorded in the Balance Sheetis subject to actuarial estimates that also take into account, among other variables,future developments in the employment relationship.The liability in the Balance Sheet represents the present value of the obligation,adjusted for any unrecognized actuarial gains and losses.

58
Valuation and recognition of gains and losses
The present value of future staff severance liabilities is calculated at year-end, based onthe Project Unit Credit Method, by an independent accountant. The year-end book valueis adjusted by the fair value of any assets pertaining to the plan. Following legislativereforms only staff severance liabilities as at 31.12.2006 are still held by the Bank andsubject to the actuarial valuation method described. Actuarial gains and losses arerecorded directly in the Income Statement. In the case of (external) defined-contribution pension funds, the Bank's contribution is calibrated to work performed andcharged to the Income Statement. Every year the liability is determined on the basis ofcontributions due for that year. As result of the legislative reform, based on the choicemade by each individual employee, Staff Severance amount due from 01.01.2007onward are transferred to an external pension fund or the INPS treasury fund and assuch are no longer considered as “defined contribution plan”.
13 - FUNDS FOR RISKS AND CHARGES
Recognition and classification
Provisioning for risks and charges is entered in the Income Statement as well as in theBalance Sheet under liabilities provided the item meets the following conditions:• a current liability exists (legal or implied) arising from a past event;• it is deemed probable that financial resources will be disbursed to settle the
liability;• a reliable estimate can be made of the probable future disbursement.
Allocations are made based on the best estimate of the amount required to settle theliability, or to transfer it to a third party at the end of the year concerned.When the financial impact linked to the passing of time is significant and the dates forsettling the liabilities can be estimated reliably, the allocation is stated at present valueusing the market rates applying at the end of the financial year.
Valuation and recognition of gains and losses
Amounts provisioned for are reassessed at the end of each financial year and adjustedto reflect the best estimate of the expense required to settle outstanding liabilities.The impact of time elapsed and any changes in interest rates are reflected in theIncome Statement under Net provisioning for the year.
DerecognitionProvisions are used solely against the liabilities for which they were originally recorded.If it is deemed that settlement of the liability will no longer require the use of resources,then the provision is reversed and the effect of this is reflected in the IncomeStatement.
14 – ACCOUNTS PAYABLES
Recognition
Initial recognition is based on the fair value of the liability, which is normally theamount received, adjusted for marginal costs and income directly attributable to thetransaction and not reimbursed by creditor, though not for any internal administrativecosts.Any financial liabilities issued at other than market conditions are recorded at estimatedfair value and the discrepancy with the amount paid or the issue price is recorded in theIncome Statement.

59
Classification
Payables include financial liabilities not held for short-term trading purposes, such asthe various kinds of interbank funding and customer deposits.
Valuation and Recognition of Gains and Losses
After initial recognition, these items are valued at amortized cost by the actual interestrate method, save for short-term liabilities whose relevance warrants their recognitionat fair value (i.e., amount received adjusted for any directly related charges/proceeds).The method for determining amortized cost is discussed in the sub-section above onFinancial assets held to maturity.
Derecognition
Financial liabilities included in this category are removed from the Balance Sheet whensettled or at maturity.
15 – FINANCIAL LIABILITIES HELD FOR TRADING
Recognition
Recognition of HFT liabilities carries the settlement date (if derivatives, the trade date).Liabilities are initially recorded at fair value, which normally equals the amountreceived.If the amount received differs from fair value, the financial liability is recorded at fairvalue and the balance of the two quantities is recorded in the Income Statement.Derivatives embedded in financial instruments or in other contract formats, and whosefinancial characteristics and risks are unrelated to the host instrument, or which haveother features that qualify them as derivatives, are accounted for separately, ifnegative, under Financial liabilities held for trading, except where the complexinstrument in which they are embedded is designated at fair value and the impact isreflected in the Income Statement.
Classification
This line item includes the negative value of derivatives that are not part of hedgingtransactions and also the negative value of implied derivatives embedded in comple xcontracts.
Valuation
After initial recognition, financial liabilities held for trading are assessed at fair value.The method for determining fair value is discussed in the sub-section on Financialassets held for trading.
Derecognition
Financial liabilities held for trading are reversed out when settled or at maturity.
Recognition of Gains and Losses
Gains and losses from the valuation of financial liabilities held for trading are recordedin the Income Statement.

60
16 – FINANCIAL LIABILITIES CARRIED AT FAIR VALUE
There are no items in this category.
17 – FOREIGN CURRENCY TRANSACTIONS
Recognition
When initially recognized, forex transactions are recorded in euros (the accountingcurrency) by applying the exchange rate in effect on the date of the transaction.
Recognition of gains and losses
At year-end positions denominated in foreign currency are assessed as follows:
monetary positions are converted at the exchange rate in effect at theend of the financial year;
non-monetary positions valued at historical cost are converted at the exchangerate in effect on the date of the transaction;
non-monetary positions assessed at fair value are converted at the exchange ratein effect at the end of the financial year.
Exchange rate differences arising from the settlement of monetary positions or fromthe conversion of monetary positions at rates different from those used initially for suchpositions (or for the conversion of the previous balance sheet) are entered in theIncome Statement relating to the period in which they arose.When a gain or loss relating to a non-monetary position is recorded under shareholders'equity, the exchange rate difference for that item is also recorded under shareholders'equity. On the other hand, when a gain or loss is recorded in the Income Statement,the related exchange rate difference is recorded there too.
18 – ADDITIONAL INFORMATION
Fair value
Fair value is defined as the amount for which an asset may be traded, or a liabilitysettled, in an unconstrained transaction between informed and mutually independentparties.
The methods adopted by the Bank for quantifying fair value may be grouped into threebroad categories:
1. Level 1 - quotes derived from active markets (mark to market), where valuation isbased on the price commanded by the same instrument, unmodified andunrecombined, as quoted on an active market. A market is considered active whenits listed prices reflect normal market conditions, are regularly and readily availab lethrough bourses, listing services and/or brokers, and represent actual and regularmarket operations.

61
2. Level 2 - methods based on observable market parameters, such as marketquotes for similar instruments, or on the fact that all the instrument’s significantfactors, including credit and liquidity spreads, can be derived from observablemarket data. Methods in this group hold little scope for discretion since allparameters used, be it for the same or similar instruments, are ultimately drawnfrom the market, hence allow for the replication of quotes from active markets.
3. Level 3 - methods based on unobservable market parameters (mark to model).These are widely accepted and used, and include discounting back future cashflows and estimating volatilities; models are revised during their developmentand periodically thereafter to ensure maximum and durable consistency. Becausemethods in this group rely heavily on significant inputs from sources other thanthe market, their use will require estimates and assumptions on themanagement’s part.
Criteria for determining the fair value for a Security are as follows
a) Securities traded on active markets.
For equities and debt instruments traded on active markets fair value will berepresented by:
o the official price on the last trading day of the relevant period if the instrument islisted by Borsa Italiana;
o the official price (or its equivalent) on the last day of the relevant period if it islisted on foreign bourses.
b) Securities traded on active markets.
For equities and debt instruments not traded on active markets, fair value will berepresented by (in descending order of preference):
o the reference price from recent trades;
o price indications, if available and dependable, supplied by infoproviders such asICMA, Bloomberg, Reuters, etc.;
o the price obtained by applying valuation methods generally accepted in thefinancial community, e.g.:
for debt instruments, the discounting back of future cash flows, based on theyield rates applying at the end of the period for an equivalent residual life andtaken account of any counterparty risk and/or liquidity risk;
for equities (if the amount is significant), the price obtained throughindependent expert assessments if available, or else a price that is equal tothe fraction of shareholders’ equity held as recognized in the company’s latestapproved accounts;
o the price supplied by the issuer, suitably adjusted for counterparty risk and/orliquidity risk;
o cost, as adjusted to take account of any material depreciation, if fair value cannotreliably be determined by any of the previously mentioned criteria.

62
For derivatives, fair value will be represented by:
o the quoted price on the last trading day of the relevant period if the instrument istraded on a regulated market;
o if the instrument is an OTC derivative, its market value on the relevant referencedate as determined in accordance with the type of derivative being valued, i .e.:
interest rate contracts: the “replacement cost” obtained by discounting backthe balances, as applying on the scheduled settlement dates, of cash flowsgenerated at contract rates and expected cash flows generated at the(objectively determined) market rates current at the end of the period for anequivalent residual life;
forex derivatives: the forward forex rates applying at the reference date formaturities equivalent to those of the transactions being valued;
derivatives on securities, commodities and precious metals: the forward pricesapplying at the reference date for maturities equivalent to those of theunderlying assets.
Recognition of revenues and costs
Revenues are recognized when they are received or, in any event, when it is likely thatfuture benefits will be received that can be quantified in a reliable manner. Inparticular:
dividends are recognized in the Income Statement when their distribution isformally approved;
revenue from dealings in financial instruments held for trading (consisting in thedifference between the transaction price and the instruments’ fair value) isentered in the Income Statement when the trades are recognized if fair valuecan be determined by reference to parameters or recent transactions observablein the same market as that in which the instruments were traded;
revenue from financial instruments for which the above assessment is notpossible is recorded in the Income Statement over the duration of thetransaction.
Costs are recognized in the Income Statement in the same year as the relatedrevenues. If the link between costs and revenues can be made in a general and indirectmanner, costs are recorded over a number of years using rational and systematicprocedures. Costs that cannot be associated with revenues are recorded in the IncomeStatement immediately.

63
Assumptions on corporate continuity
Given the current state of financial markets and the real economy and the worryingoutlook for both over the short and medium term, assumptions on corporate continuityneed – unlike in the past – to rest on an accurate assessment of the Bank’scircumstances. Yet after taking full account of the risks and uncertainties associatedwith the present macroeconomic climate, we judge it reasonable to anticipate that theBank will continue to operate for the foreseeable future. The Financial Statements forthe year ended 31 December 2010 were thus prepared on that assumption – not leastgiven UBAE’s profitability in 2010 as well as earlier years, the unique context in whichit operates, and the encouraging near-term forecasts for the Bank’s earnings and itsoverall financial health.
Accounting estimates
IFRS requires that management provide valuations, estimates and projections bearingon the application of accounting principles and the book value of assets, liabilities,expenses and revenue. Estimates and related projections are based on past experienceand other factors deemed relevant, and are used to quantify assets – signally financialassets - and liabilities whose value is not readily obtained from other sources.

A.3 FAIR VALUE DETAIL
A.3.1 Transfers between portfolios
A.3.1.3 Transfers of financial assets held for trading
A.3.1.1 Reclassified financial assets: carrying amount, fair value and effects on
comprehensive income
A.3.1.2 Reclassified financial assets: effects on comprehensive income before
transfer
A.3.1.4 Effective interest rate and expected future cash flows from reclassified
assets
64

A.3.2 Fair value hierarchy
A.3.2.1 Accounting portfolios: Breakdown by fair value level
L1 L2 L3 L1 L2 L3
1
2
3
4
114,068 4,070 883 64,378 5,932 63
1
2
3
3,968 7,154
Legend:L1= Level 1L2= Level 2L3= Level 3
A.3.3 Information on the “day one profit/loss”
63
7,1543,968
2,621 883 2,439
Financial
assets/liabilities
measured at fair value
2010
Financial assets designated
at fair value
Financial assets available
for sale
A.3.2.2 Annual changes in financial assets designated at fair value
through profit and loss (level 3)
Total
Hedging derivatives
3,493
Financial liabilities held for
trading
Financial liabilities
designated at fair value
Financial assets held for
trading
Total
Hedging derivatives
114,068 1,449 64,378
65
2009
A.3.2.3 Annual changes in financial liabilities designated at fair value
through profit and loss (level 3)

66
ASSETS
Section 1 – Cash and cash equivalents - Item 10
1.1 Cash and cash equivalents: Composition
a)
b)
PART B
INFORMATION ON THE BALANCE SHEET
10
Total 2009
331
Total 2010
10
Cash
Free deposits with central banks
216
206
341Total

Section 2 – Financial assets held for trading – Item 20
2.1 Financial assets held for trading: Composition by type
A
1
1.1
1.2
2
3
4
4.1
4.2
B
1
1.1
1.2
1.3
2
2.1
2.2
2.3
Legend:L1= Level 1L2= Level 2L3= Level 3
UCI= Undertakings in collective investments
64,378
3,493
Total 2010 Total 2009
Financial derivatives
Derivatives:
1,449
Other debt securities 113,797
L3Items / Values
Non-derivative assets
L2 L3
Other
For trading 1,449
L2
Connected at fair value option
Total (A) 114,068
113,797
3,493
L1 L1
Debt securities
Structured securities 0
63,630
59,109
4,521
Equity securities 271 748
Loans
Holdings in UCI
Other debt securities
Repo
3,493
Credit derivatives
For trading
Connected at fair value option
64,378
Other
3,493
Total (B) 1,449
Total (A+B) 114,068 1,449
67

A
1
a)
b)
c)
d)
2
a)
b)
3
4
a)
b)
c)
d)
B
a)
b)
999
1,449 3,493
115,517 67,871
748
Total (A)
- fair value
-
Total (A+B)
Total (B)
528
Derivatives
Other
- Insurance undertakings
- Financial companies
Banks
- fair value
-
Customers
2.2 Financial assets held for trading: Composition by class of debtor/issuer
- Non-financial companies
Other public-sector entities
Banks
- Other
Unit in UCI
Loans
Governments and central banks
Banks
Other issuers
Other public-sector entities
Banks
Other issuers
Equity securities
Non-derivative assets
Debt securities
Items / Values
Governments and central banks
Total 2010 Total 2009
113,797 63,630
748271
271
0
24,028
39,602
93,402
20,395
0 748
64,378
921 2,494
114,068
2,494
528 999
921
68

2.3 Financial assets held for trading: annual variation
A
B
B1
B2
B3
C
C1
C2
C3
C4
C5
D
Section 3 – Financial assets designated at fair value – Item 30
3.1 Financial assets designated at fair value: Composition by type
3.2 Financial assets designated at fair value: Composition by class of debtor/issuer
3.3 Financial assets designated at fair value: Yearly variations
Closing balance 113,797 271
Other variations
Sales
Opening balance
Increases
Decreases
Purchases
Variations (+) in FV
Other variation 562 77
35Variations (-) in FV 601
Transfers from other portfolios
63,746 55,699
54
1,823 324
69,909
63,630 748
120,076 55,334
118,199 55,010
Debt
securities
Redemptions 5,000
125,72055,811
EquitiesHoldings in
UCILoans Total
64,378
175,410
69
114,068

Section 4 – Financial assets available for sale – Item 40
4.1 Financial assets available for sale: Composition by type
1
1.1
1.2
2
2.1
2.2
3
4
4.1
4.2
4.2 Financial assets available for sale: Composition by class of debtor/issuer
1
a)
b)
c)
d)
2
a)
b)
3
4
a)
b)
c)
d)
4.3 Financial assets available for sale: assets subject to micro-hedging
Total 3,504 2,502
Other public-sector entities
- Other
Governments and central banks
Holdings in UCI
Other public-sector entities
Banks
Other issuers
- Insurance undertakings
- Financial companies
- Non-financial companies
Governments and central banks
Other public-sector entities
Banks
Other issuers
Structured
Debt securities
Items/Values
Other
Valued at cost
Structured
Equities
Holdings in UCI
Loans
Valued at fair value
63
L1 L2 L3 L1 L2 L3
2,621
64
64
2,621 315 2,439
63
504
Total 2010 Total 2009
2,4392,621 819
Others
Loans
Total 883 2,439
5 5
59 58
63
Equities 64 63
Banks
64
0 541
2,621 1,898
819
Total 2010 Total 2009
Debt securities 3,440 2,439
Items/Values
70
63

4.4 Financial assets available for sale: Yearly variation
A
B
B1
B2
B3
B4
B5
C
C1
C2
C3
C4
C5
C6
D
0Write-downs caused by impairment: 0
- booked to shareholders' equity
- booked to shareholders' equity
Variations (+) in FV
Debt
securities
Increases 4,812
Write-backs 1,314
Transfers from other portfolios
- booked to income statement 1,314
- booked to income statement 0
Transfers to other portfolios
Variations (-) in FV 0
Redemptions 552
Other variations (*) 3,498 1
Decreases
Sales
3,811 0
Purchases 0
Opening balance 2,439
EquitiesHoldings in
UCI
1
63
4,813
Loans Total
3,811
2,502
3,440 64
Other variations (**) 3,259 0
Closing balance
71
3,504
(*) Item B5 "Other variations" includes bad debts for debt securities and equities
amounting in total to EUR 2,808 mn, gross of adjustments
(**) The amount of EUR 1,128 mn refers to early repayment of the securitization
transaction in 1999 and concerns securities allocated to this portfolio written down
in previous years and entirely repaid. The amount is included in both "Write-backs"
(EUR 1,314 mn) and "Other variations" in Decreases ( EUR 3,259 mn).
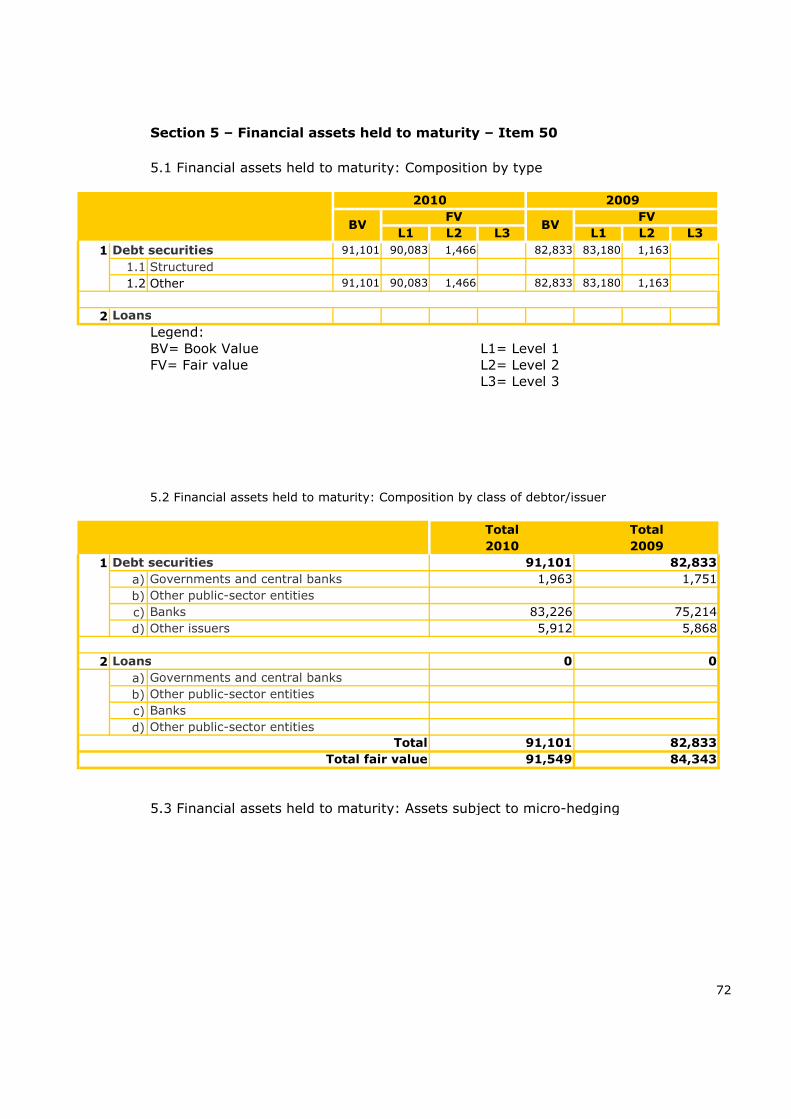
Section 5 – Financial assets held to maturity – Item 50
1
1.1 Structured
1.2 Other
2
Legend:BV= Book Value L1= Level 1FV= Fair value L2= Level 2
L3= Level 3
5.2 Financial assets held to maturity: Composition by class of debtor/issuer
1
a)
b)
c)
d)
2
a)
b)
c)
d)
5.3 Financial assets held to maturity: Assets subject to micro-hedging
Total fair value 91,549
82,833 83,180
0
Governments and central banks
Banks
Other public-sector entities
Other public-sector entities
Other issuers
Loans
Other public-sector entities
Banks
82,833
Total
2010 2009
1,7511,963
91,101
82,833 83,180 1,163
1,16390,083
Debt securities
Governments and central banks
L2
1,466
Loans
91,101
91,101
Debt securities
90,083 1,466
5,912
91,101 82,833
2010
L3
0
Total
L2 L3
5.1 Financial assets held to maturity: Composition by type
L1
2009
BVFV
L1
FV
5,868
84,343
72
75,214
Total
83,226
BV

A
B
B1 Purchases
B2 Write-backs
B3 Transfers from other
B4 Other variations
C
C1 Sales
C2 Redemptions
C3 Write-downs
C4 Transfers to other
C5 Other variations
D 91,10191,101
Opening balance
Increases
Decreases
Closing balance
0
1,665 1,665
1,915
75
7676
1,816
1,915
8,063
82,833
10,084
106
75
Debt securities Loans
5.4 Assets held to maturity: Yearly variations
10,084
73
106
82,833
8,063
Total
1,816
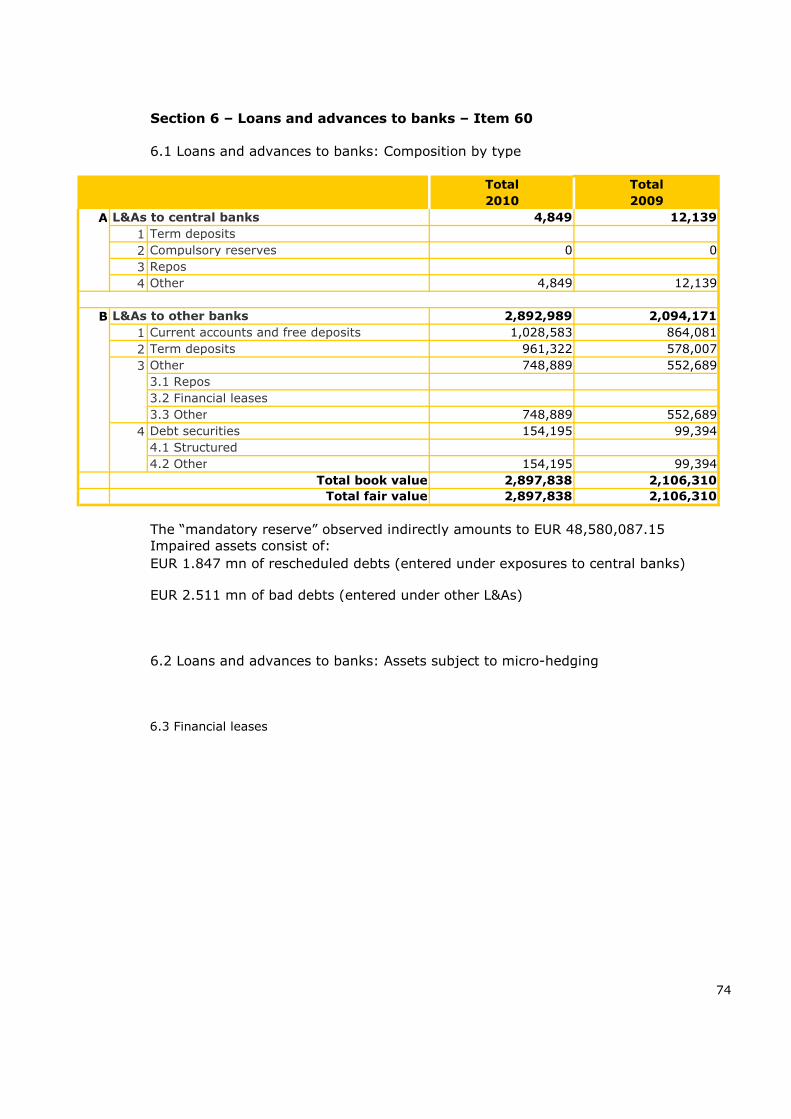
A
1
2
3
4
B
1
2
3
4
The “mandatory reserve” observed indirectly amounts to EUR 48,580,087.15Impaired assets consist of:
EUR 2.511 mn of bad debts (entered under other L&As)
6.2 Loans and advances to banks: Assets subject to micro-hedging
6.3 Financial leases
EUR 1.847 mn of rescheduled debts (entered under exposures to central banks)
3.1 Repos
99,394
Debt securities 154,195 99,394
4.1 Structured
3.2 Financial leases
3.3 Other 748,889 552,689
748,889 552,689
961,322
2,106,310
Term deposits
Compulsory reserves 0 0
Repos
864,081
Term deposits
154,195
Section 6 – Loans and advances to banks – Item 60
6.1 Loans and advances to banks: Composition by type
2009
Total
578,007
Other
Total book value 2,897,838 2,106,310
Other 4,849 12,139
4.2 Other
Total
2010
2,892,989 2,094,171
4,849
74
L&As to central banks
L&As to other banks
12,139
Current accounts and free deposits 1,028,583
Total fair value 2,897,838

1
2
3
4
5
6
7
8
8.1
8.2
1
a)
b)
c)
2
a)
b)
c)
7.3 Loans and advances to customers: Assets subject to micro-hedging
7.4 Financial leases
L&As to
200Total 210,175 100 167,904
89- Others 34,001 89 23,522
- Insurance companies
- Financial companies 28,521 24,308
200
- Non-financial companies 147,653 11 116,615 111
Others 210,175 100 164,445
Other public-sector entities 0 3,459
Governments
210,175 100 167,904 200
- Others
- Insurance companies
- Financial companies
- Non-financial companies
Other issuers
Other public-sector entities
Governments
Debt securities
Total book value
7.2 Loans and advances to customers: Composition by class of debtor/issuer
Total 2009
Bonis Impaired Bonis Impaired
Total 2010
167,904 200
210,175 100 167,904 200Total fair value
210,175 100
Other
Structured
Debt securities
Other 200,418 159,083
Factoring
Financial leases
86
Credit cards, personal loans and loans backed 2,114 1,759
Mortgages 6,890 89 6,117
114
Repos
Current accounts 753 11 945
Section 7 – Loans and advances to customers – Item 70
7.1 Loans and advances to customers: Composition by type
Total 2010 Total 2009
Bonis Impaired Bonis Impaired
75

Section 8 – Hedging derivatives - Item 80
8.1 Hedging derivatives: Composition by type of contract and underlying assets
8.2 Hedging derivatives: Composition by portfolio and type of hedging
9.1 Adjustments to hedged assets: Composition by portfolio hedged
9.2 Assets subject to macro interest rate risk hedging: Composition
Section 10 – Equity investments – Item 100
10.3 Equity investments: Yearly variations
10.4 Commitments relating to investments in subsidiaries
10.5 Commitments relating to investments in jointly controlled companies
10.1 Equity investments in subsidiaries, jointly controlled companies and companies
subject to significant influence
10.2 Equity investments in subsidiaries, jointly controlled companies and companies
subject to significant influence: Accounting data
10.6 Commitments relating to investments in companies subject to significant
influence
76
Section 9 - Adjustments to financial assets subject to macro-hedging - Item
90

Section 11 – Tangible fixed assets - Item 110
A
1.1
a)
b)
c)
d)
e)
1.2
a)
b)
c)
d)
e)
B
2.1
a)
b)
2.2
a)
b) buildings
Total (A+B) 24,982 25,671
Total (B)
77
land
Owned
electronic systems
other
buildings
movables
land
Leased 0 0
281
other 109 166
buildings
land
Leased
Assets held for investment
Total (A)
buildings 16,90816,352
24,982 25,671
332
electronic systems 53 62
movables
2009
land 8,187 8,203
24,982 25,671
Items/ValuesTotal Total
2010
11.1 Tangible fixed assets: Composition of assets carried at cost
Assets held for operational use
Owned
11.2 Tangible fixed assets: Composition of assets designated at fair value or
revalued

A Opening gross balance
A.1
A.2 Opening net balance
B Increases
B1 Purchases
B2
B3 Write-backs
B4
a) shareholders' equity
b) income statement
B5
B6 Transfers from assets held for investment
B7 Other increases
C Decreases
C1 Sales
C2 Depreciation
C3
a) shareholders' equity
b) income statement
C4
a) shareholders' equity
b) income statement
C5
C6 Transfers to:
a) shareholders' equity
b) income statement
C7 Other decreases
D Net closing balance
D1
D2 Gross closing balance
E Valuation at cost
11.4 Tangible fixed assets held for investment: Yearly variations
11.5 Commitments for purchases of tangible fixed assets (IAS 16/74.c)
53
15-
20-
25%
Depreciation rate applied
78
0% 3% 12% 20%
1,620
Total net write-downs
8,187 281
20,319
Negative changes in fair
value booked to:
Buildings Other
1,837 8,6063,359 1,239 2,171
84
16
25
27
608
Improvements capitalized
Forex gains
100 25
62 166 25,671
183
LandElectronic
systemsTotal
8,203 20,267 1,571
Movables
2,233 34,2772,003
Total net write-downs
91 49
332
49
8,203 16,908
91 27 18316
87216 647 100
84 817
55
Forex losses
109 24,982
109 24,982
3,967 1,339 2,196 1,921 9,423
8,187 16,352 281 53
2,030 26,218
16,352
39 0
Write-downs for impairment
booked to:
Positive changes in fair value
booked to:
2,249
16
11.3 Tangible fixed assets held for operational use: Yearly variations

Section 12 – Intangible fixed assets – Item 120
12.1 Intangible fixed assets: Composition by type
A1
A2
A2.1
A2.2
12.2 Intangible fixed assets: Yearly variations
A
A1
A2
B
B1
B2
B3
B4
B5
B6
C
C1
C2
C3
C4
C5
C6
D
D1
E Gross closing balance
F Valuation at cost
Net closing balance
Total net write-downs
Decreases
Opening balance
Increases
Positive changes in fair value booked to:
- income statement
2,219 2,219
79
2,219 2,219
2,219 2,219
Other decreases
Forex losses
- shareholders' equity
Negative changes in fair value booked to:
- income statement
- shareholders' equity
- devaluations
- amortization 698 698
Write-downs:
698
Sales
698
Other increases
Forex gains
- income statement
- shareholders' equity
Write-backs
2,569 2,569
Increases in internal assets
Purchases
348 348
2,569 2,569
Net opening balance
348 348
Total net write-downs
Total
Total 2,219 348
Other:
generated
externally
Limited Unl
b Other assets
a) Intangible assets developed in-house
Assets designated at fair value
b) Other assets 2,219 348
a) Intangible assets developed in-house
Assets valued at cost 2,219 348
2,219 348Other intangible assets
Total 2010 Total 2009
Limited
Life
Unlimited
Life
Limited
Life
Unlimited
Life
Goodwill
Unl
Good-
will
Other:
generated
in-house
Limited
Transfers to non-current assets being
divested

12.3 Other information
13.1 Pre-paid tax assets: Composition
1
2
3
4
5
13.2 Deferred Tax liabilities: composition
1
13.3 Changes in pre-paid tax assets: Contra-item in the income statement
1
2
2.1
2.2
2.3
3
3.1
3.2
3.3
4
Reductions in tax rates
Other increases
Income statement
Section 13 – Tax assets and tax liabilities - Item 130 (assets) and Item 80
(liabilities)
a) relating to earlier years
6
6
Pre-paid tax assets annulled during the year
Income statement
Shareholders' equity
Pre-paid tax assets recorded during the year
Total
31/12/2010
b) write-downs for intervening non-recoverability
a) reversals
253 6
253
4,588Closing balance 9,821
c) due to changes in accounting policies
d) others
Other decreases
5,486 1,708
89 112
Increases 5,486 1,708
2010
Opening balance 4,588
2009
Total
Decreases 253
5,486
b) due to changes in accounting policies
c) write-backs
d) other
New taxes or increases in tax rates
89 112
31/12/2010 31/12/2009
9,821
9,821
Other 345
Valuation reservesOther
9,476
Total 4,588
4,588
345
Total
4,243
31/12/2009
Loan lossesTax losses
2,886
1,708
80

13.4 Changes in deferred tax liabilities: Contra-item in the income statement
1
2
2.1
2.2
2.3
3
3.1
3.2
3.3
4
13.5 Changes in pre-paid tax assets: Contra-item in shareholders' equity
13.6 Changes in deferred tax liabilities: Contra-item in shareholders' equity
13.7 Other information
Section 14 – Non-current assets and groups of assets being divested andassociated liabilities – Item 140 (assets) and Item 90 (liabilities)
14.1 Non-current assets and groups of assets being divested: Composition by type
14.2 Other information
Deferred tax liabilities annulled during the year
a) reversals
112Closing balance 89
81
c)other
Other decreases
23 9
Reductions in tax rates
23 9
b) due to changes in accounting policies
Decreases 23 9
Other increases
New taxes or increases in tax rates
c) write-backs
121
Increases 0 0
Opening balance
Total
a) relating to earlier years
b) due to changes in accounting policies
d) other
112
Deferred tax liabilities recorded during the year
2010 2009
14.3 Information on holdings - not entered under shareholders' equity - in
companies subject to significant influence
Total

Section 15 – Other assets – Item 150
15.1 Other assets: Composition
1
2
3
4
Gold, silver and precious metals
Accrued income
2010 2009
1,061
1,061
Improvements to assets pertaining to third parties
Total 1,396
82
Total Total
Other (illiquid items, as yet unprocessed amounts) 1,396

83
LIABILITIES
1.1 Accounts payable to banks: Composition by type
1 Accounts payable to central banks
2 Accounts payable to other banks
2.1 Current accounts and free deposits
2.2 Term deposits
2.3 Loans
2.3.1 Repo
2.3.2 Other
2.4
2.5 Other liabilities
Total
Fair value
Accounts payable to banks
Subordinated Liabilities
Liabilities in respect of commitments to repurchase
own equity
110,672
1,942,765
886,432
1,000,766
176,741
2,380,598 2,119,506
1.4 Accounts payable to banks: Items subject to micro-hedging
1.5 Financial-leasing liabilities
77,851
1.3 Detail of item 10 “Accounts payable to banks”: Structured liabilities
77,851
Total 2009
831,327
Total 2010
1,207,099
2,380,598 2,119,506
1.2 Detail of item 10 “Accounts payable to banks”: Subordinated liabilities
Section 1 – Accounts payable to banks - Item 10
209,216
77,851 110,672
2,171,382
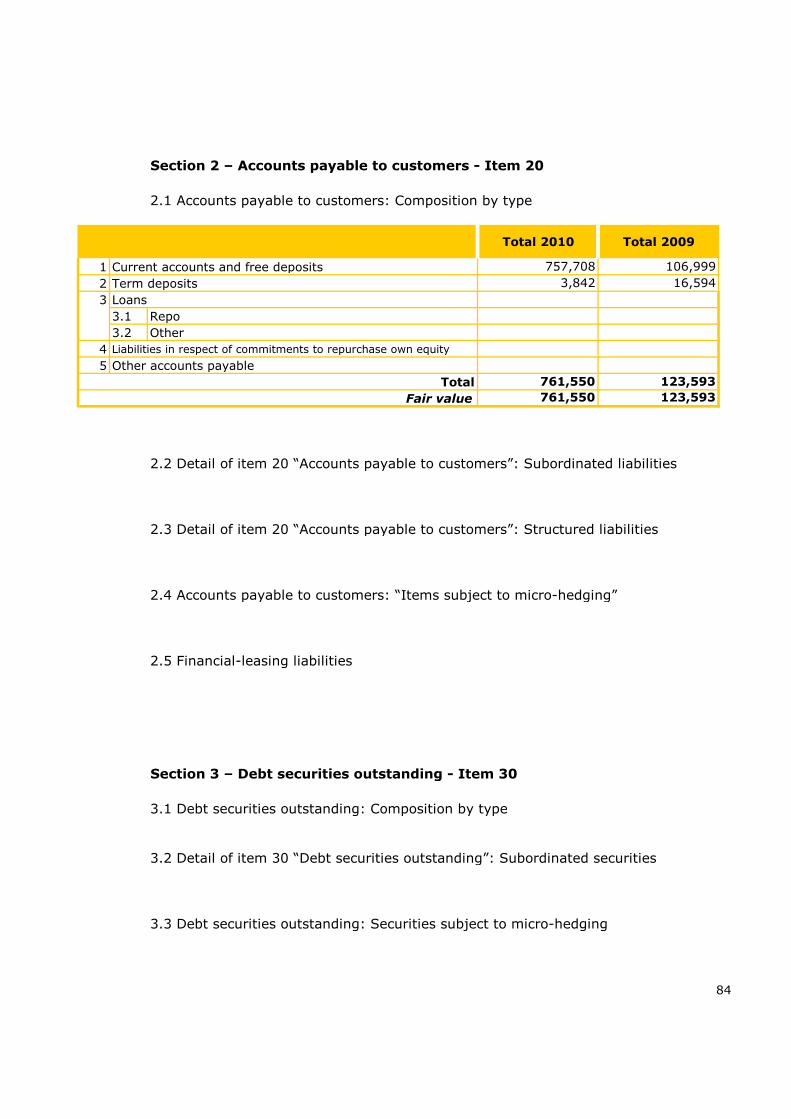
1 Current accounts and free deposits
2 Term deposits
3 Loans
3.1 Repo
3.2 Other
4 Liabilities in respect of commitments to repurchase own equity
5 Other accounts payable
Total
Fair value
Section 3 – Debt securities outstanding - Item 30
3.1 Debt securities outstanding: Composition by type
3.2 Detail of item 30 “Debt securities outstanding”: Subordinated securities
3.3 Debt securities outstanding: Securities subject to micro-hedging
2.2 Detail of item 20 “Accounts payable to customers”: Subordinated liabilities
2.3 Detail of item 20 “Accounts payable to customers”: Structured liabilities
2.4 Accounts payable to customers: “Items subject to micro-hedging”
2.5 Financial-leasing liabilities
761,550 123,593
761,550 123,593
757,708 106,999
3,842 16,594
2.1 Accounts payable to customers: Composition by type
Section 2 – Accounts payable to customers - Item 20
Total 2010 Total 2009
84
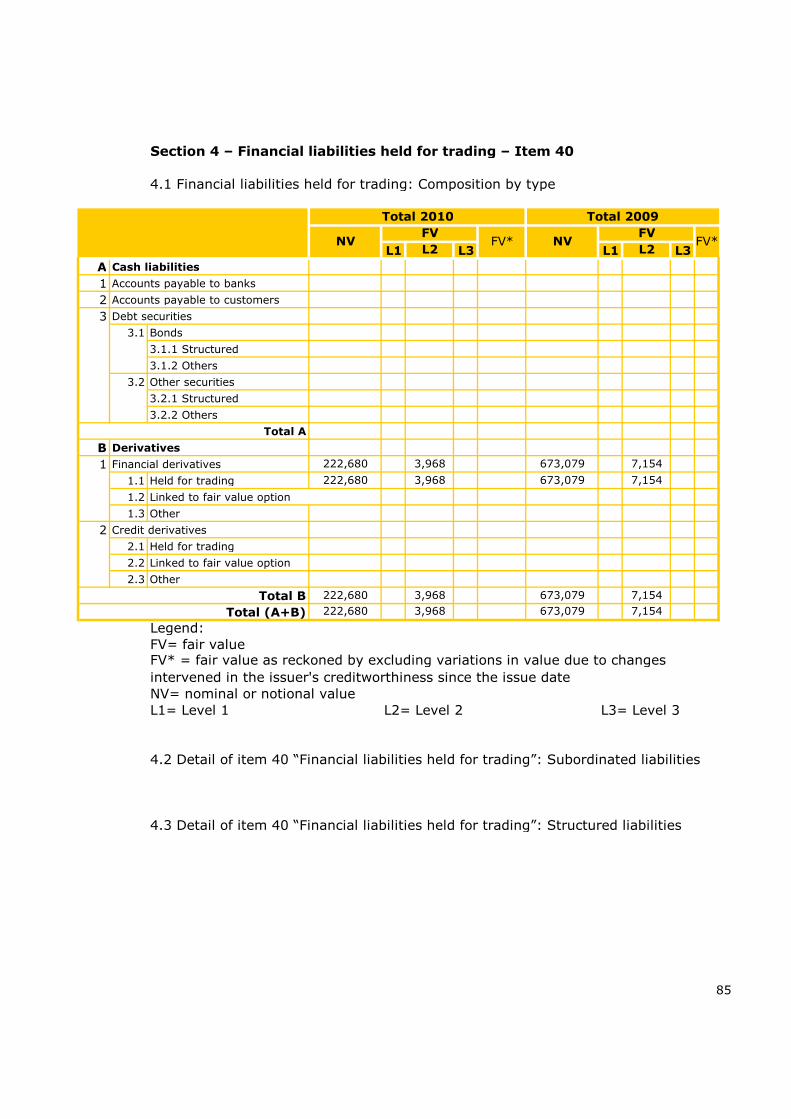
Section 4 – Financial liabilities held for trading – Item 40
4.1 Financial liabilities held for trading: Composition by type
L1 L3 L1 L3
A Cash liabilities
1 Accounts payable to banks
2 Accounts payable to customers
3 Debt securities
3.1 Bonds
3.1.1 Structured
3.1.2 Others
3.2 Other securities
3.2.1 Structured
3.2.2 Others
Total A
B Derivatives
1 Financial derivatives
1.1 Held for trading
1.2 Linked to fair value option
1.3 Other
2 Credit derivatives
2.1 Held for trading
2.2 Linked to fair value option
2.3 Other
Total B
Total (A+B)
Legend:FV= fair value
NV= nominal or notional valueL1= Level 1 L2= Level 2 L3= Level 3
4.2 Detail of item 40 “Financial liabilities held for trading”: Subordinated liabilities
4.3 Detail of item 40 “Financial liabilities held for trading”: Structured liabilities
Total 2010
FV*NVFV
L2
FV* = fair value as reckoned by excluding variations in value due to changes
intervened in the issuer's creditworthiness since the issue date
7,154
7,154
673,079
673,079
3,968
3,968
7,154
3,968
NVFV
L2
3,968
673,079
222,680
222,680
222,680 7,154
85
222,680 673,079
FV*
Total 2009

A
B
B1
B2
B3
B4
C
C1
C2
C3
C4
D
Section 5 – Financial liabilities designated at fair value – Item 50
5.1 Financial liabilities designated at fair value: Composition by type
5.3 Financial liabilities designated at fair value: Yearly variations
Section 6 – Hedging derivatives - Item 60
6.1 Hedging derivatives: Composition by type of contract and underlying assets
6.2 Hedging derivatives: Composition by portfolio and type of hedging
4.4 Cash liabilities (except “technical overdrafts”) held for trading: Yearly variations
Total
Opening balance 4,935 2,219 7,154
Due to
customersDue to banks
1,528
3,968
0
4,714
490
Closing balance 3,686 282
Negative changes in fair value
642 282
Redemptions 2,005 2,219
Sales
Positive changes in fair value
Other increases
604
924
604
490
Other decreases
Decreases 2,495 2,219
Increases 1,246 282
Securities
outstanding
Issues
0
4,224
Purchases
5.2 Detail of item 50 “Financial liabilities designated at fair value”: Subordinated
liabilities
86

7.1 Adjustment to hedged liabilities: Composition by portfolio
7.2 Liabilities macro-hedged against interest rate risk: Composition
Section 8 – Tax liabilities – Item 80
See Assets, section 13
Section 9 – Liabilities associated with assets held for divestment – Item 90
See Assets, section 14
Section 10 – Other liabilities – Item 100
10.1 Other liabilities: Composition
1
a Contingent exposures
b Credit derivatives
c Irrevocable commitments to disburse funds
2
3
4
Total
Payment agreements based on own shares
Accrued expenses
Other liabilities (illiquid items, amounts available for
customers)
3,713Liabilities arising from the impairment of: 7,697
3,713 7,697
8,7327,854
11,567 16,429
Total 2010 Total 2009
Section 7 – Adjustment to financial liabilities subject to macro-hedging –
Item 70
87

Section 11 – Staff severance fund - Item 110
11.1 Staff severance fund: Yearly variations
A Opening balance
B Increases
B.1 Provisioning for the year
B.2 Other increases
C Decreases
C.1 Severance payments
C.2 Other decreases
D Closing balance
Total
11.2 Rates
11.3 Reconciliation of actuarial valuations under IAS 19
Opening balance
Realignment
Pension cost
Financial charges
Benefits paid
Transfers
Expected liabilities
Actuarial loss
Closing balance
2,213 2,522
2,129 2,446
(84) (76)
(319) (146)
86 113
2 37
2 37
Total 2010 Total 2009
2,446 2,555
2,129 2,446
n.a.
3.00%
n.a.Real annual salary increase rate
2,446 2,555
319
319 146
146
2.00%
Total 2010
Annual technical depreciation rate
Overall annual salary increase rate
Annual inflation rate
Total 2009
Gross annual SSF increase rate
4.40%
88
2,4462,129

11.4 Other information
Provisioning for the year
Pension costs
Financial charges
Actuarial loss
Other
Section 12 – Provisions for risks and charges – Item 120
12.1 Provisions for risks and charges: Composition
1 Company pension plans
2 Other provisions for risks and charges
2.1 Litigation
2.2 Staff charges
2.3 Other
12.2 Provisions for risks and charges: Yearly variations
A Opening balance
B Increases
B.1
B.2
B.3
B.4
C Decreases
C1
C2
C3
D Closing balance
Amount drawn during the year
Variations due to changes in discount rate
Other decreases
Provisioning for the year
Variations due to the passing of time
Variations due to changes in discount rate
Company
pension
funds
Other
provisionsTotal
476
152
Other increases
476
152
152
162
466
162
162
466
Total 2010 Total 2009
466 476
466 476
86
(84)
466 476
2
89

12.3 Company defined-benefit pension funds
1. Description of funds
2. Changes in funds during the period
3. Changes in plan assets and other information during the period
5. Description of main actuarial assumptions
6. Comparative data
12.4 Provisions for risk and charges – other provisions
Other
Total
Section 13 – Insurance reserves - Item 140
13.1 Insurance reserves: Composition
Provision for unenjoyed staff holidays
466
466
4. Reconciliation between the fund’s present value, the present value of the plan assets and
the assets and liabilities recorded in the balance sheet
90

14.1 “Share capital” and “Treasury stock”: Composition
1234567
Section 14 – Shareholders’ equity - Items 130, 150, 160, 170, 180, 190,
200
Items / Values Total 2010 Total 2009
Share capital 151,061 151,061
16,702
733 285
25,418 17,333
Valuation reserves
Share premium accountReservesCapital instruments(Treasury stock)
16,702
202,315 193,466
8,401
Total8,085Profit (Loss) for the year
91

14.2 Share capital: Yearly variations in number of shares
A Shares at start of year
A1
A2
B Increases
B1
B2
B3
C Decreases
C1
C2
C3
C4
D Shares outstanding: Fiscal closing balance
D1
D2
Each of the Bank's 1,373,280 shares has a face value of EUR 110.
14.3 Share capital: Other information
Other decreases
Treasury stock(+)
- other
rights issues:
bonus issues:
Sale of treasury stock
- conversion of bonds
- exercise of warrants
- for employees
- for directors
1,373,280
1,373,280
1,373,280
1,373,280
0
0
- not fully paid up
Shares at end of year
- fully paid up
Other increases
Cancellations
Purchase of treasury stock
Disposal of companies
Other
0
- fully paid up
- not fully paid up
1,373,280
Treasury Stock
Shares outstanding: Opening balance
Common
New share issues
- combination of companies
0
0
92
1,373,280
The Bank does not hold any treasury stock.
Shareholders hold 888,004 warrants (2001-2011) entitling them to buy up to
888,004 shares at face value. As of 31.12.2010, warrants had been exercised rights
for a total of 111,996 shares.

14.4 Profit reserves: Other information
Legend:A= capital increaseB= cover for lossesC= distribution to shareholders
14.5 Stock: Composition and yearly variations
14.6 Valuation reserves: Composition
Share capital
Reservesa) Legal Reserveb) Extraordinary Reserve
Share premium accountCapital Reserves
AmountOptions for
allocation
Available
portion
Allocations over
past three years
Amount not allocatableTotalOther Reserves
c) FTA/IFRS reservesd) retained profitIFRS 2005e) retained profit
16,702
9,703 B
16,702
151,061
16,702 A,B,C17,738
9,2987,730 A,B,C 7,730
(95)400
A,B,C
34,44010,008
Amount allocatable 24,432
93

94
Other information
1 Guarantees issued and commitments
1) Financial guarantees issued
a) to banks
b) to customers
2) Commercial guarantees issued
a) to banks
b) to customers
3) Irrevocable commitments to disburse funds
a) to banks
i) draw-down certain
ii) draw-down uncertain
b) to customers
i) draw-down certain
ii) draw-down uncertain
4)
5)
6) Other commitments
2 Assets pledged as collateral for own liabilities and commitments
3 Information on operational leasing
Total
Assets pledged as collateral for third-party liabilities
1,391,234 1,639,037
Commitments underlying credit derivatives: hedging
sales
67,992
749,587
67,992
0
0
0
67,992
16,248
0
1,306,994
557,407
4,489
76,593
76,593
669,796
166,691
90,098
85,609
48
8,496
1,463,802
794,006
Total 2010 Total 2009
8,54416,248
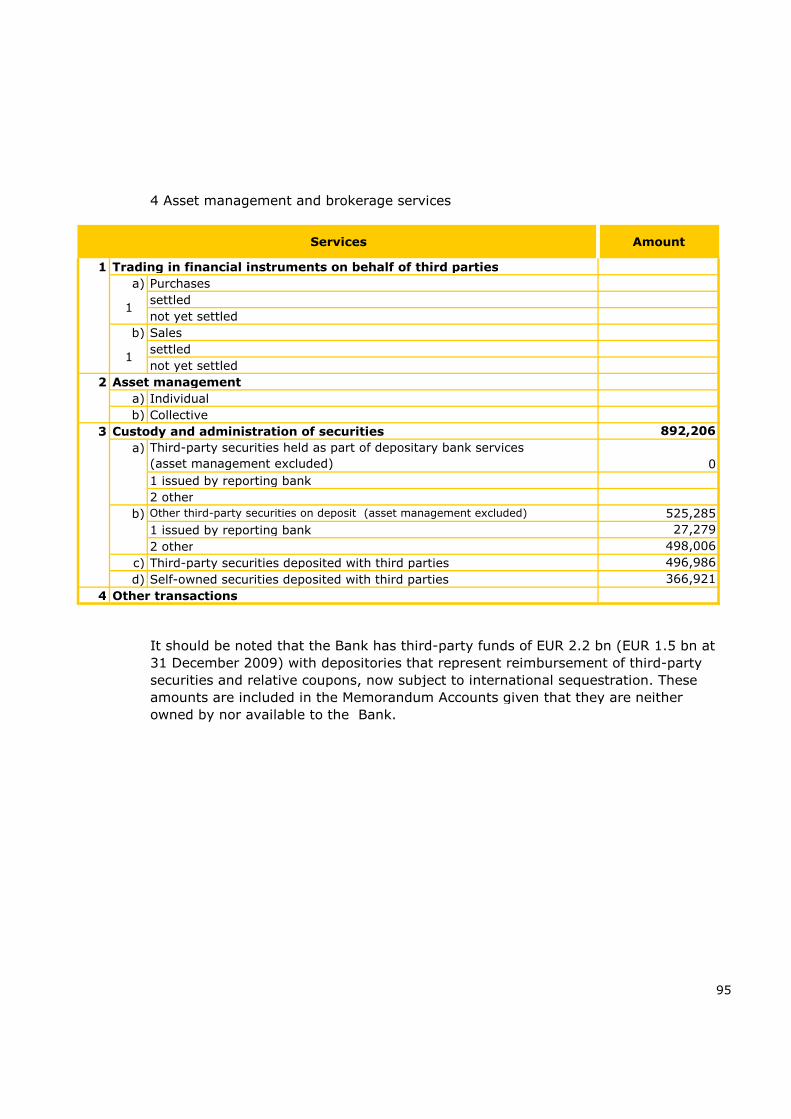
4 Asset management and brokerage services
1 Trading in financial instruments on behalf of third parties
a) Purchases
settled
not yet settled
b) Sales
settled
not yet settled
2 Asset management
a) Individual
b) Collective
3 Custody and administration of securities
a)
1 issued by reporting bank
2 other
b)
1 issued by reporting bank
2 other
c) Third-party securities deposited with third parties
d) Self-owned securities deposited with third parties
4 Other transactions
0
Third-party securities held as part of depositary bank services
(asset management excluded)
892,206
27,279
498,006
496,986
366,921
Services
1
1
95
Amount
It should be noted that the Bank has third-party funds of EUR 2.2 bn (EUR 1.5 bn at
31 December 2009) with depositories that represent reimbursement of third-party
securities and relative coupons, now subject to international sequestration. These
amounts are included in the Memorandum Accounts given that they are neither
owned by nor available to the Bank.
Other third-party securities on deposit (asset management excluded) 525,285

96
Section 1 - Interest - Items 10 and 20
1.1 Interest and similar income: Composition
1
2
3
4
5
6
7
8
1.2 Interest and similar income: Hedging differentials
Interest income from impaired L&As to customers amounted to EUR 20,427 for 2010
compared to EUR 19,436 for 2009.
Interest income from impaired L&As to banks amounted to EUR 19,606 for 2010 compared to
EUR 18,844 for 2009.
62,081
LoansOther
assets
Total
2010
Total
2009
335
2,977
49,667
6,922
30,514 37,309
25,305
6,795
7,226
321
2,825 2,825
321
7,226
23,2882,017
Financial assets designated at fair value
Financial assets disposed of but not
Total
Financial assets available for sale
Financial assets held to maturity
L&As to banks
L&As to customers
Hedging derivatives
PART C
INFORMATION ON THE INCOME STATEMENT
1,632 2,180Financial assets held for trading
Debt
securities
1,632

1.3 Interest and similar income: other information
1.3.1 Interest income from financial assets denominated in foreign currency
1 Financial assets held for trading
2 Financial assets available for sale
3 Financial assets held to maturity
4 L&As to banks
5 L&As to customers
6
7 Hedging derivatives
8
9 Other assets
1.3.2 Interest income from leasing transactions
1.4 Interest charges and similar expenses: Composition
1
2
3
4
5
6
7
8
1.5 Interest charges and similar expenses: Hedging differentials
97
12,084 34,668
0
Accounts payable to customers 896
Securities outstanding
896 777
607 15,886
10,581 18,005
Total
2009
Accounts
payableSecurities
Other
liabilities
Total
2010
Total
2009
2,266
13,283
123
186
6
248
103
10,6059,659
1,611
Impaired
assets
11,321
Other
assets
109
Total
2010
70
9,640
1,611
Performing assets
LoansDebt
securities
11,251
6
197
109
Financial assets disposed of but
not derecognized
Financial assets designated at
fair value
51
19
Total 312
Financial liabilities held for trading
Accounts payable to central banks 607
Accounts payable to banks 10,581
0
Hedging derivatives
Total 12,084
Financial liabilities designated at FV
Other liabilities and allowances

1.6 Interest charges and similar expenses: Other information
1.6.1 Interest charges on liabilities denominated in foreign currency
1
1
2
3
4
5
7
8
1.6.2 Interest charges on leasing transactions
Financial liabilities designated at fair value
98
8,073 6,037
Other liabilities and allowances
Hedging derivatives
Accounts payable to customers 378
Securities outstanding
378 356
114 258
7,581 5,423Accounts payable to banks 7,581
SecuritiesOther
liabilities
Total
2010
Total
2009
Accounts
payable
Accounts payable to central banks 114
Financial liabilities held for trading
Total 8,073

Section 2 - Commission income and expense - Items 40 and 50
2.1 Commission income: Composition
a)
b)
c)
1 trading in financial instruments
2 forex
3 asset management
3.1 individual
3.2 collective
4 custody and administration of securities
5 depositary bank services
6 placement of securities
7 collection of orders
8 advisory services
8.1 in matters of investment
8.2 in matters of financial structure
9 distribution of third-party services
9.1 asset management:
9.1.1 individual
9.1.2 collective
- insurance products
- other products
d)
e)
f)
g)
h)
i)
j) Other services
2.2 Commission income: distribution channels of products and services
99
324 432
0
0
Guarantees issued
Credit derivatives
22,643 25,223
1,573 422
122
Total 2010 Total 2009
24,805 26,199
1 1
Total
Keeping and management of current accounts
Management, brokerage and advisory services
Tax and debt collection services
Management of multilateral trading services
Securitization servicing
Factoring services
Collection and payment services
2,019 854
44
142 121

2.3 Commission expense: Composition
a)
b)
c)
1
2
3
4
5
6
d)
e)
Section 3 – Dividends and similar income – Item 70
3.1 Dividends and similar income: Composition
A
B
C
D
100
Financial assets held for trading
Total
Total 2009
Dividends
229
Financial assets available for sale
Financial assets designated at fair value
Equity investments
Income from
investment
funds
Income from
investment
funds
9
Total 2010
Dividends
22
Guarantees received 2,556 3,889
Credit derivatives
Management and brokerage services 193 249
trading in financial instruments 193 248
asset management
3.2 third-party portfolios
Other services 271
off-premises distribution of securities, products and
services
Total 2010
Collection and payment services
3.1 own portfolio
forex
placement of securities
custody and administration of securities
Total 4,318
Total 2009
180
0 1
3,020

Section 4 – Net trading income – Item 80
4.1 Net trading income: Composition
1 Financial assets held for trading
1.1 Debt securities
1.2 Equities
1.3 Holdings in UCI
1.4 Loans
1.5 Other
2 Financial liabilities held for trading
2.1 Debt securities
2.2 Other
3
4 Derivatives
4.1 Financial derivatives:
- other
4.2 Credit derivatives
Section 5 – Net income from hedging activities – Item 90
5.1 Net income from hedging activities: Composition
Section 6 – Net income from disposals and repurchases – Item 100
6.1 Net income from disposals and repurchases: Composition
7.1 Net result from financial assets/liabilities designated at fair value: Composition
333 (114)
- on foreign currencies and gold
1,177 4,224 923 3,302 1,176
- on equities and equity indices
101
(1,050)
(1,050)
Total
Section 7 – Net result from financial assets/liabilities designated at fair value –
Item 110
2,181 5,3055,997
Other financial liabilities: forex
differentials
- on debt securities and interest
rates
1,260
83
1,545
323
622 2,277 (2,112)
Net
Income
[(A+B)-(C+D)]
6,032
624
213
5,912
5,912
5,195
77
Trading
losses
(D)
85
8
1,545
35
Capital
losses
(C)
636
601
5,147
11,846
5,147
704
219
Capital
gains
Trading
gains
(B)(A)
6,699
1,179
325
5,195
1,314
1,260
54
54

Section 8 – Net impairment adjustments – Item 130
8.1 Net impairment adjustments to loans and advances: Composition
A B A B
A 586 18,970 224 0 (19,332) (8,016)
586 18,460 224 0 (18,822) (7,092)
510 (510) (924)
B 4 18 393 101 0 (314) 226
4 18 393 101 0 (314) 226
0
C 4 604 19,363 325 0 (19,646) (7,790)
A 0 1,180 (396)
B
C
D L&As to banks
E L&As to customers
F 0 1,180 (396)
Legend:
A = from interest
B = other write-backs
102
Total 1,314
Others
134
134
1,314Debt securities
Equities
Holdings in UCI
Total
2010
Total
8.2 Net impairment adjustments to financial instruments available for sale: Composition
Total
2009
Specific Specific
A Bwrite
-offs
Write-downs (1) Write-backs (2)
- Securities
L&As to customers
- Loans
- Securities
write
-offsOthers
L&As to banks
- Loans
Total
2010
Total
2009
SpecificSpecific PortfolioPort-
folio
Write-downs (1) Write-backs (2)

8.3 Net impairment adjustments to financial instruments held to maturity: Composition
A B A B
A 76 106 30 (507)
B
C
D Total 76 106 30 (507)
Legend A = from interest B = other write-backs
8.4 Net impairment adjustments to other financial instruments: Composition
A B A B
A 213 0 439 3,758 3,984 (6,419)
B
C
D
E Total 213 0 439 3,758 3,984 (6,419)
103
Write-downs (1) Write-backs (2)
Guarantees issued
Credit derivatives
Total
2010
Other instruments
Commitments to
disburse funds
L&As to customers
Total
2009
SpecificPort-
folio
Specific Portfoliowrite
-offsOthers
Total
2010
Securities
L&As to banks
Total
2009
SpecificPort-
folio
Specific Portfoliowrite
-offsOthers
Write-downs (1) Write-backs (2)

Section 9 – Administration expenses – Item 150
9.1 Personnel expenses: Composition
1
a)
b)
c)
d)
e)
f)
g)
h)
i)
2
3
4
5
6
9.2 Average number of staff: Breakdown by category
a)
b)
c)
9.3 Company defined-benefit pension funds: Total cost
1,778 1,618
595 40
163 178
72
104
160
Other staff 84
Staff
Expenses reimbursed for staff seconded from other
institutions
Expenses recouped for staff seconded to other
institutions
Allocations to the provision for pensions and
similar liabilities:
Payments to external complementary pension
funds:
Costs arising from agreements to make
payments in own equity instruments
Non-salaried personnel
Other benefits to staff
- defined benefit
- defined contribution
14,042 13,545
9,081 8,825
Pension payments
(*) This table conventionally includes compensation paid to the Bank's Statutory Auditors
(EUR 120,000 for 2010 against EUR 119,000 for 2009) which is recorded in the Income
Statement under “Other administration expenses”.
Directors (*) 1,215 1,045
Retired personnel
Total 15,420
Allocations to the staff severance fund
- defined contribution
- defined benefit
68
Total
Executive cadres
Senior managers
14,768
2,520 2,466
4
596
Wages and salaries
Social security contributions
Severance payments
Total 2010 Total 2009

9.4 Other staff benefits
9.5 Other administration expenses: Composition
Section 10 – Net provisioning for risks and charges – Item 160
10.1 Net provisioning for risks and charges: Composition
105
Total 2010 Total 2009
Litigation
(1) amounts include compensation paid to the Statutory Auditors (as entered by
convention in Table 9.1 under “Directors”)
Total 152 251
Other risks and charges 152 251
Total 8,174 8,447
Other (1) 319 318
Insurance premiums 102 109
276
182
Indirect duties and taxes 277
Advertising 149
- other
It expenses
Expenses for movable/immovable property:
- rentals and other fees 129 111
Expenses for professional services
Expenses for the purchase of goods and non-
professional services
2,257 2,322
2,788 2,886
Early retirement payments 195 286
772 1,004
Total 2010 Total 2009
1,381 1,239
Other payments 1,583 1,332
1,778 1,618
Total 2010 Total 2009

Section 11 – Net adjustments to tangible fixed assets - Item 170
11.1 Net adjustments to tangible fixed assets: Composition
A
A1
A2
Section 12 – Net adjustments to intangible fixed assets – Item 180
12.1 Net adjustments to intangible fixed assets: Composition
A
A1
A2
Section 13 – Other operating income / charges – Item 190
13.1. Other operating charges: Composition
106
Total 2010 Total 2009
Total 261 373
Other operating charges 261 373
Net result
(a+b-c)
698
Owned 698 698
- developed in-house
Total 698
- otherLeased
698 698
Total
Write-backs
( C)
Depreciation
(a)
Impairment
write-downs
(b)
Write-backs
( C)
Intangible fixed assets
Tangible fixed assets
817
Net result
(a+b-c)
817 817
817
Owned
- used in operations
Impairment
write-downs
(b)
Depreciation
(a)
- held for investment
- used in operations
Leased
817
- held for investment
817

13.2. Other operating income: Composition
Section 14 – Gains (losses) from equity investments - Item 210
14.1 Profit (loss) from equity investments: Composition
15.1 Net adjustments to fair value of tangible and intangible assets: Composition
Section 16 – Adjustments to goodwill – Item 230
16.1 Adjustments to goodwill: Composition
Section 17 – Gains (losses) from the disposal of investments - Item 240
17.1 Gains (losses) from the disposal of investments: Composition
107
Rentals and fees 111 111
Income from IT services rendered:
Duties and taxes recouped 26 28
Total 2010 Total 2009
- to companies within the banking group
- to others
Expenses recouped:
- for own staff seconded to third parties
- on deposits and current accounts 684 1,792
- other 808 1,147
SSF attribution to profit and loss 63 17
Other income 390 153
Total 2,082 3,248
Section 15 – Net adjustments to fair value of tangible and intangible assets – Item
220

Section 18 – Income tax for the year on continuing operations – Item 260
18.1 Income tax for the year on continuing operations: Composition
1
2
3
4
5
6
18.2 Reconciliation of theoretical tax liability and actual book liability
Section 19 – Net profit (loss) from groups of assets being divested - Item 280
19.1 Net profit (loss) from groups of assets being divested: Composition
19.2 Breakdown of income tax in respect of groups of assets/liabilities being divested
Section 20 – Other information
108
(9,660)
Total taxes 6,194 9,660
Net profit 8,401 8,085
IRAP adjustments for write-offs 755 800
Taxes on non-deductible costs 5,200 3,891
Theoretical IRES and IRAP due (32.32%) 4,717 5,735
IRAP adjustments for administration expenses 778 941
Total 2010 Total 2009
Profit before tax 14,595 17,745
Variation in deferred taxes (+/-) 23 9
Income tax for the year (-)
(-1+/-2+-3+/-4+/-5) (6,194)
Current tax rebate for the year (+)Variation in pre-paid taxes (+/-) 5,233 1,702
Total 2010 Total 2009
Current tax (-) (11,450) (11,371)
Variations in current tax for prior years (+/-)
Pre-paid and deferred taxes (5,256) (1,707)

Section 21 – Profit per share
21.1 Average number of diluted common shares
21.2 Other information
Profit per Shares 6.12 5.89
109
Net profit 8,401 8,085
Number of Shares 1,373,280 1,373,280
Amount 2010 Amount 2009

110
10
20
30
40
50
60
70
80
90
100
110
120 8,849 146 8,703
302Other sources of income 448 146
Comprehensive Net Income
b) income statement reversals
- from impairment
- from disposals
c) other adjustments
c) other adjustments
a) fair-value adjustments
c) other adjustments
Non-current assets earmarked for disposal:
a) fair-value adjustments
b) income statement reversals
Share of valuation reserves booked to shareholders’
equity:
Actuarial profit (loss) on defined-benefit plans
c) other adjustments
Forex differentials:
a) value adjustments
b) income statement reversals
c) other adjustments
Hedging of financial flows:
a) fair-value adjustments
b) income statement reversals
Intangible assets
Hedging of foreign investments:
a) fair-value adjustments
b) income statement reversals
- from impairment
- from disposals
c) other adjustments
Tangible assets
Net profit (loss)
Financial assets available for sale:
a) fair-value adjustments
b) income statement reversals
448 146 302
8,401 8,401
448 146 302
Net AmountIncome
Taxes
Gross
Amount
PART D
COMPREHENSIVE NET INCOME DETAIL

Section 1 – Credit
QUALITATIVE INFORMATION
PART E
RISKS AND THEIR COVERAGE 111
1. General aspects
The Bank's policy for monitoring and managing credit risk is set out in a framedirective approved by the Board of Directors which defines:
the identity and powers of the bodies and officials authorized to extend credit; the process for selecting and evaluating credit facilities; the criteria for allocating exposure by debtor, country and business sector; procedures for monitoring and enforcing compliance with the Basel 2, Pillar I
capital requirement against credit risk and central bank directives on largeexposures;
operating limits on debt exposures as weighted by risk size and type and bydebtor category, country of residence and business sector.
The adequacy of the criteria and policies adopted for managing credit risk isevaluated annually by the Board of Directors, which makes reference to current andprospective exposure data supplied by the Bank's Risk Management unit.
The Bank's mission is to promote and develop all manner of financial, commercialand industrial relations in the international sphere. Business activities are targetedprimarily, though not solely, at supporting the relations of Mediterranean andMiddle Eastern countries with Europe and the rest of the world. Fulfilling thatmission, as Banca UBAE has been doing for over three decades, implies theadoption of stringently professional borrower-selection and credit policies.
The emphasis is on financing trade transactions across the Bank's region ofinterest, where beneficiaries may be resident or non-resident, bank or non-bankenterprises. The commercial nature of such transactions is reflected in the type ofcredit facilities granted as well as in the beneficiary's overall business approach asassessed by Banca UBAE.
The extension of purely financial credit lines to parties other than target-countrybanks is subject to qualitative and quantitative constraints. Each year, in particular,the Board of Directors sets individual risk-weighted exposure limits for specificcountries and types of credit facility on the basis of detailed scenario analyses andin conformity with sound and prudent management principles.

112
[1] Instead of an additional capital requirement, the other “quantifiable” risk, i.e., liquidity risk, is managed by a
combination of means including construction of a maturity ladder, stress testing, and the formulation of in-house policies
and contingency plans.
As regards prudential regulations in force, UBAE has equipped itself with thenecessary tools/procedures to calculate overall internal capital and evaluate theBank's capital adequacy.
Regulations prescribe that methods used for calculating capital requirementsagainst market, credit and operational risks (Pillar I) will vary according to a bank'ssize and complexity, as well as with the supervisory authorities' own assessment.
UBAE has adopted the “standardized” method for calculating the capitalrequirement against credit risk and must follow the Basic Indicator Approach forcalculating the requirement against operational risks. The requirement againstmarket risks in the trading book will continue to be calculated by the currentmethod.
Basel 2 has also introduced a “supervisory review process” whereby individualbanks will have to estimate their own overall capital adequacy in relation to othertypes of risk not addressed under Pillar I. The estimate will be reviewed by Bancad’Italia, who may ask a bank to take corrective action and/or impose additionalcapital requirements (Pillar II).
The supervisory review process thus comprises two distinct phases: an internalcapital adequacy process (ICAAP) which is a matter for banks, and a supervisoryreview and evaluation process (SREP) administered by Banca d’Italia.
The principle of proportionality governing the entire arrangement stipulates thatrisk management procedures, internal control mechanisms, economic capitalvaluation methods, and the frequency and depth of central bank reviews will varyin accordance with the nature, size and operational complexity of each institution.
Banca d’Italia has divided banks and assimilated financial institutions into threegroups for the purposes of compliance with Pillar II. UBAE belongs to Group 3,representing banks that adopted the standardized method under Pillar I and whosegross assets are less than EUR 3.5 bn. Group 3 banks will adopt simplified methodsfor evaluating the various other risks addressed by Pillar II. Among these, creditconcentration risk (as linked to individual borrowers or groups of relatedborrowers) and interest rate risk in the banking book will be calculated by amethod entailing additional capital requirements with respect to Pillar I (1)

113
The Bank's 2010 ICAAP report (compiled on year-end data) will be delivered to Bancad’Italia by 30 April 2011.
As regards the public disclosure of information on exposure to specified riskcategories (Pillar III), the Bank will post the relevant qualitative and quantitativecharts and tables on its corporate website (“Financials” section) by the deadlineapplying to the publication of its financial statements.
2. Policies for Managing Credit Risk
2.1 Organizational aspects
On the Credit Committee's proposal (as based on an opinion from the competentunits), the Board of Directors or the Executive Committee resolves annually on theextension of credit facilities to eligible parties. In doing so the BD/EC will specify:
the risk group to which the prospective beneficiary belongs; the Bank's maximum risk-weighted exposure; the technical format(s) in which facilities may be authorized (including their validity
and the characteristics of acceptable guarantees) and the exposure that will resultfrom the weighting system adopted.
Technical formats include financial-market transactions (deposits and forex) and thepurchase of bonds for the HTM portfolio.
In approving facilities in favour of banks from countries lacking an investment graderating, the Board of Directors will pass a single resolution stipulating risk-weightedexposure sub-limits for each bank concerned.
The General Manager will proceed each year to assign the Treasury Division itsannual VaR, consisting of a maximum weighted-exposure limit for risks taken on fromclients or groups of connected clients in favour of whom the Board of Directors hasapproved credit facilities.
For each department within the Treasury Division, the General Manager will specify:
a list of clients and/or groups of clients, their respective risk groups and riskceilings;
the individual risk ceilings assigned to the Treasury Division expressed inpercentage terms;
a breakdown by technical format, expressed in percentage terms, of the TreasuryDivision's risk ceilings.
Provided he cites clear risk-containment reasons and notifies the Board of Directorsof his decision, the General Manager may order the curtailment of any risk positionsopened by the Treasury Division with a client or group of connected clients, eventhough they fell within the previously established risk limits.

1142) In order to be prudent the Bank has fixed a lending limit below the regulatory level.
The Risk Management unit performs daily checks to ensure lending limits applyingto the recipients of facilities from the Treasury Division are duly observed, while theprogress of exposures is a matter for a separate function within the Credit Division.
Facilities granted to any one client or group of connected clients will not, in anycase, exceed the lending limit established by existing regulations on largeexposures, as calibrated to the Bank's eligible capital (2).
Where VaR would exceed the limit set by the resolution granting any given creditfacility, the Internal Regulations will apply with regard to who may authorize suchVaR and within what quantitative and temporal limits.
2.2 Measuring, managing and monitoring credit risk
In reviewing a request for the extension or revision of credit facilities, the CreditProcessing Department assign or adjust the beneficiary's credit access score, whichis a condensed creditworthiness assessment.
The score is arrived at through a dedicated software product enabling a comparisonbetween the financials of the proposed borrower and those contained in variousdatabases for similar banking and non-banking, domestic and foreigncounterparties. Though based on peer analysis, the final score may take intoaccount the analyst's own evaluation of the borrower from an organizational orother qualitative standpoint. The weighting of each factor contributing to the finalscore is the result of a tried and tested methodology which the Bank has refinedover the years.
Assigning a credit access score enables the Bank to place borrowers inhomogeneous risk classes, hence adopt risk-weighted pricing models and obtain aready picture of the overall quality of the loans portfolio - all to the benefit of thebusiness planning process.
For the purposes of monitoring loan performance, the credit control function withinthe Credit Division draws on assistance from the competent business departmentsand the Milan Branch to keep a list of the Bank's problem loans, i .e., risk positionsto be kept under observation on the basis of information gathered from sourcesboth external (CRB data, detrimental-action records, press releases) and internal(automated monitoring of credit line utilization/overrun rates, reports from thecompetent business departments on particular countries and/or business sectors,events of default on payments due, legal steps taken by the Bank to collectamounts due).
The heads of the competent business departments and the manager of the MilanBranch provide monthly updates to the credit control function on the reasonsunderlying any anomalies detected in such positions and on any action that wasundertaken to mitigate credit risk. At the same time, they are required to forwardany information deemed useful for keeping the list of problem loans up-to-date tothe credit control function without delay.

115
The credit control function submits regular updates to the General Manager as well asa quarterly update to the Board of Directors on the progress of all problem loans.
Any proposals for new facilities in favour of clients or groups of connected clientswhose positions are under observation must be approved by the Board of Directors orthe Executive Committee, irrespective of the amount or technical format involved.
If it deems it appropriate - and definitely in the event of occurrences that might impairthe Bank's ability to recover even part of its exposure - the credit control function willpromptly present the General Manager with a written statement recommending that arisk position is downgraded to standstill or bad-debt status.
Risk Management is responsible for monitoring the capital requirement against creditrisk (Pillar I) on the basis of its quarterly risk-matrix report to Banca d'Italia. It alsosubmits a quarterly report on capital adequacy to the Risk Committee. For ICAAPpurposes, it formulates stress testing hypotheses so the Risk Committee can evaluatethe impact in terms of internal capital.
Risk Management collects quarterly data on large exposures and the Bank's individuallending limit (25% of eligible capital). Likewise, it monitors and circulates the list ofExternal Credit Assessment Institutions (ECAIs) selected for independent ratings.
Finally, it is up to Risk Management to determine the simplified indicator for "singlename" credit concentration risk in the corporate portfolio and the additional capitalrequirement called for by Pillar II in relation to overall internal capital . As regardsconcentration by banking counterparty, a system of internal operating limits has beenset up to limit this risk. And lastly, credit concentration by branch of business andgeographical area is covered by a qualitative evaluation of sector-specific indicatorsupon which to construct stress testing scenarios relevant to credit risk is carried outfor ICAAP purposes.
2.3 Credit risk mitigation techniques
An individual risk position may be backed by personal guarantees or by collateral.
The Bank's risk position with a guaranteed party may be replaced by its risk positionwith the guarantor, provided the latter is characterized by a lesser risk-weightingfactor and that the following conditions apply:
the guarantee is specific, i.e., covers the risk associated with a specifiedordinary or ad hoc credit facility;
the guarantee is unconditional, in the sense that the Bank may have recourseto the guarantor at any time;
the guarantor is independent of the guaranteed party, in the sense that thelikelihood of default by the guarantor is not linked to the likelihood of defaultby the guaranteed party.

116
Unless such conditions are fulfilled, the guaranteed party's individual risk positionmay not be replaced by the guarantor's when calculating the Bank's overall creditrisk.
The following types of collateral may be lodged in the Bank's favour, subject to thecustomary contractual formulations:
cash sums deposited with the Bank; cash sums deposited with banks that have been accorded credit lines by UBAE or
are otherwise acceptable to it; in the latter case, acceptance of any realguarantees is subject to approval by the competent loan-granting official or body;
bonds deposited with the Bank, provided they are issued by institutions whoserating is investment-grade;
bonds issued by entities whose rating is investment-grade and which aredeposited with international clearing bodies or with banks that have beenaccorded credit lines by UBAE or are otherwise acceptable to it; in the latter case,acceptance of collateral is subject to approval by the competent loan-grantingofficial or body;
matured trade receivables; not-yet matured trade receivables; residential and commercial property.
The value of cash sums and the market-price value of financial instruments lodged ascollateral (though not that of matured/not yet matured trade receivables or property)is deducted from the individual credit risk generated by the ordinary or ad hoc creditfacilities to which the collateral refers. The resulting individual net credit risk will beconsidered for the purposes of calculating the Bank's overall credit risk.
The resolution approving an ordinary or ad hoc facility that is backed by collateralmay indicate the minimum value, expressed in percentage terms, which theguarantee must preserve relative to the value of the approved exposure.
Banca UBAE does not purchase credit derivatives (CDS) as a means of protectionagainst credit risk.
2.4 Impaired financial assets
On the basis of a report submitted by the credit control function and after consultingwith the heads of the competent business departments or the Milan Branch, theGeneral Manager will decide whether or not the relevant problem loans should bereclassified as standstill positions or bad debts.
Once a risk position has been reclassified as standstill, no new credit facilities may begranted to that client or any connected client, while measures geared to make goodthe Bank's exposure must be set in train immediately.
It is up to the General Manager to authorize negotiations with a client for the purposeof reducing the Bank's exposure from a standstill position (rescheduled position).
Any proposals for new credit facilities in favour of clients whose positions have beenrescheduled must be approved by the Board of Directors, irrespective of the amountor technical format involved.

117
After consulting with the competent department heads and the credit controlfunction, the General Manager will take all necessary action to safeguard the Bank'sexposure; if a position has been reclassified as a bad debt, he will proceed withoutdelay to cancel all facilities granted and initiate legal debt-recovery proceedings. Theinitiation of legal debt-recovery proceedings automatically entails a position'sreclassification as a bad debt.
Should he deem it appropriate, the General Manager may authorize a given businessdepartment to continue dealing with a client whose position has been entered underbad debts, provided guidance is sought from the Legal unit.
Assisted by the credit control function and the Legal unit, the General Manager willupdate the Executive Committee and (on a quarterly basis) the Board of Directors onthe progress of all bad debts, rescheduled debts and standstill positions, includingdetails of loss forecasts if and as applicable.

QUANTITATIVE INFORMATION
A. Credit quality
1 Financial assets held for trading
2
3 Financial assets held to maturity
4 L&As to banks
5 L&As to customers
6
7 Financial assets being divested
8 Hedging Derivativesves
Total 2010
Total 2009
A.1 Performing and non-performing credit positions: Amounts outstanding, write-
downs, variations, distribution by business sector and geographical area
A.1.1 Distribution of financial assets by portfolio and credit quality (book value)
Other TotalBad debtsStandstill
positions
Resche-
duled
debts
Past-due
positions
3,4402,621
91,101
2,897,838
210,275210,175
0
1,847
91,101
2,893,480
Financial assets available-for-
sale
Financial assets designated at
fair value
2,511
1189
819
2,426,8091,932 3 2,421,274110
3,419
3,490
11 1,847 0 3,317,9003,312,623
118
Portfolio/credit quality
115,246 115,246

1 Financial assets held for trading
2
3 Financial assets held to maturity
4 L&As to banks
5 L&As to customers
6
7 Financial assets being divested
8 Hedging Derivatives
Total 2010
Total 2009
A.1.3 Cash and off-balance sheet exposure to banks: gross and net values
A CASH EXPOSURE
a) Bad debts
b) Standstill position
c) Rescheduled debts
d) Past due positions
e) Other assets
Total A
B OFF-BALANCE SHEET EXPOSURE
a) Impaired
b) Other
Total B
Total A+B
3,440
Net
exposure
A.1.2 Distribution of financial assets by portfolio and credit quality (gross and net values)
Portfolio/credit quality
Impaired assets Other assets
Total(net
exposure)
Gro
ss
exposure
Specific
wri
te-
dow
ns
Financial assets available-for-
sale 2,730 1,911 819
10,901 6,543 4,358 2,919,373 25,893 2,893,480 2,897,838
10,454 10,354 100 212,129 1,954 210,175 210,275
Financial assets designated at
fair value
24,085 18,808 5,277 3,341,335
2,426,8099,767 2,421,274
28,712 3,312,623 3,317,900
Net exposure
23,928 18,393 5,535 2,431,041
Exposures "in bonis" do not include exposures under renegotiation as part of collective agreements
Exposure type/valuesGross
exposure
Specific
write-downs
Portfolio
write-downs
11,767 8,437 3,330
1,864 17 1,847
3,097,696 26,667 3,071,029
3,111,327 8,454 26,667 3,076,206
577,075 2,499 574,576
577,075 2,499 574,576
3,688,402 8,454 29,166 3,650,782
Gro
ss
exposure
115,246
84191,942 91,101 91,101
119
2,621
Specific
wri
te-
dow
ns
115,246 115,246
Net
exposure
2,645 24

A.1.4 Cash exposure to banks: changes in gross impaired positions
A Opening gross exposure
B Increases
B1 inflows from performing positions
B2
B3 other increases (*)
C Decreases
C1 outflows to performing positions
C2 write-offs
C3 items collected
C4 items assigned
C5
C6 other decreases (*)
D Closing gross exposure
Causal / categories Bad debtsStandstill
positions
Rescheduled
debts
Past due
positions
11,342 1,950
of which: exposures assigned
but not derecognized
8,937 171
transfers from other classes of
impaired positions
8,937 171
(8,512) (257)
(721) (247)
transfers to other classes of
impaired positions
(7,791) (10)
11,767 1,864
of which: exposures assigned
but not derecognized
120
(*)The amounts reflect a reclassification of EUR 7,791 mn from "Bad debts"to "Rescheduled debts",
however, for supervisory reporting purposes it is classified as a bad debt

A Opening gross exposure
B Increases
B1 write-downs
B2
B3 other increases (*)
C Decreases
C1 valuation write-backs
C2 collection write-backs
C3 write-offs
C4
C5 other decreases (*)
D Closing gross exposure
A.1.6 Cash and off-balance sheet exposures to customers: gross and net values
A CASH EXPOSURE
a) Bad debts
b) Standstill positions
c) Rescheduled debts
d) Past due positions (*)
f) Other assets
B OFF-BALANCE SHEET EXPOSURES
a) Impaired
b) Other
(*) As regards past due positions amounting to EUR 90, it should be noted that these originated in June
2010. Positions overdue up to 90 days of EUR 182 originated in September 2010
Past due
positions
A.1.5 Cash exposure to banks: variations in total adjustments
Causal / categories Bad debtsStandstill
positions
Rescheduled
debts
7,939 18
6,174
of which: exposures assigned
but not derecognized
200
transfers from other classes of
impaired positions
5,974
5,676 1
223
transfers to other classes of
impaired positions
5,453 1
Net exposure
of which: exposures assigned
but not derecognized
Exposure type/valuesGross
exposure
Specific
write-downs
Portfolio
write-downs
8910,442 10,353 0
0
12 1 0 11
241,594
0
Total A 254,093 10,354 2,045
Total B 819,321 846 368
121
818,107
4,243
241,694
0
0 2,045
846
814,232 0
243,639
368 813,864
5,089
(*) The amount of EUR 5,453 mn reflects the reclassification of doubtful accounts of a position classified as
"Bad debts" to "Rescheduled debts", however, for supervisory reporting purposes it is classified as a bad
debt
8,437 17

A Opening gross exposure
B Increases
B1
B2
B3 Other increases
C Decreases
C1
C2 write-offs
C3 items collected
C4 items assigned
C5
C6 other decreases
D Closing gross exposure
A.1.8 Cash exposures to customers: changes in total adjustments
A Opening gross exposure
B Increases
B1 write-downs
B2
B3 Other Increases
C Decreases
C1 valuation write-backs
C2 collection write-backs
C3 write-offs
C4
C5 other decreases
D Closing gross exposure
Past due
positionsCausal / categories Bad debts
Standstill
positions
Rescheduled
debts
A.1.7 Cash exposures to customers: variations in gross impaired positions exposed to country
risk
10,522 111 3
of which: exposures assigned
but not derecognized
20 16 1
transfers from other classes of
impaired positions
1inflows from performing 11
3
20 2
(100) (115) (4)
outflows to performing positions
(12) (1)
(4)
(100) (99) 0
transfers to other classes of
impaired positions (3)
10,442 12 0
Causal / categories Bad debtsStandstill
positions
Rescheduled
debts
Past due
positions
of which: exposures assigned
but not derecognized
10,435 1
18 2 0
of which: exposures assigned
but not derecognized
18 1
transfers from other classes of
impaired positions 0
1
(100) (2) 0
0 (1) 0
(100) (1)
transfers to other classes of
impaired positions
of which: exposures assigned
but not derecognized
10,353 1
122

A.2 Distribution of positions by external and internal ratings
A
B
B1 Financial derivatives
B2 Credit derivatives
C
D
Class 1
Class 2
Class 3
Class 4
Class 5
Class 6
0
236,222 29,094
0
37,795
External
ratinghs bands
1,131,851
A 2.1 Distribution of off-balance sheet and cash exposures by internal rating bands
BBB+/BBB-BB+/BB-B+/B-
CCC and below
S&P Fitch
AAA/AA-A+/A-
Caa and below
Moody's
Aaa/Aa3A1/A3
Baa1/Baa3Ba1/Ba3B1/B3
4,709,470
788,617 1,323,242
67,992 67,992
1,449
Total 2,906,893 205,335 200,075
Commitments to disburse funds
Guarantees given 377,160 4,829 108,654
0
6,187
921 43 485
274,757 3,316,787
485 1,449Derivatives 921 0 43
c
l
a
s
s
6
Cash Exposures 2,528,812 200,506 91,378
class 4
198,427
class
5
22,907
Rating agencies used are Standard & Poor’s Rating Services, Moody’s Investors Service e Fitch
Ratings as per following mapping:
123
A.2.1 Distribution of off-balance sheet and cash exposures through external rating bands (Book
value)
Exposures
External rating bands
Unrated Totalclass
1
class
2class 3

A.3 Distribution of guaranteed exposures by type of guarantee
A.3.1 Guaranteed Banks' exposures
1
1.1 fully guaranteed
- out of which, impaired
1.2 not fully guaranteed
- out of which, impaired
2
2.1 fully guaranteed
- out of which, impaired
2.2 not fully guaranteed
- out of which, impaired
A.3.2 Guaranteed Clients' exposures
1
1.1 fully guaranteed
- out of which, impaired
1.2 not fully guaranteed
- out of which, impaired
2
2.1 fully guaranteed
- out of which, impaired
2.2 not fully guaranteed
- out of which, impaired
89 89
Net
exposure
value
Collateral
Credit
Linked
Notes
PropertySecu-
rities
Other
assets
7
157
150
1,799
3,859
2,060
8,531Cash exposures guaranteed
Off-Balance Sheet exposures guaranteed
2,640
5,891
Net
exposure
Value
Credit
Linked
Notes
Other
assets
Secu-
ritiesProperty
Collateral
206
150
56
Cash exposures guaranteed 14,533 6,978 0
14,533 6,978
0 0
Off-Balance Sheet exposures guaranteed 120,247 199
52,648 197
67,599 2
0
124

(following)
(following)
0
Personal
Gov't and
Central
Banks
56
56
Total
Credit derivatives Endorsement
Other derivatives
Other public
entitiesBanks Others
Personal
Others
Gov't and
Central
Banks
524
Endorsement
Other derivatives
Credit derivatives
BanksOthers
0
0
524
Other public
entitiesBanks
157
150
7
Total
4,439
2,640
1,799
Gov't and
Central
Banks
Other
public
entities
Gov't and
Central
Banks
Other
public
entities
Banks Others
14,6587,680
0 14,6587,680
890
00
43,362 6,996 92,33341,776
12,990 6,996 52,64832,465
0
30,372 39,6859,311
0 0
125

B. Credit distribution and concentration
B.1 Distribution of cash and off-balance sheet credit exposures to customers by borrower sector
A CASH EXPOSURE
A1 Bad debts
A2 Standstill positions
A3 Rescheduled debts
A4 Past due positions
A5 Other assets
Total (A)
B OFF-BALANCE SHEET EXPOSURES
B1 Bad debts
B2 Standstill positions
B3 Impaired
B4 Other
Total (B)
Total (A+B) 2010
Total (A+B) 2009
A CASH EXPOSURE
A1 Bad debts
A2 Standstill positions
A3 Rescheduled debts
A4 Past due positions
A5 Other assets
Total (A)
B OFF-BALANCE SHEET EXPOSURES
B1 Bad debts
B2 Standstill positions
B3 Impaired
B4 Other
Total (B)
Total 2010 (A+B)
Total 2009 (A+B)
Italy Other European countries
Net exposureExposures / Geographical area Total write-
downsNet exposure
Total write-
downs
89
11
0
2,760
1,483
0
0
101,236
101,336
654,656
658,899
760,235
730,602
10,341
1
0
0
934
11,276
681
165
0
320
1,166
12,442
12,630
83,337
83,337
96,686
96,686
180,023
185,222
630
630
20
20
650
706
Exposures / Counterparties
0
4,584 36 0 0
Net
exposure
Governments Other public entities
Net
exposure
Specific
write-
downs
Port-
folio
write-
downs
Net
exposure
Specific
write-
downs
Port-
folio
write-
downs
4,584 36
49,350
0
50,774
49,350
1,424
Financial
1,424
61,827
144
144
32
4,584
3,649
B.2 Distribution of cash and off-balance sheet exposures to customers by geographical area
(book value)
0
126
328 3,513
36 144

(following)
companies
(following)
Asia Rest of the World
Net exposure Total write-downs Net exposure Total write-downsTotal write-
downsNet exposure
Americas
5,054
5,054
5,054
13,974
12
3
15
15
13
0
32,356
32,356
0
26,132
26,132
58,488
41,071
300
300
605
0
12
12
312
36,390
36,390
19,083
19,083
55,473
2,779
178
178
16
16
194
26
Others
Net
exposure
Insurance companies Non financial companies
12 89 62
0
0 0
0 34,0011,373
0
316
12 320 316153,142 10,280
320 153,131
1,373 34,090 62
02,760 681
1,483 165
0 0
812,274 22
816,517 846
12 320
11,435212 281 870,207 218
10,279
11 1
Portfolio
write-
downs
Specific
write-
downs
Net
exposure
Specific
write-
downs
Portfolio
write-
downs
316
1,412 34,452 62
621,741
0
34,11211,126
22368
368
969,659
Specific
write-
downs
Portfolio
write-
downs
Net
exposure
Portfolio
write-
downs
Specific
write-
downs
127
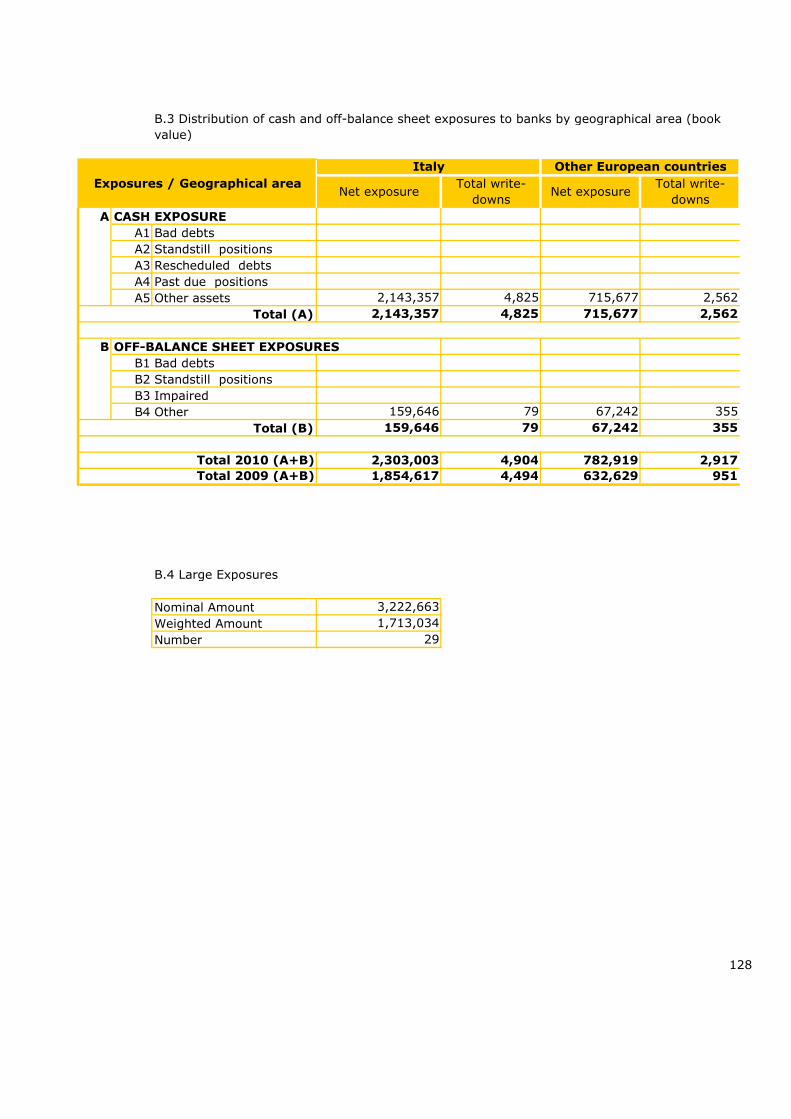
A CASH EXPOSURE
A1 Bad debts
A2 Standstill positions
A3 Rescheduled debts
A4 Past due positions
A5 Other assets
Total (A)
B OFF-BALANCE SHEET EXPOSURES
B1 Bad debts
B2 Standstill positions
B3 Impaired
B4 Other
Total (B)
B.4 Large Exposures
Nominal Amount
Weighted Amount
Number
3,222,663
1,713,034
128
Total write-
downs
Exposures / Geographical area
Italy Other European countries
Net exposureTotal write-
downsNet exposure
2,143,357 4,825 715,677 2,562
2,143,357 4,825 715,677 2,562
159,646 79 67,242 355
159,646 79 67,242 355
2,303,003 4,904 782,919 2,917
632,629 951
29
B.3 Distribution of cash and off-balance sheet exposures to banks by geographical area (book
value)
Total 2010 (A+B)
Total 2009 (A+B) 1,854,617 4,494

(following)
129
Net exposure Total write-downs
Americas Asia Rest of the World
Net exposure Total write-downs Net exposureTotal write-
downs
3,330 8,437
1,847 17
4,653 143,802 14,077 62,619 5,203
4,653 147,132 22,514 64,466 5,220
155,977 77 191,711 1,988
155,977 77 191,711 1,988
4,653 303,109 22,591
313,448 15,823 289,104 6092,400
256,177 7,208

C. Securitization and disposal of assets
C.1 Securitization
QUALITATIVE INFORMATION
QUANTITATIVE INFORMATION
C.1.4 Exposure from securitization schemes: Breakdown by portfolio and type
C.1.6 Stakes in special-purpose vehicles
C.2 Disposals
C.2.1 Financial assets disposed of but not derecognized
C.2.2 Financial liabilities linked to financial assets disposed of but not derecognized
C.3 Covered bonds
C.1.7 Servicer activities – Collection of securitized debt and redemption of securities issued by the
special purpose vehicle
C.1.5 Total value of securitized debt underlying junior notes or other forms of credit support
1.2 Exposure from main in-house securitization schemes: Breakdown by type of securitized assets
and type of exposure
C.1.3 Exposure from main third-party securitization schemes: Breakdown by type of securitized
assets and type of exposure
C.1.1 Exposure from securitization schemes: Breakdown by quality of underlying assets
The amount reimbursed to UBAE as a result of closing these positions was greater than the net
value of the securities concerned and led to a write-back of EUR 1.13 mn.
In 1999 UBAE took specific action to refine its procedure concerning bad debts by making
recourse to securitization of the loan portfolio.
During 2010, following an in-depth review conducted together with the special-purpose vehicle
and with assistance from a specialized legal firm, an analysis of outstanding positions was
made to establish the possibility of debt recovery. The conclusion was reached that the
residual securities concerned, held solely by the Bank and that had already been almost
entirely written down, should be completely written off.
130

D. Credit risk measurement models
131
Risk Management will use these PD values for each counterparty in order to obtain the EL (expected
loss) value and UL (unexpected loss) value that will then be included in a pricing formula for credit
transactions, which will highlight the risk premium and the risk adjusted performance measurement
cost.
UBAE does not have its own internal model for measuring credit risk exposure based on a
combination of internal and external factors relating to PD (probability of default).
Risk Management Department is working on a project to utilize transition tables made available by
ECAI to map internal risk groups so that the PD value indicated by ECAI can be attributed to each
internal group.

Section 2 – Market risk
2.1 – Price and Interest rate risk: Trading book
QUALITATIVE INFORMATION
A. General aspects
132
Established by the Board of Directors, the maximum level of market risk acceptable forthe HFT portfolio is equivalent to the amount of economic capital which the Bank isprepared to allocate against market risk. Risk management policy in this area willidentify the units and individuals authorized to take on risks and define their respectiveresponsibilities.
In supporting risk taking activities through a range of tasks, Risk Management helps toimplement the strategy set out by the Bank's governing bodies and sees that risks ineach category are properly monitored and reported in the light of established limits.
The risk management process is meant to ensure that the actual risk profile remainswithin the overall accepted risk level and within the limits set for each risk category,and that the risk profile is attained in a transparent manner.
The Bank's risk profile is conveyed and analysed through a reporting system that isadequate, shared and subject to periodic independent controls.
Financial transactions are recorded by Master Finance (MF), a software applicationforming part of the Bank's IT and accounting system. Risk control and managementreporting requirements are adequately served by MF.
Recent adjustments to MF took account of the internal rules governing Banca UBAE'sfinancial operations, signally the latter's subdivision into a number of elementaryportfolios, the roles of the various actors involved, management and control processes,the instruments that may be assigned to each portfolio, operating limits, and the natureand frequency of reports for the Management.
MF handles the following financial instruments:
- forex (traditional and OTC derivatives)- money market (traditional and derivatives: FRA, IRS, OIS)- bonds and derivatives (options)- equities and derivatives (index futures, options traded on regulated markets)

133
MF also contains information regarding risk positions generated by the TreasuryDept. and the business divisions (loans/discounting). The product was configuredfor automatic updates to and from all relevant SEC programs.
Since it is linked up with the most widely used infoproviders (Bloomberg, Reuters,Prometeia), MF supports pricing activity for both cash and derivative instruments.
MF supports risk-measuring methods that provide an accurate and comprehensiverepresentation of the Bank's risk exposure by monitoring operating limits. Inparticular:
position risk on the trading portfolio is expressed in terms of VaR, with a 99%confidence interval and a 10-day holding period
option risk is susceptible to monitoring in terms of delta, gamma and vegafactors
counterparty risk is calculated on the basis of the current value of OTCderivatives
interest rate risk is expressed in terms of sensitivity to shifts in the interest ratecurve (duration, interest rate potential loss, etc.).
The internal rules applying to financial operations embody two key principles:
each type of activity will be pursued through a single portfolio of financialinstruments;
each type of risk - as defined in relation to the various types of activity - will behandled by a single unit within the Treasury Division.
Adherence to both principles ensures the decision-making process is moretransparent and controls are more effective.
The internal rules set guidelines for the distribution of powers in the financialsphere, define internal communication flows for managing exceptional events, anddescribe the limits, the typical risks, and the mission assigned to each departmentin the Treasury Division.
The entire system of internal operating limits is replicated in MF to enable first -,second- and third-order controls to be carried out in real time by the competentunits.
A reporting system has also been implemented within MF, which automaticallygenerates a series of reports enabling the competent bodies to be informed on adaily, weekly or monthly basis (as variously stipulated by the internal rules) withrespect to financial positions, risks and any breaches of operating limits. Reportsare delivered to Senior Management and the head of the Treasury Division.

Por
tfoli
134
B. Risk management processes and measuring methods
Dealing on behalf of bank or corporate customers in interest- or exchange-ratederivatives may result in day-to-day misalignments in the portfolio for suchinstruments, hence in a temporary increase in exposure to generic position risk foreither the Treasury Dept. or the Securities Dept.
Trading positions in interest- and exchange-rate derivatives, whether regulated orOTC, are entered in the MF front-office system, which supports the daily pricing ofthese instruments and calculates unrealized gains and losses. The risk associatedwith each position opened in financial instruments is expressed in terms of VaR(with a 10-day holding period and a 99% confidence interval) and is subject toquantitative limits proposed by the Risk Committee. These are approved by theBoard of Directors and monitored daily by the Risk Management unit.
If a limit is approached, procedures for checking and possibly calling in the exposureare activated.
Risk Management ensures the accuracy of measurements obtained from the VaRmodel through quarterly back-testing.

135

QUANTITATIVE INFORMATION
1 Cash assets
1.1 Debt securities
- other
1.2 Other assets
2 Cash liabilities
2.1 Repo
2.2 Other liabilities
3 Financial derivatives
3.1
- Options
* Long positions
* Short positions
- Other derivatives
* Long positions
* Short positions
3.2
- Options
* Long positions
* Short positions
- Other derivatives
* Long positions
* Short positions
136
1.A Trading book: Distribution of cash financial assets/liabilities and financial derivatives by
residual maturity (repricing date) Currency: EUR
Type / Residual maturity
- with an option for early
102,931
3 to 6 monthsSight Up to 3 months
58,783 15,019
102,931
102,931
58,783 15,019
155,665
58,783 15,019
214,448 15,019
With underlying security:
W/out underlying security:

(following)
137
5 to 10 years Over 10 years Indefinite
10,350 0
6 to 12 months 1 to 5 years
00 (50,509)
00 (50,509)
10,350 0
10,350 0
0 (50,509) 0
0 55,509 0
5,000
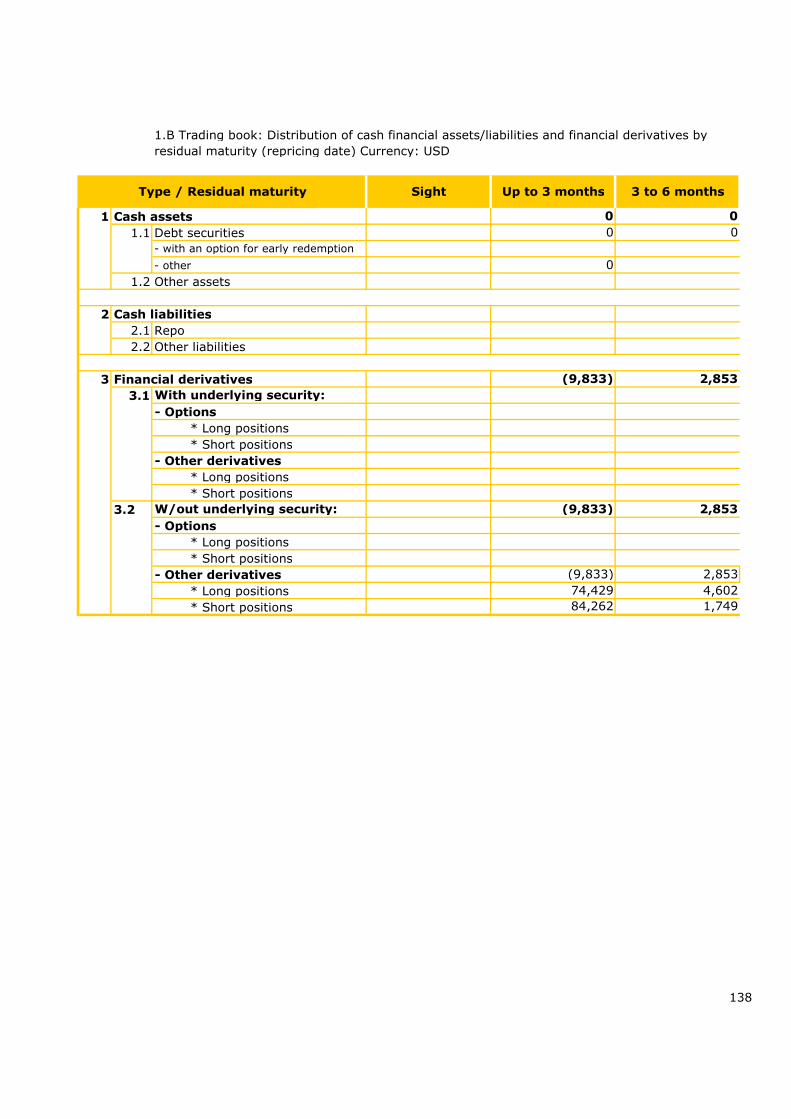
1 Cash assets
1.1 Debt securities
- other
1.2 Other assets
2 Cash liabilities
2.1 Repo
2.2 Other liabilities
3 Financial derivatives
3.1
- Options
* Long positions
* Short positions
- Other derivatives
* Long positions
* Short positions
3.2
- Options
* Long positions
* Short positions
- Other derivatives
* Long positions
* Short positions
138
84,262 1,749
74,429 4,602
(9,833) 2,853
(9,833) 2,853
(9,833) 2,853
0
- with an option for early redemption
0 0
0 0
1.B Trading book: Distribution of cash financial assets/liabilities and financial derivatives by
residual maturity (repricing date) Currency: USD
Type / Residual maturity Sight Up to 3 months 3 to 6 months
With underlying security:
W/out underlying security:

(following)
139
0
5,930
5,930
5,930
5,930
0 00
Indefinite
0 0 0
6 to 12 months 1 to 5 years 5 to 10 years Over 10 years

1 Cash assets
1.1 Debt securities
- other
1.2 Other assets
2 Cash liabilities
2.1 Repo
2.2 Other liabilities
3 Financial derivatives
3.1 With underlying security:
- Options
* Long positions
* Short positions
- Other derivatives
* Long positions
* Short positions
3.2 W/out underlying security:
- Options
* Long positions
* Short positions
- Other derivatives
* Long positions
* Short positions
140
1.C Trading book: Distribution of cash financial assets/liabilities and financial derivatives by
residual maturity (repricing date) Currency: GBP
Type / Residual maturity
9,121
9,121 1,743
1,743
0 0
0 0
0 0
3to
6m
onth
s
Up
to3
month
s
Sig
ht
Indefinite
Over
10
years
5to
10
years
1to
5years
6to
12
month
s
- with an option for early
redemption

1 Cash assets
1.1 Debt securities
- other
1.2 Other assets
2 Cash liabilities
2.1 Repo
2.2 Other liabilities
3 Financial derivatives
3.1 With underlying security:
- Options
* Long positions
* Short positions
- Other derivatives
* Long positions
* Short positions
3.2 W/out underlying security:
- Options
* Long positions
* Short positions
- Other derivatives
* Long positions
* Short positions
1.D Trading book: Distribution of cash financial assets/liabilities and financial derivatives by
residual maturity (repricing date) Currency: CHF
5to
10
years
Over
10
years
Type / Residual maturity
Sig
ht
Up
to3
month
s
3to
6m
onth
s
Indefinite
6to
12
month
s
1to
5years
- with an option for early
redemption
0
0
0
80,051
80,051
141

1 Cash assets
1.1 Debt securities
- other
1.2 Other assets
2 Cash liabilities
2.1 Repo
2.2 Other liabilities
3 Financial derivatives
3.1 With underlying security:
- Options
* Long positions
* Short positions
- Other derivatives
* Long positions
* Short positions
3.2 W/out underlying security:
- Options
* Long positions
* Short positions
- Other derivatives
* Long positions
* Short positions
1.E Trading book: Distribution of cash financial assets/liabilities and financial derivatives by
residual maturity (repricing date) Currency: AED
Type / Residual maturity
Sig
ht
Up
to3
month
s
3to
6m
onth
s
6to
12
month
s
1to
5years
5to
10
years
Over
10
years
Indefinite
- with an option for early
redemption
(11,953) (2,857) (5,918)
(11,953) (2,857) (5,918)
(11,953) (2,857) (5,918)
0 0
11,953 2,857 5,918
141

1 Cash assets
1.1 Debt securities
- other
1.2 Other assets
2 Cash liabilities
2.1 Repo
2.2 Other liabilities
3 Financial derivatives
3.1 With underlying security:
- Options
* Long positions
* Short positions
- Other derivatives
* Long positions
* Short positions
3.2 W/out underlying security:
- Options
* Long positions
* Short positions
- Other derivatives
* Long positions
* Short positions
1.F Trading book: Distribution of cash financial assets/liabilities and financial derivatives by
residual maturity (repricing date) other currencies
Type / Residual maturity
Sig
ht
Up
to3
month
s
3to
6m
onth
s
6to
12
month
s
1to
5years
5to
10
years
Over
10
years
Indefinite
- with an option for early
redemption
(1,259)
(1,259)
(1,259)
0
142
1,259

A Equities: trades settled
Long positions
Short positions
B
Long positions
Short positions
C Other derivatives on equities
Long positions
Short positions
D Derivatives on shares indices
Long positions
Short positions
2. Trading book: Distribution of exposure in equities and share indices by country of listing
Type / share indices
Equities: trades no yet
settled
ListedNot Listed
Italy
271
271
143
3. Trading book: Internal models and other sensitivity-analysis methods

2.2 – Price and Interest rate risk – Banking book
QUALITATIVE INFORMATION
- A/C
-others derivatives
144
A. General aspects, risk management processes and measuring methods
Pillar II foresees an additional capital requirement against interest rate risk and requiresbanks to check such risk regularly by calculating a (simplified) “risk indicator”corresponding to a shock producing a 200 bp parallel shift in the interest rate curve.
Readings for the indicator should never exceed 20% of eligible capital, which is wellabove the level recorded at Banca UBAE on account of the concentration of assets andliabilities within a 12-month time frame and the presence of derivatives mitigating their
riskiness. For internal operating purposes, the Bank’s rules cap this particular risk at5% of eligible capital as a measure of precaution reflecting its true susceptibility tointerest rate risk in the banking book.
Once a month, Risk Management verifies compliance with the internal operating limit.For ICAAP purposes, it uses an ALM product to conduct quarterly maturity ladder analysesunder the simplified approach as well as by the full-evaluation method. Once a year as aminimum, finally, the unit subjects the exposure to stress testing in relation to hypothetical
parallel and non-parallel shifts in the interest rate curve.
B. Fair value hedges
Banca UBAE does not hold derivatives to hedge assets or liabilities designated at fairvalue.
C. Cash flow hedges
Banca UBAE does not hold derivatives to hedge cash flow in accordance with IAS 39.Its portfolio includes interest rate derivatives (OIS, IRS) whose purpose is to provide asort of macro-coverage of the interest margin implicit in the cash flow generated bybanking activities (bonds, loans, discounting). Hedging and negotiation of derivatives area matter for the Treasury Dept. The Treasury Division as such may hold IRSs hedginginterest rate risk associated with bonds carried in the HTM portfolio.

145

QUANTITATIVE INFORMATION
1 Cash assets
1.1 Debt securities
- with an option for early redemption
-other
1.2 L&As to banks
1.3 L&As to customers
- A/C
-other L&As
with an option for early redemption
other
2 Cash liabilities
2.1 Due to customers
- A/C
-other liabilities
with an option for early redemption
other
2.2 Due to banks
- A/C
-other liabilities
2.3 Debt securities
- with an option for early redemption
-other
2.4 Other liabilities
- with an option for early redemption
-other
3 Financial derivatives
3.1 With underlying security:
- Options
* Long positions
* Short positions
-other derivatives
* Long positions
* Short positions
3.2 W/out underlying security:
- Options
* Long positions
* Short positions
-other derivatives
* Long positions
* Short positions
146
586,723 909,353
Type / Residual maturity
152,750
152,750
585,844 648,356
879 108,247
755
59 76,676
124 108,247
65 31,571
1,512,313 446,062
697,247 1,717
697,247 1,717
0 0
0
815,066 444,345
62,224 0
752,842 444,345
Up to 3 monthsSight
1.A Banking book: Distribution of cash financial assets/liabilities and financial derivatives by
residual maturity (repricing date) Currency: EUR

(following)
147
133,371
54,955
7,845
1,607
54,955
45,195
33,221
33,221
2,182
31,039
26,632
1,607
25,025
25,025
6 to 12 months 1 to 5 years 5 to 10 years
289,880 119,936 2,923
36,330
0 36,330 0
4,866 32,428 2,923
285,014 51,178
2,923
0 0 0
2,464 0
4,473 29,523 0
393 2,905 2,923
4,866 32,428
0
2,464
2,464
2,464
7,845
7,845
IndefiniteOver 10
years3 to 6 months

1 Cash assets
1.1 Debt securities
- with an option for early redemption
-others
1.2 L&As to banks
1.3 L&As to customers
- A/C
-others L&As
with an option for early redemption
others
2 Cash liabilities
2.1 Due to customers
- A/C
-others liablities
with an option for early redemption
others
2.2 Due to banks
- A/C
-others liablities
2.3 Debt securities
- with an option for early redemption
-others
2.4 Other liabilities
- with an option for early redemption
-others
3 Financial derivatives
3.1 With underlying security:
- Options
* Long positions
* Short positions
-others derivatives
* Long positions
* Short positions
3.2 W/out underlying security:
- Options
* Long positions
* Short positions
-others derivatives
* Long positions
* Short positions
148
Type / Residual maturity
0 3,881
442,003 541,881
Sight Up to 3 months
0 3,881
10 8,231
441,993 529,769
0 8,231
10 0
0 8,231
0
60,258 346
179,403 908,862
0 0
60,258 346
0
81,699 0
119,145 908,516
37,446 908,516
0
0
1. Banking book: Distribution of cash financial assets/liabilities and financial derivatives by
residual maturity (repricing date) Currency: USD

(following)
149
47,696 762 5724,590 65,723
762 57
762 57
20,749 63,933
3,841 1,790
38,461 0
9,235 0 0
3,841 1,790 9,235 0
3,841 1,790 9,235
49,403
49,403
49,403
Over 10
yearsIndefinite6 to 12 months 1 to 5 years 5 to 10 years3 to 6 months

1 Cash assets
1.1 Debt securities
- with an option for early redemption
-others
1.2 L&As to banks
1.3 L&As to customers
- A/C
- Other L&As:
with an option for early redemption
others
2 Cash liabilities
2.1 Due to customers
- A/C
-others liabilities
with an option for early redemption
others
2.2 Due to banks
- A/C
-others liabilities
2.3 Debt securities
- with an option for early redemption
-others
2.4 Other liabilities
- with an option for early redemption
-others
3 Financial derivatives
3.1 With underlying security:
- Options
* Long positions
* Short positions
-other derivatives
* Long positions
* Short positions
3.2 W/out underlying security:
- Options
* Long positions
* Short positions
-other derivatives
* Long positions
* Short positions
Type / Residual maturity
2 3,353
112 3,353
110
21 172
0 0
217 3,371
Indefinite
Over
10
years
Sig
ht
Up
to3
month
s
3to
6m
onth
s
6to
12
month
s
1to
5years
5to
10
years
217 3,371
21 172
133 3,525
150
1.C Banking book: Distribution of cash financial assets/liabilities and financial derivatives by
residual maturity (repricing date) Currency: GBP

1 Cash assets
1.1 Debt securities
- with an option for early redemption
-others
1.2 L&As to banks
1.3 L&As to customers
- A/C
- Other L&As:
with an option for early redemption
others
2 Cash liabilities
2.1 Due to customers
- A/C
-others liabilities
with an option for early redemption
others
2.2 Due to banks
- A/C
-others liabilities
2.3 Debt securities
- with an option for early redemption
-others
2.4 Other liabilities
- with an option for early redemption
-others
3 Financial derivatives
3.1 With underlying security:
- Options
* Long positions
* Short positions
-other derivatives
* Long positions
* Short positions
3.2 W/out underlying security:
- Options
* Long positions
* Short positions
-other derivatives
* Long positions
* Short positions
151
1,600
172 1,600
172
182
354 1,600
182
1,867
Sig
ht
Up
to3
month
s
3to
6m
onth
s
6to
12
month
s
1to
5years
Indefinite
Type / Residual maturity
5to
10
years
Over
10
years
1,867 0
1.D Banking book: Distribution of cash financial assets/liabilities and financial derivatives by
residual maturity (repricing date) Currency: CHF

1 Cash assets
1.1 Debt securities
- with an option for early redemption
-others
1.2 L&As to banks
1.3 L&As to customers
- A/C
- Other L&As:
with an option for early redemption
others
2 Cash liabilities
2.1 Due to customers
- A/C
-others liabilities
with an option for early redemption
others
2.2 Due to banks
- A/C
-others liabilities
2.3 Debt securities
- with an option for early redemption
-others
2.4 Other liabilities
- with an option for early redemption
-others
3 Financial derivatives
3.1 With underlying security:
- Options
* Long positions
* Short positions
-other derivatives
* Long positions
* Short positions
3.2 W/out underlying security:
- Options
* Long positions
* Short positions
-other derivatives
* Long positions
* Short positions
13
4 4,050
17 4,050
17 4,050
5to
10
years
Over
10
years
Indefinite
90 3,949
Type / Residual maturity
Sig
ht
Up
to3
month
s
3to
6m
onth
s
152
90 3,949
6to
12
month
s
1to
5years
1.E Banking book: Distribution of cash financial assets/liabilities and financial derivatives by
residual maturity (repricing date) Currency: JPY

1 Cash assets
1.1 Debt securities
- with an option for early redemption
-others
1.2 L&As to banks
1.3 L&As to customers
- A/C
- Other L&As:
with an option for early redemption
others
2 Cash liabilities
2.1 Due to customers
- A/C
-others liabilities
with an option for early redemption
others
2.2 Due to banks
- A/C
-others liabilities
2.3 Debt securities
- with an option for early redemption
-others
2.4 Other liabilities
- with an option for early redemption
-others
3 Financial derivatives
3.1 With underlying security:
- Options
* Long positions
* Short positions
-other derivatives
* Long positions
* Short positions
3.2 W/out underlying security:
- Options
* Long positions
* Short positions
-other derivatives
* Long positions
* Short positions
1.F Banking book: Distribution of cash financial assets/liabilities and financial derivatives by
residual maturity (repricing date) Currency: AED
Type / Residual maturity
Over
10
years
Indefinite
1,419 12,202 2,875 7,008
Sig
ht
5to
10
years
Up
to3
month
s
3to
6m
onth
s
6to
12
month
s
1to
5years
1,419 12,202 2,875 7,008
22 611 408
22 611 408
22
611 408
153

1 Cash assets
1.1 Debt securities
- with an option for early redemption
-others
1.2 L&As to banks
1.3 L&As to customers
- A/C
- Other L&As:
with an option for early redemption
others
2 Cash liabilities
2.1 Due to customers
- A/C
-others liabilities
with an option for early redemption
others
2.2 Due to banks
- A/C
-others liabilities
2.3 Debt securities
- with an option for early redemption
-others
2.4 Other liabilities
- with an option for early redemption
-others
3 Financial derivatives
3.1 With underlying security:
- Options
* Long positions
* Short positions
-other derivatives
* Long positions
* Short positions
3.2 W/out underlying security:
- Options
* Long positions
* Short positions
-other derivatives
* Long positions
* Short positions
907
0 907
0 907
2,140
2,140
2,140
154 2,140
Type / Residual maturity
Sig
ht
Up
to3
month
s
3to
6m
onth
s
153
2. Banking book: internal models and other sensitivity analysis methods
154
1.G Banking book: Distribution of cash financial assets/liabilities and financial derivatives by
residual maturity (repricing date) Currency: other currencies
5to
10
years
Over
10
years
Indefinite
6to
12
month
s
1to
5years

2.3 - Currency risk
QUALITATIVE INFORMATION
154
A. General aspects, risk management processes and measuring methods
UBAE's banking book denotes a prevalence of US dollars for short-term funding andeuros for earning assets.
Securities making up the HFT portfolio are mostly denominated in euros. Dealing inforward exchange rate derivatives may increase the Bank's global exposure toexchange rate risk insofar as it holds assets and liabilities denominated in othercurrencies.
Intraday and overnight operating limits as well as stop loss limits for global exposureto exchange rate risk are set by the Board of Directors, administered by the RiskCommittee and monitored daily by the Risk Management unit.
B. Hedging for currency risk
Banca UBAE does not hold derivatives to hedge financial flows denominated in non-euro currencies according to IAS 39.
The Treasury Division ensures a macro-coverage of financial flows denominated in non-euro currencies by holding interest rate and exchange rate derivatives (currencyswaps) as dictated by its appreciation of the market.

QUANTITATIVE INFORMATION
1. Distribution by currency in which assets/liabilities and derivatives are denominated
A Financial assets
A1 Debt securities
A2 Equities
A3 L&As to banks
A4 L&As to customers
A5 Other financial assets
B Other assets
C Financial liabilities
C1 Due to banks
C2 Due to customers
C3 Debt securities
C4 Other financial liabilities
D Other liabilities
E Financial derivatives
- Options
* Long positions
* Short positions
-other derivatives
* Long positions
* Short positions
Total assets
Total liabilities
Balance (+/-)
YenUnited
Arab Em.Items
JPY
4,039
4,067
0
0
4,039
4,067
AED
23,504
5
2,2993,588 1,867
2,140
3,588 1,867 15423,504
0
907
3,465 907
3,658 1,954
1,041
1,041
4,067
0193 00
(1,259)(20,728)
1,25910,864
(1,259)
10,864 0
(20,728)
0
20,728
2,16614,5221,223,679
2,29914,4521,207,677 81,91823,504
21,769
4,039
133(70)(16,002) (87)1,735(28)
2. Internal models and other sensitivity-analysis method
(1,050)
Currencies
155
23,107
(1,050)
82,005
80,051
182
1,772
80,051
1,122,716
4,700
4
1,094,905
84,961
86,011
Other
British
Pound
GBP CHF
Swiss
Franc
USD
US Dollar
1,137,668
1,077,064
60,604

2.4 Derivatives
A. Financial derivatives
A.1 Trading book: Year end and average notional values
1 Debt securities and interest rates
a) Options
b) Interest rates Swap
c) Forward
d) Futures
e) Others
2 Equities and shares indices
a) Options
b) Swap
c) Forward
d) Futures
e) Others
3 Exchange rates and gold
a) Options
b) Swap
c) Forward
d) Futures
e) Others
4 Goods
5 Others assets
Total
Average
A.2 Banking book: Year end and average notional values
A.2.1 Hedges
A.2.2 Others derivatives
Core
Counter-
parties
Total 2010 Total 2009
Over the counter
Core
Counter-
parties
65,019
156
65,019
underlying assets / derivatives type
60,509
60,509
1,147,801348,850
Over the counter
604,509
1,212,820
348,850 1,147,801
409,359
488,631

A.3 Financial derivatives: positive gross fair value: by instruments
A Trading book
a) Options
b) Interest rate swap
c) Cross currency swap
d) Equity swap
e) Forward
f) Futures
g) Others
B Banking book: hedges
a) Options
b) Interest rate swap
c) Cross currency swap
d) Equity swap
e) Forward
f) Futures
g) Others
C Banking book: other derivatives
a) Options
b) Interest rate swap
c) Cross currency swap
d) Equity swap
e) Forward
f) Futures
g) Others
Total
157
Over the counter
Core
Counter-
parties
Positive Fair value -
Total 2009
1,449 3,493
Positive Fair value -
Total 2010
Over the counter
Core
Counter-
parties
271
1,178
1,449
191
3,302
3,493
Portfolio / derivatives type
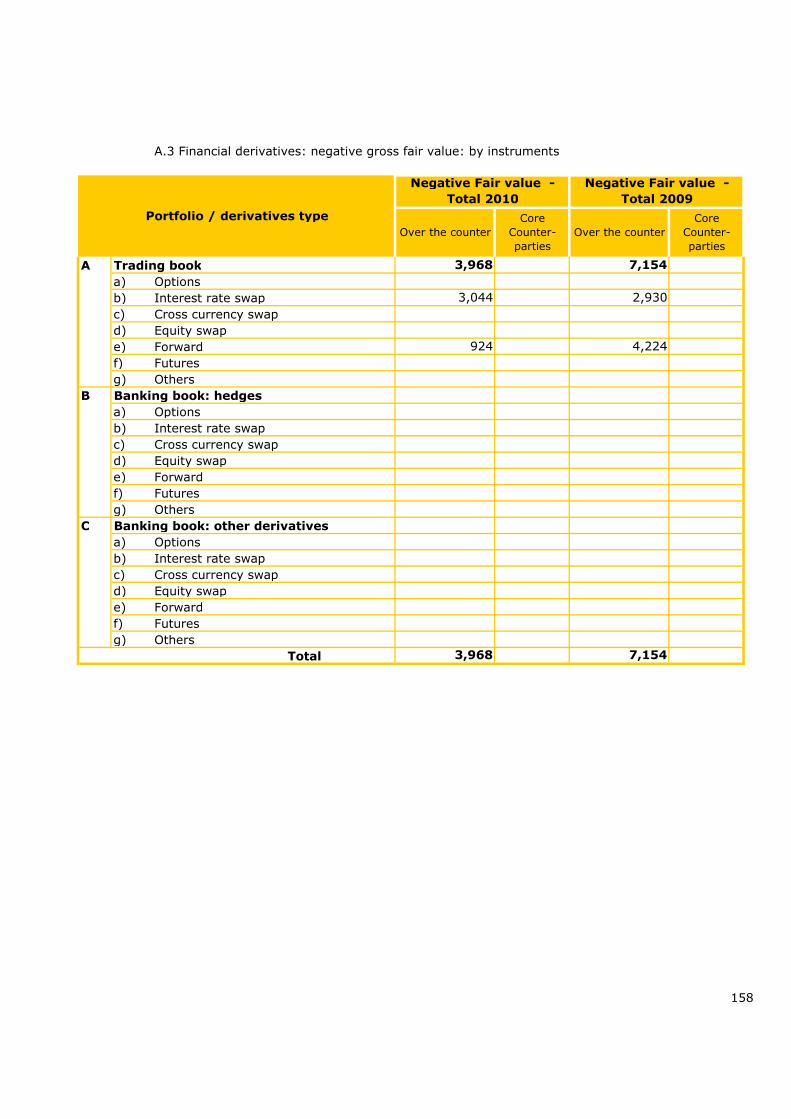
A.3 Financial derivatives: negative gross fair value: by instruments
A Trading book
a) Options
b) Interest rate swap
c) Cross currency swap
d) Equity swap
e) Forward
f) Futures
g) Others
B Banking book: hedges
a) Options
b) Interest rate swap
c) Cross currency swap
d) Equity swap
e) Forward
f) Futures
g) Others
C Banking book: other derivatives
a) Options
b) Interest rate swap
c) Cross currency swap
d) Equity swap
e) Forward
f) Futures
g) Others
Total
158
Portfolio / derivatives type
Negative Fair value -
Total 2010
Negative Fair value -
Total 2009
Over the counter
Core
Counter-
parties
Over the counter
Core
Counter-
parties
3,968 7,154
3,044 2,930
924 4,224
3,968 7,154

1) Debt securities and interest rates
- notional value
- positive fair value
- negative fair value
- future exposure
2) Equities and equity indices
- notional value
- positive fair value
- negative fair value
- future exposure
3) Currencies and gold
- notional value
- positive fair value
- negative fair value
- future exposure
4) Other
- notional value
- positive fair value
- negative fair value
- future exposure
A.5 OTC financial derivatives: regulatory trading portfolio: notional value, positive and negative
fair value by counterparties – contracts not included under netting agreements
Gov'ts &
Central
banks
Contracts not included under
netting agreements
Other
public
entities
Banks
Fin.
Compa-
nies
Insurance
Compa-
nies
Non financial
companiesOthers
A.6 OTC financial derivatives: regulatory trading portfolio: notional value, positive and negative
fair value by counterparties – contracts included under netting agreements
60,509
303
271
3,044
132,273216,577
650
642
528
282
1,759 1,021
159
A.7 OTC financial derivatives: banking book: notional value, positive and negative fair value by
counterparties – contracts not included under netting agreements
A.8 OTC financial derivatives: banking book: notional value, positive and negative fair value by
counterparties – contracts included under netting agreement

Trading book
A1
A2
A3
A4 Financial derivatives on others instruments
Banking Book
B1
B2
B3
B4 Financial derivatives on others instruments
A.10 OTC financial derivatives: financial/counterpart risk – internal models
160
Total 2009
Total 2010
348,850 60,509 0
Financial derivatives on debt
instruments and rates
Financial derivatives on equities and
shares indices
Financial derivatives on exchange
rates and gold 348,850 348,850
1,212,820
348,850 60,509 0 409,359
underlying assets / residual maturity
1,147,801 50,000 15,019
Total
60,509 60,509
Up to 1 year 1 to 5 years over 5 years
409,359
A.9 OTC financial derivatives: residual maturity - notional values
Financial derivatives on debt
instruments and rates
Financial derivatives on equities and
shares indices
Financial derivatives on exchange
rates and gold

B. Credit Derivatives
B.1 Credit derivatives: Year-end and average notional amounts
B.2 OTC Credit derivatives: Gross positive fair value – breakdown by products
B.3 OTC Credit derivatives: Gross negative fair value – breakdown by products
B.6 Residual maturity of credit derivatives: notional amounts
B.7 Credit derivatives: counterparty and financial risk - internal model
C. Credit and Financial derivatives
C.1 OTC Credit and Financial derivatives: net fair value and future exposure by counterparty
161
B.4 OTC Credit derivatives: gross (positive and negative) fair value by counterparts - contracts
not included under netting agreements
B.5 OTC Credit derivatives: gross (positive and negative) fair value by counterparts - contracts
included under netting agreements
Section 3 – Liquidity risk
QUALITATIVE INFORMATION
A. General aspects
162
Banks do not need to calculate an additional capital requirement against liquidityrisk under the Pillar II framework (Liquidity risk refers to a counterparty's failureto meet payment obligations as a result of a sudden inability to raise thenecessary funds on the market and/or to liquidate positions in financialinstruments promptly). They must, however, guard against liquidity risk byadopting suitable monitoring and audit procedures which have scope for scenario(what-if) analyses and stress tests in relation to prospective liquidity crises in themarket. Unlike its approach to interest rate risk, Banca d’Italia does not foresee acore risk indicator and a corresponding operating limit for liquidity risk. Instead, itcalls for the implementation of a risk management system that includes scenarioanalyses and internal policies for mandatory operating limits, as well as suitablecontingency planning.
The Bank relies on Master Finance to monitor liquidity (as represented bymismatchings between incoming and outgoing cash flows for any given maturity).For ICAAP purposes, it relies on an ALM product to conduct maturity ladderanalyses and devise scenarios on which to base yearly stress testing by the RiskManagement unit.
B. Risk management processes and measuring methods
Banca UBAE invests primarily on the interbank money market. Risk Managementand the Treasury Division are constantly evaluating the possibility of securingspecial credit lines to deal with potential liquidity crises.
To complete the risk management process (and comply with the regulations inforce), the Bank has adopted both a revised internal policy and a liquiditycontingency plan to comply with recent updates to rules concerning liquidity.While the former was meant to establish decision-making guidelines, allocate rolesand duties among the units concerned and define internal operating limits, thelatter contains a set of warning signals that can highlight a crisis and thus facilitateappropriate and timely action by the competent bodies.


QUANTITATIVE INFORMATION
A Cash assets
A1 Gov't securities
A2 Listed debt securities
A3 Holdings in UCIs
A4 L&As
- to banks
- to customers
B Cash liabilities
B Deposits and A/C
- from banks
- form customers
B2 Debt securities
B3 Other liabilities
C OBS transactions
C1 Financial derivatives with capital exchange
* long positions
* short position
C2 Financial derivatives without capital exchange
* long positions
* short position
C3 Deposits and loans to be settled
* long positions
* short position
C4 Irrevocable commitments to disburse funds
* long positions
* short position
C.5 Financial guarantees issued
163
1.A Financial assets and liabilities: Breakdown by residual contractual maturity – EUR
31,237
Sight 1 to 7 daysover 7 to
15 daysItems / maturity ladder
586,723
over 15
days to 1
month
446,530 30,407
586,723 446,530 30,407 31,237
585,844 419,085 718 29,877
879 27,445 29,689 1,360
1,512,313 55,480 14,152 141,297
1,512,313 55,480 14,152 141,297
815,066 55,430 13,996 139,982
697,247 50 156 1,315
(6,351) 33,841 0 (9,498)
33,841 0 (9,498)
0 40,331 45,000 8,431
0 6,490 45,000 17,929
(2,773)
271 0 0 0
3,044 0 0 0
0
(3,578)
3,578 0 0 0

(following)
164
0
14,430 333,093 9,606
0 574
248,429 78,416 289,880 83,606 5,387
0
4,866 32,428 5,387
285,014 51,178
165,127 26,632 7,845 28,006 70,006
0 0
70,006
7,845 28,006 70,006
7,845 28,006
0196 1,607
0
00 0
(1,050) 0
(1,050) 0
0
0 0 0
0 0
0 0 0 0 0
00 0
0 0
78,545
Over 1 month up
to 3 months3 to 6 months Indefiniteover 5 yearsover 1 year6 to 12 months
304,310248,429 417,273 14,993
198,676 45,195
0
0 129
0
25,025
26,632
49,753 33,221
165,127
164,931
080,196
0
81,246 0
0
0
0

A Cash assets
A1 Gov't securities
A2 Listed debt securities
A3 Holdings in UCIs
A4 L&As
- to banks
- to customers
B Cash liabilities
B Deposits and A/C
- from banks
- form customers
B2 Debt securities
B3 Other liabilities
C OBS transactions
C1 Financial derivatives with capital exchange
* long positions
* short position
C2 Financial derivatives without capital exchange
* long positions
* short position
C3 Deposits and loans to be settled
* long positions
* short position
C4 Irrevocable commitments to disburse funds
* long positions
* short position
C.5 Financial guarantees issued
165
1.B Financial assets and liabilities: Breakdown by residual contractual maturity – USD
442,003 598 19,755 8,232
442,003 598 19,755 8,232
441,993 598 19,755 8,153
10 0 0 79
179,403 63,331 147,255 135,717
179,403 63,331 147,255 135,717
119,145 63,331 147,101 135,634
60,258 0 154 83
(1,424) (24,797) 18 9,432
(32,346) 18 9,432
0 6,434 44,748 10,183
0 38,780 44,730 751
0
0 0 0 0
0 0 0 0
7,549
0 7,549 0 0
0 0 0 0
(1,424)
1,424 0 0 0
Items / maturity ladder Sight 1 to 7 daysover 7 to
15 days
over 15
days to 1
month

(following)
166
509,415 24,590 65,723 47,696 4,700
0 0 0 0 3,881
0 0 0 0 819
509,415 24,590 65,723 47,696 0
501,263 20,749 63,933 38,461 0
8,152 3,841 1,790 9,235 0
562,559 49,403 0 0 0
562,559 49,403 0 0 0
562,450 49,403 0 0 0
109 0 0 0 0
0 0 0
5,514 2,853 5,930 1,424
13,063 2,853 5,930
13,063 4,602 5,930 0 0
0 1,749 0 0 0
0 0 0 0 0
0 0 0 0 0
(7,549)
0 0 0
7,549 0 0
0 1,424
1,424
Over 1 month up
to 3 months3 to 6 months 6 to 12 months
0 0
over 1 year over 5 years Indefinite

A Cash assets
A1 Gov't securities
A2 Listed debt securities
A3 Holdings in UCIs
A4 L&As
- to banks
- to customers
B Cash liabilities
B1 Deposits and A/C
- from banks
- form customers
B2 Debt securities
B3 Other liabilities
C OBS transactions
C1
* long positions
* short position
C2
* long positions
* short position
C3
* long positions
* short position
C4
* long positions
* short position
C.5 Financial guarantees issued
1,743
167
1.C Financial assets and liabilities: Breakdown by residual contractual maturity – GBP
0 9,121
133
133 0
2,563
112
2,442
over
15
days
to1
month
217
217
217
11621
9,121
0 0
0
0
1,743
0
2,563906 56
0 2,447
906 56 0
906 0
2,442
929
929 0
0 2,442
0929
Items / maturity ladder
Over
5years
Indefinite
over
1m
onth
to3
month
s
over
6to
12
month
s
over
3to
6m
onth
s
over
1year
Sig
ht
1to
7days
over
7to
15
days
Financial derivatives with
capital exchange 0 0
0 56
Financial derivatives without
capital exchange
Deposits and loans to be
settled
Irrevocable commitments to
disburse funds

A Cash assets
A1 Gov't securities
A2 Listed debt securities
A3 Holdings in UCIs
A4 L&As
- to banks
- to customers
B Cash liabilities
B1 Deposits and A/C
- from banks
- form customers
B2 Debt securities
B3 Other liabilities
C OBS transactions
C1
* long positions
* short position
C2
* long positions
* short position
C3
* long positions
* short position
C4
* long positions
* short position
C.5 Financial guarantees issued
(1,607)
80,051
80,051
(1,607)
1,607
over
1m
onth
to3
month
s
168
354
172
1,867
354 1,600
0 0 0
1,867
1,867
1.D Financial assets and liabilities: Breakdown by residual contractual maturity – CHF
182
0
0
1,607
0 0 0
1,607
over
6to
12
month
s
over
1year
Over
5years
over
15
days
to1
month
Indefinite
over
3to
6m
onth
s
Items / maturity ladder
Sig
ht
1to
7days
over
7to
15
days
0
1,600
0 0
1,600
Financial derivatives with
capital exchange 0
0
Financial derivatives without
capital exchange
Deposits and loans to be
settled 1,607
Irrevocable commitments to
disburse funds

A Cash assets
A1 Gov't securities
A2 Listed debt securities
A3 Holdings in UCIs
A4 L&As
- to banks
- to customers
B Cash liabilities
B1 Deposits and A/C
- from banks
- form customers
B2 Debt securities
B3 Other liabilities
C OBS transactions
C1
* long positions
* short position
C2
* long positions
* short position
C3
* long positions
* short position
C4
* long positions
* short position
C.5 Financial guarantees issued
(4,077)
0
over
7to
15
days
0
4,077
0
over
6to
12
month
s
169
17
1.E Financial assets and liabilities: Breakdown by residual contractual maturity – JPY
Items / maturity ladder
Sig
ht
1to
7days
90
90
0
0
90
4,050 0
17
17 4,050 0
4,077 (4,077)
0
0
0
Over
5years
Indefinite
0 3,490 459
over
1m
onth
to3
month
s
over
3to
6m
onth
s
over
1year
over
15
days
to1
month
3,490 459
3,490 459
4,050 0
Financial derivatives without
capital exchange
Financial derivatives with
capital exchange 0
0
Deposits and loans to be
settled 4,077
4,077
Irrevocable commitments to
disburse funds 0
0

A Cash assets 0
A1 Gov't securities
A2 Listed debt securities
A3 Holdings in UCIs
A4 L&As 0
- to banks
- to customers 0
B Cash liabilities 0
B1 Deposits and A/C 0
- from banks 0
- form customers
B2 Debt securities
B3 Other liabilities
C OBS transactions 0
C1
* long positions 0
* short position
C2
* long positions
* short position
C3
* long positions
* short position
C4
* long positions
* short position
C.5 Financial guarantees issued
5,918
(5,918)
(5,918)
7,008
7,008
408
408
408
2,875
2,875
0
2,875
over
1m
onth
to3
month
s
12,202
12,202
12,202
11,953 2,857
(11,953)
(11,953)0
(2,857)
(2,857)
22
22
0
0
Sig
ht
1,419
1to
7days
611
611
611
1,419
1,419over
15
days
to1
month
over
7to
15
days
170
Irrevocable commitments to
disburse funds
Deposits and loans to be
settled
Financial derivatives without
capital exchange
Financial derivatives with
capital exchange
over
1year
Over
5years
Indefinite
over
6to
12
month
s
over
3to
6m
onth
s
22
1.F Financial assets and liabilities: Breakdown by residual contractual maturity – AED
Items / maturity ladder
7,008

A Cash assets
A1 Gov't securities
A2 Listed debt securities
A3 Holdings in UCIs
A4 L&As
- to banks
- to customers
B Cash liabilities
B1 Deposits and A/C
- from banks
- form customers
B2 Debt securities
B3 Other liabilities
C OBS transactions
C1
* long positions
* short position
C2
* long positions
* short position
C3
* long positions
* short position
C4
* long positions
* short position
C.5 Financial guarantees issued
1,639
(1,639)
7
7
1.G Financial assets and liabilities: Breakdown by residual contractual maturity – other
currencies
171
1,511
Items / maturity ladder
Indefinite
Over
5years
154
Sig
ht
1to
7days
over
15
days
to1
month
over
7to
15
days
7
154
622154
0
0
0
1,259
(1,639)
1,639
1,511
1,511
over
3to
6m
onth
s
over
6to
12
month
s
over
1year
over
1m
onth
to3
month
s
Financial derivatives with
capital exchange (1,259)
Financial derivatives without
capital exchange
Deposits and loans to be
settled 1,639
Irrevocable commitments to
disburse funds
380
622

Section 4 – Operational risk
QUALITATIVE INFORMATION
A. General aspects
B. Risk management processes and measuring methods
QUANTITATIVE INFORMATION
123
172
6,840
Advanced method
Basic indicator approachStandardized approach
To improve the quality and smooth flow of all processes, the Regulatory Development Dept.
conducts yearly self risk appraisal sessions with backing from the Risk Management and
Compliance Unit and Internal Auditing. Attended by the heads of the Bank's main business and
supporting units, they aim to identify the areas where operational risk is a potential problem and
devise appropriate remedies where needed .
Total 20096,840
7,659OPERATIONAL RISK
Total 20107,659
Before any new products or services are introduced, a thorough assessment of the risks
associated with the new activity is drawn up by the Treasury Division jointly with the IT &
Organization Division, the Risk Management unit and the Internal Auditing. and is then
submitted to Senior Management.
Banca UBAE calculates its capital requirement against operational risks by applying the Basic
Indicator Approach, in conformity with central bank regulations.
At the moment there are no plans to apply for a shift to the Standardized Approach.

Section 5 – Other Risks: Counterparty and Settlement Risk
QUALITATIVE INFORMATION
Other financial assets
173
A. General aspects, risk management processes and measuring methodsfor counterparty risk
Dealing in OTC interest- and exchange-rate derivatives generates the risk that acounterparty will default on its contractual payment obligations when these fall due.
Counterparty risk is monitored, both as a whole and with reference to specific kindsof exposure, by the MF front-office system which manages the entire limitframework.
Banking and corporate counterparties authorized to negotiate forward derivativesare granted ad hoc credit lines by the Board of Directors, the Credit Committee orother competent bodies or officials.
Limits are monitored by MF through the daily recalculation of all outstandingpositions on the basis of the latest prices.
A warning signal is triggered on reaching (90%) of the limit so that the situationcan be duly analysed and appropriate action taken including, possibly, a freeze ondealings with the counterparty concerned.
B. General aspects, risk management processes and measuring methodsfor settlement risk
Settlement risk is kept to a minimum because the negotiation of forex and otherfinancial instruments both listed and unlisted (aside from OTC derivatives, whichgenerate counterparty risk) is always subject to a payment-versus-delivery clause.

174
Section 1 – Shareholders’ equity
A.QUALITATIVE INFORMATION
B.QUANTITATIVE INFORMATION
B.1 Shareholders’ equity: Composition
1
2
3
4
5
6
7
Total 2010 Total 2009
Share capital 151,061 151,061
Share premium account 16,702 16,702
Reserves: 25,418 17,333
of equity: 25,418 17,333
a) Legal reserve 9,703 9,298
b) Extraordinary reserve
c) own shares
d) other 15,715 8,035
other reserves
Capital instruments
(Treasury stock)
Valuation reserves 733 285
-Financial assets available for sale 733 285
-Tangible fixed assets
-Intangible fixed assets
-Hedging for foreign investments
-Cash flow hedges
-Forex differentials
-Non-current assets being divested
-Actuarial profit (loss) on defined-benefit plans
-Special revaluation laws
Profit (Loss) for the year 8,401 8,085
PART F
INFORMATION ON SHAREHOLDERS’ EQUITY
Total 202,315 193,466
-Valuation reserves booked to shareholders’
equity

B2. Valuation reserves relating to financial assets available for sale: composition
1234
Total
B3. Valuation reserves relating to financial assets available for sale: Yearly variations
12
2.12.2
2.33
3.13.23.3
3.44
175
733
Loans
285Opening BalanceIncreases
Closing Balance
Income statement reversal of
negative reserves
- from disposals
Debt
Securities
Equity
and
Holdings in
UCI
449449
Other decreases
- from impairment
11
Decreases
Total 2009Positive
reserve
Negative
reserve
Income statement reversal of
positive reserves: from
Fair value adjustments
Fair value adjustmentsImpairment write-downs
Other increases
Loans
Total 2010Positive
reserve
Negative
reserve733
EquitiesHoldings in UCI
Debt securities
733
285
285

Section 2 – Regulatory capital and capital ratios
2.1 Regulatory capital
A. QUALITATIVE INFORMATION
1. Tier 1 capital
Tier 1 capital includes the following accounting items:
1. share capital
2. legal reserve
3. extraordinary reserve
4. share premium account
5. FTA–IAS reserve
6. IAS 2005 retained profit reserve
7. retained profit
net of residual value of intangible assets.
2. Tier 2 capital
Tier 2 capital includes:
1. subordinated loans
2. 50% of valuation reserves, reckoned after tax
3. Tier 3 capital
176
Consisting in the portion of subordinated loans exceeding 50% of Tier 1 capital, Tier 3
capital formed part of the Bank’s regulatory capital in the 2008 balance sheet but was
non-existent as at 31.12.2009 and 31.12.2010

B. QUANTITATIVE INFORMATION
AB
B.1B.2
CDEFG
G.1G.2
HIJK
LMN
177
Total 2010 Total 2009
199,362 192,833
199,362 192,833
199,362 192,833
78,346 85,876
(247) (96)
(247) (96)
78,099 85,780
78,099 85,780
277,461 278,613
Tier 2 capital prudential filters
Total Tier 2 capital (H-I)
Eligible capital (E+J-K)
Item to be deducted from Tier 2 capital
positive IAS/IFRS prudential filtersnegative IAS/IFRS prudential filters
Tier 2 capital before deductible item (F+G)
Eligible capital inclusive of TIER 3 capital (L+M)
277,461 278,613
Tier 3 capital (TIER 3)
Tier 1 capital prudential filtersTier 1 capital before prudential filters
Tier 1 capital before deductible items (A+B)
Total capital (TIER1)(C-D)
positive IAS/IFRS prudential filtersnegative IAS/IFRS prudential filters
Items to be deducted from Tier 1 and Tier 2
combined total
Tier 1 deductible items
TIER 2 capital before prudential filters

2.2 Capital adequacy
A. QUALITATIVE INFORMATION
178
The Bank’s capital adequacy self-assessment process was designed to reflect theproportionality principle as allowed by Banca d’Italia for Class 3 credit institutions. Itspurpose is to guarantee ongoing compliance with capital requirements - in relation bothto Pillar I risks and to those Pillar II risks that are quantifiable by accepted simplifiedmethods - as well as to provide the Board of Directors and Senior Management with theinformation they need to chart the Bank’s capital enhancement policies effectively andefficiently.
To achieve that dual aim, and granted the degree of approximation which the use ofstandardized methods implies, the process focuses on measuring and monitoring fourkey quantities:
total internal capital, i.e., the sum of capital requirements against the various types ofrisk contemplated in Pillar I (credit risk, market risk, operational risks) and Pillar II(credit concentration risk associated with individual counterparties or groups ofconnected counterparties, interest rate risk in the banking book), as applying at the endof the relevant accounting period;
total internal capital under stressed conditions, i.e., total internal capital as applyingat the end of the relevant accounting period but modified to take account of stressscenarios for credit risk, single-name credit concentration risk and interest rate risk inthe banking book;
prospective internal capital, i.e., the total internal capital amount that obtains byapplying standardized computation methods to the Bank’s assets and liabilities asapproved following the planning-and-budgeting process;
total capital, i.e., the sum of all capital resources and hybrid capitalization toolsavailable to the Bank for the purpose of meeting its internal capital requirement andthus the unexpected losses associated with the various types of risk. Total capital willsometimes exceed eligible capital, since the definition of the former includes factorswhich may not be included in the latter.

B. QUANTITATIVE INFORMATION
AA1 Credit and counterparty risk
1 Standard methodology2 Methodology based on Internal ratings
2.1 based2.2 advanced
3 Securitization
BB1B2
123
B3123
B4B5B6
CC1C2C3
179
Non-Weighted
amountWeighted amount
Total
2009
Total
2010
Total
2010
Total
2009
1,235,8411,503,077
19,348
100,415
2,4182,418
1,370,908
6,8406,840
109,673
120,246
2,911
0
2,911
7,659
14.07%
20.32%
7,659
130,816
1,635,198
12.19%
16.97%
Tier 1 capital ratio (Tier 1 capital/risk weighted assets)
Total capital ratio (Eligible capital/risk weighted assets)
Risk weighted assets
3,937,734 3,259,771
Categories/Values
CAPITAL REQUIREMENTSCREDIT AND COUNTERPARTY RISK
RISK ASSETS
0 1,548
MARKET RISKStandard MethodologyInternal ModelsCredit concentration Risk
OPERATIONAL RISKBasic indicator approachStandardized approachAdvanced method
Other capital requirements
TOTAL CAPITAL REQUIREMENTS
RISK ASSETS AND CAPITAL RATIOS
Other factors

180
Section 1 – Transactions completed during the period
1.1 Mergers
1.1.1 Other information relevant to mergers
1.2.1 Yearly variations in goodwill
1.2.2 Other
Section 2 – Transactions completed after year-end
2.1 Mergers
PART G
MERGERS INVOLVING CORPORATE UNITS OR
LINES OF BUSINESS

181
1. Compensation of Directors, Auditors and Management
(1)
(2)
(3)
(2) allocations to the severance fund
2. Dealings with connected parties
2.1 Dealings with the lead shareholder
31/12/2010126
1,481,912
17,913
DescriptionFinancial assets
Financial liabilities
Guarantees outstanding
Other benefits
2,429
58
372
1,285
Short-term benefits1,024
120- Directors- Auditors- ManagementPost-severance benefits
Description 2010
Dealings with the Bank's lead shareholder form part of its ordinary business operations
and are conducted at market prices, as with unrelated parties of similar credit standing.
(3) other benefits sanctioned by the law or the Internal Regulations including Directors'
travel expenses
(1) fixed and variable amounts payable to Directors and Auditors plus senior managers’
salaries and social charges
PART H
DEALINGS WITH CONNECTED PARTIES
As far as costs and revenues:
Description Costs RevenuesLetters of Credits 2 100
Letters of Guarantees 120
Deposits 5,048
Subordinated Loans 2,166
Current Accounts 324

182
QUALITATIVE INFORMATION
1. Description of payment agreements based on the bank’s own capital instruments
QUANTITATIVE INFORMATION
1. Yearly changes
2. Other information
PART I
PAYMENT AGREEMENTS BASED ON THE BANK’S
OWN CAPITAL INSTRUMENTS

183
PART L
SEGMENT REPORTING