banco fibra - presentation september 2008 results
TRANSCRIPT


Mr. Cassio Von Gal Financial & International Executive Director Member of the Executive Committee Tel: (5511) 38 47 67 67 [email protected] Mrs. Priscilla Lopez Head of Correspondent Banking Tel: (5511) 38 47 68 94 [email protected] Mr. Felipe Tavares Correspondent Banking Tel: (5511) 38 47 67 15 [email protected] Mr. Fabiano Tomita Head of Financial Institutions & Capital Markets Tel: (5511) 38 47 65 61 [email protected] Mr. Guilherme Gottardi Sales & Distribution Tel: (5511) 38 47 66 98 [email protected] Mrs. Fernanda Pereira Sales & Distribution Tel: (5511) 38 47 65 96 [email protected] Mr. Samuel Storch Financial Institutions Tel: (5511) 38 47 68 10 [email protected] Mrs. Renata Zaghen Financial Institutions Tel: (5511) 38 47 65 61 [email protected]
Contact Information

Organizational Chart
Shareholding Structure
IFC
VicunhaTêxtil
CSN
Vicunha Group
GVI Promotora
Banco Fibra S.A.Vicunha
SiderurgiaCEGAS
41.50%100.00%96.00%
45.00% 100.00%
7.9%92.1%100.00%
Fibra Realty
IFC
VicunhaTêxtil
CSN
Vicunha Group
GVI Promotora
Banco Fibra S.A.Vicunha
SiderurgiaCEGAS
41.50%100.00%96.00%
45.00% 100.00%
7.9%92.1%100.00%
Fibra Realty
Executive Committee
Ricardo Steinbruch
President
Board of Directors
Ricardo Steinbruch
President
4 representatives of the controlling
shareholder
2 Independent members
1 Member appointed by the
IFC
Board of Directors
Ricardo Steinbruch
President
4 representatives of the controlling
shareholder
2 Independent members
1 Member appointed by the
IFC
Cassio Von Gal
Executive Director
Maercio Soncini
Executive VP
Marcio Ronconi
Executive VP
Osias Brito
Executive VP
Luiz Jardim
Executive Director
Cassio Von Gal
Executive Director
Maercio Soncini
Executive VP
Marcio Ronconi
Executive VP
Osias Brito
Executive VP
Luiz Jardim
Executive Director
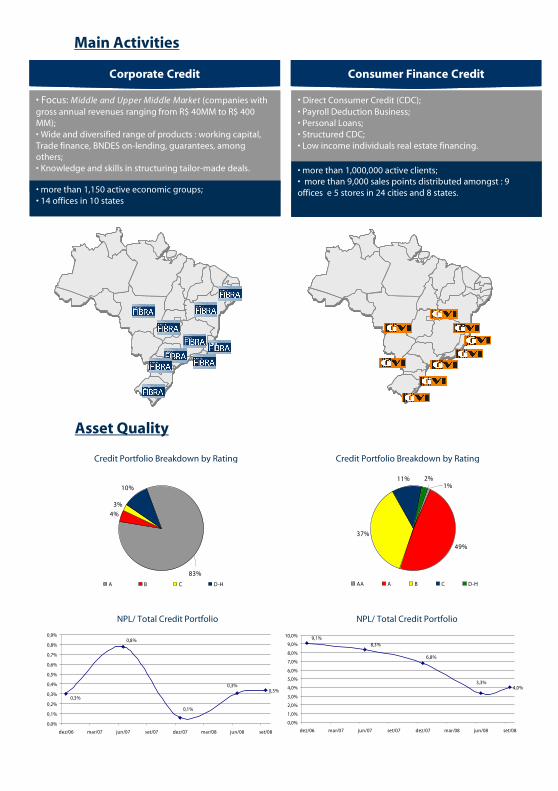
Main Activities
RS
SC
PR
SP
MG
GO
MT
AC
AM
RR
ROBA
PI
MAPA
AP
TO
CERN
PEAL
SE
MS
RJ
ES
DF
PB
RS
SC
PR
SP
MG
GO
MT
AC
AM
RR
ROBA
PI
MAPA
AP
TO
CERN
PEAL
SE
MS
RJ
ES
DF
PB
RS
SC
PR
SP
MG
GO
MT
AC
AM
RR
ROBA
PI
MAPA
AP
TO
CERN
PEAL
SE
MS
RJ
ES
DF
PB
RS
SC
PR
SP
MG
GO
MT
AC
AM
RR
ROBA
PI
MAPA
AP
TO
CERN
PEAL
SE
MS
RJ
ES
DF
PB
RS
SC
PR
SP
MG
GO
MT
AC
AM
RR
ROBA
PI
MAPA
AP
TO
CERN
PEAL
SE
MS
RJ
ES
DF
PB
RS
SC
PR
SP
MG
GO
MT
AC
AM
RR
ROBA
PI
MAPA
AP
TO
CERN
PEAL
SE
MS
RJ
ES
DF
PB
RS
SC
PR
SP
MG
GO
MT
AC
AM
RR
ROBA
PI
MAPA
AP
TO
CERN
PEAL
SE
MS
RJ
ES
DF
PB
RS
SC
PR
SP
MG
GO
MT
AC
AM
RR
ROBA
PI
MAPA
AP
TO
CERN
PEAL
SE
MS
RJ
ES
DF
PB
Corporate Credit Consumer Finance Credit
• Focus: Middle and Upper Middle Market (companies with gross annual revenues ranging from R$ 40MM to R$ 400 MM);• Wide and diversified range of products : working capital, Trade finance, BNDES on-lending, guarantees, among others;• Knowledge and skills in structuring tailor-made deals.
• Direct Consumer Credit (CDC);• Payroll Deduction Business;• Personal Loans;• Structured CDC;• Low income individuals real estate financing.
• more than 1,150 active economic groups;• 14 offices in 10 states
• more than 1,000,000 active clients;• more than 9,000 sales points distributed amongst : 9 offices e 5 stores in 24 cities and 8 states.
0,3%
0,3%
0,8%
0,3%
0,1%
0,0%
0,1%
0,2%
0,3%
0,4%
0,5%
0,6%
0,7%
0,8%
0,9%
dez/06 mar/07 jun/07 set/07 dez/07 mar/08 jun/08 set/08
4,0%3,3%
6,8%
8,3%9,1%
0,0%
1,0%
2,0%
3,0%
4,0%
5,0%
6,0%
7,0%
8,0%
9,0%
10,0%
dez/06 mar/07 jun/07 set/07 dez/07 mar/08 jun/08 set/08
49%
37%
11% 2%1%
AA A B C D-H
4%
3%
10%
83%
A B C D-H
Asset Quality
Credit Portfolio Breakdown by Rating Credit Portfolio Breakdown by Rating
NPL/ Total Credit Portfolio NPL/ Total Credit Portfolio

Bonds - outstanding issuancesMaturity Issue Date Amount Tenor Coupon
Fibra 6,50% Feb/09 Feb/06 USD 50 MM 3 Years 6,50%
Fibra 7,50% Dec/09 Dec/06 USD 75 MM 3 Years 7,50%
Fibra 6,75% Apr/10 Apr/08 USD 150 MM 2 Years 6,75%Fibra 7,00% jul/11 jul/08 USD 150 MM 3 Years 7,00%
Total Amount USD 425 MM
Other Issuances - outstanding amountsDate Amount Tenor
Subordinated debt Mar/06 USD 30 MM 10 Years
Subordinated debt May/07 R$ 76 MM 5 Years
Subordinated debt Oct/07 R$ 20 MM 5 Years
A Loan Sep/07 USD 40 MM 5 yearsB Loan Sep/07 USD 160 MM 3 Years
A Loan Jul/07 USD 30 MM 7 Years
B Loan Aug/08 USD 70 MM 3 Years
CCC Sep/08 USD 39 MM 3 Years
EDC Sep/08 USD 28 MM 1 Year
Clean Lines Sep/08 USD 44 MM 1 YearOPIC Sep/08 USD 20 MM 5 Years
Total amount in USD USD 461 MMTotal amount in Reais R$ 96 MM
Capital IncreasesDate Amount
Capital Increase Jun/07 USD 20 MM
Capital Increase Jul/08 R$ 275 MM
Trade Finance Date Amount
Trade Portfolio Sep/08 USD 498 MM
0
200.000.000
400.000.000
600.000.000
800.000.000
1.000.000.000
1.200.000.000
30/06/0
8
07/07/0
8
14/07/0
8
21/07/0
8
28/07/0
8
04/08/0
8
11/08/0
8
18/08/0
8
25/08/0
8
01/09/0
8
08/09/0
8
15/09/0
8
22/09/0
8
29/09/0
8
06/10/0
8
13/10/0
8
20/10/0
8
27/10/0
8
03/11/0
8
Am
oun
t in
Rea
is
Fund raising until Sep/08
Liquidity – Evolution of the Overnight Cashflow

Credit Portfolio * - by Tenor R$1.000
Sep/08 Jun/08 Dec/07 Jun/07 Dec/06
up to 90 days 2.091.934 1.723.844 1.335.838 1.200.457 1.009.074 From 91 to 180 days 674.736 597.723 530.919 424.000 417.670 From 181 to 360 days 502.416 565.525 448.156 385.464 345.510 Over 360 days 516.445 594.682 569.179 489.377 341.339
Total 3.785.531 3.481.774 2.884.093 2.499.298 2.113.593
Total Funding - by Tenor R$ 1.000
Sep/08 Jun/08 Dec/07 Jun/07 Dec/06
up to 90 days 1.718.564 1.422.472 1.583.571 1.532.270 1.565.732 From 91 to 180 days 960.766 476.626 658.866 392.352 183.716 From 181 to 360 days 609.155 510.739 191.622 272.938 75.579 Over 360 days 1.448.448 1.580.574 1.063.695 667.274 603.777
Total 4.736.932 3.990.411 3.497.754 2.864.834 2.428.804
* Credit Portfolio that requires the use of proprietary funding
Credit PortfolioBreakd ow n by Tenor *
55%
18%
13%
14%
up to 90 days
From 91 to 180 days
From 181 to 360 days
Over 360 days
Total FundingBreakd ow n b y Ten or
36%
20%
13%
31%
up to 90 days
From 91 to 180 days
From 181 to 360 days
Over 360 days
Credit Portfolio vs. Funding positions

Balance Sheet Highlights R$ MM
Sep/08 Jun/08 Dec/07 Jun/07 Dec/06
Total Assets 17.535 16.149 13.808 12.133 8.326
Credit Portfolio 5.319 5.053 4.479 3.938 3.244
Securities Portfolio 2.727 2.144 1.929 3.590 3.951 Total Funding 4.737 3.990 3.498 2.865 2.429
Net Worth * 782 775 505 497 433
* does not include the sub-bebt issuances
Statement of Income R$ MMSep/08 Jun/08 Dec/07 Jun/07 Dec/06
Gross income from Financial Operations 141 153 237 101 173
Non Operating Income / Expense (1,8) (0,8) 38 (0,1) (4,4)
Operating Income 80 62 130 44 103
Administrative & Personnel Expenses (144) (82) (116) (54) (76) Income Before Taxes and Social Contribution 78 61 168 44 99
Net Income 90 60 69 27 64
Financial RatiosSep/08 Jun/08 Dec/07 Jun/07 Dec/06
Performance RatioReturn on Average Equity (ROAE) 20,7% 23,8% 14,8% 12,0% 15,4%
Balance Sheet RatiosTotal Credit Portfolio / Total Assets 30,3% 31,3% 32,4% 32,5% 39,0%
Tier 1 & Tier 2 BIS Ratio 14,3% 15,3% 13,2% 14,3% 13,7%
Asset Quality RatiosNon-Performing Loans / Credit Portfolio 0,8% 0,7% 0,8% 1,6% 1,2%Reserves for loan losses / Credit Portfolio 2,7% 2,5% 2,5% 2,1% 1,8%
Ratings
Financials
Brazilian Scale Long Term A1.brPositive Outlook on September 08
Brazilian Scale Long Term A-Upgrade on July 08
Foreign Currency Long Term BB-
Brazilian Scale Long Term brA-Upgrade on August 08
Brazilian Scale Long Term A1.brPositive Outlook on September 08
Brazilian Scale Long Term A1.brBrazilian Scale Long Term A1.brPositive Outlook on September 08
Brazilian Scale Long Term A-Upgrade on July 08
Brazilian Scale Long Term A-Brazilian Scale Long Term A-Upgrade on July 08
Foreign Currency Long Term BB-
Brazilian Scale Long Term brA-Upgrade on August 08
Foreign Currency Long Term BB-
Brazilian Scale Long Term brA-Upgrade on August 08
