banco santander (brasil) · pdf filesource:anfavea top 10 on vehicles industry 4 new car sales...
TRANSCRIPT

Banco Santander (Brasil)
JP Morgan Field Trip
Mar, 2012.

Santander Financiamentos
Felix Cardamone
Head of Consumer Finance Brazil
Mar, 2012.

Agenda
I. Vehicles Market Overview
II. Santander Financiamentos
Loan Portfolio & Restructuring Plan
WebMotors
Risk Management
3

Source:ANFAVEA
Top 10 on Vehicles Industry
4
New Car Sales
China 12,668
USA 11,535
Japan 3,825
Germany 3,137
Brazil 3,096
India 2,567
France 2,406
Russia 2,402
United Kingdom 2,064
Italy 1,794
Vehicles Market
Source:ANFAVEA
2011
Millions

Sourcee: FENABRAVE/CETIP
Vehicles Sales (Units Sold - Million)
+17% +5%
+23%
Vehicles Market in Brazil 5

6
Vehicles Sales
Sourcee: FENABRAVE/CETIP
(Units - Thousand)
New Cars
-23%
0%
Used Cars
Motorcycles
-20%
-2%
-20%
+1%

Agenda
I. Vehicles Market Overview
II. Santander Financiamentos
Loan Portfolio & Restructuring Plan
WebMotors
Risk Management
7

29,1 29,8 30,2 30,8 32,7
35,6
3Q10 4Q10 1Q11 2Q11 3Q11 4Q11
Consumer Finance - Breakdown Dec/11
Total Loan Portfolio – Consumer Finance
22.4%
8.8%
R$ billion
Part. (%) – Consumer Finance / Total Loans
Santander Loan Portfolio – Consumer Finance (BR GAAP)
Vehicles & Motorcycles
Trucks
Consumer Credit
18%
82%
Santander
Financiamentos
Source: CFO Financeira (dec/11).
BR GAP: 100% Renault Portfolio
8

Integration of Banco Real and Santander:
Aymoré+Olé =
2008 2009 2010 2011
Restructuring Plan
Aymoré +
competitive
End of the restructuring process
and launch of new brand
Focus on
Profitability
Evolution of Management
Market Share Growth with Profitability
Strategic Pillars
Commercial structure focused on high productivity
Automatic credit analysis response
Redirection of collection to the Bank Risks
Products portfolio and operational processes review, operations and collected vehicles management
Commercial Strategy
Risk Management
Products & Operations
New management model and creation of committees to manage the business
Institucional
Restructuring Plan 9

10
10
Source: - Brazil Central Bank
- Competition: Investors Relationship sites
Loans Portfolio Market Share – Individuals (BR GAAP)
Santander: 100% Renault and Branches Channel
Bank 1
Bank 2
Bank 3
Agenda
I. Vehicles Market Overview
II. Santander Financiamentos
Loan Portfolio & Restructuring Plan
WebMotors
Risk Management
11

Magazines “Quatro Rodas” and “Exame”
www.webmotors.com.br
Website Leader at Brazilian Internet Automotive Sector:
– More than 4 thousand dealers with active packs and, at least, one classified ad published in a month
– 13 million unique visitors per month
“93% of Brazilian research online before buying a car”
12
Top of mind
First Choice
Usage
Source: WebMotors BI and 2010 Research
Santander Financiamentos – Internet Business

Source: WebMotors.
Unique visitors per month New and used car dealers as client
8
13
Jan/10 Dec/11 Jan/10 Dec/11
4.208
2.683
Active auto adds
Jan/10 Dec/11
159
108
13 WebMotors.com.br
(# Millions) (#)
(# Thousand)

Agenda
I. Vehicles Market Overview
II. Santander Financiamentos
Loan Portfolio & Restructuring Plan
WebMotors
Risk Management
14

15
Santander presents growth but
below market
Reference: Febraban
Não inclui canal interno.
Santander inclui Renault 100%, demais Instituições contemplam (Banco Ford, Banco Fiat).
15
Over 90 dpd - Santander vrs Market
Over 30 - mob 3
Vintages Evolution – Santander
New Admission Policy
The new admission process
generates vintages with better
quality
Auto Loan Business – Delinquency Rates
Market (Bacen) Santander Financiamentos
nov/11 dec/11 jan/12

Decreasing the Cost of Credit (%)
2009 2010 1S11 2S11
Increase of almost 40% of the
commercial staff
The improve of credit response time and
automatic decision, impacted positively
the dealer’s satisfaction…
… Even with more conservative Credit
Policy
16 Portfolio Growth with good quality
Reference: Pesquisa anual IBOPE de satisfação intermediário.

Santander Brasil Santander Cards Business
March, 2012

18 18
Agenda
Overview of Brazilian Cards Industry
Santander Cards Issuer
Santander Cards Acquirer

19 Overview of Brazilian Cards Industry Cards industry continues to show substantial growth rates, even considering the competitive scenario consolidation and recent regulation changes
Source: BACEN.
Transactions, # Billion
Transactiosn Growth
Check
Debit
# Cards/Active Economic Population
Cards Penetration Growth
2005 2006 2007 2008 2009 2010
+11%
CAGR
+ 21%
- 10%
+ 17%
Credito
CAGR
Cards transactions have been strongly replacing checks transactions last 10 years
CAGR
6,315,93
5,514,93
4,283,75
0,0
0,5
1,0
1,5
2,0
2,5
3,0
3,5
2005 2006 2007 2008 2009 2010

20
97 118 147 173 196 225 247171 187
201217
233249
266
6882
104124
136153
173
336
2005
388
2006
453
2007
628
2010
686
514
2008
565
2009
Credit
Debit
P. Label
+13%
2011
Evolución de la Industria de Meios de Pago en Brasil La industria ha logrado ritmos intensivos de crecimiento desde 2005, tanto en
base de tarjetas cuanto en facturación
67 83 107 129 158197
115142
174215
256
309
386
60 68 8529 36
2009
535
2010
56
200
2005
245
2006
45
302
2008
375
53
2007
444
2011
Credit
Debit
P.Label
+22%
668 R$, Billones
CAGR CAGR
Source: ABECS – Associação Brasileira de Cartões – 2011: Estimated values
# Millones
Number of Cards Total Revenues (R$ Bi)
Card penetration, average ticket and transactions per card are still low in Brazil
Overview of Brazilian Cards Industry
53 53 52 54 57
45 48 51 53 56 58
93 98 100 107 113
5250
46
9186
+4%
P. Label
181
2005
189
2006
194
2007
201
2008
206
2009
216
2010
228
2011
Credit
Debit
Average Ticket (R$, Transaction)

21 21
Agenda
Overview of Brazilian Cards Industry
Santander Cards Issuer
Santander Cards Acquirer

22
Product focus
Specialized
capabilities: risk,
marketing
Direct channels:
Telemkt / Mailings
Specialized
systems
Customers
Traditional
Channels: branches/
agents, call-center,
web pages
Brand
Economies of scale
Cards Specialist Retail Bank
Santander Cards Issuer – our approach Our approach continues to be the world’s best integrated cards specialist within a retail bank (since 2002)…
… Contributing to improve our local banks’ performance

23 Santander Cards Issuer – our model Is based on managing all levers along the product lifecycle …
Activation Retention Balance Building Spending
Portfolio Management
Acquisition
RISK MANAGEMENT
Dep
th o
f card
ho
lder
rela
tio
nsh
ip
VALUE
CHURN
TIME
SERVICING TECHNOLOGY ANALYTICS MULTI-CHANNEL

24
Knowledge Ca
rd
Ca
rd
s
Homogeneous Business Model
Common methodologies
Similar organizational structures
across countries
True best practices sharing
Global specialists and knowledge
initiatives (Forums, Campaigns
Library, Benchmarking, etc.)
Scale Economies
Talent Management: global
opportunities, specialist trainings
Global relationships with key industry
players (Amex, Visa, MasterCard,
Diners)
Global Products and Alliances
(Elavon, FDI, Ferrari, etc.)
Value added to the Group
Santander Cards Issuer – our model …in a absolutely integrated global business model metlhodoly….

25
(1) Source: Internal data
Increase the
profitability by using
the card’s platforms as
a distribution channel
for other banking
products and services
Continuous product
innovation as a growth
lever
Payment Services
Savings
Personal Loan
Insurance
Santander Cards Issuer – our model The Business expansion will be held in two dimensions: Customer Base and Profitability per Account
2010 2011
2010
2011
20%
12%
Net in
co
me
Card Accounts
Δ P
rofita
bili
ty p
er
Acco
un
t

26 Santander Cards Issuer – continuous growth The Credit market continues to show substantial growth rates, even considering the competitive scenario consolidation and recent regulation changes
Total Spend (R$ Bi)
Cards (MM)
Revolving Balance (R$ Bi)
Key Observations
Focus on increase credit card
penetration in client base with
new commercial agreements
(Raizen / Telefonica).
Growth of the customer
relationship stimulate Spend
Financial orientation to
revolving – offering financing
credit card bills (lower rate,
but with longer term)
Market
Note 1: Source Banco Central do Brasil, including +360 days balance
Note 2: Source ABECs – Brazilian Cards Association
173,0153,0
136,0124,0104,0
12,411,59,78,56,8
07 11 10 08 09
364,3313,7
256,0215,0
174,0
50,939,933,326,518,8
11 10 09 08 07
35,729,225,7
22,117,2
4,33,02,52,11,7
07 08 09 10 11
+19%
+14%
+16
+20%
+28%
+20%
+25%
Santander
7%
14%
12%

27 Santander Cards Issuer –performance … generating relevant revenue increase
Net Fee (R$ MM)
1.298
969
785
2011
+34%
2010 2009
+29%
19%
Source: Santander Income Statement – Net Fees IFRS
CAGR

28 28
Agenda
Overview of Brazilian Cards Industry
Santander Cards Issuer
Santander Cards Acquirer

29 Merchant Acquiring - Market Potential
» More than 2 million
establishments » 22% annual
growth
» 50% of all trade
sales
» Large
profitability
margins
» R$ 560 billion in
sales in 2011; volume
is expected to double
in 5 years
» Duopoly until
April, 2010

30
REDECARD
AND
CIELO ACQUIRING
SERVICES
FINANCIAL
SERVICES
BANKS
The 1st bank to combine acquirer and
financial services
Merchant Acquiring - Innovative Value Proposition
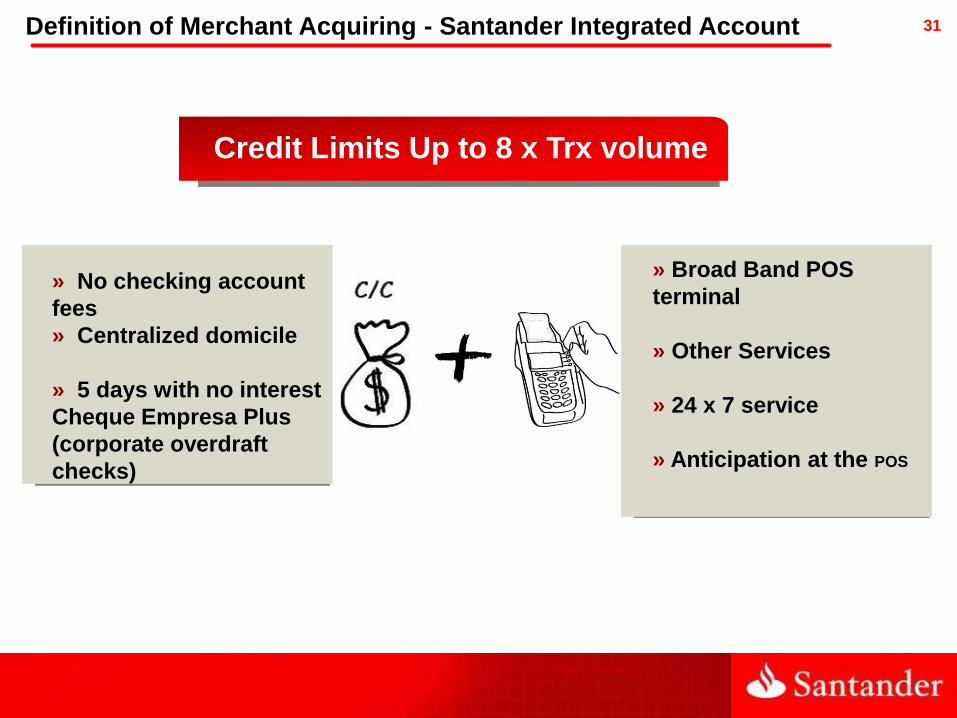
31 Definition of Merchant Acquiring - Santander Integrated Account
» No checking account
fees
» Centralized domicile
» 5 days with no interest
Cheque Empresa Plus
(corporate overdraft
checks)
» Broad Band POS
terminal
» Other Services
» 24 x 7 service
» Anticipation at the POS
Credit Limits Up to 8 x Trx volume
32
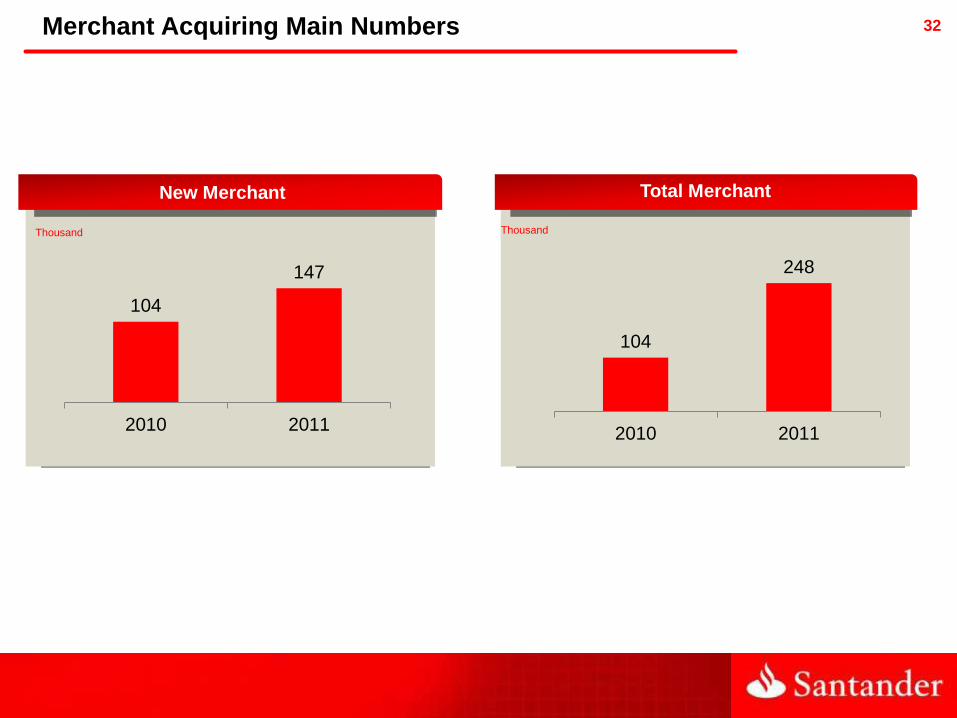
New Merchant Total Merchant
Merchant Acquiring Main Numbers
Thousand Thousand
104
147
2010 2011
104
248
2010 2011

33 Merchant Acquiring Revenue: marketing share
Market Share
55,8% 56,9% 56,3% 56,5% 57,0%
43,1% 41,8% 42,0% 41,4% 40,4%
1,0% 1,3% 1,7% 2,1% 2,6%
4Q10 1Q11 2Q11 3Q11 4Q11
ACQ 1 ACQ 2 Santander