bandar universiti seri iskandar,...
TRANSCRIPT
11Hua Yang BerhadAnnual Report 2010
Phase 2 with total units of 219 was subsequently rolled out in November 2009. 65% of the units have been sold.
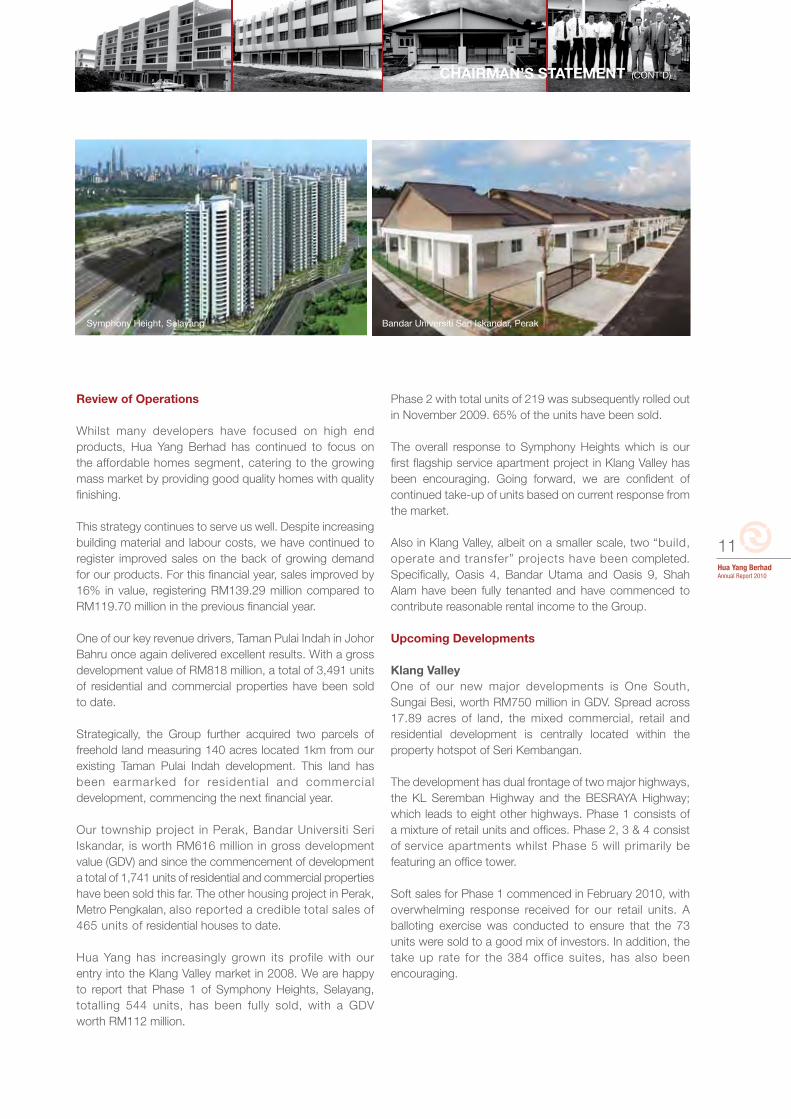
The overall response to Symphony Heights which is our first flagship service apartment project in Klang Valley has been encouraging. Going forward, we are confident of continued take-up of units based on current response from the market.
Also in Klang Valley, albeit on a smaller scale, two “build, operate and transfer” projects have been completed. Specifically, Oasis 4, Bandar Utama and Oasis 9, Shah Alam have been fully tenanted and have commenced to contribute reasonable rental income to the Group.
Upcoming Developments
Klang ValleyOne of our new major developments is One South, Sungai Besi, worth RM750 million in GDV. Spread across 17.89 acres of land, the mixed commercial, retail and residential development is centrally located within the property hotspot of Seri Kembangan.
The development has dual frontage of two major highways, the KL Seremban Highway and the BESRAYA Highway; which leads to eight other highways. Phase 1 consists of a mixture of retail units and offices. Phase 2, 3 & 4 consist of service apartments whilst Phase 5 will primarily be featuring an office tower.
Soft sales for Phase 1 commenced in February 2010, with overwhelming response received for our retail units. A balloting exercise was conducted to ensure that the 73 units were sold to a good mix of investors. In addition, the take up rate for the 384 office suites, has also been encouraging.
Review of Operations
Whilst many developers have focused on high end products, Hua Yang Berhad has continued to focus on the affordable homes segment, catering to the growing mass market by providing good quality homes with quality finishing.
This strategy continues to serve us well. Despite increasing building material and labour costs, we have continued to register improved sales on the back of growing demand for our products. For this financial year, sales improved by 16% in value, registering RM139.29 million compared to RM119.70 million in the previous financial year.
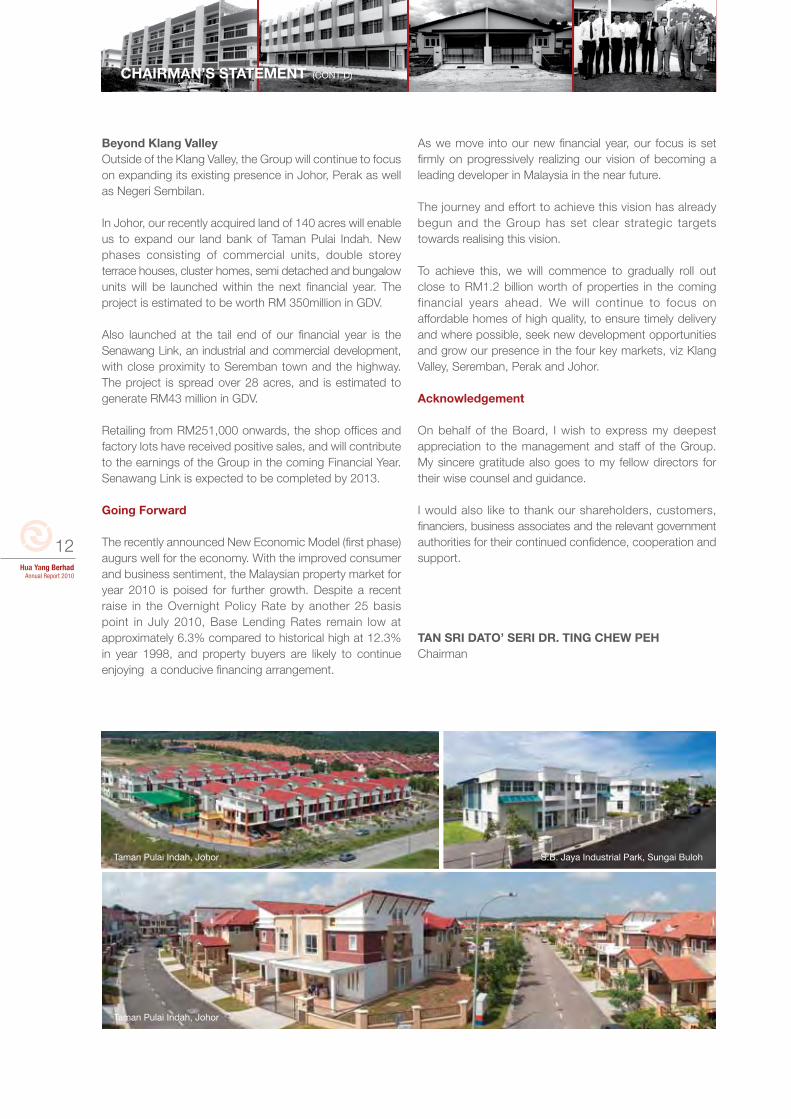
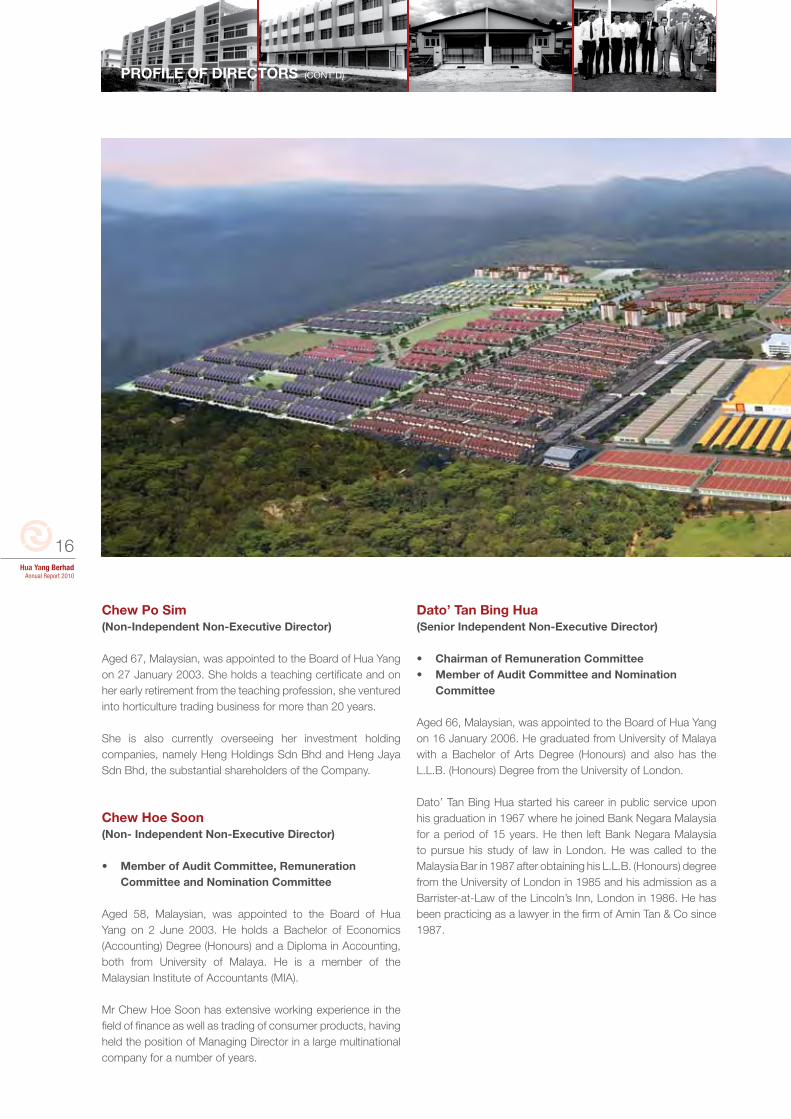
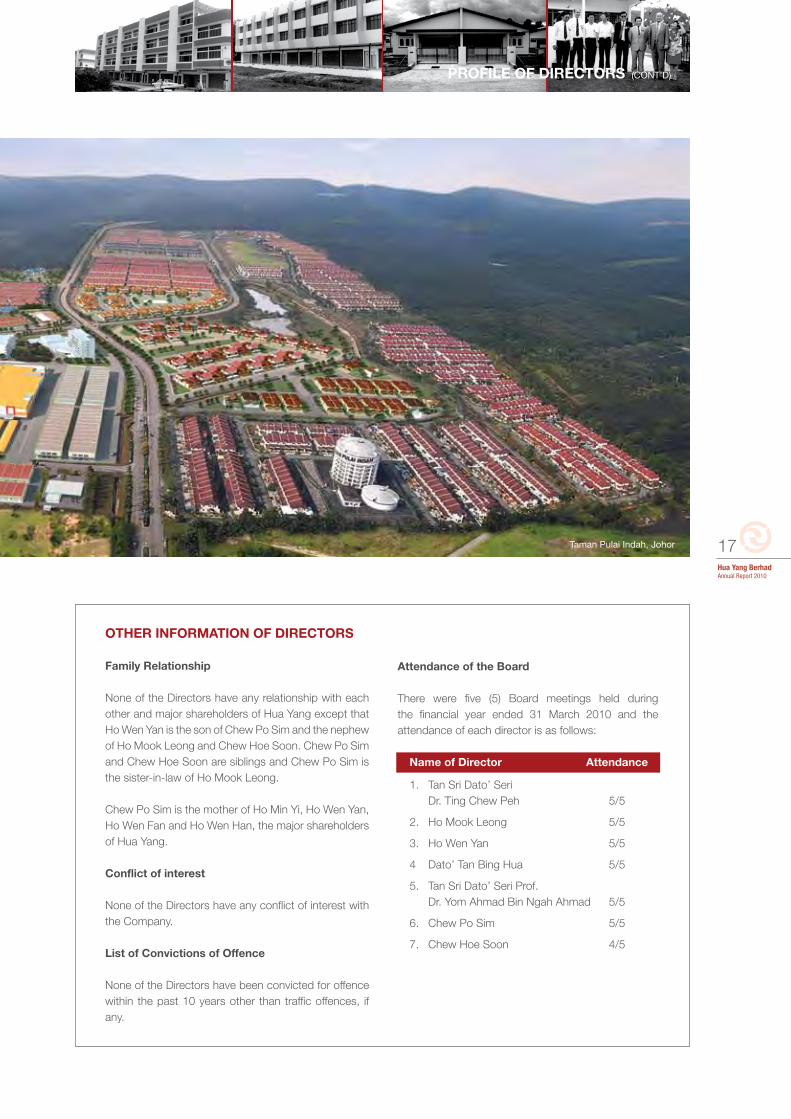
One of our key revenue drivers, Taman Pulai Indah in Johor Bahru once again delivered excellent results. With a gross development value of RM818 million, a total of 3,491 units of residential and commercial properties have been sold to date.
Strategically, the Group further acquired two parcels of freehold land measuring 140 acres located 1km from our existing Taman Pulai Indah development. This land has been earmarked for residential and commercial development, commencing the next financial year.
Our township project in Perak, Bandar Universiti Seri Iskandar, is worth RM616 million in gross development value (GDV) and since the commencement of development a total of 1,741 units of residential and commercial properties have been sold this far. The other housing project in Perak, Metro Pengkalan, also reported a credible total sales of 465 units of residential houses to date.
Hua Yang has increasingly grown its profile with our entry into the Klang Valley market in 2008. We are happy to report that Phase 1 of Symphony Heights, Selayang, totalling 544 units, has been fully sold, with a GDV worth RM112 million.
Bandar Universiti Seri Iskandar, PerakSymphony Height, Selayang
CHAIRMAN’S STATEMENT (CONT’D)
12Hua Yang Berhad
Annual Report 2010
S.B. Jaya Industrial Park, Sungai Buloh
Taman Pulai Indah, Johor
Taman Pulai Indah, Johor
CHAIRMAN’S STATEMENT (CONT’D)
Beyond Klang ValleyOutside of the Klang Valley, the Group will continue to focus on expanding its existing presence in Johor, Perak as well as Negeri Sembilan.
In Johor, our recently acquired land of 140 acres will enable us to expand our land bank of Taman Pulai Indah. New phases consisting of commercial units, double storey terrace houses, cluster homes, semi detached and bungalow units will be launched within the next financial year. The project is estimated to be worth RM 350million in GDV.
Also launched at the tail end of our financial year is the Senawang Link, an industrial and commercial development, with close proximity to Seremban town and the highway. The project is spread over 28 acres, and is estimated to generate RM43 million in GDV.
Retailing from RM251,000 onwards, the shop offices and factory lots have received positive sales, and will contribute to the earnings of the Group in the coming Financial Year. Senawang Link is expected to be completed by 2013.
Going Forward
The recently announced New Economic Model (first phase) augurs well for the economy. With the improved consumer and business sentiment, the Malaysian property market for year 2010 is poised for further growth. Despite a recent raise in the Overnight Policy Rate by another 25 basis point in July 2010, Base Lending Rates remain low at approximately 6.3% compared to historical high at 12.3% in year 1998, and property buyers are likely to continue enjoying a conducive financing arrangement.
As we move into our new financial year, our focus is set firmly on progressively realizing our vision of becoming a leading developer in Malaysia in the near future.
The journey and effort to achieve this vision has already begun and the Group has set clear strategic targets towards realising this vision.
To achieve this, we will commence to gradually roll out close to RM1.2 billion worth of properties in the coming financial years ahead. We will continue to focus on affordable homes of high quality, to ensure timely delivery and where possible, seek new development opportunities and grow our presence in the four key markets, viz Klang Valley, Seremban, Perak and Johor. Acknowledgement
On behalf of the Board, I wish to express my deepest appreciation to the management and staff of the Group. My sincere gratitude also goes to my fellow directors for their wise counsel and guidance.
I would also like to thank our shareholders, customers, financiers, business associates and the relevant government authorities for their continued confidence, cooperation and support.
TAN SRI DATO’ SERI DR. TING CHEW PEHChairman
13Hua Yang BerhadAnnual Report 2010
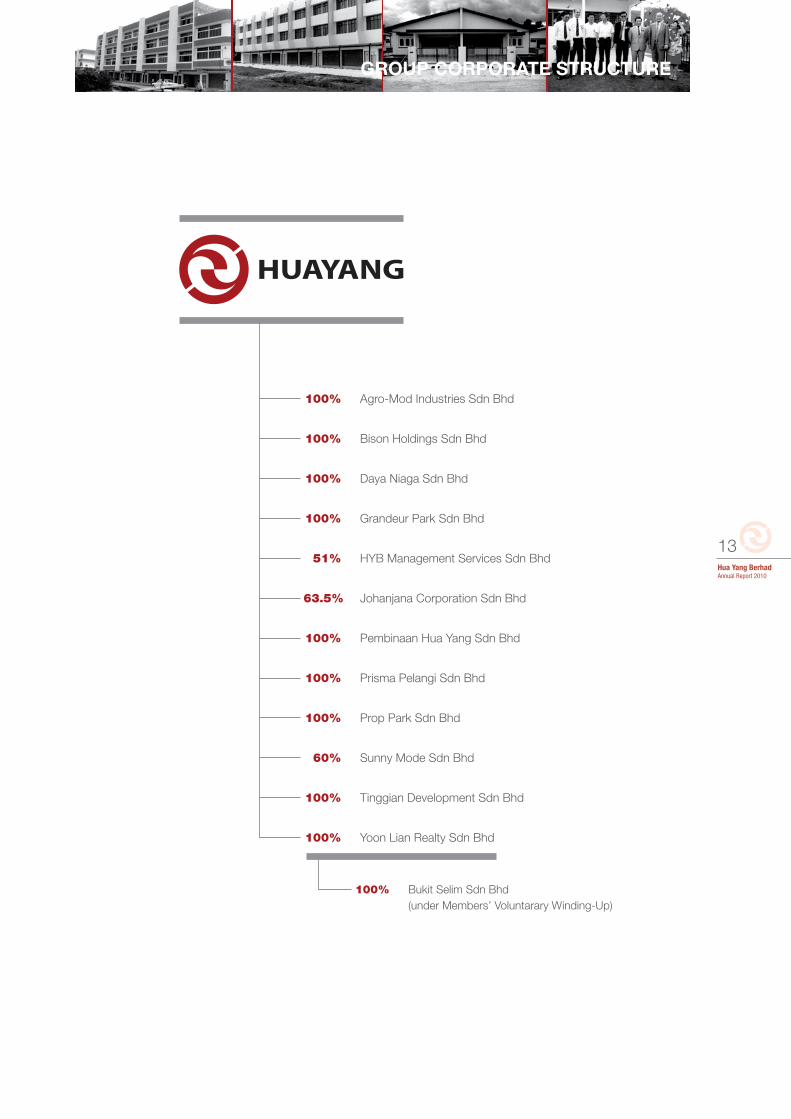
GROUP CORPORATE STRUCTURE
100% Agro-Mod Industries Sdn Bhd
100% Bison Holdings Sdn Bhd
100% Daya Niaga Sdn Bhd
100% Grandeur Park Sdn Bhd
51% HYB Management Services Sdn Bhd
63.5% Johanjana Corporation Sdn Bhd
100% Pembinaan Hua Yang Sdn Bhd
100% Prisma Pelangi Sdn Bhd
100% Prop Park Sdn Bhd
60% Sunny Mode Sdn Bhd
100% Tinggian Development Sdn Bhd
100% Yoon Lian Realty Sdn Bhd
100% Bukit Selim Sdn Bhd (under Members’ Voluntarary Winding-Up)
14Hua Yang Berhad
Annual Report 2010
FIVE YEARS GROUP FINANCIAL HIGHLIGHTS
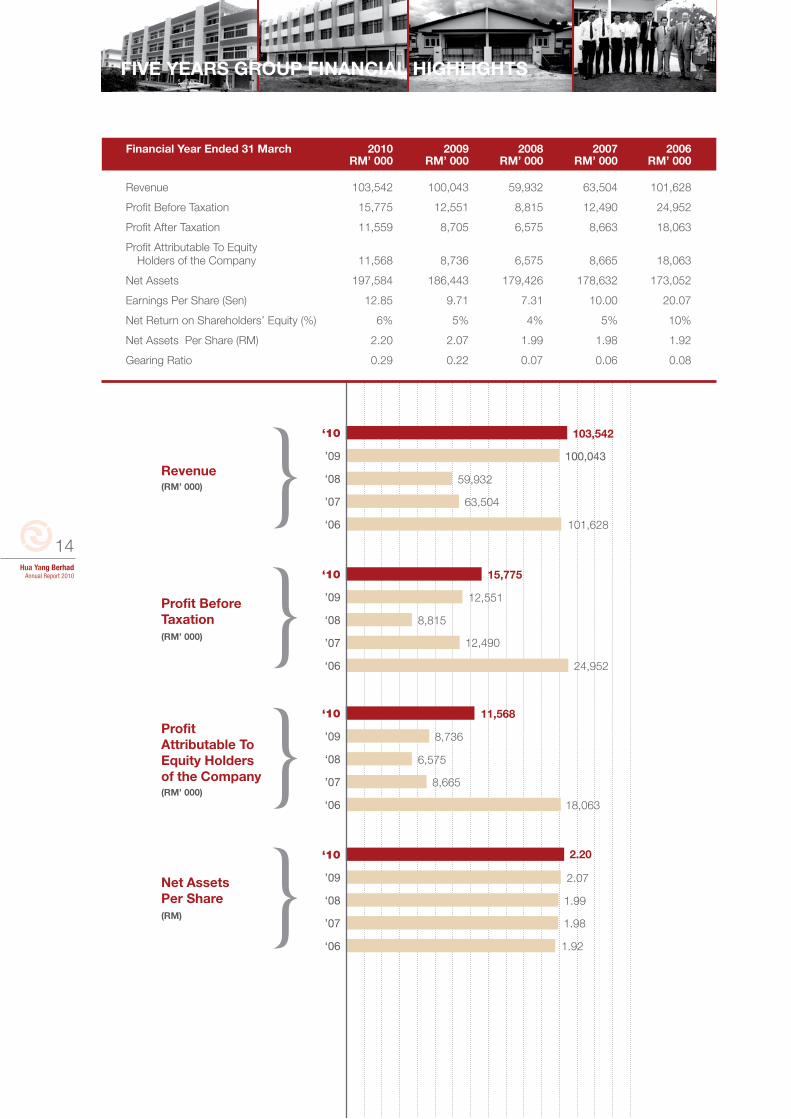
Financial Year Ended 31 March 2010 2009 2008 2007 2006 RM’ 000 RM’ 000 RM’ 000 RM’ 000 RM’ 000 Revenue 103,542 100,043 59,932 63,504 101,628
Profit Before Taxation 15,775 12,551 8,815 12,490 24,952
Profit After Taxation 11,559 8,705 6,575 8,663 18,063
Profit Attributable To Equity Holders of the Company 11,568 8,736 6,575 8,665 18,063
Net Assets 197,584 186,443 179,426 178,632 173,052
Earnings Per Share (Sen) 12.85 9.71 7.31 10.00 20.07
Net Return on Shareholders’ Equity (%) 6% 5% 4% 5% 10%
Net Assets Per Share (RM) 2.20 2.07 1.99 1.98 1.92
Gearing Ratio 0.29 0.22 0.07 0.06 0.08
Revenue(RM’ 000)
103,542‘10
100,043’09
59,932‘08
63,504’07
101,628‘06
Net Assets Per Share (RM)
2.20
2.07
1.99
1.98
1.92
‘10
’09
‘08
’07
‘06
Profit Attributable To Equity Holders of the Company(RM’ 000)
11,568‘10
8,736’09
6,575‘08
8,665’07
18,063‘06
Profit Before Taxation(RM’ 000)
15,775
12,551
8,815
12,490
24,952
‘10
’09
‘08
’07
‘06
15Hua Yang BerhadAnnual Report 2010
PROFILE OF DIRECTORS
Tan Sri Dato’ Seri Dr. Ting Chew Peh (P.S.M., S.P.M.P., D.P.M.S., D.P.M.P.)(Chairman/Independent Non-Executive Director)
• Chairman of Audit Committee and Nomination Committee• Member of Remuneration Committee
Aged 67, Malaysian, was appointed to the Board of Hua Yang Berhad (“Hua Yang”) on 1 June 2000 and was made the Chairman of the Board. He has a Bachelor of Arts Degree from University of Malaya and a Master of Science Degree from University of London. He also holds a Doctorate in Philosophy, which he obtained from University of Warwick.
YBhg Tan Sri Dato’ Seri Dr Ting started his career as a lecturer in the Faculty of Social Sciences and Humanities at Universiti Kebangsaan Malaysia in 1974 until 1980. He was then appointed as an Associate Professor at the Faculty until 1987. In 1987, YBhg Tan Sri Dato’ Seri Dr Ting ventured into politics with his election as a Member of Parliament for the Gopeng constituency, which he held until the 2008 general elections. He previously served as Parliamentary Secretary of the Ministry of Health (1988-1989), Deputy Minister in the Prime Minister’s Department (1989-1990), Minister of Housing and Local Government (1990-1999) and Secretary-General of Malaysian Chinese Association (MCA) (1990-2005).
He currently sits on the Board of Pan Malaysia Capital Berhad Group, Pan Malaysia Corporation Berhad, Johan Holdings Berhad, Complete Logistic Services Berhad and Puncak Niaga Holdings Berhad and also serves as a director of several private companies.
Ho Mook Leong(Chief Executive Officer/Executive Director)
Aged 50, Malaysian, was appointed to the Board of Hua Yang on 31 January 2002. He was made the Chief Operating Officer of Hua Yang on 1 September 2003 and subsequently promoted to the position of Chief Executive Officer on 1 June 2007. He has a Degree in Civil Engineering from Ohio State University, United States of America.
Mr Ho Mook Leong started his career as a Site Engineer with IOI Properties Bhd in 1984 and subsequently left to join Hua Yang as Project Manager in 1988 to oversee the property development project in Ipoh. From 1991 to 1997, Mr Ho Mook Leong was on secondment to one of the associated company to manage another mixed property development project in Ipoh. Having acquired extensive experience and expertise in project management and construction related fields over the years, he was made the General Manager of Hua Yang in 1997 to oversee all the development projects of Hua Yang Group.
Mr Ho Mook Leong left Hua Yang in year 2000 to pursue his own consultancy business. In the preparation for the initial public listing of Hua Yang in 2001/2002, Mr Ho Mook Leong was invited back to be a Board member of Hua Yang as the Board viewed that he had served with Hua Yang for more than 12 years and would be able to contribute effectively to Hua Yang Group with his vast knowledge of the various types of mixed development projects within the Hua Yang Group and elsewhere.
Ho Wen Yan(Chief Operating Officer/Executive Director)
Aged 36, Malaysian, was appointed to the Board of Hua Yang on 1 June 2007. He received his architectural training in the United Kingdom at the University of Bath and the Architectural Association. He also holds a Masters of Science (Construction Economics and Management) Degree from University College London.
He began his career in the architectural practice in London with PARAMETA Architects, having also done short technical attachments with Chua Ka Seng & Partners, in Singapore during his semester breaks.
He joined Hua Yang on 20 October 2003 as a Project Coordinator at its Johor Branch and within a year was promoted to oversee the Johor Branch operations as the Branch Manager. With improvement seen in the performance of the Johor Branch operations under his leadership, Mr Ho Wen Yan was appointed General Manager in April 2006 and subsequently promoted to the position of Chief Operating Officer on 1 June 2007.
Tan Sri Dato’ Seri Prof. Dr. Yom Ahmad Bin Ngah Ahmad(P.S.M., S.P.M.P., D.P.M.P., A.M.P., J.P., P.J.K., D.S.A., PhD)(Independent Non-Executive Director)
Aged 87, Malaysian, was appointed to the Board of Hua Yang on 1 December 1996. He was conferred an honorary doctorate in Business and Financial Management by Pacific Western University, Hawaii, in 1989. In 1998 he was appointed as Professor and Fellow, International Business Relations by the same University.
Tan Sri Dato’ Seri Prof. Dr. Yom Ahmad Bin Ngah Ahmad is a well-respected Bumiputera entrepreneur with business interests in the field of construction, tin-mining, plantation, transportation and haulage. He also acts as adviser to various Bumiputera trade associations and education institutions in Perak.
16Hua Yang Berhad
Annual Report 2010
PROFILE OF DIRECTORS (CONT’D)
Chew Po Sim(Non-Independent Non-Executive Director)
Aged 67, Malaysian, was appointed to the Board of Hua Yang on 27 January 2003. She holds a teaching certificate and on her early retirement from the teaching profession, she ventured into horticulture trading business for more than 20 years.
She is also currently overseeing her investment holding companies, namely Heng Holdings Sdn Bhd and Heng Jaya Sdn Bhd, the substantial shareholders of the Company.
Chew Hoe Soon(Non- Independent Non-Executive Director)
• Member of Audit Committee, Remuneration Committee and Nomination Committee
Aged 58, Malaysian, was appointed to the Board of Hua Yang on 2 June 2003. He holds a Bachelor of Economics (Accounting) Degree (Honours) and a Diploma in Accounting, both from University of Malaya. He is a member of the Malaysian Institute of Accountants (MIA).
Mr Chew Hoe Soon has extensive working experience in the field of finance as well as trading of consumer products, having held the position of Managing Director in a large multinational company for a number of years.
Dato’ Tan Bing Hua(Senior Independent Non-Executive Director)
• Chairman of Remuneration Committee• Member of Audit Committee and Nomination Committee
Aged 66, Malaysian, was appointed to the Board of Hua Yang on 16 January 2006. He graduated from University of Malaya with a Bachelor of Arts Degree (Honours) and also has the L.L.B. (Honours) Degree from the University of London.
Dato’ Tan Bing Hua started his career in public service upon his graduation in 1967 where he joined Bank Negara Malaysia for a period of 15 years. He then left Bank Negara Malaysia to pursue his study of law in London. He was called to the Malaysia Bar in 1987 after obtaining his L.L.B. (Honours) degree from the University of London in 1985 and his admission as a Barrister-at-Law of the Lincoln’s Inn, London in 1986. He has been practicing as a lawyer in the firm of Amin Tan & Co since 1987.
17Hua Yang BerhadAnnual Report 2010
PROFILE OF DIRECTORS (CONT’D)
OTHER INFORMATION OF DIRECTORS
Family Relationship
None of the Directors have any relationship with each other and major shareholders of Hua Yang except that Ho Wen Yan is the son of Chew Po Sim and the nephew of Ho Mook Leong and Chew Hoe Soon. Chew Po Sim and Chew Hoe Soon are siblings and Chew Po Sim is the sister-in-law of Ho Mook Leong.
Chew Po Sim is the mother of Ho Min Yi, Ho Wen Yan, Ho Wen Fan and Ho Wen Han, the major shareholders of Hua Yang.
Conflict of interest
None of the Directors have any conflict of interest with the Company.
List of Convictions of Offence
None of the Directors have been convicted for offence within the past 10 years other than traffic offences, if any.
Attendance of the Board
There were five (5) Board meetings held during the financial year ended 31 March 2010 and the attendance of each director is as follows:
Name of Director Attendance
1. Tan Sri Dato’ Seri Dr. Ting Chew Peh 5/5
2. Ho Mook Leong 5/5
3. Ho Wen Yan 5/5
4 Dato’ Tan Bing Hua 5/5
5. Tan Sri Dato’ Seri Prof. Dr. Yom Ahmad Bin Ngah Ahmad 5/5
6. Chew Po Sim 5/5
7. Chew Hoe Soon 4/5
Taman Pulai Indah, Johor

18Hua Yang Berhad
Annual Report 2010
Oasis S9, Shah Alam
One South, Sg Besi

19Hua Yang BerhadAnnual Report 2010
Collective strength of the company and its people; weathers the array of challenges and together we generate sustainable economic growth. That is the promise we make to our investors.
ENDURING CHALLENGES
Oasis S9, Shah Alam
Oasis BU4, Bandar Utama
20Hua Yang Berhad
Annual Report 2010
CORPORATE GOVERNANCE STATEMENT
The Board of Directors (“the Board”) of Hua Yang Berhad (“Hua Yang” or “the Company”) is committed to ensuring that the highest standards of corporate governance are implemented and maintained throughout the Group as a fundamental part of discharging its responsibilities to protect and enhance shareholders’ value. Therefore, the Board supports the principles laid out in the Malaysian Code on Corporate Governance (“the Code”). These principles and practices supported by existing internal controls processes, are regularly audited and reviewed to ensure transparency and accountability.
BOARD OF DIRECTORS
Composition of the Board
During the financial year 2010, there were seven (7) members on the Board of whom three (3) are Independent Non-Executive Directors (including the Chairman), two (2) Executive Directors and two (2) Non-Independent Non-Executive Directors. A brief profile of each Director is presented on page 15 to 17 of this Annual Report.
The Company is led and managed by an experienced Board comprising members with a wide range of experience in relevant fields such as entrepreneurship, economics, legal, accounting, finance, administration, project development, management, marketing and public service. Together, the Directors bring a broad range of skills, experience and knowledge to successfully direct and supervise the Group’s business activities.
The Executive Directors are generally responsible for making and implementing operational decisions whilst the Non-executive Directors support the skills and experience of the Executive Directors, contributing to the formulation of policy and decision-making through their knowledge and experience of other business sectors.
The Independent Non-Executive Directors, who are independent of management and free from any business relationship which could materially interfere with the exercise of their judgement, play an important role in ensuring that the strategies proposed by the Management are fully deliberated and examined, taking into consideration the long term interests of shareholders, employees, customers and other stakeholders in which the Group conducts its businesses.
The roles of the Chairman and Chief Executive Officer (“CEO”) are separate with clear division of responsibilities between them to ensure balance of power and authority. The Chairman’s main responsibility is to lead and manage the Board in order to ensure its effectiveness. Together with other Non-Executive Directors, he leads the discussion on the strategies and policies recommended by the Management.
The CEO is responsible in leading the management team, implementation of the policies/decision approved by the Board, and acts as the Group’s official spokesperson. The CEO is also responsible for planning the future direction of the Group for the Board’s consideration and approval.
Directors’ Training
All directors have attended and successfully completed the Mandatory Accreditation Programme as required by Bursa Malaysia Securities Berhad (“Bursa Securities”). In addition, seminars and conferences organised by Bursa Securities, relevant regulatory bodies and professional bodies on areas pertinent to the Directors are communicated to the Board for their participation. The Board will also identify training needs amongst the Directors and enroll the directors for training programme, as and when required.
During the financial year, all the Directors have attended a half day seminar titled “Competitive Strategy vs Redundant Strategy for Board of Directors & Senior Management” on 26 May 2009 and an in-house training on 22 July 2009 on the Bursa Securities Main Market Listing Requirements. In addition, the following Directors have also attended the following training programmes:
21Hua Yang BerhadAnnual Report 2010
CORPORATE GOVERNANCE STATEMENT (CONT’D)
Director Training Programme Mode of Duration Training of Training
Tan Sri Dato’ Seri 1. Directorship: What to look out for Seminar ½ day Dr. Ting Chew Peh 2. Risk & Reform – implication for Audit Roundtable 1 day Committee Oversight discussion Dato’ Tan Bing Hua Securities Commission - Bursa Malaysia Forum 8 June 2009 - Corporate Governance Week 2009 11 June 2009 Senior Independent Non-Executive Director
The Board has appointed Dato’ Tan Bing Hua as the Senior Independent Non-Executive Director of the Board to whom concerns may be conveyed. The Senior Independent Non-Executive Director provides a secure and confidential channel to address any concerns conveyed to him directly on matters relating to the Company. Dato’ Tan Bing Hua is authorised to seek information as required, from any employee of the company and all employees are directed to co-operate on any request made by the Senior Independent Non-Executive Director. During the year, there was no issue raised to the Senior Independent Non-Executive Director.
Board Meetings and Supply of Information
Board meetings are held at regular intervals with additional meetings convened when necessary. During the financial year, the Board met five (5) times to review the Group’s operations, quarterly and annual financial statements and any other matters that require the Board’s approval. Details of each Director’s attendance are set out on page 17 of this annual report.
The Company has adopted a policy of sending Board papers to the Directors ahead of the pre-scheduled meetings to ensure that the Directors are given sufficient time to review any matters to be discussed at the meetings later and also to enable the Directors to obtain further information and explanation, whenever necessary.
The Board papers encompass all aspects of the matters to be considered with quantitative and qualitative information thus enabling the Board to make informed decisions. Detailed reports on various issues like operational performance and profitability, human resources, business plans and various financial indicators are made available in advance to members of the Board for information and deliberation wherever applicable.
The Board papers also encompass a summary listing of the changes in the relevant laws and regulations applicable to the Company such as Bursa Securities’s Listing Requirements. The Board have the right to access all information within the Company, whether as a full board or in their individual capacity, in furtherance of their duties.
The appointment of the Company Secretary is based on the capability and proficiency determined by the Board. All Directors have access to the advice and services of the Company Secretaries who are responsible for ensuring the proper Board procedures are followed through and that all applicable rules and regulations are complied with. The Company Secretaries attended the Board meetings and recorded the deliberations, in terms of the issues discussed and the conclusion made by the Board in discharging their duties and responsibilities. The Articles of Association of the Company permits the removal of Company Secretary by the Board of Directors. Besides this, the Directors are also empowered to seek external independent professional advice at the Company’s expense, to enable them to make well-informed decisions.
22Hua Yang Berhad
Annual Report 2010
CORPORATE GOVERNANCE STATEMENT (CONT’D)
Appointments and Re-election
In accordance with the Company’s Articles of Association, one-third (1/3) or nearest to one-third (1/3) of the Directors shall retire from office and be eligible for re-election at each annual general meeting provided that all Directors shall retire from office once at least in every three (3) years but shall be eligible for re-election. Directors appointed during the year are subject to retirement and re-election by shareholders in the Annual General Meeting immediately after his/her appointment. A retiring Director shall retain office until the close of the meeting at which he retires.
Directors who are over 70 years of age are required to submit themselves for re-appointment annually in accordance with Section 129(2) of the Companies Act, 1965.
Board Committees
(i) Audit Committee
The Board is assisted by the Audit Committee, which operates within clearly defined terms of reference. The composition, terms of reference and activities of the Audit Committee are set out on pages 32 to 34 of this annual report.
(ii) Nomination Committee
The Nomination Committee met once during the financial year and the activities which had been carried out were as follows:
i. Assessed the effectiveness of the Board as a whole and the contribution of each individual director; ii. Reviewed the size, composition and the required mix of skills of the Board; and iii. Recommended the re-appointment and re-election of retiring Directors to the Board.
The Nomination Committee ensures that all assessments and evaluations carried out are properly documented.
(iii) Remuneration Committee
The Remuneration Committee met two (2) times during the financial year and the activities which had been carried out were as follows:
i. Reviewed and recommended the bonus and increment of the staff, senior management and Executive Directors to the Board by linking their rewards to corporate and individual performance; and ii. Reviewed the Directors’ Fees.
DIRECTORS’ REMUNERATION
Other than the Executive Directors, all Non-Executive Directors are paid a fixed fee besides receiving meeting allowance for each Board and Committee meeting they attend. Directors’ fees are subject to the approval of shareholders. The Chairman of the Board and Board Committee is paid a higher fee compared to other Board members and Board Committee members in recognition of his additional responsibilities.
The Executive Directors’ remuneration is contractual and reflects the Board’s recognition of his skills and experience in the industry, job responsibilities and the Group’s performance against financial objectives. The Executive Directors do not participate in discussion on their own remuneration. It is the ultimate responsibility of the entire Board to approve the remuneration of the Executive Directors. The Executive Director concerned would abstain from discussion and decision on their own remuneration.
The Board as whole determines the remuneration package of Non-Executive Directors including the Independent Chairman by linking the remuneration to their experience and level of responsibilities undertaken.
23Hua Yang BerhadAnnual Report 2010
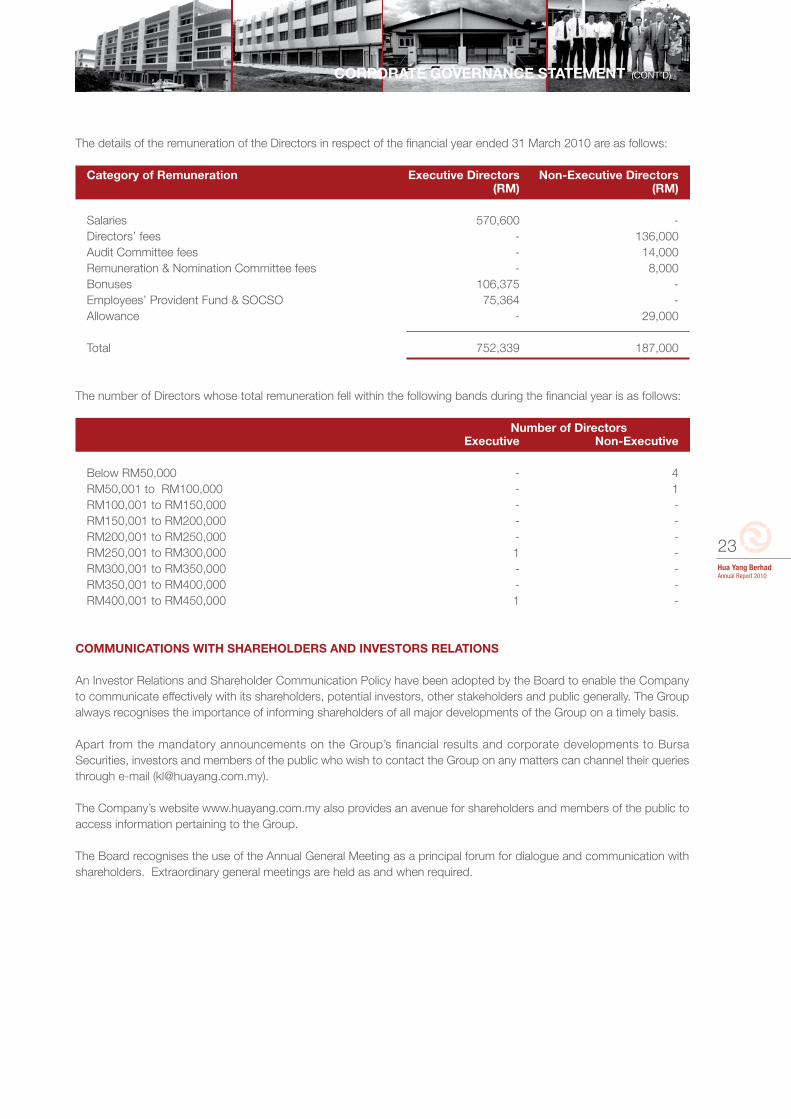
The details of the remuneration of the Directors in respect of the financial year ended 31 March 2010 are as follows:
Category of Remuneration Executive Directors Non-Executive Directors (RM) (RM)
Salaries 570,600 - Directors’ fees - 136,000 Audit Committee fees - 14,000 Remuneration & Nomination Committee fees - 8,000 Bonuses 106,375 - Employees’ Provident Fund & SOCSO 75,364 - Allowance - 29,000
Total 752,339 187,000
The number of Directors whose total remuneration fell within the following bands during the financial year is as follows: Number of Directors Executive Non-Executive
Below RM50,000 - 4 RM50,001 to RM100,000 - 1 RM100,001 to RM150,000 - - RM150,001 to RM200,000 - - RM200,001 to RM250,000 - - RM250,001 to RM300,000 1 - RM300,001 to RM350,000 - - RM350,001 to RM400,000 - - RM400,001 to RM450,000 1 -
COMMUNICATIONS WITH SHAREHOLDERS AND INVESTORS RELATIONS
An Investor Relations and Shareholder Communication Policy have been adopted by the Board to enable the Company to communicate effectively with its shareholders, potential investors, other stakeholders and public generally. The Group always recognises the importance of informing shareholders of all major developments of the Group on a timely basis.
Apart from the mandatory announcements on the Group’s financial results and corporate developments to Bursa Securities, investors and members of the public who wish to contact the Group on any matters can channel their queries through e-mail ([email protected]).
The Company’s website www.huayang.com.my also provides an avenue for shareholders and members of the public to access information pertaining to the Group.
The Board recognises the use of the Annual General Meeting as a principal forum for dialogue and communication with shareholders. Extraordinary general meetings are held as and when required.
CORPORATE GOVERNANCE STATEMENT (CONT’D)
24Hua Yang Berhad
Annual Report 2010
ACCOUNTABILITY AND AUDIT
Financial Reporting
The Directors are required by the Companies Act, 1965 to ensure that financial statements prepared for each financial year give a true and fair view of the state of affairs of the Company and the Group. The Directors consider the presentation of the financial statements and that the Group has used appropriate accounting policies, consistently applied and supported by reasonable and prudent judgments and estimates. The Audit Committee assists the Board by scrutinizing the information to be disclosed, to ensure accuracy and adequacy. The Group’s financial statements are presented on pages 36 to 94 of this annual report.
Risk Management Framework and Internal Control
The Board acknowledges their responsibility for the Group’s system of internal controls and reviewing its effectiveness regularly by setting up an internal audit function which provides support to Audit Committee in discharging its duties with respect to the adequacy and integrity of the system of internal control within the Group. A Statement on Internal Control is set out on pages 30 to 31 of this annual report. Relationship with the Auditors
Through the Audit Committee of the Board, the Group has established a transparent and appropriate relationship with the Group’s auditors, both internal and external. The external auditors are invited to attend meetings on special matters when necessary.
CORPORATE GOVERNANCE STATEMENT (CONT’D)
25Hua Yang BerhadAnnual Report 2010
“Corporate Social Responsibility is the continuing commitment by business to behave ethically and contribute the economic development while improving the quality of life of the workforce and their families as well as the local community and society at large” (Source : World Business Council for Sustainable Development)
Hua Yang Berhad (“Hua Yang”) recognizes the initiatives taken by Bursa Malaysia Securities Berhad to increase the awareness of corporate social responsibility (“CSR”) among Malaysian companies. The principal approach towards CSR is the integration of business practices with strong ethical value towards achieving the goals of the Group, while at the same time aligning with aspirations of society, local community, staff, suppliers and other stakeholders.
We endeavor to comply with the laws, regulations and rules applicable to our business and to conduct our business in accordance with the established best practices. Environmental, ethical and social responsibility issues and standards are also taken into consideration in every aspect of our business. We aim to be a responsible employer and continuously seek to equip our employees with the necessary tools and skills they need to effectively support the organization. We are also committed to the society, contributing in meaningful ways and aim to make differences in their lives.
Human Resource Development
The Company encourage continuous development for employees as this is important for the growth of the Group and our business. Employees with good knowledge, competent skills and positive attitude are among the cornerstones of its continuous success. Thus we actively create opportunities for our employees to develop and realize their true potential and strength through formal and informal training, whether on the job or outside the job. This includes participation in external trainings organised in various job related areas.
Appraisal on employee’s performance is conducted on an annual basis. The objective of this appraisal is to provide a systematic and comprehensive approach in evaluating the employee performance in relation to the competencies and to create a platform of communications for employees with their superior. The outcome of the appraisal is to be used to establish the training needs, career aspirations and the appropriate remuneration package.
To enhance the working relationship among colleagues, the Company organised events such as staff annual dinner, festive dinners, overseas trip, monthly sport activities to foster better unity and understanding among the employees.
Community
Hua Yang places great importance in education as part of its corporate social responsibility. Hua Yang made financial contributions and donations to various organizations and schools from time to time for them to carry out their various programmes.
Environment
Hua Yang’s direct environment impact is relatively low. We strive to minimize any adverse impact our operation may have on the environment.
We fully utilize resources in the office without much wastage and encourage recycling at all times. Recyclable items such as carton boxes, old newspapers and empty cartridges are sold and the proceeds would be contributed to staff fund for the benefit of the staff.
Our Commitment
Hua Yang will continue to enhance its commitment towards CSR to ensure all stakeholders will be able to benefit from our existence.
CORPORATE SOCIAL RESPONSIBILITY STATEMENT
26Hua Yang Berhad
Annual Report 2010
STATEMENT ON DIRECTORS’ RESPONSIBILITIES
Statement On Directors’ Responsibilities
The Directors are required by the Companies Act, 1965 to prepare financial statements which have been made out in accordance with the applicable Financial Reporting Standards in Malaysia and to give a true and fair view of the state of affairs of the Group and of the Company at the end of the financial year and of the results and cash flows of the Group and the Company for the financial year then ended.
In preparing the financial statements, the Directors have:
• adopted appropriate accounting policies and applied them consistently;• ensured that applicable Financial Reporting Accounting Standards in Malaysia have been followed; and• considered the going concern basis used as being appropriate.
The Directors are responsible for ensuring proper accounting records have been kept in compliance with the Companies Act, 1965 which disclosed with reasonable accuracy of the financial position of the Group and of the Company.
The Directors also have general responsibilities for taking such steps as are reasonably open to them to safeguard the assets of the Group and to prevent and detect fraud and other irregularities.
27Hua Yang BerhadAnnual Report 2010
(I) Share Buyback
The Company did not buy back any shares during the financial year.
(II) Options, Warrants or Convertible Securities
No options, warrants or convertible securities were issued during the financial year.
(III) American Depository Receipt (“ADR”) or Global Depository Receipt (“GDR”) Programme
The Company did not sponsor any ADR or GDR programme during the financial year.
(IV) Sanctions and/or Penalties
There were no public sanctions and/or penalties imposed on the Company and its subsidiaries, Directors or Management by the relevant regulatory bodies during the financial year.
(V) Non-Audit Fees
The Company paid non-audit fees of RM5,000 to the external auditors for the financial year ended 31 March 2010 for reviewing the Statement on Internal Control.
(VI) Variation in Results
There were no variations of 10% or more between the audited results for the financial year ended 31 March 2010 and the unaudited results released for the quarter ended 31 March 2010 of the Group.
(VII) Profit Guarantee
During the financial year, there was no profit guarantee received by the Company.
(VIII) Material Contracts
Other than those related party transactions disclosed in note 35 to the financial statements, there were no material contracts outside the ordinary course of business, including contract relating to loan entered into by the Company and/or its subsidiaries involving Directors and major shareholders that are still subsisting at the end of the financial year or which were entered into since the end of the previous financial year.
(IX) Revaluation on Landed Properties
The Company does not have a revaluation policy on its landed properties.
ADDITIONAL COMPLIANCE INFORMATION

28Hua Yang Berhad
Annual Report 2010
Bandar Universiti Seri Iskandar, Perak
Bandar Universiti Seri Iskandar, Perak
29Hua Yang BerhadAnnual Report 2010
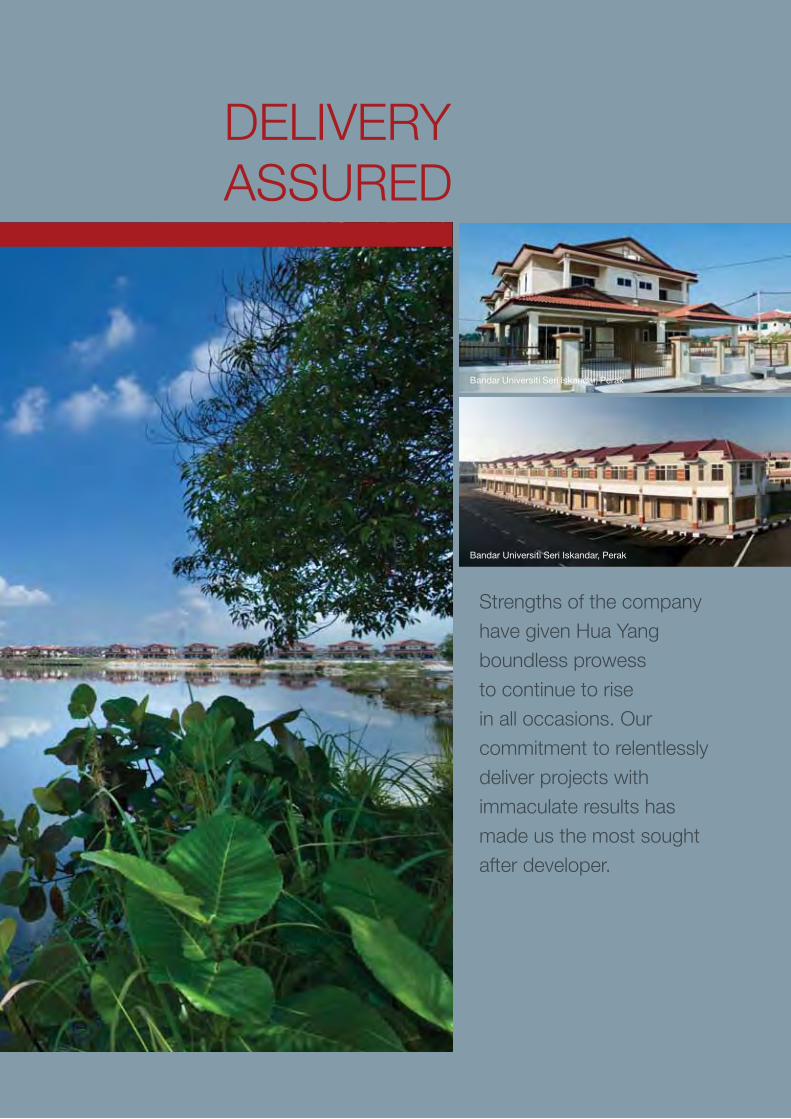
Strengths of the company have given Hua Yang boundless prowess to continue to rise in all occasions. Our commitment to relentlessly deliver projects with immaculate results has made us the most sought after developer.
DELIVERY ASSURED
Bandar Universiti Seri Iskandar, Perak
Bandar Universiti Seri Iskandar, Perak
30Hua Yang Berhad
Annual Report 2010
STATEMENT ON INTERNAL CONTROL
Introduction
During the financial year, the Board of Directors (“the Board”) of Hua Yang Berhad (“Hua Yang” or “the Company”) remains committed towards maintaining high standards of governance, accountability and transparency as well as to govern itself in accordance with the relevant regulations and laws with the objectives of safeguarding shareholders’ interest as well as protecting the Company’s assets. In line with this, the Board of Directors (“the Board”) of Hua Yang is pleased to provide the following statement prepared in accordance with the Statement on Internal Control: Guidance for Directors of Public Listed Companies (“the Guidance”), which outlines the nature and scope of internal control of Hua Yang Group (“the Group”) for the financial year ended 31 March 2010.
Board Responsibility
The Board acknowledges its responsibilities for the Group’s system of internal control and for reviewing the adequacy and integrity of these systems. The system of internal control covers, inter alia, financial, operational, management information systems, organisational and compliance controls. In view of the inherent limitations in any system of internal control, such system is designed to manage rather than eliminate the risks that may impede the achievement of Hua Yang’s business objectives. Accordingly, it can only provide reasonable but not absolute assurance against material misstatement, loss or fraud.
Risk Management
The Board confirms that there is an ongoing process for identifying, evaluating and managing significant risks faced by Hua Yang Group, and this process has been in place throughout the year and up to the date of approval of this annual report and financial statements. The Board continually reviews the adequacy and effectiveness of the risk management process across the various operating subsidiaries within Hua Yang Group. Periodic reviews were also conducted to determine the existence of new risk and whether the risks previously identified remained relevant.
Whilst the Board maintains ultimate control over risk and control issues, it has been delegated to Senior Management the implementation of risk management and internal control systems within an established framework.
Internal Control Mechanism
The Group’s internal audit function is outsourced to a professional service firm to provide independent assessments on the adequacy, efficiency and effectiveness of the Group’s internal control system. During the financial year ended 31 March 2010, the outsourced internal audit service provider carried out audits in accordance with the internal audit plan approved by the Audit Committee and other areas recommended by Senior Management to Hua Yang Group. The results of the internal audit reviews and the recommendations for improvement were presented to the Audit Committee at their quarterly meetings.
Since the appointment of the outsourced internal audit service provider, periodic internal audit visits have been carried out to monitor compliance with the Group’s procedures and to review on the adequacy and effectiveness of the Group’s system of internal control. Areas of improvement in internal controls have been identified and the implementation of action plans based on proposed recommendations have subsequently been initiated. During the financial year under review, internal audit visits which were scheduled in the internal audit plan have been conducted accordingly. In addition, follow up visits were also conducted to ensure that corrective actions have been implemented on a timely manner.
OTHER KEY ELEMENTS OF INTERNAL CONTROL
Corporate Disclosure Policies & Procedures
The Corporate Disclosure Committee (“CDC”) which was formed during the financial year ended 31 March 2005 is responsible for ensuring compliance with Corporate Disclosure Policies and Procedures through accurate, clear and complete disclosure of material information on a timely manner in order to keep shareholders and the investing public informed about the Group’s operations.
31Hua Yang BerhadAnnual Report 2010
STATEMENT ON INTERNAL CONTROL (CONT’D)
Organisation Structure & Authorisation Procedures
The Group maintains a formal line of reporting, that includes the division of responsibilities and delegation of authority. It sets out the roles and responsibilities, appropriate authority limits, review and approval procedures within the various operational segments.
Periodical and/or Annual Budget
The Group has a comprehensive budgeting and forecasting system. The annual business plan and budget are approved by the Board. Budgetary control is in place for every operational facets of the Group. Actual performances are closely monitored against budget so as to identify significant variances arising. On a quarterly basis, significant variances found are highlighted to the Board for the appropriate corrective action.
OTHER KEY ELEMENTS OF INTERNAL CONTROL
Schedule Operational and Management Committee Meetings
Regular Operational and Management Committee Meetings are held to discuss and monitor business and operational performances of the Group. Proceedings of the Operational and Management Committee Meetings are properly minuted.
Periodic Reporting
Monthly executive summaries are submitted by the Chief Executive Officer to the Board so as to provide a brief overview on financial and operational performance of the Group.
Site Visit
Regular site visits on on-going projects are performed by members of the senior management team and executive directors to ensure that contractual obligations of the Group are met.
Human Resource Policies & Procedures
Comprehensive human resource policies and procedures on recruitment, performance appraisals and promotion are in place to ensure that the Group has a team of employees who are well trained and equipped with the necessary knowledge, skills and abilities to carry out their responsibilities and tasks effectively.
SUMMARY
In accordance with the assessment of the Group’s system of internal control, the Board is of the view that the risks undertaken by the Group were within tolerable level in the context of the business environment the Group operates in and the systems of internal control that existed throughout the year comprising the internal control framework, management processes, monitoring and review process, provided a level of confidence on which the Board relied upon for assurance. During the year under review, nothing has come to the attention of the Board which would result in any material losses, contingencies or uncertainties that would require a separate disclosure in this annual report. Notwithstanding this, the Board will continue to ensure that the Group’s system of internal control continuously evolve to prevail in its current changing and challenging business environment.
32Hua Yang Berhad
Annual Report 2010
The Audit Committee currently comprises of the following members:-
ChairmanTan Sri Dato’ Seri Dr. Ting Chew Peh (Independent Non-Executive Director)
MembersDato’ Tan Bing Hua (Senior Independent Non-Executive Director) Chew Hoe Soon (Non-Independent Non-Executive Director)
TERMS OF REFERENCE
1. CompositionofAuditCommittee
The Committee shall be appointed by the Board from amongst the Directors and shall consist of not less than three members, all of the Audit Committee members must be Non-Executive Directors with a majority of them being Independent Directors. The members of the Committee shall elect a chairman from among their members who shall be an Independent Non-Executive Director. An alternate Director must not be appointed as a member of the Committee.
At least one member of the Committee:
• Must be a member of the Malaysian Institute of Accountants; or • If not a member of the Malaysian Institute of Accountants, that member must have at least 3 years’ working experience and; must have passed the examinations specified in Part I of the 1st Schedule of the Accountants Act, 1967; or must be a member of one of the associations of the accountants specified in Part II of the 1st Schedule of the Accountants Act, 1967; or • Fullfills such other requirements as prescribed or approved by the Bursa Malaysia Securities Berhad.
2. Authority
The Committee shall have the authority to investigate any matter of the Company and its subsidiaries within its terms of reference or otherwise directed by the Board. It shall have
i. Unrestricted access to any information pertaining to the Company and its subsidiaries; ii. The resources which are required to perform its duties; iii. Direct communication channels with both the external auditors and internal auditors; iv. Full access to all employees of the Group; v. To convene meetings with the external auditors, the internal auditors or both, excluding the attendance of other Directors and employees of the Company, wherever deemed necessary.
The Committee is also authorized by the Board to obtain outside legal or other independent professional advice and to secure the attendance of outsiders with relevant experience and expertise if it considers this necessary and reasonable for the performance of its duties.
3. MeetingsandMinutes
The Committee shall meet at least four times a year and such additional meetings as the Chairman shall decide in order to fulfill its duties.
The Committee may invite any person to be in attendance to assist it in its deliberations.
The Company Accountant, Head of Internal Audit Division and the External Auditors or their representatives shall be expected to attend all meetings of the Committee. At least twice a year the Committee shall meet the External Auditors without the presence of the Executive Board members.
A quorum shall be two.
AUDIT COMMITTEE REPORT
33Hua Yang BerhadAnnual Report 2010
3. MeetingsandMinutes(cont’d) The decision of the Audit Committee shall be decided by a majority of votes. In the case of an equality of votes, the Chairman shall have a second or casting vote, provided that where two (2) members form a quorum, the Chairman of a meeting at which only such a quorum is present, or at which only two (2) Directors are competent to vote on the question in issue, the Chairman shall not have a casting vote.
The Company Secretary shall act as Secretary of the Committee and shall be responsible for drawing up the agenda with the concurrence of the chairman and circulating it, supported by explanatory documentation to Committee members prior to each meeting.
The Committee shall be reporting to the full Board from time to time its recommendation for consideration and implementation and the actual decision shall be the responsibility of the Board of Director after considering the recommendation of the Committee.
The Secretary shall also be responsible for recording the proceedings of the Audit Committee and the minutes of meetings tabled at Board meetings.
4. Duties
The duties of the Committee should include the following:
• To consider any related party transaction and conflict of interest situation that may arise within the Group including any transaction, procedure or course of conduct that raises questions of management integrity;
• To review the quarterly unaudited financial results announcements, the audited financial statements of the Group before recommending for the Board of Directors approval, focusing on: - compliance with accounting standards and regulatory requirements - any changes in accounting policies and practices - compliance with Stock Exchange and other statutory requirements - going concern issues of any activities - significant and unusual issues arising from the audit
• To discuss with the external auditor, the evaluation of the system of internal controls;
• To consider and recommend the appointment of the external auditors, their remuneration and any questions of resignation or dismissal;
• To recommend the nomination of a person or persons as external auditors;
• To assist the Board in the review of adequacy and effectiveness of the internal control system;
• To review the risk management policies and practices of the Group to ensure their effectiveness;
• To assist the Board in the preparation of the Audit Committee Report for inclusion in the Annual Report;
• To discuss with the external auditors, their audit plan and the scope of audit and ensure co-ordination where more than one audit firm is involved;
• To review the assistance given by the employees of the Group to the external auditors; • To carry out such other responsibilities, functions or assignments as may be directed by the Board of Directors from time to time;
• To review the external auditor’s management letter and management’s response;
• To do the following, in relation to the internal audit function:-
- to review the internal audit programme and consider the findings arising from internal audit report or other internal investigations and management’s response and to determine appropriate corrective actions required by management;
AUDIT COMMITTEE REPORT (CONT’D)
34Hua Yang Berhad
Annual Report 2010
AUDIT COMMITTEE REPORT (CONT’D)
4. Duties(cont’d)
The duties of the Committee should include the following: (cont’d)
- review the adequacy of the scope, functions and resources of the internal audit function, and that it has the necessary authority to carry out its work;
- review any appraisal or assessment of the performance of members if the internal audit function;
- approve any appointment or termination of senior staff members of the internal audit function; and - take cognizance of resignations of internal audit staff members and provide the resignation staff member an opportunity to submit his reasons for resignation.
• To consider other topics as defined by the board.
MEETINGS
Five (5) meetings were held during the financial year ended 31 March 2010 and the attendance of the Audit Committee is as follows:
No. Name of Committee Attendance
1. Tan Sri Dato’ Seri Dr. Ting Chew Peh 5/5 2. Dato’ Tan Bing Hua 5/5 3. Chew Hoe Soon 4/5
The External Auditors were invited to present the Audit Plan for financial year 2010 and their report on the examination of the financial statements. The Audit Committee met with the External Auditors twice during the year without the presence of the Executive board members. The Financial Controller attends the Audit Committee meeting to present the financial results whilst other Board members only attend upon invitation.
The Chairman of the Audit Committee engages on a continuous basis with senior management of the Company in order to be kept informed of matters affecting the Company.
HIGHLIGHTS OF ACTIVITIES
In accordance with the terms of reference of the Audit Committee, the following activities were undertaken by the Audit Committee during the financial year ended 31 March 2010:
(a) Reviewed the unaudited consolidated quarterly results and audited financial statements of the Company and of the Group before recommending them to the Board for approval prior to announcement/submission to Bursa Securities.
(b) Reviewed the audit plan, scope of audit and the results of the external audit with the external auditors.
(c) Reviewed and approved the internal audit plan and internal audit reports and considered the major findings of internal audit review and management’s response.
(d) Reviewed the Statement on Internal Control and the Audit Committee Report for inclusion into the Annual Report.
(e) Reviewed the re-appointment of external auditors and the proposal audit fees prior to recommend same to the Board for approval.
INTERNAL AUDIT FUNCTION
The Group’s internal audit function is outsourced to an external consultant who reports to the Audit Committee and to undertake independent, objective, regular and systematic reviews of the risk management, internal controls and corporate governance system of the Group.
Periodic visits and reviews were carried out in accordance to the approved internal audit plan on business processes of various business units. The results of their reviews, recommendations as well as management’s response and action plan are brought to the attention of the Audit Committee at scheduled meetings. Follow-up reviews are also conducted in ensuring that the recommendations of the internal auditors have been adopted and implemented by the Management. The total cost incurred for the Group’s internal audit function during the financial year was RM80,000.
Financial Statements
36 Directors’ Report
39 Statement by directors
39 Statutory declaration
40 Independent auditors’ report
41 Income statements
42 Balance sheets
44 Statements of changes in equity
45 Cash flow statements
47 Notes to the financial statements
36Hua Yang Berhad
Annual Report 2010
DIRECTORS’ REPORT
The directors have pleasure in presenting their report together with the audited financial statements of the Group and of the Company for the financial year ended 31 March 2010.
Principal activities
The principal activities of the Company consist of investment holding, property development and provision of management services.
The principal activities of the subsidiary companies are stated in Note 11 to the financial statements.
There have been no significant changes in the nature of these activities during the financial year.
Results Group Company RM RM Profit for the year 11,558,553 3,022,856
Attributable to: Equity holders of the Company 11,567,672 3,022,856Minority interests (9,119) -
11,558,553 3,022,856 There were no material transfers to or from reserves or provisions during the financial year.
In the opinion of the directors, the results of the operations of the Group and of the Company during the financial year have not been substantially affected by any item, transaction or event of a material and unusual nature.
Dividends The amounts paid by the Company since 31 March 2009 were as follows: RM
In respect of the financial year ended 31 March 2009 as reported in the Directors’ Report of that year: Final dividend of 2.5% less 25% taxation, on 90,000,000 ordinary shares, approved on 22 August 2009 and paid on 30 September 2009 1,687,500
At the forthcoming Annual General Meeting, a final dividend in respect of the current financial year ended 31 March 2010, of 3% less 25% taxation on 90,000,000 ordinary shares, amounting to a total dividend of RM2,025,000 (2.25 sen net per ordinary share) will be proposed for shareholders’ approval. The financial statements for the current financial year do not reflect this proposed dividend. Such dividend, if approved by the shareholders, will be accounted for in shareholders’ equity as an appropriation of retained earnings in the next financial year ending 31 March 2011. Directors
The names of the directors of the Company in office since the date of the last report and at the date of this report are:
Tan Sri Dato’ Seri Dr. Ting Chew Peh Ho Mook Leong Ho Wen Yan Dato’ Tan Bing Hua Tan Sri Dato’ Seri Prof. Dr. Yom Ahmad Bin Ngah Ahmad Chew Po Sim Chew Hoe Soon Neither at the end of the financial year, nor at any time during that year, did there subsist any arrangement to which the Company was a party, whereby directors might acquire benefits by means of the acquisition of shares in, or debentures of, the Company or any other body corporate.
37Hua Yang BerhadAnnual Report 2010
DIRECTORS’ REPORT (CONT’D)
The following directors who held office at the end of the financial year had, according to the register required to be kept under Section 134 of the Companies Act, 1965, an interest in shares of the Company and its subsidiary companies as stated below:
Number of ordinary shares of RM1 each Balance Balance as at Bought Sold as at 1.4.2009 During the year 31.3.2010 Hua Yang Berhad Direct interest Tan Sri Dato’ Seri Dr. Ting Chew Peh 110,000 - - 110,000 Ho Mook Leong 1,307,326 - - 1,307,326 Ho Wen Yan 440,000 - - 440,000 Tan Sri Dato’ Seri Prof. Dr. Yom Ahmad Bin Ngah Ahmad 1,092,472 - - 1,092,472 Chew Hoe Soon 96,000 - - 96,000 Dato’ Tan Bing Hua 1,000 - - 1,000 Deemed interest Tan Sri Dato’ Seri Dr. Ting Chew Peh** 472,078 - (377,500) 94,578 Ho Mook Leong** 500,000 30,700 - 530,700 Ho Wen Yan* 29,125,215 - - 29,125,215 Chew Po Sim* 29,125,215 - - 29,125,215 Chew Hoe Soon** 175,000 12,000 - 187,000 * Ho Wen Yan and Chew Po Sim by virtue of their interest in the Company are also deemed interested in shares of all the Company’s subsidiary companies to the extent that the Company has an interest. ** Deemed interested through spouse and sibling
Since the end of the previous financial year, no director has received or become entitled to receive any benefit (other than a benefit included in the aggregate amount of emoluments received or due and receivable by the directors or the fixed salary of a full-time employee of the Company as shown in Note 7 to the financial statements) by reason of a contract made by the Company or a related corporation with any director or with a firm of which the director is a member, or with a company in which the director has a substantial financial interest required to be disclosed by Section 169(8) of the Companies Act, 1965, except as disclosed in Note 35 to the financial statements.
38Hua Yang Berhad
Annual Report 2010
Other statutory information
(a) Before the income statements and balance sheets of the Group and of the Company were made out, the directors took reasonable steps:
(i) to ascertain that proper action had been taken in relation to the writing off of bad debts and the making of allowance for doubtful debts and satisfied themselves that all known bad debts had been written off and that adequate allowance had been made for doubtful debts; and
(ii) to ensure that any current assets which were unlikely to realise their values as shown in the accounting records in the ordinary course of business had been written down to an amount which they might be expected so to realise.
(b) At the date of this report, the directors are not aware of any circumstances which would render:
(i) the amount written off for bad debts or the amount of the allowance for doubtful debts in the Group and the Company inadequate to any substantial extent; and
(ii) the values attributed to the current assets in the financial statements of the Group and of the Company misleading.
(c) At the date of this report, the directors are not aware of any circumstances which have arisen which would render adherence to the existing method of valuation of assets or liabilities of the Group and of the Company misleading or inappropriate.
(d) At the date of this report, the directors are not aware of any circumstances not otherwise dealt with in this report or financial statements of the Group and of the Company which would render any amount stated in the financial statements misleading.
(e) As at the date of this report, there does not exist:
(i) any charge on the assets of the Group or of the Company which has arisen since the end of the financial year which secures the liabilities of any other person; or
(ii) any contingent liability in respect of the Group or of the Company which has arisen since the end of the financial year.
(f) In the opinion of the directors:
(i) no contingent or other liability has become enforceable or is likely to become enforceable within the period of twelve months after the end of the financial year which will or may affect the ability of the Group or of the Company to meet their obligations when they fall due; and
(ii) no item, transaction or event of a material and unusual nature has arisen in the interval between the end of the financial year and the date of this report which is likely to affect substantially the results of the operations of the Group or of the Company for the financial year in which this report is made.
Subsequent events Details of subsequent events are disclosed in Note 40 to the financial statements. Auditors
The auditors, Ernst & Young, have expressed their willingness to continue in office. Signed for and on behalf of the Board in accordance with a resolution of the directors dated 16 July 2010. Ho Mook Leong Ho Wen Yan
Ipoh, Perak Darul Ridzuan, Malaysia
DIRECTORS’ REPORT (CONT’D)
39Hua Yang BerhadAnnual Report 2010
We, Ho Mook Leong and Ho Wen Yan, being two of the directors of Hua Yang Berhad, do hereby state that in the opinion of the directors, the accompanying financial statements set out on pages 41 to 94 are drawn up in accordance with applicable Financial Reporting Standards in Malaysia and the provisions of the Companies Act, 1965 so as to give a true and fair view of the financial position of the Group and of the Company as at 31 March 2010 and of the results and the cash flows of the Group and of the Company for the year then ended.
Signed for and on behalf of the Board in accordance with a resolution of the directors dated 16 July 2010.
Ho Mook Leong Ho Wen Yan Ipoh, Perak Darul Ridzuan, Malaysia
STATUTORY DECLARATION PURSUANT TO SECTION 169(16) OF THE COMPANIES ACT, 1965
I, Chan Sew Moh, being the officer primarily responsible for the financial management of Hua Yang Berhad, do solemnly and sincerely declare that the accompanying financial statements set out on pages 41 to 94 are in my opinion correct, and I make this solemn declaration conscientiously believing the same to be true and by virtue of the provisions of the Statutory Declarations Act, 1960.
Subscribed and solemnly declared by the abovenamed Chan Sew Moh at Ipoh in the State of Perak Darul Ridzuan on 16 July 2010. Chan Sew Moh Before me,
Law Hong San AMP, PJKPesuruhjaya Sumpah2C Persiaran Greentown 6Pusat Perdagangan Greentown30450 Ipoh, Perak
STATEMENT BY DIRECTORS PURSUANT TO SECTION 169(15) OF THE COMPANIES ACT, 1965
40Hua Yang Berhad
Annual Report 2010
Report on the financial statements
We have audited the financial statements of Hua Yang Berhad, which comprise the balance sheets as at 31 March 2010 of the Group and of the Company, and the income statements, statements of changes in equity and cash flow statements for the year then ended, and a summary of significant accounting policies and other explanatory notes, as set out on pages 41 to 94.
Directors’ responsibility for the financial statements
The directors of the Company are responsible for the preparation and fair presentation of these financial statements in accordance with Financial Reporting Standards and the Companies Act, 1965 in Malaysia. This responsibility includes: designing, implementing and maintaining internal control relevant to the preparation and fair presentation of financial statements that are free from material misstatement, whether due to fraud or error; selecting and applying appropriate accounting policies; and making accounting estimates that are reasonable in the circumstances.
Auditors’ responsibility
Our responsibility is to express an opinion on these financial statements based on our audit. We conducted our audit in accordance with approved standards on auditing in Malaysia. Those standards require that we comply with ethical requirements and plan and perform the audit to obtain reasonable assurance whether the financial statements are free from material misstatement.
An audit involves performing procedures to obtain audit evidence about the amounts and disclosures in the financial statements. The procedures selected depend on our judgement, including the assessment of risks of material misstatement of the financial statements, whether due to fraud or error. In making those risk assessments, we consider internal control relevant to the entity’s preparation and fair presentation of the financial statements in order to design audit procedures that are appropriate in the circumstances, but not for the purpose of expressing an opinion on the effectiveness of the entity’s internal control. An audit also includes evaluating the appropriateness of the accounting policies used and the reasonableness of accounting estimates made by the directors, as well as evaluating the overall presentation of the financial statements.
We believe that the audit evidence we have obtained is sufficient and appropriate to provide a basis for our audit opinion.
Opinion
In our opinion, the financial statements have been properly drawn up in accordance with Financial Reporting Standards and the Companies Act, 1965 in Malaysia so as to give a true and fair view of the financial position of the Group and of the Company as at 31 March 2010 and of their financial performance and cash flows for the year then ended.
Report on other legal and regulatory requirements
In accordance with the requirements of the Companies Act, 1965 in Malaysia, we also report the following: (a) In our opinion, the accounting and other records and the registers required by the Act to be kept by the Company and its subsidiary companies have been properly kept in accordance with the provisions of the Act.
(b) We are satisfied that the financial statements of the subsidiary companies that have been consolidated with the financial statements of the Company are in form and content appropriate and proper for the purposes of the preparation of the consolidated financial statements and we have received satisfactory information and explanations required by us for those purposes. (c) The auditors’ reports on the financial statements of the subsidiary companies were not subject to any qualification and did not include any comment required to be made under Section 174(3) of the Act.
Other matters
This report is made solely to the members of the Company, as a body, in accordance with Section 174 of the Companies Act, 1965 in Malaysia and for no other purpose. We do not assume responsibility to any other person for the content of this report.
Ernst & Young Oo Boon BengAF: 0039 No. 1939/12/10 (J)Chartered Accountants Chartered Accountant
Ipoh, Perak Darul Ridzuan, Malaysia Date: 16 July 2010
INDEPENDENT AUDITORS’ REPORT TO THE MEMBERS OF HUA YANG BERHAD
41Hua Yang BerhadAnnual Report 2010
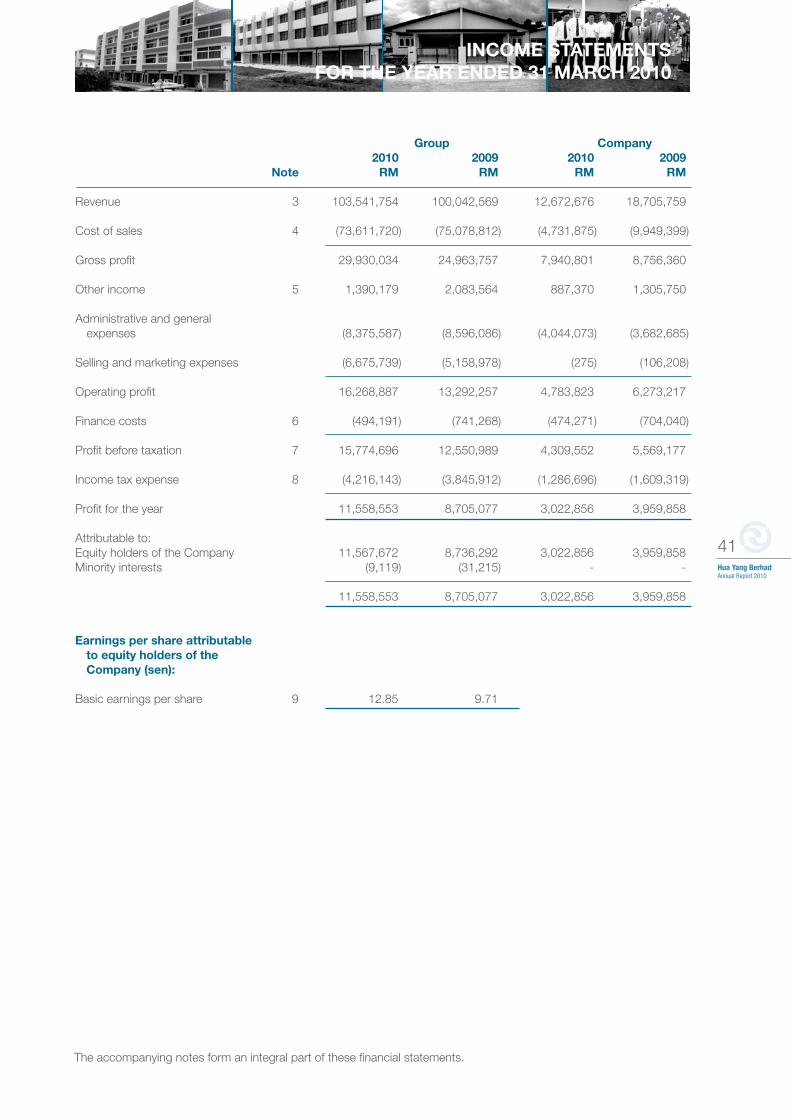
Group Company 2010 2009 2010 2009 Note RM RM RM RM Revenue 3 103,541,754 100,042,569 12,672,676 18,705,759
Cost of sales 4 (73,611,720) (75,078,812) (4,731,875) (9,949,399)
Gross profit 29,930,034 24,963,757 7,940,801 8,756,360
Other income 5 1,390,179 2,083,564 887,370 1,305,750 Administrative and general expenses (8,375,587) (8,596,086) (4,044,073) (3,682,685) Selling and marketing expenses (6,675,739) (5,158,978) (275) (106,208)
Operating profit 16,268,887 13,292,257 4,783,823 6,273,217 Finance costs 6 (494,191) (741,268) (474,271) (704,040)
Profit before taxation 7 15,774,696 12,550,989 4,309,552 5,569,177 Income tax expense 8 (4,216,143) (3,845,912) (1,286,696) (1,609,319)
Profit for the year 11,558,553 8,705,077 3,022,856 3,959,858 Attributable to: Equity holders of the Company 11,567,672 8,736,292 3,022,856 3,959,858 Minority interests (9,119) (31,215) - -
11,558,553 8,705,077 3,022,856 3,959,858 Earnings per share attributable to equity holders of the Company (sen): Basic earnings per share 9 12.85 9.71
INCOME STATEMENTSFOR THE YEAR ENDED 31 MARCH 2010
The accompanying notes form an integral part of these financial statements.
42Hua Yang Berhad
Annual Report 2010
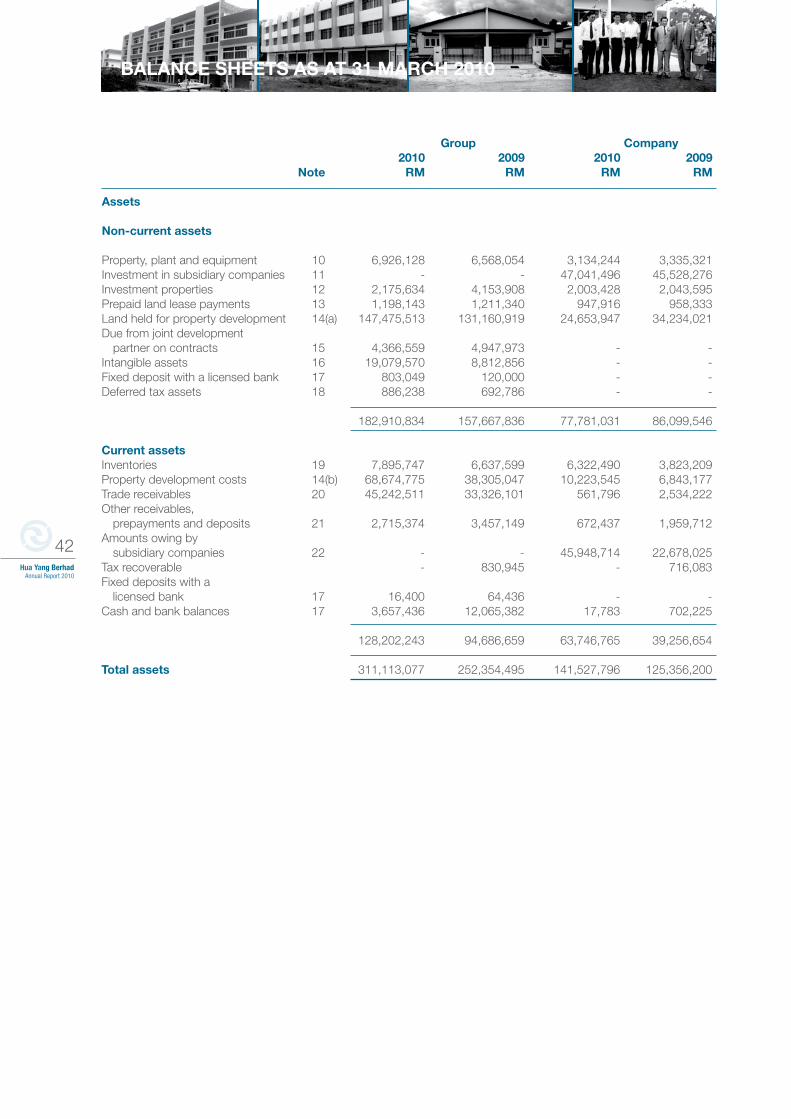
Group Company 2010 2009 2010 2009 Note RM RM RM RM Assets Non-current assets Property, plant and equipment 10 6,926,128 6,568,054 3,134,244 3,335,321 Investment in subsidiary companies 11 - - 47,041,496 45,528,276 Investment properties 12 2,175,634 4,153,908 2,003,428 2,043,595 Prepaid land lease payments 13 1,198,143 1,211,340 947,916 958,333 Land held for property development 14(a) 147,475,513 131,160,919 24,653,947 34,234,021 Due from joint development partner on contracts 15 4,366,559 4,947,973 - - Intangible assets 16 19,079,570 8,812,856 - - Fixed deposit with a licensed bank 17 803,049 120,000 - - Deferred tax assets 18 886,238 692,786 - -
182,910,834 157,667,836 77,781,031 86,099,546 Current assets Inventories 19 7,895,747 6,637,599 6,322,490 3,823,209 Property development costs 14(b) 68,674,775 38,305,047 10,223,545 6,843,177 Trade receivables 20 45,242,511 33,326,101 561,796 2,534,222 Other receivables, prepayments and deposits 21 2,715,374 3,457,149 672,437 1,959,712 Amounts owing by subsidiary companies 22 - - 45,948,714 22,678,025 Tax recoverable - 830,945 - 716,083 Fixed deposits with a licensed bank 17 16,400 64,436 - - Cash and bank balances 17 3,657,436 12,065,382 17,783 702,225
128,202,243 94,686,659 63,746,765 39,256,654 Total assets 311,113,077 252,354,495 141,527,796 125,356,200
BALANCE SHEETS AS AT 31 MARCH 2010
43Hua Yang BerhadAnnual Report 2010
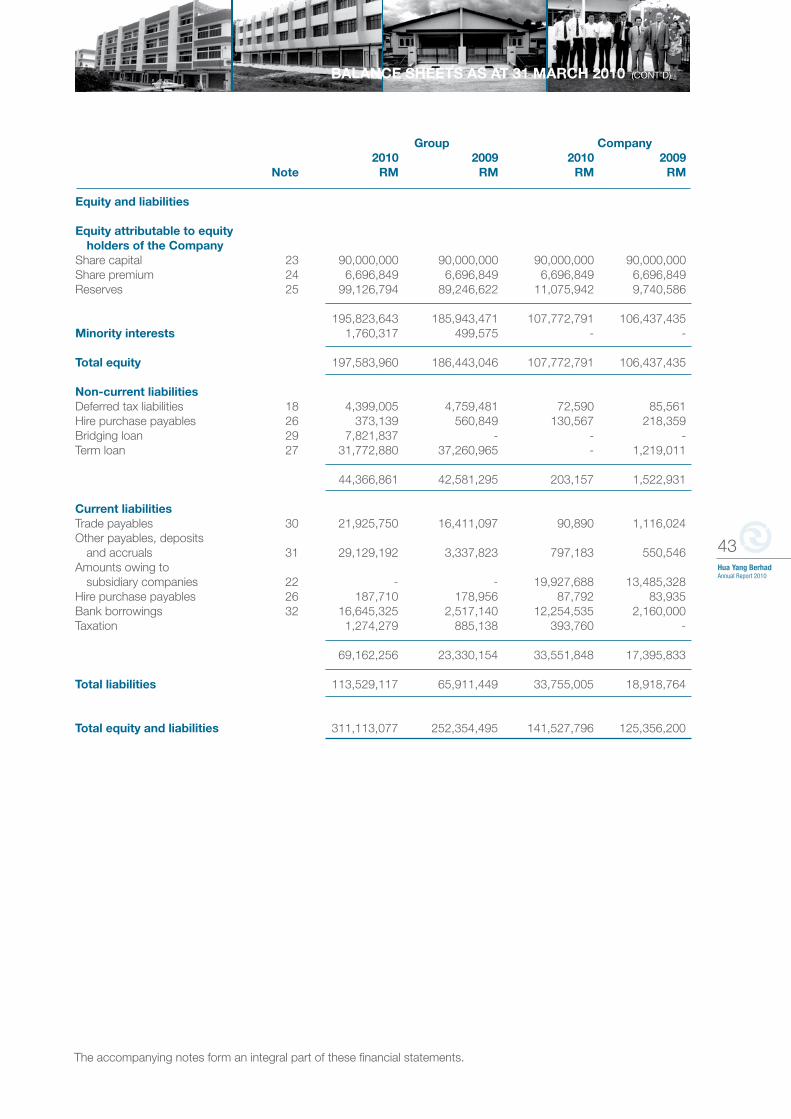
Group Company 2010 2009 2010 2009 Note RM RM RM RM Equity and liabilities Equity attributable to equity holders of the Company Share capital 23 90,000,000 90,000,000 90,000,000 90,000,000 Share premium 24 6,696,849 6,696,849 6,696,849 6,696,849 Reserves 25 99,126,794 89,246,622 11,075,942 9,740,586
195,823,643 185,943,471 107,772,791 106,437,435 Minority interests 1,760,317 499,575 - -
Total equity 197,583,960 186,443,046 107,772,791 106,437,435 Non-current liabilities Deferred tax liabilities 18 4,399,005 4,759,481 72,590 85,561 Hire purchase payables 26 373,139 560,849 130,567 218,359 Bridging loan 29 7,821,837 - - - Term loan 27 31,772,880 37,260,965 - 1,219,011
44,366,861 42,581,295 203,157 1,522,931 Current liabilities Trade payables 30 21,925,750 16,411,097 90,890 1,116,024 Other payables, deposits and accruals 31 29,129,192 3,337,823 797,183 550,546 Amounts owing to subsidiary companies 22 - - 19,927,688 13,485,328 Hire purchase payables 26 187,710 178,956 87,792 83,935 Bank borrowings 32 16,645,325 2,517,140 12,254,535 2,160,000 Taxation 1,274,279 885,138 393,760 -
69,162,256 23,330,154 33,551,848 17,395,833 Total liabilities 113,529,117 65,911,449 33,755,005 18,918,764 Total equity and liabilities 311,113,077 252,354,495 141,527,796 125,356,200
BALANCE SHEETS AS AT 31 MARCH 2010 (CONT’D)
The accompanying notes form an integral part of these financial statements.
44Hua Yang Berhad
Annual Report 2010
STATEMENTS OF CHANGES IN EQUITY FOR THE YEAR ENDED 31 MARCH 2010
A
ttri
but
able
to
eq
uity
ho
lder
s o
f th
e C
om
pan
y
N
on-
dis
trib
utab
le
Dis
trib
utab
le
Cap
ital
S
hare
S
hare
re
dem
pti
on
R
etai
ned
Min
ori
ty
Tota
l
c
apit
al
pre
miu
m
res
erve
ea
rnin
gs
To
tal
inte
rest
s
eq
uity
N
ote
R
M
RM
R
M
RM
R
M
RM
R
M
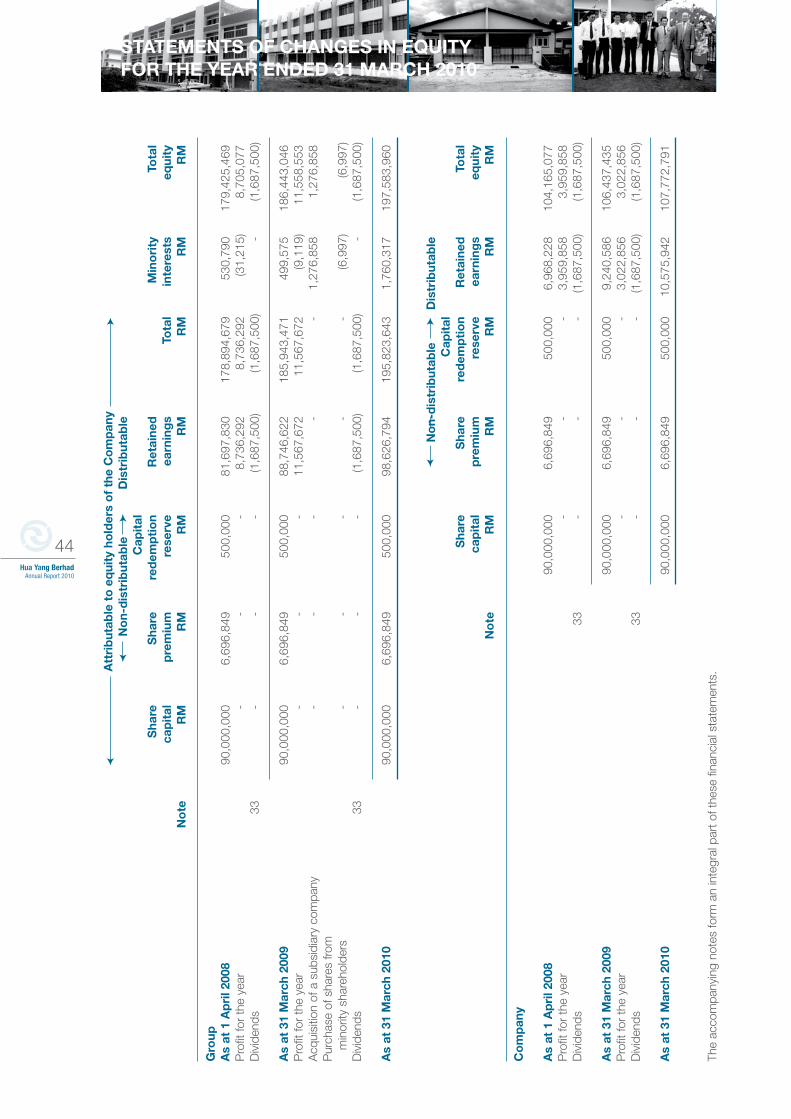
Gro
up
A
s at
1 A
pri
l 200
8
90
,000
,000
6,
696,
849
50
0,00
0
81,6
97,8
30
178,
894,
679
53
0,79
0
179
,425
,469
P
rofit
for
the
year
-
-
-
8,73
6,29
2
8,73
6,29
2
(31,
215)
8
,705
,077
D
ivid
ends
33
-
-
-
(1
,687
,500
) (1
,687
,500
) -
(1
,687
,500
)
As
at 3
1 M
arch
200
9
9
0,00
0,00
0
6,69
6,84
9
500
,000
88
,746
,622
18
5,94
3,47
1
499,
575
1
86,4
43,0
46
Pro
fit fo
r th
e ye
ar
-
-
-
11
,567
,672
11
,567
,672
(9
,119
) 11
,558
,553
Acq
uisi
tion
of a
sub
sidi
ary
com
pany
-
-
-
-
-
1,27
6,85
8 1,
276,
858
Pur
chas
e of
sha
res
from
m
inor
ity s
hare
hold
ers
-
-
-
-
-
(6
,997
) (6
,997
)D
ivid
ends
33
-
-
-
(1
,687
,500
) (1
,687
,500
) -
(1
,687
,500
)
As
at 3
1 M
arch
201
0
90,
000,
000
6,
696,
849
5
00,0
00
98,6
26,7
94
195,
823,
643
1,76
0,31
7 19
7,58
3,96
0
N
on-
dis
trib
utab
le
Dis
trib
utab
le
Cap
ital
S
hare
S
hare
re
dem
pti
on
R
etai
ned
T
ota
l
cap
ital
p
rem
ium
re
serv
e
earn
ing
s
eq
uity
N
ote
R
M
RM
R
M
RM
R
M
Co
mp
any
A
s at
1 A
pri
l 200
8
90,
000,
000
6,
696,
849
50
0,00
0
6,96
8,22
8
104
,165
,077
P
rofit
for
the
year
-
-
-
3,9
59,8
58
3,9
59,8
58
Div
iden
ds
33
-
-
-
(1,6
87,5
00)
(1,6
87,5
00)
As
at 3
1 M
arch
200
9
90,
000,
000
6,
696,
849
50
0,00
0
9,24
0,58
6
106
,437
,435
P
rofit
for
the
year
-
-
-
3,02
2,85
6 3,
022,
856
Div
iden
ds
33
-
-
-
(1,6
87,5
00)
(1,6
87,5
00)
As
at 3
1 M
arch
201
0
90,
000,
000
6,
696,
849
50
0,00
0
10,5
75,9
42
107,
772,
791
The
acco
mpa
nyin
g no
tes
form
an
inte
gral
par
t of t
hese
fina
ncia
l sta
tem
ents
.
45Hua Yang BerhadAnnual Report 2010
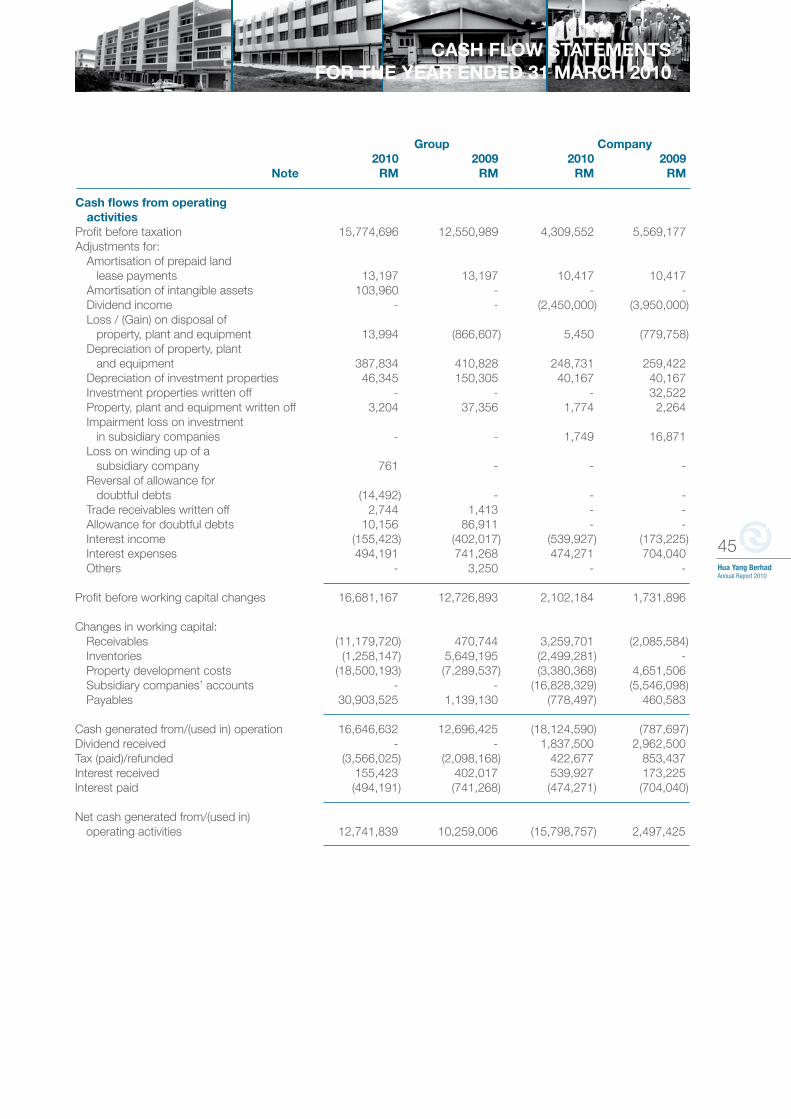
Group Company 2010 2009 2010 2009 Note RM RM RM RM
Cash flows from operating activities Profit before taxation 15,774,696 12,550,989 4,309,552 5,569,177Adjustments for: Amortisation of prepaid land lease payments 13,197 13,197 10,417 10,417 Amortisation of intangible assets 103,960 - - - Dividend income - - (2,450,000) (3,950,000) Loss / (Gain) on disposal of property, plant and equipment 13,994 (866,607) 5,450 (779,758) Depreciation of property, plant and equipment 387,834 410,828 248,731 259,422 Depreciation of investment properties 46,345 150,305 40,167 40,167 Investment properties written off - - - 32,522 Property, plant and equipment written off 3,204 37,356 1,774 2,264 Impairment loss on investment in subsidiary companies - - 1,749 16,871 Loss on winding up of a subsidiary company 761 - - - Reversal of allowance for doubtful debts (14,492) - - - Trade receivables written off 2,744 1,413 - - Allowance for doubtful debts 10,156 86,911 - - Interest income (155,423) (402,017) (539,927) (173,225) Interest expenses 494,191 741,268 474,271 704,040 Others - 3,250 - -
Profit before working capital changes 16,681,167 12,726,893 2,102,184 1,731,896
Changes in working capital: Receivables (11,179,720) 470,744 3,259,701 (2,085,584) Inventories (1,258,147) 5,649,195 (2,499,281) - Property development costs (18,500,193) (7,289,537) (3,380,368) 4,651,506 Subsidiary companies’ accounts - - (16,828,329) (5,546,098) Payables 30,903,525 1,139,130 (778,497) 460,583
Cash generated from/(used in) operation 16,646,632 12,696,425 (18,124,590) (787,697)Dividend received - - 1,837,500 2,962,500 Tax (paid)/refunded (3,566,025) (2,098,168) 422,677 853,437 Interest received 155,423 402,017 539,927 173,225 Interest paid (494,191) (741,268) (474,271) (704,040)
Net cash generated from/(used in) operating activities 12,741,839 10,259,006 (15,798,757) 2,497,425
CASH FLOW STATEMENTSFOR THE YEAR ENDED 31 MARCH 2010
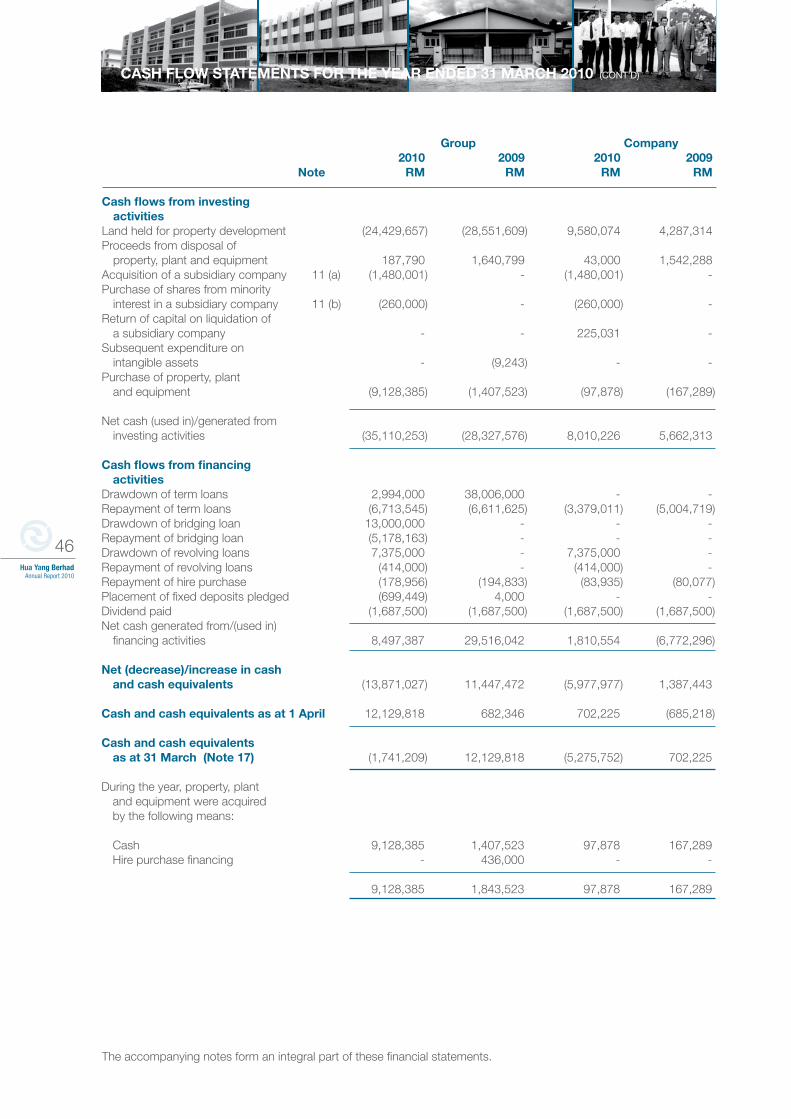
46Hua Yang Berhad
Annual Report 2010
Group Company 2010 2009 2010 2009 Note RM RM RM RM
Cash flows from investing activities Land held for property development (24,429,657) (28,551,609) 9,580,074 4,287,314 Proceeds from disposal of property, plant and equipment 187,790 1,640,799 43,000 1,542,288 Acquisition of a subsidiary company 11 (a) (1,480,001) - (1,480,001) - Purchase of shares from minority interest in a subsidiary company 11 (b) (260,000) - (260,000) - Return of capital on liquidation of a subsidiary company - - 225,031 - Subsequent expenditure on intangible assets - (9,243) - - Purchase of property, plant and equipment (9,128,385) (1,407,523) (97,878) (167,289)
Net cash (used in)/generated from investing activities (35,110,253) (28,327,576) 8,010,226 5,662,313
Cash flows from financing activitiesDrawdown of term loans 2,994,000 38,006,000 - -Repayment of term loans (6,713,545) (6,611,625) (3,379,011) (5,004,719)Drawdown of bridging loan 13,000,000 - - -Repayment of bridging loan (5,178,163) - - -Drawdown of revolving loans 7,375,000 - 7,375,000 -Repayment of revolving loans (414,000) - (414,000) -Repayment of hire purchase (178,956) (194,833) (83,935) (80,077)Placement of fixed deposits pledged (699,449) 4,000 - -Dividend paid (1,687,500) (1,687,500) (1,687,500) (1,687,500)Net cash generated from/(used in) financing activities 8,497,387 29,516,042 1,810,554 (6,772,296)
Net (decrease)/increase in cash and cash equivalents (13,871,027) 11,447,472 (5,977,977) 1,387,443
Cash and cash equivalents as at 1 April 12,129,818 682,346 702,225 (685,218)
Cash and cash equivalents as at 31 March (Note 17) (1,741,209) 12,129,818 (5,275,752) 702,225
During the year, property, plant and equipment were acquired by the following means: Cash 9,128,385 1,407,523 97,878 167,289 Hire purchase financing - 436,000 - - 9,128,385 1,843,523 97,878 167,289
The accompanying notes form an integral part of these financial statements.
CASH FLOW STATEMENTS FOR THE YEAR ENDED 31 MARCH 2010 (CONT’D)
47Hua Yang BerhadAnnual Report 2010
1. Corporate information
The Company is a public limited liability company, incorporated and domiciled in Malaysia and is listed on the Main Market of Bursa Malaysia Securities Berhad.
The principal activities of the Company consist of investment holding, property development and provision of management services. The principal activities of its subsidiary companies are set out in Note 11 to the financial statements.
The registered office of the Company is located at 123A , Jalan Raja Permaisuri Bainun (Jalan Kampar), 30250 Ipoh, Perak Darul Ridzuan whilst the principal place of business is located at C-21, Jalan Medan Selayang 1, Medan Selayang, 68100 Batu Caves, Selangor Darul Ehsan.
The financial statements were authorised for issue by the Board of Directors in accordance with a resolution of the directors on 16 July 2010.
2. Significant accounting policies 2.1 Basis of preparation
The financial statements of the Group and of the Company have been prepared under the historical cost basis and comply with the provisions of the Companies Act, 1965 and applicable Financial Reporting Standards (“FRS”) in Malaysia.
The financial statements are presented in Ringgit Malaysia (“RM”).
2.2 Summary of significant accounting policies (a) Subsidiary companies and basis of consolidation (i) Subsidiary companies
Subsidiary companies are entities over which the Group has the ability to control the financial and operating policies so as to obtain benefits from their activities. The existence and effect of potential voting rights that are currently exercisable or convertible are considered when assessing whether the Group has such power over another entity.
In the Company’s separate financial statements, investments in subsidiary companies are stated at cost less impairment losses. On disposal of such investments, the difference between net disposal proceeds and their carrying amounts is included in the income statements.
(ii) Basis of consolidation
The consolidated financial statements comprise the financial statements of the Company and its subsidiary companies as at the balance sheet date. The financial statements of the subsidiary companies are prepared for the same reporting date as the Company.
Subsidiary companies are consolidated from the date of acquisition, being the date on which the Group obtains control, and continue to be consolidated until the date that such control ceases. In preparing the consolidated financial statements, intragroup balances, transactions and unrealised gains or losses are eliminated in full. Uniform accounting policies are adopted in the consolidated financial statements for like transactions and events in similar circumstances.
Acquisitions of subsidiary companies are accounted for using the acquisition method. The acquisition method of accounting involves allocating the cost of the acquisition to the fair value of the assets acquired and liabilities and contingent liabilities assumed at the date of acquisition. The cost of an acquisition is measured as the aggregate of the fair values, at the date of exchange, of the assets given, liabilities incurred or assumed, and equity instruments issued, plus any costs directly attributable to the acquisition.
Any excess of the cost of the acquisition over the Group’s interest in the net fair value of the identifiable assets, liabilities and contingent liabilities represents goodwill. Any excess of the Group’s interest in the net fair value of the identifiable assets, liabilities and contingent liabilities over the cost of acquisition is recognised immediately in the income statements.
NOTES TO THE FINANCIAL STATEMENTS - 31 MARCH 2010
48Hua Yang Berhad
Annual Report 2010
2. Significant accounting policies (contd.)
2.2 Summary of significant accounting policies (contd.)
(a) Subsidiary companies and basis of consolidation (contd.)
(ii) Basis of consolidation (contd.)
Minority interests represent the portion of profit or loss and net assets in subsidiary companies not held by the Group. It is measured at the minorities’ share of the fair value of the subsidiary companies’ identifiable assets and liabilities at the acquisition date and the minorities’ share of changes in the subsidiary companies’ equity since then. (b) Goodwill
Goodwill acquired in a business combination is initially measured at cost being the excess of the cost of business combination over the Group’s interest in the net fair value of the identifiable assets, liabilities and contingent liabilities. Following the initial recognition, goodwill is measured at cost less any accumulated impairment losses. Goodwill is not amortised but instead, it is reviewed for impairment, annually or more frequently if events or changes in circumstances indicate that the carrying value may be impaired. Gains and losses on the disposal of an entity include the carrying amount of goodwill relating to the entity sold.
(c) Property, plant and equipment
All items of property, plant and equipment are initially recorded at cost. Subsequent costs are included in the asset’s carrying amount or recognised as a separate asset, as appropriate, only when it is probable that future economic benefits associated with the item will flow to the Group and the cost of the item can be measured reliably. The carrying amount of the replaced part is derecognised. All other repairs and maintenance are charged to the income statements during the financial period in which they are incurred.
Subsequent to recognition, property, plant and equipment are stated at cost less accumulated depreciation and any accumulated impairment losses.
Assets in the course of construction are carried at cost less any impairment loss where the recoverable amount of the asset is estimated to be lower than its carrying amount. Depreciation of these assets, on the same basis as other assets, commences when the assets are ready for their intended use.
Freehold land is not amortised.
Depreciation of other property, plant and equipment is provided for on a straight-line basis to write off the cost of each asset to its residual value over its estimated useful life, at the following annual rates:
% Buildings 2 Machinery, cabin, signboards and electrical installation 10 - 20 Furniture, fittings, office equipment and renovation 10 - 20 Motor vehicles 20
The residual values, useful life and depreciation method are reviewed at each financial year-end to ensure that the amount, method and period of depreciation are consistent with previous estimates and the expected pattern of consumption of the future economic benefits embodied in the items of property, plant and equipment.
An item of property, plant and equipment is derecognised upon disposal or when no future economic benefits are expected from its use or disposal. The difference between the net disposal proceeds, if any and the net carrying amount is recognised in the income statements.
NOTES TO THE FINANCIAL STATEMENTS - 31 MARCH 2010 (CONT’D)
49Hua Yang BerhadAnnual Report 2010
2. Significant accounting policies (contd.)
2.2 Summary of significant accounting policies (contd.)
(d) Concession assets
Concession assets are carried at cost less any accumulated amortisation and any accumulated impairment losses. The useful lives of concession assets are assessed to be finite. Concession assets with finite lives are amortised on a straight-line basis over the estimated economic useful lives and assessed for impairment whenever there is an indication that the concession assets may be impaired.
The concession assets are amortised over their concession periods of between 20 and 30 years.
The amortisation period and the amortisation method for concession assets with a finite useful life are reviewed at least at each balance sheet date. (e) Investment properties
Investment properties are properties which are held either to earn rental income or for capital appreciation or for both. Such properties are measured initially at cost, including transaction costs.
Subsequent to initial recognition, property, plant and equipment are stated at cost less accumulated depreciation and any accumulated impairment losses.
Freehold land is not amortised. Leasehold land is amortised over its remaining lease period of 77 years at the date of acquisition. The principal annual rate used for building is 2% per annum.
Investment properties are derecognised when either they have been disposed of or when the investment property is permanently withdrawn from use and no future economic benefit is expected from its disposal. Any gains or losses on the retirement or disposal of an investment property are recognised in the income statements in the year in which they arise.
(f) Land held for property development and property development costs (i) Land held for property development
Land held for property development consists of land where no development activities have been carried out or where development activities are not expected to be completed within the normal operating cycle. Such land is classified within non-current assets and is stated at cost less any accumulated impairment losses.
Land held for property development is reclassified as property development costs at the point when development activities have commenced and where it can be demonstrated that the development activities can be completed within the normal operating cycle.
(ii) Property development costs
Property development costs comprise all costs that are directly attributable to development activities or that can be allocated on a reasonable basis to such activities.
When the financial outcome of a development activity can be reliably estimated, property development revenue and expenses are recognised in the income statement by using the stage of completion method. The stage of completion is determined by the proportion that property development costs incurred for work performed to date bear to the estimated total property development costs.
Where the financial outcome of a development activity cannot be reliably estimated, property development revenue is recognised only to the extent of property development costs incurred that is probable will be recoverable, and property development costs on properties sold are recognised as an expense in the period in which they are incurred.
Any expected loss on a development project, including costs to be incurred over the defects liability period, is recognised as an expense immediately.
NOTES TO THE FINANCIAL STATEMENTS - 31 MARCH 2010 (CONT’D)
50Hua Yang Berhad
Annual Report 2010
2. Significant accounting policies (contd.)
2.2 Summary of significant accounting policies (contd.)
(f) Land held for property development and property development costs (contd.)
(ii) Property development costs (contd.)
The excess of revenue recognised in the income statements over billings to purchasers is classified as accrued billings within trade receivables and the excess of billings to purchasers over revenue recognised in the income statements is classified as progress billings within trade payables.
Property development costs not recognised as an expense are recognised as an asset, which is measured at the lower of cost and net realisable value.
(g) Construction contracts
Where the outcome of a construction contract can be reliably estimated, contract revenue and contract costs are recognised as revenue and expenses respectively by using the stage of completion method. The stage of completion is measured by reference to the proportion of contract costs incurred for work performed to date to the estimated total contract costs.
Where the outcome of a construction contract cannot be reliably estimated, contract revenue is recognised to the extent of contract costs incurred that it is probable will be recoverable. Contract costs are recognised as expenses in the period in which they are incurred.
When it is probable that total contract costs will exceed total contract revenue, the expected loss is recognised as an expense immediately.
When the total of costs incurred on construction contracts plus, recognised profits (less recognised losses), exceeds progress billings, the balance is classified as amount due from customers on contracts. When progress billings exceed costs incurred plus, recognised profits (less recognised losses), the balance is classified as amount due to customers on contracts.
(h) Impairment of non-financial assets
The carrying amounts of assets, other than property development costs, construction contract costs, inventories and financial assets, are reviewed at each balance sheet date to determine whether there is any indication of impairment. If any such indication exists, the asset’s recoverable amount is estimated to determine the amount of impairment loss.
For the purpose of impairment testing of these assets, recoverable amount is determined on an individual asset basis unless the asset does not generate cash flows that are largely independent of those from other assets. If this is the case, recoverable amount is determined for the cash-generating unit (CGU) to which the asset belongs to.
An asset’s recoverable amount is the higher of an asset’s or CGU’s fair value less costs to sell and its value in use. In assessing value in use, the estimated future cash flows are discounted to their present value using a pre-tax discount rate that reflects current market assessments of the time value of money and the risks specific to the asset. Where the carrying amount of an asset exceeds its recoverable amount, the asset is considered impaired and is written down to its recoverable amount. Impairment losses recognised in respect of a CGU or groups of CGUs are allocated first to reduce the carrying amount of any goodwill allocated to those units or groups of units and then, to reduce the carrying amount of the other assets in the unit or groups of units on a pro-rata basis.
An impairment loss is recognised in the income statements in the period in which it arises. Impairment loss on goodwill is not reversed in a subsequent period. An impairment loss for an asset other than goodwill is reversed if, and only if, there has been a change in the estimates used to determine the asset’s recoverable amount since the last impairment loss was recognised. The carrying amount of an asset is increased to its revised recoverable amount, provided that this amount does not exceed the carrying amount that would have been determined (net of depreciation) had no impairment loss been recognised for the asset in prior years. A reversal of impairment loss for an asset is recognised in the income statements.
NOTES TO THE FINANCIAL STATEMENTS - 31 MARCH 2010 (CONT’D)
51Hua Yang BerhadAnnual Report 2010
2. Significant accounting policies (contd.)
2.2 Summary of significant accounting policies (contd.)
(i) Inventories
Inventories are stated at lower of cost and net realisable value. The cost of unsold properties comprises cost associated with the acquisition of land, direct costs and appropriate proportions of common costs.
Net realisable value is the estimated selling price in the ordinary course of business less the estimated costs of completion and the estimated costs necessary to make the sale.
(j) Financial instruments
Financial instruments are recognised in the balance sheets when the Group has become a party to the contractual provisions of the instrument.
Financial instruments are classified as liabilities or equity in accordance with the substance of the contractual arrangement. Interest, dividends and gains and losses relating to a financial instrument classified as a liability, are reported as expense or income. Distributions to holders of financial instruments classified as equity are recognised directly in equity. Financial instruments are offset when the Group has a legally enforceable right to offset and intends to settle either on a net basis or to realise the asset and settle the liability simultaneously.
(i) Cash and cash equivalents
For the purposes of the cash flow statement, cash and cash equivalents comprise cash on hand and at bank, deposits at call and short term, highly liquid investments that are readily convertible to known amounts of cash and which are subject to an insignificant risk of changes in value. These are stated after off-set against overdraft balances where appropriate. Cash and cash equivalents in the cash flow statements exclude fixed deposits pledged to financial institutions and thus not available for use by the Group.
(ii) Receivables
Receivables are carried at anticipated realisable values. Bad debts are written off when identified. An estimate is made for doubtful debts based on a review of all outstanding amounts as at balance sheet date.
(iii) Payables
Payables are stated at the fair value of the consideration to be paid in the future for goods and services received.
(iv) Equity instruments
Ordinary shares are classified as equity. Dividends on ordinary shares are recognised in equity in the period in which they are declared.
The transaction costs of an equity transaction are accounted for as a deduction from equity, net of tax. Equity transaction costs comprise only those incremental external costs directly attributable to the equity transaction which would otherwise have been avoided.
(k) Borrowing costs
Borrowing costs directly attributable to the acquisition, construction or production of qualifying assets, which are assets that necessarily take a substantial period of time to get ready for their intended use or sale, are added to the cost of those assets, until such time as the assets are substantially ready for their intended use or sale. Investment income earned on the temporary investment of specific borrowings pending their expenditure on qualifying assets is deducted from the borrowing costs eligible for capitalisation.
All other borrowing costs are recognised in the income statements in the period in which they are incurred.
NOTES TO THE FINANCIAL STATEMENTS - 31 MARCH 2010 (CONT’D)
52Hua Yang Berhad
Annual Report 2010
2. Significant accounting policies (contd.)
2.2 Summary of significant accounting policies (contd.) (l) Income tax
Income tax on the profit or loss for the year comprises current and deferred tax. Current tax is the expected amount of income taxes payable in respect of the taxable profit for the year and is measured using the tax rates that have been enacted at the balance sheet date.
Deferred tax is provided for, using the liability method, on temporary differences at the balance sheet date between the tax bases of assets and liabilities and their carrying amounts in the financial statements. In principle, deferred tax liabilities are recognised for all taxable temporary differences and deferred tax assets are recognised for all deductible temporary differences, unused tax losses and unused tax credits to the extent that it is probable that the taxable profit will be available against which the deductible temporary differences, unused tax losses and unused tax credits can be utilised.
Deferred tax is measured at the tax rates that are expected to apply in the period when the asset is realised or the liability is settled, based on tax rates that have been enacted or substantively enacted at the balance sheet date. Deferred tax is recognised as income or an expense and included in the income statements for the periods, except when it arises from a transaction which is recognised directly in equity, in which case the deferred tax is also recognised directly in equity.
(m) Provisions for liabilities
Provisions for liabilities are recognised when the Group has a present obligation as a result of a past event and it is probable that an outflow of resources embodying economic benefits will be required to settle the obligation, and a reliable estimate of the amount can be made. Provisions are reviewed at each balance sheet date and adjusted to reflect the current best estimate. Where the effect of the time value of money is material, provisions are discounted using a current pre-tax rate that reflects, where appropriate, the risks specific to the liability. Where discounting is used, the increase in the provision due to the passage of time is recognised as finance cost.
(n) Employee benefits
(i) Short term benefits
Wages, salaries, bonuses and social security contributions are recognised as an expense in the year in which the associated services are rendered by employees. Short term accumulating compensated absences such as paid annual leave are recognised when services are rendered by employees that increase their entitlement to future compensated absences. Short term non-accumulating compensated absences such as sick leave are recognised when the absences occur.
(ii) Defined contribution plans
Defined contribution plans are post-employment benefit plans under which the Group pays fixed contributions into separate entities or funds and will have no legal or constructive obligation to pay further contributions if any of the funds do not hold sufficient assets to pay all employee benefits relating to employee services in the current and preceding financial years. Such contributions are recognised as an expense in the income statements as incurred. As required by law, companies in Malaysia make contributions to the Employees Provident Fund (“EPF”).
(o) Revenue recognition
Revenue is recognised to the extent that it is probable that the economic benefits will flow to the Group and the Company and the revenue can be reliably measured. The following specific recognition criteria must also be met before revenue is recognised:
(i) Sale of development properties
Revenue from sale of properties under development is accounted for by the stage of completion method as described in Note 2.2(f)(ii).
NOTES TO THE FINANCIAL STATEMENTS - 31 MARCH 2010 (CONT’D)
53Hua Yang BerhadAnnual Report 2010
NOTES TO THE FINANCIAL STATEMENTS - 31 MARCH 2010 (CONT’D)
2. Significant accounting policies (contd.)
2.2 Summary of significant accounting policies (contd.)
(o) Revenue recognition (contd.)
(ii) Sale of completed property units
Revenue is recognised when the risks and rewards associated with ownership has transferred to the purchaser with no further substantial contractual acts to complete.
(iii) Proceeds from contract works
Revenue from construction contracts is accounted for by the stage of completion method as described in Note 2.2(g).
(iv) Rental income
Rental income is recognised on a straight-line basis over the term of the lease.
(v) Interest income
Interest income is recognised on an accrual basis using the effective interest method.
(vi) Administrative fees, management fees and secretarial fees
Administrative fees, management fees and secretarial fees are recognised over the period where such service is provided.
(vii) Dividend income
Dividend income is recognised when the Company’s right to receive payment is established.
(viii) Commission income
Commission income is recognised as and when the services are performed.
(ix) Revenue from renovation works
Revenue from renovation works is recognised over the period where such service is performed.
(p) Leases
(i) Classification
A lease is recognised as a finance lease if it transfers substantially to the Group all the risks and rewards incidental to ownership. Title may/may not eventually be transferred. Leases of land and buildings are classified as operating or finance leases in the same way as leases of other assets and the land and buildings elements of a lease of land and buildings are considered separately for the purposes of lease classification.
~ Property held under operating leases that would otherwise meet the definition of an investment property is classified as an investment property on a property-by-property basis and, if classified as investment property, is accounted for as if held under a finance lease (Note 2.2(e)).
(ii) Operating leases
Operating lease payments are recognised as an expense over the term of the lease. The aggregate benefit of incentives provided by the lessor is recognised as a reduction of rental expense over the lease term on a straight-line basis.
In the case of a lease of land and buildings, the minimum lease payments or the up-front payments made are allocated, whenever necessary, between the land and the buildings elements in proportion to the relative fair values for leasehold interests in the land element and buildings element of the lease at the inception of the lease. The up-front payment represents prepaid lease payments and are amortised on a straight-line basis over the lease term.
54Hua Yang Berhad
Annual Report 2010
NOTES TO THE FINANCIAL STATEMENTS - 31 MARCH 2010 (CONT’D)
2. Significant accounting policies (contd.)
2.2 Summary of significant accounting policies (contd.)
(p) Leases (contd.)
(iii) Finance leases
Assets acquired by way of hire purchase or finance leases are stated at an amount equal to the lower of their fair values and the present value of the minimum lease payments at the inception of the lease, less accumulated depreciation and impairment losses. The corresponding liability is included in the balance sheet as borrowings. In calculating the present value of the minimum lease payments, the discount factor used is the interest rate implicit in the lease.
Lease payments are apportioned between the finance costs and the reduction of the outstanding liability. Finance costs, which represent the difference between the total commitments and the fair value of the assets acquired, are charged to the income statement over the term of the relevant lease so as to produce a constant periodic rate of charge on the remaining balance of the obligations for each accounting period.
The depreciation policy for leased assets is as described in Note 2.2 (c) and 2.2 (e).
2.3 Standards and IC Interpretations Issued but not yet effective
At the date of authorisation of these financial statements, the following new FRSs and Interpretations, and amendments to certain Standards and Interpretations were issued but not yet effective and have not been applied by the Group and the Company: Effective for financial periods beginning on FRSs, Amendments to FRSs and Interpretations or after FRS 1 First-time Adoption of Financial Reporting Standards 1 July 2010
FRS 3 Business Combinations (revised) 1 July 2010
FRS 4 Insurance Contracts 1 January 2010
FRS 7 Financial Instruments: Disclosures 1 January 2010
FRS 8 Operating Segments 1 July 2010
FRS 101 Presentation of Financial Statements (revised) 1 January 2010
FRS 123 Borrowing Costs 1 January 2010
FRS 127 Consolidated and Separate Financial Statements (amended) 1 July 2010
FRS 139 Financial Instruments: Recognition and Measurement 1 January 2010
Amendments to FRS 1 Limited Exemption from Comparative FRS 7 1 January 2011 Disclosures for First-time adopters
Amendments to FRS 1 First-time Adoption of Financial Reporting Standards and 1 January 2010 and FRS 127 Consolidated and Separate Financial Statements: Cost of an Investment in a Subsidiary, Jointly Controlled Entity or Associate
Amendments to FRS 2 Share-based Payment: Vesting Conditions and Cancellations 1 January 2010
Amendments to FRS 2 Share-based Payment 1 July 2010
Amendments to FRS 5 Non-current Assets Held for Sale and Discontinued Operations 1 July 2010
Amendments to FRS 7 Improving Disclosures about Financial Instruments 1 January 2011
Amendments to FRS 132 Financial Instruments: Presentation 1 January 2010
Amendments to FRS 132 Financial Instruments: Presentation relating to Classification 1 March 2010 of Rights Issues
Amendments to FRS 138 Intangible Assets 1 July 2010
55Hua Yang BerhadAnnual Report 2010
NOTES TO THE FINANCIAL STATEMENTS - 31 MARCH 2010 (CONT’D)
2. Significant accounting policies (contd.)
2.3 Standards and IC Interpretations Issued but not yet effective (contd.)
Effective for financial periods beginning on FRSs, Amendments to FRSs and Interpretations or after
Amendments to FRS 139 Financial Instruments: Recognition and Measurement 1 January 2010 and FRS 7 and Financial Instruments: Disclosures
Amendments to FRSs ‘Improvements to FRSs (2009)’ 1 January 2010
IC Interpretation 9 Reassessment of Embedded Derivatives 1 January 2010 and Amendment to and 1 July 2010 IC Interpretation 9
IC Interpretation 10 Interim Financial Reporting and Impairment 1 January 2010
IC Interpretation 11 FRS 2 - Group and Treasury Share Transactions 1 January 2010
IC Interpretation 12 Service Concession Arrangements 1 July 2010
IC Interpretation 13 Customer Loyalty Programmes 1 January 2010
IC Interpretation 14 FRS 119 - The Limit on a Defined Benefit Asset, Minimum 1 January 2010 Funding Requirements and their Interaction
IC Interpretation 15 Agreements for the Construction of Real Estate 1 July 2010
IC Interpretation 16 Hedges of a Net Investment in a Foreign Operation 1 July 2010
IC Interpretation 17 Distributions of Non-cash Assets to Owners 1 July 2010
TR i – 3 Presentation of Financial Statements of Islamic 1 January 2010 Financial Institutions The Group and the Company plan to adopt the above pronouncements when they become effective in the respective financial period. Unless otherwise described below, these pronouncements are expected to have no significant impact to the financial statements of the Group and the Company upon their initial application:
FRS 3: Business Combinations (revised) and FRS 127: Consolidated and Separate Financial Statements (amended)
FRS 3 (revised) introduces a number of changes to the accounting for business combinations occurring on or after 1 July 2010. These include changes that affect the valuation of non-controlling interest, the accounting for transaction costs, the initial recognition and subsequent measurement of a contingent consideration and business combinations achieved in stages. These changes will impact the amount of goodwill recognised, the reported results in the period that an acquisition occurs and future reported results.
FRS 127 (amended) requires that a change in the ownership interest of a subsidiary (without loss of control) is accounted for as a transaction with owners in their capacity as owners and to be recorded in equity. Therefore, such transaction will no longer give rise to goodwill, nor will it give rise to a gain or loss. Furthermore, the amended Standard changes the accounting for losses incurred by the subsidiary as well as loss of control of a subsidiary.
The changes by FRS 3 (revised) and FRS127 (amended) will be applied prospectively and only affect future acquisition or loss of control of subsidiaries and transactions with non-controlling interests. FRS 8: Operating Segment
FRS 8 replaces FRS 1142004: Segment Reporting and requires a ‘management approach’, under which segment information is presented on a similar basis to that used for internal reporting purposes. As a result, the Group’s external segmental reporting will be based on the allocation of resources and assesses the performance of the reportable segments. As this is a disclosure standard, there will be no impact on the financial position or results of the Group.
56Hua Yang Berhad
Annual Report 2010
NOTES TO THE FINANCIAL STATEMENTS - 31 MARCH 2010 (CONT’D)
2. Significant accounting policies (contd.)
2.3 Standards and IC Interpretations Issued but not yet effective (contd.)
FRS 101: Presentation of Financial Statements (revised)
The revised FRS 101 separates owner and non-owner changes in equity. Therefore, the consolidated statement of changes in equity will now include only details of transactions with owners. All non-owner changes in equity are presented as a single line labelled as total comprehensive income. The Standard also introduces the statement of comprehensive income: presenting all items of income and expense recognised in the income statement, together with all other items of recognised income and expense, either in one single statement, or in two linked statements. The Group and the Company will adopt two link statements of comprehensive income. In addition, a statement of financial position is required at the beginning of the earliest comparative period following a change in accounting policy, the correction of an error or the reclassification of items in the financial statements. The revised FRS does not have any impact on the financial position and results of the Group and the Company.
Amendments to FRS 138: Intangible assets
The amendments clarify that an intangible asset must be recognised separately from goodwill even if it is separable only together with a related contract, identifiable asset, or liability. Also, if an intangible asset is separable only together with another intangible asset, those assets can be recognised together as a single asset, and if the individual assets in a group of complementary intangible assets have similar useful lives, those assets can be recognised together as a single asset. The Group will apply these amendments prospectively. Therefore, amounts recognised for intangible assets and goodwill in prior business combination shall not be adjusted.
FRS 139: Financial Instruments: Recognition and Measurement, FRS 7: Financial Instruments: Disclosures and Amendments to FRS 139: Financial Instruments: Recognition and Measurement, FRS 7: Financial Instruments: Disclosures
The new Standard on FRS 139: Financial Instruments: Recognition and Measurement establishes principles for recognising and measuring financial assets, financial liabilities and some contracts to buy and sell non-financial items. Requirements for presenting information about financial instruments are in FRS 132: Financial Instruments: Presentation and the requirements for disclosing information about financial instruments are in FRS 7: Financial Instruments: Disclosures.
FRS 7 Financial Instruments: Disclosures is a new Standard that requires new disclosures in relation to financial instruments. The Standard is considered to result in increased disclosures, both quantitative and qualitative of the Group’s and the Company’s exposure to risks, enhanced disclosure regarding components of the Group’s and the Company’s financial position and performance, and possible changes to the way of presenting certain items in the financial statements.
In accordance with the respective transitional provisions, the Group and the Company is exempted from disclosing the possible impact to the financial statements upon the initial application.
Amendments to FRSs ‘Improvements to FRSs (2009)’
FRS 8 Operating Segment: Segment assets and liabilities need only be reported when those assets and liabilities are included in measures of segment profit or loss that are reviewed or otherwise regularly used by the ‘chief operating decision maker’.
FRS 107 Statement of Cash Flows (formerly known as Cash Flow Statements): Clarifies that only expenditures that result in a recognised asset in the statement of financial position can be classified as investing activities in the statement of cash flows.
FRS 116 Property, Plant and Equipment: The amendment replaces the term “net selling price” with “fair value less costs to sell”. It also clarifies that items of property, plant and equipment held for rental that are routinely sold in the ordinary course of business after rental, are transferred to inventory when rental ceases and they are held for sale.
57Hua Yang BerhadAnnual Report 2010
NOTES TO THE FINANCIAL STATEMENTS - 31 MARCH 2010 (CONT’D)
2. Significant accounting policies (contd.)
2.3 Standards and IC Interpretations Issued but not yet effective (contd.)
Amendments to FRSs ‘Improvements to FRSs (2009)’ (contd.)
FRS 123 Borrowing Costs: The definition of borrowing costs is aligned with FRS 139 by referring to the use of effective interest rate as a component of borrowing cost.
FRS 127 Consolidated and Separate Financial Statements: The amendment clarifies that when a parent entity accounts for a subsidiary at fair value in accordance with FRS 139 in its separate financial statements, this treatment continues when the subsidiary is subsequently classified as held for sale.
FRS 136 Impairment of Assets: Clarifies that when discounted cash flows are used to estimate ‘fair value less cost to sell’ additional disclosure is required about the discount rate, consistent with disclosures required when the discounted cash flows are used to estimate ‘value in use’. The amendment further clarifies that the largest cash-generating unit for group of units to which goodwill should be allocated for purposes of impairment testing is an operating segment as defined in FRS 8.
FRS 140 Investment Property: Property under construction or development for future use as an investment property is classified as investment property. Where the fair value model is applied, such property is measured at fair value. If fair value cannot be reliably determined, the investment under construction will be measured at cost until such time as fair value can be determined or construction is complete. The Group has previously accounted for such assets using the cost model. The amendment also includes changes in terminology in the Standard to be consistent with FRS 108. The change will be applied prospectively.
Amendments to FRS 1: First-time Adoption of Financial Reporting Standards and FRS 127: Consolidated and Separate Financial Statements: Cost of an Investment in a Subsidiary, Jointly Controlled Entity or Associate
The amendment to FRS 1 allows first-time adopters to use costs, determined in accordance with FRS 127, or deemed cost of either fair value (in accordance with FRS 139) or the carrying amount under previous accounting practice to measure the initial cost of investments in subsidiaries, jointly controlled entities and associates in the separate opening FRS balance sheet. In the amendment to FRS 127, there is no longer a distinction between pre-acquisition and post-acquisition dividends. The amendment also requires the cost of the investment of a new parent in a group (in a reorganisation meeting certain criteria) to be measured at the carrying amount of its share of equity as shown in the separate financial statements of the previous parent. The amendments also remove the definition of the cost method from FRS 127 and will be applied prospectively that affect only the financial statements of the Company and do not have an impact on the financial statements of the Group.
IC Interpretation I5 : Agreements for the Construction of Real Estate
The Group currently recognises revenue arising from property development projects using the stage of completion method. Upon the adoption of IC Interpretation 15, the Group and the Company may be required to change its accounting policy to recognise such revenues at completion, or upon or after delivery.
2.4 Significant accounting estimates and judgements
(a) Critical judgements made in applying accounting policies
There were no critical judgements made by management in the process of applying the accounting policies of the Group and of the Company on the amounts recognised in the financial statements.
58Hua Yang Berhad
Annual Report 2010
NOTES TO THE FINANCIAL STATEMENTS - 31 MARCH 2010 (CONT’D)
2. Significant accounting policies (contd.)
2.4 Significant accounting estimates and judgements (contd.)
(b) Key sources of estimation uncertainty
The key assumptions concerning the future and other key sources of estimation uncertainty at the balance sheet date, that have a significant risk of causing a material adjustment to the carrying amounts of assets and liabilities within the next financial year are discussed below:
(i) Property development
The Group and the Company recognise property development revenue and expenses in the income statements by using the stage of completion method. The stage of completion is determined by the proportion that property development costs incurred for work performed to date bear to the estimated total property development costs.
Significant judgement is required in determining the stage of completion, the extent of the property development costs incurred, the estimated total property development revenue and costs, as well as the recoverability of the development projects. In making the judgement, the Group and the Company evaluate based on past experience and by relying on the work of specialists. It is impractical to ascertain the sensitivity analysis for the estimated total property development revenue or cost against the actual Group revenue and cost of sales due to material price fluctuation.
(ii) Construction contracts
The Group recognises contract revenue and expenses in the income statements by using the stage of completion method. The stage of completion is determined by the proportion that contract costs incurred for work performed to date bear to the estimated total contracted costs.
Significant judgement is required in determining the stage of completion, the extent of the contract costs incurred, the estimated total contract revenue and costs, as well as the recoverability of the construction projects. In making the judgement, the Group evaluates based on past experience and by relying on the work of specialists. It is impractical to ascertain the sensitivity analysis for the estimated total contract revenue or cost against the actual Group revenue and cost of sales due to material price fluctuation.
(iii) Impairment of goodwill
The Group determines whether goodwill is impaired at least on an annual basis. This requires an estimation of the value-in use of the CGU to which goodwill is allocated. Estimating a value-in-use amount requires management to make an estimate of the expected future cash flows from the CGU and also to choose a suitable discount rate in order to calculate the present value of those cash flows. The carrying amount of goodwill as at 31 March 2010 was RM9,074,112 (2009 - RM8,812,856). Further details are disclosed in Note 16.
3. Revenue
Group Company 2010 2009 2010 2009 RM RM RM RM Sales of properties 100,988,408 90,194,124 8,463,576 13,616,509 Sales of inventories 1,898,796 9,215,760 - - Dividend income - - 2,450,000 3,950,000 Management, administrative and secretarial services fees - 7,785 1,759,100 1,139,250 Rental income 654,550 624,900 - -
103,541,754 100,042,569 12,672,676 18,705,759
59Hua Yang BerhadAnnual Report 2010
NOTES TO THE FINANCIAL STATEMENTS - 31 MARCH 2010 (CONT’D)
4. Cost of sales
Group Company 2010 2009 2010 2009 RM RM RM RM Property development costs (Note 14(b)) 68,278,819 63,612,709 4,853,785 9,949,399 Cost of construction contracts 4,025,170 4,419,065 - - Cost of inventories sold (Note 19) 1,332,139 6,685,407 - - Cost of additional works 12,221 - - - Cost of services rendered/ materials purchased - 24,001 - - (Over)/Under provision of development expenditure on projects completed in prior years (36,629) 337,630 (121,910) -
73,611,720 75,078,812 4,731,875 9,949,399
5. Other income
Group Company 2010 2009 2010 2009 RM RM RM RM Management fee - 80,400 - 80,400 Maintenance fee 10,140 43,140 5,400 - Contract wages 182,238 194,688 - - Deposits forfeited 51,134 25,895 - 245 Insurance commission 4,759 10,060 - - Parking revenue 17,879 41,665 17,879 41,665 Tender fees 32,600 23,800 - - Gain on disposal of property, plant and equipment 1,088 871,757 - 779,758 Reversal of allowance for doubtful debts 14,492 - - - Administration fee 10,406 24,814 8,256 14,676 Interest income 155,423 402,017 539,927 173,225 Rental income 456,650 319,540 298,400 210,290 Sundry income 18,085 45,788 17,508 5,491 Negative goodwill 435,285 - - -
1,390,179 2,083,564 887,370 1,305,750
6. Finance costs
Group Company 2010 2009 2010 2009 RM RM RM RM
Interest cost incurred on - bank overdrafts 134,475 239,370 133,198 232,905 - unsecured short-term loan - 12,799 - - - bridging loans 141,059 - - - - revolving loans 240,693 - 240,693 - - term loans 1,761,977 1,529,345 88,963 455,861 - hire purchase 30,060 33,238 11,417 15,274
2,308,264 1,814,752 474,271 704,040 Amount capitalised in property development costs (1,814,073) (1,073,484) - -
494,191 741,268 474,271 704,040
60Hua Yang Berhad
Annual Report 2010
NOTES TO THE FINANCIAL STATEMENTS - 31 MARCH 2010 (CONT’D)
7. Profit before taxation
Group Company 2010 2009 2010 2009 RM RM RM RM (a) This is arrived at after charging: Allowance for doubtful debts 10,156 86,911 - - Amortisation of prepaid land lease payments 13,197 13,197 10,417 10,417 Amortisation of intangible assets 103,960 - - - Auditors’ remuneration - Statutory audit 88,300 85,100 34,000 34,000 - Housing Development Accounts audit 7,000 7,000 - - - Other non-audit services 5,000 5,000 5,000 5,000 - Under provision in prior year 2,400 - - - Bad debts written off 2,744 1,413 - - Depreciation of property, plant and equipment 387,834 410,828 248,731 259,422 Depreciation of investment properties 46,345 150,305 40,167 40,167 Employee benefits expenses (Note 7(b)) 4,204,674 4,046,868 2,328,912 1,949,889 Non-executive directors’ remuneration (Note 7(c)) 187,000 222,333 187,000 192,333 Impairment loss on investment in subsidiary companies - - 1,749 16,871 Loss on winding up of a subsidiary company 761 - - - Investment properties written off - - - 32,522 Loss on disposal of property, plant and equipment 15,082 5,150 5,450 - Property, plant and equipment written off 3,204 37,356 1,774 2,264 Rental of office equipment 43,175 31,049 29,245 22,617 Rental of motor vehicle 13,309 994 13,309 994 Rental of premises 153,600 152,201 21,600 34,400
This is arrived at after crediting:
Gain on disposal of property, plant and equipment 1,088 871,757 - 779,758 Gross dividends from unquoted subsidiary companies - - 2,450,000 3,950,000 Interest income 155,423 402,017 539,927 173,225 Rental income 456,650 319,540 298,400 210,290 Reversal of allowance for doubtful debts no longer required 14,492 - - - (b) Employee benefits expense (Note 7(a)) Salaries, allowances and bonus 3,683,615 3,507,230 2,067,389 1,730,787 Gratuity 25,000 48,000 - - Employees Provident Fund 458,760 455,928 245,734 205,312 SOCSO 37,299 35,710 15,789 13,790
4,204,674 4,046,868 2,328,912 1,949,889
Included in staff costs of the Group and of the Company are executive directors’ remuneration amounting to RM752,339 (2009 - RM997,840) and RM692,339 (2009 - RM631,737) respectively as further disclosed in Note 7(c) below.
61Hua Yang BerhadAnnual Report 2010
NOTES TO THE FINANCIAL STATEMENTS - 31 MARCH 2010 (CONT’D)
7. Profit before taxation (contd.)
(c) Directors’ remuneration
Group Company 2010 2009 2010 2009 Directors of the Company RM RM RM RM Executive (Notes 7(b) and 35(b)): Salaries and other emoluments 570,600 754,076 510,600 502,125 Employees Provident Fund 74,124 101,844 74,124 67,812 Provision for gratuity - 48,000 - - Bonus 106,375 93,300 106,375 61,800 SOCSO 1,240 620 1,240 -
752,339 997,840 692,339 631,737 Estimated money value of benefits-in-kind 76,450 89,880 76,450 72,480
828,789 1,087,720 768,789 704,217 Non-executive (Note 7(a)): Fees 158,000 198,333 158,000 168,333 Other emoluments 29,000 24,000 29,000 24,000
187,000 222,333 187,000 192,333 Estimated money value of benefits-in-kind 6,000 4,200 6,000 4,200
193,000 226,533 193,000 196,533 Total 1,021,789 1,314,253 961,789 900,750
The number of directors of the Company whose total remuneration during the year fell within the following bands is analysed below:
Number of directors Executive Non-executive 2010 2009 2010 2009 Below RM50,000 - - 4 4 RM50,001 - RM100,000 - - 1 1 RM100,001 - RM150,000 - - - - RM150,001 - RM200,000 - - - - RM200,001 - RM250,000 - 1 - - RM250,001 - RM300,000 1 - - - RM300,001 - RM350,000 - - - - RM350,001 - RM400,000 - 2 - - RM400,001 - RM450,000 1 - - -
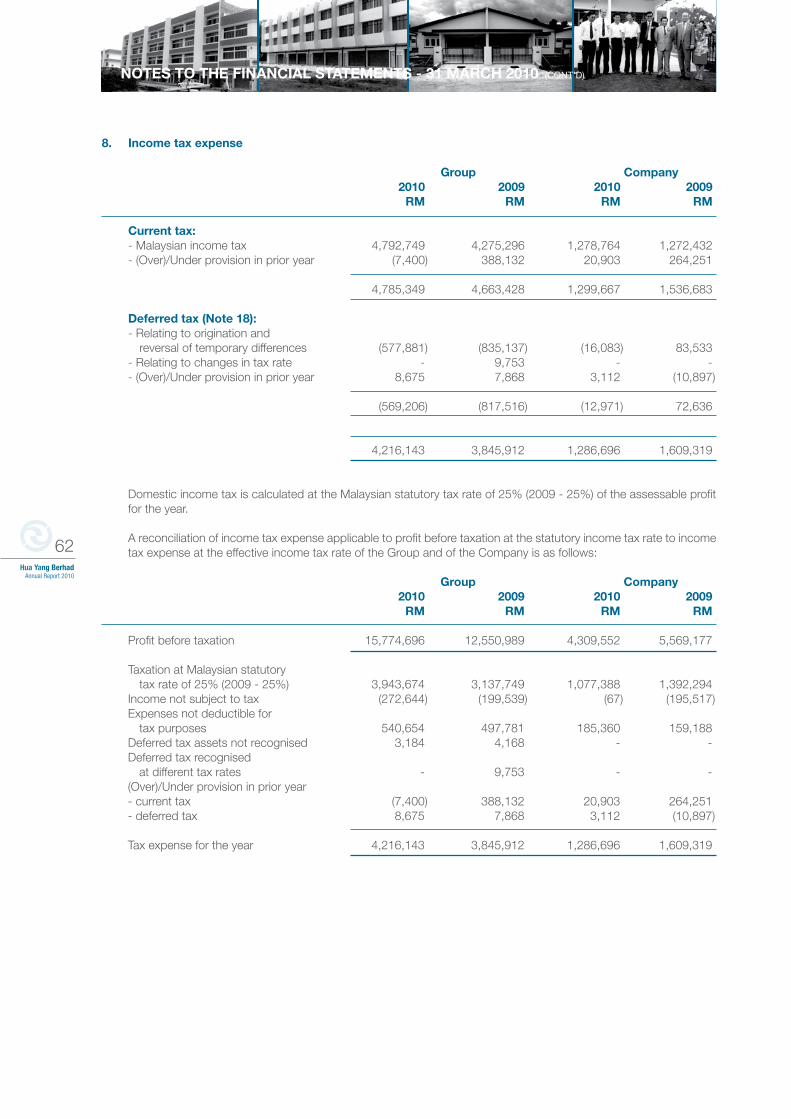
62Hua Yang Berhad
Annual Report 2010
NOTES TO THE FINANCIAL STATEMENTS - 31 MARCH 2010 (CONT’D)
8. Income tax expense
Group Company 2010 2009 2010 2009 RM RM RM RM
Current tax: - Malaysian income tax 4,792,749 4,275,296 1,278,764 1,272,432 - (Over)/Under provision in prior year (7,400) 388,132 20,903 264,251
4,785,349 4,663,428 1,299,667 1,536,683 Deferred tax (Note 18): - Relating to origination and reversal of temporary differences (577,881) (835,137) (16,083) 83,533 - Relating to changes in tax rate - 9,753 - - - (Over)/Under provision in prior year 8,675 7,868 3,112 (10,897)
(569,206) (817,516) (12,971) 72,636 4,216,143 3,845,912 1,286,696 1,609,319
Domestic income tax is calculated at the Malaysian statutory tax rate of 25% (2009 - 25%) of the assessable profit for the year.
A reconciliation of income tax expense applicable to profit before taxation at the statutory income tax rate to income tax expense at the effective income tax rate of the Group and of the Company is as follows:
Group Company 2010 2009 2010 2009 RM RM RM RM Profit before taxation 15,774,696 12,550,989 4,309,552 5,569,177 Taxation at Malaysian statutory tax rate of 25% (2009 - 25%) 3,943,674 3,137,749 1,077,388 1,392,294 Income not subject to tax (272,644) (199,539) (67) (195,517) Expenses not deductible for tax purposes 540,654 497,781 185,360 159,188 Deferred tax assets not recognised 3,184 4,168 - - Deferred tax recognised at different tax rates - 9,753 - - (Over)/Under provision in prior year - current tax (7,400) 388,132 20,903 264,251 - deferred tax 8,675 7,868 3,112 (10,897)
Tax expense for the year 4,216,143 3,845,912 1,286,696 1,609,319
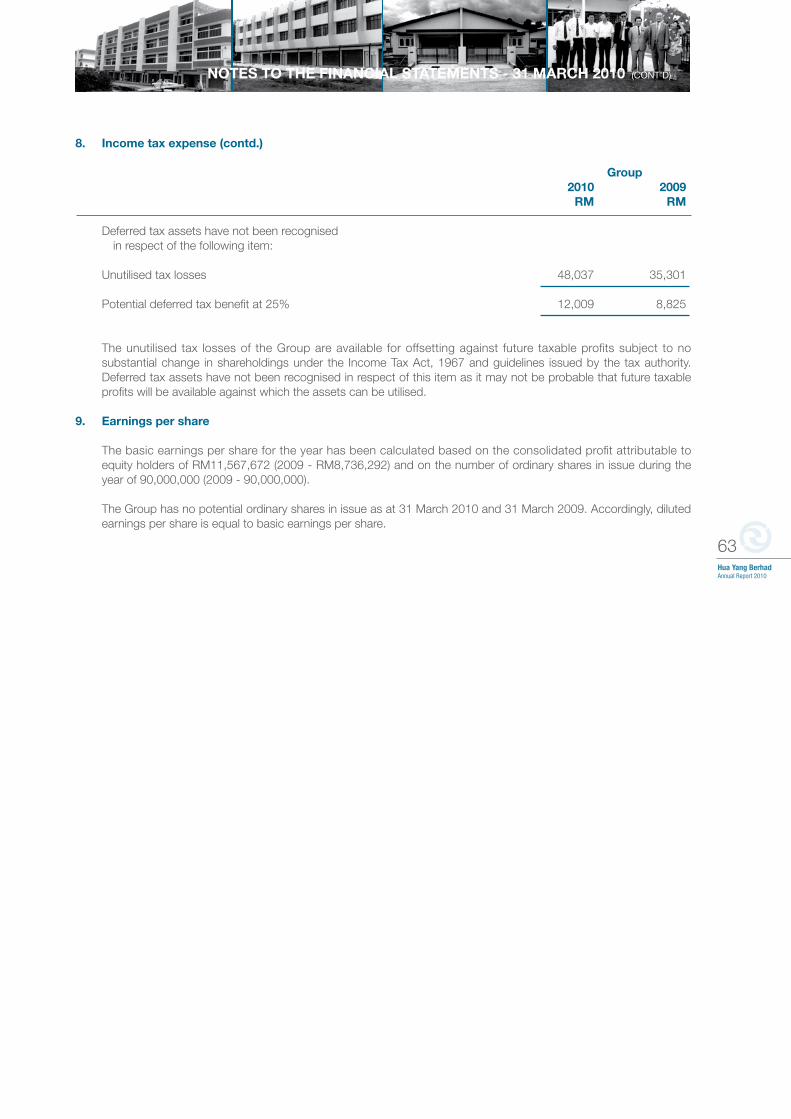
63Hua Yang BerhadAnnual Report 2010
NOTES TO THE FINANCIAL STATEMENTS - 31 MARCH 2010 (CONT’D)
8. Income tax expense (contd.)
Group 2010 2009 RM RM
Deferred tax assets have not been recognised in respect of the following item: Unutilised tax losses 48,037 35,301 Potential deferred tax benefit at 25% 12,009 8,825
The unutilised tax losses of the Group are available for offsetting against future taxable profits subject to no substantial change in shareholdings under the Income Tax Act, 1967 and guidelines issued by the tax authority. Deferred tax assets have not been recognised in respect of this item as it may not be probable that future taxable profits will be available against which the assets can be utilised.
9. Earnings per share
The basic earnings per share for the year has been calculated based on the consolidated profit attributable to equity holders of RM11,567,672 (2009 - RM8,736,292) and on the number of ordinary shares in issue during the year of 90,000,000 (2009 - 90,000,000).
The Group has no potential ordinary shares in issue as at 31 March 2010 and 31 March 2009. Accordingly, diluted earnings per share is equal to basic earnings per share.
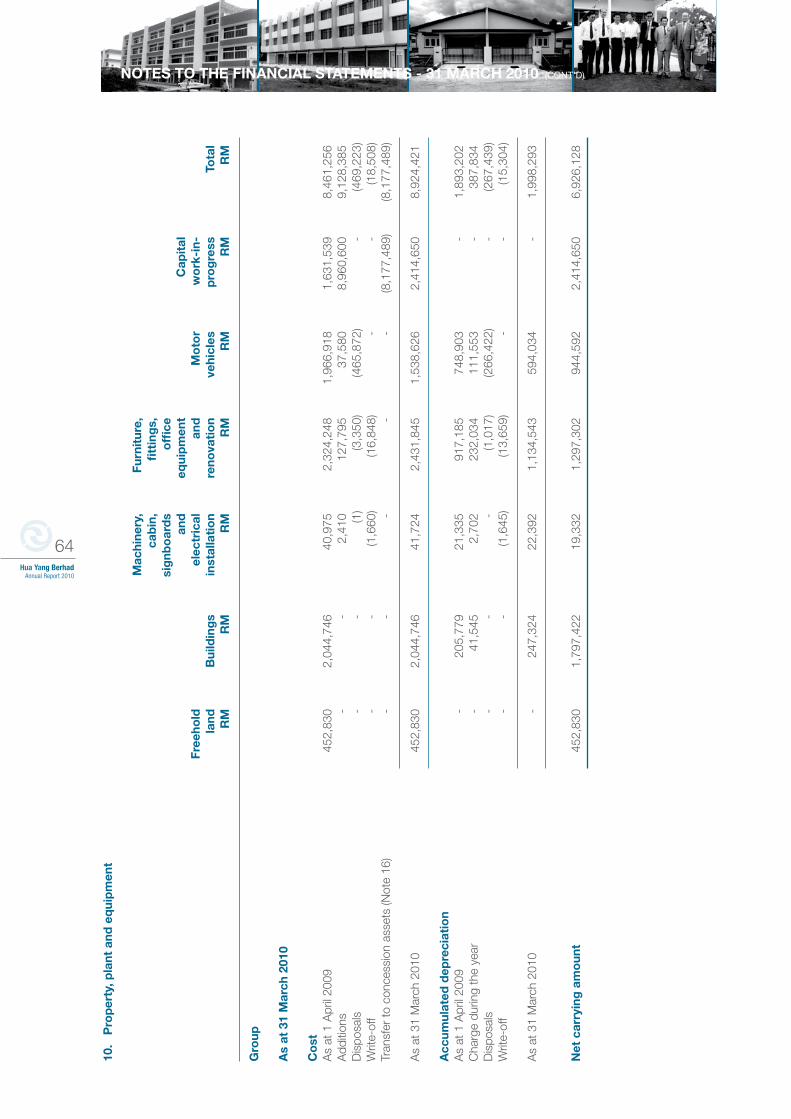
64Hua Yang Berhad
Annual Report 2010
NOTES TO THE FINANCIAL STATEMENTS - 31 MARCH 2010 (CONT’D)
10.
Pro
per
ty, p
lant
and
eq
uip
men
t
M
achi
nery
, Fu
rnit
ure,
ca
bin
, fi
ttin
gs,
si
gnb
oar
ds
o
ffice
an
d
equi
pm
ent
Cap
ital
Fr
eeho
ld
el
ectr
ical
an
d
Mo
tor
w
ork
-in-
la
nd
Bui
ldin
gs
in
stal
lati
on
re
nova
tio
n
vehi
cles
p
rog
ress
T
ota
l
RM
R
M
RM
R
M
RM
R
M
RM
Gro
up
As
at 3
1 M
arch
201
0
Co
st
As
at 1
Apr
il 20
09
452,
830
2,
044,
746
40
,975
2,
324,
248
1,
966,
918
1,
631,
539
8,4
61,2
56
Add
ition
s -
-
2,
410
12
7,79
5
37,5
80
8,96
0,60
0
9
,128
,385
D
ispo
sals
-
-
(1
) (3
,350
) (4
65,8
72)
-
(469
,223
)W
rite-
off
-
-
(1,6
60)
(16,
848)
-
-
(
18,5
08)
Tran
sfer
to c
once
ssio
n as
sets
(Not
e 16
) -
-
-
-
-
(8
,177
,489
)
(8,1
77,4
89)
As
at 3
1 M
arch
201
0 45
2,83
0
2,04
4,74
6
41,7
24
2,43
1,84
5
1,5
38,6
26
2,4
14,6
50
8
,924
,421
A
ccum
ulat
ed d
epre
ciat
ion
A
s at
1 A
pril
2009
-
20
5,77
9
21,3
35
917,
185
74
8,90
3
-
1
,893
,202
C
harg
e du
ring
the
year
-
41
,545
2
,702
23
2,03
4
111,
553
-
3
87,8
34
Dis
posa
ls
-
-
-
(1,0
17)
(266
,422
) -
(2
67,4
39)
Writ
e-of
f -
-
(1
,645
) (1
3,65
9)
-
-
(15
,304
)
As
at 3
1 M
arch
201
0 -
2
47,3
24
22,3
92
1,13
4,54
3
594,
034
-
1,9
98,2
93
Net
car
ryin
g a
mo
unt
452,
830
1,
797,
422
19
,332
1,
297,
302
9
44,5
92
2,4
14,6
50
6
,926
,128
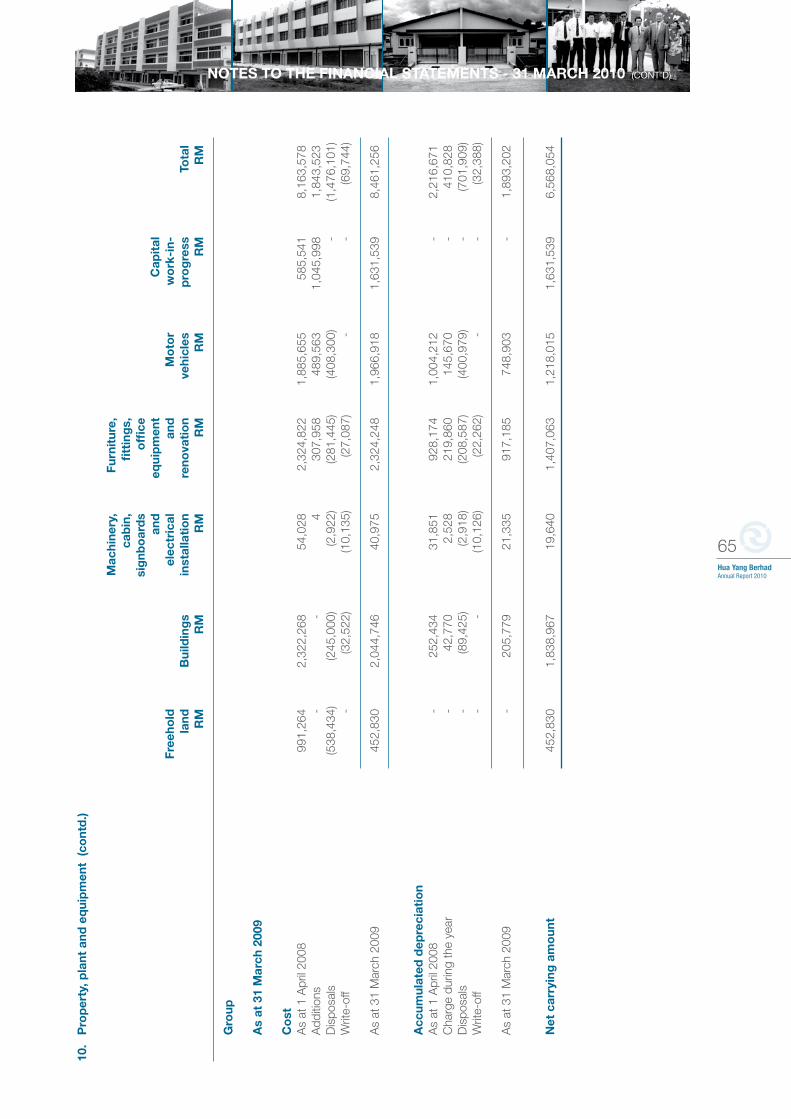
65Hua Yang BerhadAnnual Report 2010
NOTES TO THE FINANCIAL STATEMENTS - 31 MARCH 2010 (CONT’D)10
. P
rop
erty
, pla
nt a
nd e
qui
pm
ent
(co
ntd
.)
M
achi
nery
, Fu
rnit
ure,
ca
bin
, fi
ttin
gs,
si
gnb
oar
ds
o
ffice
an
d
equi
pm
ent
Cap
ital
Fr
eeho
ld
el
ectr
ical
an
d
Mo
tor
w
ork
-in-
la
nd
Bui
ldin
gs
in
stal
lati
on
re
nova
tio
n
vehi
cles
p
rog
ress
T
ota
l
RM
R
M
RM
R
M
RM
R
M
RM
Gr o
up
A
s at
31
Mar
ch 2
009
C
ost
A
s at
1 A
pril
2008
99
1,26
4
2,32
2,26
8
54,0
28
2,32
4,82
2
1,88
5,65
5
585
,541
8,1
63,5
78
A
dditi
ons
-
-
4
307,
958
48
9,56
3
1,04
5,99
8
1
,843
,523
Dis
posa
ls
(538
,434
) (2
45,0
00)
(2,9
22)
(281
,445
) (4
08,3
00)
-
(1
,476
,101
)
Writ
e-of
f -
(3
2,52
2)
(10,
135)
(2
7,08
7)
-
-
(69
,744
)
A
s at
31
Mar
ch 2
009
452,
830
2,
044,
746
40
,975
2,
324,
248
1,
966,
918
1
,631
,539
8,4
61,2
56
A
ccum
ulat
ed d
epre
ciat
ion
As
at 1
Apr
il 20
08
-
252,
434
31
,851
92
8,17
4
1,00
4,21
2
-
2
,216
,671
Cha
rge
durin
g th
e ye
ar
-
42,7
70
2,52
8
219,
860
14
5,67
0
-
410
,828
Dis
posa
ls
-
(89,
425)
(2
,918
) (2
08,5
87)
(400
,979
) -
(7
01,9
09)
W
rite-
off
-
-
(10,
126)
(2
2,26
2)
-
-
(32
,388
)
A
s at
31
Mar
ch 2
009
-
205
,779
21
,335
91
7,18
5
748,
903
-
1,8
93,2
02
N
et c
arry
ing
am
oun
t 45
2,83
0
1,83
8,96
7
19,6
40
1,40
7,06
3
1,21
8,01
5
1,63
1,53
9
6
,568
,054
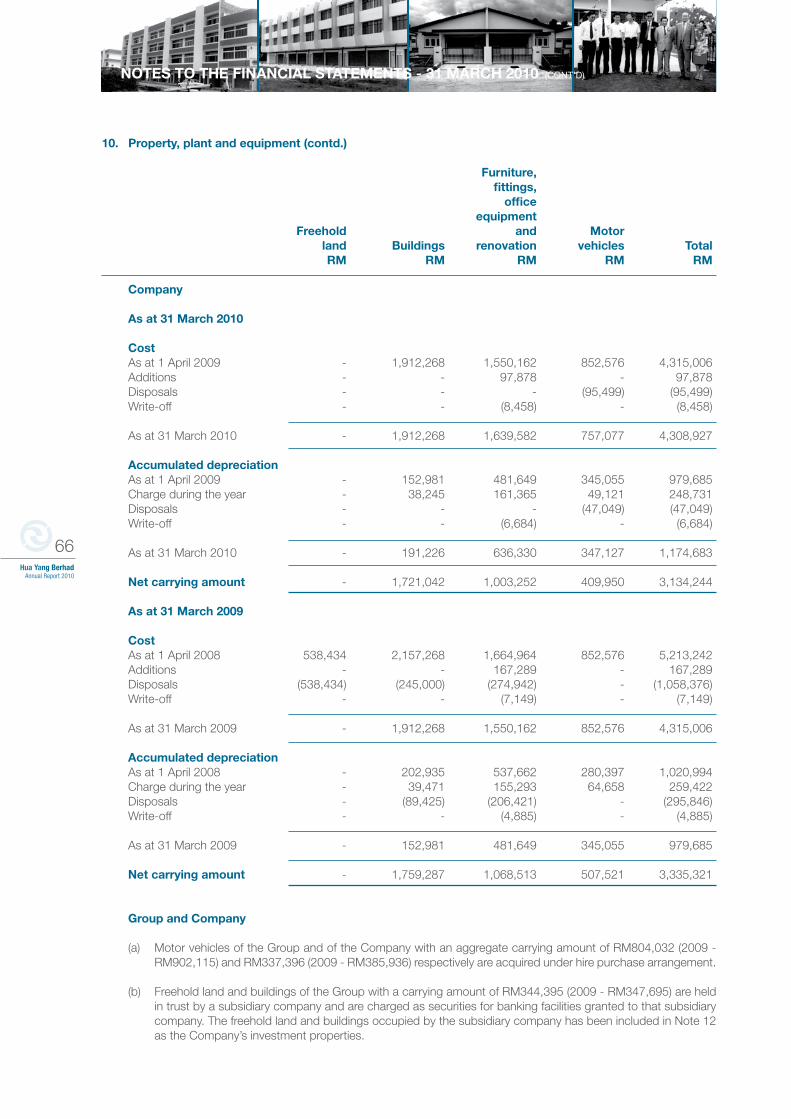
66Hua Yang Berhad
Annual Report 2010
NOTES TO THE FINANCIAL STATEMENTS - 31 MARCH 2010 (CONT’D)
10. Property, plant and equipment (contd.)
Furniture, fittings, office equipment Freehold and Motor land Buildings renovation vehicles Total RM RM RM RM RM Company
As at 31 March 2010 Cost As at 1 April 2009 - 1,912,268 1,550,162 852,576 4,315,006 Additions - - 97,878 - 97,878 Disposals - - - (95,499) (95,499) Write-off - - (8,458) - (8,458)
As at 31 March 2010 - 1,912,268 1,639,582 757,077 4,308,927 Accumulated depreciation As at 1 April 2009 - 152,981 481,649 345,055 979,685 Charge during the year - 38,245 161,365 49,121 248,731 Disposals - - - (47,049) (47,049) Write-off - - (6,684) - (6,684)
As at 31 March 2010 - 191,226 636,330 347,127 1,174,683 Net carrying amount - 1,721,042 1,003,252 409,950 3,134,244
As at 31 March 2009
Cost As at 1 April 2008 538,434 2,157,268 1,664,964 852,576 5,213,242 Additions - - 167,289 - 167,289 Disposals (538,434) (245,000) (274,942) - (1,058,376) Write-off - - (7,149) - (7,149)
As at 31 March 2009 - 1,912,268 1,550,162 852,576 4,315,006 Accumulated depreciation As at 1 April 2008 - 202,935 537,662 280,397 1,020,994 Charge during the year - 39,471 155,293 64,658 259,422 Disposals - (89,425) (206,421) - (295,846) Write-off - - (4,885) - (4,885)
As at 31 March 2009 - 152,981 481,649 345,055 979,685 Net carrying amount - 1,759,287 1,068,513 507,521 3,335,321
Group and Company
(a) Motor vehicles of the Group and of the Company with an aggregate carrying amount of RM804,032 (2009 - RM902,115) and RM337,396 (2009 - RM385,936) respectively are acquired under hire purchase arrangement.
(b) Freehold land and buildings of the Group with a carrying amount of RM344,395 (2009 - RM347,695) are held in trust by a subsidiary company and are charged as securities for banking facilities granted to that subsidiary company. The freehold land and buildings occupied by the subsidiary company has been included in Note 12 as the Company’s investment properties.
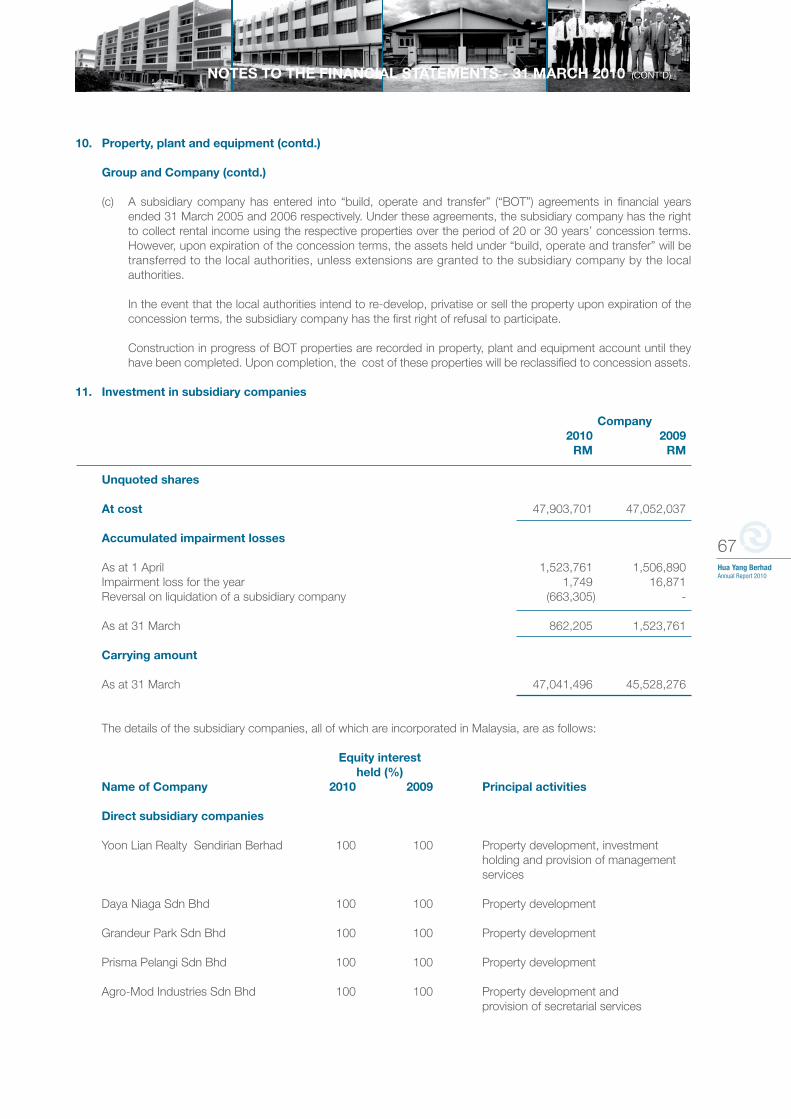
67Hua Yang BerhadAnnual Report 2010
NOTES TO THE FINANCIAL STATEMENTS - 31 MARCH 2010 (CONT’D)
10. Property, plant and equipment (contd.)
Group and Company (contd.)
(c) A subsidiary company has entered into “build, operate and transfer” (“BOT”) agreements in financial years ended 31 March 2005 and 2006 respectively. Under these agreements, the subsidiary company has the right to collect rental income using the respective properties over the period of 20 or 30 years’ concession terms. However, upon expiration of the concession terms, the assets held under “build, operate and transfer” will be transferred to the local authorities, unless extensions are granted to the subsidiary company by the local authorities.
In the event that the local authorities intend to re-develop, privatise or sell the property upon expiration of the concession terms, the subsidiary company has the first right of refusal to participate.
Construction in progress of BOT properties are recorded in property, plant and equipment account until they have been completed. Upon completion, the cost of these properties will be reclassified to concession assets.
11. Investment in subsidiary companies
Company 2010 2009 RM RM
Unquoted shares At cost 47,903,701 47,052,037 Accumulated impairment losses As at 1 April 1,523,761 1,506,890 Impairment loss for the year 1,749 16,871 Reversal on liquidation of a subsidiary company (663,305) -
As at 31 March 862,205 1,523,761 Carrying amount As at 31 March 47,041,496 45,528,276
The details of the subsidiary companies, all of which are incorporated in Malaysia, are as follows:
Equity interest held (%) Name of Company 2010 2009 Principal activities Direct subsidiary companies Yoon Lian Realty Sendirian Berhad 100 100 Property development, investment holding and provision of management services Daya Niaga Sdn Bhd 100 100 Property development Grandeur Park Sdn Bhd 100 100 Property development Prisma Pelangi Sdn Bhd 100 100 Property development Agro-Mod Industries Sdn Bhd 100 100 Property development and provision of secretarial services
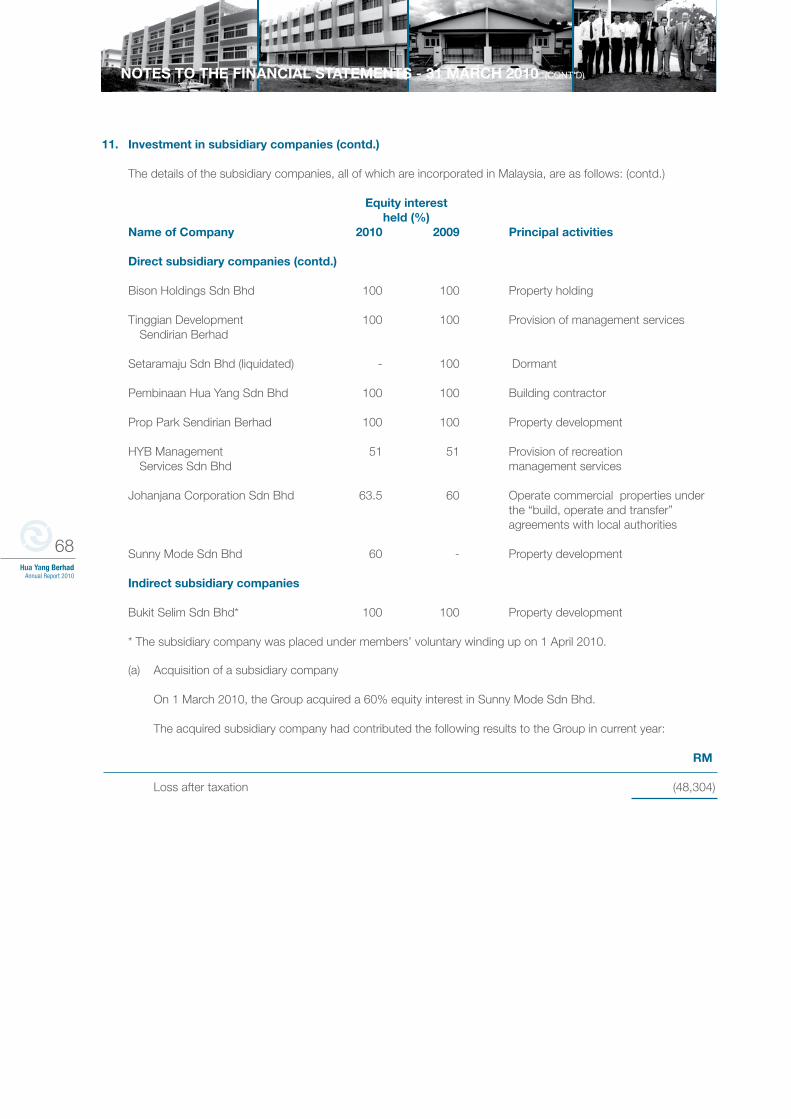
68Hua Yang Berhad
Annual Report 2010
11. Investment in subsidiary companies (contd.)
The details of the subsidiary companies, all of which are incorporated in Malaysia, are as follows: (contd.) Equity interest held (%) Name of Company 2010 2009 Principal activities Direct subsidiary companies (contd.) Bison Holdings Sdn Bhd 100 100 Property holding
Tinggian Development 100 100 Provision of management services Sendirian Berhad Setaramaju Sdn Bhd (liquidated) - 100 Dormant Pembinaan Hua Yang Sdn Bhd 100 100 Building contractor Prop Park Sendirian Berhad 100 100 Property development HYB Management 51 51 Provision of recreation Services Sdn Bhd management services Johanjana Corporation Sdn Bhd 63.5 60 Operate commercial properties under the “build, operate and transfer” agreements with local authorities Sunny Mode Sdn Bhd 60 - Property development Indirect subsidiary companies Bukit Selim Sdn Bhd* 100 100 Property development
* The subsidiary company was placed under members’ voluntary winding up on 1 April 2010.
(a) Acquisition of a subsidiary company
On 1 March 2010, the Group acquired a 60% equity interest in Sunny Mode Sdn Bhd.
The acquired subsidiary company had contributed the following results to the Group in current year: RM
Loss after taxation (48,304)
NOTES TO THE FINANCIAL STATEMENTS - 31 MARCH 2010 (CONT’D)
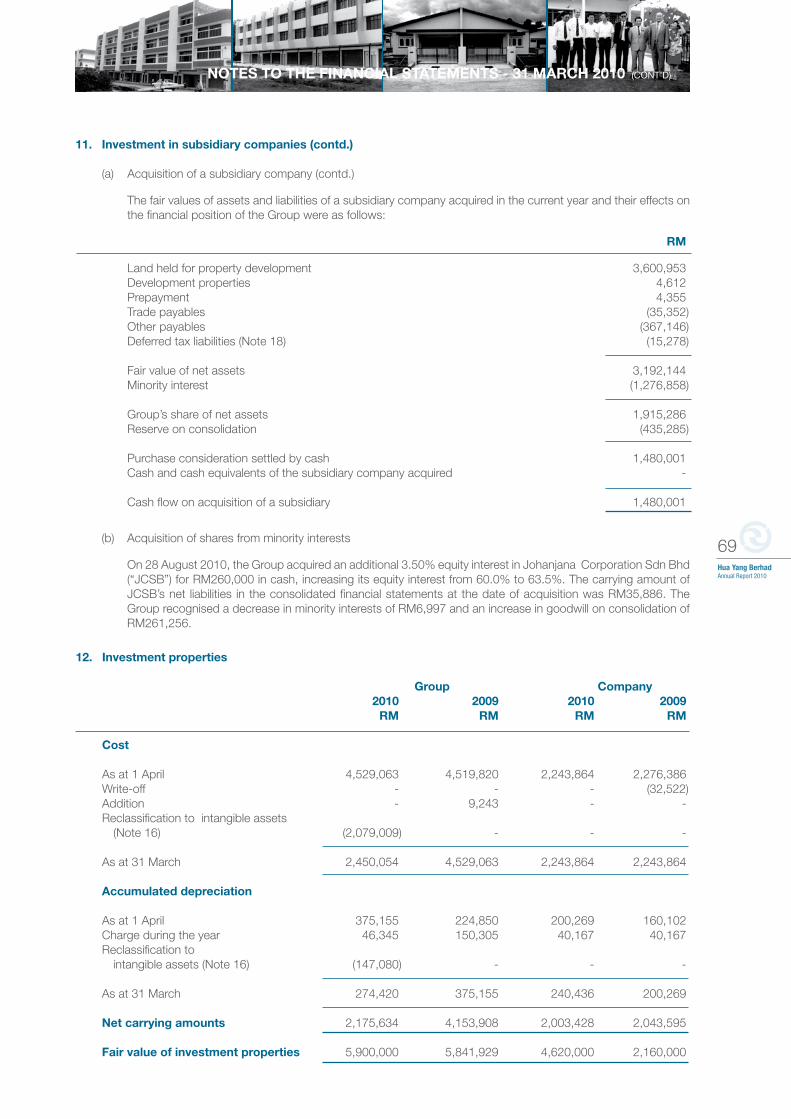
69Hua Yang BerhadAnnual Report 2010
11. Investment in subsidiary companies (contd.)
(a) Acquisition of a subsidiary company (contd.)
The fair values of assets and liabilities of a subsidiary company acquired in the current year and their effects on the financial position of the Group were as follows:
RM
Land held for property development 3,600,953 Development properties 4,612 Prepayment 4,355 Trade payables (35,352) Other payables (367,146) Deferred tax liabilities (Note 18) (15,278)
Fair value of net assets 3,192,144 Minority interest (1,276,858)
Group’s share of net assets 1,915,286 Reserve on consolidation (435,285)
Purchase consideration settled by cash 1,480,001 Cash and cash equivalents of the subsidiary company acquired -
Cash flow on acquisition of a subsidiary 1,480,001
(b) Acquisition of shares from minority interests
On 28 August 2010, the Group acquired an additional 3.50% equity interest in Johanjana Corporation Sdn Bhd (“JCSB”) for RM260,000 in cash, increasing its equity interest from 60.0% to 63.5%. The carrying amount of JCSB’s net liabilities in the consolidated financial statements at the date of acquisition was RM35,886. The Group recognised a decrease in minority interests of RM6,997 and an increase in goodwill on consolidation of RM261,256.
NOTES TO THE FINANCIAL STATEMENTS - 31 MARCH 2010 (CONT’D)
12. Investment properties
Group Company 2010 2009 2010 2009 RM RM RM RM Cost As at 1 April 4,529,063 4,519,820 2,243,864 2,276,386 Write-off - - - (32,522) Addition - 9,243 - - Reclassification to intangible assets (Note 16) (2,079,009) - - -
As at 31 March 2,450,054 4,529,063 2,243,864 2,243,864 Accumulated depreciation As at 1 April 375,155 224,850 200,269 160,102 Charge during the year 46,345 150,305 40,167 40,167 Reclassification to intangible assets (Note 16) (147,080) - - -
As at 31 March 274,420 375,155 240,436 200,269 Net carrying amounts 2,175,634 4,153,908 2,003,428 2,043,595 Fair value of investment properties 5,900,000 5,841,929 4,620,000 2,160,000
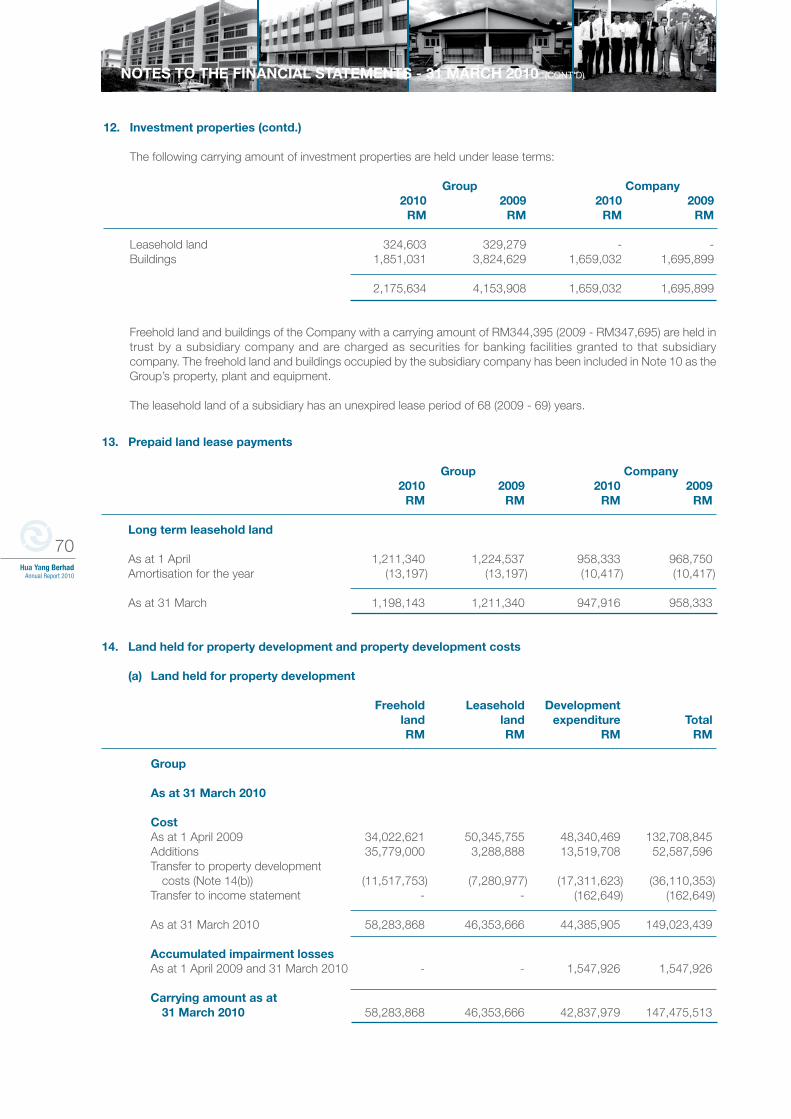
70Hua Yang Berhad
Annual Report 2010
NOTES TO THE FINANCIAL STATEMENTS - 31 MARCH 2010 (CONT’D)
12. Investment properties (contd.)
The following carrying amount of investment properties are held under lease terms:
Group Company 2010 2009 2010 2009 RM RM RM RM Leasehold land 324,603 329,279 - - Buildings 1,851,031 3,824,629 1,659,032 1,695,899
2,175,634 4,153,908 1,659,032 1,695,899
Freehold land and buildings of the Company with a carrying amount of RM344,395 (2009 - RM347,695) are held in trust by a subsidiary company and are charged as securities for banking facilities granted to that subsidiary company. The freehold land and buildings occupied by the subsidiary company has been included in Note 10 as the Group’s property, plant and equipment.
The leasehold land of a subsidiary has an unexpired lease period of 68 (2009 - 69) years.
13. Prepaid land lease payments
Group Company 2010 2009 2010 2009 RM RM RM RM Long term leasehold land As at 1 April 1,211,340 1,224,537 958,333 968,750 Amortisation for the year (13,197) (13,197) (10,417) (10,417)
As at 31 March 1,198,143 1,211,340 947,916 958,333
14. Land held for property development and property development costs (a) Land held for property development
Freehold Leasehold Development land land expenditure Total RM RM RM RM
Group As at 31 March 2010 Cost As at 1 April 2009 34,022,621 50,345,755 48,340,469 132,708,845 Additions 35,779,000 3,288,888 13,519,708 52,587,596 Transfer to property development costs (Note 14(b)) (11,517,753) (7,280,977) (17,311,623) (36,110,353) Transfer to income statement - - (162,649) (162,649)
As at 31 March 2010 58,283,868 46,353,666 44,385,905 149,023,439 Accumulated impairment losses As at 1 April 2009 and 31 March 2010 - - 1,547,926 1,547,926 Carrying amount as at 31 March 2010 58,283,868 46,353,666 42,837,979 147,475,513
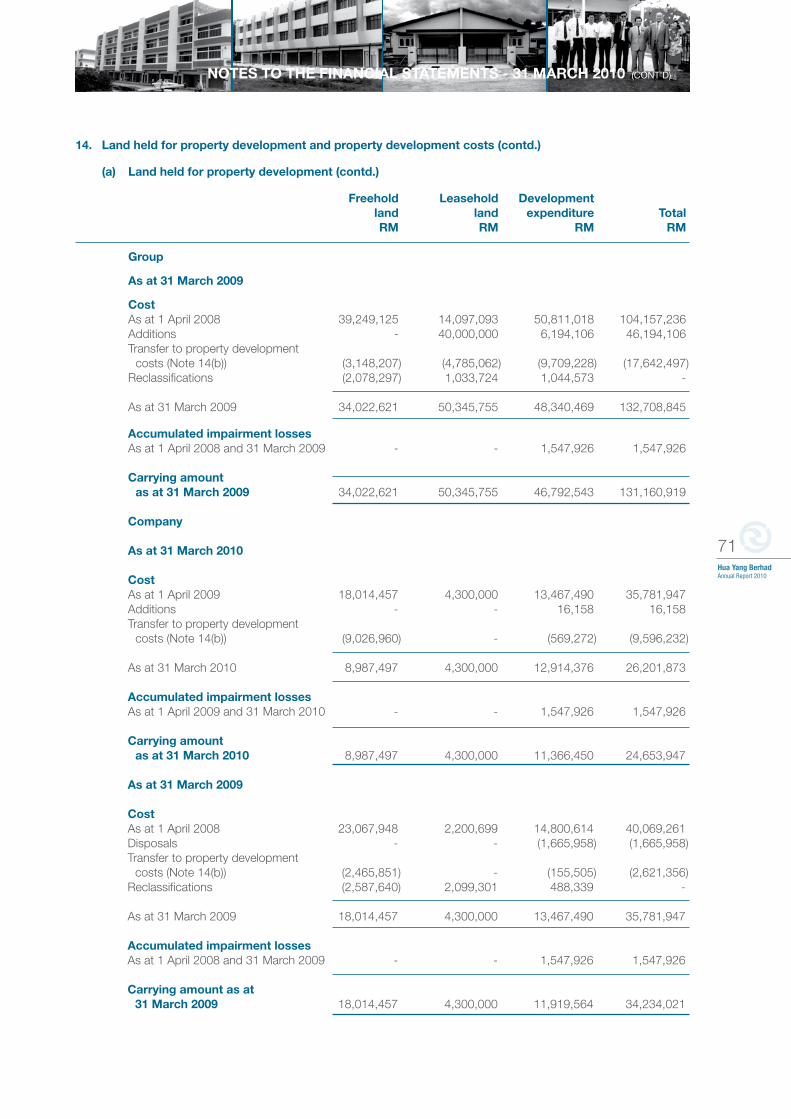
71Hua Yang BerhadAnnual Report 2010
NOTES TO THE FINANCIAL STATEMENTS - 31 MARCH 2010 (CONT’D)
14. Land held for property development and property development costs (contd.)
(a) Land held for property development (contd.) Freehold Leasehold Development land land expenditure Total RM RM RM RM
Group As at 31 March 2009 Cost As at 1 April 2008 39,249,125 14,097,093 50,811,018 104,157,236 Additions - 40,000,000 6,194,106 46,194,106 Transfer to property development costs (Note 14(b)) (3,148,207) (4,785,062) (9,709,228) (17,642,497) Reclassifications (2,078,297) 1,033,724 1,044,573 -
As at 31 March 2009 34,022,621 50,345,755 48,340,469 132,708,845 Accumulated impairment losses As at 1 April 2008 and 31 March 2009 - - 1,547,926 1,547,926 Carrying amount as at 31 March 2009 34,022,621 50,345,755 46,792,543 131,160,919 Company As at 31 March 2010 Cost As at 1 April 2009 18,014,457 4,300,000 13,467,490 35,781,947 Additions - - 16,158 16,158 Transfer to property development costs (Note 14(b)) (9,026,960) - (569,272) (9,596,232) As at 31 March 2010 8,987,497 4,300,000 12,914,376 26,201,873 Accumulated impairment losses As at 1 April 2009 and 31 March 2010 - - 1,547,926 1,547,926 Carrying amount as at 31 March 2010 8,987,497 4,300,000 11,366,450 24,653,947
As at 31 March 2009 Cost As at 1 April 2008 23,067,948 2,200,699 14,800,614 40,069,261 Disposals - - (1,665,958) (1,665,958) Transfer to property development costs (Note 14(b)) (2,465,851) - (155,505) (2,621,356) Reclassifications (2,587,640) 2,099,301 488,339 -
As at 31 March 2009 18,014,457 4,300,000 13,467,490 35,781,947 Accumulated impairment losses As at 1 April 2008 and 31 March 2009 - - 1,547,926 1,547,926 Carrying amount as at 31 March 2009 18,014,457 4,300,000 11,919,564 34,234,021
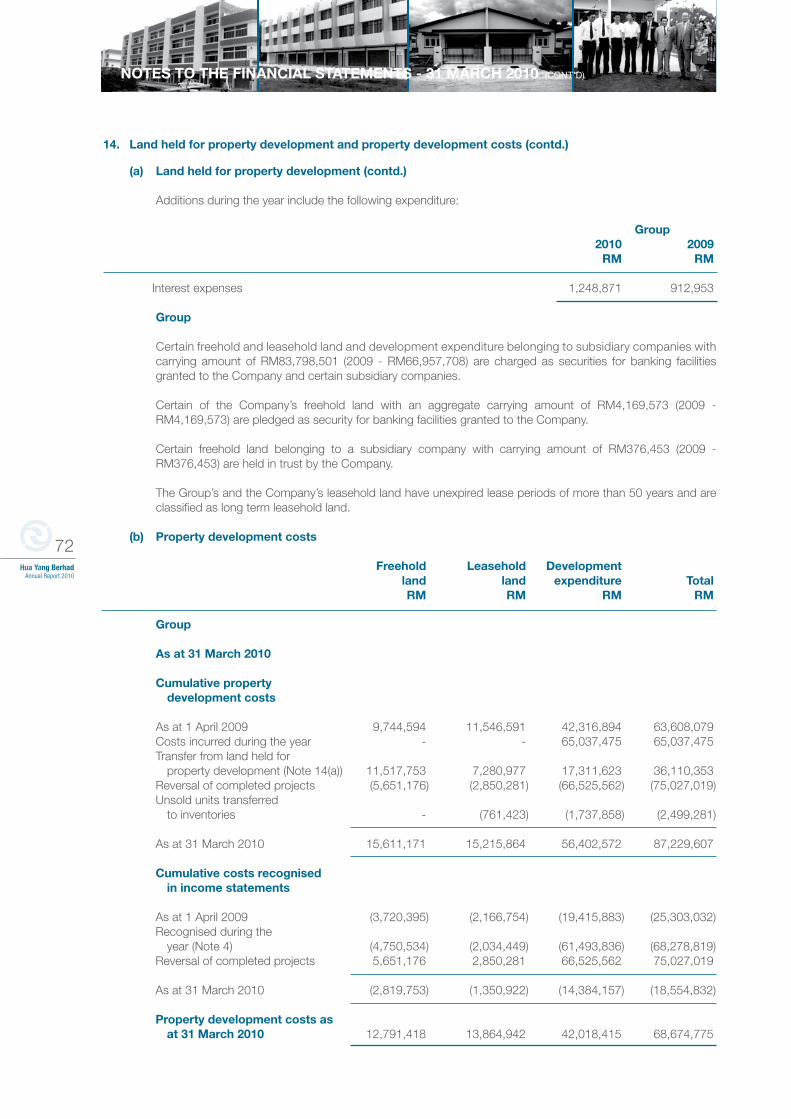
72Hua Yang Berhad
Annual Report 2010
NOTES TO THE FINANCIAL STATEMENTS - 31 MARCH 2010 (CONT’D)
14. Land held for property development and property development costs (contd.)
(a) Land held for property development (contd.)
Additions during the year include the following expenditure: Group 2010 2009 RM RM Interest expenses 1,248,871 912,953
Group Certain freehold and leasehold land and development expenditure belonging to subsidiary companies with carrying amount of RM83,798,501 (2009 - RM66,957,708) are charged as securities for banking facilities granted to the Company and certain subsidiary companies.
Certain of the Company’s freehold land with an aggregate carrying amount of RM4,169,573 (2009 - RM4,169,573) are pledged as security for banking facilities granted to the Company.
Certain freehold land belonging to a subsidiary company with carrying amount of RM376,453 (2009 - RM376,453) are held in trust by the Company.
The Group’s and the Company’s leasehold land have unexpired lease periods of more than 50 years and are classified as long term leasehold land.
(b) Property development costs
Freehold Leasehold Development land land expenditure Total RM RM RM RM Group As at 31 March 2010 Cumulative property development costs As at 1 April 2009 9,744,594 11,546,591 42,316,894 63,608,079 Costs incurred during the year - - 65,037,475 65,037,475 Transfer from land held for property development (Note 14(a)) 11,517,753 7,280,977 17,311,623 36,110,353 Reversal of completed projects (5,651,176) (2,850,281) (66,525,562) (75,027,019) Unsold units transferred to inventories - (761,423) (1,737,858) (2,499,281)
As at 31 March 2010 15,611,171 15,215,864 56,402,572 87,229,607 Cumulative costs recognised in income statements As at 1 April 2009 (3,720,395) (2,166,754) (19,415,883) (25,303,032) Recognised during the year (Note 4) (4,750,534) (2,034,449) (61,493,836) (68,278,819) Reversal of completed projects 5,651,176 2,850,281 66,525,562 75,027,019
As at 31 March 2010 (2,819,753) (1,350,922) (14,384,157) (18,554,832) Property development costs as at 31 March 2010 12,791,418 13,864,942 42,018,415 68,674,775
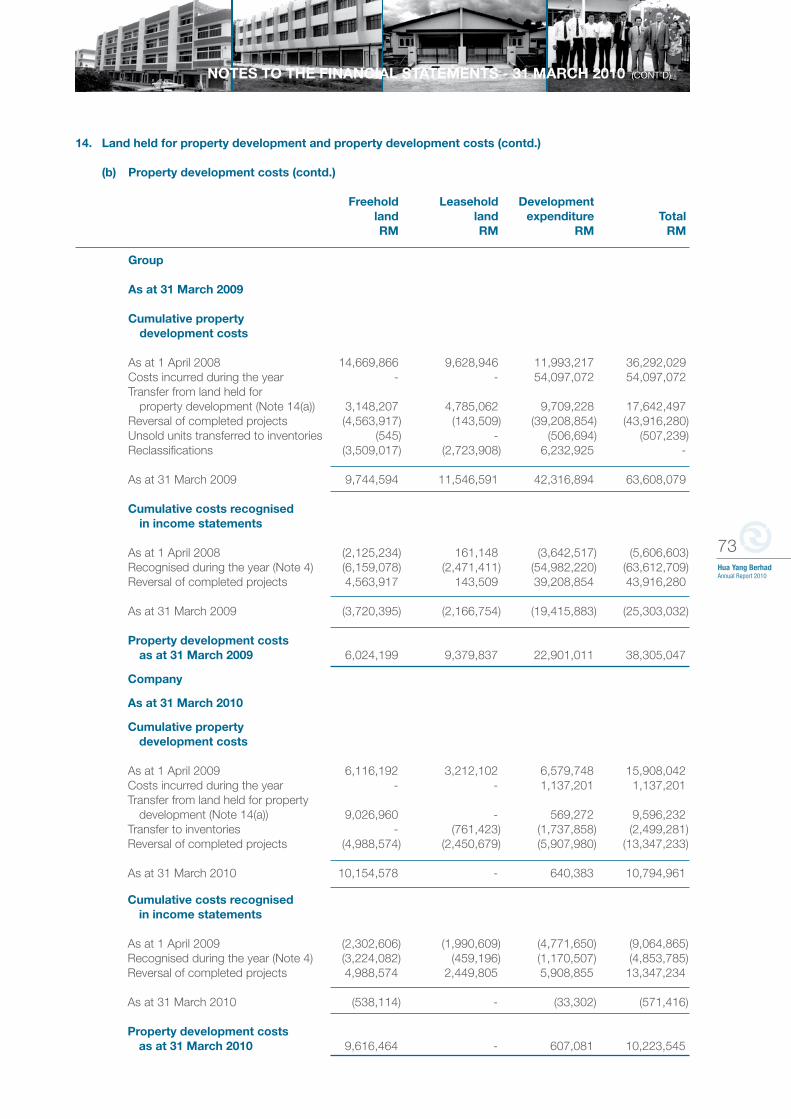
73Hua Yang BerhadAnnual Report 2010
NOTES TO THE FINANCIAL STATEMENTS - 31 MARCH 2010 (CONT’D)
14. Land held for property development and property development costs (contd.)
(b) Property development costs (contd.)
Freehold Leasehold Development land land expenditure Total RM RM RM RM Group As at 31 March 2009 Cumulative property development costs As at 1 April 2008 14,669,866 9,628,946 11,993,217 36,292,029 Costs incurred during the year - - 54,097,072 54,097,072 Transfer from land held for property development (Note 14(a)) 3,148,207 4,785,062 9,709,228 17,642,497 Reversal of completed projects (4,563,917) (143,509) (39,208,854) (43,916,280) Unsold units transferred to inventories (545) - (506,694) (507,239) Reclassifications (3,509,017) (2,723,908) 6,232,925 -
As at 31 March 2009 9,744,594 11,546,591 42,316,894 63,608,079 Cumulative costs recognised in income statements As at 1 April 2008 (2,125,234) 161,148 (3,642,517) (5,606,603) Recognised during the year (Note 4) (6,159,078) (2,471,411) (54,982,220) (63,612,709) Reversal of completed projects 4,563,917 143,509 39,208,854 43,916,280
As at 31 March 2009 (3,720,395) (2,166,754) (19,415,883) (25,303,032) Property development costs as at 31 March 2009 6,024,199 9,379,837 22,901,011 38,305,047
Company As at 31 March 2010 Cumulative property development costs
As at 1 April 2009 6,116,192 3,212,102 6,579,748 15,908,042 Costs incurred during the year - - 1,137,201 1,137,201 Transfer from land held for property development (Note 14(a)) 9,026,960 - 569,272 9,596,232 Transfer to inventories - (761,423) (1,737,858) (2,499,281) Reversal of completed projects (4,988,574) (2,450,679) (5,907,980) (13,347,233)
As at 31 March 2010 10,154,578 - 640,383 10,794,961 Cumulative costs recognised in income statements As at 1 April 2009 (2,302,606) (1,990,609) (4,771,650) (9,064,865) Recognised during the year (Note 4) (3,224,082) (459,196) (1,170,507) (4,853,785) Reversal of completed projects 4,988,574 2,449,805 5,908,855 13,347,234
As at 31 March 2010 (538,114) - (33,302) (571,416)
Property development costs as at 31 March 2010 9,616,464 - 607,081 10,223,545
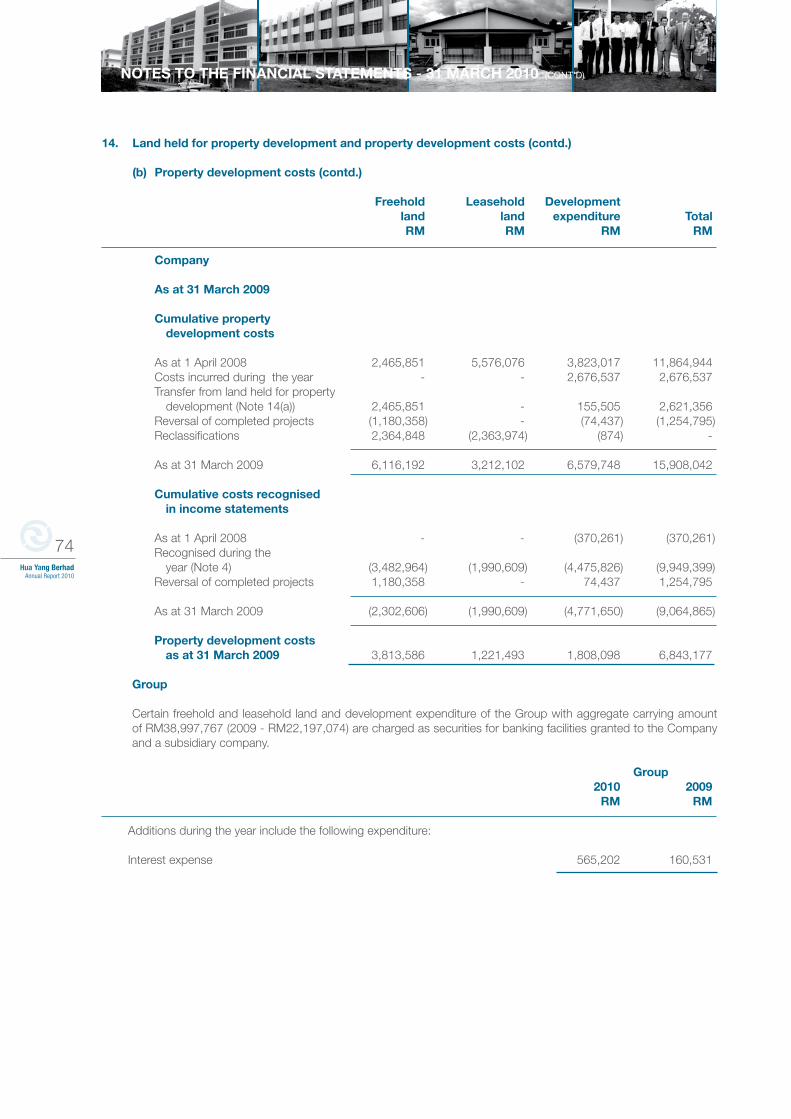
74Hua Yang Berhad
Annual Report 2010
NOTES TO THE FINANCIAL STATEMENTS - 31 MARCH 2010 (CONT’D)
14. Land held for property development and property development costs (contd.)
(b) Property development costs (contd.) Freehold Leasehold Development land land expenditure Total RM RM RM RM
Company As at 31 March 2009 Cumulative property development costs As at 1 April 2008 2,465,851 5,576,076 3,823,017 11,864,944 Costs incurred during the year - - 2,676,537 2,676,537 Transfer from land held for property development (Note 14(a)) 2,465,851 - 155,505 2,621,356 Reversal of completed projects (1,180,358) - (74,437) (1,254,795) Reclassifications 2,364,848 (2,363,974) (874) -
As at 31 March 2009 6,116,192 3,212,102 6,579,748 15,908,042 Cumulative costs recognised in income statements As at 1 April 2008 - - (370,261) (370,261) Recognised during the year (Note 4) (3,482,964) (1,990,609) (4,475,826) (9,949,399) Reversal of completed projects 1,180,358 - 74,437 1,254,795
As at 31 March 2009 (2,302,606) (1,990,609) (4,771,650) (9,064,865) Property development costs as at 31 March 2009 3,813,586 1,221,493 1,808,098 6,843,177
Group
Certain freehold and leasehold land and development expenditure of the Group with aggregate carrying amount of RM38,997,767 (2009 - RM22,197,074) are charged as securities for banking facilities granted to the Company and a subsidiary company.
Group 2010 2009 RM RM
Additions during the year include the following expenditure: Interest expense 565,202 160,531
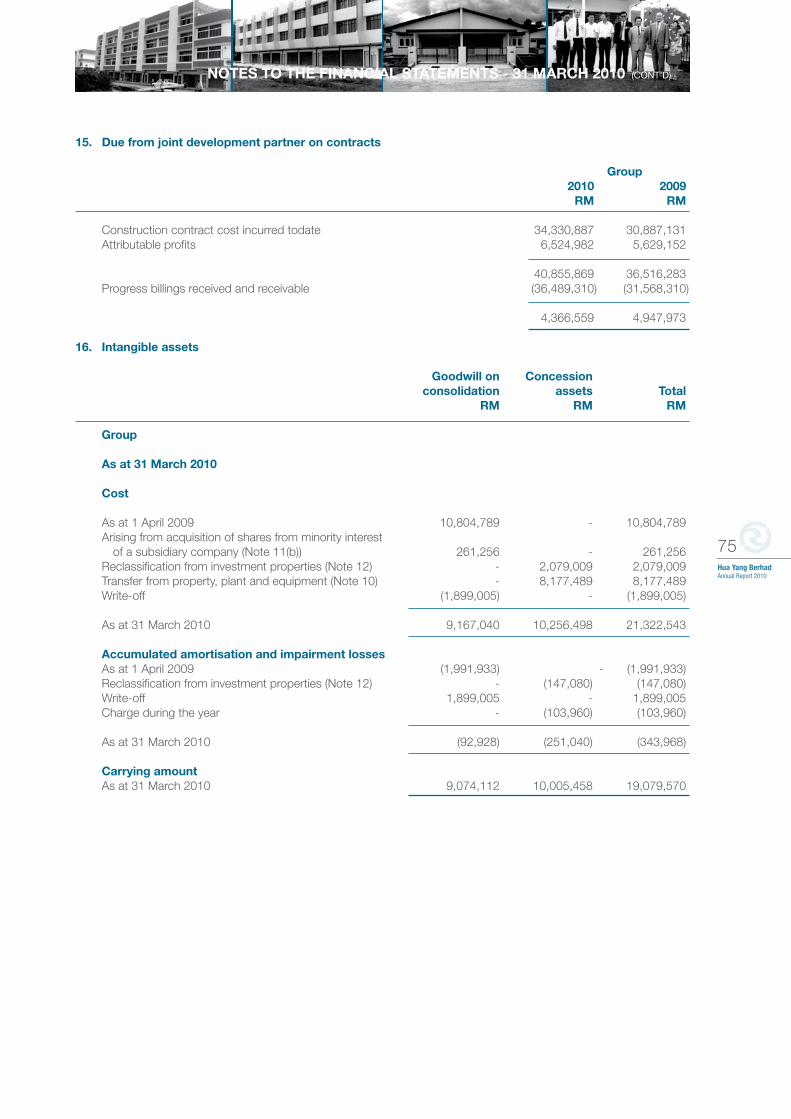
75Hua Yang BerhadAnnual Report 2010
NOTES TO THE FINANCIAL STATEMENTS - 31 MARCH 2010 (CONT’D)
15. Due from joint development partner on contracts
Group 2010 2009 RM RM Construction contract cost incurred todate 34,330,887 30,887,131 Attributable profits 6,524,982 5,629,152
40,855,869 36,516,283 Progress billings received and receivable (36,489,310) (31,568,310) 4,366,559 4,947,973 16. Intangible assets
Goodwill on Concession consolidation assets Total RM RM RM
Group As at 31 March 2010 Cost As at 1 April 2009 10,804,789 - 10,804,789 Arising from acquisition of shares from minority interest of a subsidiary company (Note 11(b)) 261,256 - 261,256 Reclassification from investment properties (Note 12) - 2,079,009 2,079,009 Transfer from property, plant and equipment (Note 10) - 8,177,489 8,177,489 Write-off (1,899,005) - (1,899,005)
As at 31 March 2010 9,167,040 10,256,498 21,322,543 Accumulated amortisation and impairment losses As at 1 April 2009 (1,991,933) - (1,991,933) Reclassification from investment properties (Note 12) - (147,080) (147,080) Write-off 1,899,005 - 1,899,005 Charge during the year - (103,960) (103,960)
As at 31 March 2010 (92,928) (251,040) (343,968) Carrying amount As at 31 March 2010 9,074,112 10,005,458 19,079,570
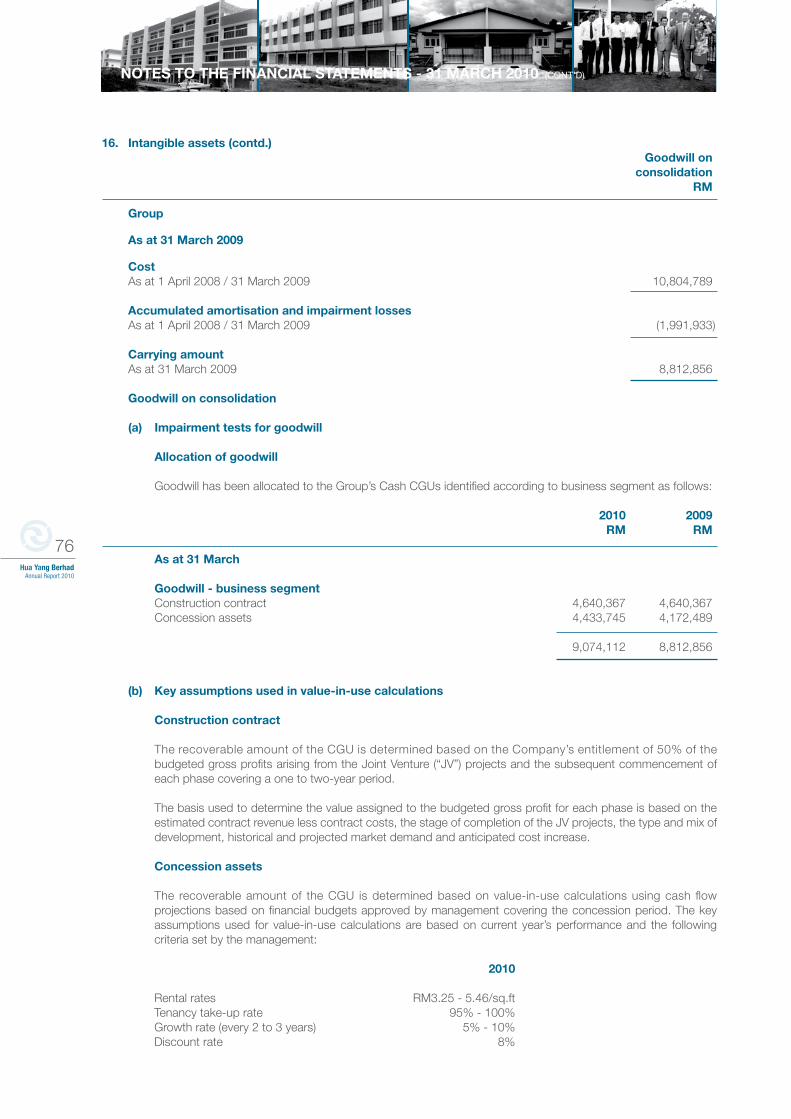
76Hua Yang Berhad
Annual Report 2010
NOTES TO THE FINANCIAL STATEMENTS - 31 MARCH 2010 (CONT’D)
16. Intangible assets (contd.) Goodwill on consolidation RM
Group As at 31 March 2009 Cost As at 1 April 2008 / 31 March 2009 10,804,789
Accumulated amortisation and impairment losses As at 1 April 2008 / 31 March 2009 (1,991,933) Carrying amount As at 31 March 2009 8,812,856 Goodwill on consolidation (a) Impairment tests for goodwill Allocation of goodwill Goodwill has been allocated to the Group’s Cash CGUs identified according to business segment as follows: 2010 2009 RM RM
As at 31 March Goodwill - business segment Construction contract 4,640,367 4,640,367 Concession assets 4,433,745 4,172,489
9,074,112 8,812,856 (b) Key assumptions used in value-in-use calculations
Construction contract The recoverable amount of the CGU is determined based on the Company’s entitlement of 50% of the budgeted gross profits arising from the Joint Venture (“JV”) projects and the subsequent commencement of each phase covering a one to two-year period. The basis used to determine the value assigned to the budgeted gross profit for each phase is based on the estimated contract revenue less contract costs, the stage of completion of the JV projects, the type and mix of development, historical and projected market demand and anticipated cost increase. Concession assets The recoverable amount of the CGU is determined based on value-in-use calculations using cash flow projections based on financial budgets approved by management covering the concession period. The key assumptions used for value-in-use calculations are based on current year’s performance and the following criteria set by the management:
2010 Rental rates RM3.25 - 5.46/sq.ft Tenancy take-up rate 95% - 100% Growth rate (every 2 to 3 years) 5% - 10% Discount rate 8%
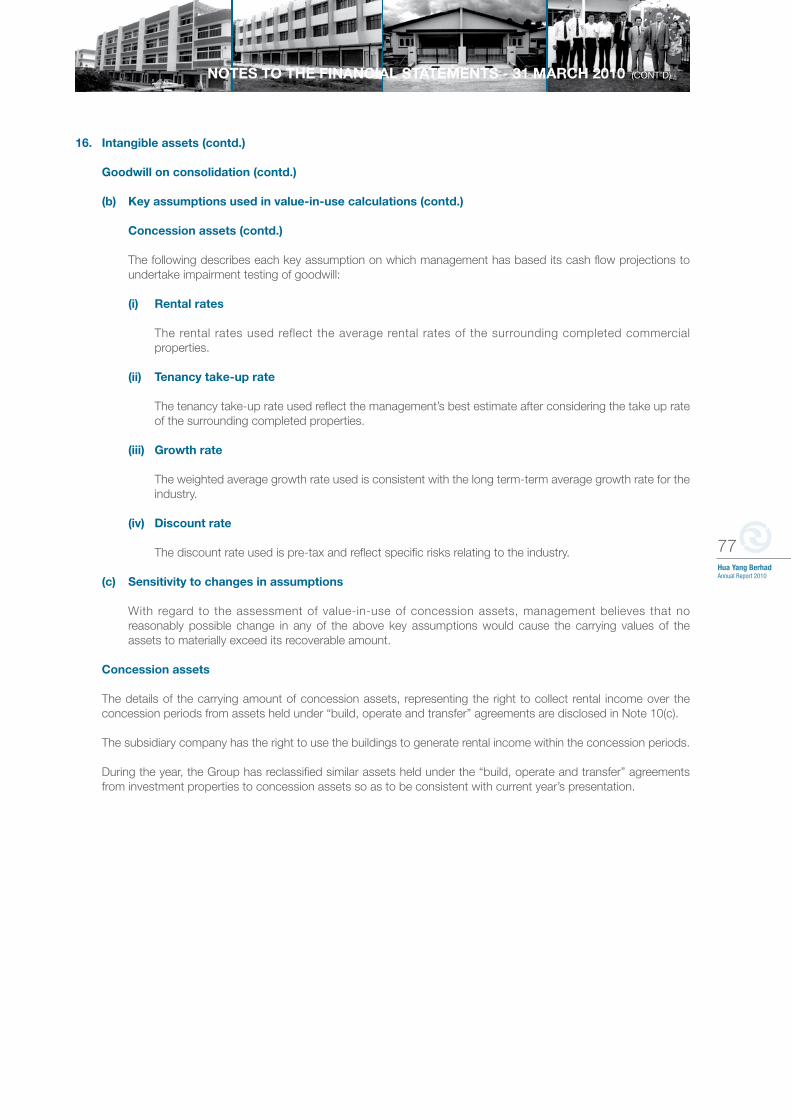
77Hua Yang BerhadAnnual Report 2010
NOTES TO THE FINANCIAL STATEMENTS - 31 MARCH 2010 (CONT’D)
16. Intangible assets (contd.)
Goodwill on consolidation (contd.)
(b) Key assumptions used in value-in-use calculations (contd.) Concession assets (contd.)
The following describes each key assumption on which management has based its cash flow projections to undertake impairment testing of goodwill:
(i) Rental rates
The rental rates used reflect the average rental rates of the surrounding completed commercial properties. (ii) Tenancy take-up rate
The tenancy take-up rate used reflect the management’s best estimate after considering the take up rate of the surrounding completed properties.
(iii) Growth rate
The weighted average growth rate used is consistent with the long term-term average growth rate for the industry.
(iv) Discount rate
The discount rate used is pre-tax and reflect specific risks relating to the industry.
(c) Sensitivity to changes in assumptions
With regard to the assessment of value-in-use of concession assets, management believes that no reasonably possible change in any of the above key assumptions would cause the carrying values of the assets to materially exceed its recoverable amount.
Concession assets
The details of the carrying amount of concession assets, representing the right to collect rental income over the concession periods from assets held under “build, operate and transfer” agreements are disclosed in Note 10(c).
The subsidiary company has the right to use the buildings to generate rental income within the concession periods.
During the year, the Group has reclassified similar assets held under the “build, operate and transfer” agreements from investment properties to concession assets so as to be consistent with current year’s presentation.
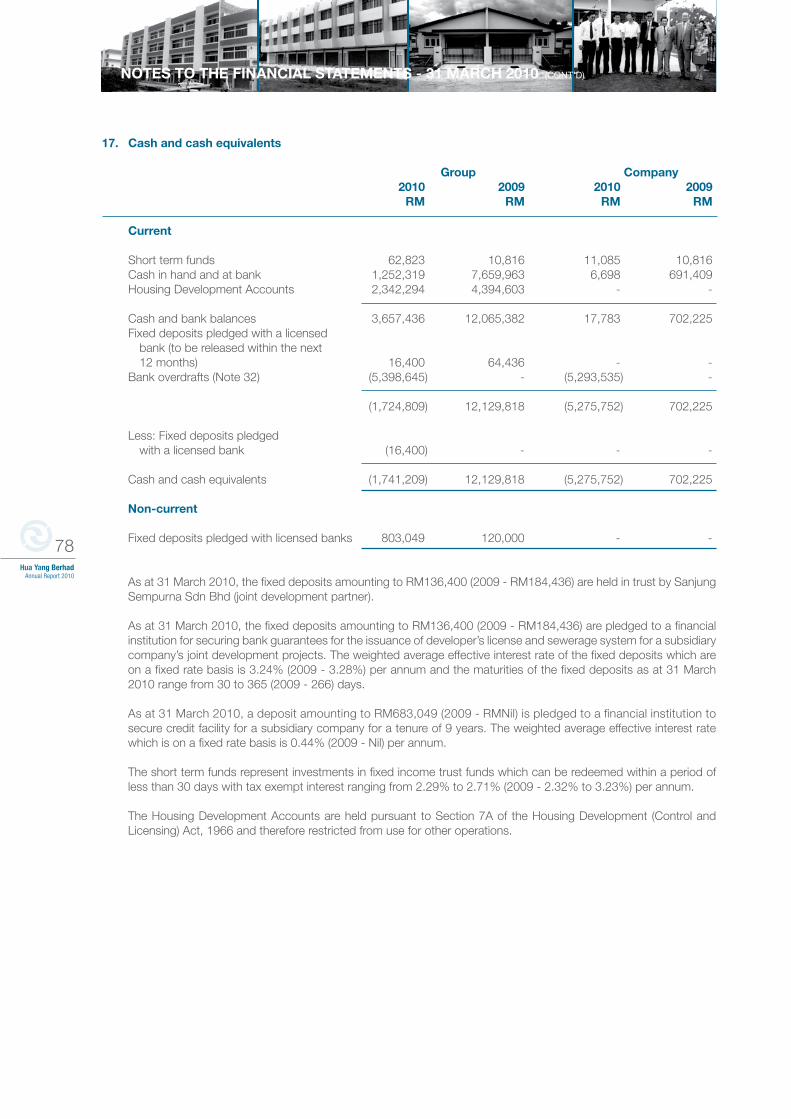
78Hua Yang Berhad
Annual Report 2010
NOTES TO THE FINANCIAL STATEMENTS - 31 MARCH 2010 (CONT’D)
17. Cash and cash equivalents
Group Company 2010 2009 2010 2009 RM RM RM RM
Current Short term funds 62,823 10,816 11,085 10,816 Cash in hand and at bank 1,252,319 7,659,963 6,698 691,409 Housing Development Accounts 2,342,294 4,394,603 - -
Cash and bank balances 3,657,436 12,065,382 17,783 702,225 Fixed deposits pledged with a licensed bank (to be released within the next 12 months) 16,400 64,436 - - Bank overdrafts (Note 32) (5,398,645) - (5,293,535) -
(1,724,809) 12,129,818 (5,275,752) 702,225 Less: Fixed deposits pledged with a licensed bank (16,400) - - -
Cash and cash equivalents (1,741,209) 12,129,818 (5,275,752) 702,225 Non-current Fixed deposits pledged with licensed banks 803,049 120,000 - -
As at 31 March 2010, the fixed deposits amounting to RM136,400 (2009 - RM184,436) are held in trust by Sanjung Sempurna Sdn Bhd (joint development partner).
As at 31 March 2010, the fixed deposits amounting to RM136,400 (2009 - RM184,436) are pledged to a financial institution for securing bank guarantees for the issuance of developer’s license and sewerage system for a subsidiary company’s joint development projects. The weighted average effective interest rate of the fixed deposits which are on a fixed rate basis is 3.24% (2009 - 3.28%) per annum and the maturities of the fixed deposits as at 31 March 2010 range from 30 to 365 (2009 - 266) days.
As at 31 March 2010, a deposit amounting to RM683,049 (2009 - RMNil) is pledged to a financial institution to secure credit facility for a subsidiary company for a tenure of 9 years. The weighted average effective interest rate which is on a fixed rate basis is 0.44% (2009 - Nil) per annum.
The short term funds represent investments in fixed income trust funds which can be redeemed within a period of less than 30 days with tax exempt interest ranging from 2.29% to 2.71% (2009 - 2.32% to 3.23%) per annum.
The Housing Development Accounts are held pursuant to Section 7A of the Housing Development (Control and Licensing) Act, 1966 and therefore restricted from use for other operations.
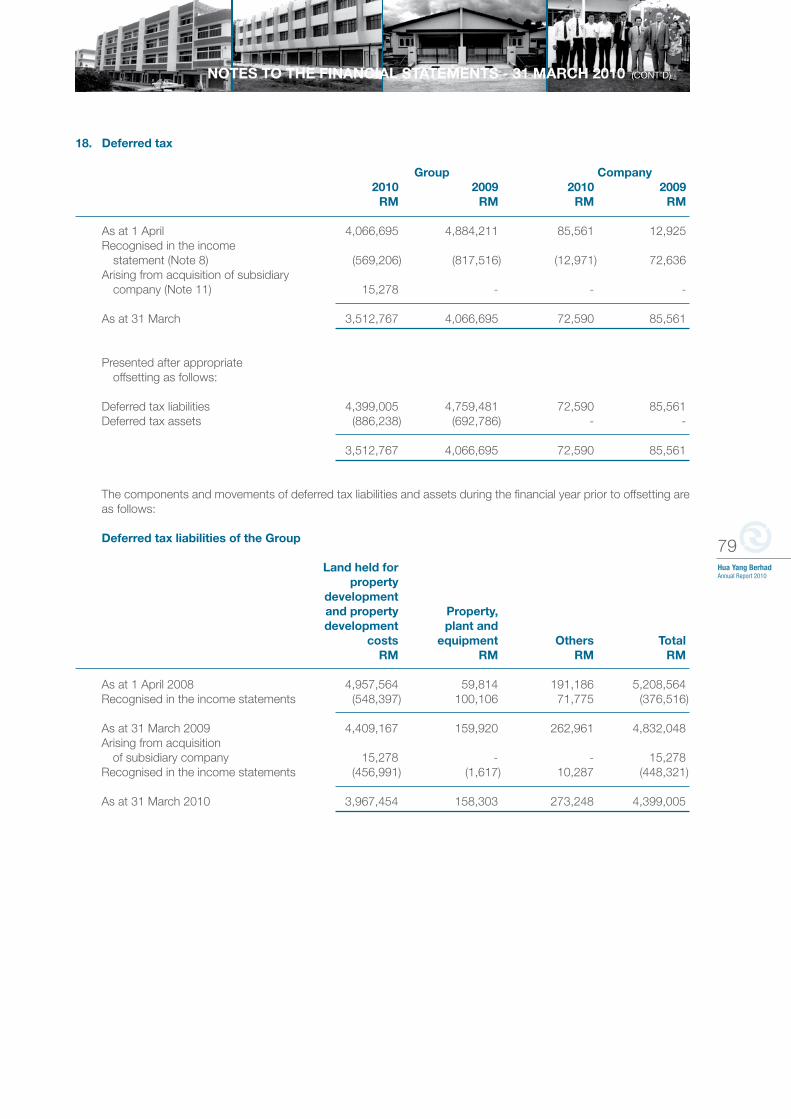
79Hua Yang BerhadAnnual Report 2010
NOTES TO THE FINANCIAL STATEMENTS - 31 MARCH 2010 (CONT’D)
18. Deferred tax
Group Company 2010 2009 2010 2009 RM RM RM RM As at 1 April 4,066,695 4,884,211 85,561 12,925 Recognised in the income statement (Note 8) (569,206) (817,516) (12,971) 72,636 Arising from acquisition of subsidiary company (Note 11) 15,278 - - -
As at 31 March 3,512,767 4,066,695 72,590 85,561 Presented after appropriate offsetting as follows: Deferred tax liabilities 4,399,005 4,759,481 72,590 85,561 Deferred tax assets (886,238) (692,786) - -
3,512,767 4,066,695 72,590 85,561
The components and movements of deferred tax liabilities and assets during the financial year prior to offsetting are as follows:
Deferred tax liabilities of the Group
Land held for property development and property Property, development plant and costs equipment Others Total RM RM RM RM As at 1 April 2008 4,957,564 59,814 191,186 5,208,564 Recognised in the income statements (548,397) 100,106 71,775 (376,516)
As at 31 March 2009 4,409,167 159,920 262,961 4,832,048 Arising from acquisition of subsidiary company 15,278 - - 15,278 Recognised in the income statements (456,991) (1,617) 10,287 (448,321)
As at 31 March 2010 3,967,454 158,303 273,248 4,399,005
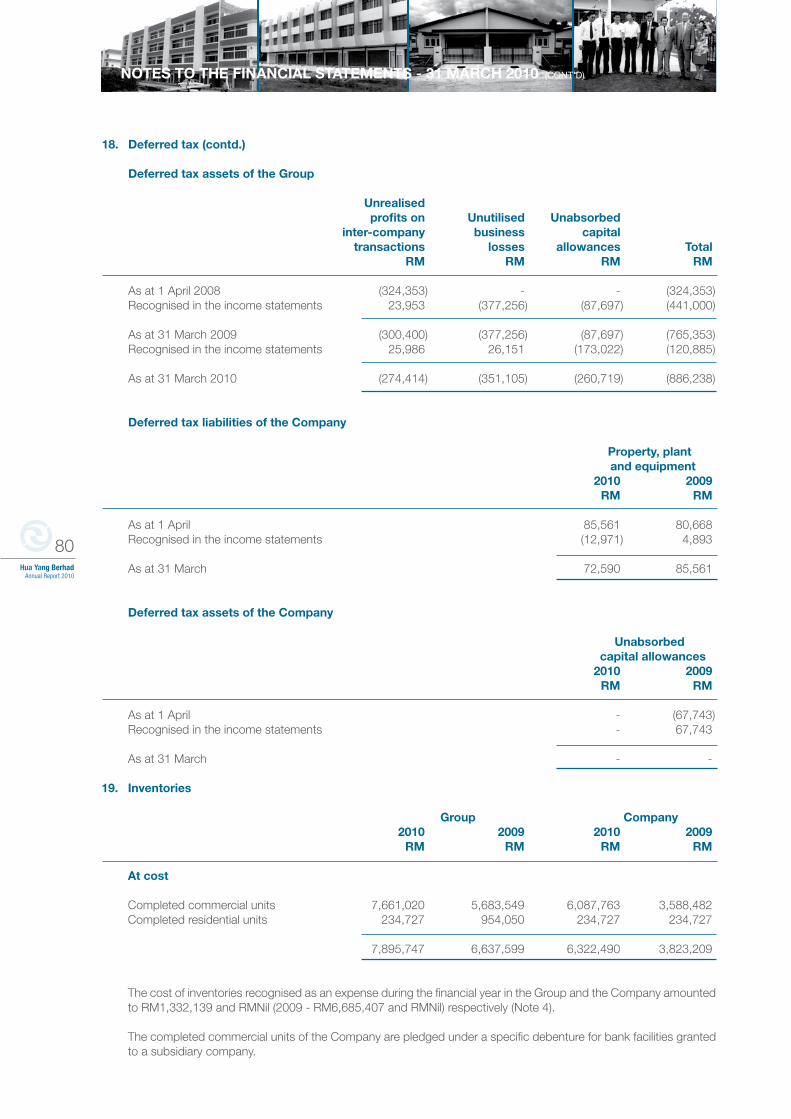
80Hua Yang Berhad
Annual Report 2010
NOTES TO THE FINANCIAL STATEMENTS - 31 MARCH 2010 (CONT’D)
18. Deferred tax (contd.)
Deferred tax assets of the Group
Unrealised profits on Unutilised Unabsorbed inter-company business capital transactions losses allowances Total RM RM RM RM As at 1 April 2008 (324,353) - - (324,353) Recognised in the income statements 23,953 (377,256) (87,697) (441,000)
As at 31 March 2009 (300,400) (377,256) (87,697) (765,353) Recognised in the income statements 25,986 26,151 (173,022) (120,885)
As at 31 March 2010 (274,414) (351,105) (260,719) (886,238)
Deferred tax liabilities of the Company Property, plant and equipment 2010 2009 RM RM As at 1 April 85,561 80,668 Recognised in the income statements (12,971) 4,893
As at 31 March 72,590 85,561 Deferred tax assets of the Company Unabsorbed capital allowances 2010 2009 RM RM As at 1 April - (67,743) Recognised in the income statements - 67,743
As at 31 March - -
19. Inventories
Group Company 2010 2009 2010 2009 RM RM RM RM
At cost Completed commercial units 7,661,020 5,683,549 6,087,763 3,588,482 Completed residential units 234,727 954,050 234,727 234,727
7,895,747 6,637,599 6,322,490 3,823,209
The cost of inventories recognised as an expense during the financial year in the Group and the Company amounted to RM1,332,139 and RMNil (2009 - RM6,685,407 and RMNil) respectively (Note 4).
The completed commercial units of the Company are pledged under a specific debenture for bank facilities granted to a subsidiary company.
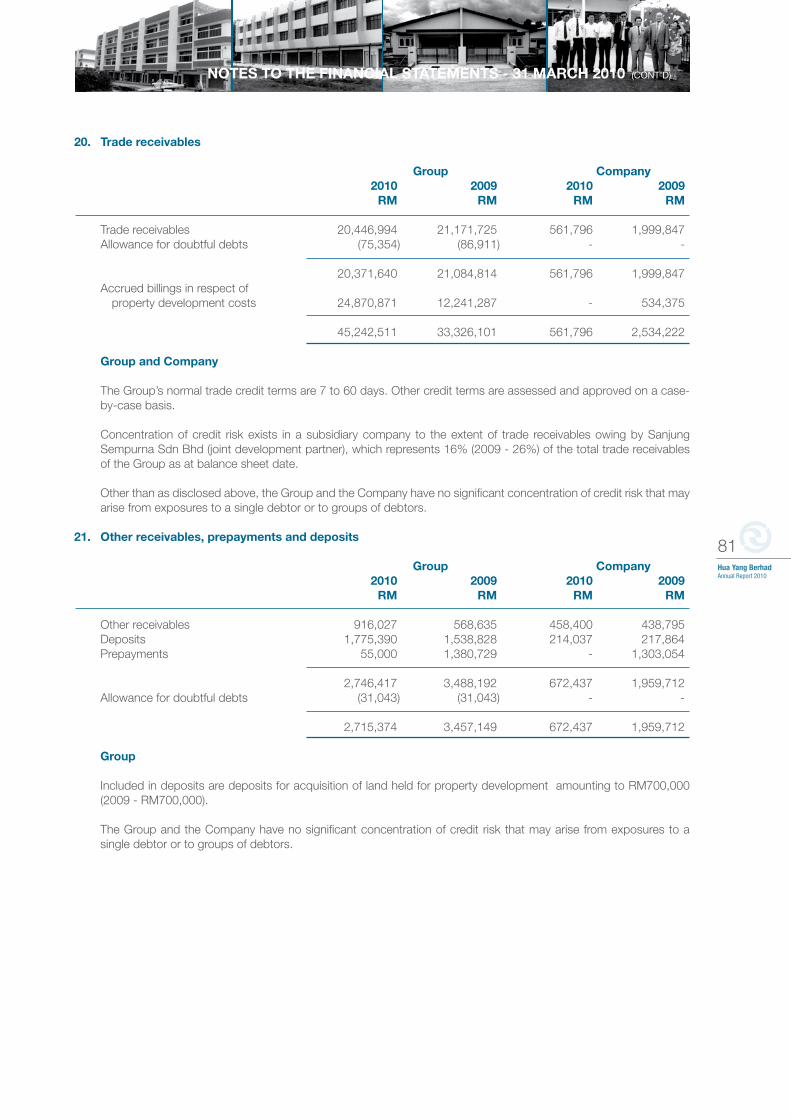
81Hua Yang BerhadAnnual Report 2010
NOTES TO THE FINANCIAL STATEMENTS - 31 MARCH 2010 (CONT’D)
20. Trade receivables
Group Company 2010 2009 2010 2009 RM RM RM RM Trade receivables 20,446,994 21,171,725 561,796 1,999,847 Allowance for doubtful debts (75,354) (86,911) - -
20,371,640 21,084,814 561,796 1,999,847 Accrued billings in respect of property development costs 24,870,871 12,241,287 - 534,375
45,242,511 33,326,101 561,796 2,534,222
Group and Company
The Group’s normal trade credit terms are 7 to 60 days. Other credit terms are assessed and approved on a case- by-case basis.
Concentration of credit risk exists in a subsidiary company to the extent of trade receivables owing by Sanjung Sempurna Sdn Bhd (joint development partner), which represents 16% (2009 - 26%) of the total trade receivables of the Group as at balance sheet date.
Other than as disclosed above, the Group and the Company have no significant concentration of credit risk that may arise from exposures to a single debtor or to groups of debtors.
21. Other receivables, prepayments and deposits
Group Company 2010 2009 2010 2009 RM RM RM RM Other receivables 916,027 568,635 458,400 438,795 Deposits 1,775,390 1,538,828 214,037 217,864 Prepayments 55,000 1,380,729 - 1,303,054
2,746,417 3,488,192 672,437 1,959,712 Allowance for doubtful debts (31,043) (31,043) - -
2,715,374 3,457,149 672,437 1,959,712
Group
Included in deposits are deposits for acquisition of land held for property development amounting to RM700,000 (2009 - RM700,000).
The Group and the Company have no significant concentration of credit risk that may arise from exposures to a single debtor or to groups of debtors.
82Hua Yang Berhad
Annual Report 2010
NOTES TO THE FINANCIAL STATEMENTS - 31 MARCH 2010 (CONT’D)
22. Amounts owing by/(to) subsidiary companies
Company
(a) Amounts owing by subsidiary companies
2010 2009 RM RM Interest bearing 10,893,787 2,754,451 Non-interest bearing 35,054,927 19,923,574
45,948,714 22,678,025
All the above amounts owing are unsecured, without fixed terms of repayment and to be settled in cash. The interest bearing amount owing by a subsidiary company bears a weighted average effective interest rate of 7.55% (2009 - 8.41%) per annum.
(b) Amounts owing to subsidiary companies
All amounts owing are non-interest bearing, unsecured, without fixed terms of repayment and to be settled in cash.
23. Share capital
Group and Company Number of ordinary shares of RM1 each Amount 2010 2009 2010 2009 RM RM Authorised 500,000,000 500,000,000 500,000,000 500,000,000 Issued and fully paid 90,000,000 90,000,000 90,000,000 90,000,000
There are no movements in the authorised and issued and fully paid share capital during the year.
The holders of ordinary shares are entitled to receive dividends as declared from time to time and are entitled to one vote per share at meetings of the Company. All ordinary shares rank equally with regard to the Company’s residual assets.
24. Share premium
The share premium arose from a public issue of 12,871,000 new shares in conjunction with the listing of the Company’s shares on the Main Market of Bursa Malaysia Securities Berhad at a premium of RM0.75 per share, net of listing expenses.
25. Reserves
Group Company 2010 2009 2010 2009 RM RM RM RM
Distributable Retained earnings 98,626,794 88,746,622 10,575,942 9,240,586 Non-distributable Capital redemption reserve 500,000 500,000 500,000 500,000
99,126,794 89,246,622 11,075,942 9,740,586
83Hua Yang BerhadAnnual Report 2010
NOTES TO THE FINANCIAL STATEMENTS - 31 MARCH 2010 (CONT’D)
25. Reserves (contd.)
The capital redemption reserve arose from redemption of 5,000,000 redeemable preference shares of RM0.10 each in year ended 31 March 1998 and can be applied in paying up unissued shares of the Company to be issued to members of the Company as fully paid bonus shares.
Prior to the year of assessment 2008, Malaysian companies adopted the full imputation system. In accordance with the Finance Act, 2007 which was gazetted on 28 December 2007, companies shall not be entitled to deduct tax on dividend paid, credited or distributed to its shareholders, and such dividends will be exempted from tax in the hands of the shareholders (“single tier system”). However, there is a transitional period of six years, expiring on 31 December 2013, to allow companies to pay franked dividends to their shareholders under limited circumstances. Companies also have an irrevocable option to disregard the 108 balance and opt to pay dividends under the single tier system. The change in the tax legislation also provides for the 108 balance to be locked-in as at 31 December 2007 in accordance with Section 39 of the Finance Act, 2007.
The Company did not elect for the irrevocable option to disregard the 108 balance. Accordingly, during the transitional period, the Company may utilise the credit in the 108 balance as at 31 March 2010 and 2009 to distribute cash dividend payments to ordinary shareholdings as defined under the Finance Act, 2007.
As at 31 March 2010 and 2009, the Company has sufficient credit in the 108 balance to pay dividends out of its entire retained earnings.
As at 31 March 2010, the Company also has tax exempt profits available for distribution of approximately RM228,000 (2009 - RM228,000).
26. Hire purchase payables
Group Company 2010 2009 2010 2009 RM RM RM RM
Future minimum hire purchase payments: Not later than 1 year 209,016 209,016 95,352 95,352 Later than 1 year and not later than 2 years 209,016 209,016 95,352 95,352 Later than 2 years and not later than 5 years 181,591 390,607 39,605 134,957
Total future minimum hire purchase payments 599,623 808,639 230,309 325,661 Finance charges (38,774) (68,834) (11,950) (23,368)
Present value of hire purchase facilities 560,849 739,805 218,359 302,294
Analysis of present value of hire purchase liabilities: Not later than 1 year 187,710 178,956 87,792 83,935 Later than 1 year and not later than 2 years 196,464 187,710 91,649 87,792 Later than 2 years and not later than 5 years 176,675 373,139 38,918 130,567
560,849 739,805 218,359 302,294 Amount due within 12 months (187,710) (178,956) (87,792) (83,935)
Amount due after 12 months 373,139 560,849 130,567 218,359
The interest rates of hire purchase, which are fixed at agreement dates, range between 2.25% to 3.70% (2009 - 2.25% to 3.70%) per annum. The hire purchase agreements are on a fixed payment basis.
84Hua Yang Berhad
Annual Report 2010
NOTES TO THE FINANCIAL STATEMENTS - 31 MARCH 2010 (CONT’D)
27. Term loans
Group Company 2010 2009 2010 2009 RM RM RM RM
Secured: As at 1 April 39,778,105 8,383,730 3,379,011 8,383,730 Drawdown 2,994,000 38,006,000 - - Repayment (6,713,545) (6,611,625) (3,379,011) (5,004,719)
As at 31 March 36,058,560 39,778,105 - 3,379,011 Repayable within 1 year included under current liabilities (Note 32) (4,285,680) (2,517,140) - (2,160,000)
Repayable after 1 year 31,772,880 37,260,965 - 1,219,011 Comprising portions repayable: More than 1 year and less than 5 years 23,558,420 24,760,825 - 1,219,011 More than 5 years 8,214,460 12,500,140 - -
31,772,880 37,260,965 - 1,219,011
Group
The term loans are secured by:
(i) First party legal charge over a piece of freehold property development land held by the Company and a third party legal charge over a piece of freehold property development land of a subsidiary company as well as first and second legal party charges over two pieces of leasehold property development land of two subsidiary companies;
(ii) Specific debenture over the 29 shop units of completed stock units held by the Company;
(iii) Specific debenture over the projects on the land charged as securities; and
(iv) Corporate guarantee by the Company.
The term loans are repayable by 35 and 83 monthly instalments of RM305,000 and RM357,140 each commencing 1 July 2011 and 29 March 2010, with a final instalment of RM325,000 and RM357,380 respectively.
Company
The term loan was secured by:
(i) First party legal charge over a piece of freehold property development land held by the Company and a third party legal charge over a piece of freehold property development land of a subsidiary company; and
(ii) Specific debenture over the project on the land charged as security.
The term loan had been fully settled during the financial year.
85Hua Yang BerhadAnnual Report 2010
NOTES TO THE FINANCIAL STATEMENTS - 31 MARCH 2010 (CONT’D)
28. Revolving loans
Group Company 2010 2009 2010 2009 RM RM RM RM Secured: As at 1 April - - - - Drawdown 7,375,000 - 7,375,000 - Repayment (414,000) - (414,000) -
As at 31 March 6,961,000 - 6,961,000 - Repayable within 1 year included under current liabilities (Note 32) (6,961,000) - (6,961,000) -
Repayable after 1 year - - - -
Revolving loans
a) The revolving loan facility of RM2,700,000 is secured by a third party first legal charge over certain parcel of freehold property development land of a subsidiary company; and
b) The revolving loan facility of RM4,675,000 is secured by a first party charge over 31 lots of freehold property development land held by the Company.
29. Bridging loan
Group 2010 2009 RM RM Secured: As at 1 April - - Drawdown 13,000,000 - Repayment (5,178,163) -
As at 31 March 7,821,837 - Repayable within 1 year included under current liabilities (Note 32) - -
Repayable after 1 year 7,821,837 - Comprising portions repayable: More than 1 year and less than 5 years 7,821,837 -
Group
The bridging loan is secured by:
(i) Second legal party charge over one piece of leasehold property development land of a subsidiary company;
(ii) Specific debenture over the 29 shop units of completed stock units held by the Company;
(iii) Specific debenture over the projects on the land charged as securities; and
(iv) Corporate guarantee by the Company.
30. Trade payables
The normal trade credit terms granted to the Group and to the Company range from 30 to 90 days.
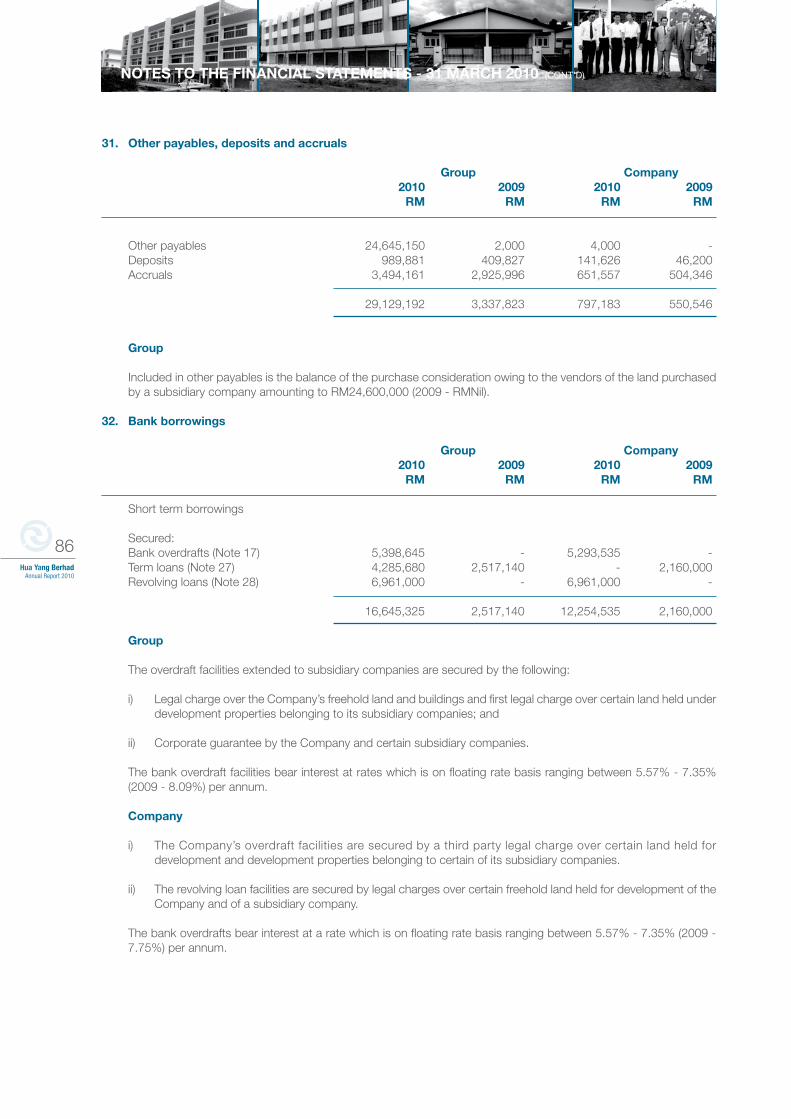
86Hua Yang Berhad
Annual Report 2010
NOTES TO THE FINANCIAL STATEMENTS - 31 MARCH 2010 (CONT’D)
31. Other payables, deposits and accruals
Group Company 2010 2009 2010 2009 RM RM RM RM Other payables 24,645,150 2,000 4,000 - Deposits 989,881 409,827 141,626 46,200 Accruals 3,494,161 2,925,996 651,557 504,346
29,129,192 3,337,823 797,183 550,546
Group
Included in other payables is the balance of the purchase consideration owing to the vendors of the land purchased by a subsidiary company amounting to RM24,600,000 (2009 - RMNil).
32. Bank borrowings
Group Company 2010 2009 2010 2009 RM RM RM RM
Short term borrowings Secured: Bank overdrafts (Note 17) 5,398,645 - 5,293,535 - Term loans (Note 27) 4,285,680 2,517,140 - 2,160,000 Revolving loans (Note 28) 6,961,000 - 6,961,000 -
16,645,325 2,517,140 12,254,535 2,160,000
Group
The overdraft facilities extended to subsidiary companies are secured by the following:
i) Legal charge over the Company’s freehold land and buildings and first legal charge over certain land held under development properties belonging to its subsidiary companies; and
ii) Corporate guarantee by the Company and certain subsidiary companies.
The bank overdraft facilities bear interest at rates which is on floating rate basis ranging between 5.57% - 7.35% (2009 - 8.09%) per annum.
Company
i) The Company’s overdraft facilities are secured by a third party legal charge over certain land held for development and development properties belonging to certain of its subsidiary companies.
ii) The revolving loan facilities are secured by legal charges over certain freehold land held for development of the Company and of a subsidiary company.
The bank overdrafts bear interest at a rate which is on floating rate basis ranging between 5.57% - 7.35% (2009 - 7.75%) per annum.
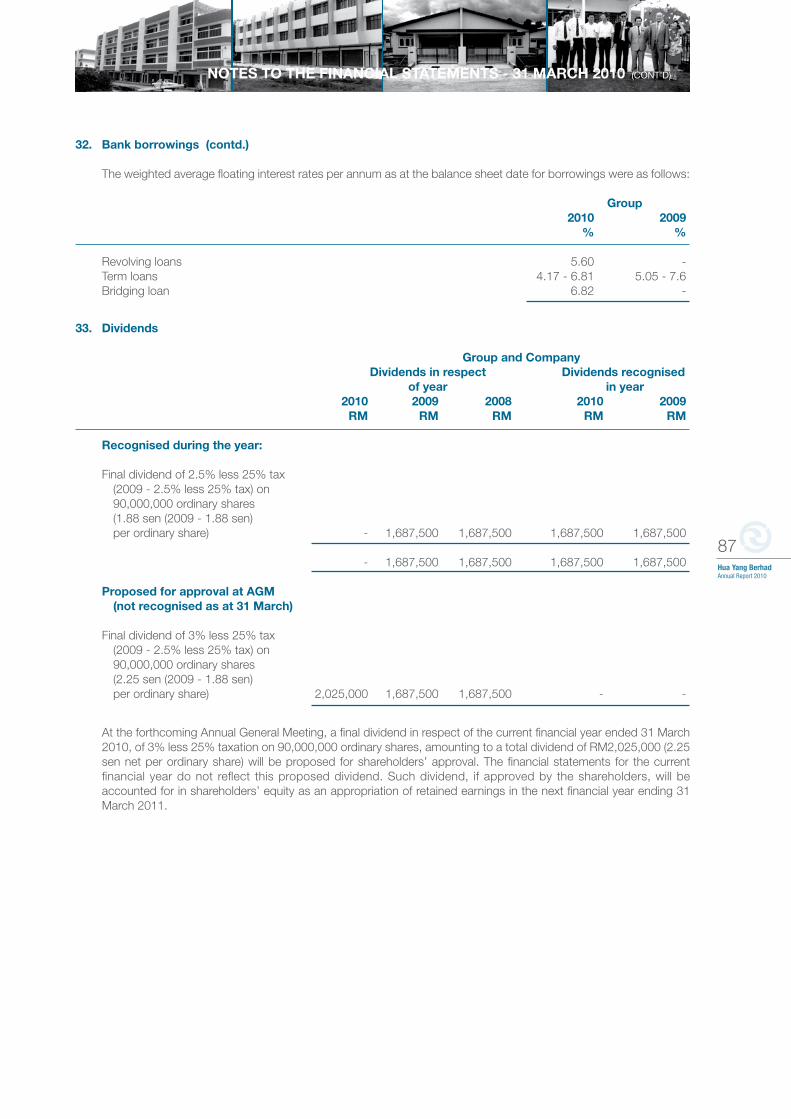
87Hua Yang BerhadAnnual Report 2010
NOTES TO THE FINANCIAL STATEMENTS - 31 MARCH 2010 (CONT’D)
32. Bank borrowings (contd.)
The weighted average floating interest rates per annum as at the balance sheet date for borrowings were as follows:
Group 2010 2009 % % Revolving loans 5.60 - Term loans 4.17 - 6.81 5.05 - 7.6 Bridging loan 6.82 -
33. Dividends Group and Company Dividends in respect Dividends recognised of year in year 2010 2009 2008 2010 2009 RM RM RM RM RM Recognised during the year: Final dividend of 2.5% less 25% tax (2009 - 2.5% less 25% tax) on 90,000,000 ordinary shares (1.88 sen (2009 - 1.88 sen) per ordinary share) - 1,687,500 1,687,500 1,687,500 1,687,500
- 1,687,500 1,687,500 1,687,500 1,687,500 Proposed for approval at AGM (not recognised as at 31 March) Final dividend of 3% less 25% tax (2009 - 2.5% less 25% tax) on 90,000,000 ordinary shares (2.25 sen (2009 - 1.88 sen) per ordinary share) 2,025,000 1,687,500 1,687,500 - -
At the forthcoming Annual General Meeting, a final dividend in respect of the current financial year ended 31 March 2010, of 3% less 25% taxation on 90,000,000 ordinary shares, amounting to a total dividend of RM2,025,000 (2.25 sen net per ordinary share) will be proposed for shareholders’ approval. The financial statements for the current financial year do not reflect this proposed dividend. Such dividend, if approved by the shareholders, will be accounted for in shareholders’ equity as an appropriation of retained earnings in the next financial year ending 31 March 2011.
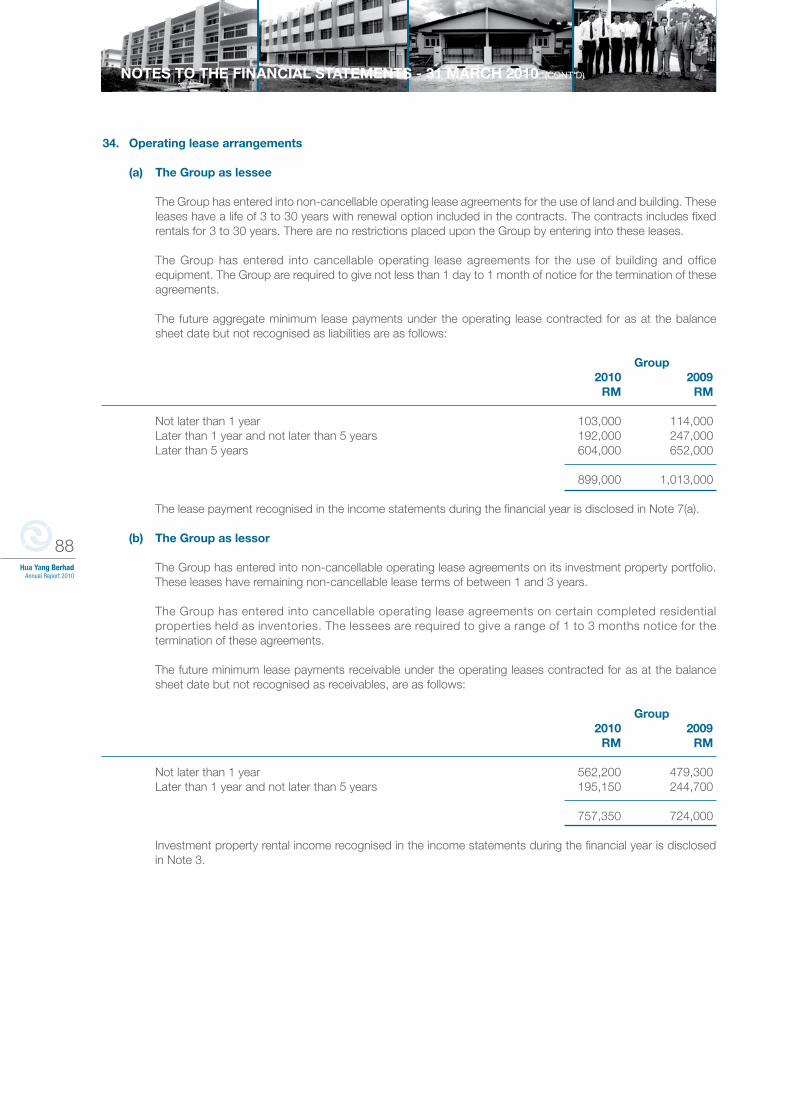
88Hua Yang Berhad
Annual Report 2010
34. Operating lease arrangements
(a) The Group as lessee
The Group has entered into non-cancellable operating lease agreements for the use of land and building. These leases have a life of 3 to 30 years with renewal option included in the contracts. The contracts includes fixed rentals for 3 to 30 years. There are no restrictions placed upon the Group by entering into these leases.
The Group has entered into cancellable operating lease agreements for the use of building and office equipment. The Group are required to give not less than 1 day to 1 month of notice for the termination of these agreements.
The future aggregate minimum lease payments under the operating lease contracted for as at the balance sheet date but not recognised as liabilities are as follows:
Group 2010 2009 RM RM
Not later than 1 year 103,000 114,000 Later than 1 year and not later than 5 years 192,000 247,000 Later than 5 years 604,000 652,000
899,000 1,013,000
The lease payment recognised in the income statements during the financial year is disclosed in Note 7(a).
(b) The Group as lessor
The Group has entered into non-cancellable operating lease agreements on its investment property portfolio. These leases have remaining non-cancellable lease terms of between 1 and 3 years.
The Group has entered into cancellable operating lease agreements on certain completed residential properties held as inventories. The lessees are required to give a range of 1 to 3 months notice for the termination of these agreements.
The future minimum lease payments receivable under the operating leases contracted for as at the balance sheet date but not recognised as receivables, are as follows:
Group 2010 2009 RM RM Not later than 1 year 562,200 479,300 Later than 1 year and not later than 5 years 195,150 244,700
757,350 724,000
Investment property rental income recognised in the income statements during the financial year is disclosed in Note 3.
NOTES TO THE FINANCIAL STATEMENTS - 31 MARCH 2010 (CONT’D)
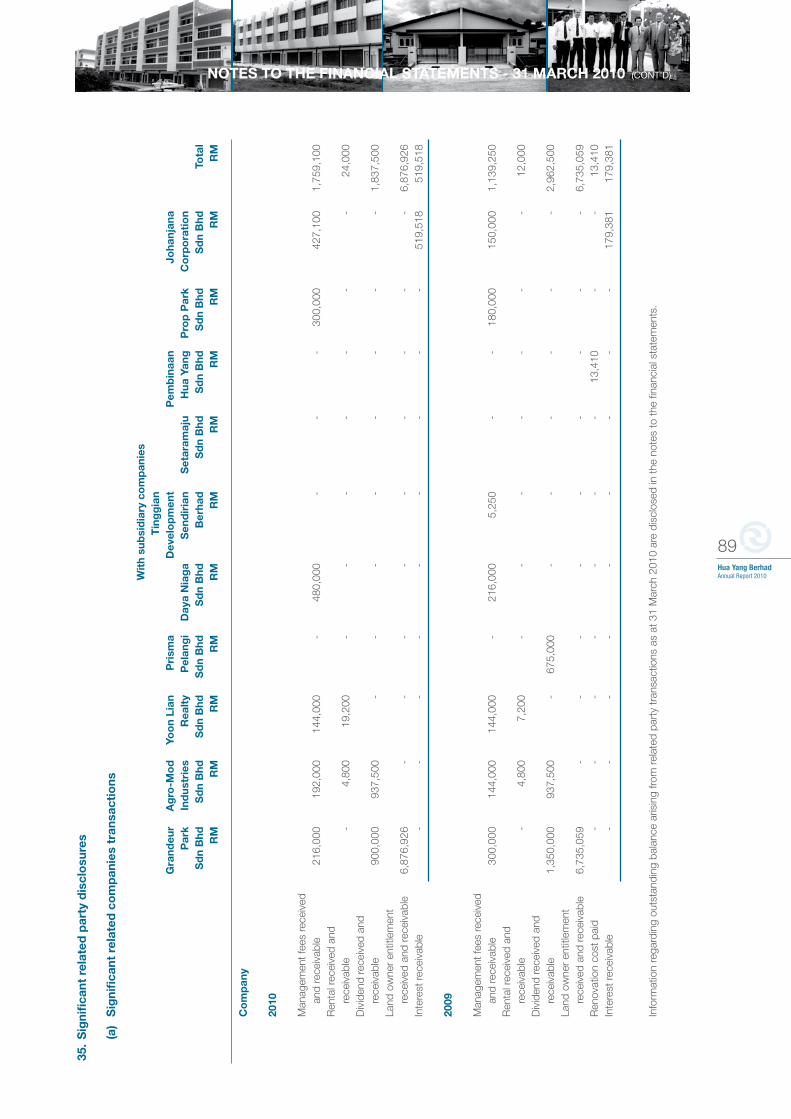
89Hua Yang BerhadAnnual Report 2010
NOTES TO THE FINANCIAL STATEMENTS - 31 MARCH 2010 (CONT’D)35
. S
igni
fica
nt r
elat
ed p
arty
dis
clo
sure
s
(a
) S
igni
fica
nt r
elat
ed c
om
pan
ies
tran
sact
ions
Wit
h su
bsi
dia
ry c
om
pan
ies
Tin
gg
ian
Gra
ndeu
r
Ag
ro-M
od
Yo
on
Lian
P
rism
a
Dev
elo
pm
ent
Pem
bin
aan
Joha
njan
a
P
ark
In
dus
trie
s
Rea
lty
P
elan
gi
Day
a N
iag
a
Sen
dir
ian
S
etar
amaj
u
Hua
Yan
g
Pro
p P
ark
C
orp
ora
tio
n
S
dn
Bhd
S
dn
Bhd
S
dn
Bhd
S
dn
Bhd
S
dn
Bhd
B
erha
d
Sd
n B
hd
Sd
n B
hd
Sd
n B
hd
Sd
n B
hd
Tota
l
R
M
RM
R
M
RM
R
M
RM
R
M
RM
R
M
RM
R
M
Co
mp
any
20
10
M
anag
emen
t fee
s re
ceiv
ed
and
rece
ivab
le
216,
000
19
2,00
0
144,
000
-
4
80,0
00
-
-
-
300
,000
42
7,10
0
1,7
59,1
00
Ren
tal r
ecei
ved
and
r e
ceiv
able
-
4,8
00
19,
200
-
-
-
-
-
-
-
24
,000
D
ivid
end
r ece
ived
and
r ece
ivab
le
9
00,0
00
937
,500
-
-
-
-
-
-
-
-
1
,837
,500
La
nd o
wne
r en
title
men
t
r ece
ived
and
rece
ivab
le
6,8
76,9
26
-
-
-
-
-
-
-
-
-
6,8
76,9
26
Inte
r est
rece
ivab
le
-
-
-
-
-
-
-
-
-
519
,518
519
,518
20
09
M
anag
emen
t fee
s r e
ceiv
ed
and
r ece
ivab
le
300
,000
14
4,00
0
144,
000
-
21
6,00
0
5,25
0
-
-
180,
000
15
0,00
0
1,1
39,2
50
Ren
tal r
ecei
ved
and
r e
ceiv
able
-
4,80
0
7,20
0
-
-
-
-
-
-
-
12,0
00
Div
iden
d r e
ceiv
ed a
nd
r e
ceiv
able
1
,350
,000
9
37,5
00
-
675,
000
-
-
-
-
-
-
2
,962
,500
La
nd o
wne
r en
title
men
t
r ece
ived
and
rece
ivab
le
6,7
35,0
59
-
-
-
-
-
-
-
-
-
6,7
35,0
59
Ren
ovat
ion
cost
pai
d -
-
-
-
-
-
-
13
,410
-
-
13
,410
In
ter e
st re
ceiv
able
-
-
-
-
-
-
-
-
-
1
79,3
81
1
79,3
81
In
form
atio
n r e
gard
ing
outs
tand
ing
bala
nce
aris
ing
from
rela
ted
part
y tr
ansa
ctio
ns a
s at
31
Mar
ch 2
010
are
disc
lose
d in
the
note
s to
the
finan
cial
sta
tem
ents
.
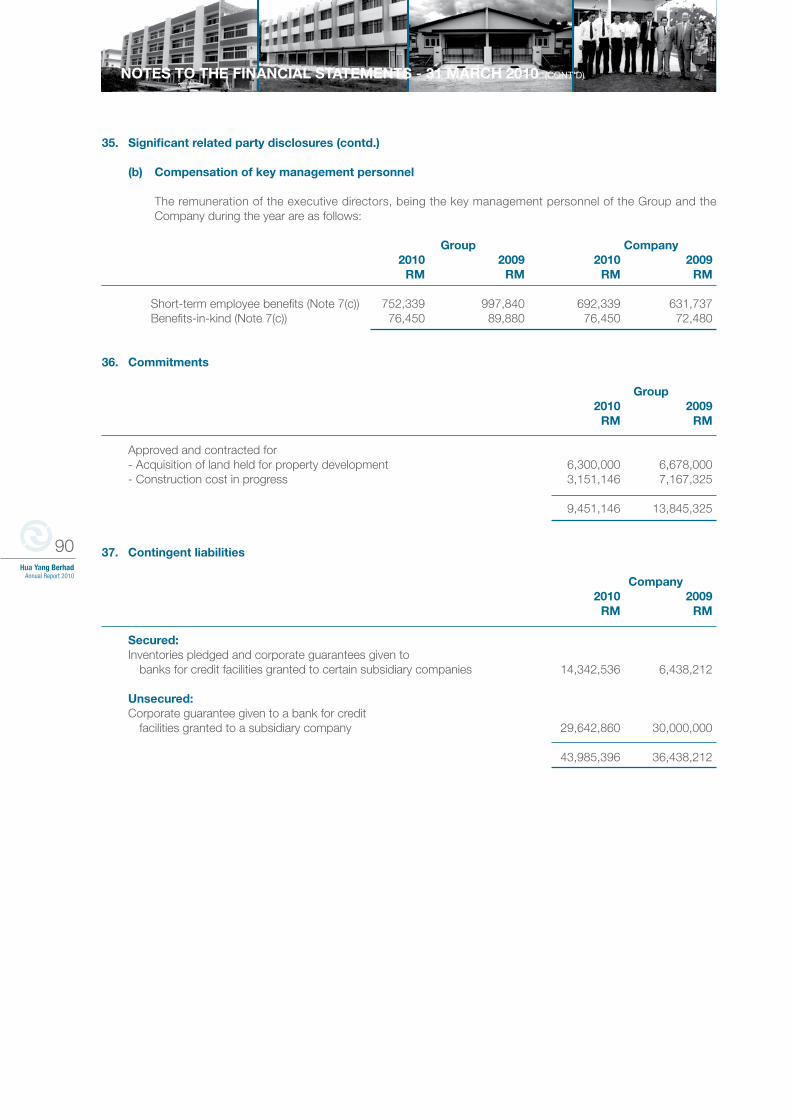
90Hua Yang Berhad
Annual Report 2010
NOTES TO THE FINANCIAL STATEMENTS - 31 MARCH 2010 (CONT’D)
35. Significant related party disclosures (contd.)
(b) Compensation of key management personnel
The remuneration of the executive directors, being the key management personnel of the Group and the Company during the year are as follows:
Group Company 2010 2009 2010 2009 RM RM RM RM Short-term employee benefits (Note 7(c)) 752,339 997,840 692,339 631,737 Benefits-in-kind (Note 7(c)) 76,450 89,880 76,450 72,480
36. Commitments
Group 2010 2009 RM RM
Approved and contracted for - Acquisition of land held for property development 6,300,000 6,678,000 - Construction cost in progress 3,151,146 7,167,325
9,451,146 13,845,325
37. Contingent liabilities
Company 2010 2009 RM RM
Secured: Inventories pledged and corporate guarantees given to banks for credit facilities granted to certain subsidiary companies 14,342,536 6,438,212 Unsecured: Corporate guarantee given to a bank for credit facilities granted to a subsidiary company 29,642,860 30,000,000
43,985,396 36,438,212
91Hua Yang BerhadAnnual Report 2010
NOTES TO THE FINANCIAL STATEMENTS - 31 MARCH 2010 (CONT’D)
38. Segment information
Segment information is not presented as the Group operates solely in Malaysia and the combined revenues, operating results and assets employed of business segments other than property development segment represents less than 10% of the Group’s revenue, operating results and assets employed respectively.
39. Financial instruments
(a) Financial risk management objectives and policies
The Group’s financial risk management policy seeks to ensure that adequate financial resources are available for the development of the Group’s businesses whilst managing its interest rate, liquidity and credit risks. The Group’s policy is not to engage in any speculative transactions.
(b) Interest rate risk
Cash flow interest rate risk is the risk that the future cash flows of a financial instrument will fluctuate because of changes in market interest rates. Fair value interest rate risk is the risk that the value of a financial instrument will fluctuate due to changes in market interest rates. As the Group has no significant interest-bearing financial assets, the Group’s income and operating cash flows are substantially independent of changes in market interest rates.
The Group’s primary interest rate risk relates to interest-bearing debt. The investment in financial assets are mainly short term in nature and they are not held for speculative purposes but have been placed in fixed deposits which yield better returns than cash at bank.
The Group manages its interest rate exposure by maintaining a prudent mix of fixed and floating rate borrowings. This strategy allows it to capitalise on cheaper funding in a low interest rate environment and achieve a certain level of protection against rate hikes.
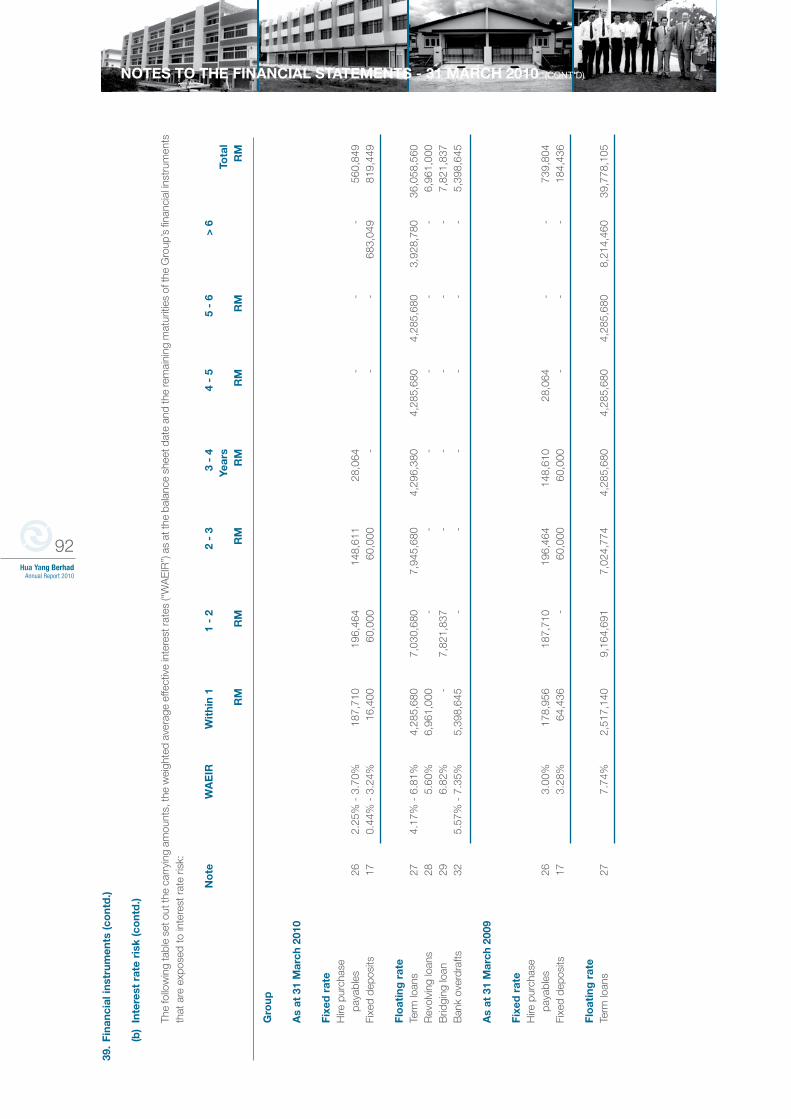
92Hua Yang Berhad
Annual Report 2010
NOTES TO THE FINANCIAL STATEMENTS - 31 MARCH 2010 (CONT’D)
39.
Fina
ncia
l ins
trum
ents
(co
ntd
.)
(b
) In
tere
st r
ate
risk
(co
ntd
.)
The
follo
win
g ta
ble
set o
ut th
e ca
rryi
ng a
mou
nts,
the
wei
ghte
d av
erag
e ef
fect
ive
inte
rest
rate
s (“
WA
EIR
”) a
s at
the
bala
nce
shee
t dat
e an
d th
e re
mai
ning
mat
uriti
es o
f the
Gro
up’s
fina
ncia
l ins
trum
ents
th
at a
re e
xpos
ed to
inte
rest
rat
e ris
k:
No
te
WA
EIR
W
ithi
n 1
1
- 2
2
- 3
3
- 4
4 -
5 5
- 6
> 6
Ye
ars
To
tal
RM
R
M
RM
R
M
RM
R
M
R
M
Gro
up
A
s at
31
Mar
ch 2
010
Fixe
d r
ate
Hire
pur
chas
e
pa
yabl
es
26
2.25
% -
3.7
0%
187,
710
19
6,46
4
148,
611
2
8,06
4
-
-
-
560
,849
Fi
xed
depo
sits
17
0.
44%
- 3
.24%
16
,400
60
,000
60
,000
-
-
-
68
3,04
9
819
,449
Fl
oat
ing
rat
e
Te
rm lo
ans
27
4.17
% -
6.8
1%
4,28
5,68
0
7,0
30,6
80
7,94
5,68
0
4,29
6,38
0
4,28
5,68
0
4,28
5,68
0
3,92
8,78
0
36,
058,
560
Rev
olvi
ng lo
ans
28
5.60
%
6,96
1,00
0
-
-
-
-
-
-
6,9
61,0
00
Brid
ging
loan
29
6.
82%
-
7,
821,
837
-
-
-
-
-
7
,821
,837
B
ank
over
draf
ts
32
5.57
% -
7.3
5%
5,3
98,6
45
-
-
-
-
-
-
5
,398
,645
As
at 3
1 M
arch
200
9
Fixe
d r
ate
Hire
pur
chas
e
pa
yabl
es
26
3.00
%
178,
956
18
7,71
0
196,
464
14
8,61
0
28,
064
-
-
7
39,8
04
Fixe
d de
posi
ts
17
3.28
%
64,4
36
-
60,0
00
60,
000
-
-
-
1
84,4
36
Flo
atin
g r
ate
Term
loan
s 27
7.
74%
2,
517,
140
9
,164
,691
7
,024
,774
4,
285,
680
4,
285,
680
4,
285,
680
8,
214,
460
3
9,77
8,10
5
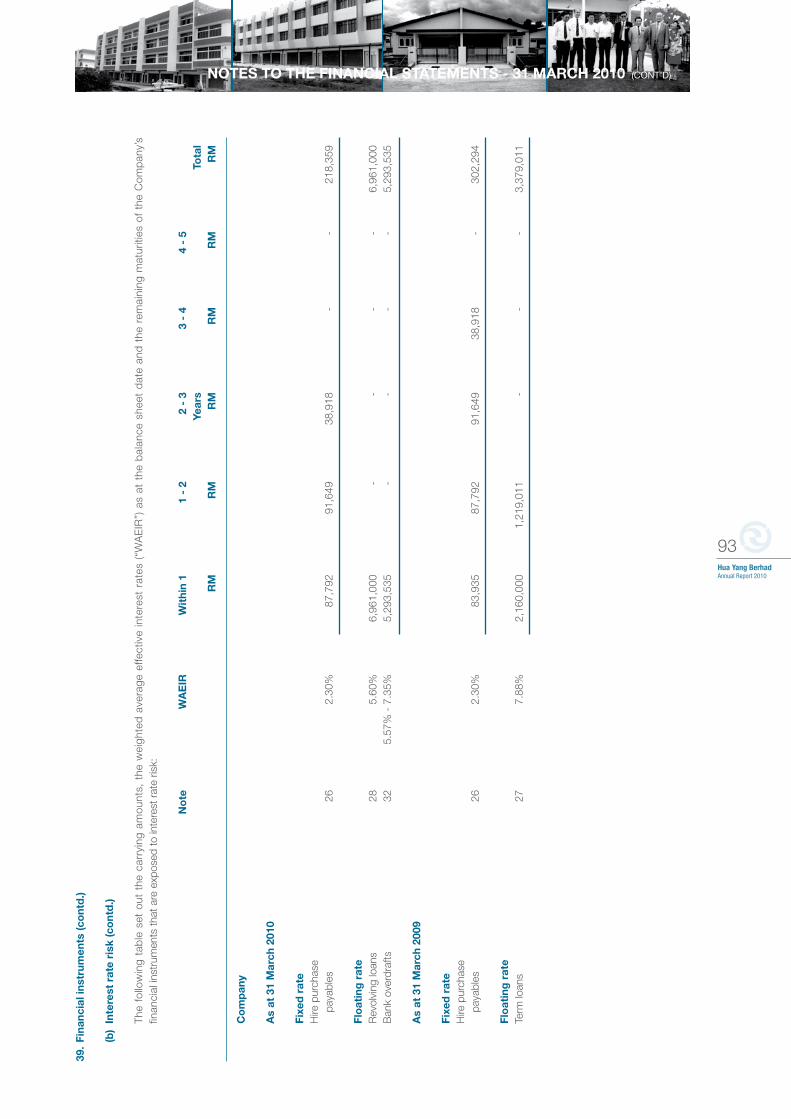
93Hua Yang BerhadAnnual Report 2010
NOTES TO THE FINANCIAL STATEMENTS - 31 MARCH 2010 (CONT’D)39
. Fi
nanc
ial i
nstr
umen
ts (c
ont
d.)
(b
) In
tere
st r
ate
risk
(co
ntd
.)
The
follo
win
g ta
ble
set
out
the
car
ryin
g am
ount
s, t
he w
eigh
ted
ave
rage
effe
ctiv
e in
tere
st r
ates
(“W
AE
IR”)
as
at t
he b
alan
ce s
heet
dat
e an
d t
he r
emai
ning
mat
uriti
es o
f th
e C
omp
any’
s
fin
anci
al in
stru
men
ts th
at a
re e
xpos
ed to
inte
rest
rat
e ris
k:
No
te
WA
EIR
W
ithi
n 1
1
- 2
2
- 3
3
- 4
4 -
5
Year
s
Tota
l
R
M
RM
R
M
RM
R
M
RM
C
om
pan
y
A
s at
31
Mar
ch 2
010
Fixe
d r
ate
Hire
pur
chas
e
pa
yabl
es
26
2.30
%
87,7
92
91,6
49
38,9
18
-
-
218,
359
Flo
atin
g r
ate
Rev
olvi
ng lo
ans
28
5.60
%
6,96
1,00
0
-
-
-
-
6
,961
,000
B
ank
over
draf
ts
32
5.57
% -
7.3
5%
5,29
3,53
5
-
-
-
-
5,29
3,53
5
A
s at
31
Mar
ch 2
009
Fixe
d r
ate
Hire
pur
chas
e
pa
yabl
es
26
2.30
%
83,9
35
87,7
92
91,6
49
38,9
18
-
302,
294
Flo
atin
g r
ate
Term
loan
s 27
7.
88%
2,
160,
000
1,
219,
011
-
-
-
3,
379,
011
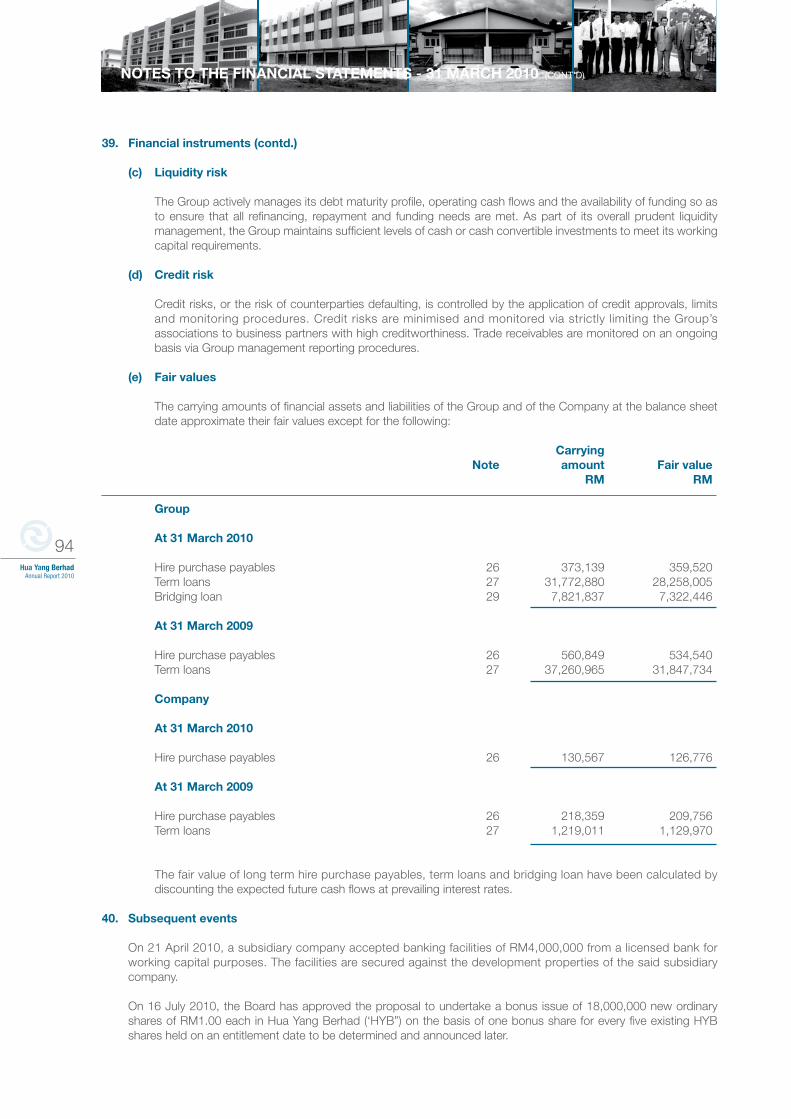
94Hua Yang Berhad
Annual Report 2010
NOTES TO THE FINANCIAL STATEMENTS - 31 MARCH 2010 (CONT’D)
39. Financial instruments (contd.)
(c) Liquidity risk
The Group actively manages its debt maturity profile, operating cash flows and the availability of funding so as to ensure that all refinancing, repayment and funding needs are met. As part of its overall prudent liquidity management, the Group maintains sufficient levels of cash or cash convertible investments to meet its working capital requirements.
(d) Credit risk
Credit risks, or the risk of counterparties defaulting, is controlled by the application of credit approvals, limits and monitoring procedures. Credit risks are minimised and monitored via strictly limiting the Group’s associations to business partners with high creditworthiness. Trade receivables are monitored on an ongoing basis via Group management reporting procedures.
(e) Fair values
The carrying amounts of financial assets and liabilities of the Group and of the Company at the balance sheet date approximate their fair values except for the following:
Carrying Note amount Fair value RM RM
Group At 31 March 2010 Hire purchase payables 26 373,139 359,520 Term loans 27 31,772,880 28,258,005 Bridging loan 29 7,821,837 7,322,446 At 31 March 2009 Hire purchase payables 26 560,849 534,540 Term loans 27 37,260,965 31,847,734 Company At 31 March 2010 Hire purchase payables 26 130,567 126,776 At 31 March 2009 Hire purchase payables 26 218,359 209,756 Term loans 27 1,219,011 1,129,970
The fair value of long term hire purchase payables, term loans and bridging loan have been calculated by discounting the expected future cash flows at prevailing interest rates.
40. Subsequent events
On 21 April 2010, a subsidiary company accepted banking facilities of RM4,000,000 from a licensed bank for working capital purposes. The facilities are secured against the development properties of the said subsidiary company.
On 16 July 2010, the Board has approved the proposal to undertake a bonus issue of 18,000,000 new ordinary shares of RM1.00 each in Hua Yang Berhad (‘HYB”) on the basis of one bonus share for every five existing HYB shares held on an entitlement date to be determined and announced later.
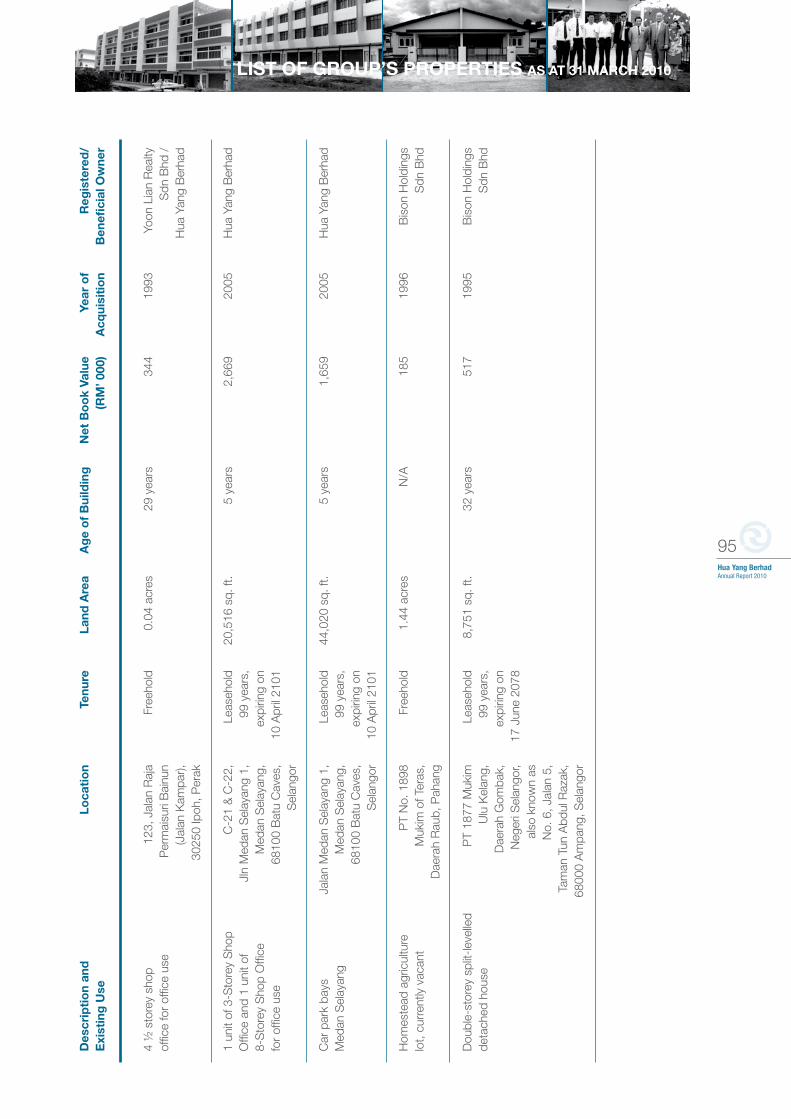
95Hua Yang BerhadAnnual Report 2010
LIS
T O
F G
RO
UP
’S P
RO
PE
RT
IES
AS
AT
31
MA
RC
H 2
010
D
escr
ipti
on
and
Lo
cati
on
Te
nure
La
nd A
rea
Ag
e o
f B
uild
ing
N
et B
oo
k Va
lue
Year
of
Reg
iste
red
/
Exi
stin
g U
se
(RM
’ 000
) A
cqui
siti
on
Ben
efici
al O
wne
r
4 ½
sto
rey
shop
12
3, J
alan
Raj
a Fr
eeho
ld
0.04
acr
es
29 y
ears
34
4 19
93
Yoon
Lia
n R
ealty
of
fice
for
offic
e us
e P
erm
aisu
ri B
ainu
n
S
dn B
hd /
(Jal
an K
ampa
r),
H
ua Y
ang
Ber
had
3025
0 Ip
oh, P
erak
1
unit
of 3
-Sto
rey
Sho
p
C-2
1 &
C-2
2,
Leas
ehol
d 20
,516
sq.
ft.
5 ye
ars
2,66
9 20
05
Hua
Yan
g B
erha
d
Offi
ce a
nd 1
uni
t of
Jln
Med
an S
elay
ang
1,
99 y
ears
,
8-S
tore
y S
hop
Offi
ce
Med
an S
elay
ang,
ex
pirin
g on
for
offic
e us
e 6
8100
Bat
u C
aves
, 10
Apr
il 21
01
S
elan
gor
Car
par
k ba
ys
Jala
n M
edan
Sel
ayan
g 1,
Le
aseh
old
44,0
20 s
q. ft
. 5
year
s 1,
659
2005
H
ua Y
ang
Ber
had
M
edan
Sel
ayan
g M
edan
Sel
ayan
g,
99 y
ears
,
68
100
Bat
u C
aves
, ex
pirin
g on
Sel
ango
r 10
Apr
il 21
01
H
omes
tead
agr
icul
ture
P
T N
o. 1
898
Free
hold
1.
44 a
cres
N
/A
185
199
6 B
ison
Hol
ding
s
lot,
curr
ently
vac
ant
Muk
im o
f Ter
as,
S
dn B
hd
D
aera
h R
aub,
Pah
ang
Dou
ble-
stor
ey s
plit-
leve
lled
P
T 18
77 M
ukim
Le
aseh
old
8,75
1 sq
. ft.
32 y
ears
51
7 1
995
Bis
on H
oldi
ngs
deta
ched
hou
se
Ulu
Kel
ang,
99
yea
rs,
Sdn
Bhd
Dae
rah
Gom
bak,
ex
pirin
g on
Neg
eri S
elan
gor,
17
Jun
e 20
78
al
so k
now
n as
No.
6, J
alan
5,
Tam
an T
un A
bdul
Raz
ak,
6800
0 A
mpa
ng, S
elan
gor
LIST OF GROUP’S PROPERTIES AS AT 31 MARCH 2010
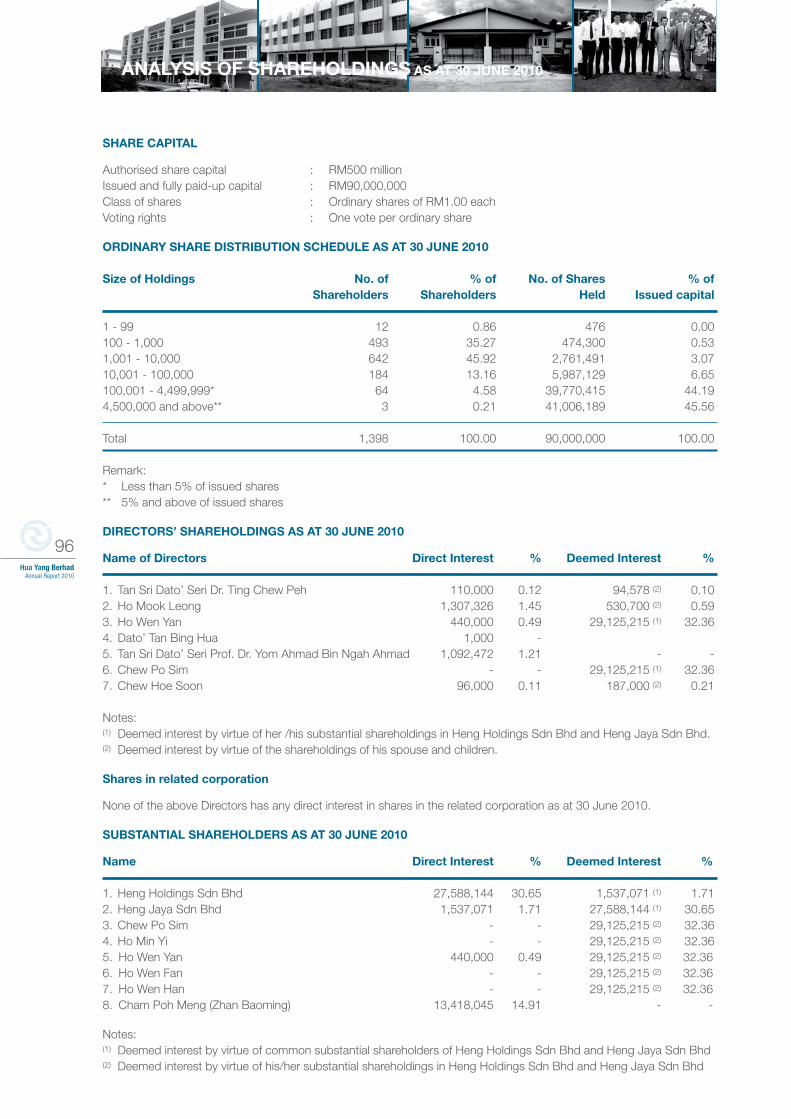
96Hua Yang Berhad
Annual Report 2010
ANALYSIS OF SHAREHOLDINGS AS AT 30 JUNE 2010
SHARE CAPITAL
Authorised share capital : RM500 millionIssued and fully paid-up capital : RM90,000,000Class of shares : Ordinary shares of RM1.00 eachVoting rights : One vote per ordinary share
ORDINARY SHARE DISTRIBUTION SCHEDULE AS AT 30 JUNE 2010
Size of Holdings No. of % of No. of Shares % of Shareholders Shareholders Held Issued capital 1 - 99 12 0.86 476 0.00100 - 1,000 493 35.27 474,300 0.531,001 - 10,000 642 45.92 2,761,491 3.0710,001 - 100,000 184 13.16 5,987,129 6.65100,001 - 4,499,999* 64 4.58 39,770,415 44.194,500,000 and above** 3 0.21 41,006,189 45.56
Total 1,398 100.00 90,000,000 100.00
Remark:* Less than 5% of issued shares** 5% and above of issued shares
DIRECTORS’ SHAREHOLDINGS AS AT 30 JUNE 2010
Name of Directors Direct Interest % Deemed Interest % 1. Tan Sri Dato’ Seri Dr. Ting Chew Peh 110,000 0.12 94,578 (2) 0.102. Ho Mook Leong 1,307,326 1.45 530,700 (2) 0.593. Ho Wen Yan 440,000 0.49 29,125,215 (1) 32.364. Dato’ Tan Bing Hua 1,000 - 5. Tan Sri Dato’ Seri Prof. Dr. Yom Ahmad Bin Ngah Ahmad 1,092,472 1.21 - -6. Chew Po Sim - - 29,125,215 (1) 32.367. Chew Hoe Soon 96,000 0.11 187,000 (2) 0.21 Notes:(1) Deemed interest by virtue of her /his substantial shareholdings in Heng Holdings Sdn Bhd and Heng Jaya Sdn Bhd. (2) Deemed interest by virtue of the shareholdings of his spouse and children.
Shares in related corporation
None of the above Directors has any direct interest in shares in the related corporation as at 30 June 2010.
SUBSTANTIAL SHAREHOLDERS AS AT 30 JUNE 2010
Name Direct Interest % Deemed Interest %
1. Heng Holdings Sdn Bhd 27,588,144 30.65 1,537,071 (1) 1.712. Heng Jaya Sdn Bhd 1,537,071 1.71 27,588,144 (1) 30.653. Chew Po Sim - - 29,125,215 (2) 32.364. Ho Min Yi - - 29,125,215 (2) 32.365. Ho Wen Yan 440,000 0.49 29,125,215 (2) 32.366. Ho Wen Fan - - 29,125,215 (2) 32.367. Ho Wen Han - - 29,125,215 (2) 32.368. Cham Poh Meng (Zhan Baoming) 13,418,045 14.91 - -
Notes:(1) Deemed interest by virtue of common substantial shareholders of Heng Holdings Sdn Bhd and Heng Jaya Sdn Bhd (2) Deemed interest by virtue of his/her substantial shareholdings in Heng Holdings Sdn Bhd and Heng Jaya Sdn Bhd
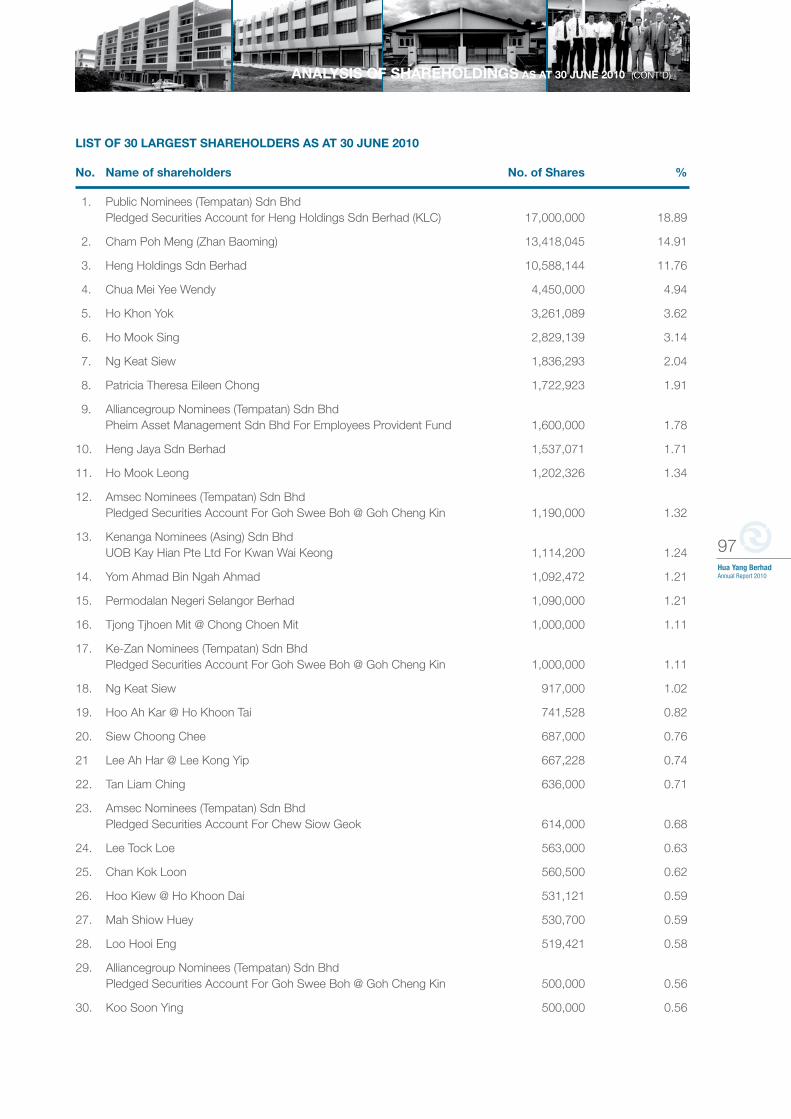
97Hua Yang BerhadAnnual Report 2010
LIST OF 30 LARGEST SHAREHOLDERS AS AT 30 JUNE 2010
No. Name of shareholders No. of Shares %
1. Public Nominees (Tempatan) Sdn Bhd Pledged Securities Account for Heng Holdings Sdn Berhad (KLC) 17,000,000 18.89
2. Cham Poh Meng (Zhan Baoming) 13,418,045 14.91
3. Heng Holdings Sdn Berhad 10,588,144 11.76
4. Chua Mei Yee Wendy 4,450,000 4.94
5. Ho Khon Yok 3,261,089 3.62
6. Ho Mook Sing 2,829,139 3.14
7. Ng Keat Siew 1,836,293 2.04
8. Patricia Theresa Eileen Chong 1,722,923 1.91
9. Alliancegroup Nominees (Tempatan) Sdn Bhd Pheim Asset Management Sdn Bhd For Employees Provident Fund 1,600,000 1.78
10. Heng Jaya Sdn Berhad 1,537,071 1.71
11. Ho Mook Leong 1,202,326 1.34
12. Amsec Nominees (Tempatan) Sdn Bhd Pledged Securities Account For Goh Swee Boh @ Goh Cheng Kin 1,190,000 1.32
13. Kenanga Nominees (Asing) Sdn Bhd UOB Kay Hian Pte Ltd For Kwan Wai Keong 1,114,200 1.24
14. Yom Ahmad Bin Ngah Ahmad 1,092,472 1.21
15. Permodalan Negeri Selangor Berhad 1,090,000 1.21
16. Tjong Tjhoen Mit @ Chong Choen Mit 1,000,000 1.11
17. Ke-Zan Nominees (Tempatan) Sdn Bhd Pledged Securities Account For Goh Swee Boh @ Goh Cheng Kin 1,000,000 1.11
18. Ng Keat Siew 917,000 1.02
19. Hoo Ah Kar @ Ho Khoon Tai 741,528 0.82
20. Siew Choong Chee 687,000 0.76
21 Lee Ah Har @ Lee Kong Yip 667,228 0.74
22. Tan Liam Ching 636,000 0.71
23. Amsec Nominees (Tempatan) Sdn Bhd Pledged Securities Account For Chew Siow Geok 614,000 0.68
24. Lee Tock Loe 563,000 0.63
25. Chan Kok Loon 560,500 0.62
26. Hoo Kiew @ Ho Khoon Dai 531,121 0.59
27. Mah Shiow Huey 530,700 0.59
28. Loo Hooi Eng 519,421 0.58
29. Alliancegroup Nominees (Tempatan) Sdn Bhd Pledged Securities Account For Goh Swee Boh @ Goh Cheng Kin 500,000 0.56
30. Koo Soon Ying 500,000 0.56
ANALYSIS OF SHAREHOLDINGS AS AT 30 JUNE 2010 (CONT’D)

THIS PAGE IS INTENTIONALLY LEFT BLANK
HUA YANG BERHAD (44094-M)
*I/We …………………………………… of …………………………………………… being a member of HUA YANG BERHAD
hereby appoint Mr/Ms ……………………………………………… of ……………………………………………………………………
or failing whom …………………………………………..… of ……………………………………………………………………………
or failing whom the Chairman of the meeting as *my/*our proxies to vote for *me/*us and on *my/*our behalf at the Thirty-First
Annual General Meeting of the Company to be held at the Head Office of the Company at 4th Floor, C-21 Jalan Medan Selayang
1, Medan Selayang, 68100 Batu Caves, Selangor on Thursday, 19 August 2010 at 10.30 a.m. and at any adjournment thereof.
*My/*Our proxy(ies) is / are to vote as indicated below:-
Resolutions For Against
Resolution 1 To approve the payment of a first and final dividend of 3.0% per Ordinary Share of RM1.00 each less 25% income tax
Resolution 2 To approve the payment of Directors’ fees of RM158,000
Resolution 3 To re-elect Mr Ho Mook Leong as Director
Resolution 4 To re-elect Mr Ho Wen Yan as Director
Resolution 5 To re-appoint Messrs Ernst & Young as the Auditors of the Company for the ensuing year
Resolution 6 To approve the Proposed Renewal of Share Buy-back Authority
Resolution 7 To approve the authority to issue shares pursuant to Section 132D of the Companies’ Act, 1965
Resolution 8 To approve the amendment to Articles of Association
[Please indicate with (X) how you wish your vote to be casted. If no specific direction as to voting is given, the proxy will vote or abstain at his discretion].
PROXY FORM
NOTES:
1. A member entitled to attend and vote at the Annual General Meeting is entitled to appoint a proxy/proxies who may but need not be a member/members of the Company to attend and vote in his/her stead and the provision of Section 149(1)(b) of the Companies Act, 1965 shall not apply to the Company.
2. When a member appoints two (2) or more proxies, the appointments shall be invalid unless he/she specifies the proportions of his/her holdings to be represented by each proxy.
3. The instrument appointing a proxy shall be in writing under the hand of the appointor or his/her attorney duly authorised in writing or, if the appointor is a corporation, either under the corporation’s seal or under the hand of an officer or attorney duly authorised.
4. The instrument appointing a proxy must be deposited at the Registered Office of the Company at 123A, Jalan Raja Permaisuri Bainun (Jalan Kampar), 30250 Ipoh, Perak Darul Ridzuan at least forty-eight (48) hours before the time appointed for the Meeting or any adjournment thereof.
…………………………………………….......…[Signature(s) / Common Seal of Shareholder(s)]
[*Delete if not applicable]
Dated this ……….day of ………………….2010
NUMBER OF SHARES HELD
AFFIXSTAMPHERE
HUA YANG BERHAD(44094-M)
123A, Jalan Raja Permaisuri Bainun(Jalan Kampar), 30250 Ipoh
Perak Darul Ridzuan
Please fold here
Please fold here