bandwidth study on energy use and potential energy saving … · 2017-12-11 · cement...
TRANSCRIPT

Bandwidth Study on Energy Use anO
d Potential Energy Savings pportunities in U.S. Cement
Manufacturing
September 2017


(This page intentionally left blank)
Preface i
Preface Reducing energy consumption through investment in advanced technologies and practices can enhance American manufacturing competitiveness. Energy bandwidth studies of U.S. manufacturing sectors serve as general data references to help understand the range (or bandwidth) of potential energy savings opportunities.1 The U.S. Department of Energy (DOE)’s Advanced Manufacturing Office (AMO) has commissioned a series of bandwidth studies to analyze the processes and products that consume the most energy, and provide hypothetical, technology-based estimates of potential energy savings opportunities. The consistent methodology used in the bandwidth studies provides a framework to evaluate and compare energy savings potentials within and across manufacturing sectors at the macro-scale.
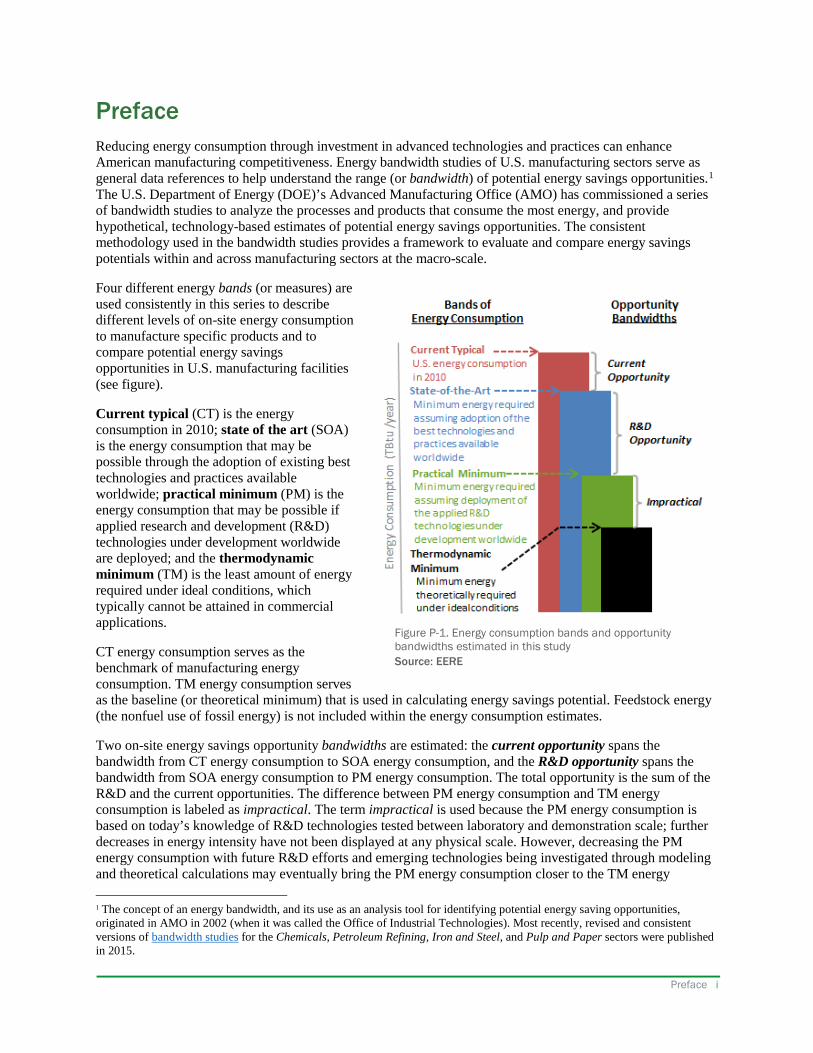
Four different energy bands (or measures) are used consistently in this series to describe different levels of on-site energy consumption to manufacture specific products and to compare potential energy savings opportunities in U.S. manufacturing facilities (see figure).
Current typical (CT) is the energy consumption in 2010; state of the art (SOA) is the energy consumption that may be possible through the adoption of existing best technologies and practices available worldwide; practical minimum (PM) is the energy consumption that may be possible if applied research and development (R&D) technologies under development worldwide are deployed; and the thermodynamic minimum (TM) is the least amount of energy required under ideal conditions, which typically cannot be attained in commercial applications.
CT energy consumption serves as the benchmark of manufacturing energy consumption. TM energy consumption serves as the baseline (or theoretical minimum) that is used in calculating energy savings potential. Feedstock energy (the nonfuel use of fossil energy) is not included within the energy consumption estimates.
Two on-site energy savings opportunity bandwidths are estimated: the current opportunity spans the bandwidth from CT energy consumption to SOA energy consumption, and the R&D opportunity spans the bandwidth from SOA energy consumption to PM energy consumption. The total opportunity is the sum of the R&D and the current opportunities. The difference between PM energy consumption and TM energy consumption is labeled as impractical. The term impractical is used because the PM energy consumption is based on today’s knowledge of R&D technologies tested between laboratory and demonstration scale; further decreases in energy intensity have not been displayed at any physical scale. However, decreasing the PM energy consumption with future R&D efforts and emerging technologies being investigated through modeling and theoretical calculations may eventually bring the PM energy consumption closer to the TM energy 1 The concept of an energy bandwidth, and its use as an analysis tool for identifying potential energy saving opportunities, originated in AMO in 2002 (when it was called the Office of Industrial Technologies). Most recently, revised and consistent versions of bandwidth studies for the Chemicals, Petroleum Refining, Iron and Steel, and Pulp and Paper sectors were published in 2015.
Figure P-1. Energy consumption bands and opportunity bandwidths estimated in this study Source: EERE

BANDWIDTH STUDY ON ENERGY USE AND POTENTIAL ENERGY SAVING OPPORTUNITIES IN THE MANUFACTURING OF CEMENT
ii Preface
consumption. Significant investment in technology development and implementation would be needed to fully realize the energy savings opportunities estimated. The costs associated with achieving SOA and PM energy consumption are not considered in this report; a techno-economic analysis of the costs and benefits of future R&D technologies was not in the scope of this study.
In each sector studied in the series, the four energy bands are estimated for select individual products or processes, sub-processes, and sector-wide. The estimation method involved a detailed review and analytical synthesis of data from diverse industry, governmental, and academic sources. Where published data were unavailable, best engineering judgment was used.

Acknowledgments iii
Acknowledgments Joseph Cresko of DOE/AMO led the conceptual development and publication of the bandwidth study series with support from Dr. Alberta Carpenter of the National Renewable Energy Laboratory. AMO recognizes the efforts of Harrison Schwartz, Nicholas Ward, Dr. Benjamin Levie, Brad Chadwell, and Sabine Brueske of Energetics Incorporated for conducting the research and analysis and writing this study.
In addition, AMO wishes to acknowledge the contributions of the following for their work reviewing this study: Hongyou Lu of Lawrence Berkeley National Laboratory, Dr. Dustin McIntyre of National Energy Technology Laboratory, Dr. Edward Garboczi of National Institute of Standards and Technology, and Ellis Gartner of Imperial College London.

BANDWIDTH STUDY ON ENERGY USE AND POTENTIAL ENERGY SAVING OPPORTUNITIES IN THE MANUFACTURING OF CEMENT
iv Acknowledgments
(This page intentionally left blank)

List of Acronyms and Abbreviations v
List of Acronyms and Abbreviations AMO Advanced Manufacturing Office Btu British thermal unit C2F Dicalcium ferrite (chemical formula 2CaO•Fe2O3) C2S Dicalcium silicate (chemical formula 2CaO•SiO2) C3S Tricalcium silicate (chemical formula 3CaO•SiO2) CA Calcium aluminate (chemical formula CaO•Al2O3) cp Heat capacity CSI Cement Sustainability Initiative CT Current typical energy consumption or energy intensity DOE U.S. Department of Energy ECRA European Cement Research Academy EERE DOE Office of Energy Efficiency and Renewable Energy EIA U.S. Energy Information Administration EPA U.S. Environmental Protection Agency G Gibbs free energy GJ Gigajoule H Enthalpy IFC International Finance Corporation IIP Institute for Industrial Productivity kg Kilogram kJ Kilojoule kWh Kilowatt-hour lb Pound LBNL Lawrence Berkeley National Laboratory MECS Manufacturing Energy Consumption Survey MJ Megajoule MMBtu Million British thermal units mol Mole NAICS North American Industry Classification System NREL National Renewable Energy Laboratory PG&E Pacific Gas & Electric PFD Process flow diagram PM Practical minimum energy consumption or energy intensity R&D Research and development SOA State of the art energy consumption or energy intensity T Temperature TBtu Trillion British thermal units TM Thermodynamic minimum energy consumption or energy intensity USCB U.S. Census Bureau USGS U.S. Geological Survey VFD Variable frequency drive

BANDWIDTH STUDY ON ENERGY USE AND POTENTIAL ENERGY SAVING OPPORTUNITIES IN U.S.CEMENT MANUFACTURING
vi List of Acronyms and Abbreviations
(This page intentionally left blank)

Executive Summary vii
Executive Summary This bandwidth study examines energy consumption and potential energy savings opportunities in U.S. cement manufacturing (North American Industry Classification System (NAICS) code 327310). Industrial, government, and academic data are used to estimate the energy consumed in the cement manufacturing process. To give a more detailed look at energy consumption within cement manufacturing, four sub-processes are explored throughout this report—crushing/grinding, pyroprocessing with cooling, finish grinding, and storage. These sub-processes are not part of NAICS coverage of the industry and are included purely to give a more detailed reporting of cement manufacturing process. Three different energy consumption bands (or levels) are estimated for these select manufacturing sub-processes based on referenced energy intensities of current, state of the art, and R&D technologies. A fourth thermodynamic minimum energy consumption band is also estimated. The bandwidth—the difference between bands of energy consumption—is used to determine the potential energy savings opportunity. The costs associated with realizing these energy savings was not in the scope of this study.
The purpose of this data analysis is to provide macro-scale estimates of energy savings opportunities for cement manufacturing sub-processes and sector-wide. This is a step toward understanding the processes that could most benefit from technology and efficiency improvements to realize energy savings.
Study Organization and Approach: The present document is organized as described below. The organization reflects the study approach.
• Chapter 1 provides an overview of the methodology and boundaries. • Chapter 2 provides a sector overview and identifies 2010 production volumes. • Chapter 3 estimates current typical (CT) energy consumption for four select sub-processes and sector
wide. • Chapter 4 estimates the minimum energy consumption for these sub-processes and sector wide. In
developing these estimates, the study assumes the state of the art (SOA), i.e., adoption of best technologies and practices available worldwide.
• Chapter 5 estimates the practical minimum (PM) energy consumption for these sub-processes and sector wide, assuming the deployment of the applied research and development (R&D) technologies available worldwide.
• Chapter 6 estimates the thermodynamic minimum (TM), i.e., the minimum amount of energy theoretically required for these processes assuming ideal conditions. In some cases, exothermic processes result in this estimate being less than zero.
• Chapter 7 provides the estimated energy savings opportunity bandwidths, i.e., the differences between the energy consumption bands (CT, SOA, PM, TM).
The U.S. Energy Information Administration’s (EIA) Manufacturing Energy Consumption Survey (MECS) provides sector-wide estimates of energy consumption for U.S. cement manufacturing; this data is referenced as sector-wide CT energy consumption. In this study, CT, SOA, PM, and TM energy consumption for individual sub-processes is estimated from multiple referenced sources; this data was then extrapolated based on the 97% coverage to estimate total subsector SOA, PM, and TM energy consumption. To estimate SOA, PM, and TM energy consumption for the cement sub-processes, available sources were reviewed to estimate the energy consumption data of the most energy intensive steps in each sub-process; data for the processes studied in the four sub-processes were extrapolated to estimate total sector SOA, PM, and TM energy consumption. The sub-process energy consumption values were summed to determine sector-wide SOA, PM, and TM energy consumption.
Study Results: Two energy savings opportunity bandwidths—current opportunity and R&D opportunity—are presented in Table ES-1 and Figure ES-1 for cement manufacturing [data calculated using methods and sources identified in this document].2 The current opportunity is the difference between the 2010 CT energy
2 The energy estimates presented in this study are for macro-scale consideration; energy intensities and energy consumption values do not represent energy use in any specific facility or any particular region in the United States. The costs associated with achieving energy savings are not considered in this study.

BANDWIDTH STUDY ON ENERGY USE AND POTENTIAL ENERGY SAVING OPPORTUNITIES IN U.S.CEMENT MANUFACTURING
viii Executive Summary
consumption and SOA energy consumption; the R&D opportunity is the difference between SOA energy consumption and PM energy consumption. Potential energy savings opportunities are presented for the processes studied in the four sub-processes and for the entire cement manufacturing sector based on extrapolated data. The energy savings opportunities presented reflect the estimated production of cement for selected application areas in baseline year 2010. Therefore, it is important to note that the total energy opportunities would scale with increasing or decreasing production levels.
All estimates are for on-site energy use (i.e., energy consumed within the plant boundary). Energy used as feedstocks (non-fuel inputs) to production is excluded. 3 Current opportunity = CT – SOA, as shown in Section 4.2. 4 Current opportunity savings percentage = �𝐶𝐶𝐶𝐶−𝑆𝑆𝑆𝑆𝑆𝑆
𝐶𝐶𝐶𝐶−𝐶𝐶𝑇𝑇�𝑥𝑥100, as shown in Section 4.2.
5 R&D opportunity = SOA – PM, as shown in Section 5.2. 6 R&D opportunity savings percentage = �𝑆𝑆𝑆𝑆𝑆𝑆−𝑃𝑃𝑇𝑇
𝐶𝐶𝐶𝐶−𝐶𝐶𝑇𝑇�𝑥𝑥100, as shown in Section 5.2.
Table ES-1. Potential Energy Savings Opportunities in the U.S. Cement Manufacturing Sector2
Opportunity Bandwidths
Estimated Energy Savings Opportunity for Processes Studied in Four Cement Sub-processes Studied
(per year)
Estimated Energy Savings Opportunity for total Cement
Manufacturing Sector Based on Extrapolated Data
(per year)
Current Opportunity: on-site energy savings if the best technologies and
practices available are used to upgrade production
59.9 TBtu 3
(34% energy savings, where TM is the baseline)4
61.8 TBtu 3
(34% energy savings, where TM is the baseline)4
R&D Opportunity: additional on-site energy savings if applied R&D
technologies under development worldwide are successfully deployed
6.4 TBtu 5 (4% energy savings,
where TM is the baseline)6
6.6 TBtu 5 (4% energy savings,
where TM is the baseline)6
Executive Summary ix
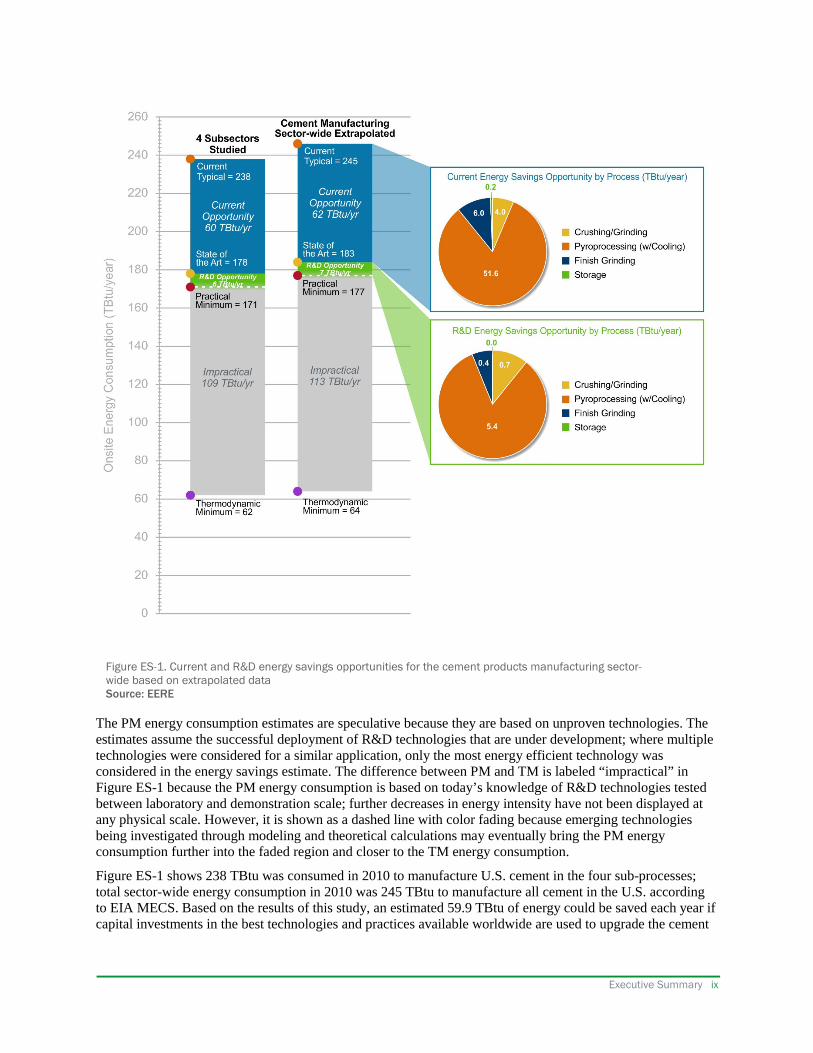
The PM energy consumption estimates are speculative because they are based on unproven technologies. The estimates assume the successful deployment of R&D technologies that are under development; where multiple technologies were considered for a similar application, only the most energy efficient technology was considered in the energy savings estimate. The difference between PM and TM is labeled “impractical” in Figure ES-1 because the PM energy consumption is based on today’s knowledge of R&D technologies tested between laboratory and demonstration scale; further decreases in energy intensity have not been displayed at any physical scale. However, it is shown as a dashed line with color fading because emerging technologies being investigated through modeling and theoretical calculations may eventually bring the PM energy consumption further into the faded region and closer to the TM energy consumption.
Figure ES-1 shows 238 TBtu was consumed in 2010 to manufacture U.S. cement in the four sub-processes; total sector-wide energy consumption in 2010 was 245 TBtu to manufacture all cement in the U.S. according to EIA MECS. Based on the results of this study, an estimated 59.9 TBtu of energy could be saved each year if capital investments in the best technologies and practices available worldwide are used to upgrade the cement
Figure ES-1. Current and R&D energy savings opportunities for the cement products manufacturing sector-wide based on extrapolated data Source: EERE

BANDWIDTH STUDY ON ENERGY USE AND POTENTIAL ENERGY SAVING OPPORTUNITIES IN U.S.CEMENT MANUFACTURING
x Executive Summary
manufacturing sub-processes studied; an additional 6.4 TBtu could be saved through the adoption of applied R&D technologies under development worldwide. These values are not based on extrapolated numbers.
The current energy savings opportunities for the cement sector sub-processes are as follows:
• Pyroprocessing with Cooling – 50.0 TBtu (or 83% of the current opportunity) • Finish Grinding – 5.8 TBtu (or 10% of the current opportunity) • Crushing/Grinding – 3.9 TBtu (or 7% of the current opportunity) • Storage – 0.2 TBtu (or 0% of the current opportunity).
The R&D energy savings opportunities for the cement sector sub-processes are as follows:
• Pyroprocessing with Cooling – 5.2 TBtu (or 82% of the R&D opportunity) • Crushing/Grinding – 0.7 TBtu (or 11% of the R&D opportunity) • Finish Grinding – 0.4 TBtu (or 7% of the R&D opportunity) • Storage – 0.0 TBtu (or 0% of the R&D opportunity).
DOE researchers will continue to evaluate the energy consumption and opportunity bandwidths in the U.S. cement manufacturing sector, along with bandwidth study results from other manufacturing sectors.

Table of Contents xi
Table of Contents Preface ................................................................................................................................................................... i Acknowledgments ............................................................................................................................................... iii List of Acronyms and Abbreviations .................................................................................................................... v Executive Summary ............................................................................................................................................ vii Table of Contents ................................................................................................................................................. xi List of Figures ..................................................................................................................................................... xii List of Tables ...................................................................................................................................................... xii 1. Introduction .................................................................................................................................................. 1
1.1. Overview .............................................................................................................................................. 1 1.2. Comparison to Other Bandwidth Studies ............................................................................................. 1 1.3. Definitions of Energy Consumption Bands and Opportunity Bandwidths .......................................... 2 1.4. Bandwidth Analysis Method ................................................................................................................ 3 1.5. Boundaries of the Study ....................................................................................................................... 5
1.5.1. Portland Cement Manufacturing .................................................................................................. 5 2. U.S. Cement Manufacturing Sector Production ........................................................................................... 6
2.1. Manufacturing Economic Overview .................................................................................................... 6 2.2. U.S. Cement Manufacturing Scope Overview ..................................................................................... 6 2.3. Production Values ................................................................................................................................ 9
3. Current Typical Energy Intensity and Energy Consumption for U.S. Cement Manufacturing .................. 12 3.1. Sources for Current Typical Energy Intensity .................................................................................... 12 3.2. Current Typical Energy Consumption by Sub-process and Sector-wide ........................................... 13
4. State of the Art Energy Intensity and Energy Consumption for U.S. Cement Manufacturing ................... 15 4.1. Sources for State of the Art Energy Intensity..................................................................................... 15 4.2. State of the Art Energy Consumption by Sub-process and Sector-wide ............................................ 16
5. Practical Minimum Energy Intensity and Energy Consumption for U.S. Cement Product Manufacturing18 5.1. Sources for Practical Minimum Energy Intensity .............................................................................. 18 5.2. Practical Minimum Energy Consumption by Sub-process and Sector-wide ..................................... 19
6. Thermodynamic Minimum Energy Intensity and Energy Consumption for U.S. Cement Manufacturing 23 6.1. Thermodynamic Minimum Energy Intensity ..................................................................................... 23 6.2. Calculated Thermodynamic Minimum Energy Intensity for Individual Cement Sub-processes ....... 23 6.3. Thermodynamic Minimum Energy Consumption by Sub-process and Sector-wide ......................... 25
7. U.S. Cement Manufacturing Current and R&D Opportunity Analysis/Bandwith Summary ..................... 26 8. References .................................................................................................................................................. 29 Appendix A1: Master Cement Manufacturing Summary Table ......................................................................... 31 Appendix A2: References for Production, CT, SOA, PM, and TM ................................................................... 33 Appendix A3: Practical Minimum Energy Intensity Calculation and Example Technologies Considered ........ 34 Appendix A4: Thermodynamic Minimum Calculation Details .......................................................................... 55

BANDWIDTH STUDY ON ENERGY USE AND POTENTIAL ENERGY SAVING OPPORTUNITIES IN U.S.CEMENT MANUFACTURING
xii Table of Contents
List of Figures Figure P-1. Energy consumption bands and opportunity bandwidths estimated in this study ............................... i Figure ES-1. Current and R&D energy savings opportunities for the cement products manufacturing sector-wide based on extrapolated data ............................................................................................................... ix Figure 1-1. Energy consumption bands and opportunity bandwidths estimated in this study .............................. 2 Figure 2-1. Process flow diagram (PFD) of the overall boundaries in the cement manufacturing process considered for this report. ..................................................................................................................................... 7 Figure 7-1. Current and R&D energy savings opportunities in U.S. cement products manufacturing sector-wide based on extrapolated data .............................................................................................................. 28
List of Tables Table ES-1. Potential Energy Savings Opportunities in the U.S. Cement Manufacturing Sector2 .................... viii Table 2-1. Cement Manufacturing Process Areas Considered in Bandwidth Analysis Based on Available Data ....................................................................................................................................................................... 8 Table 2-1. U.S. Cement Manufacturing Energy Consumption Sector-Wide, 2010 ............................................ 10 Table 2-2. U.S. Cement 2010 Production for Each Sub-process Studied ........................................................... 10 Table 3-1. Main Sources Referenced in Identifying Current Typical Energy Intensity by Sub-process and Material Total ..................................................................................................................................................... 12 Table 3-2. On-site Current Typical Energy Intensity and Consumption and Primary Energy Consumption for U.S. Cement Manufacturing Processes Studied and Sector-wide in 2010, with Percent of Sector Coverage .... 14 Table 4-1. Main Sources Referenced in Identifying State of the Art Intensity by Sub-process and Material Total .................................................................................................................................................................... 15 Table 4-2. On-site State of the Art Energy Intensities and Calculated Energy Consumption for Cement Manufacturing Processes in Four Sub-processes Studied ................................................................................... 16 Table 4-3. On-site State of the Art Energy Consumption, Energy Savings, and Energy Savings Percent for Cement Manufacturing in Sub-processes Studied and Sector-Wide .................................................................. 17 Table 5-1. Sources Referenced in Identifying Practical Minimum Energy Intensity by Sub-process and Material Total ..................................................................................................................................................... 19 Table 5-2. On-site Practical Minimum Energy Consumption for Cement Manufacturing Processes in Four Sub-processes Studied ................................................................................................................................................ 20 Table 5-3. On-site Practical Minimum Energy Consumption, Energy Savings, and Energy Savings Percent for Cement Manufacturing in Sub-processes Studied and Sector-Wide .................................................................. 20 Table 5-4. On-site Practical Minimum Energy Consumption and R&D Opportunity Energy Savings for Cement Manufacturing Processes in Four Sub-processes Studied ..................................................................... 22 Table 6-1. Calculated Thermodynamic Minimum Energy Intensities for Cement ............................................. 24 Table 6-2. On-site Thermodynamic Minimum Energy Consumption for Cement Manufacturing in Sub-processes Studied and Sector-Wide .................................................................................................................... 25 Table 7-1. Current and R&D Opportunity for Cement Manufacturing .............................................................. 26 Table A3-1. Calculated PM Energy Consumption for Cement Manufacturing .................................................. 34 Table A3-2. Details of Cement Practical Minimum Technologies Considered .................................................. 35 Table A4-1. Calculated Enthalpy and Gibbs Free Energy Changes for Clinker Production Reactions ............. 56

Table of Contents xiii
(This page intentionally left blank)


Introduction 1
1. Introduction
1.1. Overview
This bandwidth study examines energy consumption and potential energy savings opportunities in the U.S. cement manufacturing sector, as defined by classification 327310 of the North American Industry Classification System (NAICS). The purpose of this data analysis is to provide macro-scale estimates of energy savings opportunities for cement manufacturing sector-wide. In this study, four different energy consumption bands (or measures) are estimated. The bandwidth—the difference between bands of energy consumption—is the estimated potential energy savings opportunity.
There are many types of cement manufactured in the United States. The most prevalent type of cement, Portland cement, accounted for approximately 98% of 2010 U.S. production (146 billion pounds U.S. total). Since Portland cement is the primary product of cement manufacturing, the focus of this report is the four most energy-intensive sub-processes of Portland cement manufacture. Together, these sub-processes accounted for 97% of on-site energy consumption by the entire U.S. cement manufacturing sector in 2010.
The four bands of energy consumption estimated in this report include: the on-site energy consumption associated with manufacturing processes in four sub-processes in 2010; two energy consumption levels with progressively more advanced technologies and practices (state of the art and practical minimum); and one energy consumption level based on the minimum amount of energy needed to theoretically complete a manufacturing process (thermodynamic minimum). The bands of energy consumption are used to calculate current and R&D opportunity bandwidths for energy savings.
1.2. Comparison to Other Bandwidth
Studies This is the first DOE energy bandwidth study prepared specifically for the cement sector. Similar energy bandwidth studies (see inset) were prepared in 2015 for four other U.S. manufacturing sectors: chemicals, iron and steel, petroleum refining, and pulp and paper. Additional bandwidth studies were subsequently prepared to characterize energy use in manufacturing six lightweight structural materials in the United States: aluminum, magnesium, titanium, advanced high strength steel, carbon fiber reinforced polymer composites, and glass fiber reinforced composites. This report is one of a more recently commissioned set of bandwidth studies that also includes plastics and rubber products, food and beverage products, and glass products (DOE 2017).
The energy bandwidth studies completed in 2015 and later all follow the same analysis methodology and presentation format. Collectively, these studies explore the potential energy savings opportunities in
History of DOE Advanced Manufacturing Office Energy Bandwidth Reports
Before 2013, the U.S. Department of Energy (DOE)’s Advanced Manufacturing Office predecessor conducted industrial sector analyses to quantify savings opportunities. Here is a timeline of accomplishments. • 2013: Developed and refined a consistent
methodology for bandwidth studies so comparisons could be made across the manufacturing sectors.
• 2015: Published revised reports for four U.S. manufacturing sectors—chemicals, iron and steel, petroleum refining, and pulp and paper.
• 2016: Published six additional bandwidth studies on the energy use in manufacturing lightweight structural materials (aluminum, magnesium, titanium, advanced high strength steel, carbon fiber reinforced polymer composites, and glass fiber reinforced composites) in the United States, following the same analysis methodology and presentation format.
• 2017: Prepared bandwidth studies (including this report) for four additional U.S. manufacturing sectors: cement, food and beverage products, glass, and plastics and rubber products.
All of these reports are available on the AMO website (DOE 2017).

BANDWIDTH STUDY ON ENERGY USE AND POTENTIAL ENERGY SAVING OPPORTUNITIES IN THE MANUFACTURING OF CEMENT
2 Introduction
manufacturing that are available through existing technology and investment in research and development (R&D) technologies.
1.3. Definitions of Energy Consumption Bands and Opportunity Bandwidths The consistent methodology used in the bandwidth studies provides a framework to evaluate and compare energy savings potential within and across manufacturing sectors at the macro-scale. There are four energy consumption bands referenced throughout this report: current typical (CT), state of the art (SOA), practical minimum (PM), and thermodynamic minimum (TM) energy consumption. These bands describe different levels of energy consumption to manufacture products.
As shown in Figure 1-1, the bands progress from higher to lower levels of energy consumption, reflecting the use of increasingly more efficient manufacturing technologies and practices. The upper bound is set by a mix of new and older technologies and practices in current use (the current typical level of energy consumption). The lower bound is defined by the theoretical minimum energy requirement assuming ideal conditions and zero energy losses (the thermodynamic minimum level of energy consumption).
Figure 1-1. Energy consumption bands and opportunity bandwidths estimated in this study Source: EERE
Figure 1-1. Energy consumption bands and opportunity bandwidths estimated in this study Source: EERE

Introduction 3
Each of these two bounds defining the extremes of energy consumption can be compared to hypothetical measures in the middle of this range. If manufacturers use the most efficient technologies and practices available in the world, energy consumption could decrease from the current typical to the level defined by the state of the art. Since these state of the art technologies already exist, the difference between the current typical and the state of the art energy consumption levels defines the current opportunity to decrease energy consumption. Given that this is an evaluation of technical potential, fully realizing the current opportunity would require investments in capital that may not be economically viable for any given facility. Widespread deployment of future advanced technologies and practices under investigation by researchers around the globe could help manufacturers attain the practical minimum level of energy consumption. The difference between state-of-the-art and practical minimum levels of energy consumption defines the R&D opportunity for energy savings.
Definitions of the four energy bands are provided in the inset (box at right). Definitions of the two opportunity bandwidths are provided below:
The current opportunity is the energy savings that is potentially attainable through capital investments in the best technologies and practices available worldwide. It is the difference between CT and SOA energy consumption.
The R&D opportunity is the energy savings that is potentially attainable through the applied R&D technologies under development. It is the difference between SOA and PM energy consumption. To attain this energy savings, manufacturers would need to produce cement in new ways with technologies that are not commercially available.
The difference between PM and TM energy consumption is labeled as impractical. The term impractical is used because the PM energy consumption is based on today’s knowledge of R&D technologies tested between laboratory and demonstration scale; further decreases in energy intensity have not been displayed at any physical scale. However, decreasing the PM energy consumption with future R&D efforts and emerging technologies being investigated through modeling and theoretical calculations may eventually bring the PM energy consumption closer to the TM energy consumption. The costs associated with achieving SOA and PM energy consumption are not considered in this report; a techno-economic analysis of the costs and benefits of future technologies was not in the scope of this study.
1.4. Bandwidth Analysis Method This section describes the method used in this bandwidth study to estimate the four bands of energy consumption and the two corresponding energy savings opportunity bandwidths. This section can also be used as a guide to understanding the structure and content of this report.
In this study, U.S. energy consumption is labeled as either “on-site energy” or “primary energy” and defined as follows:
Definitions of Energy Bands Used in the Bandwidth Studies The following definitions are used to describe different levels of U.S. energy consumption to manufacture a specific product industry-wide:
Current Typical (CT) energy consumption:
U.S. energy consumption in 2010.
State-of-the-Art (SOA) energy consumption:
The minimum amount of energy required assuming the adoption of the best technologies and practices available worldwide.
Practical Minimum (PM) energy consumption:
The minimum amount of energy required assuming the deployment of the best applied R&D technologies under development worldwide. This measure is expressed as a range to reflect the speculative nature of the energy impacts of the unproven technologies considered.
Thermodynamic Minimum (TM) energy consumption: The minimum amount of energy theoretically required assuming ideal conditions typically unachievable in real-world applications.

BANDWIDTH STUDY ON ENERGY USE AND POTENTIAL ENERGY SAVING OPPORTUNITIES IN THE MANUFACTURING OF CEMENT
4 Introduction
• On-site energy (sometimes referred to as site or end use energy) is the energy consumed within the manufacturing plant boundary (i.e., within the plant gates). Non-fuel feedstock energy is not included in the on-site energy consumption values presented in this study.
• Primary energy (sometimes referred to as source energy) includes energy that is consumed both offsite and onsite during the manufacturing process. Off-site energy consumption includes generation and transmission losses associated with bringing electricity and steam to the plant boundary. Non-fuel feedstock energy is not included in the primary energy values. Primary energy is frequently referenced by governmental organizations when comparing energy consumption across sectors.
The four bands of energy consumption described above are quantified for processes and for the material total. To determine the total annual on-site CT, SOA, PM, and TM energy consumption (TBtu per year), energy intensity values per unit weight (Btu per pound (lb) of material manufactured) are estimated and multiplied by the production amount (lb per year of material manufactured). The year 2010 is used as a base year since it is the most recent year for which consistent energy consumption and production data are available for all materials and manufacturing sectors analyzed in this series of bandwidth studies. Unless otherwise noted, 2010 production data is used.
The estimates presented are for macro-scale consideration of energy use in cement manufacturing. The estimates reported herein are representative of average U.S. cement manufacturing; they do not represent energy use in any specific facility or any particular region in the United States or the world.
Significant investment in technology development and implementation would be needed to fully realize the potential energy savings opportunities estimated. The costs associated with achieving SOA and PM energy consumption are not considered in this report; a techno-economic analysis of the costs and benefits of future technologies was not in the scope of this study.
The calculated energy consumption values in this report are based on an examination of referenced data and extrapolation to sector-wide energy savings opportunities. The references, methodology, and assumptions employed are presented with the data in each chapter and were peer reviewed.
Chapter 2 presents the U.S. production volumes (million lb per year) for 2010.
Chapter 3 presents the calculated on-site CT energy intensity (Btu per lb) and CT energy consumption (TBtu per year) for the products, processes, sub-processes studied, totals, and sector-wide (along with sources).
Chapter 4 presents the estimated on-site SOA energy intensity (Btu per lb) and SOA energy consumption (TBtu per year) for the products, processes, sub-processes studied, totals, and sector-wide (along with sources). The SOA energy consumption for the process areas studied in the four sub-processes is extrapolated to estimate the entire SOA energy consumption for the cement sector (see inset). The extrapolated data for each sub-process is summed to provide an estimate of sector-wide SOA energy consumption.
Chapter 5 presents the estimated on-site PM energy intensity (Btu per lb) and PM energy consumption for the products, processes, sub-processes studied, totals, and sector-wide (along with sources). The PM energy intensity for the process areas studied in the four sub-processes is extrapolated to estimate the entire PM energy consumption for each sub-process (see inset). The extrapolated data for each sub-process is summed to provide an estimate of sector-wide PM energy consumption.
Cement Sub-process Analysis for SOA, PM, and TM Energy Consumption
To estimate SOA, PM, and TM energy consumption for the cement sub-processes, the energy consumption data for individual processes was aligned and grouped with its NAICS-defined sector.
The SOA, PM, and TM energy consumption data for each sub-process is extrapolated to match MECS 2010 data to estimate SOA, PM, and TM energy consumption for the entire sector. A consistent extrapolation method is used. The sub-process values are summed to provide sector-wide SOA, PM and TM energy consumption estimates.

Introduction 5
Chapter 6 presents the estimated on-site TM energy intensity (Btu per lb) and TM energy consumption for the products, processes, sub-processes studied, totals, and sector-wide (along with sources).
Chapter 7 provides a summary of current and R&D opportunity analysis based on bandwidth summary results for the cement sub-processes and sector-wide.
1.5. Boundaries of the Study The U.S. cement manufacturing sector is the physical boundary of this study. It is recognized that some of the major energy benefits (and costs) associated with the use of cement often occur outside of the manufacturing sector (e.g., improvements made in limestone quarrying). While such impacts are recognized as important, they will not be quantified as this is not a life cycle assessment study. Instead, this report focuses exclusively on the energy use directly involved in the production of cement within the manufacturing sector. This process begins when raw material enters the manufacturing plant and ends when dry cement is packaged or shipped. The focus of this bandwidth study is thus the on-site use of process energy (including purchased energy and on-site generated steam and electricity) that is directly applied to cement manufacturing at a production facility.
This study does not consider life cycle energy consumed during raw material extraction or quarrying, off-site treatment, transportation of materials, product use, or disposal. One of the most common misconceptions about cement is that it is the same as concrete. Concrete is a product that is composed of cement and other materials. The addition and mixing of those additional materials with cement is not included in this study. For consistency with previous bandwidth studies, feedstock energy and the energy associated with delivering feedstocks to the plant gate (e.g., producing, conditioning, and transporting feedstocks) are excluded from the energy consumption bands in this analysis as well.
1.5.1. Portland Cement Manufacturing Cement manufacturing consists of several different processes but none are as pervasive as the wet and dry processes for Portland cement manufacturing. Approximately 98% of all cement produced in 2010 was Portland cement and 100% of that cement is produced by either the wet or dry process. Cement manufacturing produces a variety of products including different types of cement. Portland cement is the single most important product of cement manufacturing and is also one of the most energy intensive cement product types. Other products such as slag cement, pozzolans (including fly ash), gypsum, calcium sulfoaluminate cement, and other related materials require less energy to produce and can be effective as cement products on their own or in combination with Portland cement. However, this bandwidth does not explore different product mixes that could be implemented to lower overall cement manufacturing sector energy use. This level of analysis would require a greater understanding of cement chemistry and potential cement substitutions. Instead, the report relies on product mixes and cement types produced for 2010 to develop the CT, SOA, PM, and TM consumption values.
This report does look at the energy use of both of the main Portland cement manufacturing processes: wet and dry. While CT calculations are made using production volumes reported for each of the wet and dry processes, it is assumed for SOA, PM, and TM energy consumption calculations that all cement is produced using the more energy efficient dry process. Since cost is not considered for this report, the retrofits required to shift all U.S. Portland cement production from the wet to dry process are ignored.

BANDWIDTH STUDY ON ENERGY USE AND POTENTIAL ENERGY SAVING OPPORTUNITIES IN THE MANUFACTURING OF CEMENT
6 U.S. Cement Manufacturing Sector Production
2. U.S. Cement Manufacturing Sector Production
2.1. U.S. Cement Manufacturing Overview The U.S. cement manufacturing sector consists of a large number of facilities. These facilities produce many different types of cement. In total, the industry produces a large number of diverse products that are both consumed domestically and exported to international markets. However, the main product in the cement industry is Portland cement, which accounts for approximately 98% (144 billion lbs) of all cement manufactured in the United States (146 billion lb total). Other cements like natural, masonry and pozzolanic cement make up the difference in the cement industry. Portland cement manufacture requires significant preparation and an endothermic chemical step to create the final product. Because of this, a variety of energy consuming steps are typically required throughout the manufacturing process. Overall, the main sources of energy consumption include fuel and electricity.
According to the U.S. Census Bureau, there were 256 establishments involved in cement manufacturing in 2010 (USCB 2012). These establishments employed nearly 12,992 individuals and with a total annual payroll of $815 million (USCB 2012).
2.2. U.S. Cement Manufacturing Sector Description In 2010, the United States produced approximately 146 billion lb of cement, which accounted for 2% of world capacity. Approximately 56% of global production capacity came from the world-leading cement producer, China, in 2010 (USGS 2011).
This study focuses on production of Portland cement as reported by sources representative of the industry. The raw materials required for the Portland cement manufacturing process come from either cement quarries or waste streams from other industries like steel and rubber. These raw materials go through a series of crushers (typically jaw crushers or hammer crushers) to produce ¾-inch stone. This stone is sent through a series of grinders (such as ball mills and vertical roller mills) to produce the raw meal. Concurrently, solid fuels such as coal and petroleum coke (or “petcoke”) are prepared to be fed to a kiln. This raw meal is then sent through the kiln for the very fuel-intensive pyroprocessing step to produce clinker. The clinker is cooled, mixed with other minerals such as gypsum, and sent through a series of ball mills or vertical roller mills during the finish grinding step to form a uniform cement product. The cement is then stored in a silo and eventually packaged for future consumption. Figure 2-1 shows the process flow diagram (PFD) for cement manufacturing. Table 2-1 shows the specific processes considered under the four sub-processes studied based on available recent data. The only NAICS codes applicable to this report is 327310.

U.S. Cement Manufacturing Sector Production 7
Figure 2-1. Process flow diagram (PFD) of the overall boundaries in the cement manufacturing process considered for this report Source: EERE

BANDWIDTH STUDY ON ENERGY USE AND POTENTIAL ENERGY SAVING OPPORTUNITIES IN THE MANUFACTURING OF CEMENT
8 U.S. Cement Manufacturing Sector Production
Table 2-1. Cement Manufacturing Process Areas Considered in Bandwidth Analysis Based on Available Data
Sub-process Stage End-Use Technologies
Dry Process
Crushing/Grinding
Initial Size Reduction Two-stage primary size reduction (compression type crushers)
Two-stage secondary size reduction (impact type crushers)
Single stage-size reduction (impact type crusher)
Preblending Prehomogenization
Proportioning
Grinding Ball mills
Vertical roller mills
Blending Air-fluidized homogenizing silo
Mechanical system
Storage Gravity (multi-outlet silo) dry system
Fuel grinding Ball mills
Vertical roller mills
Pyroprocessing with Cooling
Kiln burning Long dry kiln
Kiln with preheater
Kiln with precalciner
Kiln with preheater and precalciner
Kiln with multiple preheaters and precalciner
Cooling Reciprocating grate cooler
Planetary cooler
Rotary cooler
Finish Grinding
Finish grinding Ball Mills
Ball Mills w/ Roller Presses
Roller Presses
Vertical Roller Mills
Horizontal Roller Mill
High Pressure Roller Mill
Advanced Horizontal Roller Mill
OK Mill
Storage Packaging Silo
Transporting Belt conveyor
Wet Process
Crushing/Grinding Initial Size Reduction Two-stage primary size reduction
(compression type crushers)
Two-stage secondary size reduction (impact type crushers)

U.S. Cement Manufacturing Sector Production 9
Table 2-1. Cement Manufacturing Process Areas Considered in Bandwidth Analysis Based on Available Data
Sub-process Stage End-Use Technologies
Single stage-size reduction (impact type crusher)
Grinding Wash mills
Ball mills
Storage Gravity (multi-outlet silo) dry system
Fuel grinding Ball mills
Vertical roller mills
Pyroprocessing with Cooling
Kiln burning Long wet kiln
Semi-wet/semi-dry kiln
Cooling Grate cooler
Finish Grinding
Finish grinding Ball Mills
Ball Mills w/ Roller Presses
Roller Presses
Vertical Roller Mills
Horizontal Roller Mill
High Pressure Roller Mill
Advanced Horizontal Roller Mill
OK Mill
Storage
Storage Packaging Silo
Conveying Belt conveyor
* NAICS = North American Industry Classification System (2012 codes were used)
2.3. U.S. Cement Manufacturing Energy Consumption On-site energy and primary energy for the U.S. cement manufacturing sector are provided in Table 2-1. DOE’s Manufacturing Energy Consumption Survey (MECS) provides on-site energy consumption data by end use, including on-site fuel and electricity consumption. Primary energy includes assumptions for off-site losses (DOE 2014).
Cement manufacturing accounted for 307 TBtu (1.6%) of the 19,237 TBtu of total primary manufacturing energy consumption in 2010 (DOE 2014). Off-site electricity and steam generation and transmission losses in cement manufacturing totaled 62 TBtu in 2010; on-site energy consumed within the boundaries of U.S. cement manufacturing plants totaled 245 TBtu. Additional detail on these CT energy consumption estimates can be found in Chapter 3.

BANDWIDTH STUDY ON ENERGY USE AND POTENTIAL ENERGY SAVING OPPORTUNITIES IN THE MANUFACTURING OF CEMENT
10 U.S. Cement Manufacturing Sector Production
Table 2-2. U.S. Cement Manufacturing Energy Consumption Sector-Wide, 2010 On-site Energy Consumption (includes electricity, steam, and fuel energy used on site at the facility) 245 TBtu
Primary Energy Consumption* (includes on-site energy consumption, and off-site energy losses associated with generating electricity and steam off site and delivering to the facility) 307 TBtu
Source: DOE 2014 * Primary energy accounts for off-site electricity generation and transmission losses. Off-site electrical losses are based on published grid efficiency. The Energy Information Administration (EIA) Monthly Energy Review, Table 2.4, lists electrical system losses relative to electrical retail sales. The energy value of electricity from off-site sources including generation and transmission losses is determined to be 10,553 Btu/kWh.
2.4. U.S. Cement Manufacturing Production Values In this report, production data refers to the amount of cement produced in the United States. Energy intensity values represent the energy that the end-use process requires to create a pound (lb) of the cement product. Energy intensity values are multiplied by the production values in the Table 2-2 in order to estimate total energy consumption by process.
The leading source for data on cement production (crushing/grinding, pyroprocessing with cooling, finish grinding, and storage) is the U.S. Geological Survey (USGS). Table 2-2 provides the production values for domestic cement manufacturing by product type. The domestic production for cement involves raw meal, fuel, and clinker production. The raw meal encompasses the major types of raw materials used for cement manufacturing, particularly calcareous materials like limestone, cement rock and cement kiln dust (USGS 2011). However, the raw meal also includes other aluminous, ferrous, and siliceous materials such as clay, iron ore, and fly ash respectively (USGS 2011). The fuel consumed in the kiln must be prepared for burning, which is particularly important for solid fuels with respect to moisture and size (USGS 2011). The value for clinker production includes only domestically produced clinker that is manufactured by the wet or dry process. Imported clinker as well as clinker produced by two U.S. plants that use both the wet and dry process are not included in the total production value (USGS 2011). The value for cement production does not include any cement produced by grinding plants or plants that produce Portland cement by regrinding other types of cement (exclusions) as well. (USGS 2011). These restrictions on cement and clinker production values lower the total volume considered in this report below the 144 billion pounds of Portland cement mentioned earlier. The final production value of Portland cement considered in this report is 141 billion pounds or 96% of the total cement manufacture in the United States.
The volumes shown in Table 2-2 are separated by wet and dry process only when calculating CT energy consumption. SOA, PM, and TM energy consumption values assume that all wet process production values are shifted to the dry process. Therefore, the sub-process 2010 production values can be added to get the production considered for SOA, PM, and TM calculations.
The production values given in Table 2-2 are used to calculate total energy consumption for each stage. Within each sub-process, these production values remain the same. There is a decrease in volume from crushing/grinding to pyroprocessing due to raw material losses and combinations. Increases are seen from pyroprocessing to finish grinding and from finish grinding to storage due to additions of other minerals.
Table 2-3. U.S. Cement 2010 Production for Each Sub-process Studied
Sub-process (product) Stage 2010 Total Production (million lb)
Dry Process
Crushing/Grinding (raw meal) Initial Size Reduction 210,175

U.S. Cement Manufacturing Sector Production 11
Grinding 210,175 Blending 210,175 Storage 210,175 Fuel grinding1 14,176
Pyroprocessing with Cooling (clinker)
Kiln burning 120,371 Cooling 120,371
Finish Grinding (cement) Finish grinding 131,513 Wet Process
Crushing/Grinding (raw meal)
Initial Size Reduction 15,069 Grinding 15,069 Storage 15,069 Fuel grinding1 1,424
Pyroprocessing with Cooling (clinker)
Kiln burning 8,638 Cooling 8,638
Finish Grinding (cement) Finish grinding 9,429 Storage (Both Wet and Dry Processes)
Storage (cement)2 Storage 140,942 Packaging 140,942
1 Fuel grinding production assumed to be primarily for coal and petcoke fuels, although oil, natural gas, and waste fuels (e.g., tires, solid waste, etc.) can also be used. 2 Cement storage assumes the annual storage requirements for the final cement product from both the wet and dry process.

BANDWIDTH STUDY ON ENERGY USE AND POTENTIAL ENERGY SAVING OPPORTUNITIES IN THE MANUFACTURING OF CEMENT
12 Current Typical Energy Intensity and Energy Consumption for U.S. Cement Manufacturing
3. Current Typical Energy Intensity and Energy Consumption for U.S. Cement Manufacturing
This chapter presents energy intensities and energy consumption data for cement manufacturing sub-processes and sector-wide. Energy intensities were identified for each cement sub-process and applied to the relevant wet and dry process production values reported in the previous chapter to determine U.S. energy consumption. The energy intensities were identified using a top down approach that matches researched intensities to entire sub-processes. The estimates reported are representative of U.S. consumption. In some cases, non-U.S. energy intensity values are used to fill in data gaps, if it was determined that the data would be representative of U.S. manufacturing, and high-quality U.S. data were unavailable.
3.1. Sources for Current Typical Energy Intensity Appendix A1 presents the CT energy intensities and energy consumption for the sub-processes studied. Table 3-1 presents a summary of the main references consulted to identify CT energy intensity by sub-process. Appendix A2 provides the references used for each sub-process.
The cement sector can vary significantly in energy consumption depending on the specifics of the product and process used. The energy intensity values selected are determined to be the best approximation of the on-site energy consumption. The best criteria for selection include data that specify the process, cement type, and are based on U.S. facilities. In cases where this level of detail is not available, data gaps are filled in using the next best available source, with a priority on sources that accurately represent typical energy intensities for the type of process (e.g., crushing/grinding, pyroprocessing with cooling, finish grinding).
Table 3-1. Main Sources Referenced in Identifying Current Typical Energy Intensity by Sub-process and Material Total
Source Abbreviation Description
Crushing/Grinding
Worrell et al. 2013
This source provided the CT energy values for cement grinding for both wet and dry cement processes. The CT energy technology considered in this report was ball mills, as these are the most commonly used grinding mills in cement manufacturing.
Zhu 2011 This reference provided the CT energy intensity for raw meal blending. Raw meal blending is used in the dry process to assist in the homogenization of the raw meal.
Pyroprocessing with Cooling
LBNL 2012 This reference provided the CT energy value for dry pyroprocessing. The typical technology used in cement pyroprocessing is a preheater, precalciner and rotary kiln.
ECRA 2009 This reference provided the CT cooling energy value for both wet and dry processes. The typical technology used for cooling the clinker after leaving the kiln is the reciprocating grate cooler.
Worrell et al. 2013 This source provided the CT energy intensity value for the wet kiln. A long wet kiln is the most commonly used pyroprocessing technique for the wet process.
Finish Grinding
Worrell et al. 2013
This source provided the CT energy values for cement finish grinding for both wet and dry cement processes. The CT energy technology considered in this report was ball mills, as these are the most commonly used grinding mills in cement manufacturing.

Current Typical Energy Intensity and Energy Consumption for U.S. Cement Manufacturing 13
Table 3-1. Main Sources Referenced in Identifying Current Typical Energy Intensity by Sub-process and Material Total
Source Abbreviation Description
Storage
Madlool et al. 2011 The CT energy intensity for packaging silos in final cement product storage was provided by this reference.
Worrell et al. 2008 The CT energy intensity for belt conveyors in final cement product storage was provided by this reference. Belt conveyors transport the final cement product to the storage silos.
3.2. Current Typical Energy Consumption by Sub-process and Sector-wide
Table 3-2 presents the energy intensities and calculated on-site and primary CT energy consumption for the cement manufacturing sub-processes studied and sector-wide. Energy consumption values were calculated by multiplying energy intensity (Btu/lb of sub-process product) by 2010 production (million lb/year). Feedstock energy is excluded from the energy values.
While multiple process types may be included at a cement manufacturing facility, the energy intensity data collected is selected based on common equipment and processes within manufacturing plants. For calculating the off-site losses when converting from primary to on-site energy, an energy mix of electricity and fuel was used based on the Manufacturing Energy Consumption Survey’s (MECS) Cement Manufacturing Energy and Carbon Footprint (DOE 2014). Percent coverage is calculated by dividing the on-site CT energy consumption for the processes studied by sector-wide on-site CT energy consumption.
Cement manufacturing accounted for 307 TBtu (1.6%) of the 19,237 TBtu of total primary manufacturing energy consumption in 2010 (DOE 2014). Off-site electricity and steam generation and transmission losses in Cement manufacturing totaled 62 TBtu in 2010; on-site energy consumed within the boundaries of U.S. Cement manufacturing plants totaled 245 TBtu. In 2010, data available for the four sub-processes studied covered about 97% (238 TBtu) of the cement sector’s total on-site energy consumption (245 TBtu).

BANDWIDTH STUDY ON ENERGY USE AND POTENTIAL ENERGY SAVING OPPORTUNITIES IN THE MANUFACTURING OF CEMENT
14 Current Typical Energy Intensity and Energy Consumption for U.S. Cement Manufacturing
Table 3-2. On-site Current Typical Energy Intensity and Consumption and Primary Energy Consumption for U.S. Cement Manufacturing Processes Studied and Sector-wide in 2010, with Percent of Sector
Coverage
Sub-process
On-site CT Energy
Intensity for Sub-
processes Studied (Btu/lb)
Production (million lb/year)
On-site CT Energy
Consumption1
(TBtu/year)
Off-site Losses
(TBtu/year)
Primary CT Energy
Consumption2
(TBtu/year)
Percent Coverage
(On-site CT as a % of
Sector-wide total)
Dry Process
Crushing/Grinding
Kiln Feed Preparation 55 210,175 11.5 23.1 34.6 Fuel Preparation 54 14,176 0.8 1.5 2.3
Pyroprocessing with Cooling 1,554 120,371 187.1 12.1 199.2 Finish Grinding 92 131,513 12.0 24.2 36.3 SUBTOTAL – Dry Process3 211.4 60.9 272.3 86% Wet Process Crushing/Grinding
Kiln Feed Preparation 48 15,069 0.7 1.5 2.2 Fuel Preparation 54 1,424 0.1 0.1 0.2
Pyroprocessing with Cooling 2,750 8,638 23.8 0.8 24.6 Finish Grinding 105 9,429 1.0 2.0 3.0 SUBTOTAL – Wet Process3 25.6 4.4 30.0 11% Storage
Storage3 5 140,942 0.8 1.5 2.3
Total for Processes in Sub-processes Studied3
237.7 66.9 304.6 97% Total for Cement Sector-wide3
245.0 62.0 307.0 100%
Current Typical (CT) 1 On-site CT energy consumption for the processes studied is calculated from energy intensity and production data for individual processes and summed in the sub-process. 2 DOE 2014 is the source for MECS/Energy Footprints data and approaches. Primary energy is calculated from on-site energy consumption data, with scaling to include offsite electricity and steam generation and transmission loss. 3 Totals may not sum due to independent rounding.

State of the Art Energy Intensity and Energy Consumption for U.S. Cement Manufacturing 15
4. State-of-the-Art Energy Intensity and Energy Consumption for U.S. Cement Manufacturing
This chapter estimates energy savings possible in cement manufacturing plants to achieve state of the art (SOA) energy consumption levels. SOA consumption represents savings possible when applying best practices and technologies that are currently commercially available globally. Plants can vary widely in size, age, efficiency, energy consumption, and production. To develop an estimate representative of U.S. industries, this analysis uses typical energy savings found from measures applicable to major sub-processes including crushing/grinding, pyroprocessing with cooling, and finish grinding, as well as measures more widely applicable to cement processing facilities. Similar to CT estimates, energy intensities were identified using a top down approach that matches researched intensities to entire sub-processes.
4.1. Sources for State of the Art Energy Intensity Appendix A1 presents the on-site SOA energy intensity and consumption for the processes considered in this bandwidth study. The on-site SOA energy consumption values are the net energy consumed in the sub-process using the single most efficient process and production pathway. No weighting is given to processes that minimize waste, feedstock streams, and byproducts, or maximize yield, even though these types of process improvements can help minimize the energy used to produce a lb of cement. The on-site SOA energy consumption estimates exclude feedstock energy.
Table 4-1 presents the main published sources referenced to identify the SOA energy intensities.
Table 4-1. Main Sources Referenced in Identifying State of the Art Intensity by Sub-process and Material Total
Source Abbreviation Description*
Crushing/Grinding
Worrell et al. 2013
This source provided the SOA energy values for cement grinding for both wet and dry cement processes. The SOA energy technology considered in this report was the vertical roller mill, as it is a commonly used replacement or pre-grinder for the ball mill.
Zhu 2011 This reference provided the SOA energy intensity for raw meal blending.
Pyroprocessing with Cooling
Worrell et al. 2013
The SOA energy intensity for the dry kiln was used from this reference for pyroprocessing. The dry kiln technology considered in this report is the dry kiln with preheaters and precalciners.
Finish Grinding
PG&E 2006 The SOA energy intensity for finish grinding in the dry process was used from this source. The finish grinding baseline used in this report was set for energy-efficient ball mills.
Storage
Madlool et al. 2011 It is assumed that the CT=SOA for packing silos in cement manufacturing.
Worrell et al. 2008 The low value for energy consumption in cement belt conveyors was determined as the SOA from this source.
* Some descriptions mention improvements for the wet process. Improvements to the wet process are not used in this report since all cement is assumed to be produced by the dry process for SOA, PM, and TM as mentioned in Section 1.5.1.

BANDWIDTH STUDY ON ENERGY USE AND POTENTIAL ENERGY SAVING OPPORTUNITIES IN THE MANUFACTURING OF CEMENT
16 State of the Art Energy Intensity and Energy Consumption for U.S. Cement Manufacturing
4.2. State-of-the-Art Energy Intensity and Consumption SOA energy intensities were based on a literature review of existing technologies used in cements manufacturing. Table 4-2 presents the on-site SOA energy intensity and consumption for the cement manufacturing for the sub-processes studied. Full details on sub-process energy intensities used can be found in Appendix A1.
Table 4-3 presents a comparison of the on-site CT energy consumption and SOA energy consumption for each sub-process and as a total. The on-site SOA energy saving, which is the difference between CT energy consumption and SOA energy consumption, is also called the current opportunity bandwidth for the sub-processes studied.
Savings opportunity is presented as both SOA energy savings (or current opportunity) and SOA energy savings percent. It is useful to consider both energy savings and energy savings percentage when comparing the energy savings opportunity. Both are good measures of opportunity; however, the conclusions are not always the same. Among the sub-processes studied, the greatest current opportunity in terms of percent energy savings is finish grinding at 45% energy savings; the greatest current opportunity in terms of TBtu savings is pyroprocessing with cooling at 50.0 TBtu per year savings7.
Table 4-2. On-site State of the Art Energy Intensities and Calculated Energy Consumption for Cement Manufacturing Processes in Four Sub-processes Studied
Sub-process On-site SOA
Energy Intensity (Btu/lb)
Production (million lb/year)
On-site SOA Energy Consumption,
Calculated (TBtu/year)
Dry Process Crushing/Grinding
Kiln Feed Preparation 39 225,244 8.7 Fuel Preparation 31 15,600 0.5
Pyroprocessing with Cooling 1,247 129,009 160.8 Finish Grinding 51 140,942 7.2 Storage 4 140,942 0.6 Total for Sub-processes Studied* 1,371 n/a 177.8 Current Typical (CT), State of the Art (SOA) * Totals may not sum due to independent rounding.
7 Some of the TBtu savings in pyroprocessing and cooling are the direct result of the assumption that all cement made through the wet process is produced by the dry process for SOA calculations. This assumption alone accounts for 3.5 TBtu per year savings.
State of the Art Energy Intensity and Energy Consumption for U.S. Cement Manufacturing 17
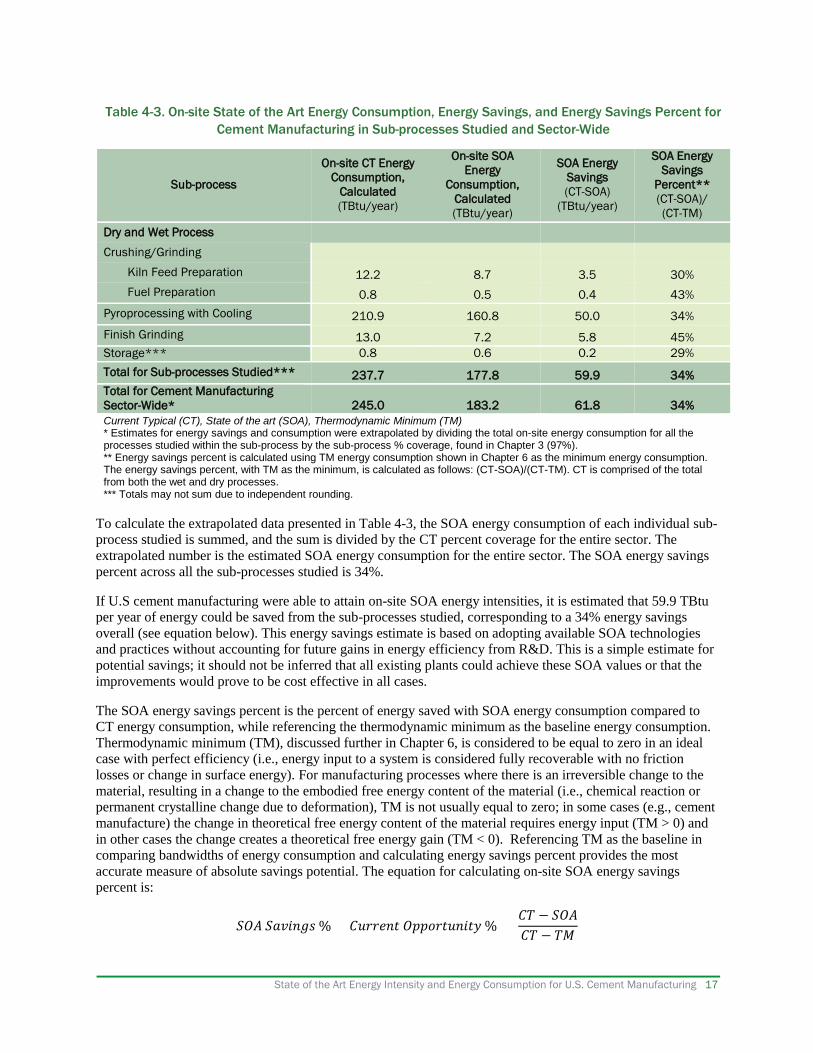
To calculate the extrapolated data presented in Table 4-3, the SOA energy consumption of each individual sub-process studied is summed, and the sum is divided by the CT percent coverage for the entire sector. The extrapolated number is the estimated SOA energy consumption for the entire sector. The SOA energy savings percent across all the sub-processes studied is 34%.
If U.S cement manufacturing were able to attain on-site SOA energy intensities, it is estimated that 59.9 TBtu per year of energy could be saved from the sub-processes studied, corresponding to a 34% energy savings overall (see equation below). This energy savings estimate is based on adopting available SOA technologies and practices without accounting for future gains in energy efficiency from R&D. This is a simple estimate for potential savings; it should not be inferred that all existing plants could achieve these SOA values or that the improvements would prove to be cost effective in all cases.
The SOA energy savings percent is the percent of energy saved with SOA energy consumption compared to CT energy consumption, while referencing the thermodynamic minimum as the baseline energy consumption. Thermodynamic minimum (TM), discussed further in Chapter 6, is considered to be equal to zero in an ideal case with perfect efficiency (i.e., energy input to a system is considered fully recoverable with no friction losses or change in surface energy). For manufacturing processes where there is an irreversible change to the material, resulting in a change to the embodied free energy content of the material (i.e., chemical reaction or permanent crystalline change due to deformation), TM is not usually equal to zero; in some cases (e.g., cement manufacture) the change in theoretical free energy content of the material requires energy input (TM > 0) and in other cases the change creates a theoretical free energy gain (TM < 0). Referencing TM as the baseline in comparing bandwidths of energy consumption and calculating energy savings percent provides the most accurate measure of absolute savings potential. The equation for calculating on-site SOA energy savings percent is:
𝑆𝑆𝑆𝑆𝑆𝑆 𝑆𝑆𝑆𝑆𝑆𝑆𝑆𝑆𝑆𝑆𝑆𝑆𝑆𝑆 % = 𝐶𝐶𝐶𝐶𝐶𝐶𝐶𝐶𝐶𝐶𝑆𝑆𝐶𝐶 𝑆𝑆𝑂𝑂𝑂𝑂𝑂𝑂𝐶𝐶𝐶𝐶𝐶𝐶𝑆𝑆𝑆𝑆𝐶𝐶𝑂𝑂 % = 𝐶𝐶𝐶𝐶 − 𝑆𝑆𝑆𝑆𝑆𝑆𝐶𝐶𝐶𝐶 − 𝐶𝐶𝑇𝑇
Table 4-3. On-site State of the Art Energy Consumption, Energy Savings, and Energy Savings Percent for Cement Manufacturing in Sub-processes Studied and Sector-Wide
Sub-process
On-site CT Energy Consumption,
Calculated (TBtu/year)
On-site SOA Energy
Consumption, Calculated (TBtu/year)
SOA Energy Savings (CT-SOA)
(TBtu/year)
SOA Energy Savings
Percent** (CT-SOA)/ (CT-TM)
Dry and Wet Process Crushing/Grinding
Kiln Feed Preparation 12.2 8.7 3.5 30% Fuel Preparation 0.8 0.5 0.4 43%
Pyroprocessing with Cooling 210.9 160.8 50.0 34% Finish Grinding 13.0 7.2 5.8 45% Storage*** 0.8 0.6 0.2 29% Total for Sub-processes Studied*** 237.7 177.8 59.9 34% Total for Cement Manufacturing Sector-Wide* 245.0 183.2 61.8 34% Current Typical (CT), State of the art (SOA), Thermodynamic Minimum (TM) * Estimates for energy savings and consumption were extrapolated by dividing the total on-site energy consumption for all the processes studied within the sub-process by the sub-process % coverage, found in Chapter 3 (97%). ** Energy savings percent is calculated using TM energy consumption shown in Chapter 6 as the minimum energy consumption. The energy savings percent, with TM as the minimum, is calculated as follows: (CT-SOA)/(CT-TM). CT is comprised of the total from both the wet and dry processes. *** Totals may not sum due to independent rounding.

BANDWIDTH STUDY ON ENERGY USE AND POTENTIAL ENERGY SAVING OPPORTUNITIES IN U.S. CEMENT MANUFACTURING
18 Practical Minimum Energy Intensity and Energy Consumption for U.S. Cement Manufacturing
5. Practical Minimum Energy Intensity and Energy Consumption for U.S. Cement Product Manufacturing
For the cement industry, the majority of the practical energy savings potential comes from state-of-the-art technologies that are already commercially available. The remaining energy savings potential comes in the form of R&D technologies. Innovation in these technologies can further improve efficiency and drive U.S. economic growth. This chapter determines the R&D opportunity for the cement industry as defined by the practical minimum (PM): the minimum amount of energy required assuming the deployment of applied R&D technologies currently under development worldwide. Unlike the CT and SOA energy intensities, PM intensities were calculated by looking at efficiency improvements to individual processes or equipment. The corresponding energy savings were applied to a SOA baseline for the particular process or equipment and the calculated savings were integrated with the particular sub-process category. The collection of energy efficiency improvements to major processes or pieces of equipment collectively shifted SOA energy intensity to PM energy intensity. These steps were repeated for each PM technology identified and deemed relevant.
5.1. Sources for Practical Minimum Energy Intensity In this study, PM energy intensity is the estimated minimum amount of energy consumed in a specific cement manufacturing sub-process assuming that the most advanced technologies under research or development around the globe are deployed.
R&D progress is difficult to predict and potential gains in energy efficiency can depend on financial investments and market priorities. To estimate PM energy consumption for this bandwidth analysis, a search of R&D activities in the cement industry was conducted. The focus of this study’s search was applied research and emerging technologies, defined as the investigation and development of new technologies with the intent of accomplishing a particular commercial objective. Basic research, involving experimentation and modeling to expand understanding of fundamental mechanisms and principles without a direct link to commercial objectives, was not considered. Many of the technologies identified were disqualified from consideration due a lack of data from which to draw energy savings conclusions. Further, applied R&D technologies without a clear connection to manufacturing energy consumption were not considered in this study. Appendix A3 provides an example of the range of technologies considered for evaluation.
Table 5-1 presents some key sources consulted to identify PM energy intensities in cement manufacturing.

Practical Minimum Energy Intensity and Energy Consumption for U.S. Cement Manufacturing 19
Table 5-1. Sources Referenced in Identifying Practical Minimum Energy Intensity by Sub-process and Material Total
Source Abbreviation Description* Crushing/Grinding
Zhu 2011 The PM energy intensities for dry process blending were determined from this reference. The PM technology chosen for this report was the gravity type silo.
Worrell et al. 2013 This source provided the PM energy intensity for dry process crushing/grinding. The advanced horizontal roller mill was used as the PM energy baseline for cement crushing/grinding.
LBNL 2009
This source provided the PM energy savings for crushing/grinding for fuel preparation. The technologies in this reference that were considered in the PM energy intensity were the new efficient coal separators, efficient roller mills for coal grinding, as well as installation of variable frequency drives (VFDs) & replacement coal mill bag dust collector’s fans.
APP 2009 This source provided the PM energy savings for crushing/grinding for fuel preparation. The technology in this reference considered in the PM energy intensity was the vertical coal mill.
Pyroprocessing with Cooling
ECRA 2009 This reference provided the PM energy for grate coolers in the dry and wet process.
IFC 2013 Electrical and thermal efficiency improvements in the kiln are applicable for both wet and dry kilns. This source provided a fuel energy savings of 0.09 MJ/kg (or 40 Btu/lb) cement for PM kiln conversions.
Finish Grinding
APP 2009
This source provided the PM energy savings for finish grinding steps in cement manufacturing. The energy savings were determined from this reference using pre-grinding of the roll press system, pre-grinding of roller mill system, and automatic run control of tube mill.
Storage Madlool et al. 2011 It is assumed that SOA=PM for cement storage processes. Worrell et al. 2008 It is assumed that SOA=PM for cement storage processes. * Some descriptions mention improvements for the wet process. Improvements to the wet process are not used in this report since all cement is assumed to be produced by the dry process for SOA, PM, and TM as mentioned in Section 1.5.1.
5.2. Practical Minimum Energy Consumption by Sub-process and Sector-wide Table 5-2 presents the on-site PM energy consumption for the cement manufacturing sub-processes studied. Full details on sub-process energy intensities used can be found in Appendix A1. Table 5-3 presents the on-site PM energy savings, which is the difference between CT energy consumption and PM energy consumption. The on-site energy consumptions and energy savings are presented as TBtu per year.
In Table 5-3, data from Table 5-2 is extrapolated to estimate the total PM sub-process consumption and the sector-wide energy savings. Table 5-3 presents the PM sub-process energy savings, which is the sum of current and R&D opportunity. Table 5-4 calculates the R&D opportunity for the processes studied and sector-wide opportunity.
To calculate the extrapolated data presented in Table 5-3, the PM energy consumption of each individual sub-process is summed, and the sum is divided by the CT percent coverage for the entire sector. The extrapolated number is the estimated PM energy consumption for the entire sector. The PM energy savings percent is assumed to be the average taken across all the sub-processes studied (38%).

BANDWIDTH STUDY ON ENERGY USE AND POTENTIAL ENERGY SAVING OPPORTUNITIES IN U.S. CEMENT MANUFACTURING
20 Practical Minimum Energy Intensity and Energy Consumption for U.S. Cement Manufacturing
Table 5-2. On-site Practical Minimum Energy Consumption for Cement Manufacturing Processes in Four Sub-processes Studied
Sub-process On-site PM Energy
Intensity (Btu/lb)
Production (million lb/year)
On-site PM Energy Consumption, Calculated (TBtu/year)
Dry Process Crushing/Grinding
Kiln Feed Preparation 36 225,244 8.1 Fuel Preparation 28 15,600 0.4
Pyroprocessing with Cooling 1,206 129,009 155.6 Finish Grinding 48 140,942 6.8 Storage 4 140,942 0.5 Total for Sub-processes Studied* 1,322 n/a 171.4 Current Typical (CT), Practical Minimum (PM) * Totals may not sum due to independent rounding.
It is useful to consider both TBtu energy savings and energy savings percent when comparing the energy savings opportunity. Both are good measures of opportunity; however, the conclusions are not always the same. Among the sub-processes studied the greatest combination of current and R&D opportunity in terms of
Table 5-3. On-site Practical Minimum Energy Consumption, Energy Savings, and Energy Savings Percent for Cement Manufacturing in Sub-processes Studied and Sector-Wide
Sub-process
On-site CT Energy Consumption,
Calculated (TBtu/year)
On-site PM Energy Consumption,
Calculated (TBtu/year)
PM Energy Savings* (CT-PM)
(TBtu/year)
PM Energy Savings
Percent** (CT-PM)/ (CT-TM)
Dry Process Crushing/Grinding
Kiln Feed Preparation 12.2 8.1 4.2 34% Fuel Preparation 0.8 0.4 0.4 48%
Pyroprocessing with Cooling 210.9 155.6 55.3 37% Finish Grinding 13.0 6.8 6.2 48% Storage 0.8 0.5 0.2 29% Total for Sub-processes Studied*** 237.7 171.4 66.3 38% Total for Cement Manufacturing Sector-Wide**** 245.0 176.7 68.3 38% Current Typical (CT), Practical Minimum (PM), Thermodynamic Minimum (TM) * When generalized to the full sector, PM energy savings is the Current Opportunity plus the R&D Opportunity. ** Energy savings percent is calculated using TM energy consumption shown in Chapter 6 as the minimum energy consumption. The energy savings percent, with TM as the minimum, is calculated as follows: (CT-PM)/(CT-TM). CT is comprised of the total from both the wet and dry processes. *** Totals may not sum due to independent rounding. **** Estimates for the entire sub-process were extrapolated by dividing the total on-site PM energy consumption for all the processes studied within the sub-process by the sub-process % coverage, found in Chapter 3.

Practical Minimum Energy Intensity and Energy Consumption for U.S. Cement Manufacturing 21
percent energy savings is in finish grinding at 48% energy savings; the greatest combination of current and R&D opportunity in terms of TBtu savings is pyroprocessing with cooling at 55.3 TBtu per year savings.
If U.S cement manufacturing (for the 2010 production level) were able to attain on-site PM energy intensities, it is estimated that 66.3 TBtu per year of energy could be saved from the sub-processes studied alone, corresponding to a 38% energy savings overall. This energy savings estimate is based on adopting available PM technologies and practices. This is a simple estimate for potential savings; it is not inferred that all existing plants could achieve these PM energy intensity values or that the improvements would prove to be cost effective in all cases.
The R&D savings percent is the percent of energy saved with SOA energy consumption compared to CT energy consumption. The PM energy savings percent is the percent of energy saved with PM energy consumption compared to CT energy consumption, while referencing the thermodynamic minimum as the baseline energy consumption. Thermodynamic minimum (TM), discussed in the following section, is considered to be equal to zero in an ideal case with perfect efficiency (i.e., energy input to a system is considered fully recoverable with no friction losses or change in surface energy). For manufacturing processes where there is an irreversible change to the material, resulting in a change to the embodied free energy content of the material (e.g., from a chemical reaction or permanent crystalline change), TM is not necessarily equal to zero; in some cases (e.g., cement manufacture) the change in theoretical free energy content of the material requires energy input (TM > 0) and in other cases the change creates a theoretical free energy gain (TM < 0). Referencing TM as the baseline in comparing bandwidths of energy consumption and calculating energy savings percent provides the most accurate measure of absolute savings potential. The equation for calculating on-site PM energy savings percent is:
𝑅𝑅&𝐷𝐷 𝑆𝑆𝑂𝑂𝑂𝑂𝑂𝑂𝐶𝐶𝐶𝐶𝐶𝐶𝑆𝑆𝑆𝑆𝐶𝐶𝑂𝑂 % = 𝑆𝑆𝑆𝑆𝑆𝑆 − 𝑃𝑃𝑇𝑇𝐶𝐶𝐶𝐶 − 𝐶𝐶𝑇𝑇
𝑃𝑃𝑇𝑇 𝑆𝑆𝑆𝑆𝑆𝑆𝑆𝑆𝑆𝑆𝑆𝑆𝑆𝑆 % = 𝐶𝐶𝐶𝐶 − 𝑃𝑃𝑇𝑇𝐶𝐶𝐶𝐶 − 𝐶𝐶𝑇𝑇

BANDWIDTH STUDY ON ENERGY USE AND POTENTIAL ENERGY SAVING OPPORTUNITIES IN U.S. CEMENT MANUFACTURING
xxii Executive Summary
R&D opportunity represents the opportunities for energy savings from technologies currently an R&D stage of development (early TRL) and are not ready for deployment to manufacturing. It represents the energy savings opportunities that can be achieved if the R&D is put into those technologies to get them to a high enough TRL level that they can be deployed in the manufacturing sector. Table 5-4 shows the R&D opportunity totals and percent for the evaluated sub-processes and extrapolated sector-wide.
Table 5-4. On-site Practical Minimum Energy Consumption and R&D Opportunity Energy Savings for Cement Manufacturing Processes in Four Sub-processes Studied
Sub-process On-site SOA Energy
Consumption (TBtu/year)
On-site PM Energy Consumption (TBtu/year)
R&D Opportunity (SOA-PM)
(TBtu/year)
R&D Opportunity Savings Percent* (SOA-PM)/(CT-TM)
Total for Sub-processes Studied** 177.8 171.4 6.4 3.6% Total for Cement Sector-wide ** 183.2† 176.7† 6.6 3.6%
Current Typical (CT), State of the Art (SOA), Practical Minimum (PM), Thermodynamic Minimum (TM) † Estimates for the entire sub-process were extrapolated by dividing the total on-site PM energy consumption for all the processes studied within the sub-process by the sub-process % coverage, found in Chapter 3. * Energy savings percent is calculated using TM energy consumption shown in Chapter 6 as the minimum energy consumption. The energy savings percent, with TM as the minimum, is calculated as follows: (SOA-PM)/(CT-TM). ** Totals may not sum due to independent rounding.

Executive Summary xxiii
6. Thermodynamic Minimum Energy Intensity and Energy Consumption for U.S. Cement Manufacturing
Real world cement production does not occur under theoretically ideal conditions; however, understanding the theoretical minimal amount of energy required to manufacture cement can provide a more complete understanding of the realistic opportunities for energy savings. This baseline can be used to establish more realistic projections (and bounds) for the future R&D energy savings that may be achieved. This chapter presents the thermodynamic minimum (TM) energy consumption required to manufacture cement.
6.1. Thermodynamic Minimum Energy Intensity TM energy consumption, which is based on Gibbs free energy (G) calculations, assumes ideal conditions that are unachievable in real-world applications. TM energy consumption assumes that all energy is used productively, that there are no energy losses, and that energy is ultimately perfectly conserved by the system (i.e., when cooling a material to room temperature or applying work to a process, the heat or work energy is fully recovered – perfect efficiency). It is not anticipated that any manufacturing process would ever attain this value in practice. A reasonable long-term goal for energy efficiency would be the practical minimum (see Chapter 5).
For manufacturing processes where there is an irreversible change to the material, resulting in a change to the embodied free energy content of the material (i.e., a chemical reaction or permanent crystalline change due to deformation), TM is not necessary equal to zero; in some cases the change in theoretical free energy content of the material requires energy input (TM > 0) and in other cases the change creates a theoretical free energy gain (TM < 0).
6.2. Calculated Thermodynamic Minimum Energy Intensity for Individual Cement
Sub-processes The thermodynamic minimum energy intensity was calculated for each cement sub-process by determining the Gibbs free energy (G) associated with the chemical transformations involved, under ideal conditions for a manufacturing process.8 The change in Gibbs free energy (ΔG) is defined in terms of the change in enthalpy (ΔH), temperature (T), and the change in entropy (ΔS), as shown in the following equation:
∆𝐺𝐺 = ∆𝐻𝐻 − 𝐶𝐶∆𝑆𝑆
The TM energy intensity calculation is path independent (state function), but is directly related to the relative energy levels of the substrates and the products. The reported value depends only on the starting material and the end product, and would not change if the process had greater or fewer process steps. Note that for processes that involve no net chemical changes or reactions, the TM energy intensity is zero because all energy expended is assumed to be perfectly recovered. The TM energy intensity is negative when the chemical reaction is net-exergonic and positive when the chemical reaction is net-endergonic.9 It is important to note that a negative TM value does not imply that the reaction will occur without being forced by a manufacturing process.
Most cement products have a zero TM energy intensity because there are no significant chemical reactions involved. There is one process of this sector that involves chemical reactions: pyroprocessing with cooling. The TMs for these sub-processes were calculated based on the net Gibbs free energy change and can be found below in Table 6-1. Complete details on the calculations can be found in Appendix A4.
8 Unless otherwise noted, “ideal conditions” means a pressure of one atmosphere and a temperature of 77°F. 9 Exergonic (reaction is favorable) and endergonic (reaction is not favorable) are thermodynamic terms for total change in Gibbs free energy (ΔG). This differs from exothermic (reaction is favorable) and endothermic (reaction is not favorable) terminology used in describing change in enthalpy (ΔH).
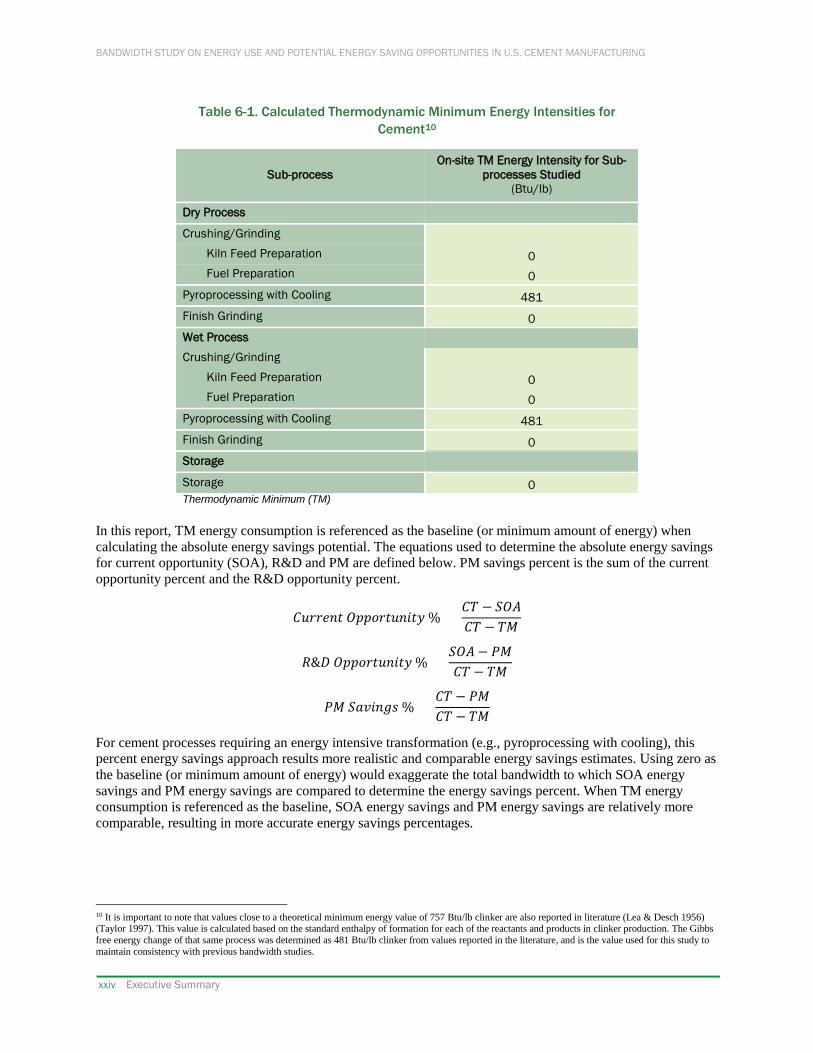
BANDWIDTH STUDY ON ENERGY USE AND POTENTIAL ENERGY SAVING OPPORTUNITIES IN U.S. CEMENT MANUFACTURING
xxiv Executive Summary
Table 6-1. Calculated Thermodynamic Minimum Energy Intensities for Cement10
Sub-process On-site TM Energy Intensity for Sub-
processes Studied (Btu/lb)
Dry Process
Crushing/Grinding Kiln Feed Preparation 0 Fuel Preparation 0
Pyroprocessing with Cooling 481 Finish Grinding 0 Wet Process Crushing/Grinding
Kiln Feed Preparation 0 Fuel Preparation 0
Pyroprocessing with Cooling 481 Finish Grinding 0 Storage Storage 0 Thermodynamic Minimum (TM)
In this report, TM energy consumption is referenced as the baseline (or minimum amount of energy) when calculating the absolute energy savings potential. The equations used to determine the absolute energy savings for current opportunity (SOA), R&D and PM are defined below. PM savings percent is the sum of the current opportunity percent and the R&D opportunity percent.
𝐶𝐶𝐶𝐶𝐶𝐶𝐶𝐶𝐶𝐶𝑆𝑆𝐶𝐶 𝑆𝑆𝑂𝑂𝑂𝑂𝑂𝑂𝐶𝐶𝐶𝐶𝐶𝐶𝑆𝑆𝑆𝑆𝐶𝐶𝑂𝑂 % = 𝐶𝐶𝐶𝐶 − 𝑆𝑆𝑆𝑆𝑆𝑆𝐶𝐶𝐶𝐶 − 𝐶𝐶𝑇𝑇
𝑅𝑅&𝐷𝐷 𝑆𝑆𝑂𝑂𝑂𝑂𝑂𝑂𝐶𝐶𝐶𝐶𝐶𝐶𝑆𝑆𝑆𝑆𝐶𝐶𝑂𝑂 % = 𝑆𝑆𝑆𝑆𝑆𝑆 − 𝑃𝑃𝑇𝑇𝐶𝐶𝐶𝐶 − 𝐶𝐶𝑇𝑇
𝑃𝑃𝑇𝑇 𝑆𝑆𝑆𝑆𝑆𝑆𝑆𝑆𝑆𝑆𝑆𝑆𝑆𝑆 % = 𝐶𝐶𝐶𝐶 − 𝑃𝑃𝑇𝑇𝐶𝐶𝐶𝐶 − 𝐶𝐶𝑇𝑇
For cement processes requiring an energy intensive transformation (e.g., pyroprocessing with cooling), this percent energy savings approach results more realistic and comparable energy savings estimates. Using zero as the baseline (or minimum amount of energy) would exaggerate the total bandwidth to which SOA energy savings and PM energy savings are compared to determine the energy savings percent. When TM energy consumption is referenced as the baseline, SOA energy savings and PM energy savings are relatively more comparable, resulting in more accurate energy savings percentages.
10 It is important to note that values close to a theoretical minimum energy value of 757 Btu/lb clinker are also reported in literature (Lea & Desch 1956) (Taylor 1997). This value is calculated based on the standard enthalpy of formation for each of the reactants and products in clinker production. The Gibbs free energy change of that same process was determined as 481 Btu/lb clinker from values reported in the literature, and is the value used for this study to maintain consistency with previous bandwidth studies.

Executive Summary xxv
6.3. Thermodynamic Minimum Energy Consumption by Sub-process and Sector-wide The minimum baseline of energy consumption for a cement manufacturing process is its TM energy consumption. If all the 2010 level of cement manufacturing occurred at TM energy intensity, there would be 100% savings. The percentage of energy savings is determined by calculating the decrease in energy consumption and dividing it by the total possible savings (CT energy consumption-TM energy consumption).
Table 6-2 provides the TM energy consumption for the sub-processes studied and sector-wide. It is important to keep in mind that ideal conditions are unrealistic goals in practice and these values serve only as a guide to estimating energy savings opportunities. As mentioned, the TM energy consumption was used to calculate the current and R&D energy savings percentages (not zero). The total TM energy consumption sector-wide for the processes studied is positive due to energy required for the pyroprocessing with cooling step.
Table 6-2. On-site Thermodynamic Minimum Energy Consumption for Cement Manufacturing in Sub-processes Studied and Sector-Wide
Sub-process On-site TM Energy
Intensity (Btu/lb)
Production (million lb/year)
On-site TM Energy Consumption, Calculated (TBtu/year)
Dry Process Crushing/Grinding
Kiln Feed Preparation 0 225,244 0.0 Fuel Preparation 0 15,600 0.0
Pyroprocessing with Cooling 481 129,009 62.1 Finish Grinding 0 140,942 0.0 Storage 0 140,942 0.0 Total for Sub-processes Studied* 481 n/a 62.1 Thermodynamic Minimum (TM) * Totals may not sum due to independent rounding.

BANDWIDTH STUDY ON ENERGY USE AND POTENTIAL ENERGY SAVING OPPORTUNITIES IN U.S. CEMENT MANUFACTURING
xxvi Executive Summary
7. U.S. Cement Manufacturing Current and R&D Opportunity Analysis/Bandwith Summary
This chapter presents the energy savings bandwidths for the cement manufacturing sub-processes studied and sector-wide based on the analysis and data presented in the previous Chapters and the following Appendices. Data is presented for the four sub-processes studied and extrapolated to estimate the energy savings potential for all of U.S. cement manufacturing.
Table 7-1 presents the current opportunity and R&D opportunity energy savings for the sub-processes studied for cement manufacturing as well as the total sector. Each row in Table 7-1 shows the opportunity bandwidth for a specific cement sub-process and as a sector-wide total. As previously noted, the energy savings opportunities presented reflect the estimated production of cement products for selected sub-processes and sector-wide in baseline year 2010.
Table 7-1. Current and R&D Opportunity for Cement Manufacturing
Sub-process
Current Opportunity for Sub-processes
Studied*** (CT-SOA)
(TBtu/year)
R&D Opportunity for Sub-
processes Studied***
(SOA-PM) (TBtu/year)
Crushing/Grinding* 3.9 0.7 Pyroprocessing with Cooling** 50.0 5.2 Finish Grinding** 5.8 0.4 Storage 0.2 0.0 Total for Processes Studied*** 59.9 6.4 Total for Cement Manufacturing Sector-wide (extrapolated) 61.8 6.6
Current typical (CT), state of the art (SOA), practical minimum (PM) * Includes both the wet and dry process for kiln feed preparation and fuel grinding sub-processes ** Includes both the wet and dry process *** Totals may not sum due to independent rounding.
As shown in Figure 7-1, four hypothetical opportunity bandwidths for energy savings are estimated (as defined in Chapter 1). For the four sub-processes studied, the analysis shows the following:
• Current Opportunity – 59.9 TBtu per year of energy savings could be obtained if state of the art technologies and practices are deployed.
• R&D Opportunity – 6.4 TBtu per year of additional energy savings could be attained in the future if applied R&D technologies under development worldwide are deployed (i.e., reaching the practical minimum).
For sector-wide U.S. cement manufacturing (based on extrapolated data), the analysis shows the following:

Executive Summary xxvii
• Current Opportunity – 61.8 TBtu per year of energy savings could be obtained if state of the art technologies and practices are deployed.
• R&D Opportunity – 6.6 TBtu per year of additional energy savings could be attained in the future if applied R&D technologies under development worldwide are deployed (i.e., reaching the practical minimum).
Figure 7-1 also shows the estimated current and R&D energy savings opportunities for individual cement manufacturing sub-processes as well as sector-wide. The area between R&D opportunity and impractical is shown as a dashed line with color fading because the PM energy savings impacts are based on today’s knowledge of research tested between laboratory and demonstration scale; emerging technologies being investigated through modeling and theoretical calculations may eventually bring the PM energy consumption further into the faded region and closer to the TM energy consumption.
From the sub-processes studied, the greatest current and R&D percent energy savings opportunity for cement manufacturing comes from upgrading finish grinding. In addition, the greatest total current and R&D energy savings opportunity for cement manufacturing comes from upgrading pyroprocessing with cooling—this is largely due to the fact that a significant amount of energy consumed in the sector occurs in these sub-processes.
The impractical bandwidth, or the difference between PM energy consumption and TM energy consumption, represents the area that would require fundamental changes in cement manufacturing. The term impractical is used because the PM energy consumption is based on current knowledge of R&D technologies tested between laboratory and demonstration scale; further decreases in energy intensity have not been displayed at any physical scale. The TM energy consumption is based on ideal conditions that are typically unattainable in commercial applications. It was used as the baseline for calculating the energy savings potentials (not zero) to provide more accurate targets of energy savings opportunities.
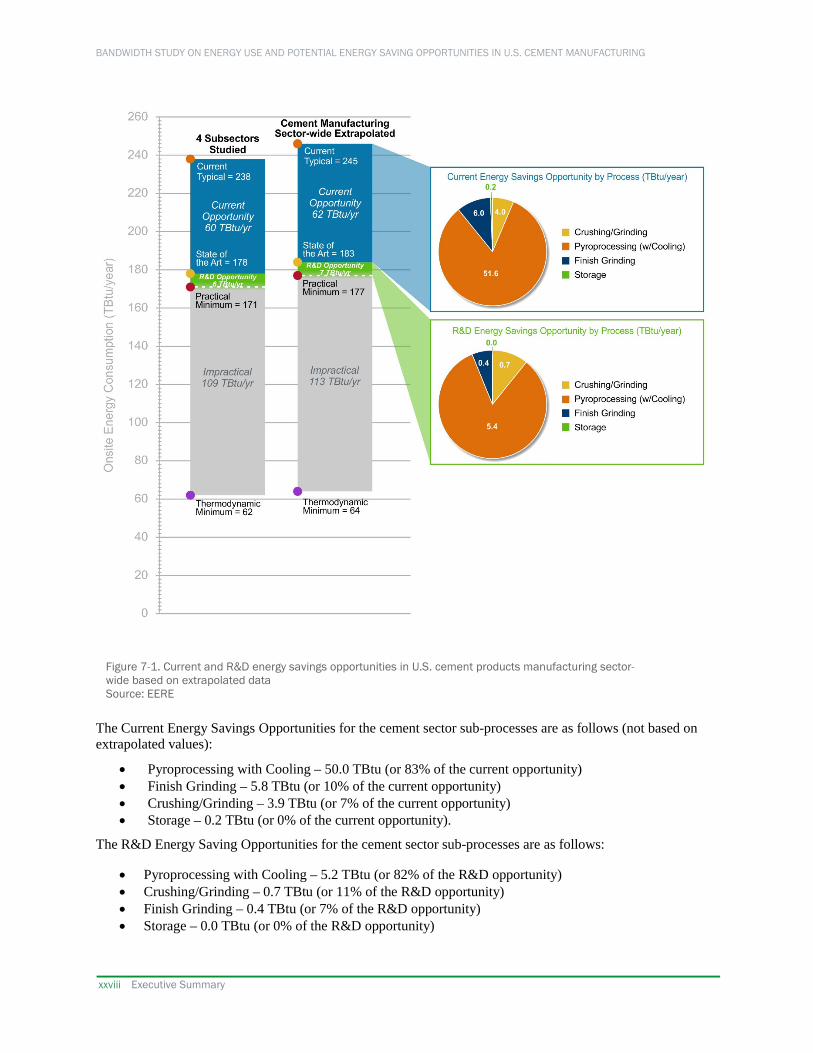
BANDWIDTH STUDY ON ENERGY USE AND POTENTIAL ENERGY SAVING OPPORTUNITIES IN U.S. CEMENT MANUFACTURING
xxviii Executive Summary
The Current Energy Savings Opportunities for the cement sector sub-processes are as follows (not based on extrapolated values):
• Pyroprocessing with Cooling – 50.0 TBtu (or 83% of the current opportunity) • Finish Grinding – 5.8 TBtu (or 10% of the current opportunity) • Crushing/Grinding – 3.9 TBtu (or 7% of the current opportunity) • Storage – 0.2 TBtu (or 0% of the current opportunity).
The R&D Energy Saving Opportunities for the cement sector sub-processes are as follows:
• Pyroprocessing with Cooling – 5.2 TBtu (or 82% of the R&D opportunity) • Crushing/Grinding – 0.7 TBtu (or 11% of the R&D opportunity) • Finish Grinding – 0.4 TBtu (or 7% of the R&D opportunity) • Storage – 0.0 TBtu (or 0% of the R&D opportunity)
Figure 7-1. Current and R&D energy savings opportunities in U.S. cement products manufacturing sector-wide based on extrapolated data Source: EERE
References 29
8. References APP 2009 Asia-Pacific Partnership on Clean Development & Climate (APP). Energy Efficiency and
Resource Saving Technologies in Cement Industry. 2009. CSI 2009 Cement Industry Energy and CO2 Performance: "Getting the Numbers Right". Prepared by
the Cement Sustainability Initiative (CSI) for the World Business Council for Sustainable Development. 2009.
DOE 2014 Manufacturing Energy and Carbon Footprint. Sector: Cement. U.S. Department of Energy
(DOE), Advanced Manufacturing Office. 2014. https://energy.gov/sites/prod/files/2014/02/f7/2014_cement_energy_carbon_footprint.pdf
DOE 2017 U.S. Department of Energy (DOE), Advanced Manufacturing Office (AMO). “Bandwidth
Studies.” 2017. https://energy.gov/eere/amo/energy-analysis-sector#5 ECRA 2009 European Cement Research Academy (ECRA). Development of State of the Art-
Techniques in Cement Manufacturing: Trying to Look Ahead. June 4, 2009. EPA 2010 EPA (2010), "Available and Emerging Technologies for Reducing Greenhouse Gas
Emissions from the Portland Cement Industry" Farag 2012 Farag, L.M., "Energy and Exergy Analyses of Egyptian Cement Kiln Plant with Complete
Kiln Gas Diversion through by Pass", International J of Advances in Applied Sciences, Vol 1, No1, 2012.
Fumo et al. 1996
Fumo, D.A., Morelli, M.R., and Segadães, A.M. “Combustion Synthesis of Calcium Aluminates.” Materials Research Bulletin, Vol 31, No 10, pg 1243-1255, 1996.
Harder 2010
Harder, J. (2010). “Grinding trends in the cement industry.” ZKG International, 4(63):46-58. einkaufsfuehrer-bau.de/forum/2.pdf
IFC 2013 International Finance Corporation (IFC). 2013. Existing and Potential Technologies for
Carbon Emissions Reductions in the Indian Cement Industry: A set of technical papers produced for the project ‘Low Carbon Technology Roadmap for the Indian Cement Industry’. Prepared for Cement Sustainability Initiative (CSI).
IIP 2017 Industrial Efficiency Technology Database: Cement. Institute for Industrial Productivity
(IIP), 2017. http://ietd.iipnetwork.org/content/cement Lea & Desch 1956
The Chemistry of Cement and Concrete. Lea, F.M. and Desch, C.H. St. Martin’s Press: New York, NY. 1956.
LBNL 2009 Price, L., Hasanbeigi, A., Lu, H., and Lan, W. (2009). "Analysis of Energy-Efficiency
Opportunities for the Cement Industry in Shandong Province, China." LBNL 2012 LBNL. (2012), "Emerging Energy-efficiency and CO2 Emission-reduction Technologies
for Cement and Concrete Production."
BANDWIDTH STUDY ON ENERGY USE AND POTENTIAL ENERGY SAVING OPPORTUNITIES IN U.S. CEMENT MANUFACTURING
30 References
Madlool et al. 2011
Madlool, N. A., Saidur, R., Hossain, M. S., & Rahim, N. A. "A Critical Review on Energy Use and Savings in the Cement Industries." Renewable and Sustainable Energy Reviews, 15:2042-2060. 2011.
Marceau et al. 2006
Marceau, M. L., Nisbet, M. A., and VanGeem, M. G. Life Cycle Inventory of Portland Cement Manufacture. SN2095b, Portland Cement Association. Skokie, Illinois, USA. 2006. 69 pages.
Matschei 2007
Matschei, T. Thermodynamics of Cement Hydration. University of Aberdeen. December 2007. http://library.eawag-empa.ch/empa_publications_2007_open_access/EMPA20070485.pdf.
NREL 2012 National Renewable Energy Laboratory (NREL). NREL US LCI Database: Portland
cement, at plant. 2012. Accessed December 19, 2016 from https://uslci.lcacommons.gov/uslci/process/show/28901
PG&E 2006 Cement Industry Energy Baseline Study. Prepared by Resource Dynamics Corporation for
Pacific Gas & Electric (PG&E). October 2006. Robie and Hemingway 1995
Robie, R. A., Hemingway, B. S. "Thermodynamic Properties of Minerals and Related Substances at 298.15K and 1 Bar Pressure and at Higher Temperatures." USGS Bulletin 2131, 1995.
Ruth et al. 2000
Ruth, M., Worrell, E., & Price, L., "Evaluating Clean Development Mechanism Projects in the Cement Industry Using a Process-Step Benchmarking Approach." 2000. Report LBNL-45346.
Taylor 1997 Cement Chemistry. 2nd ed. Taylor, HFW. Thomas Telford Publishing: London, England.
1997. USCB 2012 U.S. Census Bureau (USCB). 2010 County Business Patterns. 2012.
https://factfinder.census.gov/faces/tableservices/jsf/pages/productview.xhtml?src=bkmk USGS 2011 U.S. Geological Survey (USGS). 2011 Minerals Yearbook: Cement [Advance Release].
2011. https://minerals.usgs.gov/minerals/pubs/commodity/cement/ Worrell et al. 2001
Worrell, E., Price, L., Martin, N., Hendriks, C., & Meida, L. O. "Carbon Dioxide Emissions From The Global Cement Industry." Annual Review of Energy and the Environment, 26:303-329. 2001.
Worrell et al. 2008
Worrell, E., Price, L., Neelis, M., Galitsky, C., & Nan, Z. World Best Practice Energy Intensity Values for Selected Industrial Sectors. 2008. Report LBNL-62806, Rev. 2.
Worrell et al. 2013
Worrell, E., Kermili, K., & Galitsky, C. Energy Efficiency Improvement and Cost Saving Opportunities for Cement Making: An ENERGY STAR® Guide for Energy and Plant Managers. 2013. https://www.energystar.gov/buildings/facility-owners-and-managers/industrial-plants/measure-track-and-benchmark/energy-star-energy-1
Zhu 2011 Zhu, Q. CO2 abatement in the cement industry. IEA Clean Coal Centre, June 2011. ISBN
978-92-9029-504-4.

Appendix A1: Master Cement Manufacturing Summary Table 31
Appendix A1: Master Cement Manufacturing Summary Table
Table A1. U.S. Production Volume of Cement Manufacturing Processes in 2010 with Energy Intensity Estimates and Calculated On-site Energy Consumption for the Four Bandwidth Measures (Excludes Feedstock Energy)
Sub-process (Product) 2010 Production (million lb) On-site Energy Intensity
(Btu/lb)
Calculated On-site Energy Consumption*
(TBtu/year) CT SOA PM TM CT SOA PM TM
Dry Process Crushing/Grinding (raw meal, fuel)
Kiln Feed Preparation (raw meal)
210,175 (CT); 225,244 (SOA, PM, TM) 55 39 36 0 11.5 8.7 8.1 0.0
Fuel Preparation (fuel) 14,176 (CT); 15,600 (SOA, PM, TM) 54 31 28 0 0.8 0.5 0.4 0.0
Pyroprocessing with Cooling (clinker)
120,371 (CT); 129,009 (SOA, PM, TM) 1,554 1,247 1,206 481 187.1 160.8 155.6 62.1
Finish Grinding (cement) 131,513 (CT); 140,942 (SOA, PM, TM) 92 51 48 0 12.0 7.2 6.8 0.0
Wet Process Crushing/Grinding (raw meal, fuel)
Kiln Feed Preparation (raw meal)
15,069 (CT); 0 (SOA, PM, TM) 48 39 39 0 0.7 0.0 0.0 0.0
Fuel Preparation (fuel) 1,424 (CT); 0 (SOA, PM, TM) 54 31 28 0 0.1 0.0 0.0 0.0
Pyroprocessing with Cooling (clinker)
8,638 (CT); 0 (SOA, PM, TM) 2,750 1,653 1,612 481 23.8 0.0 0.0 0.0
Finish Grinding (cement) 9,429 (CT); 0 (SOA, PM, TM) 105 30 27 0 1.0 0.0 0.0 0.0
Storage Storage (cement) 140,942 5 4 4 0 0.8 0.5 0.5 0.0
Dry Process SUBTOTAL, Processes Studied* 211.4 177.2 170.9 62.1 Wet Process SUBTOTAL, Processes Studied* 25.6 0.0 0.0 0.0
Storage SUBTOTAL, Processes Studied* 0.8 0.5 0.5 0.0 Total for all Processes Studied* 237.7 177.8 171.4 62.1
Total for Sector-Wide, CT from MECS, Extrapolated for SOA, PM, TM* 245.0 183.2 176.7 64.0

BANDWIDTH STUDY ON ENERGY USE AND POTENTIAL ENERGY SAVING OPPORTUNITIES IN THE MANUFACTURING OF CEMENT
32 Appendix A1: Master Cement Manufacturing Summary Table
Table A1. U.S. Production Volume of Cement Manufacturing Processes in 2010 with Energy Intensity Estimates and Calculated On-site Energy Consumption for the Four Bandwidth Measures (Excludes Feedstock Energy)
Sub-process (Product) 2010 Production (million lb) On-site Energy Intensity
(Btu/lb)
Calculated On-site Energy Consumption*
(TBtu/year) CT SOA PM TM CT SOA PM TM
The four bandwidth measures are current typical (CT), state of the art (SOA), practical minimum (PM), and thermodynamic minimum (TM). * Totals may not sum due to independent rounding.

Appendix A2. References for Production, CT, SOA, PM, TM 33
Appendix A2: References for Production, CT, SOA, PM, and TM Table A2. U.S. Production Volume of Cement Manufacturing Processes in 2010 with Energy Intensity Estimates and Calculated On-site Energy
Consumption for the Four Bandwidth Measures (Excludes Feedstock Energy)
Sub-process Production Reference(s)
CT Energy Intensity Reference(s)
SOA Energy Intensity
Reference(s)
PM Energy Intensity Reference(s)
TM Energy Intensity Reference(s)
Dry Process
Crushing/Grinding
Kiln Feed Preparation USGS 2011 Zhu 2011, Worrell et al. 2013
Zhu 2011, Worrell et al. 2013
Zhu 2011, Worrell et al. 2013
Set to zero due to minimal chemical conversions
Fuel Preparation USGS 2011 IIP 2017 IIP 2017 IIP 2017, LBNL 2009, APP 2009
Set to zero due to minimal chemical conversions
Pyroprocessing with Cooling USGS 2011 LBNL 2012, ECRA 2009
Worrell et al. 2013, ECRA 2009 IFC 2013, ECRA 2009 Internal calculations
Finish Grinding* USGS 2011 Worrell et al. 2013 PG&E 2006 APP 2009 Set to zero due to minimal chemical conversions
Wet Process
Crushing/Grinding
Kiln Feed Preparation USGS 2011 Zhu 2011, Worrell et al. 2013
Zhu 2011, Worrell et al. 2013
Zhu 2011, Worrell et al. 2013
Set to zero due to minimal chemical conversions
Fuel Preparation USGS 2011 IIP 2017 IIP 2017 IIP 2017, LBNL 2009, APP 2009
Set to zero due to minimal chemical conversions
Pyroprocessing with Cooling USGS 2011 Worrell et al. 2013, ECRA 2009
Worrell et al. 2013, ECRA 2009 IFC 2013, ECRA 2009 Internal calculations
Finish Grinding* USGS 2011 Worrell et al. 2013 Worrell et al. 2008 APP 2009 Set to zero due to minimal chemical conversions
Storage
Storage USGS 2011 Madlool et al. 2011, Worrell et al. 2008
Madlool et al. 2011, Worrell et al. 2008
Madlool et al. 2011, Worrell et al. 2008
Set to zero due to minimal chemical conversions
The four bandwidth measures are current typical (CT), state of the art (SOA), practical minimum (PM), and thermodynamic minimum (TM) * Peer reviewer indicated that wet process finish grinding should have the same energy intensity as dry process finishing grinding for SOA and PM. References listed here used as basis for value given in Table A1.

BANDWIDTH STUDY ON ENERGY USE AND POTENTIAL ENERGY SAVING OPPORTUNITIES IN THE MANUFACTURING OF CEMENT
34 Appendix A3: Practical Minimum Energy Intensity Calculation and Example Technologies Considered
Appendix A3: Practical Minimum Energy Intensity Calculation and Example Technologies Considered To estimate PM energy consumption for this bandwidth analysis, a broad search of R&D activities in the cement industry was conducted. A large number and range of potential technologies were identified. If more than one technology was considered for a particular process, the technology that resulted in the lowest energy intensity was selected for the PM energy intensity. The on-site PM energy intensity and consumption values are shown in Table A3-1 below.
Table A3-1. Calculated PM Energy Consumption for Cement Manufacturing
Sub-process On-site PM Energy
Intensity (Btu/lb)
On-site PM Energy Consumption, Calculated*
(TBtu/year) Dry Process
Crushing/Grinding Kiln Feed Preparation 36 8.1 Fuel Preparation 28 0.4
Pyroprocessing with Cooling 1,206 155.6 Finish Grinding 48 6.8
Wet Process Crushing/Grinding
Kiln Feed Preparation 39 0.0 Fuel Preparation 28 0.0
Pyroprocessing with Cooling 1,612 0.0 Finish Grinding 27 0.0
Storage Storage 4 0.5
Total for Sub-processes Studied 171.4 Practical Minimum (PM) * Totals may not sum due to independent rounding.
The PM energy intensity for cement manufacturing was determined based on the technologies outlined in Table A3-2. The applicability column indicates the sub-process where the technology is considered for application. The percent savings over the PM baseline is estimated, along with a brief explanation.

Appendix A3: Practical Minimum Energy Intensity Calculation and Example Technologies Considered 35
Some technologies in Table A3-2 were considered but not included in the final PM model (in most of the cases the savings estimates were conservative compared to SOA energy intensity).
In some cases, there was a limited amount of information available on technologies for specific stages (such as storage and finish grinding), requiring best engineering judgment to be used in determining the PM energy intensity. For storage, the PM energy intensity and consumption values are calculated to be the same as the SOA energy intensity and consumption values based on best engineering judgment.
Table A3-2. Details of Cement Practical Minimum Technologies Considered Energy
Technology Name Description Applicability Explanation of Energy
Savings Assumptions
Savings Estimate
(percentage
Included in SOA
Calculations
Included in PM
Calculations References
or energy intensity)
Standalone savings Crushing/Grinding Energy savings estimated 71% No Yes Zhu 2011
Upgrading to gravity-fed silo
for blending step. Saving over mechanical blending
(dry) as 0.00576 MJ/kg over mechanical system
system.
Mechanical Crushing/Grinding Energy consumption is 30 62 Btu/lb No No LBNL 2012 activation or to 50 kWh/t product. cement enhanced reactivity of fly ash or blast For every t of clinker furnace slag in replaced by additives from cement mechanical activation
High-activation grinding, the avoided grinding energy uses are
approximately: •thermal energy: 3.0 to 6.5 GJ/t clinker •electricity: 60 to 100 kWh/t clinker (European Commission 2010)
Calcareous Oil Shale as an
Calcareous oil shale can be used as an alternative feedstock
Crushing/Grinding Energy use could be reduced by 74 MJ/t cement if oil shale is used to make
32 Btu/lb cement
No No LBNL 2012

BANDWIDTH STUDY ON ENERGY USE AND POTENTIAL ENERGY SAVING OPPORTUNITIES IN THE MANUFACTURING OF CEMENT
36 Appendix A3: Practical Minimum Energy Intensity Calculation and Example Technologies Considered
Table A3-2. Details of Cement Practical Minimum Technologies Considered Energy
Technology Name Description Applicability Explanation of Energy
Savings Assumptions
Savings Estimate
(percentage
Included in SOA
Calculations
Included in PM
Calculations References
or energy intensity)
Alternative Raw and partial fuel up 8 percent of the raw Material substitute in clinker meal in cement production.
production
Pneumatic and Crushing/Grinding Energy savings of 2.9 5 Btu/lb No No EPA 2010 mechanical conveyor kWh/ton cement cement systems are used throughout cement plants to convey kiln
Switch from feed, kiln dust, pneumatic to finished cement, and mechanical raw fuel. Mechanical material systems typically use transport less energy than
pneumatic systems, and switching to mechanical conveyor systems can save 2.9 kWh/ton of cement.
Conversion from Crushing/Grinding Energy savings of 2.5 4 Btu/lb No No EPA 2010 pneumatic systems kWh/ton cement cement
Use of belt conveyors and bucket elevators instead of pneumatics
to mechanical systems may be cost-effective due to increased reliability and reduced downtime, which can also reduce energy consumption.

Appendix A3: Practical Minimum Energy Intensity Calculation and Example Technologies Considered 37
Table A3-2. Details of Cement Practical Minimum Technologies Considered Energy
Technology Name Description Applicability Explanation of Energy
Savings Assumptions
Savings Estimate
(percentage
Included in SOA
Calculations
Included in PM
Calculations References
or energy intensity)
Gravity-fed raw meal Crushing/Grinding Energy savings of 1.4-3.5 4 Btu/lb No No EPA 2010
Convert raw meal blending silo to gravity-type homogenizing silo
blending systems mixes the raw meal thoroughly to form a homogenous mixture, which optimizes clinker
kWh/ton cement cement
production.
Energy efficiency Crushing/Grinding Energy savings of 1.0 2 Btu/lb No No EPA 2010
Improvements in raw material blending
measure used to increase production volumes and decrease energy
kWh/ton cement cement
consumption.
Ball mills combined Crushing/Grinding Energy savings of 10 17 Btu/lb No No EPA 2010 with high pressure kWh/ton cement cement roller presses, or
Replace ball mills with high efficiency roller mills
horizontal roller mills, used to increase grinding efficiency, which may reduce
energy consumption by 9 – 11 kWh/ton cement
Replace ball mills with vertical
Replacing older ball mills with vertical roller mills or high
Crushing/Grinding Energy savings of 11-15 kWh/ton cement
22 Btu/lb cement
No No EPA 2010

BANDWIDTH STUDY ON ENERGY USE AND POTENTIAL ENERGY SAVING OPPORTUNITIES IN THE MANUFACTURING OF CEMENT
38 Appendix A3: Practical Minimum Energy Intensity Calculation and Example Technologies Considered
Table A3-2. Details of Cement Practical Minimum Technologies Considered Energy
Technology Name Description Applicability Explanation of Energy
Savings Assumptions
Savings Estimate
(percentage
Included in SOA
Calculations
Included in PM
Calculations References
or energy intensity)
roller pressure grinding mills rolls can reduce the
electricity demand of the grinding operation from 11 – 15 kWh/ton cement.
High-pressure roller Crushing/Grinding Modern state-of-the-art 13% No Yes Harder mill and the concepts utilize a high- 2010; horizontal roller mill pressure roller mill and the Worrell et al.
horizontal roller mill (e.g., 2013; Zhu Horomill®) (Seebach et al., 2011 1996) that are claimed to use 20-50% less energy than a ball mill.
Advanced horizontal roller mill
Finish Grinding Zhu 2011 states an SOA value of 0.043 MJ/kg raw
No
meal. Taking 50% of this value results in an estimated energy value of 0.022 MJ/kg raw meal.
Estimated percent savings with the reported SOA is; 1-(0.022/0.025) = 13%.
High Efficiency Classifiers that Crushing/Grinding Energy savings of 3.8-5.2 8 Btu/lb No No EPA 2010 Classifiers efficiently separate kWh/ton cement cement

Appendix A3: Practical Minimum Energy Intensity Calculation and Example Technologies Considered 39
Table A3-2. Details of Cement Practical Minimum Technologies Considered Energy
Technology Name Description Applicability Explanation of Energy
Savings Assumptions
Savings Estimate
(percentage
Included in SOA
Calculations
Included in PM
Calculations References
or energy intensity)
particles by size, which minimizes grinder loading and energy consumption
Finish Grinding Energy savings of 1.7-2.3 kWh/ton cement
3 Btu/lb cement
No No EPA 2010
as a result.
The uncrushed Crushing/Grinding As compared with 30% No No APP 2009 materials jumped out conventional internal from the table, fall circulating system, power through gas inlet box consumed for fan is
External to, and collected by reduced until half and it’s circulating the mechanical possible to reduce power of system to vertical transportation grinding system by about roller mill equipment installed 30%
below the mill such as chain conveyor and bucket elevator etc.
The raw materials Crushing/Grinding Power consumption of 5 Btu/lb raw No No APP 2009 are dried and ground fan(s) reduces about 3 to 4 meal
Direct dust by the mill kWh/t. collection system simultaneously in to vertical mill one-pass kiln exit gas grinding process and then fine product
after separation is sent to EP directly.
A pre-grinder, which Crushing/Grinding Specific power 25% No No APP 2009 Pre-grinding is roller mill or roller consumption of tube mill equipment for press, as coarse only: 25% down
grinding before the

BANDWIDTH STUDY ON ENERGY USE AND POTENTIAL ENERGY SAVING OPPORTUNITIES IN THE MANUFACTURING OF CEMENT
40 Appendix A3: Practical Minimum Energy Intensity Calculation and Example Technologies Considered
Table A3-2. Details of Cement Practical Minimum Technologies Considered Energy
Technology Name Description Applicability Explanation of Energy
Savings Assumptions
Savings Estimate
(percentage
Included in SOA
Calculations
Included in PM
Calculations References
or energy intensity)
raw material existing tube mill, grinding process which is exclusively
used for fine grinding.
The cause of this Crushing/Grinding The decrease of power 2 Btu/lb raw No No APP 2009 phenomenon is that consumption rate is not meal grids contained in the remarkable but below 1 separator returned kWh per ton of raw power directly enters materials. the second chamber.
Classification of powder returned from raw material
To separate grids from the returned powder and return them to the first chamber for coarse
separator grinding, a simple grid screen (classifier).
was installed at the return chute of the separator
Wash mills and classifiers
Use of wash mills instead of tube mills and circuit classifiers
Crushing/Grinding (wet)
Baseline set at efficient tube mill: 13 kWh/ton of raw meal
22 Btu/lb raw meal
No No PG&E 2006, Madlool et al. 2011
Slurry blending Optimizing the water Crushing/Grinding 0.3-0.5 kWh/tonne 3 Btu/lb raw No No Madlool et and content in the raw (wet) energy/fuel savings; 0.5- meal al. 2011 homogenizing meal slurry for the
wet process leads to
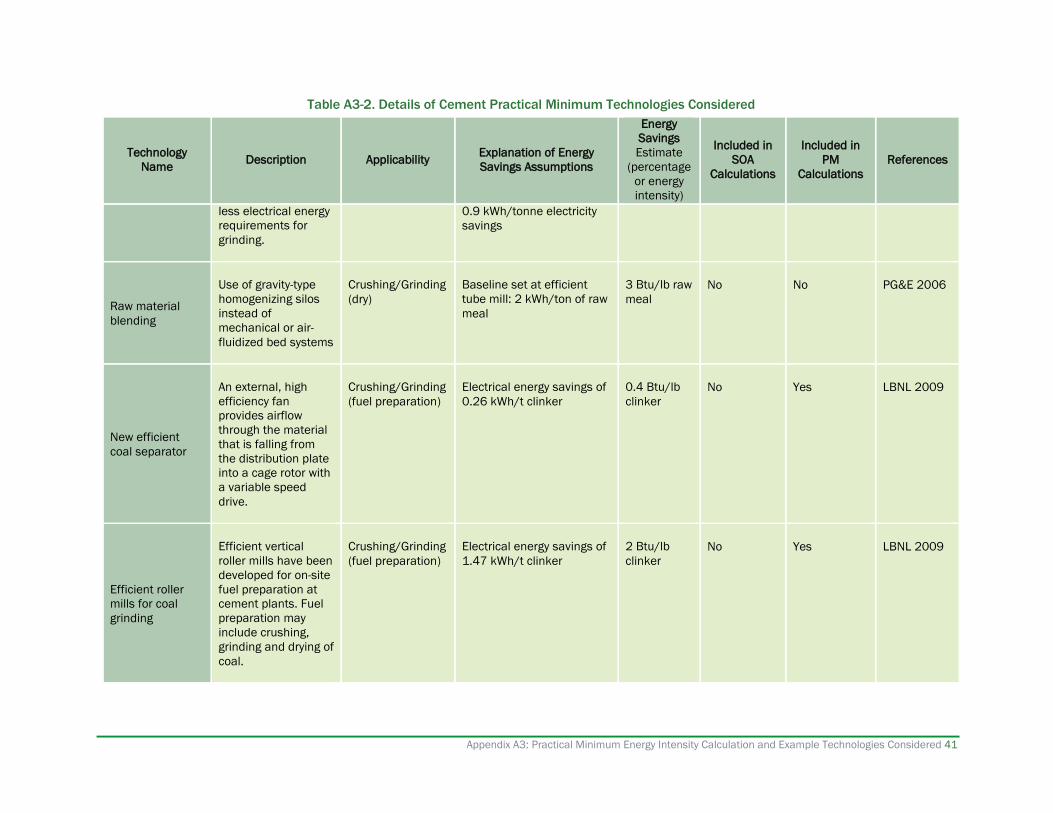
Appendix A3: Practical Minimum Energy Intensity Calculation and Example Technologies Considered 41
Table A3-2. Details of Cement Practical Minimum Technologies Considered Energy
Technology Name Description Applicability Explanation of Energy
Savings Assumptions
Savings Estimate
(percentage
Included in SOA
Calculations
Included in PM
Calculations References
or energy intensity)
less electrical energy 0.9 kWh/tonne electricity requirements for savings grinding.
Use of gravity-type Crushing/Grinding Baseline set at efficient 3 Btu/lb raw No No PG&E 2006
Raw material blending
homogenizing silos instead of mechanical or air-
(dry) tube mill: 2 kWh/ton of raw meal
meal
fluidized bed systems
An external, high Crushing/Grinding Electrical energy savings of 0.4 Btu/lb No Yes LBNL 2009 efficiency fan (fuel preparation) 0.26 kWh/t clinker clinker provides airflow
New efficient coal separator
through the material that is falling from the distribution plate into a cage rotor with a variable speed drive.
Efficient vertical Crushing/Grinding Electrical energy savings of 2 Btu/lb No Yes LBNL 2009 roller mills have been (fuel preparation) 1.47 kWh/t clinker clinker developed for on-site
Efficient roller fuel preparation at mills for coal cement plants. Fuel grinding preparation may
include crushing, grinding and drying of coal.

BANDWIDTH STUDY ON ENERGY USE AND POTENTIAL ENERGY SAVING OPPORTUNITIES IN THE MANUFACTURING OF CEMENT
42 Appendix A3: Practical Minimum Energy Intensity Calculation and Example Technologies Considered
Table A3-2. Details of Cement Practical Minimum Technologies Considered Energy
Technology Name Description Applicability Explanation of Energy
Savings Assumptions
Savings Estimate
(percentage
Included in SOA
Calculations
Included in PM
Calculations References
or energy intensity)
Installation of VFD & replacement of coal mill bag dust collector's fan
Variable frequency drives can be installed on coal mill bag dust collector fans to improve energy efficiency.
Crushing/Grinding (fuel preparation)
Electrical energy savings of 0.16 kWh/t clinker
0.2 Btu/lb clinker
No Yes LBNL 2009
In a vertical coal mill, Crushing/Grinding Capable of reducing 23% No No APP 2009 drying, grinding, and (fuel preparation) electricity consumptions for separating/classifyin coal grinding by 20-25%.
Vertical coal mill g of coal can be done simultaneously. Hence, production and energy efficiency is higher.
High Efficiency Energy and thermal Pyroprocessing Electrical energy savings of 40.6 Btu/lb No Yes Harder 2010 and Low efficiency measures with Cooling 3.0 kWh/tonne clinker; fuel clinker Pressure Drop can drive down SOA savings of 20.0 kcal/kg Preheating Stage energy value clinker
Burns raw materials Pyroprocessing FBK energy use is expected 13% No No LBNL 2012 into powder with with Cooling to be 10 to 15 percent
Fluidized bed kiln granules 1.5 to 2.5 lower than that of millimeters (mm) in conventional rotary kilns. diameter
Use of Steel Slag During the kiln Pyroprocessing Using 10 percent slag 82 Btu/lb No No LBNL 2012 as Raw Material pyroprocess, ¾-inch- with Cooling would reduce energy cement for the Kiln - to 1-inch-diameter consumption by 0.19

Appendix A3: Practical Minimum Energy Intensity Calculation and Example Technologies Considered 43
Table A3-2. Details of Cement Practical Minimum Technologies Considered Energy
Technology Name Description Applicability Explanation of Energy
Savings Assumptions
Savings Estimate
(percentage
Included in SOA
Calculations
Included in PM
Calculations References
or energy intensity)
CemStar® slag is added to the GJ/tonne, CO2 emissions by Technology feed end of the kiln roughly 11 percent, and
as a component of NOx emissions by 9 to 60 the raw material mix percent, depending on kiln
type and plant specific conditions (Worrell et al. 2008; Perkins 2000).
Automated control Pyroprocessing 2.5-5% or 42-167 MJ/ton 4% No No EPA 2010 systems that can be with Cooling cement and electricity used to maintain savings of 1 kWh/ton operating conditions cement
Process control in the kiln at and optimum levels, management which leads to more systems efficient operation
throughout the cement manufacturing process.
Minimizing leaks in Pyroprocessing 0.4% or 0.01 MMBtu/ton 0.4% No No EPA 2010 the kiln seals (which with Cooling cement are used at the inlet and outlet of the kiln
Replacement of to reduce heat loss kiln seals and air penetration)
can result in decreased heat loss and as a result decreased fuel use.

BANDWIDTH STUDY ON ENERGY USE AND POTENTIAL ENERGY SAVING OPPORTUNITIES IN THE MANUFACTURING OF CEMENT
44 Appendix A3: Practical Minimum Energy Intensity Calculation and Example Technologies Considered
Table A3-2. Details of Cement Practical Minimum Technologies Considered Energy
Technology Name Description Applicability Explanation of Energy
Savings Assumptions
Savings Estimate
(percentage
Included in SOA
Calculations
Included in PM
Calculations References
or energy intensity)
Optimization of the Pyroprocessing 2-10% reduction in fuel 6% No No EPA 2010 kiln burning process with Cooling usage by minimizing
Kiln combustion incomplete system combustion via improvements incomplete fuel
burning, poor fuel/air mixtures, and poorly adjusted firing.
The use of fluxes and Pyroprocessing 42–150 MJ/ton cement 91 Btu/lb No No EPA 2010 mineralizers can with Cooling cement reduce the temperature at which the clinker melt begins to form in the kiln, promote
Fluxes and mineralizers
formation of clinker compounds, and reduce the lower temperature limit of the tricalcium silicate stability range. All of these factors can reduce the fuel energy demand of the kiln.
Kiln/preheater Proper insulation for Pyroprocessing 0.1–0.31 MMBtu/ton 102 Btu/lb No No EPA 2010 insulation the kiln shell with Cooling cement cement (internal) minimizes heat
losses, which

Appendix A3: Practical Minimum Energy Intensity Calculation and Example Technologies Considered 45
Table A3-2. Details of Cement Practical Minimum Technologies Considered Energy
Technology Name Description Applicability Explanation of Energy
Savings Assumptions
Savings Estimate
(percentage
Included in SOA
Calculations
Included in PM
Calculations References
or energy intensity)
decreases fuel consumption.
Proper insulation for Pyroprocessing 17 Btu/ton cement 0.01 Btu/lb No No EPA 2010 the upper preheater with Cooling cement
Kiln/preheater vessels and the insulation cooler housing were (external) estimated to provide
energy savings of 17 Btu/ton cement.
The refractory bricks Pyroprocessing 49,800 Btu/ton cement 25 Btu/lb No No EPA 2010 lining the combustion with Cooling cement zone of the kiln
Refractory protect the outer material shell from the high selection combustion
temperatures, as well as chemical and mechanical stresses.
Grate coolers are Pyroprocessing Reduce energy 8% No No EPA 2010 Replacement of used to cool the with Cooling consumption by 8% or 84–planetary and clinker immediately 251 MJ/ton cement; travelling grate after it exits the kiln. increase electricity use cooler with Grate coolers that by 1–5 kWh/ton cement reciprocating operate with higher grate cooler efficiencies will lead
to less wasted heat and reduce fuel

BANDWIDTH STUDY ON ENERGY USE AND POTENTIAL ENERGY SAVING OPPORTUNITIES IN THE MANUFACTURING OF CEMENT
46 Appendix A3: Practical Minimum Energy Intensity Calculation and Example Technologies Considered
Table A3-2. Details of Cement Practical Minimum Technologies Considered Energy
Technology Name Description Applicability Explanation of Energy
Savings Assumptions
Savings Estimate
(percentage
Included in SOA
Calculations
Included in PM
Calculations References
or energy intensity)
usage elsewhere in the process.
Based on the heat Pyroprocessing Energy savings of 7–20 23 Btu/lb No No EPA 2010 recovery system and with Cooling kWh/ton cement cement the kiln technology,
Heat recovery for power - cogeneration
7–8 kWh/ton cement can be produced from hot air from the clinker cooler, and 8–10kWh/ton cement from the kiln exhaust.
Exhaust gases from Pyroprocessing Energy savings of 0.5–0.6 1 Btu/lb No No EPA 2010 the kiln or clinker with Cooling kWh/ton cement cement
Suspension preheater low pressure drop cyclones
cooler are routed to the cyclone and provide the heat to preheat the raw meal suspended or residing in the cyclone.
Multistage Pyroprocessing Energy savings of 0.4 200 Btu/lb No No EPA 2010 preheaters allow with Cooling MMBtu/ton cement cement
Multistage higher energy preheater transfer efficiency
and lower fuel requirements.

Appendix A3: Practical Minimum Energy Intensity Calculation and Example Technologies Considered 47
Table A3-2. Details of Cement Practical Minimum Technologies Considered Energy
Technology Name Description Applicability Explanation of Energy
Savings Assumptions
Savings Estimate
(percentage
Included in SOA
Calculations
Included in PM
Calculations References
or energy intensity)
Converting to a Pyroprocessing Energy savings of 1.1 550 Btu/lb No No EPA 2010 preheater/precalcine with Cooling MMBtu/ton cement cement r kiln may increase production by 40
Conversion from percent and may long dry kiln to require more preheater/precal extensive upgrades ciner kiln in the raw grinding
and clinker cooling areas to handle the increased production.
When direct current Pyroprocessing Energy savings of 0.5 1 Btu/lb No No EPA 2010 motors are used, the with Cooling kWh/ton cement cement
Kiln drive efficiency improvements
efficiency of the motors is maximized by using a single pinion drive with an air clutch and a synchronous motor.
Adjustable speed Pyroprocessing Energy savings of 5 9 Btu/lb No No EPA 2010 drives assist in with Cooling kWh/ton cement cement replacing the damper
Adjustable speed on the kiln fan drive for kiln fan system, which can
reduce energy consumption of the kiln fan.
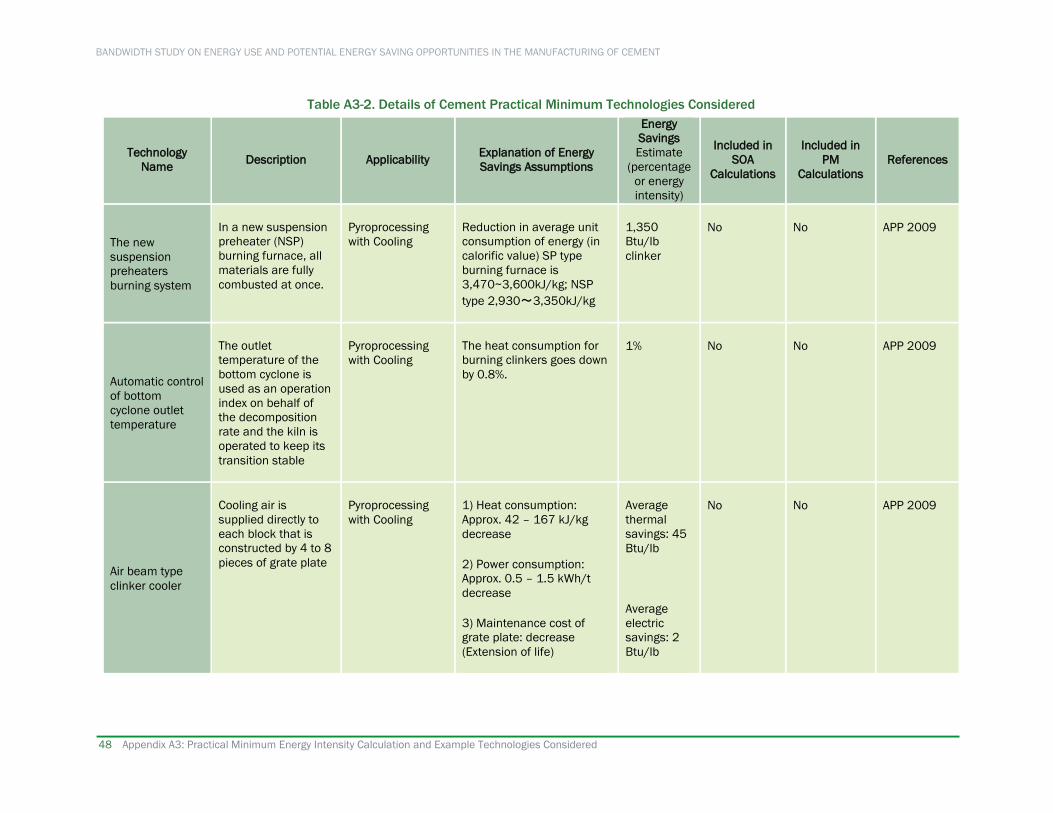
BANDWIDTH STUDY ON ENERGY USE AND POTENTIAL ENERGY SAVING OPPORTUNITIES IN THE MANUFACTURING OF CEMENT
48 Appendix A3: Practical Minimum Energy Intensity Calculation and Example Technologies Considered
Table A3-2. Details of Cement Practical Minimum Technologies Considered Energy
Technology Name Description Applicability Explanation of Energy
Savings Assumptions
Savings Estimate
(percentage
Included in SOA
Calculations
Included in PM
Calculations References
or energy intensity)
In a new suspension Pyroprocessing Reduction in average unit 1,350 No No APP 2009 The new preheater (NSP) with Cooling consumption of energy (in Btu/lb suspension preheaters
burning furnace, all materials are fully
calorific value) SP type burning furnace is
clinker
burning system combusted at once. 3,470~3,600kJ/kg; NSP type 2,930~3,350kJ/kg
The outlet Pyroprocessing The heat consumption for 1% No No APP 2009 temperature of the with Cooling burning clinkers goes down
Automatic control of bottom cyclone outlet temperature
bottom cyclone is used as an operation index on behalf of the decomposition rate and the kiln is
by 0.8%.
operated to keep its transition stable
Cooling air is Pyroprocessing 1) Heat consumption: Average No No APP 2009 supplied directly to with Cooling Approx. 42 – 167 kJ/kg thermal each block that is decrease savings: 45 constructed by 4 to 8 Btu/lb
Air beam type clinker cooler
pieces of grate plate 2) Power consumption: Approx. 0.5 – 1.5 kWh/t decrease
Average 3) Maintenance cost of electric grate plate: decrease savings: 2 (Extension of life) Btu/lb

Appendix A3: Practical Minimum Energy Intensity Calculation and Example Technologies Considered 49
Table A3-2. Details of Cement Practical Minimum Technologies Considered Energy
Technology Name Description Applicability Explanation of Energy
Savings Assumptions
Savings Estimate
(percentage
Included in SOA
Calculations
Included in PM
Calculations References
or energy intensity)
The electricity Finish Grinding Energy savings of 6–25 26 Btu/lb No No EPA 2010 savings when kWh/ton cement cement replacing an older ball mill with a new finish grinding mill
Improved ball mills
may be 25 kWh/ton cement. The addition of a pre-grinding system to an existing ball mill can reduce electricity consumption by 6–22 kWh/ton cement.
Increases in the ball Finish Grinding Energy/fuel savings of 3–5 6 Btu/lb No No Madlool et charge distribution kWh/tonne cement cement al. 2011 and surface hardness of grinding
Improved media and wear grinding media resistant mill linings
have shown a potential for reducing wear as well as energy consumption.
Process control Optimizing process Finish Grinding Energy/fuel savings of 2.5– 6% No No Madlool et and controls can increase 10% al. 2011 management in cement production grinding mills for and decrease energy finish grinding consumption.

BANDWIDTH STUDY ON ENERGY USE AND POTENTIAL ENERGY SAVING OPPORTUNITIES IN THE MANUFACTURING OF CEMENT
50 Appendix A3: Practical Minimum Energy Intensity Calculation and Example Technologies Considered
Table A3-2. Details of Cement Practical Minimum Technologies Considered Energy
Technology Name Description Applicability Explanation of Energy
Savings Assumptions
Savings Estimate
(percentage
Included in SOA
Calculations
Included in PM
Calculations References
or energy intensity)
Adding a high Finish Grinding Electrical energy savings of 0.4 Btu/lb No No LBNL 2009
High pressure roller press for ball mill pre-grinding
pressure roller press as pre-grinding to the ball mill for younger cement plants can potentially increase
0.26 kWh/t clinker clinker
the energy efficiency.
Replacement of a Finish Grinding Electrical energy savings of 2.3 Btu/lb No No LBNL 2009 cement mill fan with 0.13 kWh/t clinker clinker
High efficiency a higher efficiency cement mill vent fan has the potential fan to reduce energy
requirements by 0.13 kWh/ton clinker.
This liner improves Finish Grinding The power consumption 2 Btu/lb No No APP 2009 the coarse grinding rate is down 1 to 2 kWh/t. cement capacity at the inlet
Classification liner for the second chamber of tube mill
of the second chamber; the grinding performance of the entire mill may improve of the first chamber is made short and the second chamber long.
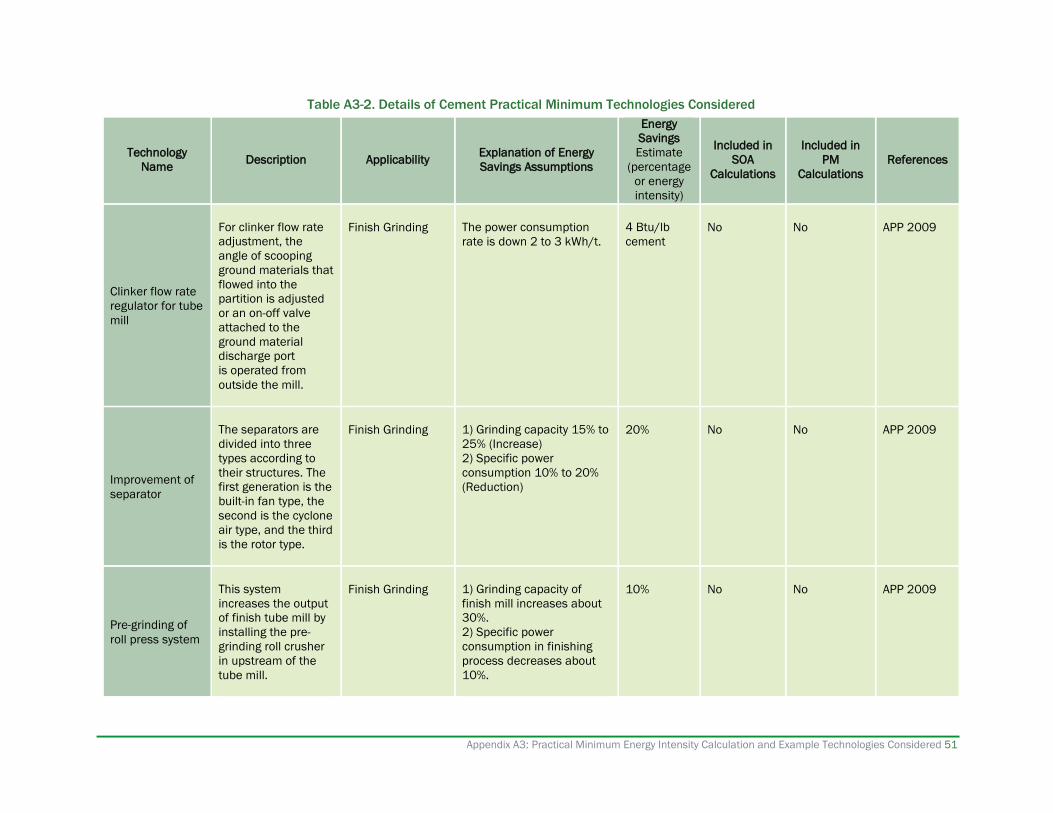
Appendix A3: Practical Minimum Energy Intensity Calculation and Example Technologies Considered 51
Table A3-2. Details of Cement Practical Minimum Technologies Considered Energy
Technology Name Description Applicability Explanation of Energy
Savings Assumptions
Savings Estimate
(percentage
Included in SOA
Calculations
Included in PM
Calculations References
or energy intensity)
For clinker flow rate Finish Grinding The power consumption 4 Btu/lb No No APP 2009 adjustment, the rate is down 2 to 3 kWh/t. cement angle of scooping ground materials that
Clinker flow rate regulator for tube mill
flowed into the partition is adjusted or an on-off valve attached to the ground material discharge port is operated from outside the mill.
The separators are Finish Grinding 1) Grinding capacity 15% to 20% No No APP 2009 divided into three 25% (Increase) types according to 2) Specific power
Improvement of separator
their structures. The first generation is the built-in fan type, the
consumption 10% to 20% (Reduction)
second is the cyclone air type, and the third is the rotor type.
This system Finish Grinding 1) Grinding capacity of 10% No No APP 2009 increases the output finish mill increases about
Pre-grinding of roll press system
of finish tube mill by installing the pre-grinding roll crusher
30%. 2) Specific power consumption in finishing
in upstream of the process decreases about tube mill. 10%.

BANDWIDTH STUDY ON ENERGY USE AND POTENTIAL ENERGY SAVING OPPORTUNITIES IN THE MANUFACTURING OF CEMENT
52 Appendix A3: Practical Minimum Energy Intensity Calculation and Example Technologies Considered
Table A3-2. Details of Cement Practical Minimum Technologies Considered Energy
Technology Name Description Applicability Explanation of Energy
Savings Assumptions
Savings Estimate
(percentage
Included in SOA
Calculations
Included in PM
Calculations References
or energy intensity)
This system installs a Finish Grinding 1) Grinding capacity of 15% No No APP 2009 vertical roller mill (of finish mill increases about
Pre-grinding of roller mill system
high grinding efficiency) for a pre-grinding in the
30~60%. 2) Specific power consumption in finishing
upstream of the tube process decreases mill. 10~20%.
For this control, the Finish Grinding 1) The power consumption 6% No No APP 2009 power of the bucket rate is down about 2 to
Automatic run control of tube mill
elevator at the mill outlet used to be kept constant.
10%. 2) The labor for running operation can be reduced. 3) The quality becomes stable because of stable run.
Ground cement Finish Grinding Electrical power 30% Yes No APP 2009 materials are sent to consumption can be separator installed in reduced by 30% (compared mill upper position by with the tube mills).
Vertical roller mill for cement grinding
air and classified to coarse particles and fine product. Coarse particles are returned on the grinding table to be re-ground and the fine product is sent to dust collectors such as

Appendix A3: Practical Minimum Energy Intensity Calculation and Example Technologies Considered 53
Table A3-2. Details of Cement Practical Minimum Technologies Considered Energy
Technology Name Description Applicability Explanation of Energy
Savings Assumptions
Savings Estimate
(percentage
Included in SOA
Calculations
Included in PM
Calculations References
or energy intensity)
cyclone and/or bag filter.
The external Finish Grinding Specific power 10% No Yes APP 2009 External circulating system is consumption is down about materials adopted to vertical 10%. circulating roller mill grinding system to process in order to cement grinding reduce power vertical mill consumption of mill
fan.
Adjusts the separator Finish Grinding 1) The cement quality (grain 4% No Yes APP 2009 automatically; the size) is stable. grain size of refined 2) The power consumption powder (product) rate is down 3 to 5%.
Automatic control changes with the of cement grain passage of time size under the influence
of various factors even when the running conditions are fixed.
Improvements in the Finish Grinding Reduction in unit electricity 31 Btu/lb No No APP 2009 grinding process to consumption (Blended cement
High efficiency produce fine value 4,000 cm2/g) grinding of blast granulated blast * Tube mill 70 kWh/t furnace slag furnace slag suitable (approx., excluding drying)
for use in the * Vertical mill <40 kWh/t production of blast (including separator, wind-furnace cement was

BANDWIDTH STUDY ON ENERGY USE AND POTENTIAL ENERGY SAVING OPPORTUNITIES IN THE MANUFACTURING OF CEMENT
54 Appendix A3: Practical Minimum Energy Intensity Calculation and Example Technologies Considered
Table A3-2. Details of Cement Practical Minimum Technologies Considered
Technology Name Description Applicability Explanation of Energy
Savings Assumptions
Energy Savings Estimate
(percentage or energy intensity)
Included in SOA
Calculations
Included in PM
Calculations References
achieved with pre-grinding and vertical mill technologies used in cement manufacturing.
chamber/fan, conveyor systems, etc.)
In cases where more than one technology was considered for a given subarea/sub-process, the following calculation was used:
𝑃𝑃𝑇𝑇 = 𝑃𝑃𝑇𝑇𝑃𝑃𝑆𝑆𝑆𝑆𝐶𝐶𝑃𝑃𝑆𝑆𝑆𝑆𝐶𝐶 ∗ [(1− 𝑃𝑃1) ∗ (1− 𝑃𝑃2) ∗ … ∗ (1− 𝑃𝑃𝑛𝑛)]
where PM is the practical minimum energy intensity, PMBaseline is the baseline energy intensity (i.e., the SOA energy intensity), and P1, P2, … Pn are the percent savings for each of the n PM technologies included in the model. Energy savings from different technologies were not considered additive; rather, this formula considers technologies as compounding when more than one is applicable to a certain subarea. Energy savings from cross-cutting technologies were applied across all subareas and sub-processes as part of the compounded savings estimate.

Appendix A4: Thermodynamic Minimum Calculation Details 55
Appendix A4: Thermodynamic Minimum Calculation Details This Appendix provides details on how the thermodynamic minimum energy intensities for pyroprocessing with cooling stages were calculated for cement manufacturing processes, as well as any assumptions and reference values used.
The thermodynamic minimum energy intensity of pyroprocessing with cooling for a cement kiln depends upon the moisture content fraction of the input materials. The main inputs for the raw meal for dry kiln feed consists primarily of calcium carbonate (CaCO3), magnesium carbonate (MgCO3), silica (SiO2), alumina (Al2O3), and iron(III) oxide (Fe2O3). The pyroprocessing reaction sequence begins with the formation calcium oxide (CaO), and magnesium oxide (MgO), as well as kaolinite (Al2O3•2SiO2•2H2O) decomposition, as shown in the following equations (Farag 2012):
Al2O3•2SiO2•2H2O Al2O3 + 2SiO2 + 2H2O [1]
MgCO3 MgO + CO2 [2]
CaCO3 CaO + CO2 [3]
From these oxide materials, intermediate cement materials are formed. According to Farag 2012, the main intermediates in cement pyroprocessing are calcium aluminate (CaO•Al2O3, or CA), dicalcium ferrite (2CaO•Fe2O3, or C2F), and dicalcium silicate (2CaO•SiO2, or β-C2S). The formation of these intermediates are shown in the following reactions (Farag 2012):
Al2O3 + CaO CaO•Al2O3 (CA) [4]
Fe2O3 + 2CaO 2CaO•Fe2O3 (C2F) [5]
2CaO + SiO2 2CaO•SiO2 (β-C2S) [6]
The reaction intermediates then undergo further reactions to form clinker. The clinker is primarily composed of tetracalcium aluminoferrite (4CaO•Al2O3•Fe2O3, or C4AF), tricalcium aluminate (3CaO•Al2O3, or C3A), and tricalcium silicate (3CaO•SiO2, or C3S). The clinkering reactions are then summarized in the following chemical equations:
CA + C2F + CaO 4CaO•Al2O3•Fe2O3 (C4AF) [7]
CA + 2CaO 3CaO•Al2O3 (C3A) [8]
CaO + β-C2S 3CaO•SiO2 (C3S) [9]
The mineral composition of the clinker as it leaves the rotary kiln consists of approximately 8% C4AF, 20% β-C2S, 10% C3A, 56% C3S. The remaining 6% of the final product is comprised of various other minerals and impurities (Farag 2012).
To determine the TM energy intensity, the enthalpy and Gibbs free energy changes were determined for each of the nine reactions. Robie and Hemingway 1995 provided most of the thermodynamic data for each of the reactants and products considered in Table A4-1 except for CA, C4AF, and C3A. The thermodynamic data for CA were determined from Fumo et al. 1996 and C4AF and C3A from Matschei 2007.

BANDWIDTH STUDY ON ENERGY USE AND POTENTIAL ENERGY SAVING OPPORTUNITIES IN THE MANUFACTURING OF CEMENT
56 Appendix A4. Thermodynamic Minimum Calculation Details
Table A4-1. Calculated Enthalpy and Gibbs Free Energy Changes for Clinker Production Reactions
Reaction Molecular weight (g/g-mol)
Mass (kg)
ΔH (kJ/kg clinker)
[Btu/lb clinker]*
ΔG (kJ/kg clinker)
[Btu/lb clinker]*
Kaolinite decomposition [1] 258.16 0.15 80.4 [35]
26.4 [11]
MgCO3 dissociation [2] 84.31 0.04 56.1 [24]
31.2 [13]
CaCO3 dissociation [3] 100.09 1.29 2,295.6 [987]
1,681.9 [723]
CA formation [4] 158.04 0.09 -9.1 [-4]
-13.7 [-6]
C2F formation [5] 271.85 0.05 -7.9 [-3]
-9.2 [-4]
β-C2S formation [6] 172.24 0.69** -502.5 [-216]
-514.1 [-221]
C4AF formation [7] 485.96 0.09 3.7 [2]
4.7 [2]
C3A formation [8] 270.19 0.11 14.1 [6]
12.9 [6]
C3S formation [9] 228.32 0.62 23.6 [10]
21.2 [9]
Clinker formation*** N/A 1.11 1,953.9
[840] 1,241.2
[534]
N/A 1.00 1,761.9 [757]
1,119.2 [481]
*Each of the reactions enthalpies and Gibbs free energies were calculated in Farag 2012 based on 1.109 kg clinker. Values are adjusted to the formation of 1.00 kg clinker in the final row of the table. ** 0.22 kg β-C2S was left in the final clinker composition. ***Totals may not sum due to independent rounding.

For more information, visit: energy.gov/eere/AMO
DOE/EE-1660 • September 2017