bangladesh development update - world bank
TRANSCRIPT

BANGLADESH DEVELOPMENT UPDATE Breaking the barriers
May 2017
Bangladesh Development Update
Pub
lic D
iscl
osur
e A
utho
rized
Pub
lic D
iscl
osur
e A
utho
rized
Pub
lic D
iscl
osur
e A
utho
rized
Pub
lic D
iscl
osur
e A
utho
rized


The World Bank Office, Dhaka
Plot E-32, Agargaon
Sher-e-Bangla Nagar
Dhaka – 1207, Bangladesh
Tel.: (880-2) 5566-7777
Fax: (880-2) 5566-7778
www.worldbank.org/bd
Standard Disclaimer:
This volume is a product of the staff of the International Bank for Reconstruction
and Development/ The World Bank. The findings, interpretations, and
conclusions expressed in this paper do not necessarily reflect the views of the
Executive Directors of The World Bank or the governments they represent. The
World Bank does not guarantee the accuracy of the data included in this work.
The boundaries, colors, denominations, and other information shown on any map
in this work do not imply any judgment on the part of The World Bank
concerning the legal status of any territory or the endorsement or acceptance of
such boundaries.
Copyright Statement:
The material in this publication is copyrighted. Copying and/or transmitting ions
or all of this work without permission may be a violation of applicable law. The
International Bank for Reconstruction and Development/The World Bank
encourages dissemination of its work and will normally grant permission to
reproduce portions of the work promptly.
For permission to photocopy or reprint any part of this work, please send a
request with complete information to the Copyright Clearance Center, Inc., 222
Rosewood Drive, Danvers, MA 01923, USA, telephone 978-750-8400, fax 978-
750-4470, http://www.copyright.com/.
All other queries on rights and licenses, including subsidiary rights, should be
addressed to the Office of the Publisher, The World Bank, 1818 H Street NW,
Washington, DC 20433, USA, fax 202-522-2422, e-mail
Photo Credits:
Cover: ©The World Bank, 2017 Printed in Bangladesh

Table of Contents
Preface ....................................................................................................................... v
Acknowledgement .................................................................................................... v
Abbreviations and Acronyms ............................................................................... vi
Executive Summary ................................................................................................. 1
I. Recent Economic Developments....................................................................... 5
Poverty Trends .......................................................................................................................................... 6
Real Sector Developments ........................................................................................................................ 7
Inflation Trends ....................................................................................................................................... 14
External Trade and Exchange Rates ....................................................................................................... 17
Fiscal Policy ............................................................................................................................................ 23
Monetary Policy ...................................................................................................................................... 28
Structural Reforms .................................................................................................................................. 29
II. An Analysis of Bangladesh’s Long-Term Growth Prospects ......................33
Setting the stage ...................................................................................................................................... 35
The growth dividends ............................................................................................................................. 36
Fiscal implications .................................................................................................................................. 38
TFP Growth and Resource Allocation across Sectors ............................................................................ 39
Determinants of TFP Growth at the Firm Level ..................................................................................... 40
III. Constraints on Female Labor Force Participation ......................................43
Household responsibilities ...................................................................................................................... 45
Human capital deficiency ....................................................................................................................... 46
Human capital mismatch ......................................................................................................................... 50
Open Discrimination by Gender in Hiring and Promotion ..................................................................... 53
Moving forward ...................................................................................................................................... 54
IV. Outlook and Risks ............................................................................................55
Global Prospects ..................................................................................................................................... 56
Outlook for Bangladesh .......................................................................................................................... 57
Risks ........................................................................................................................................................ 63
V. Policy challenges ..............................................................................................64
Structural impediments to investments ................................................................................................... 65
Energy ..................................................................................................................................................... 66

ii
Fiscal reforms.......................................................................................................................................... 67
Financial sector reforms .......................................................................................................................... 68
Global integration ................................................................................................................................... 68
Increasing potential growth ..................................................................................................................... 70
A Road Map for Improving Women’s Labour Force Outcomes ............................................................ 70
Appendix .................................................................................................................75
Appendix Table 1: Bangladesh Macroeconomic Indicators ................................................................... 75
Appendix Table 2: Bangladesh Current Macro Economic Indicators .................................................... 77

iii
List of Figures
Figure 1: Remittance Performance (FY17) ................................................................................................................. 13
Figure 2: Inflation rate (%) .......................................................................................................................................... 14
Figure 3: Price trend of Coarse Rice, Soyabean Oil and Brinjal ................................................................................. 16
Figure 4: Overall BOP (% of GDP) and Reserve (US$ b.) .......................................................................................... 17
Figure 5: Exchange Rate .............................................................................................................................................. 17
Figure 6: Bangladesh: Real Effective Exchange Rate ................................................................................................. 19
Figure 7: Inter-bank and Informal Exchange Rate ...................................................................................................... 20
Figure 8: Interest Rate Movement ............................................................................................................................... 20
Figure 9: NPL as percent of Outstanding Loan ........................................................................................................... 21
Figure 10: Dhaka Stock Exchange General Index (Jan 2017-Feb 2017) ..................................................................... 22
Figure 11: DSE Ratios ................................................................................................................................................. 22
Figure 12: Expenditure and Current Expenditure (% of GDP) .................................................................................... 26
Figure 13: ADP Implementation (% of Revised ADP)................................................................................................ 26
Figure 14: Budget Target and Net Govt. Domestic Borrowing, FY17 (Jul-Jan) ......................................................... 27
Figure 15: Four Growth Scenarios............................................................................................................................... 37
Figure 16: Taxes for Industry and Services relative to Agriculture ............................................................................. 40
Figure 17: Labor Force Participation rate .................................................................................................................... 44
Figure 18: Reasons given for not being in the labor force, by sex (LFS 2013) ........................................................... 45
Figure 19: Unemployment rates by wealth decile, sex (Bangladesh 2013 LFS) ......................................................... 46
Figure 20: Highest level of education completed over years, age 15-64, by sex ......................................................... 48
Figure 21: Workers without contracts among wage workers (ages 15-64) .................................................................. 49
Figure 22: Mean earnings per month (excluding unpaid workers), by sex and year ................................................... 50
Figure 23: Sex-based segregation of employment by male-and female-dominated occupations ................................ 51
Figure 24: Occupational segregation in Bangladesh, by occupation and sex .............................................................. 51
Figure 25: CPI ratio (2005-06=100), Urban ................................................................................................................ 59
Figure 26: CPI ratio (2005-06=100), Rural ................................................................................................................. 59
Figure 27: Export Performance (FY17) ....................................................................................................................... 59
List of Tables
Table 1: Sectoral Growth ............................................................................................................................................... 7
Table 2: High Frequency Indicators (%) ....................................................................................................................... 8
Table 3: Contribution to Growth ................................................................................................................................. 11
Table 4: Accounting for Remittance Decline .............................................................................................................. 12
Table 5: Actual GDP, Potential GDP and Output Gap ................................................................................................ 15
Table 6: Exchange rate (Taka/unit of foreign currency) changes and Inflation differential ........................................ 18
Table 7: Reserve Adequacy Indicators ........................................................................................................................ 19
Table 8: Fiscal Outcomes ............................................................................................................................................ 24
Table 9: Revenue Composition ................................................................................................................................... 25
Table 10: Monetary Program Performance ................................................................................................................. 28
Table 11: The Growth Dividends ................................................................................................................................ 36
Table 12: Marginal Productivity of Labor Relative to Agriculture ............................................................................. 39
Table 13: Counterfactual increase in GDP per capita and Distortions ........................................................................ 40
Table 14: FLFP of those with less than 5 years of education, by religion ................................................................... 46
Table 15: Labor Force Participation Rates of Different Age Groups in Bangladesh (percent) ................................... 48
Table 16: Percentage of workers who work from inside their houses ......................................................................... 52
Table 17: Employers' views on the challenges of employing women ......................................................................... 53
Table 18: Employers' views on the challenges of employing women, by firm size .................................................... 54
Table 19: Bangladesh Macro Outlook Indicators ........................................................................................................ 58
Table 20: High Frequency Indicators (%) ................................................................................................................... 60

iv
List of Boxes
Box 1: The Analytical Framework .............................................................................................................................. 34
Box 2: FY17 Monetary Policy ..................................................................................................................................... 61
Box 3: Gas Pricing Issue ............................................................................................................................................. 66
Box 4: Unshackling Informal Remittances .................................................................................................................. 69
Box 5: The Critical Role of ID .................................................................................................................................... 72
Box 6: NARI gives a break .......................................................................................................................................... 73

v
Preface
The objective of this report is to update the Government of Bangladesh, think tanks
and researchers, the general public as well as the Bank’s senior management on the
state of the economy, outlook, risks, progress on structural policy reforms and key
challenges the economy is currently facing. The coverage includes developments
in the real sector focusing on poverty, growth, and inflation; external sector
developments focusing on the balance of payments, foreign exchange reserves and
the exchange rate; fiscal developments focusing on revenue mobilization, public
expenditures, and deficit financing; financial sector developments focusing on
credit and interest rates; and monetary developments. This update also assesses the
long-term growth potentials and constraints on female labor force participation in
Bangladesh. It concludes with an exposition of the policy challenges that need to
be addressed to unleash Bangladesh’s growth potentials.
Acknowledgement
This report was prepared by a team comprising of Zahid Hussain (Lead Economist),
Sheikh Tanjeb Islam (Economist), Jennifer Solotaroff (Senior Social Development
Specialist), Rishabh Sinha (Economist), Sabiha Subah Mohona (Research Analyst),
and Shegufta Shahriar (Team Assistant). Valuable contributions were made by Md.
Iqbal (Senior Energy Specialist), Nawra Mehrin (Consultant) and Sabah Moyeen
(Senior Social Development Specialist). Iffath Anwar Sharif (Program Leader),
Christian Eigen Zucchi (Program Leader), Maria Eugenia Genoni (Senior
Economist), and Ruth Hill (Senior Economist) made very useful comments and
suggestions. Manuela Francisco (Practice Manager) provided overall guidance in
the preparation of this report.

vi
Abbreviations and Acronyms ADP Annual Development Plan
ADR Advance Deposit Ratio
ADR Alternative Dispute Resolution
AIT Advance Income Tax
APTA Asia-Pacific Trade Agreement
ATV Advance Trade VAT
BB Bangladesh Bank
BBS Bangladesh Bureau of Statistics
BDHS Bangladesh Demographic and Health Survey
BDT Bangladeshi Taka
BERC Bangladesh Energy Regulatory Commission
BIDA Bangladesh Investment Development Authority
BIN Business Identification Number
BMI Body Mass Index
BO Beneficiary Owner
BOI Board of Investment
BPDB Bangladesh Power Development Board
BRRI Bangladesh Rice Research Institute
CAGR Compound Annual Growth Rate
CAR Capital Adequacy Ratio
CPI Consumer Price Index
CRAR Capital Risk-weighted Asset Ratio
DAE Department of Agricultural Extension
DAM Department of Agricultural Marketing
DB2017 Doing Business 2017
DHS Demographic and Household Survey
DSE Dhaka Stock Exchange
EMDEs Emerging Market Developing Economies
EPB Export Promotion Bureau
EU European Union
FAO Food and Agriculture Organization
FBCCI Federation of Bangladesh Chamber of Commerce and Industry
FDA Food and Drug Administration
FDI Foreign Direct Investment
FGD Focus Group Discussions
FLFP Female Labor Force Participation
FSNSP Food Security Nutritional Surveillance Project
FY Fiscal Year
GCC Gulf Cooperation Council
GDP Gross Domestic Product
GTAP Global Trade Analysis Project
HIES Household Income and Expenditure Survey
HP Hodrick-Prescott
HYV High Yielding Varieties
ICT Information and Communication Technology
ID4D Identification for Development
IEC Information, Education and Communication
IFC International Finance Cooperation
IMED Implementation Monitoring Evaluation Division
IMF International Monetary Fund
IOC International Oil Company

vii
IPO Initial Public Offering
KII Key Informant Interviews
km Kilometer
KSA Kingdom of Saudi Arabia
LC Letter of Credit
LDCs Less Developed Countries
LFP Labor Force Participation
LFS Labor Force Survey
LNG Liquefied Natural Gas
LPG Liquefied Petroleum Gas
MCF Thousand Cubic Feet
MG Meter Gauge
MoPEMR Ministry of Power, Energy and Mineral Resources
MPS Monetary Policy Statement
MT Metric Ton
MW Megawatts
NARI Northern Areas Reduction-of-Poverty Initiative
NBR National Board of Revenue
NGO Non-Governmental Organization
NOC National Oil Company
NPL Non-Performing Loan
NSCs National Savings Certificates
OECD Organisation for Economic Co-operation and Development
OPEC Organization of the Petroleum Exporting Countries
PB Petro Bangla
PCBs Private Commercial Banks
PE Price Earning
PFM Public Financial Management
PPP Purchasing Power Parity
PSC Production Sharing Contract
PVC Polyvinyl Chloride
PWT Penn World Table
QIIP Quantum Index of Industrial Production
R&D Research and Development
RCA Revealed Comparative Advantage
REER Real Effective Exchange Rate
REHAB Real Estate and Housing Association of Bangladesh
RMG Ready-Made Garments
SAR South Asia Region
SARMD South Asia Region MicroDatabase
SASEC South Asia Subregional Economic Cooperation
SCBs State-owned Commercial Banks
SD Supplementary Duty
SDBs Specialized Development Banks
SES Socio Economic Status
SEZ Special Economic Zone
SMEs Small and Medium Enterprises
SOE State Owned Enterprise
SWF Sovereign Wealth Fund
TFP Total Factor Productivity
TFP Total Factor Productivity
Tk Taka
ToT Terms of Trade

viii
TPP Trans-Pacific Partnership
TVET Technical and Vocational Education and Training
UAE United Arab Emirates
UK United Kingdom
USA United States of America
USD United States Dollar
USDA United States Department of Agriculture
VAT Value Added Tax
WDI World Development Indicators
WDI World Development Indicators
WHO World Health Organization
WTI West Texas Intermediate
Y-O-Y Year-on-Year

1
Executive Summary
The Bangladesh economy is weathering persistent global uncertainties relatively well. Poverty reduction
is expected to have continued. Growth remained resilient, aided recently by recovery in exports and private
investments. Inflation has decelerated benefitting from soft international commodity prices and prudent
macroeconomic management. The outlook for Bangladesh’s main export destinations is projected to
improve, although downside risks remain elevated. More recently, falling export growth and decline in
remittances are emerging near term concerns. According to our model, increased capital accumulation can
contribute significantly to boosting growth, but alone cannot deliver a sustainable and accelerated growth
path. More is needed, including closing the inter-sectoral productivity gap through increased resource
mobility, easing the constraints on firm level productivity and increasing female labor force participation
in the formal sectors. In addition, poor infrastructure, inadequate energy supply, and inefficient financial
intermediation combined with high cost of doing business remain the key obstacles hindering the realization
of Bangladesh’s vast economic potential.
Recent Economic Developments
Declining poverty trend is likely to have persisted despite shocks. Preliminary official quarterly poverty
statistics (April-June, 2016) released by the government in October 2016 suggest that the headcount poverty
rate, based on the national upper poverty line, declined to 23.2 percent in April-June, 2016. In 2010, the
poverty incidence was 31.5 percent. Rebound in labor intensive exports, decline in food inflation, and rise
in wages is likely to have contributed to continued gains in poverty reduction in FY16. Of late, slowing
exports, falling remittances, rising food inflation, and early floods in some parts of the country may be
decelerating the pace of poverty reduction.
Growth has been steady. GDP Growth, officially reported at 7.1 percent in FY16, has been led by industry
on the supply side and investments and net exports on the demand side. Manufacturing and construction,
which boosted industrial growth in FY16 to 11.1 percent, appear to be growing strongly. Agricultural
growth has been lackluster and remittances through formal channels have reached a historic low dragging
down consumption growth. Aggregate demand was boosted by a rebound in net exports and private
investments in FY16. Private consumption growth slowed, as the impact of large increases in public sector
salaries was diluted by a decrease in remittances. Private investment as a share of GDP rose from 22.1
percent in FY15 to almost 23 percent of GDP in FY16, the highest level in the past two decades. This is at
odds with high frequency proxy indicators suggesting at best a marginal improvement in the private
investment trend. The growth recovery notwithstanding, Bangladesh needs to do more to leverage local
capabilities, cost advantages and available incentives in order to emerge as a manufacturing hub for exports.
Macroeconomic stability nurtured growth. Inflation is contained. Headline inflation declined to 5.3
percent in February 2017, driven by slowing non-food inflation, but core inflation and inflationary
expectations remain high. External balances are comfortable. Foreign exchange reserves rose to nearly $33
billion in early April, 2017, although the rate of buildup slowed as weaker export growth and plummeting
remittances led to $1.1 billion current account deficit in the first eight months of FY17. While the
Bangladesh Bank managed to keep nominal exchange rate against the US dollar in the interbank market
almost fixed, the nominal cross rates appreciated particularly against the pound-sterling and the Euro, which
led to an appreciation of the Real Effective Exchange Rate. Since July, 2016, the interbank taka-dollar rate
has depreciated by about 2.3 percent through April 2017 with the emergence and growth of deficit in the
external current account. Overall, monetary policy has been accommodative, but fell short on protecting
competitiveness on the exchange rate front.

2
Governance in the financial sector has remained weak. Financial sector distress has muted declining
trends in lending rates, notwithstanding growing excess liquidity. Bank lending rates maintained a declining
trend, falling to 9.9 percent in January, 2017. Private sector credit growth remained subdued at 15.9 percent
through February, 2017, driven by trade and commerce, while banks remained flushed with excess liquidity
and burdened by non-performing loans. Stock prices surged temporarily, but capital market development
is bogged down by the rapid rise in sales of the National Savings Certificates (NSCs).
Fiscal prudence has been maintained. The fiscal deficit has declined with improved revenue mobilization,
undershooting of capital expenditure relative to target and reduced spending on subsidies. However, the
composition of deficit financing has hindered the effectiveness of financial intermediation. Increasing
reliance on NSCs led to the swelling of the interest burden on the budget. Ad-hoc administered price
adjustments of gas and electricity have reduced the quasi-fiscal deficit.
Potential Growth
Bangladesh needs to increase the potential growth rate to accelerate its journey on the middle income
path. An investment-led strategy coupled with improvements in the efficiency of public capital will
support economic growth above 5 percent for the next decade. Achieving higher than 7 percent annual
growth on a sustained basis will inevitably require increased productivity growth as well as much higher
female labor force participation over the medium term. The economy can deliver an average annual growth
rate in excess of 7 percent during the 7th Plan period if the expansion in investment share and female labor
force participation is accompanied by productivity growth of 1 percent each year. Real GDP per capita
would more than double if the distortions inhibiting resource mobility between sectors are reduced to the
levels observed in China. Reduced to the levels observed in Malaysia and Indonesia, it could increase by
82 and 45 percent respectively. Real GDP per capita has the potential to increase by about 20 percent if
distortions equal what is observed in India, which has similar level of distortions in industry but much lower
distortions in services.
The gender gap in the labor market is a huge waste. Gender equality, from an employment perspective,
means equal access to education, opportunities for career advancement, and equal legal rights. Gender
inequality deprives national economies of women’s talents and wastes the national and personal benefits of
investment in female education by forcing women into professions and occupations that make less than full
use of their capabilities. If Bangladesh is able to replicate the gains of the past decade and raise the female
labor force participation rate to 45 percent by 2020, it will be able to maintain economic growth 1
percentage point above trend through 2020. This could continue if the female participation rate continues
to increase until reaching parity with the male participation in the labor force. With a productivity growth
of 1.5 percent per year, the economy would be able to exceed the growth targets envisioned in the plan.
The gender gap in labour force participation in Bangladesh is attributable to numerous factors,
including: (1) uneven burden of household roles and responsibilities, which fall disproportionately on
women; (2) human capital deficiency, whereby women are not acquiring the education and skills demanded
by job markets; (3) human capital mismatch leading to wasting of female talents and acquired skills and
(4) gender discrimination in job search, hiring, and promotion processes.
Outlook and Risks
Growth in the medium-term is projected to remain robust. A reasonably prudent macro-fiscal balance,
modest improvements in infrastructure, and some reduction in the cost of doing business through reforms
in business regulation will support growth. Growth in Bangladesh’s largest export markets, the US and
Europe, are projected to improve as is global trade. International commodity prices have bottomed out and
may rise moderately in the near-term.

3
GDP is projected to grow by 6.8 percent in FY17, with agriculture growth rising to 4.1 percent as farmers
respond to sustained relative price increases of rice, vegetable and livestock products in the last half of
2016. Industrial growth may edge down to 8.9 percent due to softer export growth and weaker domestic
demand associated with the decline in remittances. Services are projected to grow at a steady 6 percent.
The upturn in private investment is projected to continue in FY17, helped by political stability and a
reduction in trade logistics costs due to the opening of two key road projects. High-frequency indicators so
far this fiscal year point to a stronger performance and give confidence that the economy is on course to
maintaining robust growth.
Macroeconomic stability is expected to be maintained. Notwithstanding a moderate increase in inflation
due to higher import prices and overheating, the overall macroeconomic outlook is stable. The overall
balance of payment surplus is projected to shrink significantly without impairing stability in the foreign
exchange market, given the cushion in the level of reserves. The FY17 budget aims to raise revenue through
improved revenue administration. Current spending will grow with an increase in public sector benefits and
subsidies directed mainly to agriculture and social welfare. Capital spending is slated to rise as well. The
deficit is projected at around 4 percent of GDP, with 60 percent financed by domestic borrowing.
Downside risks are predominantly rooted in domestic factors. The risks are centered on potential
deterioration of financial sector stability, slippage in fiscal reforms and resurgence of more confrontational
politics. Domestic risks include further deterioration in financial sector stability, slippages in addressing
fiscal reforms, and elevated political tensions in the run up to elections in 2019. High levels of non-
performing bank loans make banks vulnerable to financial stress. The business environment continues to
be weak, with Bangladesh ranking 176th out of 190 countries in Doing Business and 107th out of 140 in the
Global Competitiveness Index 2016, one of the lowest in South Asia.
External risks are nontrivial, despite Bangladesh’s still limited global integration. They include
heightened policy uncertainty in the United States and Euro Area, which are Bangladesh’s largest export
markets and the most important source of remittance inflows after GCC. A jump in energy prices could
also precipitate strains on import payments and the budget. However, it could at the same time support a
more rapid recovery in remittances from GCC countries in the near term than currently projected, and thus
constitutes an upside risk to the outlook as well.
Policy Challenges
Policy reforms need stepping up. Bangladesh has been a success story in recent years, with high growth,
and considerable progress in poverty reduction. The key challenge is to move this success forward in the
face of future domestic and external headwinds. Removal of structural barriers to female labor force
participation, investments and innovations to improve productivity, pursuit of greater integration internally
and externally through trade, fiscal and financial reforms, are strategic priorities. While the government has
looked to address infrastructure gaps through large investment projects, policy deficits remain. Besides
efforts by the Bangladesh Investment Development Authority to improve the ranking on the World Bank’s
Doing Business indicators, policy reforms have stagnated. It is imperative that Bangladesh implements the
new VAT and Supplementary Duty Act to boost domestic resource mobilization and signal the commitment
to undertake other difficult reforms.
Breaking the barriers to productivity growth and female participation is a high priority. To move up
a higher real GDP growth trajectory than achieved in the recent past it is crucial for Bangladesh to focus
not just on easing the bottlenecks to capital accumulation but also on reforms to break the barriers to raising
productivity growth and female participation in the labor force. Absent these, the country will fail to achieve
the 7th Plan growth target despite meeting the envisaged levels of investment. Moreover, it is necessary for

4
the government to meet its revenue targets in order to maintain fiscal sustainability, considering the planned
expansion in expenditures.
The government, business and civil society in Bangladesh need to work hand-in-hand to promote
gender equality in labor markets. Reducing the prevalence of early marriage, strengthening girls’ early
orientation to career development, improving the jobs orientation of education providers, ensuring gender
equity in labor legislations and fostering non-discriminatory workplace environment are top priorities. In
addition to raising other challenges, gender based discrimination leads to a major misallocation of
resources. Strategic investments have to be made to increase women’s participation in the formal economy.
Women’s labor market access and agency have to be addressed in a more holistic way.
Policy should also aim at improving the quality of capital. To this end, important policies include
financial sector reform to increase savings, better allocate them to investment and maintain healthy
incentives. Trade reforms are also important for increasing access to foreign capital. Capital accumulation
will not occur unless good institutions are in place. Infrastructural improvements are important as well,
provided that the government sensibly finances capital formation and establishes institutions with strong
governance and good management.
Regulatory reforms needed to promote household enterprises in retail and wholesale trades. This can
unlock the potential of small- and medium-size enterprises. Appropriate reforms would reduce the number
of permits (and the associated delays) required to start and operate a business. In addition, lower collateral
requirements would improve access to finance and decrease the cost of credit for small businesses. Under
the right conditions, small and medium-sized firms can be major creators of jobs. Reforms to raise
agricultural productivity and rural incomes have a major role to play in poverty alleviation. Increased access
to modern irrigation, use of high-yield varieties, and improved market access could boost productivity.
Encouraging diversification through labor-intensive agri-business activities such as food processing, and
fostering greater value added in agricultural production will create job opportunities, and lessen incentive
to move to already congested cities.
5
I. Recent Economic Developments
The Bangladesh economy is weathering persistent global uncertainties relatively well. Poverty reduction
has continued. Growth remained resilient, aided recently by recovery in exports and private investments.
Inflation has decelerated benefitting from soft international commodity prices and prudent macroeconomic
management. Foreign exchange reserves have reached new heights. The real effective exchange rate has
appreciated, the financial sector is fragile although interest rates have declined, and the quality of budget
implementation remains deficient despite improvements in revenue mobilization. Outlook for Bangladesh’s
main export destinations is projected to improve, although downside risks remain elevated. Falling export
growth and decline in remittances are emerging near term concerns. Increased capital accumulation can
contribute significantly to growth acceleration, but increased female participation in labor force and
efficiency growth will be needed for the sustaining the accelerated growth path. Bangladesh continues to
be one of the more attractive nations in the South-east Asia region in which to do business. However, poor
infrastructure, inadequate energy supply, and inefficient financial intermediation combined with high cost
of doing business remain the main obstacles hindering the realization of Bangladesh’s vast economic
potential.

6
Poverty Trends
Declining poverty trend is likely to have persisted because of growth resilience accompanied by moderately
rising agricultural wages, declining food inflation and increased employment in labor intensive export
activities. Of late, slowing export growth, falling remittances and rising food inflation may have decelerated
the pace of poverty reduction.
Poverty is likely to have continued to decline. Rebound in labor intensive exports, decline in food
inflation, and rise in wages is likely to have contributed to maintaining a decent pace of poverty reduction
in FY16. Preliminary official quarterly poverty statistics (April-June, 2016) released by the government in
October 2016 suggest Bangladesh has continued its impressive poverty reduction observed in the past
decade. Poverty declined from 31.5 percent in 2010 to 23.2 percent in April-June, 2016.1 More recently,
slowing export growth (garments in particular), a rise in food inflation and large decline in remittances may
have set the trend back somewhat. According to BBS data, nominal wages in January 2017 were 6.7 percent
higher relative to January 2016, reflecting 6.7 percent higher wages in agriculture and services and 6.5
percent in industry. Nominal wage growth thus stayed somewhat ahead of headline inflation.
The year-on-year average daily wage for male laborers during the first half of FY17 increased by about
6-9 percent, growing 7 percent on average. Being the peak period for agricultural activities, wages
during the reporting quarter were relatively higher than in the previous one, for both male and female
laborers.
The scenario was fairly similar for female laborers. Although the wage rate of female laborers was
lower than that of their male counterparts, the year-on-year average grew about 11 percent during this
period despite a slight decline during the quarter compared to the previous quarter, for both male and
female laborers. In July, the average wage for a female laborer was Tk 259/day whereas for a male
laborer it was Tk 335/day – a difference of Tk 76 per day.
Wage data collected from BBS showed that the average Terms of Trade (ToT) declined in October as
compared to the previous quarter, then started rising to 10 kg of rice per day in December 2016.
However, the average ToT during this period was lower than in the same period last year. As mentioned
earlier considerably higher rice prices during the reporting quarter contributed to the decline.
Aggregate food availability remains satisfactory despite slower production growth. The Department
of Agricultural Extension (DAE) has fixed the target for food grain production at 36.5 million MT for FY17
of which 35.15 million MT is for rice and 1.35 million MT for wheat. Total food grain production in FY16
was 35.8 million MT against the target of 36.42 million MT. This year’s 1.8 percent growth target increase
relative to the actual production in FY16 is on the high side. The stock of food grain as of March 1, 2017
was 40.8 percent lower compared to March 1, 2016. Such a large decline reflected 9.3 percent decline in
food imports and 43.6 percent increase in public food distribution during July – February FY17 compared
with the same period in FY16. Early floods in the haor areas in Sylhet in late April 2017 have reportedly
damaged the standing boro crop to the extent of 2.5 to 5 percent of the DAE target.2
Despite certain shortfalls in the production system, Bangladesh has attained food self-sufficiency at the
aggregate level in terms of calorie availability. Alongside availability, people’s access to food has also
1 Note that the 31.2 percent estimate for 2010 was based on annual data, while the 23.2 percent estimate for 2016 is
based on quarterly data. Estimate based on the full year data from the Household Income and Expenditure Survey
2016/17 is still work-in-progress. 2 Various media reports, April 23-25, 2017.

7
improved which is evident from the rapid decline in poverty. Food utilization, in terms of nutritional
outcomes, has progressed significantly. Stunting among under 5 children has decreased from 55 percent in
1996–97 to 36 percent in 2014. Maternal undernutrition, as measured by “low” body mass index (BMI) has
declined sharply from 52 percent to 17 percent during the same period.3
Real Sector Developments
Growth resilience anchored poverty reduction, led by industry on the supply side and investments and net
exports on the demand side. Agricultural growth has been lackluster while remittances through formal
channels have reached a historic low dragging down consumption growth.
Healthy growth sustained. GDP growth in FY16 is officially estimated at 7.1 percent, higher than the 6.6
percent achieved in FY15, according to the final estimates from the Bangladesh Bureau of Statistics (BBS)
released in October 2016 (Table-1). This exceeded the 7 percent target set for the fiscal year for the first
time in recent decade. Both industrial and services sectors registered higher growth rates in FY16 compared
to FY15.
Table 1: Sectoral Growth
Overall GDP Growth Agriculture Industry Services
FY10 5.57 6.2 7.0 5.5
FY11 6.46 4.5 9.0 6.2
FY12 6.52 3.0 9.4 6.6
FY13 6.01 2.5 9.6 5.5
FY14 6.06 4.4 8.2 5.6
FY15 6.55 3.3 9.7 5.8
FY16 7.11 2.8 11.1 6.2
Source: Bangladesh Bureau of Statistics
Industry led growth from the supply side. Industrial growth increased to 11.1 percent in FY16 from 9.7
percent in FY15 with both the export-oriented garment industry and manufacturing for the domestic market
performing better. However, the official reported rise in manufacturing growth is not corroborated by a
corresponding rise in the Quantum Index of Industrial Production (QIIP) and growth in LC settlements for
industrial raw materials import in FY16 (Table-2). The QIIP, used for measuring the production
performance of the manufacturing industries, shows 12.1 growth for medium to large scale industries in
FY16, compared with 15.7 percent in FY15. Data on manufacturing industries available for the first quarter
(July-September) of FY17 show:
Medium and large scale manufacturing industries grew 7.3 percent over the corresponding period of
FY16. Among medium and large-scale manufacturing industries, production of leather & related
products increased 29.3 percent, non-metallic mineral products 29.1 percent, pharmaceuticals &
medicinal chemical 18.5 percent, fabricated metal products except machinery 17.2 percent, chemicals
& chemical products 16.2 percent, and textile 10.3 percent.
Production of basic metals declined by 8.1 percent, food products 6.6 percent, and the general index of
small scale manufacturing industry increased by a very modest 0.4 percent.
3 World Food Program, Bangladesh Food Security Monitoring Quarterly Bulletin, Issue No. 26, July-September
2016.

8
Table 2: High Frequency Indicators (%)
FY16 FY15
NBR Tax Revenue growth, July-June 14.6 12.3
ADP Implementation, July-June (% of Revised) 91.7 91.4
ADP Implementation, July-June (% of original) 86.1 85.3
Industrial raw materials import growth, July-June
LC Opening 4.2 3.8
LC Settlement 3.2 3.1
Growth in import of construction materials, July-June
LC Opening -3.3 18.8
LC Settlement 5.7 21.7
Growth in import of capital machinery, July-June 2.3 17.8
Remittances growth, July-June -2.5 7.7
Growth in quantum Index of manufacturing July-June 12.1 13.4
Credit flow to private sector, July-June 16.8 13.2
Exports, July-June 9.8 3.4
Sources: Bangladesh Bank, IMED, NBR, and EPB
Construction as an emerging subsector of industry grew by 8.6 percent in FY16, same as in FY15.
However, growth in import of construction materials has been weak (Table-2). In spite of the yet
unexploited potential of the construction sector, various factors such as land value distortion, absence of
secondary property market, asset securitization and sale of mortgages, and backward linkage industries
such as cement, ceramic, brick manufacturing adversely affected its development. The real estate business
improved in recent times, thanks to property price corrections, falling interest on home loans and continued
political stability. An increasing number of customers placed new bookings, with most of the realtors selling
flats and plots at a low profit margin to maintain their cash flows. Thus, in the five-day ‘REHAB Fair-2016’
of the Real Estate and Housing Association of Bangladesh (REHAB) in December 2016, realtors received
spot orders of 520 flats and 145 plots and 14 commercial spaces, worth around Tk.5.16 billion, in addition
to receiving bank loan commitment of Tk.9.17 billion.4 Expecting that the recent cut in lending rates by
banks and financial institutions would help raise the apartment sales, the realtors started undertaking new
apartment projects. The real estate sector now accounts for about 7 percent of the country’s GDP, employing
around a hundred thousand skilled people and 3.5 million others in the linkage industries, according to the
REHAB.
The share of electricity, gas and water supply in GDP is negligible, but the subsector is significant for
facilitating industrialization, services and modernization of agriculture. Growth in this subsector doubled
to 13.3 percent in FY16, compared with 6.2 percent in FY15. Notwithstanding commendable success in
power sector crisis management in the short-term, the long-term goals for sustainable power and energy
supply remain unresolved. The power supply situation improved in the first quarter of FY17 but the demand
for power, is estimated at around 10,000 mw, well above the maximum generation of 7,547 mw on January
17, 2017. By end-December 2016, total installed capacity rose to 13,151 mw, and derated/present capacity
to 12,547 mw, but production remained low because of gas shortage and also because some power stations were shut for maintenance.
4 A total of 160 REHAB members, 22 building material companies, and 10 financial institutions participated in the
five-day fair.

9
Access to electricity is currently about 80 percent, including both grid and off-grid (solar home systems)
connections.5 Those with grid connection experience supply disruptions due to shortage in generation
capacity and bottlenecks in the grid network. Annual per capita electricity consumption in Bangladesh is
currently at 370 kWh, compared to 1,010 kWh in India and 2,600 kWh in China. Bangladesh ranked 110th
on quality of electricity supply on Global Competitiveness Index.6
The government has undertaken a massive capacity expansion plan to have 24,000 mw capacity of power
production in the country by 2021. It has plans to commission some 10 power plants, including 8 in the
public sector with generation capacity of 1,623 mw and 2 in the private sector with generation capacity of
217 mw. Additional total generation capacity of these 10 power plants is projected to be 1,840 mw in 2017.7
Uninterrupted supply of electricity to run production smoothly and protect the machines from damages
caused by sudden power outages is a problem that refuses to go away, especially in peri-urban and rural areas, despite rapid growth in power generation capacity in recent years.8
Lackluster growth in agriculture. Agriculture grew by 2.8 percent in FY16, further decelerating from the
previous year’s 3.3 percent as expansion in staple crops and horticulture moderated. FY16 was
comparatively a slow year for crop production. Except for aman, maize and onion, production of all other
major crops had very weak growth. Overall, paddy production remained the same as in FY15. Apart from
aman, all the other crops registered negative growth rates compared to FY15. Adoption of improved seed
varieties appear to have reached saturation with modern rice varieties now accounting for 99 percent of
boro areas, 73 percent of aman, and 80 percent of aus. Improved varieties including hybrids accounted for
92 percent of the 34.7 million tonnes of rice produced in FY16.9 Further expansion of modern varieties is
constrained by submergence of land under water, salinity and farmers’ interest in local varieties. There is
room for increasing the HYV coverage of aman to no more than 90 percent of the total cultivated area.10
Comparatively faster growth rates were observed in maize (2.9 percent), potato (1 percent) and onion (4.4
percent).
Services benefited from public sector wage increases and stability. Services growth was stronger at 6.3
percent, compared with 5.8 percent in FY15. Higher public sector spending boosted the contributions of
public administration, education, and health services, augmenting growth in trade and business services as
well. Sustained political stability helped as well.
The rate of growth in transport, storage and communication, which accounts for 10.3 percent of GDP,
increased slightly to 6.1 percent in FY16, compared with 6 percent in FY15, helped by orderly
functioning throughout the year. Growth in this sector was dragged down by stagnating water transport
which struggled to maintain growth at barely 3 plus percent while the air transport sector growth
plummeted from 8.7 percent in FY15 to 1.5 percent in FY16.
5 According to the Ministry of Power, Energy and Mineral Resources (MoPEMR). The government has set the goal
of providing electricity to all citizens by 2021. 6 World Economic Forum, The Global Competitiveness Report 2016-2017. 7 Construction of these plants are mostly at initial stages. 8 There is robust evidence on the existence of a long run association between electricity consumption and economic
growth in Bangladesh, with causality running from electricity consumption to economic growth. Electricity
consumption can explain the major variations in economic growth in Bangladesh. Similarly in the short run a reverse
causality relationship exists between the two variables as well. Arifuzzaman Khan, Sandip Sarkar, Delowar Hossain,
Electricity Consumption & Economic Growth in Bangladesh: Evidence from Time-Series Causality Approach
9 BBS quoted by The Daily Star, February 5, 2017. 10 The recently introduced varieties like BRRI Dhan-76 and 77 have given hope that the hitherto uncovered areas
can be brought under HYV aman cultivation.

10
Community, social and personal services, accounting for 11.8 percent of GDP, continued to struggle
with a growth of only 3.3 percent in FY16, same as last year. Growth in the financial intermediation
sector, which accounts for 3.9 percent of GDP, remained unchanged at 7.7 percent.
Notwithstanding slight recovery, the real estate, renting and business activities remained trapped in a
low growth trajectory of about 4.5 percent.
Aggregate demand was boosted by a rebound in net exports and private investments in FY16 while private
consumption growth slowed despite large increases in public sector salaries as its impact was diluted by
decrease in remittances.
Private consumption, the mainstay of growth in recent years, slowed considerably. Growth in
household final consumption expenditure declined from 5.8 percent in FY15 to 3 percent in FY16, resulting
in a decrease in its contribution from 3.84 percentage points in FY15 to 1.97 percentage point in FY16
(Table-3). Its share in total GDP declined significantly from 72.4 percent in FY15 to 69.1 percent in FY16.
The fall in private consumption share reflected primarily slower growth in agricultural income and decline
in remittances.
Consumerism has been buoyant recently. Bangladeshis mostly consume basic staple foods, but with
urbanization, rising income and increasingly busy lifestyles, consumer preferences have shifted
dramatically. All consumer categories had been growing strongly in recent years. Growing disposable
income (6 percent CAGR during FY09-16) and an expanding urban middle class bolstered sales of non-
essential items.
Packaged food was valued at $9.8 billion in 2013 after registering a compound annual growth rate
(CAGR) of 20 percent from 2009 to 2013.
Dairy (CAGR 37 percent), baby food (CAGR 31 percent), noodles and pasta (CAGR 28 percent) and
confectionery (CAGR 25 percent) performed exceptionally well.
Soft drinks market value amounted to US$235 million in 2013 after registering a CAGR of 18 percent
since 2009. Juice (CAGR 23 percent), bottled water and sports and energy drinks (19 percent CAGR
each) and carbonates (16 percent CAGR) were the most dynamic soft drinks categories.
Categories such as beauty and personal care products (CAGR 15 percent over 2009-2013), home care
(CAGR 12 percent) and tissue and hygiene (CAGR 20 percent) performed strongly.11
11 Euromonitor International, Markets of the Future in Bangladesh, June 2014.

11
Table 3: Contribution to Growth
FY11 FY12 FY13 FY14 FY15 FY16
GDP Growth 6.5 6.5 6.0 6.1 6.6 7.1
Contribution of Production Sectors (%)
Industry 2.31 2.47 2.59 2.27 2.74 3.24
o/w Manufacturing 1.60 1.70 1.80 1.60 1.93 2.26
Services 3.30 3.40 2.90 2.90 3.00 3.21
Agriculture 0.80 0.50 0.40 0.70 0.53 0.43
Import Duty 0.12 0.10 0.13 0.16 0.28 0.24
Contribution of Expenditure Components (%)
Consumption 4.86 3.02 3.77 3.09 4.29 2.41
Private consumption 4.50 2.90 3.48 2.70 3.84 1.97
Government consumption 0.40 0.20 0.29 0.40 0.45 0.44
Investment 2.72 3.10 1.63 2.98 2.23 2.81
Private Investment 1.90 2.30 0.42 2.19 1.46 2.47
Government Investment 0.90 0.80 1.21 0.79 0.77 0.34
Resource Balance -0.97 -0.05 0.20 0.36 -1.25 1.90
Exports, goods & services 4.70 2.40 0.50 0.63 -0.54 0.38
Imports, goods & services -5.60 -2.50 -0.30 -0.30 -0.70 -1.52
Statistical discrepancies -0.15 0.45 0.40 -0.37 1.28 0.00
Source: Bangladesh Bureau of Statistics (BBS)
Decline in remittances has dragged down private consumption growth. Following a 2.5 percent decline in
FY16, remittances in the first nine months of FY17 declined by 16.9 percent relative to the same period the
previous year (Table-4), the highest decline experienced in recent memory. Unlike FY16, the decline this
time is not limited to GCC countries but also extended to the United States (the largest source next to GCC
countries) and the United Kingdom (the third largest).
Remittances from GCC countries declined by 17.2 percent, from US by 35.1 percent, Malaysia 12.3
percent and from UK by 6.3 percent.
Decline from GCC accounted for 57 percent, US 31 percent, Malaysia 7.1 percent and UK 1.8 percent
of the total gross decline.
Amongst the GCC countries, only Qatar registered a positive growth of 33.8 percent. This is potentially
driven by the significant construction work that Qatar has undertaken to prepare for FIFA World Cup
in 2022.
The decline in remittances is happening despite a steady increase in the number of Bangladeshis going
abroad in the recent past. In FY16 nearly 0.68 million workers went abroad, while in FY17 that number
has already reached 1.06 million in the first nine Months. The bulk of these workers has gone to Saudi
Arabia followed by Oman, Qatar and Bahrain. Despite repeated attempts by the government to open up the
UAE market, expatriate workers going to the UAE has remained miniscule. The slow-down in remittances
can also be observed within the region (Figure 1). Most of these countries have a significant portion of their
expatriate workers working in GCC countries.

12
Table 4: Accounting for Remittance Decline
US$ in million
Sources FY16
% of
Total
Gross
Decline
FY17
(Jul-Mar)
% of
Total
Gross
Decline
FY16
(Jul-Mar)
% of
Total
Gross
Decline
GCC -606.1 80.7 -1194.9 57.0 -387.9 79.9
KSA -385.1 51.3 -579.0 27.6 -202.5 41.7
U.A.E. -109.3 14.5 -492.2 23.5 -112.8 23.2
Kuwait -40.2 5.4 -21.7 1.0 -30.3 6.2
Oman -3.8 0.5 -23.3 1.1 -8.5 1.8
Bahrain -67.8 9.0 -78.7 3.8 -33.8 7.0
Others -145.0 19.3 -903.1 43.0 -97.6 20.1
UK … … -38.8 1.8 … …
USA … … -649.0 30.9 … …
Libya -33.4 4.5 -9.6 0.5 -22.5 4.6
Singapore -54.2 7.2 -56.6 2.7 -51.7 10.7
Iran … … -0.1 0.0 … …
Japan … … -0.7 0.0 … …
Malaysia -57.4 7.6 -148.3 7.1 -23.4 4.8
Others … … … … … …
Total Gross
Decline -751.1 100.0 -2098.0 100.0 -485.5 100.0
Increases 365.4 232.8 286.9
o/w Qatar 121.5 102.1 78.9
UK 57.0 … 36.8
USA 25.5 … 100.0
Germany 5.0 2.3 2.5
Iran 0.0 … 0.0
Japan 6.4 … 4.1
Others 150.1 128.4 64.7
Net decline -385.7 -1865.2 -198.6
Source: Bangladesh Bank
The precipitous decline in remittances cannot just be explained by the depressing effects of low oil prices
on incomes and employment in the oil exporting countries. The following appear to have contributed
nontrivially to the remittance decline:
In the aftermath of several high profile acts of terrorism in some major cities all over the world since
July 2016, the compliance requirements under Anti-Money Laundering regulations have become
stricter, leading to de-risking by commercial banks in their international money transfer operations.
This may have reduced the propensity to remit overall and the incentive to transfer funds through formal
channels.
The informal market exchange rate premium has widened steadily since January, 2015 from almost
zero to nearly Tk 5 per dollar mid-December, 2016. The difference jumped following the Indian
demonetization on November 8, 2016. This also strengthened the incentive for remitting through
informal channels.
13
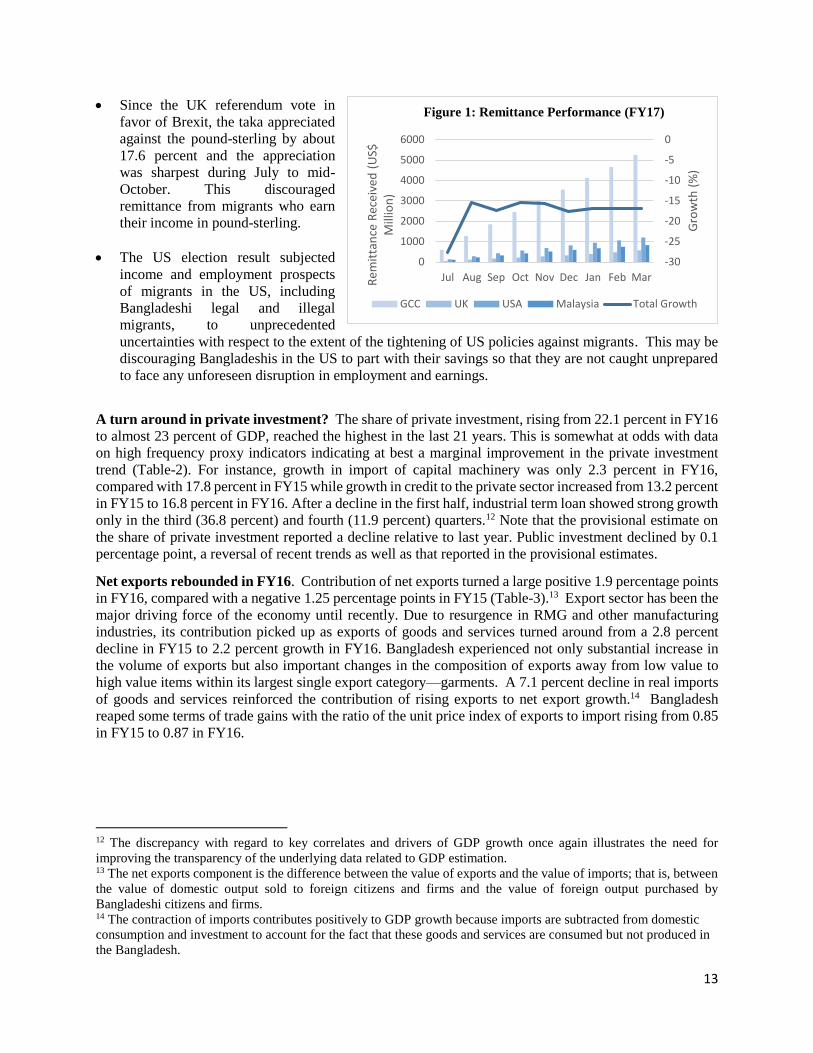
Since the UK referendum vote in
favor of Brexit, the taka appreciated
against the pound-sterling by about
17.6 percent and the appreciation
was sharpest during July to mid-
October. This discouraged
remittance from migrants who earn
their income in pound-sterling.
The US election result subjected
income and employment prospects
of migrants in the US, including
Bangladeshi legal and illegal
migrants, to unprecedented
uncertainties with respect to the extent of the tightening of US policies against migrants. This may be
discouraging Bangladeshis in the US to part with their savings so that they are not caught unprepared
to face any unforeseen disruption in employment and earnings.
A turn around in private investment? The share of private investment, rising from 22.1 percent in FY16
to almost 23 percent of GDP, reached the highest in the last 21 years. This is somewhat at odds with data
on high frequency proxy indicators indicating at best a marginal improvement in the private investment
trend (Table-2). For instance, growth in import of capital machinery was only 2.3 percent in FY16,
compared with 17.8 percent in FY15 while growth in credit to the private sector increased from 13.2 percent
in FY15 to 16.8 percent in FY16. After a decline in the first half, industrial term loan showed strong growth
only in the third (36.8 percent) and fourth (11.9 percent) quarters.12 Note that the provisional estimate on
the share of private investment reported a decline relative to last year. Public investment declined by 0.1
percentage point, a reversal of recent trends as well as that reported in the provisional estimates.
Net exports rebounded in FY16. Contribution of net exports turned a large positive 1.9 percentage points
in FY16, compared with a negative 1.25 percentage points in FY15 (Table-3).13 Export sector has been the
major driving force of the economy until recently. Due to resurgence in RMG and other manufacturing
industries, its contribution picked up as exports of goods and services turned around from a 2.8 percent
decline in FY15 to 2.2 percent growth in FY16. Bangladesh experienced not only substantial increase in
the volume of exports but also important changes in the composition of exports away from low value to
high value items within its largest single export category—garments. A 7.1 percent decline in real imports
of goods and services reinforced the contribution of rising exports to net export growth.14 Bangladesh
reaped some terms of trade gains with the ratio of the unit price index of exports to import rising from 0.85
in FY15 to 0.87 in FY16.
12 The discrepancy with regard to key correlates and drivers of GDP growth once again illustrates the need for
improving the transparency of the underlying data related to GDP estimation. 13 The net exports component is the difference between the value of exports and the value of imports; that is, between
the value of domestic output sold to foreign citizens and firms and the value of foreign output purchased by
Bangladeshi citizens and firms. 14 The contraction of imports contributes positively to GDP growth because imports are subtracted from domestic
consumption and investment to account for the fact that these goods and services are consumed but not produced in
the Bangladesh.
-30
-25
-20
-15
-10
-5
0
0
1000
2000
3000
4000
5000
6000
Jul Aug Sep Oct Nov Dec Jan Feb Mar
Gro
wth
(%
)
Rem
itta
nce
Rec
eive
d (
US$
M
illio
n)
Figure 1: Remittance Performance (FY17)
GCC UK USA Malaysia Total Growth
Figure 1: Remittance performance (FY17)Figure 1: Remittance Performance (FY17)

14
Inflation Trends
Headline inflation has declined, driven by declining non-food inflation, but core inflation and inflationary
expectations remain high. Food inflation has increased lately as a result of rise in rice prices caused by
crop damages in the northern region, public procurement and imposition of tariff on rice imports.
Inflation has moderated despite rise in food prices. Average inflation declined to 5.9 percent in FY16
from 6.4% in FY15, slightly lower than projected in the budget, restrained by subdued global commodity
prices, steady domestic supply, and a stable exchange rate. The decline came entirely from a fall in food
inflation from 6.7 percent in FY15 to 4.9 percent in FY16 while non-food inflation increased from 6 percent
to 7.6 percent. Inflation declined further to 5.3 percent (year-on-year) through February 2017 from 5.6
percent a year earlier, driven by lower non-food inflation that dipped to 3.1 percent from 8.5 percent a year
before. Food inflation rose to 6.8 percent in February 2017 from its recent low of 3.8 percent in February
2016.
Figure 2: Inflation rate (%)
4.0
6.0
8.0
10.0
12.0
14.0
16.0
18.0
FY
07
FY
08
FY
09
FY
10
FY
11
FY
12
FY
13
FY
14
FY
15
FY
16
Inflation rate, y-o-y (%)
General Index Food Non-food
Source: Bangladesh Bureau of Statistics
4.0
5.0
6.0
7.0
8.0
9.0
10.0
11.0
12.0
13.0
14.0
FY
07
FY
08
FY
09
FY
10
FY
11
FY
12
FY
13
FY
14
FY
15
FY
16
Rural and Urban Inflation, y-o-y (%)
Rural Inflation Urban Inflation
Source: Bangladesh Bureau of Statistics
4.00
4.50
5.00
5.50
6.00
6.50
7.00
7.50
8.00
8.50
9.00
Feb
-14
May
-14
Au
g-1
4
No
v-1
4
Feb
-15
May
-15
Au
g-1
5
No
v-1
5
Feb
-16
May
-16
Au
g-1
6
No
v-1
6
Feb
-17
12-monthly moving average, Rural and
Urban inflation (%)
Rural Inflation Urban InflationSource: BBS
4.00
5.00
6.00
7.00
8.00
9.00
Feb
-14
May
-14
Au
g-1
4
No
v-1
4
Feb
-15
May
-15
Au
g-1
5
No
v-1
5
Feb
-16
May
-16
Au
g-1
6
No
v-1
6
Feb
-17
12-monthly moving average inflation
(%)
General Index Food Non-foodSource: BBS

15
Significantly variation between urban and rural inflation. Headline inflation in urban areas increased
from 6.8 percent in FY15 to 7.1 percent in FY16, while it declined from 6.2 percent to 5.3 percent in rural
areas. Increase in urban inflation came entirely from increase in non-food inflation while decrease in rural
inflation came entirely from decrease in food inflation. Urban food inflation began to rise from 5.5 percent
in February 2016 to 7.2 percent in February 2017 while in rural areas it rose from 3 percent to 6.7 percent
during the same period. Urban non-food inflation declined from a recent high of 9.3 percent in January
2016 to 3.9 percent in February 2017 while rural non-food inflation declined from its 8.4 percent high in
January 2016 to 2.5 percent in February 2017.
The inflation dynamics in Bangladesh reflects the confluence of domestic output growth supported
by accommodative monetization and continued moderation in global commodity prices.15 The output
gap turned significantly positive in FY16.16 The rate of inflation tends to increase when the overall demand
for goods and services exceeds the economy's capacity to supply goods and services i.e. when the output
gap is positive. Since FY10, actual output had been below potential in the range of 0.1 to 0.5 percent until
FY16 when actual output exceeded the potential by 0.4 percent compared with -0.3 percent the previous
year. The emergence of overheating explains the steep rise of non-food inflation experienced during most
of FY16. Overheating resulted from a very large public sector pay increases implemented in FY16,
boosting aggregate demand, fueled inter-alia by cost-push from the knock on effects of the increase in gas
and electricity prices.
Weaker aggregate demand dampened non-food inflation more recently. The steady decline in non-food
inflation since January 2016 through January 2017 has to do with weakening of aggregate demand due to
a large decline in remittances, which reduced purchasing power in both rural and urban areas very
significantly, and the tapering of the effect of the public sector wage increases implemented in the first half
of 2016. In addition, there were no further upward adjustments in the administered prices of gas and
electricity that could sustain the cost push impact of the earlier increases in these prices.
Table 5: Actual GDP, Potential GDP and Output Gap
2007 2008 2009 2010 2011 2012 2013 2014 2015 2016
2017
(P)
2018
(P)
2019
(P)
Actual
GDP 7.1 6.0 5.0 5.6 6.5 6.5 6.0 6.1 6.6 7.1 6.8 6.4 6.7
Potential
GDP 5.8 5.9 6.0 6.1 6.3 6.4 6.3 6.4 6.4 6.3 6.4 6.5 6.4
Output
Gap (% of
Potential
GDP)
1.0 1.1 0.2 -0.3 -0.1 0.0 -0.2 -0.5 -0.3 0.4 0.7 0.7 1.0
Source: World Bank staff estimates
15 A methodologically sound study concluded that the GDP, broad money, government expenditure and import have
a positive effect on the inflation in long run. On the other hand, government revenue and export have a negative effect.
The government expenditure coefficient is 0.466 and the money supply coefficient is 0.337, implying a one percent
increase in government expenditure and one percent increase in money supply elicit 0.466% and 0.337% increase in
inflation respectively. In the short-run money supply has been found to be major factor influencing inflation in the
country. See Kazi Mostafa Arif1 and Munshi Murtoza Ali, Determinants of Inflation in Bangladesh: An Empirical
Investigation, Journal of Economics and Sustainable Development www.iiste.org ISSN 2222-1700 (Paper) ISSN
2222-2855 (Online) Vol.3, No.12, 2012 16 The output gap is the difference between demand and the economy's capacity to supply, as measured by the
difference between the ‘actual' level of output (GDP) and the economy's ‘potential' level of output (potential GDP).

16
Structural factors contributed to recent increase in food inflation. Sustained increase in rice prices played
an important role (Figure-3). Prices of coarse rice have been volatile with a sharp upward trend. It increased
by 47.3 percent during May-October, 2016 followed by 6.2 percent decline during October-December
before rising again by 10.9 percent through April 2017. Thus, coarse rise price increased by 51.9 percent
within a 12-month period ending April 2017. With rice accounting for 16.5 percent and 5.9 percent in rural
and urban consumption baskets respectively, this alone would have added over 7 percentage point to food
inflation in the absence of decline in prices of other food items such as onions, flour, masur, potato etc. The
rise in rice prices were not externally induced. International rice prices, as per FAO rice price index based
on 16 rice export quotations, followed a downward trend during July-September 2016. They averaged about
7 percent less than in the same period a year ago and 1.4 percent lower than in the previous quarter. The
average coarse rice price for Thai 5 percent broken rice also showed a similar pattern during the same
quarter.17 Note, however, that the average coarse rice price for Kolkata rice increased by 6 percent during
the July-September 2016 compared with the same period a year ago.
Figure 3: Price trend of Coarse Rice, Soyabean Oil and Brinjal
Source: Department of Agricultural Marketing (DAM)
Domestic factors such as reduced supply due to floods, government procurement, import tariffs and
depleting stocks contributed to the rise in course rice price. Very recently, domestic rice price suffered an
adverse shock due to flood induced damage of 0.65 million tonnes of boro crop (equivalent to 3.5 percent
of the boro production target this year) in the haor regions in Sylhet. Earlier, the Government had been
procuring paddy directly from the farmers which caused shortfall of rice stock in the local markets, thus
boosting local prices. The government hiked the customs duty on rice import to 25 percent in the FY17
budget from the previous 10 percent while removing the 10 percent regulatory duty in place since December
2015. In addition, it imposed a 15 percent value added tax (VAT), an advance income tax (AIT) of 5 percent,
and an additional advance trade VAT (ATV) of 4 percent. The tariff was raised and other taxes were added
to stop cheaper Indian rice imports that generally constitute the largest share of the import market. The duty
hike was intended to ensure that farmers in Bangladesh get a fair price for the rice they produce. Farmers
have long urged the government to increase the duty on rice import as they were reportedly unable to
recover cultivation costs because of imports from India at cheaper rates.18
17 Sluggish import demands and abundant export supplies pushed down the international rice prices. 18 Many millers had reportedly given up rice milling due to the “excessive” imports from India.
24.00
26.00
28.00
30.00
32.00
34.00
36.00
38.00
40.00
42.00
Jan
-15
Ap
r-15
Jul-
15
Oct
-15
Jan
-16
Ap
r-16
Jul-
16
Oct
-16
Jan
-17
Ap
r-17
Coarse Rice
15.00
25.00
35.00
45.00
55.00
65.00
60.00
65.00
70.00
75.00
80.00
85.00
90.00
95.00
100.00
105.00
Jan
-15
Ap
r-15
Jul-
15
Oct
-15
Jan
-16
Ap
r-16
Jul-
16
Oct
-16
Jan
-17
Ap
r-17
Soybean Oil and Brinjal
Soybean Oil Brinjal (Right Axis)

17
External Trade and Exchange Rates
Foreign exchange reserves have continued to grow, albeit at a slower pace, as decelerating export growth
and plummeting remittances resulted in large current account deficit. While the Bangladesh Bank has
managed to keep nominal exchange rate against the US dollar in the interbank market almost fixed, the
nominal cross rates have appreciated particularly against the pound-sterling and the Euro, as has the Real
Effective Exchange rate.
External balances remain robust, but
challenges may be emerging.
Bangladesh’s external position improved
further in FY16, with an overall balance of
payment surplus of $5.04 billion,
compared with $4.4 billion in FY15. The
surplus increased due to reduction in
deficits in the merchandize trade, services
and income accounts. Decline in trade and
services deficit were driven primarily by
recovery in growth of export of
merchandize and non-factor services
respectively. The increase in the size of the
current account surplus offset the
combined decrease in the size of the
financial and capital accounts surplus. The
overall surplus as percent of GDP had been declining in recent years (Figure-4). With considerable
deceleration in export growth, acceleration in import growth and a very large decline in remittances, the
current account recorded a $1.1 billion deficit in the first eight months of FY17, compared with $2.9 billion
surplus during the same period last fiscal year. However, the overall balance still had a surplus of $2.4
billion, reflecting a large increase in the financial account surplus from $824 million in July-February, FY16
to $2.9 billion in July-February, FY17. This increase came from a decline in outflows on account of trade
credit and increased FDI.
Excess supply led to some
appreciation in the exchange rate
of taka against major currencies
(Table-6). Indeed, to maintain
stability of the exchange rate of
Taka vis-à-vis the USD, BB
continued to purchase dollars to
mop up excess supply from the
inter-bank market. While this
succeeded in keeping the taka-
dollar rate stable, it could not
prevent the appreciation of taka
against the UK Pound Sterling
which dropped to Tk 105 per pound
after the Brexit vote on June 23,
2016 from Tk 114 BDT in May
2016 (Figure-5). Exchange rate of Euro was volatile during the entire last half of 2016.
0
5
10
15
20
25
30
35
-1
-0.5
0
0.5
1
1.5
2
2.5
3
3.5
4
FY07FY08FY09FY10FY11FY12FY13FY14FY15FY16
Overall BOP (% of GDP) Reserve (US$ b.)-Right axis
Source: Bangladesh Bank
Figure 4: Overall BOP (% of GDP) and
Reserve (US$ b.)
1.021.061.101.141.181.221.261.301.341.381.421.46
70.0075.0080.0085.0090.0095.00
100.00105.00110.00115.00120.00
10
-Ap
r-1
62
0-A
pr-
16
30
-Ap
r-1
61
0-M
ay-1
62
0-M
ay-1
63
0-M
ay-1
69
-Ju
n-1
61
9-J
un
-16
29
-Ju
n-1
69
-Ju
l-1
61
9-J
ul-
16
29
-Ju
l-1
68
-Au
g-1
61
8-A
ug-
16
28
-Au
g-1
67
-Se
p-1
61
7-S
ep
-16
27
-Se
p-1
67
-Oct
-16
17
-Oct
-16
27
-Oct
-16
6-N
ov-
16
16
-No
v-1
62
6-N
ov-
16
6-D
ec-1
61
6-D
ec-1
62
6-D
ec-1
65
-Jan
-17
15
-Jan
-17
25
-Jan
-17
4-F
eb
-17
14
-Fe
b-1
72
4-F
eb
-17
6-M
ar-1
71
6-M
ar-1
72
6-M
ar-1
75
-Ap
r-1
71
5-A
pr-
17
Tk per pound Tk per EuroDollar per pound (right axis) Dollar per euro (right axis)
Brexit(June23,2016)
US Presidential Election 2016(November 8)
Figure 5: Exchange Rate

18
Table 6: Exchange rate (Taka/unit of foreign currency) changes and Inflation
differential
Feb, 2016 Feb, 2017 % Change
Inflation
differential*
USD 77.08 78.56 1.92 6.29
Euro 85.58 83.69 -2.21 6.37
Indian Rupee 1.13 1.17 3.79 0.53
Pakistani Rupee 0.73 0.74 1.72 3.87
British Pound 110.31 98.07 -11.09 6.36
Chinese Yuan 11.77 11.43 -2.87 4.96
Japanese Yen 0.67 0.70 3.35 5.62
Malaysian Ringgit 18.41 17.67 -3.99 4.30
Canadian Dollar 55.87 60.01 7.40 5.28
Singapore Dollar 54.83 55.47 1.17 6.95
Thai Baht 2.16 2.24 3.61 7.30
Swedish Korna 9.09 8.83 -2.83 6.45
Indonesian Rupiah 0.01 0.01 3.61 0.04
Vietnamese Dong 0.00 0.00 -0.03 5.77
Source: Bangladesh Bank, Oanda and WDI
*difference between the inflation rate (2015) of Bangladesh and referred countries
Reserves increase continued. The level of reserves rose to $30.1 billion at the end of FY16, equivalent to
7.9 months of imports, and further to nearly $33 billion by end-April, 2017.19 Almost one-third of official
reserves are in the form of liquid assets held with the Federal Reserve Bank in the US and the Bank of
England. The rest is invested in treasury bonds and gold. The foreign exchange reserves continued to grow,
owing to an overall surplus in the balance of payments and capital account restrictions. At nearly 8 months
of imports in FY16, reserves appear comfortable and above the corresponding levels in many emerging
economies like Singapore (5.9), South Korea (7.8), Hong Kong (5.6) and was close to that of India's (9.5),
though lower than that of China's (17.6). Reserves appear comfortable on several other commonly used
reserve adequacy indicators (Table-7), but that can change rather quickly with rising imports, falling export
growth and declining remittances.
19 There was a hiccup faced by Bangladesh Bank in February 2016 when $100 million was literally stolen from its
foreign currency account held in Federal Reserve Bank of New York by hackers. So far, Bangladesh Bank has only
been able to recover part of the money.

19
Table 7: Reserve Adequacy Indicators
2010 2011 2012 2013 2014 2015 2016 Standard values
Ratio of Import cover (month) 5.1 3.9 3.3 5.5 5.8 7.0 7.9 3 months
Ratio of reserves to short-term
foreign debt balance (%) 364.5 518.4 527.1 410.0 513.4 … … ≥ 100%
Ratio of foreign exchange
reserves to the total foreign
debt (%)
41.7 40.1 40.6 60.4 69.7 76.5 84.6 40%
Ratio of foreign exchange
reserves to Money (M1) (%) 76.2 68.5 71.8 91.7 113.0 117.7 109.7
Ratio of foreign exchange
reserves to Quasi-money
(M2) (%)
18.5 16.0 15.2 18.8 22.8 24.0 25.4
10%-20% (fixed
exchange rate
system) and 5%-
10% (floating
exchange rate)
Memo Item:
Reserves (US$ bill) 10.8 10.9 10.3 15.3 21.3 25.0 30.1
Foreign Debt (US$ bill) 25.8 27.2 25.5 25.4 30.6 32.7 35.6
Source: Bangladesh Bank, International Debt Statistics 2016, Ministry of Finance
Rethinking needed on managing the managed float. A 6.5 percent appreciation of the Real Effective
Exchange Rate in the 12 months through December 2016 (Figure-6), a weak domestic investment climate,
and a sustained appetite for seeking safe haven to store locally acquired investible surplus through
corruption or tax evasion have seriously challenged exchange rate and reserve management while also
contributing to diversion of remittance inflows away from the formal/official channels. There is strong
demand for capital transfer from Bangladesh, which cannot be met through formal financial channels due
to binding capital account
restrictions. The hundi channel caters
to this unmet demand by diverting
supplies of remittances in countries
of origin. With growth in demand for
unofficial capital flight, the premium
over the interbank exchange rate
grows in order to attract funds away
from the formal market. This demand
pressure led to the widening of the
spread between the interbank and
parallel market exchange rates in
Bangladesh in early October,
exacerbated subsequently by the
Indian demonetization on November
8. The spread, which used to be Tk.
1-1.5 per US, widened to Tk. 4.5 or
more before declining to around Tk 3
in April (Figure-7). Thus the demand for officially unmet capital transfer is matched by corresponding
increased supply to the hundi market from remittances, causing a decline in the inflow of remittances into
Bangladesh through banking channels.
70
80
90
100
110
120
130
140
150
70
80
90
100
110
120
130
140
150
19
95
19
96
19
97
19
98
19
99
20
00
20
01
20
02
20
03
20
04
20
05
20
06
20
07
20
08
20
09
20
10
20
11
20
12
20
13
20
14
20
15
20
16
REER HP trend Linear (REER)
Figure 6: Bangladesh: Real Effective Exchange RateOct. 1995–Dec. 2016; (Index; 2010=100)
Source: IMF, Information Notice System database.
Figure 6: Bangladesh: Real Effective Exchange Rate

20
Learning from peers. To
manage the foreign exchange
market better, the Bangladesh
Bank and the Government
must work on both demand
and supply sides to restore the
demand-supply balance in the
interbank and curb markets.
Demand side policies should
aim at addressing the
concerns which are
contributing to the increased
capital flight. On the supply
side, efforts must be made to
contain the spread between
the interbank and
parallel/hundi markets for
foreign exchange. Bangladesh's exchange regime is still very restrictive compared with India and Pakistan.
Liberalization should help alleviate demand pressure and thus contribute to the reduction of spread between
the interbank and parallel markets. Capital flight is a manifestation of the private sector's lack of confidence
in the economy and economic policy. Making Bangladesh more business friendly through regulatory
reforms and infrastructure development, good governance, and application of rule of law will create a better
environment for the private sector to invest at home.
The Financial Sector
Bank lending rates maintained a declining trend as did the deposit rates. Private sector credit growth has
prodded along despite large excess liquidity in a banking system that is increasingly being stressed by non-
performing loans. Stock prices surged temporarily, but capital market development is bogged down by the
rapid rise in sales of the National Savings Certificates.
The banking sector, the sheet anchor of
Bangladesh’s financial sector, has
continued to struggle. Lending rates have
moved into single digit territory for the first
time in recent memory, accompanied by
similar decline in the average deposit rate
which left the spread unchanged at around
4.8 percent (Figure 8). Scheduled banks in
Bangladesh are holding liquid assets worth
1.8 times the minimum required level.
Despite the high level of liquidity in the
banking sector, private sector credit growth
declined to 15.6 percent in December, 2016
from 16.8 in June, indicating that banks are
still struggling to attract good borrowers even though lending rates have declined. The cautious approach
by the banking sector is underpinned by the rise in non-performing loans (NPL) during this period.
0.0
5.0
10.0
15.0
Au
g-1
3
No
v-1
3
Feb
-14
May
-14
Au
g-1
4
No
v-1
4
Feb
-15
May
-15
Au
g-1
5
No
v-1
5
Feb
-16
May
-16
Au
g-1
6
No
v-1
6
Feb
-17
Interest Rate Movement
Spread Lending Rate Deposit Rate
Figure 8: Interest Rate Movement
81.50
81.70
83.10
77.00
78.00
79.00
80.00
81.00
82.00
83.00
84.00
10
-Ju
l2
0-J
ul
30
-Ju
l9
-Au
g1
9-A
ug
29
-Au
g8
-Se
p1
8-S
ep
28
-Se
p8
-Oct
18
-Oct
28
-Oct
7-N
ov
17
-No
v2
7-N
ov
7-D
ec1
7-D
ec2
7-D
ec6
-Jan
16
-Jan
26
-Jan
5-F
eb
15
-Fe
b2
5-F
eb
7-M
ar1
7-M
ar2
7-M
ar6
-Ap
r1
6-A
pr
26
-Ap
r
Inter-bank and Informal Exchange rate
Weighted avg. Exchange rate Mid-Rates
81.1
78.4
83.5
80.2
Indian
Demonetization,
8th Nov
Source: Bangladesh Bank
Figure 7: Inter-bank and Informal Exchange Rate

21
NPLs continue to plague the banking
sector (Figure-9). While there was a marginal
decrease in December last, NPLs in the
banking sector continue to remain high at
nearly 10 percent of total outstanding loans.
The major contributor to NPLs are the state
owned commercial banks (SCB). Since
December 2013, the share of NPLs in SCBs
have increased from 19.8 percent to 25.2
percent as of November 2016. During the
same period, private commercial banks
(PCBs), saw their share of NPLs increase by
1.4 percentage points. The performance of the
largest SCB, Sonali Bank has particularly
been dismal. At the close of 2016, Sonali Bank’s NPLs stood at 26.6 percent increasing by 1.6 percentage
points from a year earlier. The gradual rise in NPLs have also hit the profitability of the SCBs. In the case
of Sonali Bank, overall profitability declined by nearly 51 percent in 2016. The underperformance of the
SCB has serious implications for their ability to meet the BASEL III framework. The capital to risk
weighted asset ratio set at 10.625 percent has been met by both the PCBs and the foreign banks. The SCBs
as well as the specialized development banks (SDB) were unable to maintain this minimum requirement.
This will most likely lead to further recapitalization of these banks during the next budget cycle.
Banking sector risk management needs closer attention. The Capital Adequacy Ratio of the banking
sector improved slightly as per BASEL II standards, but this increase in industry level CAR is attributable
partly to a relaxation in the large loan rescheduling requirements introduced by Bangladesh Bank (BB) for
a specific period. A number of banks also failed to maintain the regulatory capital this year, and the
insolvency of the State-owned Development Banks (SDBs) significantly worsened. The asset quality of the
overall banking sector deteriorated, even though a number of banks took advantage of the regulatory
forbearance (BB’s directive on large loan rescheduling window) and rescheduled their possible candidates
of large non-performing loans to report lower NPL figures. Banking sector efficiency indicators declined
further and the profitability recorded a mixed result. The low level of demand for credit by the private and
public sector is manifested in the rising liquidity. Higher availability of liquid funds brought down the
advance-deposit ratios (ADR) of many banks. Stress testing assessment of Bangladesh Bank based on the
figures as of September 30, 2016 indicated that default loan would have a major impact on the banking-
sector Capital Risk-weighted Asset Ratio (CRAR), implying that the banking sector as a whole need to pay
due attention to managing concentration risk in a prudent manner. By contrast, the banking industry was
found to be fairly resilient in the face of various market-risk shocks. Moreover, the individual banks and
the banking system as a whole were found to be well-resilient against various liquidity- stress scenarios
during the period.
Renewed optimism in the bourses. Breaking anxieties and uneasiness that persisted in the previous years
from both the fiscal, monetary and political fronts, the local capital market wrapped 2016 with high hope
and optimism, gaining an 8.78 percent return in the year. A consistent rally in the later part of the year
enabled the index to stay above the 5,000 points level. Policy support extended by Bangladesh Bank in
adjusting capital market overexposure to the permissible limit by banks without selling any shares as well
as the declining deposit interest rates and growing confidence in political stability prompted investors to
take position.
The market remained mostly sluggish during the first 10 months of the year including a downward trend in
the first five months. The key index of the bourse dropped to 4,171.4 points on May 2, the lowest in the
year, in line with the apprehension of liquidating portfolio of shares by the banks ahead of the July 21
0
5
10
15
20
25
30
Dec
-13
Feb
-14
Ap
r-14
Jun-1
4
Au
g-1
4
Oct
-14
Dec
-14
Feb
-15
Ap
r-15
Jun-1
5
Au
g-1
5
Oct
-15
Dec
-15
Feb
-16
Ap
r-16
Jun-1
6
Au
g-1
6
Oct
-16
Dec
-16
Total SCBs PCBs
Figure 9: NPL as percent of Outstanding Loan

22
deadline for adjusting capital market overexposure. Due to improved confidence level resulting from policy
support, the market on July 31 increased to 4,540.89 points from 4,171.4 points on May 2. On way, the
market suffered some bumpy rides but subsequently moved up significantly in the months of November
and December following substantial pouring of foreign portfolio investments.
The net portfolio investment was BDT 2.13 billion in October while the amount was BDT 1.41 billion
in September. Riding on investors’ optimistic participation on the trading floor, the daily average
turnover at the Dhaka Stock Exchange (DSE) increased to BDT 7.78 billion in last two months, while
the amount was BDT 5.20 billion in the previous two months.
In 2016, only 10 companies, including mutual funds, were listed with the bourses that raised about BDT
8.49 billion by issuing 426.7 million shares and units. The apparent intent of the regulator to restrict
IPOs in order to bring back attention into the secondary market found a bit of success. The move,
however, affected the other side since the number of active Beneficiary Owner's (BO) accounts
witnessed no significant rise. Additionally, reduced opportunity for general investors in IPO after
introduction of quota for institutions also induced some to close down their accounts.20
A bull run all of a sudden. After a sluggish 2016, when the benchmark index of the Dhaka Stock Exchange
remained stagnant, the index increased by nearly 27 percent by the end of January. As shown in Figure 10,
this particular rise in the stock market index is not as pronounced as the one in 2010-2011. However, a
closer look at the market performance for January and February reveals signs of significant bullish trends.
Given Bangladesh’s strong macroeconomic performance, one can always argue that the recent surge is a
reflection of these fundamentals. That leaves unexplained why it took so long for the capital market to
notice. The capital market in Bangladesh had two significant moments of capital market crashes and
consequently, the recent surge warranted a more cautious assessment on the part of investors.
DSE market capitalization recorded on January 24 at Tk. 3,771 billion, rising from Tk. 2,855 billion at
the end of December, representing a 32 percent increase over the course of just one month! Unlike the
bull run of 2007-08, when there was the listing of Grameen Phone, this period has not seen any
20 On July 01, 2016, the number of active BO accounts was 3.15 million. Later, on September 8, 2016 the number
declined to 2.91 million after closing of 241,062 accounts. By mid-December the number of active BO accounts
improved to 2.93 million reflecting that only 19,482 accounts were opened in the last three months.
5605.00
5000
5100
5200
5300
5400
5500
5600
5700
5800
1-J
an-1
7
4-J
an-1
7
7-J
an-1
7
10-J
an-1
7
13-J
an-1
7
16-J
an-1
7
19-J
an-1
7
22-J
an-1
7
25-J
an-1
7
28-J
an-1
7
31-J
an-1
7
3-F
eb-1
7
6-F
eb-1
7
9-F
eb-1
7
12-F
eb-1
7
15-F
eb-1
7
18-F
eb-1
7
0
5
10
15
20
25
30
35
40
2009 2010 2011 2012 2013 2014 2015 2016 2017
(Feb)
Market PE Market Cap As % of GDP
Figure 11: Dhaka Stock Exchange General
Index (Jan 2017-Feb 2017)
Figure 10: DSE Ratios

23
significant increase in the supply of Initial Public Offering (IPOs), although there were some listing of
new issues. Also, net foreign investment in the capital market increased dramatically.
Foreign investors bought shares worth Tk. 6 billion and sold shares worth Tk. 4 billion, to take their
net investment to Tk. 1.9 billion. This represents a nine-time increase relative to January, 2016. The
preferred destination for the investors was the financial sector (banking and non-banking financial
institutions) followed by the power, telecommunication and IT sector. The PE ratio of the banking
sector (11.2) and power sector (13.9) is below that of the market PE ratio (14.3) while the PE ratio in
the telecommunication sector stands at 19.2 and 21.6 for non-banking financial institutions.
The fragility of the market was evident when it plunged in response to cautionary signals given by
Bangladesh Bank during the release of its January-June, 2017 Monetary Policy Statement at the end of
January 2017.
The approach the government currently takes in financing the budget deficit is inimical to debt
market development. The budget will have to be financed domestically to a large extent with external
financing relatively stable at around 1 percent of GDP. Part of domestic financing has always been from
banks’ purchase of treasury bills and bonds. However, non-bank borrowing with National Saving
Certificates (NSCs) has sharply accelerated in recent years due to the administratively set higher interest
rates relative to the market determined term deposit rates.21 Note that the issuance of NSCs is determined
by public demand for these certificates and not the borrowing plans of the Ministry of Finance for the
budget. Sporadic downward revisions of NSC rates have not kept pace with falling inflation and market
rates, increasing NSC’s implicit subsidy.22 Overshooting the budget target for borrowing through NSCs
constrains the issuance of treasury bills and bonds, preventing the development of a deep and liquid market
for government securities needed to establish a reliable benchmark yield curve reflecting accurately the
cost of funds at different maturities. It also locks up in subsidized instruments a large share of long-term
savings which would otherwise be channeled into institutional investor funds.
Fiscal Policy Fiscal deficit has declined with improved revenue mobilization, undershooting of capital expenditure target
and reduced spending on subsidies. Reliance on costly non-bank sources of domestic financing increased,
thus contributing to swelling interest burden on the budget. Ad-hoc administered price adjustments have
reduced quasi-fiscal deficit. Concerns about the quality of expenditure outcomes continue to haunt.
Overall budget deficit continues to be within sustainable thresholds. Low level of expenditure outturns
relative to revenues resulted in a significantly lower budget deficit of 3.1 percent of GDP (Table-8),
compared with the 5 percent original budget target and 3.3 percent outturn in FY15. Financing relied heavily
on domestic non-bank sources which accounted for 69 percent of the total deficit, constituting 2.2 percent
of GDP. Government’s borrowing from sales of National Savings Certificate (NSC) in FY16 amounted to
Tk 336.9 billion, surpassing the revised target of Tk. 280 billion by 20.3 percent. The government borrowed
only Tk. 106.1 billion from the banking sources, compared with the revised budget target of Tk 316.7
billion. Net foreign borrowing and grants collectively contributed to the financing of only 9.8 percent of
total budget deficit in FY16. At the end of the year, the original expansionary fiscal stance turned not so
expansionary after all.
21 The interest rate on the NSC ranges from 9 percent to 12 percent creating a significant difference between the
term deposits offered by Banks. 22 Abuse of the NSC system is also difficult to prevent, as single-lender limits are easy to circumvent.

24
Table 8: Fiscal Outcomes
Taka in billion
FY 12 FY 13 FY 14 FY 15 FY 16
FY 16
(Jul-
Nov)
FY 17
(Jul-
Nov)
Total Revenue 1146.9 1281.3 1403.8 1438.5 1714.3 619.8 723.1
Total Expenditure 1524.3 1745.4 1882.1 1937.0 2250.6 612.7 782.0
Overall balance -377.3 -464.1 -478.3 -498.5 -536.3 7.1 -58.9
External Financing 71.9 126.9 97.1 71.5 58.2 -11.5 -6.4
Domestic Financing 305.4 331.9 381.4 427.4 478.2 4.4 65.3
o/w Bank 271.9 274.6 181.7 48.9 106.1 28.9 -65.6
o/w Non-Bank 33.5 57.3 199.7 378.5 372.1 -24.5 131.0
% of GDP
Total Revenue 10.9 10.7 10.4 9.5 9.9 3.6 3.7
Total Expenditure 14.4 14.6 14.0 12.8 13.0 3.5 4.0
Overall balance -3.6 -3.9 -3.6 -3.3 -3.1 0.0 -0.3
External Financing 0.7 1.1 0.7 0.5 0.3 -0.1 0.0
Domestic Financing 2.9 2.8 2.8 2.8 2.8 0.0 0.3
o/w Bank 2.6 2.3 1.4 0.3 0.6 0.2 -0.3
o/w Non-Bank 0.3 0.5 1.5 2.5 2.1 -0.1 0.7
Source: Ministry of Finance Revenue mobilization improved. After declining for three consecutive years since FY12, the revenue to
GDP ratio increased from 9.5 percent in FY15 to 9.9 percent in FY16 despite being well below target and
without any significant policy reform. Overall revenue earnings in FY16 experienced a shortfall of about
Tk. 369.7 billion relative to the original target of Tk 2084 billion, notwithstanding 19.1 percent revenue
growth, the highest in recent memory in any particular year. NBR revenue earnings increased by 18 percent
while non-NBR tax and non-tax revenue increased by 26.1 percent, driven by more than doubling of
dividend and profit. A positive feature of revenue mobilization has been the rise in share of income tax in
total NBR revenue collection. However, this could not be sustained in recent years (Table-9). In FY16 the
share of income tax declined for the second consecutive year to reach 34.3 percent, close to the level of
FY13.

25
Table 9: Revenue Composition
Tk. in billion
Revenue Categories FY12 FY13 FY14 FY15 FY16
FY17
(Jul-
Feb)
Indirect Taxes
Customs Duty 131.5 132.3 135.4 153.5 180.2 134.9
VAT (import) 137.9 148.5 153.3 176.9 205.8 163.2
Supp. (import) 43.7 42.1 43.4 52.5 65.6 47.9
Export Duty 0.4 0.3 0.4 0.4 0.3 0.2
Trade Related 313.5 323.1 332.4 383.3 451.9 346.2
Excise Duty 6.6 7.7 8.2 9.6 15.8 14.8
VAT (Domestic) 219.8 263.7 292.5 322.9 348.6 251.8
Supp. Duty (Domestic) 119.2 119.9 136.5 157.6 196.3 150.3
Turnover Tax 0.0 0.0 0.0 0.0 0.0 0.0
Domestic Activities 345.7 391.3 437.3 490.1 560.8 416.9
Direct Taxes
Income Tax 286.5 371.2 432.1 474.8 533.3 322.3
Other Tax and Duty 4.8 5.9 6.4 8.8 9.2 7.3
Total Direct Taxes 291.3 377.1 438.5 483.6 542.5 329.6
Grand Total 950.6 1091.5 1208.2 1357.0 1555.2 1092.7
Percent of Total
Indirect Taxes
Customs Duty 13.8 12.1 11.2 11.3 11.6 12.3
VAT (import) 14.5 13.6 12.7 13.0 13.2 14.9
Supp. (import) 4.6 3.9 3.6 3.9 4.2 4.4
Export Duty 0.0 0.0 0.0 0.0 0.0 0.0
Trade Related 33.0 29.6 27.5 28.2 29.1 31.7
Excise Duty 0.7 0.7 0.7 0.7 1.0 1.4
VAT (Domestic) 23.1 24.2 24.2 23.8 22.4 23.0
Supp. Duty (Domestic) 12.5 11.0 11.3 11.6 12.6 13.8
Turnover Tax 0.0 0.0 0.0 0.0 0.0 0.0
Domestic Activities 36.4 35.8 36.2 36.1 36.1 38.2
Income Tax 30.1 34.0 35.8 35.0 34.3 29.5
Other Tax and Duty 0.5 0.5 0.5 0.6 0.6 0.7
Total Direct Taxes 30.6 34.5 36.3 35.6 34.9 30.2
Grand Total 100 100 100 100 100 100
Source: National Board of Revenue (NBR)

26
Expenditures increased as well, driven by rise
in recurrent spending. Overall spending rose
from 12.8 percent of GDP in FY15 to 13 percent
in FY16 (Figure-12), reflecting 43.9 percent
increase in expenditures on pay and allowances
to public employees. Government spending on
subsidies declined to $2.4 billion (1.1 percent of
GDP) in FY16 from $2.8 billion in FY15,
reflecting sharp fall in oil and fertilizer import
prices. The government was able to save on its
subsidy allocations to Bangladesh Petroleum
Corporation. Also the Bangladesh Power
Development Board (BPDB) required a lower
subsidy of $700 million, compared with the
initial budgetary allocation of $1 billion and the
previous year’s actual subsidy spending of $1.2
billion—because of lower fuel costs and higher bulk and retail power tariffs. Agriculture continued to be
the main subsidy destination, providing fertilizer and electric power to farmers. Subsidy allocations for
agriculture declined marginally to $900 million in FY16 from $910 million in FY15.
Expenditure targets continue to elude.
Actual FY16 government expenditure
undershot the original budget target by 24
percent, reflecting shortfall in both recurrent
and capital expenditures. Thanks to lower
commodity prices in the global market, the
expenditure on subsidy was significantly
lower than anticipated. Public investment
was off the budget target as usual with actual
ADP implementation constituting 86 percent
of original allocation and 91.7 percent of the
revised allocation (Figure-13). The
implementation in the last quarter of FY16
was 47.1 percent while nearly 31 percent of
the total allocation was spent only in June
alone. Even conceding that funds tend to be
released towards the end of the fiscal year
after completion of works, both of these bunching is the highest since FY06. Such steep increases in the
later part of the fiscal years raises questions about the quality of public investment.
6
7
8
9
10
11
12
13
14
15
FY07 FY08 FY09 FY10 FY11 FY12 FY13 FY14 FY15 FY16
Figure 12: Expenditure and Current Expenditure
(% of GDP)
Total Expenditure (% of GDP)
Current Expenditure (% of GDP)
Source: Ministry of Finance
Figure 12: Expenditure and Current
Expenditure (% of GDP)
Figure 13: ADP Implementation (% of
Revised ADP)
91.7
41.143.7
35
45
55
65
75
85
95
105
FY
05
FY
06
FY
07
FY
08
FY
09
FY
10
FY
11
FY
12
FY
13
FY
14
FY
15
FY
16
FY
16
(Ju
l-M
ar)
FY
17
(Ju
l-M
ar)
Source: IMED, Ministry of Planning

27
Fiscal business as usual in FY17 so far. FY17 budget set highly ambitious revenue growth target without
any notable policy or administrative reforms. Not surprisingly, therefore, tax revenue collection from all
major sources were 8 percent (Tk
69.8 billion) short of target in the
first half of FY17, despite growing
by 18 percent. Income tax
collection shortfall was the highest
(11.6 percent) followed by VAT (9
percent) and Customs Duty (2.3
percent).23 NBR claims to have
added over 700,000 new taxpayers
to the tax base this year. It is also
renewing efforts to unlock the Tk
320 billion tax arrears by improving
the effectiveness of the Alternative
Dispute Resolution (ADR) system.
On the expenditure front, ADP
implementation rate, as measured
by the amount of ADP allocation
released, remained nearly
unchanged at 43.7 percent of the original ADP size in the first nine months of FY17, compared with 43.9
percent in the first nine months of last fiscal year. Utilization rate of project aid declined from 34.6 percent
to 30.2 percent. Recurrent expenditures in the first five months grew by 29.5 percent, driven by 45.4 percent
increase in subsidies and transfers and 39.3 percent increase in pay and allowances. Higher expenditures
relative to revenue growth in the first five months led to a budget deficit of about Tk 59 billion, compared
with Tk 7.1 billion surplus during the same period of the previous year. Costly nonbank borrowing financed
all of the deficit so far in addition to repaying Tk 124.5 billion central government debt to BB and Tk 65.1
billion to the scheduled banks (Figure-14).
The dramatic rise in the sale of national savings certificate (NSC) has continued in FY17. During July-
January, FY17, net sale of NSCs increased by 74 percent. In addition, due to the surge in NSCs,
government’s borrowing from the banking system has decreased even further. As of January 2017,
government’s bank borrowing 8.9 percent lower than in January 2016. This is directionally opposite to the
monetary policy target of 10.8 percent growth in credit to government from the banking system.
Financial performance of state-owned enterprises has improved largely due to fortuitous factors. Of
the 48 nonfinancial state-owned enterprises in Bangladesh, 33 earned a combined estimated profit of $2.5
billion in FY16, and the remainder incurred a loss of $972 million. The consolidated net profit of these
enterprises surged to 1.5 billion, exceeding the recent record full year net profit of $555.7 million in FY15.
The profit earned by the Bangladesh Petroleum Corporation tripled to $1.54 billion from $298.5 million
losses in FY14. The net profit of the Bangladesh Oil, Gas, and Mineral Resources Corporation contracted
slightly to $117.2 million from $142.7 million, and that of the Bangladesh Telecommunications Regulatory
Commission eased to $511.9 million from $537.4 million because it could not hold a planned spectrum
auction. The Bangladesh Power Development Board (BPDB) cut its losses to $788.9 million in FY16 from
$936.4 million in FY15, mostly through lower fuel costs. BPDB losses absorbed about one-third of
government subsidy spending for the year.
23 For some unexplained reasons, NBR has stopped posting revenue collection data on its website making it very
difficult to monitor revenue collection performance on a regular basis. However, the newspapers somehow manage
to get access to NBR data (see Bonik Barta lead story, February 14, 2017).
Figure 14: Budget Target and Net Govt.
Domestic Borrowing, FY17 (Jul-Jan)
615.5
110.2
226.1
299.8
389.4
-189.6
-65.1
-124.5
-200.0 0.0 200.0 400.0 600.0
Target (Total)
Actual (Total)
Target (Non-Bank)
Actual (Non-Bank)
Target (Banking system)
Actual (Banking system)
Scheduled Bank
Bangaldesh Bank
Tk. in billionSource: Bangladesh Bank

28
Monetary Policy
Monetary growth exceeded nominal GDP growth in FY16, reflecting a pickup in growth of credit to the
private sector and net foreign assets of the banking system. With the Bangladesh Bank’s operational
independence constrained by its need to limit losses on its balance sheet, the increasing reliance on NSCs
have weakened the already weak monetary policy transmission channels. Absence of a secondary market
for public borrowing instruments hindered the timely and efficient adjustment of intermediation in response
to mounting excess liquidity in the banking system, slowing the transmission of monetary policy changes.
Monetary prudence has helped maintain macroeconomic stability. With inflation pressures weakening,
Bangladesh Bank lowered its repo and reverse repo rates by half a percentage point in January 2016. The
call money rate has since declined to 3.8 percent in April 2017 from 5.8 percent a year earlier, reflecting
the rate cut and very ample liquidity in the banking system. Treasury bill rates also declined.
Table 10: Monetary Program Performance
FY 14 FY 15 FY 16 FY 17
Target Actual Target Actual Target Actual Target Actual*
Net Foreign Assets 10.0 41.2 3.6 18.2 11.1 23.2 10.1 17.6
Net Domestic Assets 18.6 10.3 20.2 10.7 16.2 14.2 17.3 11.9
Domestic credit 17.8 11.6 17.4 10.0 15.5 14.2 16.4 11.9
Public Sector credit 22.9 8.9 25.3 -2.6 18.7 2.6 16.1 -8.8
Private Sector credit 16.5 12.3 15.5 13.2 14.8 16.8 16.5 15.9
Broad Money 17.0 16.1 16.5 12.4 15.0 16.3 15.5 13.4
Reserve Money 16.2 15.5 15.9 14.3 14.3 30.1 14.0 18.3
Inflation (end of period
average) 7.0 7.3 6.5 6.4 6.1 5.9 5.3-5.6 5.4
Growth 5.8-6.1 6.1 6.5-6.8 6.6 6.8-6.9 7.1 7.2
Source: Bangladesh Bank and Bangladesh Bureau of Statistics
*until February, 2017
Broad money grew by 13.4 percent year-on-year in February 2017, rising from 13.1 percent in February
2016 and below the FY17 monetary program target of 15.5 percent (Table-10). Private credit growth
increased to 15.9 percent February 2017 from 15.1 percent a year earlier, still short of the FY17 program
target of 16.5 percent, despite a pickup in consumer credit which responded to lower lending rates. Growth
in net credit to the public sector was only 2.6 percent in FY16, falling further to a decline of 8.8 percent in
February 2017 as government borrowing through national savings certificates expanded. Decline in banks’
deposit rates under higher liquidity induced savers to seek the high-yielding savings instruments despite
their minimum term of 3 years.
Monetary policy has been time consistent. Bangladesh Bank’s monetary policy objectives have remained
consistent over time to maintain price stability while supporting faster economic growth and inclusion. BB
has been vigilant about inflationary pressures while maintaining growth supportive credit policies, at times
targeted to selected priority sectors. Deepening of financial inclusion of agriculture, SMEs, renewable
energy and ecological footprint have been areas of policy support through refinancing lines. Although
administered interest rates and directed credit have become practices of the past, Bangladesh Bank

29
continues to resort to these practices on a limited scale, sometimes through moral suasion.24 Regulatory
interventions on interest rates have been limited to those justifiable on consumer protection grounds.
The link between the money supply to interest rate is at best weak and certainly long and variable.25
The instruments available at the disposal of the BB, namely variations in cash reserve/statutory liquidity
requirements and treasury bonds operations, cannot exert significant influence on the money supply because
typically banks maintain large excess liquidity. This has been particularly sizable recently. In this situation,
it is futile to expand money supply because, if demand conditions permitted, the banks would prefer to earn
higher income by expanding credit anyway instead of maintaining excess liquidity. With the BB’s
operational independence constrained by its need to limit losses on its balance sheet, the preponderance of
NSCs distorts monetary policy. The shortage of government securities is a key reason sterilization costs are
borne by the central bank. The absence of a secondary market for NSCs—which force savers to commit
their funds for 3-5 years (or face a penalty)—prevents the timely and efficient adjustment of intermediation
in response to changing economic circumstances and inhibits the transmission of monetary policy changes.
Monetary policy also has a signaling effect. Change in policy rate is a signal that BB is taking measures
to influence inflation. If people believe BB is committed to maintain low inflation, they incorporate a low
future rate of inflation into the contracts they enter into, such as in wage contracts. In this way, expectations
of lower inflation can assist in lowering the actual inflation rate in the future. BB has succeeded in
conveying the message that it is serious about containing inflationary pressure, although many were
skeptical years ago. Thus, just because monetary policy transmission mechanisms in accelerating growth
or containing inflation are weak and variable in Bangladesh does not mean monetary policy has no role in
the country's economic management.
Structural Reforms
Structural reforms in Bangladesh has been fragmented and slow. While government has looked to address
the infrastructure weakness through large investment projects, policy deficits remain. Besides the recent
step by the Bangladesh Investment Development Authority to improve doing business ranking, policy
reforms have stagnated. It is imperative that Bangladesh implements the new VAT and Supplementary Duty
Act to boost domestic resource mobilization and signal the commitment to undertake other difficult reforms.
Taxation: The government is on course to implement the VAT and Supplementary Duty Act, 2012 from
July 1, 2017 despite resistance from certain sections of the business community. The National Board of
Revenue (NBR) issued the gazette notification of the rules containing 119 articles and 70 forms consistent
with the new VAT and Supplementary Duty Act-2012. The new rules have kept a provision of online
connections of integrated VAT administration system with automated systems of customs and income tax
wings of the NBR, Controller General of Accounts and Bangladesh Bank for smooth implementation of the
new VAT system. Under the new rules, large businesses will be able to run their operations with only one
24 The most recent being BB instructions on February 14, 2017 to all scheduled banks to inform clients before
increasing lending rate on variable rate term loans and to charge no more than 2 percent for late payment.
25 An examination of data from FY02 to FY10 shows that during these nine years movements in lending rate were in
the predicted direction in only three years. In the other six years, higher growth of broad money relative to the
preceding year was accompanied by higher interest or a lower growth of money supply was accompanied by lower
interest. The reason for the breakdown of the link between money supply and interest rate most likely is that the
financial system of Bangladesh does not operate on the basis of competition. The banks collusively determine the
lending rate with little regard to monetary conditions.

30
registration number instead of separate Business Identification Number (BIN) for different branches under
the current system. NBR has completed a number of user training sessions of the new system and launched
the VAT Payer Communication Strategy. Despite these positive steps, the business community and NBR
has still not been able to reach a consensus over the VAT rate. Currently, the law envisions a flat rate of 15
percent with input credit provisions, while the business community led by the Federation of Bangladesh
Chambers of Commerce and Industry (FBCCI) has been demanding the rate to be reduced to 7 percent, re-
introduction of the multiple VAT rates and reinstatement of the package VAT system. Without reaching a
consensus with the business community, it will be challenging for NBR to implement the new law, as seen
when the small traders of old Dhaka went on strike demanding a reduction of the package VAT in the
current fiscal year. The package rate was raised to Tk. 28,000 from Tk. 14,000 in the FY16 Budget
announcement.26
Natural gas prices. The government has decided to increase the price of natural gas on an average by 22.7
percent in two phases starting in March, 2017. Household gas charge for a single burner stove will be Tk
750 from March 1st while for double burner stove Tk. 800, up from the current Tk. 600 and Tk 650
respectively. This will be followed by a further increase to Tk. 900 for single burner stove and Tk. 950 for
a double burner. Furthermore, metered consumers will see their gas prices increase to Tk. 9.1 per cubic
meter from June. They are currently paying Tk. 7 per cubic meter. There will also be a 14 percent increase
in the price of compressed natural gas, which is primarily used in automobiles. Commercial and industrial
gas prices are increasing by 50 percent, while it will rise by 15 percent for power generation companies.
Power plants consume 40 percent of total gas in Bangladesh followed by the industrial sector at 17 percent.
Households use 13 percent of the gas consumed in Bangladesh, the transport sector about 6 percent and
fertilizers about 6.5 percent.
Bangladesh currently has one of the lowest administered natural gas prices in the world. According to the
International Gas Union’s Wholesale Gas Price Survey, Bangladesh’s natural gas prices are lower than its
Asian neighbors such as India, China, Indonesia, Malaysia and Vietnam. Gas price increase is based on the
BERC's regulation of cost plus. The reference point of the gas price adjustment that BERC follows is gas
utility costs plus some margin for utilities to meet their revenue requirements. This has no link to global
gas prices or indexed to of Heavy fuel oil. Gas utilities periodically file price increase applications to BERC.
It reviews the cost data, gathers public opinion and finally issues a tariff order based on the determination
of revenue requirements of the utilities and the cost data. Government thus gradually adjusts gas prices to
reach cost levels. However, the gas tariff remains below costs as the full costs of International Oil
Companies (IOC) gas has not been fully recovered from consumers. IOC costs are more than National Oil
Companies (NOC) costs. In 2015, the average gas price was about $2 per mcf which is Tk 4.54 per cubic
meter. Now it is Tk 7 against a cost of Tk 9. There is Tk 2 per cubic meter subsidy in gas prices. The
government earns 55 percent (SD and VAT) from gas, a corporate income tax of 35 percent and gas utilities
(owned by government) give annual dividends of 15-20 percent.
Gas is underpriced. The price should be continuously adjusted to bring it to cost level. A comparable
international price is that of LNG, which $8 per mcf. The current gas price is Tk 7 per cubic meter,
equivalent to $3 per mcf. Hence, Bangladesh is far below the global gas price. All gas consuming sectors
benefited from the low prices of gas. Recent price increases will reduce the benefits to all downstream
sectors that use gas such as, industry, transport, power, fertilizer and commercial sectors.
Encouraging gas exploration would help increase domestic feedstock supply, but to persuade investors with
the required capacity to invest, gas pricing policies need to be revised. In particular, there is scope to
reconsider the relationship of the pricing of gas in Bangladesh to world prices. Moreover, granting of
26 The strike forced NBR to agree to consider the demands of the business community, although, no official
announcement has been made yet.

31
production sharing contracts in a way that encourages upstream investments in gas exploration and
exploitation would also be helpful.
Infrastructure: The government has approved in principle the formation of a Sovereign Wealth Fund
(SWF). The SWF will be formed with an authorized capital of $10 billion while the initial paid-up capital
would be $2 billion. According to initial reports, the government plans to draw upon Bangladesh Bank’s
foreign exchange reserves to fund the SWF. In return, Bangladesh Bank will issue taka denominated
treasury bonds which will be traded in the central bank’s auction market. The SWF will be formed as a
separate entity from Bangladesh Bank and will be used to invest in both public and private infrastructure
projects. The operational modalities of the SWF await clarification. Currently, Bangladesh Bank reserves
are invested in highly liquid, but low yielding accounts overseas. Advocates for the fund believe that once
established, the fund will provide a stable financing mechanism for large infrastructure projects, while
ensuring a better return on Bangladesh’s foreign currency reserve. The government is targeting to launch
the fund from the next fiscal year.
The government has also approved various projects to improve Bangladesh’s infrastructure and road
connectivity. These include improvement of the rural road network in the southwest division of Khulna
through the Khulna Division Rural Infrastructure Development Project. In addition, the government has
decided to upgrade the Elenga-Hatikamrul-Rangpur highway into a four lane road. This is will be part of
the SASEC Road Link Project-11 and it will facilitate sub-regional road connectivity with Bhutan and India.
To complement the recently completed Dhaka-Chittagong four lane highway, the government has decided
to build a 220-km long elevated expressway which will connect Dhaka and Chittagong. This multimodal
expressway will be built on top of the existing highway. Construction for this expressway is scheduled to
start in 2018 and once completed, it will help to further boost connectivity between the two largest cities of
the country.
The government has also decided to upgrade the rail and air network of the country. The government has
approved a US$ 0.6 billion project to modernize and increase the capacity of Osmani International Airport
in Sylhet. This project will support the expansion of the existing runway which will allow for more
international flights to operate from the airport. Similarly, for the railway sector, the government has
decided to procure additional 200 MG coaches. This will be financed through one of the twenty-seven deals
signed during the visit of the Chinese President.
The government has also taken up numerous investment projects in the energy sector. These projects are
being developed keeping in mind the government’s vision of providing electricity to the entire population
by 2021. Two of the most notable projects include the “Power Grid Network Strengthening Project” that
aims to ensure uninterrupted power supply across the country. Through this project, the Power Grid
Company of Bangladesh will construct new transmission lines, expand existing lines and carry maintenance
work on the existing infrastructure. With an eye to diversify its energy sources and move more towards
renewable energy, the government has taken up an initiative to develop a 200 MW solar power plant at
Teknaf. This will be the biggest solar power plant in Bangladesh and will be developed by Southern Solar
Power Ltd, a subsidiary of US-based energy company SunEdison.
Trade and Competitiveness: The newly established Bangladesh Investment Development Authority
(BIDA) with support from the World Bank Group’s private sector arm the International Finance
Corporation (IFC) has taken on an ambitious reform program to improve Bangladesh’s ranking in the Doing
Business. Under this program, BIDA will coordinate with different line ministries such as the Ministry of
Finance, Ministry of Law, Ministry of Commerce and Ministry of Housing and Public Works to improve
Bangladesh’s ranking from the present 176th position to the 99th position or below by 2021 through
improvement of regulatory environment and solving other complexities in doing business. Through this
program, respective line ministries and agencies have identified areas of reform pertaining to 10 indicators
of the doing-business ranking, including reducing startup time to 7 days from 19.5 days, getting
32
construction permits to 60 days from 278 days and electricity in 28 days from present 404 days. If achieved,
this will enable Bangladesh to be an attractive destination for green field investment which will help create
new jobs and help meet the 7th Five Year Plan investment targets. These reforms will also help attract
investors in the 100 new Special Economic Zones (SEZ) being developed by the government.
Bangladesh has ratified the amendment of the Asia Pacific Trade Agreement. This agreement now includes
Mongolia as its newest member and comes with a re-arranged tariff regime. Under this agreement
Bangladesh will give 10 to 70 percent duty free access to 598 items from APTA countries (India, China,
South Korea, Sri Lanka, Laos and Mongolia) in addition to 20 to 50 percent concession to four more items
from LDCs within the group.
Bangladesh has also undertaken steps to improve the competitiveness of the pharmaceutical sector. The
pharmaceutical industry through the newly enacted National Drug Policy will look to ensure that
Bangladeshi pharmaceutical products meet international standards, while at the same time, ensure that the
manufacturing of fake and adulterated drugs are prevented. The policy will help to regulate the local market.
The new policy will also bring the Bangladeshi exporters in line with the standards of the World Health
Organization (WHO) and the Food and Drug Administration (FDA) of the United States. The
pharmaceutical industry is one the 32 thrust sectors identified by the government as it looks to diversify its
export basket.
Mobile financial services regulations. These have been tightened by BB through a circular in January has
lowered the transaction limit for mobile financial services users. Previously, users could deposit Tk 25,000
into their mobile wallets each day and take out the same amount, but now they have to make do with Tk
15,000 for cash-in and Tk 10,000 for cash-out. BB in its directive also introduced verification requirements
for withdrawal of more than Tk. 5,000. Users will now be required to present their national identity card or
a copy of it, to withdraw cash. Complementing the change in daily limits, BB has also lowered the monthly
limits. A mobile banking customer can now deposit at most Tk 100,000 in a month, down from Tk 150,000.
The maximum monthly withdrawal limit is Tk 50,000, which was earlier Tk 150,000. BB has taken these
steps to shore up remittances through the formal banking channel. BB believes that consumers are taking
advantage of the mobile financial services to transfer remittances that are flowing from the non-banking
channel. The move has already seen a slowdown in the growth of a number of key parameters for this sector
such as the number of agents, number of registered clients and number of active accounts when compared
with December, 2016. Similarly, the value of inward remittances received through this channel has
remained flat for January after a growth of 2.4 percent in December.

33
II. An Analysis of Bangladesh’s Long-Term Growth Prospects
To move up and sustain a higher real GDP growth trajectory than achieved in the recent past it is crucial
for Bangladesh to focus not just on easing the bottlenecks to capital accumulation but also on reforms to
break the barriers to female labor force and business participation in the formal sector as well as raising
productivity growth. Absent these, the country will fail to achieve 7th Plan growth target despite meeting
the envisaged levels of investment. Moreover, it is imperative for the government to meet its revenue targets
to maintain fiscal sustainability, considering the planned expansion in expenditures.

34
In the last decade and a half, Bangladesh economy grew more than 6 percent on average every year. This
was significant growth compared to peers and only about 4-5 percent annual growth observed in the
preceding decades. The sustained growth enabled Bangladesh to graduate out of the status of low-income
countries. The crucial question going forward is whether Bangladesh can continue on its path of
accelerating growth in accordance with the projections in the government’s 7th Five Year Plan. This section
attempts to identify the major impediments to sustained long-run growth and areas of policy priority in the
short and long run.
Box 1: The Analytical Framework
To better understand the growth scenarios and the key drivers of growth, a simple extension of the Solow-Swan
(1956) growth model is used. The model links investment, savings and productivity to economic growth. Labor
market forces and external factors through which additional investments can be sourced are also considered. The
economy is assumed to consist of a single sector producing a final good using capital (K) and labor (L). 27
The production function is given by:
𝒀𝒕 = 𝑨𝒕𝑲𝒕𝟏−𝜷(𝒉𝒕𝑳𝒕)𝜷
Output growth can be achieved in three ways – accumulation of capital resources, accumulation of labor resources
and productivity growth. Accumulation of physical capital occurs via investment. Capital accumulation is given by
the undepreciated portion of previous period’s capital stock 𝐾𝑡 together with the investment made in the previous
period 𝐼𝑡 where 𝑲𝒕+𝟏 = (𝟏 − 𝜹)𝑲𝒕 + 𝑰𝒕, 𝛿 represents the per period depreciation rate of physical capital. The
effective labor used in production is the product of human capital per worker ℎ𝑡 and total number of workers 𝑁𝑡
present in the economy. The productivity of labor resource is determined by human capital per worker which can
be improved by increasing the years of schooling or skills training for example. The total number of workers
employed is given by𝜌𝑡: the participation rate, 𝜔𝑡: the working age population to population ratio and 𝑁𝑡 is the
total population. So 𝑳𝒕 = 𝝆𝒕𝝎𝒕𝑵𝒕. Therefore, effective labor in the economy can increase with an increase in human
capital per worker or through an increase in the total number of workers. An increase in the total number of workers
can be caused by an increase in the participation rate or by an increase in the working age population to population
ratio.
𝒈𝒚,𝒕+𝟏𝒑𝒄
≈ 𝒈𝑨,𝒕+𝟏 + 𝜷(𝒈𝝆,𝒕+𝟏 + 𝒈𝝎,𝒕+𝟏 + 𝒈𝒉,𝒕+𝟏) + (𝟏 − 𝜷) [
𝑰𝒕𝒀𝒕𝑲𝒕𝒀𝒕
− 𝜹 − 𝒈𝑵,𝒕+𝟏]
Important insights regarding the drivers of growth can be derived from the equation presented above. First, the TFP
growth 𝑔𝐴 has the largest direct effect on growth where a 1 percentage point increase in TFP leads to a 1 percentage
point increase in growth rate of output per capita. Second, the production function parameter 𝛽 plays an important
role in determining the relative importance of capital and labor growth in driving aggregate growth. The larger the
labor share of income, the more responsive is the output growth to increases in participation rate, working age
population to population ratio and human capital per worker. Conversely, the larger the labor share of income,
lower the effect of capital accumulation in generating growth. Finally, it is important to note that keeping all else
constant, the same level of investment share of output can lead to different output growth rates depending on the
level of capital-to-output ratio (𝐾
𝑌) in the economy. Investment becomes less effective as capital-to-output ratio
rises in the economy. This implies that same level of investment share of output will generate lower growth if
capital in the economy grows faster than the output. Hence, an investment led growth strategy in absence of reforms
that focus on growth of productivity, human capital and participation will eventually lose momentum.
27 Kt is the aggregate capital stock, ht is the human capital per worker and Lt is the total number of workers present in
the economy. At denotes the common total factor productivity (TFP) that captures the productivity of both factors of
production. The time invariant parameter 𝛽 represents the aggregate labor share of income.

35
Setting the stage The analytical framework explained in Box 1 is used to examine various growth scenarios. In the first step
of the analysis, the model is customized to the Bangladeshi economy. Following customization, the long-
term growth scenarios for the country are considered based on two interrelated questions:
How much growth can be achieved under various reasonable paths of growth drivers and
What time paths of growth drivers, in particular investment, is essential to realize a given growth path.
The customization involved choosing values of the key parameters of the model reflecting
Bangladesh’s reality. Based on a detailed survey of the empirical literature, the annual depreciation rate
is taken to be 0.032 and the initial capital-to-output ratio to be 2.78 (PWT 8.1). The growth rate of human
capital per worker (gh) is taken to be 1.3 percent and the growth rate of TFP (gA) is assumed to be zero
meaning any significant TFP growth is unlikely in the long-term. Growth rate of population (gN) as
forecasted by the Human Development Network is expected to decline from 1.2 percent at present to 1
percent by 2021 and 0.7 percent by 2030. The growth rate of working age population to population ratio
(gw) is likely to continue to rise and reach almost 70 percent by 2030 indicating a 4 percentage point increase
from current levels.
In the Bangladeshi context, the investment share of GDP and the labor force participation rate are
expected to play a major role. Different scenarios have been considered for their time paths to help the
identification of their relative importance. Bangladesh’s investment share of GDP has almost doubled
between 1980 and 2015 with most of the increase coming from private investments. However, it is
commonly recognized that every percentage point expansion in public investment delivers lower growth
compared to a percentage point expansion in private investment. To capture this difference in efficiency
across public and private investments, it is assumed that one unit of public investment will equal to only a
fraction of private investment. The efficiency of public investment for Bangladesh is assumed to be 55
percent based on developing country experiences. It is also assumed that the aggregate investment share
of GDP increases from present levels to 34.4 percent of GDP by year 2020 and remains there beyond 2020.
The prospective expansion in female labor force participation is analyzed separately to isolate its impact on
growth.
To quantify the growth impact of increased investment and female labor force participation, 4 scenarios are
constructed. All other variables such as the growth of human capital per worker, TFP growth, etc remain
constant and follow the time paths previously defined.
Baseline Scenario: Public and private investment share of GDP rises according to 7th Five Year
Plan targets till 2020 and remains at 2020 level going forward. The efficiency of public investment
remains at 0.55 throughout and there is no change in the female labor force participation rate while
TFP growth is zero.
Efficiency Scenario: Public and private investment follow the same path as in Baseline Scenario
and the efficiency of public investment grows linearly from 0.55 in 2015 to 1 in 2020. There is no
change in the female labor force participation rate.
Participation Scenario: Public and private investment follow the same path as in Baseline
Scenario and the female labor force participation rate grows linearly from 34 percent in 2015 to
45 percent in 2020. There is no change in the efficiency of public investment.
Efficiency + Participation Scenario: Public and private investment follow the same path as in
Baseline Scenario and the efficiency of public investment grows linearly from 0.55 in 2015 to 1

36
in 2020. The female labor force participation rate also grows linearly from 34 percent in 2015 to
45 percent in 2020.
The growth dividends In the Baseline Scenario, the GDP growth rate increases marginally till 2021 as a result of expanding
investment share of GDP. However, for the entire period until 2021, the GDP growth rate remains around
the 5 percent mark and beyond 2021 the growth rate starts to decline and falls below 4 percent in 2028.
This result is driven primarily by diminishing returns to capital accumulation coupled with the zero TFP
growth assumption. A linear improvement in efficiency of public investments boosts economic growth by
0.2 to 0.4 percentage points relative to the Baseline Scenario (Table-11). Under the Participation Scenario,
a linear increase in female labor force participation rate leads to 1 percentage point higher growth until
2020 and 0.1-0.2 percentage points higher growth from 2021-30 relative to the Baseline Scenario. As
growth in participation rate comes to an end, growth rate declines and eventually falls to around 4 percent
by 2029. In the last scenario that considers the combined effect of improvements in efficiency of public
capital and female labor force participation rate, the growth rate increases faster compared to the Baseline
and Participation Scenarios. Additionally, the growth rate starts at a higher level owing to the impact from
higher participation rate. The growth rate however falls gradually but unlike the other scenarios, manages
to stay above the 4 percent mark by 2030. With everything else constant, an increase in capital-to-output
ratio causes a drag in the growth rate.
Table 11: The Growth Dividends
Impact on Average Annual Real GDP Growth (%)
Scenario 2016-2020 2021-2025 2026-2030
Efficiency 0.21 0.44 0.31
Participation 1 0.18 0.12
Efficiency + Participation 1.22 0.63 0.44
High Growth I28 2.38 2.01 1.93
High Growth II29 2.96 2.7 2.69
Growth Impact under different scenarios30*
The potential gender dividend is significantly large. The male participation rate in the country has
stabilized over 80 percent for many decades now and is comparable to global statistics. Conversely, the
female labor force participation stands at 34 percent despite having seen an expansion of 10 percentage
points during the last decade. The growth impact of a rise in female labor force participation rate can be
significant over a medium term. If Bangladesh is able to replicate the gains of the past decade and raise the
female labor force participation rate to 45 percent by 2020, it will be able to achieve a one percentage point
increase in economic growth each year till 2020 and this could continue if the female participation rate
continues to increase until reaching parity with the male participation in the labor force.
Sustained productivity increases required to achieve higher growth. In the two high growth scenarios,
all other variables including efficiency of public capital and female labor force participation are assumed
to follow the time path outlined in the Efficiency + Participation Scenario. The economy can deliver an
average annual growth rate in excess of 7 percent during the plan period if the expansion in investment
share and female labor force participation is accompanied with one percentage point of productivity growth
28 High Growth Scenario I: Annual growth rate of TFP is 1.0 percent 29 High Growth Scenario II: Annual growth rate of TFP is 1.5 percent 30 Impact measured in comparison to the Baseline Scenario
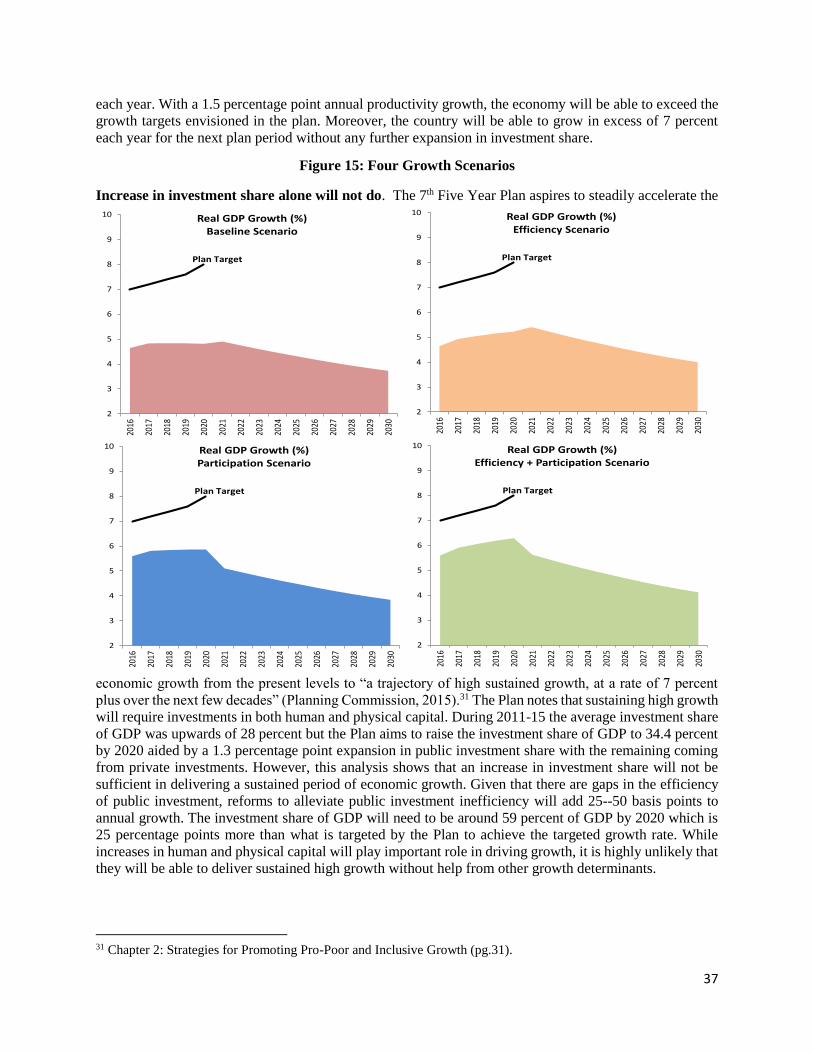
37
each year. With a 1.5 percentage point annual productivity growth, the economy will be able to exceed the
growth targets envisioned in the plan. Moreover, the country will be able to grow in excess of 7 percent
each year for the next plan period without any further expansion in investment share.
Figure 15: Four Growth Scenarios
Increase in investment share alone will not do. The 7th Five Year Plan aspires to steadily accelerate the
economic growth from the present levels to “a trajectory of high sustained growth, at a rate of 7 percent
plus over the next few decades” (Planning Commission, 2015).31 The Plan notes that sustaining high growth
will require investments in both human and physical capital. During 2011-15 the average investment share
of GDP was upwards of 28 percent but the Plan aims to raise the investment share of GDP to 34.4 percent
by 2020 aided by a 1.3 percentage point expansion in public investment share with the remaining coming
from private investments. However, this analysis shows that an increase in investment share will not be
sufficient in delivering a sustained period of economic growth. Given that there are gaps in the efficiency
of public investment, reforms to alleviate public investment inefficiency will add 25--50 basis points to
annual growth. The investment share of GDP will need to be around 59 percent of GDP by 2020 which is
25 percentage points more than what is targeted by the Plan to achieve the targeted growth rate. While
increases in human and physical capital will play important role in driving growth, it is highly unlikely that
they will be able to deliver sustained high growth without help from other growth determinants.
31 Chapter 2: Strategies for Promoting Pro-Poor and Inclusive Growth (pg.31).
2
3
4
5
6
7
8
9
10
2016
2017
2018
2019
2020
2021
2022
2023
2024
2025
2026
2027
2028
2029
2030
Real GDP Growth (%)Baseline Scenario
Plan Target
2
3
4
5
6
7
8
9
10
2016
2017
2018
2019
2020
2021
2022
2023
2024
2025
2026
2027
2028
2029
2030
Real GDP Growth (%)Efficiency Scenario
Plan Target
2
3
4
5
6
7
8
9
10
2016
2017
2018
2019
2020
2021
2022
2023
2024
2025
2026
2027
2028
2029
2030
Real GDP Growth (%)Participation Scenario
Plan Target
2
3
4
5
6
7
8
9
1020
16
2017
2018
2019
2020
2021
2022
2023
2024
2025
2026
2027
2028
2029
2030
Real GDP Growth (%)Efficiency + Participation Scenario
Plan Target

38
The most significant finding from the four scenarios is that the projected growth rate even under the
most favorable conditions fall short of the Plan targets. An investment-led strategy coupled with
improvements in the efficiency of public capital will ensure 5 percent growth for the next decade. However,
maintaining the same investment share of GDP beyond 2025 will deliver lower than 5 percent growth as
capital-to-output ratios keep growing making investment less productive. The average annual growth rate
does not rise above 6 percent significantly implying that achieving growth higher than 7 percent requires
productivity growth. The results from this simulation also confirms that without high TFP growth high
levels of GDP growth are unfeasible since required investment shares become very ambitious. In the
presence of high TFP growth, the required investment share is pushed down. All the simulations carried
out highlights the importance of a sustained high TFP growth to attain high GDP growth. An investment-
led strategy by itself will fail to deliver high growth in the long run. However, achieving high rates of
productivity growth over long periods is a daunting task as only 5 percent of the countries in the world were
able to achieve productivity growth of 2 percent on average during 1965 – 1995.32
Fiscal implications
Sustainability of government deficit and debt: The model is used to infer what the implied growth paths
spell for the sustainability of government debt position. Bangladesh had a low government debt to GDP
ratio at 34 percent at the end of 2015. The higher the growth rate of GDP, the lower is the ratio, assuming
unchanged primary balance and interest burden as a proportion of GDP. Under the Baseline Scenario, the
annual GDP growth rate for the next 15 years varies in the range of 4 – 5 percent whereas under the most
optimistic High Growth Scenario II the annual GDP growth rate varies in the 6.5 – 8.5 range. Does such
huge variation in growth rates spell remarkably different implications with regards to government debt
position? To answer this question, the 7th Five Year Plan projections for government operations are used
till 2020 after which the variables are assumed to remain at the level targeted in 2020.33
The sustainability of government debt is robust even if the economy experiences tepid growth going
forward. Government debt to GDP ratio rises steadily over time as growth rate of GDP outpaces growth
rate of government debt. The debt ratio rises slower across different scenarios as the growth rate of GDP
increases. Under the High Growth Scenarios II that features a 1.5 percent annual increase of TFP, the debt
ratio rises slowest and reaches just above 63 percent by 2030. In contrast, the debt ratio rises fastest under
the Baseline scenario and closes on the 80 percent mark by 2030. Yet, the government debt situation
remains sustainable across all scenarios.
The debt ratio reaches unsustainable levels if the revenue targets are not met. The debt situation is
closely tied to government operations and is not only determined by economic growth. If the underlying
conditions of government operations are not met, particularly with respect to meeting the tax revenue targets
as laid out in the Five Year Plan, and the tax ratio stays at 9.3 percent, the government debt to GDP ratio
increases under each scenario at a much faster rate, with total debt surpassing GDP by 2030 even under the
most optimistic High Growth II scenario. The government debt situation is sensitive to government
operations. Meeting tax revenue targets are essential to keep the government debt to GDP ratio in check.
32 Bernanke and Gurkaynak, 2002.
33 The assumptions on government operations are: Starting from 9.3 percent in 2015, tax revenue reaches 14.1 percent
of GDP by 2020; starting from 1.5 percent in 2015, non-tax revenue reaches 2.0 percent of GDP by 2020; starting
from 10.5 percent in 2015, current expenditures reaches 13.9 percent of GDP by 2020; starting from 2.0 percent in
2015, interest payment reaches 2.5 percent of GDP by 2020; starting from 6.9 percent in 2015, government capital
expenditure reaches 7.8 percent of GDP by 2020.

39
The public debt sustainability will face additional risk if the government overshoots its expenditure without
making much progress on the revenue front.
TFP Growth and Resource Allocation across Sectors Accelerating TFP growth must be at the forefront of policies. Empirical evidence shows that there is
substantial scope for improving productivity by shifting labor and capital to higher-productivity firms. The
agricultural sector employs around 45 percent of the workforce despite having labor productivity that is
orders of magnitude below what is observed in industry and services. Hence, movement of resources out
of agriculture to the other sectors has the potential to deliver gains in productivity and output even if the
aggregate resources remain the same. Bangladesh can achieve efficiency gains of around 20 percent if the
economy is able to move resources out of agriculture so that labor productivity gaps across sectors reduce
to the levels observed in India. Resource efficiency can more than double if the productivity gaps reduce to
what is observed in China.34
Average labor productivity in agriculture is less than one-fourth compared to average labor
productivity in both industry and services. While the employment share of agriculture has shrunk by
around 6.5 percentage points during the last 15 years, the country still employs 44 percent of its workforce
in the relatively unproductive agricultural sector. The huge gaps in productivity across sectors are symptoms
of misallocation of resources and economic growth can be achieved by moving resources out of agriculture
to the other sectors.
While there are large gaps in average productivity, allocative efficiency requires a convergence in marginal
productivity across sectors. Assuming Cobb-Douglas production technologies at sector level together with
perfect competition in factor markets, the measurement of marginal productivity reduces to adjusting the
average products of a sector with the sector-specific labor share of income. Table 12 shows the marginal
productivity in industry and services relative to agriculture for Bangladesh which have been computed using
labor shares of income at sector level from the GTAP database. While there has been little change in
marginal gaps in industry relative to agriculture since 2000, the productivity gap between services and
agriculture has been on the rise. This is a direct consequence of the fact that the services share of value
added has expanded without a corresponding increase in services share of employment. In fact, the services
sector has lost a percentage point of representation in the aggregate employment.
Table 12: Marginal Productivity of Labor Relative to Agriculture
2000 2005 2010 2015
Industry 4.38 4.41 4.19 4.32
Services 7.93 9.68 11.20 11.56
34 See Sinha (2016) for a more technical discussion.

40
To quantify the impact of
reallocation of resources on
economic growth, it is assumed
that productivity gaps arise as a
result of asymmetrical
taxes/distortions across sectors.
The distortions in the model are a
stylized approach to capture the
effects of a host of frictions that
restrict movement of resources
across sectors. The distortions
disappear if there are no frictions
to movement of resources across
sectors. To the extent that these
distortions are positive for a
particular sector when measured
relative to agriculture, they imply a barrier to movement of resources out of agriculture and vice versa.
Figure 16 plots these “taxes” for industry and services relative to agriculture. The trend in distortions
captures the trend in marginal productivity gaps seen in the previous table.
Resource reallocation dividends can be large. In order to quantify the gains from a better resource
allocation, a simple counterfactual exercise is performed: how much of economic growth can be achieved
by Bangladesh if the present level of distortions in the country are changed to what is observed in peer
countries.35 Table 13 reports the counterfactual growth in real GDP per capita together with distortions that
deliver this growth. Real GDP per capita will more than double if the distortions in the country are reduced
to the levels observed in China. On the other hand, real GDP per capita has the potential to increase by
about 20 percent if distortions equal what is observed in India which has similar level of distortions in
industry but much lower distortions in services.
Table 13: Counterfactual increase in GDP per capita and Distortions
Counterfactual increase in
GDP per capita (%)
Distortions Relative to Agriculture
Industry Services
China 117 -0.76 -0.77
India 19 4.17 5.76
Indonesia 45 3.94 2.74
Malaysia 82 0.59 0.44
Pakistan 41 0.58 2.81
Sri Lanka 14 3.08 6.74
Determinants of TFP Growth at the Firm Level Empirical research has identified a range of factors that are associated with TFP growth. Of these,
human capital (education and health), infrastructure, institutions, openness, competition, financial
development, geography and capital intensity/deepening occupy prominent positions, some directly and
others indirectly affecting TFP growth. Innovation and R&D appear to be important for TFP growth in
industrialized countries, but there is less persuasive evidence of their importance for developing countries.
Capital matters for absorptive capacity in the sense that more advanced technology spillovers can be
enjoyed only at a high enough level of capital intensity. More recent vintages of capital tend to be more
35 The estimates of distortions for peer countries have been taken from Sinha (2016).
0
2
4
6
8
10
12
2000 2005 2010 2015Ta
xes
Re
lati
ve t
o A
gric
ult
ure
Services
Industry
Figure 16: Taxes for Industry and Services relative to Agriculture

41
productive. Hence, policy should also aim at improving the quality of capital. To this end, important policies
for developing countries include financial sector reform to increase savings, better allocate them to
investment and maintain healthy incentives. Trade reforms are also important for increasing access to
foreign capital. Capital accumulation will not occur unless good institutions are in place. Infrastructural
improvements are important, provided that governments sensibly finance their capital formation and
establish good management systems. Management is, of course, related to institutions and good institutions
are more likely to provide good management.
The role of human capital is often under-estimated. Human capital, which includes education, training
and health is not only important for increasing labor productivity, but also a significant determinant for
whether technology transfer from abroad will impact on TFP growth. This argument is valid for both
education and health. Unhealthy students tend to attain a lower level of education. There is also evidence
that human capital may be behind institutional quality. Given the latter’s significance for development,
investment in human capital becomes even more central. Public spending on education and health appears
to be an obvious policy choice. In countries like Bangladesh, investment in “health capital” can be expected
to be particularly productive. As a byproduct to directly increase productivity, such a policy is subsequently
likely to increase the returns to education as well, thus further spurring TFP growth. Additionally, longer
life expectancy makes it more meaningful to invest in education.
Policies to stimulate competition are vital for increasing TFP growth. Policies to facilitate market entry
for new firms, possibly at the expense of relatively unproductive ones, will increase TFP growth and
stimulate competition. Since institutions have profound effects on most TFP determinants, policies to create
new and strengthen existing institutions are necessary. It is chiefly protection of property rights and rule as
well as role of law36 that are of concern to economists; the type of political institution in place seems to be
of lesser importance. For various reasons, it is never easy to change existing institutions. Even slower to
change are geographic conditions, which pose fundamental problems that cannot immediately be dealt with.
Policies here are better directed at the consequences of such tribulations as, for example, health concerns,
high transportation costs, poor soil quality, among others. Environmental policy instruments could be used
to protect the relatively vulnerable environment caused by unfavorable geographic conditions facing
Bangladesh, while investment in infrastructure could lower transportation costs.
Prioritizing the factors that can improve TFP growth: Bangladesh has made significant progress toward
macroeconomic reforms, including prudent fiscal and monetary policies. External trade has been
liberalized, but more needs to be done to close the gap with the trading partners. In line with worldwide
trends, bilateral and regional trade agreements have proliferated on paper, with much less results on the
ground. Progress over the last few years in lowering tariff barriers has been slow and as a result the latter
remains relatively high, suggesting there is still room to further liberalize trade and foster productivity.
Foreign direct investments have increased somewhat in recent years, but remain relatively low when
compared with the East Asian competitors such as Vietnam. Attracting more FDI would help increase
productivity. Important progress on human development has also been made. The health situation has
improved, and the enrollment rate in primary education is near to 100 percent. However, human capital
development still lags behind and closing the gap would help improve productivity.
36 The World Bank’s Word Development Report 2017 points out, “Although every society aspires to the “rule of
law”— where rules are applied impersonally and the ruler is also subject to the rules—the rule of law in itself is a
norm: it is achieved when the principles of law become a shared value among people in society. This sharing is the
result of a long historical process and simply cannot be instilled overnight.” It goes onto add that there are “three roles
of law: in shaping behavior, in ordering power, and in providing a tool for contestation…….. Over time, actors in the
policy arena can change the rules in concrete ways to strengthen the different roles of law and propel countries toward
a stronger rule of law.

42
Growth literature shows that policies that encourage investment have a positive impact on TFP growth.
Sustained growth is unlikely without adequate investments in physical infrastructure. Empirical evidence
shows strong relationship between infrastructure and productivity with the causality running from
infrastructure to productivity. Unfortunately, however, one of the most problematic factors for doing
business in Bangladesh is inadequate supply of infrastructure. The detailed scoring in the Global
Competitiveness Index (2016)37 shows that investments in infrastructure, specifically in the quality of roads,
port and air transport infrastructure, electricity supply is an immediate and urgent policy priority.
Market failures constraining productivity growth include under investments in upskilling and training that
results in limited learning and a skills shortage. For a successful transition from factor-driven to efficiency
driven growth, the focus needs to be on education and training, labor market efficiency and technological
readiness. Bangladesh still performs poorly in higher education and training, technology readiness, labor
market efficiency. Efficient financing mechanisms have to be established at industry levels to ensure the
development of organizational capabilities.
Innovation and imitation are important. ICT adoption in Bangladesh is limited. Innovation is limited to
a few, mature firms. That too mostly represents imitation of existing products rather than the creation of
new products. Even in the country’s most successful industry, the RMG sector, Bangladesh still operates at
the lower end of the value chain. Greater improvements in R&D, improved resource management, and the
development of skills complementary to technology is critical for increasing innovation and boosting
productivity. This suggests that further investments in firm capabilities, including better resource
management, improving skills, deepening technology adoption, and nurturing innovation could raise
productivity. Institutional factors such as legal and regulatory frameworks specifically property rights and
intellectual property protection need attention.
Reforms targeted at rationalizing government size, shifting resources from low-productivity sectors to
higher ones, and encouraging women to enter the work force, could accelerate TFP gains. Overall,
achieving high-productivity growth requires a certain combination of good macroeconomic environment,
trade openness and strong institutions, development of human capital, and institutional and socio-economic
factors that promote an attractive business environment. Sound macroeconomic policies, transfer of
technology and knowledge through international trade and FDI, human capital with high standards, sectoral
output composition, and good institutional environment are important for boosting productivity. Much
remains to be done in most of structural and institutional reform areas, particularly with respect to increasing
the number of women in the labor force.
37 Global Competitiveness Report, 2016

43
III. Constraints on Female Labor Force Participation
Factors such as excessive burden of household responsibilities, skills deficiency, skills mismatch and
unconducive working environment are deterrents to women’s participation in economic activities. Women-
friendly working environments providing childcare, occupational health and safety, legal protection from
abuse and discrimination, maternity leaves need to be ensured. Although important strides have been made
with regards to women’s rights in relations to marriage, health and safety, maternity and childcare,
enforcement is still weak. Increased access to skills training and education is vital.

44
Bangladesh has experienced remarkable human development gains, such as increases in girl’s school
enrollment and reduction in child mortality. But there continue to be challenges to empowering women
to take full advantage of development opportunities as they often face multiple facets of exclusion.
Increasing women’s participation in the formal labor force is critical in order to fully realize this
demographic dividend. Women continue to live in a marginalized position within a broader male dominated
social structure in Bangladesh. The Gender Inequality Index 2014 ranks Bangladesh 111 out of 142
countries. The Violence against Women Survey 2011 shows that approximately 80 percent of Bangladeshi
women will suffer some form of violence during their lives. The country has the highest rate of early
marriage in the world. Women have lower educational attainment, and face physical, verbal and sexual
abuse in the workplace.
Data from the Bangladesh
Bureau of Statistics (BBS)
2015 and the Labor Force
Survey (LFS) of 2013 show
that only one-third (33.5
percent) of working age
women were in the labor force
in 2013 compared to the vast
majority (over 80 percent) of
eligible men. Provisional
estimates from the 2015 LFS
put female labor force
participation (FLFP) at 35
percent. While female labor
force participation (FLFP) has
increased substantially over the
past 10-15 years, this increase
has not been continuous; in
fact, over the past few years,
FLFP rates have slightly
declined (Figure 17).
A forthcoming (2017) World Bank report on women’s economic empowerment (WEE) in Bangladesh has
conducted combined quantitative and qualitative research38 to identify determinants of the stubbornly low
FLFP rates, and to make policy and operational recommendations about addressing key barriers and
harnessing facilitating factors to improve these rates, and women’s economic empowerment more broadly.
The gender gap in labour force participation is potentially attributable to: (1) household roles and
responsibilities, which fall disproportionately on women; (2) human capital deficiency, whereby women
38 For the quantitative analysis, the study uses Labor Force Survey (LFS) data (2013 and earlier years) and the Demographic and
Household Survey (DHS) 2014 of Bangladesh to identify nationally representative trends and patterns, as well as to test various
hypotheses for low FLFP. A number of qualitative methods are employed, resulting so far in a total of 142 transcripts consisting
of 49 Focus Group Discussions (FGD), 26 Key Informant Interviews (KII), 28 Case Studies, 13 Institutional Mappings, and
numerous Problem Ranking, Community Profile and Listening Posts—together involving over 500 hundred respondents. For the
qualitative research, respondents were selected from rural and urban areas of Dhaka, Chittagong, Rajshahi, Sylhet and Barisal. Two
ethnic communities, one from urban Chittagong (Rangamati) and one from rural Rajshahi, were also included to explore patterns
of social inclusion and exclusion.
Source: BBS (2015). Report on Labour Force Survey (LFS) Bangladesh
2013.
Figure 17: Labor Force Participation rate Figure 17: Labor Force Participation rate
Labor force participation rate by sex and year

45
are not acquiring the proper education and skills demanded by job markets; (3) human capital mismatch
leading to wasting of female talents and acquired skills and (4) gender discrimination in job search, hiring,
and promotion processes.
Household responsibilities Household responsibilities is a major hindrance to female participation. A breakdown of 2013 LFS
data on reasons for absence from the labour force reveals that housework and care of family members39 is
a far more critical constraint on women’s involvement in the labour market than on men’s (Figure 18).
However, 2013 data suggest that it do not inhibit women’s participation as much as they did in the past.40
For men, the most binding constraint is that they are occupied with their schooling or training for future
work.
Figure 18: Reasons given for not being in the labor force, by sex (LFS 2013)
Source: Authors’ calculations from LFS 2013 data.
There are differences between income groups. Traditional gender norms confining women’s role to the
household do not apply as strictly to women from the lowest-income groups. In Bangladesh, labor force
participation rates tend to fall consistently as household incomes rise, according to a wealth index of
households.41 This is somewhat different from the typical U-shaped pattern of women’s labour force
participation rates in South Asian and most developing countries where poor women (out of economic
necessity) work more than middle-income women, yet women from wealthy households tend to work more
than middle-class women as well. In Bangladesh, preliminary findings from the qualitative research suggest
that women from the wealthiest households are more likely to opt out of the workforce if they cannot find
a job that suits their standing or to continue searching for such a job. The quantitative data confirms this
scenario: women from the wealthiest households have the highest rates of unemployment (Figure 19).
39 Measured by dichotomous variables that include being married, having children age 5 years or under in the
household, and having children over age 5 in the household. 40 According to 1999 LFS data. In fact, the likelihood of working increases for women in 2013 if there is a child
over age 5 in the household, though older children had no significant effect in 1999.
41 Using 2013 LFS data, the World Bank created a wealth index of households from assets that household possess.
These assets include ownership of the following: land >10 decare, almirah, bicycle, fridge, mobile, motorcycle,
radio, sewing machine, and television.
0% 10% 20% 30% 40% 50% 60% 70% 80%
In school/Training
Housework/Family Work
Illness, Injury, Disability
Retired, too old to work
No Desire to Work
Other Reasons
11%
74%
6%
4%
5%
0%
57%
9%
15%
10%
6%
1%
Male Female

46
Figure 19: Unemployment rates by wealth decile, sex (Bangladesh 2013 LFS)
Source: WB staff calculations using LFS 2013 data.
Table 14: FLFP of those with less than 5 years of education, by religion
Urban
Bottom 2 SES (%) Upper 2 SES (%)
Muslim 28 20
Hindu 23 17
Buddhist 72 45
Christian 75 34
SES: Socio-economic status by quintiles.
Source: WB staff calculations from LFS 2013 data.
LFP rates are higher among women from the ethnic communities. Women from ethnic minorities
appear to be more responsive to economic factors (Table 14). Indeed, there appears to be little difference
in participation rates between the poorest and wealthiest Muslim and Hindu women, but a considerable gap
between the poorest and wealthiest women from the Buddhist and Christian minority groups, whose rates
roughly double as income falls. Although the sample sizes of these different groups and subgroups is too
small to give this pattern much weight, it is borne out in the qualitative analysis.
Human capital deficiency Marriage is the main cause of school drop-out for girls. According to 2013 LFS data, among those who
drop out of school, the most common reason (almost 28 percent) for girls is marriage followed by the
inability to afford schools. Although fewer girls (1.2 million) never attend school than boys (2 million), the
most common reason for girls never attending school is that they are required to perform domestic chores
instead. For boys, the most common reason for never attending school is that it is unaffordable. This has
not changed much over time: reasons provided by today’s youth and by elderly (about their situations 40
years ago) for never attending school are roughly the same. Among the elderly (over age 65), the most
common explanation for girls is “parents did not want” (31 percent) and “to do domestic chores” (30
percent).
0.00%
2.00%
4.00%
6.00%
8.00%
10.00%
12.00%
14.00%
Poorest 2 3 4 5 6 7 8 9 Richest
Female Male

47
The persistence of early marriage, especially in rural areas, has a severe negative impact on girls’
future prospects for employment—especially in good-quality jobs. According to the 2011 Bangladesh
Demographic and Health Survey (BDHS), Bangladesh had the world’s second-highest rate (77 percent) of
women age 25-49 reporting that they were married by age 18, and the world’s highest rate (42 percent) of
women married by age 15. As of 2014, these rates have fallen to 75 and 38 percent, respectively; the median
age at first marriage among women age 25-49 is 15.8 years, after continuously increasing by almost two
years since 1993-94 (BDHS 2014).42 The difference between urban and rural areas in median age at first
marriage for the same age group is about one year, with 16.6 among urban women and 15.6 in rural areas.
Continuing one’s education after marriage is almost non-existent, especially among working-class
communities. In Focus Group Discussions (FGDs), participants of all ages, male and female, in urban and
rural areas stated that women could only continue their studies if their husbands and/or in-laws “allowed”
them to do so. This perception contrasted starkly with the aspirations of girls and young women—many of
whom wished to eventually work as doctors, journalists and other professionals, such as policewomen—
whose desire for jobs requiring considerable education and training depends on the attitudes of husbands
and in-laws, even when resources or infrastructure are not an obstacle. Reasons given for discontinuing
girls’ education included: the family decision to marry daughters off due to pressure from society; fear of
girls having opportunities to interact with boys, which might lead to a relationship and cause social disgrace
or “shame” for the parents in the community; and taking care of younger siblings and performing other
domestic chores considered to be the responsibility of girls only.
Negative impact on marriage prospects deter women’s education. This negative impact transmits in two
ways: (i) the longer she studies, the older she gets, and the higher the amount of dowry rises; and (ii) the
more educated a girl is, the more difficult it is to find a suitable groom for her. Dowry seems to be an
indispensable part of marriage, both in rural and urban areas. The risk of paying a higher dowry for their
educated daughters works as a serious deterrent for parents. Work after marriage, on the other hand, is not
as unlikely to attain as education, according to the working-class respondents. Due to economic
considerations, wives and daughters-in-law are “permitted” to work when necessary. Often, a working
bride requires less dowry, as she has the potential of future income that will be contributed to the husband’s
family. It should be noted, however, that even when permitted to work, women have to constantly be
mindful to adhere to gender norms such as not being late returning home from work, not going on too many
field visits/tours, not interacting with male colleagues, and definitely not traveling out of the locality for
work.
Women’s poor labour market outcomes are especially confounding given the tremendous
improvements in girls’ educational attainment over the past two decades. Comparing educational
attainment by cohort (Figure 20) shows that the proportion of women who are illiterate in the 20-29-year-
old age group is much lower (less than 20 percent) when compared to the 30-39 age group (35 percent),
40-49 age group (52 percent) and 50-64 (62 percent). Labor force participation by level of education
follows a U-shaped curve: women with the lowest and highest levels of schooling participate in labor
markets at higher rates than do those with mid-level schooling.43
42 Respondents in the primary qualitative research revealed somewhat different perceptions about age of marriage.
They generally perceived it to have risen over time, from 14-16 years in the present as compared to 11-13 years about
a decade ago. There was not much variation between urban and rural areas or divisions, except for the minority ethnic
communities—in which marriage below the age of 18 is not at all in practice.
43 According to multivariate regression results, women who complete their educations at around the 10th grade (O-
levels) have lower rates of participation.

48
Figure 20: Highest level of education completed over years, age 15-64, by sex
Source: Intermediate output for Bangladesh Jobs Diagnostic, SAR Social Protection team, using LFS data
The girls’ higher rates of schooling in more recent years are reflected in an increase in LFP rates for
female youth by nearly 200 percent between 1999 and 2013 (Table 15). Endowments such as education
and family structure have indeed contributed to (about 30 percent) this improvement in women’s labour
market participation. In other words, labour market participation is increasingly aligned with educational
attainment.44 Bangladesh society has become more supportive of young women working over the years.
Table 15: Labor Force Participation Rates of Different Age Groups in Bangladesh (percent)
Age Groups
20-29 30-39 40-49 50-59 60-64
Year 1999
Female 17.29 17.55 16.1 11.5 7.15
Male 69.35 93.66 96.8 94.48 81.39
Year 2013
Female 49.99 35.1 32.47 24.77 15.28
Male 82.46 98.95 99.79 98.37 80.35
Increase in Percent from 1999 to 2013
Female 189.13 100 101.68 115.39 113.71
Male 18.9 5.65 3.09 4.12 -1.28
*Source: Authors’ calculations using Bangladesh Labor Force Statistics of 1999, 2013
** 15-19 age group, for intervening years
44 Based on Oaxaca-Blinder decomposition of labour force participation in 2013.

49
Job quality is a major challenge for most working women. Compared to men, women continue to be
relegated to jobs in the informal sector (Figure 21), with lower wages (Figure 22), lower salaries than men
who occupy the same job, and jobs of generally less decision-making authority and status.
Figure 21: Workers without contracts among wage workers (ages 15-64)
Source: Intermediate output for Bangladesh Jobs Diagnostic, SAR Social Protection team, using LFS data
These gender disparities distort choice of fields of study. Unlike their male counterparts, young women
tend not to choose education and training fields that are closely linked to rapidly expanding industries, as
is the case with rural women regarding information and communication technology (ICT); nor do they
cluster in sectors where they have greater odds of being promoted. Although women’s employment is
higher in the agriculture and services sectors, they have higher odds of occupying higher-status positions
in industry, where they comprise 20.3 percent of chief executives, senior officers and legislators; and 12.9
percent of administrative and commercial managers. In the services sector, the female share of chief
executives, etc. is 10.7 percent, and the share of managers is 12.7 percent. In agriculture, not a single senior
executive or manager is female (BBS 2015).
Social norms nurture gender disparities. Gendered preference in selecting technical subjects or fields of
study at the government vocational training centers in urban areas, or livelihood skills training centers in
rural areas, confirms the powerful role that social norms play in every step toward economic empowerment
for women. In urban areas, female students prefer studying architecture or computer science, rather than
subjects like civil engineering that would require site visits or construction supervision. In rural areas, boys
prefer to become proficient in computers, while girls prefer stitching, sewing, tailoring, and other skills that
are associated traditionally with females. Urban women from the middle class experience greater freedom
in terms of the socially acceptable professions from which they can choose. Urban female students tend to
select subjects that will lead to employment and at the same time will not require them to do internships or
work in places like industrial sites, factories, or construction sites. Rural female students or trainees want
to learn skills that will yield income but will not require them to challenge the established gender roles.
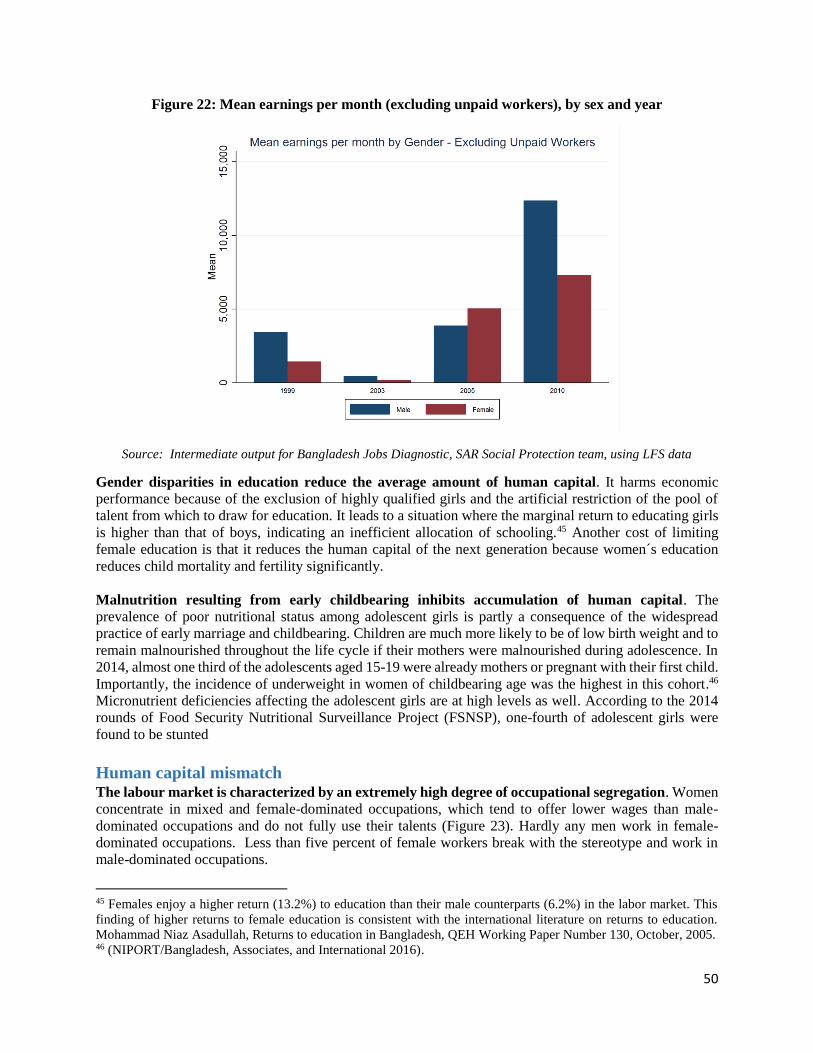
50
Figure 22: Mean earnings per month (excluding unpaid workers), by sex and year
Source: Intermediate output for Bangladesh Jobs Diagnostic, SAR Social Protection team, using LFS data
Gender disparities in education reduce the average amount of human capital. It harms economic
performance because of the exclusion of highly qualified girls and the artificial restriction of the pool of
talent from which to draw for education. It leads to a situation where the marginal return to educating girls
is higher than that of boys, indicating an inefficient allocation of schooling.45 Another cost of limiting
female education is that it reduces the human capital of the next generation because women´s education
reduces child mortality and fertility significantly.
Malnutrition resulting from early childbearing inhibits accumulation of human capital. The
prevalence of poor nutritional status among adolescent girls is partly a consequence of the widespread
practice of early marriage and childbearing. Children are much more likely to be of low birth weight and to
remain malnourished throughout the life cycle if their mothers were malnourished during adolescence. In
2014, almost one third of the adolescents aged 15-19 were already mothers or pregnant with their first child.
Importantly, the incidence of underweight in women of childbearing age was the highest in this cohort.46
Micronutrient deficiencies affecting the adolescent girls are at high levels as well. According to the 2014
rounds of Food Security Nutritional Surveillance Project (FSNSP), one-fourth of adolescent girls were
found to be stunted
Human capital mismatch The labour market is characterized by an extremely high degree of occupational segregation. Women
concentrate in mixed and female-dominated occupations, which tend to offer lower wages than male-
dominated occupations and do not fully use their talents (Figure 23). Hardly any men work in female-
dominated occupations. Less than five percent of female workers break with the stereotype and work in
male-dominated occupations.
45 Females enjoy a higher return (13.2%) to education than their male counterparts (6.2%) in the labor market. This
finding of higher returns to female education is consistent with the international literature on returns to education.
Mohammad Niaz Asadullah, Returns to education in Bangladesh, QEH Working Paper Number 130, October, 2005. 46 (NIPORT/Bangladesh, Associates, and International 2016).

51
Figure 23: Sex-based segregation of employment by male-and female-dominated occupations
Source: Authors’ calculations from LFS 2013 data.
Note: “Male-dominated” denotes when the share of males exceeds 60 percent, “mixed” when it is 40-60 percent, and
“female-dominated” when less than 40 percent.
Looking more closely at specific occupation types reveals that women tend to be segregated to less
complex jobs such as agriculture and elementary occupations. They are vastly underrepresented in
managerial positions (Figure 24).
Figure 24: Occupational segregation in Bangladesh, by occupation and sex
Source: Authors’ calculations from LFS 2013 data.
Limited opportunities to work in the formal sector. A majority of respondents in the qualitative
research, especially those who work in the RMG industry, report that obtaining entry-level employment
does not require experience. However, those who already possess skills – such as sewing or stitching in
the case of RMG workers – are able to bargain for a higher salary than other workers. Having some level
of education is reportedly required by RMG and other formal sector employment. Women from the sample
also work in factories such as PVC tape factories, small manufacturing factories, dyeing factories, bakery
etc. Across all groups, women emphasize that there are not many opportunities to work in the formal sector
in rural areas. Women with some education work as school teachers or upazila government officials, or in
clinics and factories.
0% 10% 20% 30% 40% 50% 60% 70% 80% 90% 100%
Men
Women
Male Dominated Occupations Mixed Occupations Female Dominated Occupations
0% 20% 40% 60% 80% 100%
Armed Forces
Managers
Plant and Machinery
Service and Sale
Technicians
Clerical Support
Elementary Occupation
Professionals
Skilled Agriculture
Craft and Related Activities
Males Females

52
In the informal sector, female participants mainly work as housemaids, day laborers, hawkers, community
cleaners, tailors etc. The main informal sector work opportunities in rural areas are in cattle rearing, poultry
farming, day labor, handicrafts, handlooms, and tailoring. In the ethnic minority communities, the scope
for formal sector work is very limited. They work in textile industries, handloom factories etc. Educated
women work as local school teachers, NGO workers, and sales girls. A new employment area has opened
up through growth of the tourism industry in the Chittagong area.
Employed women value skills training. Skills trainings not only equips women with a better bargaining
position and higher chances of vertical mobility; it also builds confidence and self-esteem, according to
some respondents. Networking also plays a strong role in improving chances: in the absence of formal
recruiting systems, which reportedly benefit men more than women, informal networking helps women
gain employment. Some involved in the RMG sector mention the importance of leadership and management
training to raise odds of securing higher-skill and/or higher-status jobs.
Gendered social norms around women’s mobility, safety, and honour are another source of
occupation segregation. One of the reasons women are drawn to female-dominated occupations is that
those occupations are perceived as (and typically are) presenting lower odds of sexual harassment and other
gender-based violence than are mixed and male-dominated occupations. Female workers in the Ready-
Made Garment (RMG) industry (which now employs roughly equal shares of men and women) in
Chittagong report a high prevalence of workplace violence and sexual harassment, including instances of
inappropriate touching and even rape. Women in general mention facing sexual harassment while traveling
to and from workplaces.47 Even policemen on the streets or guards of the factory make illicit proposals,
with the connotation that “working women” are not “good women.” Safety concerns may also be a factor
in their much greater share among those who work from inside their homes (Table 16).
Table 16: Percentage of workers who work from inside their houses
Rural Urban Total
Female 20 6 16
Male 3 2 2
Total 8 3 7
Source: WB staff calculations from LFS 2013 data.
Mobility issues constrain female access to education as well as work. A few participants in the
qualitative research report the lack of nearby schools and insufficient transportation systems as reasons to
keep or take girls out of school. However, it is more specifically the fear of sexual harassment, commonly
referred to as “eve teasing,” that is mentioned as a cause for limiting girls’ education. In Dhaka in particular,
both parents and school-going girls report feeling unsafe on their way to and from school, as they are
subjected to sexual harassment by men. Participants in Chittagong also refer to “inappropriate touching by
the teachers at school,” although that was not mentioned as a reason for girls discontinuing their studies,
but rather as a part of everyday life for women and girls. According to members of a male adolescent FGD
in urban Dhaka, “Girls of our area don’t inform their guardians about teasing because their parent will
stop their schooling.” Female respondents from rural areas appear to face more difficulty in leaving the
household or private domain than their urban counterparts in terms of their families and communities
disapproving and explicitly discouraging them from venturing outside.
47 As a survival technique, women form groups and commute together.

53
Open Discrimination by Gender in Hiring and Promotion Hiring women is perceived as costlier. Gender discrimination plays out on supply-side labour dynamics
through the deeply entrenched gender norms that undermine girls’ and women’s choices in seeking
education and work opportunities. This type of institutional bias on the supply side is difficult to measure,
however. Analysis of both quantitative and qualitative data suggest more direct or active discrimination
(also known as “statistical discrimination”) on the part of employers and other demand-side actors. The
gender gap is not determined so much by endowments and characteristics (such as education, family
structure, and demographics) but by the disparities in how markets and society treat men and women with
similar endowments and characteristics; and by differences in how men and women may behave given
similar circumstances.48 Analysis of Enterprise Survey 2013 data on Bangladesh reveals that employers in
many firms harbour a negative attitude toward hiring women (Table 17).
Table 17: Employers' views on the challenges of employing women
Challenges Percent agree
Challenges of working with women due to their family commitments 33
Challenges of hiring women given government regulations such as working hours and
maternity leave 35
Hiring women could cause disruption in the working environment 45
Required benefits and other expenses such as providing separate workplace facilities
for women make them more expensive employees 43
Source: Authors’ calculations from Enterprise Survey 2013 data.
This biased attitude toward working with women appears to be more pronounced among employers of
smaller firms (Table 18).
48 Based on 2013 LFS data, using Oaxaca-Blinder decomposition of labour force participation.

54
Moving forward
Despite significant progress in recent decades, labor markets in Bangladesh remain divided along
gender lines. Female labor force participation has languished far behind male participation, gender wage
gaps are high, and women are overrepresented in the informal sector and among the poor. Legal restrictions
persist which constrain women from developing their full economic potential. While equality between men
and women is in itself an important development goal, women's economic participation is also a part of the
growth and stability equation. Better opportunities for women can also contribute to broader economic
development, for instance through higher levels of school enrollment for girls.
Source: WB Staff calculations from Enterprise Survey 2013 data.
Economic growth and development depends upon successfully utilizing the country’s workforce, both
male and female. Globally, increased role of women has been a central driver of economic growth over
the past century. This role of women came in many forms: better education and health that increase female
labor force participation, and reduced discrimination and wage differentials that encourage greater effort.
It is no rocket science that empowering half of the potential workforce has significant economic benefits
beyond promoting gender equality. Despite its recent economic advances, Bangladesh’s gender balance in
labor markets remains among the lowest in the world. Improving this balance is an important step for
development and Bangladesh’s achievement of greater economic growth and gender equality.
Table 18: Employers' views on the challenges of employing women, by firm size
Size of establishment Percent agree
Micro <5 100
Small >=5 and <=19 57
Medium >=20 and <=99 42
Large >=100 29
Total 45

55
IV. Outlook and Risks
Growth in the medium-term is projected to remain robust, supported by reasonably prudent macro-fiscal
balance, modest improvements in infrastructure, and some reduction in the cost of doing business through
reforms in business regulation. Downside risks are predominantly domestic rooted in the deterioration of
financial sector stability, slippage in fiscal reforms and recurrence of confrontational politics. External
risks constitute non-trivial threat to both exports and remittances arising from rising trade protectionism
and sentiments against migrants.
56
Global Prospects49
Growth in Bangladesh’s largest export markets, the US and Europe, are projected to improve as is global
trade. Import demand from the emerging markets are expected to rebound, in part as a result of moderate
increase in international commodity prices in the near-term.
Global growth is projected to rise to 2.7 percent in 2017 from an estimated 2.3 percent in 2016. Pick
up in emerging market and developing economies (EMDEs) due to receding obstacles to activity in
commodity exporters and stronger domestic demand in commodity importers underpin the projected
increase. Fiscal stimulus and other growth enhancing policies in key major economies—the United States
in particular—could lead to stronger-than-expected activity, representing a substantial upside risk to the
outlook. Across major advanced economies, the deceleration in growth in 2016 to 1.6 percent reflected
renewed policy uncertainties, weak external demand, and subdued productivity growth. Activity is expected
to regain modest momentum in 2017-19, but uncertainty associated with policies of the new administration
in the United States and with the United Kingdom’s decision to leave the European Union (Brexit) could
significantly influence the growth trajectory of advanced economies. Growth projections for 2017 and 2018
have been revised down for the Euro Area and, especially, for the United Kingdom. For the United States,
baseline forecasts for 2017 and 2018 are unchanged at 2.2 percent and 2.1 percent respectively, in the
absence of specific details about policy changes to be implemented by the new administration. Whereas
constraints to monetary policy have intensified, fiscal policy is likely to play a greater role in the years to
come. Weak productivity growth and rising demographic pressures, which weigh on labor supply and could
contribute to a lower rate of return on capital, continue to constrain long-term prospects.
Global trade growth in 2016 recorded its weakest performance since the global financial crisis.
Stagnant goods trade for most of 2016 was exacerbated by a cyclical drawdown in inventories across
advanced economies, contracting imports in China and in major commodity exporters. The sharp drop in
oil prices from mid-2014 to early 2016 could have contributed to the weakness in global trade over that
period, as income losses were highly concentrated among a few countries, while gains were diffused among
many.50 The slowdown in global investment in 2015-16 played an important role as well, as capital goods
account for about one third of world goods trade. Structural forces at work include a slower pace of trade
liberalization and of global value chain integration. In an environment of weak global trade, stagnant real
income gains in major advanced economies, and marked currency movements between major reserve
currencies, protectionism has been slowly rising.51 The appetite for further trade liberalization has waned,
particularly among major advanced economies, which in turn appears to have contributed to the global trade
slowdown more than the rise in temporary trade barriers. The maturation of global value chains also
contributed to a lower income elasticity of trade. Among major advanced economies, the slowdown in
global value chain participation is particularly visible in the United States and Japan. Among EMDEs,
China’s move toward more mature domestic intermediate production has contributed in lowering its trade
elasticity. However, most EMDEs still have a large untapped potential to move up the value chain, by
shifting to more complex and higher domestic value-added products. Services trade continued to show
greater resilience than goods trade because of its nature.52
49 Based on the World Bank, Global Economic Prospects, 2017 and Commodity Market Outlook, 2017. 50 Import demand is generally more sensitive to large changes in income than to smaller changes. 51 For example, in 2016, G20 countries have taken more trade-restrictive measures than trade-facilitating ones.
Although subsidies and trade safeguard measures are still by far the most common forms of trade distortion, there has
been a shift toward more opaque measures, such as localization requirements, export incentives, and other trade
finance measures. 52 Services cannot be stored, often represent a fixed cost in production processes, and are less sensitive to changes in
credit and trade finance conditions.

57
A gradual recovery in global trade is still expected in 2017 and 2018, supported by a projected rebound
in import demand from large EMDEs. However, the pace of the recovery is likely to be slower than
previously expected because of downward revisions to growth prospects in major advanced economies,
persistent weakness in global investment, and slower or stalled trade liberalization amid uncertainty about
trade policy in the United States and Europe.
Energy and non-energy commodity price indexes are projected to increase in 2017 by 26 and 3 percent,
respectively. Industrial commodities are expected to outperform other markets due to strong demand and
tight supplies. Prices of beverages, grains, and precious metals are exceptions. Oil prices surged at the end
of November in response to the deal reached by OPEC member countries to cut production. Effective in
January 2017, OPEC members agreed to cut production by 1.2 mb/d to 32.5 mb/d, much higher than the
expected cut of 0.5-1 mb/d. The OPEC cut—the first such in eight years—is also contingent on the
participation of non-OPEC countries, which are expected to account for half of the cut (0.6 mb/d), of which
half will come from Russia. The cuts are effective for six months, but could be extended for another six-
months. The OPEC deal, if fully implemented, is expected to bring forward large inventory reductions and
balance the market within six months. However, more recently, crude oil prices have broken to the
downside, reflecting the ongoing imbalance between plentiful supply and limited demand. West Texas
Intermediate (WTI) crude dropped to its lowest level in the first half of March, 2017 since November 30.
There are incessant worries about the balance between supply and demand as US shale extraction capacity
grows, given a lower breakeven price than many other sources of oil. These concerns are unlikely to go
away anytime soon, suggesting that further price weakness in the near future cannot be ruled out. A
theoretical lower bound for oil prices is linked to the level of the marginal cost of production of US shale
oil, estimated at around USD 35 per barrel on average.53
Although the Agricultural Price Index is expected to remain stable in 2017, the outlook for its components
varies considerably, depending on supply conditions. Upside risks to the agricultural price forecast include
worsening weather conditions in East Asia and South America and a larger-than-expected increase in
energy prices, which are a key cost component to most food prices. Downside risks include the escalation
of agricultural subsidies, especially in grains, which could encourage greater production.
Outlook for Bangladesh
GDP growth in the medium-term is projected to be in the 6.4-6.8 percent range, anchored on industrial
growth while agriculture responds temporarily to recent relative price increases and growth in services
remain steady. Declining export growth and falling remittances have dented the resilience of Bangladesh’s
growth prospects, but overall macroeconomic stability is expected to be maintained. With rising import
prices and positive output gap, inflation is projected to rise. Uptick in investment growth coupled with
persistent budget deficit are projected to lead to modest deficits in the external current account without
jeopardizing external debt sustainability.
GDP is expected to grow by 6.8 percent in FY17 (Table-19). Agriculture growth in FY17 is expected to
rise to 4.1 percent as farmers respond to sustained increases in rice, vegetable and horticultural product
prices in the last half of 2016 (Figure-25, 26) which should encourage farmers’ to expand crop area.54 Rice
53 Little, Arthur D., Where now for oil? Viewpoint, 2015. 54 Long-run own price acreage elasticities for Boro is 0.95 (near to unitary elastic) respectively. Short-run own price
acreage elasticities for Boro rice shows inelastic rang 0.21. Limitations and inadequate irrigation facilities at private
level, distribution and availability of fertilizer in time are always problems in Bangladesh. Moreover, a main input
like capital is insufficient in the short run. These constraints helped to dampen the price elasticity of Boro rice supply
in the short run. The result suggests that farmers in Bangladesh are responsive to price incentives for Boro rice. See

58
area increased 2 percent during the aman season and farmers have prepared seedbeds for boro in an area
much higher than the Directorate of Agricultural Extension (DAE) target.55 Industry growth is projected to
edge down to 8.9 percent as a result of export slowdown and weak domestic demand in rural non-farm
sector due to a large decline in remittance inflows. Services are projected to grow at a steady 6 percent,
given political stability, rise in agricultural growth, relatively smooth power supply situation, easing of
transport bottlenecks, and increases in public sector benefit payments. Relatively strong performance of
several high-frequency indicators so far give confidence that the economy is on course to maintaining robust
growth in FY17, as it did in recent years (Table-20).
Table 19: Bangladesh Macro Outlook Indicators
(annual % change unless indicated otherwise)
2014 2015 2016 2017 f 2018 f 2019 f
Real GDP growth, at constant
market prices 6.1 6.6 7.1 6.8 6.4 6.7
Private Consumption 4.0 5.8 3.0 4.0 5.0 5.6
Government Consumption 7.9 8.8 8.4 10.2 9.6 8.9
Gross Fixed Capital Investment 9.9 7.1 8.9 12.0 11.1 11.0
Exports, Goods and Services 3.2 -2.8 2.2 5.0 6.0 6.5
Imports, Goods and Services 1.2 3.2 -7.1 6.0 10.5 11.5
Real GDP growth, at constant
factor prices 6.1 6.5 7.2 6.7 6.6 6.7
Agriculture 4.4 3.3 2.8 4.1 2.5 3.3
Industry 8.2 9.7 11.1 8.9 8.3 8.9
Services 5.6 5.8 6.3 6.0 6.9 6.4
Inflation (Consumer Price Index) 7.3 6.4 5.9 5.6 6.3 6.3
Current Account Balance (% of
GDP) 0.8 1.5 1.7 0.2 -0.3 -0.6
Financial and Capital Account (%
of GDP) 1.9 1.2 0.9 0.6 0.5 0.2
Net Foreign Direct Investment (%
of GDP) 0.8 0.9 0.9 1.1 0.9 1.0
Fiscal Balance (% of GDP) -3.5 -3.3 -3.1 -4.0 -3.5 -3.7
Debt (% of GDP) 31.9 31.5 30.6 30.6 30.0 29.6
Primary Balance (% of GDP) -1.5 -1.5 -1.4 -2.2 -1.6 -1.8
Sources: World Bank, Macroeconomics and Fiscal Management Global Practice, and Poverty Global Practice.
Notes: e = estimate, f = forecast. (a) Calculations based on SARMD harmonization, using 2005-HIES and 2010-HIES.
(b) Projection using point-to-point elasticity (2005-2010)
with pass-through = 0.87 based on GDP per capita constant PPP.
(c) Projections are from 2017 to 2019.
Domestic demand growth projected to persist. Consumption growth is expected to pick up in FY17,
supported by higher public sector benefit payments as well as continued ready access to consumer credit.
While formal channel remittances are down currently, it is expected to recover in the coming months as the
impact of the very large outflow of labor abroad last year start showing up and diversion to informal
Gazi Hasan Kamal, Supply Response of Boro Rice in Bangladesh: Cointegration and Error Correction Modelling
Approach, Bangladesh Journal of Agricultural Economics, XXX 2 (2007) 19-34. 55 USDA, Bangladesh, Grain and Feed Update, January 2017.

59
channels is expected to shrink with the narrowing of the gap between the interbank and informal market
exchange rate. An upturn in private investment is expected to begin in FY17 with the continuation of
political stability and reduction in trade logistics costs due to two key transport projects - the Dhaka–
Chittagong and Dhaka–Mymensingh four-lane highways - opened for traffic since July 2016.
Net exports are projected to be in deficit reflecting a large pick up in imports. Nonetheless, the current
account is expected to show a surplus of 0.2 percent of GDP in FY17, lower than FY16. Exports have been
stressed in the first seven months of FY17. The growth of export earnings was only 4.4 percent (in nominal
dollar terms) in July-January, 2017,
compared with the same period the
previous year. Growth during the same
period last year was 8.3 percent.
Knitwear has grown by 6 percent while
woven RMG grew by only 2.4 percent.
As shown in Figure-27, Non-RMG
growth has mirrored RMG. Overall
export earnings for the first seven
months in FY17 stood at US $20.1
billion. This means that over the next
five months Bangladesh would need to
earn nearly $17 billion to meet the $37
billion target for this fiscal year, which
will be a major challenge.56 Achieving
this target would require exports to grow by 12.7 percent over the next five months.57 The bulk of this
growth has to be driven by the RMG sector, which will need to expand at nearly 13.7 percent over the next
five months to meet its target of 8.1 percent growth in FY17.
56 The Export Promotion Bureau (EPB) had set a target of 8 percent growth in exports earnings for FY17. 57 Note that during the second half of FY 16, total exports grew on average by 9.2 percent.
0.60
0.70
0.80
0.90
1.00
1.10
1.20
1.30
1.40
1.50
1.60
Jan-1
4
Mar
-14
May
-14
Jul-
14
Sep
-14
Nov
-14
Jan-1
5
Mar
-15
May
-15
Jul-
15
Sep
-15
Nov
-15
Jan-1
6
Mar
-16
May
-16
Jul-
16
Sep
-16
Nov
-16
Ratio for Rice Ratio for Vegetable
Ratio for Meat
Source: BBS
0.60
0.70
0.80
0.90
1.00
1.10
1.20
1.30
1.40
1.50
1.60
Jan-1
4
Mar
-14
May
-14
Jul-
14
Sep
-14
Nov
-14
Jan-1
5
Mar
-15
May
-15
Jul-
15
Sep
-15
Nov
-15
Jan-1
6
Mar
-16
May
-16
Jul-
16
Sep
-16
Nov
-16
Ratio for Rice Ratio for Vegetable
Ratio for Meat
Source: BBS
Figure 25: CPI ratio (2005-06=100),
Urban
Figure 26: CPI ratio (2005-06=100),
Rural
0
5000
10000
15000
20000
25000
30000
-10
-5
0
5
10
15
Jul Aug Sept Oct Nov Dec Jan Feb MarC
um
ula
tive
Ear
nin
gs
(US
$
Mil
lio
n)
Cum
ula
tive
Gro
wth
(%
)
Export Performance
Total Export RMG Non RMG
Figure 27: Export Performance (FY17)

60
Table 20: High Frequency Indicators (%)
FY17 Same period FY16
NBR Tax Revenue growth, July-February 19.6 14.4
ADP implementation, July-March (% of original) 43.7 41.1
Industrial raw materials import growth, July-February
LC Opening 4.1 2.5
LC Settlement 2.0 4.2
Growth in import of construction materials, July-January
LC Opening 13.6 -3.6
LC Settlement 8.6 2.6
Growth in quantum index of manufacturing July-November 9.0 7.9
Growth in import of capital machinery, July-February 24.0 -2.8
Remittances growth, July-January -16.9 -1.8
Credit flow to private sector, July-February 15.9 15.1
Exports, July-March 4.0 9.0
Sources: Bangladesh Bank, IMED, NBR, and EPB
The US and UK markets could be the source of revival in export growth in the medium-term. The
United States is the single largest destination for Bangladeshi exports. Expectations of a fiscal stimulus
have already propelled a “Trump rally” in the US stock markets while jobs and wage growth have shown
large gains.58 The policies of the new US administration, particularly the imposition of the proposed border
tariffs on imports, being contemplated, may dampen apparel exports to the United States from China. The
US decision to opt out of the Trans Pacific Partnership (TPP) agreement could be a boon for Bangladeshi
exports of garments, footwear and furniture with Vietnam losing the TPP competitiveness edge vis-à-vis
Bangladesh. In UK, the third largest market for Bangladeshi exports, Brexit and the subsequent appreciation
of the Taka against the Pound Sterling eroded the competitiveness of Bangladeshi exports temporarily.
With the air clearing regarding the terms of the exit by the end of 2017, Bangladeshi exports to the UK may
regain lost grounds, irrespective of whether the UK remains a part of the single market59, and as the UK
pound recovers against the US dollar. Bangladesh’s exports are also likely to get a boost from the easing
of supply side bottlenecks as some of the ongoing work on the Special Economic Zones (SEZ) come to
fruition and regulatory reforms reduce frictions in cross-border trade.
Import is projected to be buoyant, reflecting higher domestic demand, driven by both investment and
consumption. The import bill is projected to grow at 6 percent in FY17, taking into account modest import
expansion in FY16, when higher domestic production partly replaced imports. Imports of capital machinery
are expected to pick up on higher investment, and a rebound in demand for raw materials and a projected
increase in oil prices are also taken into account. LC opening for imports grew by 9.3 percent in the first
half of FY17, driven by 21.4 percent growth in “other” imports and 21.3 percent growth in food grains. LC
opening for petroleum imports grew by 6.9 percent.
With the low oil price environment continuing, remittance inflows are likely to decline by 3-5 percent in FY17, assuming some recovery during March - June, 2017.60 The stock of Bangladeshis working abroad
increased by nearly 7.6 percent in FY16 relative to end-June, 2015 and by a further 5.7 percent through
58 US Jobs Report, March 10, 2017. 59 However, Bangladesh will need to negotiate separately the market access to UK and perhaps even EU.
60 The likely imposition by Kuwait, Oman, and Saudi Arabia of taxes on remittances will further discourage them.

61
February 2017 relative to end-June, 2016. The impact of these additions to the stock of Bangladeshis
working abroad on remittances may begin to surface in the months ahead in 2017. However, given the
current international realities, it is not reasonable to expect remittance growth to go back to double digits
as was the case three years ago.
Inflation is projected to rise moderately. Inflation is expected to be 6.1 percent in FY17. Average core
inflation (non-food, non-fuel), a traditional measure of underlying long-term inflation, declined but
remained elevated at around 7.6 percent in December, indicating inflation can pick up if buffeted by
overheating and adverse shocks. The global commodity outlook suggests emergence of some upward price
pressures from higher import prices. According to the BB's latest inflation expectation survey of December
2016, the one-year-ahead inflation expectation is around 6 percent, broadly unchanged from a year ago,
implying a strong persistence of expectations once they are formed.61 The output gap is projected to rise
from 0.4 percentage points to 0.7 percentage points, thus exerting upward pressure on core inflation and
nursing relatively high inflationary expectations.
Monetary accommodation to continue. In the monetary policy statement for the first half of FY17 (Box
2), issued in late July 2016, the central bank focused on stabilizing inflation while supporting output and
employment growth. The central bank thus kept its main policy rate unchanged at 6.75 percent. Despite
price pressures from public and private sector wage increases and upward price adjustments for natural gas
and possibly electricity, a benign inflation outcome is anticipated in light of very modest increases in global
food prices and some domestic supply response from increased demand.
Box 2: FY17 Monetary Policy
On the whole, the Monetary Policy Statement announced in January 2017 is appropriate for the current state of the
economy. The key macro targets are closer to reality. GDP growth is projected at around 7 percent. While this is
still on the optimistic side, it reflects better the information on growth based on the high frequency indicators.
Average inflation is projected to be within 5.3 to 5.6 percent while recognizing that core inflation remains elevated
at around 7.6 percent and the one-year ahead inflationary expectation is at 6 percent.
The macro-monetary balance is logical. Broad money growth target of 15.5 percent is in line with the projected
nominal GDP growth of 13 percent plus a 2.5 percent allowance for monetization of the large informal economy
and financial inclusion. This is adequate to accommodate the government’s 7.2 percent GDP growth target without
risking macroeconomic instability. Private sector credit growth target is unchanged at 16.5 percent, with ample
room for further adjustment during the rest of the year because of the ambitious target of 16.1 percent growth in
credit to the public sector. However, this may be challenged somewhat if the 10.1 percent growth target for Net
Foreign Assets is overshot.
The cautionary stance on the policy rates is a step in the right direction. Policy rates have been kept unchanged
considering “the fact that core inflation and inflation expectations remain elevated and inflation risks from higher
commodity prices are on the upside.” At the same time, flexibility is maintained by committing to review the policy
rates on a continuous basis.
The MPS notes adequately the potential risks in playing the capital market. The guardian of the financial system
has urged to keep the recent exuberance rational and quite rightly advised the banks to upgrade their surveillance
of loan usages. It also commended the Bangladesh Securities and Exchange Commission for their cautionary
messages and financial literacy promotion. At the same time, BB has committed to tighten monitoring to ensure
banks abide by statutory limits on their capital market exposures.
There is some indication of the future direction of monetary policy framework. The MPS rightly recognizes that
with growing external integration, monetary policy framework will need to move towards interest rate targeting
from the current monetary stock targeting. A pre-requisite for interest rate targeting is a well-functioning bond
market to enable the policy rates to influence the longer term interest rates. In this regard, reforms to rationalize
various risk free rates and shift the composition of domestic financing of budget deficit toward market-based
instruments have been rightly emphasized.
61 Bangladesh Bank, Monetary Policy Statement, January, 2017.

62
The MPS is a little short on addressing concerns on credit quality and reserve management. On credit quality, the
statement falls short of being innovative. There is more of the same by urging banks to improve corporate
governance while BB will continue to strengthen its supervisory scrutiny using more the IT-based online
supervision tools and placing observers in banks with governance challenges. Also, the MPS is silent on the current
BB stance on reserve management, particularly with regards to the proposals recently floated on the creation of a
Sovereign Wealth Fund and BB’s own initiative to use reserves for financing garments and footwear exports.
The fiscal deficit is targeted at 5 percent of GDP with about 60 percent financed by domestic
borrowing. The FY17 budget aims to raise revenue equal to 12.4 percent of GDP for financing a larger
Annual Development Program and a major increase in other capital spending for speeding up the
implementation of infrastructure projects. Current spending is projected to grow to 9.6 percent of GDP with
an increase in public sector salaries and modestly larger subsidies directed mainly to agriculture and social
welfare. Capital spending is slated to rise to 7.8 percent of GDP with development expenditure amounting
to 6 percent and other capital spending and net lending to state-owned enterprises increasing substantially
to 1.8 percent.
As in the past, budget implementation shortfall is likely to restrain the overall deficit below the original
budget target. But the overall deficit is projected to increase because of large shortfall in revenue relative
to the original budget target and increase in recurrent as well as capital expenditures relative to last year.
The implementation of the new Value-Added Tax Act, which had been scheduled for July 2016, was
deferred until July 2017 to allow more time for the private sector to adapt their accounting systems and
for greater outreach and education to small business. New revenue enhancing tax measures in the FY17
budget included raising rates on net wealth taxes, enhancing the minimum corporate tax, broadening
the base of the existing value-added tax by bringing wholesale and retail traders into the tax net,
increasing taxes on tobacco products, and raising import duties on a number of items. The rates of
supplementary and regulatory duties were also increased. The review yield from these measures are at
best likely to be modest.
A break from established practice, the government has kept unchanged the Tk 1107 ($14) billion size
of the ADP main program. However, the composition of ADP financing has been revised in favor of
a greater reliance on funding from internal sources. The share of foreign financing has been reduced
by 17.5 percent to Tk 330 ($4.2) billion, still very ambitious considering past trends and utilization of
only $1.3 billion project aid in the first seven months of FY17.62
Overall ADP utilization has increased in the first eight months as has recurrent expenditures relative to
last year. In conjunction with slower than budgeted revenue growth, this will lead to increase in budget
deficit. However, the size of the deficit will remain below unsustainable level.
62 The unused foreign aid pipeline reached a new high of $36.5 billion by End-February, 2017, reflecting the signing
of the mega Rooppur Nuclear Power Plant financing agreement with Russia. The revised FY17 ADP has 1415
development projects, of which 272 were added this year and the remaining were carryovers from the FY16 ADP.
The expectation is that 312 projects will be completed by the end of the current fiscal year.

63
Risks
While external risks are nontrivial, domestic risks arising from a fragile financial sector, weak business
environment and political stability are predominantly on the downside.
Risks to the outlook are primarily domestic and tilted to the downside. Domestic risks include: further
deterioration in financial and corporate sector stability, slippages in addressing fiscal reforms, and elevated
political tensions in the run up to elections in 2019. Uncertainty about fiscal strengthening through
improved revenue mobilization and public investment expenditures could weigh on confidence in the near-
term. Increases in public sector salaries and other slippages on the fiscal front coupled with a sudden
rebound in energy prices could contribute to a reintroduction or an increase in expenditures on subsidies,
raising fiscal deficits and costly domestic financing. Impaired commercial banks’ balance sheet, especially
of state-owned banks, would contribute to aggravating fiscal strain through pressure for continuing
recapitalization by the government. High levels of non-performing bank loans make banks vulnerable to
financial stress and constrict new lending. Sovereign loans and guarantees associated with the mega projects
elevate fiscal risks over the medium-term. Finally, upcoming general elections in 2019 could lead to
expansionary fiscal policy and widening fiscal deficits. Security and geopolitical tensions in the region
could derail growing regional integration, including in the apparel sector. Terrorist and militant attacks,
recurrence of confrontational politics, and border dispute on Rohyngas presents risks to stability. Increased
spending on security and refugees exacerbate fiscal vulnerabilities.
Downside external risks are non-trivial. Despite Bangladesh’s still limited global trade and financial
integration, it is vulnerable to both downside and upside external risks. The downside risks include
heightened policy uncertainty in the United States and Euro Area, Bangladesh’s largest export markets and
the most important source of remittance inflows after GCC, leading to a prolonged slowdown in key export
markets, and a jump in energy prices. External risks could arise from weaker growth in key export
markets—the United States, the United Kingdom, European Union, and the GCC countries. An unexpected
tightening of financing conditions amid normalization of monetary policies in the United States and Europe
could exert upward pressure on financing costs. Besides impacting inflation, currency pressures could make
short-term debt rollover expensive. This would compel BB to tighten monetary policy, which would reduce
credit growth and investment. As a net energy-importing country, continued low energy prices have
provided unanticipated financial windfalls to the Bangladesh Petroleum Corporation and the budget. An
increase in energy costs could lead to reintroduction of subsidies, in the absence of reforms in setting energy
prices, with detrimental consequences for fiscal deficits. Furthermore, an uptick in energy prices could raise
the energy import bill, exacerbating current account deficits. However, the upside risk associated with oil
price increases is that outward remittances from GCC countries are highly responsive to changes in GDP
in the GCC countries, which in turn is sensitive to changes in oil prices. This could help strengthen the
recovery in remittances stemming from the recent increase in the outflow of Bangladeshi labor to GCC
labor markets.

64
V. Policy challenges
Bangladesh has been a success story in recent years, with high growth, and considerable progress in
poverty reduction. The key challenge is to take that success to much higher levels by raising incomes,
inclusivity and sustainability in the face of future domestic and external headwinds. Removal of structural
barriers to investments and innovations, pursuit of greater international integration, further fiscal and
financial reforms, and improving women’s labor market outcomes deserve the highest priority.

65
Structural impediments to investments The business environment in Bangladesh is not geared to support growing to a comfortable threshold of
middle income by 2021. Despite several recent reform initiatives, Bangladesh continues at lower positions
in Doing Business and Global Competitiveness rankings. Bangladesh ranked 176th among 190 countries in
Doing Business 2017, one of the lowest ranked nation in South Asia, and significantly lower than
competitors outside the region. Bangladesh also ranks 107th amongst the 140 countries assessed under the
Global Competitiveness Index 2017.
Regulatory complexities. Weaknesses related to the institutional framework are reflected in outdated and
at-times conflicting rules, laws and regulations that govern the interfaces between government and
businesses. The recently created Bangladesh Investment Development Authority’s (BIDA)63 online
inventory of business law shows clearly the complexity of the existing laws and regulations. It lists 56 laws
relevant to the private sector. Of these, 26 were enacted before the year 2000, three date back to the 19th
century, and 12 predate the independence of Bangladesh. Also, reformed new laws are often only partially
implemented. Institutional frameworks are generally weak for the private sector as a whole, with problems
more pronounced at the sector-specific level. Different sectors face differing regulatory burdens, which
encourage informality; a few sectors with powerful voice such as RMG have managed to advocate their
way into a simpler regulatory environment, but many others and their representative associations do not
have access to the knowledge of best practices, experience or ability to advocate reforms to their regulatory
environments.
Access to industrial land. Much of the land is either waterlogged, inaccessible by road, or inhabited. An
inefficient land administration system and deficiencies in urban planning has rendered the serviced land
market opaque and often informal. The country’s existing productive zones are already at full capacity, yet
a wealth of government-owned land exists that is not being packaged and marketed effectively. Large
private investments are required to help the government shoulder the management and financial capacity
in order to develop serviced industrial economic zones.
Poor enforcement of contracts. Bangladesh has a burdensome commercial court litigation process that
most businesses find frustrating, costly and a key impediment to business operations. According to DB2017,
on average it takes 1,442 days to enforce a contract and the financial cost of enforcement is as high as 66.8
percent of the claim. An area of particular concern in Bangladesh relates to current scenario regarding debt
resolution and business exit. In light of the overburdened courts, Doing Business data also demonstrates
that it takes over four times longer to close a business in Bangladesh than it does on average in OECD
countries.
Hassles in paying tax. Doing Business 2017 reports that, on average, firms in Bangladesh make 21 tax
payments a year, spend 302 hours a year filing, preparing and paying taxes and pay total taxes amounting
to 31.6 percent of profits. Recently the Government of Bangladesh has introduced electronic tax registration
system, which has made tax registration possible in less than 1 day and at no cost. Nevertheless, there could
be further room for making paying taxes hassle free to encourage more firms to become formal enterprises.
Light at the end of the tunnel? The erstwhile Board of Investment (BoI), established originally as an
Investment Promotion Agency, focused most of its effort on regulation, without paying adequate attention
to identifying priority sectors, designing a shelf of projects, targeting strategic investors and converting
investor interest into actual investment. Consequently, its delivery on most front was very poor. The recent
restructuring of BOI as BIDA is a positive step which now needs to be followed up by deep institutional
capacity development.
63 By merging the erstwhile Board of Investment and the Privatization Commission.

66
Energy Electricity generation capacity. With onshore gas reserves depleting fast, electricity generation is
increasingly relying on more expensive and polluting fuels. Additional inefficiencies arise from dispatch,
which does not give priority to lower-cost generation, adding to the cost of supply and necessitating higher
budgetary transfers. Key initiatives to ensure that the energy sector can support a higher growth trajectory
include:
Attracting investors with state-of-the-art technology to boost gas exploration and production and
reforming the gas pricing regime, especially for fertilizer and power plants (Box 3).
Implementing a time-bound plan for corporatizing the remaining distribution assets under the
Bangladesh Power Development Board, renegotiating the rental power contracts with private investors
as they come up for renewal, and making the Load Dispatch Center an independent entity to ensure that
load dispatch follows merit order (potentially yielding $1 billion in savings annually).
Some of the politically sensitive reforms, like oil pricing reform, are best done from a position of
strength. Bangladesh economy is growing, the macro-economy is stable and inflation has declined. In this
overall positive macroeconomic environment, low international oil prices present a historic opportunity to
reduce economically costly and environmentally damaging pricing policies.
The domestic prices of oil products in Bangladesh today are above the international price and reforms
will decrease oil prices immediately. Given that the outlook for international oil prices is positive,
reforms will help link domestic price movements to movements in international prices.
The window for reform is limited, given uncertainties about the long-term outlook for international oil
prices. Indeed, oil prices have already moved up from the lowest point achieved in 2015.
An immediate priority is the adoption of an automatic pricing formula that factors in efficiency,
equity and fiscal considerations along with deregulation of the oil market to allow private sector
participation in all areas of the oil industry. The pricing policy should be administered by the BERC
without any government intervention. This requires that the BERC be strengthened with greater autonomy
and quality staffing to do its assigned job competently. BERC will also be responsible for providing
necessary information to the public at large to meet fully the transparency criteria for oil pricing. The
government’s main role will be to decide the taxation policy for oil. Over the longer term, reforms should
aim to fully liberalize pricing. The advantage of a market-based pricing is the complete de-politicization of
oil pricing. Successful implementation of an automatic pricing mechanism can facilitate the transition to a
liberalized pricing regime by getting the public used to frequent changes in domestic oil prices. It can also
build up the confidence of private suppliers that the government will not return to subsidized pricing.
Box 3: Gas Pricing Issue
Bangladesh Energy Regulatory Commission’s (BERC) tariff setting is based on cost plus method. It reviews tariff
application of a utility; considers the cost structure, determines its revenue requirement and sets a tariff. Until
November, 2014, the price did not include cost of gas as a commodity; it reflected only upstream, transmission and
distribution cost. In every stage there is a margin (upstream margin, transmission margin and distribution margin)
to cover operating cost of each utility. In 2015 tariff setting, cost of gas as a commodity was first introduced at the
rate of Tk 25/mcf (equivalent to 31 cents). This is expected to increase gradually.
Gas prices in Bangladesh are not indexed to international oil price or determined in relation to regional gas/LNG
prices or in parity with alternate fuels (say LPG) as per industry practice. Beside the $8 per mcf of LNG, regionally
gas is priced at $ 4- 8 per mcf, say, in India whereas Bangladesh gas is $3 per mcf. Gas prices for power is $5 per
mcf in India, Pakistan, Malaysia, Singapore and Thailand compared to $1.32 in Bangladesh. The government has

67
set gas price for $ 5 to 6 per mcf in Production Sharing Contract (PSC) round bidding document to attract investors.
So, a gas price for $3 per mcf and $1.32 per mcf for power (just set) will be hard to sustain. Note that power is the
largest (40 percent) consumer of the gas.
It follows that the Bangladesh gas is underpriced and subsidized. Flat rate in domestic category, uncorrected
metered volumes, minimum charge from industry and contracts based on heating value for International Power
Producers encourage inefficient gas utilization. These are distribution governance issues need to be addressed.
Subsidized (28.5 percent) gas prices have also resulted in significant inefficiencies in power; average efficiency of
power generation fleet is around 34 percent against 52-60 percent from combined cycle generation. The $5-6 per
mcf price used in PSC bidding gives an indication of global gas price. Even at $4.5 per mcf gas price, the current
price of $3 per mcf needs a 150 percent upward adjustment.
Few gas utilities have profits that are not reflective of the whole value chain. Petro Bangla (PB) has to cover a large
shortfall to pay for International Oil Company (IOC) gas (not profit gas but purchased gas) under PSC. This is a
cost in the gas cost structure based on which a uniform pricing is determined. The end-user price adjusted by BERC
results in the uniform pricing for all utilities in a certain category.
BERC has the legal mandate to set gas tariffs. In order to attract investment in exploration and production, it is
necessary to upgrade the PSC terms where upgrading of prices is one, but not the only, important issue. There are
several other issues including efficient and faster decision making in the PSC bidding processes.
Fiscal reforms Furthering fiscal initiatives at various stages of development and implementation.64 These include
boosting domestic revenue mobilization for expanding fiscal space, strengthening revenue projections to
minimize the need for indiscriminate mid-course budget cuts to adjust to revenue shortfall, strengthening
debt and cash management to ensure fiscal discipline, unifying Budget Call Circular for both the
development and non-development budgets, strengthening audit for enhancing accountability, expanding
electronic government procurement for greater efficiency and transparency, and enhancing the enabling
environment for improved PFM outcomes. Improved public financial management and efficiency would
help to anchor expectations of fiscal sustainability.
Reviving SOE reforms. There is a large opportunity cost to using public resources to support loss-making
enterprises in terms of foregone growth and poverty reduction. Absent privatization as an option, reforms
to improve managerial efficiency are urgently needed. A sound legal and regulatory framework for
corporate governance of SOEs needs to be established. Developing a functional performance-monitoring
system through the clear defining of SOE mandates, strategies, key performance indicators and targets, both
financial and non-financial, is crucial. Financial discipline needs to be promoted by reducing preferential
access to direct and indirect public financing while monitoring and managing the potential fiscal risk of
SOEs. Oversight arrangements for delivering on the social and policy obligations differ between SOEs. A
step forward in oversight arrangements is through the introduction of Annual Performance Agreements
(APA). Such performance agreements, if successful, establish explicit incentives for boards and
management for better performance. Where appropriate, privatization or liquidation of some public
enterprises may be carried out. Business failures are as normal as successful ventures in developed
countries. Entry and exit are an essential part of creative destruction. Life supporting unviable industrial
sub-sectors inhibit industry led growth.
64 As articulated in the Public Financial Management Reform Strategy, June 2016.

68
Financial sector reforms
Enhancing financial sector stability. Banking sector reforms can improve the efficiency in allocation of
credit and help curtail target driven credit growth. Appropriate reforms include:
Strengthening supervision, ensuring capital adequacy, reforming corporate governance to reduce
leverage and improve the quality of bank lending.
Increasing competitive behavior in the banking sector while encouraging efficiency enhancing
consolidation of commercial banks.
Capital market development to allow firms to use debt instruments, thereby easing reliance on
borrowing from banks but could increase vulnerabilities to external shocks.
While the financial sector in Bangladesh has avoided some of the strains affecting other countries, credible
policy commitments are needed in order to ensure that the financial sector supports the trajectory towards
upper middle-income.
Financial policy to tap remittances. Bangladeshi exchange houses in the Middle-East, the UK and the
US need to find ways of becoming much more remitter friendly with a view to minimizing the hassles in
transferring money through formal channels. Bangladesh Bank needs to recognize that a money transfer
currently takes various shapes and forms. It needs to reform the foreign exchange regulations to enable the
money transfer operators to connect with the domestic banking system at the earliest and also to contain
the premium in the informal market through easing of excessive foreign exchange control (Box 4). While
informal methods of sending remittances can be popular among migrant workers, the use of formal methods
enhances the development potential of remittances and promotes increased transparency and accountability
in the remittance market. This positively affects not only the government and the financial sector, but also
the individual remitters and their families. A shift from informal systems to formal ones can only be
achieved when funds transfer systems operate openly and are subject to prudential regulation. Channeling
remittances through transparent, formal systems, as opposed to opaque, informal ones, protects remittance
flows from illicit flows through better monitoring and recording.
Global integration No case for any policy reversal on openness to international trade. Recent slowdown in global trade
and Bangladesh’s export growth has raised questions as to whether export oriented manufacturing growth
strategy is indeed a good idea. Note that even slow growth in advanced economies create very large demand
for Bangladeshi manufactures. Bangladesh’s domestic market is growing fast, but it is no match to the
potential global market. Bangladesh’s 7th Plan has articulated a strategy for higher manufacturing growth
predicated upon an export oriented trade policy.
Export diversification continues to elude Bangladesh. Bangladesh had taken several initiatives to
diversify both the export basket as well as its export markets. Yet the export basket continues to be
dominated by the RMG sector which maintained its share at nearly 82 percent. While certain sectors
(pharmaceuticals and leather) have done well lately, overall progress on diversification is not visible. The
good news is export growth in FY16 in the non-traditional markets (11.7 percent) were stronger than in
traditional markets (9.1 percent). Markets such as Australia and Japan had registered strong growth. These

69
Box 4: Unshackling Informal Remittances
The diversion of remittance flows to informal channels needs to be seen in terms of demand and supply of foreign
exchange in two different market segments relating to India-Bangladesh unofficial trade and remittance flows and
their settlement as well as capital flight or unofficial payments from Bangladesh to the rest of the world which
diverts remittance flows primarily from GCC, Malaysia and Singapore through the hundi market.65
The diversion of remittance through hundi system is common in South Asia. When domestic economic policies are
not aligned with foreign exchange market demand-supply imbalance, suppressed supply of remittance inflows
emerges. In India, until the financial and economic liberalization of early 1990s, the inflow of remittances used to
be at around US$3 billion, close to Bangladesh’s level at that time. The remittance flows accelerated sharply after
early 1990s market liberalization and the level of remittances increased 20 fold to about US$70 billion in 2014.
Surely, the number of workers going abroad from India did not increase so much over the last two decades to
explain the jump in inflow of remittances. The jump was the private sector response to market liberalization and
restoration of confidence in India's long-term economic outlook. Wrong policies and the resulting macroeconomic
instability led to the steady decline in the level of remittance inflows during 1990s in Pakistan as well. Inflows into
Pakistan which used to be many fold higher than Bangladesh in 1980s, declined well below Bangladesh during
1996-2000. Remittances regained its lost momentum with restoration of macroeconomic stability and correction
of financial policies.
Legal and regulatory provisions affect the funds transfer market and the perceived incentives faced by senders.
Government needs to strike an appropriate balance in the level of regulation. Onerous requirements can burden
formal systems or create enforcement obligations for that cannot be feasibly implemented, whereas private-sector
competition and targeted government cooperation can shift the balance of incentives in favor of formal systems.
Government initiatives can help by improving the infrastructure used to transfer funds between financial institutions
at low cost. Effective initiatives can incorporate ideas such as automated clearing houses and private settlement and
clearing channels, and facilitate the entry of nonbank financial institutions such as credit unions and microcredit
institutions into the workers’ remittance market.
however, have not been sustained. Prospects for sustained high export performance in the medium-term are
bright. However, vulnerabilities have been exacerbated by recent changes in global sentiments and politics
on trade. One primary source of vulnerability arises from "export concentration" characterized by the
extreme reliance of export earnings on just RMG. The need for export diversification is well recognized by
the government. But the results are modest. This is partly due to the approach taken to identify products
with strong past growth record or assessment of potential comparative advantage using some indicator like
revealed comparative advantage (RCA), and to include these among the "thrust sectors" in industrial or
export policy to give them all kinds of support in preference to other sectors.
Ending asymmetric policy support for export diversification. In Bangladesh, the high reliance on RMG
exports has put in place institutions and policies giving high priority to this sector resulting in an asymmetry
of policy support. This accentuates the existing uni-product export concentration and hinders the emergence
of non-RMG exports. Given the size of the global market for textiles and clothing, Bangladesh's strong
market position in RMG is unlikely to diminish anytime soon. But the trade policy bias against exports
must be eliminated because it hurts emerging and potential exports, thus serving as a policy constraint to
export diversification. A transparent and efficient customs administration is critical for export success. It is
not enough to provide green channel clearance for RMG cargo while leaving the remaining exports at the
mercy of an archaic and incompetent customs administration. Export and imports are intricately linked so
that export performance depends critically on simplification of import procedures as well.
65 See The Advanced Migration and Remittances Fact Book (2016) of the World Bank.

70
Extending proven innovations beyond garments. The business environment needs to be improved across
the board. The garments’ sector success was made possible by cutting through a poor business environment
through policy innovations such as the bonded warehouses to address trade distortions and back-to-back
letters of credit to address financial sector distortions. The inability to introduce similar innovations in
other policy areas and to extend these innovations to other sectors is preventing Bangladesh’s export success
to extend beyond garments. Also, the success of garments owes much to the enterprise of local
entrepreneurs and to very competitive local cotton. But the inability to move in a large scale in the direction
of man-made fibers is preventing Bangladesh from tapping into global markets the way China did
before. Constraints to man-made fibers exports do not come from protectionism, as is the case in India and
Pakistan, but from the lack of integration in global value chains, an area in which Sri Lanka has been more
successful. Bangladesh will need to attract FDI to move to the next phase. Further progress is also
constrained by poor logistics, resulting in turn from urban congestion and deficient infrastructure. Export
processing zones have been the spatial equivalent of bonded warehouses and back-to-back letters of credit
in relation to the business environment.
Increasing potential growth
Structural reforms to raise potential growth. This can be accomplished through investments in human
capital, greater labor force participation by female, and in the formal sector, and increased global value
chain integration. Lifting labor market barriers for women are needed to increase the mobility and flexibility
of workforce. Reforms should create new opportunities for female workers to participate in the labor force
and introduce greater flexibility in labor markets. Measures to counter high youth unemployment would
have a large pay-off over time. Integration in global value chains has been associated with higher growth
in other regions. Bangladesh should be able to leverage its low-cost, labor-intensive, manufacturing sectors
to this end. Investment in human capital will help raise potential growth and productivity as the country
shifts from basic manufacturing to more innovative, knowledge-based industries. Improvements in the
formal education system and other training programs will be needed to prepare workers for jobs in the
modern manufacturing and services industries. While access to basic education is generally adequate,
quality is a major concern and access to higher levels of education remain low compared to the East Asian
and Pacific countries. Greater workplace based vocational training can help build relevant skills in an
economy that is getting bigger. Easing entry restrictions in the product and services markets and regulatory
burdens would encourage investment and growth in export-oriented sectors.
Regulatory reforms to promote household enterprises in retail and wholesale trades. This can unlock
the potential of small- and medium-size enterprises. Appropriate reforms would reduce the number of
permits (and the associated delays) required to start and operate a business. For example, compared to an
average of 103 days in EMDEs, connecting to electricity can take 429 days in Bangladesh. In addition,
lower collateral requirements would improve access to finance and decrease the cost of credit for small
businesses. Under the right conditions, small and medium-sized firms can be major creators of jobs. Over
two-thirds of the population in Bangladesh still resides in rural areas. Reforms to raise agricultural
productivity and rural incomes, therefore, have a major role to play in poverty alleviation. Increased access
to irrigation, use of high-yield varieties, and improved market access could boost productivity. Encouraging
diversification through labor-intensive agri-business activities such as food processing, and fostering
greater value added in agricultural production will create job opportunities, and lessen incentive to move to
already congested cities.
A Road Map for Improving Women’s Labour Force Outcomes Gender equality is about rights, opportunities, treatment and obligations. It is not about measuring
outcomes. From an employment perspective, it means equal access to healthcare, education, professions
and occupations, opportunities for career advancement, and equal legal rights. Gender inequality deprives

71
national economies of women’s talents, reduces the productive potential of the labor force, constrains
consumption, diminishes tax yields and curtails the national and personal benefits of investment in female
education by forcing women into professions and occupations that make less than full use of their skills and
capabilities. The government, business and civil society in Bangladesh should consider taking the following
practical steps to promote gender equality in labor markets.
Reduce the prevalence of early marriage. Unraveling traditions like dowry and child marriage (especially
when they serve as survival mechanisms for poor families) is a difficult undertaking, requiring multi-faceted
and persistent interventions across actors (e.g., public, private and NGOs). Investments in the reduction of
early marriage are vital to improving health of mothers and the next generation of the labor force to ensure
worker productivity is ensured to meet the demands of higher quality jobs of the future. A plethora of
practitioners in the NGO sector have been doggedly addressing this issue for decades, slowly making a dent
by raising the median age of marriage in small increments. Speeding up this progress might require the
following actions:
Conduct a thorough stocktaking, of existing programs on child marriage (especially evaluated
programs) to determine what approaches have been effective and to better harmonize efforts across
organizations, which tend to work in isolation from each other and may be duplicating efforts.
Expand successful programs to scale through government-sponsored programs and by using
government infrastructure, such as systems established in the education and/or health sectors.
Build on what works by exploring possibilities for complementary interventions in conditional cash
transfer programs that aim to improve rates of enrollment among boys as well as girls—not only to
keep girls in school, but to also ensure that boys’ educational attainments keep pace with those of
girls
Improve and enforce laws against child marriage and dowry; if legal prohibitions against the use
of dowry are unlikely to be effective, government and NGO actors will need to consider ways to
make these practices less socially acceptable, such as through information campaigns operating
through primary schools and local government and, in particular, enlisting local religious leaders.
Role of law must not be undermined. Child marriage has been illegal in Bangladesh since the adoption
of the Child Marriage Restraint Act of 1929. However, the law had been poorly enforced and the
punishment – up to one month in jail and/or a fine of up to Tk 1,000 ($13) – can hardly serve as a deterrent.
While elements of the new law recently ratified in the parliament– stiffer punishments and better law
enforcement – are long overdue steps in the right direction, allowing marriage under 18 in “special cases”
is not so. It risks worsening an already dire situation. The Government is concerned that pregnant adolescent
girls, particularly in rural areas, are ostracized by their communities if they cannot marry. Although the
intention is well-placed, marriage does not protect young girls and can hinder their aspirations and potential
as individuals (see Box-5). Research consistently shows that child marriage goes hand in hand with
dropping out of school, losing out on job opportunities, and experiencing domestic violence. What is needed
is to work with families and communities to ensure that girls stay in school, have access to the information
they need to take control of their own bodies, and thrive. In the past four years alone, 12 governments have
made legal changes to raise the age of marriage. Bangladesh’s neighbor, Nepal, increased the age of
marriage to 20 as part of a national strategy to end child marriage. Their strategy focuses on ensuring quality
education for girls, working with families and communities (including men and boys) to change mentalities,
and ensuring access to government services. South Asia as a whole has adopted a regional plan of action to
address child marriage as well as the Kathmandu Declaration laying out 12 concrete steps that governments

72
can take to strengthen their laws and policies. Bangladesh endorsed both. Allowing girls under the age of 18 to marry in “special cases” is not the right solution for ending child marriage.
Box 5: The Critical Role of ID66
When little, Rubi had been denied access to primary school because her parents hadn’t registered her at birth. Rubi’s
mother got her daughter a birth certificate, and with that, she was admitted to school, a place where she thrived. At
15, smart, ambitious Rubi did not want to get married. So she found advocates in her teachers and Plan International,
a child rights organization. With their support, Rubi went to the Union Council Office where the chairman informed
her parents about the legal ramifications of child marriage. She was not old enough and her birth certificate proved
it. She was underage. So Rubi went back to school and on to graduate at 18.
Rubi’s story highlights the importance of a well-functioning marriage registry combined with laws that prevent
child marriage. In Bangladesh, law mandates producing a birth certificate to get married. In 2012, legal precedent
established that marriage registrars are legally bound to stop child marriages.
The causes of child marriage are multifaceted and complex—including poverty, culture, gender and social norms,
as well as gaps in laws and enforcement. A new report by the World Bank’s Identification for Development (ID4D)
Program, The Role of Identification in Ending Child Marriage, highlights how official IDs and marriage registration
can help; using data from 106 countries. The study found child marriage rates were low where birth registration
rates were high on average.
Distance, cost, and burdensome laws and regulations often create barriers. Household surveys in Indonesia reveal
a strong correlation between the lack of a birth certificate and child marriage. Parents fail to obtain birth certificates
for their children primarily because of the difficulty and cost. Since 2014, the government of Indonesia has
implemented several measures to break these barriers. They have removed fees, introduced mobile identity services
in the villages, and linked identification services to mother and child health services.
As of 2014, child marriage was prohibited in 147 out of the 173 economies covered by Women, Business and the
Law.67 But many countries need better laws to protect girls. In 16 of the 173 countries, the minimum age of marriage
for girls is less than 18 years old. Of these, 162 countries allow exceptions, and customary or religious laws can be
used to override civil law.
Legal reform is not enough. Twenty-one of the 25 countries with the highest rates of child marriage have legislation
that prohibits it. Pursuing universal official identification is unlikely to have an impact on child marriage rates
unless it is embedded in broader efforts to end child marriage.
Successful programs to prevent child marriage include improving girls’ access to secondary school, combining
cash transfers with incentives to keep girls in school, and implementing programs linked to training and economic
opportunities. Mobilizing communities to support these initiatives is critical. More and more young women, like
Rubi, are speaking out and leading the momentum for change.
Strengthen girls’ early orientation to career development and reduce barriers to women’s
participation in paid work, such as gaps in child care provision. Support in this area will require
attention to both enhanced career orientation in the early years at home and in the community, as well as
support for investments to reduce barriers to women’s paid work, such as expanded provision of child care.
Specifically, this can comprise of the following interventions:
Community campaigns and outreach to parents and teachers regarding girls’ skills acquisition and
employment.
66 Based on Lucia Hanmer’s (Lead Economist in Gender and Development at the World Bank) blog titled
“Underage with an ID to prove it”, http://blogs.worldbank.org/voices/underage-id-prove-it 67 Women, Business and the Law is a World Bank Group product that collects data on laws and regulations
constraining women's entrepreneurship and employment.

73
Improved access to child care through short term measures (e.g., using Bangladesh’s expanding
program of early childhood development centers, which can provide child care without the stigma
associated with purely child care facilities) and long-term campaigns (i.e., expanding the market
for, and acceptability of child care service through, e.g., media tie-ins to promote images of working
women and children in daycare).
Improved public transport safety for women, and partnerships with private employers to encourage
firm-specific transport for female workers.
Expanded housing stock for female workforce, including with firm incentives, as well as housing
in town areas for female migrant workers and other working women that are leased at affordable
rates.
Improve jobs orientation focus of education providers and expand provision of vocational training
and job matching services (Box 6). Improving the jobs orientation focus and provision of vocational and
employment services in educational and community settings would help to reduce educational and
occupational streaming by gender. Such efforts will also bolster expanding active labor market policies in
Bangladesh focused on women through skills development, as well as enhancement of job information
services and job matching. Specific interventions could include: (1) Mentoring, peer-group support and
Box 6: NARI gives a break
The government’s IDA-assisted Northern Areas Reduction-of-Poverty
Initiative (NARI) project attempts to empower poor and vulnerable
women economically. The project addresses the key barriers to women’s
entry to labor force by providing three months training; secure and free
housing during the training period, food; job placement service, along with
a monthly stipend of Tk 800. The pilot project not only provides technical,
but also life skills training. Apart from tackling sexual harassment, the
training extends to teaching aspiring working women how to negotiate,
adjust to urban life, maintain bank account and most importantly, realizing
their aspirations to be the bread winner of their family.
The project conducts an Information, Education and Communication
(IEC) campaign targeting different societal groups who are critical in the
project’s endeavor. These include: parents, guardians, potential trainees
(young women aged 18-26, with class 5 education), community elders,
influencers, local government officials, school teacher, and others, who
are potential barriers to these young girls’ economic empowerment.
Approximately 1000 girls have been trained and certified successfully so
far. While jobs have been made available for all of them, about 70 percent
have joined. The trainees have been placed in reputable factories at levels
higher than entry level apprentices and helpers (some even as quality
controllers); while others returned home to buy a sewing machine with their stipend money and start their own
business.
Success is never achieved without a few challenges. During this whole period, many trainees were taken back by
relatives because it was against the social norms. Some were taken back before they even started their training. The
lessons learnt from these hiccups is that it takes a protracted effort for any organization to build the trust amongst
local communities, especially in remote and conservative areas (where trafficking is higher compared to other
areas), to convince multiple layers of stakeholders to allow a young girl to move to a distant training center
unaccompanied by family.

74
internships; (2) Expansion of industry-linked internships and school-based business incubator and exposure
programs for female students at the lower secondary school level; (3) Improving the jobs-orientation focus
of education providers and curriculum; (4) Enhanced job information and job placement services in school
and community settings; (5) Expanded TVET program and strengthening of national vocational
qualification systems, with country-wide accreditation of providers; (6) One-stop-shop job centers
coordinating job vacancy and TVET information and services, while providing peer group counseling for
adult job seekers.
Ensure gender equity in labor legislation and foster non-discriminatory workplace environments.
Expanding women’s LFP in Bangladesh also requires enhanced review and enforcement of labor law,
maternity leave, and anti-harassment measures—especially related to leave provisions in the private sector
and greater insistence on enforcement of provisions in the informal private sector in particular.
Recommended activities here include: (1) Review of labor law for clauses that restrict women’s rights to
paid employment; (2) Expanding application of maternity leave to include enforcement in the private sector;
(3) Enhancing safety regulation and labor monitoring audits of the workplace, and sector-specific
approaches such as promotion of child-safe tourism.
Demand side interventions have demonstrated significant promise. The garment industry has played a
key role in the remarkable progress Bangladesh has made in improving women’s lives over the past
decades. Fertility has dropped and woman’s average age at marriage has risen. Bangladesh attained gender
parity in school enrollment fifteen years before the Millennium Development Goals (MDG) deadline for
achieving this outcome. An approximate back-of-the-envelope calculation to infer how much of the gains
in girls’ enrollment nationwide can be attributed to the remarkable rise in garment exports finds that in
villages within commuting distance to garment factories, exposure to garment jobs led to a 38.6 percentage
point increase in school enrollment rates and roughly 14.8 percentage points of the national gain in girls’
enrollment could be attributed to the growth in the garment industry. These results suggest that the garment
industry was an important source of nationwide school enrollment growth. Education policy in developing
countries is closely tied to trade policy or industrial policy, and enrollments strongly respond to the arrival
of jobs, especially if these jobs reward education. The manufacturing growth also improves welfare for
young women, as they are able to avoid early marriage and childbirth, which have adverse intergenerational
consequences. Girls exposed to the garment sector delay marriage and childbirth by enrolling in school
after jobs rewarding literacy and numeracy arrive, and older girls become more likely to be employed
outside the home in proximate villages. The demand for education generated through manufacturing growth
appears to have a much larger effect on female educational attainment compared to a large-scale
government conditional cash transfer program to encourage female schooling.68
68 Rachel Heath A. and Mushfiq Mobarak, Manufacturing Growth and the Lives of Bangladeshi Women, Working
Paper 20383, http://www.nber.org/papers/w20383, National Bureau of Economic Research, August 2014.

75
Appendix
Appendix Table 1: Bangladesh Macroeconomic Indicators
Description FY09 FY10 FY11 FY12 FY13 FY14 FY15 FY16
Growth Rates (%)
GDP Growth 5.0 5.6 6.5 6.5 6.0 6.1 6.6 7.1
GDP Growth Per Capita 3.9 4.4 5.3 5.3 4.8 4.8 5.4 5.9
Per Capita GDP (current US$) 683.6 760.1 838.3 859.2 954.8 1086.8 1212.2 1358.9
Per Capita GNI (current US$) 737.8 821.7 904.7 931.9 1031.6 1159.2 1290.9 1437.1
Per Capita GNI Atlas Method
(US$) 710.0 780.0 870.0 950.0 1010.0 1080.0 1190.0 1408.7
Inflation (%)
Rate of Inflation (CPI, %) (year on
year) 7.6 6.8 10.9 8.7 6.8 7.3 6.4 5.9
Inflation (GDP deflator) 6.8 7.1 7.9 8.2 7.2 5.7 5.9 6.7
Saving & Investment (% of
GDP)
Gross Domestic Saving 20.3 20.8 20.6 21.2 22.0 22.1 22.2 25.0
Gross National Saving 28.6 29.4 28.9 29.9 30.5 29.2 29.0 30.8
Private Investment 21.9 21.6 22.2 22.5 21.7 22.0 22.1 23.0
Of which: FDI 0.9 0.7 0.6 0.9 1.2 0.8 0.9 0.9
Public Investment 4.3 4.7 5.3 5.8 6.6 6.6 6.8 6.7
Central Govt. Budget (% of
GDP)
Total Revenue 9.1 9.5 10.2 10.9 10.7 10.4 9.6 9.9
Total Expenditure 12.5 12.7 14.0 14.4 14.6 14.0 13.5 13.0
Overall Budget Deficit 3.4 3.2 3.9 3.6 3.8 3.6 3.9 3.1
Total Public Debt 36.6 35.2 34.3 33.0 32.3 31.9 31.5 30.6
Balance of Payments (% of
GDP)
Trade 35.0 32.6 41.2 43.0 40.1 38.4 35.0 33.0
Exports 15.2 14.1 17.6 18.0 17.7 17.2 15.7 15.1
Imports 19.8 18.6 23.6 25.0 22.4 21.2 19.3 17.9
Services & Income (net) -3.0 -2.4 -3.0 -3.4 -3.7 -3.9 -3.1 -2.4
Current Transfers 10.0 10.1 9.7 10.1 9.9 8.6 8.1 6.9
Current Account Balance
(including transfers) 2.4 3.2 0.7 -0.3 1.6 0.8 1.5 1.7
External Indicators
Total Debt as % of GDP 36.6 35.2 34.3 33.0 32.3 31.9 31.5 30.6
External Debt (US$ b.) 23.0 22.4 25.4 25.5 25.4 30.4 32.6 37.2
Ext. Debt as % of GDP 22.4 19.4 19.7 19.1 16.9 17.6 16.7 16.8
BB Gross Reserves (US$ b.) (end
of period) 7.5 10.8 10.9 10.3 15.3 21.3 25.0 30.1
BB Gross Reserves (in months of
imports) 3.7 5.4 3.9 3.3 5.5 5.8 7.0 7.9
Money and Credit
M2 Growth (%, year-on-year) 19.2 22.4 21.3 17.4 16.7 16.1 12.4 16.3
Net Domestic Asset Growth (%,
year-on-year) 17.8 19.1 25.0 18.5 11.8 10.3 10.7 14.4
Ratio of Private Sector Credit to
GDP (%) 30.9 33.9 37.2 38.7 37.7 37.8 37.9 38.7

76
Exchange Rate
Nominal Period Average
(TK/US$) 68.8 69.2 71.2 79.1 79.9 77.7 77.7 78.3
Nominal End of Period (TK/US$) 69.0 69.5 74.2 81.8 77.8 77.6 77.8 78.4
Real Effective Exchange Rate-
REER Index, 2000-01=100 (8
Currency Basket)
95.3 97.9 98.8 93.7 98.5 106.9 119.6 131.8
Memorandum Items
GDP at Current. Prices (Taka bill.) 7,050.7 7,975.4 9,158.3 10,552.0 11,989.2 13,436.7 15,158.0 17,328.6
GNI at Current. Prices (Taka bill) 7,609.7 8,621.4 9,883.4 11,445.1 12,953.5 14,332.2 16,142.0 18,326.7
GNI at Current. Prices Atlas
Method (US$ bill) 106.1 118.3 133.5 146.8 158.3 171.2 191.3 229.5
GNI at Current Prices (US$ bill) 110.6 124.6 138.8 144.7 162.1 184.4 207.8 234.1
Population (mill.)* 149.9 151.6 153.4 155.3 157.2 159.1 161.0 162.9
Human Development Index
(Value) 0.463 0.494 0.549 0.554 0.558 0.570
Source: Bangladesh Bureau of Statistics, Bangladesh Bank, Ministry of Finance, The World Bank and IMF
* Population data is from DECPG.

77
Appendix Table 2: Bangladesh Current Macro Economic Indicators
FY14 FY15 FY16 FY17 FY17 FY16
(Projection) (July-
Mar)
(July-
Mar)
GDP Growth (%) 6.1 6.6 7.1 6.8 .. ..
Inflation 7.3 6.4 5.9 5.6 5.3 2 5.6 2
Export Growth (%) 3.2 -2.8 2.2 5.0 4.0 3 9.0 3
Import Growth (%) 1.2 3.2 -7.1 6.0 10.2 4 7.0 4
Remittance Growth (%) -1.6 7.7 -2.5 -5.0 -16.9 -1.8
Current Account Balance (US$ million) 1402.0 2875.0 3706.0 530.5 -1118* 2908*
Overall Balance of Payments (US$ million) 5483.0 4373.0 5036.0 .. 2449* 3149*
Reserves (Months of Import) 5.8 7.0 7.9 .. 8.0 7.5
Exchange Rate (Taka per Dollar) 77.7 77.7 78.3 83.9 78.7 78.2
Total Revenue (% of GDP) 10.4 9.5 9.9 10.9 3.7 5 3.7 5
Total Expenditure (% of GDP) 14.0 12.8 13.0 14.9 4.0 5 3.5 5
ADP (% of GDP) 4.1 3.7 3.9 5.6 0.8 5 0.7 5
Fiscal Deficit (% of GDP) 3.6 3.3 3.1 4.0 0.3 5 0.0 5
ADP Utilization (% of ADP allocation) 94.6 91.4 91.7 .. 43.7 41.1
M2 Growth (%) 16.1 12.4 16.3 15.5 13.4* 13.1*
Growth of Credit to Public Sector (%) 8.9 -2.6 2.6 16.1 -8.8* -6.5*
Growth of Credit to Private Sector (%) 12.3 13.2 16.8 16.5 15.9* 15.1*
1 Projections are based on World Bank and government estimates 2 Base Year 2005/06, (Jul-Feb) 3 Based on data from Export Promotion Bureau, July-Mar (Growth calculated for exports in US$) 4 Based on data from Bangladesh Bank, July-Feb (Growth calculated for imports in US$) 5 July-Nov for relevant fiscal years, based on data from Ministry of Finance
* July-Feb for relevant fiscal years
All growth rates are year-on-year
Source: Bangladesh Bank, Bangladesh Bureau of Statistics, Export Promotion Bureau, Ministry of Finance and WB
staff estimate