bangor university doctor of philosophy essays on tax
TRANSCRIPT

Bangor University
DOCTOR OF PHILOSOPHY
Essays on Tax Avoidance
Pipatnarapong, Jirarat
Award date:2020
Awarding institution:Bangor University
Link to publication
General rightsCopyright and moral rights for the publications made accessible in the public portal are retained by the authors and/or other copyright ownersand it is a condition of accessing publications that users recognise and abide by the legal requirements associated with these rights.
• Users may download and print one copy of any publication from the public portal for the purpose of private study or research. • You may not further distribute the material or use it for any profit-making activity or commercial gain • You may freely distribute the URL identifying the publication in the public portal ?
Take down policyIf you believe that this document breaches copyright please contact us providing details, and we will remove access to the work immediatelyand investigate your claim.
Download date: 07. Nov. 2021

Essays on Tax Avoidance
by
Jirarat Pipatnarapong
MSc, BSc (Hons)
Thesis submitted in fulfilment of the requirement for the degree of Doctor
of Philosophy
Bangor Business School
Bangor University
September 2020

i
Declaration
Yr wyf drwy hyn yn datgan mai canlyniad fy ymchwil fy hun yw’r thesis hwn, ac eithrio lle nodir yn
wahanol. Caiff ffynonellau eraill eu cydnabod gan droednodiadau yn rhoi cyfeiriadau eglur. Nid yw
sylwedd y gwaith hwn wedi cael ei dderbyn o’r blaen ar gyfer unrhyw radd, ac nid yw’n cael ei
gyflwyno ar yr un pryd mewn ymgeisiaeth am unrhyw radd oni bai ei fod, fel y cytunwyd gan y
Brifysgol, am gymwysterau deuol cymeradwy.
I hereby declare that this thesis is the results of my own investigations, except where otherwise stated.
All other sources are acknowledged by bibliographic references. This work has not previously been
accepted in substance for any degree and is not being concurrently submitted in candidature for any
degree unless, as agreed by the University, for approved dual awards.

ii
Table of Contents
Table of Contents ...................................................................................................................... ii
List of Table ............................................................................................................................ vii
List of Figures .......................................................................................................................... ix
Acknowledgements ................................................................................................................... x
Abstract .................................................................................................................................... xi
Chapter 1 Introduction ........................................................................................................... 1
1.1. Background Information and Motivation ........................................................................ 1
1.2. Research Objectives and Research Questions ................................................................. 4
1.3. Research Methodology .................................................................................................... 6
1.4. Summary of the Key Findings ......................................................................................... 8
1.5. Contributions ................................................................................................................... 9
1.6. Structure of the Thesis ................................................................................................... 11
References ............................................................................................................................... 11
Chapter 2 Literature Review ............................................................................................... 18
2.1 Introduction .................................................................................................................... 18
2.2. Corporate Tax Avoidance .............................................................................................. 18
2.3. Theoretical Framework .................................................................................................. 22
2.4. Alternative Perspectives on Tax Avoidance .................................................................. 24
2.4.1. Economic perspective on tax avoidance .............................................................. 24
2.4.2. Ethical perspective on tax avoidance ................................................................... 27
2.5. Prior Studies on Tax avoidance ..................................................................................... 29
2.5.1. Firm characteristics .............................................................................................. 29
(a) Firm size ........................................................................................................ 30
(b) Leverage ........................................................................................................ 31
(c) Firm performance .......................................................................................... 31
(d) Capital intensity ............................................................................................. 32
(e) Research and development (R&D) ............................................................... 32

iii
2.5.2. Multinational corporations (MNCs) ..................................................................... 33
2.5.3. Incentive compensation ........................................................................................ 34
2.5.4. Governance mechanism ....................................................................................... 34
2.5.5. Institutional factors ............................................................................................... 35
(a) Characteristics of tax system ......................................................................... 35
(b) Strength of tax enforcement .......................................................................... 36
(c) Adoption of International Financial Reporting Standards (IFRS) ................ 37
2.6. The Importance of BRICS Economy ............................................................................. 37
2.7. Issues of Tax Avoidance in BRICS ............................................................................... 40
2.8. Conclusion ..................................................................................................................... 45
References ............................................................................................................................... 46
Appendix: Determinants of tax avoidance .............................................................................. 58
Chapter 3 Tax Avoidance and Corporate Social Responsibility (CSR) ........................... 60
3.1. Introduction .................................................................................................................... 60
3.2. Related Literature .......................................................................................................... 64
3.2.1. Corporate tax avoidance: An overview ................................................................ 64
3.2.2. Corporate Social Responsibility (CSR) ................................................................ 65
(a) The definition of CSR ................................................................................... 65
(b) The theoretical perspectives on CSR and its implications ............................ 66
3.2.3. Tax avoidance and CSR ....................................................................................... 70
3.3. Hypotheses Development .............................................................................................. 72
3.4. Research Design ............................................................................................................ 76
3.4.1. Data and sample description ................................................................................. 76
3.4.2. The measurement of variables .............................................................................. 76
(a) Tax avoidance ............................................................................................... 76
(b) Corporate Social Responsibility (CSR) ......................................................... 78
3.4.3. Empirical model ................................................................................................... 79
3.5. Results ............................................................................................................................ 82
3.5.1. Univariate analysis ............................................................................................... 82
(a) Descriptive statistics ...................................................................................... 82
(b) Trend of tax avoidance and CSR ................................................................... 83
3.5.2. Multivariate analysis ............................................................................................ 90

iv
(a) Tax avoidance and CSR ................................................................................ 90
(b) Robustness tests ............................................................................................. 92
(c) Additional analyses ....................................................................................... 99
3.6. Conclusion ................................................................................................................... 107
References ............................................................................................................................. 109
Appendices ............................................................................................................................ 125
Appendix 3.1: Prior literature on the relationship between tax avoidance and CSR ... 125
Appendix 3.2: Measurement used in literature to capture tax avoidance and CSR ..... 129
Appendix 3.3: Variable Definitions ............................................................................. 134
Appendix 3.4: The mean value of variables for overall and for each country ............ 135
Chapter 4 Tax Avoidance and Earnings Management.................................................... 136
4.1. Introduction .................................................................................................................. 136
4.2. Related Literature ........................................................................................................ 140
4.2.1. Earnings management: accruals-based and real-activities ................................. 140
4.2.2. Tax Avoidance and Earnings Management ........................................................ 142
(a) Tax-induced earnings management ............................................................. 142
(b) Theoretical perspective ............................................................................... 143
4.2.3. Conforming and non-conforming book-tax on earnings management .............. 145
4.2.4. Book-tax accounting conformity in BRICS ....................................................... 147
4.3. Hypotheses Development ............................................................................................ 150
4.4. Research Design .......................................................................................................... 152
4.4.1. Data and sample ................................................................................................. 152
4.4.2. The measurement of variables ............................................................................ 154
(a) Tax avoidance ............................................................................................. 154
(b) Accrual-Based Earnings Management (AEM) ........................................... 156
(c) Real-Activities Earnings Management (REM) ........................................... 158
4.4.3. Research model .................................................................................................. 160
4.5. Results .......................................................................................................................... 165
4.5.1. Univariate analysis ............................................................................................. 165
(a) Descriptive statistics .................................................................................... 165
(b) Variable correlation ..................................................................................... 172
(c) Trends of tax avoidance and earnings management .................................... 172

v
4.5.2 Multivariate analysis ........................................................................................... 175
(a) Tax avoidance and AEM versus REM ........................................................ 175
(b) Robustness tests ........................................................................................... 180
(c) Additional analysis ...................................................................................... 185
4.6. Conclusion ................................................................................................................... 187
References ............................................................................................................................. 188
Appendices ............................................................................................................................ 199
Appendix 4.1: Definitions of Variables ....................................................................... 199
Appendix 4.2: The mean value of variables ................................................................ 200
Appendix 4.3: Extended Test ....................................................................................... 201
Chapter 5 Tax Avoidance and Accounting Conservatism .............................................. 206
5.1. Introduction .................................................................................................................. 206
5.2. Related Literature ........................................................................................................ 209
5.2.1. Accounting conservatism ................................................................................... 209
(a) Contracting-based implications ................................................................... 210
(b) Non-contracting implications ...................................................................... 212
5.2.2. Conditional versus unconditional conservatism ................................................. 212
5.2.3. Institutional settings affecting conservatism in BRICS ..................................... 213
5.2.4. Tax-motivated conservatism .............................................................................. 215
5.3. Hypotheses Development ............................................................................................ 217
5.4. Research Design .......................................................................................................... 219
5.4.1. Data and sample description ............................................................................... 219
5.4.2. The measures of variables .................................................................................. 221
(a) Tax avoidance ............................................................................................. 221
(b) Accounting conservatism ............................................................................ 222
5.4.3. Research model .................................................................................................. 225
5.5. Results .......................................................................................................................... 229
5.5.1. Univariate analysis ............................................................................................. 229
(a) Trends of tax avoidance and accounting conservatism ............................... 229
(b) Descriptive statistics .................................................................................... 229
(c) Variables correlation ................................................................................... 230
5.5.2. Multivariate analysis .......................................................................................... 237

vi
(a) The effect of accounting conservatism on tax avoidance ........................... 237
(b) Robustness tests ........................................................................................... 241
(c) Additional analyses ..................................................................................... 243
5.6. Conclusion ................................................................................................................... 250
References ............................................................................................................................. 252
Appendices ............................................................................................................................ 263
Appendix 5.1: Prior studies on accounting conservatism and taxation ....................... 263
Appendix 5.2: Definitions of Variables ....................................................................... 266
Appendix 5.3: The mean value of interested variables ................................................ 267
Chapter 6 Summary and Conclusion ................................................................................ 268
6.1. Summary of the Thesis ................................................................................................ 268
6.2. Summary of Empirical Studies .................................................................................... 270
6.3. Research Implications .................................................................................................. 274
6.4. Limitations and Suggestion for Future Research ......................................................... 275
References ............................................................................................................................. 277

vii
List of Table
Chapter 2:
Table 2.1 Definitions of tax strategies ............................................................................................... 19
Table 2.2 BRICS Economic Indicators in 2018 ................................................................................. 40
Chapter 3:
Table 3.1 Sample Distribution by Country and Industry ................................................................... 77
Table 3.2 Descriptive Statistics .......................................................................................................... 84
Table 3.3 Variable Correlation ........................................................................................................... 89
Table 3.4 The Relation between Tax Avoidance and CSR ................................................................ 95
Table 3.5 Robustness Tests ................................................................................................................ 97
Table 3.6 The Relation between Tax Avoidance and CSR disclosure ............................................. 101
Table 3.7 The relation between Tax Avoidance and CSR by country ............................................. 105
Table 3.8 The effect of Big4 audit on the relation between tax avoidance and CSR ...................... 106
Table 3.9 The effect of foreign listing status on tax avoidance and CSR link ................................. 107
Chapter 4:
Table 4.1 Sample Distribution by Country and Industry ................................................................. 154
Table 4.2 Descriptive Statistics ........................................................................................................ 167
Table 4.3 Variable Correlation ......................................................................................................... 171
Table 4.4 The Relationship between Tax Avoidance and Earnings Management ........................... 178
Table 4.5 Regression results for tax avoidance and sub-sample of AEM ........................................ 182
Table 4.6 Regression results based on the ETR subsamples ............................................................ 183
Table 4.7 Tax avoidance and earnings management using 2SLS estimation .................................. 184

viii
Table 4.8 Tax avoidance and earnings management at country level .............................................. 186
Chapter 5:
Table 5.1 Sample Distribution by Country and Industry ................................................................. 220
Table 5.2 Descriptive Statistics ........................................................................................................ 233
Table 5.3 Variable Correlation ......................................................................................................... 236
Table 5.4 The Relation between Tax Avoidance and Accounting Conservatism ............................ 239
Table 5.5 Tax avoidance and accounting conservatism using alternative measures of ETRs ........ 242
Table 5.6 Tax avoidance and accounting conservatism using 2SLS estimation .............................. 245
Table 5.7 Tax avoidance and accounting conservatism at country level ......................................... 246
Table 5.8 The effect of Big4 auditor on tax induced conservatism ................................................. 248
Table 5.9 Regression results for the effect of NOL on tax induced conservatism ........................... 250

ix
List of Figures
Figure 2. 1 BRICS Population and land area ..................................................................................... 38
Figure 3.1 Trend of average ETR and CSR scores ............................................................................ 87
Figure 4.1 Trend of average tax avoidance, AEM, and REM .......................................................... 173
Figure 5.1 Trend of tax avoidance and accounting conservatism .................................................... 231

x
Acknowledgements
I would like to take this opportunity to express my sincere thanks to those who assisted me in
completing this thesis. Foremost, I would like to give special thanks to my main supervisor Prof. Aziz
Jaafar who provided me with the opportunity to pursue the next step of my career path and all supports
along the way of my journey. Without his continuous assistance and encouragement, this thesis could
not have been completed. I would also like to thank my co-supervisor, Dr. Annika Beelitz, for her
help, support, guidance and advice to improve this thesis.
I also wish to express my sincere appreciation and gratitude to my sponsor, University of the Thai
Chamber of Commerce (UTCC), for its generous financial support. I am also very grateful to all
faculty members and staff of the Bangor Business School at Bangor University and those of School
of Accountancy, UTCC for their help and support in any terms throughout my PhD journey. Without
them, many difficulties might be added to this journey.
Special thanks and appreciation go to Areerat Sura-amonrattana, my first Thai friend in Bangor, who
helped me in settling down before my journey started. My special thanks and gratitude also go to
Nutsuda Kueakaew and Jittakorn Yothakul who took me to the hospital and visited me almost every
day at the hospital when the emergency circumstance happened to me, and I was required to have the
operation.
I would like to say a heartfelt thank you to my parents for being the courage to embark on this journey
in the first place and being my all energy that drove me toward the goal. Last but not the least, my
deep appreciation goes out to my brother, my sister-in law, my nieces, and my friends in Thailand for
their continuous moral support and encouragement in numerous ways during various stages of my
PhD journey.

xi
Abstract
This thesis examines three topical, yet contentious issues linked to tax avoidance using a sample of
firms domiciled in the BRICS countries: Brazil, Russia, India, China, and South Africa. The three
issues examined in this study are: the relationship between tax avoidance and (i) corporate social
responsibility (CSR); (ii) earnings management; and (iii) accounting conservatism.
Using listed firms domiciled in BRICS countries for the period from 2008 to 2015, the first study
examines the relationship between tax avoidance and CSR. The results show that the effective tax
rate is positively associated with scores on CSR performance, suggesting that firms domiciled in
BRICS with higher CSR performance pay higher taxes at the same time. The results imply that firms
in BRICS countries are willing to accept compromise in the pursuit of shareholder profit by pursuing
a combined strategy of tax compliance and CSR engagement. This study also shows that audit
expertise plays a significant role in the effect of CSR on the level of tax paid. Moreover, the findings
are robust to different approaches, including the use of alternative measures of tax avoidance and the
level of CSR performance, as well as using the 2SLS model to mitigate the endogeneity issues.
The second study investigates the association between tax avoidance and the degree of earnings
management. While most prior studies focus only on discretionary accruals, this study employs both
accruals-based and real-activities techniques as proxies for earnings management. The results show a
strong and positive relationship between tax avoidance and accruals-based earnings management.
However, the relationship between tax avoidance and real-activity earnings management results is in
the opposite direction. These results suggest that nonconformity between financial accounting
standards and tax rules allows managers to make discretion only on accruals to manage book income
upwards and taxable income downwards in the same reporting period. The findings are robust to
different alternative analyses including a different level of earnings management, a different level of
tax avoidance, and endogeneity concerns.
The third study investigates the relation between tax avoidance and the degree of accounting
conservatism, where conservatism refers to the delay in income recognition in the financial report.
Specifically, the primary objective is to examine whether firms employ conservative accounting

xii
either through conditional conservatism or unconditional conservatism in reducing tax liability. Using
a dataset of listed firms domiciled in BRICS during the period 2006–2018, the results show that
conditional conservatism is positively and significantly associated with tax avoidance. In contrast,
unconditional conservatism is negatively and significantly associated with tax avoidance. These
findings suggest that the two forms of conservatism play a distinct role in tax incentives.
This thesis provides important insights for policymakers that the inclusion of responsible tax payment
as part of a global CSR agenda may motivate firms to align their behaviours with respect to tax
payment. Moreover, this thesis recommends to regulatory agencies that the high level of accrual-
based earnings management and the high level of conditional conservative accounting could indicate
tax avoidance engagement. Hence, it is vital for relevant parties to take into account the effects of tax
avoidance when drafting new and updating old accounting standards. Finally, analysts and investors
who are interested in firms’ tax avoidance activities and use the accounting numbers to evaluate the
extent of tax avoidance when making investment decisions to adjust their portfolios should also take
into consideration the effects of earnings management and accounting conservatism.

Chapter 1 Introduction
Introduction
1.1. Background Information and Motivation
The issue of corporate tax avoidance itself is not new. What is new is the attention of policymakers
and other stakeholders who have been attempting to mitigate opportunities for tax avoidance schemes
by business enterprises. Given that tax revenue is the lifeblood of every jurisdiction (Christensen &
Murphy, 2004), reduction in tax revenue due to tax avoidance has adverse effects on the budgetary
revenue to maintain public services (Avi-Yonah, 2006). Due to these potential issues, a wave of
reactions arises against the practice of tax avoidance around the world. One of these is the Base
Erosion and Profit Shifting (BEPS) Project launched by the Organisation for Economic Co-operation
and Development (OECD) and G20 countries in 2015. In particular, the OECD/G20 BEPS Project
has been created to tackle artificial profit shifting conducted by multinationals in moving their profits
from higher-tax jurisdictions to lower-tax jurisdictions. Currently, over 135 countries and
jurisdictions are collaborating through a package of fifteen actions and related solutions to improve
the coherence of international tax rules and ensure the transparency of tax environments across
countries and jurisdictions.1
As companies could potentially relocate their headquarters and operations to jurisdictions that impose
the lowest taxes, the consequences do not affect only a particular country but also represent a global
economic problem due to significant tax losses worldwide. Crivelli et al. (2016) report that $650
billion have been lost globally through tax avoidance strategies across the period from 1980 to 2013
for various countries. Similarly, Cobham & Janský (2018) indicate a more conservative global
revenue loss $500 billion from similar tax avoidance activities. More recently, the Financial Secrecy
Index (FSI) (2020) complied by Tax Justice Network researchers show a staggering loss of $21 to
$32 trillion as a result of private financial wealth located in untaxed or lightly taxed in tax havens
1 https://www.oecd.org/tax/beps/

2
around the world during 2002 to 2010.2 Empirically, Clausing (2016) finds that profit shifting
executed by corporations headquartered in the U.S. during 1983 to 2012 causes each host country to
lost tax revenues between $77 billion and $111 billion, and the value of tax losses has substantially
increased over time.
Relevant stakeholders (e.g., tax authorities, government, social activists) focus more attention on tax
avoidance issues given that they have become more ubiquitous for business corporations in recent
years. For example, Starbucks and Apple paid only 1% ETR in the Netherlands and Ireland in 2011,
and Apple’s global ETR was only 9.8% (Schimanski, 2018). Recently, in 2018, Amazon made an
$11.2 billion profit while Netflix posted its largest ever profit of $845 million; however, both paid no
federal tax (The Guardian, 2019). While most studies on tax avoidance investigate the issue of tax
avoidance in the context of developed economies, limited prior works highlight higher losses due to
tax avoidance in less developed countries. For example, Besley & Persson (2014) demonstrate that
while high-income countries are able to collect taxes of around 40% of their GDP, countries with
lower income can generally only collect between 10-20% of their GDP.
According to MSCI Market Classification Framework, an emerging market comprises some
characteristics of a developed market but does not fully meet its standards.3 In other words, although
emerging countries are comparable with developed markets in term of economy, many other factors
and criteria that make emerging countries different from developed markets, e.g., social norm,
political environment, infrastructure, legal system, population (Grewal & Lilien, 2015). More
specifically, Kvint (2009) defines an emerging market country as “a society transitioning from a
centralised to a free-market-oriented-economy, with increasing economic freedom, gradual
integration with the Global Marketplace and with other members of the GEM (Global Emerging
Market), an expanding middle class, improving standards of living, social stability and tolerance, as
well as an increase in cooperation with multilateral institution”. As the emerging markets’ GDPs are
estimated to permanently surpass that of all developed markets by 2035 (Wilson & Purushothaman,
2003), they become economically stronger and more economically important. As such, emerging
economies should to make their markets transparent and trustable by providing comparable and
2 https://fsi.taxjustice.net/en/
3 file:///C:/Users/abp6dc/Downloads/MSCI_Market_Classification_Framework.pdf

3
relevant information. Through this lens, investors would be more confident when making decisions
on their investments (Meser, Veith, & Zimmermann, 2015).
Therefore, this thesis posits that investigating tax avoidance in emerging economies may gain new
knowledge and add to the extant literature on tax avoidance in a different context as compared to
developed economies. This thesis focuses on BRICS (Brazil, Russia, India, China, and South Africa)
as a representative sample of advanced emerging economies. BRICS currently accounts for nearly a
quarter of the global economy and contribute more than half to the global economic growth (IMF,
2018), accounting for about 29% of the world’s population, 23% of the world’s land area, and
about 24% of the GDP (the World Bank database, 2019). BRICS also plays a politically important
role especially with regard to the institutions and practices of international political economy, and
they have the most discernible impact on changes in the existing global governance architectures
(Roberts & Armijo, 2014). Therefore, losing revenues from tax avoidance practised in BRICS would
have an adverse impact not only each BRICS member but also the global economic development.
Given tax avoidance issues are under-examined in emerging, the current study attempts to fill the gap
in the extant literature by focusing on the BRICS countries.
As corporate tax avoidance could be accomplished by creating legal loopholes through recording
complicated transactions, the scope of this study is decided based on these characteristics, i.e. the
legal practice and the difficulty of detection. Given that tax avoidance is undesirable corporate
conduct, which is not illegal (Guenther et al., 2013; Slemrod & Yitzhaki, 2002), it is difficult to
enforce hard laws4 to tackle this corporate behaviour. Therefore, linking soft laws5 to tax avoidance
is necessary because soft laws allow society to put pressure on firms to comply with their corporate
responsibility to pay taxes in order for them to be perceived as legitimate. As CSR is considered a
form of soft law (Jackson 2010; Vogel 2005) that emphasises a firm's social commitment to various
stakeholders, it is theoretically and practically linked to the corporate practice of tax avoidance
(Knuutinen, 2014), and the public has called on firms to pay their fair share of tax as part of their
CSR (Huseynov & Klamm, 2012). The vagueness of tax avoidance makes it difficult for stakeholders
4 Hard law is a foundation of any functioning tax system that can bring standards to all firms operating under the tax
system as it works through sanctions and determination of clarity (Nov, 2006). Therefore, it cannot be rejected that hard
law allows tax system to perform in a more efficient way.
5 Examples of soft laws are private monitoring mechanisms or agreements that embody norms, NGO legislation, and
governmental policy statements (Sheppard, 2014).
4
to detect. Determining other corporate behaviours may also help to detect the level of tax avoidance.
Engaging in earnings management and using accounting conservatism are well-known corporate
behaviours which are closely linked to the practice of tax avoidance as its incentive. Therefore,
earnings management and accounting conservatism are logical and compelling corporate behaviours
for exploring the level of tax avoidance.
1.2. Research Objectives and Research Questions
Corporate tax avoidance is traditionally viewed as a mechanism to maximize profit by reducing tax
liabilities (Hanlon & Heitzman, 2010; Preuss, 2010). Prior research has documented that tax
incentives play an important role in firms’ behaviours, such as earnings management (e.g., Desai &
Dharmapala, 2009; Shane & Stock, 2006; Sundvik, 2017; Taylor & Richardson, 2014; Wong, Lo, &
Firth, 2015), corporate social responsibility (CSR) (e.g., Lanis & Richardson, 2012, 2013, 2015;
Preuss, 2010, 2012), and profit shifting (e.g., Bartelsman & Beetsma, 2000; Fuest & Riedel, 2012;
Janský & Prats, 2015; Omar & Zolkaflil, 2015). However, as mentioned above, these studies have
focused mainly on developed countries, leaving the issue of tax avoidance in emerging countries is
under-examined. Therefore, this thesis aims to fill this gap in literature by examining the relationship
between tax avoidance and CSR, earnings management, and accounting conservatism, respectively,
in emerging countries, focusing on a sample from BRICS. More specifically, using a dataset of listed
firms domiciled in BRICS countries, the objectives of this thesis are to empirically investigate:
o the link between CSR and the level of tax avoidance.
o the link between earnings management and the level of tax avoidance
o the link between accounting conservatism and the level of tax avoidance
With respect to the first issue examined in this thesis, the association between tax avoidance and CSR,
given that tax revenue is an integral part of funds to provide public goods, losing revenue through tax
avoidance would have adverse effects on society. While tax avoidance aims to maximise
shareholders’ wealth and enables corporations to compete in the markets by reporting higher profits
to investors, it is costly to social welfare by eroding the smooth functioning of the state to provide
public goods, which affects the existence of society (Avi-Yonah, 2006). CSR captures the idea that,
beyond legal compliance, corporations need to operate in the interest of society at large (Carroll,
1979). Reporting higher profits by reducing tax expenses is considered as not paying a fair share of
tax, and a corporation may be seen as socially irresponsible (Hoi et al., 2013; Huseynov & Klamm,
2012). Therefore, the first study is motivated by the growing debate on whether responsible tax

5
payment should be part of a firm’s CSR strategy (Avi-Yonah, 2014; Desai & Dharmapala, 2006;
Dowling, 2014; Sikka, 2010). In order to achieve the first objective, i.e., to investigate whether CSR
is linked to the level of tax avoidance, the main research question is stated as:
RQ1: Is firms’ CSR engagement associated with the levels of tax avoidance?
In particular, the current study investigates the link between tax avoidance and CSR in light of
whether CSR activities are undertaken to conceal firms’ misconduct of tax avoidance, or whether
such activities are implemented by taking into consideration for social well-being.
The second study investigates the link between tax avoidance and earnings management. It is argued
that firms manage earnings to save tax because tax calculations are based on accounting numbers
(Monem, 2003). Firms may engage in tax avoidance because a proportion of their profits is paid to
the tax authority through corporate income tax. This requirement creates conflicts between contracts
a firm has with the state government and with the capital market. While pressure from the capital
market encourages firms to report high book income, firms do not simultaneously favour to pay more
tax due to such higher book income. In other words, to meet market expectations, managers need to
present high profits, but higher profits result in higher taxes. Managers may thus employ earnings
management to minimize the corporate tax obligation, and to increase corporate net income at the
same time. In doing so, firms may engage in tax avoidance which involves complicated and
confidential corporate structures and transactions (Chen & Chu, 2005). That is, managers likely have
private information and know-how to use available legal channels to reduce the effective tax rate
(ETR) (Crocker & Slemrod, 2005). Thus, the second study is driven by the question of whether tax
avoidance demands practices that can be bundled with earnings management. In order to achieve the
second objective, i.e., to investigate whether earnings management is linked to the level of tax
avoidance, the research question is stated as follows:
RQ2: Is firm’s level of earnings management associated with the levels of tax avoidance?
As there are different forms of earnings management, i.e., accruals-based earnings management
(AEM) and real-activity earnings management (REM), the study attempts to answer the above
question using both AEM and REM mechanisms in avoiding taxes.
The third study examines the link between tax avoidance and accounting conservatism. Specifically,
the study aims to answer the question of whether firms adopt conservative accounting methods to
reduce their tax liabilities. Accounting conservatism is an accounting principle that requires firms to

6
be timelier in recognizing losses than gains. That is, firms would lower net assets and profits in
response to bad news, but do not increase net assets and profits in response to good news. This is
because gains require higher standards of verification to be recorded in book income than losses
(Basu, 1997; Watts, 2003a, 2003b). By conservatively delaying the recognition of book income,
taxable income is simultaneously shifted, and tax payments are also deferred into the future
(Bornemann, 2018). In other words, while the exercise of accounting conservatism helps to provide
useful information to stakeholders, firms simultaneously shift taxable income into the future (by
delaying the recognition of revenues) and/or defer tax payments (by accelerating the recognition of
expenses). Therefore, tax savings may be an incentive for firms to increase accounting conservatism
to minimize tax liability in the current period. In order to achieve the third objective, i.e., to investigate
whether accounting conservatism is linked the level of tax avoidance, the research question is stated
as follows:
RQ3: Is a firm’s level of accounting conservatism associated with the levels of tax avoidance?
Accounting conservatism can be classified as either conditional or unconditional. Prior studies report
mixed results on whether conditional conservatism, or unconditional conservatism, or both are more
likely to be related to tax burdens. This study investigates tax-reducing effects of both the conditional
and unconditional forms of accounting conservatism in order to answer the above question.
1.3. Research Methodology
This thesis employs a deductive research approach by developing hypotheses based on the objectives
and existing theories and empirical evidence, and the hypotheses are tested through statistical models.
In the context of this thesis, the tax avoidance proxies capture all tax avoidance activities, i.e., both
legal and illegal transactions. In other words, the current study does not attempt to distinguish between
legal avoidance activities and illegal tax evasion activities. Therefore, the tax avoidance measure
employed focuses on the total amount of tax avoided, rather than on the specific actions. Prior
research claims that the ETR, specifically the GAAP-based ETR, captures a broad range of tax
avoidance activities (Badertscher, Katz, & Rego, 2013; Chen et al., 2010; Gaertner, 2014; Huseynov
& Klamm, 2012; Laguir, Staglianò, & Elbaz, 2015; Lanis & Richardson, 2012; Phillips, 2003;
Steijvers & Niskanen, 2014). Therefore, the GAAP-based ETR (hereafter ETR), calculated by
dividing income tax by pre-tax book income, is chosen as the main measure of corporate tax
avoidance in all three studies.

7
In analysing the relationship between tax avoidance and CSR, the study uses CSR dataset collected
from the Thomson Reuter’s ASSET4 database from 2008 to 2015. The CSR measure is estimated as
the average of the scores of the social and environmental pillars (Naughton et al., 2014).6 Additional
tests are also conducted to confirm interpretations of the primary results. First, two alternative
measures of CSR are used, namely, the country-industry adjusted CSR mean (McWilliams & Siegel,
2001) and a high-low separated group (Lanis & Richardson, 2012). Second, two alternative measures
of ETR are used, namely one-year ETR as calculated by dividing income tax by operating cash flows
(Jaafar & Thornton, 2015; Karampinis & Hevas, 2013) and five-year ETR (Dyreng et al., 2008).
Lastly, industry-mean scores of CSR (Kim et al., 2014) are used as instrumental variables in a
regression model estimated with the Two-Stage Least Square (2SLS) method to alleviate any bias
caused from endogeneity problems.
The second study investigates the relationship between tax avoidance and earnings management, and
the dataset is sourced from Worldscope retrieved through the Datastream Thomson Reuters database.
Earnings management is proxied through both AEM measures and REM measures. With respect to
estimation using discretionary accruals, this study uses four approaches: i) the Jones model; ii) the
modified-Jones model; iii) the performance-matched Jones model, and iv) the performance-matched
modified-Jones model. All discretionary accrual-based models are estimated for each country,
industry, and year combination (Bartov et al., 2000; Koh, 2003). Furthermore, this study conducts
some additional tests, including estimating tax avoidance with an AEM subsample and employing
estimations using 2SLS to mitigate endogeneity problems.
The third study investigates the relationship between tax avoidance and accounting conservatism for
the period 2006-2018 from WorldScope retrieved through the Datastream Thomson Reuters database.
In assessing the link between firms’ level of tax avoidance and accounting conservatism, this study
uses two measures of accounting conservatism, namely (i) the C-score developed by Khan & Watts
(2009) to proxy for conditional conservatism and: (ii) negative accruals developed by Givoly & Hayn
(2000) to proxy for unconditional conservatism. The study also investigates the association between
tax avoidance and accounting conservatism at the country level by re-estimating the main regression
model with samples for each country separately. Additionally, this study tests the effect of having a
Big4 auditor and a net operating loss (NOL) on the relationship between tax avoidance and accounting
6 Thomson Reuter’s Asset4 contains scores for four pillars: governance score, economic score, environmental score, and
social score. This study excludes the governance and economic scores, as they are not related to the objective of the study.
8
conservatism. To eliminate any alternative interpretations of results, robustness tests are carried out
using alternative measures of ETRs, analysing a subsample that excludes China and India as the main
results may be driven by the fact that the majority of sample companies are domiciled in these two
countries, and running estimations using 2SLS to deal with endogeneity problems.
1.4. Summary of the Key Findings
The main findings of the current study are as follows:
The first study empirically investigates the link between CSR and the degree of tax avoidance. The
main findings show that firms with higher level of CSR are less likely to engage in tax avoidance.
This can be theoretically explained under the perspectives of corporate culture and normative
stakeholder that if a firm strongly believes in ‘appropriate and ethical’ corporate behaviour, then all
the decisions undertaken by the firm should reflect such a right shared belief (Kreps 1996; Hermalin
2001). Therefore, firms with the strong believed culture of balancing the interests of all stakeholders
would accept compromise in the pursuit of shareholder profit by pursuing a combined strategy of tax
compliance and CSR engagement in order to satisfy stakeholders’ interests instead of shareholders’
and gain support for its continued survival (Gray et al., 1995).
In analysing the link between earnings management and tax avoidance, this thesis reports that firms
with higher level of earnings management using discretionary accruals are more likely to engage in
tax avoidance. These results support the hypothesis that firms’ managers use non-conforming
techniques to increase book incomes and decrease taxable incomes at the same time, consistent with
prior studies in the developed economies (e.g., Desai, 2002; Frank et al., 2009). Further testing the
level of conservatism, this thesis shows that firms present higher level of tax avoidance when using
conditional conservatism, rather unconditional conservatism. This positive association between tax
avoidance and conditional form of conservatism is consistent with the results in the study of Gan
(2018) finding that conditional conservatism results in reducing the tax burden and also confirms the
study of Lara, Osma, & Penalva (2009) reporting that taxation does induce not only unconditional
conservatism but also conditional conservatism.
Therefore, these results contribute to the literature by providing clear evidence on the direct link
between tax avoidance and CSR. It also extends the literature on the extent of earnings management
and accounting conservatism, affecting the level of tax avoidance in the context of BRICS emerging
markets.

9
1.5. Contributions
This thesis makes the following contributions: To the best of my knowledge, this is the first study to
empirically examine the issue of tax avoidance in the BRICS countries. In particular, in examining
tax avoidance issues, the current study offers a new setting to that of developed countries investigated
in prior literature, as BRICS countries provide different capital market characteristics and institutional
environments. Although BRICS are fast-growing economies, their regulatory mechanisms are
relatively poor, as reflected in weak law enforcement, high levels of corruption, and lack of political
accountability. These limitations may lead to more severe issues associated with tax avoidance in
BRICS. Accordingly, using listed firms domiciled in BRICS countries, this thesis extends the prior
literature on tax avoidance by providing new perspectives. What is more, it adds insights into whether
CSR, earnings management, and accounting conservatism are linked to tax avoidance in a similar
way as they are in developed economies. As BRICS are also key players in international trade and
the international tax regime (Baistrocchi, 2013), tax avoidance behaviours in BRICS need to be
explored first to better our understanding and to then investigate the impact of tax avoidance in
BRICS on international trade and the international tax regime.7 With the context of non-homogeneous
economies of BRICS, this thesis provides additional knowledge by extending studies on tax
avoidance across country contexts, which generates additional insights for policy makers on tax
avoidance in BRICS, extends research on the practice of tax avoidance in different environments, and
consequently improves investors’ decisions towards firms in the unique environment of BRICS.
The first study of this thesis is a response to prior works by Huseynov & Klamm, (2012) and Sikka
(2010) which call for more research on the link between tax avoidance and CSR. Within the context
of BRICS, prior studies have already investigated types, the nature, drivers and the scope of CSR
(e.g., Ali et al., 2018; Arrive & Feng, 2018). Extant literature has also already investigated the effect
of tax regimes in BRICS on the international tax system (e.g., Baistrocchi, 2013; Shelepov, 2017).
This study provides new insights by examining the association between tax avoidance and CSR.,
through the lenses of several theories, including legitimacy theory, stakeholder theory, reputation risk
management, organized hypocrisy, and corporate culture. More specifically, the new insights indicate
that firms in the BRICS group do not use CSR strategically as "a tool" to legitimate or manage the
risk/minimise public scrutiny from their tax avoidance behaviour. Instead, they develop a culture of
7 In the process of convergence toward, feedback to market leaders (i.e., BRICS in this thesis) offered by the global
community of tax advisors, tax scholars, and international taxpayers is needed (Baistrocchi, 2013).

10
tax compliance and CSR engagement as a complementary strategy, promising ethical conduct to
external audiences and committing to serving the interests of all stakeholders. This new evidence
would be useful for standards and regulators setters when considering CSR related regulations, and
CSR reports to include responsible tax payment as part of those regulations and reports.
Tax avoidance has been argued as schemes transferring benefits from state to shareholders through
the technique of earnings management to guarantee tax benefits and shielded them from tax
authorities (Desai & Dharmapala, 2006, 2009). While prior studies examine the association between
tax avoidance and earnings management (e,g., Badertscher et al., 2009; Desai & Dharmapala, 2009),
these studies provide inconsistent findings. Moreover, it remains largely unexplored how earnings
management influences tax avoidance in the context of BRICS, which indicates a gap in the literature.
Therefore, the second paper helps to further our understanding by providing new evidence on the
association between tax avoidance and earnings management. In particular, it demonstrates how
managers strategically use the techniques of accruals-based earnings management and real activity
earning management to deal with tax incentives. The results provide new insights showing that firms
in BRICS use a non-conforming earnings management approach to increase book income and to
reduce taxable income in the same accounting period through the discretion of accruals, not through
the alteration of real activities. This understanding would be useful for both financial standards setters
and tax authorities when considering new standards or regulations to deal with the problems of
earnings management and tax avoidance. This study also provides insights to investors (Drake et al.,
2019; Mukhlasin & Anissa, 2018) to be aware of a particular firm engaging in earnings management
might also engage in tax avoidance activities.
Another accounting practice that may be used to gain tax benefits is accounting conservatism
(Bornemann, 2018; Heltzer, 2009; Lara et al., 2009; Qiang, 2007). Existing evidence is mixed and
still inclusive about what type of accounting conservatism (the conditional or unconditional form, or
both) is more likely associated with taxation, and especially with reducing the tax liability. In
particular, while existing studies focus on an ex-ante analysis of whether high tax rate leads to more
conservatism (Bornemann, 2018), this study adopts an ex-post perspective and provides evidence of
whether employing accounting conservatism results in the reductions of tax liabilities. Therefore, the
third study expands and contributes to the literature by adding new evidence showing that firms in
BRICS use the conditional form rather than the unconditional form of conservative accounting to
reduce tax liabilities. This new evidence is important for standard setters when considering whether
conservative accounting should be emphasised in accounting standards or not, as this accounting

11
principle has both benefits and costs. That is, while firms may attempt to provide timely and useful
information to stakeholders through the use of conservative accounting, they may also simultaneously
shift taxable income into the future by delaying the recognition of revenues and/or deferring tax
payments by accelerating the recognition of expenses.
1.6. Structure of the Thesis
This thesis is organized into six chapters, as follows.
Following this chapter, Chapter two reviews and discusses extant literature on corporate tax
avoidance within the scope of this study, including definitions of tax avoidance and terminologies
widely used in the literature, theoretical frameworks underlying to the behaviour of corporate tax
avoidance, alternative perspectives on tax avoidance, factors determining corporate tax avoidance,
the importance of BRICS on the global economy, and the current tax avoidance practices in emerging
countries.
Chapters three, four, and five provide the empirical studies examining the association between (i) tax
avoidance and CSR; (ii) tax avoidance and earnings management and (iii) tax avoidance and
accounting conservatism, respectively. These three chapters are organized in the same way, i.e.,
starting with an introduction, followed by reviewing related literature, hypothesis development,
research design, results, and conclusion the main points of the study.
Chapter Six concludes the thesis by providing a summary of the thesis and related discussion, the
limitations and the suggested directions for future research.
References
Ali, S., Hussain, T., Zhang, G., & Li, B. (2018). The Implementation of Sustainable Development
Goals in “ BRICS ” Countries. Sustainability, 10(7), 2513. https://doi.org/10.3390/su10072513
Arrive, J. T., & Feng, M. (2018). Corporate social responsibility disclosure : Evidence from BRICS
nations. Corporate Social Responsibility and Environmental Management, 25(5), 920–927.
https://doi.org/10.1002/csr.1508
Avi-Yonah, R. (2014). Just Say No: Corporate Taxation and Corporate Social Responsibility. U of
Michigan Public Law Research Paper, 402, 14–010.
Avi-Yonah, R. S. (2006). Corporate Social Responsibility and Strategic Management. Journal of
Management Studies, 43, 1629–1641. https://doi.org/10.1111/j.1467-6486.2006.00655.x

12
Badertscher, B. A., Katz, S. P., & Rego, S. O. (2013). The separation of ownership and control and
corporate tax avoidance. Journal of Accounting and Economics, 56(2–3), 228–250.
https://doi.org/10.1016/j.jacceco.2013.08.005
Badertscher, B. A., Phillips, J. D., Pincus, M., & Rego, S. O. (2009). Earnings management strategies
and the trade-off between tax benefits and detection risk: To conform or not to conform?
Accounting Review, 84(1), 63–97. https://doi.org/10.2308/accr.2009.84.1.63
Baistrocchi, E. A. (2013). The international tax regime and the BRIC world: Elements for a theory.
Oxford Journal of Legal Studies, 33(4), 733–766. https://doi.org/10.1093/ojls/gqt012
Bartelsman, E. J., & Beetsma, R. (2000). Why Pay More? Corporate Tax Avoidance through Transfer
Pricing in OECD Countries. Journal of Public Economics, 87(9–10), 2225–2252.
Bartov, E., Gul, F. A., & Tsui, J. S. L. (2000). Discretionary-accruals models and audit qualification.
Journal of Accounting and E, 30(3), 421–452.
Basu, S. (1997). The Conservatism Principle and the Asymmetric Timeliness of Earnings. Journal of
Accounting and Economics, 24, 3–37. https://doi.org/10.1016/S0165-4101(97)00014-1
Besley, T., & Persson, T. (2014). Why Do Developing Countries Tax So Little? Journal of Economic
Perspectives, 28(4), 99–120. https://doi.org/10.1257/jep.28.4.99
Bornemann, T. (2018). Tax Avoidance and Accounting Conservatism. SSRN Electronic Journal.
https://doi.org/10.2139/ssrn.3114054
Carroll, A. B. (1979). Three-Dimensional Conceptual Model of Corporate Performance. The
Academy of Management Review, 4(4), 497–505.
Chen, K., & Chu, C. Y. C. (2005). Income Tax Evasion Manipulation: a Model of Corporate. The
RAND Journal of Economics, 36(1), 151–164.
Chen, S., Chen, X., Cheng, Q., & Shevlin, T. (2010). Are family firms more tax aggressive than non-
family firms? Journal of Financial Economics, 95(1), 41–61.
https://doi.org/10.1016/j.jfineco.2009.02.003
Clausing, K. A. (2016). The effect of profit shifting on the corporate tax base in the United States and
beyond. National Tax Journal, 69(4), 905–934. https://doi.org/10.17310/ntj.2016.4.09
Cobham, A., & Janský, P. (2018). Global Distribution of Revenue Loss from Corporate Tax
Avoidance: Re-estimation and Country Results. Journal of International Development, 30(2),
206–232. https://doi.org/10.1002/jid.3348
Crivelli, E., Mooij, R. De, & Keen, M. (2016). Base Erosion, Profit Shifting and Developing
Countries. FinanzArchiv: Public Finance Analysis, 72(3), 268–301.

13
Crocker, K. J., & Slemrod, J. (2005). Corporate tax evasion with agency costs. Journal of Public
Economics, 89(9–10), 1593–1610. https://doi.org/10.1016/j.jpubeco.2004.08.003
Desai, M. A. (2002). The Corporate Profit Base, Tax Sheltering Activity, and the Changing Nature
of Employee Compensation.
Desai, M. A., & Dharmapala, D. (2006). Corporate tax avoidance and high-powered incentives.
Journal of Financial Economics, 79(1), 145–179. https://doi.org/10.1016/j.jfineco.2005.02.002
Desai, M., & Dharmapala, D. (2009). Earnings management and corporate tax shelters. National Tax
Journal, 62(1), 169–186. https://doi.org/http://dx.doi.org/10.2139/ssrn.884812
Dowling, G. R. (2014). The Curious Case of Corporate Tax Avoidance: Is it Socially Irresponsible?
Journal of Business Ethics, 124(1), 173–184. https://doi.org/10.1007/s10551-013-1862-4
Drake, K. D., Lusch, S. J., & Stekelberg, J. (2019). Does Tax Risk Affect Investor Valuation of Tax
Avoidance? Journal Accounting , Auditing & Finance, 34(1), 151–176.
https://doi.org/10.1177/0148558X17692674
Dyreng, S. D., Hanlon, M., & Maydew, E. L. (2008). Long-run corporate tax avoidance. Accounting
Review, 83(1), 61–82.
Frank, M. M., Lynch, L. J., & Rego, S. O. (2009). Tax reporting aggressiveness and its relation to
aggressive financial reporting. The Accounting Review, 84(2), 467–496.
https://doi.org/10.2308/accr.2009.84.2.467
Fuest, C., & Riedel, N. (2012). Tax evasion and tax avoidance: the role of international profit shifting.
In Draining Development? Controlling flows of illicit funds from developing countries.
https://openknowledge.worldbank.org/handle/10986/2242
Gaertner, F. B. (2014). CEO after-tax compensation incentives and corporate tax avoidance.
Contemporary Accounting Research, 31(4), 1077–1102. https://doi.org/10.1111/1911-
3846.12058
Gan, Z. (2018). Conditional Conservatism and Tax Avoidance (Issue May). Erasmus University
Rotterdam.
Givoly, D., & Hayn, C. (2000). The changing time-series properties of earnings, cash flows and
accruals: Has "nancial reporting become more conservative? Journal of Accounting and
Economics, 29(3), 287–320.
Gray, R., Kouhy, R., & Lavers, S. (1995). Corporate Social and Environment Reporting: a review of
the literature and a longitudinal study of UK disclosure. Accounting, Auditing & Accountability
Journal, 8(2), 47–77.

14
Grewal, R., & Lilien, G. L. (2015). Trends in Business Markets. Customer Needs and Solutions, 2(3),
191–192. https://doi.org/10.1007/s40547-015-0052-1
Guenther, D. A., Matsunaga, S. R., & Williams, B. M. (2013). Tax Avoidance, Tax Aggressivness,
Tax Risk and Firm Risk. August.
Hanlon, M., & Heitzman, S. (2010). A review of tax research. Journal of Accounting and Economics,
50(2–3), 127–178. https://doi.org/10.1016/j.jacceco.2010.09.002
Heltzer, W. (2009). Conservatism and Book-Tax Differences. Journal of Accounting, Auditing &
Finance, 24(3), 469–504.
Hermalin, B. (2001). Economics and corporate culture. In C. L. Cooper, S. Cartwright, & P.
Christopher Earley (Eds.), The international handbook of organizational culture and climate.
Chichester: Wiley.
Hoi, C. K., Wu, Q., & Zhang, H. (2013). Is corporate social responsibility (CSR) associated with tax
avoidance? Evidence from irresponsible CSR activities. The Accounting Review, 88(6), 2025–
2059. https://doi.org/10.2308/accr-50544
Huseynov, F., & Klamm, B. K. (2012). Tax avoidance , tax management and corporate social
responsibility. Journal of Corporate Finance, 18(4), 804–827.
https://doi.org/10.1016/j.jcorpfin.2012.06.005
Jaafar, A., & Thornton, J. (2015). Tax havens and effective tax rates: An analysis of private versus
public european firms. The International Journal of Accounting, 50(4), 435–457.
https://doi.org/10.1016/j.intacc.2015.10.005
Jackson, K. T. (2010). The scandal beneath the financial crisis: Getting a view from a moral-cultural
mental model. Harvard Journal ofLaw &Public Policy, 33(2), 735–778.
Janský, P., & Prats, A. (2015). International profit-shifting out of developing countries and the role
of tax havens. Development Policy Review, 33(3), 271–292. https://doi.org/10.1111/dpr.12113
Karampinis, N. I., & Hevas, D. L. (2013). Effects of IFRS Adoption on Tax-induced Incentives for
Financial Earnings Management: Evidence from Greece. International Journal of Accounting,
48(2), 218–247. https://doi.org/10.1016/j.intacc.2013.04.003
Khan, M., & Watts, R. L. (2009). Estimation and Empirical Properties of a Firm-Year Measure of
Accounting Conservatism. Journal of Accounting and Economics, 48(2–3), 132–150.
https://doi.org/10.1016/j.jacceco.2009.08.002
Kim, Y., Li, H., & Li, S. (2014). Corporate social responsibility and stock price crash risk q. Journal
of Banking and Finance, 43, 1–13. https://doi.org/10.1016/j.jbankfin.2014.02.013
Knuutinen, R. (2014). Corporate Social Responsibility, Taxation and Aggressive Tax Planning.
Nordic Tax Journal, 1, 36–75. https://doi.org/10.1515/ntaxj-2014-0003

15
Koh, P. S. (2003). On the association between institutional ownership and aggressive corporate
earnings management in Australia. British Accounting Review, 35(2), 105–128.
https://doi.org/10.1016/S0890-8389(03)00014-3
Kreps, D. M. (1996). Corporate culture and economic theory. In J. E. Alt & K. A. Shepsle (Eds.),
Perspectives on positive political economy. Cambridge: Cambridge University Press.
Kvint, V. (2009) The Global Emerging Market: Strategic Management and Economics. Routledge,
New York, London.
Laguir, I., Staglianò, R., & Elbaz, J. (2015). Does corporate social responsibility affect corporate tax
aggressiveness? Journal of Cleaner Production, 107, 662–675.
https://doi.org/10.1016/j.jclepro.2015.05.059
Lanis, R., & Richardson, G. (2012). Corporate social responsibility and tax aggressiveness: An
empirical analysis. Journal of Accounting and Public Policy, 31(1), 86–108.
https://doi.org/10.1016/j.jaccpubpol.2011.10.006
Lanis, R., & Richardson, G. (2013). Corporate social responsibility and tax aggressiveness: a test of
legitimacy theory. Accounting, Auditing & Accountability Journal, 26(1), 75–100.
https://doi.org/10.1108/09513571311285621
Lanis, R., & Richardson, G. (2015). Is corporate social responsibility performance associated with
tax avoidance? Journal of Business Ethics, 127(2), 439–457. https://doi.org/10.1007/s10551-
014-2052-8
Lara, J. M. G., Osma, B. G., & Penalva, F. (2009). The economic determinants of conditional
conservatism. Journal of Business Finance and Accounting, 36(3–4), 336–372.
https://doi.org/10.1111/j.1468-5957.2008.02122.x
McWilliams, A., & Siegel, D. (2001). Note Corporate Social Responsibility : a Theory of the Firm
Perspective. Academy of Management Journal, 26(1), 117–127.
Meser, M., Veith, S. & Zimmermann, J. (2015). Disclosure, Enforcement, and Capital Market
Properties: A Longitudinal Analysis for Germany. Schmalenbach Bus Rev, 67, 254–288.
https://doi.org/10.1007/BF03396876
Monem, R. M. (2003). Earnings Management in Response to the Introduction of the Australian Gold
Tax. Contemporary Accounting Research, 20(4), 747–774.
Mukhlasin, M., & Anissa, N. (2018). Investor Perception of Tax Avoidance and Quality of Earnings
Information. Research Journal of Financial and Accounting, 9(12), 72–78.
Naughton, J. P., Wang, C., & Yeung, I. (2014). Are CSR expenditures affected by investor sentiment ?

16
Nov, A. (2006). The Bidding War to Attract Foreign Direct Investment: The Need for a Global
Solution. Virginia Tax Review, 25(835), 836–874.
Omar, N., & Zolkaflil, S. (2015). Profit Shifting and Earnings Management through Tax Haven
Subsidiaries: An Exploratory Analysis of Multinational Companies. Procedia Economics and
Finance, 28(April), 53–58. https://doi.org/10.1016/s2212-5671(15)01081-3
Phillips, J. D. (2003). Corporate tax-planning Effectiveness: The role of compensation-based
incentives. The Accounting Review, 78(3), 847–874.
Preuss, L. (2010). Tax avoidance and corporate social responsibility: you can’t do both, or can you?
Corporate Governance, 10(4), 365–374. https://doi.org/10.1108/14720701011069605
Preuss, L. (2012). Responsibility in Paradise? The Adoption of CSR Tools by Companies Domiciled
in Tax Havens. Journal of Business Ethics, 110, 1–14. https://doi.org/10.1007/s10551-012-
1456-6
Qiang, X. (2007). The Effects of Contracting, Litigation, Regulation, and Tax Costs on Conditional
and Unconditional Conservatism: Cross-Sectional Evidence at the Firm Level. Accounting
Review, 82(3), 759–796.
http://search.ebscohost.com/login.aspx?direct=true&db=bth&AN=25002332&lang=zh-
cn&site=ehost-live
Roberts, C., & Armijo, L. E. (2014). The Emerging Powers and Global Governance: Why the BRICS
Matter. In Handbook of Emerging Economies (Issue January, pp. 1–27).
Schimanski, C. (2018). Do multinational companies shift profits out of developing countries? How
data availability may hide the evidence (2018/52; Issue May).
Shane, P. B., & Stock, T. (2006). Efficiency in Anticipating Tax-Motivated Income Shifting Universi.
The Accounting Review, 81(1), 227–250.
Shelepov, A. (2017). Indonesia and the BRICS: Implementing the BEPS Action Plan. International
Organisations Research Journal, 12(3), 114–136. https://doi.org/10.17323/1996-7845-2017-
03-114
Sheppard, B. (2014). Norm supercompliance and the status of soft law. Buffalo Law Review, 62(4),
797–879.
Sikka, P. (2010). Smoke and mirrors : Corporate social responsibility and tax avoidance. Accounting
Forum, 34, 153–168. https://doi.org/10.1016/j.accfor.2010.05.002
Slemrod, J., & Yitzhaki, S. (2002). Tax Avoidance, Evasion, and Administration. In Handbook of
Public Economics (Issue January, pp. 1423–1470). https://doi.org/10.1016/S1573-
4420(02)80026-X

17
Steijvers, T., & Niskanen, M. (2014). Tax aggressiveness in private family firms: An agency
perspective. Journal of Family Business Strategy, 5(4), 347–357.
https://doi.org/10.1016/j.jfbs.2014.06.001
Sundvik, D. (2017). Book-tax conformity and earnings management in response to tax rate cuts.
Journal of International Accounting, Auditing and Taxation, 28, 31–42.
https://doi.org/10.1016/j.intaccaudtax.2016.12.003
Taylor, G., & Richardson, G. (2014). Incentives for corporate tax planning and reporting : Empirical
evidence from Australia. Journal of Contemporary Accounting & Economics, 10(1), 1–15.
https://doi.org/10.1016/j.jcae.2013.11.003
Watts, R. L. (2003a). Conservatism in accounting part I : Explanations and implications. Accounting
Horizons, 17(3), 207–221.
Watts, R. L. (2003b). Conservatism in Accounting Part II: Evidence and Research Opportunities.
Accounting Horizons, 17(4), 287–301.
Wilson, D., & Purushothaman, R. (2003). Dreaming with BRICs: The path to 2050. In Goldman
Sachs Economic Research Group (No. 99; Global Economics).
https://doi.org/10.4337/9781847202987.00008
Wong, R. M. K., Lo, A. W. Y., & Firth, M. (2015). Managing Discretionary Accruals and Book-Tax
Differences in Anticipation of Tax Rate Increase: Evidence from China. Journal of International
Financial Management & Accounting, 26(2), 188–222.

Chapter 2 Literature Review
Literature Review
2.1 Introduction
This chapter reviews the extant literature on corporate tax avoidance within the scope of this study.
In particular, this chapter discusses (i) definitions of tax avoidance and terminologies widely used in
the literature; (ii) theoretical frameworks underlying to the behaviour of corporate tax avoidance; (iii)
alternative perspectives on tax avoidance; (iv) factors both at the firm- and country-level determining
corporate tax avoidance; (v) the current tax avoidance practices in emerging countries and; (vi) the
importance of BRICS vis-a-vis the global economy.
2.2. Corporate Tax Avoidance
A corporate income tax (CIT) is a direct tax imposed by a jurisdiction on profits of corporations and
required to be paid to tax authorities. The amount of CIT is classified as an expense which will be
deducted from revenues when calculating net profits of firms in each accounting period. Given that
the firms’ bottom line is reduced by tax expenses, the value of firms may be also affected by the
amount of CIT that firms owe to the tax authorities. As such, firms would attempt to minimize the
amount of tax liabilities as much as possible to increase the firms’ value (Desai & Dharmapala, 2009).
This firms’ behaviour is generally referred to as corporate tax avoidance (hereafter tax avoidance).
However, several terms are used in referring to the tax reduction strategies used in the literature.
Table 2.1 presents a broad view of those terms, including tax avoidance, tax evasion, tax sheltering,
tax havens and tax aggressiveness.
The term “tax avoidance” has no universally accepted meaning, but is broadly defined as activities,
behaviours, or transactions executed within a legal framework, but alter the intent of the law it
purports to follow, in order to reduce tax liability (e.g., Bird & Davis-Nozemack, 2018; Cheng,
Huang, Li, & Stanfield, 2012; Dyreng, Hanlon, & Maydew, 2008; Hanlon & Heitzman, 2010; Lanis,
Richardson, Liu, & Mcclure, 2018; Manganaris, Spathis, & Dasilas, 2015; Payne & Raiborn, 2018).

19
In other words, tax avoidance is any actions facilitated by tax regulation loopholes to reduce the tax
burden on entities being taxed. Tax avoidance is, sometimes, used interchangeably with tax evasion,
but they are in fact different concepts. In gaining similar benefits (i.e., tax reduction), tax evasion is
illegal activities that comprise components of deception, concealment, or destruction of the nature of
transactions to reduce the actual tax liabilities (Bird & Davis-Nozemack, 2018; Payne & Raiborn,
2018; Sikka, 2010). Therefore, while tax avoidance may be an accepted element of the tax planning
process in business, tax evasion breaks the letter of the law (Payne & Raiborn, 2018).
Table 2.1 Definitions of tax strategies
Tax avoidance
Author(s) Definitions
Payne & Raiborn (2018, p. 470) The process of using legal means to reduce the amount of tax that
is owed based on enumerated provisions in the tax law.
Bird & Davis-Nozemack (2018, p.
1010)
The pursuit of transactions and structures in order to reduce tax
responsibility in a manner that is contrary to the policy or spirit of
government legislation.
Henry & Sansing (2018, p. 1043-
1044)
Anything that causes a firm’s cash taxes paid to be less than what
they would have been.
Lanis, Richardson, Liu, & Mcclure
(2018, p. 2)
The term to encompass a spectrum of what may be considered
acceptable and unacceptable tax behaviours. This range of
activities forms a tax-avoidance continuum from ordinary tax-
minimizing policies well within the boundaries of the law to the
more contentious types of tax strategies that give rise to uncertain
tax positions.
Lisowsky, Robinson, & Schmidt
(2013, p. 584)
Tax avoidance encompasses all tax positions (i.e., certain and
uncertain positions).
Hanlon & Heitzman (2010, p. 137) Strategies of tax planning to reduce explicit taxes, and if tax
avoidance represents a continuum of tax planning strategies where
something like municipal bond investments are at one end (lower
explicit tax, perfectly legal), then terms such as noncompliance,
evasion, aggressiveness, and sheltering would be closer to the other
end of the continuum.
Dyreng, Hanlon, & Maydew (2008,
p. 62)
Anything that reduces the firm's cash effective tax rate over a long
time period.

20
Kay (1980, p. 136) The facts of the transaction are admitted but they have been
arranged in such a way that the resulting tax treatment differs from
that intended by the relevant legislation.
Tax evasion
Author(s) Definitions
Payne & Raiborn (2018, p. 470) Any dishonest or dubious action taken outside the legal framework
to reduce or conceal taxable income amounts or increase deductions
so as to reduce the true tax liability to less than the obligated amount
under the legal tax framework.
Bird & Davis-Nozemack (2018, p.
1010)
An illegal and immoral practice
Cowell (1990, p. 231) Attempt of concealment some of their taxable income from the
authorities.
Kay (1980, p. 136) Evasion is concerned with concealing or misrepresenting the nature
of a transaction.
Tax sheltering
Author(s) Definitions
Chyz (2013, p. 312) The most severe or aggressive form of tax avoidance with the main
goal to lower tax liabilities by exploiting discontinuities in the tax
law.
Lisowsky, Robinson, & Schmidt
(2013, p. 584)
Tax positions with the greatest amount of uncertainty
Lisowsky (2010, p. 1694 ) Transactions or arrangements that generate tax losses without
incurring economic losses or risk to lower the corporate tax liability
by exploiting discontinuities in the tax law. Tax shelters are illegal
when they do not exhibit economic substance or a business purpose;
that is, when they are created for the sole aim of evading tax rather
than filling a non-tax economic need.
Cowell (1990, p. 231) Sheltering is a legitimate activity, openly carried out by tax-payers
taking advantage of special provisions or loopholes in tax laws.

21
Tax haven
Author(s) Definitions
Janský & Prats (2015, p. 274) Locations and a fundamental element of a broader system and
industry that support tax evasion and avoidance.
Jaafar & Thornton (2015, p. 436) Jurisdictions that impose no or very low corporate taxes and hence
offer firms the ability to reduce their overall tax burdens in their
home country.
Dharmapala & Hines (2009, p. 1058) Locations with very low tax rates and other tax attributes
Tax aggressiveness
Author(s) Tax Aggressiveness
Lanis & Richardson (2013, p. 75) A scheme or arrangement put in place with the sole or dominant
purpose of avoiding tax which is not within the spirit of the law.
Lisowsky, Robinson, & Schmidt
(2013, p. 584)
A subset of tax avoidance in which the underlying positions likely
have weak legal support.
Lanis & Richardson (2012, p. 86) The downward management of taxable income through tax
planning activities that are legal or that may fall into the grey area,
as well as activities that are illegal.
Rego & Wilson (2012, p. 776) A more aggressive tax positions are subject to greater uncertainty.
Hanlon & Slemrod (2009, p. 127) Complex transactions used by corporations to obtain significant tax
benefits probably never intended by the tax code; these transactions
may not be illegal per se.
Tax avoidance can be achieved through mechanisms referred to as tax sheltering, a method that
taxpayers can use to lower their tax liabilities. Tax sheltering activities can range from investments
that provide favourable tax treatment, to activities that reduce taxable income such as transfer pricing,
a corporate-owned life insurance deal, contingent-payment instalment sales, lease-in, lease-out
transactions, the cross-border dividend capture strategy, the contested liability acceleration strategy,
and offshore intellectual property havens (Graham & Tucker, 2006; Wilson, 2009a). One of the most-
engaged methods of tax shelters is reallocating taxable income through complex techniques such as
intra-firm trade and intangible property transferring to tax havens, the no-tax or very low-tax

22
jurisdictions (Desai et al., 2006; Dharmapala & Hines, 2009). As tax sheltering is the method to avoid
tax, Cowell (1990) asserts that sheltering is a legitimate activity but inconsistent with the spirit or
intent of the statute or regulation. Nonetheless, Hanlon & Slemrod (2009) and Lisowsky (2010) argue
that while tax shelters provide a way to legally avoid taxes, they can also be used for illegal tax
evasion if those transactions are created for the sole purpose of evading taxes.
Tax aggressiveness is another word used interchangeably with tax avoidance which defined broadly
in Lanis & Richardson (2013) as a scheme which is not consistent with the spirit of the law carried
out for the purpose of avoiding tax. However, tax aggressiveness is more likely and specifically
referring to a risky tax avoidance/tax shelter activity that leads firms to encounter a greater uncertainty
tax position (Lisowsky et al., 2013; Rego & Wilson, 2012). Therefore, tax aggressiveness can be
activities that are legal or illegal, as well as activities fall into the grey area depending on how
aggressive the activities are (Lanis & Richardson, 2012).
However, Hanlon & Heitzman (2010) argue that tax avoidance is the general terms referring to tax
strategies that firms engage for the purpose of tax reduction. It can fall anywhere along a continuum
ranging from certain tax positions (perfectly legal) to uncertain tax positions (legal, grey area, or
illegal), depending on the aggressiveness levels of avoidance activities. This suggests that the tax
avoidance should be specifically defined by a researcher according to a particular research question
and context. As the input data used in this study to distinguish between legal avoidance activities and
illegal evasion activities are not publicly accessible, tax avoidance in this study is based on the output
data to measure the overall magnitude of firms’ tax avoidance. Thus, it is defined as any schemes,
regardless of consideration about legal elements, that firms participate to receive a reduction of tax
liability.
2.3. Theoretical Framework
Tax avoidance can be viewed as another form of a principal-agent problem – the conflict of interest
between an owner (principal) and a manager (agent) (Slemrod, 2004). Based on agency theory, a
firm’s manager is expected to act on behalf of an owner to maximize the value of the firm. The
principal-agent scheme occurs when the interests of agents do not align with those of principals. This
issue is normally driven by an asymmetry of information. In a corporation, owners are mostly
separated from a management team who is responsible for day-to-day tasks. This arrangement allows
the firm’s managers to hold a more complete set of information at hand compared to the owners,
especially the outside owners. When information asymmetry exists, managers have opportunities to

23
promote their own self-interests (if those interests are not aligned with the owners’ ones) at the
expenses of the owners (Beatty & Harris, 1998).
Although tax avoidance in itself does not reflect the problem of agency, it is a part of the agency
issues due to managerial opportunism (Desai & Dharmapala, 2009). In mitigating conflicting
interests between managers and themselves, the firms’ owners align managerial incentives with after-
tax firm performance. The managers who expect to gain benefits from such incentives would exert
their effort to reduce tax liability as much as possible to maximise profits and achieve their own goals.
In other words, managers would do their best to maximize the after-tax wealth of the firm’s owners
as doing so maximizes their own wealth as well. Moreover, the information needed for the tax
function is dispersed throughout the firm, which is available only within the system created for
financial reporting and management (Cranford et al., 2012). As such, managers are provided
resources to conduct activities designed to hide bad news or disclose information that misleads
investors (Desai and Dharmapala, 2006). Furthermore, to justify the opacity of tax avoidance
transactions, managers may claim that it is necessary to obfuscate those transactions as it would help
reduce the risk of detection when firms are scrutinised by tax authorities and shield from the
investigations of external auditors and audit committees (Kim, Li, & Zhang, 2011). Desai &
Dharmapala (2009) show that complex tax shelters allow managers to report earnings while
preventing investors from understanding their sources. Under the agency perspective, as the
complexity of tax avoidance transactions can provide managers with tools to mask and justify their
opportunistic behaviours (e.g. related party transactions, earnings manipulations, and other resource-
diverting activities), tax avoidance and managerial diversion can be complementary (Desai &
Dharmapala, 2006). Taken together, the agency theory predicts that incentive-aligned managers
engage in more tax avoidance activities (Chen et al., 2010; Desai & Dharmapala, 2006; Desai &
Dharmapala, 2009).
Motivated by this line of reasoning, the extant literature has begun exploring the role of agency
frictions in explaining variation in tax avoidance. Chen et al. (2010) use multiple measures of tax
aggressiveness; GAAP ETR, cash ETR, total BTD, and abnormal BTD examining whether a family-
owned firm is more or less aggressive on tax transactions. They argue that family owners have more
opportunity to engage in tax avoidance, but the family owners simultaneously face greater agency
problem between dominant and minor shareholders who are monitoring the firm’s performance. Their
result shows that the family-owned firms are less tax aggressive than their non-family counterparts
after controlling all factors affecting the differences between family firms and non-family firms. The

24
authors conclude that the firm value could be discounted if minority shareholders detect that firm
hide rent extraction activities through complex tax transactions. Khan, Srinivasan, & Tan (2016) also
examine the role of ownership structure in explaining variation in tax avoidance. The authors argue
that although the institutional investors’ interests are in favour of shareholders’ share of after-tax
income, those institutional owners do not demand managers to employ specific strategies to maximise
profits, i.e. it could be tax avoidance or other strategies. Therefore, the level of tax avoidance is at
managers’ discretion. Using the Russell index reconstitution setting to isolate exogenous shocks to
institutional ownership, they find that higher institutional ownership is associated with higher tax
avoidance. The authors conclude that managers engage in tax avoidance due to the increase in the
institutional ownership, rather than the explicit and specific demand for tax avoidance of institutional
owners. Using a large sample of U.S. firms for the period 1995–2008, Kim et al. (2011) find that tax
avoidance is positively associated with stock crash risk. The authors explain this relationship in the
way that tax avoidance transactions offer managers tools to mask their opportunistic behaviours and
hoarding of bad news. When all hidden bad news accumulates over the turning point, and immediately
come out at once, firms face with stock price crashes. However, this relation is weakened for firms
with strong external monitoring mechanisms such as high institutional ownership, high analyst
coverage, and greater takeover threat from corporate control markets. Consistent with Desai &
Dharmapala (2006), the complementary relationship between tax avoidance and managerial diversion
is not held for firms with strong governance as managers can be kept in check.
2.4. Alternative Perspectives on Tax Avoidance
Although most studies on tax avoidance are based on an economic perspective, the ethical view has
also been used to investigate this practice. As one side of the coin, increasing the firm value is an
ultimate goal of tax avoidance engagement, but the other side of the coin, tax avoidance affect society
as a whole. Therefore, this section discusses issues of tax avoidance from both perspectives.
2.4.1. Economic perspective on tax avoidance
Tax avoidance has become one of the key strategies because of its primary benefit to maximise cash
of firms by minimising tax payments. As tax avoidance decreases cash outflows, it is expected to
increase firm value (Drake et al., 2019), and is thereby positively viewed by investors (Mukhlasin &
Anissa, 2018; Wilson, 2009a). As the outcome of tax avoidance is profit increasing which is the key
indicator of firms’ financial performance in the evaluation processes in capital markets, managers are

25
motivated to undertake tax avoidance strategies, especially, when managers’ incentives are aligned
with firm’s owners interests (Armstrong et al., 2012; Crocker & Slemrod, 2005; Slemrod, 2004).
Engaging in tax avoidance strategies imposes a variety of costs on firms and managers both explicit
costs and implicit costs (or non-tax costs). The explicit costs include expenses for setting up,
implementing, monitoring, and improving the strategy, such as registration and legal fees for
establishing business units, audit fees for consulting, and fines or penalties that may arise if the tax-
favoured transactions are considered inappropriate by the tax authority (Hanlon & Slemrod, 2009;
Kubata et al., 2013). It has been argued that tax avoidance cannot be evaluated without analysing
corporate governance issues (Desai & Dharmapala, 2006b). This view points out that, in addition to
the explicit costs, tax avoidance also imposes implicit costs. This type of cost is hidden in nature and
not easy for stakeholders to identify the true net benefits of tax avoidance. Implicit costs are mostly
referred to as agency costs which include reputational and/or political costs8 (Chen et al., 2010;
Graham, Hanlon, Shevlin, & Shroff, 2014; Hanlon & Slemrod, 2009), direct appropriation for the
managers if benefits from tax avoidance are attained and increased ability of managers to extract rents
for themselves (Santana & Rezende, 2016) and loss of financial statement credibility (Kubata et al.,
2013; Mukhlasin & Anissa, 2018).
As the reputation of a corporation represents the perception individual having toward a corporation,
a strongly positive reputation is viewed as a tool to accomplish strategic competitive advantages
(Schwaiger 2004). A corporation may be banned from society as a punishment of not being a good
citizen when the public identifies that the company has avoided paying taxes. In the study of Hanlon
& Slemrod (2009), they show the mission statement of the tax department of General Electric, as an
example, which indicates that “tax strategies should not be harmful to the company’s reputation” and
the company also categorizes reputation as a tax risk type and describe the criteria for evaluating this
type of risk. This shows that there are, at least, some companies that label reputational loss as a cost
of being aggressive tax avoider. Using a sample of firms accused of tax sheltering and firms recorded
as being poor corporate citizens for having low tax rates by the Citizens for Tax Justice, Hanlon &
Slemrod’s (2009) findings support this view in that the average company’s stock price declines when
its involvement in tax shelters is reported in the news. Chen et al. (2010) analyse family-owned
8 Not all agency costs are directly from the interactions between principal and agent. Agency costs can be incurred by
both actors trying to suppress the political pressure that is placed on firms. These costs might arise from agents acting
either for their own benefits or for the benefits of the company (Llott, 2017). For example, the penalties levied by tax
authority if the firms are discovered about their tax avoidance schemes.

26
businesses and find that family firms, compared to non-family firms, report a lower level of
aggressive tax avoidance since they attempt to mitigate reputational costs. Graham et al. (2014)
analyse a survey of nearly 600 tax executives on incentives of tax avoidance strategy. They find that
the concern about the corporate reputation is considered as “important” or “very important” by almost
70% of the executives when asked why they decide not to adopt aggressive tax strategy. This suggests
that they regard aggressive tax avoidance to potentially result in reputational costs. With the objective
to explore the effects of the corporate tax strategy on corporate reputation with customers, Hardeck
& Hertl (2014), by means of laboratory experiment, also provide evidence that aggressive tax
strategies significantly reduce corporate reputation and purchase intentions of customers. Mills et al.
(2013) investigate the impact of political costs on tax avoidance of firms that rely on government
contracts. They find that federal contractors that are highly sensitive to political costs exhibit higher
effective tax rates, implying that federal contractors do not engage in aggressive tax avoidance in
order to avoid political costs. Minnick & Noga (2010) find that firms with greater risk from public
repercussion captured by those with high advertising expenses are less likely to engage in aggressive
tax management.
Given that tax avoidance activities are risky and impose costs on both companies and managers, the
latter must be motivated to engage in tax avoidance as it is expected to generate benefits for the
company and its shareholders (Rego & Wilson, 2012). Therefore, a direct appropriation for the
managers, if the target to save tax expenses were to be successful as planned, is an implicit cost of
tax avoidance activities (Santana & Rezende, 2016). Several studies show that tax avoidance is
associated with the practices with regards to corporate compensation (e.g., Armstrong et al., 2012;
Desai & Dharmapala, 2006a; Phillips, 2003; Rego & Wilson, 2012). In addition to the reward given
to managers, under the pretext that tax avoidance activities should be vague so as to not be observable
by tax authorities, firms should not overlook the increased ability of those managers in manipulating
transactions to be opaque because they may take advantage of the situation to extract rents for
themselves, especially in environments with weak corporate governance (Desai & Dharmapala, 2009;
Kim et al., 2011). Although tax avoidance is a complex and obscure transaction by its nature, the risk
of being detected by the tax authorities is inevitable (Atwood et al., 2012; Crocker & Slemrod, 2005;
Kim et al., 2011). Once the case is found out, firms will be investigated, and if the case is judged to
be illegal by tax authority, firms are faced with potential penalties including the decline in stock price
(Brooks, Godfrey, Hillenbrand, & Money, 2016; Cloyd, Mills, & Weaver, 2003; Hanlon & Slemrod,
2009), pecuniary and reputational sanctions, as well as adverse professional consequences (Desai &

27
Dharmapala, 2006) which is certainly viewed as a cost imposed on the taxpayer (Slemrod & Yitzhaki,
2002).
Among other implicit costs, the quality of earnings information can be affected by tax avoidance
activities because the income tax expense is calculated based on an accrual basis. Prior research has
shown that accruals can be potentially be manipulated to affect after-tax earnings (Hanlon &
Heitzman, 2010). Firms that report low tax liability for a long period of time would make investors
wonder about the quality of the financial statements. If it has been exposed that the management
involves in tax dodging, investors and shareholders can also suspect that whether the management
appropriately serves their interests. If the profits are generated from opportunistic motives of
managers to cover the complexity of corporate problems, then this earnings information may not be
reliable and relevant for investors. Frank et al. (2009) find that aggressive tax-avoiding firms also
exhibit aggressive financial reporting, and hence a lower quality of financial statements. They also
find that investors do not fully incorporate the discretionary accruals information into stock prices,
and most of the mispricing is attributed to firms with the most aggressive financial reporting. Kubata
et al. (2013) find that tax avoidance reduces the informativeness of financial reporting due to the
opaque transactions, leading them to be difficult to understand. As a result, investors and shareholders
may reduce the firms’ credibility to the net income of companies due to the lower information content.
Consequently, the loss of financial statement quality affects both the cost of capital (Lambert et al.,
2007) and cost of debt (Francis et al., 2005).
All in all, tax avoidance is generally considered as a cost-benefit management strategy, which should
be properly evaluated to ensure that the benefits outweigh the costs. Typically, managers would not
proceed tax avoidance activities if those activities do not generate value where the benefits outweigh
the costs. Measuring the benefits is straightforward (the amount of money saved from a reduction of
tax expenses) but measuring the costs is a challenge as they include both explicit and implicit costs,
and some costs cannot be measured in monetary terms.
2.4.2. Ethical perspective on tax avoidance
Although tax avoidance is an expected and accepted practice in a corporate entity’s tax planning
function by taking the advantage of legal loopholes to make the tax burden as low as possible, such
practice begs the question of whether the legal minimum of aggressive tax avoidance is sufficient to
follow the ethical minimum of fair tax payment (Payne & Raiborn, 2018). The national budgets for
spending on the development and maintenance of public services such as education, physical

28
infrastructure, health care, and defence are practically from tax revenues (Christensen & Murphy,
2004; Payne & Raiborn, 2018). In the situation where some taxpayers pay less tax; the government
may seek ways to maintain national budgets so that the delivery of public goods and services is not
reduced or interrupted. By doing so, others may be forced to pay more tax. Thus, it raises the question
of whether those who underpay taxes are perceived as unfair and unethical citizens. Moreover,
multinational firms from developed jurisdictions that take advantage of a developing country’s tax
incentives and low tax rates in order to avoid higher taxes in their home country, and do not provide
significant economic benefit to the host country may be questioned as to whether they behave
ethically towards either the home or the host country (Haugen, 2018; Payne & Raiborn, 2018; West,
2018).
Ideally, business ethics and business competency should go together. In the real world of businesses,
when business organisations have to deal with conflicting demands from heterogeneous groups of
stakeholders, it is understandable that fulfilling all the stakeholders’ expectations and obeying the
business ethical codes are difficult for them to meet at the same time. However, one fact that needs
to be accepted is that no reason can be used as an excuse for doing the wrong thing. Moreover, the
“wrong things” may mean differently (e.g., law, norm and culture) to different persons. In the context
of tax avoidance practices, it seems increasingly difficult for taking ethical issues into account when
these practices are generally legal and acceptable through the uses of regulatory loopholes. Jackson
(1996) states that if there are legal loopholes that are overlooked by the legislators, it is their duty to
remove them from the system, and that the honest businesspeople has no obligation not to take
advantage to these loopholes. However. Jackson’s argument cannot be applied to all situations, for
instance, the situation that businesses legally release toxic waste by means of the legal loopholes, and
it jeopardises the health and safety of people in a community. Therefore, it is essential for businesses
to balance their responsibilities between making profits, obeying the law, and being ethical with at
least the minimum acceptable ethical behaviours (Stainer et al., 1997).
Given that to some extent tax liability is self-assessed, the interpretation of ambiguous tax law thus
depends on how much risk firms wish to take and how much ethical responsibility they have towards
the spirit of the law. As a sense of moral obligation varies across firms, their behaviours on tax
practices would be influenced by the firms’ key players who are embedded with different cultures
and adopt different ethical standards that frame their approaches to influence firms’ tax practices

29
(Sakurai & Braithwaite, 2003).9 Tax advisers, predominantly Big4 firms, play an important role here.
Characteristically, tax advisers are believed to be people who keep businesses on the right side (both
legal and ethical acceptance) of cutting down on the tax liability (Sakurai & Braithwaite, 2003;
Stainer et al., 1997) as they can be both enforcers of the tax law (for unambiguous parts) and exploiters
of the tax law (for ambiguous parts) (Klepper, Mazur & Nagin, 1991). However, recent tax-avoiding
scandals of many multinational firms (such as Google, Starbucks, and Amazon) have called into
question the ethical practices of these firms and their tax advisers. The dual roles of tax advisers, as
government agents and as client advocates are also questionable, i.e., Big4 tax advisers are likely to
be members of a professional association, helping the government in writing tax laws and at the same
time designing strategies to help their clients avoid those laws (Marshall et al., 2005). Therefore, their
ethical actions are conditional upon their self-enforcement and effective monitoring of ethical conduct
within professional organizations. Another key player is society at large, i.e., as paying corporate tax
is part of the social contract between firms and society (Hasan et al., 2017; Preuss, 2010),10 avoiding
to pay tax is viewed as unethical and irresponsible behaviour (Dowling, 2014; Hoi et al., 2013)
because firms do not act as good citizens by not paying their fair share of taxes (Huseynov & Klamm,
2012). In changing the perspective of business organization to acknowledge that the aggressive
corporate restructuring to dodge tax is not compatible with true corporate responsibility requires
large-scale cultural changes.
2.5. Prior Studies on Tax avoidance
2.5.1. Firm characteristics
A plethora of existing research on tax avoidance has focused on empirical data to highlight
characteristics of tax aggressive firms (see Appendix A), particularly since Hanlon & Heitzman
(2010) note that tax avoidance is one of four main areas of tax accounting research.11 This section
discusses prior empirical studies on firm-specific characteristics that affect the level of tax avoidance.
9 For example, Shafer and Simmon (2008) find that tax professionals who strongly believe in the importance of corporate
ethics and social responsibility will engage in less tax avoidance schemes whereas tax professionals with tendency to
adopt manipulative and deceitful behaviours believe less in the importance of corporate ethics and social responsibility
and will be more acceptable to engage in tax avoidance.
10 Social contract is viewed as an agreement, either explicit or tacit, between the state and individual to form society and
the individual needs to follow such agreement in exchange for the right to continue its existing in society. Therefore,
corporation as part of citizens in society must pay the right tax amount (respecting the law) in return for mutual benefits
(McNair, 2010; Tax and the social contract, 2016). 11 In the review of Hanlon & Heitzman (2010), four main areas of tax research in economics and finance, i.e., the
informational role of income tax expense reported for financial accounting, corporate tax avoidance, corporate decision-

30
(a) Firm size
Two contrasting theoretical frameworks are used to explain the relationship between tax avoidance
and firm size (Gupta & Newberry, 1997; Kim & Limpaphayom, 1998). On the one hand, based on
the theory of political cost, large firms encounter more scrutiny from governments (Jensen &
Meckling, 1976) and are subjected to comply with greater regulatory activity (Watts and Zimmerman,
1986) because of their greater visibility as compared to small firms. The larger firms thereby endure
higher political costs (Zimmerman, 1983). Given tax is one of the components of total political costs
that the company is responsible for; this theory suggests that larger firms exhibit higher ETRs
(Zimmerman 1983), suggesting a negative association between tax avoidance and firm size. A
number of prior studies confirm its relation in line with this notion (e.g., Minnick & Noga, 2010;
Rego, 2003). On the other hand, other studies report a positive relationship between tax avoidance
and firm size: that is, larger firms are more likely to avoid paying their share of tax. Under the notion
of the political power or clout theory, it is assumed that larger firms have more resources to influence
the political process to be in favour of their optimal tax savings and more likely to participate in more
complex tax planning strategies (e.g., Siegfried, 1972; Siegfried, 1974; Stickney & McGee, 1982;
Porcano, 1986 in Lietz, 2013). Using two measures of ETR,12 Richardson & Lanis (2007) find the
negative association between firm size and ETRs in an Australian setting, suggesting a positive
association between tax avoidance and firm size. Using non-ETR measure to proxy for tax avoidance,
Wilson (2009) finds that larger firms are more tax aggressive as presented in a positive relation
between tax shelter participation and firm size.
Nevertheless, others find mixed results in their study. For example, Wu, Wang, Luo, & Gillis (2012)
examine the size effect on ETRs, and they find that private firm size is positively associated with
ETRs whereas state-controlled firms is negatively associated with ETRs. Using a sample in the BRIC
group of countries, Fernández-Rodríguez & Martínez-Arias (2014) also find mixed results where
Brazil and China report positive relation, Russia exhibits negative relation, and India is the only
country where size is not significant. Similarly, Gupta & Newberry (1997) do not report a significant
relationship between ETRs and firm size. Although the results are mixed, the relationship between
firm size and tax avoidance can be expected within the aforementioned theoretical perspectives. The
making including investment, capital structure, and organizational form, and taxes and asset pricing are surveyed and
summarized the updated issues examined. They also suggest the important issues future research.
12 The first ETR is calculated as income tax expense divided by book income, and the second ETR is defined as income
tax expense dividend by operating cash flows (Richardson & Lanis, 2007, pp. 696, 698).
31
mixed results may be due to the different setting in each study including the sampled periods and
geographical areas (Fernández-Rodríguez & Martínez-Arias, 2014).
(b) Leverage
Taxes play an important role in understanding the capital structure choices of firms, particularly in
addressing the amount of capital which can be sourced between equity and debt in order to maximize
firm value (Barclay et al., 2017). Generally, the use of leverage increases the complexity of firms’
financial transactions. Highly leveraged firms, at first glance, have more ability to reduce taxes
through the use of complete financing transactions (Mill et al., 1998 in Dunbar et al., 2010; Lietz,
2013). Alternatively, leveraged firms may have a relatively strong incentive to avoid taxes so as to
preserve cash for paying the debt burden (Badertscher, Katz, & Rego, 2010). In line with this view,
tax avoidance is assumed to be positively associated with firm leverage.
In the opposite view, since firms with high level of leverage incur more interest expenses which are
deducted from taxable income,13 they may have less need to be tax aggressive as they face less
pressure to draw on alternative non-debt tax shields (Graham & Tucker, 2006). Nevertheless, this
would be only the case for firms with high expected marginal tax rate on their interest deduction
(Mackie-mason, 1990). Therefore, tax avoidance is expected to have negative relation with the firm
leverage level. Consistent with this notion, Faulkender & Smith (2016) find that firms operating in
countries with lower tax rates use less debt as higher leverage ratios and lower interest coverage ratios
are shown in multinational firms confronting higher tax rate. By comparing the leverage choices of
taxable real estate companies to those of similar non-taxable real estate investment trusts (REITs)14
in order to avoid noise from financial statement data, Barclay et al. (2017) find that taxable companies
exhibit leverage ratios about 5% higher than the leverage ratios of non-taxable REITs, suggesting an,
even moderate, role of tax shield considerations in the decisions to use relatively large amounts of
debt financing.
(c) Firm performance
Top-line growth firms or more profitable firms are obviously subjected to increasing applicable tax
rates as their incomes increase, suggesting that such firms have higher ETR. The empirical evidence
13 Leveraged firms already have benefits from a tax shield (Wrightsman, 1978) which thereby relatively a weak motivation
to reduce more tax (Badertscher et al., 2013).
14 REITs companies receive no benefit from the tax deductibility of interest payments (Barclay et al., 2017).

32
is clear about the positive relationship between profitability and ETR, which shows that more
profitable firms have to bear more taxes than less profitable ones. (Chen et al., 2010; Gupta &
Newberry, 1997; Plesko, 2004; Richardson & Lanis, 2007; Stickney & Mcgee, 1982). However, more
profitable firms have been argued to show a greater incentive to reduce their tax burden relative to
less profitable firms (Dunbar et al., 2010). Similarly, Phillips (2003) concludes that firms with growth
opportunities have a greater ability to engage in tax avoidance activities. Conversely, loss firms (i.e.,
firms with net operating losses) commonly have less incentive to participate in tax avoidance (Dunbar
et al., 2010; Lietz, 2013; Minnick & Noga, 2010). Moreover, firms incurring losses can reduce their
tax liability for the previous or subsequent accounting period by employing the benefit of carrybacks
or carryforwards (Fernández-Rodríguez & Martínez-Arias, 2014).
(d) Capital intensity
Another factor that influences the effective level of tax directly is the degree of capital intensity.
Capital intensity ratio is the number of assets that invest assets in fixed assets. According to
(Fernández-Rodríguez & Martínez-Arias, 2012; Stickney & Mcgee, 1982), net property, plants, and
equipment (PPE) creates depreciation expense which is a deductible item in all tax regimes. As
depreciation can be deducted from the tax calculation, firms with greater levels of PPE have higher
deductible expense in tax system, and thereby a lower ETR relative to firms with low levels of PPE.
Thus, the acquisition of PPE allows firms to enjoy tax incentives that have beneficial effects on the
firms’ tax burden. In other words, firms with high levels of capital intensive firms are usually
expected to have more tax planning opportunities (Dyreng et al., 2008). Extant empirical evidence
shows that a greater weight of PPE leads to lower ETR, indicating that there is an inverse relationship
between tax avoidance and capital intensity (Gupta & Newberry, 1997; Plesko, 2004; Richardson &
Lanis, 2007; Stickney & Mcgee, 1982). Some other studies, however, do not find a statistical
inference between tax avoidance and capital intensity (e.g., Harris & Feeny, 2000; Irianto, Sudibyo,
& Ak, 2017; Liu & Cao, 2007). This lack of significance of its relationship may be because the
benefits from other tax policies are greater than from PPE.
(e) Research and development (R&D)
The relationship between firms’ R&D intensity and their average ETR (a measure of tax planning or
tax avoidance) is intensely debated in tax policies discussion because R&D expenses are treated
differently between a tax system and an accounting system. While R&D expenses may be capitalised
as intangible assets (under certain conditions) for accounting purposes, they may be immediately

33
expensed in the tax system. This practice generally reduces a firm’s ETR, leading to a requirement
for recognition of deferred taxes for temporary book-tax differences (BTD) (Belz et al., 2017).
Moreover, under certain conditions, firms are granted R&D tax credits which allow them to deduct
an additional portion of R&D expenses from their tax base (Belz et al., 2017; Dyreng et al., 2010;
Gao et al., 2016a). This deduction leads to reduced ETRs suggesting firms’ incentive to reduce tax
burden. Dyreng et al. (2008) find a positive relation between R&D intensity and tax avoidance. Cazier
et al. (2009) find a positive relation between the level of R&D intensity and uncertain tax benefits.
Lanis & Richardson (2015) also evidence that tax avoidance is positively associated with R&D
expenditure owing to additional tax-deductible credit. Nevertheless, no relationship has been found
between tax avoidance and the level of R&D intensity (e.g., Atwood, Drake, Myers, & Myers, 2012;
Gao et al., 2016).
2.5.2. Multinational corporations (MNCs)
As multinational corporations (MNCs) operate in a variety of economic and political environments,
political, cultures as well as tax jurisdiction, they have more opportunity to pay less income tax (Rego,
2003; Wilson, 2009a). The practices that allow MNCs to lower their worldwide tax liabilities include
moving their operations to low-tax rate locations, shifting income to low-tax countries, taking
advantage from different tax rules and tax subsidy agreement, or engaging in complex property
transactions (Rego, 2003; Schwarz, 2009). Rego (2003) examines the sample of U.S. both a board
sample of domestic and multinational corporations and a subsample of U.S. multinational
corporations only. In both analyses, the results show consistently that firms with higher scales of
foreign operations have lower worldwide ETRs than firms with less extensive foreign operations.
This result is assumed that MNCs avoid more income tax. By focusing narrowly on MNCs in the oil,
gas, and manufacturing sectors in Nigeria, Otusanya (2011) finds that the key structures enabling tax
avoiding practices of MNCs are tax havens and offshore financial centres and the key actors
facilitating their avoiding are the local business elite and local professionals who are engage for their
own financial gain. Moreover, the findings show that the anti-tax practices by these MNCs shift the
tax burden to less capital flow and less well-off citizens, and thereby undermine the Nigeria's social
structure. Using a global dataset with 210,000 corporations in 102 countries to investigate whether
cross-border profit shifting by MNCs is more prevalent in less developed countries, Johannesen,
Tørsløv, & Wier (2017) find that the sensitivity of reported profits to profit-shifting incentives is
negatively related to the level of economic and institutional development, suggesting that less
developed countries appear to be significantly more exposed to tax avoidance by multinational firms.
34
2.5.3. Incentive compensation
In the last decade, studies have been examining the relationship between incentive compensation
practices and tax avoidance. Intuitively, once executive compensation is structured to align with
shareholder’s interest, managers will strive towards maximizing profit and be willing to engage in
riskier activities to gain higher value. Since tax aggressive strategies is risky behaviour leading to
reduction of tax liability, consequently increasing the bottom line, those managers tend to be involved
in tax avoidance. Therefore, the expected relation of these two aspects is a positive relation. Besides
the results of Desai & Dharmapala (2006) as described above, several studies find a significantly
positive relation between align-incentive compensation and tax avoidance. Phillips (2003)
empirically examines the theoretical link between compensation and tax avoidance measured by
GAAP ETRs. He finds that business-unit managers are compensated based on after-tax performance,
but not CEOs (supported by Armstrong et al. (2012), leads to lower GAAP ETRs. Later, Gaertner
(2014) re-examines Phillips (2003) and extends his study by estimating CEO cash compensation to
total tax expense. Inconsistent with the previous study, the findings show that CEOs’ after-tax
incentives have a negatively and statistically significant relationship with firms’ ETRs, suggesting
that after-tax compensated CEOs request an exceptional additional risk. Similarly, Armstrong et al.
(2015) and Rego & Wilson (2012) find that managers with high incentives of managerial risk-taking
equity are likely to be more aggressive tax avoidance.
2.5.4. Governance mechanism
As discussed above, tax avoidance is considered to be a risky practice and unresolved agency cost to
management. The different levels of tax avoidance, then, depend on the demand of shareholders.
Desai and Dhamapala (2006) assume in their study that well-governed firms have strong internal
control to prevent managerial diversion. However, equity incentives cannot be used in motivating a
manager to avoid tax for poorly-governed firms because these firms are lacking governance
mechanisms to prevent managerial diversion. Armstrong et al. (2015) look at the alternative view of
agency problems by assuming that firms with governance mechanisms in place can diminish agency
problems regarding tax avoidance. They examine whether a link between corporate governance
characteristics, including contracts of managers’ incentive-compensation, and tax avoidance exists.
Their results prove that firms with high levels of risk-taking equity incentives are more motivated to
invest in tax avoidance activities, which are beyond the levels of the shareholders’ preferences. They
also find that some characteristics of boards are able to mitigate agency problems with respect to high
levels of tax aggressiveness. These characteristics include independence and financial background.

35
Steijvers and Niskanen (2014) provide evidence indicating that outside boards of directors moderate
the relation between CEO ownership and tax aggressiveness.15
2.5.5. Institutional factors
Although paying tax is compulsory by the national laws and regulations, it is a voluntary action
because it commits a large amount of taxpayer’s money (Palil et al., 2016). Understanding the nature
of an individual nation toward tax is thus important to the governments in setting strategies which
can increase the willingness of their citizens to pay due tax accordingly. While the economy is the
key concern of taxpayers in their decision-making regarding tax strategy, institutional factors also
influence their decision to either avoid or not avoid tax.
(a) Characteristics of tax system
A nation’s tax system, either a worldwide or territorial tax system in the home country, plays a
primary role in determining the level of tax avoidance in a particular country because it dictates how
much tax a firm must pay (Jaafar & Thornton, 2015). It is explained in Atwood, Drake, Myers, &
Myers (2012) that under the worldwide tax system, income generated in overseas subsidiaries is
subject to additional taxes in home country when such income is repatriated back to the parent firms
as dividend. This additional tax is not collected from the parent company in countries with territorial
tax systems. As a result, multinational firms located in countries using worldwide tax system are
taxed at the higher rate on their worldwide income. Nevertheless, a number of tax planning techniques
are available for multinational firms in the worldwide tax system to achieve tax savings. For example,
subsidiary firms can delay the dividend payment in order to defer the payment of tax in their parent
firms’ countries. The firms can also defer this tax liability indefinitely if the earnings are invested in
the country in which they are generated or in other countries (Atwood et al., 2012). These options
encourage firms to park foreign profits outside their home country (Blouin et al., 2012). Taken
together, the higher tax liability and the ability to defer tax payment in the home country may induce
greater incentives for firms to avoid tax.
Interestingly, many prior studies reveal the opposing direction. Given dividends obtained from
foreign subsidiaries are permanently exempt from tax liability in the parent home country, Hicks et
15 The characteristics of corporate governance have not been included in the analysis of the empirical studies in this thesis
because missing data reduces the number of observations substantially.

36
al. (2009) argue that parent firms in countries with territorial tax systems can achieve greater tax
benefits from shifting income to low-tax jurisdictions, compared to those firms in the country with
worldwide tax systems as income shifting for them is only deferring home-country tax. Consistent
with Hicks et al. (2009)’s argument, Atwood et al. (2012) find that compared to firms with home-
country territorial tax regimes, parent firms in countries where the worldwide tax system is used avoid
less tax in a study of firms in 22 countries between 1995 and 2007. Similarly, Markle (2016) finds
that among 41 countries (24 countries with worldwide system versus 17 countries with a territorial
system), multinational firms with home-country territorial tax regimes shift more income among their
foreign affiliates than firms subjected to worldwide tax regimes.
(b) Strength of tax enforcement
The strength of the government enforcement of tax rules plays an important role in driving the
taxpayer’s view of higher probability of detection. When firms’ managers perceive that tax authorities
are more likely to detect tax avoidance activities because of the stronger tax enforcement and
potentially impose additional taxes with interest and penalties to the firms, they may engage in less
tax avoidance (Atwood et al., 2012). Allingham & Sandmo (1972) propose the economic model of
tax non-compliance assuming that taxpayers are rational actors who seek to maximize the utility of
their tax paid to the government by comparing the marginal cost and benefit of being tax compliance
with those of tax non-compliance. As such, they would not comply with tax rules if they perceive that
the probability of being caught and the potential penalty are relatively small compared to the benefits
gained from being non-compliant. Therefore, in order to discourage tax avoidance, governments need
to ensure that the benefit of being tax non-compliant is predominated by its cost through the
perception of higher probability of detection and the penalties especially the penalties imposed
directly on the manager, instead of the corporations (Crocker & Slemrod, 2005).
By using 1996 World Competitiveness Index reporting the respondents’ agreement with the statement
“Tax evasion is minimal in your country”, Dyck & Zingales (2004) find that additional monitoring
by tax authorities reduces the private benefits of controlling shareholders that are extracted from non-
controlling shareholders. In a similar vein, Atwood et al. (2012), by using the same proxy as applied
in Dyck & Zingales (2004) for tax enforcement, report that parent firms in countries where tax
enforcement is perceived to be stronger are less likely to avoid tax liability. Desai, Dyck, & Zingales
(2007) find that tax payments increased, related party trades were curtailed, and tax haven entities are
abandoned following an increase in tax enforcement after the 2000 election of Vladimir Putin.

37
Hoopes, Mescall, & Pittman (2012) also evidence that U.S. public firms exhibit less aggressive tax
positions when tax enforcement, proxied by better monitoring of IRS, is stricter.
(c) Adoption of International Financial Reporting Standards (IFRS)
The shift to the use of IFRS leads to changes in accounting methods, which also brings differences in
the current treatment of tax basis. Therefore, it should be possible to have the impact on tax strategies
because of the adoption of IFRS as tax calculation is based on the measurement and recognition of
accounting transactions. More specifically, it is argued that the adoption of IFRS reduces the level of
book-tax conformity (Chan et al., 2010; Chan et al., 2013; Chen & Gavious, 2017; Karampinis &
Hevas, 2013), thereby reducing the impact on tax after the post-IFRS period (Hung & Subramanyam,
2007). In line with this notion, Karampinis & Hevas (2013) find that ETR as a measure of tax pressure
is significantly and negatively associated with discretionary accruals in the pre-IFRS period and the
effect disperses after IFRS has been implemented. However, some scholars argue that the reduction
of book-tax conformity offers a convenient way for managers to avoid more tax because they are not
faced with the trade-off decision between increasing book income and decreasing taxable income.
Another possible condition that can explain the increased levels of tax avoidance after IFRS adoption
is the possible increase in discretionary accruals available within the IFRS framework (A. S. Ahmed
et al., 2013; Lin et al., 2012). According to Atwood et al. (2012), Frank et al. (2009) and Wilson,
(2009), an increased accruals is associated with greater tax avoidance. More recently, Braga (2017)
finds that after the adoption of IFRS, firms engage in higher levels of tax avoidance.
2.6. The Importance of BRICS Economy
Emerging markets have dramatically grown over the past few decades and now play a significant role
in the global economy. BRICS is the acronym for a group of five countries including Brazil, Russia,
India, China, and South Africa. All five are members of the G2016, but are distinguished (from other
developing or newly industrialised countries) by their large, fast-growing economies and their
significant influence on regional and global affairs (Piper, 2015). BRICS are first created as BRIC,
before the inclusion of South Africa in 2010, by Goldman Sachs analyst Jim O’Neill in 2001 in a
paper entitled Building Better Economic BRICs. O’Neill (2001) coins this group according to their
economic growth that potentially dominates the world economy by 2050. O’Neill predicts that Brazil
16 The G20 (The Group of Twenty) is an international forum that brings together the world's 20 leading industrialised and
emerging economies considered the center of the global financial system due to their population, size, or geographic
location (Piper, 2015).

38
and Russia are likely to be dominance of raw materials suppliers while China and India appear to
dominate in supply of global manufactured goods and services. Since then, BRIC have attracted
significant investors for foreign direct investment (FDI) into their regions (Vijayakumar et al., 2010).
In 2004, O’Neill then re-estimates the BRIC global economic dominance and reduces the time frame
from 2050 to around 2030. While countries in Asia, Europe and Latin America are included in the
group, the exclusion of countries in Africa would undermine the importance of the developing world
profile. Therefore, South Africa, the largest economy in the region, is included in the group, and the
acronym becomes BRICS as representatives from the four continents of the world in the globalizing
process. According to the World Bank database (Last updated 2019), BRICS together account for
about 29% of the world’s population, 23% of the world’s land area, and about 24% of the GDP
(Gross Domestic Product), making the group an important economic engine.
Figure 2. 1 BRICS Population and land area
Source: The World Bank database: Health Nutrition and Population Statistics
(Last Updated: 19/09/2019)
Although mainly focusing on economic development, BRICS also plays a politically conscious role
especially with regard to the institutions and practices of international political economy, and they
have the most discernible impact on changes in the existing global governance architectures (Roberts
& Armijo, 2014). Since the financial crisis in 2008, BRICS has started working with the G20, the
International Monetary Fund (IMF), and the World Bank to reform structures of the global financial
regulations in line with the increase in the relative weight of emerging countries in the world
economy. The IMF's quota reform approved in Seoul in 2010 is driven by the cooperation of BRICS.
Moreover, BRICS proposes initial calls for a replacement for the US dollar as the de facto global
currency. Although such a proposal has been shelved, BRICS continuously play the political role in
mainstream international relations, notably driven by an aversion to US political dominance. BRICS
carry forward the launch of two new development banks, the Reserve Contingent Arrangement (RCA)

39
and the New Development Bank (NDB), as an alternative to the World Bank, to provide fund for
infrastructure development in developing countries. However, it should be noted that there are
important differences among the five countries in terms of diverse interests, production structure,
political systems, opening outward, exchange rate, historical conflicts etc., which may affect the
cooperation of BRICS on international relations issues.
In 2001, O’Neill predicted that the combined weight of the BRIC’s GDP compared to World’s GDP
rises to 12.0% in the next ten years, but just over five years their collective share of the global
economy has reached O’Neill’s estimates and has tripled, including South Africa, in 2018 (shown in
Table 1). According to the World Bank estimates, BRICS countries stand out because of their GDP
growth with an average rate of 5.9% between 2001 and 2010, and 3.6% between 2011 and 2018 while
the average global GDP growth is only around 2.8% for both periods. Remarkably, the collective
GDP per capita of BRICS countries has been around 175% outperforming the global rate in 2001 and
almost 340% in 2018. The rapid growth of BRICS’s economic performance is due to their openness
to emerging markets (Radulescu et al., 2014). During these 17 years, BRICS’s goods imports
(exports) have grown more than 840% (900%), while global growth of imports (exports) during the
same period is 217% (222%). Moreover, BRICS have attracted significant investors for FDI into their
countries. In 2018, their FDIs are accounted for 28.91% of the world FDI net inflows and contribute
18.55% to the world’s, which present more than 300% and 1,800% growth for inflow and outflow
FDI respectively, since they had been formed in 2001. Although they have been facing a hard time,
i.e., the financial crisis in 2008, the increasing sanctions on Russia, Indian markets’ bear run in 2014,
China’s stock market crash in 2015, and the ongoing Brazilian economic crisis, BRICS’s stock
markets bounced back soon enough to overturn the damage. For example, their capital markets have
beaten out the 2008 crisis, increasing by 122% in the following year, then has recently reached more
than 200% in 2018, which accounts for 15.68% of the world market capitalization. Due to this
demonstrated model of economic growth, BRICS countries have gained an important weight in
decision-making at the international level and have exerted a global influence.

40
Table 2.2 BRICS Economic Indicators in 2018
Country
GDP Exports
(bnUS$)
Imports
(bnUS$)
IFDI
(bnUS$)
OFDI
(bnUS$)
Market Cap.
(bnUS$) Total
(bnUS$)
Per capita (US$)
Brazil 1,868.63 8,920.76 238.62 185.49 88.32 14.06 916.82
Russia 1,657.55 11,288.87 443.13 248.70 8.78 31.38 576.12
India 2,726.32 2,015.87 332.09 518.78 42.12 11.42 2,083.48
China 13,608.15 9,770.85 2,417.44 2,022.27 203.49 96.47 6,324.88
South Africa 366.30 6,339.57 94.05 92.36 5.47 4.55 865.33
World 86,600.60 11,298.30 19,233.89 18,946.53 1,204.50 850.92 68,654.09
Of which: BRICS 20,226.95 38,335.65 3,525.33 3,067.60 348.19 157.87 10,766.63
BRICS/World 23.36% 339% 18.33% 16.19% 28.91% 18.55% 15.68%
China/World 15.71% 181% 12.57% 10.67% 16.89% 11.34% 9.21%
Source: The World Bank database: World Development Indicators
(Last Updated: 19/09/2019)
However, it can be seen that the acceleration of BRICS’s economic performance has driven mainly
by Chinese economic power as against the other four countries. As shown in Table 1, China has
contributed more than half of BRICS’s economic performance for all indicators. Therefore, it should
be noted that the power of BRICS countries has been made as a group, not individually. As reported
in Table 1, there are several different elements in the individual country that bring up the synergy of
this group.
2.7. Issues of Tax Avoidance in BRICS
With their growing economic and political power, BRICS countries are indeed a topical issue and
have been examined from many different perspectives. For instance, as FDI has become an
increasingly important component in determining economic strategies of firms and countries,
Gammeltoft (2008) estimates the net FDI outflows from the BRICS while Vijayakumar et al. (2010)
examine the factors attracting the FDI inflows towards these countries. Consistent with their
economic growth, BRICS exhibit to a large extent of energy-consuming activities, leading to concerns
of the depletion of the energy resources and the problem of global warming. In response to these
concerns, several studies investigate the causality between economic growth, FDI, gross domestic
product (GDP), urban population, energy consumption (natural and/or renewable energy), and carbon

41
dioxide (CO2) emissions (Cowan et al., 2014; Dong et al., 2017; Sebri & Salha, 2014; Lifeng Wu et
al., 2015). Even though the results are mixed, they contribute to advancing the existing literature and
merit particular attention from policymakers about negative outcomes of economic growth. The
current study shifts the attention and focuses on another important issue, i.e., tax avoidance in BRICS
countries, which has been rarely examined in this setting.
Empirical studies on profit shifting find that tax problems in less developed countries are more acute
as compared to that of developed countries. First, given high levels of corruption, weak law
enforcement, and a lack of political accountability to provide the optimal legal and administrative
resources, the ability to detect tax avoidance and to increase tax revenue is an ongoing issue in many
emerging countries (Johannesen et al., 2017). Second, many emerging countries depend heavily on
tax payments from large corporations (UNCTAD, 2015). Third, sophisticated anti-avoidance rules
targeted multinational firms rarely exist in emerging countries (OECD, 2014). Besley & Persson
(2014) demonstrate that while high-income countries are able to collect taxes of around 40% of their
GDP, countries with low income can generally only collect between 10-20%. The primary source of
income missing from emerging countries results from international operational functions, especially
by transferring mispriced goods and services between subsidiaries and parent companies or between
subsidiaries/affiliates for the purpose of shifting profits to low-tax jurisdictions (Mascagni et al.,
2014).
Furthermore, Christensen & Murphy (2004) argue that the business structures of multinational firms
have been designed in a way to avoid taxes in every jurisdiction where they operate. Empirical studies
have also shown that although they report high levels of profitability, multinational US firms only
pay insignificant amount of taxes in their host countries (Grubert & Mutti, 1991; Kinney & Lawrence,
2000). This may be due to the available opportunities for corporate income shifting (Shackelford &
Shevli, 2001) and tax incentives provided by host countries. Governments from low-income countries
often offer tax incentives to attract investors and promote economic growth. These financial benefits
are prevalent in emerging countries in the form of tax holidays and tax exemptions that are difficult
to classify and regulate and lead to low effective tax rates for companies (Mascagni et al., 2014).
Given the attempt to attract FDI, the competition among emerging countries limits the ability of
governments to charge MNCs taxes (Morisset, 2003; Zee et al., 2002). Developing countries also face
challenges in enforcing tax laws and audits, which creates opportunities for tax avoidance by MNCs
(Cravens, 1997). BRICS countries also face the problem of tax dodging, as shown in the following
in-depth discussion on tax problems in each country.
42
Brazil
Brazil’s corporate income tax rate is relatively very high (34%) compared to the world average (about
23%) and the BRICS’s average rate (about 28%) (Tax Foundation, 2018). In addition, given the main
structure of Brazilian nature such as soft laws, inefficient methods of preventive combat and academic
research, lack of skilled labour, as well as a high corporate income rate and complexity of tax
compliance, the rate of tax evasion in Brazil is very high (Clemente & Lirio, 2017). According to Tax
Justice Network (2013), Brazil lost over USD 280 million due to its shadow economy, black market
sales, and tax evasion. More recently, Janský & Palanský (2019) show that around $32 billion in
corporate profits are shifted from Brazil, amounting to $11 billion in tax revenue loss. In mitigating
the use of artificial mechanisms to avoid due taxes, the Brazilian government is actively involved in
several initiatives. For example, Brazil is part of the Global Forum on Transparency and Exchange
of Information for Tax Purposes (GF) and the OECD’s base erosion and profit shifting (BEPS)
project17 and adopt the Standard for Automatic Exchange of Financial Account Information in Tax
Matters in 2018. However, despite formally participate in the development of the BEPS plan, Brazil
has not announced the scope and implementation of any specific measures to combat tax base erosion
into national legislation (Shelepov, 2017). As a result, the Brazilian firms show a low level of
awareness and the cautious attitude toward the reform plans.
Russia
With lower corporate tax rates at 20% and simplified procedures after the Russian tax reform in 2000,
tax revenue in Russia has skyrocketed from $9 billion in 1999 to $76 billion in 2012. However, there
have been significant improvements since the tax reforms in the first year of Putin’s presidency in
2000, the main remaining problems with the Russian tax system are a lack of business transparency
and ineffectiveness of its tax system (Ivanenko, 2005; Radaev, 2001; Yakovlev, 2001). The analysis
of the IMF and Russian Central Banks have revealed that Russia loses up to 1 trillion roubles a year
in tax evasion schemes, and Cyprus is the main destination for foreign Russian firms (Amos, 2013).
According to Janský & Palanský’s (2019) estimation, they show that around $85 billion in corporate
profits are shifted from Russia, amounting to $17 billion in tax revenue loss. Moreover, there are 3.9
million companies registered with the Federal Tax Service, but only 2 million are real organisations,
17 Base erosion and profit shifting (BEPS) refers to tax avoidance strategies used by multinational companies that exploit
gaps and mismatches in tax rules to artificially shift profits to low or no-tax jurisdictions. The project to stop BEPS,
headed by OECD, with fifteen action plans was initiated by G20 in 2012, but currently more than 100 countries have
undertaken this framework to battle with tycoons using tax strategies (www.oecd.org/tax/beps/).
43
and of those 2 million, about 4-6% pay only a symbolic amount of tax and 11% do not pay any taxes
at all (Amos, 2013).
India
The corporate tax rate in India stands at 35%, i.e., more than ten percentage points above the OECD
average corporate tax rate. It has recently shown that the average tax paid by corporate taxpayers has
increased from Rs 32.28 lakh (3.228 million) in the year 2014-2015 to Rs.49.95 lakh (4.995 million)
in the year 2017-2018, a growth of 55% (Press Information Bureau, 2018). However, along with this
growth of tax revenue, millions of rupees are stolen from the system. According to research by the
UN University World Institute for Development Economics Research, India loses over $40 billion in
revenue due to tax avoidance. Specifically, India loses $74 million only from the four largest US
pharmaceutical companies, according to Oxfam. Although a huge amount of money is stolen from
the nation, it is interesting that the issues regarding multinational tax avoidance has rarely been
brought up to the front pages of popular Indian newspapers and has never been discussed on
primetime TV news debates. In addition, no question relating to tax avoidance was raised in the
Sixteenth Lower House of Parliament during the 2014-2019 period (Goel, 2019). While other
countries have been in the fight against tax avoidance following the OECD’s BEPS recommendations
since 2013, the Indian government only introduced a general anti-avoidance rule (GAAR) in 2017,
only after the case of Vodafone (Goel, 2019).
China
China’s tax administration has improved substantially over the last 20 years in the face of major
changes in the economy and the tax system. Since 1994, China’s tax legislation has been
comprehensively reformed to address problems hindering tax revenues collecting by authorities. The
main problems are from a weak tax administration including a lack of equity where different treatment
is applicable to different types of taxpayers and transactions, inefficiency where the rate structure
encourages some types of investment over others, and administrative complexity where there are
multiplicity of rates and bases (Brondolo & Zhang, 2016; Gamble, 2000). These problems bring a
growing incidence of tax evasion. Yu (1997) (in Brondolo & Zhang, 2016) estimates and reveals that
up to 30% of state-owned firms, 60% of joint ventures, 80% of private firms, and 100% of individual
street vendors are unable to comply with their tax obligations in the mid-1990s. The State Taxation
Administration (STA) thus simplified the tax system by reducing the number of taxes from 35

44
different taxes to 18 today. This simplification leads to lower costs both administrative costs for the
SAT and compliance costs for taxpayers.
Even though China’s tax law has been improved, it is unable to tackle the problem of tax avoidance.
Under corporate income tax rate at 25% (topping the OECD average of 23.5%), China loses an
estimated $66.8 billion as a result of profit shifting through tax havens, ranked the second place after
the US’s losses (Cobham and Janský, 2017). In addition to the losses from profit shifting, China loses
trillions of Yuan from the malpractices of local businesses (Clayton, 2016). In China, the Tax Bureau
uses the Fapiao invoice system as a main tool to control over tax collection by compelling companies
to pay tax in advance on their future sales. Every payment that firms receive will be made aware by
the Tax Bureau from this Fapiao machine. In this way, the Fapiao invoice system is supposed to serve
as a warranty against tax evasion within the country, but it also leads to the unintended consequences
(Gamble, 2000). Companies attempt to find ways to avoid taxes by taking part in the practices such
as offering two prices for the purchase of goods or services - one with Fapiao, and a lower one
without, or making a fake Fapiao by paying an existing supplier a few extra % for surplus Fapiao
(Clayton, 2016). Bribery is also a problem where there are no independent parties to supervise the
works of tax officials, especially at the local levels (Gamble, 2000).
South Africa
In South Africa, the corporate income tax rate is 28%, and its amount is accounted for 19% of all tax
receipts (Wier, 2019). Profit shifting is shown to be a “significant leakage” (seven billion ZAR a year,
amounting to about 4% of corporate income tax receipts) in the tax system. Wier & Reynolds (2018)
recently report that 98% of the tax loss in South Africa is undertaken by the top 10% of foreign-
owned firms through forms of profit-shifting (e.g., transfer pricing). Even though these firms are
around 2,000 (out of 1.2-million South African firms), their sales volumes account for more than 30%
of the total sales. The study also shows that Switzerland is the main destination for siphoned-off
profits; half of all profits are shifted from South Africa. A clear incentive for those firms to shift
profits out of South Africa is the high tax rate: the rate is 28% in South Africa whereas there is only
8.5% rate in Switzerland. Moreover, when compared with the world average corporate tax rate of
23.03% (Tax Foundation, 2018), it ostensibly illustrates that the corporate tax rate in South Africa is
relatively high. Another prime reason that keeps South Africa in this situation is the enforcement of
its law. Although tax legislation on transfer mispricing in South Africa has been amended in line with
the OECD’s BEPS programme to meet the minimum standards since 2012, the levels of transfer
mispricing go back to the former levels before The National Treasure enforces the revised rules by

45
2015 (Bisseker, 2018). This is because the new legislation is not being matched by greater
enforcement so that companies once realized that they had not been audited, they revert back to their
old ways (Wier & Reynolds, 2018).
2.8. Conclusion
Tax avoidance is a practice that offers ways to reduce corporate expenses, i.e., tax expenses. It is an
increasingly debated issue due to the argument that tax avoidance could be legal practices. On the
contrary, the levels of tax avoidance, observed through several tax-avoiding scandals, go beyond the
acceptable levels, leading to economic problems both at the domestic and the global levels. Issues
related to tax avoidance behaviours have been examined in the literature mainly in the context of
developed markets. Although emerging markets show that their economy has grown dramatically in
the last decade, their ability to combat tax avoidance practices of firms is constrained by the limited
resources. Therefore, the current study aims to fill this gap by investigating issues relating to the
practices of tax avoidance in emerging markets where their business practices have a significant
impact on the global economy.
Theoretically, the practise of tax avoidance is due to both agency issues and information asymmetry.
The separation of ownership in business causes agency issues where managers’ interests may not the
same as their principles’ interests. The principals thus attempt to mitigate this problem by aligning
the manager’s incentives with their incentives, practically by binding the manager’s incentives with
after-tax performance. The firms’ managers who have more information compared to outsiders can
manage transactions in their favour to increase after-tax profits and receive their reward packages.
However, the levels of tax avoidance vary across firms, depending on particular factors that firms
face, both at the firm and country levels.
This thesis, therefore, investigates three topical yet contentious issues determining the degree of tax
avoidance, i.e., CSR, earnings management, and accounting conservatism. Chapter 3 explores the
relationship between tax avoidance and CSR. Chapter 4 investigates the association between tax
avoidance and earnings management. Chapter 5 analyses the link between tax avoidance and
accounting conservatism. All three studies examine a sample of listed firms domiciled in the BRICS
countries: Brazil, Russia, India, China, and South Africa.

46
References
Amos, H. (2013). Russia loses £52bn a year in tax evasion and illegal transfers. [online] the
Guardian. Available at: https://www.theguardian.com/world/2013/feb/21/russia-loses-52-
billion-tax-evasion [Accessed 19 Jul. 2019].
Ahmed, A. S., Neel, M., & Wang, D. (2013). Does mandatory adoption of IFRS improve accounting
quality? Preliminary evidence. Contemporary Accounting Research, 30(4), 1344–1372.
https://doi.org/10.1111/j.1911-3846.2012.01193.x
Allingham, M., & Sandmo, A. (1972). Income Tax Evasion: A Theoretical analysis. Journal of Public
Economics, 1, 323–338. https://doi.org/10.1016/0047-2727(72)90010-2
Armstrong, C. S., Blouin, J. L., Jagolinzer, A. D., & Larcker, D. F. (2015). Corporate Governance ,
Incentives, and Tax Avoidance. Journal of Accounting and Economics, 60(1), 1–17.
https://doi.org/10.1016/j.jacceco.2015.02.003
Armstrong, C. S., Blouin, J. L., & Larcker, D. F. (2012). The incentives for tax planning. Journal of
Accounting and Economics, 53(1–2), 391–411. https://doi.org/10.1016/j.jacceco.2011.04.001
Atwood, T. J., Drake, M. S., Myers, J. N., & Myers, L. a. (2012). Home country tax system
characteristics and corporate tax avoidance: International evidence. The Accounting Review,
87(6), 1831–1860. https://doi.org/10.2308/accr-50222
Avi-Yonah, R. S. (2006). Corporate Social Responsibility and Strategic Management. Journal of
Management Studies, 43, 1629–1641. https://doi.org/10.1111/j.1467-6486.2006.00655.x
Badertscher, B., Katz, S. P., & Rego, S. O. (2010). The Impact of Private Equity Ownership on
Portfolio Firms’ Corporate Tax Planning.
Barclay, M. J., Heitzman, S. M., & Smith, C. W. (2017). Leverage and Taxes: Evidence from the
Real Estate Industry. Journal of Applied Corporate Finance, 29(4), 86–95.
https://doi.org/10.1111/jacf.12264
Beatty, A., & Harris, D. G. (1998). The Effects of Taxes , Agency Costs and Information Asymmetry
on Earnings Management : A Comparison of Public and Private Firms. Review of Accounting
Studies, 326(3), 299–326.
Belz, T., Hagen, D. Von, & Steffens, C. (2017). R&D Intensity and The Effective Tax Rate: A Meta-
Regression analysis. Journal of Economic Survey, 31(4), 988–1010.
https://doi.org/10.1111/joes.12181
Besley, T., & Persson, T. (2014). Why Do Developing Countries Tax So Little? Journal of Economic
Perspectives, 28(4), 99–120. https://doi.org/10.1257/jep.28.4.99

47
Bird, R., & Davis-Nozemack, K. (2018). Tax Avoidance as a Sustainability Problem. Journal of
Business Ethics, 151(4), 1009–1025. https://doi.org/10.1007/s10551-016-3162-2
Bisseker, C. (2018). EXCLUSIVE: Corporates leave R7bn tax hole in SA. [online] BusinessLIVE.
Available at: https://www.businesslive.co.za/fm/features/2018-12-20-exclusive-corporates-
leave-r7bn-tax-hole-in-sa/ [Accessed 16 Jul. 2019].
Blouin, J. L., Krull, L. K., & Robinson, L. A. (2012). Is U.S. Multinational Dividend Repatriation
Policy Influenced by Reporting Incentives? The Accounting Review, 87(5), 1463–1491.
https://doi.org/10.2308/accr-50193
Braga, R. N. (2017). Effects of IFRS adoption on tax avoidance. Revista Contabilidade & Finanças
28:75, 407-424.
Brondolo, J., & Zhang, Z. (2016). Tax Administration Reform in China: Achievements, Challenges,
and Reform Priorities.
Brooks, C., Godfrey, C., Hillenbrand, C., & Money, K. (2016). Do investors care about corporate
taxes ? Journal of Corporate Finance, 38(January 2000), 218–248.
https://doi.org/10.1016/j.jcorpfin.2016.01.013
Cazier, R. A., S. O. Rego, X. Tian, and R. J. Wilson. 2009. Early Evidence on the Determinants of
Unrecognized Tax Benefits. Working paper, The University of Iowa
Chan, K. Hung, Lin, K. Z., & Mo, P. L. L. (2010). Will a departure from tax-based accounting
encourage tax noncompliance? Archival evidence from a transition economy. Journal of
Accounting and Economics, 50(1), 58–73. https://doi.org/10.1016/j.jacceco.2010.02.001
Chan, Koon Hung, Lin, K. Z., & Tang, F. (2013). Tax effects of book-tax conformity, financial
reporting incentives and firm size. Journal of International Accounting Research, 12(2), 1–25.
https://doi.org/10.2308/jiar-50404
Chen, E., & Gavious, I. (2017). The roles of book-tax conformity and tax enforcement in regulating
tax reporting behaviour following International Financial Reporting Standards adoption.
Accounting and Finance, 57, 681–699. https://doi.org/10.1111/acfi.12172
Chen, S., Chen, X., Cheng, Q., & Shevlin, T. (2010). Are family firms more tax aggressive than non-
family firms? Journal of Financial Economics, 95(1), 41–61.
https://doi.org/10.1016/j.jfineco.2009.02.003
Cheng, C. S. A., Huang, H. H., Li, Y., & Stanfield, J. (2012). The Effect of Hedge Fund Activism on
Corporate Tax Avoidance. The Accounting Review, 87(5), 1493–1526.
https://doi.org/10.2308/accr-50195

48
Christensen, J., & Murphy, R. (2004). The social irresponsibility of corporate tax avoidance: Taking
CSR to the bottom line. Development, 47(3), 37–44.
https://doi.org/10.1057/palgrave.development.1100066
Chyz, J. A. (2013). Personally tax aggressive executives and corporate tax sheltering. Journal of
Accounting and Economics, 56(2–3), 311–328. https://doi.org/10.1016/j.jacceco.2013.09.003
Cranford, S., Murias, F., & Schutzman, M. (2012). Elevating Tax Department Productivity with an
Efficiency Dividend. Tax Executive, 64, 57.
Cravens, K. S. 1997. “Examining the Role of Transfer Pricing as a Strategy for Multinational national
Firms.” International Business Review, 6 (2), 127–45.
Clayton, A. (2016). Tax Evasion in China. The Trillion Yuan Heist. [online] Linkedin.com. Available
at: https://www.linkedin.com/pulse/tax-evasion-china-trillion-yuan-heist-andy-clayton
[Accessed 17 Jul. 2019].
Clemente, F., & Lirio, V. S. (2017). Tax Evasion in Brazil and the Institutions to Control.
International Journal of Accounting and Financial Reporting, 7(1), 73–85.
https://doi.org/10.5296/ijafr.v7i1.10679
Cowan, W. N., Chang, T., Inglesi-Lotz, R., & Gupta, R. (2014). The nexus of electricity consumption,
economic growth and CO2 emissions in the BRICS countries. Energy Policy, 66, 359–368.
https://doi.org/10.1016/j.enpol.2013.10.081
Cowell, F. A. (1990). Tax Sheltering and Cost of Evasion. Oxford Journal, 42(1), 231–243.
Crocker, K. J., & Slemrod, J. (2005). Corporate tax evasion with agency costs. Journal of Public
Economics, 89(9–10), 1593–1610. https://doi.org/10.1016/j.jpubeco.2004.08.003
Desai, M. A., & Dharmapala, D. (2006). Corporate tax avoidance and high-powered incentives.
Journal of Financial Economics, 79(1), 145–179. https://doi.org/10.1016/j.jfineco.2005.02.002
Desai, M. A., & Dharmapala, D. (2009). Corporate tax avoidance and firm value. Review of
Economics and Statistics, 91(3), 537–546. https://doi.org/10.1162/rest.91.3.537
Desai, M. A., Dyck, A., & Zingales, L. (2007). Theft and taxes. Journal of Financial Economics,
84(3), 591–623. https://doi.org/10.1016/j.jfineco.2006.05.005
Desai, Ma, & Dharmapala, D. (2009). Earnings management and corporate tax shelters. National Tax
Journal, 62(1), 169–186. https://doi.org/http://dx.doi.org/10.2139/ssrn.884812
Desai, Mihir a., Foley, C. F., & Hines, J. R. (2006). The demand for tax haven operations. Journal of
Public Economics, 90(3), 513–531. https://doi.org/10.1016/j.jpubeco.2005.04.004

49
Dharmapala, D., & Hines, J. R. (2009). Which countries become tax havens? Journal of Public
Economics, 93(9–10), 1058–1068. https://doi.org/10.1016/j.jpubeco.2009.07.005
Dong, K., Sun, R., & Hochman, G. (2017). Do natural gas and renewable energy consumption lead
to less CO2 emission? Empirical evidence from a panel of BRICS countries. Energy, 141, 1466–
1478. https://doi.org/10.1016/j.energy.2017.11.092
Dowling, G. R. (2014). The Curious Case of Corporate Tax Avoidance: Is it Socially Irresponsible?
Journal of Business Ethics, 124(1), 173–184. https://doi.org/10.1007/s10551-013-1862-4
Drake, K. D., Lusch, S. J., & Stekelberg, J. (2019). Does Tax Risk Affect Investor Valuation of Tax
Avoidance? Journal Accounting , Auditing & Finance, 34(1), 151–176.
https://doi.org/10.1177/0148558X17692674
Dunbar, A., Higgins, D. M., Phillips, J. D., & Plesko, G. A. (2010). What Do Measures of Tax
Aggressive Measure? Proceedings of the National Tax Association Annual Conference on
Taxation, 18–26.
Dyck, A., & Zingales, L. (2004). Private Benefits of Control: An International Comparison. The
Journal of Finance, 59(2), 537–600.
Dyreng, S. D., Hanlon, M., & Maydew, E. L. (2008). Long-run corporate tax avoidance. Accounting
Review, 83(1), 61–82.
Dyreng, S. D., Hanlon, M., & Maydew, E. L. (2010). The effects of executives on corporate tax
avoidance. Accounting Review, 85(4), 1163–1189. https://doi.org/10.2308/accr.2010.85.4.1163
Faulkender, M., & Smith, J. M. (2016). Taxes and Leverage at Multinational Corporations. Journal
of Financial Economics, 122(1), 1–20. https://doi.org/10.1016/j.jfineco.2016.05.011
Fernández-Rodríguez, E., & Martínez-Arias, A. (2012). Do Business Characteristics Determine an
Effective Tax Rate? Evidence for Listed Companies in China and the. The Chinese Economy,
45(6), 60–83. https://doi.org/10.2753/CES1097-1475450604
Fernández-Rodríguez, E., & Martínez-Arias, A. (2014). Determinants of the Effective Tax Rate in
the BRIC Countries. Emerging Markets Finance and Trade, 50(3214–228).
https://doi.org/10.2753/REE1540-496X5003S313
Francis, J., LaFond, R., Olsson, P., & Schipper, K. (2005). The market pricing of accruals quality.
Journal of Accounting and Economics, 39(2), 295–327.
https://doi.org/10.1016/j.jacceco.2004.06.003
Frank, M. M., Lynch, L. J., & Rego, S. O. (2009). Tax reporting aggressiveness and its relation to
aggressive financial reporting. The Accounting Review, 84(2), 467–496.
https://doi.org/10.2308/accr.2009.84.2.467

50
Gaertner, F. B. (2014). CEO after-tax compensation incentives and corporate tax avoidance.
Contemporary Accounting Research, 31(4), 1077–1102. https://doi.org/10.1111/1911-
3846.12058
Gamble, W. (2000). The Middle Kingdom Runs Dry: Tax Evasion in China. Foreign Affairs, 79(6),
16. https://doi.org/10.2307/20049964
Gammeltoft, P. (2008). Emerging Multinationals: Outward FDI from the BRICS countries.
International Journal of Technology and Globalization, 4(1), 5–22.
https://doi.org/10.1504/IJTG.2008.016184
Gao, L., Yang, L. L., & Zhang, J. H. (2016). Corporate patents, R&D success, and tax avoidance.
1063–1096. https://doi.org/10.1177/0148558X17726141
Goel, S. (2019). India needs to rethink attitude towards corporate tax avoidance - Kluwer
International Tax Blog. [online] Kluwer International Tax Blog. Available at:
http://kluwertaxblog.com/2019/04/08/india-needs-to-rethink-attitude-towards-corporate-tax-
avoidance/ [Accessed 18 Jul. 2019].
Graham, J. R., Hanlon, M., Shevlin, T., & Shroff, N. (2014). Incentives for Tax Planning and
Avoidance : Evidence from the Field. The Accounting Review, 89(3), 991–1023.
https://doi.org/10.2308/accr-50678
Graham, J. R., & Tucker, A. L. (2006). Tax shelters and corporate debt policy. Journal of Financial
Economics, 81(3), 563–594. https://doi.org/10.1016/j.jfineco.2005.09.002
Grubert, H., & Mutti, J. (1991). Taxes, Tariffs and Transfer Pricing in Multinational Corporate
Decision Making. The Review of Economics and Statistics, 73(2), 285-293.
doi:10.2307/2109519
Gupta, S., & Newberry, K. (1997). Determinants of the Variability in Corporate Effective Tax Rates:
Evidence from Longitudinal Data. Journal of Accounting and Public Policy, 16(1), 1–34.
Hanlon, M., & Heitzman, S. (2010). A review of tax research. Journal of Accounting and Economics,
50(2–3), 127–178. https://doi.org/10.1016/j.jacceco.2010.09.002
Hanlon, M., & Slemrod, J. (2009). What does tax aggressiveness signal? Evidence from stock price
reactions to news about tax shelter involvement. Journal of Public Economics, 93(1–2), 126–
141. https://doi.org/10.1016/j.jpubeco.2008.09.004
Hardeck, I., & Hertl, R. (2014). Consumer reactions to corporate tax strategies: Effects on corporate
reputation and purchasing behavior. Journal of Business Ethics, 123(2), 309–326.
https://doi.org/10.1007/s10551-013-1843-7

51
Harris, M. N., & Feeny, S. (2000). Habit Persistence in Effective Tax Rates: Evidence Using
Australian Tax Entities (Issue Melbourne Institute Working Paper No. 13/00).
Hasan, I., Hoi, C. K., Wu, Q., & Zhang, H. (2017). Does Social Capital Matter in Corporate
Decisions? Evidence from Corporate Tax Avoidance. Journal of Accounting Research, 55(3),
629–668. https://doi.org/10.1111/1475-679X.12159
Haugen, H. M. (2018). Midas’ Gift Means Death: Tax Dodging is the Giggest Obstacle for Global
Justice. Etikk i Praksis: Nordic Journal of Applied Ethics, 12(1), 43–60.
Henry, E., & Sansing, R. (2018). Corporate tax avoidance: data truncation and loss firms. Review of
Accounting Studies, 23(3), 1042–1070. https://doi.org/10.1007/s11142-018-9448-0
Hicks, H., D. Soto, and B. Jenn. (2009). Hey you kids! Get off my lawn! Living with your (grumpy)
granddad’s foreign tax credit: The foreign tax credit in a non-income tax world and the prospects
of seeing a territorial tax system (if not Russia) from your front porch. Taxes—the Tax Magazine
87 (3): 75–99.
Hoi, C. K., Wu, Q., & Zhang, H. (2013). Is corporate social responsibility (CSR) associated with tax
avoidance? Evidence from irresponsible CSR activities. The Accounting Review, 88(6), 2025–
2059. https://doi.org/10.2308/accr-50544
Hoopes, J. L., Mescall, D., & Pittman, J. A. (2012). Do 1RS Audits Deter Corporate Tax Avoidance ?
The Accounting Review, 87(5), 1603–1639. https://doi.org/10.2308/accr-50187
Hung, M., & Subramanyam, K. (2007). Financial statement effects of adopting international
accounting standards: The case of Germany. Review of Accounting Studies, 12(4), 21−48.
Huseynov, F., & Klamm, B. K. (2012). Tax avoidance , tax management and corporate social
responsibility. Journal of Corporate Finance, 18(4), 804–827.
https://doi.org/10.1016/j.jcorpfin.2012.06.005
Irianto, B. S., Sudibyo, Y. A., & Ak, A. W. S. (2017). The Influence of Profitability , Leverage , Firm
Size and Capital Intensity Towards Tax Avoidance. International Journal of Accounting and
Taxation, 5(2), 33–41. https://doi.org/10.15640/ijat.v5n2a3
Ivanenko, V. (2005). The statutory tax burden and its avoidance in transitional Russia. Europe-Asia
Studies, 57(7), 1021–1045. https://doi.org/10.1080/09668130500301642
Jaafar, A., & Thornton, J. (2015). Tax havens and effective tax rates: An analysis of private versus
public european firms. The International Journal of Accounting, 50(4), 435–457.
https://doi.org/10.1016/j.intacc.2015.10.005
Janský, P., & Palanský, M. (2019). Estimating the scale of profit shifting and tax revenue losses
related to foreign direct investment. In International Tax and Public Finance. Springer US.
https://doi.org/10.1007/s10797-019-09547-8

52
Janský, P., & Prats, A. (2015). International profit-shifting out of developing countries and the role
of tax havens. Development Policy Review, 33(3), 271–292. https://doi.org/10.1111/dpr.12113
Jackson, J. (1996). An Introduction to Business Ethics, Oxford, Blackwell Publishers, pp.156-157.
Jensen, C., & Meckling, H. (1976). Theory of the Firm: Managerial Behavior, Agency Costs and
Ownership Structure. Journal of Financial Economics, 3, 305–360.
Johannesen, N., Tørsløv, T., & Wier, L. (2017). Are less developed countries more exposed to
multinational tax avoidance ? Method and evidence from micro-data (Issue May).
Karampinis, N. I., & Hevas, D. L. (2013). Effects of IFRS Adoption on Tax-induced Incentives for
Financial Earnings Management: Evidence from Greece. International Journal of Accounting,
48(2), 218–247. https://doi.org/10.1016/j.intacc.2013.04.003
Kay, J. A. (1980). The anatomy of tax avoidance. Income Distribution: The Limits to Redistribution,
135-148.
Khan, M., Srinivasan, S., & Tan, L. (2016). Institutional ownership and corporate tax avoidance: New
evidence. Accounting Review, 92(2), 101–122. https://doi.org/10.2308/accr-51529
Kim, J.-B., Li, Y., & Zhang, L. (2011). Corporate tax avoidance and stock price crash risk: Firm-
level analysis. Journal of Financial Economics, 100(3), 639–662.
https://doi.org/10.1016/j.jfineco.2010.07.007
Kim, K. A., & Limpaphayom, P. (1998). Taxes and Firm Size in Pacific-Basin Emerging Economies.
Journal of International Accounting, Auditing and Taxation, 7(1), 47–68.
Kinney, Michael and Lawrence, Janice (2000), An Analysis of the Relative U.S. Tax Burden of U.S.
Corporations Having Substantial Foreign Ownership, National Tax Journal, 53:1, 9-22.
Klepper, Steven & Mazur, Mark & Nagin, Daniel, 1991. "Expert Intermediaries and Legal
Compliance: The Case of Tax Preparers," Journal of Law and Economics, University of Chicago
Press, vol. 34(1), pages 205-229, April.
Kubata, A., Lietz, G., & Watrin, C. (2013). Does Corporate Tax Avoidance Impair Earnings
Informativeness? https://doi.org/10.2139/ssrn.2363873
Lambert, R., Leuz, C., & Verrecchia, R. E. (2007). Accounting information, disclosure, and the cost
of capital. Journal of Accounting Research, 45(2), 385–420. https://doi.org/10.1111/j.1475-
679X.2007.00238.x
Lanis, R., & Richardson, G. (2012). Corporate social responsibility and tax aggressiveness: An
empirical analysis. Journal of Accounting and Public Policy, 31(1), 86–108.

53
https://doi.org/10.1016/j.jaccpubpol.2011.10.006
Lanis, R., & Richardson, G. (2013). Corporate social responsibility and tax aggressiveness: a test of
legitimacy theory. Accounting, Auditing & Accountability Journal, 26(1), 75–100.
https://doi.org/10.1108/09513571311285621
Lanis, R., & Richardson, G. (2015). Is corporate social responsibility performance associated with
tax avoidance? Journal of Business Ethics, 127(2), 439–457. https://doi.org/10.1007/s10551-
014-2052-8
Lanis, R., Richardson, G., Liu, C., & Mcclure, R. (2018). The Impact of Corporate Tax Avoidance
on Board of Directors and CEO Reputation. In Journal of Business Ethics. Springer Netherlands.
https://doi.org/10.1007/s10551-018-3949-4
Lietz, G. M. (2013). Determinants and Consequences of Corporate Tax Avoidance. In Ssrn.
https://doi.org/10.2139/ssrn.2363868
Lin, S., Riccardi, W., & Wang, C. (2012). Does accounting quality change following a switch from
U.S. GAAP to IFRS? Evidence from Germany. Journal of Accounting and Public Policy, 31(6),
641–657. https://doi.org/10.1016/j.jaccpubpol.2012.10.006
Lisowsky, P. (2010). Seeking Shelter: Empirically modeling tax shelters using financial statement
information. The Accounting Review, 85(5), 1693–1720.
https://doi.org/10.2308/accr.2010.85.5.1693
Lisowsky, P., Robinson, L., & Schmidt, A. (2013). Do Publicly Disclosed Tax Reserves Tell Us
About Privately Disclosed Tax Shelter Activity? Journal of Accounting Research, 51(3), 583–
629. https://doi.org/10.1111/joar.12003
Liu, X., & Cao, S. (2007). Determinants of Corporate Effective Tax Rates : Evidence from Listed
Companies in China. The Chinese Economy, 40(6), 49–67. https://doi.org/10.2753/CES1097-
1475400603
Mackie-mason, J. K. (1990). Do Taxes Affect Corporate Financing Decisions? The Journal of
Finance, 45(5), 1471–1493.
Manganaris, P., Spathis, C., & Dasilas, A. (2015). Journal of International Accounting , Auditing and
Taxation The effects of mandatory IFRS adoption and conditional conservatism on European
bank values. Journal of International Accounting, Auditing and Taxation, 24, 72–81.
https://doi.org/10.1016/j.intaccaudtax.2015.02.004
Markle, K. (2016). A Comparison of the Tax-Motivated Income Shifting of Multinationals in
Territorial and Worldwide Countries. Contemporary Accounting Research, 33(1), 7–43.
https://doi.org/10.1111/1911-3846.12148

54
Marshall, R., Smith, M., & Armstrong, R. (2005). Ethical Issues Facing Tax Professionals: A
Comparative Survey of Tax Agents and Big 5 Tax Practitioners in Australia (Issue 507).
Mascagni, G., Moore, M., & McCluskey, R. (2014). Tax revenue mobilisation in developing
countries: Issues and challenges. In Directorate-General for External Policies.
https://doi.org/10.2861/58312
McNair, D. (2010). A new social contract? Organisation for Economic Cooperation and
Development. the OECD Observer, (276), 32-33. Retrieved from https://search-proquest-
com.ezproxy.bangor.ac.uk/docview/217481509?accountid=14874
Mills, L. F., Nutter, S. E., & Schwab, C. M. (2013). The effect of political sensitivity and bargaining
power on taxes: Evidence from federal contractors. The Accounting Review, 88(3), 977–1005.
https://doi.org/10.2308/accr-50368
Minnick, K., & Noga, T. (2010). Do Corporate Governance Characteristics in Fluence Tax
Management? Journal of Corporate Finance, 16, 703–718.
https://doi.org/10.1016/j.jcorpfin.2010.08.005
Mukhlasin, M., & Anissa, N. (2018). Investor Perception of Tax Avoidance and Quality of Earnings
Information. Research Journal of Financial and Accounting, 9(12), 72–78.
O’Neill, J. (2001). Building Better Global Economic BRICs. Goldman Sachs Economic Research
Group, 1–16.
Otusanya, O. J. (2011). The role of multinational companies in tax evasion and tax avoidance: The
case of Nigeria. Critical Perspectives on Accounting, 22(3), 316–332.
https://doi.org/10.1016/j.cpa.2010.10.005
Palil, M. R., Malek, M. M., & Jaguli, A. R. (2016). Issues , Challenges and Problems with Tax
Evasion: The Institutional Factors Approach. Gadjah Mada International Journal of Business,
18(2), 187–206.
Payne, D. M., & Raiborn, C. A. (2018). Aggressive Tax Avoidance: A Conundrum for Stakeholders,
Governments, and Morality. Journal of Business Ethics, 147(3), 469–487.
https://doi.org/10.1007/s10551-015-2978-5
Phillips, J. D. (2003). Corporate tax-planning Effectiveness: The role of compensation-based
incentives. The Accounting Review, 78(3), 847–874.
Piper, L. (2015). The BRICS phenomenon: from regional economic leaders to global political players.
In Bicas (Issue April).
Plesko, G. (2004). Corporate tax avoidance and the properties of corporate earnings. National Tax
Journal, 57(3), 729–737. https://doi.org/10.17310/ntj.2004.3.12

55
Preuss, L. (2010). Tax avoidance and corporate social responsibility: you can’t do both, or can you?
Corporate Governance, 10(4), 365–374. https://doi.org/10.1108/14720701011069605
Radaev, V. (2001). Informal Institutional Arrangement and Tax Evasion in the Russian Economy.
The 5th Annual Meeting of International Society for New Institutional Economics, Session II-B
‘Taxation as an Institution,’ 13-15 September.
Radulescu, I. G., Panait, M., & Voica, C. (2014). BRICS Countries Challenge to the World Economy
New Trends. Procedia Economics and Finance, 8(14), 605–613. https://doi.org/10.1016/s2212-
5671(14)00135-x
Rego, S. O. (2003). Tax-avoidance activities of U.S. multinational corporations. Contemporary
Accounting Research, 20(4), 805–833. https://doi.org/10.1506/VANN-B7UB-GMFA-9E6W
Rego, S. O., & Wilson, R. (2012). Equity risk incentives and corporate tax aggressiveness. Journal
of Accounting Research, 50(3), 775–810. https://doi.org/10.1111/j.1475-679X.2012.00438.x
Richardson, G., & Lanis, R. (2007). Determinants of the variability in corporate effective tax rates
and tax reform: Evidence from Australia. Journal of Accounting and Public Policy, 26(6), 689–
704. https://doi.org/10.1016/j.jaccpubpol.2007.10.003
Roberts, C., & Armijo, L. E. (2014). The Emerging Powers and Global Governance: Why the BRICS
Matter. In Handbook of Emerging Economies (Issue January, pp. 1–27).
Sakurai, Y., & Braithwaite, V. (2003). Taxpayers’ Perceptions of Practitioners: Finding One Who is
Effective and Does the Right Thing? Journal of Business Ethics, 45, 375–387.
Santana, S. L. L., & Rezende, A. J. (2016). Corporate tax avoidance and firm value: evidence from
Brazil. Revista Contemporโnea de Contabilidade, 13(30), pp. 114–133.
https://doi.org/10.5007/2175-8069.2016v13n30p114
Schwaiger, M. (2004). Components and parameters of corporate reputation—An empirical study.
Schmalenbach Business Review, 56(1), 46–71.
Schwarz, P. (2009). Tax-avoidance strategies of American multinationals: An empirical analysis.
Managerial and Decision Economics, 30(8), 539–549.
Sebri, M., & Salha, B. O. (2014). On the causal dynamics between economic growth, renewable
energy consumption, CO2 emissions and trade openness: Fresh evidence from BRICS countries.
Renewable and Sustainable Energy, 39, 14–23.
Shackelford, D. A., & Shevlin, T. (2001). Empirical tax research in accounting: A discussion. Journal
of Accounting and Economics, 31(1–3), 321–387. https://doi.org/10.1016/S0165-
4101(01)00021-0

56
Shafer, W. E., & Simmon, R. S. (2008). Social responsibility, Machiavellianism and tax avoidance.
Accounting, Auditing & Accountability Journal, 21(5), 695–720.
Shelepov, A. (2017). Indonesia and the BRICS: Implementing the BEPS Action Plan. International
Organisations Research Journal, 12(3), 114–136. https://doi.org/10.17323/1996-7845-2017-
03-114
Sikka, P. (2010). Smoke and mirrors : Corporate social responsibility and tax avoidance. Accounting
Forum, 34, 153–168. https://doi.org/10.1016/j.accfor.2010.05.002
Slemrod, J. (2004). The Economics of Corporate Tax Selfishness. NBER Working Paper Series, 53,
1689–1699. https://doi.org/10.1017/CBO9781107415324.004
Slemrod, J., & Yitzhaki, S. (2002). Tax Avoidance, Evasion, and Administration. In Handbook of
Public Economics (Issue January, pp. 1423–1470). https://doi.org/10.1016/S1573-
4420(02)80026-X
Stainer, A., Stainer, L., & Segal, A. (1997). The Ethics of Tax Planning. A European Review, 6(4),
213–219.
Steijvers, T., & Niskanen, M. (2014). Tax aggressiveness in private family firms: An agency
perspective. Journal of Family Business Strategy, 5(4), 347–357.
https://doi.org/10.1016/j.jfbs.2014.06.001
Stickney, C. P., & Mcgee, V. E. (1982). Effective Corporate Tax Rates The Effect of Size, Capital
Intensity, Leverage, and Other Factors. Journal of Accounting and Public Policy, 152(1), 125–
152.
Vijayakumar, N., Sridharan, P., & Chandra Sekhara Rao, K. (2010). Determinants of FDI in BRICS
countries: A panel analysis. International Journal of Business Science & Applied Management,
5(3), 1–13.
Watts, R., Zimmerman, J., 1986. In: Positive Accounting Theory. Prentice-Hall Inc.
West, A. (2018). Multinational Tax Avoidance: Virtue Ethics and the Role of Accountants. Journal
of Business Ethics, 153(4), 1143–1156. https://doi.org/10.1007/s10551-016-3428-8
Wier, L. (2019). New research on profit shifting and corporate tax avoidance. [online] BBrief.
Available at: https://www.bbrief.co.za/2019/01/03/new-research-on-profit-shifting-and-
corporate-tax-avoidance/ [Accessed 16 Jul. 2019].
Wier, L., & Reynolds, H. (2018). Big and “unprofitable”: How 10% of Multinational firms do 98%
of Profit-Shifting (No. 111; Issue December).

57
Wilson, R. J. (2009). An examination of corporate tax shelter participants. The Accounting Review,
84(3), 969–999. https://doi.org/10.2308/accr.2009.84.3.969
Wrightsman, D. (1978). Tax Shield Valuation and the Capital Structure Decision. The Journal of
Finance, 33(2), 650–656.
Wu, Liansheng, Wang, Y., Luo, W., & Gillis, P. (2012). State Ownership, Tax Status and Size Effect
of Effective Tax Rate in China. Accounting and Business Research, 42(2), 97–114.
https://doi.org/10.1080/00014788.2012.628208
Wu, Lifeng, Liu, S., Liu, D., Fang, Z., & Xu, H. (2015). Modelling and forecasting CO2 emissions
in the BRICS (Brazil, Russia, India, China, and South Africa) countries using a novel multi-
variable grey model. Energy, 79(C), 489–495. https://doi.org/10.1016/j.energy.2014.11.052
Yakovlev, A. (2001). “Black Cash” Tax Evasion in Russia: Its Forms, Incentives and Consequences
at Firm Level. Europe-Asia Studies, 53(1), 33–55. https://doi.org/10.1080/09668130125520
Zimmerman, J., 1983. Taxes and firm size. Journal of Accounting and Economics 5 (2), 119–149.

58
Appendix: Determinants of tax avoidance
Author Key Measure Sample and Period Findings
Multinational Corporations
Rego (2003) Cash ETR 19,737 firm-year observations during
1990-1997
Smaller (political cost), more profitable, and more extensive
foreign operations
Schwarz (2009) Nominal Tax Rate; Cash ETR 50 countries data during 1999-2001 More profit shifting, particularly in countries with tax rate
below 10%
Wilson (2009) BTD 59 firms accused by the government of
engaging tax shelter activity.
More foreign operations, subsidiaries in tax heaven
Jaafar & Thornton (2015) Current ETR; Current Tax Expense /
Operating Cash Flow
All firm-year observations both public
and private firms during 2001-2008
Firm with subsidiaries in tax haven
Ownership Structure
Chen et al. (2010) GAAP ETR; Cash ETR;
Total BTD; Abnormal BTD
3,865 firm-year from 1,003 firms in the
S&P 1500 index during 1996-2000
Public family firms avoid fewer taxes than public non-
family firms
Badertscher et al. (2013) GAAP ETR; Cash ETR;
Permanent BTD; Wilson (2009)
measure of tax sheltering
All firm-year observations for any 31
years during 1980-2010
Management-owned private firms avoid fewer income tax
than private equity (PE)- backed firms
Steijvers and Niskanen (2014) GAAP ETR 600 SMEs operating in Finland during
2000-2005
Private family firms avoid fewer taxes than private non-
family firms
CEO with lower ownership share is more tax aggressive
Incentive Compensation
Phillip (2003) GAAP ETR 237 survey responses during 1995-1996 High after-tax performance-based incentive for business-
unit managers, but not CEOs
Desai and Dharmapala
(2006)
BTD Large firms during 1993-2001 Low equity-based compensation, weaker shareholder rights
Rego and Wilson (2012) Discretionary permanent BTD; A tax
shelter prediction score; The five-year
Cash ETR; Unrecognized tax benefits
(UTB)
Various sources of data during 1992-
2009
High managerial risk-taking equity incentives
Gaertner (2014) GAAP ETR; Cash ETR All S&P 500 firms in 2010 Higher compensation-to-tax sensitivities
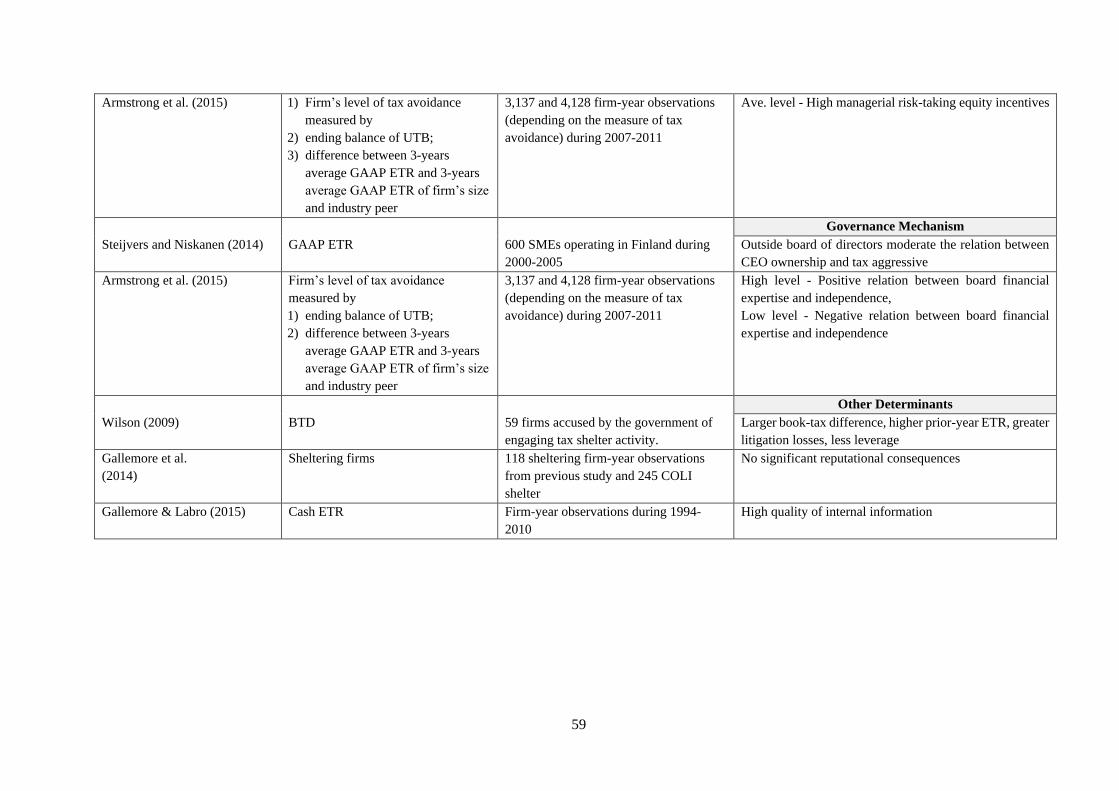
59
Armstrong et al. (2015) 1) Firm’s level of tax avoidance
measured by
2) ending balance of UTB;
3) difference between 3-years
average GAAP ETR and 3-years
average GAAP ETR of firm’s size
and industry peer
3,137 and 4,128 firm-year observations
(depending on the measure of tax
avoidance) during 2007-2011
Ave. level - High managerial risk-taking equity incentives
Governance Mechanism
Steijvers and Niskanen (2014) GAAP ETR 600 SMEs operating in Finland during
2000-2005
Outside board of directors moderate the relation between
CEO ownership and tax aggressive
Armstrong et al. (2015) Firm’s level of tax avoidance
measured by
1) ending balance of UTB;
2) difference between 3-years
average GAAP ETR and 3-years
average GAAP ETR of firm’s size
and industry peer
3,137 and 4,128 firm-year observations
(depending on the measure of tax
avoidance) during 2007-2011
High level - Positive relation between board financial
expertise and independence,
Low level - Negative relation between board financial
expertise and independence
Other Determinants
Wilson (2009) BTD 59 firms accused by the government of
engaging tax shelter activity.
Larger book-tax difference, higher prior-year ETR, greater
litigation losses, less leverage
Gallemore et al.
(2014)
Sheltering firms 118 sheltering firm-year observations
from previous study and 245 COLI
shelter
No significant reputational consequences
Gallemore & Labro (2015) Cash ETR Firm-year observations during 1994-
2010
High quality of internal information

Chapter 3 Tax Avoidance and Corporate Social Responsibility (CSR)
Tax Avoidance and Corporate Social
Responsibility (CSR)
3.1. Introduction
“Taxes are what we pay for civilized society.”
Oliver Wendell Holmes, 1904
Although it is widely believed that all citizens including corporations have a civic responsibility to
pay tax18 (Hasan et al., 2017; Preuss, 2010), tax avoidance has continued to be corporate practices in
arranging transactions to reduce their tax liability. On the one hand, tax avoidance is considered as a
mechanism to increase shareholders' wealth by reducing corporate costs (Hanlon & Heitzman, 2010;
Hanlon & Slemrod, 2009; Robinson et al., 2010). On the other hand, losses from corporate tax
avoidance result in adverse impacts on society both in term of the economy and human well-being
(Christensen & Murphy, 2004; Preuss, 2012; Salihu, Annuar, & Sheikh Obid, 2015). By concealing
tax avoidance schemes, markets cannot make a rational assessment based on corporate reported
profits, hence, significantly affecting the functioning of the market, such as mispricing the risks and
misallocating resources. Furthermore, the government could not measure the actual health of the
economy, leading to inappropriate economic policies because the state cannot distinguish whether
the profits reported by a company are generated by undertaking greater economic activities or by
simply transferring the returns owed to society (Rudu, 2012; Sikka, 2009). Since tax avoidance
schemes are aimed to transfer the profit expected to society to shareholders, the government loses
funds that could be used to improve public infrastructure. As such, tax avoidance is viewed as socially
irresponsible behaviour (Dowling, 2014). This is because corporations do not act as a good citizen by
18 Social contract is viewed as an agreement, either explicit or tacit, between the state and individual to form society and
the individual need to follow such agreement in exchange for the right to continue its existing in society. Therefore,
corporation as part of citizens in society must pay the right tax amount (respecting the law) in return for mutual benefits
(McNair, 2010; Tax and the social contract, 2016).

61
not paying their fair share of taxes (Huseynov & Klamm, 2012). Given this, research on corporate
tax avoidance in the context of corporate social responsibility (CSR) is encouraged (Avi-Yonah,
2014; Desai & Dharmapala, 2006; Dowling, 2014; Sikka, 2010).
Even though prior studies have documented the possible causality relation between tax avoidance
practices and CSR (see Appendix 3.1), they do not conclude a particular direction of its connection.
Some argue that CSR is the consequence of tax avoidance (e.g., Lanis & Richardson, 2013), others
expose that the CSR is a driver of tax avoidance (Hoi et al., 2013; Huseynov & Klamm, 2012; Laguir
et al., 2015; Lanis & Richardson, 2012, 2015). Further, the results are still mixed; whilst some studies
note that firms that act as a good citizen are also involved in tax avoidance behaviours (Lanis &
Richardson, 2013; Preuss, 2010, 2012; Sikka, 2010), others argue contrarily that firms with higher
level of CSR engagement are less likely to engage in tax avoidance (Hoi et al., 2013; Huseynov &
Klamm, 2012; Kiesewetter & Manthey, 2017; Laguir et al., 2015; Lanis & Richardson, 2012, 2015).
Moreover, prior literature mostly examines data from developed countries such as the United States,
the United Kingdom, and Australia. To fill the gap in the literature, this study examines the
relationship between tax avoidance and CSR focusing on emerging countries represented through
BRICS group of countries which include Brazil, Russia, India, China, and South Africa. Further, this
study uses the widely used theories of legitimacy theory, stakeholder theory, reputation risk
management, organized hypocrisy, and corporate culture to explain the relation between tax
avoidance and CSR. More specifically, on the one hand, this study explores whether firms have
obligated to a broad range of stakeholders by implementing the strategy of tax compliance along with
CSR engagement. On the other hand, this study examines whether BRICS firms are engaging in
organized hypocrisy by simultaneously practising tax avoidance activities and
demonstrating/portraying to be socially responsible for maintaining legitimacy and mitigate the risk
from severe sanction of dodging tax.
As a real-world entity which encounters a variety of competitive environments (Lanis & Richardson,
2012), a business corporation needs support for its continued existence (Freeman, 1984). In gaining
a legitimated support, a corporation is expected to act in congruence with society's values and norms
(Dowling & Pfeffer, 1975). From this perspective, Chen & Roberts (2010) argue that legitimacy is
judged subjectively by various stakeholder groups; thus being legitimated depends on the value
system of stakeholder groups rather than the value system of the society as a whole. CSR, the idea
embracing the concepts of corporate philanthropy, sustainability, corporate citizenship (Ganescu &
Gangone, 2017) and considering the balance of stakeholders’ interests (Ubius and Alas, 2009), has

62
become an institutionalized feature of legitimated expectation (Brammer et al., 2012). Under
normative stakeholder view, if firms integrate institutionalization of CSR into its core strategies and
consistently practice in adopting them, this practice would become a corporate culture, a shared belief
that guide appropriate behaviours for various situations to achieve its success (Needle; 2004; Pohl,
2006; Ravasi and Schultz, 2006). As such, firms with high level of CSR would be more cautious
about engaging in aggressive tax avoidance as doing so may cause a negative perception towards the
firms and eradicate the reputation they receive from CSR activities (Lanis & Richardson, 2012).
Therefore, more socially responsible firms are likely to be less tax aggressive in nature.
Nevertheless, the perspective of instrumental stakeholder suggests that CSR could be an efficient tool
to minimize public scrutiny and safeguard their legitimacy (Cho & Patten, 2007; Magness, 2006). In
this case, firms engaging in CSR activities may be able to manage the risk of reputation loss due to
their tax avoidance behaviour because participating CSR activities signals to the public that firms
operate with cautions and concerns to an impact of their operations on the society (Godfrey, 2005).
Due to the conflicting demands of stakeholder groups, it is difficult for corporations to satisfy all
interests with one set of actions without discounting the benefits of others (Brunsson, 2003). When
corporations fail to achieve what they say, they then engage in hypocrisy in order to protect their
image, and in doing so, they engage in communicate CSR activities. This practice implies that the
actual action of firms is not consistent with their actual stance on social responsibility. Simply say,
while CSR is something about doing good, tax avoidance is perceived as irresponsible practice; the
discrepancies between CSR talk and tax-avoiding actions are seen to be sources of hypocrisy (Wagner
et al., 2009). Therefore, firms with high levels of CSR are more likely to engage in tax avoidance.
Using data from Thomson Reuter’s ASSET4 to proxy for CSR engagement from 2008 to 2015, the
main results show the positive relation between the annual effective tax rate (ETR) and CSR
engagement scores for both social and environmental performance. The results suggest that CSR
engagement is negatively associated with tax avoidance: the higher level of CSR, the lower level of
tax avoidance. The findings imply that companies in BRICS countries are committed to a wide range
of stakeholders, instead of shareholders exclusively, thereby executing a strategy of tax compliance
and CSR engagement. Since there may be a gap between the claims in CSR report and the actual
practices of CSR (Font et al., 2012), the replicated model is regressed based on CSR disclosure
measured through ESG scores on social and environmental disclosures from the Bloomberg database.
The results show that CSR disclosure does explain the level of tax avoidance in BRICS countries
only scores on social activities. At a country level, the association between tax avoidance and CSR is

63
consistent with the results of the main test, albeit only for firms in Russia, India, and China. Further,
this study finds that audit expertise which is proxied through the firm’s employment of Big4 audit
firms reduce the effect of CSR engagement on tax avoidance, but a firms’ foreign listing status does
not influence the relationship.
Additional robustness tests are also conducted to rule out alternative interpretations of primary results.
First, the study uses two alternative measures of CSR, the country-industry adjusted CSR mean
(McWilliams & Siegel, 2001) and high-low separated group (Lanis & Richardson, 2012). Second,
two alternative measures of ETR, one-year ETR as calculated by dividing income tax by operating
cash flows (Jaafar & Thornton, 2015; Karampinis & Hevas, 2013) and five-year ETR (Dyreng et al.,
2008), have been regressed on CSR measure used in the primary test. Lastly, country-mean scores of
CSR (Kim et al., 2014) have been used as the instrumental variables in regression model estimated
with the Two Stage Least Square (2SLS) method to alleviate the bias caused from endogeneity
problem. The results of robustness tests are consistent with those in the main tests. The robustness
tests, therefore, confirms the negative relationship between tax avoidance and CSR in the BRICS
group of nations.
This study contributes to the literature in the following ways. First, it provides a better understanding
of how companies in emerging countries deal with tax avoidance in the context of CSR. To the best
of author’s knowledge, this study is the first empirical work investigating the link between tax
avoidance and CSR engagement in BRICS countries, and in doing so, it fills in the gap of literature
not only regarding the relation between tax avoidance and CSR, suggested by Huseynov & Klamm
(2012) and Sikka (2010) but also the CSR engagement in BRICS, suggested by Belal & Momin
(2009). Second, the theories used within the domain of social and environmental accounting research,
namely, legitimacy theory, stakeholder theory, reputation risk management, organized hypocrisy, and
corporate culture, have been usually applied and explained as separate perspectives. This study
bridges the gap among them by using all theories to explain the link between tax avoidance and CSR
as overlapping theories which are different in their levels of perception. Third, the findings provide
valuable insights for policymakers to consider the requirement for firms to include responsible tax
payment as part of their CSR strategies and for regulators to stimulate greater cooperating between
tax authorities and legal demands for better transparency in the business operation.
The rest of this paper is organized as follows: Section 3.2 presents related prior literature which is
used to hypothesize the relationship between tax avoidance and CSR. Section 3.3 provides the
conceptual framework, leading to the development of hypotheses. Section 3.4 presents research

64
design including the data, measurement of variables, and analysis model. Section 3.5 reveals the
empirical results and Section 3.6 provides a summary and conclusions.
3.2. Related Literature
3.2.1. Corporate tax avoidance: An overview
Corporate tax expenses are generally calculated on a firm’s profit. In promoting a particular corporate
behaviour, tax authorities exclude or exempt some items, such as interest earned on municipal bond,
as well as an extra amount for deducting from the calculation of tax liability. Accordingly, loopholes
are created which allow taxpayers to avoid taxes trough those exemptions and deductible items. When
referring to corporate practices that aim at reducing tax liability, ones would be confused between tax
avoidance and tax evasion. Generally, while tax avoidance embraces legal activities utilizing
loopholes in the tax system but conflicts with the spirit of laws (Guenther et al., 2013; Slemrod &
Yitzhaki, 2002), tax evasion is labelled illegal activities that comprise components of deception,
concealment, or destruction of records (Fisher, 2014; Hanlon & Heitzman, 2010; Hasseldine &
Morris, 2013; Slemrod & Yitzhaki, 2002).
Payne & Raiborn (2018) assert that interpreting the loopholes to the benefit of the taxpayer is not
illegal as long as taxpayers do not take a position that crosses the line drawn by law with the desire
to evade taxes. In line with this, tax avoidance becomes an accepted and expected practices in the
function of corporate tax planning in business entities to arrange tax burden as low as possible.19
However, what is legal may not necessarily legitimate. The benefits of tax reduction are vested
primarily to company’s shareholders, regardless of whether a use of legal loopholes for aggressively
avoiding tax may indirectly affect other stakeholders of a corporation such as employees,
management, creditors, potential investors, competitors, and governments of countries in which a
corporation reports profits, as well as society at large (Payne & Raiborn, 2018). In the situation that
some taxpayers pay less tax; the government may seek ways to maintain national budgets so that the
delivery of public goods and services is not reduced or interrupted. By doing so, others may be forced
to pay more tax. Thus, it raises the question of whether those who underpay taxes are perceived as
19 Tax avoidance is covered broad range of behaviors that a corporation engages to accomplish its goal. For example, a)
postponement of tax by retiming transaction to pay tax later than it should be (Fisher, 2014; Slemrod & Yitzhaki, 2002;
Stiglitz, 1986), b) change or make a reasonable interpretation of the legal form such as re-characterizing income to capital
gain, restructuring a business from A to B, or renaming a consumer loan as a home equity loan (Fisher, 2014; Slemrod &
Yitzhaki, 2002), and c) involve tax arbitrage by taking advantage from tax system of other countries to produce tax saving
(Fisher, 2014; Slemrod & Yitzhaki, 2002).

65
unfair and immoral citizens. Furthermore, multinational firms from developed jurisdictions that take
advantage of a developing country’s tax incentives and low tax rates in order to avoid higher taxes in
their home country, and do not provide significant economic benefit to the host country may be
questioned as to whether they behave ethically towards either the home or the host country (Haugen,
2018; Payne & Raiborn, 2018; West, 2018). Therefore, even though the benefits for a myriad of
stakeholders are difficult to be balanced, it is necessary for firms to consider the impact of their
corporate actions on all stakeholders and to maximize profits through means that do not break the
social norms.
3.2.2. Corporate Social Responsibility (CSR)
(a) The definition of CSR
The concept of CSR is not a new issue as it has been mentioned since 1916 in the writing of Clark
(p.223) as “if men are responsible for the known results of their actions, business responsibilities must
include the known results of business dealings, whether these have been recognized by law or not”.
As CSR is an evolving concept; hence, what corporations should do for society is a normative
exercise, to achieve consensus on a CSR definition is difficult (Marens, 2004). Therefore, views on
how to define CSR are based substantially on their breadth and scope of a particular context. For
example, Friedman, (1970) narrowly equates CSR with the corporate executives’ responsibility
towards their employers to make as much money as possible, and at the same time, such actions must
comply with the basic rules of society, both legal and ethical. Carroll (1979) suggests a much wider
and widely accepted definition arguing that “the social responsibility of business encompasses the
economic, legal, ethical, and discretionary expectations that society has of organizations at a given
point in time” (Carroll, 1979 p. 500), where the economic and legal responsibilities are “required,”
the ethical responsibilities are “expected,” and the philanthropic (voluntariness or discretionary)
responsibilities are “desired.” According to the absent of exclusive definition, Dahlsrud (2008)
conducts content analysis with 37 different definitions proposed by researchers in different fields and
different countries for more than 23 years from 1980 in an effort to achieve a common definition of
CSR. The results reveal that CSR is identified by five dimensions: economic, stakeholder, social,
environmental, and voluntariness. Of those 37 definitions, 97% are included at least three dimensions
in any of those CSR definitions. Nevertheless, the work of Dahlsrud (2008) cannot achieve the goal
to identify which dimension(s) is (are) or should be used in aligning with notions of CSR. Göbbels
(2002) argues that there is no agreed-upon definition for CSR because it does not always the same
thing to everyone. Some consider environmental matters to be an area requiring separate

66
consideration (Baum and Fisher, 2010) while others argue the interplay between the social, economic
and environmental is central to socially responsible business activity (Davis et al., 2016; Laguir et
al.,2015). Although CSR is not exclusive, it is generally defined as a concept that encourages
corporations to equilibrate the interests of society at large. Corporations are expected to take
responsibility for the impact of its activities at all levels of its operation on all stakeholders, and this
responsibility goes beyond the statutory obligation to comply with legislation.
(b) The theoretical perspectives on CSR and its implications
Prior studies have developed and used several streams of theoretical perspectives to explain the
motivations of CSR. Thus far, it has been reflected by a broad range of theories including legitimacy
theory, stakeholder theory, a perspective of risk management, organized hypocrisy, and corporate
culture. However, Mcwilliams et al. (2006) argue that the study related to CSR should not be
investigated through a single lens of theoretical perspective. This study thus explains the CSR and
tax avoidance link through these theories at the same time but observes them at the different levels of
perspectives.
Legitimacy Theory
Dowling & Pfeffer (1975) posit that a corporation must act in congruence with society's values and
norms in order to continue its existence. If a corporation has breached the expectations of society
where it operates, its survival will be threatened (Deegan and Rankin, 1996). In other words, if a
corporation wants to succeed in continuing its survival, its value system should be congruent with the
value system of society, and this condition is referred as to legitimacy (Suchman, 1995). Legitimacy
has been reserved in the CSR literature along two major lines, an institutional approach and a strategic
approach (Suchman, 1995). From an institutionalist perspective, legitimacy is stem from the
conformity to the constructed systems of social values, norms, beliefs, and definitions (Suchman,
1995). Therefore, if operations, structures, and strategies of corporations are set up following the
common patterns of these social constructs, the corporations would be perceived as legitimate
organizations (DiMaggio and Powell, 1983; Scott, 2008). Under this notion, the idea that companies
should engage in certain responsible behaviours towards society leads CSR become a strongly
institutionalized feature of legitimate expectation (Brammer et al., 2012). Growing pressure from
civil society on corporations have created an “unavoidability of normative conformity” (Palazzo &
Scherer, 2006 p. 73). Therefore, in order to be perceived as legitimated organizations, the
institutionalization of CSR is integrated into concrete actions. In contrast to the institutional

67
perspective, the strategic legitimacy focuses mainly on how the corporations perform to gain, protect,
increase or repair its legitimacy (Dowling and Pfeffer, l975; Ashforth and Gibbs, 1990). As such, the
adoption of CSR can be seen as a tool to build legitimacy (Preuss, 2010). CSR has been
institutionalized into value system through activities such as the diffusion of CSR departments, the
proliferation of branding initiatives, an ISO standard on CSR, and even the spread of stock market
indices related to sustainability. These activities involve the understanding of people in society that
CSR cases exist in the organizations if they are doing so (Brammer et al., 2012). That is, the visible
engagement in social or other initiatives enhance acceptance from society, and the corporations are
rewarded with increased legitimacy.
Stakeholder theory
Stakeholders are defined as “any group or individual who can affect or is affected by the achievement
of a corporation’s purpose” (Freeman, 1984, p. 46). Given that a corporation needs the business’s
ongoing success (i.e. being legitimated), activities of the corporation must be approved by its
stakeholders to gain support for its continued survival (Gray et al., 1995). From this perspective, Chen
& Roberts (2010) confer that legitimacy is judged subjectively by a various group of stakeholders;
thus being legitimated depends on the value system of stakeholder groups rather than the value system
of the society as a whole. This is because the same corporate activity would not necessarily be judged
equally by different groups of stakeholders. Social and environmental disclosure is therefore seen as
part of the communication between the corporation and its stakeholders (Gray et al., 1995).
The stakeholder theory is used by prior work to analyse in the context of CSR through the lens of
instrumental or normative stakeholder theory. Instrumental stakeholder theory assumes that the
corporation is a mechanism for wealth creation and CSR can be part of such instrument because CSR
is perceived as a strategic tool to stimulate economic objectives (Garriga & Mele, 2004). In line with
this, Rodgers et al. (2013) find that a firm’s social responsibility commitment provides contributions
to its financial performance. Normative stakeholder theory, on the other hand, describes
philosophically based on moral obligations towards stakeholders (Brickson, 2007), focusing on the
ethical issue that corporations should pledge to adhere to the relationship between business and
society (Garriga & Mele, 2004).

68
Reputation Risk Management
In an ever-changing world, businesses are forced to deal with uncertainty. Risks affect businesses
outcomes in several terms such as economic performance and reputation, environmental, safety, and
even society in general. As such, how to tackle those risks which are so-called risk management can
be a key to business success. Defined in ISO31000:2018, risk management is “coordinated activities
to direct and control an organization with regard to risk.” Generally, when a negative corporate
situation arises, society would identify sanctions basing on the conditions surrounding the incidents
(Hoi et al., 2013). Godfrey (2005) theorizes that positive moral corporate action provides firms with
the insurance-like protection as it reduces the negative impact on the misbehaviours of business
organizations. Through this lens, CSR becomes a mechanism to deal with potential reputational risks
(Fombrun et al., 2000; Lin-Hi & Blumberg, 2018; Minor & Morgan, 2011). A number of studies
show that CSR and corporate reputation are positively associated (e.g., Fombrun and Shanley 1990;
Galbreath 2010; Stanaland et al. 2011). The common argument for the presence of a positive link
between CSR and corporate reputation is based on the effect of a signal that is created by the social
responsibility assumption. Engaging in CSR allows a corporation to signal its reliable and honest
behaviours (McWilliams & Siegel, 2001), its interests in the stakeholder well-being and society as a
whole, and its willingness to take care the others’ needs ( Bhattacharya et al., 2009). Consistent with
Godfrey (2005), CSR activities can be seen as a way to manage risks as it signals to public that the
management of firms gives attention not only to maximize benefits for shareholders but also to have
responsibility towards society at large.
Extending this view using the risk management model, Godfrey et al. (2009) test the property of
insurance-like protection of CSR activity whether such activity leads to positive attributions from
stakeholders by reducing their negative judgment, and not to boycott the company. Using 178 illegal
actions against firms during 1993 – 2003, they find that firms engaging in institutional CSR activities
which are focused on society as a whole attain an ‘insurance‐like’ benefit whereas firms engaging in
technical CSR activities which are aimed at a firm's trading partners yields no benefits on the
participation. Minor & Morgan (2011) also conduct the link between CSR and reputation insurance
of all S&P 500 companies over the period 1991-2006 and suggest that “CSR acts as a powerful form
of reputation insurance when a firm suffers an adverse event” (p. 55). Specifically, a synergistic effect
on reputation presents when firms harmonize their CSR strategies in both “doing good” and “not
doing bad,” and the greatest reputational damages occurs when firms simultaneously engage in doing
good and doing wrong; this is worse than just doing nothing.

69
Organized Hypocrisy
Brunsson (1989) considers the inconsistencies among talk, decisions, and actions as hypocrisy which
organizations practically employ as a strategy to manage the conflict demands of various
stakeholders. When different stakeholder groups place conflicting demands on the organization, it is
difficult for corporations to satisfy all interests with one set of actions without discounting the
demands or benefits of others (Brunsson, 2003). Although management is encouraged to develop
strategies that at least each stakeholder group can accept at a minimum level, Cho, Laine, Roberts, &
Rodrigue (2015) argue that conflicting pressures of society and institutions lead corporations to
engage in hypocrisy in order to keep or develop their image.
In the world of business today, stakeholders are very concerned and monitor closely what and how
companies do regarding CSR issues. Due to the recent examples of organizational misconduct, the
CSR talk of companies has become scepticism by the public (Christensen, Morsing, & Thyssen,
2013). CSR means “doing” something good to society, not just “talking” about it (Aras & Crowther,
2009; Fernando, 2010; Holder-webb et al., 2009), but companies treat CSR merely as a corporate
spin to improve legitimacy (Jahdi & Acikdilli, 2009). As stated in Banerjee (2008), communicating
CSR to the public is nothing but symbols of an ideological movement intended to legitimize and
consolidate the power of large organizations. Consistently, other scholars assert that CSR is a
powerful mechanism to protect against criticism or to mislead interpretation in the way that an
organization has nothing to hide (Newell, 2008) and to expresses intentions or policies without any
real substance (Kolk, 2003). Thus, the discrepancies between CSR talk and actions are seen to be
sources of hypocrisy (Wagner et al., 2009).
Corporate or Organizational Culture
Corporate culture is mainly defined as “set of shared beliefs and assumptions” that guide
organizational members’ behaviour for various situations to achieve its economic success (Needle;
2004; Pohl, 2006; Ravasi and Schultz, 2006). Corporate culture characterizes all, or most, of the
members in an organization, creating a unique characteristic and pattern which are stable in time
(Ganescu & Gangone, 2017). As such, corporate culture influences how people in an organization
interact with each other and with various stakeholders. As an organizational business philosophy,
Gangone (2014, p. 85) states that corporate culture “should reflect the reasoning of investors and
managers, the ethical standards they employ in making decisions, the traditions, attitudes and concrete
situations experienced by the organization.” Supported by prior literature, the values and attitudes of

70
managers are determined by corporate culture, which affects their behaviors and decision making
(Subramaniam & Ashkanasy, 2001). Furthermore, the corporate culture has an impact on the
outcomes of organizational operation (McKinnon, Harrison, Chow, & Wu, 2003; Baird, Harrison, &
Reeve, 2004, 2007).
The concept of corporate culture has become an interesting topic in CSR literature as it links the
various aspects of human resources and organizational behavior to corporate social performance
(Ubius and Alas, 2009; Yu & Choi, 2016), for example, corporate philanthropy, socially responsible
investment, sustainability, corporate citizenship (Ganescu & Gangone, 2017), and the interests of
stakeholders (Ubius and Alas, 2009). Thus, ethical decision-making in the process of integrated CSR
initiatives development is usually possible when it is congruent with the culture of a corporation
(Trevino and Nelson, 2007). In particular, organizations that base their operations on high ethical
standards and intensively express concerns for the needs of all stakeholders typically link corporate
CSR activities with the system value (Jaakson, Vadi, & Tamm, 2009).
In conclusion, the theory of corporate culture suggests that if a firm strongly believes in “right”
corporate behaviour, then all the decisions undertaken by the firm should reflect such a right shared
belief (Kreps 1996; Hermalin 2001). In line with this, Hoi et al. (2013) view CSR as the shared belief
of an organization about the right course of action, influencing corporate practices that affect the
firm’s various stakeholders. Jaakson et al. (2009) support this view through an empirical study
showing that organizations with a mature corporate culture correlated with CSR initiatives benefiting
to stakeholders. On the other hand, CSR transmits corporate culture through groups of employees
who are involved in CSR activities. They also find that the performance of the organizations mediates
the relationship between corporate culture and CSR. Similarly, Yu & Choi (2016) reveal that CSR
activities of Chinese companies are carried out due to the stakeholders’ pressure and its relationship
are mediated by a CSR-oriented corporate culture. Their results suggest that Chinese companies
should promote a CSR-oriented corporate culture and make this policy efficiently to help them
achieve a competitive advantage. Still, the same instance, Upadhaya, Munir, Blount, & Su, (2018)
also demonstrate that the adoption of CSR is associated with firm strategies and its relationship is
fully mediated by corporate culture, especially, in the dimension of innovation and respect for people.
3.2.3. Tax avoidance and CSR
If tax avoidance is considered just as a business transaction, its objective is only to reduce the amount
of corporate tax expense as much as possible (Avi-Yonah, 2008) and it has nothing to concern about

71
ethics, stakeholders, or society. Given the national budget from tax revenue is “the lifeblood of the
social contract, vital to the development and maintenance of physical infrastructure”20 (Christensen
& Murphy, 2004, p. 37), avoiding to pay tax erodes the smooth functioning of state to provide public
goods (Avi-Yonah, 2006). Tax avoidance is also related to the debate around the issues regarding
regulatory compliance and organizational integrity (Bird & Davis-Nozemack, 2018). Firms readily
reap the benefits of public resources such as an educated workforce and foundational research,
transportation, and utility systems which are all created and maintained by tax revenue. As such, it is
a duty-based obligation imposed by society for firms to pay a fair share of tax to contribute to the
continuity of those public services (Scheffer, 2013; Sikka, 2010). When firms try to avoid tax in order
to maximize profits, they fail to act as good citizens of society (Hoi et al., 2013). Under this view, tax
avoidance is a socially irresponsible practice which is not consistent with a firm’s obligations to
society (Avi-Yonah, 2014; Dowling, 2014; Hasseldine & Morris, 2013; Lanis & Richardson, 2015).
To mitigate this problem, the governments in the past have dealt with the problem of tax avoidance
through hard law21 (Bird & Davis-Nozemack, 2018). Nevertheless, given that tax avoidance is the
undesirable corporate conduct which is legal (Guenther et al., 2013; Slemrod & Yitzhaki, 2002), hard
law alone cannot eliminate the corporate behaviour of tax avoidance. Since hard law does not
emphasize the key tasks of the non-coercive mechanism to play in tax compliance, it is difficult to
enforce hard law with the grey-area behaviours. Prior studies respond to this problem by linking soft
law (e.g., private monitoring mechanisms or agreements that embody norms, NGO legislation, and
governmental policy statements (Sheppard, 2014) into tax avoidance account. Given that soft law is
guided by societal values and norms, possessing the characteristics of legal rules (Park & Berger-
walliser, 2015) but flexible (Karmel and Kelly 2009), this allows society to put pressure on firms to
comply with the corporate responsibility to pay responsible taxes if they want to be perceived as
legitimated in the eyes of the public. As CSR is based on a duty-based system and considered as a
form of soft law (Jackson 2010; Vogel 2005) that emphasizes the firm's social commitment to various
stakeholders, it is theoretically and practically linked to the corporate practice of tax avoidance
(Knuutinen, 2014), and the public has called for incorporating of fair share of tax payment as part of
CSR (Huseynov & Klamm, 2012).
20 Tax revenues are essential for transportation infrastructure, public welfare, funded research, and national defense
(Center on Budget and Policy Priorities 2015; Williams 2011). 21 Hard law is a foundation of any functioning tax system that can bring standards to all firms operating under the tax
system as it works through sanctions and determination of clarity (Nov, 2006). Therefore, it cannot be rejected that hard
law allows tax system to perform in a more efficient way.

72
3.3. Hypotheses Development
As recent literature on CSR seems to suggest that CSR in developing countries is shaped by a variety
of contextual conditions and institutional pressures (Jamali & Karam, n.d.; Sharma, 2019),22 extant
findings which mostly are from developed countries may not necessarily generalise to the context of
emerging markets (i.e., BRICS). Therefore, the present study focuses on the data from emerging
markets in order to fill this gap in the literature. Furthermore, the empirical link between corporate
tax avoidance and social responsibility has not been clearly drawn as its direction has been shown
based on various theories. Scheffer (2013) suggests that such gaps should be connected to provide a
better understanding of the relation between them. In bridging the differences among them, this study
builds on related theories, namely, legitimacy theory, stakeholder theory, reputation risk
management, organized hypocrisy, and organizational culture to explain the context of tax avoidance
– CSR relationship. Legitimacy is treated as a fundamental condition that corporations aim to hold
for its continued existence in society which encompasses with various groups of stakeholders. Then,
stakeholder theory is narrowly focused on how to manage the different or even conflicting demands
of particular stakeholders to gain supports for their legitimated survival. Lastly, the perspectives of
reputation risk management, organized hypocrisy, and corporate culture are used to explain the
reasons behind corporations’ actions that are performed to satisfy their stakeholders.
As mentioned above, institutionalist legitimacy suggests that if corporations would like to be
perceived as legitimated organizations, they should follow the common patterns of social constructs
(DiMaggio and Powell, 1983; Scott, 2008). In particular, under a normative stakeholder perspective,
corporations have moral obligations towards stakeholders (Brickson, 2007) so that they should pledge
to comply with norms, values, and expectations of stakeholder groups. As Freeman (1984) includes
any individual and all parties that are affected by the operation of corporations in the term of
“stakeholders”, it is essential for corporations to establish or improve policies and strategies as well
as operations that offer outcomes most favourable to all related stakeholders (Williams, 2007). If this
belief has been adopted into corporate policy and is used consistently, it will turn into corporate
culture. In particular, corporate culture includes the shared beliefs that guide appropriate behaviours
for various situations to achieve its success (Needle; 2004; Pohl, 2006; Ravasi and Schultz, 2006) and
22 Jamali & Karam (n.d.) conclude in their review on CSR in developing nations that institutional pressures influencing
CSR include the limitations of political conditions, national policies and legislation, religion, economic conditions, and
social and cultural attitudes, as well as the contracted roles of developing country governments.

73
influences the way that corporation’s members interact with each other, and with various
stakeholders.
As CSR comprises the concepts of corporate philanthropy, sustainability, and corporate citizenship
(Ganescu & Gangone, 2017), as well as the interests of stakeholders (Ubius and Alas, 2009),
Brammer et al. (2012) argue that CSR is a strongly institutionalized feature of legitimate expectation.
Hoi et al. (2013) view CSR as one aspect of corporate cultures which presents the right course of
actions in organization. Although, having CSR as a core strategy would make a company being
recognized as a socially responsible corporation, failing to prove genuinely ethical operation may
result in reputation/political costs to the company. In the case of tax avoidance, it is viewed as
unethical and irresponsible corporate behaviour (Hoi et al., 2013; Keung et al., 2013) since avoiding
to pay tax has an impact on the function of producing public goods to serve all members in society.
Therefore, if firms with strong CSR culture simultaneously participate in tax avoidance, firms will
not be appreciated by the community and may be labelled as “poor corporate citizens” (Chen et al.,
2010). This practice is also against the culture of responsible corporations that suggests balancing the
interests of all related stakeholders.
Hoi et al. (2013) investigate the association between irresponsible CSR activities and tax avoidance
behaviour. Their results show that firms with more irresponsible CSR activities are more likely to
engage in avoiding tax, supporting the corporate culture effect on tax avoidance. Lanis & Richardson
(2012) assume that the concept of CSR provides corporation guidance to choose an appropriate
ethical stance for a particular situation that affects its stakeholders. As tax aggressiveness is viewed
as an irresponsible behavior that destroys the quality of life of people in society, Lanis & Richardson
(2012) hypothesize that firms with high CSR profile would be more cautious in considering to engage
in aggressive tax avoidance as they are frightened that it may cause a negative perception towards
their firms and eradicate the reputation from other CSR activities. By examining the level of CSR
disclosure of 408 Australian corporations using their own index with multiple proxies of corporate
tax aggressiveness for the 2008/2009 financial year, the results confirm their hypothesis that the
higher level of CSR activities, the lower level of aggressive tax engagement. Extending their own
study by utilizing a more direct measure of tax avoidance and a more objective source of firm CSR
performance from the Kinder, Lydenberg, and Domini (KLD) database, Lanis & Richardson (2015)
find further support showing that firms with higher CSR performance are less likely to engage in tax
avoidance.

74
Based on the preceding discussion, the perspective of corporate culture explains that if a firm strongly
believes in “right” corporate behaviour, then all the decisions undertaken by the firm should reflect
such a right shared belief (Kreps 1996; Hermalin 2001). Therefore, firms with the strong believed
culture of balancing the interests of all stakeholders will accept compromise in the pursuit of
shareholder profit by pursuing a combined strategy of tax compliance and CSR engagement in order
to enhance their reputation and satisfy stakeholders’ interests instead of shareholders’. Accordingly,
based on the complementary notions of legitimacy theory, normative stakeholder theory, and the
corporate culture theory, the first hypothesize predicts a negative statistical association between tax
avoidance and CSR as follows:
H1: All else being equal, firms with a high level of CSR are less likely to engage
in aggressive tax avoidance.
When managers are encouraged to prioritize the interests of shareholders, they may use the techniques
of tax avoidance to maximize profit for shareholders. At the same time, premised on legitimacy
theory, companies need to retain the rights of continuous business in the society by operating in a
way that meets the expectations of society (Deegan & Rankin, 1996; Dowling & Pfeffer, 1975). Tax
avoidance, unquestionably, is not a corporate action favoured by society. Therefore, managers of the
companies are necessary to adopt strategies that could obfuscate their avoidance behaviour or
moderate the negative consequences of tax avoidance. Under instrumental branch of stakeholder
theory, CSR could be an efficient tool to achieve managers’ objective of minimizing public scrutiny and
safeguarding their legitimacy (Cho & Patten, 2007; Magness, 2006). Although the objective of CSR
is to encourage firms to act and operate responsibly towards societies, many firms claim their
integrity, ethics, honesty, responsibility, and transparency through CSR report (Cho & Patten, 2007;
Magness, 2006) to exclusively promote company image to build (Preuss, 2010), gain, or maintain
legitimacy (Avi-Yonah, 2008), as well as to deal with potential reputational risks (Fombrun et al.,
2000; Lin-Hi & Blumberg, 2018; Minor & Morgan, 2011). Reporting good CSR activities to the
public is considered a potentially powerful mechanism to maximize firms’ reputation (Hoi et al.,
2013; Unerman, 2008). This role of CSR reporting is played either when firms develop a CSR
reputation in a new area of social value, or when the negative events occur and render bad attitude
towards corporations (Unerman, 2008).
Lanis & Richardson (2013) further explain the framework of CSR and legitimacy in the context of
tax avoidance that firms with highly aggressive tax avoidance attempt to lessen public scrutiny on its
avoidance by disclosing additional information concerning its other (good) CSR activities in various

75
areas to show their obligation fulfilling to the society. Preuss (2010) find that companies, locating
their headquarters in tax havens or Offshore Finance Centres (OFCs) made claims that they follow
socially responsible business practices through codes of conducts. Hoi et al. (2013) argue that firms
protect themselves from public penalties on adverse events by enhancing their reputation through the
reduction of irresponsible corporate social responsibility. On the other hand, firms with more
aggressive tax avoidance will increase CSR to maintain the reputation which may help them to hide
other inappropriate corporate behaviours. Stoian (2012) supports that companies are hiding their
profits through the practice of dodging tax also have a good CSR profile and not to declare their
profits movements.
Given that companies attempt to legitimate their societal credentials by presenting themselves as good
citizens but simultaneously involve in tax avoidance practices, Sikka (2010) extends that this situation
may be categorized as organized hypocrisy which represents the gaps to some extent between
corporate talk, decision, and action. That is, actual actions of the companies may not necessarily be
aligned with their publicly advocated claims. Such claims of ethics, integrity, honesty, transparency,
and responsibility actually should be covering all issues about operations of organizations, but in
reality, few companies refer tax payment as part of their social responsibility reports. In line with the
view of the hypocrisy of organizations, Stoian (2012) shows that Romanian multinational companies
with a high level of CSR avoid local tax burden by shifting their profit to offshore location without
any consideration of declaring their tax movement as part of the CSR report.
Therefore, if CSR engagement is ultimately an attempt of a company to create positive stakeholders
perceptions and reduce the harshness of penalties from negative events, it is possible that companies
that adopt aggressive tax avoidance behavior to increase profits in favour of shareholder’s interests
may pursue a strategy of CSR engagement in order to hedge against the negative outcomes of tax
avoidance. Accordingly, based on the complementary notions of a CSR hypocrisy, legitimacy theory,
and reputation risk management, the second hypothesis predicts a positive relationship between tax
avoidance and CSR as follows:
H2: All else being equal, firms with a high level of CSR are more likely to engage
in aggressive tax avoidance.

76
3.4. Research Design
3.4.1. Data and sample description
Since this study examines the relationship between tax avoidance and CSR focusing on the fast-
growing emerging country, this study uses data from BRICS group of countries which comprise of
Brazil, Russia, India, China, and South Africa between 2008 and 2015. Essential information used in
this study is mostly retrieved from the DataStream Thomson Reuters database, where CSR variables,
i.e. the scores of social and environmental pillars are extracted from ASSET4, and other financial
data are from Worldscope. The statutory tax rate is collected from KPMG International Cooperative
website23. The information about IFRS adoption relies on the IFRS® Foundation24. Following Hoon,
Selmier, & Lien (2011), the legal system is defined based on the JuriGlobe research group of the
University of Ottawa25. Furthermore, financial firms are excluded because of the unique practices of
accounting standard and firms with no data in any year. After these procedures, the final sample
consists of 428 firms with 2,211 firm-year observations. As reported in Table 3.1, 27% of the sample
firms domiciled in China, followed by Brazil (26%), South Africa (21%), India (18%), and Russia
(8%). Across the sector of operations26, the industrials industry firms consist of 23% of the total
sample, followed by basic materials (17%), consumer goods (13%), utilities (12%), and customer
services (10%). The least number of observations is of the technology industry which accounted for
3%.
3.4.2. The measurement of variables
(a) Tax avoidance
In measuring the degree of tax avoidance of a firm, there is a range of proxies used in the literature27.
Most prior studies obtain data from a firm’s financial statement to calculate the proxy of tax avoidance
23 Source: https://home.kpmg/vg/en/home/services/tax1/tax-tools-and-resources/tax-rates-online/corporate-tax-rates-
table.html
24 Source: https://www.ifrs.org
25 Source: http://www.juriglobe.ca/eng/
26 This study categorizes companies into ten industries following Industry Classification Benchmark (ICB), operated and
managed by FTSE Russell. The ten industries including health care, consumer goods, consumer services, basic materials,
utilities, telecommunications, industrials, technology, oil & gas, and financial. However, the financial industry is excluded
so that nine industries remain in the investigation.
27 The measure of tax avoidance used in previous literature on the relationship between tax avoidance and CSR is revealed
in Appendix 3.2.

77
because tax returns are not publicly presented by a firm and it provides a limited assessment to
external users (Hanlon & Heitzman, 2010). In the context of this study, tax avoidance is defined as
schemes that a corporation participates for the purpose of explicit tax reduction without any attempt
to distinguish between legal avoidance activities and illegal evasion activities following Hanlon and
Heitzman (2010). That is, tax avoidance in this paper captures both certain tax positions (perfectly
legal) and uncertain tax positions (either legal or illegal transactions). That is, this study focuses on
the total amount of tax avoided, rather than on the specific actions because specific actions taken
provide different costs and benefits across countries.
Table 3.1 Sample Distribution by Country and Industry
Panel A: Sample Distribution by Country
Country Observations Firms
N Pct. N Pct.
Brazil 446 20% 122 24%
Russia 219 10% 45 9%
India 412 18% 77 15%
China 676 30% 129 26%
South Africa 523 23% 125 25%
2,276 100% 498 100%
Panel B: Sample Distribution by Industry
Industry Observations Firms
N Pct. N Pct.
Basic Materials 457 20% 109 22%
Consumer Goods 276 13% 61 12%
Consumer Services 227 10% 56 11%
Health Care 110 5% 28 6%
Industrials 518 23% 109 22%
Oil & Gas 237 10% 37 7%
Technology 87 4% 16 3%
Telecommunications 133 6% 31 6%
Utilities 231 10% 51 10%
2,276 100% 498 100%
This table presents the sample distribution by country and industry. The total observations are 2,276 from 498
companies from the period of 2008-2015.
Therefore, the effective tax rate (i.e., GAAP ETR), computed by dividing the total tax expense by
pre-tax book income, is used to capture the consequence of tax avoidance. Moreover, extant research
argues that the ETR captures a broad range of tax avoidance activities (Badertscher, Katz, & Rego,
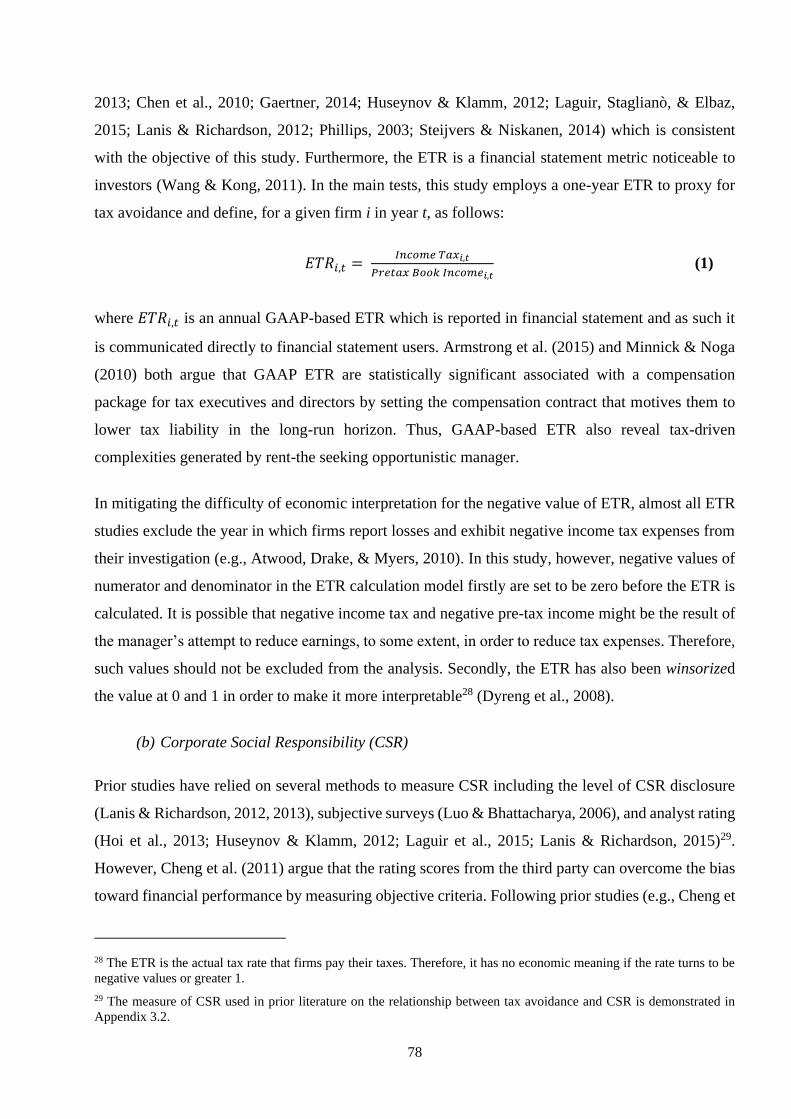
78
2013; Chen et al., 2010; Gaertner, 2014; Huseynov & Klamm, 2012; Laguir, Staglianò, & Elbaz,
2015; Lanis & Richardson, 2012; Phillips, 2003; Steijvers & Niskanen, 2014) which is consistent
with the objective of this study. Furthermore, the ETR is a financial statement metric noticeable to
investors (Wang & Kong, 2011). In the main tests, this study employs a one-year ETR to proxy for
tax avoidance and define, for a given firm i in year t, as follows:
𝐸𝑇𝑅𝑖,𝑡 = 𝐼𝑛𝑐𝑜𝑚𝑒 𝑇𝑎𝑥𝑖,𝑡
𝑃𝑟𝑒𝑡𝑎𝑥 𝐵𝑜𝑜𝑘 𝐼𝑛𝑐𝑜𝑚𝑒𝑖,𝑡 (1)
where 𝐸𝑇𝑅𝑖,𝑡 is an annual GAAP-based ETR which is reported in financial statement and as such it
is communicated directly to financial statement users. Armstrong et al. (2015) and Minnick & Noga
(2010) both argue that GAAP ETR are statistically significant associated with a compensation
package for tax executives and directors by setting the compensation contract that motives them to
lower tax liability in the long-run horizon. Thus, GAAP-based ETR also reveal tax-driven
complexities generated by rent-the seeking opportunistic manager.
In mitigating the difficulty of economic interpretation for the negative value of ETR, almost all ETR
studies exclude the year in which firms report losses and exhibit negative income tax expenses from
their investigation (e.g., Atwood, Drake, & Myers, 2010). In this study, however, negative values of
numerator and denominator in the ETR calculation model firstly are set to be zero before the ETR is
calculated. It is possible that negative income tax and negative pre-tax income might be the result of
the manager’s attempt to reduce earnings, to some extent, in order to reduce tax expenses. Therefore,
such values should not be excluded from the analysis. Secondly, the ETR has also been winsorized
the value at 0 and 1 in order to make it more interpretable28 (Dyreng et al., 2008).
(b) Corporate Social Responsibility (CSR)
Prior studies have relied on several methods to measure CSR including the level of CSR disclosure
(Lanis & Richardson, 2012, 2013), subjective surveys (Luo & Bhattacharya, 2006), and analyst rating
(Hoi et al., 2013; Huseynov & Klamm, 2012; Laguir et al., 2015; Lanis & Richardson, 2015)29.
However, Cheng et al. (2011) argue that the rating scores from the third party can overcome the bias
toward financial performance by measuring objective criteria. Following prior studies (e.g., Cheng et
28 The ETR is the actual tax rate that firms pay their taxes. Therefore, it has no economic meaning if the rate turns to be
negative values or greater 1.
29 The measure of CSR used in prior literature on the relationship between tax avoidance and CSR is demonstrated in
Appendix 3.2.

79
al., 2014; Eccles et al., 2014; Halbritter & Dorfleitner, 2015; Naughton et al., 2014; Ziegler et al.,
2011), this study thus uses data from ASSET4 to proxy for CSR. It provides scores of broad CSR
performance of a company in four pillars - environmental, social, governance and economic. The
overall score calculated by equally weighting and z-scoring all underlying data points, then
comparing them against all companies in the ASSET4 universe and position the score between 0%
and 100% for each of four pillars
As focusing on other stakeholders, rather shareholders exclusively, this study excludes economic and
corporate governance performance and capture only the level of CSR related to society as a whole
through the average scores of social and environmental pillars (Naughton et al., 2014). The score of
the social pillar is calculated based on activities related to society (e.g., community, human rights),
workforce (e.g., diversity and opportunity, employment quality, health & safety, training, and
development), and customer/product responsibility. The environmental pillar is rated based on
activities related to emission reduction, product innovation, and resource reduction (DataStream,
2017).
3.4.3. Empirical model
This study employs the fixed-effect model to control the impact of unobserved time-invariant
variables. In examining the relationship between tax avoidance and CSR engagement, the following
model is estimated:
𝑇𝑎𝑥𝐴𝑣𝑜𝑖𝑑𝑖,𝑡 = 𝛼0 + 𝛼1𝐶𝑆𝑅𝑖,𝑡 + ∑ 𝛼𝑛9𝑛=2 𝐶𝑜𝑛𝑡𝑟𝑜𝑙𝑖,𝑡
𝑓𝑖𝑟𝑚+ ∑ 𝛼𝑛
11𝑛=10 𝐶𝑜𝑛𝑡𝑟𝑜𝑙𝑖,𝑡
𝑐𝑜𝑢𝑛𝑡𝑟𝑦+
∑ 𝛼𝑛16𝑛=12 𝐹𝑖𝑥𝑒𝑑 𝐸𝑓𝑓𝑒𝑐𝑡
𝑖,𝑡𝑐𝑜𝑢𝑛𝑡𝑟𝑦 + ∑ 𝛼𝑛
26𝑛=17 𝐹𝑖𝑥𝑒𝑑 𝐸𝑓𝑓𝑒𝑐𝑡
𝑖,𝑡𝑖𝑛𝑑𝑢𝑠𝑡𝑟𝑦 +
∑ 𝛼𝑛39𝑛=27 𝐹𝑖𝑥𝑒𝑑 𝐸𝑓𝑓𝑒𝑐𝑡
𝑖,𝑡𝑦𝑒𝑎𝑟 + 휀𝑖,𝑡 (2)
where 𝑇𝑎𝑥𝐴𝑣𝑜𝑖𝑑𝑖𝑡 is ETR computed as income tax expense divided by pre-tax book income and
take the value between 0 and 1. 𝐶𝑆𝑅𝑖𝑡 is the average scores of performance in social pillar and
performance in environment pillars range from 0 to 100, and The remaining is firm specific
characteristics included as control variables30, namely, size, leverage, the return on asset ratio, net
operating loss, the market-to-book ratio, capital intensity, the closely-held shareholders, the dividend
payout, the adoption of IFRS, and the law of origins. Since higher values of 𝐶𝑆𝑅𝑖𝑡 suggest a greater
level of CSR whereas higher ETR implies less tax avoidance, this study accepts H1a if the coefficient
30 Descriptions of variables are provided in Appendix 3.3.

80
𝛽1 for 𝐶𝑆𝑅𝑖𝑡 shows negative value as it suggests a positive relationship between CSR and tax
avoidance; that is, firms may adopt CSR in order to hedge against the negative outcomes of tax
avoidance whereas tax-compliant firms may not perceive any need for further CSR engagement in
order to boost their reputations as good corporate citizens. On the contrary, if the coefficient 𝛽1 for
𝐶𝑆𝑅𝑖𝑡 is positive value, the H1b is accepted as it indicates a negative relationship between CSR and
tax avoidance; that is, firms that are willing to accept compromise in the pursuit of shareholder profit
in order to enhance their reputation or satisfy the aspirations of stakeholders other than shareholders,
may pursue a combined strategy of tax compliance (i.e. not enjoy in participating tax avoidance
strategies) and CSR engagement. In contrast, firms that prioritize shareholder profit over reputation
or non-profit stakeholder interests may pursue a combined strategy of tax avoidance and non-
engagement with CSR.
In mitigating potential confounding effects on tax avoidance by other determinants of tax
avoidance, several control variables both at the firm level and the country level are included in the
model, namely, firm size (Size), leverage (Lev), firm profitability (ROA), firm net operating losses
(Loss), firm growth (MTBV), firm capital intensity (CapInt), firm closely-held shares31 (CloseHeld),
and firm dividend payout (DivPayout) (Dyreng et al., 2008; Gupta & Newberry, 1997; Huseynov &
Klamm, 2012; Lietz, 2013; Phillips, 2003; Wilson, 2009b).
Dyreng et al. (2008) suggest that firm size may play a role in the firm’s engagement in tax avoidance.
Based on the theory of political cost, Watts and Zimmerman (1986) explain that firms with higher
visibility are subjected to comply with greater regulatory activity, introducing a negative association
between firm size and tax avoidance (Minnick & Noga, 2010; Rego, 2003). Nevertheless, others
present the results in line with a positive relation under the notion of the political power, i.e., by
assuming that larger companies having more resources to make more lobbying and participate in
more complex tax planning activities (e.g. Siegfried (1972), Siegfried (1974), Stickney and McGee
(1982), Porcano (1986) in Lietz, 2013). Wilson (2009) reports a positive relationship between tax
shelter activities and firm size. In addition, firms with high levels of property, plant & equipment
(i.e., highly capital intensive firms) are usually expected to exhibit more tax planning opportunities
31 The closely held share represents shares held by insiders. For companies with more than one class of common stock,
closely held shares for each class is added together. It includes but is not restricted to shares held by cross holdings
(corporations and holding companies), corporations (incl. real estate companies), holding Company, government,
employees, and individuals/insiders (Thompson Reuter, 2019).

81
(Dyreng et al., 2008). More profitable firms have also been argued to exhibit a greater incentive to
reduce their tax burden relative to lesser profitable firms (Dunbar et al., 2010).
Similarly, Phillips (2003) concludes that firms with growth opportunities show a greater ability to
engage in tax avoidance activities. However, top-line growth firms are subjected to increasing
applicable tax rates as their incomes increase, suggesting that such firms could have higher ETR.
Conversely, loss firms (i.e., firms with net operating losses) should commonly have less incentive to
engage in tax avoidance (Dunbar et al., 2010; Lietz, 2013; Minnick & Noga, 2010). Generally,
leverage shows the complexity of firms’ financial transactions. Highly leveraged firms, at first sight,
could be more able to reduce taxes through the use of complicated financing transactions, suggesting
a positive association between tax avoidance and firm leverage (Mill et al., 1998 in Dunbar et al.,
2010; Lietz, 2013). Alternatively, leveraged firms may have a relatively strong incentive to avoid
taxes to preserve cash to service the debt burden (Badertscher, Katz, & Rego, 2010). However, since
firms with the high level of leverage incur more interest expenses which are deducted from taxable
income32, they may have less need to be tax aggressive as they face less pressure to draw on
alternative non-debt tax shields (Graham & Tucker, 2006).
Moreover, several studies (Amiram et al., 2013; Chatty & Saez, 2005; M. A. Desai & Dharmapala,
2006) find that ownership and shareholder dividend tax policies influence managers to engage in
corporate tax avoidance. If managers are committed to increasing the benefit of shareholders, the
positive relation between tax avoidance and dividend payout is expected. On the other hand, managers
are more likely to put their effort towards the strategy of upward book income and downward taxable
income at the same time in order to increase profits which eventually increase the payout of dividends.
Amiram et al. (2013) also argue that firms with a higher proportion of closely-held shares have more
alignment between managers and shareholders, thereby accentuating the incentives to engage in
corporate tax avoidance. Therefore, those firms are expected to have higher levels of tax avoidance
to increase shareholder’s profits.
This study includes the adoption of the International Financial Reporting Standards (IFRS) and the
legal origin (LawSys) to control for country-level factors that may affect tax avoidance. The shift to
the use of IFRS leads to changes in accounting method which also bring differences in the current
treatment of tax basis. The adoption of IFRS, therefore, should be possible to give the impact on tax
32 Leveraged firms already have benefits from a tax shield (Wrightsman, 1978) which thereby relatively a weak motivation
to reduce more tax (Badertscher et al., 2010).

82
strategies because tax calculation is based on the measurement and recognition of accounting
transactions. More specifically, it is argued that the adoption of IFRS would reduce book-tax
conformity, thereby reducing the impact on tax after the post-IFRS period (Hung & Subramanyam,
2007). In line with this notion, Karampinis & Hevas (2013) find that ETR as a measure of tax pressure
is significantly and negatively associated with discretionary accruals in the pre-IFRS period and the
effect disperses after the IFRS has been implemented. Managers are less likely to engage in tax
avoidance when managers perceive that government enforcement of tax rules is stronger. This is
because they believe that strong enforcement introduces the higher expected probability of detection
and tax authorities may impose additional taxes plus penalties (Atwood et al., 2012), thereby
discouraging tax avoidance.
3.5. Results
3.5.1. Univariate analysis
(a) Descriptive statistics
Table 3.2 presents the descriptive statistics where Panel A shows the statistics for the full sample,
Panel B shows the mean value of all variables based on country of domicile, and Panel C shows the
mean value of all variables based on the industry of firm’s operation. The overall sample presents a
mean (median) ETR of 26% (25.7%) with a range of 0–1 and the mean (median) of the statutory tax
rate (STR) is 29.3% (28%) with the same range. ETR is the average rate at which an individual firm
is taxed on its pre-tax profits so that expected to be lower than STR which is the tax rates that are
established by the law of each country. As such, ETR is commonly to have a lower value than the
STR due to the allowable income tax exemptions. The lower ETR than STR also implies that there
are incomes included in book income but would not be recorded in taxable income (Armstrong et al.,
2012). However, although the overall value of ETR shows lower value in comparison to STR for the
pooled sample, not all observed countries report the consistent level having lower ETR than STR. In
particular, Russian firms pay tax at a higher rate (average at 24.80%) than required by law (average
at 20.50%) and South African firms pay tax at the quite similar rate (average at 31.40%) as the
statutory rate (average at 31.10%). In examining ETR in individual industry shown in Table 3.2 Panel
C, while firms in the industry of consumer goods (25.40%), health care (23.10%), industrials
(25.30%), and oil & gas (23.60%) report the lower mean ETR than overall mean ETR (26%) for the
whole sample, firms in technology industry pay the lowest tax rate at 21.90%.

83
In addition, in Table 3.2, CSR as the independent variable shows a mean (median) of 56.73 (63.19)
with a 0-100 range. Across the country, there are marked differences in CSR scores. South Africa
displays the highest mean value in CSR of 68.30 while China shows the lowest mean value of 36.87,
providing little support to Alon et al. (2010)’s result which claims that firms in China less realize the
importance of CSR communication in relative to other nations in the BRICS group. For other
countries, the mean value of Brazil, India, and Russia is 56.73, 66.30, and 53.24, respectively.
Considering CSR scores in each industry as shown in Table 3.2 Panel C, consumer goods (54.06),
consumer services (48.97), health care (41.59), and industrials (49.35) report lower mean CSR scores
than the overall mean (56.73).
For firm-specific controls affecting the firm level of tax avoidance, all variables are winsorized at
percentiles 1% and 99% to mitigate the potential of extreme value distorting results. The size has a
mean (median) of 15.76 (15.87), the mean (median) leverage ratio is 17.2% (14.3%), as well as the
mean (median) property, plant, and equipment present 38.4% (35.7%) of total assets. The sample
firms further exhibit profitability as mean (median) income to total assets (ROA) is equal to 10.7%
(8.4%) with only 0.5% of firms are in loss, and 46.7% of firms are held by insiders. The growth of
sample firms is observed through the market-to-book ratio having a mean (median) of 3.06 (3.46),
and an average payout of the dividends is $34.36 per share. For the controls in the country level,
58.9% of the sample firms comply with the civil law, and 71% of the firms adopt the IFRS. Overall,
the means and medians of all variables show an acceptable range which reflects normality of
distributions (Hair et al., 2006).
(b) Trend of tax avoidance and CSR
Figure 3.1 Panel A shows the trend of averages of ETR over eight years compared with the those of
the statutory tax rate. The average STR fluctuates between 28% and 31% during the year 2008 and
2012, and stable at around 29% in the year 2013 to 2015. On the contrary, the average ETR gradually
increased by two percentage points from 25% in 2008 to 27% in 2015. Overall, the gap between STR
and ETR has narrowed over eight years from 5% in 2008 to 1% in 2015. The stability of the average
STR is because the corporate tax rate in Brazil, Russia, and China remains the same over the sample
period. Figure 3.2 presents the trend of average social and environment pillar scores. Overall, the
score from both pillars have increased over eight years from 50.63 in the year 2008 to 60.23 in the
year 2015 for environmental CSR scores, and from 58.04 in the year 2008 to 64.54 in the year 2015
for social CSR scores. Specifically, firms in BRICS countries have been rated higher scores for CSR
related to social activities than those for environmental activities.

84
Table 3.2 Descriptive Statistics
Panel A: Overall variable summary
Variables N Mean 25% Median 75% SD
ETR 2276 0.260 0.196 0.257 0.310 0.136
STR 2276 0.293 0.250 0.280 0.340 0.049
CSR 2276 56.732 31.100 63.190 80.885 27.302
SOC 2276 60.037 31.800 69.540 87.940 30.213
ENV 2276 53.426 27.365 57.415 79.045 27.579
Size 2276 15.762 14.701 15.873 16.685 1.514
Lev 2276 0.172 0.048 0.143 0.255 0.146
ROA 2276 0.107 0.044 0.084 0.138 0.107
Loss 2276 0.005 0.000 0.000 0.000 0.072
MTBV 2276 3.015 1.120 1.860 3.460 3.462
CapInt 2276 0.384 0.166 0.357 0.603 0.239
CloseHeld 2276 0.467 0.244 0.515 0.677 0.271
DivPayout 2276 34.335 17.880 30.355 48.050 23.510
LawSys 2276 0.589 0.000 1.000 1.000 0.492
IFRS 2276 0.710 0.000 1.000 1.000 0.454
Panel B: Country mean value for all variables
Variables Mean Value
Overall Brazil Russia India China S.Africa
ETR 0.260 0.257 0.248 0.245 0.235 0.314
STR 0.293 0.340 0.205 0.336 0.250 0.311
CSR 56.732 66.147 53.241 66.299 36.868 68.303
SOC 60.037 71.992 55.653 67.680 35.648 77.183
ENV 53.426 60.301 50.829 64.918 38.088 59.423
Size 15.762 15.836 16.748 15.520 16.549 14.459
Lev 0.172 0.256 0.169 0.157 0.162 0.125
ROA 0.107 0.089 0.135 0.141 0.067 0.137
Loss 0.005 0.002 0.005 0.000 0.003 0.015
MTBV 3.015 3.109 2.146 4.862 2.117 31.395
CapInt 0.384 0.292 0.551 0.350 0.417 0.376
CloseHeld 0.467 0.434 0.615 0.555 0.545 0.262
DivPayout 34.335 43.422 28.358 24.649 31.382 40.534
LawSys 0.589 1.000 1.000 0.000 1.000 0.000
IFRS 0.710 0.881 0.479 0.000 1.000 0.847

85
Table 3.2 Descriptive Statistics (Cont’d)
Panel C: Industry variable mean value against overall mean value
Variables Mean Value
Overall Ind.1 Ind.2 Ind.3 Ind.4 Ind.5 Ind.6 Ind.7 Ind.8 Ind.9
ETR 0.260 0.271 0.254 0.294 0.231 0.253 0.236 0.219 0.287 0.269
STR 0.293 0.288 0.306 0.306 0.306 0.289 0.255 0.312 0.292 0.310
CSR 56.732 58.479 54.062 48.972 41.588 49.349 70.597 71.813 56.777 67.923
SOC 60.037 62.024 57.133 57.494 46.456 49.676 70.854 76.604 63.878 72.230
ENV 53.426 54.935 50.992 40.449 36.720 49.022 70.340 67.023 49.677 63.616
Size 15.762 15.893 14.906 14.632 14.602 15.652 17.704 15.187 16.330 16.331
Lev 0.172 0.179 0.098 0.173 0.110 0.173 0.149 0.059 0.209 0.313
ROA 0.107 0.109 0.144 0.125 0.144 0.070 0.111 0.171 0.122 0.072
Loss 0.005 0.013 0.004 0.004 0.000 0.004 0.000 0.000 0.015 0.000
MTBV 3.015 2.258 5.957 70.407 4.079 2.397 1.387 3.911 2.467 1.577
CapInt 0.384 0.488 0.280 0.334 0.255 0.291 0.594 0.116 0.483 0.449
CloseHeld 0.467 0.509 0.441 0.354 0.442 0.410 0.549 0.444 0.575 0.526
DivPayout 34.335 32.120 36.250 41.424 23.655 30.888 28.631 31.141 40.560 45.746
LawSys 0.589 0.573 0.540 0.507 0.382 0.581 0.789 0.276 0.519 0.831
IFRS 0.710 0.707 0.678 0.885 0.536 0.793 0.637 0.448 0.564 0.740
This table presents descriptive statistics for main variables used in this analysis. Ind.1 to Ind.9 refer to Basic Materials,
Consumer Goods, Consumer Services, Health Care, Industrials, Oil & Gas, Technology, Telecommunications, and
Utilities, respectively.
The variable computations are described in Appendix 3.3 unless definitions noted here: ETR refers to annual effective tax
rate, STR refers to the statutory tax rate, CSR refers to the average score of social pillar and environmental pillar, SOC
refers to social pillar score, ENV refers to environmental pillar score, Size refers to size of firms based on total assets, Lev
refers to firm leverage, ROA refers to firm profitability, Loss refers to net operating losses, MTBV refers to the market-to-
book-ratio, CapInt refers to the intensity of firms’ capital, and CloseHeld refers to the closely-held shares, DivPayout
refers to dividend payout per share, LawSys refers to the country’s law origins, IFRS refers to the adoption of IFRS. The
variables are measured as follows;
Dependent Variables:
ETR = the ratio of annual income tax and pretax income; Independent Variables: =
CSR = the average score of social pillar and environmental pillar; SOC = the score of social pillars; ENV = the score of environmental pillasr;
Control Variables: =
Size = the natural logarithm of total assets;
Lev = the ratio of long-term debt liability and total assets;
ROA = the ratio of pre-tax book income and total assets;
Loss = the dummy variable equal to 1 if the firm’s net income less than 1, and 0 otherwise;
MTBV = the ratio of market value and book value of the common equity;
CapInt = the ratio of gross property, plant, equipment and total assets;
CloseHeld = the ratio of number of closely held shares and common shares outstanding;
DivPayout = the ratio of dividends per share and earnings per share multiplied by 100;
IFRS = the dummy variable equal to 1 in the year and after when firms adopt IFRS, and 0
otherwise; LawSys = the dummy variable equal to 1 if firms are in country complying with civil law and 0
otherwise.

86
However, while all countries reveal a consistent trend, having higher scores on the social pillar
comparing to the environmental pillar, China exhibits opposite with overall trend. Not only does
China has the lowest average scores in both social and environmental pillars, but China is also only
the country where presents a higher score on environmental CSR than a score on social CSR. China
has the very low scores is possibly due to that China is still at an exploratory stage of reporting CSR
(Noronha et al., 2013) and also as pointed out by Belal & Momin (2009) that CSR practices in China
rarely exist. In regard to its acclaiming on the environment rather a society, it may be because China
is the world largest emitter of CO2 emission and the air quality of its major cities fails to meet
international health standards (EDGAR, 2017)33. The environment in China is also affected by water,
solid wastes and noise pollution which generated from the operation of businesses (Jiaqi, 2018). As
such, the Chinese government is putting significant effort into environmental protection by enacting
new and stricter laws and regulations (e.g. the Environmental Protection Tax Law of China and Water
Pollution Prevention and Control Law) which require firms to address the nature and size of their
impact on the environment.
Correlation analysis reported in Table 3.3 indicates that ETR is significantly positively associated
with CSR (p < .001) and its pillars on SOC (p < .001) and ENV (p < .001), implying that the higher
the corporation’s level of CSR, the lower level of tax avoidance. ETR also significantly correlates
with most of the economic factors influencing the level of tax avoidance which is included in
Equation (2). ETR correlates with leverage (p < .05), net operating loss (p < .001), market-to-book
ratio (p < .001), and dividend payout (p < .001) with positive sign. The negative correlation is shown
with the return on assets (p < .01) and the origin of the law system (p < .001). Among explanatory
variables, only moderate levels of collinearity exist (the highest correlation coefficient is between
firm size and the law system of .461 (p < .001). Moreover, the variance inflation factors (VIFs) show
that our base regression model does not present the problem of multicollinearity. The results show
that no VIFs exceed five for any of our explanatory variables, confirming none of the multicollinearity
in the model34.
33 Source: http://edgar.jrc.ec.europa.eu 34 The problem of multicollinearity among the explanatory variables is introduced to the model if a VIF value is above
the threshold of ten (Hair et al., 2006 in Lanis & Richardson, 2012).

87
Figure 3.1 Trend of average ETR and CSR scores
Panel A: Trend of average ETR against STR for pooled data
The figure above is plotted from the mean value of STR against the mean value of ETR for all sample as of 2,276 firm-
year observation during the period of 2008-2015 (see data source in Appendix 3.4).

88
Figure 3.1 Trend of average ETR and CSR scores
Panel B: Trend of average CSR score on social and environmental pillars for pooled data
The figure above is plotted from the mean value of social pillar scores against the mean value of environmental pillar
score for all sample as of 2,276 firm-year observation during the period of 2008-2015. The trend of the average CSR
score which is used to proxy for CSR in this study is lied parallelly between SOC and ENV (see data source in Appendix
3.4).

89
Table 3.3 Variable Correlation
Standard errors in parentheses
*, ** and *** indicate the level of significance at p<0.05, p<0.01, and p<0.001, respectively, using Pearson tests.
Variables (1) (2) (3) (4) (5) (6) (7) (8) (9) (10) (11) (12) (13) (14)
(1) ETR 1
(2) CSR 0.115 *** 1
(3) SOC 0.124 *** 0.950 *** 1
(4) ENV 0.092 *** 0.939 *** 0.785 *** 1
(5) Size -0,041 0.145 *** 0.038 0.246 *** 1
(6) Lev 0.051 * 0.063 ** 0.074 *** 0.044 * 0.238 *** 1
(7) ROA -0.063 ** 0.126 *** 0.149 *** 0.086 *** -0.269 *** -0.295**
*1
(8) Loss 0.348 *** 0.009 0.009 0.008 0,019 0.029 -0.063 *** 1
(9) MTBV 0.190 *** -0.017 *** 0.006 -0.041 -0,002 0,011 -0.017 -0.005 1
(10) CapInt -0,025 0.141 *** 0.119 *** 0.148 *** 0.315 *** 0.325**
*-0.068 *** 0.022 -0.065
*
*1
(11) CloseHeld -0,032 -0.109 *** -0.151 *** -0.050 *** 0.279 *** 0.047 * 0.032 -0.001 -0.056*
*0.185
**
*1
(12) DivPayout 0.107 *** 0.181 *** 0.211 *** 0.127 *** -0.125 *** 0.010 0.228 *** -0.106 *** -0.012 -0.030 -0.062 ** 1
(13) LawSys -0.143 *** -0.327 *** -0.358 *** -0.255 *** 0.461 *** 0.186**
*-0.245 *** -0.038 -0.069
*
*0.068 ** 0.232
**
*0.028 1
(14) IFRS 0.009 -0.163 *** -0.139 *** -0.200 *** -0.008 0.056**
*-0.225 *** 0.046 * -0.008 -0.041 * -0.186
**
*0.177
**
*0.436 *** 1
N 2276

90
3.5.2. Multivariate analysis
(a) Tax avoidance and CSR
In examining how CSR in BRICS group affect tax avoidance in the base-line test, this study first regresses
the average CSR scores on annual GAAP ETR across firm-year observations controlling for both firm
and country-specific variables. In the second and third steps, the same model is re-estimated by replacing
average CSR scores with scores on the social pillar and environmental pillar, respectively. However, to
ensure that the data satisfy the underlying assumptions of the classical linear regression model for an
OLS estimator to be BLUE (Best Linear Unbiased Estimator), some tests are conducted.
Table 3.4 reports the regression results for both average CSR and individual pillar and annual GAAP
ETR. Based on the Hausman test, the fixed effect regression with the robustness of standard errors at the
firm level35 is used to investigate the hypotheses. The results indicate that the regression coefficient for
average CSR (β = 0.0004, p < 0.05), for social pillar (β = 0.0002, p < 0.1), and for environmental pillar
(β = 0.0004, p < 0.01) are positive and significantly associated with annual GAAP ETR. This means
that, on average, 1% increases in CSR performance results in a 0.04% increase in annual GAAP ETR.
On the other hand, firms with a higher level of CSR are likely to be less tax aggressive. The results lend
further support for H1, explained through the complementary notions of legitimacy theory, normative
stakeholder theory, and the corporate culture theory. That is, the results suggest that firms in the BRICS
group do not use CSR as "a tool" to legitimate or manage the risk/minimise public scrutiny from their
tax avoidance behaviour. Instead, they develop a culture of tax compliance and CSR engagement as a
complementary strategy that is geared toward improving reputation to gain legitimacy where firms
promise ethical conduct to external audiences and commit to serving the interests of all stakeholders.
This also supports prior findings indicating that economic development does not explain the variation of
CSR across nations in BRICS as shown in the case of India where GDP per capita is lower than in China,
but CSR is more intensive (Alon et al., 2010; Ramasamy & Yeung, 2009; Shaomin Li, Marc Fetscherin,
Ilan Alon, 2010). Similarly, Alon et al. (2010) find that economic responsibility in the view of Chinese
firms is not perceived as the most important responsibility, but providing jobs, housing and food is the
35 Breusch Pagan/Cook Weisberg Test and Wooldridge Test indicate that my data is suspected to have the problem of
heteroskedasticity and autocorrelation. Robust the standard errors help dealing with such problems.
91
most important responsibility for CSR engagement. In comparison to developed countries, this finding
is consistent with many prior studies in which firms with a higher level of CSR are less likely to engage
in tax avoidance (e.g., Hoi et al., 2013; Laguir et al., 2015; Lanis & Richardson, 2012, 2015). As BRICS
is currently in the process of convergence towards several international standards, it is possible that firms
in BRICS also converge their CSR behaviours towards institutionalised global CSR practices.
As for the firm-specific control variables, the results are consistent in all cases for average CSR and
social and environmental pillar. The capital intensity (CapInt), which is an alternative proxy capturing
firm size, is negative and significantly associated with the effective tax rate, consistent with Huseynov
& Klamm (2012). This result implies that larger firms reduce more tax rate. This result can be explained
through the theory of political power, assuming that larger companies have more resources to make more
lobbying and participate in more complex tax planning activities. The coefficients on firm leverage (Lev)
have a significantly positive relation to the ETR, suggesting that firms with a high level of leverage
participate less in tax avoidance activities. Consistent with Huseynov & Klamm (2012), the firm
profitability proxied by return on asset (ROA) is significantly positively associated with ETR, consistent
with the notion that ETR is progressive according to income. As predicted, firms with negative income
(Loss) are less incentive to lessen tax rate thereby positively associated with the ETR. Growth, measured
as the market-to-book ratio (MTBV), is significant and positive related to the ETR, consistent with
(Dyreng et al., 2008; Minnick & Noga, 2010). The results also show that firms having more alignment
between managers and shareholders (CloseHeld) pay more tax, consistent with the results of dividend
payout per share (DivPayout) and tax rate showing the positive and significant for all models. That is,
more aligned firms commit to increasing profits for shareholders, leading to higher tax liability as to the
result of increased incomes.
Considering the results for country-specific variables, firms in the country with civil law (LawSys),
categorized as low investor protection show lower ETR as expected because the low level of investor
protection represents less enforcement of law and regulations.36 After the adoption of IFRS, firms report
higher GAAP ETR, supporting the argument that the increased book-tax conformity would reduce
managerial opportunism over financial reporting, limit tax avoidance, and minimize costs of compliance
36 Consistent with La Porta et al, 1998, common law origin presents characteristics in comply with attributes of strong investor
protection.

92
(Blaylock et al., 2015; Tang, 2015). If book income and tax income were to conform, managers would
not be motivated to upward book income because doing that would be countered by higher income tax
payments. Similarly, downward book income to avoid tax would be countered by the disapproval of
financial contracts from creditors, or dissatisfied by shareholders (Blaylock et al., 2015). Another support
of the required book-tax conformity argues that the convergence of the two would diminish earnings
management by eliminating tax accruals, which can be used to either manage or smooth financial income
with no effect on taxable income (Whitaker, 2005).
(b) Robustness tests
Alternative measures of CSR
For the first robustness test, this study adjusts the overall average CSR scores by CSR country and
industry-mean scores to control for the deviation of CSR scores across countries and industries
(McWilliams & Siegel, 2001). Second, following Lanis & Richardson (2012), this study divides overall
CSR scores into a high level of CSR performance and denote high CSR equal to 1 if the firm’s overall
average CSR score falls above the country mean score and equal to 0, otherwise. Table 3.5 Panel A
reports the positive association between tax avoidance and CSR in both alternative measures of CSR:
industry-adjusted CSR (β = 0.0307, p < 0.01) and high subgroup of CSR (β = 0.0147, p < 0.01). Again,
they are quantitatively similar to the main test and provide further support for the hypothesis of
stakeholder theory. In the case of firm and country-specific control variables, results are similar to those
in the main tests, both in term of direction and magnitude of the coefficients.
Alternative measures of tax avoidance
Since this study based on the data from different jurisdictions, the measure of ETR in the main test may
be altered the results because of differences in accounting choices across different countries. This study,
therefore, uses the first alternative measure of ETR as calculated by income tax divided by operating
cash flows to mitigate such problem (Jaafar & Thornton, 2015; Karampinis & Hevas, 2013). In addition,
annual ETR is calculated from annual data which can introduce significant year-to-year variation in the
measure, thereby misleading indicators of corporate tax avoidance. Supported by Dyreng et al., (2008),
one-year ETR is less predictive for tax avoidance. Therefore using long-term ETR is more appropriate
as it reflects sustained avoidance by firms, representing their intention to maintain low ETR over a long

93
period by manipulating in particularly complicated transactions and hence clouding users of financial
statements (Kubata et al., 2013). In addition to benefits regarding the reduction of volatility presenting
in annual ETR (Hanlon & Heitzman, 2010; Salihu et al., 2013), using long-run ETR helps diminish data
truncation bias due to a loss in each year37 (Henry & Sansing, 2018b). Gebhart (2017) investigates the
measures of tax avoidance used in literature. Predictably, he finds that there are differences among the
single measure and those differences carry on over time. In particular, measures estimated under annual
basis display considerable correlation increasing due to the similarity of computation and inputs used.
Following Dyreng et al. (2008), this study adopts five-year cumulative ETR to be the second alternative
measure of tax avoidance and define as five-year income tax divided by five-year pre-tax income. The
results of the alternative measures of ETRs and CSR are reported in Table 3.5 Panel B, and they reveal
that both average CSR and individual CSR pillar continue to exhibit a strong positive relationship with
the tax rate for both alternative proxies: the one-year ETR with operating cash flow as a denominator (β
= 0.0007, p < 0.01) and five-year ETR with pre-tax income as a denominator (β = 0.0006, p < 0.01).
Two-Stage Least Squares (2SLS) regression
This study also uses the Two-Stage Least Squares analysis to make sure that the model does not violate
the underlying assumptions of the classical linear regression model and the OLS estimators will not be
biased due to the problem on endogeneity. As the endogeneity occurs when an independent variable is
correlated with the error term which can arise as the results of (i) omitted variables; (ii) reverse causality
and; (iii) measurement error (Robert and Whited, 2012). In this study, the concern relates to the second
issue of endogeneity. That is, it can be argued that tax avoidance causes CSR engagement (Lanis &
Richardson, 2013) or that CSR engagement causes tax avoidance (Hoi et al., 2013; Huseynov & Klamm,
2012; Lanis & Richardson, 2012). In dealing with this concern, the instrumental variables (IV) is used
(Bound et al., 1995; Reed, 2015) with 2SLS estimation.
As CSR is assumed to be the endogenous variable in the model, this study uses the industry-mean CSR
as the instrumental variables (Larcker and Rusticus, 2010; Robert and Whited, 2012) in 2SLS regression.
The results in Table 3.5 Panel C reports consistent results with those of OLS regression where the
37 Almost all ETR studies exclude the year in which firms present losses because the difficulty of economic interpretation for
negative value of ETRs.

94
regression coefficient for average CSR is positive and significantly associated with the ETR (β = 0.0008,
p < 0.01). To ensure the endogeneity problem of CSR variables, the null hypothesis testing that the CSR
variables are exogenous are executed. Both Durbin test and Wu-Hausman test report a very small p-value
which suggests rejecting the null hypothesis, and the model is correct in treating CSR variables as
endogenous variables. Also, all the R2 statistics in the first-stage regression to confirm the relevance of
instrumental variables are relatively high, suggesting that the instruments are sufficiently correlated with
CSR variables. Therefore, they do not imply a weak-instrument problem.

95
Table 3.4 The Relation between Tax Avoidance and CSR
Variables
Exp. Sign ETR
OLS Estimation
CSR_A4:
Average CSR +/- 0.0004 **
(0.000)
Pillars:
Social
0.0002 *
(0.000)
Environment
0.0004 ***
(0.000)
Control Variables:
Firm-Level:
Size +/- 0.0022
0.0037
0.0017
(0.003)
(0.003)
(0.003)
CapInt - -0.0538 *** -0.0515 *** -0.054 ***
(0.014) (0.015) (0.014)
Lev +/- 0.0481 * 0.0448 * 0.0508 **
(0.025)
(0.025)
(0.025)
ROA +/- -0.1368 *** -0.1343 *** -0.1372 ***
(0.031)
(0.031)
(0.031)
Loss + 0.6394 *** 0.6394 *** 0.6391 ***
(0.059)
(0.059)
(0.059)
MTBV +/- 0.0002 *** 0.0002 *** 0.0002 ***
(0.000)
(0.000)
(0.000)
CloseHeld - 0.0389 *** 0.0387 *** 0.0386 ***
(0.012)
(0.012)
(0.012)
DivPayout - 0.0008 *** 0.0008 *** 0.0008 ***
(0.000)
(0.000)
(0.000)
Country-Level:
LawSys - -0.0711 *** -0.0721 *** -0.0719 ***
(0.011)
(0.012)
(0.011)
IFRS + -0.0467 *** -0.0461 *** -0.0465 ***
(0.011)
(0.011)
(0.011)
Fixed Effects:
Country, Industry, Year Yes
Yes
Yes
Constant 0.2549 *** 0.2387 *** 0.2655 ***
(0.041) (0.040) (0.042)
adj. R2 0.229
0.228
0.23
F 14.5941
14.5618
14.6148
N 2276 2276 2276
Robust standard errors clustered at the firm level are in parentheses.
*, ** and *** indicate the level of significance at p<0.1, p<0.05, and p<0.01, respectively, using two tailed tests.

96
The table reports regression results of the following fixed-effect model using OLS estimation with robustness of standard
errors:
𝑇𝑎𝑥𝐴𝑣𝑜𝑖𝑑𝑖,𝑡 = 𝛼0 + 𝛼1𝐶𝑆𝑅𝑖,𝑡 + ∑ 𝛼𝑛𝐶𝑂𝑁𝑇𝑅𝑂𝐿𝑆𝑖,𝑡
9
𝑛=2
+ ∑ 𝛼𝑛𝐹𝐼𝑋𝐸𝐷 𝐸𝐹𝐹𝐸𝐶𝑇𝑆𝑖,𝑡
31
𝑛=10
+ 휀𝑖,𝑡
where: TaxAvoid is tax avoidance proxied through annualETR, calculated by dividing income tax by pretax income;
CSR is corporate social responsibility measured through the average score between social pillar and environmental
pillar from ASSET4 dataset, SOC is the score from social pillar, and ENV is the score from environmental pillar.
CONTROLS are set of control variables where Size refers to size of firms based on total assets, Lev refers to firm
leverage, ROA refers to firm profitability, Loss refers to net operating losses, MTBV refers to the market-to-book-
ratio, CapInt refers to the intensity of firms’ capital, and CloseHeld refers to the closely-held shares, DivPayout
refers to dividend payout per share, LawSys refers to the country’s law origins, IFRS refers to the adoption of IFRS.
The variables are measured as follows;
Size = the natural logarithm of total assets;
Lev = the ratio of long-term debt liability and total assets;
ROA = the ratio of pre-tax book income and total assets;
Loss = the dummy variable equal to 1 if the firm’s net income less than 1, and 0 otherwise;
MTBV = the ratio of market value and book value of the common equity;
CapInt = the ratio of gross property, plant, equipment and total assets;
CloseHeld = the ratio of number of closely held shares and common shares outstanding;
DivPayout = the ratio of dividends per share and earnings per share multiplied by 100;
IFRS = the dummy variable equal to 1 in the year and after when firms adopt IFRS, and 0 otherwise; LawSys = the dummy variable equal to 1 if firms are in country complying with civil law and 0 otherwise.
FIXED EFFECTS refer to country, industry, and year fixed effect: five countries, nine industries, and eight years.

97
Table 3.5 Robustness Tests
Panel A: Tax Avoidance and CSR using Alternative CSR Measures
Variables Exp. Sign Tax Avoidance
ETR as Income Tax/Pre-tax Income
Industry Adj. CSR: +
Average CSR 0.0307 ***
(0.0077)
Social CSR
0.0216 ***
(0.0074)
Environmental CSR
0.0297 ***
(0.0075)
High level of CSR: +
Average CSR
0.0147 **
(0.0063)
Social CSR
0.0075 *
(0.0061)
Environmental CSR
0.0224 ***
(0.0063)
Constant 0.2724 *** 0.2533 *** 0.2797 *** 0.2559 *** 0.2373 *** 0.2797 *** (0.0410)
(0.0405)
(0.0420)
(0.0420)
(0.0408)
(0.0426)
adj. R2 0.234 0.232 0.235 0.229 0.227 0.231
F 15.446
15.116
15.287
15.028
14.384
15.3378
N 2276 2276 2276 2276 2276 2276
Panel B: Tax Avoidance and CSR using Alternative Tax Avoidance Measures
Variables Exp. Sign Tax Avoidance
ETR as Income Tax/Operating Cash Flow
Five-year ETR
CSR: +
Average CSR 0.0007 ***
0.0006 ***
(0.0002)
(0.0001)
Pillars:
Social
0.0008 ***
0.0006 ***
(0.0002)
(0.0001)
Environment
0.0003 *
0.0005 ***
(0.0002)
(0.0001)
Constant 0.4892 *** 0.4746 *** 0.4693 *** 0.3111 *** 0.2896 *** 0.3137 ***
(0.0648) (0.0633)
(0.0657)
(0.0413)
(0.0397)
(0.0425)
adj. R2 0.211 0.213 0.208 0.175 0.175 0.172
F 28.7114 28.7095
28.502
21.5305
21.6443
20.9798
N 2108 2108 2108 2210 2210 2210

98
Table 3.5 Robustness Tests (Cont’d)
Panel C: Tax avoidance and CSR using 2SLS estimation
Variables
Exp. Sign Tax Avoidance (ETR)
2SLS Estimation
CSR: +
Average CSR
0.0008 ***
(0.0002)
Pillars:
Social
0.0006 ***
(0.0002)
Environment
0.0007 ***
(0.0002)
Fixed Effects:
Industry, Year Yes
Yes
Yes
Constant 0.3133 *** 0.285 *** 0.3287 ***
(0.0415)
(0.0402)
(0.0434)
Adj. R2 0.226
0.225
0.227
Wald Chi2 439.240 *** 431.860 *** 436.760 ***
Tests of endogeneity:
(Ho: variables are exogenous)
Durbin chi2 15.391 *** 8.207 *** 12.694 ***
Wu-Hausman F 15.804 *** 8.748 *** 13.156 *** First-stage regression:
R2 0.8429
0.8352
0.8347
Adj. R2 0.8409
0.8331
0.8326
Part. R2 0.6585
0.6536
0.6779
F 2159.58 *** 1679.96 *** 2307.33 ***
N 2276 2276 2276
*, ** and *** indicate the level of significance at p<0.1, p<0.05, and p<0.01, respectively, using two tailed tests. Robust
standard errors clustered at the firm level are in parentheses. All models are controlled for country, industry, year fixed effects.
1 ETR1 is calculated as income tax divided by operating cash flow. 2 Five-year ETR is calculated as five-year income tax divided by five-year pre-tax income.

99
(c) Additional analyses
Tax avoidance and CSR disclosure
To achieve the goal of long-term financial performance, corporations have structured CSR practices as
an integral function of its business. Besides the engagement, corporations realize that their CSR activities
also need to be communicated to the public (Font et al., 2012), generally through CSR disclosure, to be
deemed as legitimated corporate organizations. However, the CSR agenda in business is not necessarily
acknowledged in more responsible behaviour; it has questioned to what extent CSR disclosure is
consistent with CSR performance, or whether CSR engagement policy is just a method to avoid other
regulations (Hess, 2008). Therefore, transparency in CSR reporting is crucial if companies are to be held
to account for their actions (Font et al., 2012).
Nevertheless, it is difficult to evaluate whether a firm’ CSR policy is genuine or is only a marketing tool
to achieve its financial goal. Hess (2014) argues that CSR reports are primarily aimed at sharing
information to outside, tend to be noticed as to the main company objectives, but no end results are
reported. This could be one of the reasons causing the gap between CSR disclosure and CSR performance
as said, “it is one thing to have a policy; it is another to adhere to it” (Font et al., 2012, p. 1550). Font et
al. (2012) test the gap between corporate social responsibility claims and actual practices of ten
international hotel chains through a content analysis approach. Their results suggest that corporate
policies do not necessarily reflect actual operations. Gutsche et al. (2017) find that although the firm
value is affected by both CSR disclosure and CSR performance, the total effect of the individual
dimensions of CSR performance is smaller than the relative effect of CSR disclosure, suggesting the
inconsistency between what companies talk and what they have done.
In investigating whether there is any difference between the impact of CSR performance and CSR
disclosure on tax avoidance, the main model has been re-estimated by replacing CSR scores from
ASSET4 database with those from Bloomberg database.38 Noted, CSR scores from Bloomberg is claimed
38 Comparable to ASSET4, Bloomberg ESG Disclosure Scores rate over 10,000 publicly listed companies globally based on
their disclosure of quantitative and policy related ESG data with more than 120 indicators. Based on the extent of a company's
Environmental, Social, and Governance (ESG) disclosure, the score ranges from 0.1 to 100 for companies that expose a
minimum number of data points to those that disclose every sustainability data point collected through CSR report, annual
report, company website, and Bloomberg survey from companies (Qiu, 2013).

100
to be proxied for CSR disclosure because none of the data from Bloomberg is estimated or derived,
thereby every data field can be traced back to a company. Furthermore, as different industries cannot be
assigned an equal weight for each ESG factor, each data point then is adjusted by industries and weighted
by importance. This means that a company is only scored with data points relevant to its industry sector.
For example, with data point such as Phones Recycled, it is only evaluated and scored for companies in
the Telecommunications sector and not penalized for those in other sectors that do not disclose it. As
such, the industry-fixed effects are excluded from the model. Table 3.6 shows that scores of average CSR
disclosure are positively associated with the ETR. The results also reveal that this positive relationship
is driven by social disclosure, as the coefficient of environmental disclosure scores is not significant. As
the results are consistent with social performance, it can be implied that firms’ social disclosure does
reflect their actual social performance.

101
Table 3.6 The Relation between Tax Avoidance and CSR disclosure
Variables
Exp. Sign ETR
OLS Estimation
CSR:
Average CSR +/- 0.0008 ***
(0.0004)
Pillars:
Social +/-
0.0007 ***
(0.0003)
Environment +/-
0.0005
(0.0004)
Control Variables:
Firm-Level:
Size +/- 0.0049
0.0053
0.0056
(0.0049)
(0.0049)
(0.0049)
Lev +/- 0.0584
0.061
0.059
(0.0469)
(0.0473)
(0.0209)
Growth + -0.0224
-0.0232
-0.0188
(0.0189)
(0.0190)
(0.0312)
ROA - -0.0693 ** -0.0688 ** -0.0641 **
(0.0328)
(0.0338)
(0.0325)
MTBV + 0.0002 *** 0.0002 *** 0.0002 ***
0.0000
0.0000
0.0000
IntangInt - -0.032
-0.0344
-0.036
(0.0362)
(0.0364)
(0.0366)
FirmAge + 0.0002
0.0003
0.0002
(0.0006)
(0.0007)
(0.0007)
Loss + 0.6134 *** 0.6155 *** 0.6131 ***
(0.0655)
(0.0657)
(0.0655)
Country-Level:
LawSys - -0.063 *** -0.0623 *** -0.0611 ***
(0.0232)
(0.0232)
(0.0234)
IFRS - -0.0357 * -0.0351 * -0.035 *
(0.0189)
(0.0188)
(0.0188)
Fixed Effects:
Country, Industry, Year Yes
Yes
Yes
Constant 0.1762 *** 0.1688 *** 0.1827 ***
(0.0757) (0.0760) (0.0752)
adj. R2 0.316
0.317
0.313
F 12.0924
12.0169
12.1061
N 726 726 726
Standard errors in parentheses
*, ** and *** indicate the level of significance at p<0.1, p<0.05, and p<0.01, respectively, using two tailed tests.

102
Tax avoidance and CSR at individual country level
Table 3.7 reports the regression results for each member country in the BRICS group. Explained by
institutional theory, the way corporations governing vary across jurisdictions due to a variation of the
motives of managers, shareholders, and other key stakeholders driven by the long-standing, historically
entrenched institutions (Matten & Moon, 2008) which focus on the role of economic, political, and
cultural context (Baughn et al., 2007). Therefore, the relationship between tax avoidance and CSR may
present diversely among countries in the BRICS group. The main regression model is re-estimated with
the country-based data separately. The results show that Russia, India, and China provide statistically
significant evidence consistent with the main test. Although Brazil and South Africa show a relatively
high mean value of CSR rating scores signifying a high level of CSR performance, the relation between
tax avoidance and CSR is no longer significant. This suggests that the firms’ behaviour regarding CSR
is not a driver, for firms in Brazil and South Africa, of tax avoidance. Consistent with Im, Kim, & Ko
(2017), they find that the active activities on CSR in Brazil do not link with tax avoidance.
The effect of Big4 auditor on the relation between tax avoidance and CSR
Since the audit firms are not prohibited from providing services other than audit services to their audit
clients39, tax services from audit firms are one option for firms to succeed in their tax saving goal. Using
tax consulting services from the same audit firms, although it is concerned about auditor independence
(Cripe and McAllister, 2009), many research evidence that synergies between audit and tax work within
the same audit firm help in discovering opportunities for tax savings (Dhaliwal et al., 2013; Seetharaman,
Sun, & Wang, 2011). In this line, Omer, Bedard, & Falsetta (2006) find a negative relationship between
using auditor-provided tax services and subsequent changes in tax rates. However, this relation weakened
in 2002 as the result of mandated SOX. Gleason & Mills (2011) note that using auditor-provided tax
services is associated with lower US tax expenses. Hogan & Noga (2015) also find that the auditor-
provided tax services are negatively associated with the five-year average annual cash-effective tax rates,
suggesting firms using the auditor-provided tax service pay less tax. Prior literature use Big4 firms as
39 Although limitations on the types of non-audit services are stricter after the passage of the Sarbanes–Oxley Act of 2002
(SOX), tax-related services are not fully forbidden. The act just required firms to disclose annual fees paid for non-audit
services and disclose separately the amount paid for tax services (Hogan & Noga, 2015).

103
representative of large audit firms40 to investigate the audit quality (e.g., Behn et al., 2008; Cassell et al.,
2013; Francis & Yu, 2009; Lai, 2013). In the context of tax avoidance, McGuire, Omer, & Wang (2012)
and Janssen, Vandenbussche, & Crabbé (2005) find that clients using tax services from their audit firm
engage in greater tax avoidance when their external audit firm is tax expertise proxied through Big4. In
the context of CSR, prior research also indicates that audit firm size is positively associated with
voluntary CSR disclosure (Ahmed & Courtis, 1999; Kelton & Yang, 2008; Xiao et al., 2004). Therefore,
employing Big4 audit firms may influence the effect of CSR on the level of tax avoidance. This study
investigates this hypothesis by capturing the audit expertise through the use of Big4 firms and measuring
Big4 as a dichotomous variable equal to 1 if firms use audit services from Big4 (i.e., Deloitte & Touche,
Ernst & Young, PricewaterhouseCoopers, and KPMG,) and 0 otherwise.
Table 3.8 shows the interaction terms of Big4 and CSR are negatively associated with ETR in all models,
reducing the relationship between tax avoidance and CSR from 0.04% to 0.02%41. The results suggest
that high CSR firms that hire external auditors from Big4 firms tend to pay less tax. Taken together, the
expert auditor itself does not affect the level of tax avoidance, but it does when interact with high CSR
performance. The possible explanation is that Big4 auditor may help top CSR performance firms
arranging transactions for tax reduction purpose as overinvesting in CSR can disguise the sin nature of
their misbehaviour regarding tax payment.
The effect of listing status on tax avoidance – CSR association
Since the multinational companies (MNCs) operate in a range of economic environment, political, and
culture as well as numerous tax jurisdictions, they use those advantages to set up complex schemes that
allow them to avoid tax both in their home country and the host country. Given that the MNCs have more
opportunities to participate in tax avoidance schemes ( through tax sheltering, transfer pricing, or income
shifting), Rego (2003) finds that firms with the high scale of foreign operations present lower worldwide
ETRs. Similarly, companies that have been identified to be actively involved in tax sheltering showing
higher levels of overseas operations, often have subsidiaries in tax havens and exhibit inconsistent book-
40 DeAngelo (1981) claims that audit quality is driven by many factors including the size of audit firm which can measure
through a market share; the larger market shares the audit firm has, the more expert the audit firm is.
41 The effect of CSR on the ETR in this model is equal to (0.0014) + (-0.0012 x 1) = 0.002, while the effect of CSR on the
ETR in the model without Big4 is equal to 0.0004 as presented in Table 3.4.

104
tax treatment (Lisowsky, 2010; Wilson, 2009b). Investigating firm-level corporate income tax rates for
11,602 corporations and country-level ETRs from over 80 countries between 1988 and 2009, Markle &
Shackelford (2012) find that MNEs located in low-tax jurisdictions display the lowest ETRs at 14% in
comparison to ETRs at 30% for MNEs domiciled in the U.S.
As globalization is one of the drivers to form new developments of CSR engagement, it could be
conjectured that firms in emerging countries have encouraged to the trend toward universal practices
(Chapple & Moon, 2005) either by outside-in perspective or inside-out perspective. Through the outside-
in perspective, firms from advanced markets operating in emerging counties bring the new CSR strategies
to implement or adapt it in accordance with their policies. Argued in the aspect of inside-out view, firms
in emerging countries operating internationally consider CSR as a tool to build their reputation and to be
the proof of being good citizens in the eyes of host countries. Hafsi & Farashahi (2005) state that
international functions (e.g., multinational firms, international joint venture, and alliance) within a
country may lead domestic firms to adapt to globalization. To test the conjecture, the variable of firms
foreign listing status is added into the replication of the main model. Table 3.9 reports that listing stocks
in foreign markets does not influence the level of the tax rate and does not have an impact on the
relationship between tax avoidance and CSR in BRICS countries.
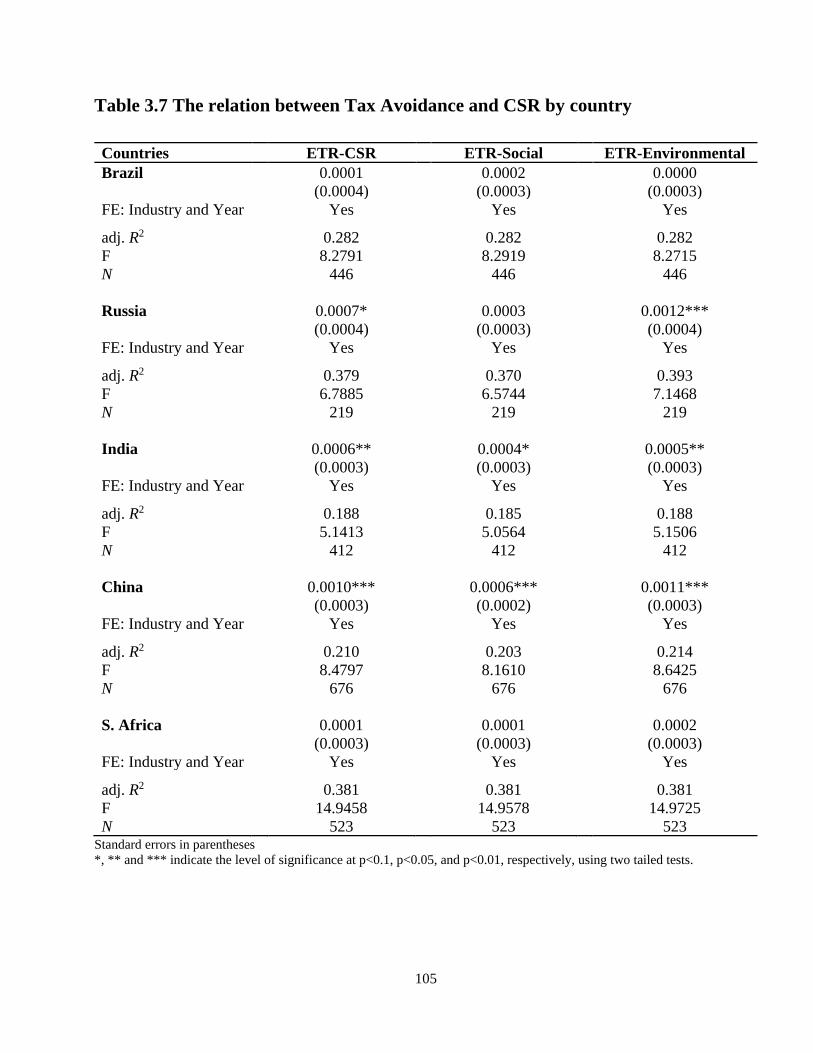
105
Table 3.7 The relation between Tax Avoidance and CSR by country
Countries ETR-CSR ETR-Social ETR-Environmental
Brazil 0.0001 0.0002 0.0000 (0.0004) (0.0003) (0.0003)
FE: Industry and Year Yes Yes Yes
adj. R2 0.282 0.282 0.282
F 8.2791 8.2919 8.2715
N 446 446 446
Russia 0.0007* 0.0003 0.0012*** (0.0004) (0.0003) (0.0004)
FE: Industry and Year Yes Yes Yes
adj. R2 0.379 0.370 0.393
F 6.7885 6.5744 7.1468
N 219 219 219
India 0.0006** 0.0004* 0.0005** (0.0003) (0.0003) (0.0003)
FE: Industry and Year Yes Yes Yes
adj. R2 0.188 0.185 0.188
F 5.1413 5.0564 5.1506
N 412 412 412
China 0.0010*** 0.0006*** 0.0011*** (0.0003) (0.0002) (0.0003)
FE: Industry and Year Yes Yes Yes
adj. R2 0.210 0.203 0.214
F 8.4797 8.1610 8.6425
N 676 676 676
S. Africa 0.0001 0.0001 0.0002 (0.0003) (0.0003) (0.0003)
FE: Industry and Year Yes Yes Yes
adj. R2 0.381 0.381 0.381
F 14.9458 14.9578 14.9725
N 523 523 523 Standard errors in parentheses
*, ** and *** indicate the level of significance at p<0.1, p<0.05, and p<0.01, respectively, using two tailed tests.
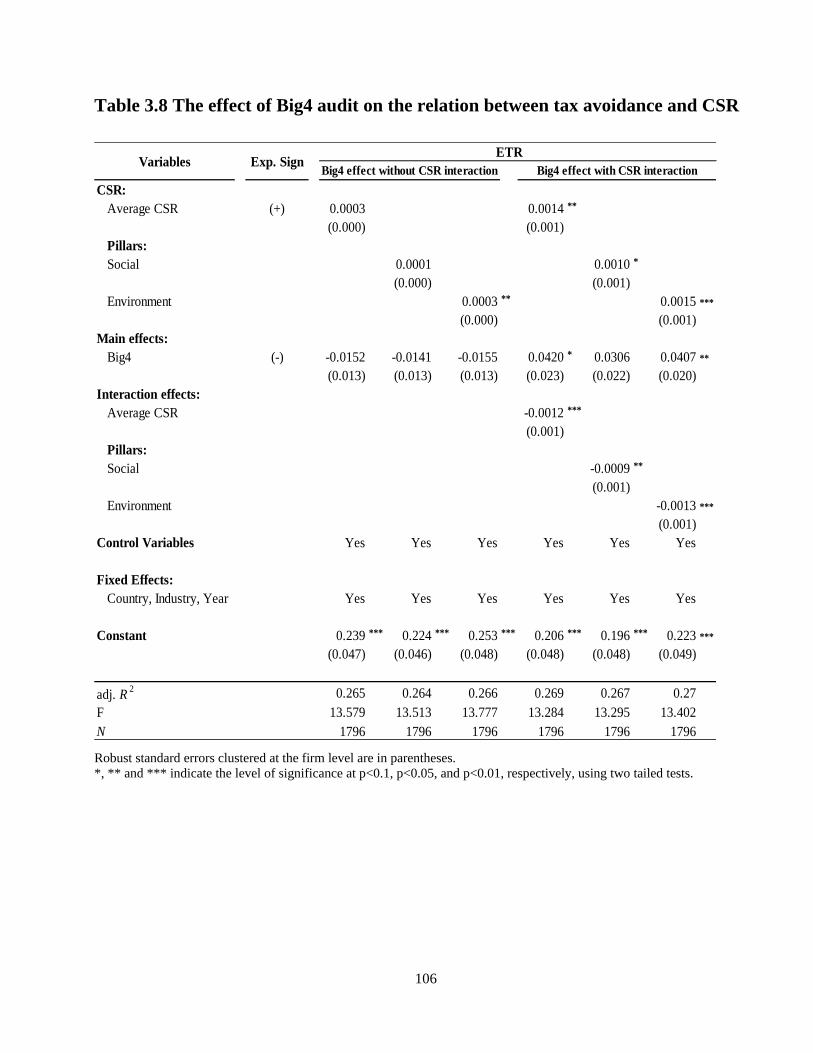
106
Table 3.8 The effect of Big4 audit on the relation between tax avoidance and CSR
Robust standard errors clustered at the firm level are in parentheses.
*, ** and *** indicate the level of significance at p<0.1, p<0.05, and p<0.01, respectively, using two tailed tests.
CSR:
Average CSR (+) 0.0003 0.0014 **
(0.000) (0.001)
Pillars:
Social 0.0001 0.0010 *
(0.000) (0.001)
Environment 0.0003 ** 0.0015 ***
(0.000) (0.001)
Main effects:
Big4 (-) -0.0152 -0.0141 -0.0155 0.0420 * 0.0306 0.0407 **
(0.013) (0.013) (0.013) (0.023) (0.022) (0.020)
Interaction effects:
Average CSR -0.0012 ***
(0.001)
Pillars:
Social -0.0009 **
(0.001)
Environment -0.0013 ***
(0.001)
Control Variables Yes Yes Yes Yes Yes Yes
Fixed Effects:
Country, Industry, Year Yes Yes Yes Yes Yes Yes
Constant 0.239 *** 0.224 *** 0.253 *** 0.206 *** 0.196 *** 0.223 ***
(0.047) (0.046) (0.048) (0.048) (0.048) (0.049)
adj. R2 0.265 0.264 0.266 0.269 0.267 0.27
F 13.579 13.513 13.777 13.284 13.295 13.402
N 1796 1796 1796 1796 1796 1796
Variables Exp. SignETR
Big4 effect without CSR interaction Big4 effect with CSR interaction

107
Table 3.9 The effect of foreign listing status on tax avoidance and CSR link
Robust standard errors clustered at the firm level are in parentheses.
*, ** and *** indicate the level of significance at p<0.1, p<0.05, and p<0.01, respectively, using two tailed tests.
3.6. Conclusion
Since corporate taxes are part of the national revenue, which is a fundamental budget for supporting
social infrastructures, avoiding paying tax by corporations in a social perspective would affect society as
a whole. Tax-avoiding firms, then, are conceived as not being a good citizen because they do not
CSR:
Average CSR (+) 0.0004 ** 0.0003 **
(0.000) (0.000)
Pillars:
Social 0.0002 * 0.0002
(0.000) (0.000)
Environment 0.0004 ** 0.0003 **
(0.000) (0.000)
Main effects:
Foreign Listing (-) -0.0044 -0.0040 -0.0045 -0.0089 -0.0059 -0.0108
(0.006) (0.006) (0.006) (0.012) (0.012) (0.011)
Interaction effects:
Average CSR 0.0001
(0.000)
Pillars:
Social 0.0000
(0.000)
Environment 0.0001
(0.000)
Control Variables Yes Yes Yes Yes Yes Yes
Fixed Effects:
Country, Industry, Year Yes Yes Yes Yes Yes Yes
Constant 0.252 *** 0.236 *** 0.263 *** 0.254 *** 0.237 *** 0.266 ***
(0.041) (0.040) (0.042) (0.042) (0.041) (0.043)
adj. R2 0.229 0.228 0.23 0.229 0.228 0.229
F 14.177 14.138 14.196 13.717 13.687 13.748
N 2276 2276 2276 2276 2276 2276
Variables Exp. Sign Foreign listing effect without
CSR interaction
ETR
Foreign listing effect with CSR
interaction

108
discharge the duty to pay their fair share of taxes, implying that they neglect their social responsibility.
This raises the question of whether it is time to bring the issue of tax avoidance into CSR account in
considering the firms’ obligations about responsibility towards “all stakeholders” in “all aspects” affected
by their business operation. Although tax avoidance seems to be related to CSR strategy, the link between
them is not well explored in literature. In the real business world, many companies label themselves as a
green corporation but simultaneously face the accusation of tax avoidance. This study examines how tax
avoidance relates to CSR in BRICS (Brazil, Russia, India, China, and South Africa). In particular, this
study investigates how a firm’s CSR in social and environmental activities relates to its average tax paid
measured through the ETR.
At the firm level across BRICS countries, the results show that firms with higher level of CSR display
lower level of tax avoidance. The results suggest that firms in BRICS do not engage in CSR activities to
manage the risk/minimise public scrutiny from their tax avoidance behaviour. Instead, they legitimate
themselves by having a culture of promising ethical conduct to external audiences and commit to serve
all stakeholders' interests. However, at the country level, the findings are consistent with the observation
that firms claiming to be socially responsible are less likely to avoid tax only in India and China.
Additionally, the results demonstrate that firms with high level of CSR using audit services from Big4
firms are more likely to pay less tax. On the contrary, although literature claims that multinational
corporations have more opportunity to find a way to reduce the tax burden, foreign listing status of firms
in BRICS countries do not affect the level of tax avoidance.
The findings have significant implications for policymakers who seek to identify the conditions under
which tax avoidance is less likely to be aggressive. This study finds that the association between tax
avoidance and CSR for developing markets is consistent with results from developed markets, showing
that strong CSR firms are less likely to engage in tax avoidance. Therefore, the result furthers
policymakers' understanding and allow them to formulate effective regulations that can improve firm's
tax compliance by stimulating firms to include responsible tax payments as part of a CSR code of conduct
policy. Moreover, these results support the calls by non-governmental organisations, such as ActionAid,
Oxfam, Christian Aid, and the Tax Justice Network, to frame corporate taxation as a CSR issue. The
requirement of including responsible tax payment as part of global CSR agenda may make firms to have
more concern about their behaviours regarding tax payment.

109
This thesis is subject to the following limitations. First, the sample is limited to publicly listed firms and
limited to only five countries as the representatives of emerging countries. Second, the measures of tax
avoidance (ETR) are based on financial statement data which cannot be guaranteed their accuracy. Third,
due to the unavailability of data, CSR measures are limited to only one score provider (i.e., ASSET4);
the findings may not be easily comparable to studies investigating the same or similar aspects that use
different measures. Therefore, future research on the relationship between tax avoidance and CSR in
emerging economies is encouraged to expand the sample size, use proxy which can ensure the practice
of tax avoidance in particular sample such as a sample of corporations accused by the taxation office that
they are tax avoiders, and investigate based on the same measure using data from the same database.
References
Ahmed, K., & Courtis, J. K. (1999). Association Between Corporate Characteristics and Disclosure
Levels in Annual Reports: a Meta-Analysis. British Accounting Review, 31, 35–61.
Alon, I., Lattemann, C., Fetscherin, M., Li, S., & Schneider, A.-M. (2010). Usage of public corporate
communications of social responsibility in Brazil, Russia, India and China (BRIC). International
Journal of Emerging Markets, 5(1), 6–22. https://doi.org/10.1108/17468801011018248
Amiram, D., Bauer, A. M., & Frank, M. M. (2013). Corporate Tax Avoidance and Managerial Incentives
Generated by Shareholder Dividend Tax Policy. CAAA Annual Conference and the European
Accounting Association.
Aras, G., & Crowther, D. (2009). Corporate Sustainability Reporting : A Study in Disingenuity ? Journal
of Business Ethics, 87(Supplement 1: Globalization and the Good Corporation (2009),), 279–288.
https://doi.org/10.1007/sl0551-008-9806-0
Armstrong, C. S., Blouin, J. L., & Larcker, D. F. (2012). The incentives for tax planning. Journal of
Accounting and Economics, 53(1–2), 391–411. https://doi.org/10.1016/j.jacceco.2011.04.001
Armstrong, C. S., Blouin, J. L., Jagolinzer, A. D., & Larcker, D. F. (2015). Corporate Governance ,
Incentives, and Tax Avoidance. Journal of Accounting and Economics, 60(1), 1–17.
https://doi.org/10.1016/j.jacceco.2015.02.003
Atwood, T. J., Drake, M. S., Myers, J. N., & Myers, L. a. (2012). Home country tax system characteristics
and corporate tax avoidance: International evidence. The Accounting Review, 87(6), 1831–1860.
https://doi.org/10.2308/accr-50222

110
Atwood, T. J., Drake, M. S., & Myers, L. A. (2010). Book-Tax Conformity, Earnings Persistence and
the Association between Earnings and Future Cash Flows. Journal of Accounting and Economics,
Forthcoming, 1–16.
Ashforth, B.E. and Gibbs, B.W. (1990), “The double-edge of organizational legitimation”, Organization
Science, 1(2), 177-94.
Avi-Yonah, R. (2014). Just Say No: Corporate Taxation and Corporate Social Responsibility. U of
Michigan Public Law Research Paper, 402, 14–010.
Avi-Yonah, R. S. (2006). Corporate Social Responsibility and Strategic Management. Journal of
Management Studies, 43, 1629–1641. https://doi.org/10.1111/j.1467-6486.2006.00655.x
Avi-Yonah, R. S. (2008). Corporate social responsibility and strategic tax behavior. In W. Scho¨n (Ed.),
Tax and corporate governance (pp. 183–198). Berlin: Springer.
Badertscher, B. A., Katz, S. P., & Rego, S. O. (2013). The separation of ownership and control and
corporate tax avoidance. Journal of Accounting and Economics, 56(2–3), 228–250.
https://doi.org/10.1016/j.jacceco.2013.08.005
Badertscher, B., Katz, S. P., & Rego, S. O. (2010). The Impact of Private Equity Ownership on Portfolio
Firms’ Corporate Tax Planning.
Banerjee, S. B. (2008). Corporate Social Responsibility : The Good, the Bad and the Ugly. Critical
Sociology, 34(1), 51–79. https://doi.org/10.1177/0896920507084623
Baird, K. M., Harrison, G. L., & Reeve, R. C. (2004). Adoption of activity management practices: A note
on the extent of adoption and the influence of organizational and cultural factors. Management
Accounting Research, 15(4), 383–399.
Baird, K. M., Harrison, G., & Reeve, R. (2007). The culture of Australian organizations and its relation
with strategy. International Journal of Business Studies, 15(1), 15–41.
Baughn, C. C., Bodie, N. L., & McIntosh, J. C. (2007). Corporate social and environmental responsibility
in Asian countries and other geographical regions. Corporate Social Responsibility and
Environmental Management, 14(4), 189–205. https://doi.org/10.1002/csr.160
Behn, B. K., Choi, J., & Kang, T. (2008). Audit Quality and Properties of Analyst Earnings Forecasts.
The Accounting Review, 83(2), 327–349. https://doi.org/10.2308/accr.2008.83.2.327

111
Belal, A. R., & Momin, M. (2009). Corporate Social Reporting (CSR) in emerging economies: A review
and future direction. Research in Accounting in Emerging Economies, 9, 119–143.
https://doi.org/10.1108/S1479-3563(2009)0000009007
Bhattacharya, A. C. B., Korschun, D., & Sen, S. (2009). Strengthening Stakeholder–Company
Relationships through Mutually Beneficial Corporate Social Responsibility Initiatives. Journal of
Business Ethics, 85(2), 257–272.
Bird, R., & Davis-Nozemack, K. (2018). Tax Avoidance as a Sustainability Problem. Journal of Business
Ethics, 151(4), 1009–1025. https://doi.org/10.1007/s10551-016-3162-2
Blaylock, B., Gaertner, F., & Shevlin, T. (2015). The association between book-tax conformity and
earnings management. Review of Accounting Studies, 20(1), 141–172.
https://doi.org/10.1007/s11142-014-9291-x
Bound, J., Jaeger, D. A., & Baker, R. M. (1995). Problems with Instrumental Variables Estimation When
the Correlation Between the Instruments and the Endogeneous Explanatory Variable is Weak.
Journal of the American Statistical Association, 90(430), 443–450.
Brammer, S., Jackson, G., & Matten, D. (2012). Corporate social responsibility and institutional theory:
New perspectives on private governance. Socio-Economic Review, 10(1), 3–28.
Brunsson, N. (1989). The organization of hypocrisy. Talk, decisions and actions in organizations.
Chichester: John Wiley & Sons.
Brunsson, N. (2003) ‘Organized Hypocrisy’, in B. Czarnaiwska and G. Sevón (eds) The Northern
Lights—Organization Theory in Scandinavia, pp. 201–22. Copenhagen: Copenhagen Business
School Press.
Carroll, A. B. (1979). Three-Dimensional Conceptual Model of Corporate Performance. The Academy
of Management Review, 4(4), 497–505.
Cassell, C. A., Giroux, G., Myers, L. A., & Omer, T. C. (2013). The Emergence of Second-Tier Auditors
in the US: Evidence from Investor Perceptions of Financial Reporting Credibility. Journal of
Business Finance and Accounting, 40(3–4), 350–372. https://doi.org/10.1111/jbfa.12016
Chapple, W., & Moon, J. (2005). Corporate Social Responsibility (CSR) in Asia: A Seven-Country Study
of CSR Web Site Reporting. Business and Society, 44(4), 415–441.
Chatty, R., & Saez, E. (2005). Dividend Taxes and Corporate Behavior: Evidence from the 2003
Dividend Tax Cut. Oxford Journal, 120(3), 791–833.

112
Chen, J. C., & Roberts, R. W. (2010). Toward a More Coherent Understanding of the Organization –
Society Relationship: A Theoretical Consideration for Social and Environmental Accounting
Research. Journal of Business Ethics, 97(4), 651–665. https://doi.org/10.1007/s10551-010-0531-0
Chen, S., Chen, X., Cheng, Q., & Shevlin, T. (2010). Are family firms more tax aggressive than non-
family firms? Journal of Financial Economics, 95(1), 41–61.
https://doi.org/10.1016/j.jfineco.2009.02.003
Cheng, B., Ioannou, I., & Serafeim, G. (2014). Corporate social responsibility and access to finance.
Strategic Management Journal, 35, 1–23. https://doi.org/10.1002/smj
Cho, C. H., Laine, M., Roberts, R. W., & Rodrigue, M. (2015). Organized hypocrisy, organizational
façades, and sustainability reporting. Accounting, Organizations and Society, 40, 78–94.
https://doi.org/10.1016/j.aos.2014.12.003
Cho, C. H., & Patten, D. M. (2007). The role of environmental disclosures as tools of legitimacy : A
research note. Accounting, Organization, and Society, 32, 639–647.
https://doi.org/10.1016/j.aos.2006.09.009
Christensen, J., & Murphy, R. (2004). The social irresponsibility of corporate tax avoidance: Taking CSR
to the bottom line. Development, 47(3), 37–44.
https://doi.org/10.1057/palgrave.development.1100066
Christensen, L. T., Morsing, M., & Thyssen, O. (2013). CSR as aspirational talk. Organization, 20(3),
372–393. https://doi.org/10.1177/1350508413478310
Clark, J. M. (1916). The Changing Basis of Economic Responsibility. Journal of Political Economy,
24(3), 209–229.
Cripe, B., & McAllister, B. (2009). Determinants of audit/tax separation decisions. American Journal
ofBusiness, 24, 47-56.
Dahlsrud, A. (2008). How Corporate Social Responsibility is Defined : an Analysis of 37 Definitions.
Corporate Social Responsibility and Environmental Management, 15(November 2006), 1–13.
Davis, A. K., Guenther, D. A., Krull, L. K., & Williams, B. M. (2016). Do socially responsible firms pay
more taxes? Accounting Review, 91(1), 47–68.
DeAngelo, L. E. (1981). Auditor size and audit quality. Journal of Accounting and Economics, 3(3),
183–199. https://doi.org/10.1016/0165-4101(81)90002-1

113
Deegan, C. and Rankin, M. (1996), “Do Australian companies objectively report environmental news?
An analysis of environmental disclosures by firms successfully prosecuted by the Environmental
Protection Authority”, Accounting, Auditing & Accountability Journal, 9(2), 50-67.
Desai, M. A., & Dharmapala, D. (2006). Corporate tax avoidance and high-powered incentives. Journal
of Financial Economics, 79(1), 145–179. https://doi.org/10.1016/j.jfineco.2005.02.002
Dhaliwal, D., Gal-Or, R., Naiker, V., & Sharma, D. (2013). Auditor-provided tax services and tax
avoidance. Working Paper, University of Arizona, Tucson, AZ.
DiMaggio, P.J. and W.W. Powell (1983), “The Iron Cage Revis- ited: Instructional Isomorphism and
Collective Rationality in Organizational Fields,” American Sociological Review, 48 (2), 17–60.
Dowling, G. R. (2014). The Curious Case of Corporate Tax Avoidance: Is it Socially Irresponsible?
Journal of Business Ethics, 124(1), 173–184. https://doi.org/10.1007/s10551-013-1862-4
Dowling, J., & Pfeffer, J. (1975). Organizational legitimacy: social values and organizational behavior.
The Pacific Sociological Review, 18(1), 122–136.
Dunbar, A., Higgins, D. M., Phillips, J. D., & Plesko, G. A. (2010). What Do Measures of Tax Aggressive
Measure? Proceedings of the National Tax Association Annual Conference on Taxation, 18–26.
Dyreng, S. D., Hanlon, M., & Maydew, E. L. (2008). Long-run corporate tax avoidance. Accounting
Review, 83(1), 61–82.
Eccles, R. G., Ioannou, I., & Serafeim, G. (2014). The Impact of Corporate Sustainability on
Organizational Processes and Performance. Management Science, 60(11), 2835–2845.
Fernando, M. (2010). Corporate social responsibility in the wake of the Asian tsunami : Effect of time
on the genuineness of CSR initiatives. European Management Journal, 28(1), 68–79.
https://doi.org/10.1016/j.emj.2009.08.002
Fisher, J. M. (2014). Fairer shores: Tax heavens, tax avoidance, and corporate social responsibility.
Fombrun, Charles and Mark Shanley (1990), “What’s in a Name? Reputation Building and Corporate
Strategy,” Academy of Management Journal, 33(2), 233–58.
Fombrun, C. J., Gardberg, N. A., & Barnett, M. L. (2000). Opportunity Platforms and Safety Nets:
Corporate Citizenship and Reputational. Business and Society, 105(1), 85–106.

114
Font, X., Walmsley, A., Cogotti, S., McCombes, L., & Häusler, N. (2012). Corporate social
responsibility : The disclosure-performance gap. Tourism Management, 33(6), 1544–1553.
https://doi.org/10.1016/j.tourman.2012.02.012
Francis, J. R., & Yu, M. D. (2009). Big 4 Office Size and Audit Quality. Accounting Review, 84(5),
1521–1552. https://doi.org/10.2308/accr.2009.84.5.1521
Freeman, R. E. (1984). Stakeholder management: Framework and philosophy. MA: Manfield
Friedman, M. (1970). The Social Responsibility of Business is to Increase its Profits. The New York
Times Magazine, 32, September 13. https://doi.org/10.1007/978-3-540-70818-6_14
Gaertner, F. B. (2014). CEO after-tax compensation incentives and corporate tax avoidance.
Contemporary Accounting Research, 31(4), 1077–1102. https://doi.org/10.1111/1911-3846.12058
Galbreath, J. (2010). Drivers of corporate social responsibility: The role of formal strategic planning and
firm culture. British Journal of Management, 21, 511–525.
Ganescu, C., & Gangone, A. (2017). A Model of Socially Responsible Organizational Culture. 27(2),
45–59. https://doi.org/10.1515/sues-2017-0008
Gangone, A.D. (2014). Responsabilitate sociala corporatista. Repere conceptuale. Abordari strategice.
Particularitaţi culturale. BucureSti: Universitara Publishing House.
Garriga, E., & Mele, D. (2004). Corporate social responsibility theories : Mapping the territory. Journal
of Business Ethics, 23, 51–71.
Gebhart, M. S. (2017). Measuring Corporate Tax Avoidance - An Analysis of Different Measures. Junior
Management Science, 3(2), 43–60. https://doi.org/10.5282/jums/v2i2pp43-60
Gleason, C. A., & Mills, L. F. (2011). Do Auditor-Provided Tax Services Improve the Estimate of Tax
Reserves? Contemporary Accounting Research, 28(5), 1484–1509. https://doi.org/10.1111/j.1911-
3846.2010.01057.x
Göbbels M. (2002). Reframing corporate social responsibility: the contemporary conception of a fuzzy
notion. In Concepts and Definitions of CSR and Corporate Sustainability: Between Agency and
Communion, Van Marrewijk M (ed.). Journal of Business Ethics, 44: 95–105.
Godfrey, P. C. (2005). The Relationship between Corporate Philanthropy and Shareholder Wealth: A
Risk Management Perspective. The Academy of Management Review, 30(4), 777–798.

115
Godfrey, P. C., Merrill, C. B., & Hansen, J. M. (2009). The Relationship Between Corporate Social
Responsibility and Sharholder Value: An Empirical Test of The Risk Management Hypothesis.
Strategic Management Journal, 30(4), 245–445. https://doi.org/10.1002/smj
Graham, J. R., & Tucker, A. L. (2006). Tax shelters and corporate debt policy. Journal of Financial
Economics, 81(3), 563–594. https://doi.org/10.1016/j.jfineco.2005.09.002
Gray, R., Kouhy, R., & Lavers, S. (1995). Corporate Social and Environment Reporting: a review of the
literature and a longitudinal study of UK disclosure. Accounting, Auditing & Accountability
Journal, 8(2), 47–77.
Guenther, D. A., Matsunaga, S. R., & Williams, B. M. (2013). Tax Avoidance, Tax Aggressivness, Tax
Risk and Firm Risk. August.
Gupta, S., & Newberry, K. (1997). Determinants of the Variability in Corporate Effective Tax Rates:
Evidence from Longitudinal Data. Journal of Accounting and Public Policy, 16(1), 1–34.
Gutsche, R., Schulz, J.-F., & Gratwohl, M. (2017). Firm‐value effects of CSR disclosure and CSR
performance. EFMA-Conference Proceedings, 1–31.
Hair, J.F., Black, W.C., Babin, B.J., Anderson, R.E., Tatham, R.L., 2006. Multivariate Data Analysis,
Sixth edition. Pearson Prentice-Hall, Upper Saddle River, NJ.
Hafsi, T., & Farashahi, M. (2005). Applicability of Management Theories to Developing Countries: A
Synthesis. Management International Review, 45(4), 483–511. https://doi.org/10.1007/s
Halbritter, G., & Dorfleitner, G. (2015). The wages of social responsibility - where are they? A critical
review of ESG investing. Review of Financial Economics, 26, 25–35.
https://doi.org/10.1016/j.rfe.2015.03.004
Hanlon, M., & Heitzman, S. (2010). A review of tax research. Journal of Accounting and Economics,
50(2–3), 127–178. https://doi.org/10.1016/j.jacceco.2010.09.002
Hanlon, M., & Slemrod, J. (2009). What does tax aggressiveness signal? Evidence from stock price
reactions to news about tax shelter involvement. Journal of Public Economics, 93(1–2), 126–141.
https://doi.org/10.1016/j.jpubeco.2008.09.004
Hasan, I., Hoi, C. K., Wu, Q., & Zhang, H. (2017). Does Social Capital Matter in Corporate Decisions?
Evidence from Corporate Tax Avoidance. Journal of Accounting Research, 55(3), 629–668.
https://doi.org/10.1111/1475-679X.12159
116
Hasseldine, J., & Morris, G. (2013). Corporate social responsibility and tax avoidance : A comment and
reflection. Accounting Forum, 37(1), 1–14. https://doi.org/10.1016/j.accfor.2012.05.001
Haugen, H. M. (2018). Midas’ Gift Means Death: Tax Dodging is the Giggest Obstacle for Global
Justice. Etikk i Praksis: Nordic Journal of Applied Ethics, 12(1), 43–60.
Henry, E., & Sansing, R. (2018). Corporate Tax Avoidance: Data Truncation Bias and Loss Firms. SSRN
Electronic Journal, May.
Hermalin, B. (2001). Economics and corporate culture. In Col, B., & Patel, S. (2016). Going to Haven?
Corporate Social Responsibility and Tax Avoidance. Journal of Business Ethics, 1–18.
http://doi.org/10.1007/s10551-016-3393-2
Hess, D. (2008). The three pillars of corporate social reporting as new governance regulation: disclosure,
dialogue, and development. Business Ethics Quarterly, 18(4), 447-482.
Hess, D. W. (2014). The framework for CSR assessment, measurement, and reporting. In Christian ethics
and corporate culture (pp. 177-192). Springer, Cham.
Hogan, B., & Noga, T. (2015). Auditor-provided tax services and long-term tax avoidance. Review of
Accounting and Finance, 14(3), 285–305.
Hoi, C. K., Wu, Q., & Zhang, H. (2013). Is corporate social responsibility (CSR) associated with tax
avoidance? Evidence from irresponsible CSR activities. The Accounting Review, 88(6), 2025–2059.
https://doi.org/10.2308/accr-50544
Holder-webb, A. L., Cohen, J. R., Nath, L., Wood, D., Holder-webb, L., Cohen, J. R., & Wood, D.
(2009). The Supply of Corporate Social Responsibility Disclosures Among U . S . Firms. Journal
of Business Ethics, 84(4), 497–527.
Hoon, C., Selmier, W. T., & Lien, D. (2011). International trade, foreign direct investment, and
transaction costs in languages. Journal of Socio-Economics, 40(6), 732–735.
https://doi.org/10.1016/j.socec.2011.08.003
Hung, M., & Subramanyam, K. (2007). Financial statement effects of adopting international accounting
standards: The case of Germany. Review of Accounting Studies, 12(4), 21−48.
Huseynov, F., & Klamm, B. K. (2012). Tax avoidance , tax management and corporate social
responsibility. Journal of Corporate Finance, 18(4), 804–827.
https://doi.org/10.1016/j.jcorpfin.2012.06.005

117
Im, C. C., Kim, J. H., & Ko, J. (2017). A study on Brazil corporate’ s CSRActivity and Propensity of
Tax Avoidance. International Information Institute (Tokyo), 20(5), 3143–3152.
Jaafar, A., & Thornton, J. (2015). Tax havens and effective tax rates: An analysis of private versus public
european firms. The International Journal of Accounting, 50(4), 435–457.
https://doi.org/10.1016/j.intacc.2015.10.005
Jaakson, K., Vadi, M., & Tamm, K. (2009). Organizational culture and CSR : an exploratory study of
Estonian service organizations. Social Responsibility Journal, 5(1), 6–18.
https://doi.org/10.1108/17471110910939962
Jackson, K. T. (2010). Global corporate governance: Soft law and reputational accountability. In Bird,
R., & Davis-Nozemack, K. (2018). Tax Avoidance as a Sustainability Problem. Journal of Business
Ethics, 151(4), 1009–1025. http://doi.org/10.1007/s10551-016-3162-2
Jahdi, K. S., & Acikdilli, G. (2009). Marketing Communications and Corporate Social Responsibility
(CSR): Marriage of Convenience or Shotgun Wedding? Journal of Business Ethics, 88(1,
Professional Ethics in Business and Social Life-The Eben 21st Annual Conference in Antalya), 103–
113. https://doi.org/10.1007/sl0551-009-0113-l
Jamali, D., & Karam, C. (n.d.). CSR in developed versus developing countries: a comparative glimpse.
In Handbook of Research on Corporate Social Responsibility: Vol. A. Örtenbl (pp. 1–14).
Janssen, B., Vandenbussche, H., & Crabbé, K. (2005). Corporate tax savings when hiring a Big 4 auditor:
Empirical evidence for Belgium. SSRN Electronic Journal, March, 1–19.
Jiaqi, Z. (2018). 2 new environmental laws to go into effect in 2018- China.org.cn. [online] China.org.cn.
Available at: http://www.china.org.cn/china/2018-01/01/content_50176729.htm [Accessed 25 Mar.
2019].
Karmel, R. S., & Kelly, C. (2009). The hardening of soft law in securities regulation. Brooklyn Journal
of International Law, 34, 883.
Karampinis, N. I., & Hevas, D. L. (2013). Effects of IFRS Adoption on Tax-induced Incentives for
Financial Earnings Management: Evidence from Greece. International Journal of Accounting,
48(2), 218–247. https://doi.org/10.1016/j.intacc.2013.04.003
Kelton, A. S., & Yang, Y. (2008). The impact of corporate governance on Internet financial reporting.
Journal of Accounting and Public Policy, 27, 62–87.
https://doi.org/10.1016/j.jaccpubpol.2007.11.001

118
Kiesewetter, D., & Manthey, J. (2017). Tax avoidance, value creation and CSR – a European perspective.
Corporate Governance: The International Journal of Business in Society, 17(5), 803–821.
https://doi.org/10.1108/CG-08-2016-0166
Kim, Y., Li, H., & Li, S. (2014). Corporate social responsibility and stock price crash risk q. Journal of
Banking and Finance, 43, 1–13. https://doi.org/10.1016/j.jbankfin.2014.02.013
Knuutinen, R. (2014). Corporate Social Responsibility, Taxation and Aggressive Tax Planning. Nordic
Tax Journal, 1, 36–75. https://doi.org/10.1515/ntaxj-2014-0003
Kolk, A. (2003). Trends in sustainability reporting by the Fortune Global 250. Business Strategy and the
Environment, 12(5), 278–291.
Kreps, D. M. (1996). Corporate culture and economic theory. In Col, B., & Patel, S. (2016). Going to
Haven? Corporate Social Responsibility and Tax Avoidance. Journal of Business Ethics, 1–18.
http://doi.org/10.1007/s10551-016-3393-2
Kubata, A., Lietz, G., & Watrin, C. (2013). Does Corporate Tax Avoidance Impair Earnings
Informativeness? https://doi.org/10.2139/ssrn.2363873
Laguir, I., Staglianò, R., & Elbaz, J. (2015). Does corporate social responsibility affect corporate tax
aggressiveness? Journal of Cleaner Production, 107, 662–675.
https://doi.org/10.1016/j.jclepro.2015.05.059
Lai, K. W. (2013). Audit Reporting of Big 4 Versus Non-Big 4 Auditors: The Case of Ex-Andersen
Clients. International Journal of Accounting, 48(4), 495–524.
https://doi.org/10.1016/j.intacc.2013.10.001
Lanis, R., & Richardson, G. (2012). Corporate social responsibility and tax aggressiveness: An empirical
analysis. Journal of Accounting and Public Policy, 31(1), 86–108.
https://doi.org/10.1016/j.jaccpubpol.2011.10.006
Lanis, R., & Richardson, G. (2013). Corporate social responsibility and tax aggressiveness: a test of
legitimacy theory. Accounting, Auditing & Accountability Journal, 26(1), 75–100.
https://doi.org/10.1108/09513571311285621
Lanis, R., & Richardson, G. (2015). Is corporate social responsibility performance associated with tax
avoidance? Journal of Business Ethics, 127(2), 439–457. https://doi.org/10.1007/s10551-014-2052-
8
Larcker, D., & Rusticus, T. (2010). On the use of instrumental variables in accounting research. Journal
of Accounting and Economics, 49, 186–205.

119
Lietz, G. M. (2013). Determinants and Consequences of Corporate Tax Avoidance. In Ssrn.
https://doi.org/10.2139/ssrn.2363868
Lin-Hi, N., & Blumberg, I. (2018). The Link Between (Not) Practicing CSR and Corporate Reputation :
Psychological Foundations and Managerial Implications. Journal of Business Ethics, 150(1), 185–
198. https://doi.org/10.1007/s10551-016-3164-0
Lisowsky, P. (2010). Seeking Shelter: Empirically modeling tax shelters using financial statement
information. The Accounting Review, 85(5), 1693–1720.
https://doi.org/10.2308/accr.2010.85.5.1693
Luo, X., & Bhattacharya, C. B. (2006). Corporate social responsibility, customer satisfaction, and market
value. Journal of Marketing, 70(4), 1–18.
Magness, V. (2006). Strategic posture, financial performance and environmental disclosure: An
empirical test of legitimacy theory. Accounting, Auditing & Accountability Journal, 19(4), 540–
563.
Marens, R. (2004). Wobbling on a one-legged stool: the decline of american pluralism and the academic
treatment of corporate social responsibility. Journal of Academic Ethics, 2(1), 63–87.
Markle, K. S., & Shackelford, D. A. (2012). Cross-country comparisons of corporate income taxes.
National Tax Journal, 65, 493–528.
Matten, D., & Moon, J. (2008). “Implicit” and “Explicit” CSR: A Conceptual Framework for a
Comparative Understanding of Corporate Social Responsibility. Academy of Management Review,
33(2), 404–424. https://doi.org/10.5465/AMR.2008.<strong data-auto="strong_text"
xmlns:translation="urn:EBSCO-Translation">31193458</strong>
McGuire, S. T., Omer, T. C., & Wang, D. (2012). Tax Avoidance: Does Tax-Specific Industry Expertise
Make a Difference? The Accounting Review, 87(3), 975–1003. https://doi.org/10.2308/accr-10215
McNair, D. (2010). A new social contract? Organisation for Economic Cooperation and Development,
the OECD Observer, (276), 32-33. Retrieved from https://search-proquest-
com.ezproxy.bangor.ac.uk/docview/217481509?accountid=14874
McWilliams, A., & Siegel, D. (2001). Note Corporate Social Responsibility : a Theory of the Firm
Perspective. Academy of Management Journal, 26(1), 117–127.
Mcwilliams, A., Siegel, D. S., & Wright, P. M. (2006). Guest Editors ’ Introduction Corporate Social
Responsibility : Strategic Implications *. January.

120
Minnick, K., & Noga, T. (2010). Do Corporate Governance Characteristics in Fluence Tax Management?
Journal of Corporate Finance, 16, 703–718. https://doi.org/10.1016/j.jcorpfin.2010.08.005
Minor, D., & Morgan, J. (2011). CSR as Reputation Insurance: Primum Non Nocere. California
Management Review, 53(3), 40–59. https://doi.org/10.1525/cmr.2011.53.3.40
Naughton, J. P., Wang, C., & Yeung, I. (2014). Are CSR expenditures affected by investor sentiment ?
Needle, D. (2004). Business in context: An introduction to business and its environment. London:
Cengage Learning Business Press.
Newell, P. (2008). Debate CSR and the Limits of Capital. Developmen and Change, 39(6), 1063–1078.
Noronha, C., Tou, S., Cynthia, M. I., & Guan, J. J. (2013). Corporate Social Responsibility Reporting in
China: An Overview and Comparison with Major Trends. Corporate Social Responsibility and
Environmental Management, 20(February 2012), 29–42. https://doi.org/10.1002/csr.1276
Nov, A. (2006). The Bidding War to Attract Foreign Direct Investment: The Need for a Global Solution.
Virginia Tax Review, 25(835), 836–874.
Omer, T. C., Bedard, J. C., & Falsetta, D. (2006). Auditor-provided tax services: The effects of a
changing regulatory environment. Accounting Review, 81(5), 1095–1117.
https://doi.org/10.2308/accr.2006.81.5.1095
Palazzo, G., & Scherer, A. G. (2006). Corporate Legitimacy as Deliberation: A Communicative
Framework. Journal of Business Ethics, 66(1), 71–88. https://doi.org/10.1007/s10551-006-9044-2
Park, S. K., & Berger-walliser, G. (2015). A Firm-Driven Approach to Global Governance and
Sustainability. American Business Law Journal, 52(2), 255–315.
Payne, D. M., & Raiborn, C. A. (2018). Aggressive Tax Avoidance: A Conundrum for Stakeholders,
Governments, and Morality. Journal of Business Ethics, 147(3), 469–487.
https://doi.org/10.1007/s10551-015-2978-5
Phillips, J. D. (2003). Corporate tax-planning Effectiveness: The role of compensation-based incentives.
The Accounting Review, 78(3), 847–874.
Pohl, M. (2006). Corporate culture and CSR–how they interrelate and consequences for successful
implementation. The ICCA Handbook on Corporate Social Responsibility. Chichester: Wiley, 47-
60.
121
Preuss, L. (2010). Tax avoidance and corporate social responsibility: you can’t do both, or can you?
Corporate Governance, 10(4), 365–374. https://doi.org/10.1108/14720701011069605
Preuss, L. (2012). Responsibility in Paradise? The Adoption of CSR Tools by Companies Domiciled in
Tax Havens. Journal of Business Ethics, 110, 1–14. https://doi.org/10.1007/s10551-012-1456-6
Qiu, Y. (2013). Does Corporate Environmental and Social Responsibility Matter for Firm Performance
in the UK ? 1–199.
Ramasamy, B., & Yeung, M. (2009). Chinese consumers’ perception of corporate social responsibility
(CSR). Journal of Business Ethics, 88(SUPPL. 1), 119–132. https://doi.org/10.1007/s10551-008-
9825-x
Ravasi, D., Schultz, M. (2006). "Responding to organizational identity threats: Exploring the role of
organizational culture". Academy of Management Journal, 49(3), 433–458.
Reed, W. R. (2015). On the Practice of Lagging Variables To Avoid Simultaneity. Oxford Bulletin of
Economics and Statistics, 77(6), 897–905.
Rego, S. O. (2003). Tax-avoidance activities of U.S. multinational corporations. Contemporary
Accounting Research, 20(4), 805–833. https://doi.org/10.1506/VANN-B7UB-GMFA-9E6W
Roberts, M. R. & Whited, T. M. (2012). Endogeneity in empirical corporate finance. In: Constantinides,
M., Harris, M. & Stulz, R. (Eds), Handbook of the Economics of finance, vol. 2, Amsterdam,
Elsevier, 493-572.
Robinson, J. R., Sikes, S. a., & Weaver, C. D. (2010). Performance measurement of corporate tax
departments. The Accounting Review, 85(3), 1035–1064.
https://doi.org/10.2308/accr.2010.85.3.1035
Rodgers, W., Geological, F., & Choy, H. L. (2013). Do Investors Value a Firm ’ s Commitment to Social
Activities ? Do Investors Value a Firm ’ s Commitment to Social Activities ? Journal of Business
Ethics, 114, 607–623. https://doi.org/10.1007/s10551-013-1707-1
Salihu, I. A., Annuar, H. A., & Sheikh Obid, S. N. (2015). Foreign investors’ interests and corporate tax
avoidance: Evidence from an emerging economy. Journal of Contemporary Accounting &
Economics, 11(2), 138–147. https://doi.org/10.1016/j.jcae.2015.03.001
Salihu, I. A., Obid, S. N. S., and Annuar, H. A. (2013). Measures of corporate tax avoidance: Empirical
evidence from an emerging economy. International Journal of Business and Society, 14(3):412–
427.

122
Scheffer, D. (2013). The Ethical Imperative of Curbing Corporate Tax Avoidance. Ethics & International
Affairs, 27(4), 361–369. https://doi.org/10.1017/S0892679413000324
Scott WR. (2008). Institutions and organizations. 3rd edn. Sage Publications: Los Angeles, CA.
Seetharaman, A., Sun, Y., & Wang, W. (2011). Tax-related financial statement restatements and auditor-
provided tax services. Journal of Accounting, Auditing and Finance, 26(4), 677–698.
https://doi.org/10.1177/0148558X11409146
Shaomin Li, Marc Fetscherin, Ilan Alon, C. L. and K. Y. (2010). Corporate Social responsibility in
emerging Markets: The importance of the governance environment. Management International
Review, 50(5), 635–654.
Sharma, E. (2019). A review of corporate social responsibility in developed and developing nations.
Corporate Social Responsibility and Environmental Management, 26(4), 712–720.
https://doi.org/10.1002/csr.1739
Sheppard, B. (2014). Norm supercompliance and the status of soft law. Buffalo Law Review, 62(4), 797–
879.
Sikka, Prem, 2009. "Financial crisis and the silence of the auditors," Accounting, Organizations and
Society, Elsevier, 34(6-7), pages 868-873, August.
Sikka, P. (2010). Smoke and mirrors : Corporate social responsibility and tax avoidance. Accounting
Forum, 34, 153–168. https://doi.org/10.1016/j.accfor.2010.05.002
Slemrod, J., & Yitzhaki, S. (2002). Tax Avoidance, Evasion, and Administration. In Handbook of Public
Economics (Issue January, pp. 1423–1470). https://doi.org/10.1016/S1573-4420(02)80026-X
Stanaland, A. J., Lwin, M. O., & Murphy, P. E. (2011). Consumer perceptions of the antecedents and
consequences of corporate social responsibility. Journal of Business Ethics, 102(1), 47–55.
Steijvers, T., & Niskanen, M. (2014). Tax aggressiveness in private family firms: An agency perspective.
Journal of Family Business Strategy, 5(4), 347–357. https://doi.org/10.1016/j.jfbs.2014.06.001
Stiglitz, J. E. (1986). The General Theory of Tax Avoidance. NBER Working Paper Series, 1868.
Suchman, M. C. (1995). Managing Legitimacy: Strategic and Institutional Approaches. Academy of
Management Review, 20(3), 571–610. https://doi.org/10.5465/AMR.1995.9508080331

123
Subramaniam, N., & Ashkanasy, N. M. (2001). The effect of organizational culture perceptions on the
relationship between budgetary participation and managerial job-related outcomes. Australian
Journal of Management, 26(1), 35–54.
Tang, T. (2015). Does Book-Tax Conformity Deter Opportunistic Book and Tax Reporting? An
International Analysis. European Accounting Review, 24(3), 441–469.
Trevino, L. and Nelson, K. (2007). Managing Business Ethics: Straight Talk About How to Do It Right,
4th edn. New York: Wiley.
Ubius, U. and Alas, R., 2009. Organizational Culture Types as Predictors of Corporate Social
Responsibility. Engineering Economics, 1(61), 90-99.
Unerman, J. (2008). Strategic reputation risk management and corporate social responsibility reporting
J. Accounting, Auditing & Accountability Journal, 8(2), 47–77.
Upadhaya, B., Munir, R., Blount, Y., & Su, S. (2018). Does organizational culture mediate the CSR –
strategy relationship ? Evidence from a developing country , Nepal. Journal of Business Research,
91(June), 108–122. https://doi.org/10.1016/j.jbusres.2018.05.042
Vogel, D. (2005). The market for virtue: The potential and limits of corporate social responsibility. In
Bird, R., & Davis-Nozemack, K. (2018). Tax Avoidance as a Sustainability Problem. Journal of
Business Ethics, 151(4), 1009–1025. http://doi.org/10.1007/s10551-016-3162-2
Wagner, T., Lutz, R. J., & Weitz, B. A. (2009). Corporate Hypocrisy: Overcoming the Threat of
Inconsistent Corporate Social Responsibility Perceptions. Journal of Marketing, 73(6), 77–91.
Wang, M., & Kong, D. (2011). Corporate Social Responsibility , Investor Behaviors , and Stock Market
Returns : Evidence from a Natural Experiment in China. 127–141. https://doi.org/10.1007/s10551-
010-0713-9
Watts, R., Zimmerman, J., 1986. In: Positive Accounting Theory. Prentice-Hall Inc.
West, A. (2018). Multinational Tax Avoidance: Virtue Ethics and the Role of Accountants. Journal of
Business Ethics, 153(4), 1143–1156. https://doi.org/10.1007/s10551-016-3428-8
Whitaker, C. (2005). Bridging the book-tax accounting gap. Yale Law Journal, 115(3), 680–726.
Wilson, R. J. (2009). An examination of corporate tax shelter participants. Accounting Review, 84(3),
969–999. https://doi.org/10.2308/accr.2009.84.3.969
Williams, D. F. (2007). Developing the concept of tax governance. London: KPMG.

124
Williams, R. (2011). The numbers: How does federal government spend its money? Tax Policy Center.
http://www.taxpolicycen ter.org/briefing-book/background/numbers/expenses.cfm.
Wrightsman, D. (1978). Tax Shield Valuation and the Capital Structure Decision. The Journal of
Finance, 33(2), 650–656.
Xiao, J. Z., Yang, H., & Chow, C. W. (2004). The determinants and characteristics of voluntary Internet-
based disclosures by listed Chinese companies. Journal of Accounting and Public Policy, 23, 191–
225. https://doi.org/10.1016/j.jaccpubpol.2004.04.002
Yu, Y., & Choi, Y. (2016). Stakeholder pressure and CSR adoption : The mediating role of organizational
culture for Chinese companies. The Social Science Journal, 53(2), 226–235.
https://doi.org/10.1016/j.soscij.2014.07.006
Ziegler, A., Busch, T., & Hoffmann, V. H. (2011). Disclosed corporate responses to climate change and
stock performance: An international empirical analysis. Energy Economics, 33(6), 1283–1294.
https://doi.org/10.1016/j.eneco.2011.03.007

125
Appendices
Appendix 3.1: Prior literature on the relationship between tax avoidance and CSR
Author Objective(s) Theories Sample/
Country
Key Measures
Tax Avoidance CSR Method Empirical Results
Proxy Source Proxy Source
Shafer &
Simmon
(2008)
Investigate the
effects of
attitudes toward
corporate ethics
and social
responsibility,
and
Machiavellianism
on tax
professionals’
willingness to
participate in
aggressive tax
avoidance.
--- Professional
institute(s) /
Hong Kong
--- --- --- --- Survey High Machiavellians
are more likely to
endorse the traditional
“stockholder view” of
corporate responsibility
and less likely to
support the “stakeholder
view”.
The stockholder view of
corporate responsibility
mediates the
relationship between
Machiavellianism and
ethical/social
responsibility
judgements.
Machiavellianism had
significant direct effects
on ethical and social
responsibility
judgements.
Preuss
(2010)
Examine whether
companies that
engage in tax
avoidance by
locating their
headquarters in
Legitimacy
theory
Forbes
Global
2000 Index
MNEs
headquartered
in two OFCs
(Bermuda
--- Codes of
Conduct
Company
website
Content
analysis
(counting
the
OFC-based companies
have codes of conduct
which comparable with
codes adopted by US
firms, in terms of
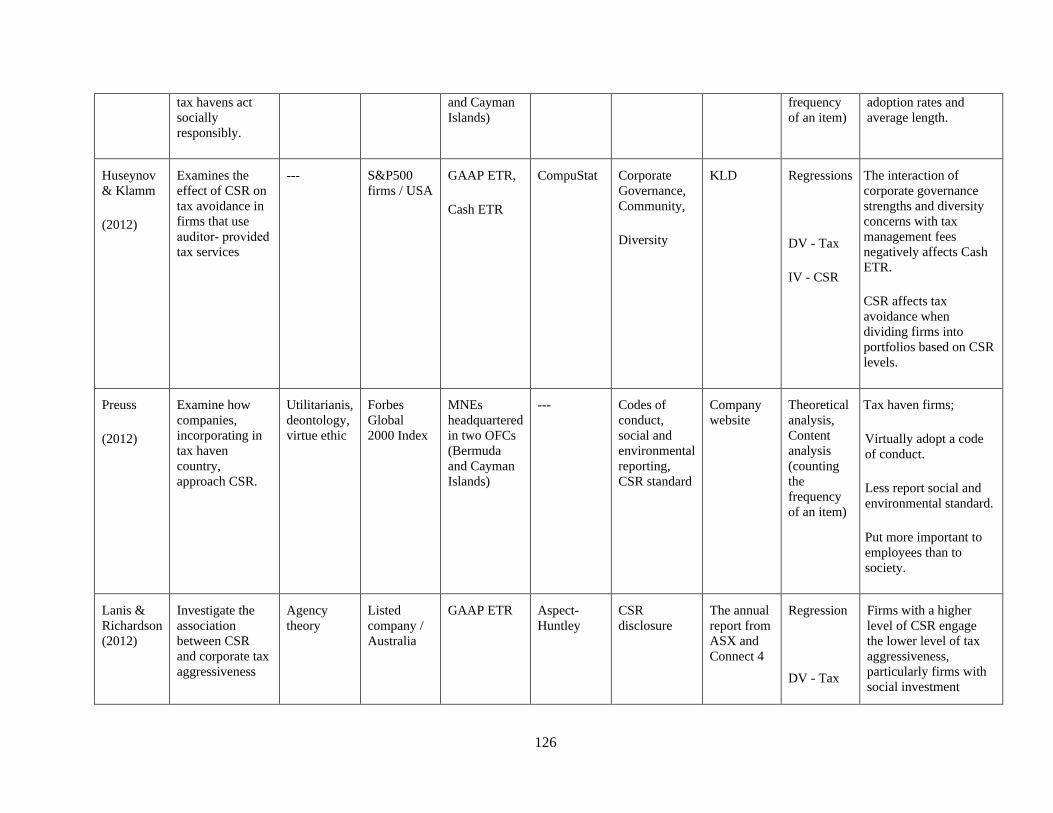
126
tax havens act
socially
responsibly.
and Cayman
Islands)
frequency
of an item)
adoption rates and
average length.
Huseynov
& Klamm
(2012)
Examines the
effect of CSR on
tax avoidance in
firms that use
auditor‐ provided
tax services
--- S&P500
firms / USA
GAAP ETR,
Cash ETR
CompuStat Corporate
Governance,
Community,
Diversity
KLD Regressions
DV - Tax
IV - CSR
The interaction of
corporate governance
strengths and diversity
concerns with tax
management fees
negatively affects Cash
ETR.
CSR affects tax
avoidance when
dividing firms into
portfolios based on CSR
levels.
Preuss
(2012)
Examine how
companies,
incorporating in
tax haven
country,
approach CSR.
Utilitarianis,
deontology,
virtue ethic
Forbes
Global
2000 Index
MNEs
headquartered
in two OFCs
(Bermuda
and Cayman
Islands)
--- Codes of
conduct,
social and
environmental
reporting,
CSR standard
Company
website
Theoretical
analysis,
Content
analysis
(counting
the
frequency
of an item)
Tax haven firms;
Virtually adopt a code
of conduct.
Less report social and
environmental standard.
Put more important to
employees than to
society.
Lanis &
Richardson
(2012)
Investigate the
association
between CSR
and corporate tax
aggressiveness
Agency
theory
Listed
company /
Australia
GAAP ETR Aspect-
Huntley
CSR
disclosure
The annual
report from
ASX and
Connect 4
Regression
DV - Tax
Firms with a higher
level of CSR engage
the lower level of tax
aggressiveness,
particularly firms with
social investment

127
IV - CSR commitment and ethic
and business conduct.
Lanis &
Richardson
(2013)
Empirically test
legitimacy theory
by comparing the
corporate social
responsibility
(CSR)
disclosures of tax
aggressive
corporations with
those of non-tax
aggressive
corporations in
Australia.
Legitimacy
theory
20 firms
accused by
the
Australian
Taxation
Office of
engaging in
tax
aggressive
activities
during the
2001-2006
period /
Australia
--- --- CSR
disclosure
Annual
report
Content
analysis
DV - CSR
IV - Tax
A positive relationship
between corporate tax
aggressiveness and
CSR disclosure,
confirming legitimacy
theory.
Hoi et al.
(2013)
Examine the
empirical
association
between
CSR and tax
avoidance.
--- US large
firms
Cash ETR,
tax sheltering
probability
measure, the
permanent
BTD, the
discretionary
BTD
Compustat Negative
social rating
KLD Regression
DV - Tax
IV - CSR
Firms with excessive
irresponsible CSR
activities have a higher
likelihood of engaging
in tax-sheltering
activities and greater
discretionary/permanent
book-tax differences.
Hardeck &
Hertl
(2014)
Investigate the
effects of media
reports on tax
aggressiveness
and a customer-
oriented
company
Carroll’s
pyramid of
CSR
Germany Media report
on corporate
tax strategies
Constructed Corporate
reputation,
purchase
intention,
willingness to
pay
Constructed Laboratory
experiment
Aggressive tax
strategies have a
negative impact on firm
reputation and purchase
intention, lower
willingness to pay.
Customers with high
tax morale and negative
attitude on tax

128
avoidance enhance the
above relationship.
Laguir et
al.
(2015)
How the different
activities of CSR
affect corporate
tax
aggressiveness.
Agency
theory/
Stakeholder
theory/
Legitimacy
theory
French
Firms
during
2003-2011
ETR DIANE
financial
database
CSR
dimension
score rating
(Social, CG,
Economic,
Environment)
Vigeo
database
PLS-SEM Higher activity in the
social dimension, lower
the level of tax
aggressiveness.
Higher activity in the
economic dimension,
higher the level of tax
aggressiveness.
Insignificant result for
the relation between tax
aggressiveness and CG
as well as the
environment.
Lanis &
Richardson
(2015)
Examine whether
CSR
performance is
associated with
corporate tax
avoidance.
--- US firms
during
2003-2009
Tax Dispute
(Dummy
coded as 1 if
a firm
involve a
major tax
dispute)
KLD
database
CSR
performance
KLD
database
Logit
Regression
More CSR
performance, less tax
avoidance

129
Appendix 3.2: Measurement used in literature to capture tax avoidance and CSR
Author Dependent Variables Independent Variables Controls
Proxy Measure(s) Source Proxy Measure(s) Source Proxy Measure(s)
Lanis &
Richardson
(2015)
Tax Dispute Dummy coded
as 1 if a firm
involves a
major tax
dispute
KLD
database
CSR performance Sum up every
strength and
concern for all
categories
(Community
Relation, CG,
Diversity,
Employee
Relation,
Environment,
Human Rights,
Products)
KLD database BOD independence
Management stock
ownership of BOD
Age public
CEO tenure
CEO duality
Big-four auditor
Size
Leverage
Capital intensity
R&D intensity
Inventory intensity
Market-to-book ratio
ROA
Year
The proportion of board
members who are an
independent director
The total proportion of
corporate stock owned by
insiders
No. of years that stock has
been traded in public
No. of years that CEO has
served as a director on board
Dummy coded as 1 if
chairperson also holds the
managerial position of CEO
or managing director
Dummy coded as 1 if a firm
uses a big-four auditor
Natural logarithm of total
assets
Long-term debt/total assets
Net PPE/total assets
R&D expenditure/net sales
Inventory/total assets
The market value of
equity/BV of equity
Pre-tax income/total assets
Dummy coded as 1 if the
year falls within the
specific year category

130
Author Dependent Variables Independent Variables Controls
Proxy Measure(s) Source Proxy Measure(s) Source Proxy Measure(s)
Lauir et al.
(2015)
ETR1
ETR2
Income tax expense
currently
payable/book
income
Income tax expense
currently payable/
operating cash flow
DIANE
financial
database
Social
Dimension
Governance
Dimension
Economic
Dimension
Environment
Dimension
Human
resource/Human
rights/Community
involvement
CG score
Business behavior
rating
Environment
rating
Vigeo database Size
Financial
performance
Industry sector
Leverage
Capital intensity
Intangibles
The natural logarithm of
total assets
-ROA (Pre-tax
income/total assets)
-ROE (Pre-tax
income/shareholder's
equity)
Dummy constructs
Long-term debt/total
assets
Net PPE/total assets
Intangible
expenditure/total assets
Lanis &
Richardson
(2013)
The level of
CSR
disclosure
The NO. of
sentences for each
CSR disclosure
theme
(Environment,
Energy,
Product/Consumer,
Community,
Employee/HR,
General/Other)
A firm’s
annual report
Tax
aggressiveness
Dummy coded as
1 if a firm had
been excused of
tax aggressiveness
by the ATO
ASX and ATO
website
Size
Leverage
Capital intensity
Market-to-book
ratio
ROA
The natural logarithm of
total assets
Long-term debt/total
assets
Net PPE/total assets
The market value of
equity/BV of equity
Pre-tax income/total
assets

131
Author Dependent Variables Independent Variables Controls
Proxy Measure(s) Source Proxy Measure(s) Source Proxy Measure(s)
Hoi et al.
(2013)
Book-tax
difference
Cash ETR
- Desai &
Dhamapala
(2006)
discretionary
BTD
- Frank et al.
(2009)
permanent
BTD
Cash tax
paid/Pre-tax
income
Negative social
ratings
Dummy coded as
1 if the firm has 4
or more
irresponsible CSR
activities
KLD database Positive CSR
Earning Quality
CG
Profitability
Liquidity
Leverage
Foreign Operation
Firm Size
Firm Growth
Opportunity
Other Firm
Attributes*
*scaled by lagged
assets
Sum of all engagement of
CSR
Abs. value of
discretionary accrual
using the modified Jones
model
The fraction of
institutional investors
- Operating income scaled
by lagged assets
- Dummy coded as 1 if
loss carry forward is
positive
- Loss carry forward
scaled by lagged assets
Cash holding scaled by
lagged assets
Long-term debt scaled by
lagged assets
Foreign income scaled by
lagged assets
- The natural log of the
MV of equity
- The natural log of the
No. of employees
- Change in sales scaled
by lagged assets
- Market-to-book ratio
scaled by BV of equity
- R&D expense
- PPE
- Equity income in
earning

132
Author Dependent Variables Independent Variables Controls
Proxy Measure(s) Source Proxy Measure(s) Source Proxy Measure(s)
Lanis &
Richardson
(2012)
ETR1
ETR2
Income tax
expense / book
income
Income tax
expense /
operating cash
flow
Aspect-
Huntley
financial
database
CSR Disclosure
Develop a broad-
based CSR
disclosure index
A corporations’
annual report
BOD independence
Trouble
Management stock
ownership of BOD
Age public
CEO tenure
CEO duality
Block held
Size
Leverage
Capital intensity
R&D intensity
Inventory intensity
Market-to-book ratio
ROA
Industry sector
The proportion of board
members who are an
independent director
Dummy coded as 1 if a firm
report a 3-year net loss
Cumulative proportion of
corporate stock owned by
insiders
No. of years that stock has
been traded on ASX
No. of years that CEO has
served as a director on board
Dummy coded as 1 if
chairperson also holds the
managerial position of CEO
or managing director
The total proportion of
blockholder who hold at least
5% of the outstanding share
Natural logarithm of total
assets
Long-term debt/total assets
Net PPE/total assets
R&D expenditure/net sales
Inventory/total assets
The market value of
equity/BV of equity
Pre-tax income/total assets
Dummy as two-digit GICS
code for nine sectors

133
Author Dependent Variables Independent Variables Controls
Proxy Measure(s) Source Proxy Measure(s) Source Proxy Measure(s)
Huseynov &
Klamm
(2012)
GAAP ETR
Cash ETR
Tax
expense/Pre-
tax income
Cash tax
paid/(Pre-tax
income –
special item)
*Compute 3-
year average
value
Compustat
database
Tax Fee Rate
CSR score
(Annual rating of
community,
diversity, and
governance
performance)
The 3-year
average of Tax
free/Pre-tax
income
Sum the score of
strength (+1) and
concern (-1)
KLD STATS
database
Audit Analytics
database
Size
Performance
Market-to-book
ratio
Dividend Payout
Leverage
Institutional
ownership
Capital intensive
Foreign sales
Advertising
The logarithm of total
assets
ROA
The market value of
equity/BV of equity
Dummy coded as 1 if a
firm pays a dividend
Total debt/BV of total
equity
The percentage of shares
held by institutions
Capital expenditure/total
assets
Foreign sales/total assets
Advertising expense/total
assets
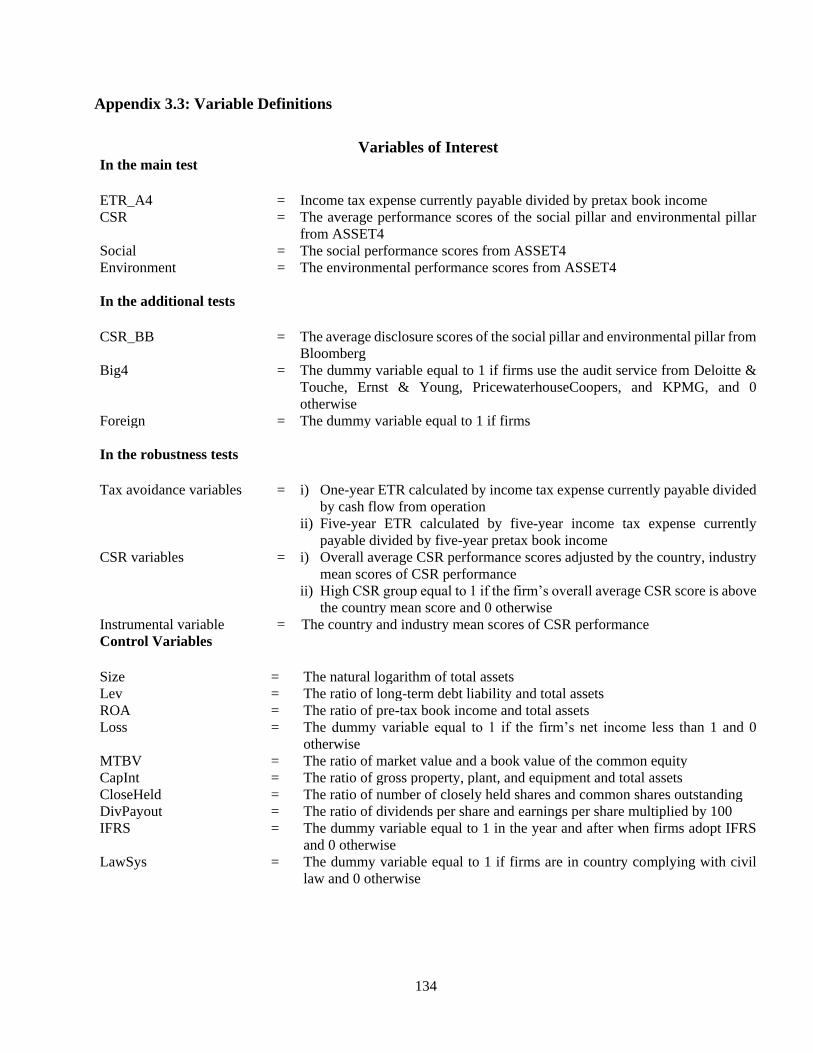
134
Appendix 3.3: Variable Definitions
Variables of Interest In the main test
ETR_A4 = Income tax expense currently payable divided by pretax book income
CSR = The average performance scores of the social pillar and environmental pillar
from ASSET4
Social = The social performance scores from ASSET4
Environment = The environmental performance scores from ASSET4
In the additional tests
CSR_BB = The average disclosure scores of the social pillar and environmental pillar from
Bloomberg
Big4 = The dummy variable equal to 1 if firms use the audit service from Deloitte &
Touche, Ernst & Young, PricewaterhouseCoopers, and KPMG, and 0
otherwise
Foreign = The dummy variable equal to 1 if firms
In the robustness tests
Tax avoidance variables = i) One-year ETR calculated by income tax expense currently payable divided
by cash flow from operation
ii) Five-year ETR calculated by five-year income tax expense currently
payable divided by five-year pretax book income
CSR variables = i) Overall average CSR performance scores adjusted by the country, industry
mean scores of CSR performance
ii) High CSR group equal to 1 if the firm’s overall average CSR score is above
the country mean score and 0 otherwise
Instrumental variable = The country and industry mean scores of CSR performance
Control Variables
Size = The natural logarithm of total assets
Lev = The ratio of long-term debt liability and total assets
ROA = The ratio of pre-tax book income and total assets
Loss = The dummy variable equal to 1 if the firm’s net income less than 1 and 0
otherwise
MTBV = The ratio of market value and a book value of the common equity
CapInt = The ratio of gross property, plant, and equipment and total assets
CloseHeld = The ratio of number of closely held shares and common shares outstanding
DivPayout = The ratio of dividends per share and earnings per share multiplied by 100
IFRS = The dummy variable equal to 1 in the year and after when firms adopt IFRS
and 0 otherwise
LawSys = The dummy variable equal to 1 if firms are in country complying with civil
law and 0 otherwise

135
Appendix 3.4: The mean value of variables for overall and for each country
The mean value of ETR and STR
Year
Overall Brazil Russia India China S. Africa
STR
(%)
ETR
(%)
STR
(%)
ETR
(%)
STR
(%)
ETR
(%)
STR
(%)
ETR
(%)
STR
(%)
ETR
(%)
STR
(%)
ETR
(%)
2008 29.50 24.60 34.00 31.01 24.00 25.11 34.00 19.41 25.00 17.95 34.55 30.85
2009 28.29 24.38 34.00 27.34 20.00 23.64 34.00 21.18 25.00 20.44 34.55 37.49
2010 29.61 24.62 34.00 25.65 20.00 24.33 34.00 23.08 25.00 21.48 34.55 31.92
2011 29.50 25.03 34.00 25.10 20.00 23.91 32.40 22.67 25.00 23.58 34.55 30.18
2012 30.41 26.56 34.00 27.79 20.00 24.68 32.50 25.57 25.00 22.31 34.55 30.50
2013 28.95 26.76 34.00 24.96 20.00 26.07 34.00 26.02 25.00 24.39 28.00 31.65
2014 29.05 26.81 34.00 23.30 20.00 27.35 34.00 24.78 25.00 26.74 28.00 30.94
2015 28.80 27.33 34.00 24.94 20.00 23.70 34.60 27.37 25.00 25.46 28.00 32.20
The mean value of CSR scores: the average of social scores and environmental scores
Year Overall Brazil Russia India China S. Africa
SOC ENV SOC ENV SOC ENV SOC ENV SOC ENV SOC ENV
2008 56.69 51.42 80.76 64.21 36.98 40.35 70.55 62.13 39.48 41.22 67.38 56.06
2009 55.10 47.21 76.20 54.36 48.80 40.30 73.36 66.62 34.94 34.25 65.92 58.17
2010 60.02 52.43 74.70 59.59 61.78 53.86 70.28 63.06 36.06 36.74 79.54 64.38
2011 59.16 51.69 72.77 60.09 60.20 51.72 65.35 60.83 35.43 35.71 80.53 62.32
2012 60.89 51.53 73.44 61.01 59.33 52.59 65.66 63.83 34.53 34.18 73.69 53.51
2013 59.82 54.41 68.19 59.74 55.65 53.74 68.31 67.27 32.63 39.94 77.10 56.17
2014 58.81 53.59 66.74 59.33 58.30 54.45 62.55 63.80 32.78 36.20 77.52 59.89
2015 64.76 60.09 72.40 63.81 64.58 61.58 71.41 70.08 41.31 46.73 81.53 65.33
Chapter 4 Tax Avoidance and Earnings Management
Tax Avoidance and Earnings Management
4.1. Introduction
Tax avoidance has been argued as schemes transferring benefits from state to shareholders through
transactions that can be bundled with earnings management to guarantee tax benefits and shielded
them from tax authorities (Desai & Dharmapala, 2006, 2009). Specifically, while book income is
normally referred to earnings before recording tax expense in the income statement under the
generally accepted accounting principles (GAAP), taxable income is calculated following the rules
of earnings recognition prescribed by corporate tax laws, which can be estimated by adjusting book
income with the book-tax difference items. As a result, firms’ managers face with conflicting
incentives for the reported value of pre-tax income; whether the high value should be reported to
signal firm high performance, or the low value is encouraged to achieve the purpose for tax reduction.
Regardless of the incentives, such a situation suggests that the managers may be involved in managing
reported earnings to meet their own and other stakeholders’ expectations.
Prior research studies show a considerable gap between corporate income reported to tax authorities
and income reported to the shareholders especially in the U.S (Desai, 2002; Manzon & Plesko, 2002;
Mills et al., 2002). This is partly due to the conflicting objectives and rules in preparing financial
statements (Hanlon, 2005; Hu et al., 2015), it provides opportunities for managers to employ different
strategies which allow them to simultaneously inflate income as a signal of high performance to
investors, and deflated reported income to avoid tax in the same reporting period (Frank, Lynch, &
Rego, 2009).

137
With regards to earnings management, the majority of previous empirical accounting research has
commonly focused on accruals-based approach42, the concept of accounting earnings comprising of
cash flows and accruals, to investigate behaviours of earnings management (e.g., Dechow & Dichev,
2002; Dechow, Sloan, & Sweeney, 1995; Francis, LaFond, Olsson, & Schipper, 2005; Hope et al.,
2013; Jones, 1991; Kothari, Leone, & Wasley, 2005; McNichols, 2002; McNichols & Stubben, 2008;
Ruch et al., 2011). In addition to accrual-based earnings management (hereafter AEM), firms can
manage earnings through the alteration of real activities (the so-called real-activities earnings
management and hereafter REM) (e.g. Francis, Hasan, & Li, 2016; Gunny, 2005; Gunny, 2010;
Roychowdhury, 2006), which have direct effect on cash flow43 (Cohen & Zarowin, 2010) and more
difficult to control (Dichev et al., 2013), as it is an operational decision, than accruals estimation
which can be upheld by the work of an auditor (Bereskin et al., 2018). Prior empirical studies have
analysed whether firms engage REM to increase their income in the current period and the extant
literature report that such action does exist (Cohen et al., 2008; Graham et al., 2005; Roychowdhury,
2006). In particular, Graham et al. (2005) and Cohen et al. (2008) both document the widespread
occurrence of earnings management through REM.
Despite the prevalence of literature on earnings management, the number of studies incorporating tax
avoidance in the context of earnings management in emerging markets has been relatively quite
limited. The role of AEM versus REM in the context of tax avoidance remains largely unexplored at
the same time; this indicates an important gap in the literature. When different forms of earnings
management are available for managers to use as a tool in their strategic earnings reporting, a question
naturally arises whether and how managers use AEM and REM to achieve their goal. This study,
therefore, examines the relationship between tax avoidance and earnings management through both
AEM and REM and extend the focus of study into advanced emerging countries, BRICS, which have
different tax regimes, enforcement, and market practices as compared to developed countries.
42 Earnings management through accruals models are working on the researcher’s attempt to measure the normal and
discretionary portion of accruals. The latter reflects the level of firms’ earnings management.
43 However, REM may not always necessarily affect earnings and abnormal cash flow from operations in the same
direction. For instance, assumingly paid by cash, reductions of discretionary expense will increase both earnings and
abnormal cash flow from operation at the end of the current period. For the other instance, if a manager undertakes the
overproduction in order to decrease cost of goods sold, but those costs are not recovered by sales in the same period, the
abnormal cash flow from operation will be low in the current period while earnings are increased (assuming products are
sold at the price with lower costs of production). Moreover, if the firm engages in REM more than one activities in the
same period, the effect of REM on abnormal cash flow from operations may be ambiguous (Gunny, 2010).

138
One of the main factors driving managers to manipulate earnings is an information asymmetry
between managers and their stakeholders (Schipper, 1989). Managers may make use of the
complexity of tax information which is difficult to be identified by outside shareholders to ascertain
their actual tax obligations and to monitor managerial actions (Chen & Chu, 2005; Crocker &
Slemrod, 2005). With agency issues, managers have opportunities to promote their own self-interest
at the expense of shareholders to exploit tax benefits which provide positive effects on firm value
(Desai & Dharmapala, 2009b) and reward themselves as a form of compensation (Gaertner, 2014;
Phillips, 2003; Seidman & Stomberg, 2012). Supported by the study of Taylor & Richardson (2014),
the results indicate that tax avoidance is an outcome of managerial incentives, opportunism, and
capabilities. In other words, when a manager is motivated to reduce tax burden, the financial
accounting number provides a recourse to do so. As such, tax incentives are a logical and powerful
context for exploring the boundary of earnings management. Existing studies have demonstrated a
positive association between tax avoidance and earnings management.
Using the sample from the BRICS group of countries, an advanced emerging market, this study
investigates the relationship between tax avoidance measured as the annual GAAP effective tax rate
(hereafter the GAAP ETR) and earnings management through AEM and REM, in particular, with a
conforming or non-conforming strategy. The results show that the GAAP ETR is negatively and
significantly associated with measures AEM, implying that firms with higher levels of AEM exhibit
greater degree of tax avoidance. This result supports the hypothesis that managers of firms use non-
conforming techniques to manage earnings which are able to increase book income (higher
discretionary accruals) and simultaneously decrease taxable income (lower the effective tax rate)
(Desai, 2002; Frank et al., 2009; Hanlon et al., 2005; Manzon & Plesko, 2002). In contrast, the GAAP
ETR is positively and significantly associated with measures of REM, implying that firms with higher
REM engage in lower degrees of tax avoidance. This result supports the hypothesis that managers of
firms use conforming techniques to manage earnings where the higher income leads to the higher
effective tax rate, consistent with Zang (2012). In sum, the results imply that firms employ non-
conforming earnings management through discretionary accruals to increase income and avoid tax in
the same accounting period. Simultaneously, they employ the strategy of conforming earnings
management through the alteration of real activities to increase income which eventually increases
tax expense at the same time. At the country level analysis, only India and China show consistent
results for all measures of AEM and REM. The results for Russia and South Africa are consistent
with the main results only one measure of REM, i.e., sales manipulation for Russia, and
overproduction for South Africa.

139
This study adds three incremental contributions to the literature. First, the findings contribute to the
growing literature on the association between tax avoidance and earnings management, in particular,
on how managers strategically use the techniques of AEM and REM to deal with tax incentives.
Secondly, while prior studies have focused on one specific country and use only one measure of
earnings management (mostly focus on the accruals-based measure), this study is the first study that
examines the association between tax avoidance and earnings management captured by both
techniques of earnings management, i.e., AEM and REM, and focuses on the sample from BRICS
countries. This provides the preliminary findings for future research to improve the methodology and
make the association between tax avoidance and earnings management in the context of an emerging
market more pronounced. Thirdly, this study fills the gap in the literature on the effects of AEM and
REM on tax avoidance. More precisely, using an alternative measure of tax avoidance, this study
provides consistent evidence with Frank et al. (2009) to support the recent trends that areas of book-
tax nonconformity offer managers the opportunity to manage book income upwards and taxable
income downwards through discretionary accruals in the same reporting period. Again, by using
different measures of key variables, this study also supports Zang (2010)’s findings indicating that
REM is subject to a higher level of book-tax conformity than AEM. Specifically, when firms increase
book income by manipulating sales volume or by overproducing inventory, they also increase taxable
income and incur higher tax costs in the current period. It seems fair to conclude that the relationship
between tax avoidance and earnings management triggered by the discretion on accruals and the
alteration of real activities has gained universal support in BRICS firms.
Moreover, a better understanding of the extent to which tax avoidance is related to earnings
management in an emerging market provides practical implications to several parties. Given that
nonconformity between financial accounting standards and corporate tax regulation allows tax
planning by firms that manage earnings, especially through discretion on accrual transactions, the
government incurs additional costs to prevent the loss of tax revenue. Thus, this study provides
support of the requirement of the more book-tax conformity, which would likely reduce the game of
numbers in financial report played by corporations. Given anecdotal evidence (Drake et al., 2019;
Mukhlasin & Anissa, 2018) shows that investors are keen to factor firms’ tax avoidance activities
when making investment decisions this study is also important for investors, who directly use the
accounting numbers to evaluate the extent of tax avoidance and the quality of earnings.
The remainder of the paper is organized as follows: Section 4.2 reviews relevant literature and
discussed underlying theoretical frameworks. Section 4.3 presents the development of hypotheses.

140
Section 4.4 describes the research design, including the data, measurement of variables, and analysis
model. Section 4.5 presents the main findings and results from additional and robustness tests. Section
4.6 provides a summary and conclusion.
4.2. Related Literature
4.2.1. Earnings management: accruals-based and real-activities
According to the survey by Graham et al. (2005),44 due to stock market reactions, CFOs believe that
earnings, not cash flows, are the key metrics considered by investors. Missing the earnings per share
(EPS) target might be interpreted as evidence of potential red-flags in the company. In particular, if
the company is not able to meet the target, it could be described as poor management in the sense that
the company cannot generate sufficient value in the future. These situations create uncertainties about
the prospects of the company, which would have adverse consequences. Managers thus engage in
earnings management in order to meet the expectations of analysts and investors. Apart from the
pressure of stock markets, there are other possible motives driving managers to manage earnings such
as to signal firms’ private information, to protect the CEOs and senior managers’ positions, and to
meet performance standard of the firms (Verbruggen, Christaens, & Mills, 2008).
Earnings management can be classified into two main categories: AEM and REM. Healy and Wahlen
(1999, p. 368) describe the practice of AEM as “…managers [using] judgment in financial reporting
and in structuring transactions to alter financial reports to either mislead some stakeholders about the
underlying economic performance of the company or to influence contractual outcomes that depend
on reported accounting practices.” In other words, AEM can be achieved by managers attempting to
disguise or obscure the firm’s underlying economic performance through the accounting choices
available within the GAAP (Dechow and Skinner 2000); for example, changing the depreciation
method for fixed assets and the estimation for provision for doubtful debt. Prior studies use the model
of the accrual process to distinguish abnormal accruals (or discretionary accruals) from normal
accruals. By doing so, the model captures distortions of earnings induced by application of earnings
management available within the accounting rules through abnormal accruals. The interpretation of
44 Graham et al. (2005) investigate the factors that drive reported earnings and disclosure decisions. They use a
combination of field interviews and a survey method with more than 400 executives to address the following questions:
“Do managers care about earnings benchmarks or earnings trends and, if yes, which benchmarks are perceived to be
important? What factors motivate firms to exercise discretion, and even sacrifice economic value, to manage reported
earnings?”
141
this measure is that if the normal accruals are appropriately modelled, then the abnormal component
of accruals represents a distortion, i.e., a higher level of the abnormal component, a higher level of
earnings management, and thereby a lower quality of earnings. The use of accruals to manage
earnings varies according to specific events and specific industries depending on the flexibility
available within the framework of GAAP for managers to make discretions (Trejo-pech et al., 2016;
Verbruggen et al., 2008). Prior literature documents the positive association between discretionary
accruals and earnings management (Dechow et al., 1995; Mcnichols, 2000; Mcnichols & Wilson,
1988), in particular with beating earnings benchmarks (Ayers, Jiang, & Yeung, 2006; Dechow, 2003;
Phillips, Pincus, & Rego, 2003).
Furthermore, several studies show that managerial intervention during the reporting process can occur
not only through accounting estimation, but also through the decisions on an operational process by
changing the timing or structuring an operation, investment, and financing decision to purposefully
alter the reported earnings in a particular direction. These actions are referred to as REM. In the
accounting and financial literature, Roychowdhury (2006, p. 337) defines REM as “departures from
normal operational practices, motivated by managers’ desire to mislead at least some stakeholders
into believing certain financial reporting goals have been met in the normal course of operations.”
The notion of REM to manipulate earnings upwards is demonstrated analytically through activities
such as myopically investing in discretionary expenditures, timing of income recognition from the
disposal of long-lived assets and investments, giving excessive price discounts to boost temporary
sales in the current period, and overproducing to report the lower cost of goods sold (COGS) (Cohen
et al., 2008; Gunny, 2005; Gunny, 2010; Roychowdhury, 2006). The survey by Graham et al. (2005)
shows that to mee the forecasted earnings, CFOs would reduce research and development,
advertising, and maintenance expenses (80%), and would delay a new project (55%), all of which are
REM activities. Roychowdhury (2006) finds that managers improve reported margins to avoid
reporting annual losses through REM activities, specifically, offering price discounts, overproducing,
and cutting discretionary expenditures. Similarly, Bhojraj et al. (2009) find that managers cut
discretionary expenditures to beat earnings benchmarks. Cohen & Paul Zarowin (2010) show that
firms using REM to achieve earnings targets are followed by better operating performance. Focusing
on the zero earnings threshold, Gunny (2010) report that REM activities are significantly and
positively associated with just meet earnings benchmarks (meet zero and last year’s net income).
Notwithstanding, it is a normal business decision to engage in some certain REM activities (e.g.,
offering price discounts and reducing discretionary expenditures) in some economic situations as they
are possibly optimal actions for businesses. Nevertheless, if managers engage in those activities more

142
aggressively than the normal practices according to such economic circumstances in an effort to meet
or beat earnings targets even though those activities do not contribute to future firm value, then it is
argued that they engage in REM (Roychowdhury, 2006).
While a growing body of literature has shown the existence of upward earnings-inflating abnormal
activities (i.e., increasing-incomes), Francis et al. (2016) argue that in some cases, managers have
incentives to temporarily move earnings downwards. Focusing on the events of management buyouts
(MBOs), share repurchases, and CEO option awards, they find that managers use REM to deflate
market valuations. Joosten (2012) finds that firms which report increased earnings between zero and
ten per cent manage earnings downwards through REM strategy. In a similar vein, Anagnostopoulou
& Tsekrekos (2015) find that firms publicly announce their intention to be acquired to engage in
downward earnings management in the years surrounding the announcement year. Further, many
studies document that firms manage earnings downwards in the event of changes in the statutory tax
rate (Guenther, 1994; Scholes et al.,1992; Sundvik, 2017).
In sum, REM occurs when there is a change of the firm’s underlying operational activities, whereas
AEM is accomplished through the judgement on the choice of accounting methods to report those
activities without changing underlying transactions. Regardless of which strategy managers choose,
the ultimate purpose of either AEM or REM is to influence reported earnings number for particular
objectives. That is, managers may either manage upward or downward earnings depending on the
flexibility available within the framework of accounting standards to make discretions in particular
events.
4.2.2. Tax Avoidance and Earnings Management
Tax avoidance activities are used by firms to reduce the amount of taxable income reported to tax
authorities. However, conflicts between contracts a firm has with the state government and contracts
a firm has with a capital market need to be fulfilled by a manager at the same time. While capital
market motivates firms to report a high book income, firms do not want to pay more tax due to such
higher book incomes. In other words, to meet market expectations, a manager of a firm needs to report
high profits, but by making the firm very profitable would result in a much higher payment of taxes.
(a) Tax-induced earnings management
Although pressures from the stock market seem to be the main reason pushing managers to manage
earnings, to respond to other stakeholders who make use of financial statements is also the motives

143
of earnings management. Tax authorities, among others, are one of the possible sources of earnings
management motives. As a firm can be viewed as a nexus of contracts (Sundvik, 2017a), earnings
management is generated from conflicts of contracts between a firm and its stakeholders. Corporate
tax payment,45 the contract between firms and government, is not consistent with the contract between
firms and their shareholders. That is, shareholders expect to see high profits as the outcomes of firm
performance, but at the same time, they must sacrifice a large portion of their profits to pay taxes. On
the other hand, tax liability constrains the firm’s profits, eventually reducing earnings per share - a
key indicator of business performance. Managers thus may employ earnings management to
minimize corporate tax obligation and/or to increase corporate net income. The corporate income tax
expense is closely related to free cash flow of a firm, i.e., the amount of corporate income tax paid
in the current period is cash outflow which reduces the net operating cash flow, and as a result,
decreases the free cash flow. The limited firm’s free cash flow also confines the firm’s capability to
pay the corporate income tax in current period. For example, when a firm has a low level of free cash
flow, i.e., lacking excess cash to pay for corporate income tax, the firm needs to be very careful with
the amount of corporate tax liability. In essence, tax saving could be an incentive for firms to manage
earnings because tax calculation is based on accounting numbers (Monem, 2003). Furthermore, tax
avoidance is a practice involving complicated and confidential corporate structures and transactions
(Chen & Chu, 2005). It is complex by the fact that managers are more likely to have private
information and know-how to use available legal channels to reduce the effective tax rate (Crocker
& Slemrod, 2005).
(b) Theoretical perspective
The underlying factors of earnings management problem, which leads to the low quality of earnings,
stems from two related issues, information asymmetry and agency problems. In a corporation, the
owners are mostly separated from the management team that executes day-to-day tasks. This setting
allows managers of firms to hold a more complete set of information at hand compared to outside
shareholders. In tax planning engagement, the internal information and internal documentation
processes are, therefore, the key factors and only insiders can access that information and processes.
Supported by Gallemore & Labro (2015), the quality of internal information plays a significant role
45 The amount of tax that a firm need to pay to government. Its calculation is based on the magnitude of firm’s profit,
thereby, the more profit firms have, the more corporate tax they pay.

144
in managerial decision-making in influencing the outcomes of the operation. In their study, they find
that firms with a higher quality of internal information are more likely to be able to reduce ETR.
When information asymmetry exists, managers have opportunities to achieve their own self-interest
at the expenses of shareholders, introducing the agency problem (Beatty & Harris, 1998). Under the
notion of agency theory, managers are expected to act on behalf of shareholders (i.e., the owners) to
maximize the value of the firm which could include the pursuit of activities to reduce tax burden as
long as the benefits are over the costs (Desai & Dharmapala, 2009b). If the tax authority detects tax
avoidance schemes, it may generate both explicit costs from fines and implicit costs from damaging
the reputation (Christensen et al., 2015; Crocker & Slemrod, 2005; Putri et al., 2016). Nevertheless,
Slemrod (2004) argues that tax avoidance itself does not reflect the agency problem. The principal-
agent scheme occurs when agents’ interests do not align with those of principals. Therefore, in such
a situation, managers would not act their best to increase profit because profit maximization might
not be in their personal interests. The agency could get involved in tax avoidance schemes when
incentives for managers are tied with after-tax performance to align their interests with those of
shareholders. Given the separation of ownership and control, the schemes are easier to be achieved.
Managers who expect to gain benefit from compensation incentives would exert effort to minimize
tax liability in order to achieve their own target (Crocker & Slemrod, 2005).
Building on the study of Slemrod (2004), Hanlon & Heitzman (2010) argue that if tax avoidance is a
valuable activity (i.e., the marginal benefit of such activity exceeds the marginal cost), shareholders
should create managerial incentives to ensure that managers would do their best on maximizing the
after-tax wealth of the firm’s owners. Therefore, the agency framework in this notion predicts that
incentive-aligned managers engage in more tax avoidance (Desai & Dharmapala, 2009a; Hanlon &
Heitzman, 2010; Slemrod, 2004). Yermack (2004) investigates the performance incentives of outside
directors of leading companies in the U.S. during 1994-1996. By analysing the personal financial
position of those directors, part of the results shows that the awards of stock and stock option (i.e.,
performance-based incentives) for directors occur in line with the tax benefit management, assuming
they attempt to avoid tax. In the same vein, Rego & Wilson (2012) argue that as tax avoidance
involves a high level of uncertainty of certain risks, managers must be motivated by incentives to
engage in risky tax avoidance that could give positive net value in return to the firm, and also to
themselves. Through several measures of tax avoidance including five-year cash ETR, tax shelter
prediction score, and permanent discretionary differences, the results are consistent with their
argument showing that greater equity risk incentives drive a higher level of participating in risk tax

145
avoidance. Armstrong, Blouin, Jagolinzer, & Larcker (2015) also indicate that risk-taking equity
incentives are positively related to tax avoidance. More recently, Koester, Shevlin, & Wangerin
(2017) find that managers with high abilities to manage their firms’ resources efficiently are able to
engage in greater state tax planning activities, shift more income to foreign tax havens, make greater
investments in assets that generate accelerated depreciation deductions, and make more claims on
research and development (R&D) credit.
4.2.3. Conforming and non-conforming book-tax on earnings management
In most jurisdictions, corporate income is calculated for two purposes in each accounting period: one
is for financial reporting prepared under account standards, and the other for tax reporting prepared
in accordance with corporate income tax law (Hanlon, 2005; Hu et al., 2015). Although both financial
and tax accounting are prepared on an accrual basis, different rules lead to differences in the amount
of book income and taxable income and those differences can be generated from either temporary or
permanent differences46 (Hanlon, 2005; Tang & Firth, 2011).
Due to conflicting objectives in developing the rules and incentives, they leave room for managers to
employ techniques of earnings management. In addition, accounting standards offer firms’ managers
with substantial discretion in choices of accounting procedures (Frank et al., 2009; Manzon & Plesko,
2002; Watts & Zimmerman, 1986) such as accounting choices with respect to depreciation, asset
valuation, and cost allocation (Mills & Newberry, 2001). Typically, managers manage earnings and
taxation through transactions (discretionary part) which causes temporary differences,47(Miiller &
Martinez, 2016). To manage earnings, managers may have incentives to choose either conforming
strategies that affect both book and taxable income in the same direction or non-conforming strategies
which can be three different ways. These are strategies that (i) affect both book income and taxable
income but in the opposite direction such as reporting higher earnings and lower taxable income; (ii)
affect only book income but does not affect taxable income such as taking a bath and boosting
earnings; and (iii) affect only taxable income but keep book income constant such as smoothing taxes
46 Permanent differences are caused by transactions which are allowed to recognise in one system (book or tax) but are
not allowed in another system. For example, tax codes do not accept a fine as a revenue deduction, but fines are accepted
as deductible expenses in book income. Temporary differences are differences between pre-tax book income and taxable
income that will reverse itself in the future time of period. To put this another way, temporary differences occur from
transactions which are acceptable items in both financial accounting and tax purposes but are recognized in different
periods and will be eliminated in a certain future period. This type of difference generates deferred taxes, which is not
happening in the case of permanent differences (Hanlon, 2005).
47 Earnings management and tax management are rarely caused by permanent differences as it is non-discretionary part
(Hanlon, 2005: Miiller & Martinez, 2016)

146
and reducing (deferring) taxes (Hu et al., 2015; Tang & Firth, 2011). Since some strategies influence
only tax expense without affecting deferred tax expenses (i.e., conforming earnings management that
boosts both book income and taxable income) while others affect deferred tax expense but not
affecting on current income tax expenses (i.e., non-conforming earnings management that increases
only book income), managers can adopt both types of strategies to reach optimal tax savings (Hu et
al., 2015).
The conforming book-tax earnings management is used to manage book income and taxable income
downward at the same time when the event of changes in the statutory tax rate (STR) occurs.
Following the Tax Reform Act in 1986 which reduces the maximum tax rate from 46%to 34%, a
number of US studies highlight that firms respond to such an incentive by lowering book and taxable
income in the year before the act is enforced (Sundvik, 2017a). Observing changes in gross profits
and SG&A expenses (selling, general and administrative expenses) in the fourth quarter in the year
prior to the effective date of the act, Scholes et al. (1992) find that large firms (relative to small firms)
are more active in income shifting (e.g. deferring sales) and by doing so, they reduce the taxable
income. Guenther (1994) also documents that large firms report current negative accruals (i.e.,
decreased income accruals) in the year prior to the tax rate reduction, suggesting that the reduction of
tax rate provides a substantial incentive to engage in downward earnings management. Similarly,
Goncharov & Zimmermann (2006) investigate through data from Russian firms and find that firms
manage earnings downwards to reduce tax expense. However, because of the dual role in preparing
financial statements, managers face a trade-off dilemma where tax incentives must be weighed
against financial reporting incentives (Mills, 1998; Shackelford & Shevlin, 2001). That is, managers
have to trade off between tax costs occurring when they aim to enhance book income and financial
report costs occurring when they attempt to lower taxable income.48 Reducing tax liability by
managing income downwards could make firms fail to deliver targeted earnings, which may then lead
firms to be punished severely by stock markets.
Alternatively, the strategy of non-conforming book-tax management could be applied to achieve both
goals: by simultaneously managing book income upwards and taxable income downwards. It has
been increasingly documented in the literature that corporations have reported the large gap between
income reported to the tax authorities and income reported to the shareholders (Desai, 2002; Manzon
48 Reported income in financial statement is a key figure to be considered for specifying the term of financial contracts.
Therefore, reporting lower income for tax saving must be exchanged with losing significant contracts with other
stakeholders such as creditor, suppliers, lenders (Shackelford & Shevlin, 2001).

147
& Plesko, 2002; Mills et al., 2002). In particular, prior literature suggests that firm’s managers may
take advantage from accounting choices to increase book income reported to shareholders and
simultaneously minimize taxable income reported to tax authorities (Desai, 2002; Frank et al., 2009;
Hanlon et al., 2005; Manzon & Plesko, 2002). Frank et al. (2009) use the residual from a regression
of permanent book-tax differences (BTDs)49 on non-discretionary items and known items driving the
differences to explore the relationship between aggressive tax reporting and aggressive financial
reporting. They find that aggressive tax reporting is positively associated with aggressive financial
reporting, suggesting that firms manage to inflate book income and deflate taxable income at the same
time in the same accounting period. Wilson (2009) examines fifty-nine tax shelter firms accused by
the government from 1975 to 2002 and finds that firms engaging in tax sheltering exhibit large book-
tax differences and tendency towards aggressive financial reporting. Desai & Dharmapala (2007) find
that incidence of tax sheltering is positively associated with BTDs (book income is greater than
taxable income), suggesting firms that avoid tax also manage earnings upwards. This situation is also
demonstrated in firms outside the US market. Using Malaysian listed firms, Rohaya, Noor, Mastuki,
& Bardai, (2009) provide empirical evidence that firms report higher financial accounting income to
shareholders and lower taxable income to tax authorities at the same time during the years 2000 to
2004. Wong, Lo, & Firth (2015) investigate the Chinese firms’ reaction to the increase of tax rate and
find that firms manage to increase taxable income in the period before tax rate increases in a manner
of book-tax non-conforming strategies where managers manage taxable income upwards with no
effect on book income.
4.2.4. Book-tax accounting conformity in BRICS
One of the primary factors influencing earnings management is the conformity of book and tax rules
used in preparing financial statements reporting to shareholders and taxable incomes reporting tax
authorities (Blaylock et al., 2015; Tang, 2015). The higher level of book-tax conformity is argued to
reduce managerial discretion over financial reporting which consequently reduces upward earnings
management (Desai, 2005; Whitaker, 2005). The conformity would also mitigate incentives for
opportunistically reporting financial profits and taxable income. The notion under this argument is
that when book incomes are managed upwards, taxable incomes would be increased at the same time,
leading to higher tax liability. In contrast, downward earnings management to reduce the tax liability
49 Book-tax differences are the gap between financial accounting income and taxable income that are commonly used to
capture earnings management through the temporary portion of the differences which leave the room for managers to
employ techniques to manipulate earnings.

148
may result in investors’ dissatisfaction (Blaylock et al., 2012, 2015). However, as financial statement
users and tax authorities require different kinds of information for decision making, opponents argue
that increase in conformity would lead to a significant loss of financial information for capital markets
(Hanlon et al., 2005; Hanlon & Shevlin, 2005). That is, managers would be more concerned with
minimizing the taxes paid than conveying information if book and tax incomes are aligned (Atwood,
Drake, & Myers 2010). Therefore, different levels of book-tax conformity may affect earnings
management to varying degrees. The following section discusses differences in the level of book-tax
conformity in BRICS member countries which is the focus of the current study.
Brazil
Prior to the full adoption of IFRS in 2010, the requirements of financial standards and tax rules in
Brazil are virtually indistinguishable, i.e., Brazilian companies operate under “mandatory” book-tax
conformity. Brazil was governed under a rigid system, and it’s very small stock market encouraged
this practice. Although from 1977, listed companies had their own set of financial accounting
standards, each set of standards was subordinated to federal law and consequently to its tax rules.
These tax effects are one of the barriers to information quality improvement, information asymmetry
reduction, and the country’s stock market growth (Nakao & Gray, 2018). Moreover, due to the
relatively small size of a stock market, Brazilian companies have highly concentrated ownership
where large proportions of capital are held by the government, families and multinational companies.
This governance setting is not designed to provide information to investors but rather to improve
equity positions to avoid covenant violations driven by opportunistic motivations (Lopes & Walker,
2012).
During the 2000s, Brazil’s stock market has increased in size, and some companies have begun
trading stocks in the US. Consequently, their financial reporting must conform to US GAAP.
However, according to the Brazilian GAAP, another financial report is required by Brazilian law for
purposes of tax and dividends distribution. This situation remained in force until the end of 2007
(Martinez et al., 2014; Miiller & Martinez, 2016; Nakao & Gray, 2018). The Brazilian financial
accounting standards issued by the Securities Exchange Commission of the Brazilian Government
are required to comply with international accounting standards, leading to the approval of IFRS
adoption. Nevertheless, all adjustments resulting from this compliance would not imply any tax
effects (Martinez et al., 2014; Miiller & Martinez, 2016; Nakao & Gray, 2018). No changes related
to tax enforcement have occurred after IFRS adoption in Brazil. Thus, tax avoidance practices are not
expected to change because of IFRS compliance. Operating in a country where taxation system is a

149
key factor influencing the quality of information, Brazilian firms that engage in tax avoidance
practices are not perceived as a risk in the eyes of the analysts of rating agencies, but engaging in
earnings management are perceived as a risk (Miiller & Martinez, 2016). Therefore, the firms attempt
to manage book and taxable income in the same direction and present the differences between them
in level and variation around the breakeven in order to avoid a perception as of low earnings quality
(Ferreira et al., 2012 in Martinez et al., 2014).
Russia
A company tax system in Russia was established in December 1991 around the break-up of the Soviet
Union. Although there is a mismatch when certain expenses are not tax-deductible items and/or
additional expenses can be claimed for deduction in a tax system, the Russian tax and financial
accounting are highly aligned (Goncharov & Zimmermann, 2006). As a result of the enactment of
Chapter 25 of the Second Part of the Tax Code in 2002, taxpayers and permanent establishments
(PEs) are required by the Russian Tax Code to keep separate accounting records for tax purposes
(Bakaev, 2002 in Goncharov & Zimmermann, 2006; Minyailo, 2016). In other words, firms have to
develop two accounting policies: one for financial accounting and one for tax accounting. Both
accounting systems are recorded in parallel during the period (Purina, 2015). This creates major
differences in calculations as tax accounting rules differ from financial accounting principles. This
also implies that firms do not face with trade-off dilemma between reducing taxable income and
increasing book income.
India
Propelled by globalization, India is one of the emerging market economies. Indian firms are exposed
to foreign competition and foreign investment since the liberalization of the Indian economy in 1991.
Currently, India has only initiated some steps and is subject to a few carve-outs toward the
convergence of its accounting standards issued by the Institute of Chartered Accountants of India
with IFRS. However, since Indian accounting standards are based mainly on International Accounting
Standards (IAS), taxable income is computed from accounting income following IAS12 by adjusting
with the items specified by federal tax law. This suggests the extent of differences between financial
income and taxable income. Consistent with Atwood et al. (2010), Blaylock, Gaertner, & Shevlin
(2015) show that overall book-tax conformity level in India is quite low, i.e., it is ranked fifth in the
Atwood et al. (2010)’s list and ranked sixth in the Blaylock et al. (2015)’s list.

150
China
Chinese financial and tax accounting have converged since 1985 (Tang & Firth, 2011) as a result of
the China's Accounting Reform Project. Before that, the rules for calculating accounting profit and
taxable income are the same, therefore there is no difference on book and tax accounting in China
(Tang, Chow, & Cooper 2000; Davidson, Gelardi, & Li, 1996). In 1992, China reformed its
accounting and legal systems and created a stock exchange in order to gain membership of the World
Trade Organization. It is a condition that the Chinese financial reporting standards have to be in line
with international standards (i.e., IFRS at the present time) and the profession of public accounting
has to be developed (Rich, 2004). In the transition to a new business system, Chinese GAAP has
departed from Chinese income tax laws, giving rise to a large portion of differences between financial
income and taxable income (Tang & Firth, 2011). During the period from 1999 to 2004, Tang & Firth
(2011) find that the aggregate differences between financial income and taxable income are negative
which means that taxable income is higher than financial income in such a period. This can be
interpreted that corporate income tax laws in China are more conservative in recognizing expenses
than both Chinese GAAP and IFRS which is due to the limitation, and non-allowance, of deductible
expenses.
South Africa
As one of the first countries in the world that implements IFRS in 2004 and uses it as the official
reporting standard in 2005 (Verhoef, 2012), South Africa seems to have unalignment between
financial accounting and tax accounting since 2005. The goal of mandatory IFRS adoption is to
provide more information relevant to users of financial statements without any aim to give effect in
the area of taxation. However, prior studies have documented that, after IFRS adoption, as the gap
between the rules for financial statement preparation and those for taxation purposes becomes larger,
thereby the level of book-tax conformity reduces (Chan, Lin, & Mo, 2010; Chan, Lin, & Tang, 2013;
Chen & Gavious, 2017). Incidentally, Atwood, Drake, & Myers, (2010) show that among major
countries which have almost fully converged with IFRS, South Africa is ranked second in the list for
the low level of book-tax conformity.
4.3. Hypotheses Development
Although the focus of extant literature on earnings management has clearly expanded and confirmed
its widespread existence, most of the existing studies on earnings management have focused on

151
reporting practices of firms in advanced countries (Blkasem Elhaj & Mansor, 2019). However,
Bhattacharya et al. (2003) state that the (higher) degree of earnings interference in less developed
countries in relation to developed countries is determined by cross-country indications such as
protection of minority investors, competition, and overall business productivity. As such, the practice
of earnings management and tax avoidance may also be different in emerging economies compared
to advanced economies. This study, therefore, aims to fill this gap by investigating its link in emerging
markets (i.e., BRICS).
As discussed earlier, many factors driving managers of firms to engage in manipulating the artificial
increase (or decrease) of earnings through accounting tactics available within the framework of
GAAP. When information asymmetry exists, it is more convenient for managers to promote their
self-interest, and thereby introducing the agency problem into the games. Actually, avoiding the tax
is not the managers’ personal incentives to engage in aggressive earnings management. They do so,
in practice, because the firms’ owners tie their self-benefits, usually in the forms of after-tax firm
performance packages, with the owner’s interests, i.e., achieving high profit as much as possible.
Therefore, tax avoidance may be the very first incentive, among others, of managers to manage
earnings downwards in order to reduce the amount of tax paid. It is important to note that if the
managers choose to report the same book income and taxable income, they will be faced with relative
costs incurred by not achieving the other target. If firms manage transactions to reduce earnings for
gaining benefits from tax amount reduction, they may be liable for financial reporting costs (e.g.,
decline in stock prices). Conversely, firms engaging in upward-earnings management have to
inevitably accept a higher tax liability as a result of higher book incomes. Alternatively, firms have a
choice of book-tax non-conforming earnings management. Due to the differences between accounting
standard and tax regulations, previous studies (Frank et al., 2009; Wong et al., 2015) show that firms
can also achieve ideal tax management by manipulating taxable income downwards while keeping
book income with high value.
The decision that the managers need to make is to choose between AEM or REM. AEM is
accomplished through the judgement on the choice of accounting methods to represent those activities
without changing underlying transactions, whereas REM involves in the change of the firm’s
underlying operational activities. One may argue that the simultaneous achievement between
financial and taxable income can be succeeded through the use of AEM, not REM because increasing
book income through REM (i.e., increasing temporary sales volumes, reducing discretionary
expenditures, and overproducing in order to decrease COGS) will always result in the increment of

152
tax liability. As claimed in Zang (2012), a high marginal tax rate constrains firms to use REM in an
effort to increase earnings. However, Desai (2005) argues that firms can simultaneously understate
profits reported to tax authorities and inflate profits reported to the capital markets by keeping two
sets of books. Therefore, following two distinct rules as well as other available tools, this study argues
that it is possible that firms accelerating current-period incomes through REM can decelerate tax
liability in the same period through the channels created by the dual reporting system.
In summary, there is strong evidence of earnings management achieved through various means of
AEM and REM to increase or decrease book income for tax purposes. Building on the above
discussion, the association between tax avoidance and earnings management can be in either a
positive or negative direction. If a firm’s manager decides to engage in conforming book-tax earnings
management, the positive relationship between the two issues will be presented: lowering book
income is to lower taxable income (an objective is to pay less tax), or increasing book income (an
objective is to beat the targets) results in higher taxable income. The negative relation will be
presented when managers engage in non-conforming book-tax earnings management: increasing-
book income and decreasing-taxable income are achieved simultaneously. Therefore, to investigate
what scenario describes the relationship between tax avoidance and earnings management in BRICS
countries, the hypotheses are developed in an alternative form as follows:
H1a: Using conforming book-tax earnings management, tax avoidance is positively
associated with earnings management captured through both AEM and REM.
H1b: Using non-conforming book-tax earnings management, tax avoidance is
negatively associated with earnings management captured through both AEM
and REM.
4.4. Research Design
4.4.1. Data and sample
The sample used for testing the proposed hypotheses consists of listed companies across five
countries which are Brazil, Russia, India, China, and South Africa named as BRICS50 for the period
50 BRICS’s main objectives are to cooperate between the member nations for development in the area such as finance,
economy, agriculture, trade, science and technology, health, education, corporate and academic dialogue, crime, and
security (http://brics.itamaraty.gov.br/about-brics/information-about-brics).

153
2006-2017. Data used in this study is sourced from WorldScope retrieved through the DataStream
Thomson Reuters database. The statutory tax rate is collected from KPMG International Cooperative
website51. The information about IFRS adoption is based on the IFRS® Foundation52. Lastly, the legal
system is defined based on the JuriGlobe research group of the University of Ottawa53. Following
previous literature, financial firms are excluded from this study because of the unique practices of an
accounting standard. Firms with no data in any year are also excluded from the analysis. The final
sample consists of 5,710 firms with 23,214 firm-year observations, i.e., 50% from China, 37% from
India, 5% from South Africa, 4% from Brazil, and 3% from Russia as presented in Table 4.1 Panel
A. Since the discretionary accruals are assumed to vary across the industry (due to the difference in
market expectation and detailed regulations), firms then are classified into an industry sector using
the ICB code which categorizes an industry into ten industries, i.e., health care, consumer goods,
consumer services, basic materials, utilities, telecommunications, industrials, technology, oil & gas,
and financial. The sample distribution by industry is described in Panel B of Table 4.1. The table
shows that main data, 70% of the firms belong to basic materials industry (30%), consumer goods
industry (21%), and basic materials (18%). The least number of observations are from the technology
industry accounted for only 1%.
51 Source: https://home.kpmg/vg/en/home/services/tax1/tax-tools-and-resources/tax-rates-online/corporate-tax-rates-
table.html 52 Source: https://www.ifrs.org 53 Source: http://www.juriglobe.ca/eng/

154
Table 4.1 Sample Distribution by Country and Industry
Panel A: Sample Distribution by Country
Country Observations Firms
N Pct. N Pct.
Brazil 963 4% 266 5%
Russia 761 3% 186 3%
India 8.531 37% 1,884 33%
China 11,632 50% 3,155 55%
South
Africa 1,237 5% 219 4%
23,124 100% 5,710 100%
Panel B: Sample Distribution by Industry
Industry Observations Firms
N Pct. N Pct.
Basic Materials 4,150 18% 1,018 18%
Consumer Goods 4,828 21% 1,224 21%
Consumer Services 1,954 8% 477 8%
Health Care 1,623 7% 404 7%
Industrials 6,986 30% 1,729 30%
Oil & Gas 585 3% 120 2%
Technology 1,689 7% 473 8%
Telecommunications 236 1% 51 1%
Utilities 1,073 5% 214 4%
23,124 100% 5,710 100%
This table presents the sample distribution by country and industry. The total observations are
23,124 from 5,710 companies from the period of 2006-2017.
4.4.2. The measurement of variables
(a) Tax avoidance
There are various proxies used in the literature to capture the tax avoidance of a firm. Most prior
studies obtain data from a firm’s financial statement to calculate the proxy of tax avoidance because
tax returns are not publicly reported by a firm and it provides a limited assessment to external users
(Hanlon & Heitzman, 2010). Following Hanlon & Heitzman (2010), in the context of this paper, tax
avoidance is defined following as schemes that a corporation participates for the purpose of explicit
tax reduction. This study does not put any attempt to distinguish between legal avoidance activities
and illegal evasion activities. That is, tax avoidance in this context captures both certain tax positions
(perfectly legal) and uncertain tax positions (either legal or illegal transactions). As such, this study
focuses on the total amount of tax avoided, rather than on the specific actions, because specific actions
taken provide different costs and benefits across countries. Moreover, specific actions taken are
unobservable in the setting of this study.

155
Prior studies argues that the effective tax rate (ETR) captures a broad range of tax avoidance activities
which is consistent with the objective of this study (e.g., Badertscher, Katz, & Rego, 2013; Chen et
al., 2010; Gaertner, 2014; Huseynov & Klamm, 2012; Laguir, Staglianò, & Elbaz, 2015; Lanis &
Richardson, 2012; Phillips, 2003; Steijvers & Niskanen, 2014). Several reasons support the use of
GAAP-based ETR as a proxy for tax avoidance. First, it is a financial statement metric which is
relevant to investors (Wang & Kong, 2011) which means that it communicates directly to the users
of financial statement. Second, it has empirically shown the relationship between tax avoidance and
the GAAP ETR. For example, Thornton & Jaafar (2015) document that both private and public firms
with affiliates in tax havens present lower GAAP ETRs. Armstrong et al. (2015) and Minnick & Noga
(2010) report that the GAAP ETR is statistically and significantly associated with the compensation
package for tax executives and directors. This is achieved by setting the compensation contract that
motivates them to lower tax liability in the long-run horizon and may hence better reveal tax-driven
complexities which are generated by opportunistic rent-seeking manager. Moreover, Graham,
Hanlon, Shevlin, & Shroff (2014) provide evidence from their survey showing that firms give the
importance to the figure of GAAP ETR because it reflects the amount of after-tax accounting income.
Thus, this study employs the GAAP ETR to proxy the degree of tax avoidance. It is computed by
dividing the total tax expense by pre-tax book income for a given firm i in year t, as follows:
𝐸𝑇𝑅𝑖,𝑡 = 𝐼𝑛𝑐𝑜𝑚𝑒 𝑇𝑎𝑥𝑖,𝑡
𝑃𝑟𝑒𝑡𝑎𝑥 𝐵𝑜𝑜𝑘 𝐼𝑛𝑐𝑜𝑚𝑒𝑖,𝑡 (1)
where 𝐸𝑇𝑅𝑖,𝑡 is a one – year GAAP-based ETR.
Although Gebhart (2017) finds that ETR measure estimated under annual basis displays considerable
correlation increasing due to similarity of computation and inputs used, and Hanlon & Heitzman
(2010) and Salihu et al. (2013) suggest to use long- term ETR to deal with the volatility presenting
in annual ETR, it is not suitable to use long-term ETR the context of this study. Typically, earnings
management is the action undertaken in an effort to mislead the underlying value of the current period
income which is used to calculate the amount of the income tax liability. Therefore, it is more
reasonable to use the same period ETR to examine the association between tax avoidance and
earnings management.
Almost all ETR studies exclude the year in which firms present losses and exhibit negative income
tax expenses from their investigation in order to avoid the difficulty of economic interpretation for a
negative value of ETR, (Atwood et al., 2010). In this study, however, negative values of numerator

156
and denominator in the ETR calculation model firstly are winsorized to be zero before the ETR is
calculated. It is possible that the negative income tax and the negative pre-tax income might be the
result of the manager’s attempt to reduce earnings, to some extent, in order to reduce tax expenses.
Therefore, such values should not be excluded from the analysis. Secondly, following recent research,
ETR is also constrained to a range between 0 and 1 (Chen et al., 2010; Dyreng, Hanlon, & Maydew,
2008; Lisowsky, 2010).
(b) Accrual-Based Earnings Management (AEM)
Following prior study (e.g., Chen, Huang, & Fan, 2012; Cohen et al., 2008; Cohen & Zarowin, 2010;
Ipino & Parbonetti, 2017; Zang, 2012), the current study uses the discretionary accruals (the
difference between firms’ actual accruals and the normal level of accruals) to proxy for accrual-based
earnings management. In particular, four widely used approaches are employed in this study in order
to control different dimensions of earnings management. An intercept term is included in all following
models to anticipate problems about the omitting of size variable, and to yield a more symmetric
measure (Kothari et al., 2005; Tang, 2015). All discretionary accrual models are estimated for each
country, industry (ICB industry classification codes), and year (Bartov et al., 2000; Koh, 2003).
The Jones’s discretionary accrual model
The first proxy for discretionary accruals uses the cross-sectional variation of the Jones model (Jones,
1991). The model is estimated by regressing the normal level of accruals as a function of sales growth
(ΔREV) and PPE, as follows:
𝑇𝑜𝐴𝑐𝑐𝑟𝑖,𝑡
𝑇𝐴𝑠𝑠𝑖,𝑡−1= 𝛼0 + 𝛼1
1
𝑇𝐴𝑠𝑠𝑖,𝑡−1+ 𝛼2
(∆𝑅𝐸𝑉)𝑖,𝑡
𝑇𝐴𝑠𝑠𝑖,𝑡−1+ 𝛼3
𝑃𝑃𝐸𝑖,𝑡
𝑇𝐴𝑠𝑠𝑖,𝑡−1+ 휀𝑖,𝑡 (2)
Then, Jones’s discretionary accruals proxy (Jones) is obtained by fitting the accruals model (2) as
below:
𝐽𝑜𝑛𝑒𝑠𝑖,𝑡 = 𝑇𝑜𝐴𝑐𝑐𝑟𝑖,𝑡
𝑇𝐴𝑠𝑠𝑖,𝑡−1− [ 𝛼0 + 𝛼1
1
𝑇𝐴𝑠𝑠𝑖,𝑡−1+ 𝛼2
(∆𝑅𝐸𝑉)𝑖,𝑡
𝑇𝐴𝑠𝑠𝑖,𝑡−1+ 𝛼3
𝑃𝑃𝐸𝑖,𝑡
𝑇𝐴𝑠𝑠𝑖,𝑡−1] (3)
Where 𝐽𝑜𝑛𝑒𝑠𝑖,𝑡 is the discretionary accruals using the Jones (1991) model, 𝑇𝑜𝐴𝑐𝑐𝑟𝑖,𝑡 is total accruals,
measured as the change in current assets plus the change in short-term debt less the change in current
liabilities less the change in cash, and less depreciation and amortization expenses for firm i in year
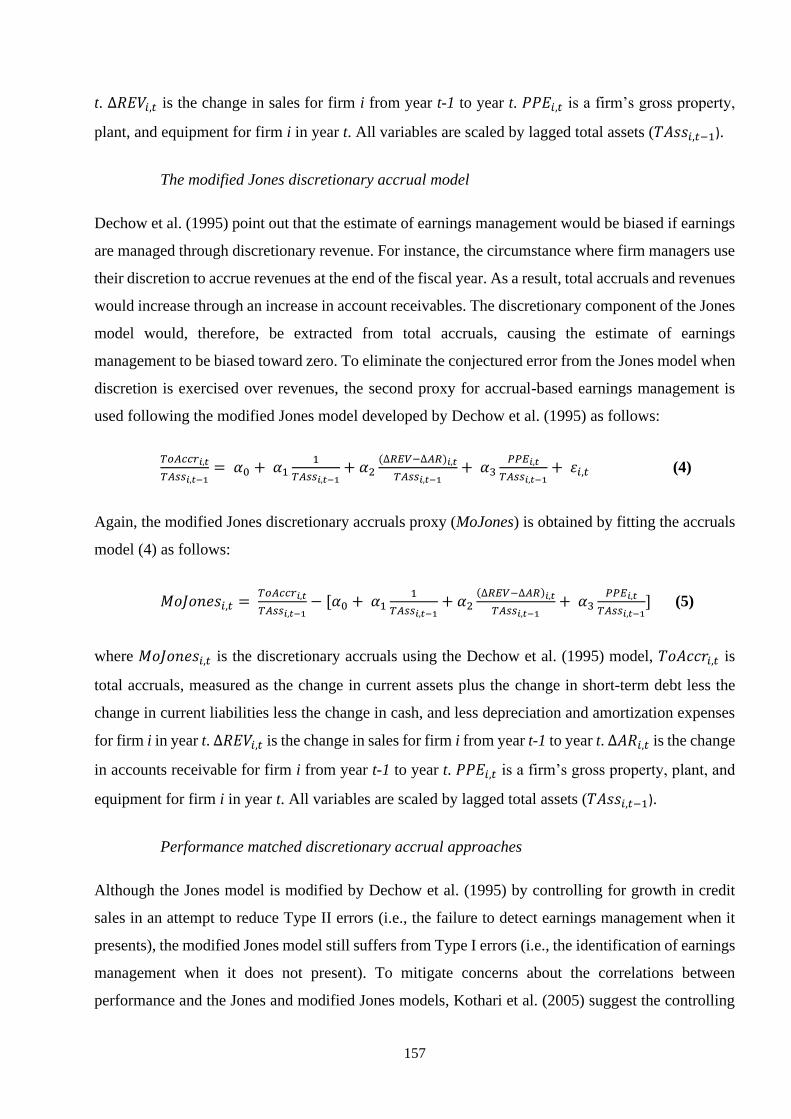
157
t. ∆𝑅𝐸𝑉𝑖,𝑡 is the change in sales for firm i from year t-1 to year t. 𝑃𝑃𝐸𝑖,𝑡 is a firm’s gross property,
plant, and equipment for firm i in year t. All variables are scaled by lagged total assets (𝑇𝐴𝑠𝑠𝑖,𝑡−1).
The modified Jones discretionary accrual model
Dechow et al. (1995) point out that the estimate of earnings management would be biased if earnings
are managed through discretionary revenue. For instance, the circumstance where firm managers use
their discretion to accrue revenues at the end of the fiscal year. As a result, total accruals and revenues
would increase through an increase in account receivables. The discretionary component of the Jones
model would, therefore, be extracted from total accruals, causing the estimate of earnings
management to be biased toward zero. To eliminate the conjectured error from the Jones model when
discretion is exercised over revenues, the second proxy for accrual-based earnings management is
used following the modified Jones model developed by Dechow et al. (1995) as follows:
𝑇𝑜𝐴𝑐𝑐𝑟𝑖,𝑡
𝑇𝐴𝑠𝑠𝑖,𝑡−1= 𝛼0 + 𝛼1
1
𝑇𝐴𝑠𝑠𝑖,𝑡−1+ 𝛼2
(∆𝑅𝐸𝑉−∆𝐴𝑅)𝑖,𝑡
𝑇𝐴𝑠𝑠𝑖,𝑡−1+ 𝛼3
𝑃𝑃𝐸𝑖,𝑡
𝑇𝐴𝑠𝑠𝑖,𝑡−1+ 휀𝑖,𝑡 (4)
Again, the modified Jones discretionary accruals proxy (MoJones) is obtained by fitting the accruals
model (4) as follows:
𝑀𝑜𝐽𝑜𝑛𝑒𝑠𝑖,𝑡 = 𝑇𝑜𝐴𝑐𝑐𝑟𝑖,𝑡
𝑇𝐴𝑠𝑠𝑖,𝑡−1− [𝛼0 + 𝛼1
1
𝑇𝐴𝑠𝑠𝑖,𝑡−1+ 𝛼2
(∆𝑅𝐸𝑉−∆𝐴𝑅)𝑖,𝑡
𝑇𝐴𝑠𝑠𝑖,𝑡−1+ 𝛼3
𝑃𝑃𝐸𝑖,𝑡
𝑇𝐴𝑠𝑠𝑖,𝑡−1] (5)
where 𝑀𝑜𝐽𝑜𝑛𝑒𝑠𝑖,𝑡 is the discretionary accruals using the Dechow et al. (1995) model, 𝑇𝑜𝐴𝑐𝑐𝑟𝑖,𝑡 is
total accruals, measured as the change in current assets plus the change in short-term debt less the
change in current liabilities less the change in cash, and less depreciation and amortization expenses
for firm i in year t. ∆𝑅𝐸𝑉𝑖,𝑡 is the change in sales for firm i from year t-1 to year t. ∆𝐴𝑅𝑖,𝑡 is the change
in accounts receivable for firm i from year t-1 to year t. 𝑃𝑃𝐸𝑖,𝑡 is a firm’s gross property, plant, and
equipment for firm i in year t. All variables are scaled by lagged total assets (𝑇𝐴𝑠𝑠𝑖,𝑡−1).
Performance matched discretionary accrual approaches
Although the Jones model is modified by Dechow et al. (1995) by controlling for growth in credit
sales in an attempt to reduce Type II errors (i.e., the failure to detect earnings management when it
presents), the modified Jones model still suffers from Type I errors (i.e., the identification of earnings
management when it does not present). To mitigate concerns about the correlations between
performance and the Jones and modified Jones models, Kothari et al. (2005) suggest the controlling

158
of the normal level of accruals conditional with return on assets (ROA). It appears that the current
state of the literature generally employs the modified Jones model including ROA to control for
performance (Jackson, 2018) as follows:
𝑇𝑜𝐴𝑐𝑐𝑟𝑖,𝑡
𝑇𝐴𝑠𝑠𝑖,𝑡−1= 𝛼0 + 𝛼1
1
𝑇𝐴𝑠𝑠𝑖,𝑡−1+ 𝛼2
(∆𝑅𝐸𝑉−∆𝐴𝑅)𝑖,𝑡
𝑇𝐴𝑠𝑠𝑖,𝑡−1+ 𝛼3
𝑃𝑃𝐸𝑖,𝑡
𝑇𝐴𝑠𝑠𝑖,𝑡−1+ 𝛼4
𝑅𝑂𝐴𝑖,𝑡
𝑇𝐴𝑠𝑠𝑖,𝑡−1+ 휀𝑖,𝑡 (6)
Then, the discretionary accruals proxy is obtained by fitting the accruals model (6) as follows:
𝑀𝑎𝑡𝑐ℎ𝑒𝑑_𝑀𝑜𝐽𝑜𝑛𝑒𝑠𝑖,𝑡 = 𝑇𝑜𝐴𝑐𝑐𝑟𝑖,𝑡
𝑇𝐴𝑠𝑠𝑖,𝑡−1− [𝛼0 + 𝛼1
1
𝑇𝐴𝑠𝑠𝑖,𝑡−1+ 𝛼2
(∆𝑅𝐸𝑉−∆𝐴𝑅)𝑖,𝑡
𝑇𝐴𝑠𝑠𝑖,𝑡−1+ 𝛼3
𝑃𝑃𝐸𝑖,𝑡
𝑇𝐴𝑠𝑠𝑖,𝑡−1+
𝛼4𝑅𝑂𝐴𝑖,𝑡
𝑇𝐴𝑠𝑠𝑖,𝑡−1] (7)
This study also includes ROA in the original Jones model as follows:
𝑇𝑜𝐴𝑐𝑐𝑟𝑖,𝑡
𝑇𝐴𝑠𝑠𝑖,𝑡−1= 𝛼0 + 𝛼1
1
𝑇𝐴𝑠𝑠𝑖,𝑡−1+ 𝛼2
(∆𝑅𝐸𝑉)𝑖,𝑡
𝑇𝐴𝑠𝑠𝑖,𝑡−1+ 𝛼3
𝑃𝑃𝐸𝑖,𝑡
𝑇𝐴𝑠𝑠𝑖,𝑡−1+ 𝛼4
𝑅𝑂𝐴𝑖,𝑡
𝑇𝐴𝑠𝑠𝑖,𝑡−1+ 휀𝑖,𝑡 (8)
Then, the discretionary accruals proxy is obtained by fitting the accruals model (8) as follows:
𝑀𝑎𝑡𝑐ℎ𝑒𝑑_𝐽𝑜𝑛𝑒𝑠𝑖,𝑡 = 𝑇𝑜𝐴𝑐𝑐𝑟𝑖,𝑡
𝑇𝐴𝑠𝑠𝑖,𝑡−1− [ 𝛼0 + 𝛼1
1
𝑇𝐴𝑠𝑠𝑖,𝑡−1+ 𝛼2
(∆𝑅𝐸𝑉)𝑖,𝑡
𝑇𝐴𝑠𝑠𝑖,𝑡−1+ 𝛼3
𝑃𝑃𝐸𝑖,𝑡
𝑇𝐴𝑠𝑠𝑖,𝑡−1 + 𝛼4
𝑅𝑂𝐴𝑖,𝑡
𝑇𝐴𝑠𝑠𝑖,𝑡−1]
(9)
Where 𝑀𝑎𝑡𝑐ℎ𝑒𝑑_𝐽𝑜𝑛𝑒𝑠𝑖,𝑡 and 𝑀𝑎𝑡𝑐ℎ𝑒𝑑_𝑀𝑜𝐽𝑜𝑛𝑒𝑠𝑖,𝑡 are the discretionary accruals using the Kothari
et al. (2005) model, 𝑇𝑜𝐴𝑐𝑐𝑟𝑖,𝑡 is total accruals, measured as the change in current assets plus the
change in short-term debt less the change in current liabilities less the change in cash, and less
depreciation and amortization expenses for firm i in year t. ∆𝑅𝐸𝑉𝑖,𝑡 is the change in sales for firm i
from year t-1 to year t. ∆𝐴𝑅𝑖,𝑡 is the change in accounts receivable for firm i from year t-1 to year t.
𝑃𝑃𝐸𝑖,𝑡 is a firm’s gross property, plant, and equipment for firm i in year t. 𝑅𝑂𝐴𝑖,𝑡 is return on assets
calculated by dividing pre-tax income by total assets. All variables are scaled by lagged total assets
(𝑇𝐴𝑠𝑠𝑖,𝑡−1).
(c) Real-Activities Earnings Management (REM)
In capturing the increased revenue manipulation through real activities, the three proxies (i.e., sales
manipulation, overproduction, and discretionary expenditures) proposed by Roychouhury (2006) and
subsequently used by a number of studies (e.g., Cohen et al., 2008; Cohen & Zarowin, 2010; Ipino &

159
Parbonetti, 2017; Zang, 2012). Due to the missing data of research and development (R&D) expenses
substantially reduce the number of observations, this study uses only two measures of Roychouhury
(2006) to proxy for REM. These proxies are estimated on the basis of deviations from the normal
levels of two manipulations methods to REM: abnormal cash flow from operating activities (sales
manipulation) and abnormal production costs (overproduction).
Sales manipulation
Managers can temporarily boost sales volumes from the next fiscal year to the current year by offering
limited-time discounts or more lenient credit terms. The accelerated volumes of sales as a result of
these actions are likely to disappear when the offers end. These REM methods lead to lower operating
current-period cash flow (OCF) as margins decrease. By offering sales discounts, total earnings are
higher in the current period, but per given sales, the relative production costs are unusually high,
which in turn lower margins. By offering more lenient credit terms, this is actually another way of
price discounts which lead to the decline in cash inflow over the life cycle of sales if suppliers of the
firm do not give the matching discounts. Therefore, the abnormal cash flow from operations
(AbnOCF) is typically used to detect the level of sales manipulation. The normal OCF is expressed
as a linear function of sales and changes in sales.
The normal OCF level is firstly estimated cross-sectional data for each industry and year by using the
following equation developed by Dechow et al. (1998) and the capture AbnOCF through the residual
from the model:
𝑂𝐶𝐹𝑖,𝑡
𝑇𝐴𝑠𝑠𝑖,𝑡−1= 𝛼0 + 𝛼1 (
1
𝑇𝐴𝑠𝑠𝑖,𝑡−1) + 𝛼2 (
𝑆𝑎𝑙𝑒𝑠𝑖,𝑡
𝑇𝐴𝑠𝑠𝑖,𝑡−1) + 𝛼3 (
∆𝑆𝑎𝑙𝑒𝑠𝑖,𝑡
𝑇𝐴𝑠𝑠𝑖,𝑡−1) + 휀𝑖,𝑡 (10)
where 𝑂𝐶𝐹𝑖,𝑡 is cash flow from operations, measured as the sum of net income and depreciation and
amortization, minus total accruals for firm i in year t. 𝑆𝑎𝑙𝑒𝑠𝑖,𝑡 is the sales for firm i in year t. ∆𝑆𝑎𝑙𝑒𝑠𝑖,𝑡
is the change in sales for firm i from year t-1 to year t. All variables are scaled by lagged total assets
(𝑇𝐴𝑠𝑠𝑖,𝑡−1) to reduce heteroskedasticity. Since some REM activities such as extending more generous
credit terms (lead to increase sales but do not be mapped into cash flow) would result in a more
negative AbnOCF, AbnOCF is thus multiplied by minus one so that positive value of AbnOCF reflects
income-increasing REM. On the other word, higher values indicate greater amounts of AbnOCF
manipulating by firms to increase reported earnings.

160
Overproduction
Another approach of REM to manage earnings upward is producing more products than necessary,
so that fixed production costs are spread over the increased number of product units, hence reducing
fixed costs per unit. Total costs per unit also decrease as long as the reduced fixed costs per unit are
not offset by any increased marginal costs per unit. The normal level of production cost (PROD) is
defined, following Roychowhury (2006), as the sum of the cost of goods sold (COGS) and change in
inventory (ΔINV) during the year. The normal level of COGS and inventory growth can be estimated
as a function of sales as follows:
𝐶𝑂𝐺𝑆𝑖,𝑡
𝑇𝐴𝑠𝑠𝑖,𝑡−1= 𝛼0 + 𝛼1 (
1
𝑇𝐴𝑠𝑠𝑖,𝑡−1) + 𝛼2 (
𝑆𝑎𝑙𝑒𝑠𝑖,𝑡
𝑇𝐴𝑠𝑠𝑖,𝑡−1) + 휀𝑖,𝑡 (11)
∆𝐼𝑁𝑉𝑖,𝑡
𝑇𝐴𝑠𝑠𝑖,𝑡−1= 𝛼0 + 𝛼1 (
1
𝑇𝐴𝑠𝑠𝑖,𝑡−1) + 𝛼2 (
∆𝑆𝑎𝑙𝑒𝑠𝑖,𝑡
𝑇𝐴𝑠𝑠𝑖,𝑡−1) + 𝛼3 (
∆𝑆𝑎𝑙𝑒𝑠𝑖,𝑡−1
𝑇𝐴𝑠𝑠𝑖,𝑡−1) + 휀𝑖,𝑡 (12)
As 𝑃𝑅𝑂𝐷𝑖,𝑡 is defined as 𝐶𝑂𝐺𝑆𝑖,𝑡 + ∆𝐼𝑁𝑉𝑖,𝑡, Equation (5) and (6) are combined and normal production
costs is depicted from the following country-industry-year regression model. Subsequently, the
abnormal production costs (AbnPROD) is proxied by the residual from the model.
𝑃𝑅𝑂𝐷𝑖,𝑡
𝑇𝐴𝑠𝑠𝑖,𝑡−1= 𝛼0 + 𝛼1 (
1
𝑇𝐴𝑠𝑠𝑖,𝑡−1) + 𝛼2 (
𝑆𝑎𝑙𝑒𝑠𝑖,𝑡
𝑇𝐴𝑠𝑠𝑖,𝑡−1) + 𝛼3 (
∆𝑆𝑎𝑙𝑒𝑠𝑖,𝑡
𝑇𝐴𝑠𝑠𝑖,𝑡−1) + 𝛼4 (
∆𝑆𝑎𝑙𝑒𝑠𝑖,𝑡−1
𝑇𝐴𝑠𝑠𝑖,𝑡−1) + 휀𝑖,𝑡 (13)
where 𝑃𝑅𝑂𝐷𝑖,𝑡 is production costs, measured as the sum COGS and ΔINV for firm i in year t. 𝑆𝑎𝑙𝑒𝑠𝑖,𝑡−1
is the sales for firm i in year t-1. ∆𝑆𝑎𝑙𝑒𝑠𝑖,𝑡 is the change in sales for firm i from year t-1 to year t.
∆𝑆𝑎𝑙𝑒𝑠𝑖,𝑡−1 is the change in sales for firm i from year t-2 to year t-1. Again, all variables are scaled
by lagged total assets (𝑇𝐴𝑠𝑠𝑖,𝑡−1). Since it indicates an overproduction and introduces lower costs of
sales, positive AbnPROD value reflects income-increasing REM. In the other word, the higher the
residual, the larger is the amount of inventory overproduction, and the greater is the increase in
reported earnings by reducing the cost of goods sold.
4.4.3. Research model
In analysing how earnings management are related to tax avoidance (H1a and H1b), the following
equation is estimated using the full sample:

161
𝑇𝑎𝑥𝐴𝑣𝑜𝑖𝑑𝑖,𝑡 = 𝛼0 + 𝛼1𝐸𝑀𝑖,𝑡 + ∑ 𝛼𝑛9𝑛=2 𝐶𝑜𝑛𝑡𝑟𝑜𝑙𝑖,𝑡
𝑓𝑖𝑟𝑚+ ∑ 𝛼𝑛
11𝑛=10 𝐶𝑜𝑛𝑡𝑟𝑜𝑙𝑖,𝑡
𝑐𝑜𝑢𝑛𝑡𝑟𝑦+
∑ 𝛼𝑛16𝑛=12 𝐹𝑖𝑥𝑒𝑑 𝐸𝑓𝑓𝑒𝑐𝑡
𝑖,𝑡𝑐𝑜𝑢𝑛𝑡𝑟𝑦 + ∑ 𝛼𝑛
26𝑛=17 𝐹𝑖𝑥𝑒𝑑 𝐸𝑓𝑓𝑒𝑐𝑡
𝑖,𝑡𝑖𝑛𝑑𝑢𝑠𝑡𝑟𝑦 +
∑ 𝛼𝑛39𝑛=27 𝐹𝑖𝑥𝑒𝑑 𝐸𝑓𝑓𝑒𝑐𝑡
𝑖,𝑡𝑦𝑒𝑎𝑟 + 휀𝑖,𝑡 (14)
where:
𝑇𝑎𝑥𝐴𝑣𝑜𝑖𝑑𝑖,𝑡 = tax avoidance (𝑎𝑛𝑛𝑢𝑎𝑙𝐸𝑇𝑅𝑖,𝑡) measured as income tax divided by pre-tax income
for firm i in year t;
𝐸𝑀𝑖,𝑡 = (i) REM measured through the two following measures:
𝐴𝑏𝑛𝑂𝐶𝐹𝑖,𝑡 =
The abnormal cash flow from operations for firm i in
year t;
𝐴𝑏𝑛𝑃𝑅𝑂𝐷𝑖,𝑡 = The abnormal production costs for firm i in year t;
(ii) AEM measured through the following four approaches:
𝐽𝑜𝑛𝑒𝑠𝑖,𝑡 =
The total discretionary accruals from Jones’s model for
firm i in year t;
𝑀𝑜𝐽𝑜𝑛𝑒𝑠𝑖,𝑡
= The total discretionary accruals from Modified Jones’s
model for firm i in year t;
𝑀𝑎𝑡𝑐ℎ𝑒𝑑_𝐽𝑜𝑛𝑒𝑠𝑖,𝑡 = The total discretionary accruals from performance-
matched Jones’s model for firm i in year t;
𝑀𝑎𝑡𝑐ℎ𝑒𝑑_𝑀𝑜𝐽𝑜𝑛𝑒𝑠𝑖,𝑡 = The total discretionary accruals from performance-
matched modified-Jones' model for firm i in year t;
𝐶𝑂𝑁𝑇𝑅𝑂𝐿𝑆𝑖,𝑡 = Control variables for firm i in year t.
Following prior studies (Dyreng et al., 2008; Gupta & Newberry, 1997; Lietz, 2013; Phillips, 2003;
R. J. Wilson, 2009a), control variables that influence tax avoidance across firms are included in the
estimation, i.e., firm size (Size), financial leverage (Lev), firm growth (Growth), firm net operating
losses (Loss), firm capital intensity (CapInt), firm intangible intensity (IntangInt), dividend payout
(DivPayout), and firm closely-held shares54 (CloseHeld). As corporate organizations are economic
units operating in environments modelled by and expected by institutions which influence their
behaviour (Campbell and Lindberg, 1991; Campbell, 2007), it is worth controlling for institutional
factors affecting the level of tax avoidance. Given that this study owes to the use of an international
54 The closely-held share represents shares held by insiders. For companies with more than one class of common stock,
closely held shares for each class is added together. It includes but is not restricted to shares held by cross holdings
(corporations and holding companies), corporations (incl. real estate companies), holding Company, government,
employees, and individuals/insiders (Thompson Reuter, 2019).

162
dataset with discrepancies in accounting standards and regulation enforcement across countries, the
adoption of the International Financial Reporting Standards (IFRS) and the legal origin (LawSys) are
used to control for country-level factors that may affect tax avoidance.
Firm size (Size) is measured by the natural logarithm of total assets. Dyreng et al. (2008) suggest that
firm size may play a role in the firm’s participation in tax avoidance. Based on the theory of political
cost, Watts and Zimmerman (1986, p. 235) explain that firms with higher visibility are subjected to
comply with greater regulatory activity, introducing a negative association between firm size and tax
avoidance (Minnick & Noga, 2010; Rego, 2003). Nevertheless, others present the results in line with
a positive relation assuming that larger companies having more resources to make more lobbying and
participate in more complex tax planning activities (e.g. Siegfried (1972), p. 32-36, Siegfried (1974),
Stickney and McGee (1982), Porcano (1986) in Lietz, 2013). Wilson, (2009b) finds that larger firms
are more tax aggressive as presented in a positive relation between tax shelter participation and firm
size.
Financial leverage (Lev) is defined as long-term debt liability divided by total assets. Highly leveraged
firms, at first glance, could be more able to reduce taxes through the use of complicated financing
transactions, suggesting a positive association between tax avoidance and firm leverage (Mill et al.,
1998 in Dunbar et al., 2010; Lietz, 2013). Alternatively, leveraged firms may have a relatively strong
incentive to avoid taxes to preserve cash to service the debt burden (Badertscher, Katz, & Rego,
2010). Since firms with a high level of leverage incur more interest expenses which are deducted
from taxable income55, they may exhibit less need to be tax aggressive as they face less pressure to
draw on alternative non-debt tax shields (Graham & Tucker, 2006).
Firm growth (Growth) is defined as changes in net sales divided by total assets and firm net operating
losses (Loss) is defined as a dummy variable equal to 1 if the firm’s net income is less than 1 and 0
otherwise. More profitable firms have been argued to report a greater incentive to reduce their tax
burden relative to lesser profitable firms (Dunbar et al., 2010). Similarly, Phillips (2003) concludes
that firms with growth opportunities have greater ability to engage in tax avoidance activities.
However, top-line growth firms are subjected to increasing applicable tax rates as their incomes
increase, suggesting that such firms could have higher ETR. Conversely, loss firms (i.e., firms with
55 Leveraged firms already have benefits from a tax shield (Wrightsman, 1978) which thereby relatively a weak motivation
to reduce more tax (Badertscher et al., 2010).
163
net operating losses) (Loss) should commonly have less incentive to participate in tax avoidance
(Dunbar et al., 2010; Lietz, 2013; Minnick & Noga, 2010).
Capital intensity (CapInt) is defined as net property, plant & equipment (PP&E) divided by total
assets and intangible intensity (IntangInt) is defined as the amount of intangible assets divided by
total assets. Since firms with high intensity of physical plant and equipment (firms with high levels
of PP&E) are more visible to the public (Clarkson et al., 2008), they are usually expected to have
more tax planning opportunities (Dyreng et al., 2008). Gupta & Newberry (1997) reveal that firm
capital intensity is related to tax benefits because of tax-deductible accelerated depreciation relative
to the actual asset lives. Previous studies include R&D expenditures to control for tax credits available
for particular R&D activities (Dyreng et al., 2008). Unfortunately, information about R&D expense
is not widely available in the setting of this study. Thus, the amount of intangible assets, which is
assumed to be positively correlated with the firm’s level of R&D expenses (Markle & Shackelford,
2012), is used instead.
Dividend pay-out (DivPayout) is defined as dividends per share divided by earnings per share and
then multiplied by 100, and firm closely-held shares (CloseHeld) is defined as the percentage of a
number of closely held shares in relative to the common shares outstanding. Prior studies (Amiram,
Bauer, & Frank, 2013; Chatty & Saez, 2005; Desai & Dharmapala, 2006) find that ownership and
shareholder dividend tax policies influence managers to engage in corporate tax avoidance. If
managers are committed to increasing the benefit of shareholders, the positive relation between tax
avoidance and dividend pay-out is expected. On the other hand, managers are more likely to put their
effort towards the strategy of upward book income and downward taxable income at the same time
in order to increase profits which eventually increase the pay-out of dividends. Amiram et al. (2013)
also argue that firms with a higher proportion of closely-held shares have more alignment between
managers and shareholders, thereby accentuating the incentives to engage in corporate tax avoidance.
Therefore, those firms are expected to have higher levels of tax avoidance to increase shareholder’s
profits.
The adoption of the International Financial Reporting Standards (IFRS) is defined as a dummy
variable equal to 1 in the year and after, when firms adopt IFRS, and 0 otherwise. The shift to the use
of IFRS leads to changes in accounting method, which also bring differences in the current treatment
of tax basis. The adoption of IFRS, therefore, should be possible to give the impact on tax strategies
because tax calculation is based on the measurement and recognition of accounting transactions. More
specifically, it is argued that the adoption of IFRS reduces the level of book-tax conformity (Chan et

164
al., 2010; Chan et al., 2013; Chen & Gavious, 2017; Karampinis & Hevas, 2013), thereby reducing
the impact on tax after the post-IFRS period (Hung & Subramanyam, 2007). In line with this notion,
Karampinis & Hevas (2013) find that ETR as a measure of tax pressure is significantly and negatively
associated with discretionary accruals in the pre-IFRS period and the effect disperses after the IFRS
has been implemented. The opponents argue that the reduction of book-tax conformity offers the
convenient way for manager to avoid more tax because they do not face the trade-off decision between
increasing book income and decreasing taxable income. Another possible condition that can explain
the increased levels of tax avoidance after IFRS adoption is the possible increase in discretionary
accruals available within IFRS framework (Ahmed et al., 2013; Lin et al., 2012). As reported by the
studies of Atwood, Drake, Myers, & Myers (2012), Frank et al. (2009) and Wilson, (2009), an
increased aggressiveness of accruals is associated with a greater tax avoidance. Similarly, Braga
(2017) find that after the adoption of IFRS, firms are associated with higher levels of corporate tax
avoidance.
The legal origin (LawSys) is defined as a dummy variable equal to 1 if firms are domiciled in country
complying with civil law and 0 otherwise. Managers are less likely to engage in tax avoidance when
managers perceive that government enforcement of tax rules is stronger. This is because they believe
that strong enforcement introduces the higher expected probability of detection and tax authorities
may impose additional taxes plus penalties (Atwood et al., 2012), thereby discouraging tax avoidance.
Consistent with Desai, Dyck, & Zingales (2007), they find that tax payments increase, related party
trades are curtailed, and tax haven entities are abandoned following an increase in tax enforcement
after the 2000 election of Vladimir Putin. This study applies legal of origins to proxy for regulation
enforcement where civil law is similarly argued, subject to judicial review, to have a higher standard
of proof in legal suits and helps to decrease the scope of managerial decisions (Johnson et al., 2000 in
Dyck & Zingales, 2004).
H1a predicts that firms manage earnings through conforming book-tax earnings management which
suggests a positive association between 𝑇𝑎𝑥𝐴𝑣𝑜𝑖𝑑𝑖,𝑡 and 𝐸𝑀𝑖,𝑡. Thus, 𝛼1 is expected to be positive;
that is, firms manage the book and taxable income downward or upward in the same direction. This
hypothesis implies that managers apply a trade-off decision between increasing earnings and reducing
tax liabilities. H1b predicts that firms manage earnings through non-conforming book-tax earnings
management, suggesting a negative association between 𝑇𝑎𝑥𝐴𝑣𝑜𝑖𝑑𝑖,𝑡 and 𝐸𝑀𝑖,𝑡. Since tax avoidance
can be reflected by the lower amount of tax liabilities that firms pay (lower ETR), 𝛼1 is predicted to

165
be negative in this situation; that is, firms manage book income upward and taxable income
downward at the same time.
4.5. Results
4.5.1. Univariate analysis
(a) Descriptive statistics
Table 4.2 Panel A reports that, overall, the annual ETR mean value is around 6% lower than the
statutory tax rate (i.e., the corporate tax rate imposed by law). Table 4.2 Panel B shows that all
countries, except Russia, consistently show that the lower ETR than STR as follows: 10% lower in
Brazil, 7% lower in India, 6% lower in China, and 3% lower in South Africa. Across industries, Table
4.2 Panel C demonstrates that all industries also report a lower percentage of ETR comparing with a
percentage of STR. Specifically, while technology industry (Ind.7) presents the highest percent-
differences between ETR and STR at around 10%, the industry of consumer services (Ind.3), oil &
gas (Ind.6), and telecommunications (Ind.8) show the lowest percent-differences at 3%
approximately. However, these four industries dominate only 12% of the dataset. Firms operating in
basic materials, consumer goods, and basic materials report at around 6% difference between ETR
and STR.
According to the magnitude of accrual-based earnings management for the full data set as shown in
Table 4.2 Panel A, the mean values of the discretionary accruals are -0.067 from the Jones model, -
0.089 from the modified Jones model, 0.020 and 0.022 from performance-matched Jones model and
modified Jones model, respectively. Table 4.2 Panel B shows that the mean values of Jones and
modified Jones discretionary accruals of all countries (except China) indicate that firms manage
earnings downward which consistent with mean value of the full sample. Among firms that manage
earnings downward, firms in India report the highest level of earnings downward (mean = -0.196 for
Jones model and mean = -0.252 for modified Jones model). For the discretionary accruals from
performance matched with both Jones and modified Jones models, only firms in China and South
Africa manage earnings upward consistent with an overall mean value of the whole dataset. Based
on the industry of operation, firms in all industries seem to manage earnings downwards when the
discretionary accruals estimated via Jones and modified Jones models, but manage earnings upwards
when the discretionary accruals estimated through performance-matched Jones and performance-

166
matched modified Jones models for firms in all industries except telecommunications (Ind.8) and
utilities (Ind.9).
Looking at real-activity earnings management, the overall mean value of sales manipulation is -0.017,
and the overall mean value of overproduction is 0.073. The results suggest that overall firms in the
full sample manipulate sales to decrease earnings but overproduce inventory to increase earnings.
More specifically, while all countries manage earnings downward through sales manipulation, firms
domiciled in South Africa exhibit the highest level of earnings management. Moreover, firms
domiciled in India and China manage to increase earnings through the technique of overproduction,
whereas firms in Brazil, Russia, and South Africa engage in overproduction activity to manage
earnings downward. In term of industry perspective, the firms in all industries, except the industry of
industrials (Ind.5), engage in sales manipulation activity to manage earnings downward. However,
firms in all industries, except the industries of health care (Ind.4), utilities (Ind.8) and
telecommunications (Ind.9), engage in overproduction activity to manage earnings upward.
The descriptive statistics of other firm characteristic variables used in this study are reported in Table
4.2 Panel A. All variables are winsorized at percentiles 1% and 99% to mitigate the potential of
extreme value distorting results. The size has a mean (median) of 12.99 (13.01), the mean (median)
leverage ratio is 10.1% (4.8%) of total assets, the mean (median) property, plant, and equipment
present 47.0% (41.7%) of total assets, as well as the mean (median) net intangible assets is 6.9%
(2.8%) of total assets. The sample firms further exhibit growth as mean (median) changes in net sales
to total assets is equal to 6.9% (5.2%) with only 0.7% of firms are in loss, and 53.3% of firms are
held by insiders. The average payout of the dividends is $23.77 per share. For country-level controls,
57.8% of the sample firms domiciled in the civil law, and 56.4% of the firms adopt the IFRS.

167
Table 4.2 Descriptive Statistics
Panel A: Overall variable summary
Variables N Mean 25% Median 75% SD
Tax avoidance:
annualETR 23124 0.231 0.139 0.220 0.310 0.152
Statutory tax rate 23124 0.290 0.250 0.250 0.340 0.046
Accrual-based management:
Jones 23124 -0.067 -0.131 -0.028 0.045 0.267
MoJones 23124 -0.089 -0.147 -0.038 0.034 0.292
Matched-Jones 23124 0.020 -0.075 0.028 0.118 0.293
Matched-MoJones 23124 0.022 -0.074 0.029 0.123 0.296
Real-activity management:
AbnOCF 23124 -0.017 -0.068 -0.007 0.043 0.116
AbnProd 23124 0.073 -0.104 0.016 0.199 0.317
Control variables:
Firm level:
Size 23124 12.994 11.886 13.007 14.139 1.792
CapInt 23124 0.470 0.217 0.417 0.680 0.319
IntangInt 23124 0.069 0.003 0.028 0.079 0.108
Lev 23124 0.101 0.000 0.048 0.160 0.131
Growth 23124 0.069 -0.018 0.052 0.147 0.221
DivPayout 23124 23.767 5.710 20.340 34.350 21.415
CloseShare (%) 23124 53.263 40.850 56.770 70.590 23.600
Loss 23124 0.007 0.000 0.000 0.000 0.084
Country level:
IFRS 23124 0.564 0.000 1.000 1.000 0.496
LawSys 23124 0.578 0.000 1.000 1.000 0.494

168
Table 4.2 Descriptive Statistics (Cont’d)
Panel B: Country mean value for all variables
Variables Overall Brazil Russia India China S. Africa
Tax avoidance:
annualETR 0.231 0.249 0.267 0.267 0.194 0.296
Statutory tax rate 0.290 0.340 0.208 0.337 0.253 0.323
Accrual-based management:
Jones -0.067 -0.006 -0.013 -0.196 0.019 -0.060
MoJones -0.089 -0.027 -0.031 -0.252 0.021 -0.090
Matched-Jones 0.020 -0.015 -0.008 -0.038 0.065 0.039
Matched-MoJones 0.022 -0.014 -0.005 -0.039 0.069 0.046
Real-activity management:
AbnOCF -0.017 -0.034 -0.070 -0.017 -0.006 -0.075
AbnProd 0.073 -0.064 -0.086 0.147 0.049 -0.004
Control variables:
Firm level:
Size 12.994 14.539 14.563 11.858 13.565 13.300
Lev 0.101 0.220 0.160 0.128 0.067 0.111
CapInt 0.470 0.454 0.765 0.528 0.408 0.485
IntangInt 0.069 0.171 0.041 0.038 0.079 0.125
Growth 0.069 0.017 0.043 0.074 0.073 0.051
DivPayout 23.767 38.041 20.027 18.054 25.857 34.711
CloseShare (%) 53.263 48.536 73.081 60.358 48.844 37.379
Loss 0.007 0.024 0.014 0.009 0.003 0.015
Country level:
IFRS 0.564 0.868 0.453 0.000 0.959 0.570
LawSys 0.578 1.000 1.000 0.000 1.000 0.000

169
Table 4.2 Descriptive Statistics (Cont’d)
Panel C: Industry variable mean value against overall mean value
Variables Overall Ind.1 Ind.2 Ind.3 Ind.4 Ind.5 Ind.6 Ind.7 Ind.8 Ind.9
Tax avoidance:
annualETR 0.231 0.240 0.230 0.264 0.211 0.229 0.254 0.186 0.259 0.240
Statutory tax rate 0.290 0.292 0.298 0.290 0.290 0.287 0.281 0.289 0.284 0.279 Accrual-based management:
Jones -0.067 -0.072 -0.097 -0.078 -0.051 -0.048 -0.025 -0.090 -0.066 -0.017
MoJones -0.089 -0.096 -0.131 -0.102 -0.078 -0.064 -0.037 -0.110 -0.086 -0.031
Matched-Jones 0.020 0.009 0.003 0.018 0.059 0.030 0.032 0.041 -0.051 -0.005
Matched-MoJones 0.022 0.011 0.006 0.021 0.061 0.032 0.035 0.045 -0.050 -0.006 Real-activity management:
AbnOCF -0.017 -0.019 -0.021 -0.030 -0.026 0.001 -0.038 -0.024 -0.112 -0.028
AbnProd 0.073 0.108 0.123 0.024 -0.022 0.084 0.055 0.057 -0.125 -0.046 Control variables:
Firm level:
Size 12.994 13.092 12.539 12.980 12.683 13.015 14.449 12.438 14.918 14.682
CapInt 0.470 0.609 0.483 0.421 0.394 0.398 0.666 0.227 0.814 0.760
IntangInt 0.069 0.049 0.049 0.088 0.099 0.066 0.059 0.118 0.152 0.080
Lev 0.101 0.113 0.091 0.097 0.075 0.095 0.142 0.046 0.152 0.236
Growth 0.069 0.065 0.083 0.060 0.079 0.065 0.057 0.091 0.039 0.024
DivPayout 23.767 21.589 24.248 27.045 22.237 23.791 23.388 20.799 31.715 29.356
CloseShare 53.263 55.960 57.105 51.696 48.832 51.332 58.201 42.253 59.231 61.002
Loss 0.007 0.005 0.007 0.009 0.006 0.006 0.015 0.009 0.000 0.010
Country level:
IFRS 0.564 0.516 0.486 0.639 0.579 0.611 0.513 0.575 0.432 0.677
LawSys 0.578 0.537 0.501 0.591 0.583 0.606 0.641 0.573 0.614 0.826
This table presents descriptive statistics for main variables used in this analysis (see Appendix 4.1).

170
The variables are measured as follows;
Tax avoidance:
annualETR = The ratio of income tax and pretax income;
Statutory tax rate = The corporate income tax that are established by the law;
Accrual-based management:
Jones = The residuals from Jones’s model by Jones (1991);
MoJones = The residuals from Modified-Jones’s model by Dechow et al. (1995);
Matched-Jones = The residuals from matched ROA with Jones’s model by Kothari et al. (2005);
Matched-MoJones = The residuals from matched ROA with Modified-Jones’s model by Kothari et al. (2005);
Real-activity management:
AbnOCF = The residuals from the normal operating cash flow level model
AbnProd = The residuals from the normal production costs model
Control variables:
Size = The natural logarithm of total assets;
CapInt = The ratio of net property, plant, and equipment and total assets;
IntangInt = The ratio of intangible assets and total assets;
Lev = The ratio of long-term debt liability and total assets;
Growth = The change in net sales divided by total assets;
DivPayout = The ratio of dividends per share and earnings per share multiplied by 100;
CloseShare = The percentage of number of closely held shares to common shares outstanding;
Loss = The dummy variable equal to 1 if the firm’s net income less than 1, and 0 otherwise;
IFRS = The dummy variable equal to 1 in the year and after when firms adopt IFRS, and 0 otherwise;
LawSys = The dummy variable equal to 1 if firms are in the country obeying by civil law, and 0 otherwise.

171
Table 4.3 Variable Correlation
Standard errors in parentheses
*, ** and *** indicate the level of significance at p<0.05, p<0.01, and p<0.001, respectively, using Pearson tests.
Variables (1) (2) (3) (4) (5) (6) (7) (8) (9) (10) (11) (12) (13) (14) (15) (16) (17)
(1) annualETR 1
(2) Jones -0.110 *** 1
(3) MoJones -0.123 *** 0.909 *** 1
(4) Matched Jones -0.086 *** 0.657 *** 0.534 *** 1
(5) Matched MoJones -0.089 *** 0.652 *** 0.546 *** 0.996 *** 1
(6) AbnOCF 0.010 *** 0.056 *** 0.066 *** -0.149 *** -0.177 *** 1
(7) AbnProd 0.032 *** -0.173 *** -0.057 *** -0.051 *** 0.008 -0.045 *** 1
(8) Size -0.032 *** 0.511 *** 0.612 *** 0.161 *** 0.178 *** -0.060 *** -0.082 *** 1
(9) Lev 0.092 *** 0.006 0.005 -0.126 *** -0.126 *** 0.056 *** -0.017 ** 0.237 *** 1
(10) Growth -0.034 *** -0.108 *** 0.019 ** 0.058 *** 0.133 *** -0.278 *** 0.716 *** 0.026 *** -0.027 *** 1
(11) DivPayout -0.001 0.115 *** 0.112 *** 0.091 *** 0.091 *** -0.151 *** -0.106 *** 0.190 *** -0.076 *** -0.029 *** 1
(12) CapInt 0.060 *** -0.110 *** -0.160 *** -0.129 *** -0.139 *** -0.173 *** -0.058 *** 0.038 *** 0.340 *** -0.059 *** -0.006 1
(13) IntangInt -0.051 *** 0.077 *** 0.112 *** 0.004 0.011 -0.039 *** -0.094 *** 0.165 *** 0.073 *** 0.004 0.032 *** -0.279 *** 1
(14) CloseShare 0.075 *** -0.074 *** -0.090 *** -0.015 * -0.015 * -0.077 *** 0.062 *** -0.029 *** 0.057 *** 0.017 ** -0.016 * 0.152 *** -0.160 *** 1
(15) Loss 0.341 *** -0.024 *** -0.027 *** -0.055 *** -0.057 *** 0.044 *** -0.014 * -0.008 0.050 *** -0.038 *** -0.094 *** 0.005 0.010 0.010 1
(16) IFRS -0.203 *** 0.354 *** 0.397 *** 0.151 *** 0.152 *** 0.085 *** -0.166 *** 0.405 *** -0.181 *** -0.059 *** 0.171 *** -0.191 *** 0.215 *** -0.241 *** -0.022 *** 1
(17) LawSys -0.222 *** 0.360 *** 0.417 *** 0.140 *** 0.146 *** 0.055 *** -0.149 *** 0.455 *** -0.163 *** -0.008 *** 0.144 *** -0.141 *** 0.160 *** -0.152 *** -0.027 *** 0.849 *** 1
N 23124

172
(b) Variable correlation
Table 4.3 presents the pairwise Pearson correlation matrix indicating the multicollinearity test results.
The matrix reveals inclusive results that annual ETR is significantly and negatively associated with
accrual-based earnings management for all models. On the contrary, annual ETR is significantly and
positively associated with real-activity earnings management both through sales manipulation and
overproduction. In addition to the results from Pearson correlation matrix, the results of variance
inflation factors (VIFs) also show that no VIFs exceed six for any of the explanatory variables,
endorsing none of the multicollinearity in the model.56
(c) Trends of tax avoidance and earnings management
Figure 4.1 Panel A shows the trend of averages of ETR over the sample period against those of the
STR. The results show that both STR and ETR gradually decline over time. In particular, the STR
has reduced from 33% to 27%, and the ETR has decreased by approximately 24% to 21%. Overall,
the gap between STR and ETR has reduced over the sample period, from 9% in 2006 to 6% in 2017.
Furthermore, Figure 4.1 Panel B reports the trend of BRICS firms’ practices of earnings management
through both AEM and REM techniques. The trend is estimated based on the average value of four
measures of abnormal accruals proxied for AEM, as well as the average value between abnormal
level of cash flow from operating and abnormal level of production proxied for REM. Overall, the
results show that firms in BRICS use AEM to manage earnings downward as the average abnormal
accruals are below zero, and use REM to manage earnings upward as the average abnormal level of
activities is above zero. Although the levels of earnings management of both techniques fluctuate
over the sample period, the level of earnings management of each technique starts gradually to decline
from -0.16 in 2012 to -0.01 in 2014 for AEM, and from 0.05 in 2012 to 0.02 in 2014 for REM.
Moreover, the technique that firms use to manage earnings upward and downward is switched in
2015. That is, firms use the technique of AEM to increase incomes and use REM to decrease incomes.
56 The problem of multicollinearity among the explanatory variables is introduced to the model if a VIF value is above
the threshold of ten (Hair et al., 2006 in Lanis & Richardson, 2012).

173
Figure 4.1 Trend of average tax avoidance, AEM, and REM
Panel A: Trend of average ETR against STR for pooled data
The figure above is plotted from the mean value of STR against the mean value of ETR for all sample as of 23,124 firm-
year observations during the period of 2006-2017 (see Appendix 4.2).

174
Figure 4.1 Trend of average tax avoidance, AEM, and REM (Cont’d)
Panel B: Trend of average AEM and REM for pooled data
The figure above is plotted from the average mean value of four measures of AEM (Jones, MoJones, Matched_Jones, and
Matched_MoJones) against the average mean value of two measures of REM for all sample as of 23,124 firm-year observation
during the period of 2006-2017 (see Appendix 4.2).

175
4.5.2 Multivariate analysis
Prior to conducting the multivariate analysis, this study carried out a series of sample tests to ensure
that the sample data satisfy the underlying assumptions of the classical linear regression model for an
OLS estimator to be BLUE (Best Linear Unbiased Estimator) and the regression’s results are verified.
The Breusch Pagan/Cook Weisberg’s test to detect heteroskedasticity problem and the Wooldridge’s
test to detect autocorrelation in panel data shows that the data is suspected of having both problems.
Hence, the models in this study are regressed with the option of robust standard errors in order to
mitigate both heteroskedasticity and autocorrelation issues.
(a) Tax avoidance and AEM versus REM
In analysing how earnings management practices in BRICS countries affect tax avoidance in the main
test, Equation (14) has been separately regressed the annual GAAP ETR on each measure of AEM
and REM across firm-year observations and controlled for other firm and country-specific variables.
The results for the multivariate tests addressing the hypotheses are reported in Table 4.4.
In columns (1) - (4), the coefficients on accrual-based earnings management measures are negatively
and significantly (β_Jones = -0.04, p < 0.01; β_MoJones = -0.045, p < 0.01; β_Matched_Jones = -
0.022, p < 0.01; β_Matched_MoJones = -0.022, p < 0.01) associated with annual GAAP ETR,
supporting the hypothesis (H1b) that managers of firms use non-conforming techniques to manage
earnings which are able to increase book incomes (higher discretionary accruals) and decrease taxable
incomes (lower the effective tax rate). This result is consistent with prior studies in developed
economies (e.g., Desai, 2002; Frank et al., 2009). As the accounting standards used in BRICS is
highly aligned with IFRS which is argued to reduce the level of book-tax conformity (Chan et al.,
2010; Chan et al., 2013; Chen & Gavious, 2017; Karampinis & Hevas, 2013), this finding can be
interpreted that the reduction of book-tax conformity offers a convenient way for managers to avoid
more tax because they are not faced with the trade-off decision between increasing book income and
decreasing taxable income. Another possible condition that can explain the increased levels of tax
avoidance after IFRS adoption is the increase in discretion on accruals available within the IFRS
framework (Ahmed et al., 2013; Lin et al., 2012).
In contrast, columns (5) and (6) report positive and significant coefficients (β_AbnOCF = 0.034, p <
0.01, β_AbnProd = 0.03, p < 0.01) on the association between real-activity earnings management
measures and annual GAAP ETR, supporting hypothesis H1a that managers of firms use conforming
176
techniques so that the higher income leads to a higher effective tax rate. This is consistent with the
study by Zhang (2012) which finds that REM is costly due to tax incentives because when firms
increase book income by manipulating sales or overproducing inventory, taxable income would
increase and incur higher tax costs in the same period. This result is intuitive as the techniques of
real-activity earnings management are operating practices intended to increase incomes.
Consequently, firms bear higher tax liabilities caused by increased incomes.
However, before it can be concluded that firms' managers in the BRICS countries employ non-
conforming earnings management through AEM to avoid tax, examining whether there is any
substitution or complementary relation between REM and AEM has been conducted.57 The extended
test shows that the sample does not provide evidence for the simultaneous or substitute strategy used
by managers, and the level of AEM is not adjusted based on the unexpected amount of REM (detailed
in Appendix 4.3). Therefore, in the setting of this study, it can be concluded that firms in BRICS
employ income-increasing AEM as a means to reduce taxes.
As for firm-specific control variables, the results are consistent in all cases for the measures of AEM
and REM. The regression coefficient for firm size (Size) using the logarithm of total assets is
positively significant with ETR, suggesting that the larger firms pay more tax (Dyreng et al., 2008;
Huseynov & Klamm, 2012; Minnick & Noga, 2010). Conversely, the capital intensity (CapInt) is
negatively and significantly associated with the effective tax rate, consistent with Huseynov &
Klamm (2012). The intensity of intangible assets (IntangInt), a proxy of R&D expenses in this study,
is negatively associated with the ERT. This result suggests that firms use tax avoidance techniques
through the investments in assets that generate more claims on R&D credit (Belz et al., 2017; Gao et
al., 2016b; Koester et al., 2017). The coefficients on firm leverage (Lev) is not significant, suggesting
57 This is because it is possible that firms may use both AEM and REM as results of tax incentives but undertake one of
the strategies under a condition of its cost of execution or different time orientation. There is empirical evidence revealing
that managers use AEM and REM to manage earnings based on their relative costs (Badertscher, 2011; Cohen et al.,
2008; Cohen & Zarowin, 2010; Enomoto et al., 2015; Ipino & Parbonetti, 2017; Joosten, 2012; Zang, 2012). In particular,
decisions to use REM activities as substitute decisions to manage earnings through AEM occurs when the costs of AEM
is higher than those of REM and vice versa. Under the notion of the complementary hypothesis, managers may use both
AEM and REM, but at different timings. That is, managers can observe the outcome of REM on earnings at the end of
the fiscal year, and then they can use less (more) AEM to offset any unexpectedly high (low) results from REM.

177
that the firm’s financial leverage has no effect on tax avoidance level in the BRICS nations. A higher
level of firm’s growth (Growth) is significantly associated with the lower level of ETR (but not in the
model measured through Matched-MoJones and AbnOCF), suggesting that firms with higher net
sales avoid more tax as they have a greater incentive to reduce their tax burden relative to lesser
profitable firms (Dunbar et al., 2010). As predicted, firms with negative income (Loss) are less
incentive to reduce the tax rate, thereby positively associated with the ETR. The results also show
that firms having more alignment between managers and shareholders (CloseHeld) pay more tax,
consistent with the results of dividend pay-out per share (DivPayout) and ETR showing the positive
and significant relationship for all models. That is, more aligned firms commit to increasing profits
for shareholders, leading to a higher tax liability due to the result of increased incomes. Considering
the results for country-specific variables, firms in the country with civil law (LawSys), categorized
as low investor protection by the World Economic Forum’s 2012/2013 Global Competitiveness
Report, have lower ETR as expected because the low level of investor protection represents less
enforcement of law and regulations.58 After the adoption of IFRS, firms report lower GAAP ETR,
supporting the argument that IFRS adoption reduces the level of book-tax conformity (Chan et al.,
2010; Chan et al., 2013; Chen & Gavious, 2017; Karampinis & Hevas, 2013) and, thereby more
convenient way to engage in greater tax avoidance (Desai, 2005; Hanlon et al., 2005).
58 Consistent with La Porta et al, 1998, common law origin presents characteristics in comply with attributes of strong
investor protection.

178
Table 4.4 The Relationship between Tax Avoidance and Earnings Management
Variables Exp.
Sign
One-year ETR
Measure of tax avoidance
AEM Measures: (-/+)
Jones -0.04 ***
(0.004)
MoJones
-0.045 ***
(0.004)
Matched-Jones
-0.022 ***
(0.003)
Matched-MoJones
-0.022 ***
(0.003)
REM Measures: (-/+)
AbnOCF
0.034 ***
(0.009)
AbnProd
0.03 ***
(0.005)
Control variables:
Firm level:
Size (-/+) 0.007 *** 0.009 *** 0.005 *** 0.005 *** 0.005 *** 0.005 ***
(0.001)
(0.001)
(0.001)
(0.001)
(0.001)
(0.001)
CapInt (-) -0.015 *** -0.018 *** -0.014 *** -0.014 *** -0.009 ** -0.01 ***
(0.004) (0.004) (0.004) (0.004) (0.004) (0.004)
IntangInt (-) -0.043 *** -0.042 *** -0.04 *** -0.04 *** -0.033 *** -0.031 ***
(0.010) (0.010) (0.010) (0.010) (0.010) (0.010)
Lev (-/+) 0.007
0.006
0.004
0.003
0.003
0.008
(0.010)
(0.010)
(0.010)
(0.010)
(0.011)
(0.010)
Growth (-/+) -0.017 *** -0.012 ** -0.01 ** -0.007
-0.006
-0.041 ***
(0.005)
(0.005)
(0.005)
(0.005)
(0.005)
(0.007)
Loss (+) 0.602 *** 0.602 *** 0.601 *** 0.601 *** 0.603 *** 0.603 ***
(0.023) (0.023) (0.023) (0.023) (0.023) (0.023)
DivPayout (-) 0.000 *** 0.000 *** 0.000 *** 0.000 *** 0.000 *** 0.000 ***
(0.000)
(0.000)
(0.000)
(0.000)
(0.000)
(0.000)
CloseShare (-) 0.000 *** 0.000 *** 0.000 *** 0.000 *** 0.000 *** 0.000 ***
(0.000) (0.000) (0.000) (0.000) (0.000) (0.000)
Country level:
IFRS (-/+) -0.024 *** -0.024 *** -0.023 *** -0.023 *** -0.025 *** -0.026 ***
(0.005)
(0.005)
(0.005)
(0.005)
(0.005)
(0.005)
LawSys (-) -0.055 *** -0.055 *** -0.055 *** -0.055 *** -0.054 *** -0.053 ***
(0.006)
(0.006)
(0.006)
(0.006)
(0.006)
(0.006)
Fixed effects:
Industry, Year Yes
Yes
Yes
Yes
Yes
Yes
Constant 0.187 *** 0.169 *** 0.220 *** 0.219 *** 0.223 *** 0.223 ***
(0.012)
(0.012)
(0.011)
(0.011)
(0.012)
(0.012)
adj. R2 0.192
0.193
0.190
0.190
0.189
0.190
F 95.622
97.838
92.48
92.57
91.55
92.973
n 23124
23124
23124
23124
23124
23124
Robust standard errors clustered at the firm level are in parentheses.
*, ** and *** indicate the level of significance at p<0.1, p<0.05, and p<0.01, respectively, using two tailed tests.
The table reports regression results of the following fixed-effect model using OLS estimation with robustness of standard errors:

179
𝑇𝑎𝑥𝐴𝑣𝑜𝑖𝑑𝑖,𝑡 = 𝛼0 + 𝛼1𝐸𝑀𝑖,𝑡 + ∑ 𝛼𝑛
9
𝑛=2
𝐶𝑜𝑛𝑡𝑟𝑜𝑙𝑖,𝑡𝑓𝑖𝑟𝑚
+ ∑ 𝛼𝑛
11
𝑛=10
𝐶𝑜𝑛𝑡𝑟𝑜𝑙𝑖,𝑡𝑐𝑜𝑢𝑛𝑡𝑟𝑦
+ ∑ 𝛼𝑛
16
𝑛=12
𝐹𝑖𝑥𝑒𝑑 𝐸𝑓𝑓𝑒𝑐𝑡𝑖,𝑡𝑐𝑜𝑢𝑛𝑡𝑟𝑦
+ ∑ 𝛼𝑛
25
𝑛=17
𝐹𝑖𝑥𝑒𝑑 𝐸𝑓𝑓𝑒𝑐𝑡𝑖,𝑡𝑖𝑛𝑑𝑢𝑠𝑡𝑟𝑦
+ ∑ 𝛼𝑛
37
𝑛=26
𝐹𝑖𝑥𝑒𝑑 𝐸𝑓𝑓𝑒𝑐𝑡𝑖,𝑡𝑦𝑒𝑎𝑟
+ 휀𝑖,𝑡
where:
TaxAvoid is tax avoidance proxied through annualETR, calculated by dividing income tax by pretax income;
EM is earnings management proxied through set of the accrual-based managements measures {Jones, MoJones, Matched-
Jones, and Matched-MoJones}, measured by the residuals of the total accrual regression models, and the set of real-
activity managements {AbnOCF and AbnProd} where AbnOCF is an abnormal cash flow from operating activities,
representing sales manipulation and AbnProd is an abnormal level of firm production,
Controlfirm is set of control variables at a firm level including Size refers to size of firms based on total assets, Lev refers
to firm leverage, Growth refers to firm growth, Loss refers to net operating losses, CapInt refers to the intensity of firms’
capital assets, IntangInt refers to the intensity of firms’ intangible assets, CloseHeld refers to the closely-held shares,
DivPayout refers to dividend payout per share.
Controlcountry is set of control variables at a country level including LawSys refers to the country’s law origins, and IFRS
refers to the adoption of IFRS.
The variables are measured as follows;
Size = The natural logarithm of total assets;
CapInt = The ratio of gross property, plant, equipment and total assets;
IntangInt = The ratio of intangible assets and total assets;
Lev = The ratio of long-term debt liability and total assets;
Growth = The ratio of changes in net sale and total assets;
DivPayout = The ratio of dividends per share and earnings per share multiplied by 100;
CloseHeld = The percentage of number of closely held shares to common shares outstanding;
Loss = The dummy variable equal to 1 if the firm’s net income less than 1, and 0 otherwise;
IFRS = The dummy variable equal to 1 in the year and after when firms adopt IFRS, and 0 otherwise;
LawSys = The dummy variable equal to 1 if firms are in country complying with civil law and 0 otherwise.
Fixed Effectcountry, industry, year refer to country, industry, and year fixed effect: five countries, nine industries, and fourteen
years.

180
(b) Robustness tests
Tax avoidance on upward AEM subsamples
Using the signed discretionary accruals (both positive and negative sign) in the main test, the results
suggest that firms managing earnings through discretionary accruals employ a non-conforming
approach to increase book incomes and to decrease taxable income at the same time. To check the
robustness of the initial results, model (8) has been re-estimated with the positive signed AEM sub-
sample, which represents only the firms that engage in increased book income management. The
negative coefficients should be expected in order to confirm the main results. Indeed Table 4.5 reports
the negative and significant association between ETR and positive AEM for all measures: Jones (β =
-0.056, p < 0.01), MoJones (β = -0.039, p < 0.01), Matched_Jones (β = -0.021, p < 0.01),
Matched_Jones (β = -0.020, p < 0.01). All results consistent with the main test and provide further
support for the hypothesis of a non-conforming earnings management approach for the purpose of
tax liability reduction. For other firm and country-specific control variables, the results show
consistently with those in the main tests both in term of direction and magnitude of the regression
coefficient.
Regression results based on a different level of tax avoidance
In analysing firms that engage in different levels of tax avoidance, all sample firms are partitioned
into 12 different categories with equal interval value of 0.05 between each bin (except the ETRs in
the first bin which is ranged from 0 to 0.15) according to the level of annual GAAP ETR. The samples
with ETR above 0.70 are excluded from the analyses because such particularly high ETRs do not
allow for a sound economic interpretation (Kubata et al., 2013). Then, the baseline regressions are re-
estimated separately for the sample in each bin. In particular, the ETRs are regressed on the
aggregated proxy of AEM and REM with controlling of the effect from country, industry, and year
indicators. Table 4.6 presents the results of regression investigated based on the GAAP ETR
partitioned firms. The results are qualitatively similar to that of baseline regressions, supporting the
main analysis of the association between tax avoidance and earnings management through AEM and
REM. More precisely, the ETRs in the first interval ranging from 0-0.15 show the strong negative
association between ETR and earnings management through AEM, and the strong positive
association between ETR and REM for the sample with the highest number of observations (equal to
7,063) and high value of the adjusted R2 (equal to 54.2% in both models). This can be interpreted that

181
firms with relatively high levels of tax avoidance (as reflected by particularly low ETRs) appear to
manage book income upward and taxable income downward at the same time through discretionary
accruals. However, they seem to use real-activities earnings management to only increase book
income and trade-off such benefit with the higher cost of tax payment (as reflected by higher ETRs).
Endogeneity concerns
In general, the problem of endogeneity occurs when an explanatory variable in a regression is
correlated with the regression’s disturbance term, which possibly arises from (i) omitted variables,
(ii) reverse causality, and (iii) measurement error (Robert and Whited, 2012). This problem inherent
in the OLS by giving the unbiased and consistent estimates of the causal effect of an explanatory
variable on an outcome (Bound et al., 1995; Reed, 2015). In mitigating this concern, this study repeats
the main analysis (the Equation 14) using instrumental variables (IV) with the Two-Stage Least
Squares (2SLS) estimation and employing lagged values of the endogenous explanatory variable as
instruments, thought to have no direct association with the outcome (Reed, 2015). The results are
consistent with the OLS results reported in Table 4.7. To ensure the endogeneity problem of CSR
variables, the null hypothesis testing that the AEM and REM variables are exogenous are estimated.
Both Durbin test and Wu-Hausman test report a very small p-value which suggests rejecting the null
hypothesis, and the model is correct in treating AEM and REM variables as endogenous variables.
Further, all the R2 statistics in the first-stage regression to confirm the relevance of instrumental
variables are relatively high, suggesting that the instruments are sufficiently correlated with AEM
and REM variables. Therefore, they do not imply a weak-instrument problem.

182
Table 4.5 Regression results for tax avoidance and sub-sample of AEM
Variables
Exp. Sign One-year ETR
Measure of Tax Avoidance
Positive AEM:
Jones (-) -0.056 ***
(0.009)
MoJones (-) -0.039 ***
(0.008)
Matched_Jones (-) -0.020 ***
(0.005)
Matched_MoJones (-) -0.021 ***
(0.005)
Controls Yes Yes Yes Yes
FE: Country, Industry, Year Yes Yes Yes Yes
Constant 0.165 *** 0.135 *** 0.218 *** 0.218
(0.021) (0.020) (0.015) (0.014) ***
Adj. R2 0.200 0.164 0.208 0.211
F 41.649 34.319 74.48 77.999
N 9280 8308 13442 13567
Robust standard errors clustered at the firm level are in parentheses.
*, ** and *** indicate the level of significance at p<0.1, p<0.05, and p<0.01, respectively, using two-tailed tests.
The table reports regression results of the following fixed-effect model using OLS estimation with robustness of standard
errors:
𝑇𝑎𝑥𝐴𝑣𝑜𝑖𝑑𝑖,𝑡 = 𝛼0 + 𝛼1𝐸𝑀𝑖,𝑡 + ∑ 𝛼𝑛
9
𝑛=2
𝐶𝑜𝑛𝑡𝑟𝑜𝑙𝑖,𝑡𝑓𝑖𝑟𝑚
+ ∑ 𝛼𝑛
11
𝑛=10
𝐶𝑜𝑛𝑡𝑟𝑜𝑙𝑖,𝑡𝑐𝑜𝑢𝑛𝑡𝑟𝑦
+ ∑ 𝛼𝑛
16
𝑛=12
𝐹𝑖𝑥𝑒𝑑 𝐸𝑓𝑓𝑒𝑐𝑡𝑖,𝑡𝑐𝑜𝑢𝑛𝑡𝑟𝑦
+ ∑ 𝛼𝑛
25
𝑛=17
𝐹𝑖𝑥𝑒𝑑 𝐸𝑓𝑓𝑒𝑐𝑡𝑖,𝑡𝑖𝑛𝑑𝑢𝑠𝑡𝑟𝑦
+ ∑ 𝛼𝑛
37
𝑛=26
𝐹𝑖𝑥𝑒𝑑 𝐸𝑓𝑓𝑒𝑐𝑡𝑖,𝑡𝑦𝑒𝑎𝑟
+ 휀𝑖,𝑡
The variables are as described in Table 4.4.

183
Table 4.6 Regression results based on the ETR subsamples
Bin No.
N
ETR range AEM REM
Coef. Adj. R2 Coef. Adj. R2
1 7063 0.00-0.15 -0.008 *** 0.542
0.036 *** 0.542
(0.004)
(0.009)
2 3494 0.15-0.20 -0.003 *** 0.057
0.007 *** 0.057
(0.001)
(0.002)
3 3040 0.20-0.25 0.001 *** 0.015
0.003 *** 0.015
(0.001)
(0.002)
4 3314 0.25-0.30 -0.003 ** 0.078
0.003 * 0.077
(0.001)
(0.002)
5 3332 0.30-0.35 0.001
0.041
0.001
0.041
(0.001)
(0.002)
6 1312 0.35-0.40 -0.006 *** 0.04
0.007 ** 0.037
(0.002)
(0.003)
7 523 0.40-0.45 -0.001
0.001
0.004
0.003
(0.003)
(0.005)
8 280 0.45-0.50 -0.001
0.054
-0.005
0.056
(0.004)
(0.008)
9 198 0.50-0.55 -0.007
0.022
0.016
0.019
(0.006)
(0.012)
10 144 0.55-0.60 0.002
0.065
-0.003
0.065
(0.006)
(0.013)
11 109 0.60-0.65 -0.009
0.013
0.001
0.023
(0.010)
(0.020)
12 83 0.65-0.70 0.020 ** 0.092
0.007
0.014
(0.009) (0.016)
Robust standard errors clustered at the firm level are in parentheses.
*, ** and *** indicate the level of significance at p<0.1, p<0.05, and p<0.01, respectively, using two-tailed tests.
The following regressions are estimated cross-sectionally with a fixed-effect model for the sample of different bins of
ETR value. The ordinary least square (OLS) is used with firm-level clustered standard errors for the estimation of the p-
values.
𝑇𝑎𝑥𝐴𝑣𝑜𝑖𝑑𝑖,𝑡 = 𝛼0 + 𝛼1𝐸𝑀𝑖,𝑡 + ∑ 𝛼𝑛
9
𝑛=2
𝐶𝑜𝑛𝑡𝑟𝑜𝑙𝑖,𝑡𝑓𝑖𝑟𝑚
+ ∑ 𝛼𝑛
11
𝑛=10
𝐶𝑜𝑛𝑡𝑟𝑜𝑙𝑖,𝑡𝑐𝑜𝑢𝑛𝑡𝑟𝑦
+ ∑ 𝛼𝑛
16
𝑛=12
𝐹𝑖𝑥𝑒𝑑 𝐸𝑓𝑓𝑒𝑐𝑡𝑖,𝑡𝑐𝑜𝑢𝑛𝑡𝑟𝑦
+ ∑ 𝛼𝑛
25
𝑛=17
𝐹𝑖𝑥𝑒𝑑 𝐸𝑓𝑓𝑒𝑐𝑡𝑖,𝑡𝑖𝑛𝑑𝑢𝑠𝑡𝑟𝑦
+ ∑ 𝛼𝑛
37
𝑛=26
𝐹𝑖𝑥𝑒𝑑 𝐸𝑓𝑓𝑒𝑐𝑡𝑖,𝑡𝑦𝑒𝑎𝑟
+ 휀𝑖,𝑡
The variables are as described in Table 4.4

184
Table 4.7 Tax avoidance and earnings management using 2SLS estimation
Variables Exp.
Sign
One-year ETR (measure of tax avoidance)
2SLS Estimation
Accrual-based
management: (-)
Jones -0.108 ***
(0.013)
MoJones
-0.094 ***
(0.011)
Matched-
Jones
-0.024 **
(0.010)
Matched-
MoJones
-0.024 **
(0.009)
Real-activity
management: (+)
AbnOCF
0.136 ***
(0.026)
AbnProd
0.350 ***
(0.089)
Controls
included Yes
Yes
Yes
Yes
Yes
Yes
Fixed Effects:
Cntr, Inds, Yr Yes
Yes
Yes
Yes
Yes
Yes
Constant 0.131 *** 0.113 *** 0.221 *** 0.219 *** 0.222 *** 0.207 ***
(0.016)
(0.017)
(0.012)
(0.012)
(0.012)
(0.015)
Adj. R2 0.187
0.193
0.195
0.195
0.184
0.011
Wald Chi2 2955.5 *** 2975.3 *** 2743.3 *** 2742.0 *** 2985.4 *** 2386.3 ***
Tests of
endogeneity:
Durbin chi2 34.796 *** 29.564 *** 0.023
0.008
16.583 *** 21.772 ***
Wu-Hausman
F 35.233 *** 29.925 *** 0.023
0.008
16.379 *** 21.823 ***
First-stage
regression:
R2 0.423
0.549
0.234
0.253
0.301
0.578
Adj. R2 0.422
0.549
0.233
0.252
0.300
0.577
Part. R2 0.117
0.169
0.16
0.162
0.116
0.004
F 1260.5 *** 1986.2 *** 990.18 *** 1017.4 *** 874.29 *** 33.816 ***
N 23124 23124 23124 23124 23124 23124
Robust standard errors clustered at the firm level are in parentheses.
*, ** and *** indicate the level of significance at p<0.1, p<0.05, and p<0.01, respectively, using two tailed tests.

185
(c) Additional analysis
As suggested by institutional theory, the way corporations are governed varies across countries due
to a variation of the motives of managers, shareholders, and other key stakeholders. All these factors
are driven by the long-standing, historically entrenched institutions (Matten & Moon, 2008) which
focus on the role of economic, political, and cultural context (Baughn et al., 2007). Therefore, the
association between tax avoidance and earnings management may vary among countries in the
BRICS group. The main regression model is re-estimated with the data of each country separately.
Table 4.8 reports the regression results for the relationship between tax avoidance and earnings
management at the country level. The findings show consistent results with the main findings only
when the models are estimated with the sample data in India and China. Specifically, the coefficients
on AEM measures are negatively and significantly (β_Jones = -0.026, p < 0.01; β_MoJones = -0.029,
p < 0.01; β_Matched_Jones = -0.008, p < 0.01; β_Matched_MoJones = -0.009, p < 0.1 for India, and
β_Jones = -0.031, p < 0.01; β_MoJones = -0.034, p < 0.01; β_Matched_Jones = -0.035, p < 0.01;
β_Matched_MoJones = -0.035, p < 0.1 for China) associated with annual GAAP ETR, but the
coefficients on REM measures present the positively and significantly (β_AbnOCF = 0.016, p < 0.01,
β_AbnProd = 0.015, p < 0.01 for India, and β_AbnOCF = 0.066, p < 0.01, β_AbnProd = 0.057, p <
0.01 for China) with annual GAAP ETR. Therefore, it confirms that firms domiciled in India and
China use non-conforming techniques to manage discretionary accruals which are able to increase
book incomes (higher discretionary accruals) and decrease taxable incomes (lower the effective tax
rate) at the same time (Desai, 2002; Frank et al., 2009; Hanlon et al., 2005; Manzon & Plesko, 2002).
For firms using real-activities earnings management techniques, managers of the firms need to trade-
off between taxable income and book income between as REM is conforming techniques where the
higher income increasing leads to the higher effective tax rate.
For firms domiciled in Brazil, Russia, and South Africa, no relationship between tax avoidance and
earnings management exists in the setting of this study. A possible explanation for this is that metric
of tax avoidance used in these jurisdictions is only based on taxes on income, while the overall firm’s
tax burden includes other federal levies (at the state and municipal levels), all of which vary greatly
based on the main sector of firm’s activity.
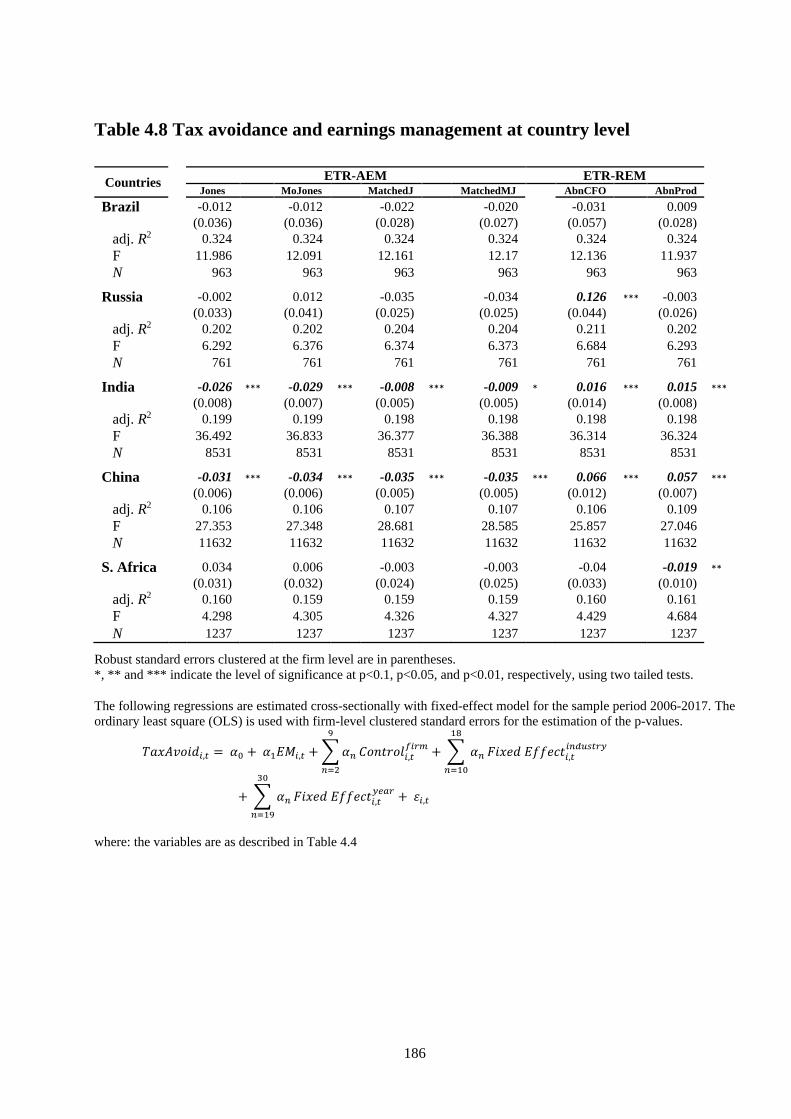
186
Table 4.8 Tax avoidance and earnings management at country level
Countries ETR-AEM ETR-REM
Jones MoJones MatchedJ MatchedMJ AbnCFO AbnProd
Brazil -0.012 -0.012 -0.022 -0.020 -0.031 0.009
(0.036) (0.036) (0.028) (0.027) (0.057) (0.028)
adj. R2 0.324 0.324 0.324 0.324 0.324 0.324
F 11.986 12.091 12.161 12.17 12.136 11.937
N 963 963 963 963 963 963
Russia -0.002 0.012 -0.035 -0.034 0.126 *** -0.003
(0.033) (0.041) (0.025) (0.025) (0.044) (0.026)
adj. R2 0.202 0.202 0.204 0.204 0.211 0.202
F 6.292 6.376 6.374 6.373 6.684 6.293
N 761 761 761 761 761 761
India -0.026 *** -0.029 *** -0.008 *** -0.009 * 0.016 *** 0.015 ***
(0.008) (0.007) (0.005) (0.005) (0.014) (0.008) adj. R2 0.199 0.199 0.198 0.198 0.198 0.198 F 36.492 36.833 36.377 36.388 36.314 36.324 N 8531 8531 8531 8531 8531 8531 China -0.031 *** -0.034 *** -0.035 *** -0.035 *** 0.066 *** 0.057 ***
(0.006) (0.006) (0.005) (0.005) (0.012) (0.007) adj. R2 0.106 0.106 0.107 0.107 0.106 0.109 F 27.353 27.348 28.681 28.585 25.857 27.046 N 11632 11632 11632 11632 11632 11632 S. Africa 0.034 0.006 -0.003 -0.003 -0.04 -0.019 **
(0.031) (0.032) (0.024) (0.025) (0.033) (0.010) adj. R2 0.160 0.159 0.159 0.159 0.160 0.161
F 4.298 4.305 4.326 4.327 4.429 4.684
N 1237 1237 1237 1237 1237 1237
Robust standard errors clustered at the firm level are in parentheses.
*, ** and *** indicate the level of significance at p<0.1, p<0.05, and p<0.01, respectively, using two tailed tests.
The following regressions are estimated cross-sectionally with fixed-effect model for the sample period 2006-2017. The
ordinary least square (OLS) is used with firm-level clustered standard errors for the estimation of the p-values.
𝑇𝑎𝑥𝐴𝑣𝑜𝑖𝑑𝑖,𝑡 = 𝛼0 + 𝛼1𝐸𝑀𝑖,𝑡 + ∑ 𝛼𝑛
9
𝑛=2
𝐶𝑜𝑛𝑡𝑟𝑜𝑙𝑖,𝑡𝑓𝑖𝑟𝑚
+ ∑ 𝛼𝑛
18
𝑛=10
𝐹𝑖𝑥𝑒𝑑 𝐸𝑓𝑓𝑒𝑐𝑡𝑖,𝑡𝑖𝑛𝑑𝑢𝑠𝑡𝑟𝑦
+ ∑ 𝛼𝑛
30
𝑛=19
𝐹𝑖𝑥𝑒𝑑 𝐸𝑓𝑓𝑒𝑐𝑡𝑖,𝑡𝑦𝑒𝑎𝑟
+ 휀𝑖,𝑡
where: the variables are as described in Table 4.4

187
4.6. Conclusion
This study attempts to fill the gap in the literature by exploring the relationship between tax avoidance
and earnings management in emerging markets, and empirically analysing such strategies both in
terms of discretion made on accruals and operational decision on real activities. Using a large sample
of firms domiciled in Brazil, Russia, India, China, and South Africa (BRICS), the main result shows
that firms use a non-conforming approach to manage earnings to increase book income, and to reduce
taxable income in the same accounting period through the technique of accruals discretion, consistent
with prior studies in the developed economies (e.g., Desai, 2002; Frank et al., 2009).
On the contrary, the technique of real-activities alteration provides a piece of additional evidence as
the results show that firms with a high level of real-activities earnings management are likely to pay
higher tax, suggesting that tax avoidance and real-activities management are subject to the
conforming approach where firms may need to trade-off between increasing book income and
decreasing taxable income. These results support the hypothesis that managers of firms use
conforming techniques to manage earnings so that the higher book income, the higher taxable income.
This finding is consistent with Zang (2012)’s argument indicating that REM is costly due to tax
incentives because the practices of REM has direct cash flow effect in the current period and thereby
affecting the level of tax liabilities in the same direction in the same period. However, these results
hold only with the sample from India and China when the models are tested at the country level.
Nonconformity between financial accounting standards and corporate tax regulation allows tax
planning by firms to manage earnings, especially through discretion on accrual transactions. As each
member of BRICS comply with international accounting standards, i.e. IFRS, which are argued to
reduce the level of book-tax conformity, it is important for standard setters to have a better
understanding as to what extent earnings management is positively related to tax avoidance in the
context of emerging markets. This study recommends that the high level of accrual-based earnings
management could be used as a mechanism for tax avoidance. Therefore, the findings provide
important implications for policymakers who seek to identify the conditions under which tax
avoidance is more likely to be aggressive and suggests for them to take tax effects into account when
developing and revising accounting standards. Finally, this study recommends analysts and investors
who are interested in firms' tax avoidance activities and directly use the accounting numbers to
evaluate the extent of tax avoidance when making investment decisions to adjust their portfolios.
Awareness of firms' earnings management practices may help to investigate whether firms also
188
participate in tax avoidance practices. This study is subject to the following limitations: First, the
sample is limited to publicly listed firms and limited to only five countries as the representatives of
emerging countries. Second, the measures of tax avoidance (ETR) are based on external financial
statement data and not financial data submitted to the tax authorities. Third, the measure of REM
excludes expenditure discretion due to missing data; hence, the findings may not be fully comparable
to studies investigating the same or similar aspects that use different measures. Therefore, future
research on the relationship between tax avoidance and earnings management in emerging economies
should consider expanding the sample size and using more countries. Future studies could also
investigate whether firms that are exposed as tax avoiders used accrual-based earnings management
exclusively to manage earnings or they use a combination of both accrual-based earnings
management and real activities manipulation for the purpose of tax reduction.
References
Ahmed, A. S., Neel, M., & Wang, D. (2013). Does mandatory adoption of IFRS improve accounting
quality? Preliminary evidence. Contemporary Accounting Research, 30(4), 1344–1372.
https://doi.org/10.1111/j.1911-3846.2012.01193.x
Amiram, D., Bauer, A. M., & Frank, M. M. (2013). Corporate Tax Avoidance and Managerial
Incentives Generated by Shareholder Dividend Tax Policy. CAAA Annual Conference and the
European Accounting Association.
Anagnostopoulou, S. C., & Tsekrekos, A. E. (2015). Earnings management in fi rms seeking to be
acquired. The British Accounting Review, 47, 351–375.
https://doi.org/10.1016/j.bar.2014.07.001
Armstrong, C. S., Blouin, J. L., Jagolinzer, A. D., & Larcker, D. F. (2015). Corporate Governance ,
Incentives, and Tax Avoidance. Journal of Accounting and Economics, 60(1), 1–17.
https://doi.org/10.1016/j.jacceco.2015.02.003
Atwood, T. J., Drake, M. S., Myers, J. N., & Myers, L. a. (2012). Home country tax system
characteristics and corporate tax avoidance: International evidence. The Accounting Review,
87(6), 1831–1860. https://doi.org/10.2308/accr-50222
Atwood, T. J., Drake, M. S., & Myers, L. A. (2010). Book-Tax Conformity, Earnings Persistence and
the Association between Earnings and Future Cash Flows. Journal of Accounting and
Economics, Forthcoming, 1–16.
Ayers, B. C., Jiang, J. (Xuefeng), & Yeung, P. E. (2006). Discretionary Accruals and Earnings
Management : An Analysis of Pseudo Earnings Targets. The Accounting Review, 81(3), 617–
652.

189
Badertscher, B. A. (2011). Overvaluation and the Choice of Alternative Earnings Management
Mechanisms. The Accounting Review, 86(5), 1491–1518. https://doi.org/10.2308/accr-10092
Badertscher, B. A., Katz, S. P., & Rego, S. O. (2013). The separation of ownership and control and
corporate tax avoidance. Journal of Accounting and Economics, 56(2–3), 228–250.
https://doi.org/10.1016/j.jacceco.2013.08.005
Badertscher, B., Katz, S. P., & Rego, S. O. (2010). The Impact of Private Equity Ownership on
Portfolio Firms’ Corporate Tax Planning.
Bartov, E., Gul, F. A., & Tsui, J. S. L. (2000). Discretionary-accruals models and audit qualification.
Journal of Accounting and E, 30(3), 421–452.
Baughn, C. C., Bodie, N. L., & McIntosh, J. C. (2007). Corporate social and environmental
responsibility in Asian countries and other geographical regions. Corporate Social
Responsibility and Environmental Management, 14(4), 189–205.
https://doi.org/10.1002/csr.160
Beatty, A., & Harris, D. G. (1998). The Effects of Taxes , Agency Costs and Information Asymmetry
on Earnings Management : A Comparison of Public and Private Firms. Review of Accounting
Studies, 326(3), 299–326.
Belz, T., Hagen, D. Von, & Steffens, C. (2017). R&D Intensity and The Effective Tax Rate: A Meta-
Regression analysis. Journal of Economic Survey, 31(4), 988–1010.
https://doi.org/10.1111/joes.12181
Bereskin, F. L., Hsu, P.-H., & Rotenberg, W. (2018). The Real Effects of Real Earnings
Management : Evidence from Innovation. Contemporary Accounting Research, 35(1), 525–557.
https://doi.org/10.1111/1911-3846.12376
Bhattacharya, U., Daouk, H., & Walker, M. (2003). The World Price of Earnings Management. In
The Accounting Review (Vol. 78, Issue 3).
http://www.aaajournals.org/doi/abs/10.2308/accr.2003.78.3.641%5Cnhttp://aaapubs.org/doi/ab
s/10.2308/accr.2003.78.3.641
Bhojraj, S., Hribar, P., Picconi, M., & McInnis, J. (2009). Making Sense of Cents : An Examination
of Firms That Marginally Miss or Beat Analyst Forecasts. The Journal of Finance, 64(5), 2361–
2388.
Blaylock, B., Gaertner, F., & Shevlin, T. (2015). The association between book-tax conformity and
earnings management. Review of Accounting Studies, 20(1), 141–172.
https://doi.org/10.1007/s11142-014-9291-x
Blaylock, B., Shevlin, T., & Wilson, R. J. (2012). Tax Avoidance, Large Positive Temporary Book-
Tax Differences, and Earnings Persistence. The Accounting Review, 87(1), 91–120.
https://doi.org/10.2308/accr-10158

190
Blkasem Elhaj, E., & Mansor, N. (2019). Earnings Management In Developed And Developing
Countries: A Review Of Recent Literature. American Based Research Journal, 8(2019–01), 14–
26. http://www.abrj.org14
Bound, J., Jaeger, D. A., & Baker, R. M. (1995). Problems with Instrumental Variables Estimation
When the Correlation Between the Instruments and the Endogeneous Explanatory Variable is
Weak. Journal of the American Statistical Association, 90(430), 443–450.
Braga, R. N. (2017.) Effects of IFRS adoption on tax avoidance. Revista Contabilidade & Finanças,
28(75), 407-424.
Campbell, J. L. (2007). Why Would Corporations Behave in Socially Responsible Ways? An
Institutional Theory of Corporate Social Responsibility. The Academy of Management Review,
32(3), 946–967.
Campbell, J. L., Lindberg, L., & Campbell, J. L. (1991). The evolution of governance regimes.
Morality, Rationality, and Efficiency: New Perspectives on Socio-economics, 227.
Chan, K. Hung, Lin, K. Z., & Mo, P. L. L. (2010). Will a departure from tax-based accounting
encourage tax noncompliance? Archival evidence from a transition economy. Journal of
Accounting and Economics, 50(1), 58–73. https://doi.org/10.1016/j.jacceco.2010.02.001
Chan, Koon Hung, Lin, K. Z., & Tang, F. (2013). Tax effects of book-tax conformity, financial
reporting incentives and firm size. Journal of International Accounting Research, 12(2), 1–25.
https://doi.org/10.2308/jiar-50404
Chatty, R., & Saez, E. (2005). Dividend Taxes and Corporate Behavior: Evidence from the 2003
Dividend Tax Cut. Oxford Journal, 120(3), 791–833.
Chen, E., & Gavious, I. (2017). The roles of book-tax conformity and tax enforcement in regulating
tax reporting behaviour following International Financial Reporting Standards adoption.
Accounting and Finance, 57, 681–699. https://doi.org/10.1111/acfi.12172
Chen, K., & Chu, C. Y. C. (2005). Income Tax Evasion Manipulation: a Model of Corporate. The
RAND Journal of Economics, 36(1), 151–164.
Chen, S., Chen, X., Cheng, Q., & Shevlin, T. (2010). Are family firms more tax aggressive than non-
family firms? Journal of Financial Economics, 95(1), 41–61.
https://doi.org/10.1016/j.jfineco.2009.02.003
Chen, C., Huang, S., & Fan, H. (2012). Complementary association between real activities and
accruals-based manipulation in earnings reporting. Journal of Economic Policy Reform, 15(2),
93–108. https://doi.org/10.1080/17487870.2012.667965
Christensen, D. M., Dhaliwal, D. S., Boivie, S., & Graffin, S. D. (2015). Top Management
Conservatism and Corporate Risk Strategies: Evidence from Managers’ Personal Political
Orientation and Corporate Tax Avoidance. Strategic Management Journal, 36(12), 1918–1938.
https://doi.org/10.1002/smj
191
Clarkson, P. M., Li, Y., Richardson, G. D., & Vasvari, F. P. (2008). Revisiting the relation between
environmental performance and environmental disclosure: An empirical analysis. Accounting,
Organizations and Society, 33(4–5), 303–327. https://doi.org/10.1016/j.aos.2007.05.003
Cohen, D. A., Dey, A., & Lys, T. Z. (2008). Real and Accrual-Based Earnings Management in the
Pre- and Post-Sarbanes-Oxley Periods. The Accounting Review, 83(3), 757–787.
Cohen, D. A., & Zarowin, P. (2010). Accrual-based and real earnings management activities around
seasoned equity offerings. Journal of Accounting and Economics, 50(1), 2–19.
https://doi.org/10.1016/j.jacceco.2010.01.002
Crocker, K. J., & Slemrod, J. (2005). Corporate tax evasion with agency costs. Journal of Public
Economics, 89(9–10), 1593–1610. https://doi.org/10.1016/j.jpubeco.2004.08.003
Davidson, R., Gelardi, A., & Li, F. (1996). Analysis of the conceptual framework of China's new
accounting system. Accounting Horizons, 10(1), 58–74.
Dechow, P., & Dichev, I. D. (2002). The Quality of Accruals and Earings: The Role of Accruals
Estimation Errors. The Accounting Review, 77(2002), 35–59.
https://doi.org/10.2308/accr.2002.77.s-1.61
Dechow, P. M. (2003). Why Are Earnings Kinky ? An Examination of the Earnings Management
Explanation. 355–384.
Dechow, P. M., Sloan, R. G., & Sweeney, A. P. (1995). Detecting Earnings Management. The
Accounting Review, 70(2), 193–225. https://doi.org/10.2307/248303
Desai, M. A. (2002). The Corporate Profit Base, Tax Sheltering Activity, and the Changing Nature
of Employee Compensation.
Desai, M. A., & Dharmapala, D. (2006). Corporate tax avoidance and high-powered incentives.
Journal of Financial Economics, 79(1), 145–179. https://doi.org/10.1016/j.jfineco.2005.02.002
Desai, M. A., & Dharmapala, D. (2007). Taxes, institutions and foreign diversification opportunities.
Desai, M. A., & Dharmapala, D. (2009). Corporate tax avoidance and firm value. Review of
Economics and Statistics, 91(3), 537–546. https://doi.org/10.1162/rest.91.3.537
Desai, M. A., Dyck, A., & Zingales, L. (2007). Theft and taxes. Journal of Financial Economics,
84(3), 591–623. https://doi.org/10.1016/j.jfineco.2006.05.005
Desai, Ma, & Dharmapala, D. (2009). Earnings management and corporate tax shelters. National Tax
Journal, 62(1), 169–186. https://doi.org/http://dx.doi.org/10.2139/ssrn.884812
Desai, Mihir. (2005). The Degradation of Reported Corporate Profit. Journal of Economic
Perspectives, 19(4), 171–192. https://doi.org/10.2307/2225251
Dichev, I. D., Graham, J. R., Harvey, C. R., & Rajgopal, S. (2013). Earnings quality: Evidence from
the field. Journal of Accounting and Economics, 56(2–3), 1–33.

192
https://doi.org/10.1016/j.jacceco.2013.05.004
Drake, K. D., Lusch, S. J., & Stekelberg, J. (2019). Does Tax Risk Affect Investor Valuation of Tax
Avoidance? Journal Accounting , Auditing & Finance, 34(1), 151–176.
https://doi.org/10.1177/0148558X17692674
Dunbar, A., Higgins, D. M., Phillips, J. D., & Plesko, G. A. (2010). What Do Measures of Tax
Aggressive Measure? Proceedings of the National Tax Association Annual Conference on
Taxation, 18–26.
Dyck, A., & Zingales, L. (2004). Private Benefits of Control: An International Comparison. The
Journal of Finance, 59(2), 537–600.
Dyreng, S. D., Hanlon, M., & Maydew, E. L. (2008). Long-run corporate tax avoidance. Accounting
Review, 83(1), 61–82.
Enomoto, M., Kimura, F., & Yamaguchi, T. (2015). Accrual-based and real earnings management:
An international comparison for investor protection. Journal of Contemporary Accounting &
Economics, 11(3), 183–198. https://doi.org/10.1016/j.jcae.2015.07.001
Francis, B., Hasan, I., & Li, L. (2016). Evidence for the Existence of Downward Real-Activity
Earnings Management. Journal Accounting , Auditing & Finance, 31(2), 212–248.
https://doi.org/10.1177/0148558X15582086
Francis, J., LaFond, R., Olsson, P., & Schipper, K. (2005). The market pricing of accruals quality.
Journal of Accounting and Economics, 39(2), 295–327.
https://doi.org/10.1016/j.jacceco.2004.06.003
Frank, M. M., Lynch, L. J., & Rego, S. O. (2009). Tax reporting aggressiveness and its relation to
aggressive financial reporting. The Accounting Review, 84(2), 467–496.
https://doi.org/10.2308/accr.2009.84.2.467
Gaertner, F. B. (2014). CEO after-tax compensation incentives and corporate tax avoidance.
Contemporary Accounting Research, 31(4), 1077–1102. https://doi.org/10.1111/1911-
3846.12058
Gallemore, J., & Labro, E. (2015). The importance of the internal information environment for tax
avoidance. Journal of Accounting and Economics, 60(1), 149–167.
https://doi.org/10.1016/j.jacceco.2014.09.005
Gao, L., Yang, L. L., & Zhang, J. H. (2016). Corporate patents, R&D success, and tax avoidance.
Review of Quantitative Finance and Accounting, 47(4), 1063–1096.
https://doi.org/10.1007/s11156-015-0531-3
Gebhart, M. S. (2017). Measuring Corporate Tax Avoidance - An Analysis of Different Measures.
Junior Management Science, 3(2), 43–60. https://doi.org/10.5282/jums/v2i2pp43-60
Goncharov, I., & Zimmermann, J. (2006). Earnings Management when Incentives Compete : The
Role of Tax Accounting in Russia. Journal of International Accounting Research, 5(1), 41–65.

193
Graham, J. R., Hanlon, M., Shevlin, T., & Shroff, N. (2014). Incentives for Tax Planning and
Avoidance : Evidence from the Field. The Accounting Review, 89(3), 991–1023.
https://doi.org/10.2308/accr-50678
Graham, J. R., Harvey, C. R., & Rajgopal, S. (2005). The economic implications of corporate
financial reporting $. Journal of Accounting and E, 40, 3–73.
https://doi.org/10.1016/j.jacceco.2005.01.002
Graham, J. R., & Tucker, A. L. (2006). Tax shelters and corporate debt policy. Journal of Financial
Economics, 81(3), 563–594. https://doi.org/10.1016/j.jfineco.2005.09.002
Guenther, D. A. (1994). Tax Reform Act Earnings Management in Response to Corporate Tax Rate
Changes : Evidence from the 1986 Tax Reform Act. The Accounting Review, 69(1), 230–243.
Gunny, K. (2005). What Are the Consequences of Real Earnings Management ?
Gunny, K. A. (2010). The Relation Between Earnings Management Using Real Activities
Manipulation and Future Performance : Evidence from Meeting Earnings Benchmarks.
Contemporary Accounting Research, 27(3), 855–888. https://doi.org/10.1111/j.1911-
3846.2010.01029.x
Gupta, S., & Newberry, K. (1997). Determinants of the Variability in Corporate Effective Tax Rates:
Evidence from Longitudinal Data. Journal of Accounting and Public Policy, 16(1), 1–34.
Hanlon, M. (2005). The Persistence and Pricing of Earnings, Accruals, and Cash Flows When Firms
Have Large Book-Tax Differences. The Accounting Review, 80(1), 137–166.
http://www.jstor.org/stable/4093164%0Ahttp://www.jstor.org/%0Ahttp://www.jstor.org/action
/showPublisher?publisherCode=aaasoc.%0Ahttp://www.jstor.org
Hanlon, M., & Heitzman, S. (2010). A review of tax research. Journal of Accounting and Economics,
50(2–3), 127–178. https://doi.org/10.1016/j.jacceco.2010.09.002
Hanlon, M., Laplante, S. K., & Shevlin, T. (2005). Evidence for the possible informaiton loss of
conforming book income and taxable income. The Journal of Law & Economics, 48(2), 407–
442. https://doi.org/10.3868/s050-004-015-0003-8
Hanlon, M., & Shevlin, T. (2005). Book-Tax Conformity for Corporate Income: An Introduction to
the Issues. Tax Policy and the Economy, 19, 101–134.
Healy, P. M., and J. Wahlen. 1999. A review of the earnings management literature and its
implications for standard setting. Accounting Horizons, 13(4), 365–383.
Hope, O., Thomas, W. B., & Vyas, D. (2013). Financial Reporting Quality of U.S. Private and Public
Firms. The Accounting Review, 88(5), 1715–1742. https://doi.org/10.2308/accr-50494
Hu, N., Cao, Q., & Zheng, L. (2015). Listed Companies ’ Income Tax Planning and Earnings
Management : Based on China ’ s Capital Market. Journal of Industrial Engineering and
Management, 8(2), 417–434.
https://doi.org/http://dx.doi.org.ezaccess.library.uitm.edu.my/10.3926/jiem.1310

194
Hung, M., & Subramanyam, K. (2007). Financial statement effects of adopting international
accounting standards: The case of Germany. Review of Accounting Studies, 12(4), 21−48.
Huseynov, F., & Klamm, B. K. (2012). Tax avoidance , tax management and corporate social
responsibility. Journal of Corporate Finance, 18(4), 804–827.
https://doi.org/10.1016/j.jcorpfin.2012.06.005
Ipino, E., & Parbonetti, A. (2017). Mandatory IFRS adoption : the trade-off between accrual-based
and real earnings management. Accounting and Business Research, 47(1), 91–121.
https://doi.org/10.1080/00014788.2016.1238293
Jaafar, A., & Thornton, J. (2015). Tax havens and effective tax rates: An analysis of private versus
public european firms. The International Journal of Accounting, 50(4), 435–457.
https://doi.org/10.1016/j.intacc.2015.10.005
Jackson, A. B. (2018). Discretionary Accruals: Earnings Management.. or Not? Abacus, 54(2), 136–
153. https://doi.org/10.1111/abac.12117
Jones, J. J. (1991). Earnings Management During Import Relief Investigations. Journal of Accounting
Research, 29(2), 193. https://doi.org/10.2307/2491047
Joosten, C. (2012). Real Earnings Management and Accrual-based Earnings Management as
Substitutes. Tilburg University.
Karampinis, N. I., & Hevas, D. L. (2013). Effects of IFRS Adoption on Tax-induced Incentives for
Financial Earnings Management: Evidence from Greece. International Journal of Accounting,
48(2), 218–247. https://doi.org/10.1016/j.intacc.2013.04.003
Koester, A., Shevlin, T., & Wangerin, D. (2017). The Role of Managerial Ability in Corporate Tax
Avoidance The Role of Managerial Ability in Corporate Tax Avoidance. October 2018.
Koh, P. S. (2003). On the association between institutional ownership and aggressive corporate
earnings management in Australia. British Accounting Review, 35(2), 105–128.
https://doi.org/10.1016/S0890-8389(03)00014-3
Kothari, S. P., Leone, A. J., & Wasley, C. E. (2005). Performance matched discretionary accrual
measures. Journal of Accounting and Economics, 39(1), 163–197.
https://doi.org/10.1016/j.jacceco.2004.11.002
Kubata, A., Lietz, G., & Watrin, C. (2013). Does Corporate Tax Avoidance Impair Earnings
Informativeness? https://doi.org/10.2139/ssrn.2363873
Laguir, I., Staglianò, R., & Elbaz, J. (2015). Does corporate social responsibility affect corporate tax
aggressiveness? Journal of Cleaner Production, 107, 662–675.
https://doi.org/10.1016/j.jclepro.2015.05.059
Lanis, R., & Richardson, G. (2012). Corporate social responsibility and tax aggressiveness: An
empirical analysis. Journal of Accounting and Public Policy, 31(1), 86–108.
https://doi.org/10.1016/j.jaccpubpol.2011.10.006

195
La Porta, R., F. Lopez-De-Silanes, A. Shleifer, and R. Vishny. 1998. Law and finance. Journal of
Political Economy, 106,1113–1156.
Lietz, G. M. (2013). Determinants and Consequences of Corporate Tax Avoidance. In Ssrn.
https://doi.org/10.2139/ssrn.2363868
Lin, S., Riccardi, W., & Wang, C. (2012). Does accounting quality change following a switch from
U.S. GAAP to IFRS? Evidence from Germany. Journal of Accounting and Public Policy, 31(6),
641–657. https://doi.org/10.1016/j.jaccpubpol.2012.10.006
Lisowsky, P. (2010). Seeking Shelter: Empirically modeling tax shelters using financial statement
information. The Accounting Review, 85(5), 1693–1720.
https://doi.org/10.2308/accr.2010.85.5.1693
Lopes, B. A., & Walker, M. (2012). Asset revaluations , future fi rm performance and fi rm-level
corporate governance arrangements : New evidence from Brazil. The British Accounting Review,
44(2), 53–67. https://doi.org/10.1016/j.bar.2012.03.007
Manzon, G. B., & Plesko, G. A. (2002). The Relation Between Financial and Tax Reporting Measures
of Income. Tax Law Review, 55, 175–214. https://doi.org/10.2139/ssrn.264112
Markle, K. S., & Shackelford, D. A. (2012). Cross-country comparisons of corporate income taxes.
National Tax Journal, 65, 493–528.
Martinez, A. L., Passamani, R., & Teixeira, A. (2014). The Value Relevance of Book-Tax Differences
in Brazil. Australian Journal of Basic & Applied Sciences, 8(1), 479–489.
https://doi.org/10.2139/ssrn.2139429
Matten, D., & Moon, J. (2008). “Implicit” and “Explicit” CSR: A Conceptual Framework for a
Comparative Understanding of Corporate Social Responsibility. Academy of Management
Review, 33(2), 404–424. https://doi.org/10.5465/AMR.2008.<strong data-auto="strong_text"
xmlns:translation="urn:EBSCO-Translation">31193458</strong>
Mcnichols, M. F. (2000). Research design issues in earnings management studies (Vol. 19).
McNichols, M. F. (2002). The Quality of Accruals and Earings: The Role of Accruals Estimation
Errors. The Accounting Review, 77((Supplement)), 61–69.
https://doi.org/10.2308/accr.2002.77.s-1.61
McNichols, M. F., & Stubben, S. R. (2008). Does earnings management affect firms’ investment
decisions? The Accounting Review, 83(6), 1571–1603.
https://doi.org/10.2308/accr.2008.83.6.1571
Mcnichols, M., & Wilson, G. P. (1988). Evidence of Earnings Management from the Provision for
Bad Debts. Journal of Accounting Research, 26, 1–31.
Miiller, D., & Martinez, A. (2016). Book-Tax Difference, Earnings Management and Bond Ratings
in the Brazilian Market. Revista Universo Contábil, 12(3), 91–109.
https://doi.org/10.4270/ruc.2016323

196
Mills, L. F. (1998). Book-Tax Differences and Internal Revenue Service Adjustments. Journal of
Accounting Research, 36(2), 343–356.
Mills, L. F., & Newberry, K. J. (2001). The influence of tax and nontax costs on book-tax reporting
differences: Public and private firms. Journal of the American Taxation Association, 23(1), 1-
19.
Mills, L., Newberry, K., & Trautman, W. B. (2002). Trends in book-tax income and balance sheet
differences. Tax Note, August 19, 1109–1124.
Minnick, K., & Noga, T. (2010). Do Corporate Governance Characteristics in Fluence Tax
Management? Journal of Corporate Finance, 16, 703–718.
https://doi.org/10.1016/j.jcorpfin.2010.08.005
Minyailo, S. (2016). Russian Accounting & Audit: Recent Years Development. [online] Awara.
Available at: https://www.awaragroup.com/blog/doing-business-in-russia-accounting-and-
audit-in-russia-the-new-way/ [Accessed 17 Jun. 2019].
Monem, R. M. (2003). Earnings Management in Response to the Introduction of the Australian Gold
Tax. Contemporary Accounting Research, 20(4), 747–774.
Mukhlasin, M., & Anissa, N. (2018). Investor Perception of Tax Avoidance and Quality of Earnings
Information. Research Journal of Financial and Accounting, 9(12), 72–78.
Nakao, S. H., & Gray, S. J. (2018). The Impact of IFRS in Brazil: The Legacy of Mandatory Book-
tax Conformity. Australian Accounting Review, 28(87), 482–495.
https://doi.org/10.1111/auar.12223
Noor, R.D., Mastuki, N.A., Bardai, B. 2009. Book-Tax Difference and Value Relevance of Taxable
Income: Malaysian Evidence. Journal of Financial Reporting and Accounting, 7(2), 19-40.
Phillips, J. D. (2003). Corporate tax-planning Effectiveness: The role of compensation-based
incentives. The Accounting Review, 78(3), 847–874.
Phillips, J. D., Pincus, M. P. K., & Rego, S. O. (2003). Earnings Management: New Evidence Based
On Deferred Tax Expense. The Accounting Review, 78(2), 491–521.
https://doi.org/10.2139/ssrn.276997
Purina, M. (2015). Tax Accounting in the Russian Federation. Procedia Economics and Finance,
25(May), 127–133. https://doi.org/10.1016/S2212-5671(15)00719-4
Putri, A., Rohman, A., & Chariri, A. (2016). Tax Avoidance, Earnings Management and Corporate
Governance Mechanism (An Evidence From Indonesia). International Journal of Economic
Research, 13(4), 1931–1943.
Reed, W. R. (2015). On the Practice of Lagging Variables To Avoid Simultaneity. Oxford Bulletin of
Economics and Statistics, 77(6), 897–905.

197
Rego, S. O. (2003). Tax-avoidance activities of U.S. multinational corporations. Contemporary
Accounting Research, 20(4), 805–833. https://doi.org/10.1506/VANN-B7UB-GMFA-9E6W
Rego, S. O., & Wilson, R. (2012). Equity risk incentives and corporate tax aggressiveness. Journal
of Accounting Research, 50(3), 775–810. https://doi.org/10.1111/j.1475-679X.2012.00438.x
Rich, A. J. (2004). Ten Years Of Progress And Challenges. International Business and Economics
Research Journal, 3(2), 77–84.
Roberts, M. R. & Whited, T. M. (2012). Endogeneity in empirical corporate finance. In:
Constantinides, M., Harris, M. & Stulz, R. (Eds), Handbook of the Economics of finance, vol.
2, Amsterdam, Elsevier, 493-572.
Roychowdhury, S. (2006). Earnings management through real activities manipulation. Journal of
Accounting and Economics, 42(3), 335–370. https://doi.org/10.1016/j.jacceco.2006.01.002
Ruch, G. W., & Taylor, G. (2015). Accounting conservatism: A review of the literature. Journal of
Accounting Literature, 34, 17–38. https://doi.org/10.1007/s10551-011-0871-4
Schipper, K. 1989. Commentary on Earnings Management. Accounting Horizons, 3(4), 91-102
Scholes, M.S., Wilson, G.P., Wolfson M.A., 1992. “Firm’s responses to anticipated reductions in tax
rates: The Tax Reform Act of 1986” Journal of Accounting Research, 30, 161–185.
Seidman, J., & Stomberg, B. (2012). Stock-Based Compensation and Tax Sheltering: Are They
Negatively Related due to Incentives or Tax Benefits?
file://localhost/Users/christian/Documents/Papers/2011/Unknown/Seidman2011Stock-Based
Compensation and Tax Sheltering__1-49.pdf
Shackelford, D. A., & Shevlin, T. (2001). Empirical tax research in accounting: A discussion. Journal
of Accounting and Economics, 31(1–3), 321–387. https://doi.org/10.1016/S0165-
4101(01)00021-0
Slemrod, J. (2004). The Economics of Corporate Tax Selfishness. NBER Working Paper Series, 53,
1689–1699. https://doi.org/10.1017/CBO9781107415324.004
Steijvers, T., & Niskanen, M. (2014). Tax aggressiveness in private family firms: An agency
perspective. Journal of Family Business Strategy, 5(4), 347–357.
https://doi.org/10.1016/j.jfbs.2014.06.001
Sundvik, D. (2017). A review of earnings management in private firms in response to tax rate
changes. Nordic Tax Journal, 1, 151–161. https://doi.org/10.1515/ntaxj-2017-0011
Tang, Y., Chow, L., & Cooper, B. J. (2000). Accounting and finance in China: A review of current
practice. Asia: Sweet & Maxwell.

198
Tang, T. (2015). Does Book-Tax Conformity Deter Opportunistic Book and Tax Reporting? An
International Analysis. European Accounting Review, 24(3), 441–469.
Tang, T., & Firth, M. (2011). Can book-tax differences capture earnings management and tax
Management? Empirical evidence from China. International Journal of Accounting, 46(2), 175–
204. https://doi.org/10.1016/j.intacc.2011.04.005
Taylor, G., & Richardson, G. (2014). Incentives for corporate tax planning and reporting : Empirical
evidence from Australia. Journal of Contemporary Accounting & Economics, 10(1), 1–15.
https://doi.org/10.1016/j.jcae.2013.11.003
Trejo-pech, C. J. O., Weldon, R. N., & Gunderson, M. A. (2016). Earnings Management through
Specific Accruals and Discretionary Expenses : Evidence from U . S . Agribusiness Firms.
64(2006), 89–118. https://doi.org/10.1111/cjag.12063
Verbruggen, S., Christaens, J., & Mills, K. (2008). Earnings management: a literature review. HUB
Research Paper, 14.
Verhoef, G. (2012). Economic integration through knowledge integration. The impact of IFRS on the
globalisation of accounting firms and corporate business in South Africa. In Asia-Pacific
Economic and Business History Conference (pp. 1-5).
Wang, M., & Kong, D. (2011). Corporate Social Responsibility , Investor Behaviors , and Stock
Market Returns : Evidence from a Natural Experiment in China. 127–141.
https://doi.org/10.1007/s10551-010-0713-9
Watts, R., Zimmerman, J., 1986. In: Positive Accounting Theory. Prentice-Hall Inc.
Whitaker, C. (2005). Bridging the book-tax accounting gap. Yale Law Journal, 115(3), 680–726.
Wilson, R. J. (2009). An examination of corporate tax shelter participants. The Accounting Review,
84(3), 969–999. https://doi.org/10.2308/accr.2009.84.3.969
Wong, R. M. K., Lo, A. W. Y., & Firth, M. (2015). Managing Discretionary Accruals and Book-Tax
Differences in Anticipation of Tax Rate Increase: Evidence from China. Journal of International
Financial Management & Accounting, 26(2), 188–222.
Wrightsman, D. (1978). Tax Shield Valuation and the Capital Structure Decision. The Journal of
Finance, 33(2), 650–656.
Yermack, D. (2004). Remuneration , Retention , and Reputation Incentives for outside Directors. The
Journal of Finance, 59(5), 2281–2308.
Zang, A. Y. (2012). Evidence on the Trade-Off between Real Activities Manipulation and Accrual-
Based Earnings Management. American Accounting Association Annual Meeting-Tax
Concurrent Sessions, 87(2), 675–703. https://doi.org/10.2308/accr-10196
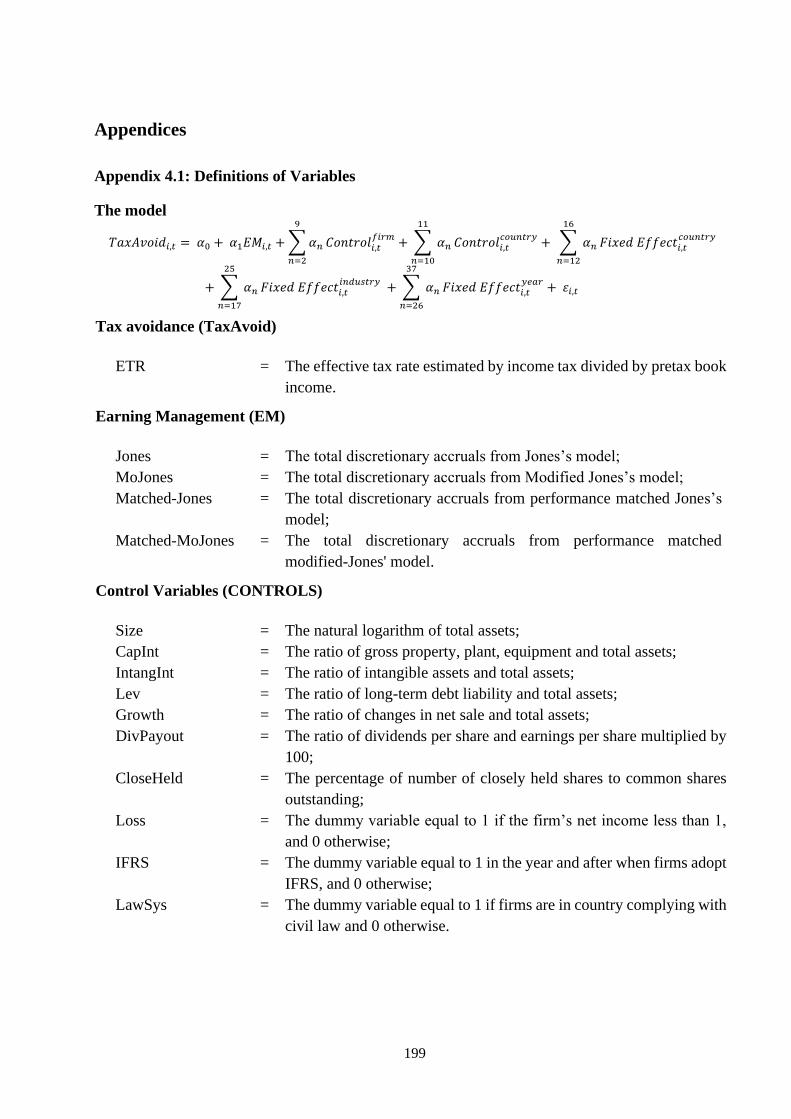
199
Appendices
Appendix 4.1: Definitions of Variables
The model
𝑇𝑎𝑥𝐴𝑣𝑜𝑖𝑑𝑖,𝑡 = 𝛼0 + 𝛼1𝐸𝑀𝑖,𝑡 + ∑ 𝛼𝑛
9
𝑛=2
𝐶𝑜𝑛𝑡𝑟𝑜𝑙𝑖,𝑡𝑓𝑖𝑟𝑚
+ ∑ 𝛼𝑛
11
𝑛=10
𝐶𝑜𝑛𝑡𝑟𝑜𝑙𝑖,𝑡𝑐𝑜𝑢𝑛𝑡𝑟𝑦
+ ∑ 𝛼𝑛
16
𝑛=12
𝐹𝑖𝑥𝑒𝑑 𝐸𝑓𝑓𝑒𝑐𝑡𝑖,𝑡𝑐𝑜𝑢𝑛𝑡𝑟𝑦
+ ∑ 𝛼𝑛
25
𝑛=17
𝐹𝑖𝑥𝑒𝑑 𝐸𝑓𝑓𝑒𝑐𝑡𝑖,𝑡𝑖𝑛𝑑𝑢𝑠𝑡𝑟𝑦
+ ∑ 𝛼𝑛
37
𝑛=26
𝐹𝑖𝑥𝑒𝑑 𝐸𝑓𝑓𝑒𝑐𝑡𝑖,𝑡𝑦𝑒𝑎𝑟
+ 휀𝑖,𝑡
Tax avoidance (TaxAvoid)
ETR = The effective tax rate estimated by income tax divided by pretax book
income.
Earning Management (EM)
Jones = The total discretionary accruals from Jones’s model;
MoJones = The total discretionary accruals from Modified Jones’s model;
Matched-Jones = The total discretionary accruals from performance matched Jones’s
model;
Matched-MoJones = The total discretionary accruals from performance matched
modified-Jones' model.
Control Variables (CONTROLS)
Size = The natural logarithm of total assets;
CapInt = The ratio of gross property, plant, equipment and total assets;
IntangInt = The ratio of intangible assets and total assets;
Lev = The ratio of long-term debt liability and total assets;
Growth = The ratio of changes in net sale and total assets;
DivPayout = The ratio of dividends per share and earnings per share multiplied by
100;
CloseHeld = The percentage of number of closely held shares to common shares
outstanding;
Loss = The dummy variable equal to 1 if the firm’s net income less than 1,
and 0 otherwise;
IFRS = The dummy variable equal to 1 in the year and after when firms adopt
IFRS, and 0 otherwise;
LawSys = The dummy variable equal to 1 if firms are in country complying with
civil law and 0 otherwise.

200
Appendix 4.2: The mean value of variables
The mean value of ETR and STR
Year
N Overall Brazil Russia India China S. Africa
STR ETR STR ETR STR ETR STR ETR STR ETR STR ETR
2006 651 0.33 0.24 0.34 0.24 0.24 0.32 0.34 0.23 0.33 0.23 0.37 0.29
2007 703 0.33 0.24 0.34 0.25 0.24 0.31 0.34 0.24 0.33 0.21 0.37 0.29
2008 1,033 0.32 0.25 0.34 0.26 0.24 0.29 0.34 0.25 0.25 0.19 0.35 0.30
2009 1,059 0.31 0.25 0.34 0.22 0.20 0.27 0.34 0.27 0.25 0.19 0.35 0.31
2010 1,308 0.31 0.25 0.34 0.26 0.20 0.25 0.34 0.27 0.25 0.19 0.35 0.30
2011 1,521 0.31 0.25 0.34 0.24 0.20 0.26 0.32 0.25 0.25 0.22 0.35 0.29
2012 1,786 0.31 0.27 0.34 0.29 0.20 0.27 0.32 0.28 0.25 0.22 0.35 0.29
2013 2,647 0.29 0.24 0.34 0.23 0.20 0.26 0.34 0.27 0.25 0.21 0.28 0.29
2014 2,725 0.28 0.23 0.34 0.24 0.20 0.28 0.34 0.27 0.25 0.20 0.28 0.29
2015 2,927 0.27 0.21 0.34 0.24 0.20 0.25 0.35 0.26 0.25 0.19 0.28 0.30
2016 3,354 0.27 0.21 0.34 0.24 0.20 0.24 0.35 0.28 0.25 0.19 0.28 0.32
2017 3,410 0.27 0.21 0.34 0.27 0.20 0.24 0.35 0.28 0.25 0.18 0.28 0.28
The mean value of ETR and STR
Year
N Overall Brazil Russia India China S. Africa
AEM REM AEM REM AEM REM AEM REM AEM REM AEM REM
2006 651 -0.01 0.01 0.10 -0.12 -0.04 -0.08 0.04 0.07 -0.05 0.02 0.00 0.00
2007 703 0.00 0.12 0.01 -0.06 0.03 -0.02 0.01 0.19 -0.01 0.07 0.00 0.00
2008 1,033 -0.10 -0.05 -0.02 -0.15 -0.16 -0.11 -0.14 -0.03 -0.03 0.05 0.00 0.00
2009 1,059 -0.10 0.08 0.04 0.01 0.01 -0.17 -0.18 0.14 -0.01 -0.04 0.00 0.00
2010 1,308 -0.09 0.06 0.00 -0.04 0.05 0.02 -0.15 0.09 -0.02 0.10 0.00 -0.09
2011 1,521 -0.12 0.05 0.02 -0.05 -0.03 -0.04 -0.18 0.09 -0.03 0.05 0.00 -0.11
2012 1,786 -0.16 0.05 -0.06 -0.07 -0.02 -0.10 -0.23 0.09 0.06 0.00 -0.02 0.03
2013 2,647 -0.08 0.02 -0.03 -0.03 -0.01 -0.07 -0.21 0.02 0.03 0.04 -0.01 -0.08
2014 2,725 -0.01 0.02 -0.03 -0.06 0.00 -0.18 -0.10 0.11 0.03 0.01 -0.04 -0.07
2015 2,927 0.03 -0.01 -0.04 -0.12 0.03 -0.14 -0.05 0.02 0.06 -0.01 -0.03 -0.10
2016 3,354 0.04 0.01 -0.02 0.08 -0.02 0.00 -0.03 0.01 0.06 0.01 0.00 0.01
2017 3,410 0.04 0.04 -0.02 -0.05 -0.04 -0.10 -0.01 0.05 0.07 0.07 -0.01 -0.03
The mean value of sample of 23,124 firm-year observations during the period of 2006-2017 used to plot
the Figure 4.1

201
Appendix 4.3: Extended Test
Simultaneous and trade-off actions between AEM and REM
Since managers can employ AEM and REM to achieve the same objective, which is to manage earnings
in their favour, these two techniques can be seen either as non-simultaneous strategies or as mutually
exclusive strategies.
Following Zang (2007) and Chen, Huang & Fan (2012), this extended test adopts the simultaneous
equations estimated by the two-stage least square (2SLS) regression to examine whether the levels of
AEM and REM behave as endogenous variables that are simultaneously determined (Hausman 1978).
In the first stage, AEM and REM are regressed on the exogenous variables (i.e., the costs relative to each
approach of earnings management and the common control variables) to obtain instruments for AEM
and REM (i.e., the predicted values from the equations). In the second stage, AEM is regressed on the
exogenous variables, the instrument of REM, and REM itself. Similarly, REM is regressed on the
exogenous variables, the instrument of AEM, and AEM itself. If one approach is defined by the other,
the coefficients on the instruments of AEM in the REM equation and the coefficients on the instruments
of REM in the AEM equation should not be significantly different from zero. The results show that the
coefficients on the instrument of REM and AEM are significant in both equations. Specifically, the
Hausman tests rejected both the exogeneity of REM in the AEM regression and the exogeneity of AEM
in the REM regression (with Wu-Hausman F-value of 9.18 (p < 0.01) in the AEM model and with Wu-
Hausman F-value of 26.38 (p < 0.01) in the REM model). These results suggest that there is a
simultaneity issue between AEM and REM. Therefore, the following simultaneous equations are
estimated using the 2SLS method:
𝐴𝐸𝑀_𝑃𝑅𝑂𝑋𝑌𝑖,𝑡 = 𝛼0 + 𝛿1𝑅𝐸𝑀_𝑃𝑅𝑂𝑋𝑌𝑖,𝑡 + ∑ 𝛿3𝑛=2 𝑛
𝐶𝑜𝑠𝑡𝑠 𝑜𝑓 𝐴𝐸𝑀𝑖,𝑡 + ∑ 𝛿𝑛𝐶𝑜𝑛𝑡𝑟𝑜𝑙𝑠𝑖,𝑡8𝑛=4 + 휀𝑖,𝑡 (15)
𝑅𝐸𝑀_𝑃𝑅𝑂𝑋𝑌𝑖,𝑡 = 𝛼0 + 𝛾1𝐴𝐸𝑀_𝑃𝑅𝑂𝑋𝑌𝑖,𝑡 + ∑ 𝛾3𝑛=2 𝑛
𝐶𝑜𝑠𝑡𝑠 𝑜𝑓 𝑅𝐸𝑀𝑖,𝑡 + ∑ 𝛾𝑛𝐶𝑜𝑛𝑡𝑟𝑜𝑙𝑠𝑖,𝑡8𝑛=4 + 휀𝑖,𝑡 (16)
Where AEM_PROXY is the aggregated AEM measure estimated by averaging the value of Jones,
MoJones, Matched_Jones, and Matched_MoJones. REM_PROXY is the aggregated REM proxy
measured by averaging the value of AbnOCF and AbnProd. Costs of AEM refer to the lagged value of
AEM_PROXY and the dummy variable equal to 1 if the firm's auditor is a Big 4 firm. Costs of REM
refer to the firm's production capacity and market share of the preceding year. Controls refer to the firm's

202
size, firm's market-to-book ratio, firm's leverage, firm's growth, and closely-held shares (see the
definitions in Appendix A).
The substitutive hypothesis predicts that firms engage in REM more when the relative costs of AEM are
high, and vice versa. Hence, 𝛿1 in Equation (15) and 𝛾1 in Equation (16) are expected to be negative
(𝛿1 < 0 𝑎𝑛𝑑 𝛾1 < 0). In contrast, the complementary hypothesis assumes that managers use both AEM
and REM at the same time. 𝛿1 in Equation (15) and 𝛾1 in Equation (16) are thus expected to be positive
(𝛿1 > 0 𝑎𝑛𝑑 𝛾1 > 0). If the results turn out to be in a way that 𝛿1 < 0 𝑎𝑛𝑑 𝛾1 > 0 or 𝛿1 > 0 𝑎𝑛𝑑 𝛾1 < 0,
it suggests that AEM and REM are independently used by the firm's managers.
Columns (1) and (2) in the table below report the regression results for the simultaneous versus
substitutive practice between AEM and REM. Although the coefficient of REM in the AEM model and
the coefficient of AEM in the REM model are positive consistent with the complementary hypothesis,
both values are not statistically significant, suggesting that the sample does not provide evidence
regarding a simultaneous or substitute strategy used by managers of firms in BRICS countries.
In addition to the empirical evidence documenting that managers use AEM and REM to manage earnings
based on their relative costs (Badertscher, 2011; Cohen et al., 2008; Cohen & Zarowin, 2010; Enomoto
et al., 2015; Ipino & Parbonetti, 2017; Joosten, 2012; Zang, 2012), another difference between AEM and
REM influencing managers' decisions is timing differences in their application. REM activities can only
take place before the fiscal year-end. Relying on REM alone is uncertain as a manager does not have
perfect control over the exact amount of REM to be manipulated. This would be a problem if realised
income falls below the threshold because after the year-end, a manager can no longer engage in REM.
Similarly, although managers can manipulate accruals after the end of the fiscal period, engaging in AEM
alone may lead to the risky circumstance that reported earnings are below the desired threshold and all
accrual-based strategies to meet the threshold are exhausted. Managers then need to leave the shortfall
between unmanaged earnings and the desired threshold because it cannot be adjusted through REM
activities after the fiscal reporting period ends either. Therefore, a coordinated strategy between REM
and AEM may be the optimal means to manage earnings. By doing so, managers can adjust earnings
through AEM, which can be used to cover the missing amount, after REM actions are exhausted after
the end of the fiscal year. That is, the managers can observe the outcomes of REM on earnings at the end
of the fiscal year, and then they can use less (more) AEM to offset an unexpectedly high (low) result

203
from REM. Following Zang (2012), the following recursive equation system is conducted to capture this
sequence of decisions:
𝑅𝐸𝑀_𝑃𝑅𝑂𝑋𝑌𝑖,𝑡 = 𝛼0 + ∑ 𝜑𝑛2𝑛=1 𝐶𝑜𝑠𝑡𝑠 𝑜𝑓 𝑅𝐸𝑀𝑖,𝑡 + ∑ 𝜑𝑛
4𝑛=3 𝐶𝑜𝑠𝑡𝑠 𝑜𝑓 𝐴𝐸𝑀𝑖,𝑡 + ∑ 𝜑𝑛𝐶𝑜𝑛𝑡𝑟𝑜𝑙𝑠𝑖,𝑡
9𝑛=5 + 휀𝑖,𝑡 (17)
𝐴𝐸𝑀_𝑃𝑅𝑂𝑋𝑌𝑖,𝑡 = 𝛼0 + ∑ 𝜎𝑛2𝑛=1 𝐶𝑜𝑠𝑡𝑠 𝑜𝑓 𝐴𝐸𝑀𝑖,𝑡 + ∑ 𝜎𝑛
4𝑛=3 𝐶𝑜𝑠𝑡𝑠 𝑜𝑓 𝑅𝐸𝑀𝑖,𝑡 + 𝜎5𝑈𝑛𝑒𝑥𝑝𝑒𝑐𝑡𝑒𝑑𝑅𝐸𝑀𝑖,𝑡 +
∑ 𝜎𝑛𝐶𝑜𝑛𝑡𝑟𝑜𝑙𝑠𝑖,𝑡10𝑛=6 + 휀𝑖,𝑡 (18)
Where all variables used are measures the same as in the previous test.
The equations (17) is estimated to investigate to what extent REM is determined by the relative costs of
AEM and REM as well as other firm characteristics, but not by the realised outcome of AEM. Unlike
REM, the extent of AEM may be determined not only by the relative costs of AEM and REM and other
firm characteristics but also by the unexpected amount of REM (which is revealed shortly after the fiscal
year-end). Therefore, 𝜎5 in the equation (18) is expected to be negative.
Columns (3) and (4) show that the unexpected value of REM is insignificantly and positively associated
with AEM, suggesting that this study cannot provide further support for evidence reported by Zang
(2012), which indicates that the level of AEM is negatively related to the unexpected amount of REM.
However, the results lend support, to some extent, for the argument that managers trade off earnings
management methods based on their relative costs. The AEM model (column 4) shows that the
coefficients of LagAEM_Proxy and Big4 (i.e., costs of AEM) are negatively related to AEM and the
coefficient of LagShare (i.e., cost of REM) is positively associated to AEM. These results suggest that
when AEM is constrained by its relative costliness, managers use a greater extent of REM. The REM
model (column 3) shows that the level of REM is depended on its costs as the coefficients of LagShare
and C_Prod (i.e., cost of REM) are positively associated with REM. The results mean that when the costs
of REM increase (reduce), managers of the firms reduce (increase) the level of REM. Interestedly, the
costs claimed to constrain the level of AEM (Big4) also constrain the level of REM in this study.

204
Regression results for simultaneous and trade-off actions between AEM and REM
Robust standard errors clustered at the firm level are in parentheses.
*, ** and *** indicate the level of significance at p<0.1, p<0.05, and p<0.01, respectively, using two tailed tests.
a The following regressions are estimated cross-sectionally for the sample covering the period 2006-2017. The two-stage least
square (2SLS) is used with firm-level robustness of standard errors for the estimation of the p-values.
Unexp_REM 0.004
(0.013)
Earnings management approach:
REM_Proxy 0.012
(0.013)
AEM_Proxy 0.008
(0.008)
Costs of AEM:
LagAEM_Proxy 0.092 *** -0.657 -3.935 ***
(0.010) (0.862) (1.063)
Big4 -0.013 *** -0.022 *** -0.005 ***
(0.004) (0.001) (0.002)
Costs of REM:
LagShare -0.241 -0.042 *** 0.087 ***
(0.860) (0.008) (0.010)
C_Prod -0.022 *** -0.001 *** -0.013 ***
(0.001) (0.003) (0.004)
Control variables Yes Yes Yes Yes
FE: Country, Industry, Year Yes Yes Yes Yes
Constant -0.284 *** -0.006 -0.061 *** -0.386 ***
(0.024) (0.021) (0.023) (0.028)
Adj. R2 0.164 0.158 0.161 0.165
Wald Chi2 751.490 *** 1453.810 ***
F-statistic 57.160 *** 57.339 ***
Durbin chi2 8.201 *** 26.406 ***
Wu-Hausman F 8.179 *** 26.388 ***
First-stage regression:
Adj. R2 0.973 0.990
F-statistic 285096 *** 814583 ***
N 9376 9376 9376 9376
Tests of endogeneity
VariablesSimultaneous action
aSequential action
b
AEM model REM Model REM model AEM Model

205
𝐴𝐸𝑀𝑃𝑅𝑂𝑋𝑌𝑖,𝑡= 𝛼0 + 𝛿1𝑅𝐸𝑀𝑃𝑅𝑂𝑋𝑌𝑖,𝑡
+ ∑ 𝛿3𝑛=2 𝑛
𝐶𝑜𝑠𝑡𝑠 𝑜𝑓 𝐴𝐸𝑀𝑖,𝑡 + ∑ 𝛿𝑛𝐶𝑜𝑛𝑡𝑟𝑜𝑙𝑠𝑖,𝑡8𝑛=4 +
∑ 𝛼𝑛13𝑛=9 𝐹𝑖𝑥𝑒𝑑 𝐸𝑓𝑓𝑒𝑐𝑡𝑖,𝑡
𝑐𝑜𝑢𝑛𝑡𝑟𝑦 + ∑ 𝛼𝑛
22𝑛=14 𝐹𝑖𝑥𝑒𝑑 𝐸𝑓𝑓𝑒𝑐𝑡𝑖,𝑡
𝑖𝑛𝑑𝑢𝑠𝑡𝑟𝑦 +
∑ 𝛼𝑛34𝑛=23 𝐹𝑖𝑥𝑒𝑑 𝐸𝑓𝑓𝑒𝑐𝑡𝑖,𝑡
𝑦𝑒𝑎𝑟+ 휀𝑖,𝑡
𝑅𝐸𝑀_𝑃𝑅𝑂𝑋𝑌𝑖,𝑡 = 𝛼0 + 𝛾1𝐴𝐸𝑀_𝑃𝑅𝑂𝑋𝑌𝑖,𝑡 + ∑ 𝛾3𝑛=2 𝑛
𝐶𝑜𝑠𝑡𝑠 𝑜𝑓 𝑅𝐸𝑀𝑖,𝑡 + ∑ 𝛾𝑛𝐶𝑜𝑛𝑡𝑟𝑜𝑙𝑠𝑖,𝑡8𝑛=4 +
∑ 𝛼𝑛13𝑛=9 𝐹𝑖𝑥𝑒𝑑 𝐸𝑓𝑓𝑒𝑐𝑡𝑖,𝑡
𝑐𝑜𝑢𝑛𝑡𝑟𝑦 + ∑ 𝛼𝑛
22𝑛=14 𝐹𝑖𝑥𝑒𝑑 𝐸𝑓𝑓𝑒𝑐𝑡𝑖,𝑡
𝑖𝑛𝑑𝑢𝑠𝑡𝑟𝑦 +
∑ 𝛼𝑛34𝑛=23 𝐹𝑖𝑥𝑒𝑑 𝐸𝑓𝑓𝑒𝑐𝑡𝑖,𝑡
𝑦𝑒𝑎𝑟+ 휀𝑖,𝑡
b The following regressions are estimated cross- sectionally for the sample covering the period 2006-2017. The ordinary least
square (OLS) is used with firm-level robustness standard errors for the estimation of the p-values.
𝑅𝐸𝑀_𝑃𝑅𝑂𝑋𝑌𝑖,𝑡 = 𝜑0 + ∑ 𝜑𝑛2𝑛=1 𝐶𝑜𝑠𝑡𝑠 𝑜𝑓 𝑅𝐸𝑀𝑖,𝑡 + ∑ 𝜑𝑛
4𝑛=3 𝐶𝑜𝑠𝑡𝑠 𝑜𝑓 𝐴𝐸𝑀𝑖,𝑡 + ∑ 𝜑𝑛𝐶𝑜𝑛𝑡𝑟𝑜𝑙𝑠𝑖,𝑡
9𝑛=5 +
∑ 𝛼𝑛14𝑛=10 𝐹𝑖𝑥𝑒𝑑 𝐸𝑓𝑓𝑒𝑐𝑡𝑖,𝑡
𝑐𝑜𝑢𝑛𝑡𝑟𝑦 + ∑ 𝛼𝑛
23𝑛=15 𝐹𝑖𝑥𝑒𝑑 𝐸𝑓𝑓𝑒𝑐𝑡𝑖,𝑡
𝑖𝑛𝑑𝑢𝑠𝑡𝑟𝑦 +
∑ 𝛼𝑛35𝑛=24 𝐹𝑖𝑥𝑒𝑑 𝐸𝑓𝑓𝑒𝑐𝑡𝑖,𝑡
𝑦𝑒𝑎𝑟+ 휀𝑖,𝑡
𝐴𝐸𝑀_𝑃𝑅𝑂𝑋𝑌𝑖,𝑡 = 𝜎0 + ∑ 𝜎𝑛2𝑛=1 𝐶𝑜𝑠𝑡𝑠 𝑜𝑓 𝐴𝐸𝑀𝑖,𝑡 + ∑ 𝜎𝑛
4𝑛=3 𝐶𝑜𝑠𝑡𝑠 𝑜𝑓 𝑅𝐸𝑀𝑖,𝑡 + 𝜎5𝑈𝑛𝑒𝑥𝑝. 𝑅𝐸𝑀𝑖,𝑡 +
∑ 𝜎𝑛𝐶𝑜𝑛𝑡𝑟𝑜𝑙𝑠𝑖,𝑡10𝑛=6 + ∑ 𝛼𝑛
15𝑛=11 𝐹𝑖𝑥𝑒𝑑 𝐸𝑓𝑓𝑒𝑐𝑡𝑖,𝑡
𝑐𝑜𝑢𝑛𝑡𝑟𝑦 + ∑ 𝛼𝑛
24𝑛=16 𝐹𝑖𝑥𝑒𝑑 𝐸𝑓𝑓𝑒𝑐𝑡𝑖,𝑡
𝑖𝑛𝑑𝑢𝑠𝑡𝑟𝑦 +
∑ 𝛼𝑛36𝑛=25 𝐹𝑖𝑥𝑒𝑑 𝐸𝑓𝑓𝑒𝑐𝑡𝑖,𝑡
𝑦𝑒𝑎𝑟+ 휀𝑖,𝑡
where: AEM_PROXY is the aggregated AEM measure estimated by averaging the value of Jones, MoJones, Matched_Jones,
and Matched_MoJones.
REM_PROXY the aggregated REM proxy measured by averaging the value of AbnOCF and AbnProd.
Costs of AEM refer to the lagged value of AEM_PROXY and the dummy variable equal to 1 if the firm’s auditor is
a Big 4 firm.
Costs of REM refer to the market share of firms to its industry and the firm’s production capacity.
Controls refer to firm’s size, firm’s equity market-to-book ratio, firm’s leverage, firm’s net incomes, and firm’s
closely held shares, defined as follows:
Size = The natural logarithm of total assets;
Lev = The ratio of long-term debt liability and total assets;
NI = The ratio of net income and total assets;
MTBV = The market-to-book ratio;
CloseHeld = The percentage of number of closely held shares to common shares outstanding.
Fixed Effectcountry, industry, year refer to country, industry, and year fixed effect: five countries, nine industries, and
fourteen years.
Chapter 5 Tax Avoidance and Accounting Conservatism
Tax Avoidance and Accounting
Conservatism
5.1. Introduction
Corporate tax avoidance is traditionally viewed as one of the mechanisms used to maximize profit by
reducing tax liabilities (Hanlon & Heitzman, 2010; Preuss, 2010). Prior empirical research shows that
tax incentives play an important role in firms’ behaviours such as engaging in earnings management
(e.g., Desai & Dharmapala, 2009; Shane & Stock, 2006; Sundvik, 2017; Taylor & Richardson, 2014;
Wong, Lo, & Firth, 2015), participating in corporate social responsibility (e.g., Lanis & Richardson,
2012, 2013, 2015; Preuss, 2010, 2012), and shifting profit to subsidiaries (e.g., Bartelsman & Beetsma,
2000; Fuest & Riedel, 2012; Janský & Prats, 2015; Omar & Zolkaflil, 2015). Thus far, the extant
literature on the link between tax avoidance and conservatism is relatively under-examined. The current
study aims to fill this gap by examining the relationship between conservatism and tax avoidance,
specifically to answer the question of whether firms apply conservative accounting to reduce their tax
liabilities.
Generally, conservatism is an accounting principle that makes liabilities/losses big or assets/incomes
small when firms face the situations that there are more than one alternative available methods in the
preparation of financial statements. In other words, firms are timelier in recognizing losses than gains.
For example, firms would lower net assets and profits in response to bad news but do not increase net
assets and profits in response to good news. This is because gains require higher standards of verification
to be recorded in book income than losses (Basu, 1997; Watts, 2003a, 2003b). Although a firm’s book
income and its taxable income are determined by different rules and regulations, it is a well-known fact
that taxable income is affected by book income. By conservatively delaying the recognition of book
income, taxable income is simultaneously shifted, and tax payments are also deferred into the future

207
(Bornemann, 2018). Therefore, tax saving may be an incentive for firms to increase accounting
conservatism in order to minimize tax liability. Managers, working on behalf of shareholders, would
attempt to reduce taxable income in the current period by delaying the revenue recognition and
accelerating the expense recognition.
Moreover, while the majority of extant research on this link focuses exclusively on the behaviour of firms
in the US (e.g., Gan, 2018; Heltzer, 2009; Lara, Osma, & Penalva, 2009; Qiang, 2007), investors have
drawn more attention to comparing related information to make investment decisions globally. As the
emerging markets’ GDPs (the gross domestic product) are estimated to be permanently surpassed that of
all developed markets by 2035 (Wilson & Purushothaman, 2003), the emerging markets are considered
the vital part of the world’s economy. As such, emerging economies need to make the markets
understandable and trustable by providing comparable and relevant information. Through this lens,
investors would be more confident when making decisions on their investments (Meser, Veith, &
Zimmermann, 2015). Due to differences between emerging and developed markets59, the current study
posits that emerging economies may provide further information regarding taxation and accounting
conservatism in a specific and different way in relative to developed markets. Therefore, this study aims
at providing a more comprehensive understanding of conservatism on tax avoidance in an emerging
context, the BRICS: Brazil, Russia, India, China, and South Africa, the group of emerging countries that
has been projected to exert an important influence over the world’s economy60.
Accounting conservatism can be classified as either conditional or unconditional conservatism. The
conditional form is made upon the occurrence of a contemporaneous economic event (i.e., based on
news) while the unconditional form is predetermined, and does not vary according to news (Basu, 1997;
Watts, 2003a). In the context of taxation, there is no requirement of a particular form of conservatism to
achieve tax incentives. Prior research shows that it is likely to be associated with unconditional
conservatism. For example, Qiang (2007) argues that tax burdens tend to induce unconditional
conservatism. Similarly, Kim & Jung (2007) find that unconditional conservatism, rather than
59 Although an emerging country has some characteristics of a developed market, it does not meet the required standards to
be termed a developed market. With lower standards, the emerging market may face different degrees and situations in a
particular circumstance comparing to the developed market.
60 BRICS have become the key debate in various facets including economy, politics, and development (Piper, 2015) as it is
predicted to dominate the world’s economy by 2050 (O’Neill, 2001).
208
conditional conservatism, is positively associated with the tax burden of firms. Heltzer (2009) finds that
firms having taxable income more than book income present higher levels of unconditional conservatism.
Asgari & Behpouri (2013) report a positive association between unconditional conservatism and tax
burdens.
In contrast, other studies suggest that conditional conservatism can also effectively minimize firms’ tax
payments. Lara, Osma, & Penalva (2009) document that taxation induces not only unconditional
conservatism but also conditional conservatism. Bornemann (2018) shows that conditional conservatism
is positively associated with taxation when changes in tax rates are approaching. Furthermore, Gan
(2018) sheds more light on this link by revealing that firms utilize conditional conservatism as a vehicle
for tax avoidance to reduce actual tax payments. As prior studies report mixed results on whether
conditional conservatism, or unconditional conservatism, or both are more likely to be related to tax
burdens, this study fills this gap by investigating the tax-reduced effects of conservatism through both
conditional and unconditional forms.
This study finds that firms’ conditional conservatism is significantly and negatively associated with
firms’ annual effective tax rate (ETR), suggesting the positive association between accounting
conservatism and tax avoidance. In contrast, firms’ unconditional conservatism is significantly and
positively associated with firms’ annual effective tax rate, implying that increases in unconditional
conservatism would lead to lower levels of tax avoidance. These effects of firms’ conditional and
unconditional conservatism hold only with Chinese firms when investigating at a country level and only
unconditional conservatism is still positively associated with annual ETRs of firms in Brazil, India, and
South Africa.
This study aims to contribute to several streams of literature: Firstly, by examining the impact of
conservatism both in conditional form and unconditional form on tax avoidance, this study adds to the
stream of literature on determinants of tax avoidance, sheds additional light on the consequences of
accounting conservatism especially conservatism in response to the incentives of tax reduction, and
contributes to the ongoing and topical debate whether conditional or unconditional forms of conservatism
are more likely associated with taxation (Heltzer, 2009; Qiang, 2007; Watts, 2003a, 2003b) specifically
with tax-reducing liabilities (Bornemann, 2018; Gan, 2018; Lara et al., 2009). While existing studies
have focused on an ex-ante analysis of whether high tax pressure leads to more conservatism, this study

209
conversely provides analysis based on an ex-post perspective and presents direct evidence as to whether
conditional or unconditional conservatism results in reductions in tax liabilities. Secondly, by focusing
on the emerging markets, this study, to the best of the author’s knowledge, is the first paper contributing
to literature on tax avoidance and accounting conservatism in the context of BRICS. While most of
existing studies have repeatedly documented empirical evidence from developed markets like the US,
this study provides the results that help enhance a generalization ability of the test on the link between
tax avoidance and conservatism into emerging economies. Furthermore, understanding the relationship
between conservatism and a company’s tax avoidance from this study provides implications to several
parties. The findings potentially benefit (i) policymakers and standard setters in both evaluating and
improving the existing policies and stimulating new policies to discourage firms from taking advantage
of conservatism for the purpose of tax avoidance; (ii) tax authorities in developing methods to detect and
deter firms’ tax avoidance practices through information from financial statements; and (iii) researchers
who are interested in the on-going and inclusive discussion of the conservatism-tax relationship.
Furthermore, this study provides the preliminary findings for future research to improve the methodology
and to make the association between tax avoidance and accounting conservatism more pronounced.
Anecdotal evidence shows that investors have expressed a heightened interest in firms’ tax avoidance
activities when making investment decisions (Drake et al., 2019; Mukhlasin & Anissa, 2018). Therefore,
if investors are aware that a particular firm uses conservative accounting (tax avoidance), then they
should also investigate whether the firm participates in tax avoidance (conservative accounting).
The rest of the chapter proceeds as follows: Section 5.2 reviews relevant literature and elucidates
underlying theory followed by Section 5.3 on the development of hypotheses. Section 5.4 discusses the
research design, including the data, measurement of variables, and analysis model. Section 5.5 presents
the main findings and results from additional and robustness tests. Finally, Section 5.6 provides a
summary and conclusion.
5.2. Related Literature
5.2.1. Accounting conservatism
The main objective of accounting is to provide information reflecting firms’ underlying economic
circumstances. A firm’s economic value can be decomposed into a realised part, which is objective and

210
recognised through cash flow, and unrealized part which is subjective and needs to be predicted (Zhong
& Li, 2017). As an accounting transaction is recorded based on an accrual basis, how the unrealized part
is recognised in earnings is important because it determines the properties of financial reporting.
Accounting conservatism has been one of the most influential principles of the accounting process
(Sterling, 1967). Traditionally defined by Bliss (1924), accounting conservatism is “anticipat[ing] no
profits but anticipat[ing] all losses”. The US accounting standard setter includes the issue of conservatism
in the Statement of Concepts No. 2 (FASB, 1980) and defines it as “[a] prudent reaction to uncertainty
... If two estimates of amounts to be received or paid in the future are about equally likely, conservatism
dictates using the less optimistic estimate.” In other words, among the possible alternative values, the
lowest value for assets and the highest value for liabilities should be chosen to be recognized (Watts &
Zimmerman, 1986). Although these definitions are useful, they do not consider the actual economic
environment. Basu (1997) proposes an alternative definition of accounting conservatism by taking the
degree of verification for good news and bad news into account when recognizing them in accounting
processes. According to Basu (1997), earnings should reflect bad news more quickly than good news.
Although conservatism is not a desirable aspect of a faithful representation of financial reporting (IASB,
2006, BC2.22), some respondents to the Discussion Paper and Exposure Draft argue that conservatism
should be included in the conceptual framework for financial reporting because “…bias should not
always be assumed to be undesirable, especially in circumstances when bias, …, produces information
that is more relevant to some users.” (FASB, 2010).
Watts (2003) and Zhong & Li (2017) both argue the benefits of conservative financial reporting to various
stakeholders. Watts (2003) proposes four explanations for conservatism: contracting, litigation, income
tax, and regulatory. Zhong & Li (2017) describe a different party’s demand for conservatism:
debtholders, shareholders, auditors, and regulators. This study thus explains the usefulness of
conservatism from another perspective by discussing its demands based on contracting and non-
contracting parties.
(a) Contracting-based implications
As part of a contract between firms and various stakeholders, managers are responsible for informing the
firms’ performance to all parties in order to assess the firms. The majority of information is conveyed

211
through financial reports. Given that the managers have incentives to exaggerate reported performance,61
the credibility of the financial information needs to be assured. Conservatism constrains and offsets
managerial biases caused by opportunistic managers through the high level of verifiability requirement.
This offset increases firm value which would be shared among all parties related to the firms, i.e.,
increasing everyone’s welfare, not only managers and shareholders. Watts (2003), thus, concludes that
conservatism is an efficient mechanism for contracting. The first party that benefits from conservative
accounting information is debtholder. Given that debtholders will lose their wealth if a firm suffers from
financial trouble, debt covenants usually include criteria that may limit the payment of dividends and
criteria in terms of the fixed-charge coverage ratio, leverage, and net worth (Nikolaev, 2010).
Conservatism can improve the efficiency of debt contracting by triggering covenant violations through
the recognition of loss at the right time and by requiring high verifiability for gain recognition (Watts,
2003a). Debtholders prefer timely losses realization to timely gains recognition due to asymmetric
payoffs. While timely loss recognition allows debtholders to take actions to protect their wealth in a
timely manner, timely gain recognition does not offer them any additional benefits apart from the
principal and interest. Moreover, when high verifiability is required to recognize gains, it is difficult for
managers to overstate earnings or net assets (Zhong & Li, 2017).
Shareholders also demand for conservatism. In business organizations, executive compensation contracts
are linked to firm performance. Managers, as such, have incentives to inflate earnings and withhold bad
news. Accounting conservatism as a principle of timely loss recognition facilitates shareholders’ ability
to mitigate the problem of agency conflicts and information asymmetry between them and managers
(LaFond & Roychowdhury, 2008; LaFond & Watts, 2008). In line with this, Ball & Shivakumar (2005)
reveal that conservative accounting information reduces managers’ incentives to invest or continue
negative NPV projects. Tax saving is another possible explanation for shareholders’ demand for
conservatism. As the last stakeholders to claim firm profits,62 shareholders have incentives to minimize
tax liability. According to the link between tax system and accounting system, asymmetry in recognition
of gains and losses generates conservatism in financial reporting. Managers, on behalf of shareholders,
61 The manager’s incentives to embellish the performance reports better than reality are not only for management
compensation purposes, but also for the manager’s job opportunities in the labor market for management (Kothari et al.,
2010). 62 Firm wealth is paid for interest to debtholders, compensation to managers, taxation to the government. The residual portion
of firm profit then belongs to shareholders (Zhong & Li, 2017).

212
would try to reduce taxable income for deferring tax payment by delaying the revenue recognition and
accelerating the expense recognition.
(b) Non-contracting implications
Under the litigation explanation, which is not consistent with the contracting perspective, if a firm’s net
assets are overstated, it is more likely to generate litigation costs on shareholders. Auditors are
responsible for the validation and reliability of financial reporting. In a situation where firms are subject
to financial fraud, auditors encounter with reputational harm and the risk of being prosecuted by
shareholders. As conservatism refers to the accounting principles that understate the value of net assets,
it reduces firm’s litigation costs and thereby preferred by auditors. Basu (1997) documents that
conservatism increases during periods when litigation against auditors increases. Basu, Hwang, & Jan
(2001) find that Big Eight auditors report more conservative financial reporting than non-Big Eight
auditors, especially when they are exposed to greater legal liability.
Like the litigation costs, political costs (another non-contracting perspective) are more likely to occur to
standard setters and regulators if firms overstate earnings or net assets. That is, one consequence when
firms face bankruptcy is a condemnation by the media and investors (Pinnuck, 2012). Therefore, shaped
by market forces, conservatism and verifiability are critical features of a GAAP to ease criticism on firms,
and consequently reduce political costs imposed on standard setters and regulators (Kothari et al., 2010).
5.2.2. Conditional versus unconditional conservatism
Although there are useful definitions of accounting conservatism, measuring conservatism is difficult,
which thereby leads to contradicting conclusions in existing research. One of the possible reasons is that
researchers do not consider types of conservatism and the actual economic environment in their studies.
Distinguishing different types of conservatism have been considered in accounting research since Basu
(1997). He proposes a new accounting conservatism definition that contributes to more understanding of
the conservatism concept. Under Basu’s definition of conservatism, types of income (i.e., economic gains
and losses) are conditionally added into the traditional conservatism definition (an accounting bias
toward reporting low book values of stockholder equity). By using stock returns to measure news and
regressing earnings on unexpected returns, he finds that earnings are contemporaneously more sensitive
to negative returns (bad news) than it is to positive returns (good news). In other words, earnings reflect

213
bad news in a timelier manner than good news. This implies that good news requires higher verifiability
to recognize in financial reporting relative to bad news. As the bias toward understated reporting is
conditional on contemporaneous economic losses that firms face, this type of conservatism is called
conditional conservatism (Basu, 1997), which is also called news-dependent or ex post conservatism
(Zhong & Li, 2017). Examples of conditional conservatism include goodwill impairment, long-lived
tangible and intangible asset impairment, and inventory recorded at the lower of cost or market (Ruch &
Taylor, 2015).
Unconditional conservatism, which is also called news-independent or ex ante conservatism, is the
accounting process determined assets and liabilities at the beginning (Zhong & Li, 2017). Consequently,
the under-recognition of net assets and the over-recognition of liabilities is consistent and does not
depend on economic news events (Ruch & Taylor, 2015). Examples of unconditional conservatism
include the immediate expensing of R&D costs, the accelerated depreciation methods long-lived assets,
LIFO method for inventory, and accumulated reserves in excess of expected future costs (e.g., warranty
allowance and allowance for doubtful accounts) (Ruch & Taylor, 2015; Zhong & Li, 2017). Although
both types of conservatism result in understating book value of net assets compared with their market
value, understanding the differences between conditional and unconditional forms of conservatism helps
explain why conservatism has different effects on the financial statements. (Ruch & Taylor, 2015).
Moreover, the application of one type affects the application of the other type of conservatism. Beaver
& Ryan (2005) find that the unconditional conservatism, which understates assets at the inception, limits
the magnitude of write-downs in the presence of bad news events. Therefore, the presence of
unconditional conservatism may confound inferences made about the existence of conditional
conservatism. Furthermore, two forms of conservatisms play different roles in different demanding
parties. As Watts (2003a) proposes four explanations for conservatism: contracting, litigation, regulation,
and taxation, Qiang (2007) further examines and finds that while conditional conservatism arises in
settings where contracting and litigation costs are high, unconditional conservatism arises in settings
where litigation, regulatory, and tax costs are high.
5.2.3. Institutional settings affecting conservatism in BRICS
Prior studies report that accounting conservatism is influenced by institutional factors (e.g., Andre &
Filip, 2012; Ball, Kothari, & Robin, 2000; Bushman & Piotroski, 2006; Xu & Lu, 2008). For instance,

214
Bushman & Piotroski (2006) argue that accounting conservatism is influenced by institutional structures
(legal/judicial systems, securities laws, and political economy) as they create incentives that influence
the behaviours of market participants (e.g., corporate executives, regulators, investors). Ultimately, these
behaviours affect the conservatism in firms’ accounting practices. Given that BRICS is a group of five
major emerging countries but with different backgrounds (i.e., different institutional contexts), this may
cause variations in the demand for conservatism.
Previous research has documented that differences in demands for conservatism are attributable to
differences in the quality of financial reporting (Pinnuck & Potter, 2009). The first institutional factors
that may affect the level of conservatism in BRICS countries is the adoption of IFRS. According to a
status of IFRS adoption, countries can be divided into three groups: (i) those that have already adopted
mandatory IFRS; (ii) those that have set up a time frame for adoption; and (iii) those who have no full
plan in place (Borker, 2012). In BRICS countries, they all have committed to adopt IFRS but currently
are in the different stages towards the implementation. Moreover, different types of firms in each country
may be required to use different standards. This section thus discusses only the extent of IFRS
implementation of public firms as the sample data are focusing only on this type of firms. Brazil has
already adopted IFRS standards for all firms publicly listed in stock markets since 2010. In Russia, IFRS
has become mandatory for consolidated financial statements since 2012 under the Federal Law 208-FZ
On Consolidated Financial Statements. Although India has made a public commitment towards IFRS
standards as that single set of global accounting standards, it has not yet formally committed to adopting
IFRS standards. However, the Indian Accounting Standards (Ind AS) that are mandated to all firms
whose securities trade in a public market are based on and substantially converged with IFRS standard.
Similarly, all Chinese public firms are required to use the Chinese Accounting Standards for Business
Enterprises (ASBEs) which have issued since February 2006 and been substantially converged with
IFRS, for financial reporting within mainland China. For firms listed in the Johannesburg Stock
Exchange (JSE) in South Africa, they are required to use IFRS standards effective from 1 January 2005.
In summary, currently, Brazil, Russia, and South Africa are categorized as countries in Group 1 that have
already adopted mandatory IFRS while India and China are in Group 2 that have set up a period for
adoption but not yet adopted. Within the conceptual framework of IFRS, prudence and conservatism are
not desirable qualities of financial reporting information (IASB, 2006a, BC2.22) as it is believed that the
consistent understatement of net assets is not an appropriate way to deal with uncertain transactions
(Hellman, 2008). In line with this, Piot, Dumontier, & Janin (2010) find that the level of conditional

215
conservatism in European firms decreases under IFRS. Similarly, Andre & Filip (2012) find that after
the adoption of IFRS, the conservatism of a sample of firms in 16 countries decreases overall, but this
result holds at country-level data only in France, Germany, Netherlands, Portugal, and Switzerland.
In addition to the quality of financial accounting standards, Ball, Kothari, & Robin (2000) suggest that a
law system, functioning as a proxy for the extent of political influence on accounting, also affects the
conservatism of firms’ accounting reports. By classifying countries into code-law (or civil-law) system
and common-law system, they find that firms in countries domiciled in a common-law system recognize
a loss in a timelier manner than firms in code-law countries. This is because code law is the system with
strong political influences where national accounting standards are established and enforced by
governments, following a planning-oriented and stakeholder model. Here, shareholdings are
concentrated, and debt tends to be private, resolving information asymmetry through inside
communication, and recognizing income based on each stakeholder interests. Conversely, accounting
standards in common-law countries are determined mainly in the private sector. As common law is under
the market-oriented and shareholder model where shareholders and bondholders are diverse, information
asymmetry is resolved through public disclosure rather than through inside communication. This makes
litigation costs of firms in common-law countries high, therefore, they are more demanded for
conservative reports (Ball et al., 2000). In this study, Brazil, China, and Russia are classified as code-law
countries while India and South Africa are classified as common-law countries. Taken together, firms in
Brazil and Russia may report lower level of conservatism than other countries in BRICS group as they
are in the institutional settings (mandatorily adopt IFRS and follow the code-law system) where there is
less demand for being conservative in financial reporting.
5.2.4. Tax-motivated conservatism
Accounting numbers are usually estimated to serve two main objectives: (i) to be a basis for tax
payments; and (ii) to reflect firms’ economic situations for relevant stakeholders’ decision making. While
firms attempt to provide early and useful information to stakeholders through the use of conservative
accounting, firms simultaneously shift taxable income into the future (by delaying the recognition of
revenues) and defer tax payments (by accelerating the recognition of expenses). In other words,
accounting conservatism enables firms to reduce the present value of tax payments, which in turn
increases the value of a firm (Watts, 2003a). Therefore, tax avoidance can be an incentive for firms to

216
increase accounting conservatism, i.e., recording expenses and losses as early as possible (Qiang, 2007).
However, there is no requirement of a particular form of conservatism to achieve tax incentives.
Moreover, prior studies are still inconclusive on whether conditional conservatism (e.g., Bornemann,
2018; Gan, 2018) or unconditional conservatism (Asgari & Behpouri, 2013; Kim & Jung, 2007;
Purwantini, Chandrarin, & Assih, 2017; Qiang, 2007), or both (e.g., Lara, Osma, & Penalva, 2009) is
related to tax burdens (see Appendix 5.1).
In general, while some rules in recognizing accounting transactions for tax purposes and accounting
purposes are the same, others are somewhat different. For some particular transactions, tax codes are
primarily on a cash basis, whereas standards for accounting are more on an accrual basis. Due to book-
tax conformity, if firms are targeting to minimize taxable income, they usually manage book income.
Under this view, tax codes offer rules which are unconditional conservatism in nature in reducing book
income such as extra expenses to be deductible and expensing R&D expenses. Heltzer (2009) finds that
firms with taxable income greater than book income exhibit higher levels of unconditional conservatism
in their book income. Unlike unconditional losses which are realized from transactions, losses due to
conditional conservatism are usually based on unrealized decreases in market value. Therefore, rules in
the conditional form are barely allowed to be deductible in tax laws. Due to book-tax differences, firms
need to be careful with large book-tax differences because they may trigger scrutiny from tax authority
(Hoopes et al., 2012). As such, firms prefer to lower book income in order to narrow the difference
between a book and taxable income when they intend to minimize taxable income. Although both forms
can achieve this, Qiang (2007) argues that the unconditional form has some advantages over conditional
form by the fact that (i) it recognizes losses earlier before news occurs; (ii) it is independent from the
news so that easier to control; (iii) it has less costs to implement (e.g., no impairment test); and (iv) results
in fewer shocks from unexpected news so that smoother earnings. By proxy tax costs with the estimated
association between book and tax income, Qiang's (2007) results show that taxation induces
unconditional conservatism. Several studies also provide support of a positive association between
taxation and unconditional conservatism. For example, Asgari & Behpouri (2013) find that firms use
conservative accounting to reduce book-tax differences and corporate tax burdens drive unconditional
conservatism.
However, Lara et al. (2009) contend that in addition to delaying tax payments through unconditional
conservatism, firms can decrease their current net value of tax payments by shifting income from high

217
marginal tax rate periods to low marginal tax rate periods. The nature of unconditional conservative
accounting does not support the latter because the feature of its pre-determination makes firms inflexible
to shift income across periods. In contrast, under conditional conservatism, managers can use their
discretion to choose between delaying the revenue recognition for good news and accelerating the
recognition of losses for bad news. This makes conditional conservatism more flexible to conduct the
income-shifting plan. In other words, Lara et al. (2009) explain that when firms face with high marginal
tax rates, firms’ managers can discretionarily shift income towards future periods which are expected to
have lower marginal tax burdens through the strategies such as increasing the costs of goods sold and
increasing bad debt expenses. Consistent with their argument, Lara et al. (2009) find that for firms with
high marginal tax, managers respond to such pressure by increasing conditional conservatism. They
further demonstrate that unconditional conservatism is associated with tax pressures only when such
pressures do not change over time. Recently, Bornemann (2018) analyses the association between future
tax rate cuts and the levels of accounting conservatism and finds that in periods of steady tax rates,
conditional conservatism is strongly positive-associated with taxation, supporting the evidence of Lara
et al. (2009). Regardless of consideration of changes in the tax rate, Gan (2018) reveals that firms use
conditional conservatism to reduce actual tax burdens in the current period.
5.3. Hypotheses Development
As there is a strong association between taxable income and book income, it is not surprising that tax
incentives affect financial accounting choices (Shackelford & Shevlin, 2001). To minimize tax liability,
conservative accounting transactions is one mechanism to achieve it. This is because the accounting
conservatism results in a decrease in net income, which eventually reduces taxable income and tax
expenses, respectively. In other words, firms can reduce the current value of taxes by deferring their
income (Watts, 2003a). However, thus far, extant empirical research on the link between tax avoidance
and conservatism is relatively under-examined. Moreover, prior studies report that accounting
conservatism is influenced by a number of institutional factors (e.g., Andre & Filip, 2012; Ball, Kothari,
& Robin, 2000; Bushman & Piotroski, 2006; Xu & Lu, 2008). For instance, Bushman & Piotroski (2006)
argue that accounting conservatism is influenced by economy's institutional structures such as the
legal/judicial system, securities laws, and political economy because they create incentives that influence
the behaviours of market participants. Therefore, different jurisdictions may cause variations in the
demand for conservatism, particularly in jurisdictions located in less developed countries compared to

218
developed markets. The current study aims to fill this gap by examining the relationship between
accounting conservatism and tax avoidance to answer the question of whether firms apply conservative
accounting to reduce their tax liabilities in emerging markets.
Although prior literature demonstrates the relation between tax avoidance and accounting conservatism,
the results are not exclusive about what forms of conservatism is tax-motivated conservatism. As tax
codes, in general, do not allow firms to recognize losses if they do not yet occur, the tax deduction for
conditional conservatism (more timely loss recognition) then is limited by this principle (Basu, 2005;
Qiang, 2007). Conversely, unconditional conservatism allowing firms to carry out such actions as
expensing R&D expenses or advertisement expenses to predetermine the understated value of assets
since the record time (losses already occurred) facilitates the purpose of firm’s tax reduction. In line with
this notion, Heltzer (2009) finds that firms having taxable income more than book income present higher
levels of unconditional conservatism. Kim & Jung (2007) find that unconditional conservatism, rather
than conditional conservatism, is positively associated with the tax burden of firms. Qiang (2007) also
determines that tax burdens tend to induce unconditional conservatism. Similarly, Asgari & Behpouri
(2013) have reached the results that support the positive association between unconditional conservatism
and tax burdens.
As discussed above, prior studies report that unconditional conservatism, by nature, influences tax
burdens, and they have reached a consensus that taxation is associated with unconditional conservatism.
However, this study approaches its relationship from another perspective by investigating whether the
levels of unconditional conservatism in financial reporting results in levels of tax avoidance (reductions
of tax payments). Based on the argument of the higher the tax pressure, the more unconditional
conservatism, it is reasonable to expect that more unconditionally conservative accounting results in
more aggressive tax avoidance (less tax payments). Thus, the hypothesis to test this argument is as
follows:
H1: Ceteris paribus, unconditional conservatism is positively associated with tax
avoidance
Nevertheless, the results of other empirical studies (e.g., Bornemann, 2018; Gan, 2018; Lara et al., 2009)
suggest that conditional conservatism can also effectively minimize firms’ tax payments. Watts (2003)
explains that conservative accounting can be achieved in reducing the net present value of tax payments

219
by deferring tax payments through unconditional conservatism and by shifting income from periods when
marginal tax rates are high to periods that ones are low. For the latter of the two strategies, the
unconditional form of conservatism is not an efficient tool because it is not flexible to facilitate income
shifting across periods (Lara et al., 2009). Under unconditional conservatism, assets understated in the
current period are also translated into overstated net income in future periods. When statutory tax rates
(STR) increase, firms may face higher marginal tax rates, but they cannot make an adjustment with those
transactions that already recorded. In contrast, Lara et al. (2009) argue that when firms face with high
marginal tax rates, the principle of conditional conservatism allows managers to be more flexible in
making discretion on strategies, recognizing current losses on a very timely basis or delaying the
recognition of current gains to future periods in order to reduce current tax burdens. Their results show
that taxation induces not only unconditional conservatism, but also conditional conservatism. Based on
the above arguments, Bornemann (2018) shows that conditional conservatism is positively associated
with taxation when changes in tax rates are approaching. Moreover, Gan (2018) sheds more light on this
link by documenting that firms utilize conditional conservatism as a vehicle for tax avoidance to reduce
actual tax payments. Taken together, it is reasonable to expect that conditional conservatism can reduce
tax burdens even though change in tax rate is not taken into account. Thus, the second hypothesis to
examine the conjecture is as follows:
H2: Ceteris paribus, conditional conservatism is positively associated with tax
avoidance
5.4. Research Design
5.4.1. Data and sample description
The sample chosen to investigate the effect of accounting conservatism on tax avoidance in this study is
BRICS group of countries, i.e., Brazil, Russia, India, China, and South Africa63 during the period
spanning from 2006 to 2018. Financial data used in this study is sourced from Worldscope retrieved
through the Datastream Thomson Reuters database. The STR is collected from KPMG International
63 BRICS’s main objectives are to cooperate between the member nations for development in the area such as finance,
economy, agriculture, trade, science and technology, health, education, corporate and academic dialogue, crime, and security
(http://brics.itamaraty.gov.br/about-brics/information-about-brics).

220
Cooperative website.64 The information about IFRS adoption is retrived from the IFRS® Foundation
website.65 Lastly, following Hoon, Selmier, & Lien (2011), the legal system is defined based on the
JuriGlobe research group of the University of Ottawa.66 Due to the unique accounting practices, financial
firms are excluded from the study. Firms with no data in any year are also excluded from the sample. To
mitigate the effect of outliers, all continuous variables are winsorised at 1st and 99th percentile. This
results in a final sample containing 30,178 firm-year observations, corresponding to 5,568 unique firms.
As reported in Panel A of Table 5.1, the highest percentage of the total sample is from China (57%)
followed by India (37%), South Africa (3%), Brazil (3%) and Russia (2%). The sample distribution by
industry is given in Panel B of Table 5.1. It shows that 70% of the sample firms consist of those from
industrial sector (25%), consumer goods sector (20%), and basic materials sector (18%).
Table 5.1 Sample Distribution by Country and Industry
Panel A: Sample Distribution by Country
Country Observations Firms
N Pct. N Pct.
Brazil 594 2% 158 3%
Russia 427 1% 114 2%
India 11,525 38% 1,961 35%
China 15,098 50% 3,150 57%
South Africa 2,534 8% 185 3%
30,178 100% 5,568 100% Panel B: Sample Distribution by Industry
Industry Observations Firms
N Pct. N Pct.
Basic Materials 5,232 17% 987 18%
Consumer Goods 6,099 20% 1,101 20%
Consumer Services 2,385 8% 400 7%
Energy 882 3% 161 3%
Health Care 2,030 7% 382 7%
Industrials 7,767 26% 1,408 25%
Oil & Gas 1,477 5% 261 5%
Technology 2,365 8% 487 9%
Telecommunications 848 3% 173 3%
Utilities 1,093 4% 208 4%
30,178 100% 5,568 100%
This table presents the sample distribution by country and industry. The total observations are 30,178 from 5,568 companies
from the period of 2006-2018.
64 Source: https://home.kpmg/vg/en/home/services/tax1/tax-tools-and-resources/tax-rates-online/corporate-tax-rates-
table.html
65 Source: https://www.ifrs.org
66 Source: http://www.juriglobe.ca/eng/

221
5.4.2. The measures of variables
(a) Tax avoidance
Several methods are used in the literature to estimate the degree of tax avoidance. Most studies obtain
data from a firm’s financial statement to calculate the proxy of tax avoidance because tax returns are not
publicly reported by a firm, and it provides a limited assessment to external users (Hanlon & Heitzman,
2010). Following the definition offered by Hanlon and Heitzman (2010), tax avoidance is defined as
schemes that a corporation engages for the purpose of explicit tax reduction. This study does not
distinguish between legal avoidance activities and illegal evasion activities. That is, tax avoidance in this
context captures both certain tax positions (perfectly legal) and uncertain tax positions (either legal or
illegal transactions). As such, this study focuses on the total amount of tax avoided, rather than on the
specific actions, because specific actions taken provide different costs and benefits across countries.
Moreover, specific actions taken are unobservable in the setting of this study.
Prior research claims that the effective tax rate (ETR) captures a broad range of tax avoidance activities
which is consistent with the objective of this study ( e.g., Badertscher, Katz, & Rego, 2013; Chen et al.,
2010; Gaertner, 2014; Huseynov & Klamm, 2012; Laguir, Staglianò, & Elbaz, 2015; Lanis &
Richardson, 2012; Phillips, 2003; Steijvers & Niskanen, 2014). Justifications in using the GAAP-based
ETR as a proxy for tax avoidance are as follows: First, it is a financial statement metric which is visible
to investors (Wang & Kong, 2011) which means that it communicates directly to the users of financial
statement. Second, prior studies empirically report the relationship between tax avoidance and the GAAP
ETR. For instance, Thornton & Jaafar (2015) document that both private and public firms with affiliates
in tax havens present lower GAAP ETRs. Similarly, Armstrong et al. (2015) and Minnick & Noga (2010)
report that the GAAP ETR is statistically significantly associated with a compensation package for tax
executives and directors by setting the compensation contract that motives them to lower tax liability in
the long-run horizon. Moreover, Graham, Hanlon, Shevlin, & Shroff (2014) provide evidence from their
survey indicating that firms give the importance to the figure of GAAP ETR because it eventually reflects
the amount of after-tax accounting income.
Thus, this study employs the GAAP ETR to proxy the total consequences of tax avoidance. It is computed
by dividing the total tax expense by pre-tax book income for a given firm i in year t, as follows:

222
𝐸𝑇𝑅𝑖,𝑡 = 𝐼𝑛𝑐𝑜𝑚𝑒 𝑇𝑎𝑥𝑖,𝑡
𝑃𝑟𝑒𝑡𝑎𝑥 𝐵𝑜𝑜𝑘 𝐼𝑛𝑐𝑜𝑚𝑒𝑖,𝑡 (1)
where 𝐸𝑇𝑅𝑖,𝑡 is a one – year GAAP-based ETR67.
In this study, negative values of numerator and denominator in the ETR calculation model firstly are
winsorized to be zero before the ETR is calculated. It is possible that the negative income tax and the
negative pre-tax income might be the result of the manager’s attempt to reduce earnings, to some extent,
in order to reduce tax expenses. Therefore, such values should not be excluded from the investigation.
Secondly, following extant research, ETR is constrained to range between 0 and 1 (Chen et al., 2010;
Dyreng, Hanlon, & Maydew, 2008; Lisowsky, 2010).
(b) Accounting conservatism
In assessing the effects of firms’ level of conservatism on tax avoidance, this study uses two measures
of accounting conservatism to proxy for conservative accounting: C-score by Khan & Watts (2009) to
proxy for conditional conservatism, and negative accruals by Givoly & Hayn (2000) to proxy for
unconditional conservatism.
The conditional Conservatism
The first proxy is to measure the conditional conservatism, the so-called C-score. The C-score of Khan
& Watts (2009) is further developed based on Basu’s (1997) seminal asymmetric timeliness model in
order to allow firm-year estimations.68 In capital markets, all related information including reported
earnings by firms are incorporated in stock prices on a timely basis. Therefore, changes in stock prices
can be proxied for news arriving during the period. Under conservative accounting, bad news is reflected
in earnings faster than good news because good news requires higher standards of recognition than bad
news. To capture this differential timing of good news and bad news being recognized and reflected in
67 The context of this study is not suitable to use long-term ETR because long- term ETR is suggested to use for dealing with
the volatility presenting in annual ETR (Hanlon & Heitzman, 2010; Salihu et al., 2013). Typically, earnings management is
the action undertaken in an effort to mislead the true position of the current period income which is used to calculate the
amount of the income tax liability. Therefore, it is more reasonable to use the same period ETR to examine the association
between tax avoidance and earnings management.
68 The measure of Basu’s (1997) asymmetric timeliness is based on data providing variation in conservatism only over time,
and not across firms.

223
earnings, Basu’s (1997) uses stock return (results of stock price changes) to proxy for good news (positive
returns) and bad news (negative returns) and expects a higher association between negative returns and
earnings from the following model:
𝑋𝑖 = 𝛽0 + 𝛽1𝐷𝑖 + 𝛽2𝑅𝐸𝑇𝑖 + 𝛽3(𝐷𝑖 ∗ 𝑅𝐸𝑇𝑖) + 휀𝑖 (2)
where 𝑋𝑖 is net income before extraordinary items scaled by the firm’s market value of equity at the
beginning of the year. 𝑅𝐸𝑇𝑖 is the closing price of the company’s stock at their fiscal year end. 𝐷𝑖 denotes
a dummy variable that equals 1 if 𝑅𝐸𝑇𝑖 < 0 (bad news) and set to 0 otherwise (good news).
In this equation, if earnings are conservative, it would incorporate bad news earlier than good news and
indicate a positive coefficient on the interaction term (𝛽3), the incremental timeliness of earnings to bad
news relative to good news. That is, the larger 𝛽3, the higher the levels of conditional conservatism. For
other coefficients, 𝛽2 captures the responsiveness of earnings to positive return (good news), and 𝛽2 +
𝛽3 captures the responsiveness to negative return (bad news). As the Basu’s model does not capture the
variation of conservatism across firms, Khan & Watts (2009) propose that a level of conditional
conservatism of a certain firm depends on its size, leverage, and market-to-book ratio. They then develop
the C-score method to measure the asymmetric timeliness of earnings to bad news over good news at the
firm level as presented below:
𝐺 − 𝑠𝑐𝑜𝑟𝑒 = 𝛽2 = 𝛾0 + 𝛾1𝑆𝑖𝑧𝑒𝑖 + 𝛾2𝑀𝑇𝐵𝑖 + 𝛾3𝐿𝑒𝑣𝑖 (2a)
𝐶 − 𝑠𝑐𝑜𝑟𝑒 = 𝛽3 = 𝜇0 + 𝜇1𝑆𝑖𝑧𝑒𝑖 + 𝜇2𝑀𝑇𝐵𝑖 + 𝜇3𝐿𝑒𝑣𝑖 (2b)
where𝑆𝑖𝑧𝑒𝑖 is the natural log of market value of equity, 𝑀𝑇𝐵𝑖 is the firm’s market-to-book ratio and 𝐿𝑒𝑣𝑖
denotes total debt scaled by market value of equity at the beginning of the year. These three firm-specific
factors are incorporated into the linear functions to estimate the earnings responsiveness to good news
(G-Score) and the incremental timeliness response of bad news (C-Score) at the firm level. Substituting
equations (2a) and (2b) into equation (2) derives the annual cross-sectional regression model proposed
by Khan and Watts (2009):

224
𝑋𝑖=𝛽0 + 𝛽1𝐷𝑖 + 𝛽2𝑅𝐸𝑇𝑖(𝛾0 + 𝛾1𝑆𝑖𝑧𝑒𝑖 + 𝛾2𝑀𝑇𝐵𝑖 + 𝛾3𝐿𝑒𝑣𝑖) + 𝛽3(𝐷𝑖 ∗ 𝑅𝐸𝑇𝑖)(𝜇0 +
𝜇1𝑆𝑖𝑧𝑒𝑖 + 𝜇2𝑀𝑇𝐵𝑖 + 𝜇3𝐿𝑒𝑣𝑖) + 𝜕1𝑆𝑖𝑧𝑒𝑖 + 𝜕2𝑀𝑇𝐵𝑖 + 𝜕3𝐿𝑒𝑣𝑖 + 𝜕4(𝐷𝑖 ∗ 𝑆𝑖𝑧𝑒𝑖) +
𝜕5(𝐷𝑖 ∗ 𝑀𝑇𝐵𝑖) + 𝜕6(𝐷𝑖 ∗ 𝐿𝑒𝑣𝑖) + 휀𝑖 (3)
Under the C-score method in equation (3), the coefficients 𝛾𝑖 and 𝜇𝑖 are estimated using annual cross-
sectional regressions and therefore vary over time, but not in the cross-section. The annual coefficients
𝛾𝑖 and 𝜇𝑖 are then used to estimate G-score (2a) and C-score (2b). Cross-sectional variation in C-score
is added through cross-sectional variation in firm-level characteristics (size, the market-to-book ratio and
leverage). Thus, the C-score measures firm-level conservatism across years with higher reliability and
validity for empirical testing. As the C-score indicates the incremental timeliness response of bad news,
the larger 𝛽3, the more conditionally conservative the firm. After deriving the C-score, it is included as
an independent variable in the regression model in this study to examine whether conditional
conservatism is associated with higher tax avoidance.
The unconditional conservatism
The second measure is the accrual-based method proposed by Givoly & Hayn, 2000 and generally used
to measure the degree of unconditional conservatism (e.g., Asgari & Behpouri, 2013; Kim & Jung, 2007;
Qiang, 2007; Yuniarsih, 2018). Although conservatism is an accounting criterion selected in order to
minimize the cumulative reported earnings either by faster (slower) expense (revenue) recognition, or
low (higher) asset (liability) valuation, the sum of earnings over a business life cycle must be the same
regardless of the accounting choice (Givoly & Hayn, 2000). Under this view, Givoly & Hayn (2000)
argue that the cumulative net income before depreciation and amortization are then expected to converge
to cash flow from operation in the long run. Given that net income is recognized on an accrual basis
which tends to be reversed in the future period, conservatism can be identified by the magnitude and sign
of the accumulated accruals over a long period of time. That is, if firms report a consistent and prominent
negative-accruals over a long period, their financial reporting can be identified as conservative reporting.
Following prior research (e.g., Ahmed, Billings, Morton, & Stanford-Harris, 2002; Ahmed & Duellman,
2013; Bornemann, 2018; Givoly & Hayn, 2000), this study defines the accrual-based measure (i.e., the
persistent use of negative accruals) as net income before extraordinary items less cash flow from
operations plus depreciation expense deflated by average total assets and averaged over the previous

225
three years, multiplied by negative one. The larger estimated values indicate the greater unconditional
conservatism.
5.4.3. Research model
To test whether firms’ level of accounting conservatism is positively associated with tax avoidance (H1
and H2), this study uses the following model estimating with the whole sample:
𝑇𝑎𝑥𝐴𝑣𝑜𝑖𝑑𝑖,𝑡 = 𝛼0 + 𝛼1𝐴𝑐𝑐_𝐶𝑜𝑛𝑖,𝑡 + ∑ 𝛼𝑛9𝑛=2 𝐶𝑜𝑛𝑡𝑟𝑜𝑙𝑖,𝑡
𝑓𝑖𝑟𝑚+ ∑ 𝛼𝑛
11𝑛=10 𝐶𝑜𝑛𝑡𝑟𝑜𝑙𝑖,𝑡
𝑐𝑜𝑢𝑛𝑡𝑟𝑦+
∑ 𝛼𝑛16𝑛=12 𝐹𝑖𝑥𝑒𝑑 𝐸𝑓𝑓𝑒𝑐𝑡𝑖,𝑡
𝑐𝑜𝑢𝑛𝑡𝑟𝑦 + ∑ 𝛼𝑛
26𝑛=17 𝐹𝑖𝑥𝑒𝑑 𝐸𝑓𝑓𝑒𝑐𝑡𝑖,𝑡
𝑖𝑛𝑑𝑢𝑠𝑡𝑟𝑦 +
∑ 𝛼𝑛39𝑛=27 𝐹𝑖𝑥𝑒𝑑 𝐸𝑓𝑓𝑒𝑐𝑡𝑖,𝑡
𝑦𝑒𝑎𝑟+ 휀𝑖,𝑡 (4)
where 𝑇𝑎𝑥𝐴𝑣𝑜𝑖𝑑𝑖,𝑡 is an annual effective tax rate, a proxy for tax avoidance measured as income tax
divided by pre-tax income for firm i in year t. 𝐴𝑐𝑐_𝐶𝑜𝑛𝑖,𝑡 indicates firms’ level of accounting
conservatism: i) the conditional form measured as the C-score of Khan & Watts (2009), and ii) the
unconditional form measured as the cumulative negative accruals of Givoly & Hayn (2000).
𝐶𝑜𝑛𝑡𝑟𝑜𝑙𝑖,𝑡𝑓𝑖𝑟𝑚
and 𝐶𝑜𝑛𝑡𝑟𝑜𝑙𝑖,𝑡𝑐𝑜𝑢𝑛𝑡𝑟𝑦
are control variables at a firm level and a country level, respectively,
for firm i in year t. 𝐹𝑖𝑥𝑒𝑑 𝐸𝑓𝑓𝑒𝑐𝑡𝑖,𝑡𝑐𝑜𝑢𝑛𝑡𝑟𝑦
, 𝐹𝑖𝑥𝑒𝑑 𝐸𝑓𝑓𝑒𝑐𝑡𝑖,𝑡𝑖𝑛𝑑𝑢𝑠𝑡𝑟𝑦
, and 𝐹𝑖𝑥𝑒𝑑 𝐸𝑓𝑓𝑒𝑐𝑡𝑖,𝑡𝑦𝑒𝑎𝑟
are country-,
industry-, and year-fixed effects, respectively.
Prior studies (Dyreng et al., 2008; Gupta & Newberry, 1997; Lietz, 2013; Phillips, 2003; Wilson, 2009a)
show that a range of control variables which influence tax avoidance include firm size (Size), financial
leverage (Lev), firm growth (Growth), firm net operating losses (Loss), firm firm capital intensity
(CapInt), firm intangible intensity (IntangInt), dividend payout (DivPayout), and firm closely-held
shares69 (CloseHeld). As firms are economic units operating in environments modelled by and expected
by institutions which influence their behaviour (Campbell and Lindberg, 1991; Campbell, 2007), it is
worth controlling for institutional factors affecting the level of tax avoidance. Given that this study uses
an international dataset with differences in accounting standards and regulation enforcement across
69 The closely-held share represents shares held by insiders. For companies with more than one class of common stock,
closely held shares for each class is added together. It includes but is not restricted to shares held by cross holdings
(corporations and holding companies), corporations (incl. real estate companies), holding Company, government, employees,
and individuals/insiders (Thompson Reuter, 2019).

226
countries, the adoption of the International Financial Reporting Standards (IFRS) and the legal origin
(LawSys) are used to control for country-level factors.
Firm size (Size) is measured by the natural logarithm of total assets. Dyreng et al. (2008) suggest that
firm size may play a role in the firm’s engagement in tax avoidance. Based on the theory of political cost,
Watts and Zimmerman (1986, p. 235) explain that firms with higher visibility are subjected to comply
with greater regulatory activity, hence, a negative association between firm size and tax avoidance
(Minnick & Noga, 2010; Rego, 2003). Nevertheless, others report the results in line with a positive
relation (under the notion of the political power or clout theory), assuming that larger companies having
more resources to make more lobbying and participate in more complex tax planning activities (e.g.
Siegfried (1972), p. 32-36, Siegfried (1974), Stickney and McGee (1982), Porcano (1986) in Lietz, 2013).
Wilson, (2009b) finds that larger firms are more tax aggressive as shown in a positive relation between
tax shelter participation and firm size.
Financial leverage (Lev) is defined as long-term debt liability divided by total assets. Generally, leverage
represents the degree of complexities of firms’ financial transactions. Highly leveraged firms, at first
glance, could be more able to reduce taxes through the use of complicated financing transactions,
suggesting a positive association between tax avoidance and firm leverage (Mill et al., 1998 in Dunbar
et al., 2010; Lietz, 2013). Alternatively, leveraged firms may have a relatively strong incentive to avoid
taxes to preserve cash to service the debt burden (Badertscher, Katz, & Rego, 2010). However, since
firms with a high level of leverage incur more interest expenses which are deducted from taxable
income70, they may have less need to be tax aggressive as they face less pressure to draw on alternative
non-debt tax shields (Graham & Tucker, 2006).
Capital intensity (CapInt) is defined as net property, plant & equipment (PP&E) divided by total assets,
and intangible intensity (IntangInt) is defined as the total of intangible assets divided by total assets.
Since firms with high intensity of physical plant and equipment (firms with high levels of PP&E) are
more visible to the public (Clarkson et al., 2008), they are usually expected to have more tax planning
opportunities (Dyreng et al., 2008). Gupta & Newberry (1997) report that firm capital intensity is related
70 Leveraged firms already have benefits from a tax shield (Wrightsman, 1978) which thereby relatively a weak motivation
to reduce more tax (Badertscher et al., 2010).

227
to tax benefits because of tax-deductible accelerated depreciation relative to the actual asset lives.
Previous studies include R&D expenditures to control for tax credits available for particular R&D
activities (Dyreng et al., 2008). Unfortunately, information about R&D expense is not available in the
setting of this study. Thus, the amount of intangible assets, which is assumed to be positively correlated
with the firm’s level of R&D expenses (Markle & Shackelford, 2012), is observed instead.
Firm growth (SalesGrowth) is defined as changes in net sales divided by total assets. More profitable
firms have been argued that they have a greater incentive to reduce their tax burden relative to lesser
profitable firms (Dunbar et al., 2010). Similarly, Phillips (2003) concludes that firms with growth
opportunities exhibit greater ability to engage in tax avoidance activities. However, top-line growth firms
are subjected to increasing applicable tax rates as their incomes increase, suggesting that such firms could
report higher ETR.
Dividend pay-out (DivPayout) is defined as dividends per share divided by earnings per share and then
multiplied by 100. Several studies (Amiram, Bauer, & Frank, 2013; Chatty & Saez, 2005; Desai &
Dharmapala, 2006) find that tax policies of ownership and shareholder dividends influence managers to
engage in corporate tax avoidance. If managers are committed to increasing the benefit of shareholders,
the positive relation between tax avoidance and dividend pay-out is expected. On the other hand,
managers are more likely to put their effort towards the strategy of upward book income and downward
taxable income at the same time in order to increase profits which eventually increase the pay-out of
dividends.
Firm closely-held shares (CloseHeld) is defined as the percentage of a number of closely held shares in
relative to the common shares outstanding. Amiram et al. (2013) argue that firms with a higher proportion
of closely-held shares have more alignment between managers and shareholders, thereby accentuating
the incentives to engage in corporate tax avoidance. Therefore, those firms are expected to have higher
levels of tax avoidance to increase shareholder’s profits.
The legal origin (LawSys) is defined as a dummy variable equal to 1 if firms are domiciled in country
complying with civil law and 0 otherwise. Managers are less likely to engage in tax avoidance when
managers perceive that government enforcement of tax rules is strong. This is because they believe that
strong enforcement leads to higher expected probability of detection and tax authorities may impose
additional taxes plus penalties (Atwood et al., 2012), thereby discouraging tax avoidance. Consistent with

228
Desai, Dyck, & Zingales (2007), they find that tax payments increase, related party trades are curtailed,
and tax haven entities are abandoned following an increase in tax enforcement after. This study uses the
legal origins to proxy for political influence on accounting standards. As civil law is categorized as less
strength of law enforcement due to the influence of institutional characteristics (e.g., family and political
connections) (Gassen et al., 2006; Lara and Mora, 2004), and as low investor protection by the World
Economic Forum’s 2012/2013 Global Competitiveness Report, the positive association between a law
origins and tax avoidance is expected.
The adoption of the International Financial Reporting Standards (IFRS) is defined as a dummy variable
equal to 1 in the year and after, when firms adopt IFRS, and 0 otherwise. The shift to the use of IFRS
leads to changes in accounting method, which also bring differences in the current treatment of tax basis.
The adoption of IFRS, therefore, should be possible to give the impact on tax strategies because tax
calculation is based on the measurement and recognition of accounting transactions. More specifically,
it is argued that the adoption of IFRS reduces the level of book-tax conformity (Chan et al., 2010; Chan
et al., 2013; Chen & Gavious, 2017; Karampinis & Hevas, 2013), thereby reducing the impact on tax
after the post-IFRS period (Hung & Subramanyam, 2007). The opponents argue that the reduction of
book-tax conformity offers a convenient way for a manager to avoid more tax because they do not face
the trade-off decision between increasing book income and decreasing taxable income. Another possible
condition that can explain the increased levels of tax avoidance after IFRS adoption is the possible
increase in discretionary accruals available within IFRS framework (Ahmed et al., 2013; Lin et al., 2012).
Atwood, Drake, Myers, & Myers (2012), Frank et al. (2009) and Wilson, (2009) report that an increased
aggressiveness of accruals is associated with greater tax avoidance. Similarly, Braga (2017) find that
after the adoption of IFRS, firms are associated with higher levels of corporate tax avoidance. All
variables are summarized in Appendix 5.2.
Both H1 and H2 predict that the levels of accounting conservatism, either conditional or unconditional
form, are positively associated with tax avoidance. The coefficients of proxies for conservatism are then
expected to be negative where the higher the levels of conservatism, the lower the effective tax rate (i.e.,
the higher tax avoidance).

229
5.5. Results
5.5.1. Univariate analysis
(a) Trends of tax avoidance and accounting conservatism
Figure 5.1 Panel A shows the trends of averages of ETR and the STR over the sample period. Overall,
the average STR is higher than the average of ETR, suggesting avoidance of tax to some extent. The
trends demonstrate that STR and ETR gradually decline over time, i.e., STR has reduced from 34% to
28%, and the ETR has decreased from 24% to approximately 22%. Overall, the averages of STR and
ETR converge, leading the reduced gap between them from 10.29% difference in 2006 to 4.98%
difference in 2013. From 2014, the averages of STR and ETR have gradually diverged, making the
increased gap between STR and ETR.
Figure 5.1 Panel B reports the trends of firms’ practices of conservative accounting both in forms of
conditional conservatism (the C-score) and unconditional conservatism (accumulated negative accruals).
Overall, while the accumulated negative accruals are likely stable at range of -0.01 to -0.03, the averages
of C-score are clearly fluctuated by alternating up and down every year with the highest value of 0.35 in
2010 and the lowest value of -0.18 in 2013.
(b) Descriptive statistics
Table 5.2 summarizes descriptive statistics of the sample. Based on the full sample, Panel A shows that
the annual ETR mean value is 23% which is 6% lower than the mean value of STR. The mean (median)
of C_Score is 0.083 (0.098) while the mean (median) of Acc_NegAccru is -0.023 (-0.016). For other
firm-characteristic variables, the mean (median) of Size is 12.867 (12.957), of Lev is 0.103 (0.05), of
CapInt is 0.311 (0.273), of SalesGrowth is 0.066 (0.047), of IntangInt is 0.066 (0.023), of Cashholding
is 0.061 (0.021), DivPay is 23.404 (19.67), of CloseShare is 50.935 (54.770). In the case of country-
specific characteristics, 53.4% of the sample firms domiciled in civil law countries, and 55.7% adopt
IFRS during the sample period.
Table 5.2 Panel B depicts descriptive statistics at the country level. Consistent with overall results, the
mean of annual ETR is lower the mean of STR in all countries, except for Russia. In particular, Brazil
has 9% ETR lower than STR, India has 7% ETR lower than STR, China has 6% ETR lower STR, and

230
South Africa has 3% ETR lower than STR. The possible reason leading ETR in Russian firms higher
than STR is that they are charged other withholding taxes as a part of the corporate tax. In particular,
9% tax on dividends and 15% when they are international firms, 20% on royalties and interests if firms
operating in a country which has no tax treaty signed with Russia, 30% on social contribution tax for
firms having income of around 567,000 Russian rubles and 10% more if the profit exceeds this amount.
With respect to accounting conservatism variables, China presents the highest mean value of C_Score
and is the only country having the mean value higher than the overall mean value. For Acc_NegAccr,
Russia has the highest mean value, while India has the lowest value and is the only country having lower
mean value than overall mean value. Based on descriptive statistics at industry level, Table 5.2 Panel C
demonstrates that all industries exhibit lower mean value of ETR comparing to the mean value of STR.
Specifically, while technology industry (Ind.8) presents the highest differences between ETR and STR
of around 10%, the energy industry (Ind.4) shows the lowest differences of 3%. The difference between
ETR and STR of firms in other industries (basic materials, consumer goods, and industrials) of the sample
seems to be at a moderate level at around 6%. The industry of technology shows the highest mean value
of C_Score, while the utility industry presents the highest mean value of Acc_NegAccr.
(c) Variables correlation
Table 5.3 presents the Pearson correlations for the variables used in the main regression analysis. The
annual ETR are negatively correlated with C_Score (p < .001) as expected, but it is positively correlated
with Acc_NegAccru (p < .001). Among the correlation between annual ETR and other firm- and country-
control variables, the annual ETR is unlikely to be correlated only with DivPay and it can be readily
observed that none of them is larger than 0.3. However, some correlations between other determinants
present strong linear relationship; that is, the correlation between IFRS and LawSys with the coefficient
of 0.822 (p < .001) and the correlation between IFRS and Size with the coefficient of 0.502 (p < .001).
In addition to the results from Pearson correlation matrix, the results of the variance inflation factor
(VIFs) also show that no VIFs exceed four for any of the explanatory variables, suggesting that
multicollinearity in the model is not an issue.

231
Figure 5.1 Trend of tax avoidance and accounting conservatism
Panel A: Trend of the average ETR against the average STR

232
Figure 5.1 Trend of tax avoidance and accounting conservatism
Panel B: Trend of the average C_score and accumulated negative accruals
The figures in Panel A are plotted from the mean value of STR against the mean value of ETR. The figures in Panel B are
plotted from the mean value of the measure of conditional conservatism (C_Score) against the mean value of measure of
unconditional conservatism (accumulated negative accruals). The summarized data used to plot all figures are provided in
Appendix 5.3.

233
Table 5.2 Descriptive Statistics
Panel A: Overall variable summary
Variables N Mean 25% Median 75% SD
Tax avoidance:
annualETR 30178 0.232 0.137 0.225 0.314 0.154
Statutory tax rate 30178 0.293 0.25 0.28 0.34 0.045
Accounting Conservatism:
C_Score 30178 0.083 -0.016 0.098 0.182 0.206
Acc_NegAccru 30178 -0.023 -0.049 -0.016 0.01 0.064
Control variables:
Firm-level:
Size 30178 12.867 11.662 12.957 14.114 1.911
Lev 30178 0.103 0 0.05 0.162 0.132
CapInt 30178 0.311 0.134 0.273 0.461 0.218
SalesGrowth 30178 0.066 -0.018 0.047 0.142 0.215
IntangInt 30178 0.066 0.001 0.023 0.075 0.108
Cashholding 30178 0.061 0.002 0.021 0.087 0.090
DivPay 30178 23.404 3.14 19.67 34.48 21.782
CloseShare 30178 50.935 38.16 54.77 68.43 23.753
Country-level:
LawSys 30178 0.534 0.000 1.000 1.000 0.499
IFRS 30178 0.557 0.000 1.000 1.000 0.497

234
Table 5.2 Descriptive Statistics (Cont’d)
Panel B: Country mean value for all variables
Variables Overall Brazil Russia India China S. Africa
Tax avoidance:
annualETR 0.232 0.249 0.257 0.267 0.197 0.283
Statutory tax rate 0.293 0.34 0.202 0.339 0.254 0.315
Accounting Conservatism:
C_Score 0.083 0.052 0.052 0.042 0.117 0.076
Acc_NegAccru -0.023 0.000 0.009 -0.032 -0.019 -0.010
Control variables:
Firm-level:
Size 12.867 14.444 14.724 11.509 13.7 13.399
Lev 0.103 0.213 0.189 0.127 0.075 0.128
CapInt 0.311 0.262 0.518 0.339 0.276 0.367
SalesGrowth 0.066 -0.004 0.021 0.073 0.068 0.043
IntangInt 0.066 0.173 0.044 0.032 0.082 0.102
Cashholding 0.061 0.061 0.053 0.033 0.077 0.099
DivPay 23.404 37.552 27.176 17.175 25.014 38.190
CloseShare 50.935 48.246 71.721 59.792 46.370 34.980
Country-level:
LawSys 0.534 1.000 1.000 0.000 1.000 0.000
IFRS 0.557 0.926 0.754 0.000 0.944 0.662
N 30,178 594 427 11,525 15,098 2,534

235
Table 5.2 Descriptive Statistics (Cont’d)
Panel C: Industry variable mean value against overall mean value
Variables Overall Ind.1 Ind.2 Ind.3 Ind.4 Ind.5 Ind.6 Ind.7 Ind.8 Ind.9 Ind.10
Tax avoidance:
annualETR 0.232 0.240 0.241 0.246 0.251 0.214 0.236 0.237 0.182 0.213 0.235
Statutory tax rate 0.293 0.300 0.298 0.302 0.281 0.289 0.292 0.285 0.283 0.287 0.274
Accounting Conservatism:
C_Score 0.083 0.067 0.083 0.094 0.085 0.108 0.079 0.059 0.114 0.100 0.059
Acc_NegAccru -0.023 -0.023 -0.019 -0.018 -0.007 -0.029 -0.026 -0.042 -0.026 -0.018 0.005
Control variables:
Firm-level:
Size 12.867 12.747 12.550 12.542 14.415 12.611 12.907 13.599 12.398 13.276 14.557
Lev 0.103 0.111 0.097 0.076 0.134 0.078 0.100 0.185 0.049 0.074 0.240
CapInt 0.311 0.396 0.309 0.324 0.440 0.289 0.277 0.212 0.180 0.230 0.549
SalesGrowth 0.066 0.069 0.067 0.086 0.067 0.076 0.062 0.024 0.085 0.061 0.028
IntangInt 0.066 0.042 0.060 0.058 0.070 0.099 0.067 0.023 0.114 0.111 0.073
Cashholding 0.061 0.047 0.063 0.062 0.064 0.064 0.065 0.055 0.080 0.079 0.042
DivPay 23.404 21.069 23.655 28.049 21.595 23.209 23.859 21.914 21.010 23.880 28.458
CloseShare 50.935 53.940 53.504 54.019 55.266 47.612 49.713 50.183 39.319 45.769 57.008
Country-level:
LawSys 0.534 0.448 0.494 0.415 0.672 0.580 0.542 0.628 0.629 0.571 0.814
IFRS 0.557 0.470 0.516 0.475 0.664 0.588 0.570 0.689 0.638 0.634 0.727
n 30178 5232 6099 2385 882 2030 7767 1477 2365 848 1093
This table presents descriptive statistics for the main variables used in this analysis.
The variable computations are described in Appendix 5.2 unless definitions noted here: annualETR refers to annual effective tax rate, STR refers to the statutory tax rate,
C_Score refers to the proxy for conditional conservatism, Acc_NegAccru is accumulated negative accruals (the proxy for unconditional conservatism) Size refers to size
of firms based on total assets, Lev refers to firm leverage, CapInt refers to the intensity of firms’ capital, SalesGrowth refers to firms’ growth, IntangInt refers to intensity
of firm’s intangible assets, Cashholding refers to cash that firms are holding, DivPay refers to dividend payout, CloseShare refers to the number of closely held shares,
LawSys refers to the country’s law origin, IFRS refers to the adoption of IFRS.

236
Table 5.3 Variable Correlation
Standard errors in parentheses
*, ** and *** indicate the level of significance at p<0.05, p<0.01, and p<0.001, respectively, using Pearson tests.
Variables (1) (2) (3) (4) (5) (6) (7) (8) (9) (10) (11) (12) (13)
(1) annualETR 1
(2) C_Score -0.05 *** 1
(3) Acc_NegAccru 0.055 *** 0.024 *** 1
(4) Size -0.05 *** 0.125 *** 0.098 *** 1
(5) Lev 0.080 *** -0.13 *** 0.023 *** 0.194 *** 1
(6) CapInt 0.032 *** -0.09 *** 0.200 *** 0.059 *** 0.411 *** 1
(7) SalesGrowth -0.030 *** 0.044 *** -0.05 *** 0.028 *** -0.01 -0.04 *** 1
(8) IntangInt -0.06 *** 0.062 *** 0.079 *** 0.164 *** 0.014 * -0.24 *** 0.005 1
(9) Cashholding -0.02 ** 0.039 *** 0.108 *** 0.156 *** -0.13 *** -0.2 *** 0.047 *** 0.003 1
(10) DivPay 0.009 0.068 *** 0.097 *** 0.223 *** -0.06 *** 0.027 *** -0.03 *** 0.044 *** 0.097 *** 1
(11) CloseShare 0.085 *** -0.1 *** 0.020 *** -0.08 *** 0.062 *** 0.106 *** -0 -0.16 *** -0.05 *** -0.04 *** 1
(12) LawSys -0.22 *** 0.158 *** 0.082 *** 0.497 *** -0.17 *** -0.14 *** -0.01 0.180 *** 0.169 *** 0.105 *** -0.17 *** 1
(13) IFRS -0.18 *** 0.156 *** 0.080 *** 0.502 *** -0.14 *** -0.14 *** -0.07 *** 0.245 *** 0.157 *** 0.175 *** -0.27 *** 0.82 *** 1
N 30178

237
5.5.2. Multivariate analysis
The current study performs a series of tests to ensure that the sample data satisfy the underlying
assumptions of the classical OLS linear regression model and the regression’s results would be reliable.
The results show that both heteroskedasticity and autocorrelation may be an issue. Thus, the models are
regressed with the robust standard errors in order to mitigate those two issues.
(a) The effect of accounting conservatism on tax avoidance
In analysing whether accounting conservatism affects tax avoidance in BRICS countries, the Equation
(4) has been separately regressed on each measure of conservatism (i.e., C_Score for conditional form
and Acc_NegAccru for unconditional form) across firm-year observations and controlled for other firm-
and country-specific variables. In order to choose an appropriate model, this study firstly conducts F-test
to determine whether the pooled OLS model or fixed effect model is more suitable with the sample. The
statistic of 3.67 (p < .001) in the model with C_Score and of 3.65 (p < .001) in the model with
Acc_NegAccru indicate that the fixed-effects model is more appropriate for both. Then, the Hausman
test is conducted to compare between the fixed-effects model and random-effects model. The statistics
of the Hausman test is 84.82 (p < .001) in the model with C_Score and 112.87 (p < .001) in the model
with Acc_NegAccru, suggesting that the fixed-effects model is more suitable to use in investigating the
hypotheses of this study.
Table 5.4 presents the regression results addressing H1 and H2. The results indicate that Acc_NegAccru
is positively associated with the annual ETR (𝛼 = 0.185, p < 0.01), impying that unconditional
conservatism is negatively associated with tax avoidance. Although the result contradicts to the H1, this
negative association between accumulated negative accruals and tax avoidance is consistent with
Purwantini, Chandrarin, & Assih (2017) and Yuniarsih (2018), who also find that tax avoidance is not
the reason behind the practice of conservatism accounting. The C_Score is negatively associated with
the annual ETR (𝛼 = -0.016, p < 0.05), lending support to H2 predicting that conditional conservatism is
positively associated with tax avoidance. This negative association between the C_Score and the annual
ETR is consistent with the results in the study of Gan (2018) and also confirms the study of Lara, Osma,
& Penalva (2009), which report that taxation does induce not only unconditional conservatism but also
conditional conservatism.
238
Regarding control variables, all variables are statistically associated with the annual ETR, except cash
intensity (Cashholding) in the model regressed with Acc_NegAccru. The regression coefficient for firm
size (Size) using the logarithm of total assets is positively significant with ETR, suggesting that the larger
firms pay more tax as shown at higher levels of the annual ETR (Dyreng et al., 2008; Huseynov &
Klamm, 2012; Minnick & Noga, 2010). The coefficients on firm leverage (Lev) is positively associated
with the annual ETR, suggesting that high leveraged firms are unlikely to engage in tax avoidance. This
may be due to a high level of leverage incurs more interest expenses which are deducted from taxable
income, high leveraged firms hence have less incentive to avoid tax. The coefficients on the capital
intensity (CapInt) is negatively associated with the annual ETR, consistent with Huseynov & Klamm
(2012). The intensity of intangible assets (IntangInt), a proxy of R&D expenses in this study, is also
negatively associated with the annual ETR. These results suggest that firms avoid tax through the
investments in assets that generate more claims on R&D credit (Belz et al., 2017; Gao et al., 2016b;
Koester et al., 2017). A higher level of sales growth (SalesGrowth) is significantly associated with a
lower level of the annual ETR, suggesting that firms with higher net sales avoid more tax as they have a
greater incentive to reduce their tax burden (Dunbar et al., 2010).
Inconsistent with the prediction, the results also show that firms having more alignment between
managers and shareholders (CloseHeld) pay more tax. Similarly, the dividend pay-out per share
(DivPayout) and the annual ETR are positively associated. These results can be explained that more
aligned firms commit to increasing profits for shareholders, leading to higher tax liability due to the result
of increased incomes. Considering the country-specific variables, firms in the country with civil law
(LawSys) have lower annual ETR as expected because the low level of investor protection represents
less enforcement of law and regulations.71 After the adoption of IFRS, firms report lower annual ETR,
supporting the argument asserting that IFRS adoption reduces the level of book-tax conformity (Chan et
al., 2010; Chan et al., 2013; Chen & Gavious, 2017; Karampinis & Hevas, 2013). That is, it is plausible
that IFRS adoption allows managers not to face with the trade-off decision between book and taxable
income, and thereby more convenient way to engage in greater tax avoidance (Desai, 2005; Hanlon et
al., 2005).
71 Consistent with La Porta et al, 1998, common law origin presents characteristics in comply with attributes of strong investor
protection.

239
Table 5.4 The Relation between Tax Avoidance and Accounting Conservatism
Variables
Exp. Sign Tax Avoidance
Measure as one-year ETR
Accounting Conservatism:
C_Score (-) -0.016 **
(0.007)
Acc_Negaccru (-)
0.185 ***
(0.016)
Control Variables:
Firm-level:
Size (+/-) 0.005 *** 0.005 ***
(0.001)
(0.001)
Lev (+/-) 0.037 *** 0.047 ***
(0.010)
(0.010)
CapInt (-) -0.04 *** -0.054 ***
(0.005)
(0.006)
IntangInt (-) -0.046 *** -0.061 ***
(0.009)
(0.009)
SalesGrowth (-) -0.018 *** -0.016 ***
(0.005)
(0.005)
Cashholding (-) 0.021 ** 0.005
(0.010)
(0.010)
DivPay (-) 0.000 ** 0.000 *
(0.000)
(0.000)
CloseShare (-) 0.000 *** 0.000 ***
(0.000)
(0.000)
Country-level:
LawSys (-) -0.044 *** -0.047 ***
(0.009)
(0.008)
IFRS (-) -0.028 *** -0.03 ***
(0.005)
(0.005)
Fixed effects:
Country, Industry, Year Yes
Yes
Constant 0.226 *** 0.236 ***
(0.011)
(0.011)
adj. R2 0.072
0.077
F 77.797
83.737
N 30178 30178
Robust standard errors clustered at the firm level are in parentheses.
*, ** and *** indicate the level of significance at p<0.1, p<0.05, and p<0.01, respectively, using two tailed tests.

240
The table reports regression results of the following fixed-effect model using OLS estimation with robustness of standard
errors:
𝑇𝑎𝑥𝐴𝑣𝑜𝑖𝑑𝑖,𝑡 = 𝛼0 + 𝛼1𝐴𝑐𝑐_𝐶𝑜𝑛𝑖,𝑡 + ∑ 𝛼𝑛
9
𝑛=2
𝐶𝑜𝑛𝑡𝑟𝑜𝑙𝑖,𝑡𝑓𝑖𝑟𝑚
+ ∑ 𝛼𝑛
11
𝑛=10
𝐶𝑜𝑛𝑡𝑟𝑜𝑙𝑖,𝑡𝑐𝑜𝑢𝑛𝑡𝑟𝑦
+ ∑ 𝛼𝑛
16
𝑛=12
𝐹𝑖𝑥𝑒𝑑 𝐸𝑓𝑓𝑒𝑐𝑡𝑖,𝑡𝑐𝑜𝑢𝑛𝑡𝑟𝑦
+ ∑ 𝛼𝑛
26
𝑛=17
𝐹𝑖𝑥𝑒𝑑 𝐸𝑓𝑓𝑒𝑐𝑡𝑖,𝑡𝑖𝑛𝑑𝑢𝑠𝑡𝑟𝑦
+ ∑ 𝛼𝑛
39
𝑛=27
𝐹𝑖𝑥𝑒𝑑 𝐸𝑓𝑓𝑒𝑐𝑡𝑖,𝑡𝑦𝑒𝑎𝑟
+ 휀𝑖,𝑡
where: TaxAvoid is tax avoidance proxied through annualETR, calculated by dividing income tax by pretax income;
Acc_Con refers to accounting conservatism proxied through C_Score, a measure of conditional conservatism, and
Acc_NegAccru, a measure of unconditional conservatism;
CONTROLS are set of control variables where Size refers to size of firms based on total assets, Lev refers to firm
leverage, SalesGrowth refers to firm growth, Cashholding refers to cash that firms are holding, CapInt refers to the
intensity of firms’ capital assets, IntangInt refers to the intensity of firms’ intangible assets, CloseHeld refers to the
closely-held shares, DivPayout refers to dividend payout per share, LawSys refers to the country’s law origins, and
IFRS refers to the adoption of IFRS. The variables are measured as follows;
Firm-level:
Size = The natural logarithm of total assets;
Lev = The ratio of long-term debt liability and total assets;
CapInt = The ratio of gross property, plant, equipment and total assets;
IntangInt = The ratio of intangible assets and total assets;
Cashholding = The ratio of cash and total assets;
SalesGrowth = The ratio of changes in net sale and total assets;
DivPayout = The ratio of dividends per share and earnings per share multiplied by 100;
CloseHeld = The ratio of number of closely held shares and common shares outstanding;
Country-level:
IFRS = The dummy variable equal to 1 in the year and after when firms adopt IFRS, and 0 otherwise;
LawSys = The dummy variable equal to 1 if firms are in country complying with civil law and 0
otherwise.
FIXED EFFECTS refer to country, industry, and year fixed effect: five countries, ten industries, and thirteen years.

241
(b) Robustness tests
Alternative measures of ETRs
As a denominator of ETR calculation in the main analysis is pre-tax book incomes which is subject to
accounting standards mandated in each country, the results may be distorted due to differences in
accounting choices across countries. In mitigating such possible problem, this study follows Jaafar &
Thornton (2015) using the alternative ETR calculated as firms' current tax expense divided by their
operating cash flows. Gupta & Newberry (1997) and Zimmerman (1983) indicate that cash flows from
operations help reduce systematic differences in the selection of accounting methods across different
jurisdictions. Furthermore, prior studies have used cash effective tax rate as a proxy of tax avoidance
(e.g., Chen et al., 2010; Dyreng, Hanlon, & Maydew, 2010; Rego, 2003). Dyreng et al. (2010) state that
the cash ETR, measured as cash tax paid divided by pre-tax income, can capture firms’ strategies of tax
deferring, and also represents a summary of the explicit reductions in tax burdens. As tax deferring (by
deferring income) is considered as one important way to reduce taxes through conservative accounting,
Gan (2018) argues that cash ETR can be more effectively captured the results of tax reductions through
conservatism. The cash ETR thus is employed as the second alternative measure of ETR. As in the main
analysis, cash ETRs are truncated between the value of 0 and 1 to facilitate an interpretable outcome
(Dyreng et al., 2008). By replacing tax avoidance measure in Equation (4) with Cash ETRs, the results
are consistent with the main results for both ETR measures as demonstrated in Table 5.5.

242
Table 5.5 Tax avoidance and accounting conservatism using alternative measures of
ETRs
Variables
Exp.
Sign
Tax Avoidance
Cash tax paid / Pretax book
income
Income tax / Operating cash
flow
Conservatism:
C_Score (-) -0.043 ***
-0.126 **
(0.012)
(0.124)
Acc_NegAccru (+)
0.382 ***
0.578 ***
(0.031)
(0.216)
Controls
included Yes
Yes
Yes
Yes
Fixed Effects:
Cntry, Ind, Yr Yes
Yes
Yes
Yes
Constant 0.403 *** 0.425 *** 0.362 *** 0.395 ***
(0.021)
(0.021)
(0.051)
(0.061)
adj. R2 0.166
0.171
0.003
0.003
F 192.493
194.843
17.922
17.945
N 30178 30178 30178 30178
Robust standard errors clustered at the firm level are in parentheses.
*, ** and *** indicate the level of significance at p<0.1, p<0.05, and p<0.01, respectively, using two tailed tests.
The table reports regression results of the following fixed-effect model using OLS estimation with robustness of standard
errors:
𝑇𝑎𝑥𝐴𝑣𝑜𝑖𝑑𝑖,𝑡 = 𝛼0 + 𝛼1𝐴𝑐𝑐_𝐶𝑜𝑛𝑖,𝑡 + ∑ 𝛼𝑛
9
𝑛=2
𝐶𝑜𝑛𝑡𝑟𝑜𝑙𝑖,𝑡𝑓𝑖𝑟𝑚
+ ∑ 𝛼𝑛
11
𝑛=10
𝐶𝑜𝑛𝑡𝑟𝑜𝑙𝑖,𝑡𝑐𝑜𝑢𝑛𝑡𝑟𝑦
+ ∑ 𝛼𝑛
16
𝑛=12
𝐹𝑖𝑥𝑒𝑑 𝐸𝑓𝑓𝑒𝑐𝑡𝑖,𝑡𝑐𝑜𝑢𝑛𝑡𝑟𝑦
+ ∑ 𝛼𝑛
26
𝑛=17
𝐹𝑖𝑥𝑒𝑑 𝐸𝑓𝑓𝑒𝑐𝑡𝑖,𝑡𝑖𝑛𝑑𝑢𝑠𝑡𝑟𝑦
+ ∑ 𝛼𝑛
39
𝑛=27
𝐹𝑖𝑥𝑒𝑑 𝐸𝑓𝑓𝑒𝑐𝑡𝑖,𝑡𝑦𝑒𝑎𝑟
+ 휀𝑖,𝑡
where: TaxAvoid is tax avoidance proxied through CashETR, calculated by dividing cash tax paid by pre-tax income, and
ETR calculated by dividing income tax by cash flow from operating activities. Other variables are as defined in Table
5.4.

243
Sensitivity test with the 2SLS analysis for endogeneity concern
Although this study examines the effect of accounting conservatism on tax avoidance, the nature of
taxation and conservatism may cause reverse relationship, one of endogeneity problem.72 To mitigate
this concern, this study repeats the main analysis (the Equation 4) using instrumental variables (IV) with
the Two-Stage Least Squares (2SLS) estimation and employs lagged conservatism (i.e., lagged C_Score
and lagged Acc_NegAccru) as instruments. Lagged conservatism variables are closely associated with
current conservatism variables (because firms would avoid to make significant changes in accounting
conservatism so that their earnings keeping smooth) and thought to have no direct association with the
outcome (Gan, 2018). The results are consistent with OLS results reported earlier as reported in Table
5.6. To ensure the endogeneity problem of conservatism variables, the hypothesis testing whether the
C_Score and Acc_NegAccru are exogenous are executed. Both Durbin test and Wu-Hausman test report
a very small p-value which suggests rejecting the null hypothesis, and the model is correct in treating
C_Score and Acc_NegAccru as endogenous variables. In addition, all the R2 statistics in the first-stage
regression to confirm the relevance of instrumental variables are relatively high, suggesting that the
instruments are sufficiently correlated with C_Score and Acc_NegAccru. Therefore, they do not imply
a weak-instrument problem.
(c) Additional analyses
Tax avoidance and accounting conservatism at a country level
The association between tax avoidance and accounting conservatism may vary across countries due to
differences in institutional settings. This study thus investigates the relationship at the country level by
re-estimating the main regression model with the sample data of each country separately. Table 5.7
reports the regression results for the relationship between tax avoidance and earnings management at the
country level. The findings show that only China has consistent results with the main findings.
Specifically, the coefficients on C_Score is negatively and significantly associated with the annual ETR
(𝛼 = -0.047, p < 0.01) and Acc_NegAccru are positively and significantly associated with the annual
72 In general, the problem of endogeneity occurs when an explanatory variable in a regression is correlated with the
regression’s disturbance term, which possibly arises from (i) omitted variables, (ii) reverse causality, and (iii) measurement
error (Robert and Whited, 2012).

244
ETR (𝛼 = 0.173, p < 0.01). These results imply that firms in China use conditional conservatism as a tool
in lowering their tax burden. Firms in Brazil, India, and South Africa presents statistically significant
results only on the measure of unconditional conservatism, consistent with the main results. For Russia
firms, it is not statistically significant on both measures of accounting conservatism, suggesting that
conservatism cannot be explained in the context of tax avoidance in Russian firms.

245
Table 5.6 Tax avoidance and accounting conservatism using 2SLS estimation
Variables
Exp. Sign Tax Avoidance
OLS Estimationa
2SLS Estimation
Accounting Conservatism:
C_Score (-) -0.016 **
-0.021 *
-0.007
-0.051
Acc_NegAccru (+)
0.185 ***
0.064 ***
-0.016
-0.024
Controls included Yes
Yes
Yes
Yes
Fixed Effects:
Country, Industry, Year Yes
Yes
Yes
Yes
Constant 0.226 *** 0.236 *** 0.229 *** 0.235 ***
-0.011
-0.011
-0.011
-0.012
Adj. R2 0.072
0.077
0.071
0.068
Wald Chi2
2575.42 *** 1895.48 ***
Tests of endogeneity:
(Ho: variables are exogenous)
Durbin chi2
3.437 ** 73.111 ***
Wu-Hausman F
3.436 ** 73.272 ***
First-stage regression:
R2
0.0623
0.546
Adj. R2
0.062
0.546
Part. R2
0.0002
0.498
F
8.7038 *** 27116 ***
N 30,178 30,178 30,178 30,178
Robust standard errors clustered at the firm level are in parentheses.
*, ** and *** indicate the level of significance at p<0.1, p<0.05, and p<0.01, respectively, using two tailed tests.
a Results from table 5.4
The table reports regression results of the following fixed-effect model using 2SLS estimation with robustness of standard
errors:
𝑇𝑎𝑥𝐴𝑣𝑜𝑖𝑑𝑖,𝑡 = 𝛼0 + 𝛼1𝐴𝑐𝑐𝐶𝑜𝑛𝑖,𝑡+ ∑ 𝛼𝑛
9
𝑛=2
𝐶𝑜𝑛𝑡𝑟𝑜𝑙𝑖,𝑡𝑓𝑖𝑟𝑚
+ ∑ 𝛼𝑛
11
𝑛=10
𝐶𝑜𝑛𝑡𝑟𝑜𝑙𝑖,𝑡𝑐𝑜𝑢𝑛𝑡𝑟𝑦
+ ∑ 𝛼𝑛
16
𝑛=12
𝐹𝑖𝑥𝑒𝑑 𝐸𝑓𝑓𝑒𝑐𝑡𝑖,𝑡𝑐𝑜𝑢𝑛𝑡𝑟𝑦
+ ∑ 𝛼𝑛
26
𝑛=17
𝐹𝑖𝑥𝑒𝑑 𝐸𝑓𝑓𝑒𝑐𝑡𝑖,𝑡𝑖𝑛𝑑𝑢𝑠𝑡𝑟𝑦
+ ∑ 𝛼𝑛
39
𝑛=27
𝐹𝑖𝑥𝑒𝑑 𝐸𝑓𝑓𝑒𝑐𝑡𝑖,𝑡𝑦𝑒𝑎𝑟
+ 휀𝑖,𝑡
All variables are as defined in Table 5.4.

246
Table 5.7 Tax avoidance and accounting conservatism at country level
Countries annualETR - Conservatism
Countries annualETR - Conservatism
C_Score Acc_NegAccru
C_Score
Acc_NegAccru
Brazil 0.038
0.302 * Russia -0.076
0.152
(0.057)
(0.158)
(0.076)
(0.16) FE: Ind and Yr Yes
Yes
FE: Ind and Yr Yes
Yes
adj. R2 0.036
0.045
adj. R2 0.042
0.041
F 2.252
2.264
F 1.988
2.042
N 594
594
N 427
427
Countries annualETR - Conservatism
Countries annualETR - Conservatism
C_Score Acc_NegAccru
C_Score
Acc_NegAccru
India -0.011
0.078 *** China -0.047 *** 0.173 ***
(0.011)
(0.03)
(0.012)
(0.019)
FE: Ind and Yr Yes
Yes
FE: Ind and Yr Yes
Yes
adj. R2 0.030
0.030
adj. R2 0.054
0.058
F 12.709
13.081
F 29.382
32.470
N 11525
11525
N 15098
15098
Countries annualETR - Conservatism
C_Score Acc_NegAccru
S.Africa 0.03
0.437 ***
(0.024)
(0.066)
FE: Ind and Yr Yes
Yes
adj. R2 0.177
0.202
F 22.553
24.975
N 2534 2534
Robust standard errors clustered at the firm level are in parentheses.
*, ** and *** indicate the level of significance at p<0.1, p<0.05, and p<0.01, respectively, using two tailed tests.
The following regressions are estimated cross-sectionally with fixed-effect model for the sample period 2006-2018. The
ordinary least square (OLS) is used with firm-level clustered standard errors for the estimation of the p-values.
𝑇𝑎𝑥𝐴𝑣𝑜𝑖𝑑𝑖,𝑡 = 𝛼0 + 𝛼1𝐴𝑐𝑐_𝐶𝑜𝑛𝑖,𝑡 + ∑ 𝛼𝑛
9
𝑛=2
𝐶𝑜𝑛𝑡𝑟𝑜𝑙𝑖,𝑡𝑓𝑖𝑟𝑚
+ ∑ 𝛼𝑛
19
𝑛=10
𝐹𝑖𝑥𝑒𝑑 𝐸𝑓𝑓𝑒𝑐𝑡𝑖,𝑡𝑖𝑛𝑑𝑢𝑠𝑡𝑟𝑦
+ ∑ 𝛼𝑛
32
𝑛=20
𝐹𝑖𝑥𝑒𝑑 𝐸𝑓𝑓𝑒𝑐𝑡𝑖,𝑡𝑦𝑒𝑎𝑟
+ 휀𝑖,𝑡
The definitions are as described above in Table 5.4.

247
The effect of Big4 auditors on tax avoidance and accounting conservatism relationship
Using tax consulting services from accounting audit firms is one of the options for firms to succeed in
their tax-saving goal. Many prior studies find that synergies between audit and tax work within the same
audit firm help in planning opportunities for tax savings (Dhaliwal et al., 2013; Seetharaman, Sun, &
Wang, 2011). In this line, Omer, Bedard, & Falsetta (2006) find a negative relationship between using
auditor-provided tax services and subsequent changes in tax rates. Gleason & Mills (2011) note that using
auditor-provided tax services is associated with lower US tax expenses. Hogan & Noga (2015) also find
that the auditor-provided tax services are negatively associated with the five-year average annual cash
ETRs. In the extant literature, many studies use Big4 firms as representative of large audit firms73 to
investigate the audit quality (e.g., Behn et al., 2008; Cassell et al., 2013; Francis & Yu, 2009; Lai, 2013).
McGuire, Omer, & Wang (2012) and Janssen, Vandenbussche, & Crabbé (2005) find that clients using
tax services from their audit firm engage in greater tax avoidance when their external audit firm is tax
expertise proxied through Big4. Using Big4 audit firms may also have an impact on accounting
conservatism because as offering higher audit quality compared to their peers, Big4 firms are not likely
to compromise their reputation with clients’ questionable accounting practices. As such, the tendency to
use conservative accounting for tax purposes may be constrained. However, it can be the case that the
tax-reducing effects of accounting conservatism is more pronounced for firms hiring Big4 firms as their
external auditors. In order to reduce risks from shareholder lawsuits, typically argue that liabilities and
expenses are understated and/or that revenues and assets are overstated, auditors are motivated to report
earnings conservatively (Basu, Hwang, & Jan, 2001).
In analysing the effect of audit expertise on the relationship between tax avoidance and accounting
conservatism, Big4 audit firms measured as a dichotomous variable equal to 1 if firms use Big4 audit
and 0, otherwise. Further, an interaction term of Big4 and accounting conservatism are added into the
model (Equation (4)). Table 5.8 shows that the coefficients of Big4 are positively associated with the
annual ETR, suggesting that firms using services from Big4 firms pay higher tax (i.e. less tax avoidance).
73 DeAngelo (1981) claims that audit quality is driven by many factors including the size of audit firm which can measure
through a market share; the larger market shares the audit firm has, the more expert the audit firm is.

248
However, the coefficients of the interaction terms are insignificant, suggesting that hiring Big4 as the
firms’ external auditor does not affect the tax reducing impact of accounting conservatism.
Table 5.8 The effect of Big4 auditor on tax induced conservatism
Variables
Exp. Sign Tax Avoidance
Measure as one-year ETR
C_Score - -0.021
(0.014)
Acc_NegAccru - 0.277 ***
(0.028) Big4 Auditor / 0.013 *** 0.015 ***
(0.004) (0.003) C_Score * Big 4 Auditor + 0.023
(0.018)
Acc_NegAccru * Big 4 Auditor + 0.034 -0.047 FE: Country, Industry, and Year
Yes Yes
adj. R2 0.084 0.097
F 34.36 40.545 N 11800 11800
Robust standard errors clustered at the firm level are in parentheses.
*, ** and *** indicate the level of significance at p<0.1, p<0.05, and p<0.01, respectively, using two tailed tests.
The table reports regression results of the following fixed-effect model using OLS estimation with robustness of standard
errors:
𝑇𝑎𝑥𝐴𝑣𝑜𝑖𝑑𝑖,𝑡 = 𝛼0 + 𝛼1𝐴𝑐𝑐_𝐶𝑜𝑛𝑖,𝑡 + 𝛼2𝐴𝑢𝑑𝑖𝑡𝑜𝑟𝑖,𝑡 + 𝛼3(𝐴𝑐𝑐_𝐶𝑜𝑛𝑖,𝑡 ∗ 𝐴𝑢𝑑𝑖𝑡𝑜𝑟𝑖,𝑡) + ∑ 𝛼𝑛
11
𝑛=4
𝐶𝑜𝑛𝑡𝑟𝑜𝑙𝑖,𝑡𝑓𝑖𝑟𝑚
+ ∑ 𝛼𝑛
13
𝑛=12
𝐶𝑜𝑛𝑡𝑟𝑜𝑙𝑖,𝑡𝑐𝑜𝑢𝑛𝑡𝑟𝑦
+ ∑ 𝛼𝑛
18
𝑛=14
𝐹𝑖𝑥𝑒𝑑 𝐸𝑓𝑓𝑒𝑐𝑡𝑖,𝑡𝑐𝑜𝑢𝑛𝑡𝑟𝑦
+ ∑ 𝛼𝑛
28
𝑛=19
𝐹𝑖𝑥𝑒𝑑 𝐸𝑓𝑓𝑒𝑐𝑡𝑖,𝑡𝑖𝑛𝑑𝑢𝑠𝑡𝑟𝑦
+ ∑ 𝛼𝑛
41
𝑛=29
𝐹𝑖𝑥𝑒𝑑 𝐸𝑓𝑓𝑒𝑐𝑡𝑖,𝑡𝑦𝑒𝑎𝑟
+ 휀𝑖,𝑡
where: Auditory refers to the dummy variable equal to 1 if firms use the audit service from Deloitte & Touche, Ernst &
Young, PricewaterhouseCoopers, and KPMG, and 0 otherwise. Other variables are as defined in Table 5.4.

249
Net operating loss and the relationship between tax avoidance and conservatism
Generally, losses from business operation are considered as a net operating losses (NOL) which can be
carried forward to offset with firm profits in the following periods. Therefore, firms with NOL at the
beginning of the current period may have less incentive to participate in tax avoidance (Dunbar et al.,
2010; Lietz, 2013; Minnick & Noga, 2010). Moreover, having NOL may influence the effect of
accounting conservatism on tax reduction. Because the brought forward NOL in the current period might
be results of firms being conservative in the previous period, the existence of NOL may reduce the
sensitivity of tax-reducing effect of accounting conservatism. Therefore, the effect of accounting
conservatism on tax avoidance may be less pronounced for firms having NOL at the beginning of the
current period.
To test the prediction above, NOL, measured as 1 if firms have negative net incomes in the previous
year, and 0 otherwise, and an interaction term of NOL and accounting conservatism are added into the
model (Equation 4). The coefficient of NOL is expected to be positive, of accounting conservatism to be
negative, and of the interaction term to be positive so that the overall tax reduction effect can be
moderated. Table 5.9 reports the regression results indicating that the coefficients of accounting
conservatism and of NOL are significant with the expected sign while the coefficients of the interaction
terms are not significant. The results suggest that firm with operating losses have less incentives to reduce
their tax burden, but such losses do not influence the tax reducing effect of accounting conservatism.

250
Table 5.9 Regression results for the effect of NOL on tax induced conservatism
Variables
Exp. Sign Tax Avoidance
Measure as one-year ETR
C_Score - -0.015 **
(0.007)
Acc_NegAccru -
0.184 ***
(0.016)
NOL + 0.012 ** 0.006 **
(0.006)
(0.005)
C_Score * NOL + -0.005
(0.021)
Acc_NegAccru * NOL +
-0.021
-0.069
FE: Country, Industry, and Year Yes
Yes
adj. R2 0.072
0.077
F 73.806
80.333
N 30178 30178
Robust standard errors clustered at the firm level are in parentheses.
*, ** and *** indicate the level of significance at p<0.1, p<0.05, and p<0.01, respectively, using two tailed tests.
The table reports regression results of the following fixed-effect model using OLS estimation with robustness of standard
errors:
𝑇𝑎𝑥𝐴𝑣𝑜𝑖𝑑𝑖,𝑡 = 𝛼0 + 𝛼1𝐴𝑐𝑐_𝐶𝑜𝑛𝑖,𝑡 + 𝛼2𝑁𝑂𝐿𝑖,𝑡 + 𝛼3(𝐴𝑐𝑐_𝐶𝑜𝑛𝑖,𝑡 ∗ 𝑁𝑂𝐿𝑖,𝑡) + ∑ 𝛼𝑛
11
𝑛=4
𝐶𝑜𝑛𝑡𝑟𝑜𝑙𝑖,𝑡𝑓𝑖𝑟𝑚
+ ∑ 𝛼𝑛
13
𝑛=12
𝐶𝑜𝑛𝑡𝑟𝑜𝑙𝑖,𝑡𝑐𝑜𝑢𝑛𝑡𝑟𝑦
+ ∑ 𝛼𝑛
18
𝑛=14
𝐹𝑖𝑥𝑒𝑑 𝐸𝑓𝑓𝑒𝑐𝑡𝑖,𝑡𝑐𝑜𝑢𝑛𝑡𝑟𝑦
+ ∑ 𝛼𝑛
28
𝑛=19
𝐹𝑖𝑥𝑒𝑑 𝐸𝑓𝑓𝑒𝑐𝑡𝑖,𝑡𝑖𝑛𝑑𝑢𝑠𝑡𝑟𝑦
+ ∑ 𝛼𝑛
41
𝑛=29
𝐹𝑖𝑥𝑒𝑑 𝐸𝑓𝑓𝑒𝑐𝑡𝑖,𝑡𝑦𝑒𝑎𝑟
+ 휀𝑖,𝑡
where: NOL refers to the dummy variable equal to 1 if the firm’s net income less than 1, and 0 otherwise. Other variables
are as defined in Table 5.4.
5.6. Conclusion
This study attempts to fill the gap in the literature by empirically examining the relationship between tax
avoidance and accounting conservatism in emerging countries. In particular, the current study analyses
whether tax-reducing incentive drives firms to be conservative in the form of conditional and/or
unconditional conservatism in their financial accounting. Using a large sample of firms domiciled in
BRICS (Brazil, Russia, India, China, and South Africa), the evidence shows that conditional

251
conservatism is negatively associated with firms’ annual effective tax rate. On the contrary, unconditional
conservatism is positively related to the annual effective tax rate of the sample firms. These results
suggest that firms in BRICS use conditional, rather unconditional, conservative accounting to reduce tax
liabilities. However, these results hold only with the sample from China when the models are tested at
the country level. Although the tax-motivated conservatism is not detected when the measure of
conditional conservatism is used, the positive association between the effective tax rate and unconditional
conservatism does significantly hold for the sample data in Brazil, India, and South Africa. This study
does not detect tax-motivated conservatism in either form in Russian firms. Furthermore, the findings
also show that firms using services from Big4 firms pay higher tax (i.e. less tax avoidance), but it does
not affect the tax-reducing impact of accounting conservatism. Similarly, firms with operating losses
have less incentives to reduce their tax burden, but such losses do not influence the tax reducing effect
of accounting conservatism.
The findings of this study have implications for several interested parties. This study contributes to
academia by providing evidence for the unresolved debate about what forms of accounting conservatism
can reduce tax liabilities. Although several studies lean on the premise that taxation induces
unconditional conservatism, this study provides evidence that conditional conservatism has a direct
impact on tax reductions, supporting the findings of Lara et al. (2009), who find that a high tax rate
creates incentives for manager to shift income to a period with a lower tax rate and this strategy induces
conditional conservatism. Shedding additional insights on the association between accounting
conservatism and tax avoidance allows standard setters to have a better understanding of accounting
conservatism's overall effects, which could help them to improve policies for discouraging firms from
using accounting conservatism to avoid taxes. This study can assist tax authorities in developing methods
to detect firms' tax avoidance practices through information from financial statements. Moreover, this
study alerts investors, who have a heightened interest in firms' tax avoidance activities when making
investment decisions, to be aware of firms' using conservative accounting, because they may also engage
in tax avoidance activities.
However, this study is subject to some limitations. First, the sample is limited to publicly listed firms and
to only five countries as the representatives of advanced emerging countries. Secondly, the measures of
tax avoidance (the GAAP ETR) are based on financial statement data whose accuracy cannot be
guaranteed. Further, the accounting standard and tax ruled firms complying with are different across

252
countries in the sample. Finally, even though this study captures accounting conservatism in the form of
both conditional and unconditional conservatism, each form is proxied by only one measure. This is
where the ability to generalize the findings is limited and the results may be suffered from estimation
errors to some extent. Thus, caution should be taken when interpreting the results. For further research,
additional work could investigate which specific firms’ characteristics affect the managers’ decision in
choosing the approach to manage earnings through accounting conservatism to diminish tax burden.
Furthermore, it would be relevant to examine the extent to which the use of a particular form of
conservatism for the purposes of tax avoidance is influenced by managerial self-interests and how the
markets and a firm's stakeholders respond to the firm's choices.
References
Ahmed, A. S., Billings, B. K., Morton, R. M., & Stanford-Harris, M. (2002). The Role of Accounting
Mitigating and in Conservatism in over Conflicts Bondholder-Sharehol Dividend Policy Reducing
Debt Costs. The Accounting Review, 77(4), 867–890.
Ahmed, A. S., & Duellman, S. (2013). Managerial Overconfidence and Accounting Conservatism.
Journal of Accounting Research, 51(1), 1–30. https://doi.org/10.1111/j.1475-679X.2012.00467.x
Ahmed, A. S., Neel, M., & Wang, D. (2013). Does mandatory adoption of IFRS improve accounting
quality? Preliminary evidence. Contemporary Accounting Research, 30(4), 1344–1372.
https://doi.org/10.1111/j.1911-3846.2012.01193.x
Amiram, D., Bauer, A. M., & Frank, M. M. (2013). Corporate Tax Avoidance and Managerial Incentives
Generated by Shareholder Dividend Tax Policy. CAAA Annual Conference and the European
Accounting Association.
Andre, P., & Filip, A. (2012). Accounting Conservatism in Europe and the Impact of Mandatory IFRS
Adoption: Do country, institutional and legal differences survive?
Asgari, M. R., & Behpouri, M. A. (2013). Investigating the effect of tax costs on accounting
conservatism: Evidence from Tehran Stock Exchange. Management Science Letters, 4, 5–10.
https://doi.org/10.5267/j.msl.2013.12.007
Atwood, T. J., Drake, M. S., Myers, J. N., & Myers, L. a. (2012). Home country tax system characteristics
and corporate tax avoidance: International evidence. The Accounting Review, 87(6), 1831–1860.
https://doi.org/10.2308/accr-50222

253
Badertscher, B. A., Katz, S. P., & Rego, S. O. (2013). The separation of ownership and control and
corporate tax avoidance. Journal of Accounting and Economics, 56(2–3), 228–250.
https://doi.org/10.1016/j.jacceco.2013.08.005
Badertscher, B., Katz, S. P., & Rego, S. O. (2010). The Impact of Private Equity Ownership on Portfolio
Firms’ Corporate Tax Planning.
Ball, R., Kothari, S. P., & Robin, A. (2000). The Effect of International Instutional Factors on Properties
of Accounting Earnings. Journal of Accounting and Economics, 29(1), 1–51.
Ball, R., & Shivakumar, L. (2005). Earnings quality in UK private firms: Comparative loss recognition
timeliness. Journal of Accounting and Economics, 39(1), 83–128.
https://doi.org/10.1016/j.jacceco.2004.04.001
Bartelsman, E. J., & Beetsma, R. (2000). Why Pay More? Corporate Tax Avoidance through Transfer
Pricing in OECD Countries. Journal of Public Economics, 87(9–10), 2225–2252.
Basu, S. (1997). The Conservatism Principle and the Asymmetric Timeliness of Earnings. Journal of
Accounting and Economics, 24, 3–37. https://doi.org/10.1016/S0165-4101(97)00014-1
Basu, S. (2005). Discussion of ‘“Conditional and Unconditional Conservatism: Concepts and
Modeling.”’ Review of Accounting Studies, 10, 311–321.
Basu, S., Hwang, L., & Jan, C.-L. (2001). Differences in Conservatism between Big Eight and non-Big
Eight Auditors.
Behn, B. K., Choi, J., & Kang, T. (2008). Audit Quality and Properties of Analyst Earnings Forecasts.
The Accounting Review, 83(2), 327–349. https://doi.org/10.2308/accr.2008.83.2.327
Belz, T., Hagen, D. Von, & Steffens, C. (2017). R&D Intensity and The Effective Tax Rate: A Meta-
Regression analysis. Journal of Economic Survey, 31(4), 988–1010.
https://doi.org/10.1111/joes.12181
Borker, D. R. (2012). Accounting, Culture, And Emerging Economies: IFRS In The BRIC Countries.
Journal of Business & Economics Research (JBER), 10(5), 313.
https://doi.org/10.19030/jber.v10i5.6983
Bornemann, T. (2018). Tax Avoidance and Accounting Conservatism. SSRN Electronic Journal.
https://doi.org/10.2139/ssrn.3114054
Braga, R. N. (2017.) Effects of IFRS adoption on tax avoidance. Revista Contabilidade & Finanças,
28(75), 407-424.

254
Bushman, R. M., & Piotroski, J. D. (2006). Financial Reporting Incentives for Conservative Accounting:
The Influence of Legal and Political Institutions. Journal of Accounting and Economics, 42(1–2),
107–148. https://doi.org/10.1017/CBO9781107415324.004
Campbell, J. L. (2007). Why Would Corporations Behave in Socially Responsible Ways? An
Institutional Theory of Corporate Social Responsibility. The Academy of Management Review,
32(3), 946–967.
Campbell, J. L., Lindberg, L., & Campbell, J. L. (1991). The evolution of governance regimes. Morality,
Rationality, and Efficiency: New Perspectives on Socio-economics, 227.
Cassell, C. A., Giroux, G., Myers, L. A., & Omer, T. C. (2013). The Emergence of Second-Tier Auditors
in the US: Evidence from Investor Perceptions of Financial Reporting Credibility. Journal of
Business Finance and Accounting, 40(3–4), 350–372. https://doi.org/10.1111/jbfa.12016
Chan, K. Hung, Lin, K. Z., & Mo, P. L. L. (2010). Will a departure from tax-based accounting encourage
tax noncompliance? Archival evidence from a transition economy. Journal of Accounting and
Economics, 50(1), 58–73. https://doi.org/10.1016/j.jacceco.2010.02.001
Chan, Koon Hung, Lin, K. Z., & Tang, F. (2013). Tax effects of book-tax conformity, financial reporting
incentives and firm size. Journal of International Accounting Research, 12(2), 1–25.
https://doi.org/10.2308/jiar-50404
Chatty, R., & Saez, E. (2005). Dividend Taxes and Corporate Behavior: Evidence from the 2003
Dividend Tax Cut. Oxford Journal, 120(3), 791–833.
Chen, E., & Gavious, I. (2017). The roles of book-tax conformity and tax enforcement in regulating tax
reporting behaviour following International Financial Reporting Standards adoption. Accounting
and Finance, 57, 681–699. https://doi.org/10.1111/acfi.12172
Chen, S., Chen, X., Cheng, Q., & Shevlin, T. (2010). Are family firms more tax aggressive than non-
family firms? Journal of Financial Economics, 95(1), 41–61.
https://doi.org/10.1016/j.jfineco.2009.02.003
Clarkson, P. M., Li, Y., Richardson, G. D., & Vasvari, F. P. (2008). Revisiting the relation between
environmental performance and environmental disclosure: An empirical analysis. Accounting,
Organizations and Society, 33(4–5), 303–327. https://doi.org/10.1016/j.aos.2007.05.003
Desai, M. A., & Dharmapala, D. (2006). Corporate tax avoidance and high-powered incentives. Journal
of Financial Economics, 79(1), 145–179. https://doi.org/10.1016/j.jfineco.2005.02.002

255
Desai, M. A., Dyck, A., & Zingales, L. (2007). Theft and taxes. Journal of Financial Economics, 84(3),
591–623. https://doi.org/10.1016/j.jfineco.2006.05.005
Desai, Ma, & Dharmapala, D. (2009). Earnings management and corporate tax shelters. National Tax
Journal, 62(1), 169–186. https://doi.org/http://dx.doi.org/10.2139/ssrn.884812
Desai, Mihir. (2005). The Degradation of Reported Corporate Profit. Journal of Economic Perspectives,
19(4), 171–192. https://doi.org/10.2307/2225251
Dhaliwal, D., Gal-Or, R., Naiker, V., & Sharma, D. (2013). Auditor-provided tax services and tax
avoidance. Working Paper, University of Arizona, Tucson, AZ.
Drake, K. D., Lusch, S. J., & Stekelberg, J. (2019). Does Tax Risk Affect Investor Valuation of Tax
Avoidance? Journal Accounting , Auditing & Finance, 34(1), 151–176.
https://doi.org/10.1177/0148558X17692674
Dunbar, A., Higgins, D. M., Phillips, J. D., & Plesko, G. A. (2010). What Do Measures of Tax Aggressive
Measure? Proceedings of the National Tax Association Annual Conference on Taxation, 18–26.
Dyreng, S. D., Hanlon, M., & Maydew, E. L. (2008). Long-run corporate tax avoidance. Accounting
Review, 83(1), 61–82.
Dyreng, S. D., Hanlon, M., & Maydew, E. L. (2010). The effects of executives on corporate tax
avoidance. Accounting Review, 85(4), 1163–1189. https://doi.org/10.2308/accr.2010.85.4.1163
Francis, J. R., & Yu, M. D. (2009). Big 4 Office Size and Audit Quality. Accounting Review, 84(5),
1521–1552. https://doi.org/10.2308/accr.2009.84.5.1521
Frank, M. M., Lynch, L. J., & Rego, S. O. (2009). Tax reporting aggressiveness and its relation to
aggressive financial reporting. The Accounting Review, 84(2), 467–496.
https://doi.org/10.2308/accr.2009.84.2.467
Fuest, C., & Riedel, N. (2012). Tax evasion and tax avoidance: the role of international profit shifting.
In Draining Development? Controlling flows of illicit funds from developing countries.
https://openknowledge.worldbank.org/handle/10986/2242
Gaertner, F. B. (2014). CEO after-tax compensation incentives and corporate tax avoidance.
Contemporary Accounting Research, 31(4), 1077–1102. https://doi.org/10.1111/1911-3846.12058
Gan, Z. (2018). Conditional Conservatism and Tax Avoidance (Issue May). Erasmus University
Rotterdam.

256
Gao, L., Yang, L. L., & Zhang, J. H. (2016). Corporate patents, R&D success, and tax avoidance. Review
of Quantitative Finance and Accounting, 47(4), 1063–1096. https://doi.org/10.1007/s11156-015-
0531-3
Gassen, J., Fu¨lbier, R. U. and Sellhorn, T. (2006) International differences in conditional conservatism
– the role of unconditional conservatism and income smoothing, European Accounting Review,
15(4), 527–564.
Givoly, D., & Hayn, C. (2000). The changing time-series properties of earnings, cash flows and accruals:
Has "nancial reporting become more conservative? Journal of Accounting and Economics, 29(3),
287–320.
Gleason, C. A., & Mills, L. F. (2011). Do Auditor-Provided Tax Services Improve the Estimate of Tax
Reserves? Contemporary Accounting Research, 28(5), 1484–1509. https://doi.org/10.1111/j.1911-
3846.2010.01057.x
Graham, J. R., Hanlon, M., Shevlin, T., & Shroff, N. (2014). Incentives for Tax Planning and Avoidance :
Evidence from the Field. The Accounting Review, 89(3), 991–1023. https://doi.org/10.2308/accr-
50678
Graham, J. R., & Tucker, A. L. (2006). Tax shelters and corporate debt policy. Journal of Financial
Economics, 81(3), 563–594. https://doi.org/10.1016/j.jfineco.2005.09.002
Gupta, S., & Newberry, K. (1997). Determinants of the Variability in Corporate Effective Tax Rates:
Evidence from Longitudinal Data. Journal of Accounting and Public Policy, 16(1), 1–34.
Hanlon, M., & Heitzman, S. (2010). A review of tax research. Journal of Accounting and Economics,
50(2–3), 127–178. https://doi.org/10.1016/j.jacceco.2010.09.002
Hanlon, M., Laplante, S. K., & Shevlin, T. (2005). Evidence for the possible informaiton loss of
conforming book income and taxable income. The Journal of Law & Economics, 48(2), 407–442.
https://doi.org/10.3868/s050-004-015-0003-8
Hellman, N. (2008). Accounting Conservatism under IFRS. Accounting in Euroupe, 5(2), 71–100.
Heltzer, W. (2009). Conservatism and Book-Tax Differences. Journal of Accounting, Auditing &
Finance, 24(3), 469–504.
Hogan, B., & Noga, T. (2015). Auditor-provided tax services and long-term tax avoidance. Review of
Accounting and Finance, 14(3), 285–305.

257
Hoon, C., Selmier, W. T., & Lien, D. (2011). International trade, foreign direct investment, and
transaction costs in languages. Journal of Socio-Economics, 40(6), 732–735.
https://doi.org/10.1016/j.socec.2011.08.003
Hoopes, J. L., Mescall, D., & Pittman, J. A. (2012). Do 1RS Audits Deter Corporate Tax Avoidance ?
The Accounting Review, 87(5), 1603–1639. https://doi.org/10.2308/accr-50187
Hung, M., & Subramanyam, K. (2007). Financial statement effects of adopting international accounting
standards: The case of Germany. Review of Accounting Studies, 12(4), 21−48.
Huseynov, F., & Klamm, B. K. (2012). Tax avoidance , tax management and corporate social
responsibility. Journal of Corporate Finance, 18(4), 804–827.
https://doi.org/10.1016/j.jcorpfin.2012.06.005
Jaafar, A., & Thornton, J. (2015). Tax havens and effective tax rates: An analysis of private versus public
european firms. The International Journal of Accounting, 50(4), 435–457.
https://doi.org/10.1016/j.intacc.2015.10.005
Janský, P., & Prats, A. (2015). International profit-shifting out of developing countries and the role of
tax havens. Development Policy Review, 33(3), 271–292. https://doi.org/10.1111/dpr.12113
Janssen, B., Vandenbussche, H., & Crabbé, K. (2005). Corporate tax savings when hiring a Big 4 auditor:
Empirical evidence for Belgium. SSRN Electronic Journal, March, 1–19.
Karampinis, N. I., & Hevas, D. L. (2013). Effects of IFRS Adoption on Tax-induced Incentives for
Financial Earnings Management: Evidence from Greece. International Journal of Accounting,
48(2), 218–247. https://doi.org/10.1016/j.intacc.2013.04.003
Khan, M., & Watts, R. L. (2009). Estimation and Empirical Properties of a Firm-Year Measure of
Accounting Conservatism. Journal of Accounting and Economics, 48(2–3), 132–150.
https://doi.org/10.1016/j.jacceco.2009.08.002
Kim, B., & Jung, K. (2007). The Influence of Tax Costs on Accounting Conservatism.
Koester, A., Shevlin, T., & Wangerin, D. (2017). The Role of Managerial Ability in Corporate Tax
Avoidance The Role of Managerial Ability in Corporate Tax Avoidance. October 2018.
Kothari, S. P., Ramanna, K., & Skinner, D. J. (2010). Implications for GAAP from an Analysis of
Positive Research in Accounting. Journal of Accounting and Economics, 50(2), 246–286.
LaFond, R., & Roychowdhury, S. (2008). Managerial Ownership and Accounting Conservatism. Journal
of Accounting Research, 46(1), 101–135. https://doi.org/10.1111/j.1475-679X.2008.00268.x

258
LaFond, R., & Watts, R. L. (2008). The Information Role of Conservatism. The Academy of Management
Review, 83(2), 447–478.
Laguir, I., Staglianò, R., & Elbaz, J. (2015). Does corporate social responsibility affect corporate tax
aggressiveness? Journal of Cleaner Production, 107, 662–675.
https://doi.org/10.1016/j.jclepro.2015.05.059
Lai, K. W. (2013). Audit Reporting of Big 4 Versus Non-Big 4 Auditors: The Case of Ex-Andersen
Clients. International Journal of Accounting, 48(4), 495–524.
https://doi.org/10.1016/j.intacc.2013.10.001
Lanis, R., & Richardson, G. (2012). Corporate social responsibility and tax aggressiveness: An empirical
analysis. Journal of Accounting and Public Policy, 31(1), 86–108.
https://doi.org/10.1016/j.jaccpubpol.2011.10.006
Lanis, R., & Richardson, G. (2013). Corporate social responsibility and tax aggressiveness: a test of
legitimacy theory. Accounting, Auditing & Accountability Journal, 26(1), 75–100.
https://doi.org/10.1108/09513571311285621
Lanis, R., & Richardson, G. (2015). Is corporate social responsibility performance associated with tax
avoidance? Journal of Business Ethics, 127(2), 439–457. https://doi.org/10.1007/s10551-014-2052-
8
Lara, J. M. G., & Mora, A. (2004). Balance sheet versus earnings conservantism. European Accounting
Review, 13(2), 261–292.
Lara, J. M. G., Osma, B. G., & Penalva, F. (2009). The economic determinants of conditional
conservatism. Journal of Business Finance and Accounting, 36(3–4), 336–372.
https://doi.org/10.1111/j.1468-5957.2008.02122.x
Lietz, G. M. (2013). Determinants and Consequences of Corporate Tax Avoidance. In Ssrn.
https://doi.org/10.2139/ssrn.2363868
Lin, S., Riccardi, W., & Wang, C. (2012). Does accounting quality change following a switch from U.S.
GAAP to IFRS? Evidence from Germany. Journal of Accounting and Public Policy, 31(6), 641–
657. https://doi.org/10.1016/j.jaccpubpol.2012.10.006
Lisowsky, P. (2010). Seeking Shelter: Empirically modeling tax shelters using financial statement
information. The Accounting Review, 85(5), 1693–1720.
https://doi.org/10.2308/accr.2010.85.5.1693
Markle, K. S., & Shackelford, D. A. (2012). Cross-country comparisons of corporate income taxes.
National Tax Journal, 65, 493–528.

259
McGuire, S. T., Omer, T. C., & Wang, D. (2012). Tax Avoidance: Does Tax-Specific Industry Expertise
Make a Difference? The Accounting Review, 87(3), 975–1003. https://doi.org/10.2308/accr-10215
Minnick, K., & Noga, T. (2010). Do Corporate Governance Characteristics in Fluence Tax Management?
Journal of Corporate Finance, 16, 703–718. https://doi.org/10.1016/j.jcorpfin.2010.08.005
Meser, M., Veith, S., & Zimmermann, J. (2015). Disclosure, Enforcement and Capital Market Properties:
A Longitudinal Analysis for Germany. Schmalenbach Business Review, 67(2), 254- 287.
Mukhlasin, M., & Anissa, N. (2018). Investor Perception of Tax Avoidance and Quality of Earnings
Information. Research Journal of Financial and Accounting, 9(12), 72–78.
Nikolaev, V. (2010). Debt covenants and accounting conservatism. Journal ofAccounting Research,
48(1), 51–89.
O’Neill, J. (2001). Building Better Global Economic BRICs. Goldman Sachs Economic Research Group,
1–16.
Omar, N., & Zolkaflil, S. (2015). Profit Shifting and Earnings Management through Tax Haven
Subsidiaries: An Exploratory Analysis of Multinational Companies. Procedia Economics and
Finance, 28(April), 53–58. https://doi.org/10.1016/s2212-5671(15)01081-3
Omer, T. C., Bedard, J. C., & Falsetta, D. (2006). Auditor-provided tax services: The effects of a
changing regulatory environment. Accounting Review, 81(5), 1095–1117.
https://doi.org/10.2308/accr.2006.81.5.1095
Phillips, J. D. (2003). Corporate tax-planning Effectiveness: The role of compensation-based incentives.
The Accounting Review, 78(3), 847–874.
Pinnuck, M. (2012). A Review of the Role of Financial Reporting in the Global Financial Crisis.
Australian Accounting Review, 22(1), 1–14. https://doi.org/10.1111/j.1835-2561.2011.00155.x
Pinnuck, M., & Potter, B. N. (2009). The quality and conservatism of the accounting earnings of local
governments. Journal of Accounting and Public Policy, 28(6), 525–540.
https://doi.org/10.1016/j.jaccpubpol.2009.08.002
Piot, C., Dumontier, P., & Janin, R. (2012). IFRS consequences on accounting conservation within
Europe.
Piper, L. (2015). The BRICS phenomenon: from regional economic leaders to global political players.
In Bicas (Issue April).

260
Preuss, L. (2010). Tax avoidance and corporate social responsibility: you can’t do both, or can you?
Corporate Governance, 10(4), 365–374. https://doi.org/10.1108/14720701011069605
Preuss, L. (2012). Responsibility in Paradise? The Adoption of CSR Tools by Companies Domiciled in
Tax Havens. Journal of Business Ethics, 110, 1–14. https://doi.org/10.1007/s10551-012-1456-6
Purwantini, H., Chandrarin, G., & Assih, P. (2017). Minimizing Tax Avoidance by Using Conservatism
Accounting Through Book Tax Differences. International Journal of Research in Business and
Social Science, 6(5), 55–67. https://doi.org/10.20525/ijrbs.v6i5.765
Qiang, X. (2007). The Effects of Contracting, Litigation, Regulation, and Tax Costs on Conditional and
Unconditional Conservatism: Cross-Sectional Evidence at the Firm Level. Accounting Review,
82(3), 759–796.
http://search.ebscohost.com/login.aspx?direct=true&db=bth&AN=25002332&lang=zh-
cn&site=ehost-live
Reed, W. R. (2015). On the Practice of Lagging Variables To Avoid Simultaneity. Oxford Bulletin of
Economics and Statistics, 77(6), 897–905.
Rego, S. O. (2003). Tax-avoidance activities of U.S. multinational corporations. Contemporary
Accounting Research, 20(4), 805–833. https://doi.org/10.1506/VANN-B7UB-GMFA-9E6W
Roberts, M. R. & Whited, T. M. (2012). Endogeneity in empirical corporate finance. In: Constantinides,
M., Harris, M. & Stulz, R. (Eds), Handbook of the Economics of finance, vol. 2, Amsterdam,
Elsevier, 493-572.
Ruch, G. W., & Taylor, G. (2015). Accounting conservatism: A review of the literature. Journal of
Accounting Literature, 34, 17–38. https://doi.org/10.1007/s10551-011-0871-4
Salihu, I. A., Sheikh Obid, S. N. and Annuar, H. A. (2013). Measures of corporate tax avoidance:
empirical evidence from an emerging economy. International Journal of Business and Society, 14
(3), 412-427.
Seetharaman, A., Sun, Y., & Wang, W. (2011). Tax-related financial statement restatements and auditor-
provided tax services. Journal of Accounting, Auditing and Finance, 26(4), 677–698.
https://doi.org/10.1177/0148558X11409146
Shackelford, D. A., & Shevlin, T. (2001). Empirical tax research in accounting: A discussion. Journal of
Accounting and Economics, 31(1–3), 321–387. https://doi.org/10.1016/S0165-4101(01)00021-0
Shane, P. B., & Stock, T. (2006). Efficiency in Anticipating Tax-Motivated Income Shifting Universi.
The Accounting Review, 81(1), 227–250.

261
Steijvers, T., & Niskanen, M. (2014). Tax aggressiveness in private family firms: An agency perspective.
Journal of Family Business Strategy, 5(4), 347–357. https://doi.org/10.1016/j.jfbs.2014.06.001
Sterling, R. R. (1967). Conservatism: The Fundamental Principle of Valuation in Traditional Accounting.
Abacus, 3(2), 109–132.
Sundvik, D. (2017). Book-tax conformity and earnings management in response to tax rate cuts. Journal
of International Accounting, Auditing and Taxation, 28, 31–42.
https://doi.org/10.1016/j.intaccaudtax.2016.12.003
Taylor, G., & Richardson, G. (2014). Incentives for corporate tax planning and reporting : Empirical
evidence from Australia. Journal of Contemporary Accounting & Economics, 10(1), 1–15.
https://doi.org/10.1016/j.jcae.2013.11.003
Wang, M., & Kong, D. (2011). Corporate Social Responsibility , Investor Behaviors , and Stock Market
Returns : Evidence from a Natural Experiment in China. 127–141. https://doi.org/10.1007/s10551-
010-0713-9
Watts, R. L. (2003a). Conservatism in accounting part I : Explanations and implications. Accounting
Horizons, 17(3), 207–221.
Watts, R. L. (2003b). Conservatism in Accounting Part II: Evidence and Research Opportunities.
Accounting Horizons, 17(4), 287–301.
Watts, R., Zimmerman, J., 1986. In: Positive Accounting Theory. Prentice-Hall Inc.
Wilson D, Purushothaman R. 2003. Dreaming with Brics: The path to 2050 (Global Economics Paper
No: 99). Goldman Sachs: New York.
Wilson, R. J. (2009). An examination of corporate tax shelter participants. The Accounting Review, 84(3),
969–999. https://doi.org/10.2308/accr.2009.84.3.969
Wong, R. M. K., Lo, A. W. Y., & Firth, M. (2015). Managing Discretionary Accruals and Book-Tax
Differences in Anticipation of Tax Rate Increase: Evidence from China. Journal of International
Financial Management & Accounting, 26(2), 188–222.
Wrightsman, D. (1978). Tax Shield Valuation and the Capital Structure Decision. The Journal of
Finance, 33(2), 650–656.
Xu, J., & Lu, C. (2008). Accounting Conservatism: A Study of Market-Level and Firm-Level
Explanatory Factors. China Journal of Accounting Research, 1(1), 11–29.
https://doi.org/10.1016/s1755-3091(13)60003-9

262
Yuniarsih, N. (2018). The effect of accounting conservatism and corporate governance mechanism on
tax avoidance. Academic Research International, 9(3), 68–76.
Zhong, Y., & Li, W. (2017). Accounting Conservatism: A Literature Review. Australian Accounting
Review, 27(28), 195–213. https://doi.org/10.1111/auar.12107
Zimmerman, J., 1983. Taxes and firm size. Journal of Accounting and Economics 5 (2), 119–149.

263
Appendices
Appendix 5.1: Prior studies on accounting conservatism and taxation
Author(s) Research question Sample Type of conservatism Findings
Conditional Unconditional Bornemann
(2018)
18 countries
(1995-2010)
C-Score
- Negative accruals
(Givoly & Hayn, 2000)
- Skewness
Only conditional conservatism is positively associated
with future tax rate cuts when book-tax conformity is
high.
Gan (2018) U.S. firms
(2009-2016)
- C-Score
- Skewness
Firms use conditional conservatism as a vehicle to
reduce actual tax burdens.
Yuniarsih
(2018)
Indonesian
firms
(2014-2016)
Negative accruals
(Givoly & Hayn, 2000)
Unconditional conservatism is not a factor that
encourages firms to engage in tax avoidance.
Purwantini,
Chandrarin, &
Assih (2017)
Do firms minimize tax
by employing
conservatism
accounting through
book tax differences?
Indonesian
firms
(2014-2015)
Negative accruals
(Givoly & Hayn, 2000)
Tax avoidance is not the reason behind the practice of
conservatism accounting.
Vale & Nakao
(2017)
Does the advent of tax
neutrality influence
unconditional
conservatism in
publicly-traded
companies in Brazil?
Brazilian
firms
(2002-2014)
The bias component
(Beaver & Ryan, 2000)
Unconditional conservatism is only found in companies
that are subject to greater market monitoring.
Taxation does not induce unconditional conservatism in
reported earnings, which is expected in a tax neutrality
context
Asgari &
Behpouri
(2013)
Is there a relationship
between accounting
conservatism and
financial burden of tax?
Tehran firms
(2004-2009)
Negative accruals
(Givoly & Hayn, 2000)
Unconditional conservatism is positively related with
corporate tax burden, and the motivation behind
conservatism is to reduce the difference between taxable
income and accounting income.
Heltzer (2009) U.S. firms
(1994-2003)
Basu (1997)’s
model
The intercept of Basu
(1997)’s regression
The conditional and unconditional financial statement
conservatism of firms with large positive BTDs is
similar to that of other sample firms, while the

264
conditional and unconditional conservatism in taxable
income of firms with large positive BTDs is greater than
that of other sample firms.
Large positive BTDs do not reveal information about a
firm’s relative level of financial statement conservatism.
The unconditional conservatism among firm-years with
large negative BTDs is greater than that of other sample
firm-years.
The conditional and unconditional conservatism in
taxable income among firm-years with large negative
BTDs is less than that of other sample firm-years.
Lara, Osma, &
Penalva
(2009)
U.S. firms
(1964-2005)
Basu (1997)’s
model
The bias component
(Beaver & Ryan, 2000)
Contracting induces only conditional conservatism.
Taxation, litigation, and regulation induce both
conditional conservatism and unconditional
conservatism.
Qiang (2007) U.S. firms
(1982-2002)
- The bias
component
(Beaver &
Ryan, 2000)
- Negative
accruals
(Givoly &
Hayn, 2000)
- The bias component
(Beaver & Ryan, 2000)
- Negative accruals
(Givoly & Hayn, 2000)
Debt contracting costs induce conditional conservatism,
whereas tax reduction costs and accounting regulation
costs induce unconditional conservatism. However,
litigation costs induce both conditional and
unconditional conservatism.
Kim & Jung
(2007)
Does tax cost influence
accounting
conservatism?
Korean firms
(1997-2002)
Basu (1997)’s
model
- Negative accruals
(Givoly & Hayn, 2000)
- The bias component
(Beaver & Ryan, 2000)
- The level of estimated
reserves (Penman and
Zhang, 2002)
The level of unconditional, but not conditional,
conservatism is positively associated with tax burden.
Firms with a closer link between book and taxable
income are likely to have a
stronger relation between tax costs and conservatism.
Tax motivated conservatism is more prevalent for the
firms with low non-tax cost.

265
Related tax avoidance – conservatism issues
Authors Research
Questions Samples Measures Findings
Clemente-
Almendros &
Sogorb-Mira
(2018)
Are firms less leveraged
than they should be
comparing with tax
benefits from interest
deduction?
Spanish
firms
(2007-2015)
Graham’s (2000) kink variable to measure
the degree of leverage
conservativeness
The conservative firms in terms of debt financing are
not acting sub-optimally about debt tax advantage.
Crabtree &
Kubick (2014)
What extent dose tax
avoidance contribute to
a delay in the timing of
the annual earnings
announcement?
U.S. firms
(1993–2010)
The timeliness of the annual earnings
announcement
Tax avoidance manifesting through greater temporary
and permanent book-tax differences shows a less timely
annual earnings announcement.

266
Appendix 5.2: Definitions of Variables
Tax avoidance (TaxAvoid)
ETR = The effective tax rate estimated by income tax divided by pretax book
income.
Earning Management (EM)
C_Score = The proxy for conditional conservatism measured as Khan & Watts
(2009)’s model;
Acc_NegAccru = The proxy for conditional conservatism measured as Givoly & Hayn
(2000)’s model.
Control Variables (CONTROLS)
Size = The natural logarithm of total assets;
Lev = The ratio of long-term debt liability and total assets;
CapInt = The ratio of gross property, plant, equipment and total assets;
IntangInt = The ratio of intangible assets and total assets;
Cashholding = The ratio of cash and total assets;
SalesGrowth = The ratio of changes in net sale and total assets;
DivPayout = The ratio of dividends per share and earnings per share multiplied by
100;
CloseHeld = The ratio of number of closely held shares and common shares
outstanding;
IFRS = The dummy variable equal to 1 in the year and after when firms adopt
IFRS, and 0 otherwise;
LawSys = The dummy variable equal to 1 if firms are in country complying with
civil law and 0 otherwise.

267
Appendix 5.3: The mean value of interested variables
The mean value of ETR and STR
Year
N
Overall Brazil Russia India China S. Africa STR ETR STR ETR STR ETR STR ETR STR ETR STR ETR (%) (%) (%) (%) (%) (%)
2006 866 33.92 23.63 34.00 26.47 24.00 25.49 33.66 22.99 33.00 22.14 36.89 28.41
2007 980 33.96 22.75 34.00 26.16 24.00 30.84 33.99 23.83 33.00 19.28 36.89 29.21
2008 1,642 31.70 24.19 34.00 26.31 24.00 33.99 33.99 25.17 25.00 19.00 34.55 29.84
2009 1,628 31.36 25.15 34.00 22.66 20.00 26.00 33.99 27.63 25.00 18.18 34.55 29.55
2010 1,868 31.47 24.97 34.00 25.11 20.00 24.16 33.99 26.99 25.00 19.12 34.55 28.25
2011 1,928 30.58 24.91 34.00 30.01 20.00 23.59 32.44 25.75 25.00 20.88 34.55 29.60
2012 1,760 30.77 26.37 34.00 25.32 20.00 26.67 32.45 27.55 25.00 21.98 34.55 29.32
2013 1,669 30.84 25.85 34.00 22.20 20.00 28.69 33.99 27.36 25.00 22.74 28.00 25.76
2014 2,765 27.85 22.45 34.00 21.71 20.00 33.23 33.99 26.40 25.00 20.27 28.00 25.48
2015 3,495 27.33 21.98 34.00 25.97 20.00 24.80 34.61 26.03 25.00 19.95 28.00 28.28
2016 3,926 27.47 22.25 34.00 24.61 20.00 23.36 34.61 27.85 25.00 19.66 28.00 28.55
2017 3,989 27.61 21.78 34.00 25.48 20.00 23.09 34.61 27.43 25.00 19.01 28.00 28.02
2018 3,662 28.42 22.09 34.00 24.93 20.00 26.86 35.00 27.36 25.00 18.50 28.00 27.48
The mean value of conservatism: conditional form and unconditional form
Year
N Overall Brazil Russia India China S. Africa
Cona Unconb Cona Unconb Cona Unconb Cona Unconb Cona Unconb Cona Unconb
2006 866 0.17 -0.01 0.30 0.03 0.19 -0.03 0.22 -0.02 0.11 0.00 0.22 -0.01
2007 980 -0.03 -0.01 -0.03 0.02 -0.10 -0.02 -0.02 -0.03 -0.03 0.00 -0.04 -0.02
2008 1,642 0.12 -0.03 0.07 0.00 0.06 0.00 0.16 -0.04 0.05 -0.01 0.07 -0.02
2009 1,628 -0.02 -0.02 0.12 -0.02 0.11 0.00 -0.07 -0.04 0.07 0.00 0.04 0.00
2010 1,868 0.35 -0.02 0.23 -0.04 0.24 0.01 0.43 -0.03 0.22 0.00 0.26 0.00
2011 1,928 0.06 -0.03 0.09 -0.02 0.10 0.01 0.06 -0.04 0.07 -0.02 0.07 0.00
2012 1,760 0.07 -0.03 0.14 -0.02 0.10 0.00 0.01 -0.04 0.18 -0.01 0.16 -0.01
2013 1,669 -0.18 -0.03 -0.18 -0.02 -0.20 -0.01 -0.27 -0.04 -0.01 -0.02 -0.05 -0.01
2014 2,765 -0.03 -0.02 -0.12 0.00 -0.12 0.01 -0.18 -0.03 0.04 -0.02 -0.08 -0.01
2015 3,495 0.28 -0.02 0.21 0.01 0.17 0.02 0.28 -0.03 0.30 -0.02 0.22 -0.01
2016 3,926 0.11 -0.02 0.00 0.02 0.01 0.04 0.02 -0.02 0.14 -0.02 0.05 -0.01
2017 3,989 0.13 -0.02 0.14 0.01 0.12 0.00 0.11 -0.02 0.13 -0.03 0.12 -0.01
2018 3,662 -0.06 -0.03 -0.01 0.01 -0.06 -0.01 -0.14 -0.03 -0.02 -0.03 -0.07 -0.01
a Con refers conditional conservatism measured through the C_Score. b
Uncon refers to unconditional conservatism measured through accumulated negative accruals.

Chapter 6 Summary and Conclusion
Summary and Conclusion
This thesis investigates the association between corporate tax avoidance in BRICS countries and
three topics: corporate social responsibility (Chapter 3), earnings management (Chapter 4), and
accounting conservatism (Chapter 5). Furthermore, the current study discusses relevant issues
related to corporate tax avoidance including (i) definitions of corporate tax avoidance; (ii)
theoretical frameworks used in connection with tax avoidance; (iii) alternative perspectives on tax
avoidance, (iv) prior studies on corporate tax avoidance; (v) the importance of BRICS economy
and; (vi) issues of tax avoidance in BRICS (Chapter 2).
6.1. Summary of the Thesis
The common thread running through the thesis is the focus on tax avoidance. The consequences
of tax avoidance have damaging effects in nearly all countries, but the effects of tax avoidance for
lower-income nations are even more acute. This thesis hence emphasises the unique setting of
emerging BRICS countries because they are key players in the global economy yet remain under-
researched in the literature. These countries differ markedly from other emerging countries by their
large, fast-growing economies and their significant influence on regional and global affairs (Piper,
2015). This thesis specifically examines the association between tax avoidance and three distinct,
but related areas, namely CSR, earnings management, and accounting conservatism.
Tax avoidance can be viewed as two sides of a coin. On one side, it facilitates the increasing of
firm profits. On the other side, it damages the well-being of people in society as a whole. Therefore,
tax avoidance should be understood from both perspectives, i.e. the economic perspective and the

269
ethical perspective. Although tax avoidance is a legal practice using loopholes in tax law, it is
viewed as socially irresponsible/unethical behaviour (Dowling, 2014), because corporations do not
act as a good citizen by not paying their fair share of taxes (Huseynov & Klamm, 2012). As such,
it is difficult for tax authorities to tackle the practice of tax avoidance by law enforcement. Given
that CSR emphasises a firm's social commitment to various stakeholders which would allow
society to put pressure on firms to comply with the corporate responsibility to pay responsible
taxes, research on corporate tax avoidance in the boundary of corporate social responsibility (CSR)
is encouraged (Avi-Yonah, 2014; Desai & Dharmapala, 2006; Dowling, 2014; Sikka, 2010). In
addition to legal features, in order to avoid taxes, a firm's management team needs to make tax
avoidance transactions complicated and difficult to be discovered by stakeholders. As such,
determining the level of tax avoidance through a firm's other behaviours is encouraged. Although
a firm's book income and its taxable income are determined by different rules and regulations, it
is a well-known fact that taxable income is affected by book income. Therefore, engaging in
earnings management and using accounting conservatism are well-known corporate behaviours
which are closely linked to the practice of tax avoidance, as tax avoidance is argued to be an
incentive for engaging in earnings management and using accounting conservatism.
Shareholders expect to see high profits as the outcomes of firm performance, but at the same time,
they must sacrifice a large portion of their profits to pay taxes. However, according to the
separation of ownership and control in corporate organisations, which may lead to agency
problems, managers may not aim to increase profits if it is not in their personal interests.
Shareholders hence tie their interests with managers' interests by means of after-tax performance
compensation. Managers who aim to gain benefit from compensation incentives would then aim
to minimise the tax liability in order to achieve their own target (Crocker & Slemrod, 2005).
Managers may thus employ earnings management to minimise corporate tax obligation and to
increase corporate net income. Similarly, firms' managers may attempt to reduce taxable income
in the current period by employing the principle of accounting conservatism which allows them to
delay revenue recognition and accelerate expense recognition. The principle of accounting
conservatism entails overstating the values of liabilities/losses or understating the values of
assets/incomes when firms face the situation that there are more than one alternative available

270
methods in the preparation of financial statements. In other words, firms are timelier in recognising
losses than gains. By conservatively delaying recognition of book income, taxable income is
simultaneously shifted, and tax payments are also deferred into the future (Bornemann, 2018).
Therefore, tax saving may be an incentive for firms to increase accounting conservatism in order
to minimise tax liability.
Therefore, this thesis investigates the following research questions:
RQ1: Is firms' CSR engagement associated with the levels of tax avoidance?
RQ2: Is firm's level of earnings management associated with the levels of tax avoidance?
RQ3: Is firms' level of accounting conservatism associated with the levels of tax avoidance?
This thesis provides answers to these questions by providing evidence that tax avoidance is
significantly associated with all three areas. More precisely, in line with the economic perspective
on tax avoidance, the results indicate that firms with high levels of accruals earnings management
and conditional accounting conservatism are likely to engage in more aggressive tax avoidance.
However, from the ethical perspective on tax avoidance, firms in BRICS implement CSR activities
by taking into consideration social well-being, and do not engage in the practice of tax avoidance.
6.2. Summary of Empirical Studies
Tax Avoidance and CSR
Responding to the call of prior research to include responsible tax payments in firms’ CSR policies
(Avi-Yonah, 2014; Desai & Dharmapala, 2006; Dowling, 2014; Sikka, 2010), the first study of
the thesis examines the association between tax avoidance and CSR. Specifically, this study
explores whether firms address the interests of a broad range of stakeholders by implementing the
strategy of tax compliance along with CSR. Alternatively, firms may engage in organized
hypocrisy by involving in tax avoidance activities whilst demonstrating to be socially responsible
in order to maintain legitimacy and mitigate the risks of severe sanctions for dodging tax.
The results show tax avoidance is negatively associated with CSR for both social activities and
environmental activities, suggesting that firms engaging in more CSR activities are less likely to

271
avoid tax. The findings lend credential to the idea that the corporate behaviour of firms in BRICS
promotes the commitment to a wide range of stakeholders, instead of shareholders exclusively,
thereby executing a strategy of tax compliance and CSR engagement. This also supports the
findings of prior studies that economic development does not explain variations of CSR across
nations in BRIC, as shown in the case of India, where GDP per capita is lower than in China, but
CSR is more intensive (Alon et al., 2010; Ramasamy & Yeung, 2009; Shaomin Li, Marc
Fetscherin, Ilan Alon, 2010). Similarly, Alon et al. (2010) find that Chinese firms do not perceive
economic responsibility as the most important responsibility, but their ability to provide jobs,
housing and food. This finding is consistent with results of prior studies on developed countries
that firms with higher levels of CSR are less likely to engage in tax avoidance (e.g., Hoi et al.,
2013; Laguir et al., 2015; Lanis & Richardson, 2012, 2015). As BRICS are currently in the process
of convergence towards international benchmarks in several fronts,74 it is possible that firms in
BRICS also converge their CSR activities with global CSR norms and standards.
At the country level, the results for Russia, India, and China are consistent with the main test, in
which tax avoidance is negatively associated with CSR. Results for Brazil and South Africa are
not statistically significant. Additional tests show that firms’ CSR disclosures (social disclosure,
but not environmental disclosure) are negatively associated with tax avoidance. This means that
firms with higher levels of disclosure in social activities are less likely in tax avoidance. As the
results are consistent with social performance, it can be implied that firms’ social disclosure does
reflect their actual social performance. Furthermore, firms with higher levels of CSR that employ
external auditors from Big4 firms tend to pay less tax. Firms’ foreign listing status has no
significant effect on the relationship between tax avoidance and CSR. These results are robust
using alternative measures of CSR and tax avoidance, as well as performing 2SLS tests. Table 6.1
summarizes the main results of the first study.
74 For example, the convergence towards the United Nations’ Sustainable Development Goals (Ali et al., 2018), the
convergence towards internal audit effectiveness (Barac et al., 2016), and the convergence towards the International
Tax Regime (ITR) (Baistrocchi, 2013).

272
Tax Avoidance and Earnings Management
The second study investigates the relationship between tax avoidance and the degree of earnings
management. In particular, this study investigates whether and, if so, how managers use AEM and
REM to achieve their goal. The results show that firms with a higher level of earnings management
through AEM are more likely to engage in tax avoidance. These results support the hypothesis that
firms’ managers use non-conforming techniques to increase book incomes and decrease taxable
incomes at the same time. This finding is consistent with findings of prior studies in developed
economies (e.g., Desai, 2002; Frank et al., 2009). As the accounting standards used in BRICS are
aligned with IFRS which is argued as one of the factors in reducing the level of book-tax
conformity (Chan et al., 2010; Chan et al., 2013; Chen & Gavious, 2017; Karampinis & Hevas,
2013). Reducing the level of book-tax conformity offers a convenient way for managers to avoid
higher taxes, because they are not faced with the trade-off decision between increasing book
income and decreasing taxable income.
Another condition that can explain the increased levels of tax avoidance after IFRS adoption is the
increase in discretionary accruals available within IFRS (Ahmed et al., 2013; Lin et al., 2012). In
contrast, tax avoidance is negatively associated with earnings management through the use of
REM. These results support the hypothesis that managers use conforming techniques to manage
earnings, so that the higher the book income, the higher the taxable income. This finding is
consistent with Zang’s (2012) argument that REM is costly if firms aim to engage in tax reduction.
This is due to the fact that the practice of REM has direct cash flow implications in the current
period, thereby affecting the level of tax liabilities in the same direction with the level of book
income in the same period. That is, though the technique of REM, if firms intend to decrease tax
liabilities, they have to reduce book income, leading to lower earnings per share reported to stock
markets. At the country level, only results for India and China are consistent with the main tests
for both AEM and REM. Results for Russia and South Africa are consistent with the main results
only for one measure of REM, namely sales manipulations in the case of Russia, and
overproduction in the case of South Africa. Moreover, the main results are robust after performing
additional tests including (i) estimating tax avoidance with an AEM subsample and (ii) employing

273
a 2SLS method to mitigate potential biases caused by endogeneity problems. Table 6.2 summarizes
the main results of the second study.
Tax Avoidance and Accounting Conservatism
The third study investigates the relationship between tax avoidance and the degree of accounting
conservatism. It investigates in particular whether the level of tax avoidance is affected through
both forms of accounting conservatism, namely conditional and unconditional. The results show
that firms’ conditional conservatism is positively associated with tax avoidance. In contrast, firms’
unconditional conservatism is negatively associated with tax avoidance. The findings suggest that
firms using conditional methods of accounting conservatism, but not unconditional methods of
accounting conservatism, indicate higher levels of tax avoidance. The positive association is
consistent with findings by Gan (2018) that conditional conservatism results in a reduced tax
burden, and also confirms findings by Lara, Osma, & Penalva (2009), which report that taxation
does induce not only unconditional conservatism but also conditional conservatism.
At the country level, these results hold only for Chinese firms. Brazilian and South African firms
indicate consistent results for unconditional conservatism, but no evidence has been shown for
conditional form. Furthermore, the findings show that firms engage in Big4 firms pay higher tax
(i.e. less tax avoidance), but this does not affect the tax-reducing impact of accounting
conservatism. Similarly, firms with operating losses have less incentives to reduce their tax burden,
but such losses do not influence the tax-reducing effect of accounting conservatism.

274
6.3. Research Implications
This thesis expands our understanding of the variation of tax avoidance in BRICS and has several
potential implications for policymakers and regulators who seek to identify the conditions under
which tax avoidance is more likely to be aggressive. First, the thesis provides further insights into
the association between tax avoidance and CSR engagement. Explaining through legitimacy
theory, stakeholder theory, and corporate culture, the results show that BRICS firms with strong
CSR engagement are less likely to engage in tax avoidance. This findings imply that firms in
BRICS legitimate themselves by having culture of doing good things; that is, they place the
importance on CSR in accordance with their corporate culture to take responsible to society as a
whole, not doing CSR activities to create good image for the organization to be continued its
operation. Therefore, these findings provide important insights for policymakers and allow them
to formulate effective regulations that can improve firm’s tax compliance through institutionalized
CSR. Moreover, these results support the call for made by non-governmental organisations such
as ActionAid, Oxfam, Christian Aid, and the Tax Justice Network to frame corporate taxation as
a CSR issue.75 The recommendation of including responsible tax payment as part of global CSR
agenda may make firms align their behaviours regarding tax payment.
Second, this thesis provides a recommendation to relevant regulatory agencies that the high level
of accrual-based earnings management and the high level of conditional conservative accounting
could indicate tax avoidance engagement. Nonconformity between financial accounting standards
and corporate tax regulation allows tax planning by firms to manage earnings, primarily through
discretionary accruals transactions. As each member of BRICS adopts or converges their
accounting standards to IFRS, it is important for standard setters to have a better understanding
about the extent to which earnings management and conservatism are related to tax avoidance in
the context of emerging markets. In particular, they should take into account the effects of tax
avoidance when drafting new and updating old accounting standards. Finally, analysts and
investors who are interested in firms’ tax avoidance activities and use the accounting numbers to
75 https://www.actionaid.org.uk/sites/default/files/publications/tax_responsibility.pdf

275
evaluate the extent of tax avoidance when making investment decisions should take into
consideration the effects of earnings management and accounting conservatism.
6.4. Limitations and Suggestion for Future Research
This thesis is also subject to the following limitations. First, according to the MSCI Emerging
Markets Index, twenty-seven countries are currently classified as emerging markets.76 The current
study uses a sample which is limited to publicly listed firms in five countries representing emerging
economies. This may constrain the generalizability of findings for emerging countries as a whole.
Exploring the practice of tax avoidance in other emerging countries would be a useful avenue for
future research. Moreover, this thesis focuses on the sample of BRICS which comprises of
countries in different continents. The results can only present tax avoidance practice in BRICS
countries between tax avoidance and CSR, earnings management, and accounting conservatism.
Therefore, investigating and comparing these practices for a particular continent would provide
better understanding about tax avoidance in emerging countries across continents.
Second, measures of tax avoidance in this thesis are based on financial statement data whose
accuracy cannot be guaranteed. The firms' level of tax avoidance is assumed by a lower level of
ETR. That is, a lower ETR is assumed to be the result of firms avoiding tax. Although ETR is a
reasonable, powerful, and accepted measure of tax avoidance in the literature, it cannot be
guaranteed that firms with a low value of ETR all engage in tax avoidance activities. Taken
together, future research on tax avoidance is encouraged to measure tax avoidance through other
proxies, for example, using a sample of corporations accused by tax authorities or other parties of
tax avoidance, so that firms' engagement in tax avoidance can be assured.
Third, the dependent variables in all three studies are restricted due to the limitation of data
availability. In the study of tax avoidance and CSR, CSR is proxied by the ASSET4’s ESG score
in the main test, and the Bloomberg’s ESG score in the additional test. Although both databases
76 Source: https://www.msci.com/market-classification

276
are widely used in the extant empirical work, they suffer limitations in term of reliability. ESG
scores are based on disclosure-based information that firms provide, and they may thus not be
based on actual actions. It is estimated that 70% of the ESG data points measure whether the firms
have a relevant policy but having a policy in place does not guarantee the level of commitment
(Funds Global Asia, 2018). Future research may seek a measure of CSR that can pair policy
disclosures with actual performance to ensure firms' CSR engagement.
In the study of tax avoidance and earnings management, the measures of REM, proposed by
Roychouhury (2006) and mostly used in literature, should be included sales manipulation,
overproduction, and discretionary expenditures. While most prior studies employ all three
measures, this thesis excludes expenditure discretion due to the lack data of R&D expenses.
Similarly, in the study of tax avoidance and accounting conservatism, this thesis captures
conservatism in both conditional and unconditional forms but uses only one measure for each form.
Due to these limitations, the findings from this thesis may not be completely comparable to prior
studies investigating similar issues.
Finally, this thesis investigates three aspects, i.e., CSR, earnings management and accounting
conservatism, that may help in explaining practices of tax avoidance in BRICS. Therefore, it would
be interesting if future research further examines these three aspects in more details. For example,
investigating whether the relation between tax avoidance and earnings management is mediated
by CSR engagement, examining whether the relation between tax avoidance and CSR is depended
on characteristics of corporate governance, exploring the association between tax avoidance and
earnings management using other techniques of earnings management such as classification
shifting, investigating whether suspect tax avoidants use multiple techniques of earnings
management substitute or complementarily.
It may also be interesting to explore other aspects related to the practice of tax avoidance, such as
different disclosure practices, corporate governance, or attributes of both internal and external
auditors, that may help in explaining tax avoidance in BRICS in order to assist policy-makers in
drawing effective regulation to tackled tax avoidance both at the national and international level.

277
References
Ahmed, A. S., Neel, M., & Wang, D. (2013). Does mandatory adoption of IFRS improve
accounting quality? Preliminary evidence. Contemporary Accounting Research, 30(4), 1344–
1372. https://doi.org/10.1111/j.1911-3846.2012.01193.x
Ali, S., Hussain, T., Zhang, G., & Li, B. (2018). The Implementation of Sustainable Development
Goals in “ BRICS ” Countries. Sustainability, 10(7), 2513.
https://doi.org/10.3390/su10072513
Alon, I., Lattemann, C., Fetscherin, M., Li, S., & Schneider, A.-M. (2010). Usage of public
corporate communications of social responsibility in Brazil, Russia, India and China (BRIC).
International Journal of Emerging Markets, 5(1), 6–22.
https://doi.org/10.1108/17468801011018248
Avi-Yonah, R. (2014). Just Say No: Corporate Taxation and Corporate Social Responsibility. U
of Michigan Public Law Research Paper, 402, 14–010.
Baistrocchi, E. A. (2013). The international tax regime and the BRIC world: Elements for a theory.
Oxford Journal of Legal Studies, 33(4), 733–766. https://doi.org/10.1093/ojls/gqt012
Barac, K., Coetzee, P., & Staden, M. (2016). Convergence towards Internal Audit Effectiveness
in the BRICS Countries. Journal of Economic and Financial Sciences, 9(2), 609–629.
Bornemann, T. (2018). Tax Avoidance and Accounting Conservatism. SSRN Electronic Journal.
https://doi.org/10.2139/ssrn.3114054
Chan, K. Hung, Lin, K. Z., & Mo, P. L. L. (2010). Will a departure from tax-based accounting
encourage tax noncompliance? Archival evidence from a transition economy. Journal of
Accounting and Economics, 50(1), 58–73. https://doi.org/10.1016/j.jacceco.2010.02.001
Chan, Koon Hung, Lin, K. Z., & Tang, F. (2013). Tax effects of book-tax conformity, financial
reporting incentives and firm size. Journal of International Accounting Research, 12(2), 1–
25. https://doi.org/10.2308/jiar-50404
Chen, E., & Gavious, I. (2017). The roles of book-tax conformity and tax enforcement in regulating
tax reporting behaviour following International Financial Reporting Standards adoption.
Accounting and Finance, 57, 681–699. https://doi.org/10.1111/acfi.12172

278
Crocker, K. J., & Slemrod, J. (2005). Corporate tax evasion with agency costs. Journal of Public
Economics, 89(9–10), 1593–1610. https://doi.org/10.1016/j.jpubeco.2004.08.003
Desai, M. A. (2002). The Corporate Profit Base, Tax Sheltering Activity, and the Changing Nature
of Employee Compensation.
Desai, M. A., & Dharmapala, D. (2006). Corporate tax avoidance and high-powered incentives.
Journal of Financial Economics, 79(1), 145–179.
https://doi.org/10.1016/j.jfineco.2005.02.002
Dowling, G. R. (2014). The Curious Case of Corporate Tax Avoidance: Is it Socially
Irresponsible? Journal of Business Ethics, 124(1), 173–184. https://doi.org/10.1007/s10551-
013-1862-4
Frank, M. M., Lynch, L. J., & Rego, S. O. (2009). Tax reporting aggressiveness and its relation to
aggressive financial reporting. The Accounting Review, 84(2), 467–496.
https://doi.org/10.2308/accr.2009.84.2.467
Gan, Z. (2018). Conditional Conservatism and Tax Avoidance (Issue May). Erasmus University
Rotterdam.
Hoi, C. K., Wu, Q., & Zhang, H. (2013). Is corporate social responsibility (CSR) associated with
tax avoidance? Evidence from irresponsible CSR activities. The Accounting Review, 88(6),
2025–2059. https://doi.org/10.2308/accr-50544
Huseynov, F., & Klamm, B. K. (2012). Tax avoidance , tax management and corporate social
responsibility. Journal of Corporate Finance, 18(4), 804–827.
https://doi.org/10.1016/j.jcorpfin.2012.06.005
Karampinis, N. I., & Hevas, D. L. (2013). Effects of IFRS Adoption on Tax-induced Incentives
for Financial Earnings Management: Evidence from Greece. International Journal of
Accounting, 48(2), 218–247. https://doi.org/10.1016/j.intacc.2013.04.003
Laguir, I., Staglianò, R., & Elbaz, J. (2015). Does corporate social responsibility affect corporate
tax aggressiveness? Journal of Cleaner Production, 107, 662–675.
https://doi.org/10.1016/j.jclepro.2015.05.059
Lanis, R., & Richardson, G. (2012). Corporate social responsibility and tax aggressiveness: An
empirical analysis. Journal of Accounting and Public Policy, 31(1), 86–108.
https://doi.org/10.1016/j.jaccpubpol.2011.10.006

279
Lanis, R., & Richardson, G. (2015). Is corporate social responsibility performance associated with
tax avoidance? Journal of Business Ethics, 127(2), 439–457. https://doi.org/10.1007/s10551-
014-2052-8
Lara, J. M. G., Osma, B. G., & Penalva, F. (2009). The economic determinants of conditional
conservatism. Journal of Business Finance and Accounting, 36(3–4), 336–372.
https://doi.org/10.1111/j.1468-5957.2008.02122.x
Lin, S., Riccardi, W., & Wang, C. (2012). Does accounting quality change following a switch from
U.S. GAAP to IFRS? Evidence from Germany. Journal of Accounting and Public Policy,
31(6), 641–657. https://doi.org/10.1016/j.jaccpubpol.2012.10.006
Piper, L. (2015). The BRICS phenomenon: from regional economic leaders to global political
players. In Bicas (Issue April).
Ramasamy, B., & Yeung, M. (2009). Chinese consumers’ perception of corporate social
responsibility (CSR). Journal of Business Ethics, 88(SUPPL. 1), 119–132.
https://doi.org/10.1007/s10551-008-9825-x
Roychowdhury, S. (2006). Earnings management through real activities manipulation. Journal of
Accounting and Economics, 42(3), 335–370. https://doi.org/10.1016/j.jacceco.2006.01.002
Shaomin Li, Marc Fetscherin, Ilan Alon, C. L. and K. Y. (2010). Corporate Social responsibility
in emerging Markets: The importance of the governance environment. Management
International Review, 50(5), 635–654.
Sikka, P. (2010). Smoke and mirrors : Corporate social responsibility and tax avoidance.
Accounting Forum, 34, 153–168. https://doi.org/10.1016/j.accfor.2010.05.002
Zang, A. Y. (2012). Evidence on the Trade-Off between Real Activities Manipulation and Accrual-
Based Earnings Management. American Accounting Association Annual Meeting-Tax
Concurrent Sessions, 87(2), 675–703. https://doi.org/10.2308/accr-10196