banjo & matilda investor presentation
TRANSCRIPT


This presentation includes forward-looking statements. Forward-looking statements reflect our current views with respect to, among other things, future events and performance. All statements other than statements of historical facts, including statements regarding our future operating results and financial position, business strategy, and plans and objectives of management for future operations, are forward-looking statements. In many cases, you can identify forward-looking statements by words such as “anticipate,” “contemplate,” “could,” “estimate,” “expect,” “intend,” “project,” “plan,” “potential,” “predict,” “target,” “believe,” “seek,” “continue,” “outlook,” “may,” “might,” “will,” “should,” “can have,” “likely” or the negative version of these words or comparable words. Forward-looking statements speak only as of the date on which they are made and are based on beliefs and assumptions made by management using currently available information.
These statements are only predictions and are not guarantees of future performance, results, actions or events. The issuer expressly disclaims any obligation to update or revise any forward-looking statement, whether as a result of new information, future events or otherwise.
All written and oral forward-looking statements attributable to the Company, or persons acting on are its behalf, expressly qualified in their entirety by the cautionary statements in the preliminary prospectus, including, without limit, those described under the heading “risk factors”, as well as other cautionary statements that are made from time to time in the Company’s public communications. You should evaluate all forward-looking statements made in this presentation in the context of these risks and uncertainties.
This presentation contains certain information that has not been derived in accordance with generally accepted accounting principles (“GAAP”). Reconciliations of such information to the most directly comparable information derived in accordance with GAAP are contained in this presentation. This information should not be considered a substitute for any measures derived in accordance with GAAP.
Disclaimer | Forward Looking Statements
2
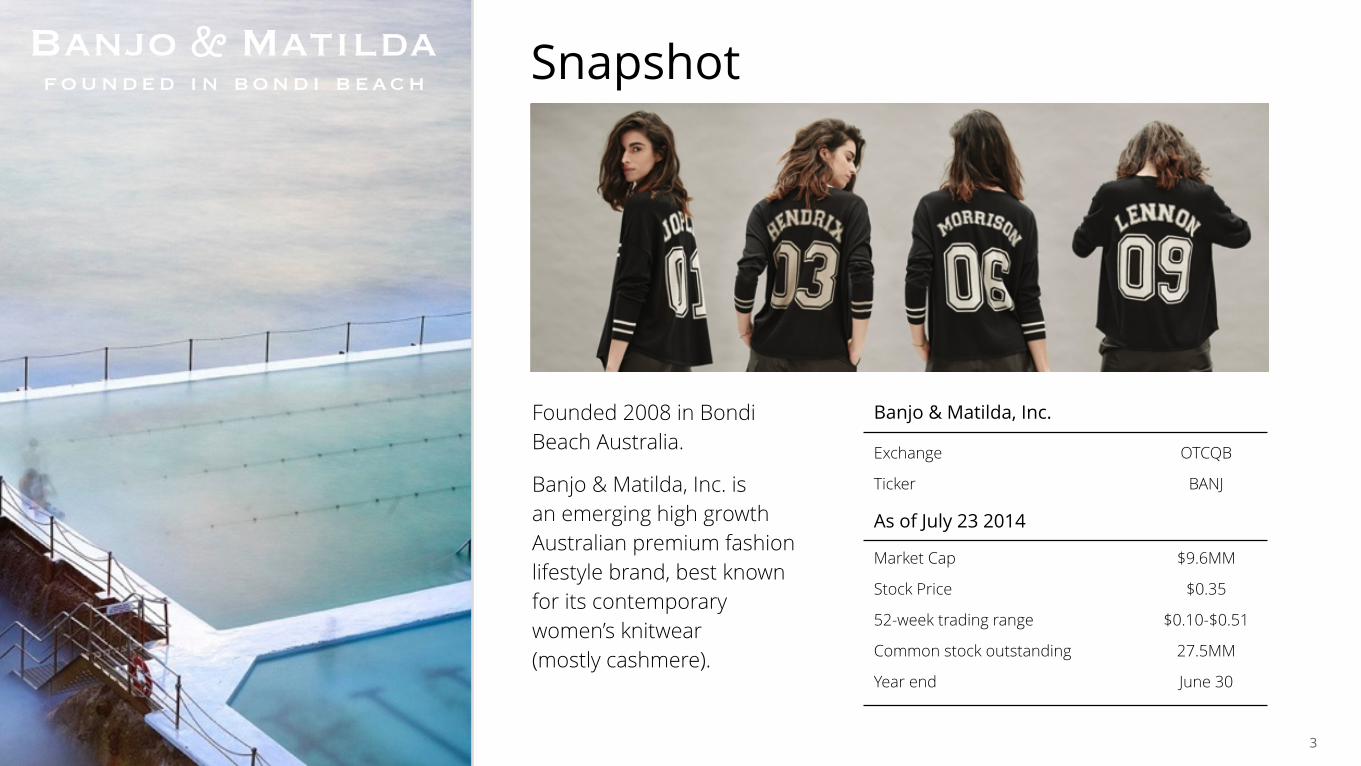
Snapshot
Founded 2008 in Bondi Beach Australia.
Banjo & Matilda, Inc. isan emerging high growth Australian premium fashion lifestyle brand, best known for its contemporary women’s knitwear (mostly cashmere).
Banjo & Matilda, Inc.
Exchange OTCQB
Ticker BANJ
As of July 23 2014
Market Cap $9.6MM
Stock Price $0.35
52-week trading range $0.10-$0.51
Common stock outstanding 27.5MM
Year end June 30
3

Distribution / Where to Buy
Yesterday
Premium contemporary cashmere knitwear collection.
!4 styles - solely women’s sweaters.
Today Tomorrow
4
2008 2014 2015 & beyond
Brand
Brand taking off - media support, celebrity endorsements, & industry jumping on board.
40+ styles per season
Full lifestyle product offering with unique brand position and offer
!Valuable lifestyle brand
Online retail only. Stocked in 100+ retail outlets around the world.
Key retailers including:Net-a-porter, Harvey Nichols, Neiman Marcus, Anthropologie ShopBop, Intermix, Beyman, Revolve, David Jones.
Current growth path will see retail outlets stocking the brand continue to grow quickly and sales continue to double.
!Target 1,000+ outlets
Results
Year 1 - $80k revenue. FY 14’ June 30 Revenue circa $2.5MM.
Online Retail sales keeping pace with Wholesale sales.
Sales more than doubling every 12 months.
FY 15’ June 30 Revenue $4MM+
Raising additional $5m to fast track growth through expanded ranges/ offering =open more doors and expand Revenue per Door.
Liquidity in BANJ public co.

Belynda MacphersonCo-founder & Creative Director
Belynda’s love of knitwear began at an earlyage and continued throughout a successful career in public relations.
Tight knit management team
Ben MacphersonCo-founder & CEO
Ben has started 5 businesses, successfully developing and exiting with 3 of the 5being sold and one resulting in IPO.
Neil LivingstonExternal Chief Financial Officer
Neil is a career finance professional with broad experience in both Financial Services & Fashion for public and private companies.
5

Global Apparel Retail IndustryValue Forecast 2009 - 2014*
Industry opportunity
6* Source: companiesandmarkets.com, Global Apparel Industry - http://www.companiesandmarkets.com/MarketInsight/Textiles-and-Clothing/Global-Apparel-Industry/NI7468
1000
1100
1200
2009 2010 2011 2012 2013 2014
$ Billion
% Growth2.22.5
2.6
2.5
2.3
2.0
Stable single digit growthLow competition entry point to
broader $1.2T market
Womenswear $621
2014 Global Market Segments Apparel Industry*
$ Billion
12% year over year increase
Menswear $40215% increase over 5 year span
Childrenswear $186
Knitwear $20

New luxury sweet spot
New Luxury products are sold at much higher prices than conventional goods and in much higher volumes than Old Luxury goods,
the result is a transformation of the entire category.“ “
Boston Consulting Group
7

Luxury
PremiumFashion
dream
seduction realism
Social imitation & instant
Social elevation & timelessness
Quality / price ratio, investment & performance
Priceless gift
In with the fast crowd…
Lora Piana Hermes Chanel YSL Bally
Gucci Prada Chloe Lanvin Louboutin
ACNE Isabel Marrant Rag & Bone Vince !Equipment Zadig & Voltaire Stella McCartney Chintia & Parker
H&M ZARA J.Crew Mango Top Shop
8

0
1,000,000
2,000,000
3,000,000
4,000,000
5,000,000
December 2008 2009 2010 2011 2012 2013 2014
May 2008Brand & first collection launched Bondi Beach Australia - online only
Banjo & Matilda timeline
Operating Profit(169,400) (280,571) (130,176) (171,287) (18,227) 212,451
Revenue
Doors
Celebrity collaboration program commenced
Wholesale program commenced
Sweater Exchange launched
First retail store opens
Net-a-porter secured. Re-orders within 3 weeks.
GOOP / Gwyneth Paltrow collaboration goes global
$1MM Equity Convertible
APO listing on OTCBB: BANJ
Additional US & UK retailers begin to stock B&M
US based Debtor finance secured
First collection launched - 4 styles
8
1 1 11
18
149,462
200+
200 Doors confirmed Oct 14
$ 000‘s per door82 135 684 836 155 114 26
9
2012 Brand Begins to Take Off
!!+
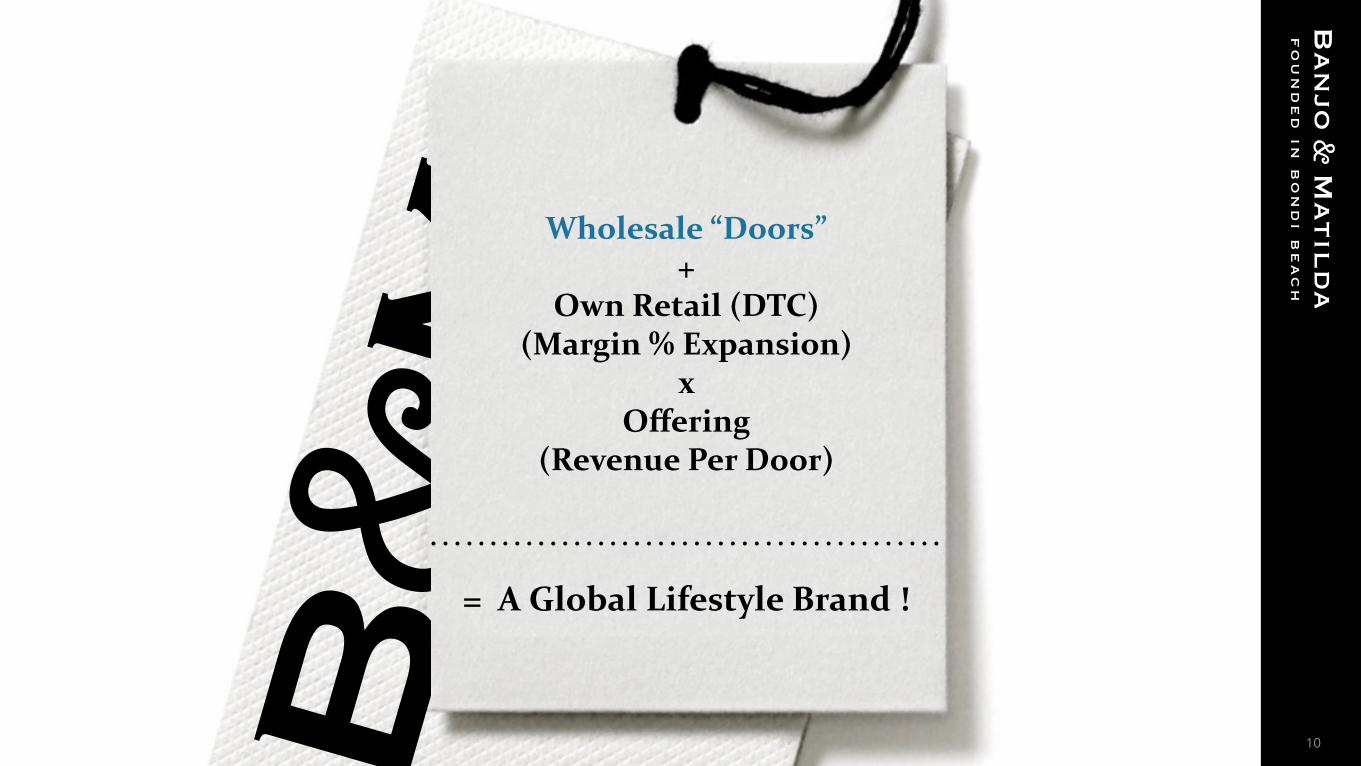
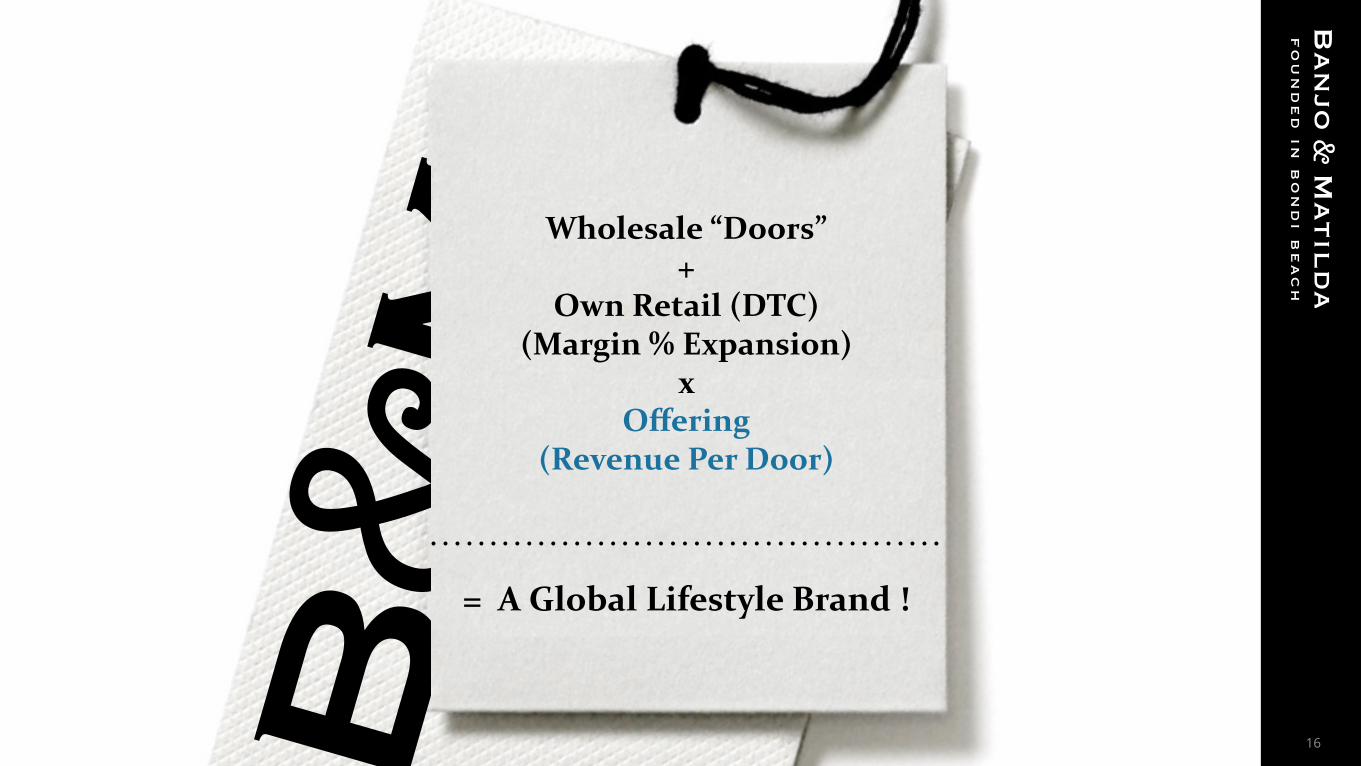
Own Retail (DTC) (Margin % Expansion)
x Offering
(Revenue Per Door) !
Wholesale “Doors”
= A Global Lifestyle Brand !
10

Retailers jumping on board
USA Net-A-Porter ShopBop Revolve Intermix Neiman Marcus Anthropologie !!!UK Net-A-Porter Harvey Nichols
Germany KaDeWe
Hong Kong Net-a-porter
Australia David Jones
Middle East Boutique1
On radar of..
11

Media & Celebrities fuelling brand growth
12
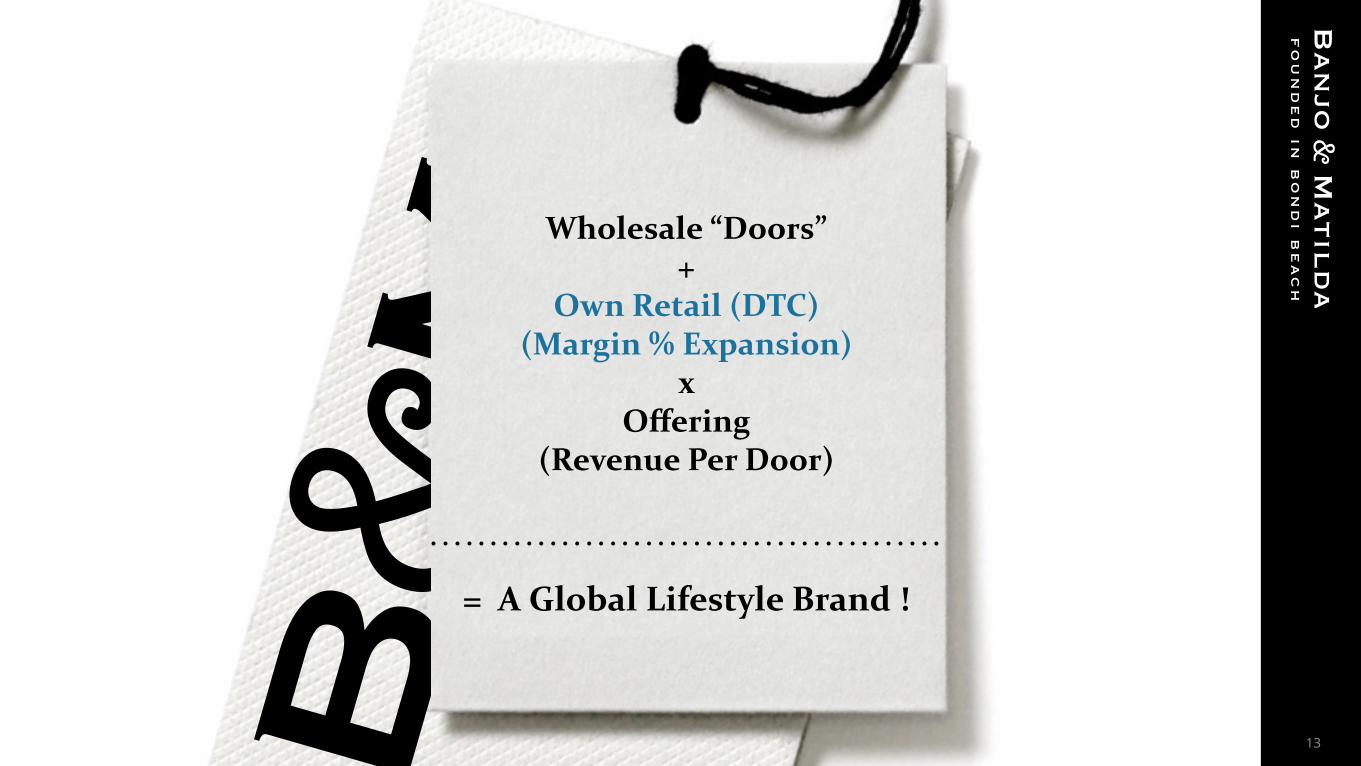
!Wholesale “Doors”
+ !!x
Offering (Revenue Per Door)
!
Own Retail (DTC) (Margin % Expansion)
= A Global Lifestyle Brand !
13

Consumers diving in
DTC Onlinee-commerce
1 x Sydney Australia store
14
0
35,000
70,000
105,000
140,000
Q1 Q2 Q3 Q4 Q1 Q2
Sales
2013 2014
0
25,000
50,000
75,000
100,000
Q3 Q1 Q3 Q1 Q3 Q1 Q3 Q1 Q3 Q1 Q3 Q1
2008 2009 2010 2011 2012 2013 2014
Visitors
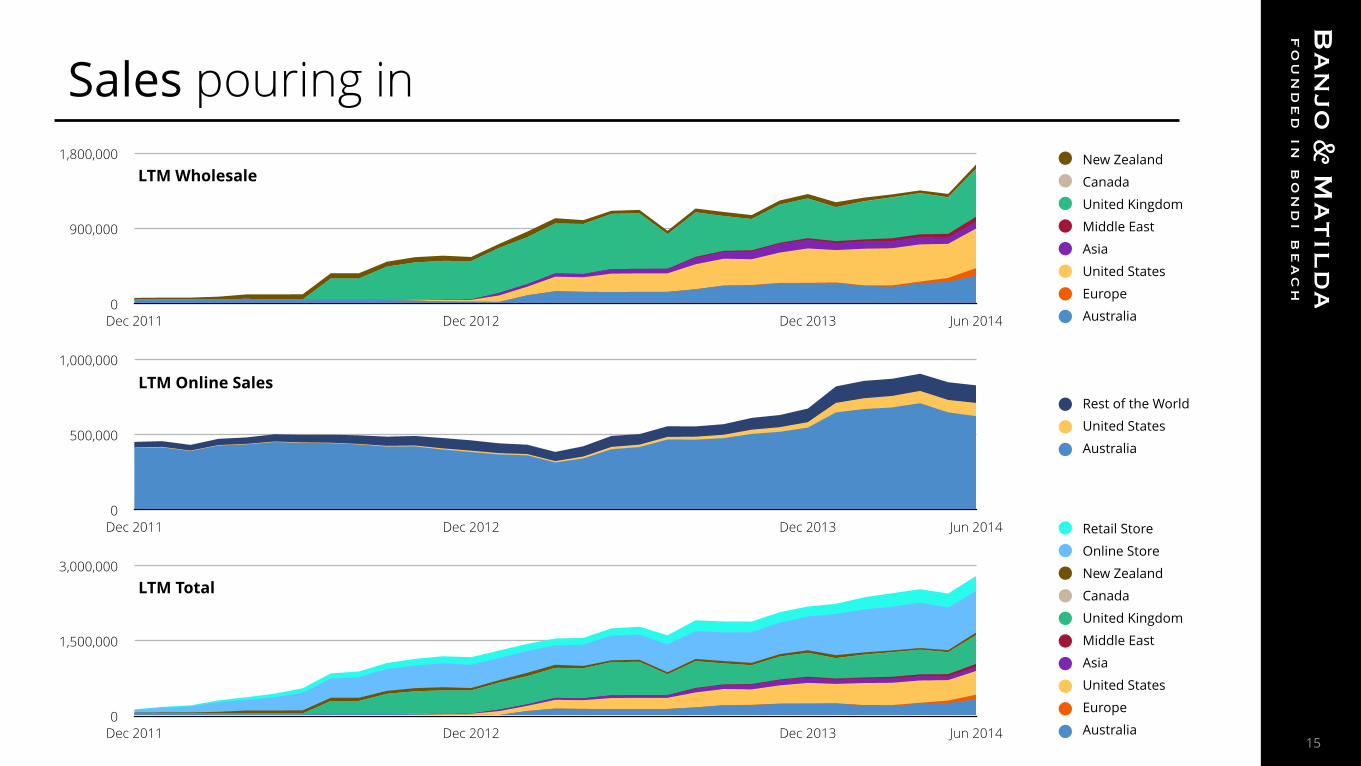
Sales pouring in
0
900,000
1,800,000
Dec 2011 Dec 2012 Dec 2013 Jun 2014
LTM WholesaleNew Zealand
Canada
United Kingdom
Middle East
Asia
United States
Europe
Australia
0
500,000
1,000,000
Dec 2011 Dec 2012 Dec 2013 Jun 2014
LTM Online SalesRest of the World
United States
Australia
0
1,500,000
3,000,000
Dec 2011 Dec 2012 Dec 2013 Jun 2014
LTM Total
Retail Store
Online Store
New Zealand
Canada
United Kingdom
Middle East
Asia
United States
Europe
Australia15
Offering (Revenue Per Door)
!Wholesale “Doors”
+ Own Retail (DTC)
(Margin % Expansion) x !!
= A Global Lifestyle Brand !
16

today
Global Australian Lifestyle
Brand
Simple growth plan
+ +
ExpandRanges
+ Aggressive online US
penetration
Major department
concession roll out +
Key flagship retail stores
Secure new key retailers
Wholesale “Doors” + Retail (DTC) Margin Expansion x Revenue/Offering per door
17
June 30 YE 2014 2015 2016 2017 2018
Revenue $m 2.6 6 11.2 21 37.9
Doors 96 214 310 505 725
Rev/Door$‘000 26 28 36 41 52

FinancialsSummary P&L (ending June 30)* FY12’ FY13’ 9 MONTHS TO MARCH 14’
New Wholesale Revenue $- 0% 147,793 8.3% 272,984 13.6%Existing Wholesale Revenue 269,784 29.3% 1,026,514 57.8% 818,951 42.5%Total Wholesale Revenue 269,784.13 29.3% 1,174,307.11 66.1% 1,091,934 56.1%Total Online Revenue 540,053.85 58.6% 446,286.09 25.1% 549,100 30.6%Total Retail Revenue 111,744 12.1% 154,650.53 8.7% 198,321 11.8%Total Revenue 921,581.98 1,775,243.73 1,839,356
Total Wholesale COGS 191,721 20.8% 727,243.69 41% 672,362 36.7%Total Online COGS (incl. Freight) 384,532.68 41.7% 153,893.5 8.7% 312,173 15.9%Total Retail COGS 79,564.7 8.6% 69,685.82 3.9% 143,491 7.1%Total COGS 655,818.38 71.2% 950,823.01 53.6% 1,128,026 59.7%
Total Wholesale GP 78,063.13 8.5% 447,063.42 25.2% 419,572 19.4%Total Online GP 155,521.17 16.9% 292,392.59 16.5% 236,927 14.7%Total Retail GP 32,179.3 3.5% 84,964.71 4.8% 54,831 4.8%Total GP 265,763.6 28.8% 824,420.72 46.4% 711,329 40.3%
Total Wholesale OPEX 49,270 5.3% 59,678 3.4% 53,919 2.8%Total Online OPEX 143,587 15.6% 89,487 5% 30,965 2.1%Total Retail OPEX 73,010 7.9% 130,385 7.3% 83,482 4.1%Total OPEX (exc. Corporate) 265,867 28.8% 279,550 15.7% 168,366 9%
Total Wholesale Contribution 28,793 3.1% 387,386 21.8% 365,653 16.6%Total Online Contribution 11,934 1.3% 202,906 11.4% 205,962 12.6%Total Retail Contribution (40,831) (4.4%) (45,420) (2.6%) (28,651) (0.6%)Total Contribution -104 0% 544,871 30.7% 542,964 29.4%
Corporate Overhead 184,904 20.1% 325,360 18.3% 594,478 31.3%
Total EBITDA -185,007 (20.1%) 219,511 12.4% -51,514 (0.1%) 18* All financials in AUD and based on Management Accounts. See relevant filings for US and public company results. Excludes financing/interest costs.
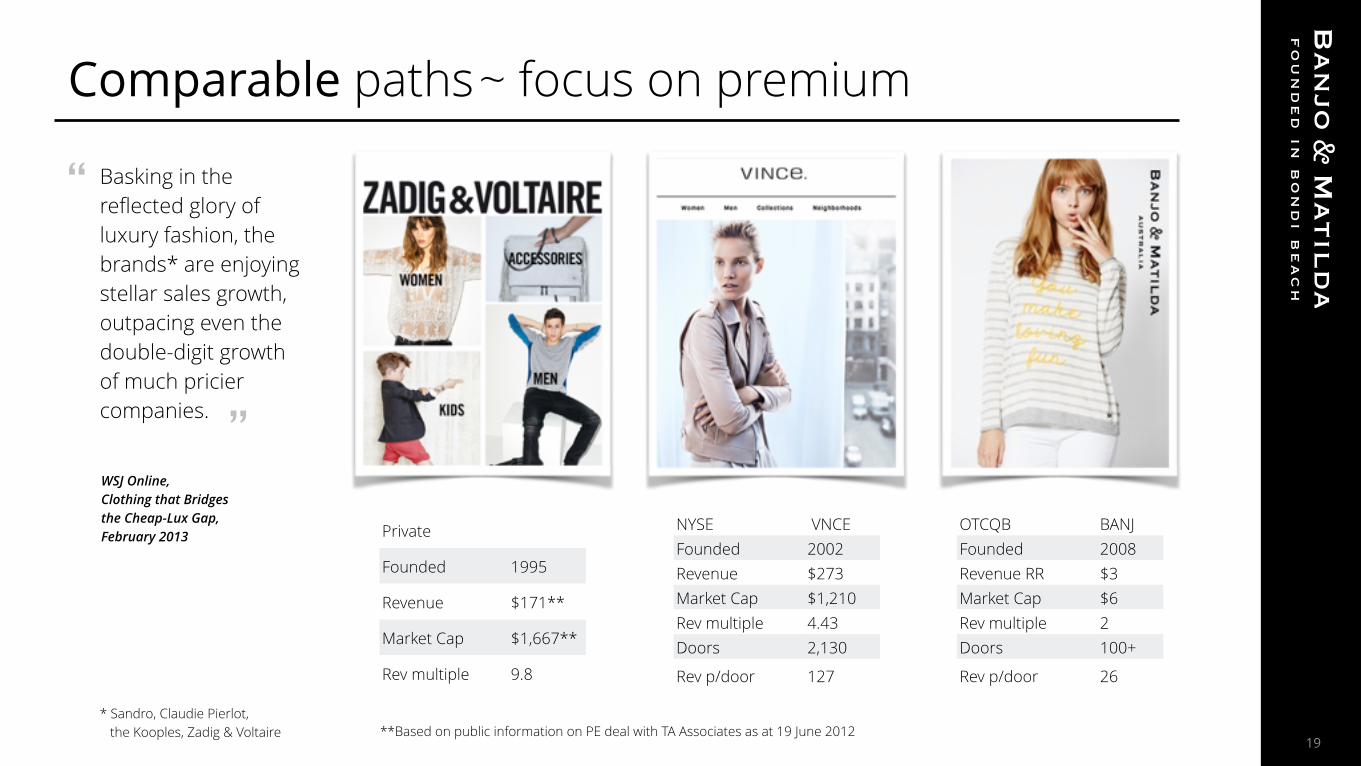
Basking in the reflected glory of luxury fashion, the brands* are enjoying stellar sales growth, outpacing even the double-digit growthof much pricier companies.
“
“
Comparable paths ~ focus on premium
**Based on public information on PE deal with TA Associates as at 19 June 201219
WSJ Online,Clothing that Bridges the Cheap-Lux Gap,February 2013
* Sandro, Claudie Pierlot, the Kooples, Zadig & Voltaire
NYSE VNCEFounded 2002Revenue $273Market Cap $1,210Rev multiple 4.43Doors 2,130
Rev p/door 127
Private
Founded 1995
Revenue $171**
Market Cap $1,667**
Rev multiple 9.8
OTCQB BANJFounded 2008Revenue RR $3Market Cap $6Rev multiple 2Doors 100+
Rev p/door 26

Market Cap *
EBITDA Margins CY 2014
EV / Sales CY 2014
EV / EBITDA CY 2014
Revenues (FY) 2014 * Growth %
Kate Spade & Co US 4,882 12.4% 4.77x NM 1,080 -15%
Vince Holding Corp US 1,342 21.6% 4.35x 20.2x 331 15%
Michael Kors Holdings Ltd Hong Kong 18,083 32.5% 4.30x 13.3x 3,311 -15%
Brunello Cucinelli Spa Italy 1,499 18.2% 3.16x 17.4x 4891 14%
Salvatore Ferragamo Spa Italy 4,778 21.3% 2.66x 12.5x 18,311 10%
Banjo & Matilda Aust/US 7 N/A 1.60x N/A 4 127%
Steven Madden Ltd US 2,186 16% 1.36x 8.5x 1,403 7%
Listed comparables
Low Mean High
12.4% 20.3% 32.5%
1.36x 3.85x 4.77x
12.5x 15.8x 20.2x
4 1,408 3,311
(15%) 20%
127%
* $ million 7 4,682
18,083
20
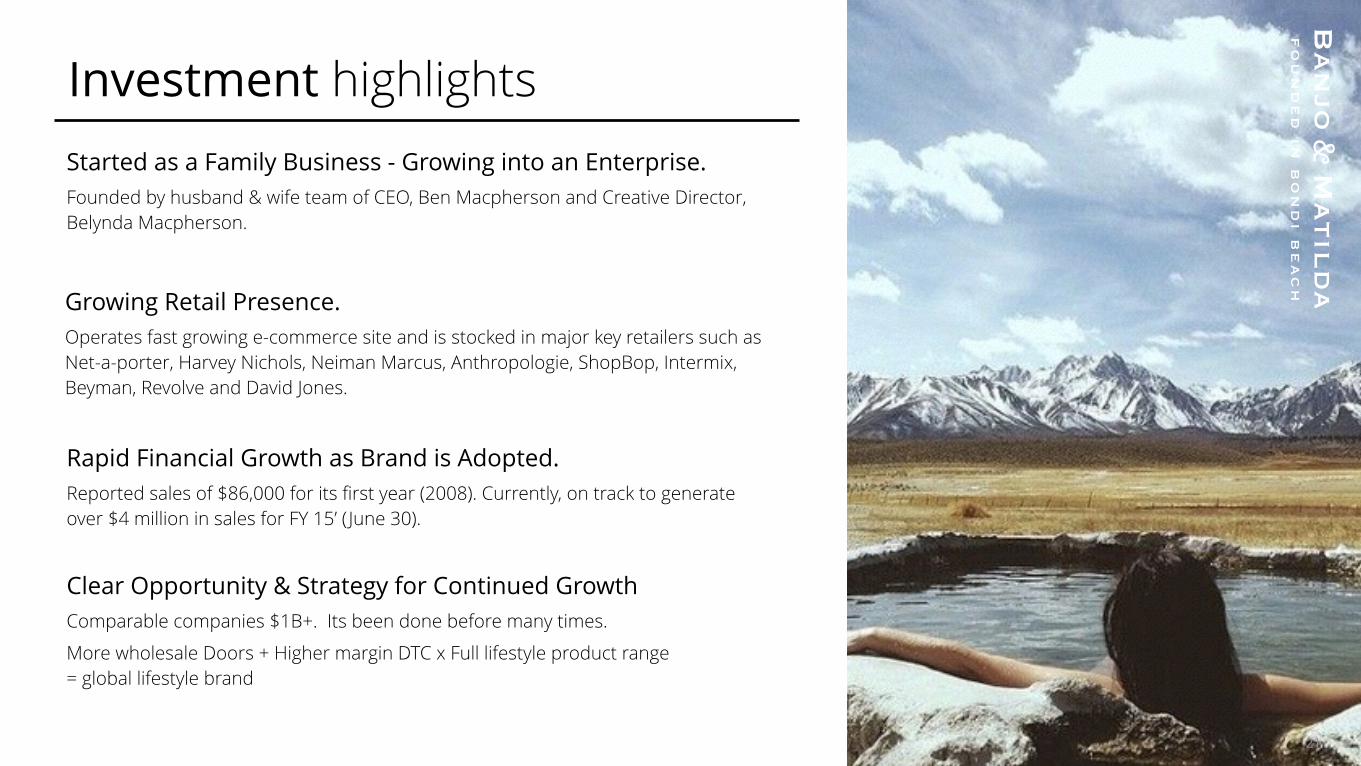
Investment highlights
21
Started as a Family Business - Growing into an Enterprise. Founded by husband & wife team of CEO, Ben Macpherson and Creative Director, Belynda Macpherson.
Growing Retail Presence. Operates fast growing e-commerce site and is stocked in major key retailers such as Net-a-porter, Harvey Nichols, Neiman Marcus, Anthropologie, ShopBop, Intermix, Beyman, Revolve and David Jones.
Rapid Financial Growth as Brand is Adopted. Reported sales of $86,000 for its first year (2008). Currently, on track to generateover $4 million in sales for FY 15’ ( June 30).
Clear Opportunity & Strategy for Continued Growth Comparable companies $1B+. Its been done before many times.
More wholesale Doors + Higher margin DTC x Full lifestyle product range= global lifestyle brand
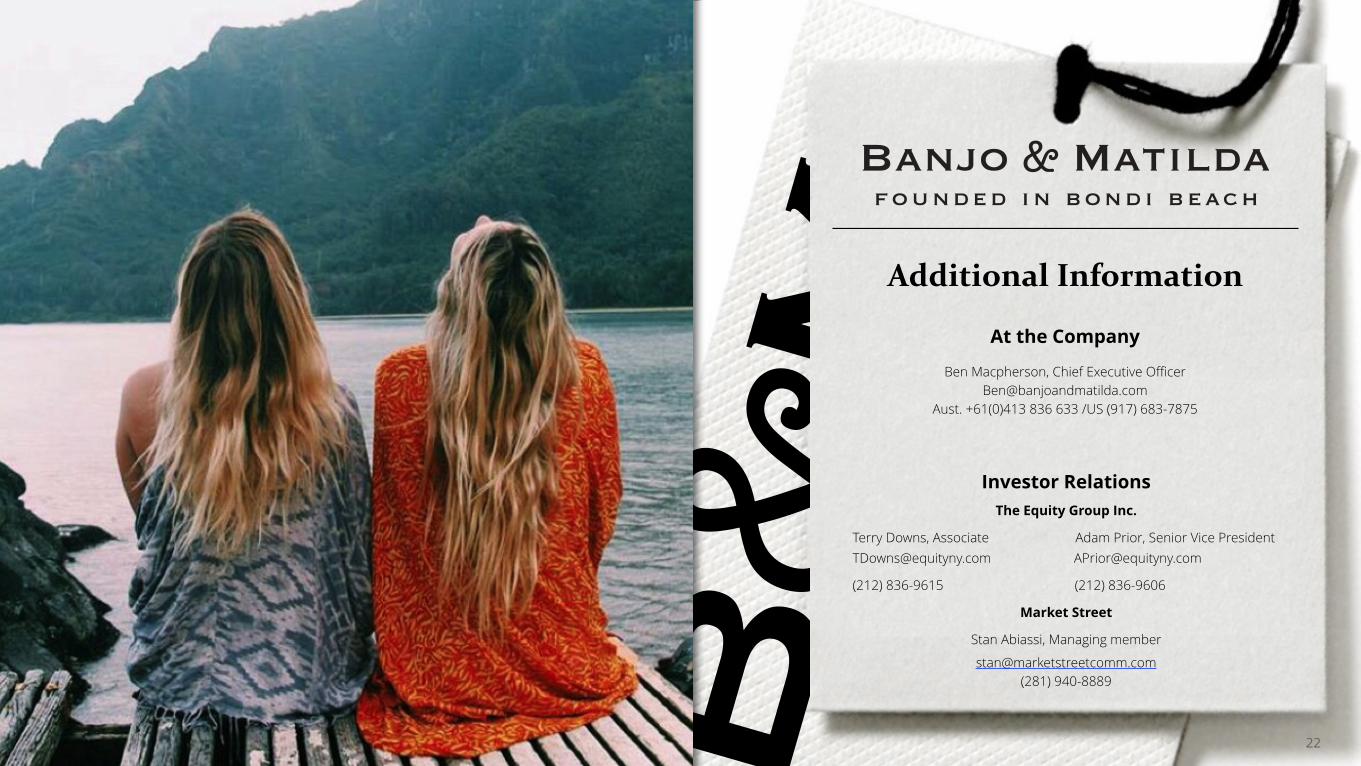
Additional Information
At the Company
Ben Macpherson, Chief Executive Officer [email protected]
Aust. +61(0)413 836 633 /US (917) 683-7875
Investor Relations The Equity Group Inc.
Terry Downs, Associate Adam Prior, Senior Vice President [email protected] [email protected]
(212) 836-9615 (212) 836-9606
Market Street
Stan Abiassi, Managing member
[email protected] (281) 940-8889 !
22