bank negara malaysia annual release 2019
TRANSCRIPT

社会经济研究中心
SOCIO-ECONOMIC
RESEARCH CENTRE
Bank Negara Malaysia (BNM)’s
Annual Release 2019
2020 – A COVID-19 Induced Recession
3 April 2020

Socio-Economic Research Centre 1
Key Messages
A COVID-19 INDUCED GLOBAL RECESSION
KEY RISKS TO GLOBAL GROWTH
MALAYSIA IS NOT SPARED AS GROWTH ENGINES DISRUPTED
ECONOMIC & FINANCIAL ISSUES
CONCLUSION

Socio-Economic Research Centre
The International Monetary Fund (IMF) stated that “It is now clear that we have entered
a recession – as bad as or worse than in 2009” while projecting a rebound in 2021.
The global growth declined by 0.1% in 2019 in 2008-2009 Global Financial Crisis.
The World Bank expects global growth to reduce by 2.1% points (pt) from the
benchmark, with developing countries and high-income countries to reduce by 2.5 % pt
and 1.9%-pt respectively. Under an amplified scenario, the global growth would be
wiped off a 3.9% pt from the benchmark. Developing countries and high-income
countries to lose by 4.0%-pt and 3.8%-pt respectively.
East Asia and Pacific (EAP) economies would suffer the most due to their relatively deep
trade integration and direct impact on tourism.
In terms of real exports loss, a baseline of 2.5% will be set off from benchmark. A
bigger loss of 4.6% in real exports is expected if the global pandemic impact worsens.
2
Asian Development Bank (ADB) also cut its developing Asia’s growth
estimate to 2.4% this year from 5.7% previously. China’s growth forecast
is slashed to just 2.3% in 2020 on coronavirus pandemic and expects a
strong bounce back of 7.3% in 2021.
The world is facing an unprecedented global pandemic-
induced crisis

Socio-Economic Research Centre 3
Key risk factors to global growth
Following the COVID-19 global pandemic outbreak, countries worldwide
have implemented broad-based travel restrictions, enforce business
closures and restrictions on social activities, suppress private and
business activities in domestic-oriented and tourism-related services
sectors as well as in the manufacturing sector.
Tightening global financial conditions, corresponding with a sharp rise
in volatility, sell-offs in major equity markets, and a depreciation in many
currencies.
The sharp decline in crude oil prices hit oil-exporting countries and
significantly impaired governments’ oil revenue-dependent budget.
Potential geopolitical conflicts in the Middle East; potential re-
escalation of trade tension among the US and its trading partner.

Socio-Economic Research Centre 4
Global policy responses to limit the human and economic
impact of the COVID-19 pandemic
Mitigating and containing as well as protection measures to prevent
the spreading of the COVID-19. These include a partial or full-locked down;
stricter social-distancing procedures; banning of gathering in crowded
places; a temporary closing of non-essential services; travel bans on
visitors originating from, etc.
Aggressive monetary and financial measures to ease tighter financial
conditions as well as to stabilise capital and foreign exchange markets.
These include bigger interest rate cuts; injection of liquidity through
quantitative easing (QE); provision of soft loans and working capital at
preferential interest rates; financial and cash flow reliefs for households
and businesses, etc.
Fiscal stimulus packages providing tax break and relief, exemption of
duties, wage subsidy and income support (cash handouts) to households
and businesses as well as measures to ease cash flow and operating costs
of businesses to cope with the demand and supply shocks.

Socio-Economic Research Centre 5
Malaysia “could not escape” recession in 2020 …
7.0
8.1 7.6 BNM
4.2
9.3
4.5 1.5
BNM
-9.7
2017 2018 2019 2020F
Private Consumption GrowthPrivate Investment Growth
%
Source: DOSM; BNM; SERC
Real GDP growth is likely to
contract, the upside support could
come from …
… as well as continued progress
of public projects and higher
public sector expenditure
… household spending by
stimulus measures and subdued
inflation …
5.5
3.3 2.0
BNM
5.9
0.3
-5.0
-10.8
BNM
-7.5
2017 2018 2019 2020F
Public Consumption Growth
Public Investment Growth
%
• BNM estimates real GDP growth between -2.0% and +0.5% in 2020 (4.3% in 2019), disrupted by
output loss from the COVID-19, Movement Control Order (MCO) and commodity supply disruptions. This
marks a sharp revision from Ministry of Finance’s estimates (3.2%-4.2% in Feb 2020 and 4.8% in 2020
Budget in October 2019).
• SERC’s GDP growth estimate is -3.0% for this year. Our estimates embedded an assumption that
the coronavirus will run its course and dissipate gradually going into the third quarter. We expect
two or three consecutive quarters of contraction with the potential broadening disruptions on economic
activities if the virus outbreak prolongs.
5.9
4.7 4.3
BNM
-2.0 to +0.5
2017 2018 2019 2020F 2020F
%
SERC
2.5
SERC
-11.4
SERC
5.4
SERC
-6.9
SERC
-3.0%

Socio-Economic Research Centre
The timely fiscal and monetary stimulus as well as micro-financial measures are
estimated to add 2.8% pt to GDP growth while capital spending for major transport
infrastructure projects (RM15 billion) are expected to lift 2020’s GDP growth by
1.0% pt.
BNM expects private consumption to grow slower by 4.2% in 2020 (7.6% in 2019)
as against SERC’s estimate of 2.5%. Weak labour market conditions, mobility
restrictions and subdued sentiments in the first half-year would weigh on households’
consumption. Several consumption stimulus and cash flow cushion initiatives (cash
assistance, flexibility and withdrawal from EPF as well as moratorium on loans
facilities) are expected to add between 4.5% pt and 5.0% pt to private consumption
growth.
Private investment is projected to decline by 9.7% in 2020 (+1.5% in 2019), which
SERC expects a sharper double-digit contraction of 11.4%, due to dampened business
sentiments as well as higher domestic and external uncertainties.
The 28 days MCO has severely impacted businesses as non-essential services have
temporary ceased operations and selected manufacturing firms are operating only at a
partial capacity. The moratorium on loan payments and loan guarantees as well as
wage subsidy scheme would provide some respite to businesses.
6
… dragged by weak global demand and domestic
containment measures

Socio-Economic Research Centre
Public consumption is expected to expand further by 5.9% in 2020 (2.0% in 2019),
due to higher public spending, including the implementation of more small-scale
projects worth RM4 billion and higher spending on healthcare purposes.
Public investment is projected to contract milder by 7.5% in 2020 (-10.8% in 2019),
underpinned by the continuation of large-scale transport-related projects (such as
MRT2, LRT3 and Pan Borneo highway) and the implementation of upstream oil and
gas, telecommunication and power generation projects. Non-financial public
enterprises’ capital spending will continue to decline.
Net external sector is expected to contract significantly by 27.0% (+8.9% in 2019)
as real exports will decline by a larger magnitude (-13.6% vs. -1.1% in 2019),
reflecting primarily weaker global demand conditions following the spread of COVID-19
across many major economies. Commodities exports are expected to contract further
due mainly to lower prices of crude oil and LNG as well as weaker commodities
production. The sharp decline in tourist arrivals will result in low tourism receipt and
hence, lower exports for services.
Weaker labour market conditions. Unemployment rate is estimated to reach 4.0%
in 2020 (3.3% in 2019 and 3.7% in 2009). Besides increasing number of
retrenchments, compensation of employees are expected to be lower due to unpaid
leave, pay cut, reducing working hours, freezing of new hiring, and delay in salary
increment/bonus. Income support measures can only partially offset the loss of income.
7

Socio-Economic Research Centre 8
Sectoral outlook: Services sector alone is “insufficient”
2020F: 2.3% (SERC: -0.8%) 2019: 6.1%; % share of GDP: 57.7
• Impact of COVID-19 and MCO on
tourism-related and consumer services
is cushioned by stimulus measures.
• Supported by a gradual improvement
in household spending. Services
2020F: -1.9% (SERC: -1.0%) 2019: 0.1%; % share of GDP: 4.7
• Further progress in the implementation
of transport-related projects.
• Implementation of more small-scale
projects worth RM4 billion. Construction
2020F: -8.6% (SERC: -8.0%) 2019: 3.8%; % share of GDP: 22.3
• Inputs procurement disrupted by
prolonged factory closures in key
industrial hubs in the COVID-19
affected countries.
• Production disruptions abroad also
lower demand for manufactured
products.
Manufacturing
2020F: -4.2% (SERC: -3.8%) 2019: -1.5; % share of GDP: 7.1
• Sharp decline and volatile shifts in crude oil and LNG prices (BNM’s estimates: US$25-US$35 per
barrel for Brent crude oil and RM1,150-RM1,250 per tonne for LNG).
• Affected by continued maintenance works. But, operationalisation of new fields in Sarawak and
PETRONAS Floating LNG Dua (PFLNG2) facility in Sabah will partially offset the decline in output. Mining
2020F: -2.9% (SERC: -3.0%) 2019: 1.8; % share of GDP: 7.1
• Low oil palm production is expected to
extend into early 2020 as well as output
constraints arising from MCO.
• Disruptions to dissipate gradually as
weather conditions normalise later.
• BNM’s estimates: RM2,000-RM2,200/mt
Agriculture

Socio-Economic Research Centre 9
Risks to 2020’s baseline growth prospect
BNM’s baseline assessment for GDP growth in 2020: -2.0% to +0.5%
Upside risks
▲ Larger-than-expected impact from pro-
growth measures
▲ Faster normalisation in activity amid
pent-up demand
Downside risks
▼ Prolonged and wider spread of COVID-19
globally and domestically
▼ Recurring commodities supply disruptions
▼ Tightening of financial conditions
• COVID-19 impact on economic
activity is expected to be
significant but transitory.
• Effective implementation of
comprehensive measures will
provide support to economic
activity.

Socio-Economic Research Centre 10
BNM’s monetary and financial measures to support growth
from 3.00% to 2.50%
from 3.00% to 2.00%

Socio-Economic Research Centre
• In this unprecedented global pandemic-inflicted economic disruptions and financial
turbulences, Malaysia cannot be spared from a fallout in global trade, extreme
financial markets’ volatility, shaken domestic consumers’ and businesses’
sentiments as well as a sharp fall in private investment, which we estimate to decline
by 11.4% in 2020 compared to -9.7% as projected by Bank Negara Malaysia (BNM).
• While the rolling out of two Economic Stimulus Packages totalling RM250.0 billion or 17% of
GDP are expected to soften economic damages and financial losses in terms of the
magnitude of economic contraction, it cannot avoid an outright recession this year.
• Bank Negara Malaysia’s projection of between +0.5% and -2.0% in 2020 is optimistic
compared to our estimates of -3.0%. We attach considerable downside risks to our
estimates given the potential broadening disruptions on economic activities if the virus
outbreak prolongs.
• Businesses in sectors such as tourism, hospitality, entertainment, air transportation,
consumer goods and retail have been particularly hard-hit. Foreign tourists are expected
to take a longer while to resume travelling until the global outbreak stabilizes and sentiment
gradually restored. Businesses in property sector are expected to worsen further due
to extremely cautious consumer sentiment to commit buying big ticket items amid the
stubbornly property overhang.
11
SERC’s commentaries

Socio-Economic Research Centre
• Export-oriented industries such as electrical products and electronics, palm oil as
well as oil and gas are exposed to shrinking global demand and slumping prices as
Malaysia’s major trading partners such as the US, Europe and China as well as ASEAN
countries are going through a tough time of the COVID-19’s inflicted economic and financial
disturbances.
• The key outlook issue now is to gauge how lasting damage, the depth and duration of
2020 recession from the COVID-19’s shock. SERC’s estimate embedded an assumption
that the coronavirus will run its course and dissipate gradually going into the third quarter.
This is a worldwide virus attack and it is likely to take at least 6-12 months from
containment, stabilisation and recovery before people and businesses are returning to
normalcy.
• We expect two or three consecutive quarters of contraction. The 28-day Movement
Control Order (MCO) is expected to have a significant knock-down impact in late March and
2Q given that about 77% of SMEs surveyed have temporary closed their business operation
and for those companies and industries allowed to operate are generally running at around
40%-50% capacity. Softer discretionary spending and restricted movement throughout the
MCO have resulted in lower than normal spending and economic actvities.
12
SERC’s commentaries (cont.)

Socio-Economic Research Centre
• Even after the MCO is lifted, we expect continued stricter physical procedures and
measures, including social distancing at public places until the COVID-19 situation is
under controlled.
• We are pinning hope that the sizeable cash handouts and cash flows cushion provided to
households would help to release pent-up consumer spending when the virus outbreak
stabilizes and sentiment improves and hence, help to generate domestic demand.
Nevertheless, Bank Negara Malaysia’s estimated rise in the jobless rate of 4.0% or 629,000
persons this year (3.3% in 2019) could rise higher, and higher retrenchments would weigh
on consumer spending. The biggest worries are that those who were affected by pay cut,
unpaid leave or got retrenched during six months’ moratorium on loans facilities, could face
the cash flow problem to resume their loans repayment after the expiry of moratorium
period.
• With a subdued headline inflation or even deflation as projected by Bank Negara
Malaysia to between -1.5% and +0.5% in 2020, Bank Negara Malaysia’s monetary policy
will continue to remain highly accommodative to complement the expansionary fiscal policy
to counteract the demand and supply shocks. The projected deflation is largely attributable
to the plunging global crude oil prices that have translated into lower fuel prices as well as
moderating consumer demand.
13
SERC’s commentaries (cont.)

Socio-Economic Research Centre
-9.7
9.0
4.3 1.5
-11.4
2017 2018 2019 2020E
Private Investment Growth
(%)
4.2
6.9
8.0 7.6
2.5
2017 2018 2019 2020E
Private Consumption Growth
(%)
14
Malaysia’s key economic indicators
Source: DOSM; MPOB; BNM; SERC
5.7 4.7 4.3
-3.0
2017 2018 2019 2020E
Real GDP Growth (%)
SERC
BNM
SERC
BNM
SERC
BNM
-13.0
18.8
7.3
-1.7 -11.2
2017 2018 2019 2020
Gross Export Growth
(%)
SERC
-1.5 to +0.5
3.7
1.0 0.7
2017 2018 2019 2020E
Inflation Rate (%)
SERC
-0.5 to -1.0 BNM
4.0
3.4
3.3 3.3
4.5
2017 2018 2019 2020E
Unemployment Rate (%)
BNM
SERC
25 to 35
54
71 64
2017 2018 2019 2020E
Brent Crude Oil Prices
(US$/barrel)
BNM SERC
2,000-2,200
2,783
2,233
2,079 2,150
2017 2018 2019 2020E
Crude Palm Oil Prices
(RM/metric tonne)
BNM
SERC
-2.0 to +0.5
BNM

Socio-Economic Research Centre 15
Sources of GDP growth: Demand and supply side
% growth, 2015=100 2017 2018 2019 2020F
(BNM)
2020F
(SERC)
GDP by demand component
Private consumption (58.8%) 6.9 8.0 7.6 4.2 2.5
Private investment (16.8%) 9.0 4.3 1.5 -9.7 -11.4
Public consumption (12.2%) 5.5 3.3 2.0 5.9 5.4
Public investment (6.3%) 0.3 -5.0 -10.8 -7.5 -6.9
Exports of goods and services (64.0%) 8.7 2.2 -1.1 -13.6 -13.1
Imports of goods and services (56.7%) 10.2 1.3 -2.3 -11.9 -12.8
GDP by economic sector
Agriculture (7.1%) 5.7 0.1 1.8 -2.9 -3.0
Mining & quarrying (7.1%) 0.4 -2.6 -1.5 -4.2 -3.8
Manufacturing (22.3%) 6.0 5.0 3.8 -8.6 -8.0
Construction (4.7%) 6.7 4.2 0.1 -1.9 -1.0
Services (57.7%) 6.2 6.8 6.1 2.3 -0.8
Overall GDP 5.7 4.7 4.3 -2.0 to +0.5 -3.0
Source: DOSM; BNM; SERC
Figure in parenthesis indicates % share to GDP in 2019
• Private consumption is the primary engine to hold up the economy, albeit weaker.
• Manufacturing sector the hardest hit due to the restriction of operations and supply
chain disruptions.

Socio-Economic Research Centre 16
Sharp decline in exports lead to lower current account surplus
Source: DOSM; BNM; SERC
-13.0
1.2
18.8
7.3
-1.7
-11.2
-16
-12
-8
-4
0
4
8
12
16
20
24
2010 2011 2012 2013 2014 2015 2016 2017 2018 2019 2020E
%
Exports is expected to decline further by 13.0%
in 2020
Broad based contraction in exports in 2019
Current account surplus is expected to go
lower at 1.0%-2.0% of GDP in 2020
Major export products RM billion % Growth
E&E products [37.8%] 372.7 -2.3
Petroleum product [7.2%] 71.5 -6.1
Chemical and related products [5.8%] 57.0 -1.2
Palm oil [4.4%] 43.1 -3.6
Manufactures of metal [4.2%] 41.5 -7.1
LNG [4.2%] 41.5 -1.9
Machinery & equipment [4.2%] 41.4 1.8
Optical & scientific equipment [3.9%] 38.6 5.5
Crude Petroleum [2.7%] 26.3 -28.1
83.1 94.3 101.5
114.7
-53.2 -56.0 -70.9 -64.9
2.4% 2.8% 2.1% 3.3%
1.0% - 2.0%
-9%
-6%
-3%
0%
3%
6%
9%
12%
15%
-90
-60
-30
0
30
60
90
120
150
2010 2011 2012 2013 2014 2015 2016 2017 2018 2019 2020F
Current Account Balance Goods & Services Balance Primary & Secondary Income Balance CA/GDP Ratio (RHS)
RM billion
Figure in parenthesis indicates % share of gross exports in 2019
BNM
SERC

Socio-Economic Research Centre
• BNM expects headline inflation to
average between -1.5% and +0.5% in
2020 (SERC: -0.5% to -1.0%) (0.7% in
2019), with the downside risks come from
movements in global oil and commodity
prices.
• Brent crude oil spot price level fell to a low
US$19.07/bbl on 30 March while RON95
petrol retail price level lowered to
RM1.30/litre, the lowest since Nov 2002-
Feb 2003*.
• Core inflation is projected to remain in
positive trajectory at average of 0.8%-
1.3% in 2020 (1.5% in 2019) as demand
pressures subdued, coupled with
projected negative output gap and weak
labour market conditions.
17
Inflationary pressures remain subdued on lower oil prices
and weaker demand
Source: BNM; DOSM
Note: Core inflation in 2008-2014 excludes food and non-alcoholic beverages only.
-20
-15
-10
-5
0
5
10
15
20
25
-8
-6
-4
-2
0
2
4
6
8
10
2008 09 10 11 12 13 14 15 16 17 18 19 20
% % Inflation Rate
Headline Inflation Rate (LHS)
Core Inflation Rate (LHS)
Transport Inflation Rate (RHS)
* Referred to RON92 petrol as RON95 petrol is
introduced in Sep 2009 to replace the former.

Socio-Economic Research Centre 18
Monetary measures to remain highly accommodative
2.50
1.3
-1
0
1
2
3
4
5
Jan2016
Jul Jan2017
Jul Jan2018
Jul Jan2019
Jul Jan2020
%
OPR Inflation Rate
Lower oil prices-induced deflation in 2020 Ringgit outlook: RM4.30-RM4.50 per US dollar
at end-2020
Source: DOSM; BNM
* OPR as at end-period
^ SERC’s estimates
-6.1%
-18.6%
-4.3%
10.4%
-1.8%
1.1%
-6.1%
3.4950
4.2920
4.4860
4.0620
4.1385
4.0925
4.3600
2014 2015 2016 2017 2018 2019 3 Apr2020
Change from previous end-year's rate RM/US$
Year 2016 2017 2018 2019 2020E^
OPR (%)* 3.00 3.00 3.25 3.00 2.00-
2.50
Inflation
Rate (%) 2.1 3.7 1.0 0.7
-0.5 to
-1.0
Note: Exchange rate (12:00 rate) as at end-period
• BNM has cut overnight policy rate (OPR) twice to 2.50% and lowered statutory reserve
requirement (SRR) by 100bps to 2.00% to cushion domestic demand. Six months’
moratorium on loan payment is allowed to ease cash flow for individuals and businesses.

Socio-Economic Research Centre 19
Moderating net inflows of direct investment
Gross FDI inflows continued to shrink Gross ODI flows have increased; ODI stock
declining at a slower pace
Net FDI inflows higher than net outward direct investment in 2019
-1.8
13.8 16.2 11.3 9.4
-30
-20
-10
0
10
20
30
0
10
20
30
40
50
60
2011 2012 2013 2014 2015 2016 2017 2018 2019
RM billion RM billion
Net FDI (LHS) Net ODI (LHS) Net Direct Investment (RHS)
595.5 631.2
691.6
156.8
144.2 137.0
90
100
110
120
130
140
150
160
0
100
200
300
400
500
600
700
800
2012 2013 2014 2015 2016 2017 2018 2019
RM billion RM billion
FDI Stock (LHS) Gross FDI Inflow (RHS)
526.5 492.0 486.3
65.4 64.5 70.5
40
50
60
70
80
90
100
0
100
200
300
400
500
600
2012 2013 2014 2015 2016 2017 2018 2019
RM billion RM billion
ODI Stock (LHS) Gross ODI outflow (RHS)
Source: BNM FDI = Foreign direct investment; ODI = Outward direct investment

Socio-Economic Research Centre
• Household debt expanded higher by 5.3% to RM1,250 billion (or 82.7% of GDP) in 2H
2019 (vs. 5.1% in 1H 2019 and 4.7% in 2H 2018), driven by higher loans for purchases of
residential property, boosted by Home Ownership Campaign (HOC) as well as personal
financing and credit card loan on higher lending to civil servants.
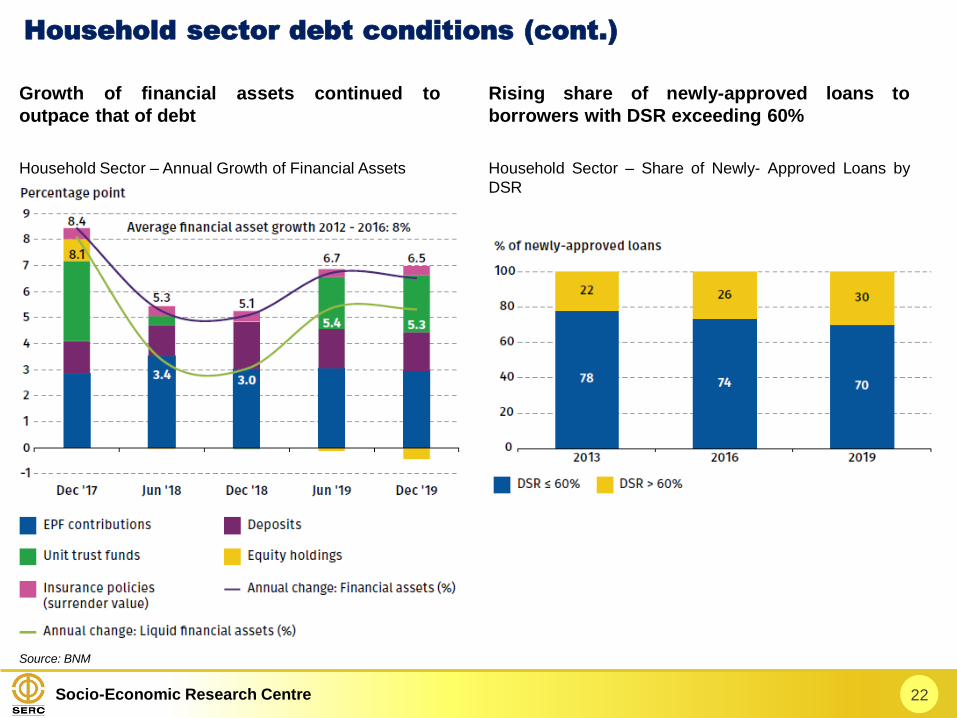
• However, credit risks remain largely contained as household financial assets and
liquid financial assets remained broadly stable at 2.2 times and 1.4 times of debt
respectively. Household financial assets also continued to outpace the growth in debt for the
third consecutive year.
20
Household debt-to-GDP ratio edged higher in 2H 2019
Source: BNM
1,023 1,081
1,134 1,187
1,250
88.4 87.8 82.7 82.0 82.7
207.1 206.6 213.5 214.4 216.7
143.4 141.4 145.7 143.4 143.4
0
50
100
150
200
250
300
0
200
400
600
800
1000
1200
1400
2006 2007 2008 2009 2010 2011 2012 2013 2014 2015 2016 2017 2018 2019
Ratio RM billion
Household (HH) Debt (LHS) HH Debt-to-GDP Ratio
HH Financial Asset to Total HH Debt Ratio HH Liquid Financial Asset to Total HH Debt Ratio

Socio-Economic Research Centre 21
Household sector debt conditions
Household debt growth was higher Higher debt- and financial assets-to-GDP ratios
Household Sector – Annual Growth of Debt Household Sector – Key Ratios
Source: BNM
Socio-Economic Research Centre 22
Household sector debt conditions (cont.)
Growth of financial assets continued to
outpace that of debt
Rising share of newly-approved loans to
borrowers with DSR exceeding 60%
Household Sector – Annual Growth of Financial Assets Household Sector – Share of Newly- Approved Loans by
DSR
Source: BNM

Socio-Economic Research Centre 23
Household sector debt conditions (cont.)
Higher impaired loan growth for residential
properties
Exposures to vulnerable borrowers continued
to decline
Household Sector – Annual Growth of Impaired Loans Household Sector – by Monthly Income Group
Source: BNM

Socio-Economic Research Centre 24
Household sector debt conditions (cont.)
Vulnerable borrowers have insufficient LFA
cover
Larger holdings of equities and variable price
unit trust funds among higher-income group
Source: BNM
Household Sector – Financial Assets-to-Debt Ratio by Type
and Income Group
Composition of Liquid Financial Assets by Components and
Income Group

Socio-Economic Research Centre 25
Household sector debt conditions (cont.)
While higher-income groups are more sensitive to equity market volatility, their asset cover
remained above the prudent threshold
Source: BNM
Pre- and Post-shock Scenarios – Liquid financial assets (LFA) Cover by Income Group
BL = Baseline
S1 = 45% decline in value of equity and variable price UTF holdings (as per scenario during GFC)
S2 = 77% decline in value of equity and variable price UTF holdings (as per scenario during AFC)
Most households would still maintain an LFA cover above the prudent threshold, as more than 60% of which
are held in bank deposits and investments in fixed-priced unit trust funds (UTFs), which are not affected by
movements in the equity market.

Socio-Economic Research Centre 26
Business risks to the financial system are contained
Most firms have the capacity to continue
servicing their debt
Debt-servicing capacity improved for most
sectors
Business Sector – Liquidity and Debt-servicing Capacity
Indicators for Selected Sectors
Source: BNM
ICR = Interest coverage ratio
CASTD = Cash to short-term debt ratio

Socio-Economic Research Centre
The excess capital of RM121 billion allowed the
six-month loan moratorium and continued support
lending activity.
27
Sustained profitability and sound asset quality strengthened
the solvency position of the banking system
Banks continued to maintain strong buffers
against potential credit losses
Banks and insurers’ capital buffers sufficient to
absorb potential losses and support lending
activity
Banking System – Provisions
Source: BNM

Socio-Economic Research Centre
• Private investment recorded the lowest growth of 1.5% (4.3% in 2018) since Global
Financial Crisis (GFC) in 2008-2009, much lower compared to long-term average growth of
7.9%.
• The weak investment growth in recent years were contributed by:
1. Challenging global macroeconomic backdrop
– UNCTAD highlighted that average net FDI growth globally dropped from 8%
(2000-2007) to only 1% in the recent decade.
– Net FDI in Malaysia declined by an average of 11% a year between 2016 and
2019
2. Oversupply in domestic property market
– Total construction work done continuously moderating to 0.6% growth in 2019
from 25.5% in 2012 due to oversupply and persistent market imbalances.
– The slowdown in residential and commercial property construction caused the
significant decline in the contribution from structures investment since the peak in
2012.
3. Sharp fall in oil prices
– Oil and gas sector reduced their capital expenditure significantly for four
consecutive years after sharp decline in oil prices since late-2014, resulting a fall
of share of mining sector to private investment from 15% in 2015 to 10% in 2018.
28
Persistent weak investment is threatening Malaysia’s future
potential growth

Socio-Economic Research Centre 29
Holistic reforms are necessary to reinvigorate investment

Socio-Economic Research Centre
Establish overall investment policy goals in line with national developmental
objectives
• FIVE “National Investment Aspirations” (NIAs) outline the key criteria for
quality investments necessary for Malaysia.
• To operationalize NIAs, investment incentives policy should shift away from
predominantly targeting specific sectors towards encouraging high-value
activities (e.g. advanced research and development (R&D)).
30
Key areas of reform to strengthen investment ecosystem
FIVE “National Investment Aspirations”

Socio-Economic Research Centre
Streamlining investment promotion and elevating investor services to
facilitate the realisation of investment
• The success of coherent investment ecosystem hinges on a strategic division
of mandates to avoid confusion among investors and a well-structured,
well-coordinated institutional framework.
31
Key areas of reform to strengthen investment ecosystem
(cont.)
Investment Lifecycle
Source: World Bank
• This arrangement should
facilitate the implementation
of investments by reducing
bureaucracy at both the
Federal and State level.
Broad types of services that
the Investment Promotion
Agencies (IPAs) provide to
investors – and that
investors typically expect –
at different stages of the
investor journey.

Socio-Economic Research Centre
Clear, transparent and predictable tax incentives administration
• Investment tax incentives should be efficient and transparent to allow
investors to make informed decisions on investing.
• The recent centralisation of incentives approvals under the National
Committee on Investments (NCI) is a positive step towards streamlining and
strengthening the incentives administration framework.
• For standard cost-based incentives, an automatic approval system can be
introduced with transparent criteria and self-assessed outcomes reported
during the annual tax return.
• To attract high-quality and strategic investment, customised incentives are
necessary. Malaysia needs to define strategic investors that allow Malaysia to
acquire new skills, talent and establish leadership in emerging technology while
at the same time to improve the ability to monitor investor compliance and the
desired outcomes.
32
Key areas of reform to strengthen investment ecosystem
(cont.)
Socio-Economic Research Centre
• The IMF said that the COVID-19 global pandemic has triggered a global recession and the
fallout will be much worse than 2008-2009 Global Financial Crisis. Bank Negara Malaysia
projects Malaysia’s GDP growth between -2.0% and +0.5% in 2020, much lower than
Ministry of Finance’s estimates of 3.2%-4.2% in February 2020 and 4.8% in October last
year. SERC’s estimate is -3.0% in 2020 with still considerable downside risks.
• Consumer spending, to be lifted by cash aids and cash flow cushion measures would be
the only primary support to the economy. Weak global demand, dampened business
sentiment and sharply reduced tourism activities are expected to push investment
and external sector into a deep negative territory, and wipe off the gains from
consumption, and causes a recession.
• While the services sector is severely hit by sluggish retail and tourism-related
activities, the manufacturing sector is expected to contract sharply by 8.6% while
other key economic sectors also in a contraction mode. As the 28-day MCO (18 March
to 14 April) has only allowed selective operation of industries and supply chains in the
manufacturing sector, but not the construction and some mining-related sectors, this has led
to a major loss of output.
33
CONCLUSION

Socio-Economic Research Centre
• Even the MCO is lifted after 14 April, stricter protection procedures and social-
distancing measures are expected to continue until the COVID-19 situation stabilises,
and hence, we expect a gradual return to normalcy in consumer spending and business
activities. Foreign tourists are expected to resume leisure and travelling until sentiment
improves and coronavirus global outbreak subsides.
• The timely rollout of RM250 billion or 17% of GDP Economic Stimulus Packages and
monetary and financial measures could ease economic and financial pressures on
domestic economy and businesses, but it is likely to avert a recession this year.
• Weaker domestic demand and lower fuel prices-induced risk of deflation arises as
BNM estimates headline inflation to average -1.5% to +0.5% in 2020. We expect Bank
Negara Malaysia to cut interest rate by 50 basis points to 2.00% in May 2020 and also more
liquidity injection into the banking system.
34
CONCLUSION (cont.)

社会经济研究中心
SOCIO-ECONOMIC
RESEARCH CENTRE
谢 谢 THANK YOU
Address : 6th Floor, Wisma Chinese Chamber, 258, Jalan Ampang, 50450 Kuala Lumpur, Malaysia.
Tel : 603 - 4260 3116 / 3119
Fax : 603 - 4260 3118
Email : [email protected]
Website : http://www.acccimserc.com