bank of baroda from stability to sustainability ( q1, 2010-11) ( q1, 2010-11) dr rupa rege nitsure...
Post on 19-Dec-2015
215 views
TRANSCRIPT
Bank of BarodaBank of Baroda From Stability to SustainabilityFrom Stability to Sustainability
( Q1, 2010-11)( Q1, 2010-11)
Dr Rupa Rege NitsureDr Rupa Rege NitsureChief EconomistChief Economist
July 29, 2010July 29, 2010
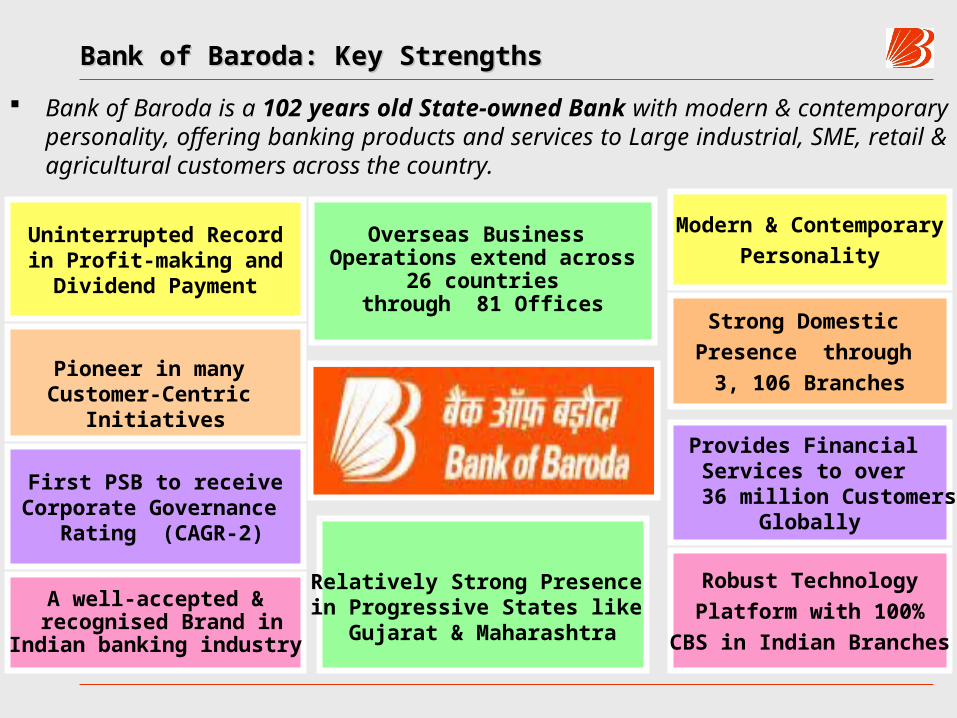
Bank of Baroda: Key StrengthsBank of Baroda: Key Strengths
Bank of Baroda is a 102 years old State-owned Bank with modern & contemporary personality, offering banking products and services to Large industrial, SME, retail & agricultural customers across the country.
Relatively Strong Presence in Progressive States like
Gujarat & Maharashtra
Uninterrupted Record in Profit-making and
Dividend Payment
Overseas Business Operations extend across
26 countries through 81 Offices
First PSB to receiveCorporate Governance
Rating (CAGR-2)
Robust TechnologyPlatform with 100%
CBS in Indian Branches
Pioneer in many Customer-Centric
Initiatives
Strong Domestic Presence through
3, 106 Branches
Modern & ContemporaryPersonality
Provides Financial Services to over
36 million Customers Globally
A well-accepted & recognised Brand in
Indian banking industry

Domestic Branch NetworkDomestic Branch Network
27032735
2851
2927
3106
2500
2600
2700
2800
2900
3000
3100
3200
Q1-FY07
Q1-FY08
Q1-FY09
Q1-FY10
Q1-FY11
No. of Domestic Branches
Regional Break-up of Domestic Branches as on 30th June,
2010
Metro Urban Semi-Urban
Rural
673 581 723 1,129
•Bank’s network of domestic branches as on 30th June, 2010 was 3,106 & no. of ATMs were 1,372 .
•During Q1, FY10, Bank opened seven new branches and merged one existing branch.
•Around 36.35% of the Bank’s branch network is located in rural areas.
•Seven new branches are opened in Bihar, Jharkhand, Mumbai, Delhi, Lucknow, Bharuch & Kaprain and One branch is merged in Ahmedabad.
•Bank proposes to open around 383 more branches during rest of FY11.

Robust Technology PlatformRobust Technology Platform
•As on 30 June 2010, all domestic branches, that is 3,106 branches & 26 extension were on CBS.
•Additionally, 43 branches in 12 overseas territories & 28 branches in eight overseas subsidiaries are on CBS covering 94.0% of total overseas business. During Q1, FY11, the CBS was rolled out in the Bank’s New Zealand territory.
•Bank’s Retail & Corporate Customers enjoy several facilities like internet banking, phone banking, rapid funds2india – an online money transfer service, retail depository services, e-tax payment, NEFT/RTGS thru’ e-banking, sms alerts, cash mgmt services, online institutional trading, etc.
•As on 30 June, 2010, Bank had 1,372 ATMs – 863 Onsite ATMs & 509 Offsite ATMs.
• An Integrated Global Treasury Solution is implemented in UK, UAE, Bahamas, Baharain, Hong Kong & recently in India.
•AML System has been implemented in India & in 18 overseas territories.
• Bank has created an Online Centralised-Database of its employees, which enables speedy decision-making, promotions, selection, etc. through automated processes.
• Payment Messaging Solution has been implemented in 16 overseas territories & all B category branches in India.
•Bank has implemented multiple accounts being linked to a single Debit Card (verified by Visa; CVV2) & has also implemented 3DSecure feature & Back Office for Merchant Mgmt in the Internet Payment Gateway.
•Document Mgmt System has been rolled out for Centralised Pension Payment Cell at Baroda.
•All Back-Office functions have now been effectively centralised in Bank of Baroda.
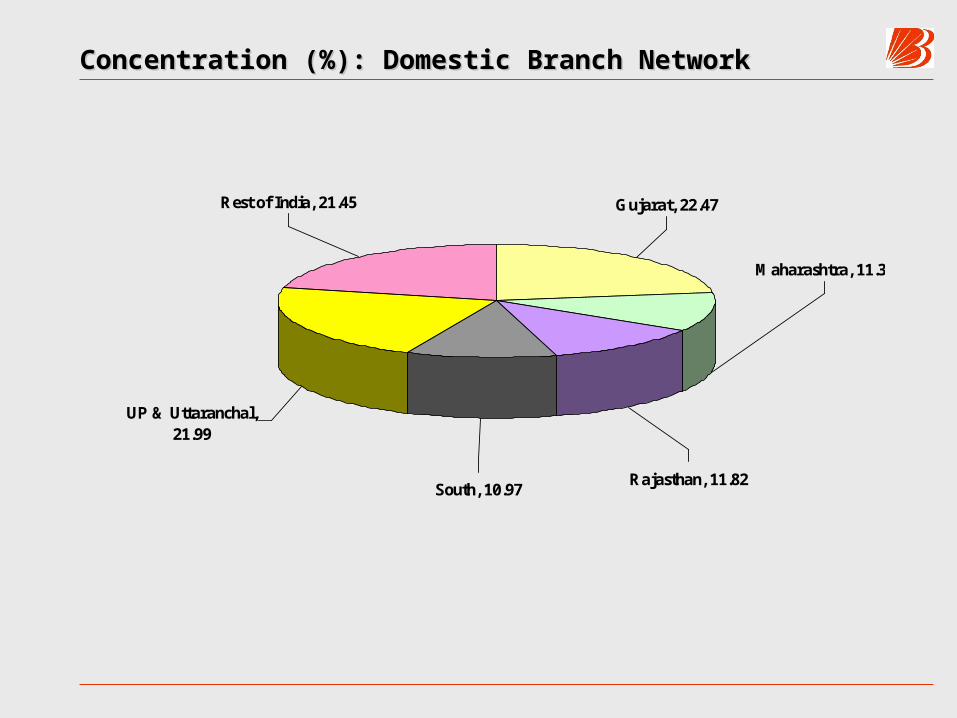
Concentration (%): Domestic Branch NetworkConcentration (%): Domestic Branch Network
Gujarat, 22.47
Maharashtra, 11.30
Rajasthan, 11.82South, 10.97
UP & Uttaranchal, 21.99
Rest of India, 21.45

Pattern of Shareholding: 30Pattern of Shareholding: 30thth June, 2010 June, 2010
FIIs17.8%
Corp. Bodies4.9%
Indian Public5.9%
Others0.2%
Mutual Funds8.9%
Insurance Cos8.5%
Govt. of India53.8%
• BOB is a Part of the following Indexes
BSE 100, BSE 200 and BSE 500
Nifty Junior and Bankex.
• BOB’s Share is listed on BSE and NSE in ‘Future and Options’ segment also.
As on 30th June, 2010
•Share Capital Rs 365.53 crore
•No. of Shares 364.27 million
• Net worth Rs 14,646.26 crore
• B. V. per share Rs 402.08
•Return on Equity (annualised): 23.46%

Comparative Performance of BoB Stock: Jun’09 to Jun’10
Index/StockValue(30th
Jun’09)
Value(30th
Jun’10)% Change
Sensex 14,493.84 17,700.90 22.1%
Nifty 4,219.10 5,312.50 25.9%
Bankex 8,211.48 10,765.03 31.1%
BankNifty 7,338.85 9,464.60 29.0%
BoB-BSEBoB-BSE 445.30445.30 701.95701.95 57.6%57.6%
BoB-NSEBoB-NSE 445.45445.45 701.85701.85 57.6%57.6%

Indian Macro Scene during Jun’09 to Jun’10
IIP Growth (%)
11.5
16.5
13.9
15.1
8.3
7.2
10.6
9.3
10.2
12
17.7
16.3
02468
101214161820
WPI (%)
10.55
-1.01
-0.67-0.17
0.46
1.46
5.55
7.318.56
9.89
9.90
10.1611.23
-2
0
2
4
6
8
10
12
Jun
'09
Au
g'09
Oct
'09
Dec
'09
Feb
'10
Ap
r'10
Jun
'10
15.115.8
14.112.6
9.5 10.0
12.214.8
15.116.7
17.618.1
21.7
0.0
5.0
10.0
15.0
20.0
25.0
Jun'09 Aug'09 Oct'09 Dec'09 Feb'10 Apr'10 Jun'10
Bank Credit Growth (%)
47.9 47.94
48.82
48.1
46.9546.51 46.53 46.1746.08
44.9
44.36
46.3746.46
42
43
44
45
46
47
48
49
Jun'09 Aug'09 Oct'09 Dec'09 Feb'10 Apr'10 Jun'10
Rs/$

Economic Environment & Policy Developments in Q1, FY11•Global economy grew by over 5.0% in Q1, FY11 but has developed some downside risks after that due to sovereign debt concerns in the euro area.
•Good progress of monsoon so far implies better prospects for agriculture growth in FY11; industrial output continues to grow in double-digits despite some moderation in May’10; lead indicators for services activity suggest continuation of strong growth momentum; India’s growth expected around 8.5% in FY11
•Production trends in domestic capital goods and rising imports of foreign capital goods accompanied with improving signs of credit offtake imply strong investment sentiment in Indian economy.
•Information on production trends in consumer durables, auto sales, realty prices and strong growth in corporate earnings indicate a good pick up in private demand
•India’s Fiscal Consolidation Plan is going to benefit from the larger than expected mobilisation from 3G/BWA Spectrum auctions and partial deregulation/upward revision in the prices of petroleum products in June, 2010.
•Imports growth of 40.9% (y-o-y) in Apr-May’10 has been in excess of export growth of 35.7%; trade deficit has widened to $21.71 bln from $14.51 bln a year ago; portfolio flows have moderated from $6.5bln in Q1, FY10 to $3.7 bln in Q1, FY11; Rupee has depreciated by 3.5% against the USD in Q1, FY11.
•Headline inflation (WPI) has been in double digits since Feb’10 & is getting generalised every successive month – A real threat to inclusive growth.
•RBI has continued with the process of normalisation of Monetary Policy despite some pressures on liquidity; short-term interest rates have edged up.

Bank’s Business Growth (Y-O-Y): Jun’06 to Jun’10Business Growth (Y-O-Y): Jun’06 to Jun’10
13.7
19.3
25.2 24.727.0
0.0
5.0
10.0
15.0
20.0
25.0
30.0
Jun'06 Jun'07 Jun'08 Jun'09 Jun'10
Growth: Total Deposits (%)
37.5
27.5
42.1
27.730.7
0.0
5.0
10.0
15.0
20.0
25.0
30.0
35.0
40.0
45.0
Jun'06 Jun'07 Jun'08 Jun'09 Jun'10
Growth: Total Advances (%)
22.021.1
29.4
24.5
29.3
0.0
5.0
10.0
15.0
20.0
25.0
30.0
Jun'06 Jun'07 Jun'08 Jun'09 Jun'10
Growth: Total Business (%)
25.0
11.1
20.3 18.8
27.5
0.0
5.0
10.0
15.0
20.0
25.0
30.0
Jun'06 Jun'07 Jun'08 Jun'09 Jun'10
Domestic CASA Growth (%)
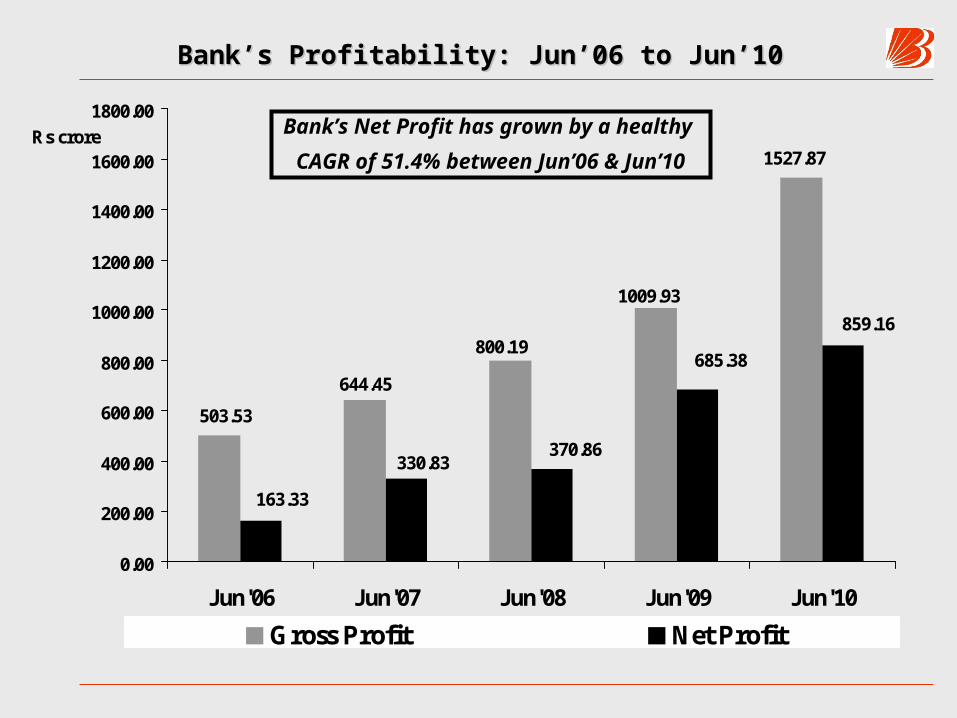
Bank’s Profitability: Jun’06 to Jun’10Bank’s Profitability: Jun’06 to Jun’10
503.53
644.45
800.19
1009.93
1527.87
859.16
685.38
370.86330.83
163.33
0.00
200.00
400.00
600.00
800.00
1000.00
1200.00
1400.00
1600.00
1800.00
Jun'06 Jun'07 Jun'08 Jun'09 Jun'10
Rs crore
Gross Profit Net Profit
Bank’s Net Profit has grown by a healthy
CAGR of 51.4% between Jun’06 & Jun’10
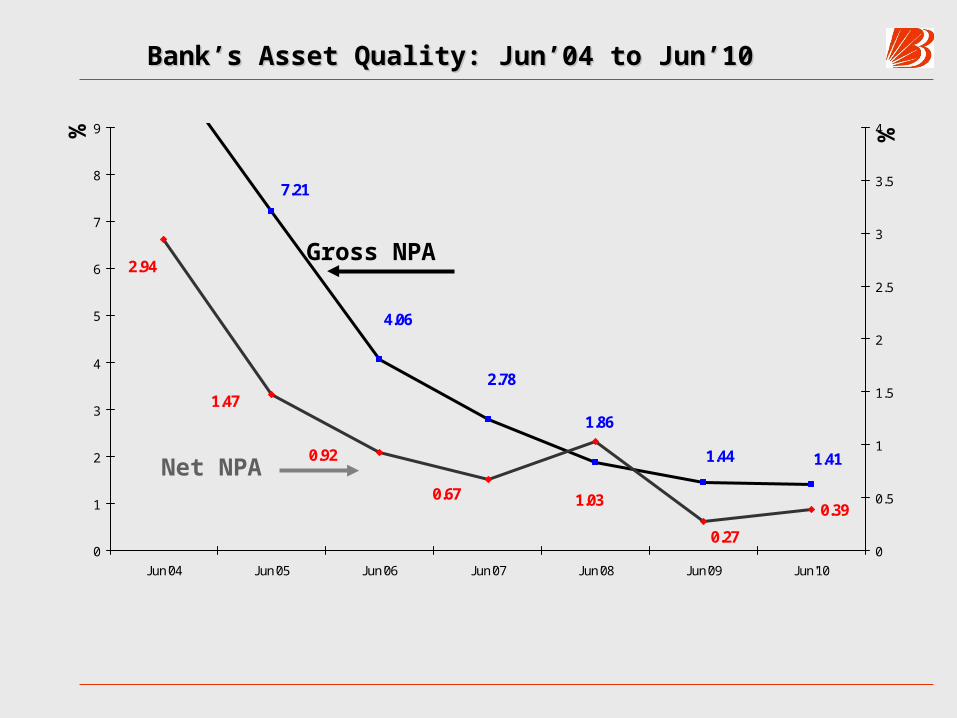
Bank’s Asset Quality: Jun’04 to Jun’10Bank’s Asset Quality: Jun’04 to Jun’10
7.21
4.06
2.78
1.86
1.44 1.41
0.39
2.94
1.47
0.92
0.67 1.03
0.270
1
2
3
4
5
6
7
8
9
Jun'04 Jun'05 Jun'06 Jun'07 Jun'08 Jun'09 Jun'10
%
0
0.5
1
1.5
2
2.5
3
3.5
4 %
Gross NPA
Net NPA

Bank’s Business Performance: Jun’09 to Jun’10Bank’s Business Performance: Jun’09 to Jun’10
Particular(Rs crore)
Jun’09 Mar’10 Jun’10Y-O-Y(%)
ChangeOver
March (%)
Global Business 3,40,616 4,16,080 4,40,262 29.3% 5.8%
Domestic Business 2,60,332 3,16,926 3,31,878 27.5% 4.7%
Overseas Business 80,284 99,153 1,08,384 35.0% 9.3%
Global Deposits 1,98,609 2,41,044 2,54,668 28.2% 5.7%
Domestic Deposits 1,54,435 1,85,283 1,96,166 27.0% 5.9%
Overseas Deposits 44,175 55,762 58,502 32.4% 4.9%
Global CASA Deposits
58,483 71,468 74,784 27.8% 4.6%
Domestic CASA 54,197 66,024 69,114 27.5% 4.7%
Overseas CASA 4,286 5,444 5,670 32.3% 4.2%
•Share of Domestic CASA improved from 35.09% in Q1, FY10 to 35.23% in Q1, FY11.
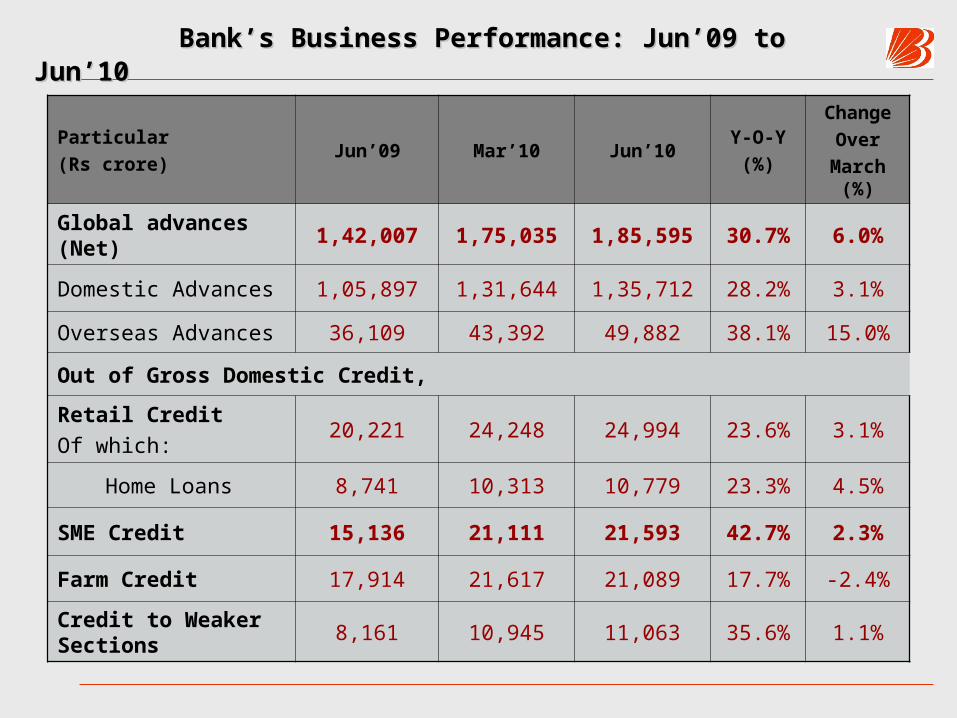
Bank’s Business Performance: Jun’09 to Jun’10Bank’s Business Performance: Jun’09 to Jun’10
Particular(Rs crore)
Jun’09 Mar’10 Jun’10Y-O-Y(%)
ChangeOver
March (%)
Global advances (Net)
1,42,007 1,75,035 1,85,595 30.7% 6.0%
Domestic Advances 1,05,897 1,31,644 1,35,712 28.2% 3.1%
Overseas Advances 36,109 43,392 49,882 38.1% 15.0%
Out of Gross Domestic Credit,
Retail CreditOf which:
20,221 24,248 24,994 23.6% 3.1%
Home Loans 8,741 10,313 10,779 23.3% 4.5%
SME Credit 15,136 21,111 21,593 42.7% 2.3%
Farm Credit 17,914 21,617 21,089 17.7% -2.4%
Credit to Weaker Sections
8,161 10,945 11,063 35.6% 1.1%

Bank’s Business Performance: Jun’09 to Jun’10Bank’s Business Performance: Jun’09 to Jun’10
Particular(Rs crore)
Jun’09 Mar’10 Jun’10Y-O-Y(%)
ChangeOver
March (%)
Global Saving Deposits
44,237 52,544 56,061 26.7% 6.7%
Domestic Savings Deposits
43,103 51,258 54,769 27.1% 6.8%
Overseas Savings Deposits
1,134 1,286 1,292 13.9% 0.5%
Global Current Deposits
14,246 18,924 18,723 31.4% -1.1%
Domestic Current Deposits
11,095 14,766 14,345 29.3% -2.9%
Overseas Current Deposits
3,152 4,158 4,378 38.9% 5.3%
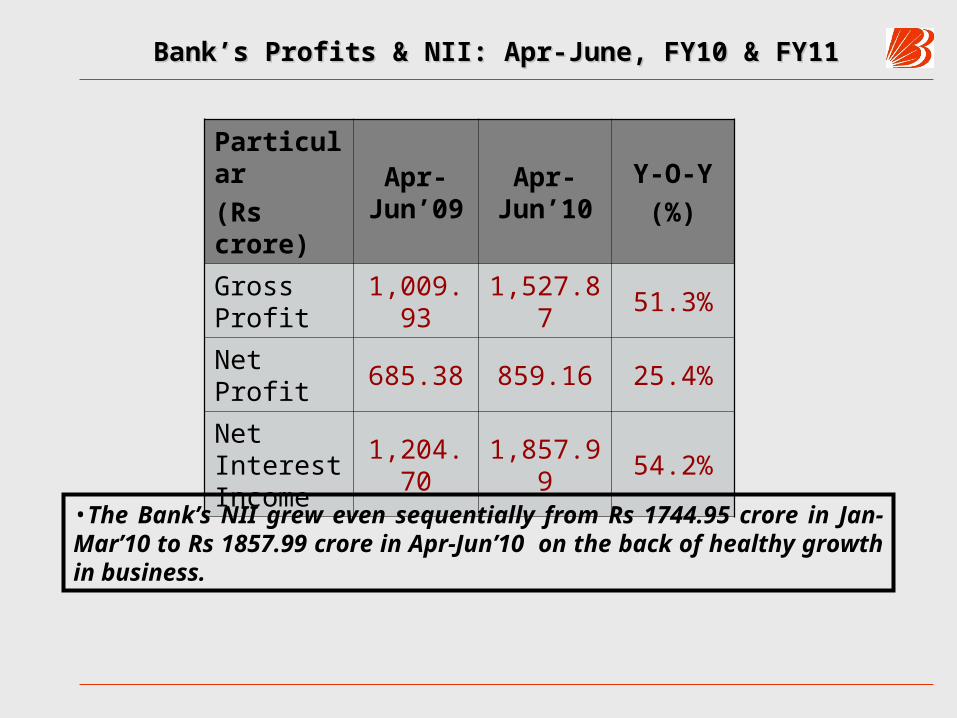
Bank’s Profits & NII: Apr-June, FY10 & FY11Bank’s Profits & NII: Apr-June, FY10 & FY11
Particular(Rs crore)
Apr-Jun’09
Apr-Jun’10
Y-O-Y(%)
Gross Profit
1,009.93
1,527.87
51.3%
Net Profit 685.38 859.16 25.4%
Net Interest Income
1,204.70
1,857.99
54.2%
•The Bank’s NII grew even sequentially from Rs 1744.95 crore in Jan-Mar’10 to Rs 1857.99 crore in Apr-Jun’10 on the back of healthy growth in business.
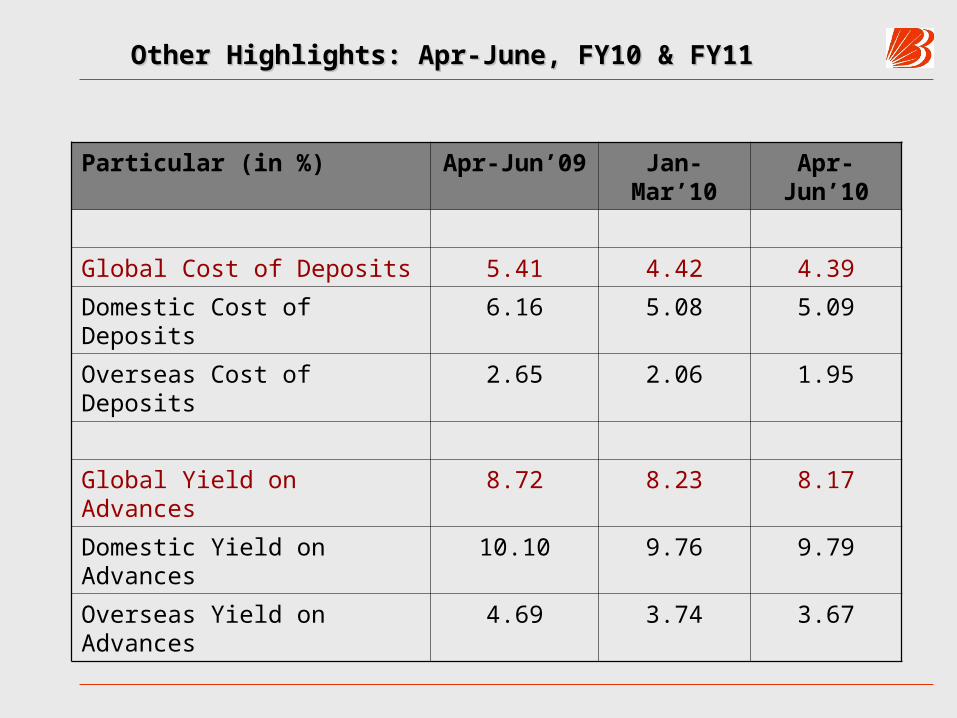
Other Highlights: Apr-June, FY10 & FY11Other Highlights: Apr-June, FY10 & FY11
Particular (in %) Apr-Jun’09 Jan-Mar’10
Apr-Jun’10
Global Cost of Deposits 5.41 4.42 4.39
Domestic Cost of Deposits 6.16 5.08 5.09
Overseas Cost of Deposits 2.65 2.06 1.95
Global Yield on Advances 8.72 8.23 8.17
Domestic Yield on Advances 10.10 9.76 9.79
Overseas Yield on Advances 4.69 3.74 3.67

Other Highlights: Apr-June, FY10 & FY11Other Highlights: Apr-June, FY10 & FY11
Particular (in %) Apr-Jun’09 Jan-Mar’10
Apr-Jun’10
Global Yield on Investment 6.83 6.51 6.66
Domestic Yield on Investment
7.07 6.72 6.83
Overseas Yield on Investment
3.87 3.68 3.71
Global NIM 2.37 2.97 2.90
Domestic NIM 2.57 3.50 3.43
Overseas NIM 1.48 1.30 1.31
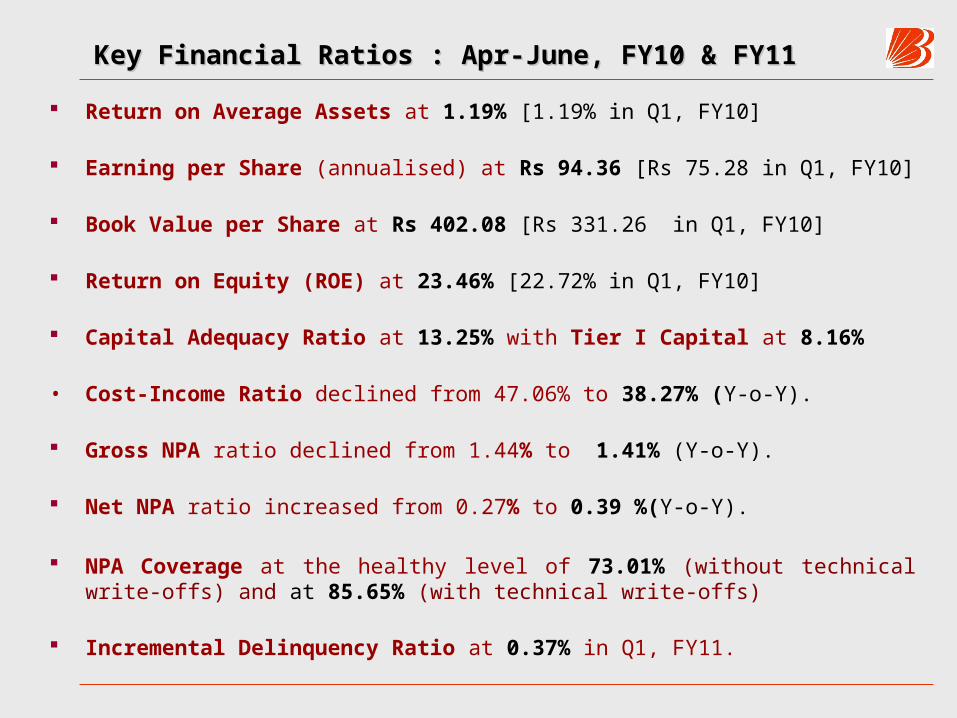
Key Financial Ratios : Apr-June, FY10 & FY11Key Financial Ratios : Apr-June, FY10 & FY11
Return on Average Assets at 1.19% [1.19% in Q1, FY10]
Earning per Share (annualised) at Rs 94.36 [Rs 75.28 in Q1, FY10]
Book Value per Share at Rs 402.08 [Rs 331.26 in Q1, FY10]
Return on Equity (ROE) at 23.46% [22.72% in Q1, FY10]
Capital Adequacy Ratio at 13.25% with Tier I Capital at 8.16%
• Cost-Income Ratio declined from 47.06% to 38.27% (Y-o-Y).
Gross NPA ratio declined from 1.44% to 1.41% (Y-o-Y).
Net NPA ratio increased from 0.27% to 0.39 %(Y-o-Y).
NPA Coverage at the healthy level of 73.01% (without technical write-offs) and at 85.65% (with technical write-offs)
Incremental Delinquency Ratio at 0.37% in Q1, FY11.
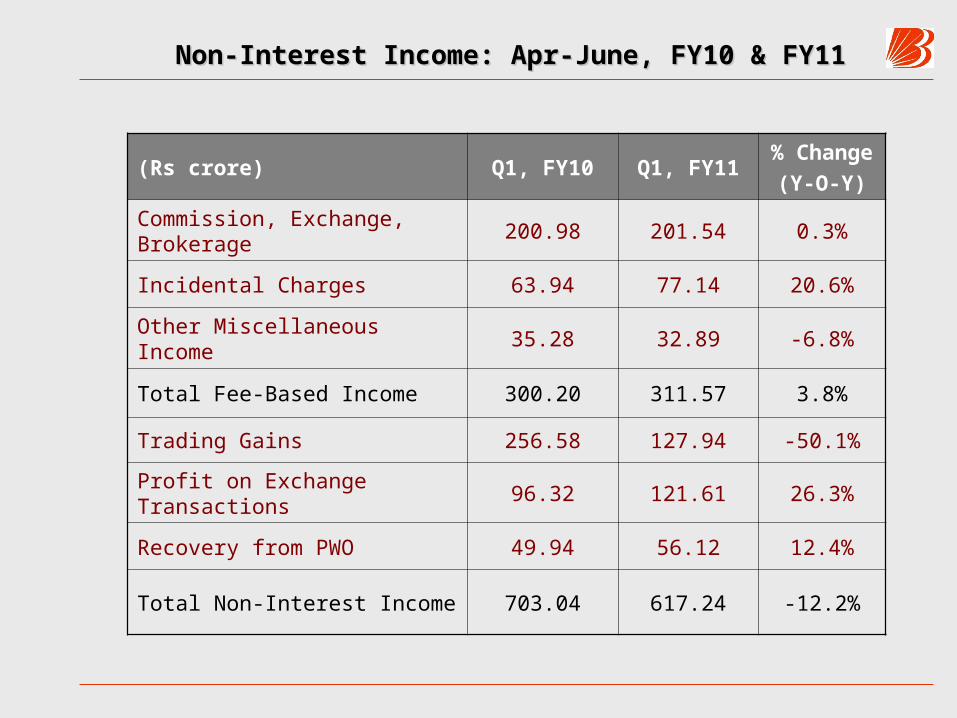
Non-Interest Income: Apr-June, FY10 & FY11Non-Interest Income: Apr-June, FY10 & FY11
(Rs crore) Q1, FY10 Q1, FY11%
Change(Y-O-Y)
Commission, Exchange, Brokerage
200.98 201.54 0.3%
Incidental Charges 63.94 77.14 20.6%
Other Miscellaneous Income 35.28 32.89 -6.8%
Total Fee-Based Income 300.20 311.57 3.8%
Trading Gains 256.58 127.94 -50.1%
Profit on Exchange Transactions
96.32 121.61 26.3%
Recovery from PWO 49.94 56.12 12.4%
Total Non-Interest Income 703.04 617.24 -12.2%
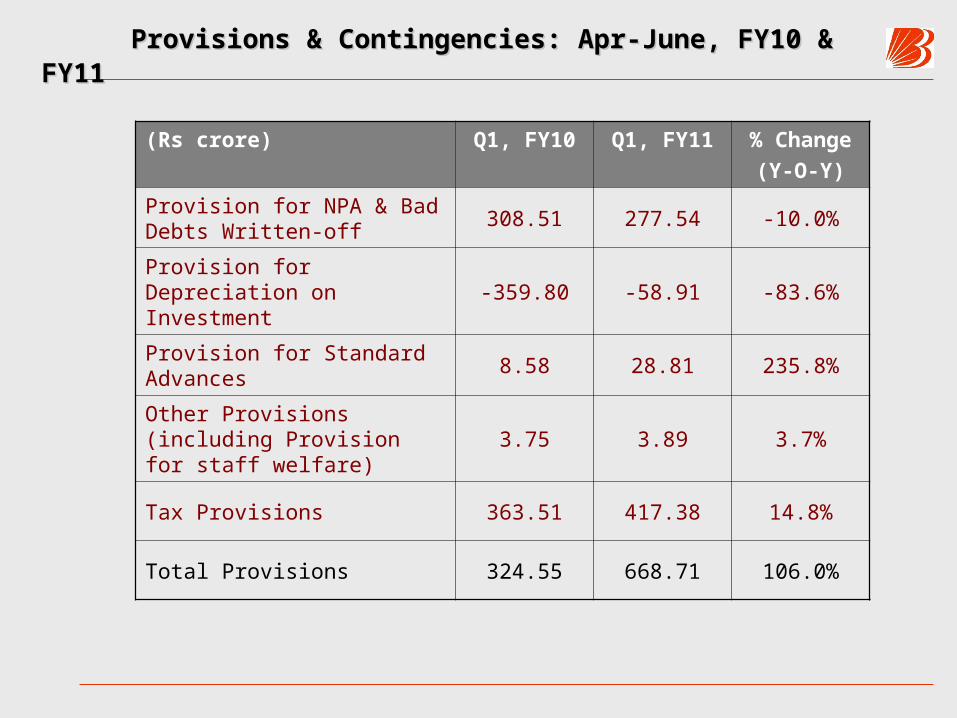
Provisions & Contingencies: Apr-June, FY10 & Provisions & Contingencies: Apr-June, FY10 & FY11FY11
(Rs crore) Q1, FY10 Q1, FY11 % Change(Y-O-Y)
Provision for NPA & Bad Debts Written-off
308.51 277.54 -10.0%
Provision for Depreciation on Investment
-359.80 -58.91 -83.6%
Provision for Standard Advances
8.58 28.81 235.8%
Other Provisions (including Provision for staff welfare)
3.75 3.89 3.7%
Tax Provisions 363.51 417.38 14.8%
Total Provisions 324.55 668.71 106.0%

Bank’s Treasury Highlights: Q1, FY11Bank’s Treasury Highlights: Q1, FY11
• Treasury Income stood at the healthy level of Rs 249.55 crore in Q1, FY11 despite heightened volatility in the G-sec market.
• The Bank’s Trading Gains Stood at Rs 127.94 crore; of which Rs 57 crore came from the domestic equity portfolio.
• As of June 30, 2010, the share of SLR Securities in Total Investment was 87.21%.
• The Bank had 79.66% of SLR Securities in HTM and 19.89% in AFS at end-June 2010.
• The per cent of SLR to NDTL as on 30th June, 2010 was 27.33%.
• While the modified duration of AFS investments is 2.21 years; that of HTM securities is 5.12 years.
• Total size of Bank’s Domestic Investment Book as on 30th June, 2010 stood at Rs 62,963 crore.
• Total size of Bank’s Overseas Investment Book as on 30th June, 2010 stood at Rs 3,676 crore.

Overseas Business: Apr-June, FY11Overseas Business: Apr-June, FY11
• In Q1, FY11, the “Overseas Business” contributed 24.6% to the Bank’s Total Business, 16.4% to its Gross Profit and 26.7% to its Fee-based income.
• While the Cost-Income Ratio for Domestic Operations stood at 41.03% in Q1, FY11, it was just 19.06% for the Bank’s Overseas Operations.
• While the Gross NPA (%) in Domestic Operations stood at 1.73% at end-June, 2010, that for Overseas Operations was just 0.547%.
• “Gross Profit to Avg. Working Funds” ratio for Overseas Operations was 1.40% in Q1, FY11 versus 2.38% for Domestic Operations.
• The ROAA of overseas operations was 0.95% and the ROE was 17.55% in Q1, FY11, reflecting continuation of weaknesses in global economy.
• During Q1, FY11, the Bank raised US $350 mln for 5.5 years at 4.75% coupon under its MTN programme to finance asset growth in overseas operations.

Capital Adequacy & Capital Raising in Capital Adequacy & Capital Raising in Q1, FY11Q1, FY11
• The Bank’s CRAR as on 30th June, 2009 stood at 13.25%; of which Tier1 was at 8.16% and Tier 2 at 5.09%.
• The size of Bank’s risk-weighted assets as on 30th June, 2010 was Rs 1,76,705 crore.
• The Bank proposes to maintain its CRAR in the band of 13.0% to 13.5% in the coming years (with the Tier 1 between 8.0% and 8.5%).
• The Bank raised Rs 1,000 crore during Q1, FY11 by way of the following issues.
• Subordinated Upper Tier II Bonds (maturing in 2025): Rs 500 crore in May, 2010
• Subordinated Upper Tier II Bonds (maturing in 2025): Rs 500 crore in June, 2010

NPA Movement (Gross): Q1, FY11NPA Movement (Gross): Q1, FY11
Particular ( Rs crore)
A. Opening Balance 2,400.69
B. Additions during Q1, FY11 666.21
Out of which, Fresh Slippages 639.21
C. Reduction during Q1, FY11
Recovery 143.32
Upgradation 109.56
PWO & WO 156.60
Exchange Difference --
NPA as on 30th June, 2010 2,657.42
Recovery in PWO in Q1, FY11 56.12

Sector-wise Gross NPAs: Q1, FY10 & FY11Sector-wise Gross NPAs: Q1, FY10 & FY11
Sector Gross NPA (%)
Q1, FY10
Gross NPA (%)
Q1, FY11
Agriculture 2.15% 3.43%
Large & Medium Industries
1.05% 1.69%
Retail 2.65% 2.41%
Housing 2.99% 2.41%
SME 2.47% 2.91%
Cumulative Position of Restructured AssetsCumulative Position of Restructured Assets
• During 27 months (1 Apr’08 to 30 June’10), the Bank has restructured 63,454 accounts amounting Rs 5,283.41 crore.
• Within this, the loans worth Rs 169.79 were restructured in Q1, FY11.
• For the period of 27 months, out of the total amount restructured, Rs 2,796.09 crore belonged to wholesale banking, Rs 1,296.52 crore to SMEs, Rs 560.10 crore to retail and Rs 630.70 crore to agriculture sector.
• About 39 accounts (of Rs 1 crore & above) restructured on/after 1st Apr, 2008 with aggregate outstanding of Rs 475.77 crore became NPA after restructuring and most of them belonged to the SME segment.
• Industry-wise break-up shows that the Bank’s restructured accounts are well spread over different sectors, the major ones being iron & steel, cotton textiles, engineering goods, real estate, food processing and infrastructure.
• The Bank has primarily helped genuine borrowers who suffered from temporary cash flow problems due to the global crisis. These accounts are restructured looking into the internal strength & the financial viability of such borrowers.
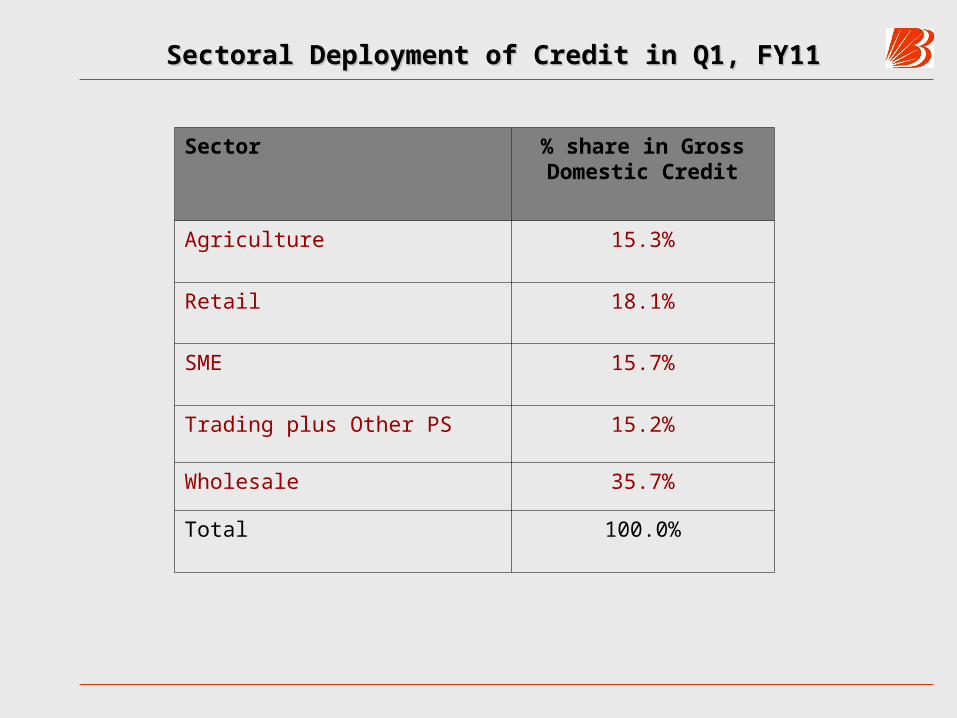
Sectoral Deployment of Credit in Q1, FY11Sectoral Deployment of Credit in Q1, FY11
Sector % share in Gross Domestic Credit
Agriculture 15.3%
Retail 18.1%
SME 15.7%
Trading plus Other PS 15.2%
Wholesale 35.7%
Total 100.0%
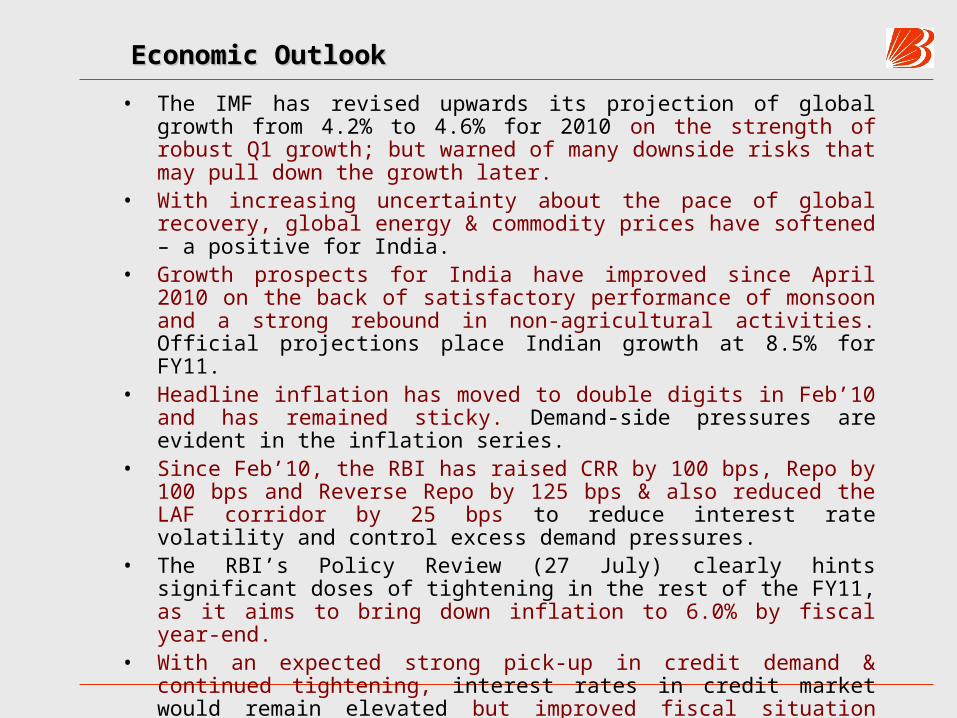
Economic OutlookEconomic Outlook • The IMF has revised upwards its projection of global growth from
4.2% to 4.6% for 2010 on the strength of robust Q1 growth; but warned of many downside risks that may pull down the growth later.
• With increasing uncertainty about the pace of global recovery, global energy & commodity prices have softened – a positive for India.
• Growth prospects for India have improved since April 2010 on the back of satisfactory performance of monsoon and a strong rebound in non-agricultural activities. Official projections place Indian growth at 8.5% for FY11.
• Headline inflation has moved to double digits in Feb’10 and has remained sticky. Demand-side pressures are evident in the inflation series.
• Since Feb’10, the RBI has raised CRR by 100 bps, Repo by 100 bps and Reverse Repo by 125 bps & also reduced the LAF corridor by 25 bps to reduce interest rate volatility and control excess demand pressures.
• The RBI’s Policy Review (27 July) clearly hints significant doses of tightening in the rest of the FY11, as it aims to bring down inflation to 6.0% by fiscal year-end.
• With an expected strong pick-up in credit demand & continued tightening, interest rates in credit market would remain elevated but improved fiscal situation would help lower the pressure on bond yields.
• Rupee has developed a “depreciation bias” due to a faster widening of current account deficit and intermittent risk aversion amongst global investors.

Bank’s Guidance & VisionBank’s Guidance & Vision
•The Bank would continue with its thrust on sustainable & qualitative growth --
•Would maintain its growth above the industry average to steadily expand the market share. From Jun’09 to Jun’10, the Bank’s market share in Deposits has gone up from 3.68% to 3.98% and in Advances from 3.72% to 3.93%.
•The Bank would grow its deposits in the band of 20% to 22.0%; credit in the range of 22.0% to 24.0%, fee-based income in line with the loan-book and overall profitability by 25.0%, factoring in various downside risks stemming from the economic environment.
•The Bank is building Strong Foundation for Future Growth by
•Recruiting the best possible talent in the country from the Premier Institutions
•Working on BPR project in consultation with Mckinsey & Co. so as to achieve the optimum use of technology and right skilling of the manpower to yield maximum customer satisfaction.
•Aggressively launching a series of marketing campaigns to promote its Brand value, such as the well-publicised Baroda Next Reinforcement Campaign – II.

Thank you.