bank performance analysis - resources.gabankers.comresources.gabankers.com/event agenda...
TRANSCRIPT
Bank Performance Analysis
The Business of Banking
© 2015 American Bankers Association
Objectives
Explain the ratios used in analyzing the performance of a commercial bank
Calculate the various performance ratios to evaluate the performance of a commercial bank
Recognize the historical experience of the commercial banking industry
Explain the various driver ratios used to explain bank management strategies
© 2015 American Bankers Association
Analyzing Performance
System that decomposes changes in ROA/ROE
Identifies drivers of profitability performance
Illustrates connection between drivers and final performance results
Useful at all levels of performance analysis
– Industry
– Bank
– Line of business
© 2015 American Bankers Association
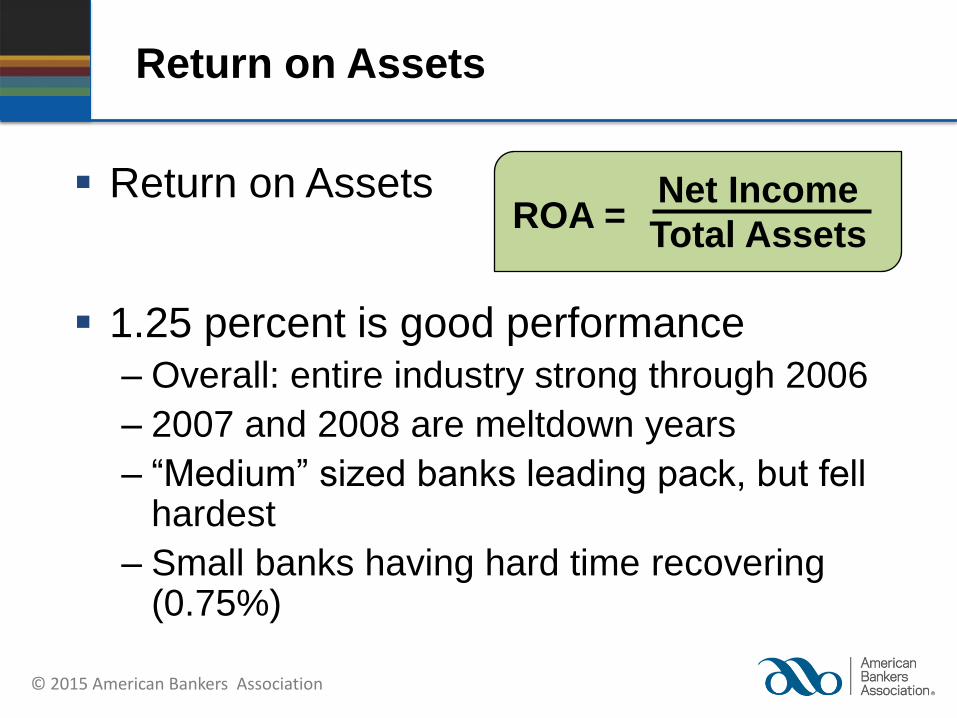
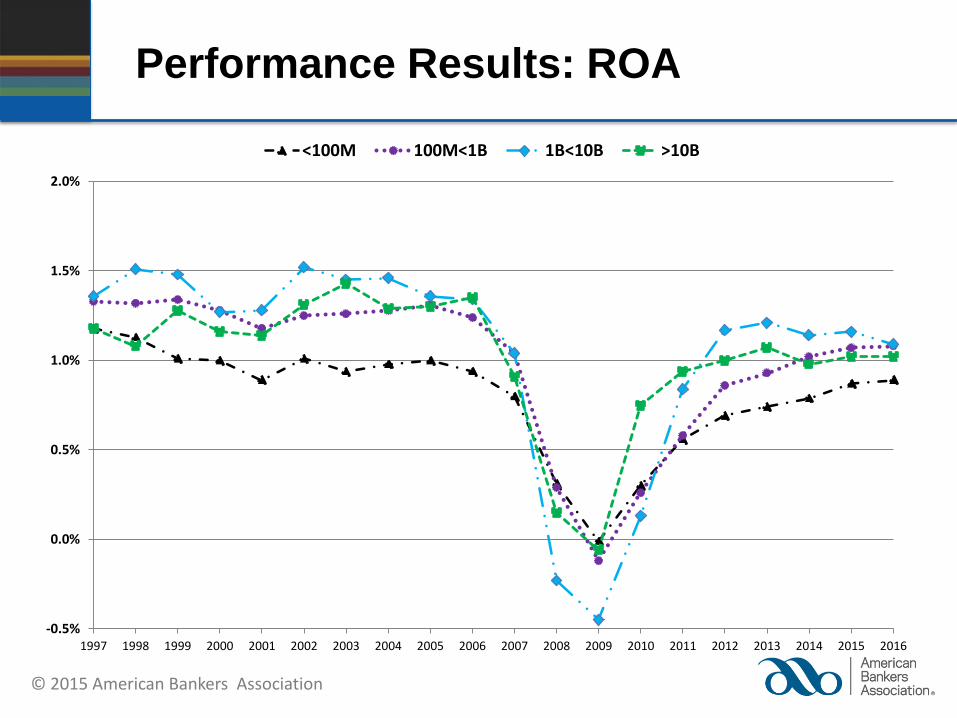
Return on Assets
Return on Assets
1.25 percent is good performance
– Overall: entire industry strong through 2006
– 2007 and 2008 are meltdown years
– “Medium” sized banks leading pack, but fell hardest
– Small banks having hard time recovering (0.75%)
ROA = Net Income
Total Assets
© 2015 American Bankers Association
Performance Results: ROA
-0.5%
0.0%
0.5%
1.0%
1.5%
2.0%
1997 1998 1999 2000 2001 2002 2003 2004 2005 2006 2007 2008 2009 2010 2011 2012 2013 2014 2015 2016
<100M 100M<1B 1B<10B >10B
© 2015 American Bankers Association
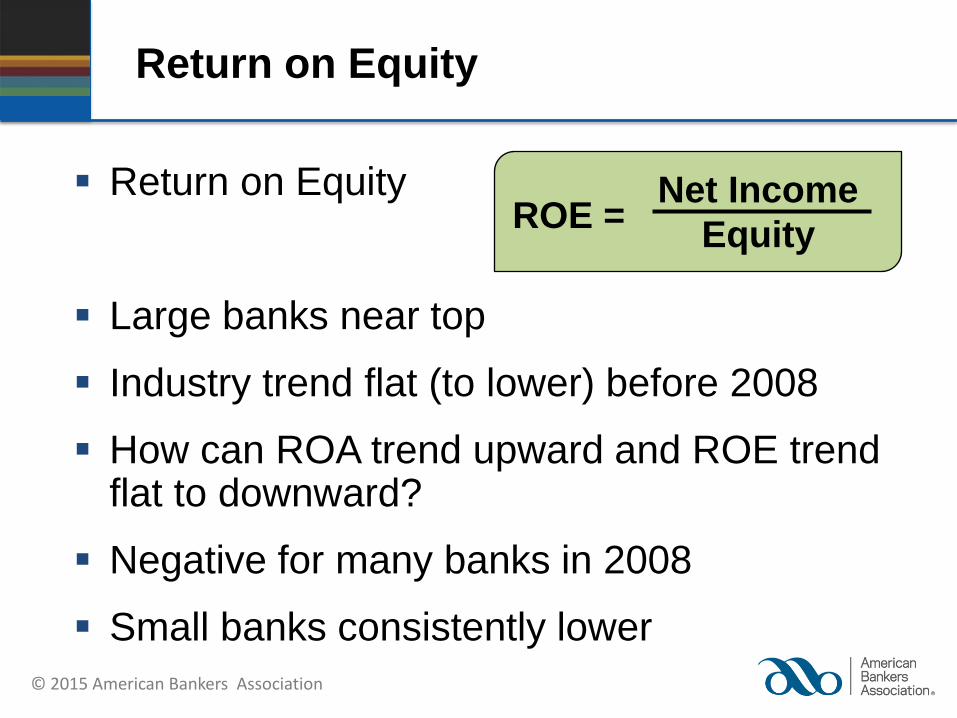
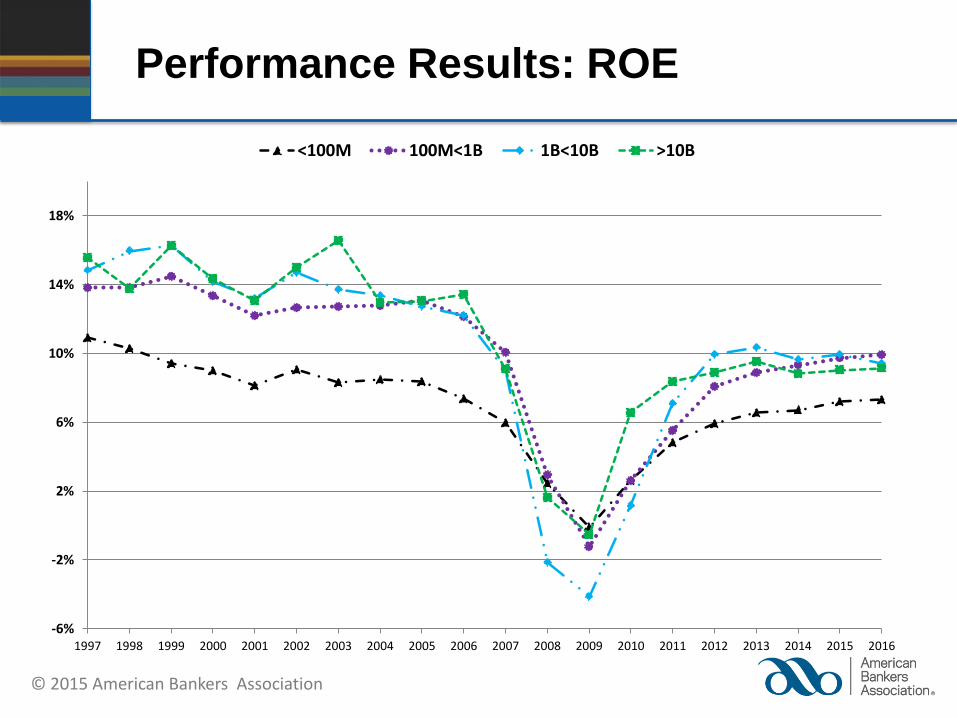
Return on Equity
Return on Equity
Large banks near top
Industry trend flat (to lower) before 2008
How can ROA trend upward and ROE trend flat to downward?
Negative for many banks in 2008
Small banks consistently lower
ROE = Net Income
Equity
© 2015 American Bankers Association
Performance Results: ROE
-6%
-2%
2%
6%
10%
14%
18%
1997 1998 1999 2000 2001 2002 2003 2004 2005 2006 2007 2008 2009 2010 2011 2012 2013 2014 2015 2016
<100M 100M<1B 1B<10B >10B
© 2015 American Bankers Association
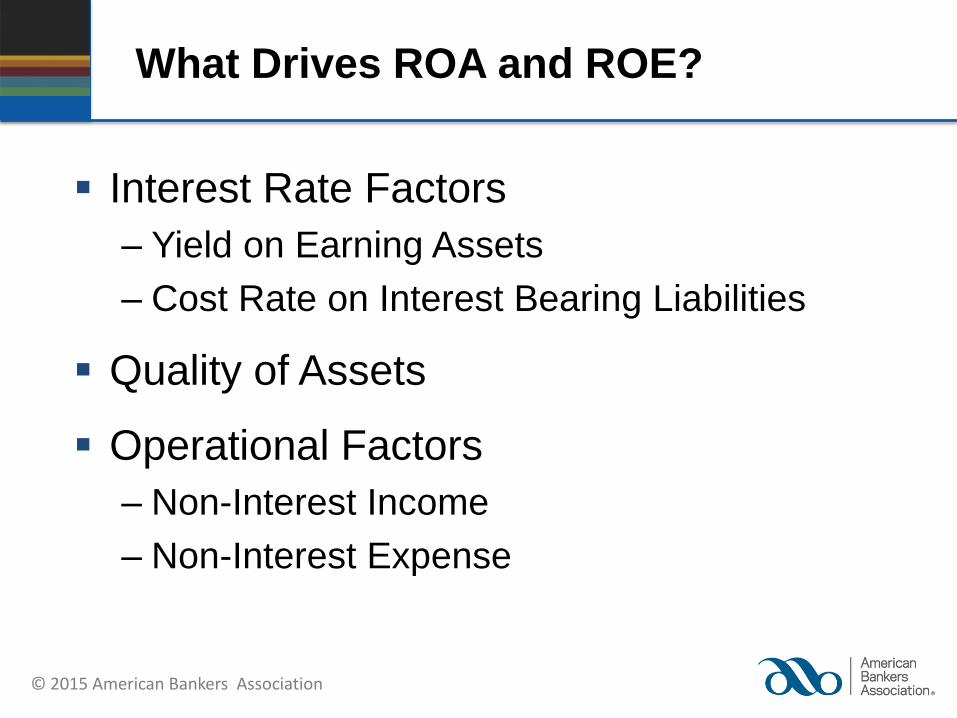
What Drives ROA and ROE?
Interest Rate Factors
– Yield on Earning Assets
– Cost Rate on Interest Bearing Liabilities
Quality of Assets
Operational Factors
– Non-Interest Income
– Non-Interest Expense
© 2015 American Bankers Association
Performance Driver Ratios
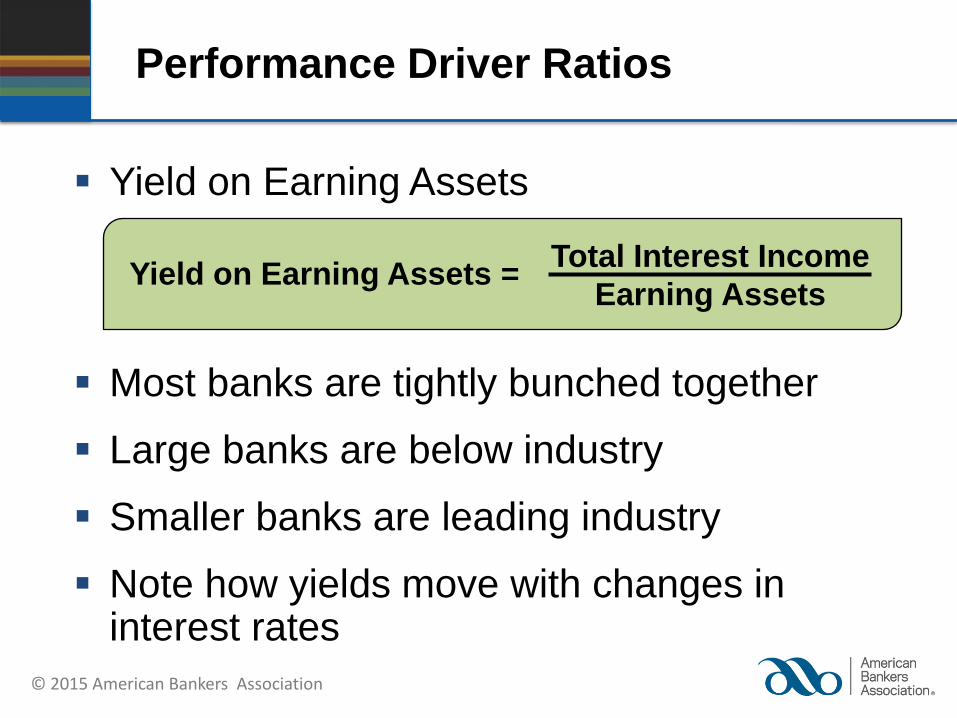
Yield on Earning Assets
Most banks are tightly bunched together
Large banks are below industry
Smaller banks are leading industry
Note how yields move with changes in interest rates
Yield on Earning Assets = Total Interest Income
Earning Assets
© 2015 American Bankers Association
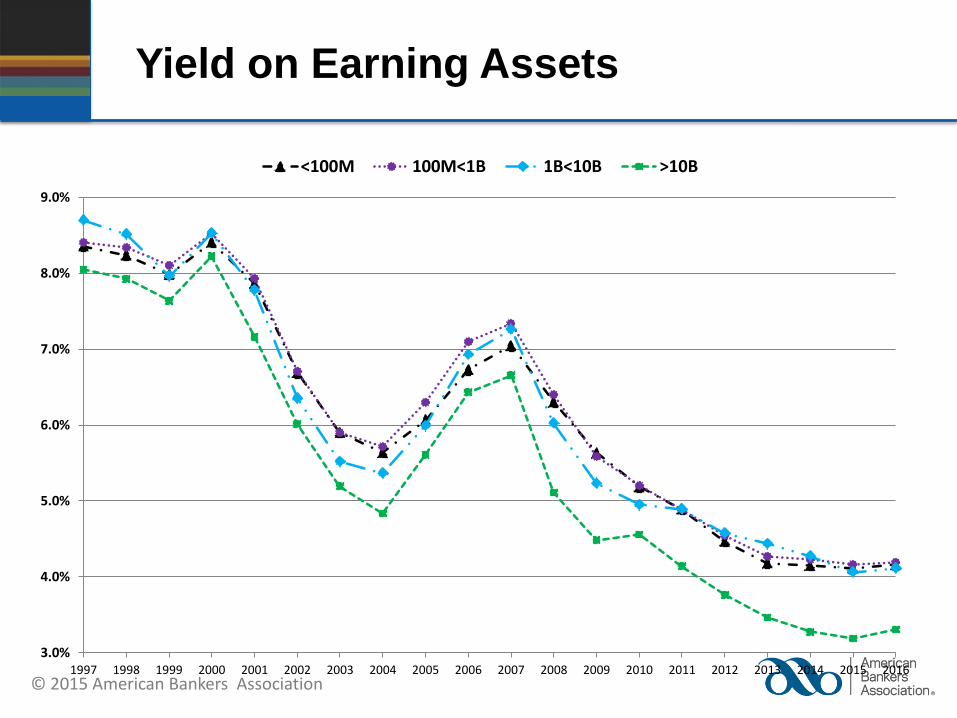
Yield on Earning Assets
3.0%
4.0%
5.0%
6.0%
7.0%
8.0%
9.0%
1997 1998 1999 2000 2001 2002 2003 2004 2005 2006 2007 2008 2009 2010 2011 2012 2013 2014 2015 2016
<100M 100M<1B 1B<10B >10B
© 2015 American Bankers Association
Performance Driver Ratios
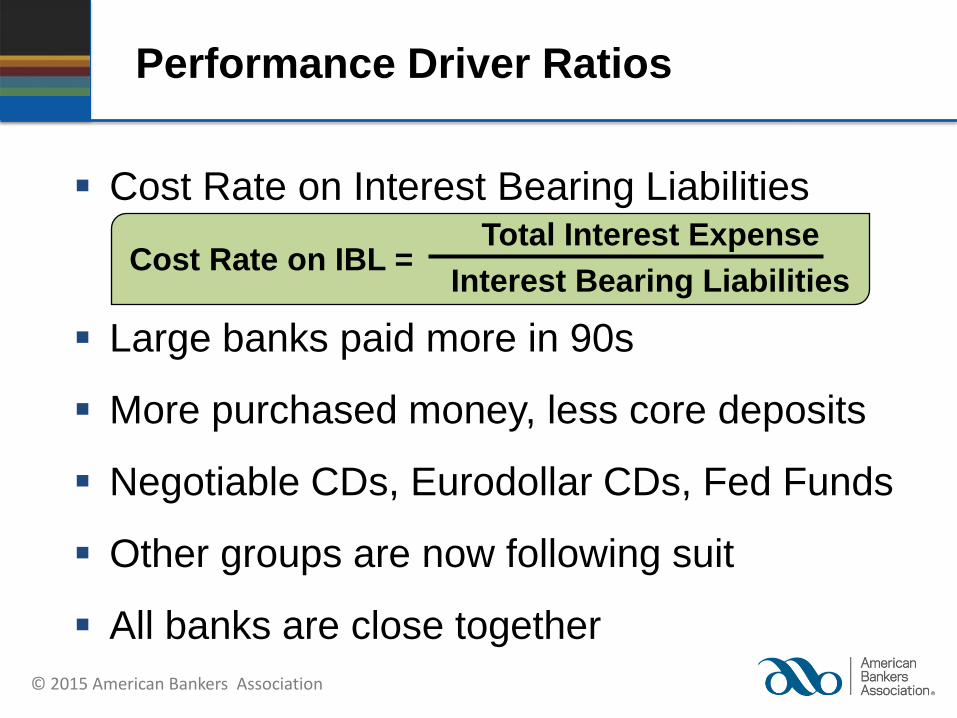
Cost Rate on Interest Bearing Liabilities
Large banks paid more in 90s
More purchased money, less core deposits
Negotiable CDs, Eurodollar CDs, Fed Funds
Other groups are now following suit
All banks are close together
Cost Rate on IBL = Total Interest Expense
Interest Bearing Liabilities
© 2015 American Bankers Association
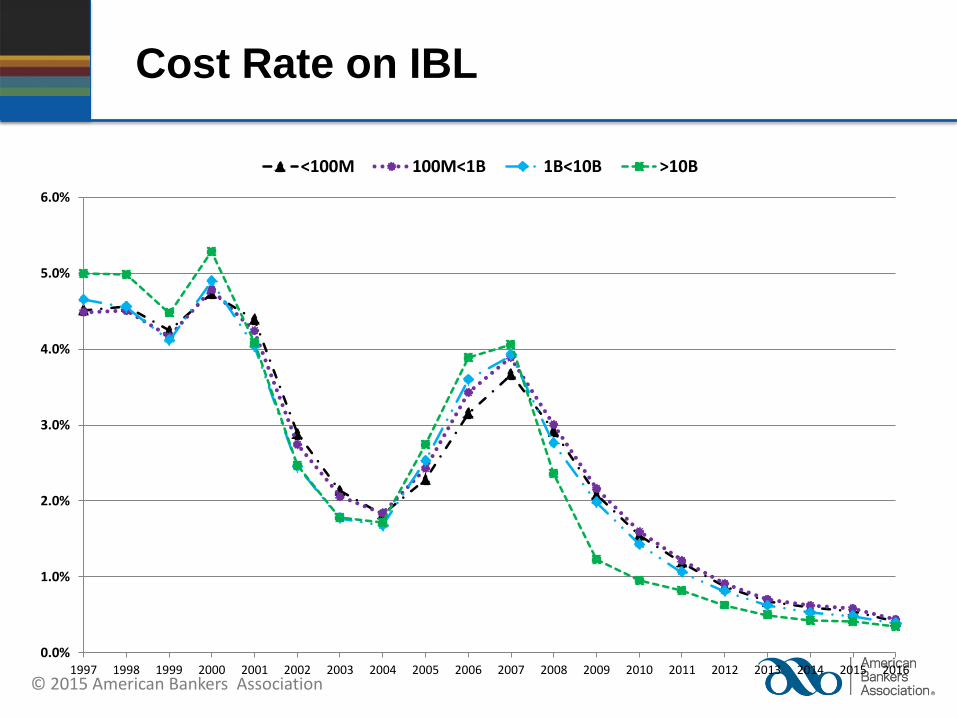
Cost Rate on IBL
0.0%
1.0%
2.0%
3.0%
4.0%
5.0%
6.0%
1997 1998 1999 2000 2001 2002 2003 2004 2005 2006 2007 2008 2009 2010 2011 2012 2013 2014 2015 2016
<100M 100M<1B 1B<10B >10B
© 2015 American Bankers Association
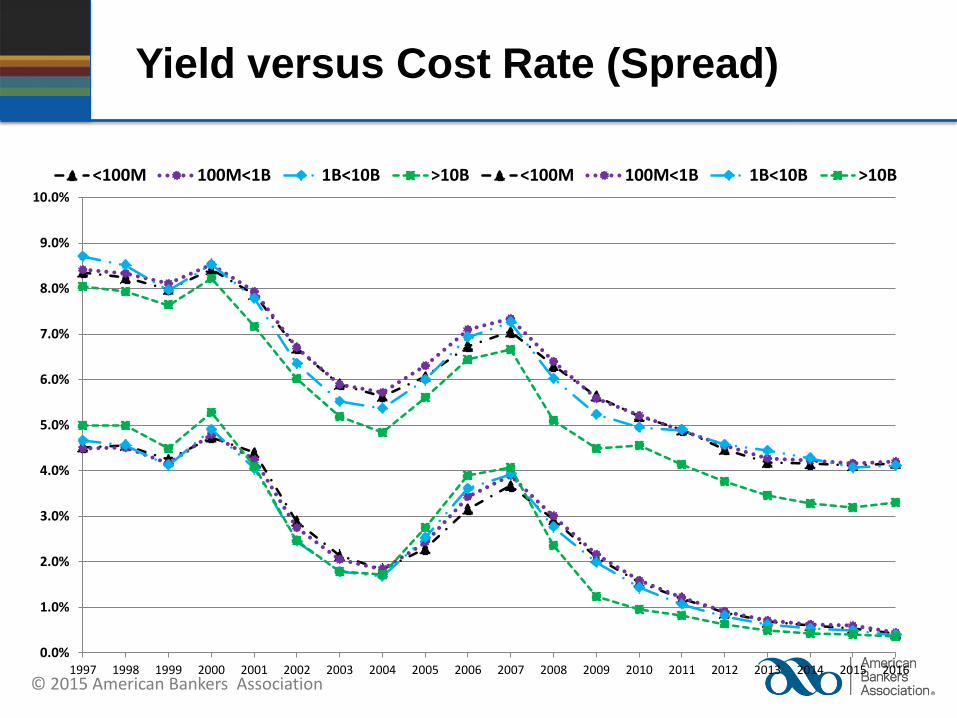
Yield versus Cost Rate (Spread)
0.0%
1.0%
2.0%
3.0%
4.0%
5.0%
6.0%
7.0%
8.0%
9.0%
10.0%
1997 1998 1999 2000 2001 2002 2003 2004 2005 2006 2007 2008 2009 2010 2011 2012 2013 2014 2015 2016
<100M 100M<1B 1B<10B >10B <100M 100M<1B 1B<10B >10B
© 2015 American Bankers Association
Performance Driver Ratios
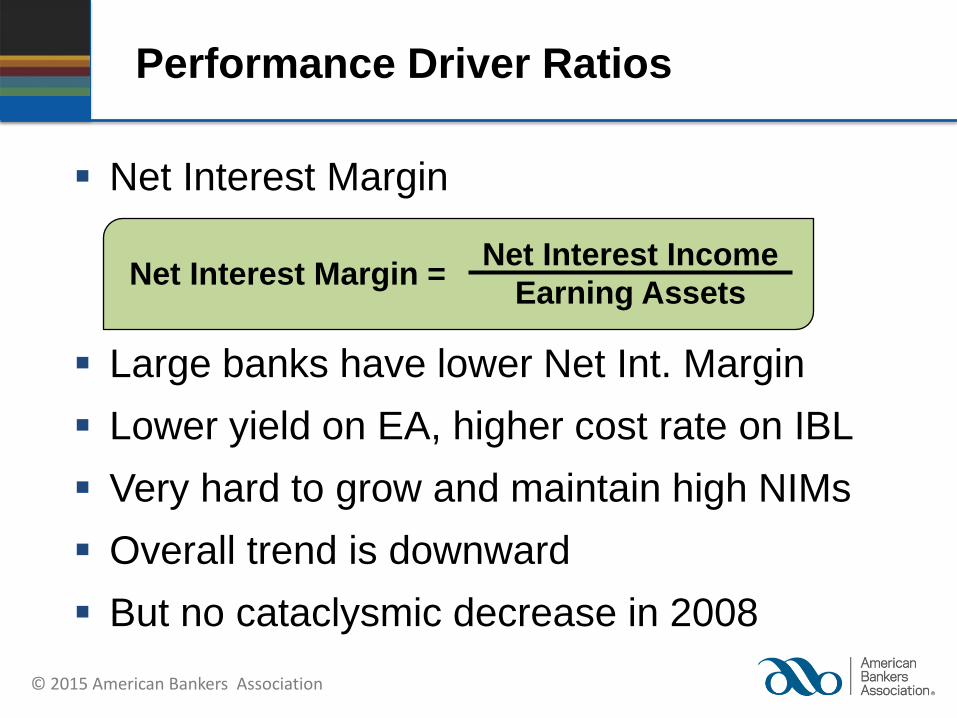
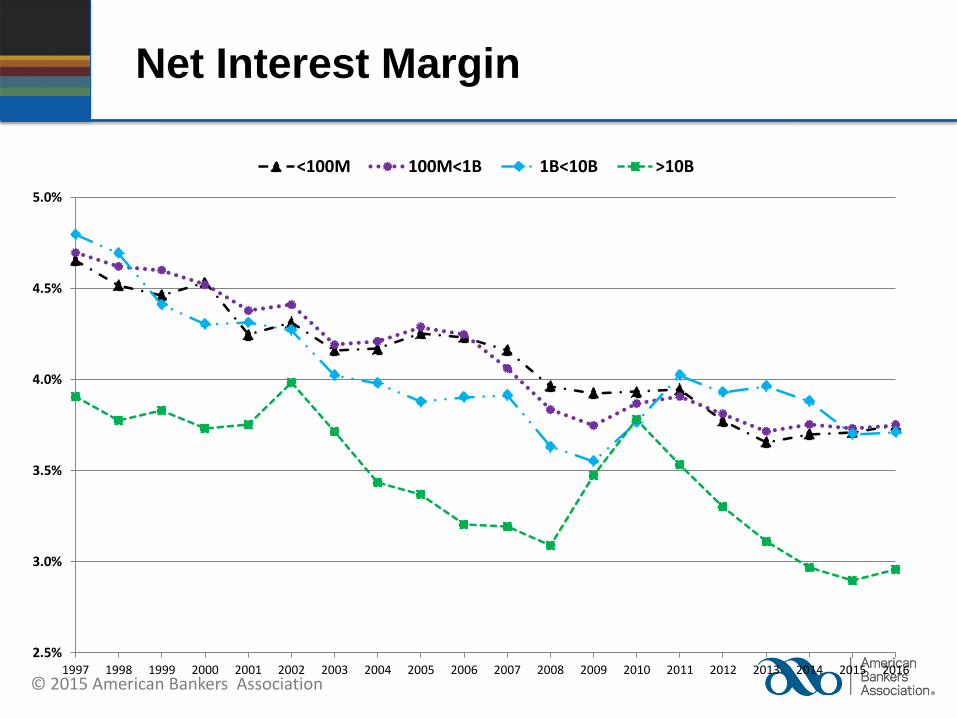
Net Interest Margin
Large banks have lower Net Int. Margin
Lower yield on EA, higher cost rate on IBL
Very hard to grow and maintain high NIMs
Overall trend is downward
But no cataclysmic decrease in 2008
Net Interest Margin = Net Interest Income
Earning Assets
© 2015 American Bankers Association
Net Interest Margin
2.5%
3.0%
3.5%
4.0%
4.5%
5.0%
1997 1998 1999 2000 2001 2002 2003 2004 2005 2006 2007 2008 2009 2010 2011 2012 2013 2014 2015 2016
<100M 100M<1B 1B<10B >10B
© 2015 American Bankers Association
Performance Driver Ratios
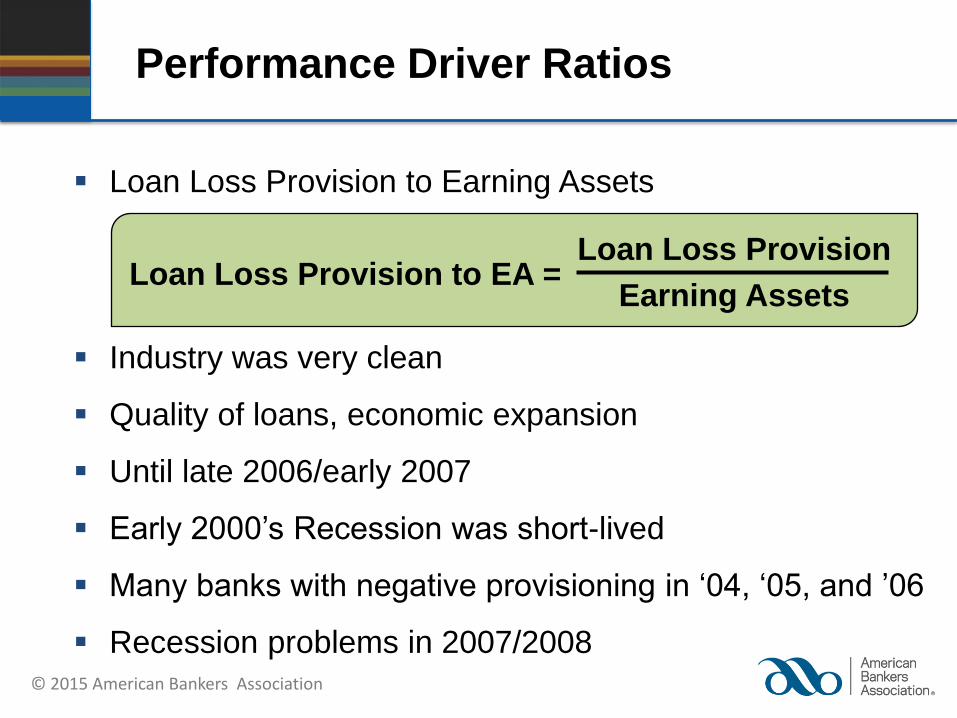
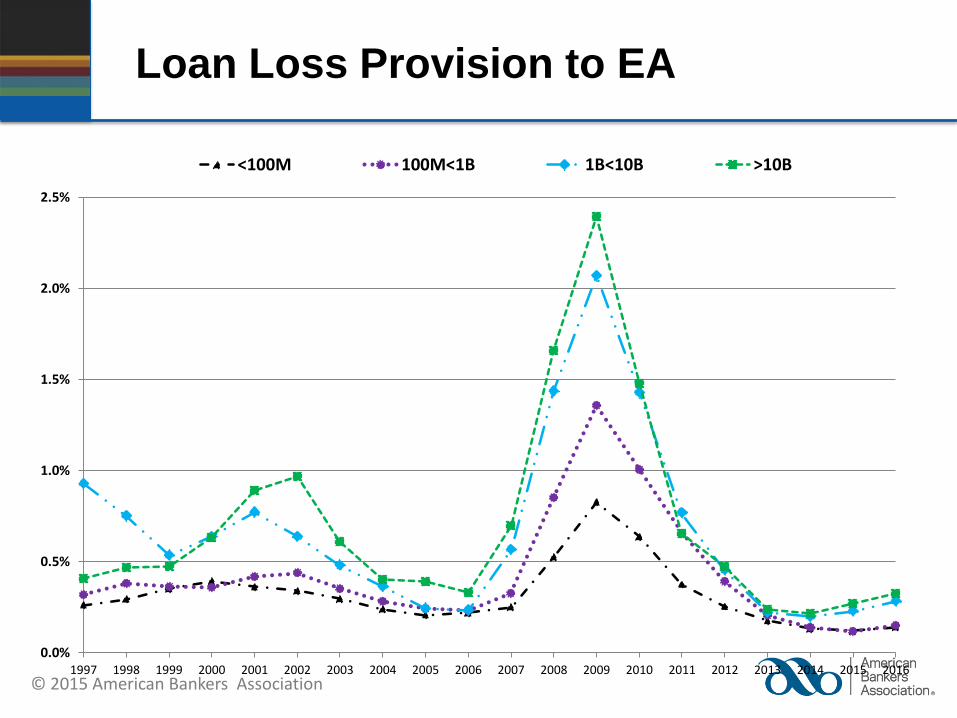
Loan Loss Provision to Earning Assets
Industry was very clean
Quality of loans, economic expansion
Until late 2006/early 2007
Early 2000’s Recession was short-lived
Many banks with negative provisioning in ‘04, ‘05, and ’06
Recession problems in 2007/2008
Loan Loss Provision to EA = Loan Loss Provision
Earning Assets
© 2015 American Bankers Association
Loan Loss Provision to EA
0.0%
0.5%
1.0%
1.5%
2.0%
2.5%
1997 1998 1999 2000 2001 2002 2003 2004 2005 2006 2007 2008 2009 2010 2011 2012 2013 2014 2015 2016
<100M 100M<1B 1B<10B >10B
© 2015 American Bankers Association
Performance Driver Ratios
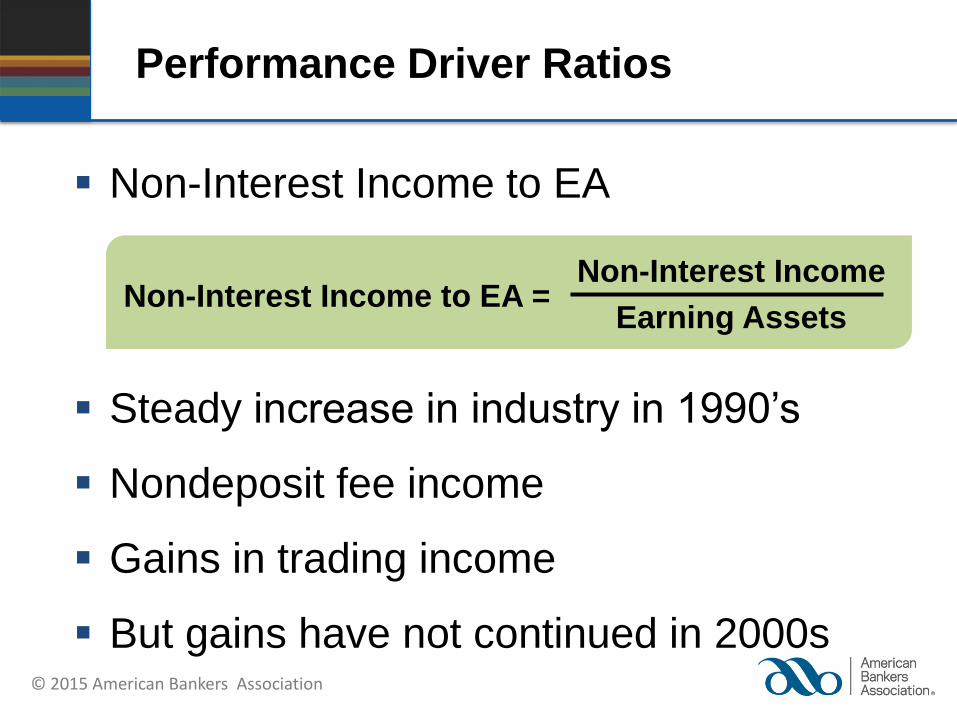
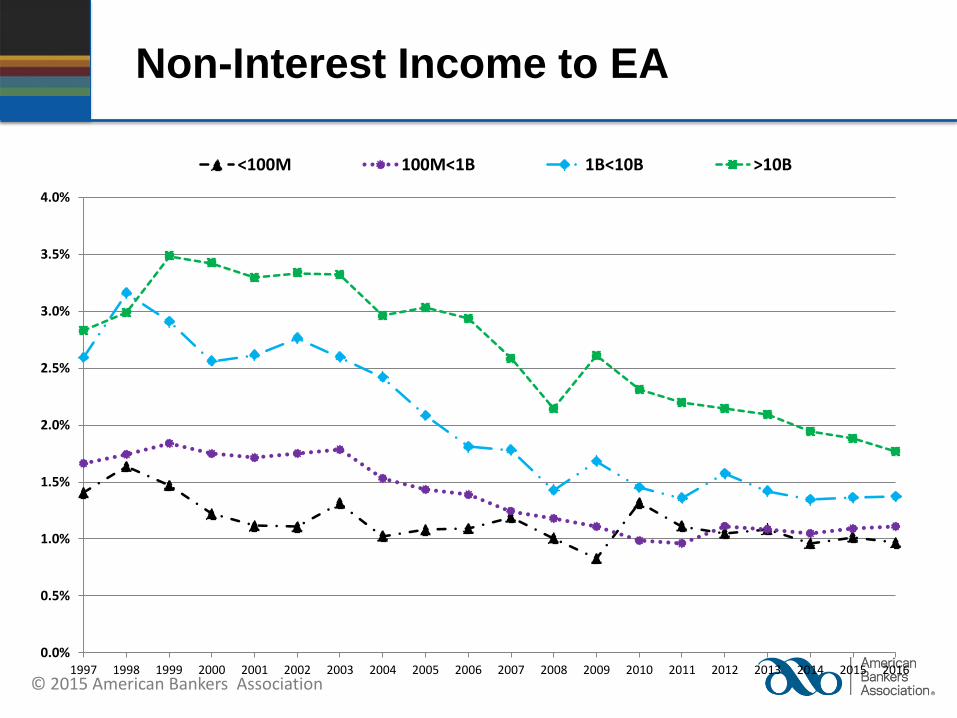
Non-Interest Income to EA
Steady increase in industry in 1990’s
Nondeposit fee income
Gains in trading income
But gains have not continued in 2000s
Non-Interest Income to EA = Non-Interest Income
Earning Assets
© 2015 American Bankers Association
Non-Interest Income to EA
0.0%
0.5%
1.0%
1.5%
2.0%
2.5%
3.0%
3.5%
4.0%
1997 1998 1999 2000 2001 2002 2003 2004 2005 2006 2007 2008 2009 2010 2011 2012 2013 2014 2015 2016
<100M 100M<1B 1B<10B >10B
© 2015 American Bankers Association
Performance Driver Ratios
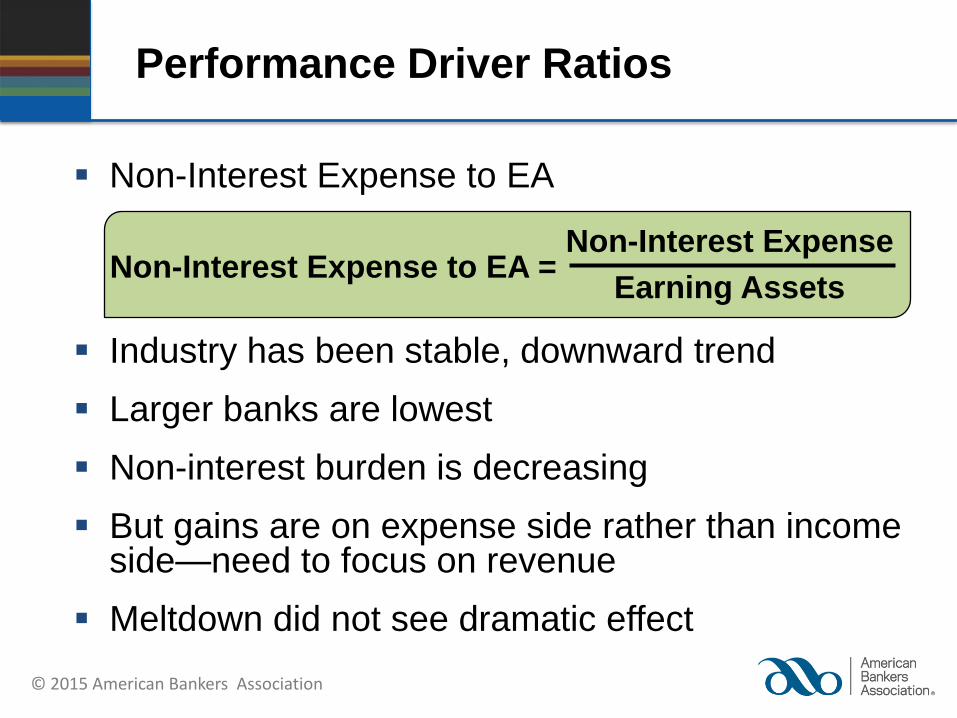
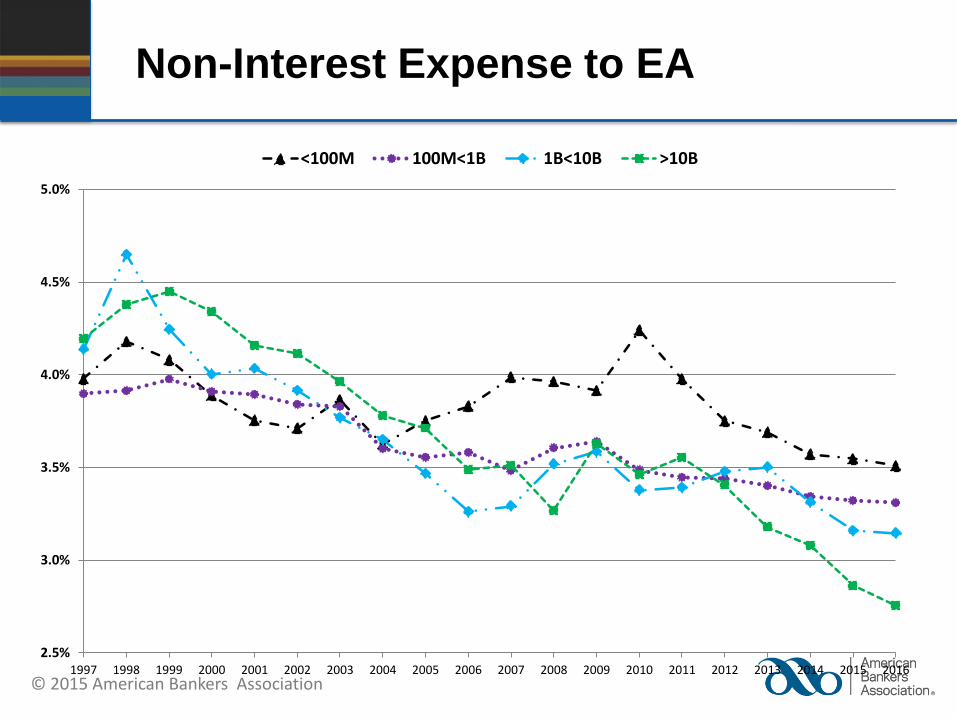
Non-Interest Expense to EA
Industry has been stable, downward trend
Larger banks are lowest
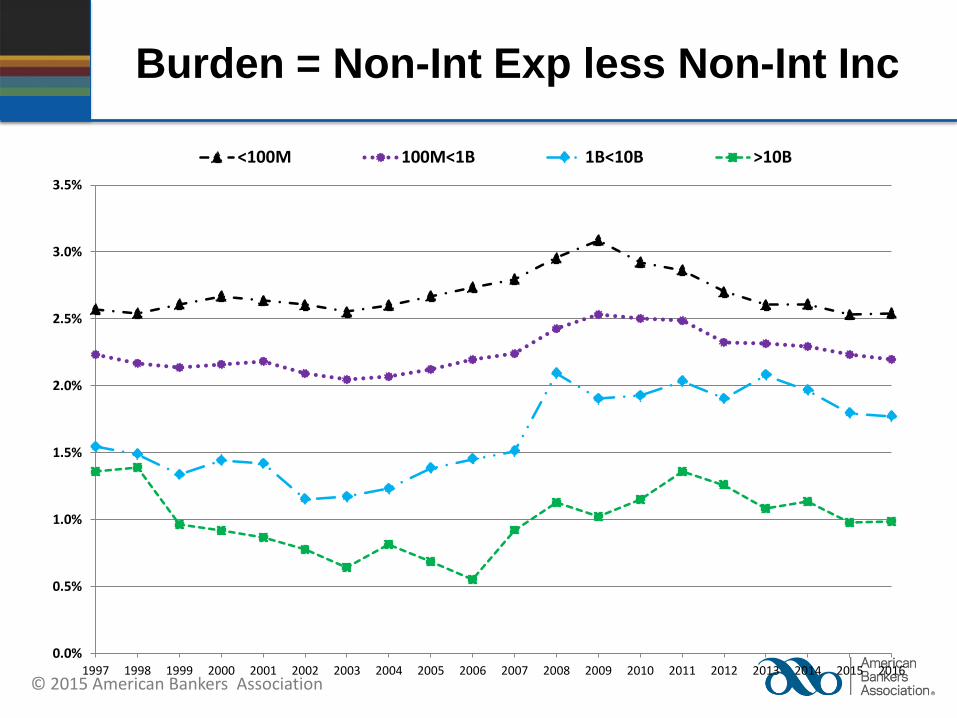
Non-interest burden is decreasing
But gains are on expense side rather than income side—need to focus on revenue
Meltdown did not see dramatic effect
Non-Interest Expense to EA = Non-Interest Expense
Earning Assets
© 2015 American Bankers Association
Non-Interest Expense to EA
2.5%
3.0%
3.5%
4.0%
4.5%
5.0%
1997 1998 1999 2000 2001 2002 2003 2004 2005 2006 2007 2008 2009 2010 2011 2012 2013 2014 2015 2016
<100M 100M<1B 1B<10B >10B
© 2015 American Bankers Association
Burden = Non-Int Exp less Non-Int Inc
0.0%
0.5%
1.0%
1.5%
2.0%
2.5%
3.0%
3.5%
1997 1998 1999 2000 2001 2002 2003 2004 2005 2006 2007 2008 2009 2010 2011 2012 2013 2014 2015 2016
<100M 100M<1B 1B<10B >10B
© 2015 American Bankers Association
Performance Driver Ratios
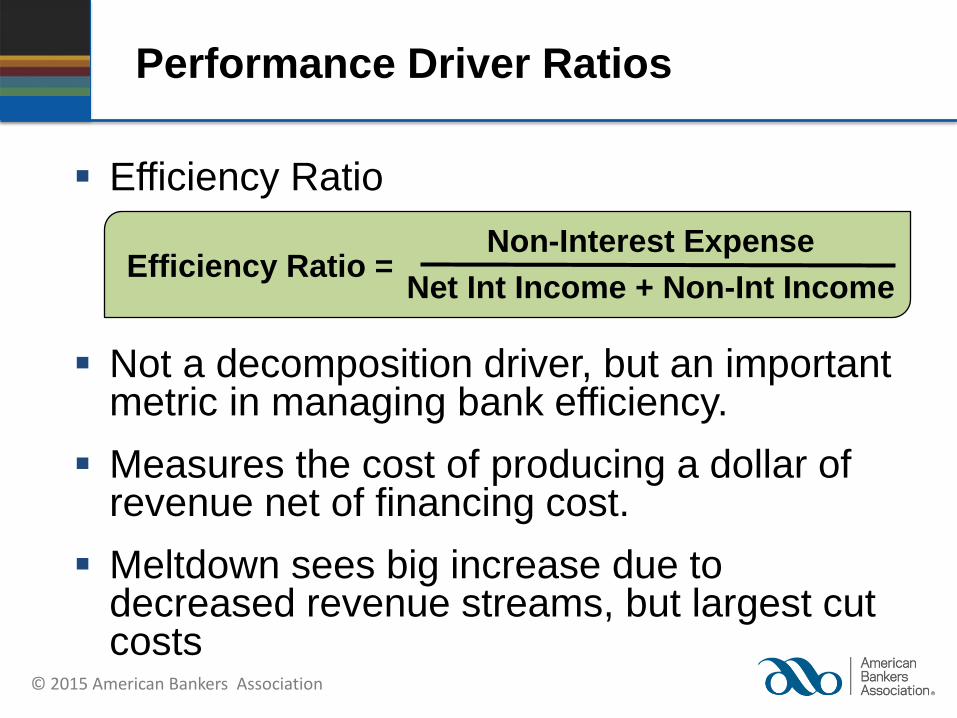
Efficiency Ratio
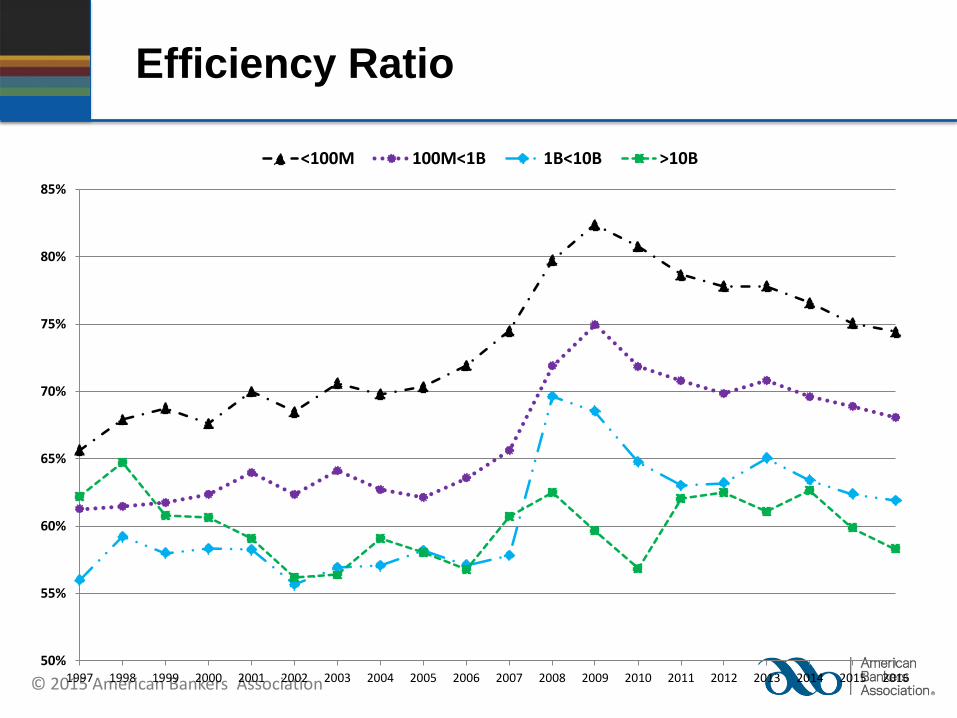
Not a decomposition driver, but an important metric in managing bank efficiency.
Measures the cost of producing a dollar of revenue net of financing cost.
Meltdown sees big increase due to decreased revenue streams, but largest cut costs
Efficiency Ratio = Non-Interest Expense
Net Int Income + Non-Int Income
© 2015 American Bankers Association
Efficiency Ratio
50%
55%
60%
65%
70%
75%
80%
85%
1997 1998 1999 2000 2001 2002 2003 2004 2005 2006 2007 2008 2009 2010 2011 2012 2013 2014 2015 2016
<100M 100M<1B 1B<10B >10B
© 2015 American Bankers Association
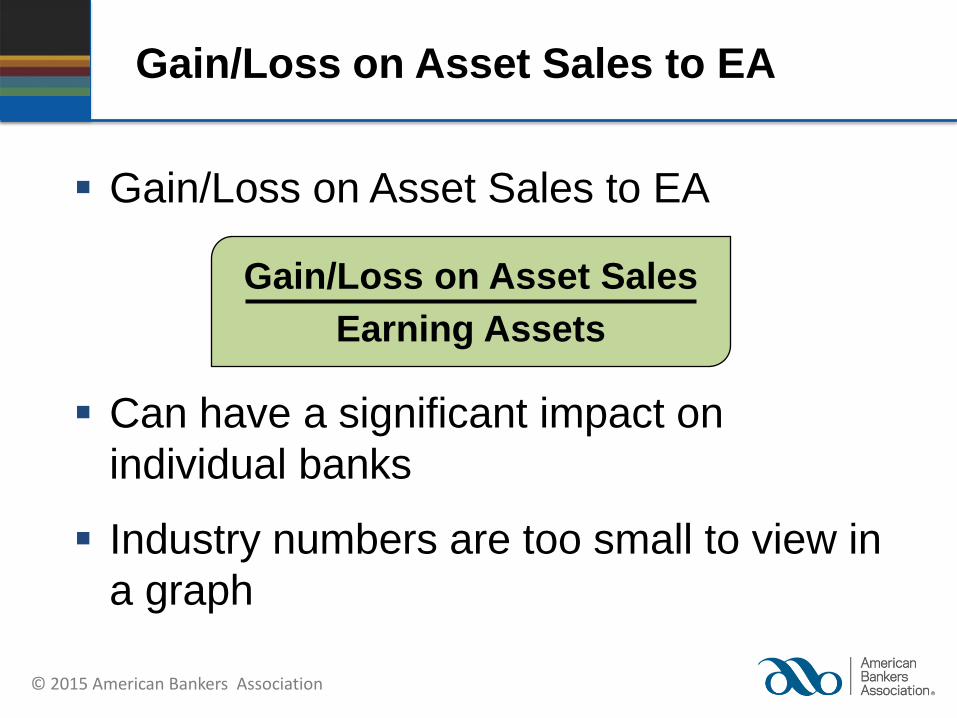
Gain/Loss on Asset Sales to EA
Gain/Loss on Asset Sales to EA
Can have a significant impact on
individual banks
Industry numbers are too small to view in
a graph
Gain/Loss on Asset Sales
Earning Assets
© 2015 American Bankers Association
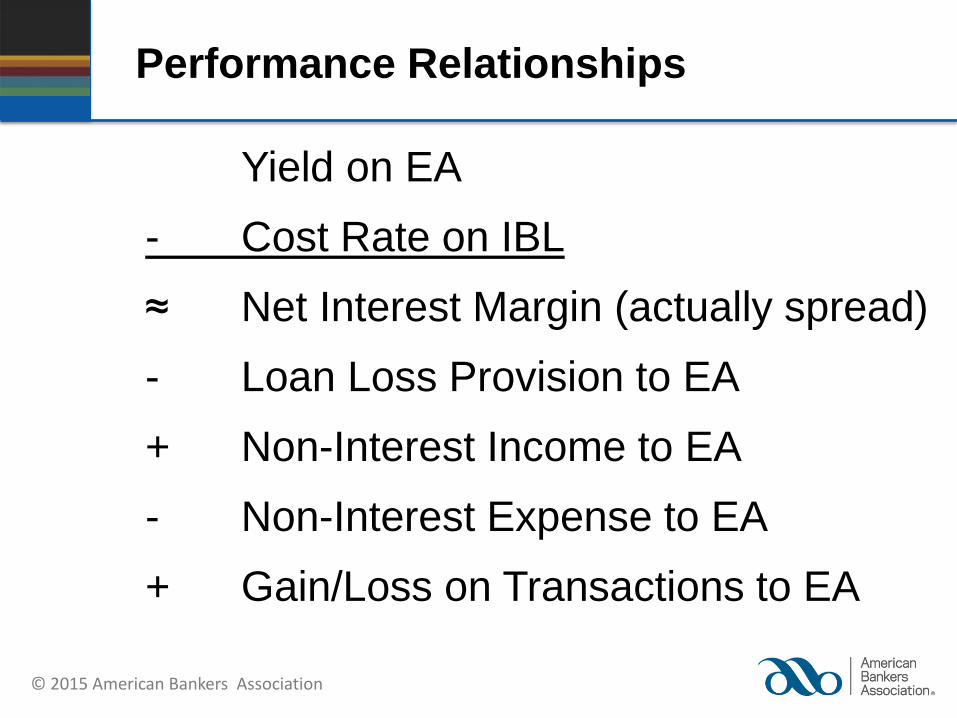
Performance Relationships
Yield on EA
- Cost Rate on IBL
≈ Net Interest Margin (actually spread)
- Loan Loss Provision to EA
+ Non-Interest Income to EA
- Non-Interest Expense to EA
+ Gain/Loss on Transactions to EA
© 2015 American Bankers Association
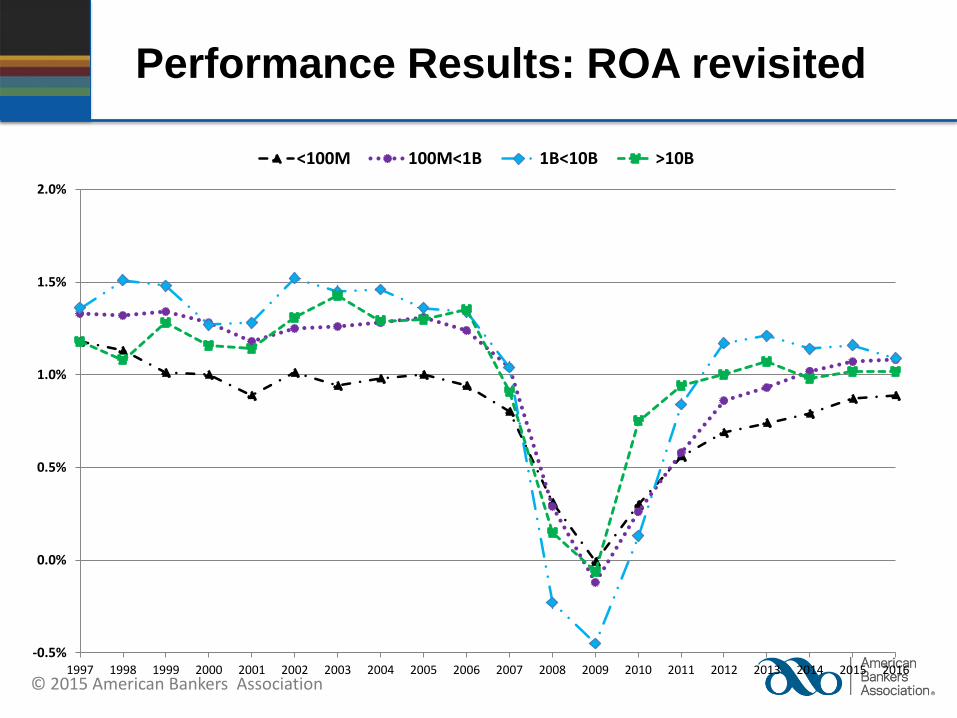
Performance Results: ROA revisited
-0.5%
0.0%
0.5%
1.0%
1.5%
2.0%
1997 1998 1999 2000 2001 2002 2003 2004 2005 2006 2007 2008 2009 2010 2011 2012 2013 2014 2015 2016
<100M 100M<1B 1B<10B >10B
© 2015 American Bankers Association
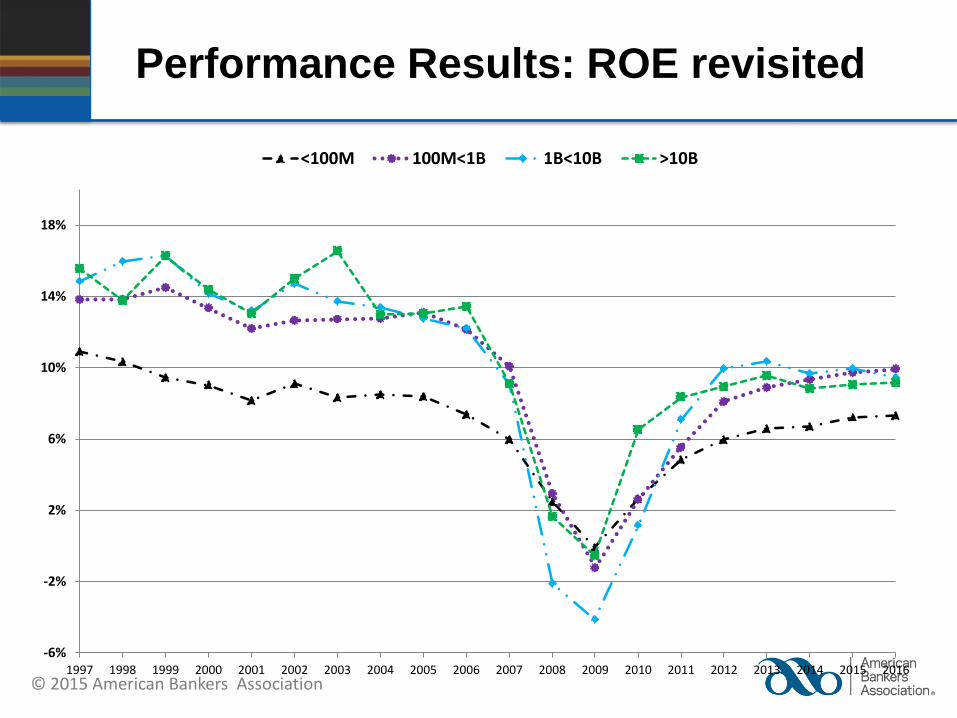
Performance Results: ROE revisited
-6%
-2%
2%
6%
10%
14%
18%
1997 1998 1999 2000 2001 2002 2003 2004 2005 2006 2007 2008 2009 2010 2011 2012 2013 2014 2015 2016
<100M 100M<1B 1B<10B >10B
© 2015 American Bankers Association
Relationship of ROA and ROE
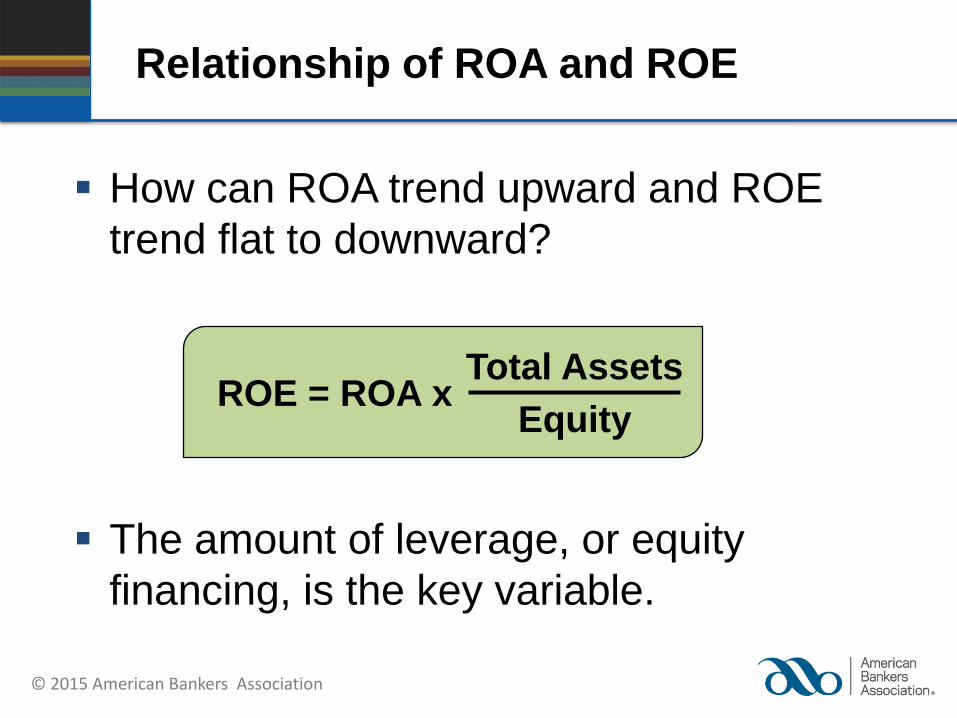
How can ROA trend upward and ROE
trend flat to downward?
The amount of leverage, or equity
financing, is the key variable.
Total Assets
Equity ROE = ROA x
© 2015 American Bankers Association
Strategic Relationship
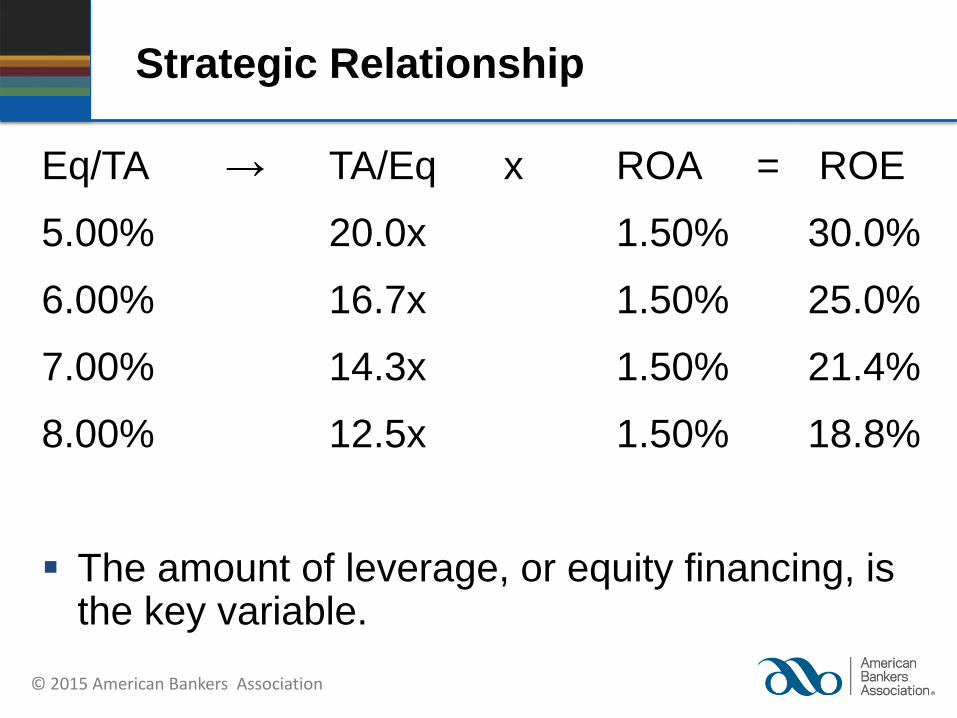
Eq/TA → TA/Eq x ROA = ROE
5.00% 20.0x 1.50% 30.0%
6.00% 16.7x 1.50% 25.0%
7.00% 14.3x 1.50% 21.4%
8.00% 12.5x 1.50% 18.8%
The amount of leverage, or equity financing, is the key variable.
© 2015 American Bankers Association
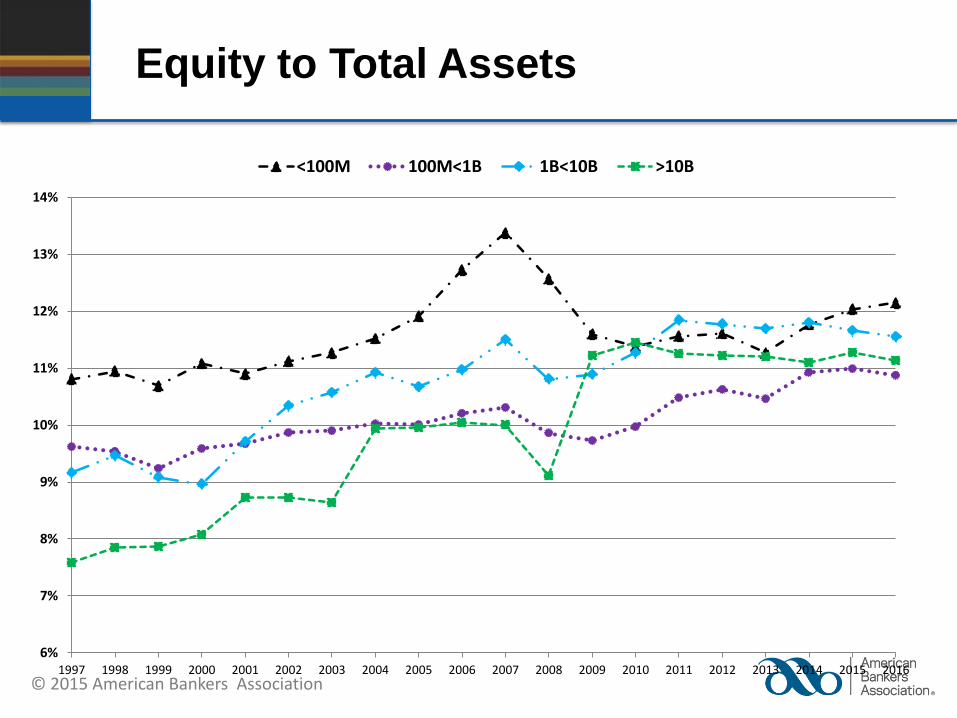
Equity to Total Assets
6%
7%
8%
9%
10%
11%
12%
13%
14%
1997 1998 1999 2000 2001 2002 2003 2004 2005 2006 2007 2008 2009 2010 2011 2012 2013 2014 2015 2016
<100M 100M<1B 1B<10B >10B
© 2015 American Bankers Association
Performance Analysis
The analysis that we have just completed
can be arrayed in a strategic relationship
Any change in the drivers will cause a
change in results variables (ROA and ROE)
Strategic initiatives should be designed to
cause specific changes in the drivers
Actual calculations can be done on the basis
of total assets rather than earning assets
© 2015 American Bankers Association
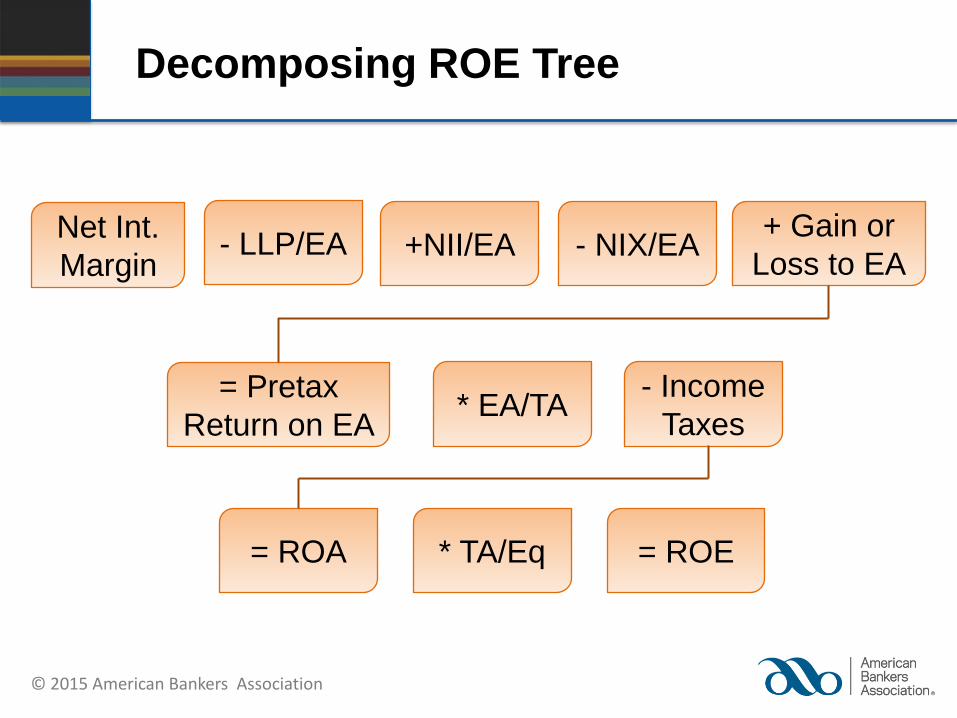
Decomposing ROE Tree
Net Int.
Margin - LLP/EA +NII/EA - NIX/EA
+ Gain or
Loss to EA
= Pretax
Return on EA * EA/TA
- Income
Taxes
* TA/Eq = ROA = ROE
© 2015 American Bankers Association
Performance Summary Industry
ROA and ROE recovering last couple of
years
– Net interest margin has been declining
– Lower loan loss provisions
– Pressure on non-interest income
– Non-interest expense leveling out to up
© 2015 American Bankers Association
Decisions Affecting ROE
Pricing and mix of assets
Pricing and mix of liabilities
Quality and growth of loans
Service charges and fee income
Expense control
Choice to sell assets
Amount of earning assets
Ability to manage taxes
Payment of dividends
Use of deposits and debt
© 2015 American Bankers Association
Data Sources
Comparative Data Sources
FDIC Statistics on Depository Institutions (SDI)
Similar data can also be obtained from the FDIC via www5.fdic.gov/qbp and www5.fdic.gov/SDI/SOB
Industry definitions
– SDI offers several predefined peer groups: <100M, 100M to 300M, 300M to 500M, 500M to 1B, 100M to 1B, 1B to 10B, and >10B
– Custom peer groups may also be defined by the user