bank size, compliance costs and compliance performance …/media/files/communitybanking/... · 1 ....
TRANSCRIPT

1
Bank Size, Compliance Costs and Compliance Performance in Community Banking
Drew Dahl
Division of Bank Supervision Federal Reserve Bank of St. Louis
411 Locust Street St. Louis, MO 63102
Andrew Meyer
Division of Bank Supervision Federal Reserve Bank of St. Louis
411 Locust Street St. Louis, MO 63102
Michelle Neely
Division of Bank Supervision Federal Reserve Bank of St. Louis
411 Locust Street St. Louis, MO 63102
May, 2016
The views expressed are those of the individual authors and do not necessarily reflect official positions of the Federal Reserve Bank of St. Louis, the Federal Reserve System, or the Board of Governors.
Abstract. We investigate whether economies of scale exist in satisfying regulatory
requirements using a sample of 469 community banks surveyed in 2015. We find that compliance costs at banks with assets of less than $100 million represented more than 8 percent of noninterest expense, while the same costs at banks with assets of between $1 billion and $10 billion represented less than 3 percent of noninterest expense. This is consistent with the existence of scale economies. We also find that higher (lower) compliance expenses do not necessarily lead to better (worse) performance on two separate regulatory-assessed ratings.

2
Bank Size, Compliance Costs and Compliance Performance in Community Banking
1. Introduction
Regulatory burden has long been, and continues to be, a concern within the banking
industry. Recently, particular attention has been devoted to compliance costs that weigh more
heavily on smaller banks than their larger counterparts (see hearings on the Economic Growth
and Regulatory Paperwork Reduction Act (EGRPRA), 2015). But how much more?
We address this question using a unique source of data obtained in a survey of
community banks conducted by state banking commissioners and the Conference of State Bank
Supervisors in cooperation with the Federal Reserve Bank of St. Louis (CSBS, 2015). In the
survey, bankers were asked to identify expenses in various operational areas that were expended
on compliance activities. We compare these expenses across 469 banks that vary by total assets.
We find that compliance costs increase, but at a decreasing rate, with bank size. Banks
with assets of less than $100 million, for instance, reported total compliance costs representing
8.7 percent of noninterest expense, while banks with assets of $1 billion to $10 billion reported
costs representing 2.9 percent of noninterest expense. Thus, relative regulatory burden, in
relation to noninterest expense, triples with decreases in bank size across this threshold.
Our results with respect to levels of compliance costs are consistent with those of
Ellihausen (1998) and our results with respect to how costs vary with bank size are consistent
with those of the Federal Deposit Insurance Corp (2012b) and the Independent Community
Bankers of America (2014). Such a confirmation is valuable insofar as our survey has
methodological advantages relative to prior research.
A unique aspect of our study concerns the relationship between compliance costs and
compliance performance. Using two separate ratings that reflect compliance performance, as

3
assessed by regulators, we find that higher compliance expenses are not necessarily and
uniformly associated with better performance. Highly rated banks in the smallest size category,
for example, have lower ratios of compliance expenses to noninterest expenses than banks with
lower ratings in the same size category. This result appears to indicate that at least some banks
could reduce compliance expenses without necessarily sacrificing performance objectives.
Overall, we offer insight into proposals to exempt community banks from various aspects
of a regulatory system that reflects some aspects of a “one size fits all” model (Lael Brainard,
Board of Governors of the Federal Reserve, at an EGRPRA hearing on February 4, 2015). The
proposals follow earlier exemptions granted by the Consumer Financial Protection (CFPB) and
the Federal Reserve; the CFPB exempted banks with assets of less than $2 billion from tougher
rules governing mortgage lending, and the Federal Reserve excused banks with assets of between
$500 million and $1 billion from more detailed financial reporting requirements and capital
rules.1
The increasing attention devoted to regulatory burdens on community banks reflects,
paradoxically, their declining, but nevertheless overwhelming, number. In this regard, the
community banking industry—defined to consist of all banks with assets of less than $10
billion—was reduced by 844 banks from 2007 to 2013 (McCord and Prescott, 2014), but still
accounted for 98 percent of all banks and thrifts in 2015 (GAO, 2015).
“Community banks play an essential role in our financial system, supporting the
economic health and vitality of the communities they serve,” said Jerome Powell of the Board of
Governors of the Federal Reserve System during a research conference for community bankers
(May 14, 2015). “The risks and vulnerabilities of community banks differ from those of larger
1 For a chronology of regulatory enactments and subsequent exemptions, see U.S. Government Accountability Office (GAO), 2015.

4
banks, and an explicit tailoring of regulation and supervision for community banks is
appropriate.”
2. Background
Prior analyses of regulatory costs in banking have used anecdotes, surveys, econometric
estimation or other methods of inference (Federal Financial Institutions Examination Council
(FFIEC), 1992, and references therein; the GAO, 1994; Elliehausen, 1998; Elliehausen and
Lowry, 2000; Eldridge and Kealey, 2006; Janson and Scheiner, 2006; Federal Reserve Bank of
Kansas City, 2011; FDIC, 2012; the CFPB, 2013; and Feldman et al., 2013. These analyses are
limited by a lack of cost data,2 fraught with measurement error3 and difficult to generalize
because of small samples or a focus on specific regulations.4,5
Data from the CSBS survey addresses some of these limitations: They reflect specific
dollar costs, are obtained across a relatively large sample of banks and incorporate effects of all
regulations. The method of analysis used here—means comparisons—does not require
sophisticated econometric estimation, but does have its own limitations. The sample size is small
and obtained from just a single year. Respondent bias exists to the extent that managers of
smaller banks have incentives to exaggerate reported regulatory burden. And surveyed banks
2 The FDIC (2012) does not provide data within its interview approach. Feldman et al. (2013) illustrate dollar costs by applying publicly available data on salaries in banking to an estimate of the numbers of employees working in regulatory compliance that is based, in part, on a survey by the Federal Reserve Bank of Kansas City (2011). 3 Banks generally “do not track their full costs of compliance, and the relevant information is often scattered across several departments and many employees (CFPB, 2013).” 4 Elliehausen and Lowrey (2000) examine one regulation, the Truth in Savings Act, while the CFPB (2013) examines the Truth in Savings Act, the Electronic Fund Transfer Act, the Grammm-Leach Bliley financial privacy requirements and the Fair Credit Reporting Act. 5 The CFPB (2013) and the FDIC (2012) interview employees of fewer than 10 banks. Eldridge and Kealey (2006) and Janson and Scheiner (2006) examine publicly traded bank holding companies rather than banks.

5
may not be representative of the industry as a whole. Our conclusions must be qualified
accordingly.
2.1 The Survey
The survey asked bankers to identify expenses in one of five categories: 1) data
processing; 2) accounting and auditing; 3) consulting and advising; 4) legal; and 5) personnel.
They were asked to specify both the dollar amounts of total expenses and the amounts spent on
compliance in each of these five categories.
The survey sought to focus attention on areas of bank operations that were considered
likely to reflect compliance expenses. McCord and Prescott (2014) similarly considered these
same categories (personnel expenses excepted) in their analysis of regulatory burden.
“Data processing expenses” incorporate compliance costs associated with the
manipulation of data for regulatory purposes. Bankers surveyed by the CSBS and the GAO
(2015) underscored the existence of software expenses necessary to produce disclosures under
various regulatory requirements. Similarly, the CFPB (2013) reported that information
technology was one of two business functions that incurred the highest share of compliance costs
in four of the seven banks it studied.
Economies of scale appear possible in data processing compliance costs to the extent that
they have fixed components. Larger banks, for instance, may implement their information
technology needs in-house, while smaller banks may rely exclusively on external vendors. It is
difficult, however, to “parse out” incremental and fixed costs in this area, particularly as only a
small percentage of information technology expenses are attributable to compliance (CFPB,
2013).
6
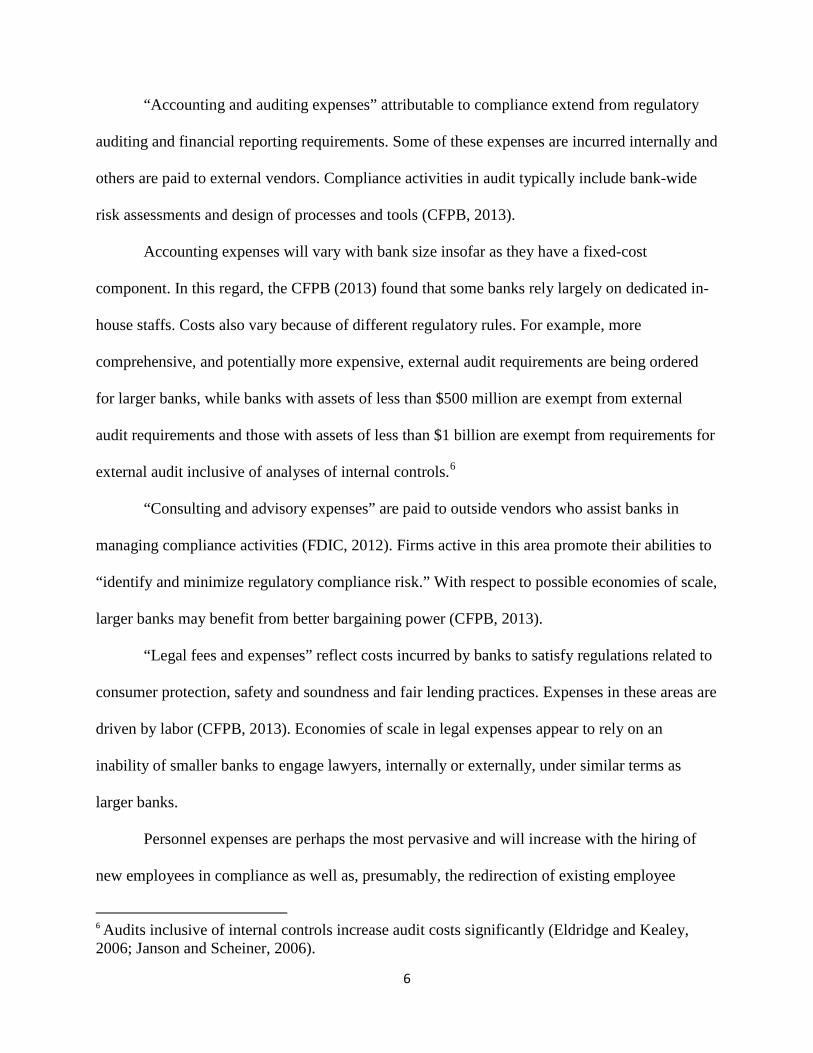
“Accounting and auditing expenses” attributable to compliance extend from regulatory
auditing and financial reporting requirements. Some of these expenses are incurred internally and
others are paid to external vendors. Compliance activities in audit typically include bank-wide
risk assessments and design of processes and tools (CFPB, 2013).
Accounting expenses will vary with bank size insofar as they have a fixed-cost
component. In this regard, the CFPB (2013) found that some banks rely largely on dedicated in-
house staffs. Costs also vary because of different regulatory rules. For example, more
comprehensive, and potentially more expensive, external audit requirements are being ordered
for larger banks, while banks with assets of less than $500 million are exempt from external
audit requirements and those with assets of less than $1 billion are exempt from requirements for
external audit inclusive of analyses of internal controls.6
“Consulting and advisory expenses” are paid to outside vendors who assist banks in
managing compliance activities (FDIC, 2012). Firms active in this area promote their abilities to
“identify and minimize regulatory compliance risk.” With respect to possible economies of scale,
larger banks may benefit from better bargaining power (CFPB, 2013).
“Legal fees and expenses” reflect costs incurred by banks to satisfy regulations related to
consumer protection, safety and soundness and fair lending practices. Expenses in these areas are
driven by labor (CFPB, 2013). Economies of scale in legal expenses appear to rely on an
inability of smaller banks to engage lawyers, internally or externally, under similar terms as
larger banks.
Personnel expenses are perhaps the most pervasive and will increase with the hiring of
new employees in compliance as well as, presumably, the redirection of existing employee
6 Audits inclusive of internal controls increase audit costs significantly (Eldridge and Kealey, 2006; Janson and Scheiner, 2006).
7
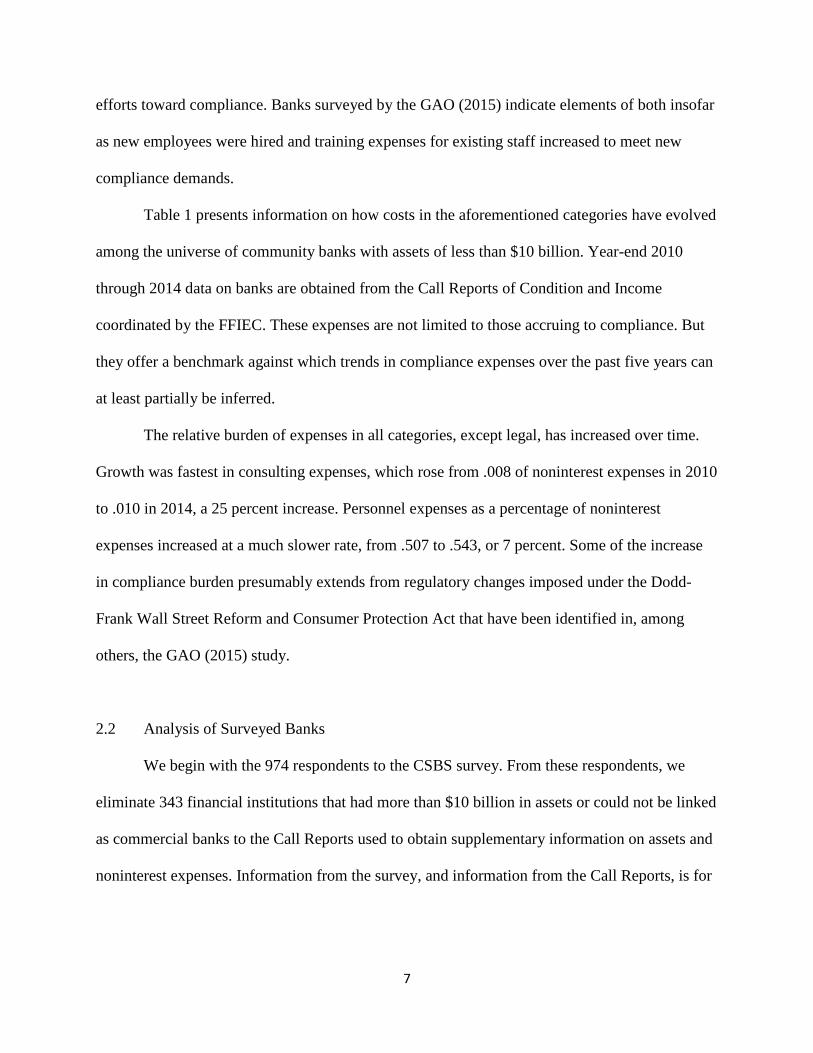
efforts toward compliance. Banks surveyed by the GAO (2015) indicate elements of both insofar
as new employees were hired and training expenses for existing staff increased to meet new
compliance demands.
Table 1 presents information on how costs in the aforementioned categories have evolved
among the universe of community banks with assets of less than $10 billion. Year-end 2010
through 2014 data on banks are obtained from the Call Reports of Condition and Income
coordinated by the FFIEC. These expenses are not limited to those accruing to compliance. But
they offer a benchmark against which trends in compliance expenses over the past five years can
at least partially be inferred.
The relative burden of expenses in all categories, except legal, has increased over time.
Growth was fastest in consulting expenses, which rose from .008 of noninterest expenses in 2010
to .010 in 2014, a 25 percent increase. Personnel expenses as a percentage of noninterest
expenses increased at a much slower rate, from .507 to .543, or 7 percent. Some of the increase
in compliance burden presumably extends from regulatory changes imposed under the Dodd-
Frank Wall Street Reform and Consumer Protection Act that have been identified in, among
others, the GAO (2015) study.
2.2 Analysis of Surveyed Banks
We begin with the 974 respondents to the CSBS survey. From these respondents, we
eliminate 343 financial institutions that had more than $10 billion in assets or could not be linked
as commercial banks to the Call Reports used to obtain supplementary information on assets and
noninterest expenses. Information from the survey, and information from the Call Reports, is for

8
2014. We eliminate banks that reported missing values or zeroes across all compliance expense
categories. The final sample consists of 469 banks.
Operating expenses (compliance and non-compliance) reported in the survey for the 469
banks as of year-end 2014 are presented in the upper part of Table 2. Note that this information
is from the Call Reports (not the survey).
Mean levels of expenses, by category, as well as the ratios of expenses to noninterest
expenses, are similar to those reported for the community banking industry as a whole using data
from the 2014 Call Reports (last column of Table 1). This mitigates, to some extent, concerns
that the banks in the survey are not representative of the general industry.
Compliance expenses within these amounts are identifiable from the survey. Across all
categories, mean compliance expenses represented six percent of noninterest expense (not shown
in any table). This is low relative to levels reported from earlier time periods. Elliehausen (1998),
for instance, in summarizing the results of several studies, suggests that total compliance costs
may account for 12 to 13 percent of noninterest expenses. The discrepancy could be an artifact of
the CSBS survey, insofar as respondents may have interpreted questions concerning cost on an
incremental, rather than total, basis; in this regard, one study cited by Elliehausen (1998)
identified incremental costs of six percent of noninterest expense.7
Table 3 provides information on the five categories of expenses for banks in different size
groups. It lists average dollar amounts, and dollar amounts as percentages of noninterest expense,
in each size category. For the ratios, means and medians are presented. We present our
discussion in terms of means.
7 Lower compliance costs relative to those reported in Elliehausen (1998) could indicate, alternatively, that banks have become more efficient over time in satisfying regulatory obligations (even though the scope of regulations has expanded).

9
For banks with assets of less than $100 million, total compliance expenses averaged
$163,000, or 8.7 percent of noninterest expense. For banks with assets of $1 billion to $10
billion, total compliance averaged $1,843,000, or 2.9 percent of noninterest expense. The
differences suggest a tripling of regulatory burden for banks in the smaller size category. By way
of comparison, the CFPB (2013) found that banks with less than $1 billion in assets had costs
representing as much as six percent of retail deposit operating expenses, which was more than
double the percentage for banks with more than $1 billion in assets.
Across all size categories, ratios of total compliance expenses to noninterest expense
were, respectively, 8.7 percent, 5.9 percent, 5.2 percent, 4.2 percent and 2.9 percent. The
declines, in other words, are monotonic, suggesting that economies of scale persist even in the
largest size categories of community banks (which, by definition, are limited to those under $10
billion in assets). Ellihausen (1998), among others, has observed that economies of scale are
large at relatively low levels of assets and decline with increases in size, while evidence from the
ICBA study (2014) suggested that economies of scale in preparing financial reports did not
extend beyond the $500 million asset level.
Compliance expenses for personnel are, by far, the largest category, in all size groups,
typically representing 60 percent or more of total compliance expenses. They decline, as a
percentage of noninterest income, from 5.3 percent, for banks with less than $100 million in
assets, to 1.7 percent, for banks with assets of $1 billion to $10 billion. This result is consistent
with Yellen (2015) and the Federal Reserve Bank of Kanas City (2014), both of which contend

10
that smaller banks have fewer staff members over which regulatory costs can be spread
efficiently.8
Compliance expenses declined consistently, as percentages of noninterest expense, with
increases in size in the data processing and consulting categories, which exhibited percentage
drops of more than 65 percent in moving from the less than $100 million asset threshold to the
$1 billion to $10 billion threshold. Relative accounting expenses declined similarly across size
categories. The latter result can be compared to the study by the ICBA (2014), which found that
the costs of preparing required financial statements were $10,316 for banks with assets of less
than $100 million and $14,990 for banks with assets of $250 million to $500 million. In other
words, costs were 45 percent higher over an interval in which size increased by a minimum of
150 percent. Similarly, the FDIC (2012b) found that examinations at banks with less than $50
million in assets averaged 335 hours, while banks with assets of $500 million to $1 billion
averaged 850 hours.
Relative accounting costs related to compliance for banks in the $250 million to $500
million asset category, compared with banks in the $500 million to $1 billion category, were
nearly twice as large. This suggests that economies of scale were sufficient to overcome any
additional costs associated with the mandatory audit that banks with assets of $500 million or
more face. Relative costs failed to further decline, however, for banks with assets of more than
$1 billion, the level at which audits under internal controls are required.
8 The survey by the Federal Reserve Bank of Kansas City (2011) identified the numbers of employees involved in regulatory compliance. It showed that 32 of 45 banks with assets under $50 million reported one to three employees, while five of 11 banks with assets between $500 million and $1 billion reported more than five employees.
11
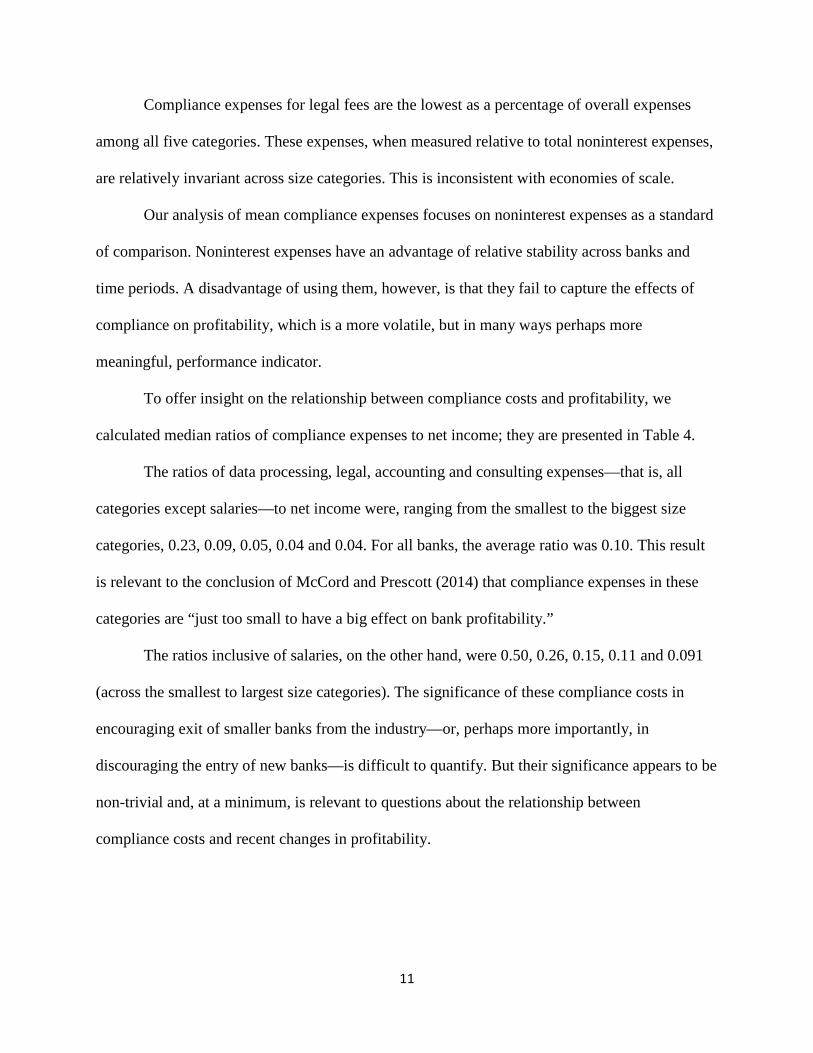
Compliance expenses for legal fees are the lowest as a percentage of overall expenses
among all five categories. These expenses, when measured relative to total noninterest expenses,
are relatively invariant across size categories. This is inconsistent with economies of scale.
Our analysis of mean compliance expenses focuses on noninterest expenses as a standard
of comparison. Noninterest expenses have an advantage of relative stability across banks and
time periods. A disadvantage of using them, however, is that they fail to capture the effects of
compliance on profitability, which is a more volatile, but in many ways perhaps more
meaningful, performance indicator.
To offer insight on the relationship between compliance costs and profitability, we
calculated median ratios of compliance expenses to net income; they are presented in Table 4.
The ratios of data processing, legal, accounting and consulting expenses—that is, all
categories except salaries—to net income were, ranging from the smallest to the biggest size
categories, 0.23, 0.09, 0.05, 0.04 and 0.04. For all banks, the average ratio was 0.10. This result
is relevant to the conclusion of McCord and Prescott (2014) that compliance expenses in these
categories are “just too small to have a big effect on bank profitability.”
The ratios inclusive of salaries, on the other hand, were 0.50, 0.26, 0.15, 0.11 and 0.091
(across the smallest to largest size categories). The significance of these compliance costs in
encouraging exit of smaller banks from the industry—or, perhaps more importantly, in
discouraging the entry of new banks—is difficult to quantify. But their significance appears to be
non-trivial and, at a minimum, is relevant to questions about the relationship between
compliance costs and recent changes in profitability.

12
As a final way of examining the relationship between size and relative compliance costs,
we consider raw correlations between the two. These are presented in Table 5. They are negative
and statistically significant in all but one of the cases (legal expenses).
2.3 Compliance Costs and Performance
A potentially extenuating factor in our analysis of compliance costs is an implicit
assumption of constant compliance performance across bank size categories. It seems possible,
alternatively, that lesser (greater) relative expenditures on compliance for bigger (smaller) banks
may be associated with worse (better) performance outcomes. We are unaware of any previous
study that has considered this issue.
We selected two proxies for compliance performance. The first uses a component of the
overall “CAMELS” rating that is assigned to a bank by its regulators that reflects assessment of
“management.”9 It reflects the capability to “identify, measure, monitor and control the risks of
an institution’s activities and to insure a financial institution’s safe, sound and efficient operation
in compliance with applicable laws and regulations.” We define banks as “highest rated” if
assigned a “1” rating for management and “other” if assigned lesser ratings.
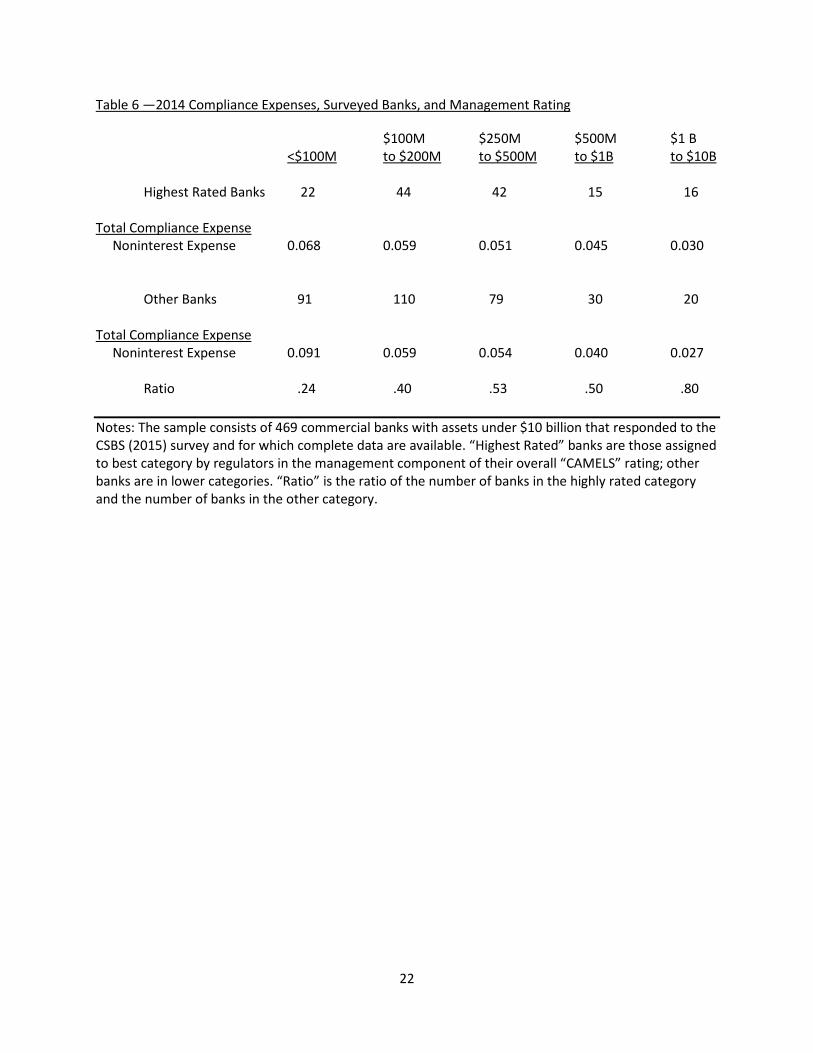
Table 6 shows the distribution of highly rated and other banks by asset size and their
mean ratios of compliance expenses to all noninterest expenses. Comparisons across size
categories, in the last row of the table, fail to provide direct and obvious evidence that assessed
managerial performance deceases with bank size. The ratio of highest-rated banks to other banks,
presented in the last row of the table, tends to increase, rather than decrease, with bank size.
9 See Federal Deposit Insurance Corporation, Statements of Policy (5000), Uniform Financial Institution Rating System.

13
We also present information on compliance expenses as a percentage of noninterest
expenses, by management rating, within each size category. We find few systematic differences
in total compliance expenses between highly rated and other banks within each size category.
Total compliance expense ratios are lower for highly rated banks than for other banks in the less
than $100 million asset size group and roughly the same across other size groups.
Results presented in this table, overall, appear to be inconsistent with a hypothesis that
greater expenditures on compliance activities are necessary to improve compliance performance.
Similarly, higher compliance costs at the smallest banks are not necessarily associated with
better compliance outcomes. Both inconsistencies suggest that observed variation in corporate
governance practices across community banks may not be as critically dependent on direct
expenditures as on, alternatively, the ability of management, boards, audit committees and
internal auditors to work together to properly focus oversight attention (Bies, 2004).
Our second proxy for compliance performance is a rating established by regulators for a
bank’s ability to comply with consumer regulations. We define banks as “highest rated” if
assigned a “1” rating and “other” if assigned lesser ratings. Results are presented in Table 7.
Once again, within size categories, total compliance expenses between highest rated
banks and other banks exhibit few systematic differences. Highest rated banks in the smallest
size category have lower ratios of compliance expenses to noninterest expenses than banks with
lower ratings in the same size category. This result is perhaps unsurprising, as there is
considerable overlap in banks that are highly rated across the two proxies. But it does reinforce
the possibility that at least some banks could reduce compliance expenses without sacrificing
performance objectives.

14
3. Conclusions
We compare compliance costs across a sample of 469 banks that vary by size using
unique data obtained in survey by the CSBS (2015). We find that the ratio of these costs to total
noninterest expense averages more than eight percent at banks with assets of less than $100
million and less than three percent at banks with assets of $1 billion to $10 billion. This result is
consistent with the existence of economies of scale in fulfilling compliance obligations.
The survey data also allow us to identify expenses by operational categories specified in
Call Reports. We find that expenses in data processing, accounting and consulting vary by size in
the same general patterns identified for total expenses; similar relationships for legal expenses,
however, are less evident. The dollar volume of expenses in these four categories is exceeded
substantially by compliance expenses embedded in salaries.
Previous research has led to similar findings. But it is limited to consideration of costs
that can be inferred from simulations, inferred from aggregated data (compliance and non-
compliance), are unique to a particular regulation rather than cumulative across all regulations or
are cumulative but observed only in a small number of banks. We, on the other hand, are able to
quantify, using a relatively large sample of banks, a “cumulative compliance cost” that has been
“hard to quantify” because it is not reported separately in Call Reports (GAO, 2015).
A novel aspect of our study is that incorporates identifiable “outputs” that, presumably,
are the objective of expenditures on compliance activities. These are a regulatory-assessed rating
for managerial performance and regulatory-assessed rating for satisfaction of consumer
regulations. We find that these ratings do not necessarily improve with increases in relative
compliance expenditures.

15
4. References
Bies, S. 2004. Trends in Risk Management and Corporate Governance (June 22).
Consumer Finance Protection Bureau. 2013. Understanding the Effects of Certain Deposit Regulations on Financial Institutions’ Operations (November).
Conference of State Bank Supervisors. 2015. Community Banking in the 21st Century, Community Banking Research and Policy Conference, Federal Reserve Bank of St. Louis. Eldridge, S. and B. Kealey. 2006. SOA attestation: What are the initial costs for banks? Bank Accounting and Finance (December-January), 3-12.
Elliehausen, G. 1998. The cost of bank regulation: A review of the evidence, Staff Study, Federal
Reserve Board. Elliehausen, G. and B. Lowrey. 2000. The costs of implementing regulatory changes: The Truth
in Savings Act, Journal of Financial Services Research 17, 165-179.
Federal Reserve Bank of Kansas City. 2011. Survey of Community Depository Institutions (August).
Feldman, R., K. Heinecke and J. Schmidt. 2013. Quantifying the costs of additional regulation
on community banks, Economic Policy Paper, Federal Reserve Bank of Minneapolis.
Federal Deposit Insurance Corp. 2005. Statement of John Reich on Regulatory Burden Relief Efforts (U.S. House of Representatives, June 9).
Federal Deposit Insurance Corp. 2012a. Community Banking Study (December).
Federal Deposit Insurance Corp. 2012b. The FDIC’s examination process for small community
banks, Office of Inspector General (August).
Federal Financial Institutions Examination Council. 1992. Study on Regulatory Burden (December 17).
Hoskins, S. and M. Labonte. 2015. An analysis of the regulatory burden on small banks, working
paper, Congressional Research Service. Independent Community Bankers of America. 2014. Community Bank Call Report Burden
Survey. Janson, K. and J. Scheiner. 2006. FDICIA and Sarbanes-Oxley requirements: Impact on bank
audit fees, Bank Accounting and Finance (April-May), 23-48. Lux, M. and R. Greene. 2015. The state and fate of community banking, working paper, Harvard University.

16
McCord, R. and E. Prescott. 2014. The financial crisis, the collapse of bank entry, and changes in the size distribution of banks, Economic Quarterly, Federal Reserve Bank of Richmond, 23-50. U.S. Government Accountability Office. 1993. Regulatory Burden (December). Yellen, J. 2015. Some thoughts on community banking: a conversation with Janet Yellen, Community Banking Connections (Federal Reserve System).

17
Table 1—Mean Expenses by Year, All Banks
2010 2011 2012 2013 2014
Data Processing $426 $451 $489 $523 $560 (0.048) (0.049) (0.050) (0.052) (0.054)
Legal $158 $162 $181 $146 $128 (0.013) (0.013) (0.012) (0.011) (0.010)
Accounting $80 $88 $97 $101 $108 (0.013) (0.014) (0.014) (0.014) (0.015)
Consulting $153 $181 $221 $222 $253 (0.008) (0.009) (0.009) (0.009) (0.010)
Personnel $5,174 $5,514 $6,120 $6,497 $6,792
(0.507) (0.517) (0.530) (0.540) (0.543)
Total $5,993 $6,397 $7,109 $7,491 $7,843 (0.590) (0.602) (0.616) (0.628) (0.631)
Number of Banks 6,499 6,257 6,045 5,819 5,575 Notes: Data are obtained in a given year for all commercial banks with under $10 billion in assets. Dollar amounts, expressed in thousands, represent means for banks in varying categories. Percentages (in parentheses) are means within a category of the ratios of dollar amounts to overall noninterest expenses.

18
Table 2—2014 Mean Expenses, Surveyed Banks
Data Processing Legal Accounting Consulting Personnel Total $492 $122 $102 $121 $6,529 $7,367 (0.056) (0.009) (0.014) (0.009) (0.552) (.640) Notes: The sample consists of 469 commercial banks with assets under $10 billion that responded to the CSBS (2015) survey and for which complete data are available. Dollar amounts, expressed in thousands, represent means for banks in varying categories. Percentages (in parentheses) are means within a category of the ratios of dollar amounts to overall noninterest expenses.

19
Table 3—2014 Mean Compliance Expenses, Surveyed Banks, as Percentages of Noninterest Expense
$100M $250M $500M $1 B <$100M to $250M to $500M to $1B to $10B
Data Processing $27.5 $36.8 $82.8 $109 $188 Mean (0.014) (0.009) (0.009) (0.006) (0.003) Median (0.008) (0.005) (0.005) (0.003) (0.001)
Legal $4.5 $5.8 $20.0 $47.4 $135 Mean (0.002) (0.001) (0.002) (0.002) (0.002) Median (0.000) (0.000) (0.001) (0.000) (0.000)
Accounting $18.9 $31.6 $45.5 $57.7 $188 Mean (0.010) (0.006) (0.005) (0.003) (0.003) Median (0.007) (0.005) (0.004) (0.002) (0.001)
Consulting $11.7 $18.2 $23.9 $43.3 $129 Mean (0.006) (0.004) (0.003) (0.002) (0.002)
Median (0.004) (0.002) (0.001) (0.001) (0.000) Personnel $100 $176 $312 $507 $1,202
Mean (0.053) (0.039) (0.034) (0.028) (0.017) Median (0.033) (0.032) (0.024) (0.021) (0.018)
Total $163 $269 $484 $764 $1,843 Mean (0.087) (0.059) (0.052) (0.042) (0.029) Median (0.067) (0.050) (0.041) (0.030) (0.018)
Number of Banks 113 154 121 45 36 Notes: The sample consists of 469 commercial banks with assets under $10 billion that responded to the CSBS (2015) survey and for which complete data are available. Dollar amounts, expressed in thousands, represent means for banks in varying categories. Percentages (in parentheses) are means, and medians, within a category of the ratios of dollar amounts to overall noninterest expenses.

20
Table 4—2014 Mean Compliance Expenses, Surveyed Banks, as Percentages of Net Income
$100M $250M $500M $1 B <$100M to $250M to $500M to $1B to $10B Compliance Expenses Excluding Salaries 0.227 0.091 0.053 0.037 0.036 Compliance Expenses Including Salaries 0.500 0.265 0.155 0.111 0.091
Number of Banks 113 154 121 45 36
Notes: The sample consists of 469 commercial banks with assets under $10 billion that responded to the CSBS (2015) survey and for which complete data are available.

21
Table 5—Correlations of Size and Ratios of Compliance Expenses to Noninterest Expense
Data Processing Legal Accounting Consulting Personnel Total -0.157* 0.009 -0.162* -0.114* -0.135* -0.178* Log Form -0.298* -0.235* -0.322* -0.285* -0.238* -0.253* (418) (288) (423) (352) (435) (469) Note: For ratios in the first row of the table, the sample consists uniformly of 469 commercial banks with assets under $10 billion that responded to the CSBS (2015) survey and for which complete data are available. For the second row, sample sizes are listed in parentheses. Asterisks indicate correlations that are statistically significant at the one per cent level.
22
Table 6 —2014 Compliance Expenses, Surveyed Banks, and Management Rating
$100M $250M $500M $1 B <$100M to $200M to $500M to $1B to $10B
Highest Rated Banks 22 44 42 15 16
Total Compliance Expense Noninterest Expense 0.068 0.059 0.051 0.045 0.030
Other Banks 91 110 79 30 20
Total Compliance Expense Noninterest Expense 0.091 0.059 0.054 0.040 0.027 Ratio .24 .40 .53 .50 .80 Notes: The sample consists of 469 commercial banks with assets under $10 billion that responded to the CSBS (2015) survey and for which complete data are available. “Highest Rated” banks are those assigned to best category by regulators in the management component of their overall “CAMELS” rating; other banks are in lower categories. “Ratio” is the ratio of the number of banks in the highly rated category and the number of banks in the other category.

23
Table 7 —2014 Compliance Expenses, Surveyed Banks, and Consumer Compliance Rating
$100M $250M $500M $1 B <$100M to $200M to $500M to $1B to $10B
Highest Rated Banks 22 54 40 15 10
Total Compliance Expense Noninterest Expense 0.074 0.061 0.061 0.034 0.032
Other Banks 90 100 81 30 26
Total Compliance Expense Noninterest Expense 0.090 0.057 0.048 0.045 0.027 Ratio .24 .54 .49 .50 .38 Notes: The sample consists of 468 commercial banks with assets under $10 billion that responded to the CSBS (2015) survey and for which complete data are available (one bank in the overall sample has a missing rating). “Highest Rated” banks are those assigned the best category by regulators for consumer compliance; other banks are in lower categories. “Ratio” is the ratio of the number of banks in the highly rated category and the number of banks in the other category.