bankruptcy behavior in the nfl: does the overtime structure change
TRANSCRIPT

Bankruptcy Behavior in the NFL:
Does the Overtime Structure Change the Strategy of the Game?
Kurt W Rotthoff
Seton Hall University
Stillman School of Business
Last working version, final version published in: Journal of Economics and Finance Volume 36, Issue 3, July, Pages 662-674
The final publication is available at www.springerlink.com:
http://www.springerlink.com/content/47k4658696t3m52t/?p=175ff2b84e3a4424b7c5358
8a537da07&pi=4
Contact Information: [email protected], Seton Hall University, JH 621, 400 South Orange Ave, South Orange, NJ 07079. I would like to thank Robert Tollison, Mike Maloney, Brian Henderson, Patrick
McLaughlin, Rey Hernandez, and Hillary Morgan for the helpful comments. Also thanks to those helpful
comments from the presentation at the Academy of Economics and Finance meetings. Any mistakes are my
own.
2
Abstract
Companies in financial distress have an incentive to take on high-risk/high-reward
projects, known as ‘bankruptcy behavior.’ This paper investigates the activity of
bankruptcy behavior outside of the corporate setting by analyzing the effects of the
overtime structure in the NFL relative to College Football. In overtime, the first team to
score in the NFL wins. In college football, however, both teams in overtime get a chance
to score and the winner is decided when one team outscores the other. This structure
causes different strategies for the NFL teams approaching overtime relative to college
football teams. Using the variance in scoring throughout the game, I find evidence that
NFL teams take on more risk late in the game to avoid overtime, or act as if they have
bankruptcy behavior.
3
I. Introduction
“The Great Overtime Debate” between Phil Simms and Jim Nantz on Showtime
Sports’ Inside the NFL1 demonstrates the continued debate on the issue of overtime in the
National Football League (NFL). The debate is built on the idea that the NFL’s overtime
structure doesn’t change the nature of the game. However, analysts on other major sports
networks state that NFL teams do their best to avoid overtime while college teams are
willing to run out the clock to take the game to overtime. This study adds advanced
statistical analysis to the ongoing debate; does the overtime structure change the strategy
of the game?
The NFL and college football both play four quarters of regulation and both have
an overtime structure in place if the game is still tied at the end of regulation. However
this is where the similarities end. In college football the overtime rule says each team gets
a chance to score from the 25 yard line. Each team takes their chance until one team
scores more points with their chance than the other team does. This tit-for-tat strategy
allows both teams the opportunity to play offense and score. On the other hand, the NFL
says the first team to score in overtime wins the game, which is known as sudden death.
In this set-up, if the team that gets the ball first scores, the other team will never have a
chance on offense.
During “The Great Overtime Debate” (2009) Jim Nantz points out that the
original NFL overtime rule was established in 1974. From 1974-1978 there were 34
overtime games of which the first team to touch the ball won 48.5% of the games (29%
had a first position win). More recently, from 2004-2008, 72 games went into overtime.
In the more recent sample, the team who touches the ball first wins 61.8% of the games,
1 http://sports.sho.com/infl/great-overtime-debate.html
4
with 38.9% winning on the first drive. Jim Nantz suggests that this occurs because the
NFL has changed rules in the league to open up the offense and increase scoring.
Rosen and Wilson (2007) write that “[t]he overtime method used in college
football is designed to minimize the importance of the coin toss, unlike the system used
by the National Football League (NFL). Their sudden-death overtime system has long
been criticized for favoring the team that gets the ball first, implying that the team which
wins the coin toss usually wins the game.” If overtime structure causes teams in different
leagues to act differently when they approach the possibility of going into overtime, their
difference in strategy will be observable. The NFL’s rules creates an environment where
the optimal strategy to win the game changes. This change in strategy, and implicitly the
overtime success being influenced by something outside of their control (the coin flip),
will cause the teams in different leagues to act differently. NFL teams should be more
likely to act with risky plays late in the game.
This study uses a unique approach to measure the unintended consequences that
occur because of the overtime structure. I adopt the financial concept of ‘bankruptcy
behavior’ to the scoring patterns of college football and the NFL to see if there is any
measurable evidence of increased risk taking in the NFL. I find evidence that NFL teams
do employ risky strategies to win games when the score is close in the fourth quarter. The
next section discusses the differences in the two leagues followed by an explanation of
bankruptcy behavior. Section four looks at the data and results with section five
concluding.
5
II. Model
This section is not concerned directly with the winning function (established in
Rosen and Wilson 2007 and presented below), I am concerned with how this winning
function changes for the NFL and college football teams as they proceed to overtime. In
both college football and the NFL, if teams are tied at the end of regulation they go to an
overtime period. Before the overtime period begins, there is a coin flip. In both leagues
the winner of the coin flip decides if they want the ball first.
In college football each team gets a chance from the 25 yard-line to score. If the
score is tied after the first overtime period, they rotate who gets the ball first and continue
playing until one team outscores the other team. After the second overtime period, teams
can no longer attempt an extra point after a touchdown; they must go for a two point
conversion. Rosen and Wilson (2007) find a statistical advantage for college teams taking
a defense first strategy.
In the NFL, there is an overtime period, which lasts 15 minutes.2 The first team to
score wins the game, and if no one scores at the end of this period, the game is called a
tie.3 As Che and Hendershott (2008) point out (about the NFL) “While the outcome of a
coin flip to determine first possession is ex ante fair, immediately after the toss it is no
longer fair because the winning team has a significant chance of scoring on the first
possession.” They also talk about Tom Donahoe’s4 quote on the overtime system: “[w]e
don’t like the current system. It just seems that too much depends on the coin flip – who
wins it and who loses it.” (Wall Street Journal, 2003) For discussion on what ‘fair’ is, see
2 In a playoff game there can be additional periods played, if needed, to determine a winner. 3 This happens rarely, only once in this data set. 4 Buffalo Bill’s president and general manager at the time.
6
work on competitive balance in sports leagues (e.g. Fort and Quirk 2009 or Syzmanski
2009).
Before the coin flip ever occurs in overtime, teams from both leagues try to win
the game. Rosen and Wilson (2007) use these factors that influence game outcomes:
Winningi = f (game location, pre-game points spread, momentum, pressure, score)
This winning function can be used for both leagues, i. This study focuses on the
difference between the two leagues when overtime in imminent. In college football the
winning function is unchanged:
Winningcollege football = f (game location, pre-game points spread, momentum, pressure,
score)
However the winning function in the NFL is different due to different overtime rules. The
coin flip changes the odds of winning a game, causing the winning function to change:
WinningNFL = f (game location, pre-game points spread, momentum, pressure, score, coin
flip)
This shows that when going into overtime the original function for winning changes to
include the coin flip. Because of this, NFL teams look at the overtime period as
fundamentally different then regulation. In addition to that, the part that has been added,
7
the coin flip, is independent of the talent levels of the team, so they will try their best to
avoid these overtime periods, which is the focus of this study.
As stated in Romer (2006) “a team trailing by two points with time running out is
not indifferent between three points for sure and a three-sevenths chance of seven”. This
also means that a team that is down by four will find no value in a sure three point play,
but will value the three-sevenths chance to score seven. The value of these plays will
change as the game approaches the end, thus the marginal value of the plays will change.
Because the scoring value changes with the clock I expect to find different scoring
patterns in the second and fourth quarter, the question is: Does the fourth quarters scoring
pattern change differently in the NFL and college football? A change in the strategy,
should it exist, is measurable.5
III. Bankruptcy Behavior
a. Overtime
The incentives, and effects, of overtime rules have been looked at in many
studies. The effect of unintended consequences have been looked at in the NHL’s rule
change before the 1999-2000 season, changing the way teams were awarded points in
overtime. Abrevaya (2004), Easton and Rockerbie (2005), Shmanske and Lowenthal
(2007), and Longley and Sankaran (2007), in general, find that when the NHL changed
the points awarded, the teams responded to these rules and changed their strategies on the
ice.
5 I it important to note that I am assuming the margin of victory is irrelevant. In a close game teams do not
care if they win by 1 or 10, they just want to win.
8
When looking at football, Rosen and Wilson (2007) find that the ‘defense first’
strategy is preferred in college football due to the structure (but would not be chosen in
the NFL). Peterson (2004) finds an overtime bias in football, but Che and Hendershott
(2008) find that this bias, from the coin flip, is ex ante fair. This study continues this
research to see if the overtime structure changes the strategy of the game. I will be
looking at the overtime structure’s affects on risky plays through a theory called
bankruptcy behavior, or the act of risk shifting.
Poulsen (2008) shows how risk shifting can be illustrated in football: “Woody
Hayes, the legendary Ohio State University football coach known for grinding out
yardage on the ground, used to say that three things can happen when you pass the ball,
and two of them are bad. His philosophy is sound in a close game; in that case it is best to
play conservatively and avoid the risk of incompletion or interception. But if you're down
by three touchdowns in the fourth quarter, a conservative strategy will not get you back
into the game quickly. Instead, you should throw a bomb—a long pass. True, the ball
might be intercepted or fall incomplete, but if you were going to lose anyway, the
downside is not that bad. On the upside is the chance of a big payoff—a touchdown. How
does this relate to shareholders and bondholders? If it looks as if the firm will not be able
to cover its obligations and thus the equity claim is worthless, shareholders may throw
the bomb, i.e., take on risky projects that have big payoffs but high probability of failure.
If the project does fail, bondholders lose, but the shareholders are no worse off since their
claims were worthless anyway. But if the project succeeds, the shareholders will be the
major beneficiaries.”
9
Although the ‘Hail Mary’ pass is commonly though of as an example of this
(Mahar and Paul 2003), or a hockey team pulling the goalie, the last play of the game
doesn’t give the whole picture. To measure if this action is detectable in the game, or if
the overtime structure change the strategy of the game, it will be more valuable to see if
this occurs throughout the fourth quarter of play.
b. Bankruptcy Behavior
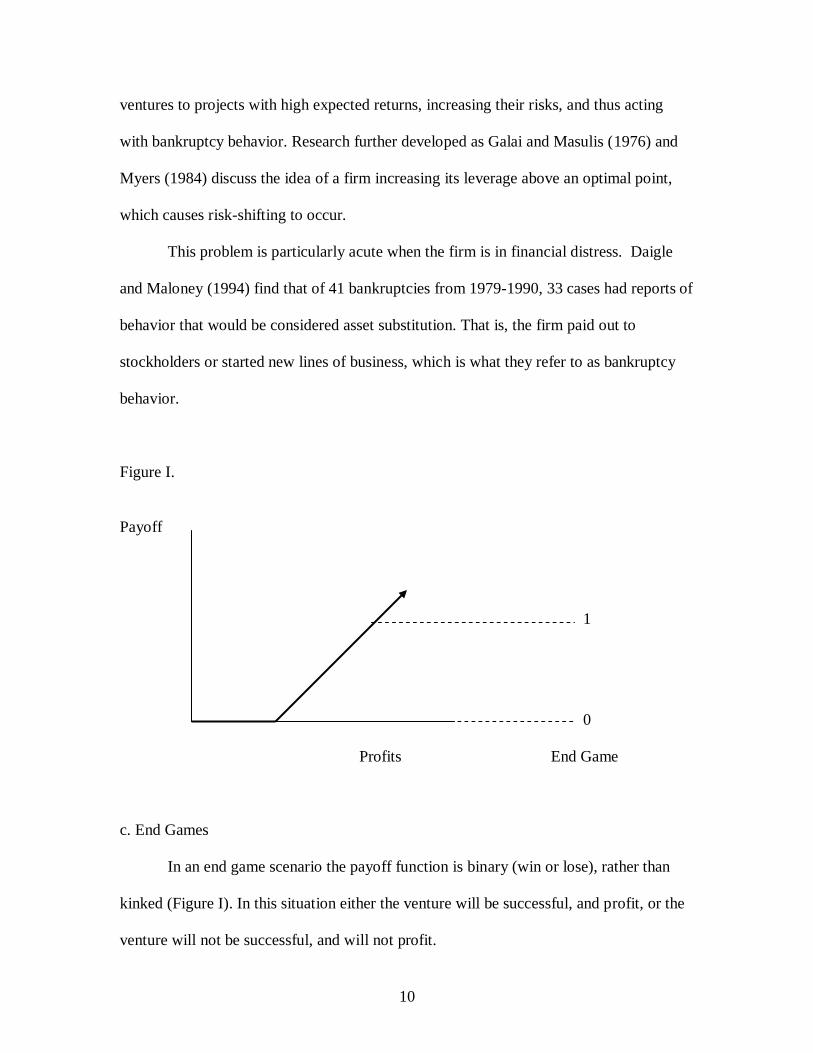
When corporate debt exists, the payoff function for a shareholder is kinked
(Figure I). Any revenue made up to the value of the loan goes directly to the lender.
Under a kinked payoff function an agents’ optimal level of production changes,
depending on their position on the curve and expected value of the company. If a
business begins to fail, and the value of the company falls below the amount owed to the
bank, shareholders’ (and agents’) incentives change. At this point the agent becomes
willing to take on high risk projects in order to make money, ignoring the incentives of
the lender who will have to be paid back if (and only if) the project works.
This situation is nothing new. The fundamental conflict of interest between
shareholders and bondholders has been recognized as early as Adam Smith: in good
times, the shareholders are treated to excess returns, but in bad times the stockholders
lose their investment. It is during these bad times, where the classic example says the
company (shareholders) will want to take on riskier projects than those sanctioned by the
creditors when the debt was issued. However, this is also the time when the shareholders
(to whom the boards’ responsibilities lie) want to make money beyond what they owe
their creditors. Therefore, the company shifts production from current non-money making
10
ventures to projects with high expected returns, increasing their risks, and thus acting
with bankruptcy behavior. Research further developed as Galai and Masulis (1976) and
Myers (1984) discuss the idea of a firm increasing its leverage above an optimal point,
which causes risk-shifting to occur.
This problem is particularly acute when the firm is in financial distress. Daigle
and Maloney (1994) find that of 41 bankruptcies from 1979-1990, 33 cases had reports of
behavior that would be considered asset substitution. That is, the firm paid out to
stockholders or started new lines of business, which is what they refer to as bankruptcy
behavior.
Figure I.
Payoff
1
0
Profits End Game
c. End Games
In an end game scenario the payoff function is binary (win or lose), rather than
kinked (Figure I). In this situation either the venture will be successful, and profit, or the
venture will not be successful, and will not profit.
11
An example of changing strategy as the end game nears can be found during the
end of a politicians’ elected term. At the point in time when they are vying for re-
election, they will change their policies in order to obtain the votes necessary for re-
election. If they use current, or future, tax payer dollars to fund projects that are likely to
get them re-elected, they will be using tax dollars not because they are socially optimal,
but rather because it increases their re-election chances at the cost of the tax payer. In this
situation the strategy of the politician is changed only when there is a chance of
reelection, a politician that cannot be reelected will act differently then on that can. A
form of this has been shown with lame duck offices, in terms of ‘midnight regulations’
(Cochran 2001 and Davies and de Rugy 2008) and with less scrutiny from the agencies
that produce them (McLaughlin 2009). Cochran (2001) says this exists because of the
“’Cinderella constraint.’ Simply put, as the clock runs out on an administration’s term in
office, would-be Cinderellas—including the President, Cabinet officers, and agency heads—
work assiduously to promulgate regulations before they turn back into ordinary citizens at the
stroke of midnight.” Although this has been shown for lame duck offices, a similar idea is
expected to occur during re-election campaigns.
By definition, end games are not the traditional ‘bankruptcy behavior’ because
there is not necessarily a shift of costs to others. However it is possible to still take
increased risks, thus acting as if they have bankruptcy behavior. For this study I will use
the term bankruptcy behavior in this manor, the act of shifting risk, rather than the
technical definition. For football, this will be the measure of teams in different leagues
taking different levels of risk, given their rule structure.
12
IV. Data and Results
The natural measure for the existence of bankruptcy behavior would be to
compare the risky plays used, in the two different leagues, in the last period of play. To
do this, comparing the long plays vs. short plays, measuring the number of turnovers, or
even measuring first downs, would all be great measures for this. However those data are
not available for analysis. For this reason I find a proxy as a measurement of bankruptcy
behavior in the NFL, I use relative variation in scoring. If volatility in scoring is different
in the fourth quarter, relative to the other quarters, this can reveal bankruptcy behavior.
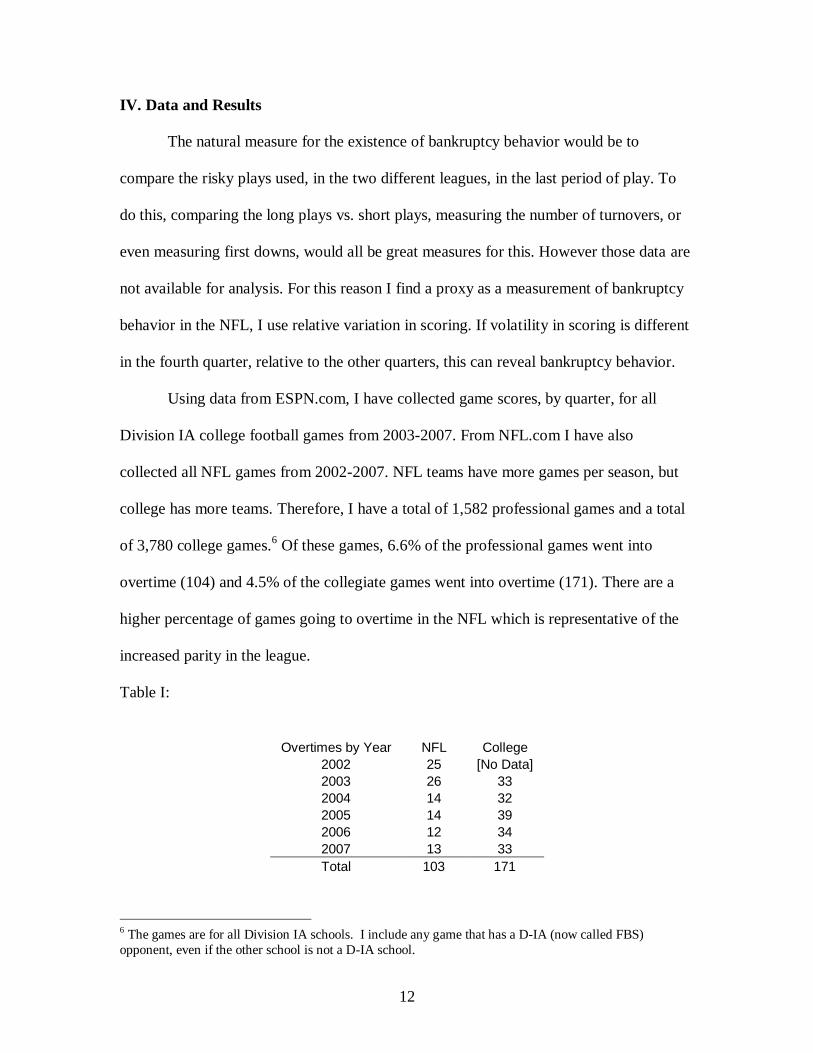
Using data from ESPN.com, I have collected game scores, by quarter, for all
Division IA college football games from 2003-2007. From NFL.com I have also
collected all NFL games from 2002-2007. NFL teams have more games per season, but
college has more teams. Therefore, I have a total of 1,582 professional games and a total
of 3,780 college games.6 Of these games, 6.6% of the professional games went into
overtime (104) and 4.5% of the collegiate games went into overtime (171). There are a
higher percentage of games going to overtime in the NFL which is representative of the
increased parity in the league.
Table I:
Overtimes by Year NFL College
2002 25 [No Data]
2003 26 33
2004 14 32
2005 14 39
2006 12 34
2007 13 33
Total 103 171
6 The games are for all Division IA schools. I include any game that has a D-IA (now called FBS)
opponent, even if the other school is not a D-IA school.
13
Paul Tagliabue, the NFL commissioner, said “There has been a trend in the last
seven or eight seasons that the team winning the toss in overtime wins the game. That
advantage of receiving the ball first is becoming unbalanced.” (New York Times, 2003)
This is also supported by Peterson (2004) who found that from 1974-2003 there were 365
overtime games in the NFL. In 72% of those overtime games, both teams had at least one
possession. When the team won the toss, that team won 52% of the time. 44% of the
teams that lost the toss won the game, with 5% tying. Peterson goes on to point out that
these numbers are missing an important change in the league. In 1994 there was a change
in the kickoff rule; kickoffs were moved back 5 yards to the 30-yard line. Since this rule
change, nearly one third of all games have been won on the opening possession, as
opposed to slightly more than a quarter of the games under the old rule. Peterson says
that it has been confirmed, by Richard E. Hawkins at Pennsylvania State University at
Dubois, that before the rule change the coin flip did not matter, but after the rule change
there is a statistical advantage to those who win the flip.
In my sample, there were 103 overtime games in the NFL; 63 were won by the
team who won the coin flip (61%), and all of which were played after the kickoff rule
change. The data lack information on whether both teams had a possession, but as the
data seems to fall in line with Peterson and Hawkins, I assume that teams do believe that
those who win the toss are more likely to win the game.
Because the NFL faces an overtime outcome that can be determined by something
other than the ability of the players, the coin flip, the team will act with bankruptcy
behavior. To examine if teams in the NFL act with bankruptcy behavior, I compare how
college and NFL teams behave when faced with the possibility of overtime. So the
14
question is: do NFL teams act differently in the fourth quarter than a college football
team, relative to the other quarters of play? To test this I will look at scoring patterns
throughout the game. The fourth quarter of the regular game is the last chance the teams’
decisions have an affect on the game; during this fourth quarter, should it exist,
bankruptcy behavior will be observed.
When looking at bankruptcy behavior, teams will only behave differently when
the game is on the line. For that reason, I will look at only games that are close. I
determined that a game that is within two scores to be close, or a game that is within 14
points after the third quarter.7 When I drop observations that have a point spread of more
than 14 points after three quarters, the NFL has 1187 of the 1582 games left (or 75%) and
college has 2127 of the 3780 games left (or 56%).8
To test this bankruptcy behavior I will use two different tests (and a robustness
check):
Tests:
a. Consistent Scoring
b. Regressed on Each Quarter
c. Robustness Test
7 All the regressions have been done for 3, 7, 8, 10, and 16 points. The results are consistent. 8 This is also an example of increased parity in professional football relative to college football.
15
a. Consistent Scoring:
The first test is to look at the consistency of scoring throughout the game.
Because we have limited our sample to only games that have close scores after three
quarters, the ability of the teams to score should, on average, be consistent throughout the
game. If this is the case, the ability to score in the first quarter will be correlated with the
ability to score in the second quarter. If this is true the ability to score will occur
consistently throughout the game and if it deviates from this in the fourth quarter would
reveal a team that is acting with bankruptcy behavior. Specifically I want to know if there
is something different about the scoring in the fourth quarter relative to the other quarters
of play.
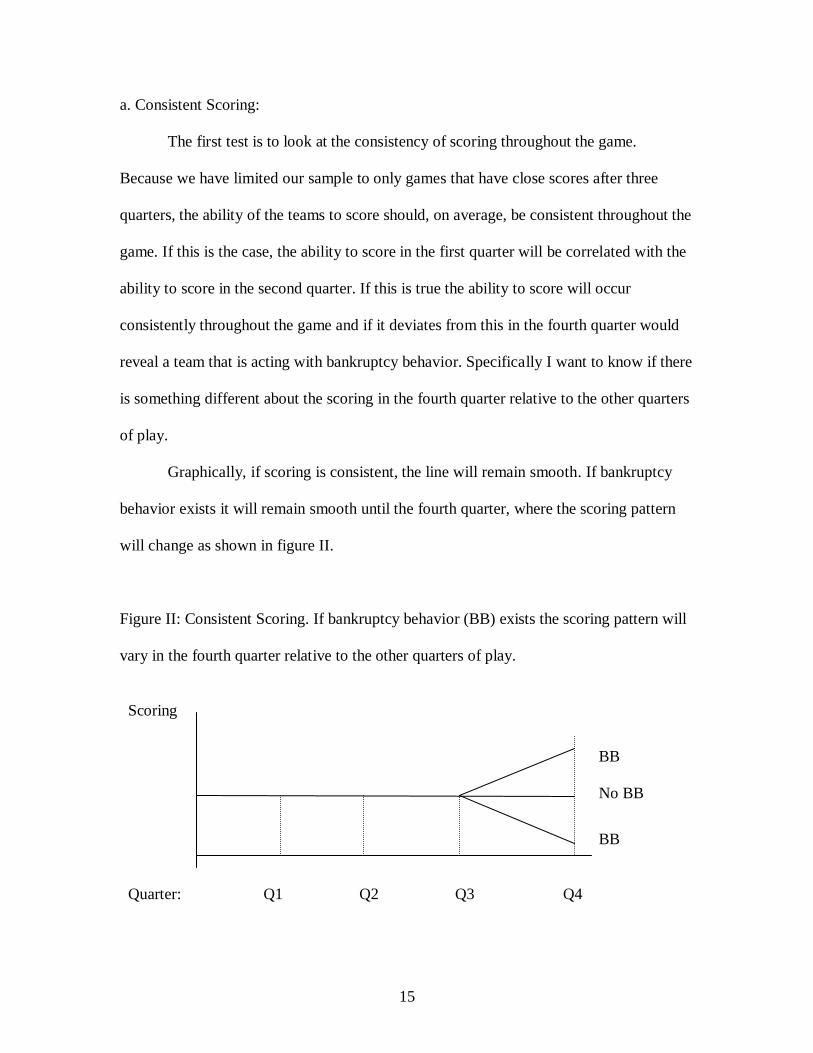
Graphically, if scoring is consistent, the line will remain smooth. If bankruptcy
behavior exists it will remain smooth until the fourth quarter, where the scoring pattern
will change as shown in figure II.
Figure II: Consistent Scoring. If bankruptcy behavior (BB) exists the scoring pattern will
vary in the fourth quarter relative to the other quarters of play.
Scoring
BB
No BB
BB
Quarter: Q1 Q2 Q3 Q4
16
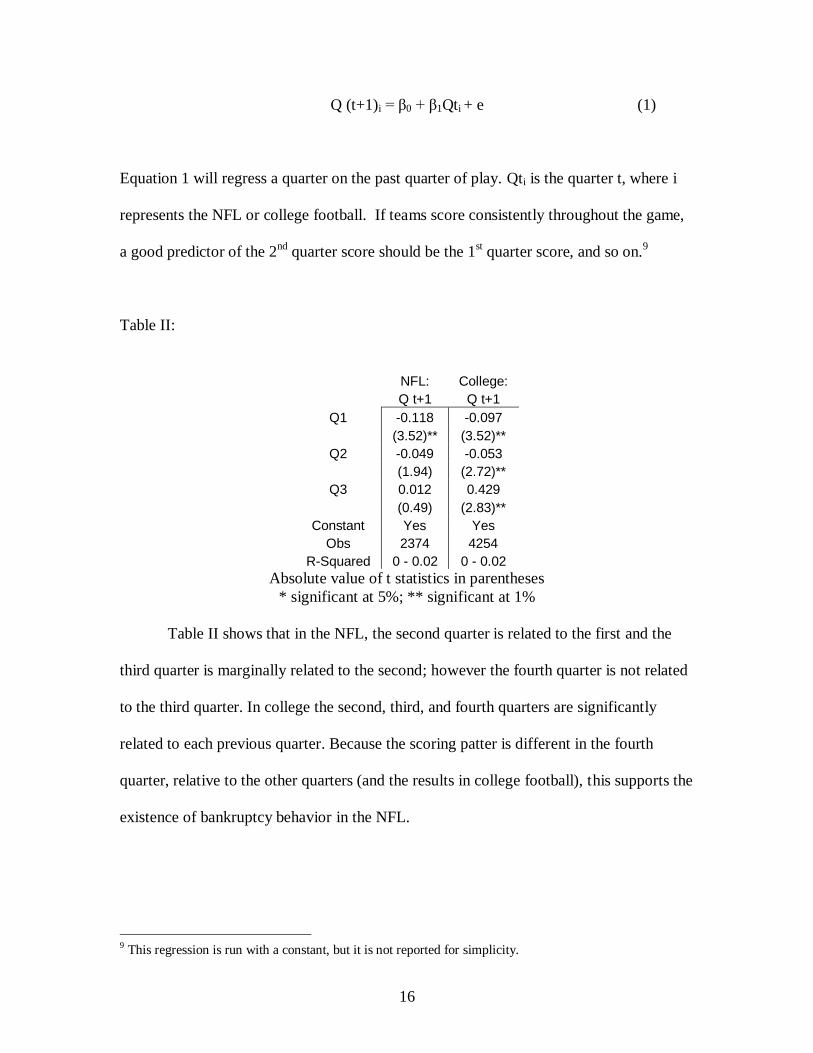
Q (t+1)i = β0 + β1Qti + e (1)
Equation 1 will regress a quarter on the past quarter of play. Qti is the quarter t, where i
represents the NFL or college football. If teams score consistently throughout the game,
a good predictor of the 2nd
quarter score should be the 1st quarter score, and so on.
9
Table II:
NFL: College:
Q t+1 Q t+1
Q1 -0.118 -0.097
(3.52)** (3.52)**
Q2 -0.049 -0.053
(1.94) (2.72)**
Q3 0.012 0.429
(0.49) (2.83)**
Constant Yes Yes
Obs 2374 4254
R-Squared 0 - 0.02 0 - 0.02
Absolute value of t statistics in parentheses
* significant at 5%; ** significant at 1%
Table II shows that in the NFL, the second quarter is related to the first and the
third quarter is marginally related to the second; however the fourth quarter is not related
to the third quarter. In college the second, third, and fourth quarters are significantly
related to each previous quarter. Because the scoring patter is different in the fourth
quarter, relative to the other quarters (and the results in college football), this supports the
existence of bankruptcy behavior in the NFL.
9 This regression is run with a constant, but it is not reported for simplicity.
17
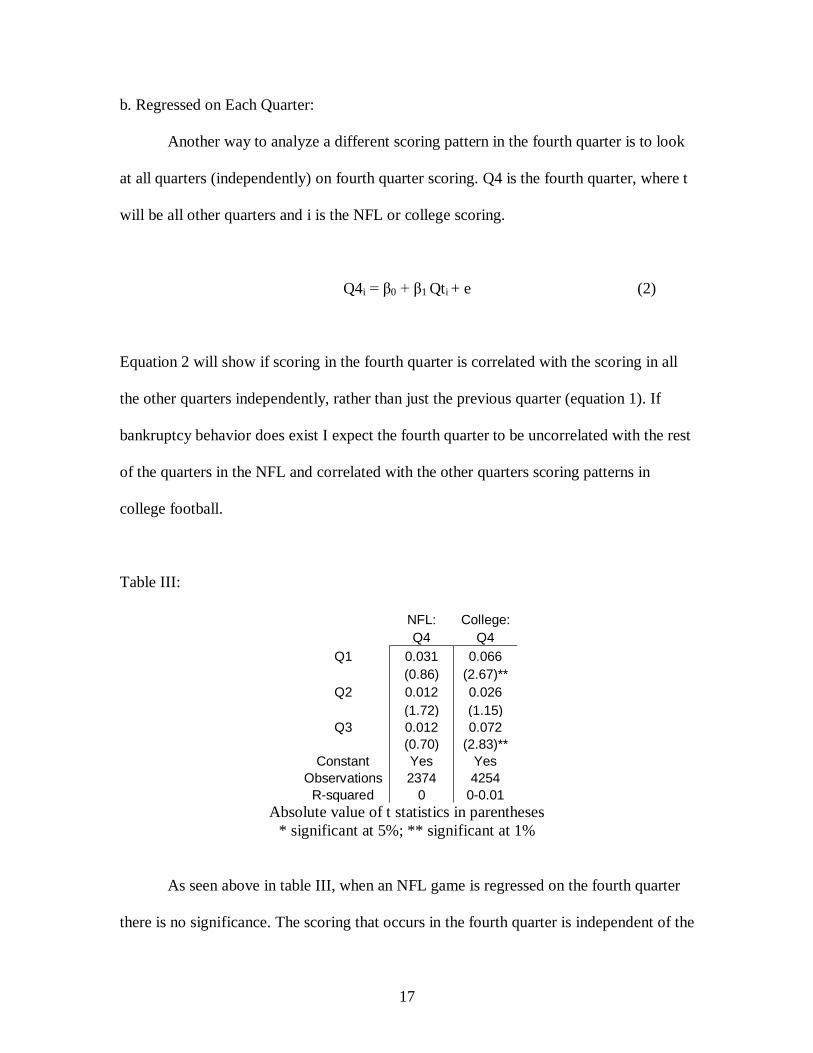
b. Regressed on Each Quarter:
Another way to analyze a different scoring pattern in the fourth quarter is to look
at all quarters (independently) on fourth quarter scoring. Q4 is the fourth quarter, where t
will be all other quarters and i is the NFL or college scoring.
Q4i = β0 + β1 Qti + e (2)
Equation 2 will show if scoring in the fourth quarter is correlated with the scoring in all
the other quarters independently, rather than just the previous quarter (equation 1). If
bankruptcy behavior does exist I expect the fourth quarter to be uncorrelated with the rest
of the quarters in the NFL and correlated with the other quarters scoring patterns in
college football.
Table III:
NFL: College:
Q4 Q4
Q1 0.031 0.066
(0.86) (2.67)**
Q2 0.012 0.026
(1.72) (1.15)
Q3 0.012 0.072
(0.70) (2.83)**
Constant Yes Yes
Observations 2374 4254
R-squared 0 0-0.01
Absolute value of t statistics in parentheses
* significant at 5%; ** significant at 1%
As seen above in table III, when an NFL game is regressed on the fourth quarter
there is no significance. The scoring that occurs in the fourth quarter is independent of the
18
other quarters played for the NFL. In college football data, the fourth quarter is
significantly related to the first and third quarters. Because the fourth quarter is related to
the other quarters in college football, but not in the NFL, this also supports bankruptcy
behavior in the NFL.
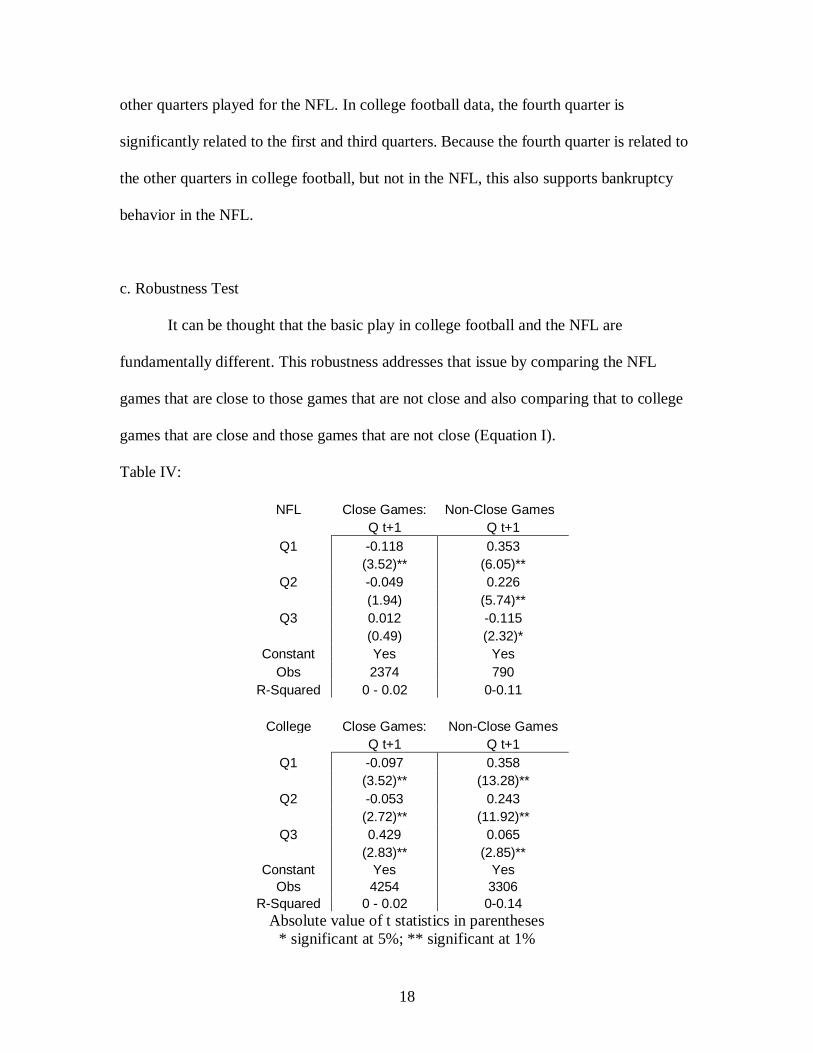
c. Robustness Test
It can be thought that the basic play in college football and the NFL are
fundamentally different. This robustness addresses that issue by comparing the NFL
games that are close to those games that are not close and also comparing that to college
games that are close and those games that are not close (Equation I).
Table IV:
NFL Close Games: Non-Close Games
Q t+1 Q t+1
Q1 -0.118 0.353
(3.52)** (6.05)**
Q2 -0.049 0.226
(1.94) (5.74)**
Q3 0.012 -0.115
(0.49) (2.32)*
Constant Yes Yes
Obs 2374 790
R-Squared 0 - 0.02 0-0.11
College Close Games: Non-Close Games
Q t+1 Q t+1
Q1 -0.097 0.358
(3.52)** (13.28)**
Q2 -0.053 0.243
(2.72)** (11.92)**
Q3 0.429 0.065
(2.83)** (2.85)**
Constant Yes Yes
Obs 4254 3306
R-Squared 0 - 0.02 0-0.14
Absolute value of t statistics in parentheses
* significant at 5%; ** significant at 1%
19
Table IV strengthens the finding of bankruptcy behavior in the NFL. NFL teams
that are not close in the fourth quarter show a correlation between all quarters, which
does not exist in close games. In addition to that, I find that college games that are close
give significant correlation, which is the same as non-close college games.
V. Conclusion
Bankruptcy behavior occurs in business when the person in charge tries to make a
last ditch effort to make money. They take on high risk/high reward projects, which they
might not normally take, because they believe they have no other option to obtain a
positive outcome.
High risk/high reward behavior can also happen in football. In the National
Football League the team that scores first in overtime wins. However, in college, when a
game goes to overtime each team gets a chance to score and the winner is whoever scores
more points, given equal attempts for each team. Because of this rule difference
unintended consequences can occur; more specifically NFL teams act differently than
college teams when overtime is likely. NFL teams will take on risky plays, or act with
bankruptcy behavior.
Using data of scoring by quarter for both college and NFL games that were close
in the fourth quarter, I find evidence that bankruptcy behavior exists in the NFL. Looking
at scoring variation by quarters, it is noticeable that the scoring pattern in the fourth
quarter is different in the NFL and not in college football. Finding strong results, with
both tests and the robustness check, support the hypothesis I conclude that NFL teams act
20
with bankruptcy behavior in close games. This is interesting in light of the fact that the
NFL believes their overtime structure has no adverse affects on the game, although I am
in no way implying that this has a positive or negative affect.
21
VI. WORKS CITED
Abrevaya, Jason. 2004, Fit to be Tied: The Incentive Effects of Overtime Rules in
Professional Hockey Journal of Sports Economics, Vol 5, 292-306
Che, Yeon-Koo and Terrence Hendershott. 2008, How to divide the possession of a football?
Economics Letters 99, 561-565
Cochran, Jay. 2001, The Cinderella Constraint: Why Regulations Increase Significantly during
Post-Election Quarters. Working Paper, Mercatus Center at George Mason University.
Daigle, Katherine and Michael Maloney. 1994. Residual Claim in Bankruptcy: An Agency
Theory Explanation Journal of Law & Economics, April.
Davies, Antony and Veronique de Rugy. 2008, Midnight Regulations: An Update. Working Paper
No. 08-06, Mercatus Center at George Mason University.
Easton, S., & Rockerbie, D. (2005). Overtime!: Rules and incentives in the National
Hockey League. Journal of Sports Economics, Vol6, 178-202.
Fort, Rodney and James Quirk. 2009, Optimal Competitive Balance in a Season Ticket
League Working Paper http://www.rodneyfort.com/Academic/CurrentEfforts/
Forthcoming/FortQuirkEI.pdf
Galai, Dan, and Ronald W. Masulis. 1976, The option pricing model and the risk factor of stock,
Journal of Financial Economics 3, 53-81.
Longley, Neil and Swaminathan Sankaran.2007, The Incentive Effects of Overtime Rules
in Professional Hockey Journal of Sports Economics Vol. 8 No. 5, 546-554
Mahar, James Jr. and Rodney Paul. 2003, Using Football to Teach Finance, (March 2008) St.
Bonaventure University. http://www.westga.edu/~bquest/2003/football.htm
McLaughlin, Patrick. 2009, Empirical Tests for Midnight Regulations and Their Effect on OIRA
Review Time. Working Paper, Mercatus Center at George Mason University.
Myers, Stewart C. 1984, Determinants of Corporate Borrowing The Modern Theory of Corporate
Finance. Edited by Michael C. Jensen and Clifford W. Smith, Jr. New York, NY:
McGraw-Hill Book Co.
N.F.L. Ponders Changing How Overtime Is Played. New York Times, 2003 Janurary 25, Section
D, Page 5.
Peterson, Ivan. 2004, ‘Football’s Overtime Bias’, Math Trek: (March 2008)
www.sciencenews.org/articles/20041106/mathtrek.asp
Poulsen, Annette. 2008,Corporate Debt. Liberty Fund. Concise Encyclopedia of Economics. (June
2008) http://www.econlib.org/library/Enc/CorporateDebt.html
22
Romer, David. 2006, Do Firms Maximize? Evidence from Professional Football Journal of
Political Economy. April
Rosen, Peter A. and Wilson, Rick L. (2007) "An Analysis of the Defense First Strategy in
College Football Overtime Games," Journal of Quantitative Analysis in Sports:
Vol. 3, Is. 2, Article 1.
Shmanske, Stephen and Franklin Lowenthal. 2007, Overtime Incentives in the National
Hockey League (NHL) Journal of Sports Economics, Vol. 8 No. 4, 435-442
Should the Outcome of a Coin Flip Mean So Much in NFL Overtime? Wall Street Journal
Online, 2003. December 22
Szymanski, Stefan. 2009, Competitive balance in sports leagues and the paradox of
power Working Paper http://ideas.repec.org/p/spe/wpaper/0618.html
“The Great Overtime Debate” 2009, Showtime Sports http://sports.sho.com/infl/great-
overtime-debate.html