banks in turkey banks in turkey 2010 2010 · 'banks in turkey 2010' provides general...
TRANSCRIPT

MAY 2011
MA
Y 2
011
The Banks Assoc›at›on
of Turkey
Nispetiye CaddesiAkmerkez B3 Blok Kat 13
Etiler 34340 Istanbul - TurkeyTel: +90 212 282 09 73Fax: +90 212 282 09 46E-mail: [email protected]
www.tbb.org.tr
BA
NK
S IN
TU
RK
EY
201
0B
AN
KS
IN T
UR
KE
Y 2
010
20102010BANKS IN TURKEYBANKS IN TURKEY

MAY 2011
Publication No: 277
BANKS IN TURKEY2010
ISSN 1300 - 6460 (printed)ISSN 1308 - 3678 (online)ISBN 978-975-8564-94-1 (printed)ISBN 978-975-8564-95-8 (online)
Copyright © The Banks Association of Turkey, 2011
Publication Name : Banks in TurkeyPublication Type : Local PeriodicalPublication Period : AnnualOwner of the Publication : The Banks Association of TurkeyManaging Director : Dr. Ekrem KeskinAddress : Nispetiye Cad. Akmerkez, B3 Blok Kat 13, Etiler, 34340 stanbulPhone : +90-212-282 09 73Fax : +90-212-282 09 46E-mail : [email protected] : www.tbb.org.tr/eng
Printed in : Paragraf Basım Sanayi A. .Address : Yüzyıl Mah. Matbaacılar Sitesi, 2.Cad. No 202/A, Ba cılar, 34560 stanbulPhone : +90-212-629 06 07-10Fax : +90- 212-629 03 85
Certificate No: 17188
2011.34.Y.8564.277
All rights reserved. No part of this report may be reproduced or transmitted, in any form or by any means, electronic, photocopying or otherwise, without the prior written permission of the Banks Association of Turkey.
Whilst every effort has been made to ensure that the information contained in this book is correct, the Banks Association of Turkey can not accept any responsibility for any errors or omissions or for any consequences resulting therefrom.
This book is prepared from the year-end audited and non-consolidated "The Common Data Set" of deposit banks and development and investment banks, that are prepared according to related Communique -Financial Statements and Related Explanation and Footnotes of the banks that is disclosed to the Public-

Contents
Page No.
Preface………………………………..….………………………………………………………… v
Main Economic Indicators………...………………………………….……………............... vi
Turkish Economy and Banking System in 2010…………………………...……………… I-1
General Outlook….……………………………….………………………………………..... I-1Turkish Economy in 2010………..……….…………..………............................ I-7Banking System in Turkey in 2010 …………………………………………...…………... I-29
The Banks Association of Turkey andBanks Operating in Turkey…………………………………..…………………………......... II-1
The Banking System in Turkey……………………………..………………..……………… II-9
Deposit Banks..…………………………………...……........………………….....………... II-14
State-owned Banks..……...……………...................……....…………………………… II-18 Privately-owned Banks...........…….....…...…….......……............…………………… II-22 Banks Under the Deposit Insurance Fund...........………….....………….................. II-26 Foreign Banks……………………………………...………..…........……..................... II-30
Development and Investment Banks………………….…………………………………… II-34
i

Page No.
Balance Sheets of the Banks………..……………………………….…………….……....... II-39
Deposit Banks.....................…………………….....…........................…...…….............. II-41
State-owned Banks…………………..........……..………………................................ II-43Türkiye Cumhuriyeti Ziraat Bankası A. .……………………………….………… II-44Türkiye Halk Bankası A. ……………………………………………..…………… II-48Türkiye Vakıflar Bankası T.A.O…………………………………………..……… II-52
Privately-owned Banks……………………..…………………………………………...… II-57
Adabank A. …………………………………………..…………………………… II-58Akbank T.A. ………………………………………………………………………. II-62
Alternatif Bank A. …………………………………...……..……………………… II-66Anadolubank A. ………………………………………...…...…...……………… II-70
ekerbank T.A. .…………………………………………………………………… II-74Tekstil Bankası A. .………………………………………………………………… II-78Turkish Bank A. .………………………………….……..………………………… II-82Türk Ekonomi Bankası A. .……………………………………………………… II-86Türkiye Garanti Bankası A. .……………………………………………………… II-90
Türkiye Bankası A. .…………………………………………………………… II-94Yapı ve Kredi Bankası A. ………………………………………………………… II-98
Banks Under the Deposit Insurance Fund...........…….....………............................. II-103
Birle ik Fon Bankası A. …………………………………………………………… II-104
Foreign Banks………………………………………………………..…....................... II-109Arap Türk Bankası A. ……………………………………………….…………… II-110Bank Mellat……………………………………..……………………….…………. II-114Citibank A. .. …………………………………...…………………....…………... II-118Denizbank A. ……………………………………...……………………………… II-122Deutsche Bank A. .………………………………………...……………………… II-126Eurobank Tekfen A. ……………………………………………………………… II-130Finans Bank A. …………………………………………………………………… II-134Fortis Bank A. ……………………………………………………………………… II-138Habib Bank Limited……………………………………….………………………… II-142HSBC Bank A. .……………………………………………..…………………… II-146ING Bank A. .......…….………………………...………………………………… II-150JPMorgan Chase Bank N.A.…….………………………...……………………… II-154Millenium Bank A. ..…………………………………………..…………………… II-158Sociéte Générale (SA)……………………………………...……………………… II-162The Royal Bank of Scotland N.V……………………………………..…………… II-166Turkland Bank A. .…………………………...…………………………………… II-170WestLB AG……………………..………………………………...………………… II-174
Development and Investment Banks…….………………………………………...…....... II-179Aktif Yatırım Bankası A. ..………………………………………...……………… II-180BankPozitif Kredi ve Kalkınma Bankası A. .…………………………………… II-184
ii

Page No.Development and Investment Banks continued…
Credit Agricole Yatırım Bankası Türk A. ..………………...…………………… II-188Diler Yatırım Bankası A. ………………………………………….……………… II-192GSD Yatırım Bankası A. ……………………………………...………………… II-196ller Bankası A. .…………………………………………….…….…………....… II-200MKB Takas ve Saklama Bankası A. .…………………..……………………… II-204
Merrill Lynch Yatırım Bank A. ....................................................................... II-208Nurol Yatırım Bankası A. ………………………………………………...……… II-212Taib Yatırımbank A. .………………………………………...…………………… II-216Türk Eximbank…………………………………………………...………………... II-220Türkiye Kalkınma Bankası A. .…………………………………..……………… II-224Türkiye Sınai Kalkınma Bankası A. .…………………..………………………… II-228
Appendix………......…...................................................................................................... II-233
Table 1 Turkish Banks - Ranked by Total Assets, as of December 31, 2010............. II-234Table 2 Number of Branches and Employees by the Banks and Groups,
as of December 31, 2010……………………………………………………........ II-236Table 3 Presentation of Assets and Liabilities According to their
Outstanding Maturities, as of December 31, 2010…………………..………… II-238Table 4 Interest Rate Sensitivity of Assets, Liabilities and Off Balance-Sheet
Items based on repricing dates, as of December 31, 2010………...………… II-239Table 5 Information on Currency Risk, as of December 31, 2010…………….………… II-240Table 6 Saving Deposits, as of December 31, 2010…………………………….…….... II-241Table 7 Number of Deposit Accounts, as of December 31, 2010……………...…….... II-242Table 8 Maturity Structure of Deposits, as of December 31, 2010…………................ II-244Table 9 Classification of Deposits, as of December 31, 2010……………...……......... II-246Table 10 Number of Deposit Accounts by Geographical Regions and Provinces,
as of December 31, 2010………………………………………………………… II-248Table 11 Deposits by Geographical Regions and Provinces,
as of December 31, 2010………………………….…………………………....... II-251Table 12 Loans by Geographical Regions and Provinces, as of December 31, 2010… II-254Table 13 Classification of Cash Loans, as of December 31, 2010……………...…….... II-257Table 14 Sector Concentrations for Cash Loans, as of December 31, 2010…………… II-259Table 15 Sectoral Risk Concentrations of Non-Cash Loans,
as of December 31, 2010………………………….…………………………....... II-260Table 16 Share in Group and Share in Sector, as of December 31, 2010................... II-261Table 17 Bank Employees by Sex and Education, as of December 31, 2010…........... II-262Table 18 Bank Employees by Geographical Regions and Provinces,
as of December 31, 2010………………………….…………………………....... II-264Table 19 Number of ATM, POS and by Geographical Regions and Provinces,
as of December 31, 2010………………………….…………………………....... II-265Table 20 Equity Participations and Affiliated Companies of Turkish Banks
Abroad, as of December 31, 2010……………………………………………… II-266Table 21 Branches and Representative Offices of Turkish Banks Abroad,
as of December 31, 2010………………………………………………………… II-270Table 22 Representative Offices in Turkey, as of December 31, 2010………..………… II-273
Glossary….....................................………………............................................................. II-274
iii

Preface
'Banks in Turkey 2010' provides general information about deposit banks and development and investment banks operating in Turkey as well as their audited financial tables which are prepared according to the related Communique-Financial statements and related explanation and footnotes of the banks that is disclosed to the Public-. This book also offers an overall evaluation of the performance of the Turkish economy and the banking system in 2010.
In addition, more details and tables that are prepared according to the related Communique, in terms of banks or groups, can be found in the web site of the Association (www.tbb.org.tr).
It is hoped that this publication will be useful for those who are interested.
The Banks Association of Turkey
v

The Turkish EconomyMain Economic Indicators
Unit 2007 2008 2009 2010 2011*Growth
...
...
...
%
Agriculture 9 7 8 8 ... Industry 24 20 15 16 ... Services 67 73 77 76 ...
GDP USD billion 659 742 617 736 ...GDP TL billion 856 951 953 1105 ...
...Income per capita In USD terms 9,333 10,436 8,590 10,079 ...
Source-use As % of GDP
Fixed-capital outlays 22 20 17 19 19
Public 4 4 4 4 4
Private 18 16 13 15 15
Total savings % 16 17 15 13 14
Public 3 2 1 1 1
Private 13 15 14 12 13
Savings gap -6 -5 -2 -7 -5
Public -2 -3 -5 -4 -3
Private -4 -3 3 -3 -2
Total consumption 87 88 89 88 86
Public 14 14 14 14 11
Private 73 74 75 74 75
GDP deflator % 8 12 5 6 ...
Unemployment
Overall % 11 14 14 11 ...Urban 12 15 16 14 ...Rural 8 11 9 7 ...
Inflation %
Producer 6 8 6 6 ...
Public sector balance, as % of GDP %
PSBR (excluding privatization) -1 -2 -6 -4 -3
PSBR (including privatization) 0 -2 -5 -3 -2
PSBR (exc. Interest pay. and privatization) 5 3 0 1 1
Budget deficit -2 -2 -6 -4 -3
Budget deficit (excluding interest payments) 6 4 1 1 2
SEEs 0 0 0 0 0
Public administrations 0 -1 0 0 0
Funds 1 0 0 0 0
Other 1 1 1 0 0
Central Government budget** TL billion
Revenues 190 210 215 237 279
Expenditures 204 227 268 287 313
Interest expenditures 49 51 53 57 48
Budget deficit -14 -19 -49 -39 -34
Primary balance 35 33 1 7 14
Financing 13 19 49 39 ...
External borrowing -3 4 3 8 ... G-bonds 12 6 51 23 ... Short-term financing -3 8 0 0 ... T-bills -3 8 0 0 ... Other 7 1 -5 8 ...
** Forecast for 2011.
i
Sectoral breakdown (at current prices)
(Twelve month chg)
* Programme target
vi

Unit 2007 2008 2009 2010 2011* Selected Budget Ratios %
Revenue/GDP 22 22 23 21 ... Expenditure/GDP 24 24 28 26 ... Personnel expenditure/GDP 5 5 6 6 ... Interest expenditure/GDP 6 5 6 5 ... Investment/GDP 2 2 3 2 ...
Personnel expenditure/total expenditure 21 21 21 21 ... Interest expenditure/total expenditure 24 26 20 20 ... Investment/total expenditure 6 6 9 8 ...
Outstanding domestic debt TL billion
G-bonds 249 261 316 343 ... T-bills 6 14 14 10 ... Total Government securities 255 275 330 353 ... Devaluation account 0 0 0 0 ... Total 255 275 330 353 ...
Outstanding Domestic G. securities/GDP % 30 29 35 32 ... Outstanding debt/GDP 41 38 47 43 ...
Interest rates %
(Annual,compound, average)
O/n (CB) 17 16 7 2 ... G-Securities 17 19 9 9 ...G-securities maturity (day) 999 806 1,100 1,314 ...
Exchange rates
...
... Euro (year-end) 1.7060 2.1435 2.1427 2.0551 ...
CB Balance Sheet TL billion
Total balance sheet 106 113 110 128 ...As % of GDP % 11 12 12 12 ...
51 70 72 85 ...Net domestic assets -6 -15 -8 -9 ... Lending to Government 17 14 9 8 ...Reserve money 45 56 65 76 ...CB money 55 54 51 71 ...Fx position USD billion 33 37 36 51 ...Fx reserves USD billion 71 70 71 81 ...
Monetary aggregates
M1** TL billion 78 83 107 134 ...M2*** 345 434 494 588 ...M3**** 370 458 521 615 ...
4 3 4 4 ...Investment Funds (F) 21 21 23 24 ...G-securities held by non banks (D) 68 74 76 68 ...Loans 286 368 393 526 ...
M3RF 395 475 548 643 ...M3RFD 463 549 624 711 ...
M1/GDP % 8 9 11 12 ...M3/GDP % 39 48 55 56 ...Loans/GDP % 30 39 41 48 ...
**Money in circulation+demand deposit (Fx included)
*** M1+time deposit (Fx included)
(Twelve month chg)
(Twelve month chg)
Net fx assets
Repos (R)
* Programme target
**** M2+repos+investment funds)
vii

Unit 2007 2008 2009 2010 2011*Financial assets TL billion
Monetary assets 345 439 498 594 ... TL 234 304 350 438 ... FX 111 135 148 156 ...Securities 589 471 697 847 ... Shares 334 181 351 473 ... Bonds and Bills 255 276 331 359 ... Government 249 275 330 353 ... Private 6 1 1 6 ...Investment Funds 21 14 16 16 ...Total 955 896 1.195 1.441 ...
Foreign trade USD billion
Exports 107 132 102 114 ... Imports 170 202 141 185 ... Trade deficit 63 70 39 71 ...
Foreign trade as of GDP %
Exports 16 18 17 15 ... Imports 26 27 23 25 ... Trade deficit 10 9 6 10 ...
Balance of payments USD billion
Trade balance -47 -53 -25 -56 ...Invisible balance 9 11 11 7 ...Current account balance -38 -42 -14 -49 ...
Current account balance/GDP % -6 -6 -2 -7 ...
Capital movements USD billion 49 34 9 45 ... Foreign direct investment 20 16 7 7 ... Portfolio investment 1 -5 0 16 ...
2 6 5 4 ...Change in reserves -8 1 0 -13 ...
USD billion
CB reserves 71 70 71 81 ...Commercial banks 44 ... ... ... ...Total 115 ... ... ... ...
Outstanding external debt USD million
Total 249 278 269 290 ...Long-term capital 206 227 219 212 ... Government 71 75 80 85 ... Central Bank 14 12 12 10 ... Private sector 121 140 128 117 ...
79 99 92 83 ...42 41 35 34 ...
Short term 43 50 50 79 ... Government 2 3 4 4 ... Central Bank 2 2 2 2 ... Private sector 39 45 45 73 ...
23 24 22 24 ...16 21 23 49 ...
Istanbul Stock Exchange
Number of companies traded 292 318 325 350 ... ISE index In USD terms 2,790 1,020 2,068 2.500 ... Daily trading volume USD million 1,166 1,041 1,225 1,703 ... Total trading volume USD billion 291 252 299 387 ...
USD billion 288 119 236 308 ... Market P/E 12 6 17 13 ...
Net errors and ommissions
International fx reserves
Non-financials
Financials
Non-financials
Financials
Market capitilization
* Programme targetviii

I-1

Banks in Turkey 2010
I. Turkish Economy and Banking System in 2010
1. General Outlook
1.1. Global Economy Recovered Rapidly As Developing Countries Grew Faster
The world economy entered into a rapid recovery period due to the intensive efforts of countries and international organizations to restrict the contractionary pressure of global crisis on economic activities and to capture the growth process again. The global economy was estimated to grow by 4.8 percent in 2010 following the downsizing of 0.6 percent in 2009. In addition to expansionary monetary policies concerning additional liquidity support and/or capital support to the financial sector to make the financial sector functional again, expansionary fiscal policies leading to the domestic demand increase were also effective in supporting the economic recovery particularly in the developed countries. On the other hand, developing countries continued their growth at a higher rate. International trade volume regained momentum upwards.
According to the forecasts of the International Monetary Fund, the growth rate was recorded as 2.7 percent in the developed countries and 7.1 percent in the developing countries. Due to the low level of inflation rate and contributions of the positive trends in commodity and basic energy prices, the central banks of many countries lowered their policy interest rates to the lowest levels of the near past, and real interest rates remained close to or even below zero.
The low level of real interest rates ensured the relieving, even partially, of the pressure caused by the rapidly growing debt service coverage ratio in these countries. Despite this fact, due to the rapidly growing budget deficits and the supports provided to the financial sector the ratio of debt stock to national income in many developed countries rose and reached to high levels. This ratio was recorded as 90 percent in the developed countries, while it was around 40 percent in the developing countries.
In order to assure the coordination of policies with a view to re-establishing the long-term stability by reducing the global imbalances, G20 group, comprised of twenty developed and developing countries from various different regions of the world, together with international organizations, actively made efforts for resolution of the problems. G20 on one hand expresses opinions and brings forward proposals about resolution of budget deficits and debt stock problems growing in the developed countries and of current deficit and increasing inflationary pressures caused by rapid growth in the developing countries, and on the other hand initiated works for better regulations and supervision structure in financial sector.
Within this framework, approaches relating to capital adequacy, risk management, liquidity, supervision were handled with the intention of improving efficiency in supervision of financial institutions. However, due to the diversity of views between the countries, a mutual agreement could not be reached on “an internationally accepted joint text” in short-term. This in turn continued to create an ambiguity in creation of business plans and in expectations in the financial sector. Furthermore, various risks faced in economy and particularly, some international-scale serious problems emerging in financial sectors in some EU member states delayed the recovery of credit markets in the developed countries. On the other hand, credit market further grew in the developing countries. International capital inflow to these countries began to rise, due to their high growth potential, better balance of savings, low level of public
I-1
Turkish Economy and Banking System in 2010
balance and debts, low inflationary pressure, and less problems in their financial sectors.
1.2. Turkish Economy Rapidly Recovered and Financial Sector Supported Economic Growth
In 2010, the Turkish economy showed a performance even beyond expectations in terms of growth, inflation and public balance. The growth rate realized as 8.9 percent.
Rapid rise in the household consumptions and private sector fixed capital investments supported the national growth through domestic demand expansion, while the increase in foreign demand remained at a limited level depending on the slow growth of developed countries as well.
Savings ratio continued to fall, while savings deficit grew up. The ratio of savings to gross domestic product (gdp) fell to 12.6 percent which was the lowest level of the recent thirty years. The ratio of savings deficit to gross domestic product doubled approximately to around 6.6 percent. In the public sector, the ratio of savings deficit to gross domestic product reduced, and in the private sector, the savings surplus turned to savings deficit.
Beside the technology innovation and capacity increase investments, the fixed capital investments made in the energy sector resulted in the change of savings balance in the private sector. The household consumptions and the private sector fixed capital investments increased by 8.4 percent and 50 percent in constant prices, respectively.
Unemployment rate declined due to the economic recovery. Unemployment rate fell from 13.5 percent in December 2009 to 11.4 percent in December 2010.
Due to the positive effects of the growth based on strong domestic demand increase and appreciation of TL in parallel with strong capital inflows, the imports rapidly rose, and the current account deficit expanded. Foreign trade volume grew by 23 percent, exports by 12 percent, and imports by 11 percent. The ratio of foreign trade volume to gross domestic product realized as 41 percent.
Net international capital inflow rose from USD 9 billion in 2009 to USD 45 billion in 2010. During the same period, the foreign exchange reserves of the Central Bank increased by USD 11.2 billion.
Due to the Bank’s strong balance sheet structure, and rise in demand for TL, and fall in the debt service coverage ratio of the public sector, and the improvement in inflation expectations, the Central Bank continued to supply TL liquidity to the banking sector through open market operations throughout the year. Despite this, net domestic assets declined.
Inflation expectation was generally close to the inflation target. Consumer inflation realized as 6.4 percent, which was the lowest level after the high inflation period, and thus remained below the inflation target of 6.5 percent.
The Central Bank lowered the policy interest rates by 1.5 percentage points in 2010. With the intention of limiting the negative effects of the global crisis on growth and financial sector, the support given to markets throughout 2009 was started to be withdrawn as of the second quarter of 2010. Within the framework of acceleration in growth rate, capital inflows and loan supply, and on the ground that the markets were
I-2

Banks in Turkey 2010
normalized, a road map named “exit strategy” aiming at monetary tightening was declared. (See Section 1.3)
The rapid recovery in economy further supported the realization of fiscal policy targets in parallel with the forecasts. The ratio of budget deficit to gross domestic product was forecasted to fall by 1.5 percentage points to 4 percent. Accordingly, the ratio of primary balance to gross domestic product recorded a surplus of 0.5 percentage points.
Budget performance made a significant contribution to the fall in the ratio of public sector borrowing requirement to gross domestic product. As a matter of fact, this ratio was estimated to decline from 5.1 percent to 3.4 percent.
Debt service coverage ratio in the domestic borrowing of public sector reduced by 16 percentage points to around 90 percent. Thus, the ratio of outstanding domestic debt to gross domestic product decreased from 35 percent to 32 percent. As a result, the average cost of domestic borrowing realized as 7.6 percent, and its maturity was 1,314 days.
The ratio of public sector outstanding debt to gross domestic product decreased from 47 percent to 43 percent.
The ratio of outstanding domestic debt to broadly defined money supply (deposits, currency in circulation, repurchase agreements and investment mutual funds, M2YRF) decreased from 64 percent to 58 percent, w its ratio to total assets of banks was around 35 percent. 62 percent and 14 percent of outstanding domestic debt were demanded by banks and residents abroad respectively.
Outstanding foreign debt of Turkey increased by 8 percent to around USD 290 billion.
1.3. Normalization and Exit Measures
During 2009 while the global crisis was predominantly effective, with a view to alleviating the negative effects of crisis, in general, expansionary measures were taken in both monetary and fiscal policies. On the other hand, during 2010, various different measures were taken as a part of the exit strategy from crisis resulting from increase in short-term capital inflows to Turkey and better differentiation between developed and developing countries in the second phase of the crisis.
These measures were addressed at two main targets. Measures increasing the loan cost aimed at limiting the increase in domestic demand and the use of foreign resources by slowing down the rise in loan supply. In addition, reduction of interest rates intended to prevent the short-term capital inflows through diminishing of short-term return of TL investments.
The measures adopted by the Government:
By a Decree of the Council of Ministers, the rate of discounts for resource utilization support fund was increased by 5 percentage points to 15 percent
The measures adopted by the Central Bank:
• On September 16, 2010, an adjustment decision to increase the difference between weekly bid interest rate (policy interest rate) and the overnight borrowing interest rate (technical interest rate) by 0,25 points was taken.
I-3

Turkish Economy and Banking System in 2010
• On September 23, 2010, TL reserve requirement ratio was increased from 5 percent to 5.5 percent, while foreign exchange reserve requirement ratio was increased from 10 percent to 11 percent. Furthermore, the rate of interest applied on required reserves for TL was declined to 0 percent.
• On October 14, 2010, overnight borrowing interest rate was reduced from 6.25 percent to 5.75 percent.
• On November 11, 2010, overnight borrowing interest rate was reduced from 5.75 percent to 1.75 percent this time, while the late liquidity window borrowing rate was reduced from 1.75 percent to 0 percent.
• On November 12, 2010, TL reserve requirement ratio was increased from 5.5 percent to 6 percent.
• On December 16, 2010, policy interest rate was reduced from 7 percent to 6.5 percent. Furthermore, the Central Bank borrowing interest rates were further reduced in various different maturities and transaction types, while its lending interest rates were increased.
• On December 17, 2010, TL reserve requirement ratio were differentiated depending on the term structure, and repurchase agreements of banks with each other or with the Central Bank were included in the scope of required reserves. Considering the existing term structure of deposit accounts, the effective required reserve ratio for TL obligations rose from around 6 percent to approximately 7.5 percent in average.
• In addition to the measures listed above, foreign exchange buying auctions was made possible through additional foreign currency bids, and the Central Bank’s intermediary role in foreign currency market was terminated, and in the right of repurchase borrowings granted to market-maker banks, the maturity was reduced from 1 week to 1 day.
The measures adopted by the Banking Regulation and Supervision Agency (BRSA):
• On December 18, 2010, credit card minimum payment amount previously equal to 20 percent of the outstanding debt of account period was increased to a range of rates varying from 25 percent to 40 percent depending on the card limit.
• By the Banking Regulation and Supervision Board’s Resolution dated December 16, 2010 it was decided that in loans to be extended by banks to customers for housing and in consumer loans to be extended under housing collaterals, the amount of the loan shall be limited to 75 percent of the value of the real estate subject to collateral and in installment commercial loans to be extended for commercial real estate purchase, the amount of the loan shall be limited to 50 percent of the value of the real estate subject to collateral.
1.4. Mid-Term Program and Forecasts for 2011-2013 Period
The Mid-Term Program declared in October 2010 set down the targets relating to economic aggregates. Accordingly, the gross domestic product was foreseen to grow by 5 percent in average during the 2011-2013 period.
The ratio of current account deficit to gross domestic product was estimated to be 5.4 percent in 2011 and decline down slightly in the subsequent years. The ratio of public sector balance deficit to gross domestic product was programmed to be reduced
I-4
Banks in Turkey 2010
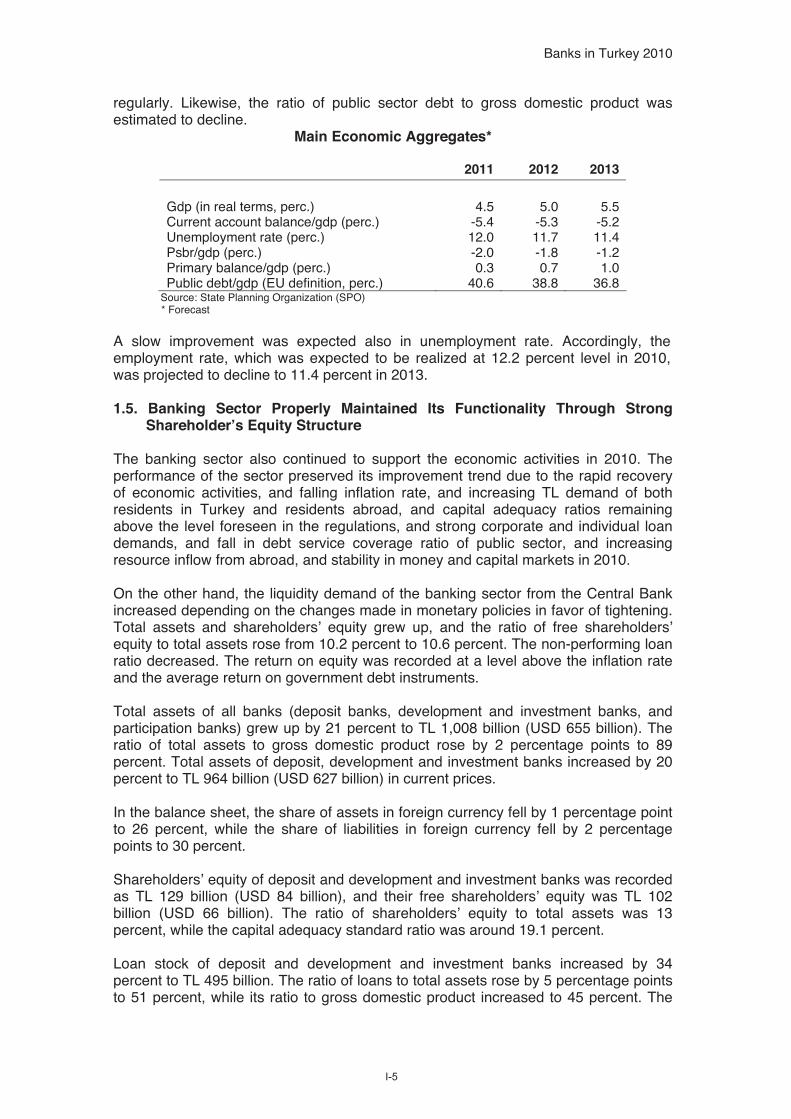
regularly. Likewise, the ratio of public sector debt to gross domestic product was estimated to decline.
Main Economic Aggregates*
2011 2012 2013
Gdp (in real terms, perc.) 4.5 5.0 5.5Current account balance/gdp (perc.) -5.4 -5.3 -5.2Unemployment rate (perc.) 12.0 11.7 11.4Psbr/gdp (perc.) -2.0 -1.8 -1.2Primary balance/gdp (perc.) 0.3 0.7 1.0Public debt/gdp (EU definition, perc.) 40.6 38.8 36.8
Source: State Planning Organization (SPO)* Forecast
A slow improvement was expected also in unemployment rate. Accordingly, the employment rate, which was expected to be realized at 12.2 percent level in 2010, was projected to decline to 11.4 percent in 2013.
1.5. Banking Sector Properly Maintained Its Functionality Through Strong Shareholder’s Equity Structure
The banking sector also continued to support the economic activities in 2010. The performance of the sector preserved its improvement trend due to the rapid recovery of economic activities, and falling inflation rate, and increasing TL demand of both residents in Turkey and residents abroad, and capital adequacy ratios remaining above the level foreseen in the regulations, and strong corporate and individual loan demands, and fall in debt service coverage ratio of public sector, and increasing resource inflow from abroad, and stability in money and capital markets in 2010.
On the other hand, the liquidity demand of the banking sector from the Central Bank increased depending on the changes made in monetary policies in favor of tightening. Total assets and shareholders’ equity grew up, and the ratio of free shareholders’ equity to total assets rose from 10.2 percent to 10.6 percent. The non-performing loan ratio decreased. The return on equity was recorded at a level above the inflation rate and the average return on government debt instruments.
Total assets of all banks (deposit banks, development and investment banks, and participation banks) grew up by 21 percent to TL 1,008 billion (USD 655 billion). The ratio of total assets to gross domestic product rose by 2 percentage points to 89 percent. Total assets of deposit, development and investment banks increased by 20 percent to TL 964 billion (USD 627 billion) in current prices.
In the balance sheet, the share of assets in foreign currency fell by 1 percentage point to 26 percent, while the share of liabilities in foreign currency fell by 2 percentage points to 30 percent.
Shareholders’ equity of deposit and development and investment banks was recorded as TL 129 billion (USD 84 billion), and their free shareholders’ equity was TL 102 billion (USD 66 billion). The ratio of shareholders’ equity to total assets was 13 percent, while the capital adequacy standard ratio was around 19.1 percent.
Loan stock of deposit and development and investment banks increased by 34 percent to TL 495 billion. The ratio of loans to total assets rose by 5 percentage points to 51 percent, while its ratio to gross domestic product increased to 45 percent. The
I-5
Turkish Economy and Banking System in 2010
growth in foreign exchange denominated loans accelerated. The ratio of securities to total assets declined by 3 percentage points to 30 percent. The share of fixed assets in total assets was around 3 percent.
The share of total deposits in the resources was 61 percent, and its ratio to gross domestic product was around 53 percent. The share of TL deposits in total deposits was 70 percent.
There was no significant change in term structure of deposits; average maturity of TL deposits was 2.3 months, while average maturity of foreign exchange deposits was 2.8 months.
Resources of TL 120 billion (USD 78 billion) from foreign banks represented 12 percent of total assets; the major part of which were in foreign exchange.
Profit volume expanded by 9.3 percent, and return on equity reduced by 1.8 percentage points to 16.4 percent level.
Off-balance sheet items increased by 67 percent. The increase in off-balance sheet items resulted from commitments and derivative transactions.
Total market value of financial institutions increased by 18 percent compared to the end of 2009, and rose to USD 113 billion. Total market value of financial institutions traded in Istanbul Stock Exchange accounted for 41 percent of total market value of all companies.
In 2010, the number of banks operating in Turkey was 49. Of which 32 were deposit banks and 13 development and investment banks and 4 participation banks. There were 17 deposit banks and 4 development and investment banks whose shares were owned by non-resident investors at a rate of minimum 51 percent.
The number of banks having strategic partnership (50 percent partnership) with the non-resident financial institutions was 4. Out of bank partners resident abroad, 13 were European, 5 were Middle Eastern, 4 were U.S.A. and 1 was Asian and 1 was African-origins.
As of December 2010, the Turkish banking sector owned 38 financial subsidiaries and 78 branches and representation offices abroad. Number of representation offices of banks operating abroad in Turkey was 41.
The upward trend in the number of branches and employees in the banking sector which started in 2003 also continued in 2010. Thus, total number of branches of all banks reached 10,072, and total number of employees was 191,207.
In Turkey, the financial sector and banking sector are still at growth phase. The banking sector plays a predominant role in the financial sector. According to international comparisons, the banking sector has a high growth potential.
I-6
Banks in Turkey 2010
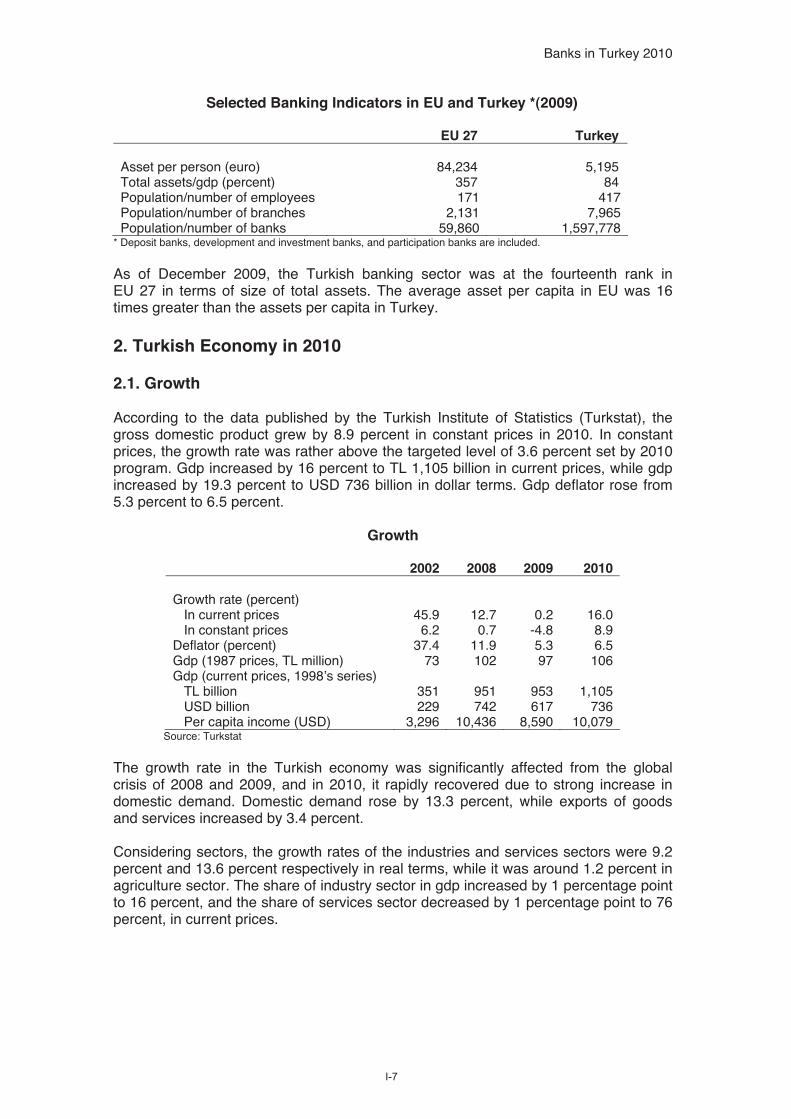
Selected Banking Indicators in EU and Turkey *(2009)
EU 27 Turkey Asset per person (euro) 84,234 5,195 Total assets/gdp (percent) 357 84 Population/number of employees 171 417Population/number of branches 2,131 7,965Population/number of banks 59,860 1,597,778
* Deposit banks, development and investment banks, and participation banks are included.
As of December 2009, the Turkish banking sector was at the fourteenth rank in EU 27 in terms of size of total assets. The average asset per capita in EU was 16 times greater than the assets per capita in Turkey.
2. Turkish Economy in 2010
2.1. Growth
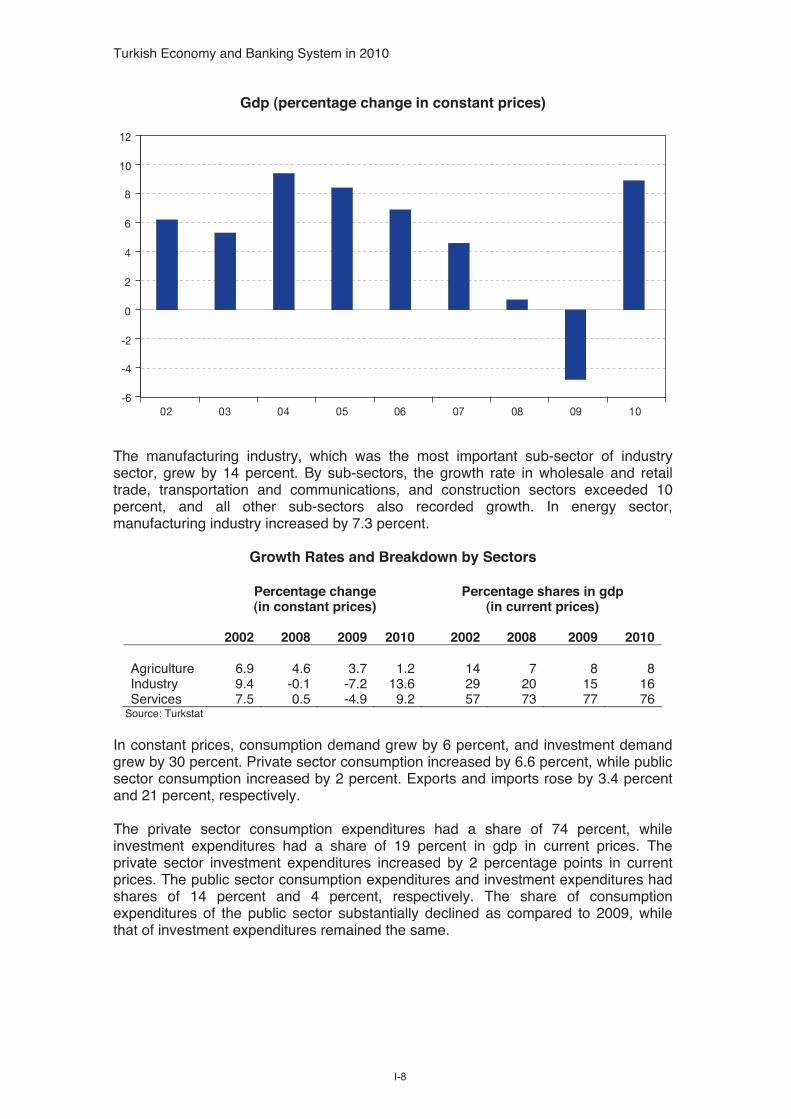
According to the data published by the Turkish Institute of Statistics (Turkstat), the gross domestic product grew by 8.9 percent in constant prices in 2010. In constant prices, the growth rate was rather above the targeted level of 3.6 percent set by 2010 program. Gdp increased by 16 percent to TL 1,105 billion in current prices, while gdp increased by 19.3 percent to USD 736 billion in dollar terms. Gdp deflator rose from 5.3 percent to 6.5 percent.
Growth
2002 2008 2009 2010
Growth rate (percent) In current prices 45.9 12.7 0.2 16.0 In constant prices 6.2 0.7 -4.8 8.9Deflator (percent) 37.4 11.9 5.3 6.5Gdp (1987 prices, TL million) 73 102 97 106Gdp (current prices, 1998’s series) TL billion 351 951 953 1,105 USD billion 229 742 617 736 Per capita income (USD) 3,296 10,436 8,590 10,079
Source: Turkstat
The growth rate in the Turkish economy was significantly affected from the global crisis of 2008 and 2009, and in 2010, it rapidly recovered due to strong increase in domestic demand. Domestic demand rose by 13.3 percent, while exports of goods and services increased by 3.4 percent.
Considering sectors, the growth rates of the industries and services sectors were 9.2 percent and 13.6 percent respectively in real terms, while it was around 1.2 percent in agriculture sector. The share of industry sector in gdp increased by 1 percentage point to 16 percent, and the share of services sector decreased by 1 percentage point to 76 percent, in current prices.
I-7
Turkish Economy and Banking System in 2010
Gdp (percentage change in constant prices)
The manufacturing industry, which was the most important sub-sector of industry sector, grew by 14 percent. By sub-sectors, the growth rate in wholesale and retail trade, transportation and communications, and construction sectors exceeded 10 percent, and all other sub-sectors also recorded growth. In energy sector, manufacturing industry increased by 7.3 percent.
Growth Rates and Breakdown by Sectors
Percentage change (in constant prices)
Percentage shares in gdp (in current prices)
2002 2008 2009 2010 2002 2008 2009 2010
Agriculture 6.9 4.6 3.7 1.2 14 7 8 8Industry 9.4 -0.1 -7.2 13.6 29 20 15 16Services 7.5 0.5 -4.9 9.2 57 73 77 76
Source: Turkstat
In constant prices, consumption demand grew by 6 percent, and investment demand grew by 30 percent. Private sector consumption increased by 6.6 percent, while public sector consumption increased by 2 percent. Exports and imports rose by 3.4 percent and 21 percent, respectively.
The private sector consumption expenditures had a share of 74 percent, while investment expenditures had a share of 19 percent in gdp in current prices. The private sector investment expenditures increased by 2 percentage points in current prices. The public sector consumption expenditures and investment expenditures had shares of 14 percent and 4 percent, respectively. The share of consumption expenditures of the public sector substantially declined as compared to 2009, while that of investment expenditures remained the same.
02 03 04 05 06 07 08 09 10-6
-4
-2
0
2
4
6
8
10
12
I-8

Ara.10
-40
InvestmentConsumption
-30
-20
-10
0
10
20
30
40
50
02 04 06 08 Jun.10Dec.09Jun.09 Dec.10
Banks in Turkey 2010
Consumption and Investment (annual change in constant prices)
According to the estimations of the State Planning Organization, the ratio of domestic savings to gdp fell down by 2.3 percentage points to 12.6 percent. The savings ratio fell in both private and public sectors. Savings deficit increased by 4.5 percentage points to 6.6 percent of gdp. The ratio of savings deficit to gdp in public sector fell, while the savings surplus turned into savings deficit in private sector.
Domestic Savings and Balance of Savings (as percentage of gdp)
2002 2008 2009 2010*
Domestic savings 19.0 16.9 14.9 12.6 Public -6.2 1.7 0.9 0.8 Private 25.3 15.1 14.0 11.8Savings balance -2.6 -5.2 -2.1 -6.6 Public -12.5 -2.5 -5.3 -4.0 Private 9.9 -2.7 3.2 -2.6External funds** 2.6 5.2 -2.1 -6.6
Source: State Planning Organisation * Estimation, savings balance is own estimation.
** Factor income and current transfers are included.
2.2. Employment and Wages
In spite of increase in labor force and labor force participation rate, unemployment rate declined due to rapid growth of employment depending on economic recovery.
According to the data of Turkstat, total labor force supply was 25.6 million, and total employment was 22.7 million as of December 2010. Total number of workforce increased by 781 thousand as compared to the same period of the last year. Besides this increase, the labor force participation rate also rose. In the same period, total employment increased by 1.2 million. Accordingly, the unemployed population decreased by around 432 thousand to 2.9 million as compared to the previous year.
I-9

05 06 07 08 09 100
3
6
9
12
15
CPIPPI
Turkish Economy and Banking System in 2010
Unemployment Rate (percent)
2002 2008 2009 2010Unemployment rate Overall 10.3 14.0 13.5 11.4 Urban 14.2 15.6 16.1 13.9 Youth … 26.0 24.1 21.6
Source: Turkstat
Thus, unemployment rate reduced by 2.1 percentage points to 11.4 percent as of December 2010 as compared to the same period of the last year. This rate fell down from 15.6 percent to 13.9 percent in urban area, and from 9.2 percent to 7.2 percent in rural area. Of total employment, 55 percent were employed in services sector, 25 percent in agriculture and 20 percent in industry sectors.
Real Labor Cost Index (1994=100)
2006 2007 2008 2009 2010
Public 104 112 105 112 110Private 114 118 113 123 ...Civil servant 140 148 147 165 163Minimum wage 181 184 177 191 193
Source: SPO
According to the forecasts of the State Planning Organization, while the real labor cost of public workers and civil servants decreased, minimum wage increased in 2010.
2.3. Inflation
Consumer prices inflation realized in 8 to 9 percent range on annual basis during the first three quarters of 2010 and was above the Central Bank’s target level of 6.5 percent. In the last quarter of the year, consumer prices inflation realized at the targeted level with the effects of the exclusion of the effect of tax regulations enacted in October 2009 from the index, and the fall in prices of non-processed food and tobacco products on annual basis.
Inflation (12-month, percentage change)
I-10

Banks in Turkey 2010
Producer Price Index (PPI) increased by 8.9 percent on annual basis. Annual average increase rates were 8.6 percent and 8.5 percent for CPI (Consumer Price Index) and PPI (Producer Price Index) respectively.
Inflation (percentage)
2002 2008 2009 2010Annual average Producer* 50 13 1.2 8.5Consumer 45 10 6.3 8.612-month change Producer* 31 8 5.9 8.9Consumer 30 10 6.5 6.4CPI target ... 4 7.5 6.5
Source: Turkstat * Values until 2004 belong to previously calculated wholesale price index.
The increases recorded in international markets in petroleum prices, non-petroleum energy prices and commodity prices used as basic inputs exerted an upward pressure on PPI (Producer Price Index), while the appreciation of TL depending on capital inflows made a downward pressure on costs.
2.4. Public Sector Balance
Depending on rapid recovery of economic activities, strong growth, and increase in domestic demand emerging from private sector, measures were taken for renouncing from expansionary fiscal policies in 2010. As a result of these measures, the ratio of public sector deficit to gdp declined from 6.6 percent to 4.9 percent. According to the forecasts of the State Planning Organization, total public sector income increased by 15 percent, while total public sector expenditures increased by 9 percent in 2010. The ratio of total public sector income to gdp rose by approximately 2.2 percentage points to 35.7 percent, while the ratio of total public sector expenditures to gdp rose by 0.2 percentage points to 40.3 percent.
Accordingly, the ratio of public sector primary surplus to gdp increased from 0.7 percent in 2009 to 1.3 percent in 2010. The ratio of primary surplus to gdp rose for the first time since 2006.
Public Sector Borrowing Requirement (as percentage of gdp)
2002 2008 2009 2010* Consolidated budget -14.8 -1.8 -5.5 -4.5** State economic enterprises -1.0 0.0 0.3 0.1 Local administrations 0.1 -0.6 -0.4 -0.2 Funds 0.0 0.0 0.0 0.0 Other 3.0 0.8 -0.5 -0.5 Public sector deficit -12.7 -1.6 -3.4 -2.1 Public sector primary balance -7.0 4.1 0.7 1.3
Source: State Planning Organization * Forecast ** Realization
The share of tax revenues in the public revenues was around 55 percent and indirect taxes accounted for 66 percent of tax revenues. Non-interest expenses accounted for 85 percent of total expenditures. The share of interest expenses in total expenditures decreased by 1 percentage point to 15 percent in 2010 as compared with 2009.
I-11

02 03 04 05 06 07 08 09 100
-5
5
10
15
20
25
30
35
PPIPsbr/Gdp
Turkish Economy and Banking System in 2010
Public Sector Borrowing Requirement /Gdp and Inflation (percentage)
According to the data of the Ministry of Finance, the ratio of the central government budget deficit to gdp which constituted the most important part in the public sector income and expenses declined from 5.5 percent to 4.5 percent. The central government budget income and expenses increased by 10 percent, and 7 percent, respectively. Interest expenses and non-interest expenses grew by 7 percent. In current prices, budget deficit reduced by 5 percent, while the primary surplus rose to TL 6.6 billion. The ratios of budget income and budget expenses to gdp were realized at 21 percent and 26 percent, respectively. The ratio of interest expenses to gdp decreased by 0.5 percentage points to 5.1 percent level.
Central Government Budget (TL million)
Per. Per. Per. As per. of gdp2009 share 2010* share change 2010
Revenues 215,458 100 236,794 100 10 21.4 Tax revenues 172,440 80 193,324 82 12 17.5 Non-tax revenues 43,018 20 43,470 18 1 3.9 Expenditures 268,219 100 286,981 100 7 26.0 Interest expend. 53,201 20 56,750 20 7 5.1 Non-interest 215,018 80 230,231 80 7 20.9 Personnel 55,947 21 60,349 21 8 5.5 Current 134,680 50 147,529 51 10 13.4 Investment 24,391 9 22,353 8 -8 2.0 Budget balance -52,761 -50,187 -5 -4.5 Primary balance 440 6,563 1,392 0.6
Source: The Ministry of Finance* Provisional
The current expenditures had the highest share with 51 percent in the budget expenditures. The share of investment expenditures decreased by 1 percentage point to 8 percent in 2010 compared with 2009 and those of personnel and interest expenditures were 21 percent and 20 percent, respectively.
I-12
Banks in Turkey 2010
Financing of the Central Government Budget
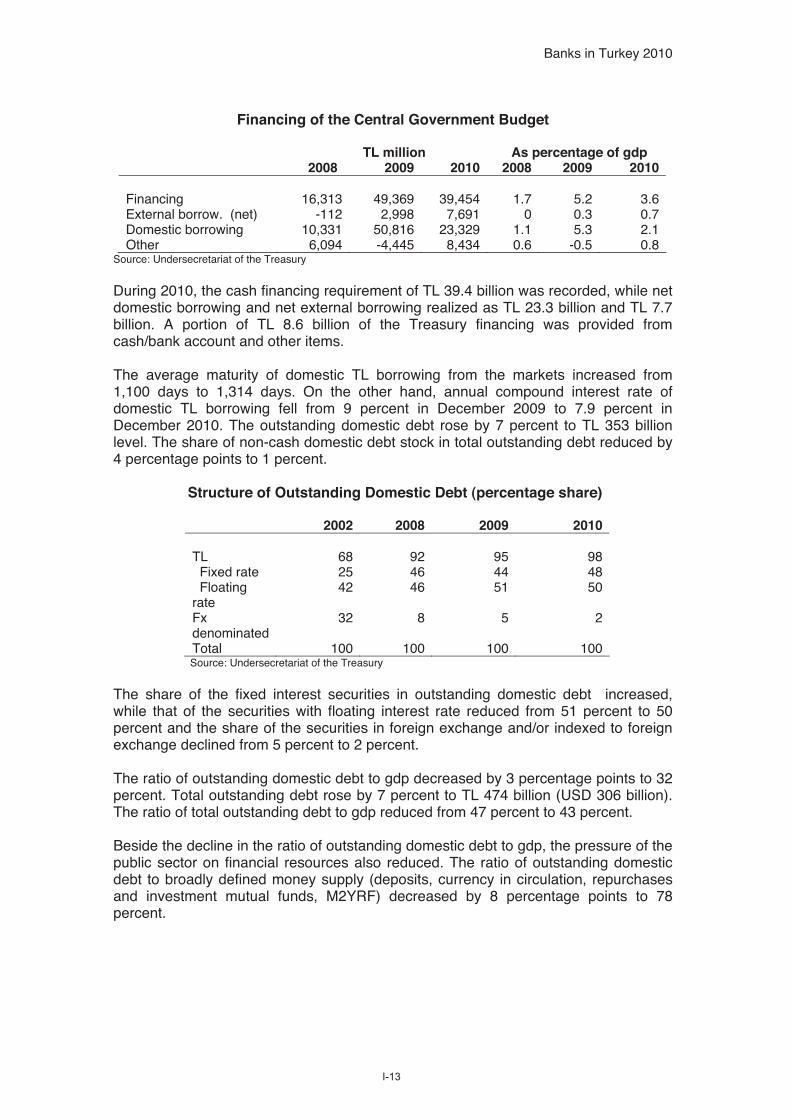
TL million As percentage of gdp 2008 2009 2010 2008 2009 2010
Financing 16,313 49,369 39,454 1.7 5.2 3.6External borrow. (net) -112 2,998 7,691 0 0.3 0.7Domestic borrowing 10,331 50,816 23,329 1.1 5.3 2.1Other 6,094 -4,445 8,434 0.6 -0.5 0.8
Source: Undersecretariat of the Treasury
During 2010, the cash financing requirement of TL 39.4 billion was recorded, while net domestic borrowing and net external borrowing realized as TL 23.3 billion and TL 7.7 billion. A portion of TL 8.6 billion of the Treasury financing was provided from cash/bank account and other items.
The average maturity of domestic TL borrowing from the markets increased from 1,100 days to 1,314 days. On the other hand, annual compound interest rate of domestic TL borrowing fell from 9 percent in December 2009 to 7.9 percent in December 2010. The outstanding domestic debt rose by 7 percent to TL 353 billion level. The share of non-cash domestic debt stock in total outstanding debt reduced by 4 percentage points to 1 percent.
Structure of Outstanding Domestic Debt (percentage share)
2002 2008 2009 2010
TL 68 92 95 98 Fixed rate 25 46 44 48 Floating rate
42 46 51 50
Fxdenominated
32 8 5 2
Total 100 100 100 100 Source: Undersecretariat of the Treasury
The share of the fixed interest securities in outstanding domestic debt increased, while that of the securities with floating interest rate reduced from 51 percent to 50 percent and the share of the securities in foreign exchange and/or indexed to foreign exchange declined from 5 percent to 2 percent.
The ratio of outstanding domestic debt to gdp decreased by 3 percentage points to 32 percent. Total outstanding debt rose by 7 percent to TL 474 billion (USD 306 billion). The ratio of total outstanding debt to gdp reduced from 47 percent to 43 percent.
Beside the decline in the ratio of outstanding domestic debt to gdp, the pressure of the public sector on financial resources also reduced. The ratio of outstanding domestic debt to broadly defined money supply (deposits, currency in circulation, repurchases and investment mutual funds, M2YRF) decreased by 8 percentage points to 78 percent.
I-13

Turkish Economy and Banking System in 2010
Central Government Budget and Outstanding Public Debt
TL million As percentage of gdp 2010 2007 2008 2009 2010
Government securities 352,841 30 29 35 32 Cash 350,379 26 26 33 32 Non-cash 2,462 4 3 2 0 Bonds 343,316 29 27 33 31 Cash 340,854 25 25 31 31 Non-cash 2,462 4 3 2 0 Treasury bills 9,525 1 1 1 1 Cash 9,525 1 1 1 1 Non-cash 0 0 0 0 0Domestic debt 352,841 30 29 35 32External debt* 120,702 11 10 12 11Total 473,543 41 38 47 43
* For Central Government Budget
Out of total outstanding domestic debt of central government budget, 15 percent was held by public organizations, and 85 percent by the investment portfolio of market. These shares were 18 percent and 82 percent, respectively as of the end of 2009.
Distribution of Government Domestic Debt InstrumentsBy Investors (TL million)
2008 2009 2010 Non-financial residents 73,767 74,890 68,192 Real persons 16,395 10,644 6,080 Corporations 57,372 64,247 62,114Mutual funds 14,198 15,547 16,003Persons resident abroad 29,936 31,145 49,173Non-financial residents (Total) 117,901 121,583 133,368Banks and other 156,926 208,422 219,473Total 274,827 330,005 352,841
Source: Central Bank of the Republic of Turkey
As of December 2010, 62 percent of the government debt securities was held by banks. Total amount of government domestic debt securities held by non-bank sectors was TL 133 billion. The shares of real persons and legal entities decreased, while the share of the persons resident abroad increased. Government domestic debt securities held by non-bank sectors constituted 38 percent of the outstanding domestic debt.
Demand of legal entities for government debt securities fell during periods of dynamic economic activity. The share of banks in government domestic debt securities demand also declined by 1 percentage point.
The annual compound interest rate of government domestic debt securities slightly declined parallel to the budget discipline in the first quarter of the year, and realized in 7 to 8 percent range during the rest of the year. The interest rate of government securities decreased by around 1 percentage point to 8 percent on annual basis in 2010 compared with 2009.
I-14

Banks in Turkey 2010
2.5. Monetary Aggregates
2.5.1. Monetary Policy
An expansionary monetary policy was implemented in 2009 to limit the negative effects of global crisis on financial markets and support the recovery of economic activities. Due to the increase in loan supply, acceleration in capital inflows, stabilized markets, normalization in the economic activities resulting from increase in domestic demand since the last quarter of 2009 again, the Central Bank started to withdraw the crisis measures as of the second quarter of 2010. Measures aimed at limiting the liquidity support granted to markets were declared under the name of “crisis exit strategy”. According to the new approach, the liquidity was limited in terms of amount and maturity. The policy interest rates showed a horizontal trend until the last quarter.
Interest Rates, Exchange Rates and Inflation (percentage)
2009 2010Dec. March June Sept. Dec.
Interest rate* O/n (CBRT) 6.7 6.7 6.7 6.7 1.6Repo (weekly, CBRT) 8.0 8.0 7.3 7.3 6.7 Government securities 9.0 7.1 7.6 7.9 7.9Exchange rates (annual change) TL/USD -2.3 -9.1 3.2 2.3 3.4 TL/Euro 0.4 -7.9 -10.4 -8.9 -4.1Inflation (CPI, annual change) 6.5 9.6 8.4 9.2 6.4
* Annual compounded, average
In the last quarter, daily interest rates were rapidly reduced to prevent short-term capital inflow, 1-weekly repurchase agreement interest rate was started to be used as policy interest rate. The liquidity support provided to the foreign currency markets was limited, and the intermediary transactions at the foreign exchange buying market were stopped.
Starting from the last quarter, the reserve requirement ratios were increased so that they would be lower at long-terms. The non-deposit funds provided from domestic and foreign resources also made subject to the required reserves. The reserve requirement ratio was increased from 5 percent as of last quarter to 7.5 percent towards the end of year, and the interest rate applicable on non-deposit fund resources was determined as 8 percent.
In the meantime, the rate of interest applied on required reserves reduced to zero starting from the last quarter. The foreign currency buying amounts were increased as well.
The Central Bank aimed to improve the sensitivity to policy interests, and increase the intermediation cost, and limit the loan growth by increasing the liquidity deficit of banks, and declared that to strengthen the resistance of banks against probable risks that may be caused by instabilities in international markets with these measures, would contribute to maintaining of financial stability.
Monetary base grew by 17 percent to TL 76 billion in 2010. The great portion of this increase was recorded in the last quarter of 2010 when the foreign exchange buying auctions accelerated within the framework of the Central Bank’s approach aimed at strengthening the foreign exchange reserves by creating demand for the foreign
I-15

Deflator CB balance sheet
-5
0
5
10
15
20
25
30
35
40
45
02 03 04 05 06 07 08 09 10
Turkish Economy and Banking System in 2010
exchange supply surplus. As a result, net foreign assets increased by 18 percent, while net domestic assets continued to reduce in the first half, and increased again depending on the fall in the Treasury’s deposits in the second half of the year.
Balance Sheet of the Central Bank, Selected Items* (TL million)
2009 2010 Dec. March June Sept. Dec.
Net foreign assets 72,024 72,224 79,896 76,861 85,228Net domestic assets -7,505 -11,331 -15,517 -8,705 -9,484Open market operations (net) 18,917 11,530 11,276 16,340 10,913Monetary base 64,519 60,893 64,379 68,156 75,744
Source: Central Bank of the Republic of Turkey * All the items belongs to CB Balance sheet in the framework of Stand-by agreement.
Throughout the year, the Central Bank continued to provide liquidity to the markets though in declining quantities through open market transactions. The liquidity deficit of banks reduced from TL 19 billion as of the end of 2009 to USD 11 billion as of the end of the last year. The other development which affected the net domestic assets of the Central Bank in 2010 was that the public sector reduced its deposits held with the Central Bank both in TL and in foreign exchange.
Central Bank’s Balance Sheet and Deflator (annual percentage change)
Foreign exchange reserves of the Central Bank increased to USD 80.7 billion by an increase of USD 10 billion in 2010. On the other hand, its foreign exchange obligations fell down by USD 2.2 billion due to decline in the external obligations. Accordingly, the net foreign exchange position rose from USD 37.7 billion to USD 50.6 billion.
Central Bank’s Fx Reserves and Net Fx Position (USD billion)
2009 2010 Dec. March June Sept. Dec.Fx reserves 70.7 68.3 70.6 75.8 80.7Net Fx position 37.7 35.2 41.6 41.0 50.6
Source: Central Bank of the Republic of Turkey
I-16
Banks in Turkey 2010
2.5.2. Financial Assets and Money Demand
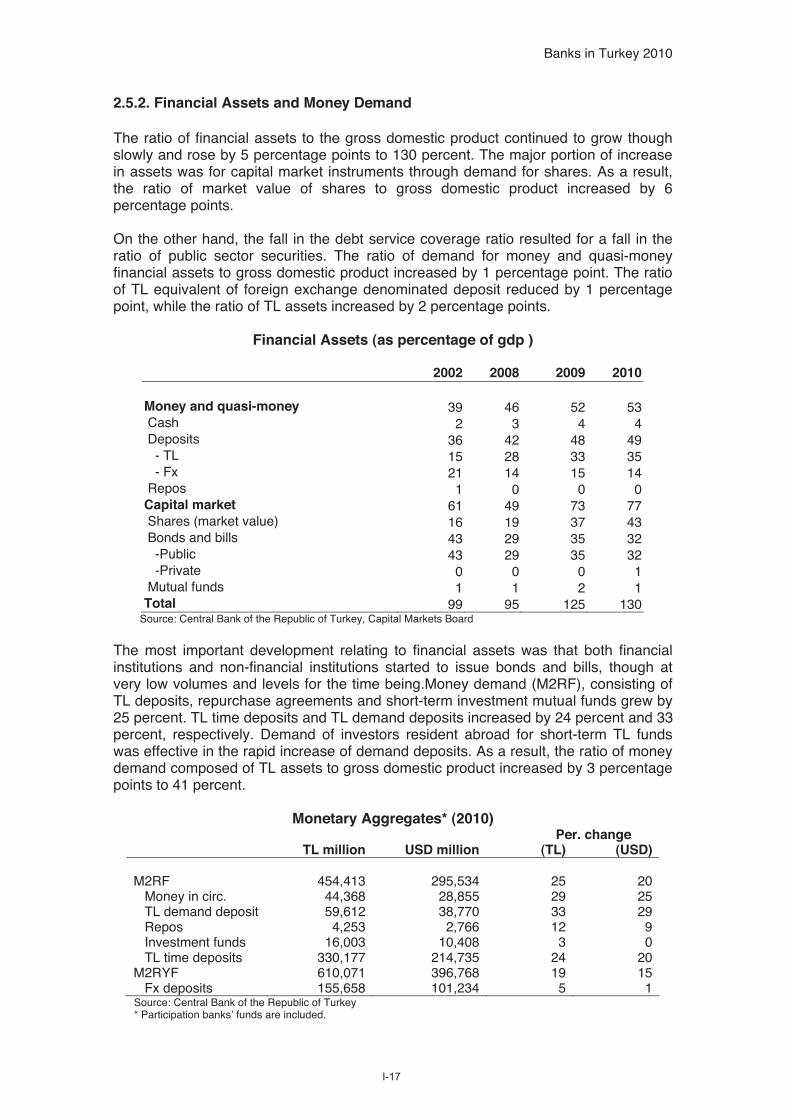
The ratio of financial assets to the gross domestic product continued to grow though slowly and rose by 5 percentage points to 130 percent. The major portion of increase in assets was for capital market instruments through demand for shares. As a result, the ratio of market value of shares to gross domestic product increased by 6 percentage points.
On the other hand, the fall in the debt service coverage ratio resulted for a fall in the ratio of public sector securities. The ratio of demand for money and quasi-money financial assets to gross domestic product increased by 1 percentage point. The ratio of TL equivalent of foreign exchange denominated deposit reduced by 1 percentage point, while the ratio of TL assets increased by 2 percentage points.
Financial Assets (as percentage of gdp )
2002 2008 2009 2010
Money and quasi-money 39 46 52 53 Cash 2 3 4 4 Deposits 36 42 48 49 - TL 15 28 33 35 - Fx 21 14 15 14 Repos 1 0 0 0Capital market 61 49 73 77 Shares (market value) 16 19 37 43 Bonds and bills 43 29 35 32 -Public 43 29 35 32 -Private 0 0 0 1 Mutual funds 1 1 2 1Total 99 95 125 130
Source: Central Bank of the Republic of Turkey, Capital Markets Board
The most important development relating to financial assets was that both financial institutions and non-financial institutions started to issue bonds and bills, though at very low volumes and levels for the time being.Money demand (M2RF), consisting of TL deposits, repurchase agreements and short-term investment mutual funds grew by 25 percent. TL time deposits and TL demand deposits increased by 24 percent and 33 percent, respectively. Demand of investors resident abroad for short-term TL funds was effective in the rapid increase of demand deposits. As a result, the ratio of money demand composed of TL assets to gross domestic product increased by 3 percentage points to 41 percent.
Monetary Aggregates* (2010) Per. change
TL million USD million (TL) (USD)
M2RF 454,413 295,534 25 20 Money in circ. 44,368 28,855 29 25 TL demand deposit 59,612 38,770 33 29 Repos 4,253 2,766 12 9 Investment funds 16,003 10,408 3 0 TL time deposits 330,177 214,735 24 20M2RYF 610,071 396,768 19 15 Fx deposits 155,658 101,234 5 1
Source: Central Bank of the Republic of Turkey * Participation banks’ funds are included.
I-17

M2YRF M2RF
0
5
10
15
20
25
30
05 06 07 08 09 10
Turkish Economy and Banking System in 2010
The annual increase rate of broadly defined money demand (M2YRF), also including the foreign exchange deposits, realized as 19 percent (15 percent in dollar terms). Particularly due to the fall in demand of real persons resident in Turkey, the foreign exchange deposits increased by 5 percent on TL equivalent basis and 1 percent in dollar terms. The ratio of M2RFY to gross domestic product also rose by 1 percentage point to 55 percent.
Money Demand (annual change in real terms)
Currency substitution continued to fall. The share of foreign exchange deposits in the broadly defined money demand reduced by 4 percentage points to 26 percent as compared to 2009, and the same ratio declined by 25 percentage points as compared to 2002.
Breakdown of Monetary Aggregates (percentage)
2002 2008 2009 2010Money in circulation 5 7 7 7TL demand deposits 5 7 7 10Repos 2 1 1 1Investment funds 3 5 3 3TL time deposits 33 51 53 54Fx deposits 51 29 30 26M2RYF 100 100 100 100
Source: Central Bank of the Republic of Turkey
Deposit interest rates realized parallel to the trends in policy interest rates of the Central Bank, with a limited fall. The interest rate applied on 3-month time deposits, having the highest share in total deposits, was 9.3 percent on average as of the end of 2009, and increased by 20 base points as of the end of the first half of 2010, and reduced by 60 base points as of the end of 2010 as compared to 2009.
According to the BRSA data, total deposits of deposit banks increased by 20 percent. TL deposits grew up by 27 percent, and TL equivalent of foreign exchange deposits grew up by 6 percent. The foreign exchange deposits rose from USD 116 billion as of the end of 2009 to USD 119 billion as of the end of 2010. The share of TL equivalent
I-18

Banks in Turkey 2010
of foreign exchange deposits in total deposits declined by 4 percentage points to 30 percent, as compared to the end of 2009. The ratio of TL deposits to gdp increased by 2 percentage points to 37 percent, while the ratio of total deposits, including foreign exchange deposits, to gdp increased by 2 percentage points to 53 percent. The average maturity of total deposits was 2.3 months. The average maturity of foreign exchange deposits was 2.8 months, and the average maturity of TL deposits was 2.3 months.
Maturity Structure of Total Deposits (percentage)
2002 2008 2009 2010
Total 100 100 100 100 Demand 19 14 15 15 1-month 30 31 27 24 3-month 38 48 50 56 6-month 8 3 3 412- month+ 6 4 4 1Average (month) 2.8 2.4 2.4 2.4
Source: Central Bank of the Republic of Turkey
According to data of BRSA, state-owned banks by including the participation banks had a share of 36 percent in total deposits, while that of private banks was 48 percent. The share of state-owned banks in total deposits increased by 1 percentage point, while the share of private banks and foreign banks in total deposits decreased by 0.5 percentage points, and the share of participation banks in total deposits remained at the same at 5 percent compared to the end of 2009.
Deposits and Loans (TL million)*
2002 2008 2009 2010
Total deposits 141,889 454,599 514,618 617,037 TL 60,075 294,093 341,412 433,501 Fx 81,814 160,506 173,206 183,536
Total loans** 51,955 367,609 392,622 525,905 TL 20,662 262,285 288,209 383,815 Fx 31,293 105,324 104,413 142,091
Non-performing loans (Net) 1,695 2,824 3,598 3,107 Non-performing loans (Gross) 3,041 13,881 21,852 19,932 Provisions 1,346 11,057 18,254 16,825
Total loans 51,955 374,877 397,708 543,651 Corporate 44,954 256,839 266,757 369,364 Consumer 7,001 118,038 130,951 174,287
Total loans 51,955 367,609 392,622 525,905 From domestic branches 36,762 302,424 338,452 435,765 From branches abroad 15,193 65,185 54,170 90,140
Source: BRSA, CBTR *Participation banks are included. ** Non-performing loans are excluded.
The share of state-owned banks in total TL deposits was 40 percent and 26 percent in total foreign exchange deposits, while private banks had a share of 44 percent in TL
I-19

0
10
20
30
40
50
60
70
80
90
100
02 03 04 05 06 07 08 09 10
Mar-07 Aug-07 Jan-08 Jun-08 Nov-08 Apr-09 Sep-09 Feb-10 Jul-10 Dec-10
50
45
40
35
30
25
20
15
10
5
0
Corporate Retail Total
Turkish Economy and Banking System in 2010
deposits and 56 percent in foreign exchange deposits. The share of foreign banks in TL and foreign exchange deposits was 11 percent and 12 percent, respectively.
Loans/Deposits (percentage)
Loans to deposit ratio which was 77 percent as of the end of 2009 rose from 81 as of June 2009 to 86 percent as of the end of 2010. This ratio was 66 percent in state-owned banks, and 88 percent in private banks, and 110 percent in foreign banks.
Corporate, Retail and Total Loans (annual percentage change)
The annual growth rate in the loan stock was 6 percent as of December 2009 and rose to 23 percent as of June 2010 and 34 percent as of December 2010. TL loans increased by 36 percent, while foreign exchange loans increased by 33 percent. Corporate loans grew up by 36 percent, while retail loans grew up by 30 percent. The share of retail loans in total loan stock decreased by 1 percentage point to 32 percent, as compared to the end of 2009. This development was affected especially by the slow rate of growth in credit cards and automobile loans.
I-20

3
4
4
5
5
6
6
05 06 07 08 09 10
Banks in Turkey 2010
Non-performing loans reduced by 9 percent before specific provisions and 14 percent after specific provisions. The ratio of non-performing loans before specific provisions to total loans declined by 2 percentage points to 3.8 percent. The ratio of non-performing loans after specific provisions to total loans fell from 0.9 percent to 0.6 percent. The ratio of non-performing loans to retail loans was 4.1 percent.
Non Performing Loans/Total Loans (percentage)
The shares of deposit banks, participation banks and development and investments banks in total loans were 92 percent, 6 percent and 2 percent, respectively. The share of loans extended through private banks in total loans was 50 percent, and that of state-owned banks was 27 percent, while the share of foreign banks in total loans was 15 percent.
The ratio of total loans of banking sector to gdp was 48 percent. 88 percent of total loans was extended through domestic branches, and remaining 12 percent branches abroad. Most of the loans extended by the branches abroad was foreign exchange denominated and their share in total loan stock decreased. Due to the legislation changes enabling the banks resident in Turkey to supply foreign exchange loans also to sectors which do not have foreign exchange revenues, the foreign exchange loans which were previously extended through foreign branches of domestic banks were started to be extended also by their domestic branches. Hence, external debts of the non-financial sector continued to fall in 2010 and reduced from USD 113.7 billion to USD 106.6 billion.
Corporate Loans and Non-Financial Sector External Debt (USD million)
2002 2009 2010
Corporate loans (Fx) 19,085 70,580 95,276 -From domestic branches 13,901 34,217 66,117 -From branches abroad 5,184 36,363 29,159
Non-financial sector -External debt stock 32,986 113,706 106,610 -Fx borrowing from abroad 27,802 77,343 77,451* Fx indexed loans were included.
I-21

Percentage of gdp Market value (right axis)
0
5
10
15
20
25
30
35
40
45
50
02 03 04 05 06 07 08 09 10
350
300
250
200
150
100
50
0
USD billionpercent
Turkish Economy and Banking System in 2010
Total foreign exchange corporate loans extended by banks resident in Turkey realized as USD 95 billion, while foreign exchange loans extended through domestic branches increased by USD 32 billion, and foreign exchange loans extended through foreign branches reduced by USD 7 billion.
2.6. Istanbul Stock Exchange
Istanbul Stock Exchange (ISE) 100 index increased both in dollars and in TL in 2010. The index rose by 21 percent to 2,500 points level in dollar terms, and by 25 percent to 66,004 points level in TL terms. On the other hand, total transaction volume grew by 29 percent and reached USD 387 billion.
Due to the recovery of economic activities in a short time, rapid growth of gross domestic product, fall in debt service coverage ratio of public sector, real decline in short-term interest rates, acceleration in capital inflows, and increase in portfolio investments of residents abroad were the factors behind the increase in demand for shares.
ISE Market Value (USD billion) and Market Value/Gdp (percentage)
The market value of companies listed to ISE increased from USD 232 billion at the end of 2009 to USD 296 billion at the end of 2010. The ratio of total market value to gdp also increased from 38 percent to 40 percent.
The number of listed companies increased by 25 to 350 as compared to 2009. 65 companies consisting of exchange traded funds, real estate investment trusts, venture capital investment trusts and securities investment funds were classified in the newly established Corporate Product Market of ISE.
Stocks of 32 financial institutions were traded in the ISE. Of these, 17 were banks. 5 banks were included among 10 corporations with the highest market value. Market value of financial institutions first reached USD 126 billion by an increase of 31 percent as of September 2010 as compared to the end of the previous year and then fell to USD 114 billion by a decrease of USD 12 billion. Then, due to the expectations of fall
I-22

Market value Share in total (right axis)
0
20
40
60
80
100
120
140
05 06 07 08 09 Sep 10 1033
34
35
36
37
38
39
40
41
42
USD billion percent
Banks in Turkey 2010
in profitability and profit margin of banks resulting from the measures taken for tightening the monetary policy, and rise in the reserve requirement ratio, and reducing interest rate applied on required reserves to zero level, the ratio of market value of financial institutions to market value of all corporations listed in the ISE reduced by 2 percentage points to 38.5 percent.
Market Value of Financial Institutions
2.7. Foreign Trade Balance
Rapid growth in domestic demand, and high rate of increase in fixed capital investments, and appreciation of TL, and increase of prices of basic commodities beside the petroleum and other energy prices, limited foreign demand increase resulted in the growth of foreign trade volume based primarily on imports. Foreign trade value increased by 23 percent to USD 299 billion in 2010. The ratio of foreign trade volume to gdp rose by 2 percentage points to 41 percent level. Exports increased by 12 percent to USD 114 billion, while imports rose by 31 percent to USD 185 billion.Foreign trade deficit grew up by 85 percent to USD 72 billion. The ratio of foreign trade deficit to gdp rose by 4 percentage points to 10 percent. The ratio of exports to imports declined by 10 percentage points to 62 percent. The ratio of exports to gdp fell by 2 percentage points to 15 percent as compared 2009, while the ratio of imports to gdp increased by 2 percentage points to 25 percent.
Foreign Trade (USD billion)
2002 2008 2009 2010
Exports 36 132 102 114Imports 52 202 141 185Foreign trade deficit 16 70 39 72Foreign trade volume 88 334 243 299Foreign trade deficit/gdp 9 9 6 10Exports/imports 70 65 72 62Quantity index* (2003=100) Exports 86 148 160 183 Imports 89 128 154 199
Source: Turkstat, * Seasonally adjusted.
I-23

-40
-30
-20
-10
0
10
20
30
40
50
03 04 05 06 07 08 09 10
Gdp Export Import
Turkish Economy and Banking System in 2010
According to the seasonally adjusted data, the export quantity index and the import quantity index increased by 14 percent and 30 percent, respectively, while the price index increased by 3.5 percent for exports and by 8.1 percent for imports.
GDP, Export and Import Growth (annual, percentage, in USD terms)
By commodity groups, imports increased by 34 percent in capital goods, 32 percent in intermediate goods, and 28 percent in consumer goods. Imports of intermediate goods accounted for 71 percent of total imports. By sectors, the share of manufacturing industry in total imports was 78 percent. Machinery, land vehicles, iron and steel, electrical machines and equipments and plastics sectors were the most important sub-sectors playing an important role in manufacturing industry. Mining sector had a share of 14 percent. In 2010, the mineral oils and fuels segment, greatly composed of crude petroleum and natural gas sub-items, rose by 29 percent to USD 38.5 billion and constituted 21 percent of total imports, as compared to the previous year.
Foreign Trade by Commodity Groups, 2010
Exports Imports USDmillion
Per. change
Per. share
USDmillion
Per. change
Per.share
Capital goods 11,776 6 10 28,820 34 16Intermediate goods 56,379 13 50 131,393 32 71Consumer goods 45,364 11 40 24,734 28 13Other 411 -26 0 546 -18 0Total 113,930 12 100 185,493 32 100
Source: Turkstat
In breakdown of exports by commodity groups, consumer goods, intermediate goods and capital goods had 40 percent, 50 percent and 10 percent of total exports respectively. In breakdown of exports by sectors, manufacturing industry had a share of 93 percent, and agriculture sector had 4 percent. The major sub-sectors of the manufacturing industry were land vehicles, textiles, iron and steel, machinery and electrical machines.
I-24

Banks in Turkey 2010
EU member states had a share of 43 percent in foreign trade. The share of non-EU European countries was 13 percent. The foreign trade deficit with EU member states rose from USD 9.5 billion in 2009 to USD 19.6 billion in 2010. EU member states had a share of 39 percent in imports and 46 percent in exports, respectively.
Foreign Trade By Country Groups, 2010
Exports Imports Trade BalanceUSD
million Per.
changePer.
share USD
millionPer.
changePer.
share USDmillion
EU 52,670 12 46 72,215 28 39 -19,545 Free zone 2,082 6 2 875 -9 1 1,207 Other 59,177 11 52 112,403 35 61 -53,226 Europe 11,388 1 10 30,301 17 16 -18,913 Africa 9,302 -8 8 6,412 13 4 2,890 America 6,085 25 5 16,798 37 9 -10,713 Middle East 23,320 22 21 16,094 68 9 7,226 Other Asia 8,578 11 8 41,414 42 22 -32,836 Other 403 -82 0 891 572 1 -488 Total 113,930 12 100 185,493 32 100 -71,563
Source: Turkstat
In foreign trade volume, Germany was in the first rank with a share of 9.7 percent, followed by Russia with 8.8 percent and Italy with 5.6 percent. Exports to Germany constituted 10 percent of total exports, and imports from Russia constituted 12 percent of total imports. Trade deficit with the group of other Asian countries was mainly produced by the trade with South Korea and China.
2.8. Balance of Payments
Due to rapid increase in imports, current account deficit increased by 251 percent to USD 48.6 billion. The contribution of the services balance to the current account balance reduced. The ratio of current account deficit to gdp rose from 2.3 percent to 6.6 percent.
Current Account Balance (USD million)
2002 2008 2009 2010
Current account balance -1,522 -41,947 -13,854 -48,561 -General merchandise -8,337 -53,022 -24,850 -56,354 -Exports 40,124 140,799 109,647 120,923 -Imports -48,461 -193,821 -134,497 -177,277 -Services (net) 7,879 17,121 16,749 14,245 -Tourism (net) 6,599 18,445 17,103 15,981 -Income (net) -5,637 -8,159 -7,816 -7,774 -Direct investments -86 -2,610 -2,732 -2,866 -Portfolio investments -835 972 267 -491 -Other investments -3,633 -6,455 -5,619 -4,329 -Interest expenditures -4,417 -8,477 -7,304 -5,423 -Current transfers 3,490 2,113 2,299 1,364 -Workers remittances 1,936 1,431 934 829
Source: Central Bank of the Republic of Turkey
The balance of income had a deficit of USD 7.8 billion. Interest expenses, the most important sub-item of income balance, declined from USD 7.3 billion to USD 5.4
I-25
Direct investments Capital flows
0
5
10
15
20
25
30
35
40
45
50
55
02 03 04 05 06 07 08 09 10
Turkish Economy and Banking System in 2010
billion. The contribution of net tourism income to the current account balance was USD 16 billion.
Capital and Financial Account (USD million)
2002 2008 2009 2010
Capital and financial account 1,161 33,536 8,923 44,545 -Capital account (net) 0 0 -42 -36 -Financial account (net) 1,161 33,536 8,965 44,581 -Direct invest. abroad (net) 863 15,720 6,856 7,154 -Portfolio investments (net) -593 -5,046 227 16,291 -Other investments (net) 891 24,563 1,993 33,935 -Net errors and omissions 149 5,653 5,068 4,016General balance -212 -2,758 791 14,958 -IMF account 6,365 1,701 -680 -2,159 -Official reserves -6,153 1,057 -111 -12,799
Source: Central Bank of the Republic of Turkey
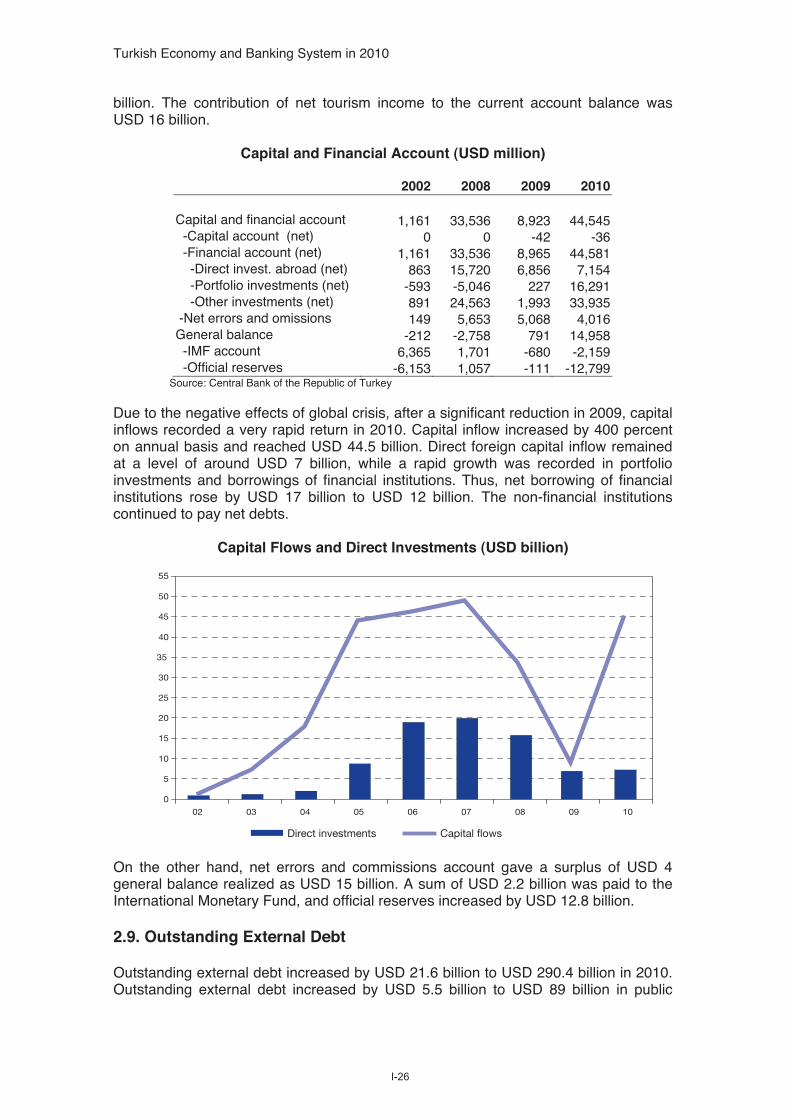
Due to the negative effects of global crisis, after a significant reduction in 2009, capital inflows recorded a very rapid return in 2010. Capital inflow increased by 400 percent on annual basis and reached USD 44.5 billion. Direct foreign capital inflow remained at a level of around USD 7 billion, while a rapid growth was recorded in portfolio investments and borrowings of financial institutions. Thus, net borrowing of financial institutions rose by USD 17 billion to USD 12 billion. The non-financial institutions continued to pay net debts.
Capital Flows and Direct Investments (USD billion)
On the other hand, net errors and commissions account gave a surplus of USD 4 general balance realized as USD 15 billion. A sum of USD 2.2 billion was paid to the International Monetary Fund, and official reserves increased by USD 12.8 billion.
2.9. Outstanding External Debt
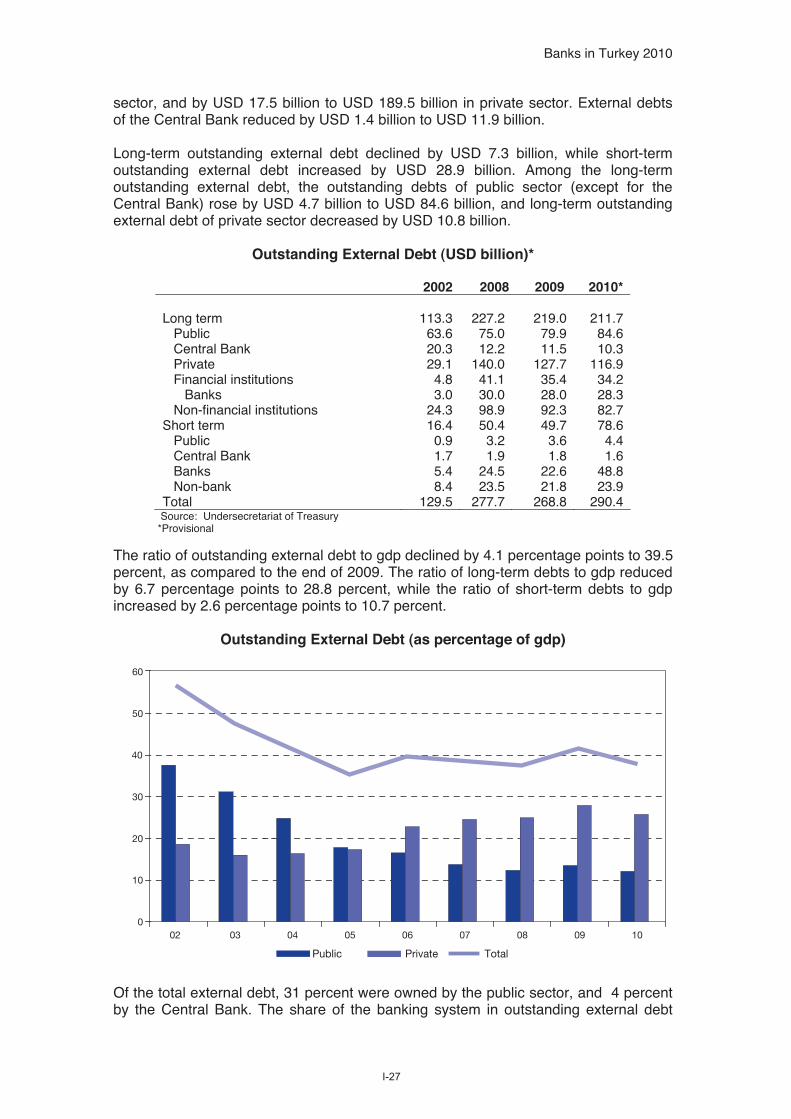
Outstanding external debt increased by USD 21.6 billion to USD 290.4 billion in 2010. Outstanding external debt increased by USD 5.5 billion to USD 89 billion in public
I-26
Public Private Total
0
10
20
30
40
50
60
02 03 04 05 06 07 08 09 10
Banks in Turkey 2010
sector, and by USD 17.5 billion to USD 189.5 billion in private sector. External debts of the Central Bank reduced by USD 1.4 billion to USD 11.9 billion.
Long-term outstanding external debt declined by USD 7.3 billion, while short-term outstanding external debt increased by USD 28.9 billion. Among the long-term outstanding external debt, the outstanding debts of public sector (except for the Central Bank) rose by USD 4.7 billion to USD 84.6 billion, and long-term outstanding external debt of private sector decreased by USD 10.8 billion.
Outstanding External Debt (USD billion)*
2002 2008 2009 2010*
Long term 113.3 227.2 219.0 211.7 Public 63.6 75.0 79.9 84.6 Central Bank 20.3 12.2 11.5 10.3 Private 29.1 140.0 127.7 116.9 Financial institutions 4.8 41.1 35.4 34.2 Banks 3.0 30.0 28.0 28.3 Non-financial institutions 24.3 98.9 92.3 82.7Short term 16.4 50.4 49.7 78.6 Public 0.9 3.2 3.6 4.4 Central Bank 1.7 1.9 1.8 1.6 Banks 5.4 24.5 22.6 48.8 Non-bank 8.4 23.5 21.8 23.9Total 129.5 277.7 268.8 290.4
Source: Undersecretariat of Treasury *Provisional
The ratio of outstanding external debt to gdp declined by 4.1 percentage points to 39.5 percent, as compared to the end of 2009. The ratio of long-term debts to gdp reduced by 6.7 percentage points to 28.8 percent, while the ratio of short-term debts to gdp increased by 2.6 percentage points to 10.7 percent.
Outstanding External Debt (as percentage of gdp)
Of the total external debt, 31 percent were owned by the public sector, and 4 percent by the Central Bank. The share of the banking system in outstanding external debt
I-27

Turkish Economy and Banking System in 2010
was 26 percent, and non-bank sectors had a share of 39 percent. The ratio of public sector (excluding Central Bank) external debt to gdp was at 12 percent.
Out of the long-term external debt, a portion of USD 40 billion owed to official creditors, and USD 126 billion to private creditors. The largest share in the official creditors belonged to international institutions item, which also included the International Monetary Fund with USD 31 billion. Furthermore, the bonds stock, comprised entirely of long-term bonds, was at the level of USD 46.6 billion as of December 2010. Private sector bonds took place among the stock of bonds for the first time since 2003. The private sector bonds realized as USD 1.2 billion.
I-28
Banks in Turkey 2010
3. Turkish Banking System in 20101
3.1. Number of Banks and Branches
The number of banks operating in Turkey was 49, of which 4 were participation banks.2 The number of deposit banks and development and investment banks remained the same at 45 compared with the end of 2009.
31 of the banks were deposit banks, and 13 were development and investment banks. Out of deposit banks, 3 were state-owned, and 11 were private banks. The Saving Deposits Insurance Fund (SDIF) owned 1 bank. There were 17 deposit banks with foreign capital participation whose shares were owned by non resident investors at a rate of minimum 51 percent. Of the development and investment banks, 3 were state-owned, 6 were private, and 4 were foreign banks.
Number of Banks and Branches*
2002 2009 2010 Bank Branch Bank Branch Bank Branch
Deposit banks 40 6,087 32 8,991 32 9,423 State-owned banks 3 2,019 3 2,530 3 2,744 Private banks 20 3,659 11 4,390 11 4,582 SDIF banks 2 203 1 1 1 1 Foreign banks 15 206 17 2,070 17 2,096Development and investment banks 14 19 13 45 13 42Total 54 6,106 45 9,036 45 9,465
Source: The Banks Association of Turkey * Including branches in the Turkish Republic of Northern Cyprus and branches abroad.
Due to the reacceleration of growth in economy, the banks also continued to expand their branch networks, thereby creating new employment. Besides, technology-based investments continued in non-branch activities area, and the services and products offered to clients were diversified. Total number of branches increased by 429 to 9,465. The number of branches increased by 432 in the deposit banks group and decreased by 3 in development and investment banks group. The number of branches increased by 192 in private banks, 214 in state-owned banks and 26 in foreign banks. The number of branches reached its ever highest level as of the end of the year. As for all banks, the population per branch was around 7,280.
3.2. Number of Employees
The number of employees also continued to increase in 2010. The number of employees increased by 2,379 in state-owned banks, and by 1,362 in private banks, and by 2,338 in foreign banks, but reduced by 9 in the bank owned by SDIF. The number of employees increased by 31 in development and investment banks.
Similar to the number of branches, the number of employees also reached its ever highest level as of the end of the year. As for all banks, the population per employee of the banking sector was 384.
1 Includes data about deposit banks and development and investment banks. 2Please see www.bddk.org.tr and www.tkbb.org.tr addresses for detailed information about participation banks.
I-29

5,000
5,500
6,000
6,500
7,000
7,500
8,500
9,000
10,000
02 03 04 05 06 07 08 09 10
190,000
100,000
180,000
170,000
160,000
150,000
140,000
130,000
120,000
110,000
8,000
9,500
Branch Employee (right axis)
Turkish Economy and Banking System in 2010
Number of Employees
2002 2009 2010
Deposit banks 118,329 167,064 173,134 State-owned banks 40,159 44,856 47,235 Private banks 66,869 82,271 83,633 SDIF banks 5,886 261 252 Foreign banks 5,416 39,676 42,014Development and investment banks 4,942 5,339 5,370Total 241,671 172,403 178,504
Source: The Banks Association of Turkey
Of the total bank employees, 97 were employed by deposit banks, and remaining 3 percent by development and investment banks. In the deposit banks group, the number of employees per bank in state-owned banks was 15.7 thousand, and the number of employees per bank in private banks was 7.6 thousand.
Number of Branches and Employees Per Bank
Branch Employee 2002 2009 2010 2002 2009 2010
Deposit banks 2,958 5,221 5,410 State-owned banks 673 843 915 13,386 14,952 15,745 Private banks 183 399 417 3,343 7,479 7,603 SDIF banks 102 1 1 2,943 261 252 Foreign banks 14 122 123 361 2,334 2,471Development and investment banks 353 411 413Total 972 2,337 1,456 2,283 3,831 3,967
Source: The Banks Association of Turkey
Of total employees in the banking sector, 26 percent were employed in state-owned banks, 47 percent in private banks, and 24 percent in foreign banks.
Number of Branches and Employees (2002-2010)
I-30
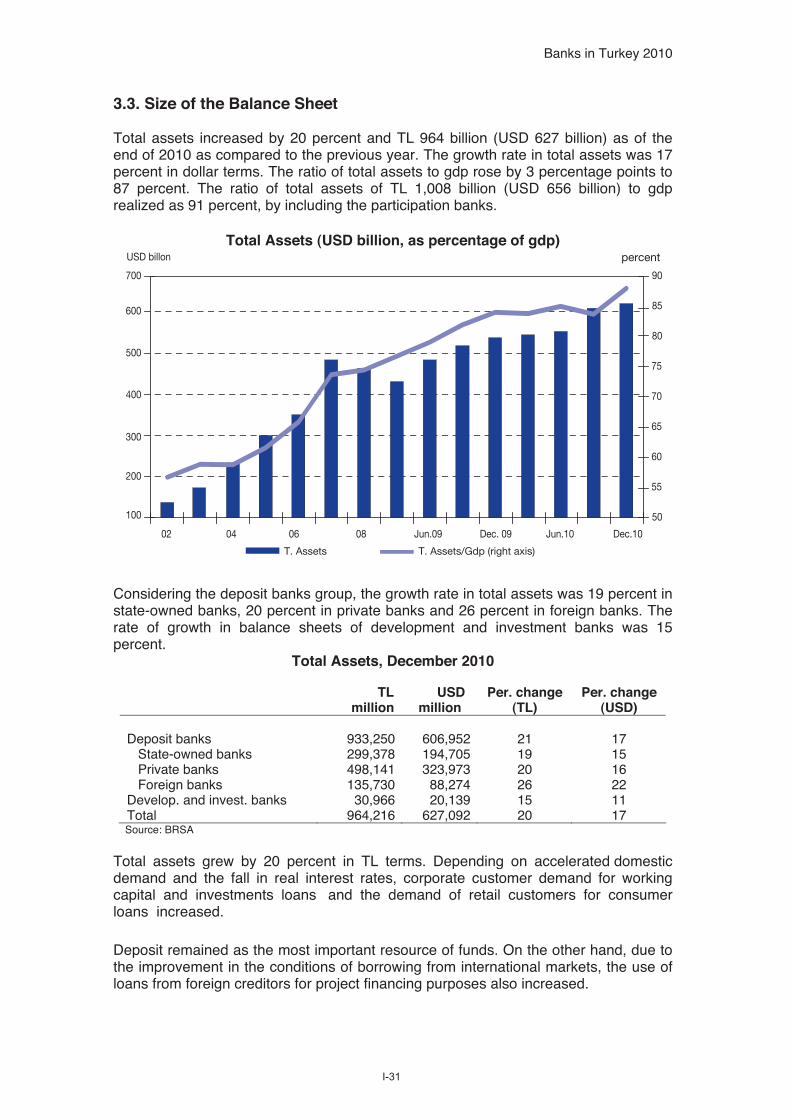
T. Assets T. Assets/Gdp (right axis)
USD billon percent
100
200
300
400
500
600
700
02 04 06 08 Jun.09 Dec. 09 Jun.10 Dec.10
50
55
60
65
70
75
80
85
90
Banks in Turkey 2010
3.3. Size of the Balance Sheet
Total assets increased by 20 percent and TL 964 billion (USD 627 billion) as of the end of 2010 as compared to the previous year. The growth rate in total assets was 17 percent in dollar terms. The ratio of total assets to gdp rose by 3 percentage points to 87 percent. The ratio of total assets of TL 1,008 billion (USD 656 billion) to gdp realized as 91 percent, by including the participation banks.
Total Assets (USD billion, as percentage of gdp)
Considering the deposit banks group, the growth rate in total assets was 19 percent in state-owned banks, 20 percent in private banks and 26 percent in foreign banks. The rate of growth in balance sheets of development and investment banks was 15 percent.
Total Assets, December 2010
TL million
USD million
Per. change (TL)
Per. change (USD)
Deposit banks 933,250 606,952 21 17 State-owned banks 299,378 194,705 19 15 Private banks 498,141 323,973 20 16 Foreign banks 135,730 88,274 26 22 Develop. and invest. banks 30,966 20,139 15 11 Total 964,216 627,092 20 17
Source: BRSA
Total assets grew by 20 percent in TL terms. Depending on accelerated domestic demand and the fall in real interest rates, corporate customer demand for working capital and investments loans and the demand of retail customers for consumer loans increased.
Deposit remained as the most important resource of funds. On the other hand, due to the improvement in the conditions of borrowing from international markets, the use of loans from foreign creditors for project financing purposes also increased.
I-31
Turkish Economy and Banking System in 2010
Nominal Change in Balance Sheet Items (TL million)
Assets 2009 2010
Liquid assets 764 -6,133 Financial assets 67,884 24,579 Loans 19,817 125,661 Other assets 4,886 19,809 Total 93,351 163,916 -TL 94,700 129,626 -Fx -1,349 34,290
Liabilities 2009 2010
Deposits 52,352 96,041 Non-deposit funds 15,216 35,128 Shareholders’ equity 23,728 22,486 Other liabilities 2,055 10,261 Total 93,351 163,916 -TL 86,119 123,071 -Fx 7,232 40,845
Total balance sheet size of the banking sector increased by TL 164 billion in 2010. Of this increase 59 percent (TL 96 billion) stemmed from deposits; 21 percent (TL 35 billion) from non-deposit resources; 14 percent (TL 22 billion) from shareholders’ equity; and 6 percent (TL 10 billion) from other liabilities. Of the resources 77 percent (TL 126 billion) were allocated to loan facilities, 15 percent (TL 25 billion) to securities portfolio; and 12 percent (TL 20 billion) to other assets. As a result of decrease in the effects of global crisis, banks reduced their liquid assets set aside as reserves.
3.4. Market Shares
The share of deposit banks in the total assets was 97, and that of development and investment banks was 3 percent. In the deposit banks group the distribution of market shares remained the same in terms of total assets.
Market Shares of Groups (percentage)
T. assets T. deposits T. loans 02 09 10 02 09 10 02 09 10
Deposit banks 96 97 97 100 100 100 89 96 97 State-owned banks 36 31 31 39 37 38 20 27 29 Private banks 56 52 52 58 50 50 65 52 52 Foreign banks 3 13 13 2 13 12 4 17 15Develop. and invest. banks 4 3 3 - - - 11 4 3Total 100 100 100 100 100 100 100 100 100
Source: BRSA
On the other hand, the share of foreign banks in total deposits reduced by 1 percentage point to 12 percent, while the share of state-owned banks increased by 1 percentage point to 38 percent. The share of state-owned banks in total loans increased from 27 percent to 29 percent, while that of foreign banks reduced by 2 percentage points to 15 percent.
I-32

Banks in Turkey 2010
3.5. Concentration
The shares of the largest five and the largest ten banks in total assets and deposits remained the same, while their shares in total loans increased by 2 percentage pointsand 1 percentage point to 57 percent and 86 percent, respectively.
Concentration in Banking Sector* (percentage)
2002 2007 2009 2010Largest five* T. assets 58 62 63 63 T. deposits 61 64 66 66 T. loans 55 57 55 57Largest ten* T. assets 81 85 87 87 T. deposits 86 89 91 91 T. loans 74 83 85 86
Source: The Banks Association of Turkey * In terms of total assets
As of the end of 2010, the largest five banks included 1 state-owned bank and 4 private banks, and the largest ten banks included 3 state-owned banks, 5 private and 2 foreign banks.
The Number of Banks by Asset Size (2010)
USD billion +0-2 2-5 5-10 10-20 20-40 40+ 02 10 02 10 02 10 02 10 02 10 10NumberDeposit b. 26 14 7 4 1 1 5 5 1 1 7 State 1 1 1 3 Private 11 3 5 2 1 4 1 4 Foreign 10 10 2 4 1 Fund 5 1 2Dev. inv. b. 13 10 1 1 2Total 39 24 8 5 1 3 5 5 1 1 7
There were 7 banks with an asset size above USD 40 billion, and 6 banks with an asset size between USD 10 billion and USD 40 billion. However, more than half of the banks in the banking sector had an asset size below USD 2 billion.
3.6. Balance Sheet TL-FX Structure and “FX Assets-FX Liabilities”
In the balance sheet, TL items continued to increase more rapidly than foreign exchange items. TL items and Fx items grew by 22 percent and 16 percent both at the assets and the liabilities side, respectively.
The share of TL items in the balance sheet rose due to appreciation of TL in real terms as a result of strong demand for TL and increase of use of external resources. On the other hand, particularly in the second half of the year, strong increase in demand for foreign exchange loan relatively limited the reduction in the share of foreign exchange items in the assets. The share of TL assets in balance sheet increased by 1 percentage point to 74 percent, and the share of TL liabilities rose by 2 percentage points to 70 percent.
I-33
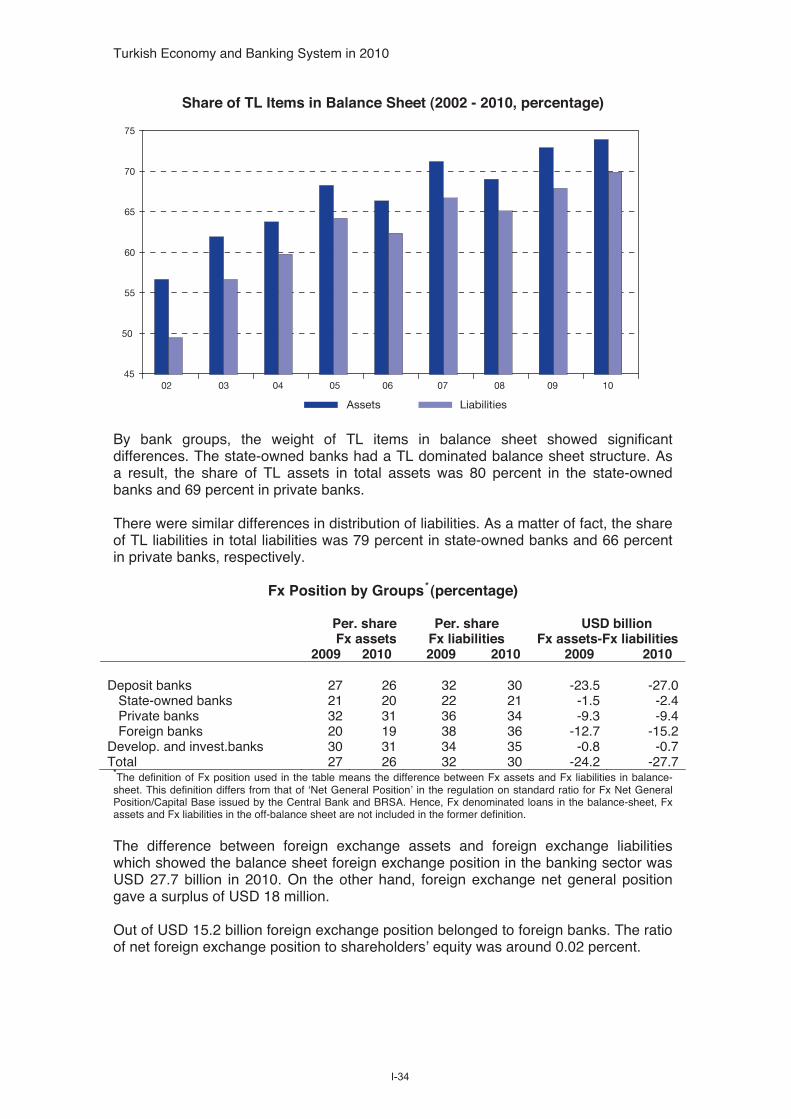
45
50
55
60
65
70
75
02 03 04 05 06 07 08 09 10
Assets Liabilities
Turkish Economy and Banking System in 2010
Share of TL Items in Balance Sheet (2002 - 2010, percentage)
By bank groups, the weight of TL items in balance sheet showed significant differences. The state-owned banks had a TL dominated balance sheet structure. As a result, the share of TL assets in total assets was 80 percent in the state-owned banks and 69 percent in private banks.
There were similar differences in distribution of liabilities. As a matter of fact, the share of TL liabilities in total liabilities was 79 percent in state-owned banks and 66 percent in private banks, respectively.
Fx Position by Groups* (percentage)
Per. share Per. share USD billion Fx assets Fx liabilities Fx assets-Fx liabilities 2009 2010 2009 2010 2009 2010
Deposit banks 27 26 32 30 -23.5 -27.0 State-owned banks 21 20 22 21 -1.5 -2.4 Private banks 32 31 36 34 -9.3 -9.4 Foreign banks 20 19 38 36 -12.7 -15.2Develop. and invest.banks 30 31 34 35 -0.8 -0.7Total 27 26 32 30 -24.2 -27.7
*The definition of Fx position used in the table means the difference between Fx assets and Fx liabilities in balance-sheet. This definition differs from that of ‘Net General Position’ in the regulation on standard ratio for Fx Net General Position/Capital Base issued by the Central Bank and BRSA. Hence, Fx denominated loans in the balance-sheet, Fx assets and Fx liabilities in the off-balance sheet are not included in the former definition.
The difference between foreign exchange assets and foreign exchange liabilities which showed the balance sheet foreign exchange position in the banking sector was USD 27.7 billion in 2010. On the other hand, foreign exchange net general position gave a surplus of USD 18 million.
Out of USD 15.2 billion foreign exchange position belonged to foreign banks. The ratio of net foreign exchange position to shareholders’ equity was around 0.02 percent.
I-34

Average: 21
1 3 5 7 9 11 13 15 17 19 21 23 25 27 29 310
5
10
15
20
25
30
-5
Banks in Turkey 2010
Net General Fx Position (USD million)
2008 2009 2010
Deposit banks* -129 107 -10* State-owned banks -191 93 108 Private banks 44 98 44 Foreign banks 18 -84 -162Development and investment banks 38 -111 28Total 16 46 18
Source: BRSA Weekly Bulletin, *SDIF banks are excluded.
3.7.The Outlook of Banking Sector by Selected Indicators
3.7.1. Growth
Balance sheet size of deposit banks recorded an average growth of 21 percent in 2010.
Growth* (annual, percentage)
*Graph scale was limited for presentation purposes.
Out of 32 deposit banks active in the banking sector, 15 banks grew at a rate higher than the average of the sector. The balance sheet size of 14 deposit banks increased below 21 percent, while balance sheet of 3 deposit banks contracted.
3.7.2. Profitability
Return on equity in deposit banks was recorded as 17.8 percent on average as of December 2010. Return on equity in five banks was above the average, while 2 banks recorded loss.
I-35
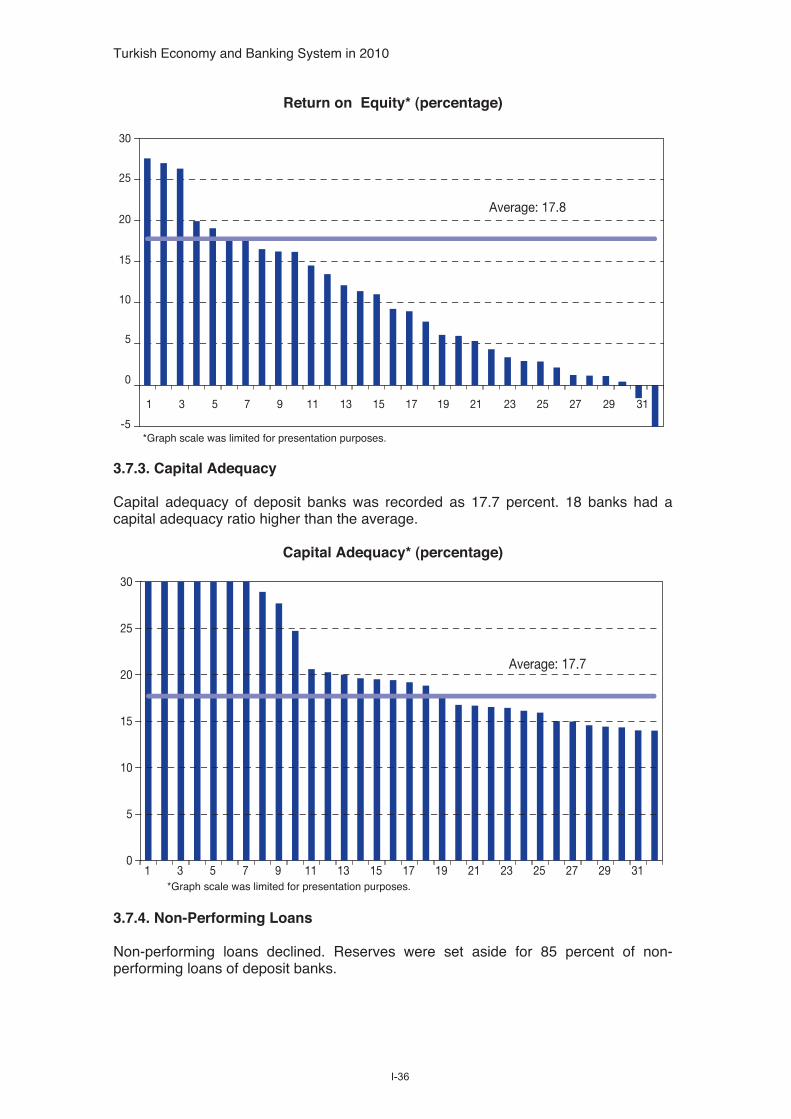
1 3 5 7 9 11 13 15 17 19 21 23 25 27 29 31
0
5
10
15
20
25
30
-5
Average: 17.8
Average: 17.7
0
5
10
15
20
25
30
1 3 5 7 9 11 13 15 17 19 21 23 25 27 29 31
Turkish Economy and Banking System in 2010
Return on Equity* (percentage)
*Graph scale was limited for presentation purposes.
3.7.3. Capital Adequacy
Capital adequacy of deposit banks was recorded as 17.7 percent. 18 banks had a capital adequacy ratio higher than the average.
Capital Adequacy* (percentage)
*Graph scale was limited for presentation purposes.
3.7.4. Non-Performing Loans
Non-performing loans declined. Reserves were set aside for 85 percent of non-performing loans of deposit banks.
*Graph scale was limited for presentation purposes.
I-36
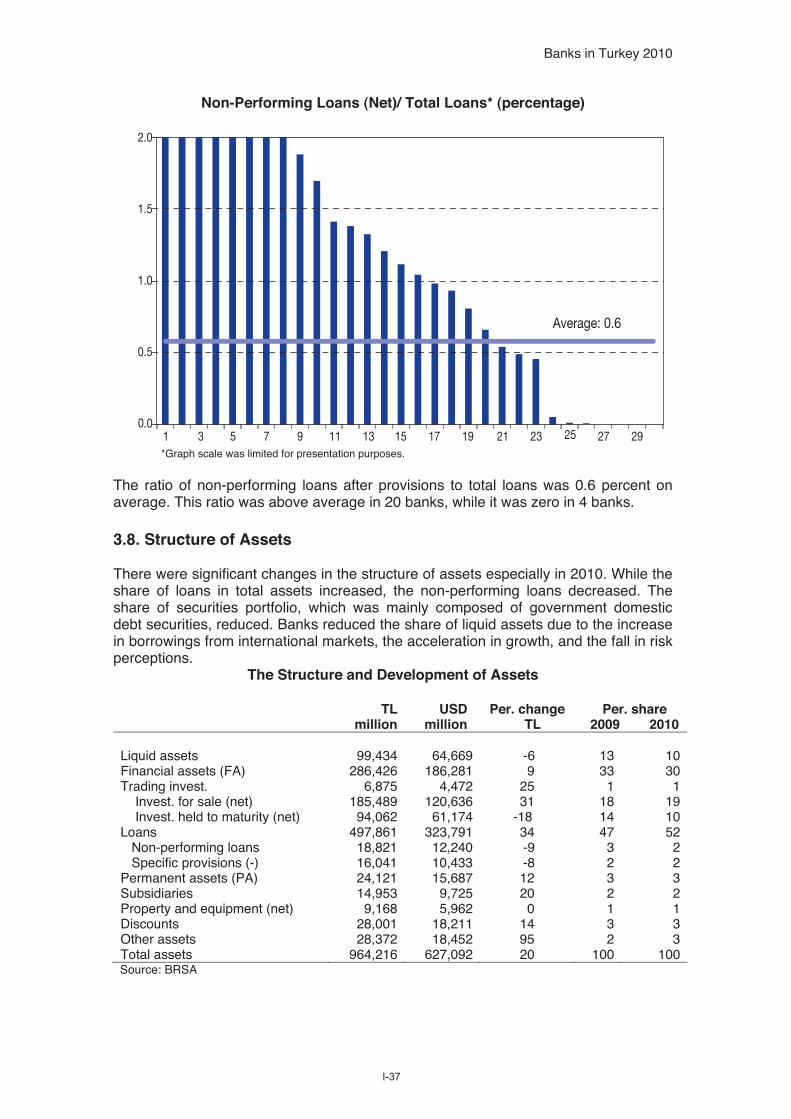
1 3 5 7 9 11 13 15 17 19 21 23 27 290.0
0.5
1.0
1.5
2.0
25
Average: 0.6
Banks in Turkey 2010
Non-Performing Loans (Net)/ Total Loans* (percentage)
*Graph scale was limited for presentation purposes.
The ratio of non-performing loans after provisions to total loans was 0.6 percent on average. This ratio was above average in 20 banks, while it was zero in 4 banks.
3.8. Structure of Assets
There were significant changes in the structure of assets especially in 2010. While the share of loans in total assets increased, the non-performing loans decreased. The share of securities portfolio, which was mainly composed of government domestic debt securities, reduced. Banks reduced the share of liquid assets due to the increase in borrowings from international markets, the acceleration in growth, and the fall in risk perceptions.
The Structure and Development of Assets
TL million
USD million
Per. change TL
Per. share 2009 2010
Liquid assets 99,434 64,669 -6 13 10Financial assets (FA) 286,426 186,281 9 33 30Trading invest. 6,875 4,472 25 1 1 Invest. for sale (net) 185,489 120,636 31 18 19 Invest. held to maturity (net) 94,062 61,174 -18 14 10Loans 497,861 323,791 34 47 52 Non-performing loans 18,821 12,240 -9 3 2 Specific provisions (-) 16,041 10,433 -8 2 2Permanent assets (PA) 24,121 15,687 12 3 3Subsidiaries 14,953 9,725 20 2 2Property and equipment (net) 9,168 5,962 0 1 1Discounts 28,001 18,211 14 3 3Other assets 28,372 18,452 95 2 3Total assets 964,216 627,092 20 100 100
Source: BRSA
I-37

0
5
10
15
20
25
30
35
40
45
Dec-07
LoansSecurities
Jun-07 Dec-08 Jun-08 Dec-09 Jun-10 Dec-10
5
10
15
20
25
30
35
40
45
50
55
02 04 06 08 Mar.10 Sep.10
Loans/T. Assets Loans/Gdp
Turkish Economy and Banking System in 2010
The growth rate in loans was 23 percent in the first half, and 34 percent as of the end of year on annual basis. The annual growth rate of the securities portfolio slowed down from 35 percent as of December 2009 to 9 percent as of December 2010. The share of loans in total assets rose by 5 percentage points to 52 percent, and the shares of securities portfolio and liquid assets declined by 3 percentage points each to 30 percent and 10 percent, respectively.
Total loans were consisted of TL loans by 72 percent and foreign exchange loans by 28 percent. The share of corporate loans in total loans was 68 percent, and the share of loans borrowed by households was 32 percent, as of the end of 2010.
Total Loans and Securities (annual, percentage change)
The share of loans borrowed by households in total loans was 32 percent. The share of housing loans in consumer loans was 34 percent, credit cards 27 percent, and the automobile loans 3 percent.
Loans/ Total Assets and Loans/Gdp (percentage)
I-38

Banks in Turkey 2010
According to the data published by BRSA, cash loans extended to Small and Medium-Size Enterprises (SMEs) increased by 51 percent, and non-cash loans increased by 26 percent. The share of loans extended to SMEs in the total loan stock increased by 1 percentage point to 22 percent as compared to 2009. The number of bank customers categorized as SMEs also increased by 9 percent to 1.9 million in 2010. The non-performing SME loans reduced by 15 percent to TL 5.9 billion, and their share in total SME loans declined from 8.3 percent to 4.7 percent.
Loans By Sectors* (TL million)
Per. change Per. share 2010 (annual) 2002 2009 2010
Corporate loans 381,803 36 86 67 68Retail loans 181,780 30 14 33 32Credit cards 49,098 17 9 9 9Consumer loans 132,682 36 5 23 24 Housing 61,660 34 1 11 11 Automobile 6,027 22 1 1 1 Other 64,995 39 3 11 12Total 563,583 34 100 100 100
Source: BRSA * Participation banks are included.
The share of loans extended to manufacturing industry in total corporate cash loans was 38 percent, while those of trade sector, services sector and construction sector were 15 percent, and 13 percent and 8 percent, respectively. The loans extended to energy sector, the share of which in the total loans was gradually increasing, realized as 7 percent of the total loans.
In deposit banks and development and investment banks, the non-performing loans before specific provisions reduced by 9 percent to TL 18.8 billion in 2010. Specific provisions were set aside for 85 percent of non-performing loans. This rate was 88 percent in state-owned banks, 87 percent in private banks and 81 percent in foreign banks. The ratio of non-performing loans after specific provisions to total loans reduced from 0.9 percent to 0.6 percent.
Non-Performing Loans* and Specific Provisions (percentage)
NPLs/ Total loans Provisions/ NPLs2002 2009 2010 2009 2010
Deposit banks 20 5.7 3.9 84.6 85.3 State-owned banks 24 4.6 3.4 86.7 87.8 Private banks 9 5.5 3.4 88.0 86.5 Foreign banks 5 8.1 6.2 75.3 80.7Development and investment banks 3 1.4 2 75.1 80.6Total 19 5.6 3.8 84.4 85.2
Source: BRSA * Before provisions
The non-performing loans, by including participation banks decreased by 9 percent in total, and 11 percent in consumer loans, and 8 percent in corporate loans. Among the types of loans extended to households, the most rapid reduction in non-performing loans was recorded in automobile loans with 29 percent.
I-39
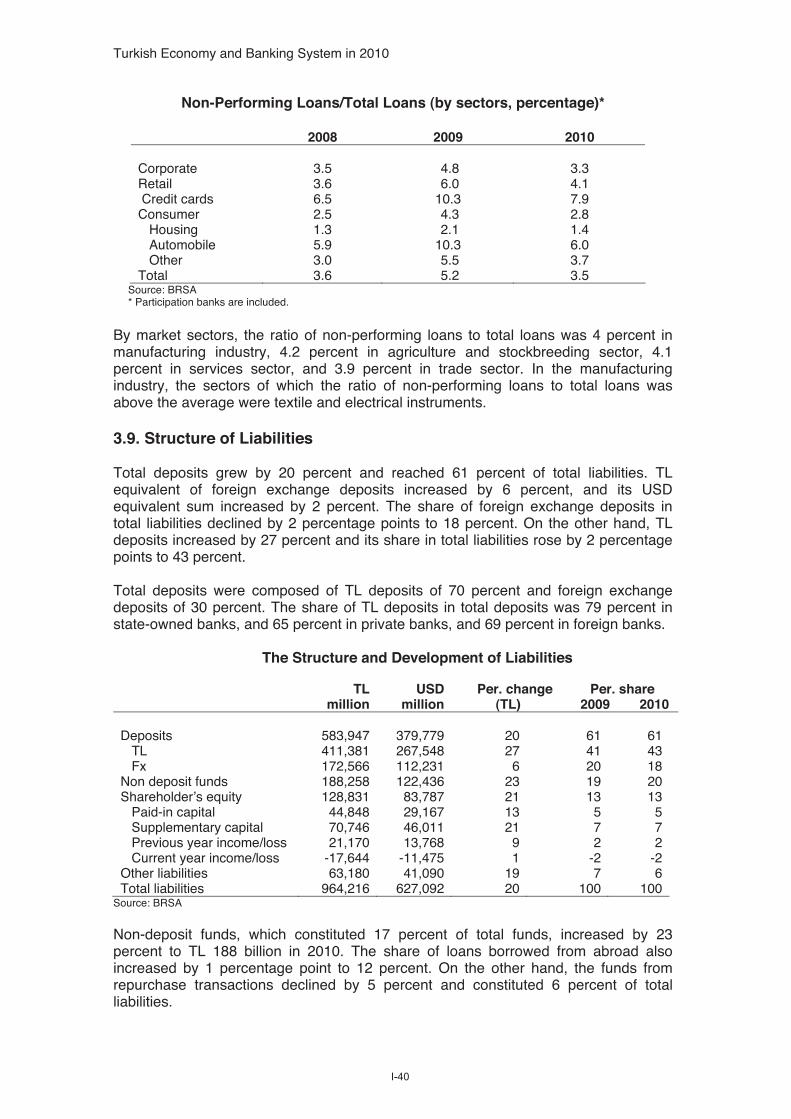
Turkish Economy and Banking System in 2010
Non-Performing Loans/Total Loans (by sectors, percentage)*
2008 2009 2010 Corporate 3.5 4.8 3.3 Retail 3.6 6.0 4.1 Credit cards 6.5 10.3 7.9 Consumer 2.5 4.3 2.8 Housing 1.3 2.1 1.4 Automobile 5.9 10.3 6.0 Other 3.0 5.5 3.7 Total 3.6 5.2 3.5
Source: BRSA * Participation banks are included.
By market sectors, the ratio of non-performing loans to total loans was 4 percent in manufacturing industry, 4.2 percent in agriculture and stockbreeding sector, 4.1 percent in services sector, and 3.9 percent in trade sector. In the manufacturing industry, the sectors of which the ratio of non-performing loans to total loans was above the average were textile and electrical instruments.
3.9. Structure of Liabilities
Total deposits grew by 20 percent and reached 61 percent of total liabilities. TL equivalent of foreign exchange deposits increased by 6 percent, and its USD equivalent sum increased by 2 percent. The share of foreign exchange deposits in total liabilities declined by 2 percentage points to 18 percent. On the other hand, TL deposits increased by 27 percent and its share in total liabilities rose by 2 percentage points to 43 percent.
Total deposits were composed of TL deposits of 70 percent and foreign exchange deposits of 30 percent. The share of TL deposits in total deposits was 79 percent in state-owned banks, and 65 percent in private banks, and 69 percent in foreign banks.
The Structure and Development of Liabilities
TLmillion
USDmillion
Per. change (TL)
Per. share 2009 2010
Deposits 583,947 379,779 20 61 61 TL 411,381 267,548 27 41 43 Fx 172,566 112,231 6 20 18Non deposit funds 188,258 122,436 23 19 20Shareholder’s equity 128,831 83,787 21 13 13 Paid-in capital 44,848 29,167 13 5 5 Supplementary capital 70,746 46,011 21 7 7 Previous year income/loss 21,170 13,768 9 2 2 Current year income/loss -17,644 -11,475 1 -2 -2Other liabilities 63,180 41,090 19 7 6Total liabilities 964,216 627,092 20 100 100
Source: BRSA
Non-deposit funds, which constituted 17 percent of total funds, increased by 23 percent to TL 188 billion in 2010. The share of loans borrowed from abroad also increased by 1 percentage point to 12 percent. On the other hand, the funds from repurchase transactions declined by 5 percent and constituted 6 percent of total liabilities.
I-40

Banks in Turkey 2010
Total Deposits by Bank Groups (TL million, 2010)
Percentage share
TL FX Total TL FX Total
Deposit banks 411,381 172,566 583,947 70 30 100 State-owned banks 172,811 46,819 219,630 79 21 100 Private banks 188,825 103,134 291,958 65 35 100 Foreign banks 49,746 22,613 72,359 69 31 100 Development and investment banks - - - - - - Total 411,381 172,566 583,947 70 30 100
Source: BRSA
Average maturity of total deposits was 2.4 months. Average maturity of foreign exchange deposits which was 2.7 months in December 2009 rose to 2.8 months as of December 2010, while average maturity of TL deposits remained the same at 2.2 months.
3.10. Shareholders’ Equity
Shareholders’ equity increased by 21 percent in TL terms to TL 129 billion, and increased by 17 percent in dollar terms to USD 84 billion. Free shareholders’ equity (shareholders’ equity – fixed assets – non-performing loans after provisions) grew from TL 82 billion (USD 55 billion) to TL 102 billion (USD 66 billion).
Shareholders’ Equity
TL million
USDmillion
Per. change (TL)
Per. change (USD)
Share in total liabilities (Per.)
Deposit banks 114,717 74,608 22 18 12 State-owned banks 30,021 19,525 28 24 10 Private banks 66,319 43,132 23 19 13 Foreign banks 18,377 11,952 16 12 14 Development and investment banks 14,114 9,179 12 8 46 Total 128,831 83,787 21 17 13
Source: BRSA
The ratio of shareholders’ equity to total assets remained almost the same at 13 percent. The ratio of free shareholders’ equity to total assets increased by 0.4 percentage points to 10.6 percent. The increase in free shareholders’ equity resulted mainly from decline in non-performing loans.
Free Shareholders’ Equity*
TL million Share in total assets (Per.)2002 2009 2010 2002 2009 2010
Deposit banks 3,053 69,597 88,542 1.5 9.0 9.5 State-owned banks 700 19,257 24,791 0.9 7.7 8.3 Private banks 1,262 38,195 48,759 1.1 9.2 9.8 Foreign banks 1,091 12,145 14,992 16.5 11.3 11.0Development and investment banks 2,550 11,910 13,387 27.0 44.0 43.2Total 5,602 81,507 101,929 2.6 10.2 10.6
Source: BRSA* Shareholders’ equity-permanent assets-loans under follow-up after specific provisions
I-41
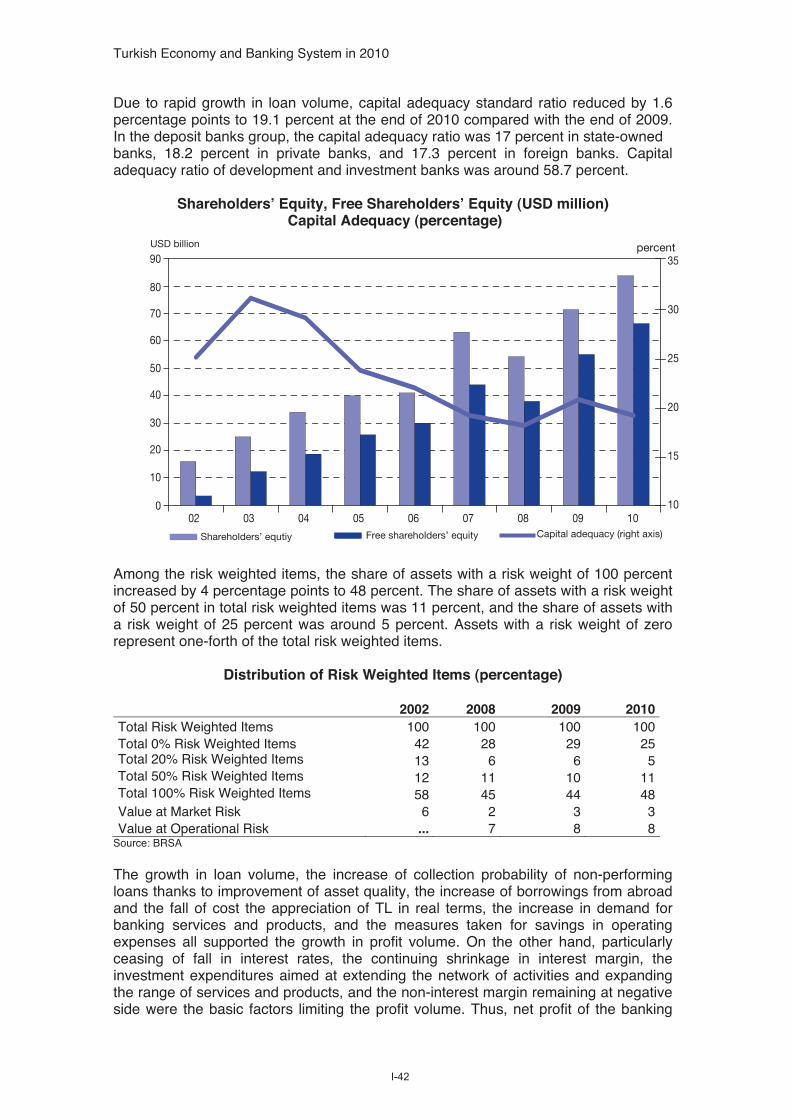
USD billion percent
0
10
20
30
40
50
60
70
80
90
02 03 04 05 06 07 08 09 10
35
10
15
20
25
30
Capital adequacy (right axis)Shareholders’ equtiy Free shareholders’ equity
Turkish Economy and Banking System in 2010
Due to rapid growth in loan volume, capital adequacy standard ratio reduced by 1.6 percentage points to 19.1 percent at the end of 2010 compared with the end of 2009. In the deposit banks group, the capital adequacy ratio was 17 percent in state-owned banks, 18.2 percent in private banks, and 17.3 percent in foreign banks. Capital adequacy ratio of development and investment banks was around 58.7 percent.
Shareholders’ Equity, Free Shareholders’ Equity (USD million) Capital Adequacy (percentage)
Among the risk weighted items, the share of assets with a risk weight of 100 percent increased by 4 percentage points to 48 percent. The share of assets with a risk weight of 50 percent in total risk weighted items was 11 percent, and the share of assets with a risk weight of 25 percent was around 5 percent. Assets with a risk weight of zero represent one-forth of the total risk weighted items.
Distribution of Risk Weighted Items (percentage)
2002 2008 2009 2010Total Risk Weighted Items 100 100 100 100Total 0% Risk Weighted Items 42 28 29 25Total 20% Risk Weighted Items 13 6 6 5Total 50% Risk Weighted Items 12 11 10 11Total 100% Risk Weighted Items 58 45 44 48Value at Market Risk 6 2 3 3Value at Operational Risk ... 7 8 8
Source: BRSA
The growth in loan volume, the increase of collection probability of non-performing loans thanks to improvement of asset quality, the increase of borrowings from abroad and the fall of cost the appreciation of TL in real terms, the increase in demand for banking services and products, and the measures taken for savings in operating expenses all supported the growth in profit volume. On the other hand, particularly ceasing of fall in interest rates, the continuing shrinkage in interest margin, the investment expenditures aimed at extending the network of activities and expanding the range of services and products, and the non-interest margin remaining at negative side were the basic factors limiting the profit volume. Thus, net profit of the banking
I-42

-10
-8
-6
-4
-2
0
2
4
6
8
10
04 05 06 07 08 09 10
Banks in Turkey 2010
sector rose by 9 percent to 21.2 billion TL. Net profit increased by 7 percent in state-owned banks and 17 percent in private banks, while it decreased by 9 percent and 15 percent in foreign banks and development and investment banks, respectively.
Net Profit-Loss, 2010 Per. changeTL million USD million TL USD
Deposit banks 20,324 13,218 11 6 State-owned banks 6,881 4,475 7 3 Private banks 11,553 7,514 17 13 Foreign banks 1,890 1,229 -9 -12Development and investment banks 846 550 -15 -18Total 21,170 13,768 9 5
Source: BRSA
The return on equity reduced by 1.9 percentage points to 16.4 percent. Despite this, the return on equity remained 7.8 percentage points above the return on government domestic debt instruments. The return on assets declined by 0.2 percentage points to 2.2 percent.
Difference Between Return on Equity and Return on Government Bonds(percentage)
Profitability ratios declined in all bank groups. The state-owned deposit banks had the highest return on equity with 22.9 percent.
Return on Assets and Return on Equity, 2010
Return on assets Return on equity (percentage) (percentage)
Deposit banks 2.2 17.7 State-owned banks 2.3 22.9 Private banks 2.3 17.4 Foreign banks 1.4 10.3 Development and investment banks 2.7 6.0 Total 2.2 16.4 Source: BRSA
I-43
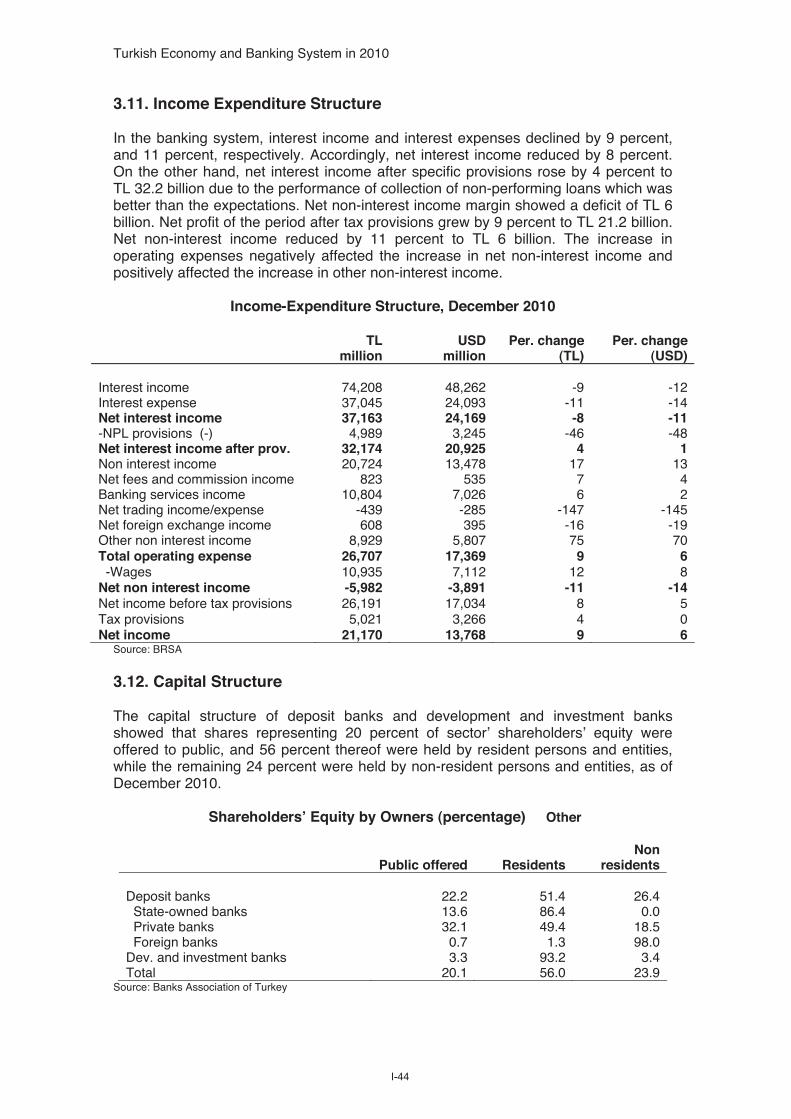
Turkish Economy and Banking System in 2010
3.11. Income Expenditure Structure
In the banking system, interest income and interest expenses declined by 9 percent, and 11 percent, respectively. Accordingly, net interest income reduced by 8 percent. On the other hand, net interest income after specific provisions rose by 4 percent to TL 32.2 billion due to the performance of collection of non-performing loans which was better than the expectations. Net non-interest income margin showed a deficit of TL 6 billion. Net profit of the period after tax provisions grew by 9 percent to TL 21.2 billion. Net non-interest income reduced by 11 percent to TL 6 billion. The increase in operating expenses negatively affected the increase in net non-interest income and positively affected the increase in other non-interest income.
Income-Expenditure Structure, December 2010
TLmillion
USDmillion
Per. change (TL)
Per. change (USD)
Interest income 74,208 48,262 -9 -12Interest expense 37,045 24,093 -11 -14Net interest income 37,163 24,169 -8 -11-NPL provisions (-) 4,989 3,245 -46 -48Net interest income after prov. 32,174 20,925 4 1Non interest income 20,724 13,478 17 13Net fees and commission income 823 535 7 4Banking services income 10,804 7,026 6 2Net trading income/expense -439 -285 -147 -145Net foreign exchange income 608 395 -16 -19Other non interest income 8,929 5,807 75 70Total operating expense 26,707 17,369 9 6 -Wages 10,935 7,112 12 8Net non interest income -5,982 -3,891 -11 -14Net income before tax provisions 26,191 17,034 8 5Tax provisions 5,021 3,266 4 0Net income 21,170 13,768 9 6
Source: BRSA
3.12. Capital Structure
The capital structure of deposit banks and development and investment banks showed that shares representing 20 percent of sector’ shareholders’ equity were offered to public, and 56 percent thereof were held by resident persons and entities, while the remaining 24 percent were held by non-resident persons and entities, as of December 2010.
Shareholders’ Equity by Owners (percentage) Other
Public offered Residents Non residents
Deposit banks 22.2 51.4 26.4 State-owned banks 13.6 86.4 0.0 Private banks 32.1 49.4 18.5 Foreign banks 0.7 1.3 98.0Dev. and investment banks 3.3 93.2 3.4Total 20.1 56.0 23.9
Source: Banks Association of Turkey
I-44
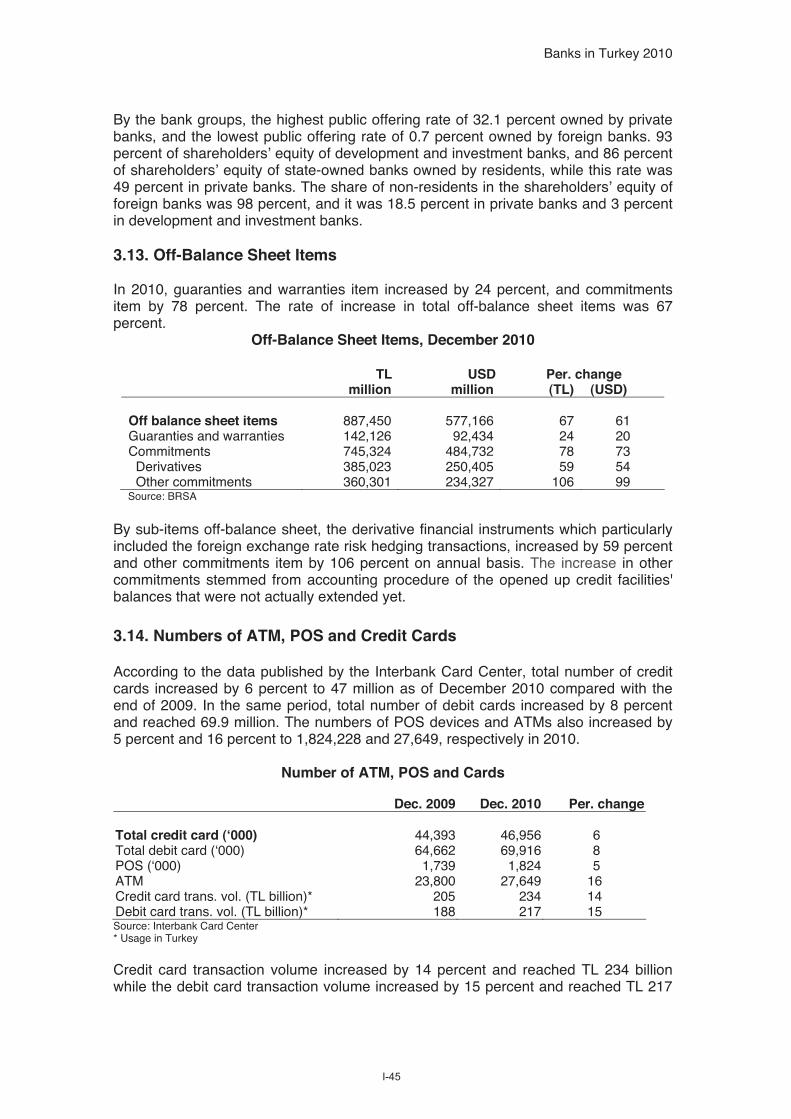
Banks in Turkey 2010
By the bank groups, the highest public offering rate of 32.1 percent owned by private banks, and the lowest public offering rate of 0.7 percent owned by foreign banks. 93 percent of shareholders’ equity of development and investment banks, and 86 percent of shareholders’ equity of state-owned banks owned by residents, while this rate was 49 percent in private banks. The share of non-residents in the shareholders’ equity of foreign banks was 98 percent, and it was 18.5 percent in private banks and 3 percent in development and investment banks.
3.13. Off-Balance Sheet Items
In 2010, guaranties and warranties item increased by 24 percent, and commitments item by 78 percent. The rate of increase in total off-balance sheet items was 67 percent.
Off-Balance Sheet Items, December 2010
TL USD Per. change million million (TL) (USD)
Off balance sheet items 887,450 577,166 67 61Guaranties and warranties 142,126 92,434 24 20Commitments 745,324 484,732 78 73 Derivatives 385,023 250,405 59 54 Other commitments 360,301 234,327 106 99
Source: BRSA
By sub-items off-balance sheet, the derivative financial instruments which particularly included the foreign exchange rate risk hedging transactions, increased by 59 percent and other commitments item by 106 percent on annual basis. The increase in other commitments stemmed from accounting procedure of the opened up credit facilities' balances that were not actually extended yet.
3.14. Numbers of ATM, POS and Credit Cards
According to the data published by the Interbank Card Center, total number of credit cards increased by 6 percent to 47 million as of December 2010 compared with the end of 2009. In the same period, total number of debit cards increased by 8 percent and reached 69.9 million. The numbers of POS devices and ATMs also increased by 5 percent and 16 percent to 1,824,228 and 27,649, respectively in 2010.
Number of ATM, POS and Cards
Dec. 2009 Dec. 2010 Per. change
Total credit card (‘000) 44,393 46,956 6 Total debit card (‘000) 64,662 69,916 8 POS (‘000) 1,739 1,824 5 ATM 23,800 27,649 16Credit card trans. vol. (TL billion)* 205 234 14Debit card trans. vol. (TL billion)* 188 217 15Source: Interbank Card Center * Usage in Turkey
Credit card transaction volume increased by 14 percent and reached TL 234 billion while the debit card transaction volume increased by 15 percent and reached TL 217
I-45
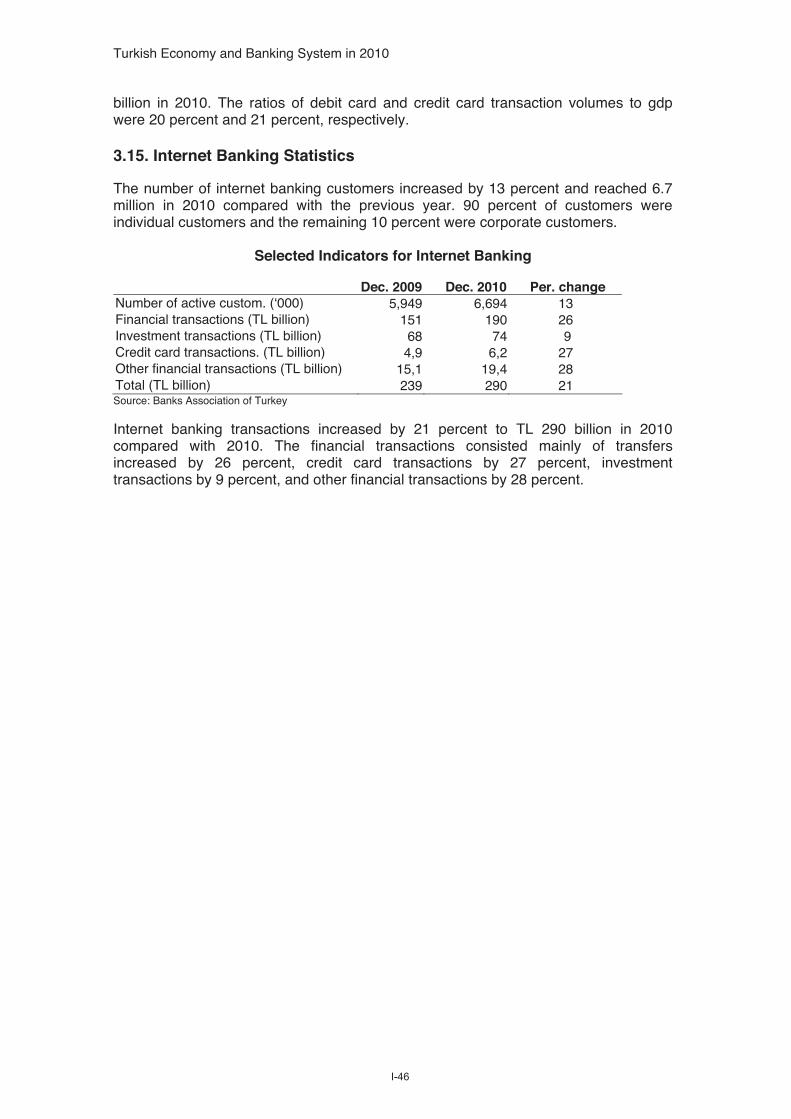
Turkish Economy and Banking System in 2010
billion in 2010. The ratios of debit card and credit card transaction volumes to gdp were 20 percent and 21 percent, respectively.
3.15. Internet Banking Statistics
The number of internet banking customers increased by 13 percent and reached 6.7 million in 2010 compared with the previous year. 90 percent of customers were individual customers and the remaining 10 percent were corporate customers.
Selected Indicators for Internet Banking
Dec. 2009 Dec. 2010 Per. change Number of active custom. (‘000) 5,949 6,694 13Financial transactions (TL billion) 151 190 26Investment transactions (TL billion) 68 74 9 Credit card transactions. (TL billion) 4,9 6,2 27Other financial transactions (TL billion) 15,1 19,4 28Total (TL billion) 239 290 21Source: Banks Association of Turkey
Internet banking transactions increased by 21 percent to TL 290 billion in 2010 compared with 2010. The financial transactions consisted mainly of transfers increased by 26 percent, credit card transactions by 27 percent, investment transactions by 9 percent, and other financial transactions by 28 percent.
I-46

II-1


II-3
General Information (*)
Date of Establishment : 1958
Members : Deposit banks and development andinvestment banks operating in Turkey
Chairman of the Board : Hüseyin Aydın - Türkiye Halk Bankası A. .
Deputy Chairman : Varol Civil - Türk Ekonomi Bankası A. .
Board of Directors : Türkiye Cumhuriyeti Ziraat Bankası A. .,Türkiye Bankası A. .,Türkiye Garanti Bankası A. ., Akbank T.A. .,Yapı ve Kredi Bankası A. .,Türkiye Vakıflar Bankası T.A.O., Türkiye Halk Bankası A. ., Finans Bank A. .,Türk Ekonomi Bankası A. ., HSBC Bank A. .,
ekerbank T.A. .,Türkiye Sınai Kalkınma Bankası A. .,Turkland Bank A. .
Auditors : Denizbank A. .,Türk Eximbank, Eurobank Tekfen A. .
Secretary General : Dr. Ekrem Keskin
Head Office : Nispetiye Cad. Akmerkez, B3 Blok, Kat 1334340 Etilerstanbul
Turkey
Phone : 90-212- 282 09 73Fax : 90-212- 282 09 46URL : www.tbb.org.trE-mail : [email protected]
Number of Employees : 40
Ankara Representative Phone : 90-312-419 49 55Office Fax : 90-312-417 66 59
stanbul Training Center Phone : 90-212-233 01 50, 233 01 53Fax : 90-212-233 01 83
(*) Information provided as of May 6, 2011
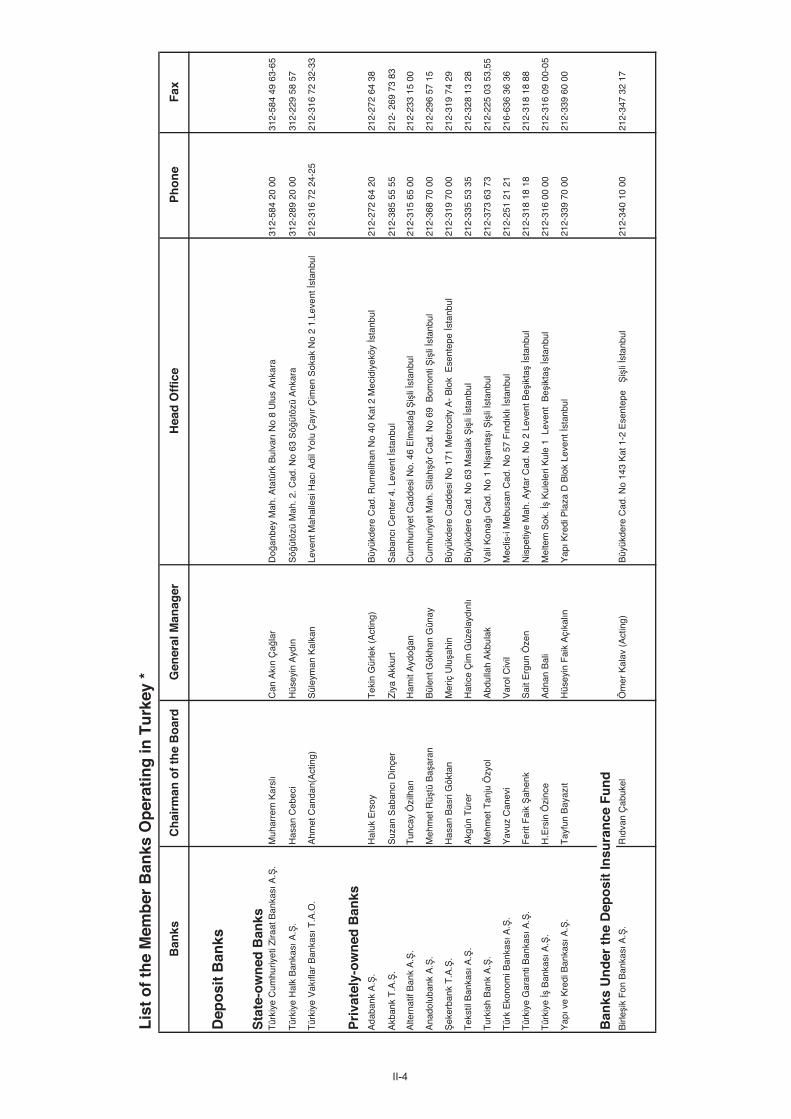
II-4
Lis
t o
f th
e M
emb
er B
anks
Op
erat
ing
in T
urk
ey *
Ban
ksC
hai
rman
of
the
Bo
ard
Gen
eral
Man
ager
Hea
d O
ffic
eP
ho
ne
Fax
Dep
osi
t B
anks
Sta
te-o
wn
ed B
anks
Tür
kiye
Cum
huriy
eti Z
iraat
Ban
kası
A.
.M
uhar
rem
Kar
slı
Can
Akı
n Ç
ala
rD
oan
bey
Mah
. Ata
türk
Bul
varı
No
8 U
lus
Ank
ara
312-
584
20 0
031
2-58
4 49
63-
65
Tür
kiye
Hal
k B
anka
sı A
..
Has
an C
ebec
iH
üsey
in A
ydın
Sö
ütöz
ü M
ah. 2
. Cad
. No
63 S
öüt
özü
Ank
ara
312-
289
20 0
031
2-22
9 58
57
Tür
kiye
Vakıfl
ar B
anka
sı T
.A.O
.A
hmet
Can
dan(
Act
ing)
Sül
eym
an K
alka
nLe
vent
Mah
alle
si H
acı A
dil Y
olu
Çayır
Çim
en S
okak
No
2 1.
Leve
ntst
anbu
l21
2-31
6 72
24-
2521
2-31
6 72
32-
33
Pri
vate
ly-o
wn
ed B
anks
Ada
bank
A.
.H
aluk
Ers
oyT
ekin
Gür
lek
(Act
ing)
Büy
ükde
re C
ad. R
umel
ihan
No
40 K
at 2
Mec
idiy
eköy
sta
nbul
212-
272
64 2
021
2-27
2 64
38
Akb
ank
T.A
..
Suz
an S
aban
cı D
inçe
rZ
iya
Akk
urt
Sab
ancı
Cen
ter
4. L
even
t st
anbu
l21
2-38
5 55
55
212-
269
73
83
Alte
rnat
if B
ank
A.
.T
unca
y Ö
zilh
anH
amit
Ayd
oan
Cum
huriy
et C
adde
si N
o. 4
6 E
lmad
ai
list
anbu
l21
2-31
5 65
00
212-
233
15 0
0
Ana
dolu
bank
A.
.M
ehm
et R
ütü
Ba
aran
Bül
ent G
ökha
n G
ünay
Cum
huriy
et M
ah. S
ilah
ör C
ad. N
o 69
Bom
onti
ili
stan
bul
212-
368
70 0
021
2-29
6 57
15
eker
bank
T.A
..
Has
an B
asri
Gök
tan
Mer
iç U
luah
inB
üyük
dere
Cad
desi
No
171
Met
roci
ty A
- B
lok
Ese
ntep
e st
anbu
l21
2-31
9 70
00
212-
319
74 2
9
Tek
stil
Ban
kası
A.
.A
kgün
Tür
erH
atic
e Ç
im G
üzel
aydı
nlı
Büy
ükde
re C
ad. N
o 63
Mas
lak
ili
stan
bul
212-
335
53 3
521
2-32
8 13
28
Tur
kish
Ban
k A
..
Meh
met
Tan
ju Ö
zyol
Abd
ulla
h A
kbul
akV
ali K
onaı C
ad. N
o 1
Ni
antaı
ili
stan
bul
212-
373
63 7
321
2-22
5 03
53,
55
Tür
k E
kono
mi B
anka
sı A
..
Yav
uz C
anev
iV
arol
Civ
ilM
eclis
-i M
ebus
an C
ad. N
o 57
Fın
dıklı
stan
bul
212-
251
21 2
121
6-63
6 36
36
Tür
kiye
Gar
anti
Ban
kası
A.
.F
erit
Fai
k ah
enk
Sai
t Erg
un Ö
zen
Nis
petiy
e M
ah. A
ytar
Cad
. No
2 Le
vent
Be
ikta
stan
bul
212-
318
18 1
821
2-31
8 18
88
Tür
kiye
Ban
kası
A.
.H
.Ers
in Ö
zinc
eA
dnan
Bal
iM
elte
m S
ok.
Kul
eler
i Kul
e 1
Lev
ent
Be
ikta
stan
bul
212-
316
00 0
021
2-31
6 09
00-
05
Yapı v
e K
redi
Ban
kası
A.
.T
ayfu
n B
ayazıt
Hüs
eyin
Fai
k A
çıka
lınY
apı K
redi
Pla
za D
Blo
k Le
vent
sta
nbul
212-
339
70 0
021
2-33
9 60
00
Ban
ks U
nd
er t
he
Dep
osi
t In
sura
nce
Fu
nd
Birl
eik
Fon
Ban
kası
A.
.Rıd
van
Çab
ukel
Öm
er K
alav
(A
ctin
g)B
üyük
dere
Cad
. No
143
Kat
1-2
Ese
ntep
e
ili
stan
bul
212-
340
10 0
021
2-34
7 32
17
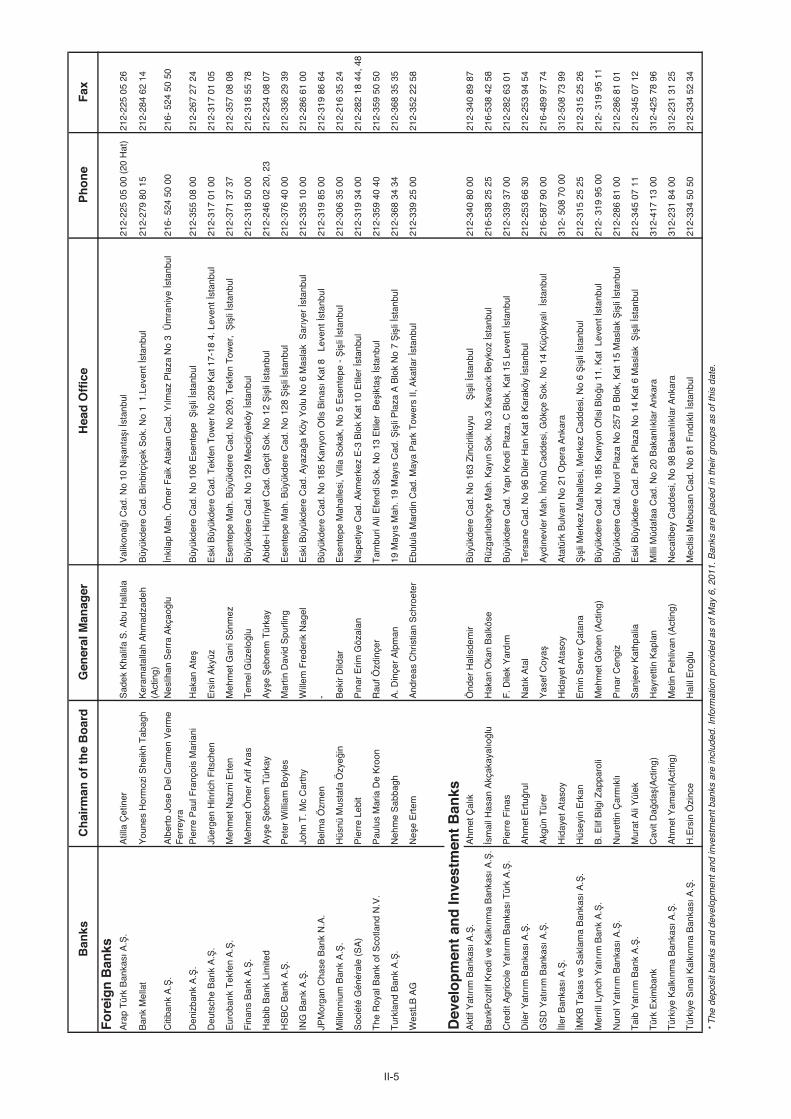
II-5
Ban
ksC
hai
rman
of
the
Bo
ard
Gen
eral
Man
ager
Hea
d O
ffic
eP
ho
ne
Fax
Fo
reig
n B
anks
Ara
p T
ürk
Ban
kası
A.
.A
tilla
Çet
iner
Sad
ek K
halif
a S
. Abu
Hal
lala
Val
ikon
aı C
ad. N
o 10
Ni
antaı
stan
bul
212-
225
05 0
0 (2
0 H
at)
212-
225
05 2
6
Ban
k M
ella
tY
oune
s H
orm
ozi S
heik
h T
abag
hK
eram
atal
lah
Ahm
adza
deh
(Act
ing)
Büy
ükde
re C
ad. B
inbi
rçiç
ek S
ok. N
o 1
1.L
even
t st
anbu
l21
2-27
9 80
15
212-
284
62 1
4
Citi
bank
A.
.A
lber
to J
ose
Del
Car
men
Ver
me
Fer
reyr
aN
eslih
an S
erra
Akç
aolu
nkila
p M
ah. Ö
mer
Fai
k A
taka
n C
ad. Yılm
az P
laza
No
3 Ü
mra
niye
sta
nbul
216-
524
50
0021
6- 5
24 5
0 50
Den
izba
nk A
..
Pie
rre
Pau
l Fra
nçoi
s M
aria
niH
akan
Ate
Büy
ükde
re C
ad. N
o 10
6 E
sent
epe
ili
stan
bul
212-
355
08 0
021
2-26
7 27
24
Deu
tsch
e B
ank
A.
.Jü
erge
n H
inric
h F
itsch
enE
rsin
Aky
üzE
ski B
üyük
dere
Cad
. Tek
fen
Tow
er N
o 20
9 K
at 1
7-18
4. L
even
t st
anbu
l21
2-31
7 01
00
212-
317
01 0
5
Eur
oban
k T
ekfe
n A
..
Meh
met
Naz
mi E
rten
Meh
met
Gan
i Sön
mez
Ese
ntep
e M
ah. B
üyük
dere
Cad
. No
209,
Tek
fen
Tow
er,
ili
stan
bul
212-
371
37 3
7 21
2-35
7 08
08
Fin
ans
Ban
k A
..
Meh
met
Öm
er A
rif A
ras
Tem
el G
üzel
olu
Büy
ükde
re C
ad. N
o 12
9 M
ecid
iyek
öy s
tanb
ul21
2-31
8 50
00
212-
318
55 7
8
Hab
ib B
ank
Lim
ited
Ay
eeb
nem
Tür
kay
Ay
eeb
nem
Tür
kay
Abi
de-i
Hür
riyet
Cad
. Geç
it S
ok. N
o 12
i
list
anbu
l21
2-24
6 02
20,
23
212-
234
08 0
7
HS
BC
Ban
k A
..
Pet
er W
illia
m B
oyle
sM
artin
Dav
id S
purli
ngE
sent
epe
Mah
. Büy
ükde
re C
ad. N
o 12
8 i
list
anbu
l21
2-37
6 40
00
212-
336
29 3
9
ING
Ban
k A
..
John
T. M
c C
arth
yW
illem
Fre
derik
Nag
elE
ski B
üyük
dere
Cad
. Aya
zaa
Köy
Yol
u N
o 6
Mas
lak
Sarıy
er s
tanb
ul21
2-33
5 10
00
212-
286
61 0
0
JPM
orga
n C
hase
Ban
k N
.A.
Bel
ma
Özm
en-
Büy
ükde
re C
ad. N
o 18
5 K
anyo
n O
fis B
inası K
at 8
Le
vent
sta
nbul
212-
319
85 0
021
2-31
9 86
64
Mill
enni
um B
ank
A.
.H
üsnü
Mus
tafa
Özy
ein
Bek
ir D
ildar
Ese
ntep
e M
ahal
lesi
, Vill
a S
okak
, No
5 E
sent
epe
- i
list
anbu
l21
2-30
6 35
00
212-
216
35 2
4
Soc
iété
Gén
éral
e (S
A)
Pie
rre
Lebi
tPın
ar E
rim G
özal
anN
ispe
tiye
Cad
. Akm
erke
z E
-3 B
lok
Kat
10
Etil
er s
tanb
ul21
2-31
9 34
00
212-
282
18 4
4, 4
8
The
Roy
al B
ank
of S
cotla
nd N
.V.
Pau
lus
Mar
ia D
e K
roon
Rau
f Özd
inçe
rT
ambu
ri A
li E
fend
i Sok
. No
13 E
tiler
Be
ikta
stan
bul
212-
359
40 4
021
2-35
9 50
50
Tur
klan
d B
ank
A.
.N
ehm
e S
abba
ghA
. Din
çer
Alp
man
19 M
ayıs
Mah
. 19
Mayıs
Cad
. i
li P
laza
A B
lok
No
7 i
list
anbu
l21
2-36
8 34
34
212-
368
35 3
5
Wes
tLB
AG
Ne
e E
rtem
And
reas
Chr
istia
n S
chro
eter
Ebu
lula
Mar
din
Cad
. May
a P
ark
Tow
ers
II, A
katla
r st
anbu
l21
2-33
9 25
00
212-
352
22 5
8
Dev
elo
pm
ent
and
Inve
stm
ent
Ban
ksA
ktif
Yatırım
Ban
kası
A.
.A
hmet
Çalık
Önd
er H
alis
dem
irB
üyük
dere
Cad
. No
163
Zin
cirli
kuyu
ili
stan
bul
212-
340
80 0
021
2-34
0 89
87
Ban
kPoz
itif K
redi
ve
Kal
kınm
a B
anka
sı A
..
smai
l Has
an A
kçak
ayalıo
luH
akan
Oka
n B
alkö
seR
üzga
rlıba
hçe
Mah
. Kayın
Sok
. No.
3 K
avacık
Bey
koz
stan
bul
216-
538
25 2
521
6-53
8 42
58
Cre
dit A
gric
ole
Yatırım
Ban
kası
Tür
k A
..
Pie
rre
Fin
asF
. Dile
k Y
ardı
mB
üyük
dere
Cad
. Yapı K
redi
Pla
za, C
Blo
k, K
at 1
5 Le
vent
sta
nbul
212-
339
37 0
021
2-28
2 63
01
Dile
r Y
atırım
Ban
kası
A.
.A
hmet
Ert
uru
lN
atık
Ata
lT
ersa
ne C
ad. N
o 96
Dile
r H
an K
at 8
Kar
aköy
sta
nbul
212-
253
66 3
021
2-25
3 94
54
GS
D Y
atırım
Ban
kası
A.
.A
kgün
Tür
erY
asef
Coy
aA
ydın
evle
r M
ah.
nönü
Cad
desi
, Gök
çe S
ok. N
o 14
Küç
ükya
lıst
anbu
l21
6-58
7 90
00
216-
489
97 7
4
ller
Ban
kası
A.
.H
iday
et A
taso
yH
iday
et A
taso
yA
tatü
rk B
ulva
rı N
o 21
Ope
ra A
nkar
a31
2- 5
08 7
0 00
312-
508
73 9
9
MK
B T
akas
ve
Sak
lam
a B
anka
sı A
..
Hüs
eyin
Erk
anE
min
Ser
ver
Çat
ana
ili
Mer
kez
Mah
alle
si, M
erke
z C
adde
si, N
o 6
ili
stan
bul
212-
315
25 2
521
2-31
5 25
26
Mer
rill L
ynch
Yatırım
Ban
k A
..
B. E
lif B
ilgi Z
appa
roli
Meh
met
Gön
en (
Act
ing)
Büy
ükde
re C
ad. N
o 18
5 K
anyo
n O
fisi B
lou
11. K
at L
even
t st
anbu
l21
2- 3
19 9
5 00
212-
319
95
11
Nur
ol Y
atırım
Ban
kası
A.
.N
uret
tin Ç
armık
lıPın
ar C
engi
zB
üyük
dere
Cad
. Nur
ol P
laza
No
257
B B
lok,
Kat
15
Mas
lak
ili
stan
bul
212-
286
81 0
021
2-28
6 81
01
Tai
b Y
atırım
Ban
k A
..
Mur
at A
li Y
ülek
San
jeev
Kat
hpal
iaE
ski B
üyük
dere
Cad
. Par
k P
laza
No
14 K
at 6
Mas
lak
i
list
anbu
l21
2-34
5 07
11
212-
345
07 1
2
Tür
k E
xim
bank
Cav
it D
ada
(Act
ing)
Hay
retti
n K
apla
nM
illi M
üdaf
aa C
ad. N
o 20
Bak
anlık
lar
Ank
ara
312-
417
13 0
031
2-42
5 78
96
Tür
kiye
Kal
kınm
a B
anka
sı A
..
Ahm
et Y
aman
(Act
ing)
Met
in P
ehliv
an (
Act
ing)
Nec
atib
ey C
adde
si, N
o 98
Bak
anlık
lar
Ank
ara
312-
231
84 0
031
2-23
1 31
25
Tür
kiye
Sın
ai K
alkı
nma
Ban
kası
A.
.H
.Ers
in Ö
zinc
eH
alil
Ero
luM
eclis
i Meb
usan
Cad
. No
81 Fın
dıklı
stan
bul
212-
334
50 5
021
2-33
4 52
34
* T
he d
epos
it ba
nks
and
deve
lopm
ent a
nd in
vest
men
t ban
ks a
re in
clud
ed. I
nfor
mat
ion
prov
ided
as
of M
ay 6
, 201
1. B
anks
are
pla
ced
in th
eir
grou
ps a
s of
this
dat
e.
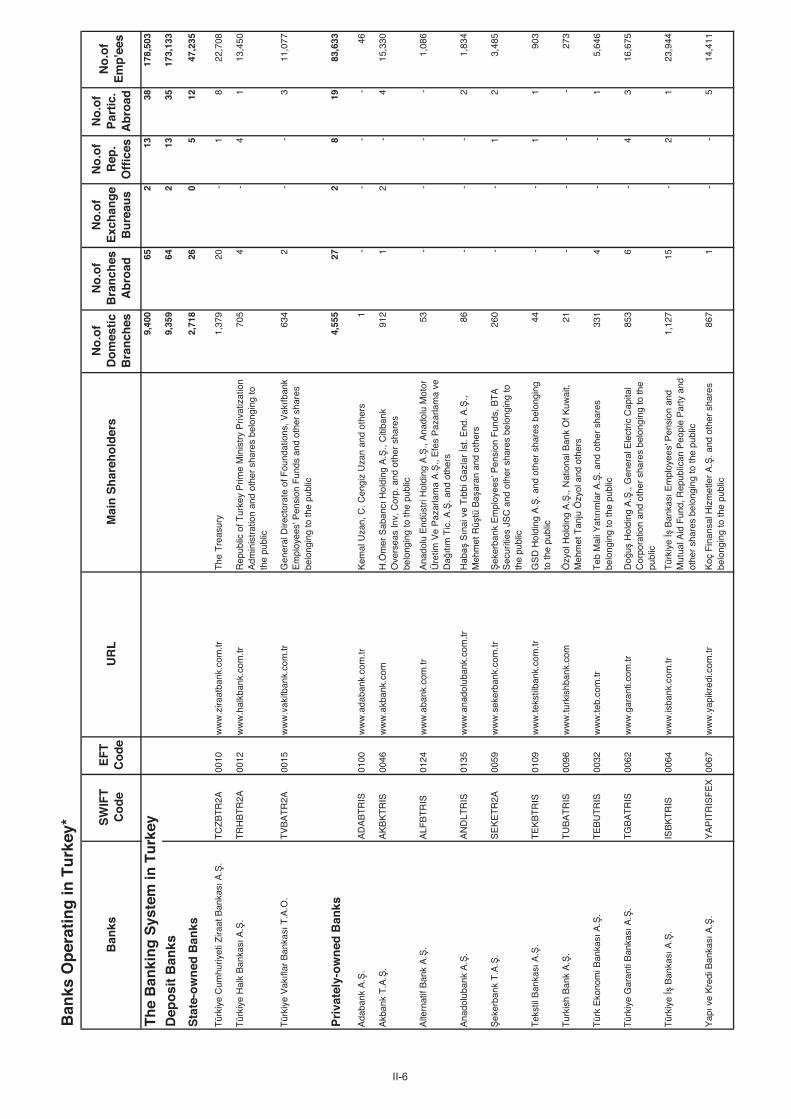
II-6
Ban
ks O
per
atin
g in
Tu
rkey
*
Ban
ksS
WIF
TC
od
eE
FT
Co
de
UR
LM
ain
Sh
areh
old
ers
No
.of
Do
mes
tic
Bra
nch
es
No
.of
Bra
nch
esA
bro
ad
No
.of
Exc
han
ge
Bu
reau
s
No
.of
Rep
.O
ffic
es
No
.of
Par
tic.
Ab
road
No
.of
Em
p'e
es
Th
e B
anki
ng
Sys
tem
in T
urk
ey9,
400
652
1338
178,
503
Dep
osi
t B
anks
9,35
964
213
3517
3,13
3
Sta
te-o
wn
ed B
anks
2,71
826
05
1247
,235
Tür
kiye
Cum
huriy
eti Z
iraat
Ban
kası
A.
.T
CZ
BT
R2A
00
10
ww
w.z
iraat
bank
.com
.trT
he T
reas
ury
1,37
920
-1
822
,708
Tür
kiye
Hal
k B
anka
sı A
..
TR
HB
TR
2A
0012
w
ww
.hal
kban
k.co
m.tr
Rep
ublic
of T
urke
y P
rime
Min
istr
y P
rivat
izat
ion
Adm
inis
trat
ion
and
othe
r sh
ares
bel
ongi
ng to
th
e pu
blic
705
4-
41
13,4
50
Tür
kiye
Vakıfl
ar B
anka
sı T
.A.O
.T
VB
AT
R2A
00
15
ww
w.v
akifb
ank.
com
.trG
ener
al D
irect
orat
e of
Fou
ndat
ions
, Vakıfb
ank
Em
ploy
ees'
Pen
sion
Fun
ds a
nd o
ther
sha
res
belo
ngin
g to
the
publ
ic
634
2-
-3
11,0
77
Pri
vate
ly-o
wn
ed B
anks
4,55
527
28
1983
,633
Ada
bank
A.
.A
DA
BT
RIS
01
00
ww
w.a
daba
nk.c
om.tr
Kem
al U
zan,
C. C
engi
z U
zan
and
othe
rs1
--
--
46
Akb
ank
T.A
..
AK
BK
TR
IS
0046
w
ww
.akb
ank.
com
H.Ö
mer
Sab
ancı
Hol
ding
A.
., C
itiba
nk
Ove
rsea
s In
v. C
orp.
and
oth
er s
hare
s be
long
ing
to th
e pu
blic
912
12
-4
15,3
30
Alte
rnat
if B
ank
A.
.A
LFB
TR
IS
0124
w
ww
.aba
nk.c
om.tr
Ana
dolu
End
üstr
i Hol
ding
A.
., A
nado
lu M
otor
Ü
retim
Ve
Paz
arla
ma
A.
., E
fes
Paz
arla
ma
ve
Daıtı
m T
ic. A
.. a
nd o
ther
s
53-
--
-1,
086
Ana
dolu
bank
A.
. A
ND
LTR
IS
0135
w
ww
.ana
dolu
bank
.com
.trH
aba
Sın
ai v
e Tıb
bi G
azla
r st
. End
. A.
.,M
ehm
et R
ütü
Ba
aran
and
oth
ers
86-
--
21,
834
eker
bank
T.A
..
SE
KE
TR
2A
0059
w
ww
.sek
erba
nk.c
om.tr
eker
bank
Em
ploy
ees'
Pen
sion
Fun
ds, B
TA
S
ecur
ities
JS
C a
nd o
ther
sha
res
belo
ngin
g to
th
e pu
blic
260
--
12
3,48
5
Tek
stil
Ban
kası
A.
.T
EK
BT
RIS
01
09
ww
w.te
kstil
bank
.com
.trG
SD
Hol
ding
A.
. and
oth
er s
hare
s be
long
ing
to th
e pu
blic
44-
-1
190
3
Tur
kish
Ban
k A
..
TU
BA
TR
IS
0096
w
ww
.turk
ishb
ank.
com
Özy
ol H
oldi
ng A
..,
Nat
iona
l Ban
k O
f Kuw
ait,
Meh
met
Tan
ju Ö
zyol
and
oth
ers
21-
--
-27
3
Tür
k E
kono
mi B
anka
sı A
..
TE
BU
TR
IS
0032
w
ww
.teb.
com
.trT
eb M
ali Y
atırım
lar
A.
. and
oth
er s
hare
s be
long
ing
to th
e pu
blic
331
4-
-1
5,64
6
Tür
kiye
Gar
anti
Ban
kası
A.
.T
GB
AT
RIS
00
62
ww
w.g
aran
ti.co
m.tr
Do
u H
oldi
ng A
..,
Gen
eral
Ele
ctric
Cap
ital
Cor
pora
tion
and
othe
r sh
ares
bel
ongi
ng to
the
publ
ic
853
6-
43
16,6
75
Tür
kiye
Ban
kası
A.
.IS
BK
TR
IS
0064
w
ww
.isba
nk.c
om.tr
Tür
kiye
B
anka
sı E
mpl
oyee
s' P
ensi
on a
nd
Mut
ual A
id F
und,
Rep
ublic
an P
eopl
e P
arty
and
ot
her
shar
es b
elon
ging
to th
e pu
blic
1,12
715
-2
123
,944
Yapı v
e K
redi
Ban
kası
A.
.Y
AP
ITR
ISF
EX
0067
w
ww
.yap
ikre
di.c
om.tr
Koç
Fin
ansa
l Hiz
met
ler
A.
. and
oth
er s
hare
s be
long
ing
to th
e pu
blic
867
1-
-5
14,4
11
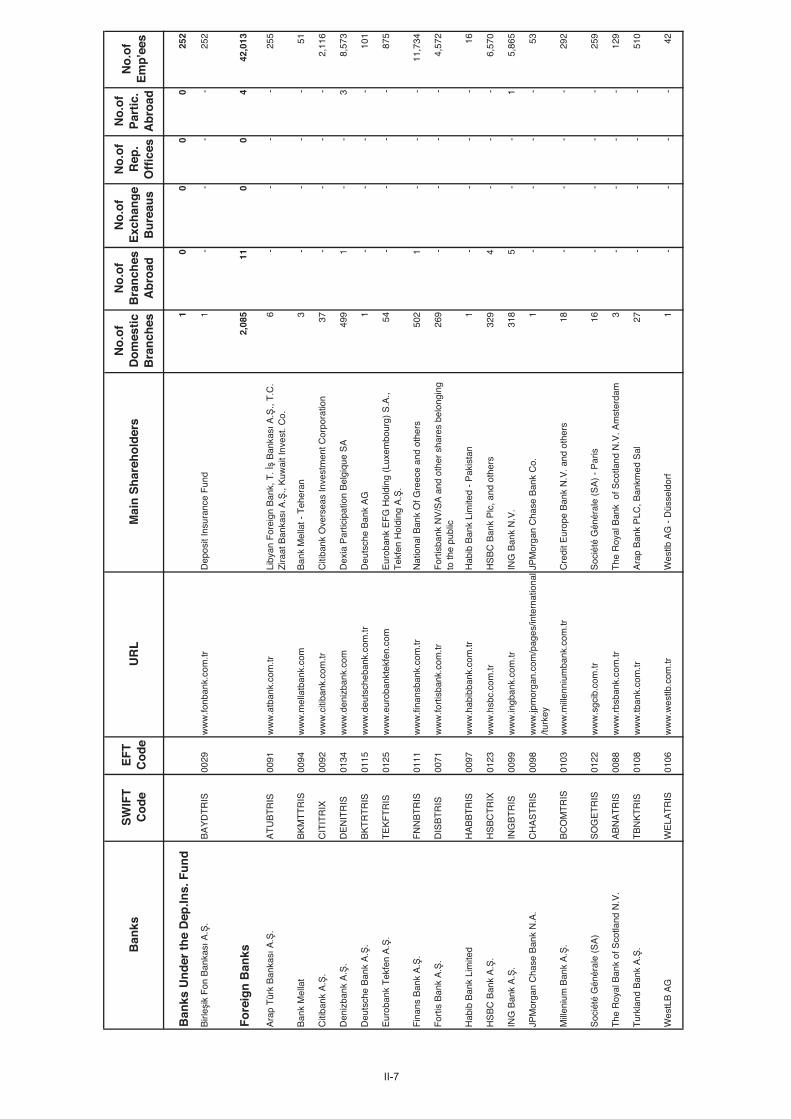
II-7
Ban
ksS
WIF
TC
od
eE
FT
Co
de
UR
LM
ain
Sh
areh
old
ers
No
.of
Do
mes
tic
Bra
nch
es
No
.of
Bra
nch
esA
bro
ad
No
.of
Exc
han
ge
Bu
reau
s
No
.of
Rep
.O
ffic
es
No
.of
Par
tic.
Ab
road
No
.of
Em
p'e
es
Ban
ks U
nd
er t
he
Dep
.Ins.
Fu
nd
10
00
025
2
Birl
eik
Fon
Ban
kası
A.
.B
AY
DT
RIS
00
29
ww
w.fo
nban
k.co
m.tr
Dep
osit
Insu
ranc
e F
und
1-
--
-25
2
Fo
reig
n B
anks
2,08
511
00
442
,013
Ara
p T
ürk
Ban
kası
A.
.A
TU
BT
RIS
00
91
ww
w.a
tban
k.co
m.tr
Liby
an F
orei
gn B
ank,
T.
Ban
kası
A.
., T
.C.
Zira
at B
anka
sı A
..,
Kuw
ait I
nves
t. C
o.6
--
--
255
Ban
k M
ella
tB
KM
TT
RIS
00
94w
ww
.mel
latb
ank.
com
Ban
k M
ella
t - T
eher
an3
--
--
51
Citi
bank
A.
.C
ITIT
RIX
00
92
ww
w.c
itiba
nk.c
om.tr
Citi
bank
Ove
rsea
s In
vest
men
t Cor
pora
tion
37-
--
-2,
116
Den
izba
nk A
..
DE
NIT
RIS
01
34
ww
w.d
eniz
bank
.com
Dex
ia P
artic
ipat
ion
Bel
giqu
e S
A49
91
--
38,
573
Deu
tsch
e B
ank
A.
.B
KT
RT
RIS
01
15
ww
w.d
euts
cheb
ank.
com
.trD
euts
che
Ban
k A
G1
--
--
101
Eur
oban
k T
ekfe
n A
..
TE
KF
TR
IS
0125
w
ww
.eur
oban
ktek
fen.
com
Eur
oban
k E
FG
Hol
ding
(Lu
xem
bour
g) S
.A.,
Tek
fen
Hol
ding
A.
.54
--
--
875
Fin
ans
Ban
k A
..
FN
NB
TR
IS
0111
w
ww
.fina
nsba
nk.c
om.tr
Nat
iona
l Ban
k O
f Gre
ece
and
othe
rs50
21
--
-11
,734
For
tis B
ank
A.
.D
ISB
TR
IS
0071
w
ww
.fort
isba
nk.c
om.tr
For
tisba
nk N
V/S
A a
nd o
ther
sha
res
belo
ngin
g to
the
publ
ic26
9-
--
-4,
572
Hab
ib B
ank
Lim
ited
HA
BB
TR
IS00
97w
ww
.hab
ibba
nk.c
om.tr
Hab
ib B
ank
Lim
ited
- P
akis
tan
1-
--
-16
HS
BC
Ban
k A
..
HS
BC
TR
IX
0123
w
ww
.hsb
c.co
m.tr
HS
BC
Ban
k P
lc, a
nd o
ther
s32
94
--
-6,
570
ING
Ban
k A
..
ING
BT
RIS
00
99
ww
w.in
gban
k.co
m.tr
ING
Ban
k N
.V.
318
5-
-1
5,86
5
JPM
orga
n C
hase
Ban
k N
.A.
CH
AS
TR
IS
0098
w
ww
.jpm
orga
n.co
m/p
ages
/inte
rnat
iona
l/tu
rkey
JPM
orga
n C
hase
Ban
k C
o.1
--
--
53
Mill
eniu
m B
ank
A.
.B
CO
MT
RIS
0103
w
ww
.mill
enni
umba
nk.c
om.tr
Cre
dit E
urop
e B
ank
N.V
. and
oth
ers
18-
--
-29
2
Soc
iété
Gén
éral
e (S
A)
SO
GE
TR
IS
0122
w
ww
.sgc
ib.c
om.tr
Soc
iété
Gén
éral
e (S
A)
- P
aris
16-
--
-25
9
The
Roy
al B
ank
of S
cotla
nd N
.V.
AB
NA
TR
IS
0088
w
ww
.rbs
bank
.com
.trT
he R
oyal
Ban
k o
f Sco
tland
N.V
. Am
ster
dam
3-
--
-12
9
Tur
klan
d B
ank
A.
.T
BN
KT
RIS
01
08
ww
w.tb
ank.
com
.trA
rap
Ban
k P
LC, B
ankm
ed S
al27
--
--
510
Wes
tLB
AG
WE
LAT
RIS
01
06
ww
w.w
estlb
.com
.trW
estlb
AG
- D
üsse
ldor
f1
--
--
42

II-8
Ban
ksS
WIF
TC
od
eE
FT
Co
de
UR
LM
ain
Sh
areh
old
ers
No
.of
Do
mes
tic
Bra
nch
es
No
.of
Bra
nch
esA
bro
ad
No
.of
Exc
han
ge
Bu
reau
s
No
.of
Rep
.O
ffic
es
No
.of
Par
tic.
Ab
road
No
.of
Em
p'e
es
Dev
elo
pm
ent
and
Inve
stm
ent
Ban
ks41
10
03
5,37
0
Akt
if Y
atırım
Ban
kası
A.
.C
AY
TT
RIS
01
43
ww
w.a
ktifb
ank.
com
.trÇ
alık
Hol
ding
A.
. and
oth
ers
6-
--
-31
6
Ban
kPoz
itif K
redi
ve
Kal
kınm
a B
anka
sı A
..
BP
TR
TR
IS01
42
ww
w.b
ankp
oziti
f.com
.trT
arsh
ish
Hap
oalim
And
Inve
stm
ent L
td.,
C F
akto
ring
2-
--
128
8
Cre
dit A
gric
ole
Yatırım
Ban
kası
Tür
k A
..
BS
UIT
RIS
01
21
ww
w.c
a-ci
b.co
m.tr
Cre
dit A
gric
ole
- P
aris
1-
--
-20
Dile
r Y
atırım
Ban
kası
A.
.D
YA
KT
RIS
0138
w
ww
.dile
rban
k.co
m.tr
Yazıcı D
emir
Çel
ik S
anay
i ve
Tur
izm
Tic
. A.
.,F
atm
a T
uba
Yazıcı a
nd o
ther
s1
--
--
18
GS
D Y
atırım
Ban
kası
A.
.G
SD
BT
RIS
01
39
ww
w.g
sdba
nk.c
om.tr
GS
D H
oldi
ng A
..
1-
--
128
ller
Ban
kası
A.
.-
00
04
ww
w.il
bank
.gov
.trLo
cal a
nd P
rovi
ncia
l Adm
inis
trat
ions
19-
--
-2,
971
MK
B T
akas
ve
Sak
lam
a B
anka
sı A
..
TV
AB
TR
IS
0132
w
ww
.taka
sban
k.co
m.tr
stan
bul S
tock
Exc
hang
e an
d ot
hers
1-
--
-21
1
Mer
rill L
ynch
Yatırım
Ban
k A
..
MLM
BIE
2XIS
T01
29
ww
w.m
l.com
.trM
erril
l Lyn
ch E
urop
ean
Ass
et H
oldi
ng In
c.1
--
--
33
Nur
ol Y
atırım
Ban
kası
A.
.N
UR
OT
RIS
01
41
ww
w.n
urol
bank
.com
.trN
urol
Hol
ding
A.
., N
urol
naa
t ve
Tic
. A.
.an
d ot
hers
2-
--
-49
Tai
b Y
atırım
Ban
k A
..
TA
IBT
RIS
0116
w
ww
.yat
irim
bank
.com
.trT
aibb
ank
BS
C a
nd o
ther
s1
--
--
17
Tür
k E
xim
bank
TIK
BT
R2A
00
16
ww
w.e
xim
bank
.gov
.trT
he T
reas
ury
2-
--
-36
0
Tür
kiye
Kal
kınm
a B
anka
sı A
..
TK
BN
TR
2A
0017
w
ww
.kal
kinm
a.co
m.tr
The
Tre
asur
y1
--
-1
712
Tür
kiye
Sın
ai K
alkı
nma
Ban
kası
A.
.T
SK
BT
RIS
00
14
ww
w.ts
kb.c
om.tr
Tür
kiye
B
anka
sı A
..,
Tür
kiye
Vakıfl
ar
Ban
kası
T.A
.O.,
Cam
i Y
atırım
Hol
ding
A.
.an
d ot
her
shar
es b
elon
ging
to th
e pu
blic
31
--
-34
7
* T
he d
epos
it ba
nks
and
deve
lopm
ent a
nd in
vest
men
t ban
ks a
re in
clud
ed. F
igur
es p
rovi
ded
as o
f Dec
embe
r 31
, 201
0

II-9
• Deposit Banks
− State-owned Banks− Privately-owned Banks− Banks Under the Deposit Insurance Fund− Foreign Banks
• Development and Investment Banks
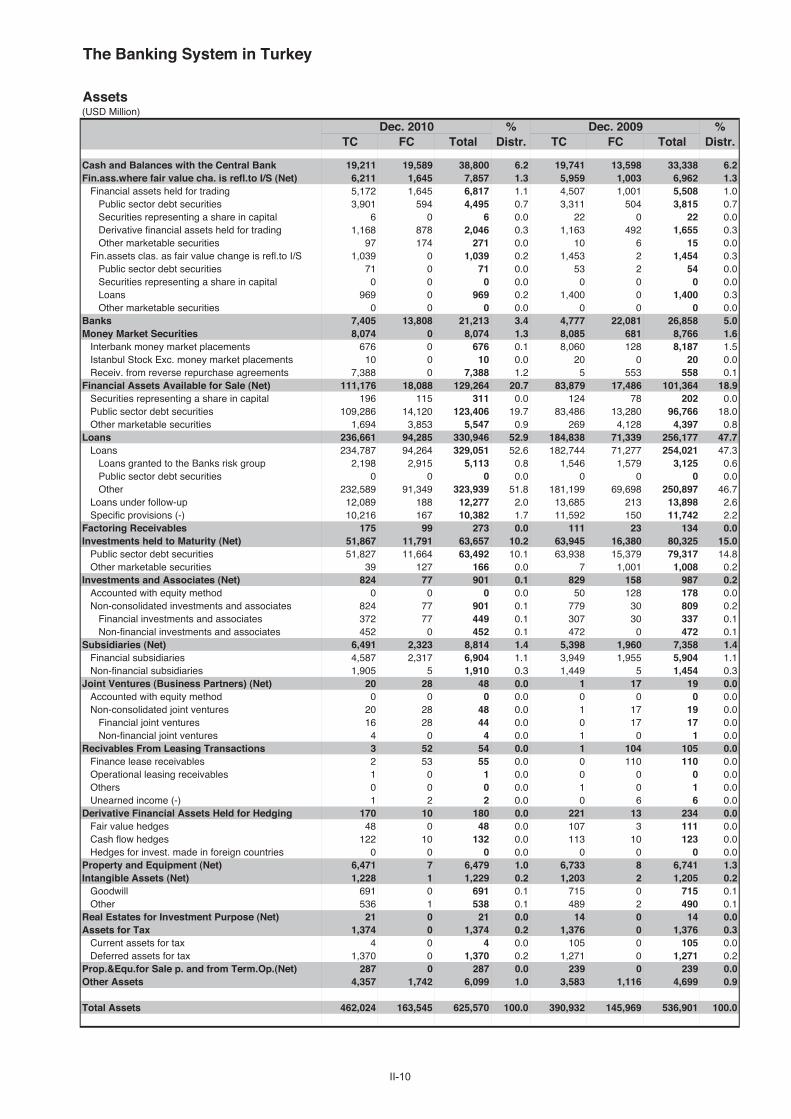
The Banking System in Turkey
Assets(USD Million)
Dec. 2010 % Dec. 2009 %TC FC Total Distr. TC FC Total Distr.
Cash and Balances with the Central Bank 19,211 19,589 38,800 6.2 19,741 13,598 33,338 6.2Fin.ass.where fair value cha. is refl.to I/S (Net) 6,211 1,645 7,857 1.3 5,959 1,003 6,962 1.3
Financial assets held for trading 5,172 1,645 6,817 1.1 4,507 1,001 5,508 1.0Public sector debt securities 3,901 594 4,495 0.7 3,311 504 3,815 0.7Securities representing a share in capital 6 0 6 0.0 22 0 22 0.0Derivative financial assets held for trading 1,168 878 2,046 0.3 1,163 492 1,655 0.3Other marketable securities 97 174 271 0.0 10 6 15 0.0
Fin.assets clas. as fair value change is refl.to I/S 1,039 0 1,039 0.2 1,453 2 1,454 0.3Public sector debt securities 71 0 71 0.0 53 2 54 0.0Securities representing a share in capital 0 0 0 0.0 0 0 0 0.0Loans 969 0 969 0.2 1,400 0 1,400 0.3Other marketable securities 0 0 0 0.0 0 0 0 0.0
Banks 7,405 13,808 21,213 3.4 4,777 22,081 26,858 5.0Money Market Securities 8,074 0 8,074 1.3 8,085 681 8,766 1.6
Interbank money market placements 676 0 676 0.1 8,060 128 8,187 1.5Istanbul Stock Exc. money market placements 10 0 10 0.0 20 0 20 0.0Receiv. from reverse repurchase agreements 7,388 0 7,388 1.2 5 553 558 0.1
Financial Assets Available for Sale (Net) 111,176 18,088 129,264 20.7 83,879 17,486 101,364 18.9Securities representing a share in capital 196 115 311 0.0 124 78 202 0.0Public sector debt securities 109,286 14,120 123,406 19.7 83,486 13,280 96,766 18.0Other marketable securities 1,694 3,853 5,547 0.9 269 4,128 4,397 0.8
Loans 236,661 94,285 330,946 52.9 184,838 71,339 256,177 47.7Loans 234,787 94,264 329,051 52.6 182,744 71,277 254,021 47.3
Loans granted to the Banks risk group 2,198 2,915 5,113 0.8 1,546 1,579 3,125 0.6Public sector debt securities 0 0 0 0.0 0 0 0 0.0Other 232,589 91,349 323,939 51.8 181,199 69,698 250,897 46.7
Loans under follow-up 12,089 188 12,277 2.0 13,685 213 13,898 2.6Specific provisions (-) 10,216 167 10,382 1.7 11,592 150 11,742 2.2
Factoring Receivables 175 99 273 0.0 111 23 134 0.0Investments held to Maturity (Net) 51,867 11,791 63,657 10.2 63,945 16,380 80,325 15.0
Public sector debt securities 51,827 11,664 63,492 10.1 63,938 15,379 79,317 14.8Other marketable securities 39 127 166 0.0 7 1,001 1,008 0.2
Investments and Associates (Net) 824 77 901 0.1 829 158 987 0.2Accounted with equity method 0 0 0 0.0 50 128 178 0.0Non-consolidated investments and associates 824 77 901 0.1 779 30 809 0.2
Financial investments and associates 372 77 449 0.1 307 30 337 0.1Non-financial investments and associates 452 0 452 0.1 472 0 472 0.1
Subsidiaries (Net) 6,491 2,323 8,814 1.4 5,398 1,960 7,358 1.4Financial subsidiaries 4,587 2,317 6,904 1.1 3,949 1,955 5,904 1.1Non-financial subsidiaries 1,905 5 1,910 0.3 1,449 5 1,454 0.3
Joint Ventures (Business Partners) (Net) 20 28 48 0.0 1 17 19 0.0Accounted with equity method 0 0 0 0.0 0 0 0 0.0Non-consolidated joint ventures 20 28 48 0.0 1 17 19 0.0
Financial joint ventures 16 28 44 0.0 0 17 17 0.0Non-financial joint ventures 4 0 4 0.0 1 0 1 0.0
Recivables From Leasing Transactions 3 52 54 0.0 1 104 105 0.0Finance lease receivables 2 53 55 0.0 0 110 110 0.0Operational leasing receivables 1 0 1 0.0 0 0 0 0.0Others 0 0 0 0.0 1 0 1 0.0Unearned income (-) 1 2 2 0.0 0 6 6 0.0
Derivative Financial Assets Held for Hedging 170 10 180 0.0 221 13 234 0.0Fair value hedges 48 0 48 0.0 107 3 111 0.0Cash flow hedges 122 10 132 0.0 113 10 123 0.0Hedges for invest. made in foreign countries 0 0 0 0.0 0 0 0 0.0
Property and Equipment (Net) 6,471 7 6,479 1.0 6,733 8 6,741 1.3Intangible Assets (Net) 1,228 1 1,229 0.2 1,203 2 1,205 0.2
Goodwill 691 0 691 0.1 715 0 715 0.1Other 536 1 538 0.1 489 2 490 0.1
Real Estates for Investment Purpose (Net) 21 0 21 0.0 14 0 14 0.0Assets for Tax 1,374 0 1,374 0.2 1,376 0 1,376 0.3
Current assets for tax 4 0 4 0.0 105 0 105 0.0Deferred assets for tax 1,370 0 1,370 0.2 1,271 0 1,271 0.2
Prop.&Equ.for Sale p. and from Term.Op.(Net) 287 0 287 0.0 239 0 239 0.0Other Assets 4,357 1,742 6,099 1.0 3,583 1,116 4,699 0.9
Total Assets 462,024 163,545 625,570 100.0 390,932 145,969 536,901 100.0
II-10

The Banking System in Turkey December 2010
Liabilities(USD Million)
Dec. 2010 % Dec. 2009 %TC FC Total Distr. TC FC Total Distr.
Deposits 278,112 121,654 399,766 63.9 223,956 117,104 341,060 63.5Deposits held by the Banks risk group 9,680 5,345 15,025 2.4 5,747 5,477 11,224 2.1Other 268,432 116,309 384,742 61.5 218,209 111,626 329,836 61.4
Derivative Finan. Liabilities Held for Trading 1,412 918 2,330 0.4 1,051 587 1,639 0.3Funds Borrowed 9,920 50,782 60,702 9.7 8,018 39,018 47,036 8.8Money Market Takings 29,869 7,661 37,530 6.0 35,308 5,899 41,207 7.7
Interbank money market takings 0 0 0 0.0 0 147 147 0.0Istanbul Stock Exc. money market takings 42 0 42 0.0 15 0 15 0.0Funds provided under repurchase agreements 29,828 7,661 37,489 6.0 35,292 5,752 41,044 7.6
Marketable Securities Issued (Net) 1,038 1,012 2,049 0.3 70 0 70 0.0Bills 937 0 937 0.1 35 0 35 0.0Asset backed securities 0 0 0 0.0 0 0 0 0.0Bonds 100 1,012 1,112 0.2 35 0 35 0.0
Funds 4,479 457 4,936 0.8 4,097 161 4,258 0.8Borrower funds 158 457 615 0.1 188 161 349 0.1Others 4,321 0 4,321 0.7 3,909 0 3,909 0.7
Miscellaneous Payables 10,675 1,882 12,557 2.0 8,645 1,005 9,650 1.8Other External Resources 4,138 1,910 6,049 1.0 3,465 1,192 4,658 0.9Factoring Payables 0 0 0 0.0 0 0 0 0.0Leasing Transactions Payables (Net) 65 16 81 0.0 29 35 64 0.0
Finance leasing payables 81 17 98 0.0 35 38 74 0.0Operations leasing payables 0 0 0 0.0 0 0 0 0.0Others 0 0 0 0.0 0 0 0 0.0Deferred finance leasing expenses (-) 16 1 17 0.0 7 3 9 0.0
Derivative Finan. Liabilities Held for Hedging 902 92 994 0.2 884 38 922 0.2Fair value hedges 404 18 422 0.1 298 29 327 0.1Cash flow hedges 498 74 572 0.1 586 9 595 0.1Hedges for invest. made in foreign countries 0 0 0 0.0 0 0 0 0.0
Provisions 8,471 524 8,996 1.4 8,302 540 8,842 1.6General provisions 2,796 387 3,183 0.5 2,376 414 2,790 0.5Restructuring reserves 8 0 8 0.0 0 0 0 0.0Reserves for employee benefit 1,546 0 1,546 0.2 1,318 1 1,319 0.2Insurance technical reserves (Net) 0 0 0 0.0 0 0 0 0.0Other provisions 4,121 137 4,259 0.7 4,608 125 4,733 0.9
Liabilities for Tax 1,782 7 1,789 0.3 1,651 11 1,662 0.3Current liabilities for tax 1,729 7 1,735 0.3 1,586 11 1,598 0.3Deferred liabilities for tax 54 0 54 0.0 64 0 64 0.0
Lia.for Pro.&Equ.for Sale p. and from Term.Op.(Net) 0 2 2 0.0 0 1 1 0.0Subordinated Loans 120 3,715 3,835 0.6 124 4,124 4,248 0.8Shareholders' Equity 83,335 618 83,954 13.4 71,098 486 71,584 13.3
Paid-in capital 29,167 0 29,167 4.7 26,762 0 26,762 5.0Supplementary capital 12,982 608 13,590 2.2 11,901 478 12,379 2.3
Share premium 2,044 0 2,044 0.3 2,117 0 2,117 0.4Share cancellation profits 0 0 0 0.0 0 0 0 0.0Valuation changes in marketable securities 5,135 693 5,828 0.9 3,209 503 3,712 0.7Revaluation changes of property and equip. 497 0 497 0.1 515 0 515 0.1Revaluation changes of intangible assets 0 0 0 0.0 0 0 0 0.0Revaluation changes of real est.for inv. pur. 0 0 0 0.0 0 0 0 0.0Free shares from inv.&ass.,subs.& joint vent. 78 0 78 0.0 57 0 57 0.0Hedging funds (active part) -349 -85 -434 -0.1 -428 -25 -453 -0.1Val.inc.in pro.& equ.held for sale p.and term.ope. 0 0 0 0.0 0 0 0 0.0Other capital reserves 5,577 0 5,577 0.9 6,432 0 6,432 1.2
Profit reserves 38,486 10 38,497 6.2 31,105 9 31,114 5.8Legal reserves 4,924 3 4,927 0.8 4,251 3 4,254 0.8Status reserves 24 0 24 0.0 19 0 19 0.0Extraordinary reserves 32,966 0 32,966 5.3 26,443 0 26,443 4.9Other profit reserves 572 7 580 0.1 392 6 397 0.1
Profit or loss 2,699 0 2,699 0.4 1,330 0 1,330 0.2Prior years income/loss -11,193 0 -11,193 -1.8 -11,766 0 -11,766 -2.2Current year income/loss 13,892 0 13,892 2.2 13,096 0 13,096 2.4
Total Liabilities 434,319 191,250 625,570 100.0 366,699 170,202 536,901 100.0
II-11

The Banking System in Turkey
Off Balance Sheet Commitments(USD Million)
Dec. 2010 Dec. 2009TC FC Total TC FC Total
Guarantees and Warranties 40,160 52,237 92,397 30,705 46,201 76,906Letters of guarantee 36,740 29,568 66,309 29,191 27,928 57,119Bank acceptances 16 2,293 2,309 3 1,982 1,985Letters of credit 1,017 17,085 18,101 11 13,623 13,634Prefinancing given as guarantee 0 40 40 0 15 15Endorsements 0 468 468 0 351 351Other guarantees and warrantees 2,387 2,784 5,171 1,500 2,303 3,803
Commitments 173,102 62,009 235,112 96,641 29,292 125,933Irrevocable commitments 101,055 20,659 121,714 89,655 25,184 114,839Revocable commitments 72,047 41,351 113,398 6,986 4,108 11,094
Derivative Financial Instruments 80,314 169,764 250,079 57,729 107,803 165,531Derivative finan. instruments held for hedging 11,750 10,160 21,910 8,389 3,453 11,842Trading transactions 68,565 159,604 228,169 49,340 104,350 153,690
Custody and Pledged Securities 6,787,229 350,954 7,138,183 5,260,267 272,760 5,533,027Items held in Custody 6,025,221 26,694 6,051,915 4,687,814 25,187 4,713,001Pledged Items 723,418 306,080 1,029,498 542,181 240,384 782,566Acccepted independent guaran. and warran. 38,590 18,179 56,769 30,271 7,189 37,460
Total Off Balance Sheet Commitments 7,080,806 634,965 7,715,771 5,445,341 456,055 5,901,397
Income-Expenditure(USD Million)
Dec. 2010 Dec. 2009
Interest Income 49,376 56,216Interest on loans 30,998 35,179Interest received from reserve deposits 191 475Interest received from banks 728 885Interest received from money market transactions 293 489Interest received from marketable securities portfolio 16,951 18,920Other interest income 215 268
Interest Expenses 24,178 28,099Interest on deposits 19,960 22,956Interest on money market transactions 1,958 2,494Interest on funds borrowed 1,973 2,356Interest on securities issued 43 2Other interest expenses 244 291
Net Interest Income/Expenses 25,198 28,117Net Fees and Commissions Income/Expenses 6,454 6,241
Fees and commissions received 7,585 7,473Fees and commissions paid 1,131 1,232
Dividend Income 547 518Trading Profit/Loss (net) 110 1,118
Profit/loss on trading account securities 1,742 1,780Profit/losses on derivative financial transactions -2,002 -1,117Foreign exchange profit/loss 370 455
Other Operating Income 5,114 2,723Total Operating Income/Expenses 37,424 38,718Provision for Loan Losses or other Receivables (-) 4,387 8,126
Specific provisions of banks loans and other receivables* 3,150 6,176General provision expenses* 727 481
Other Operating Expenses (-) 15,986 14,410Personnel Expenses* 7,105 6,560
Net Operating Profit/Loss 17,051 16,181Surplus written as gain after merger 0 0Profit/losses from equity method applied subsidiaries 0 0Net monetory position gain/loss 0 0Profit/Loss Before Taxes from Continuing Operations 17,051 16,181Provisions for Taxes on Income from Continuing Operations (±) -3,218 -3,181Net Profit/Loss from Continuing Operations 13,833 13,001Net Profit/Loss Before Taxes from Terminated Operations 66 132Provisions for Taxes on Income from Terminated Operations (±) -6 -38Net Profit/Loss from Terminated Operations 59 95
Net Profit/Losses 13,892 13,096
* Used from information and disclosures related to income statement".
II-12

The Banking System in Turkey December 2010
Ratios(%)
Dec. 2010 Dec. 2009
Capital Ratios
Shareholders’ Equity / (Amount subject to credit + market + operational risk) 19.2 20.9
Shareholders' Equity / Total Assets 13.4 13.3
(Shareholders' Equity - Permanent Assets) / Total Assets 10.3 9.8
Net On Balance Sheet Position / Total Shareholders' Equity -17.8 -17.9
Net On and Off Balance Sheet Position / Total Shareholders' Equity 0.3 0.3
Balance-Sheet Ratios
TC Assets / Total Assets 73.9 72.8
TC Liabilities / Total Liabilities 69.4 68.3
FC Assets / FC Liabilities 85.5 85.8
TC Deposits / Total Deposits 69.6 65.7
TC Loans / Total Loans and Receivables 71.5 72.2
Total Deposits / Total Assets 63.9 63.5
Funds Borrowed / Total Assets 9.7 8.8
Assets Quality
Financial Assets (net) / Total Assets 32.1 35.2
Total Loans and Receivables / Total Assets 52.9 47.7
Total Loans and Receivables / Total Deposits 82.8 75.1
Loans Under Follow-up (gross) / Total Loans and Receivables 3.7 5.4
Loans Under Follow-up (net) / Total Loans and Receivables 0.6 0.8
Specific Provisions / Loans Under Follow-up 84.6 84.5
Permanent Assets / Total Assets 3.1 3.5
Consumer Loans / Total Loans and Receivables 33.3 33.7
Liquidity
Liquid Assets / Total Assets 32.8 33.0
Liquid Assets / Short-term Liabilities 54.7 54.3
TC Liquid Assets / Total Assets 24.3 22.8
Profitability
Net Profit/Losses / Total Assets 2.2 2.4
Net Profit/Losses / Total Shareholders' Equity 16.5 18.3
Profit/Losses Before Taxes after Continuing Operations / Total Assets 2.7 3.0
Income-Expenditure Structure
Net Interest Income After Specific Provisions / Total Assets 3.5 4.1
Net Interest Income After Specific Provisions / Total Operating Income (Expenses) 58.9 56.7
Non-interest Income (net) / Total Assets 2.0 2.0
Other Operating Expenses / Total Assets 2.6 2.7
Personnel Expenses / Other Operating Expenses 44.4 45.5
Non-interest Income (net) / Other Operating Expenses 76.5 73.6
Quarterly profitability and income-expenditure ratios, except year-end figures, should be considered periodically.
II-13
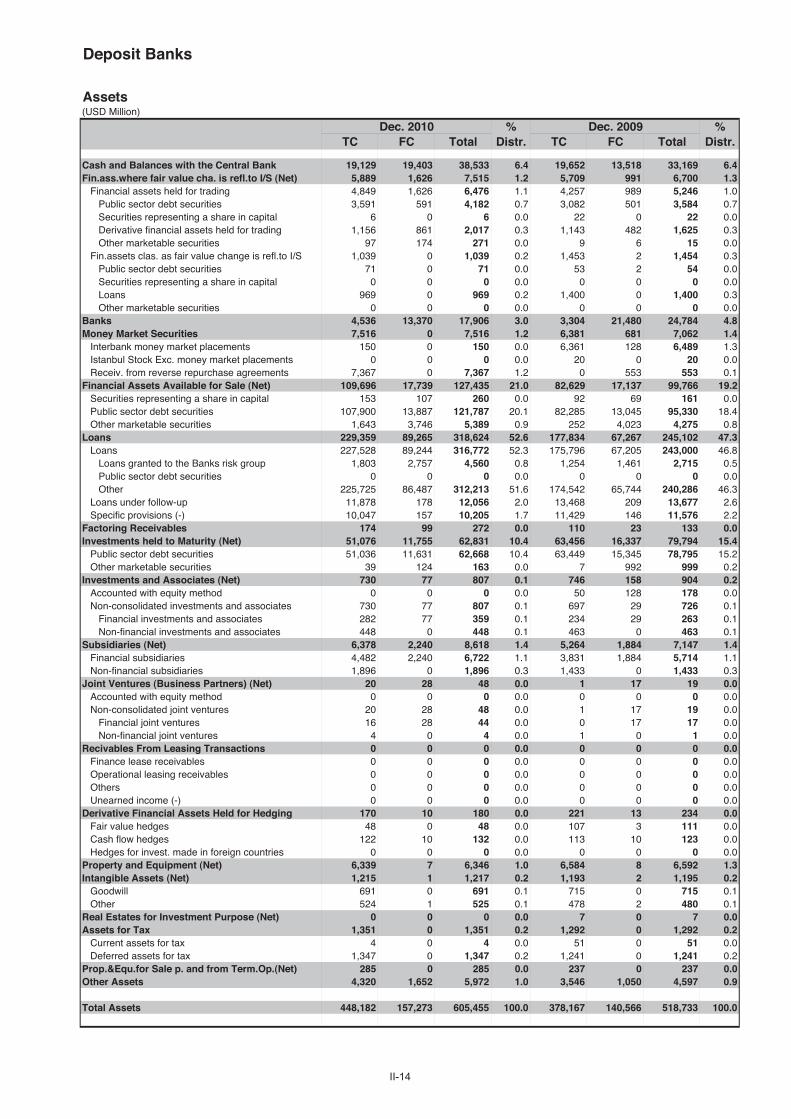
Deposit Banks
Assets(USD Million)
Dec. 2010 % Dec. 2009 %TC FC Total Distr. TC FC Total Distr.
Cash and Balances with the Central Bank 19,129 19,403 38,533 6.4 19,652 13,518 33,169 6.4Fin.ass.where fair value cha. is refl.to I/S (Net) 5,889 1,626 7,515 1.2 5,709 991 6,700 1.3
Financial assets held for trading 4,849 1,626 6,476 1.1 4,257 989 5,246 1.0Public sector debt securities 3,591 591 4,182 0.7 3,082 501 3,584 0.7Securities representing a share in capital 6 0 6 0.0 22 0 22 0.0Derivative financial assets held for trading 1,156 861 2,017 0.3 1,143 482 1,625 0.3Other marketable securities 97 174 271 0.0 9 6 15 0.0
Fin.assets clas. as fair value change is refl.to I/S 1,039 0 1,039 0.2 1,453 2 1,454 0.3Public sector debt securities 71 0 71 0.0 53 2 54 0.0Securities representing a share in capital 0 0 0 0.0 0 0 0 0.0Loans 969 0 969 0.2 1,400 0 1,400 0.3Other marketable securities 0 0 0 0.0 0 0 0 0.0
Banks 4,536 13,370 17,906 3.0 3,304 21,480 24,784 4.8Money Market Securities 7,516 0 7,516 1.2 6,381 681 7,062 1.4
Interbank money market placements 150 0 150 0.0 6,361 128 6,489 1.3Istanbul Stock Exc. money market placements 0 0 0 0.0 20 0 20 0.0Receiv. from reverse repurchase agreements 7,367 0 7,367 1.2 0 553 553 0.1
Financial Assets Available for Sale (Net) 109,696 17,739 127,435 21.0 82,629 17,137 99,766 19.2Securities representing a share in capital 153 107 260 0.0 92 69 161 0.0Public sector debt securities 107,900 13,887 121,787 20.1 82,285 13,045 95,330 18.4Other marketable securities 1,643 3,746 5,389 0.9 252 4,023 4,275 0.8
Loans 229,359 89,265 318,624 52.6 177,834 67,267 245,102 47.3Loans 227,528 89,244 316,772 52.3 175,796 67,205 243,000 46.8
Loans granted to the Banks risk group 1,803 2,757 4,560 0.8 1,254 1,461 2,715 0.5Public sector debt securities 0 0 0 0.0 0 0 0 0.0Other 225,725 86,487 312,213 51.6 174,542 65,744 240,286 46.3
Loans under follow-up 11,878 178 12,056 2.0 13,468 209 13,677 2.6Specific provisions (-) 10,047 157 10,205 1.7 11,429 146 11,576 2.2
Factoring Receivables 174 99 272 0.0 110 23 133 0.0Investments held to Maturity (Net) 51,076 11,755 62,831 10.4 63,456 16,337 79,794 15.4
Public sector debt securities 51,036 11,631 62,668 10.4 63,449 15,345 78,795 15.2Other marketable securities 39 124 163 0.0 7 992 999 0.2
Investments and Associates (Net) 730 77 807 0.1 746 158 904 0.2Accounted with equity method 0 0 0 0.0 50 128 178 0.0Non-consolidated investments and associates 730 77 807 0.1 697 29 726 0.1
Financial investments and associates 282 77 359 0.1 234 29 263 0.1Non-financial investments and associates 448 0 448 0.1 463 0 463 0.1
Subsidiaries (Net) 6,378 2,240 8,618 1.4 5,264 1,884 7,147 1.4Financial subsidiaries 4,482 2,240 6,722 1.1 3,831 1,884 5,714 1.1Non-financial subsidiaries 1,896 0 1,896 0.3 1,433 0 1,433 0.3
Joint Ventures (Business Partners) (Net) 20 28 48 0.0 1 17 19 0.0Accounted with equity method 0 0 0 0.0 0 0 0 0.0Non-consolidated joint ventures 20 28 48 0.0 1 17 19 0.0
Financial joint ventures 16 28 44 0.0 0 17 17 0.0Non-financial joint ventures 4 0 4 0.0 1 0 1 0.0
Recivables From Leasing Transactions 0 0 0 0.0 0 0 0 0.0Finance lease receivables 0 0 0 0.0 0 0 0 0.0Operational leasing receivables 0 0 0 0.0 0 0 0 0.0Others 0 0 0 0.0 0 0 0 0.0Unearned income (-) 0 0 0 0.0 0 0 0 0.0
Derivative Financial Assets Held for Hedging 170 10 180 0.0 221 13 234 0.0Fair value hedges 48 0 48 0.0 107 3 111 0.0Cash flow hedges 122 10 132 0.0 113 10 123 0.0Hedges for invest. made in foreign countries 0 0 0 0.0 0 0 0 0.0
Property and Equipment (Net) 6,339 7 6,346 1.0 6,584 8 6,592 1.3Intangible Assets (Net) 1,215 1 1,217 0.2 1,193 2 1,195 0.2
Goodwill 691 0 691 0.1 715 0 715 0.1Other 524 1 525 0.1 478 2 480 0.1
Real Estates for Investment Purpose (Net) 0 0 0 0.0 7 0 7 0.0Assets for Tax 1,351 0 1,351 0.2 1,292 0 1,292 0.2
Current assets for tax 4 0 4 0.0 51 0 51 0.0Deferred assets for tax 1,347 0 1,347 0.2 1,241 0 1,241 0.2
Prop.&Equ.for Sale p. and from Term.Op.(Net) 285 0 285 0.0 237 0 237 0.0Other Assets 4,320 1,652 5,972 1.0 3,546 1,050 4,597 0.9
Total Assets 448,182 157,273 605,455 100.0 378,167 140,566 518,733 100.0
II-14
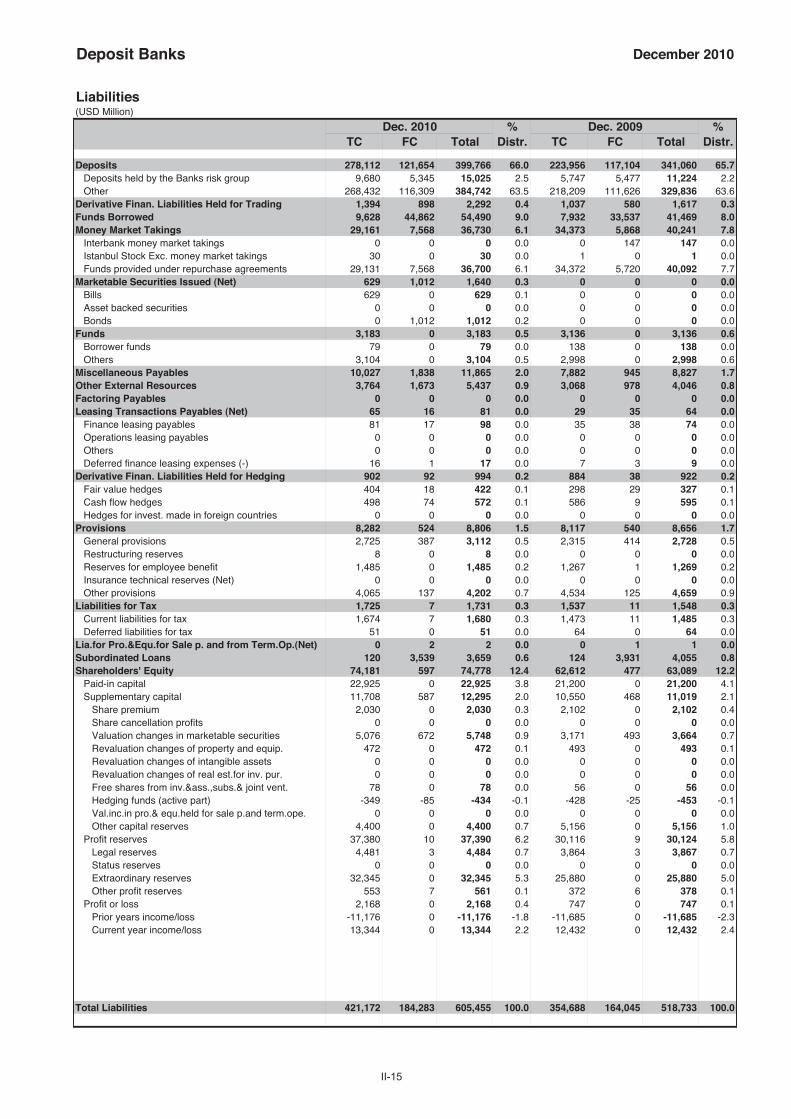
Deposit Banks December 2010
Liabilities(USD Million)
Dec. 2010 % Dec. 2009 %TC FC Total Distr. TC FC Total Distr.
Deposits 278,112 121,654 399,766 66.0 223,956 117,104 341,060 65.7Deposits held by the Banks risk group 9,680 5,345 15,025 2.5 5,747 5,477 11,224 2.2Other 268,432 116,309 384,742 63.5 218,209 111,626 329,836 63.6
Derivative Finan. Liabilities Held for Trading 1,394 898 2,292 0.4 1,037 580 1,617 0.3Funds Borrowed 9,628 44,862 54,490 9.0 7,932 33,537 41,469 8.0Money Market Takings 29,161 7,568 36,730 6.1 34,373 5,868 40,241 7.8
Interbank money market takings 0 0 0 0.0 0 147 147 0.0Istanbul Stock Exc. money market takings 30 0 30 0.0 1 0 1 0.0Funds provided under repurchase agreements 29,131 7,568 36,700 6.1 34,372 5,720 40,092 7.7
Marketable Securities Issued (Net) 629 1,012 1,640 0.3 0 0 0 0.0Bills 629 0 629 0.1 0 0 0 0.0Asset backed securities 0 0 0 0.0 0 0 0 0.0Bonds 0 1,012 1,012 0.2 0 0 0 0.0
Funds 3,183 0 3,183 0.5 3,136 0 3,136 0.6Borrower funds 79 0 79 0.0 138 0 138 0.0Others 3,104 0 3,104 0.5 2,998 0 2,998 0.6
Miscellaneous Payables 10,027 1,838 11,865 2.0 7,882 945 8,827 1.7Other External Resources 3,764 1,673 5,437 0.9 3,068 978 4,046 0.8Factoring Payables 0 0 0 0.0 0 0 0 0.0Leasing Transactions Payables (Net) 65 16 81 0.0 29 35 64 0.0
Finance leasing payables 81 17 98 0.0 35 38 74 0.0Operations leasing payables 0 0 0 0.0 0 0 0 0.0Others 0 0 0 0.0 0 0 0 0.0Deferred finance leasing expenses (-) 16 1 17 0.0 7 3 9 0.0
Derivative Finan. Liabilities Held for Hedging 902 92 994 0.2 884 38 922 0.2Fair value hedges 404 18 422 0.1 298 29 327 0.1Cash flow hedges 498 74 572 0.1 586 9 595 0.1Hedges for invest. made in foreign countries 0 0 0 0.0 0 0 0 0.0
Provisions 8,282 524 8,806 1.5 8,117 540 8,656 1.7General provisions 2,725 387 3,112 0.5 2,315 414 2,728 0.5Restructuring reserves 8 0 8 0.0 0 0 0 0.0Reserves for employee benefit 1,485 0 1,485 0.2 1,267 1 1,269 0.2Insurance technical reserves (Net) 0 0 0 0.0 0 0 0 0.0Other provisions 4,065 137 4,202 0.7 4,534 125 4,659 0.9
Liabilities for Tax 1,725 7 1,731 0.3 1,537 11 1,548 0.3Current liabilities for tax 1,674 7 1,680 0.3 1,473 11 1,485 0.3Deferred liabilities for tax 51 0 51 0.0 64 0 64 0.0
Lia.for Pro.&Equ.for Sale p. and from Term.Op.(Net) 0 2 2 0.0 0 1 1 0.0Subordinated Loans 120 3,539 3,659 0.6 124 3,931 4,055 0.8Shareholders' Equity 74,181 597 74,778 12.4 62,612 477 63,089 12.2
Paid-in capital 22,925 0 22,925 3.8 21,200 0 21,200 4.1Supplementary capital 11,708 587 12,295 2.0 10,550 468 11,019 2.1
Share premium 2,030 0 2,030 0.3 2,102 0 2,102 0.4Share cancellation profits 0 0 0 0.0 0 0 0 0.0Valuation changes in marketable securities 5,076 672 5,748 0.9 3,171 493 3,664 0.7Revaluation changes of property and equip. 472 0 472 0.1 493 0 493 0.1Revaluation changes of intangible assets 0 0 0 0.0 0 0 0 0.0Revaluation changes of real est.for inv. pur. 0 0 0 0.0 0 0 0 0.0Free shares from inv.&ass.,subs.& joint vent. 78 0 78 0.0 56 0 56 0.0Hedging funds (active part) -349 -85 -434 -0.1 -428 -25 -453 -0.1Val.inc.in pro.& equ.held for sale p.and term.ope. 0 0 0 0.0 0 0 0 0.0Other capital reserves 4,400 0 4,400 0.7 5,156 0 5,156 1.0
Profit reserves 37,380 10 37,390 6.2 30,116 9 30,124 5.8Legal reserves 4,481 3 4,484 0.7 3,864 3 3,867 0.7Status reserves 0 0 0 0.0 0 0 0 0.0Extraordinary reserves 32,345 0 32,345 5.3 25,880 0 25,880 5.0Other profit reserves 553 7 561 0.1 372 6 378 0.1
Profit or loss 2,168 0 2,168 0.4 747 0 747 0.1Prior years income/loss -11,176 0 -11,176 -1.8 -11,685 0 -11,685 -2.3Current year income/loss 13,344 0 13,344 2.2 12,432 0 12,432 2.4
Total Liabilities 421,172 184,283 605,455 100.0 354,688 164,045 518,733 100.0
II-15

Deposit Banks
Off Balance Sheet Commitments(USD Million)
Dec. 2010 Dec. 2009TC FC Total TC FC Total
Guarantees and Warranties 36,954 49,611 86,565 28,084 44,469 72,553Letters of guarantee 35,322 28,276 63,599 27,744 27,268 55,011Bank acceptances 16 2,289 2,305 3 1,967 1,970Letters of credit 1,017 16,565 17,581 11 13,341 13,352Prefinancing given as guarantee 0 40 40 0 15 15Endorsements 0 20 20 0 28 28Other guarantees and warrantees 599 2,421 3,020 326 1,851 2,177
Commitments 170,479 58,015 228,494 96,026 28,298 124,324Irrevocable commitments 100,524 20,259 120,783 89,183 24,827 114,010Revocable commitments 69,955 37,756 107,711 6,843 3,471 10,314
Derivative Financial Instruments 79,305 166,316 245,620 56,938 104,816 161,754Derivative finan. instruments held for hedging 11,750 10,160 21,910 8,389 3,453 11,842Trading transactions 67,555 156,155 223,710 48,549 101,363 149,912
Custody and Pledged Securities 1,029,731 317,473 1,347,205 832,733 259,201 1,091,934Items held in Custody 275,631 26,482 302,113 266,242 24,934 291,176Pledged Items 716,705 283,928 1,000,632 536,814 227,310 764,124Acccepted independent guaran. and warran. 37,396 7,064 44,460 29,676 6,957 36,633
Total Off Balance Sheet Commitments 1,316,469 591,415 1,907,884 1,013,782 436,784 1,450,565
Income-Expenditure(USD Million)
Dec. 2010 Dec. 2009
Interest Income 48,343 54,939Interest on loans 30,365 34,312Interest received from reserve deposits 190 473Interest received from banks 634 805Interest received from money market transactions 222 414Interest received from marketable securities portfolio 16,722 18,676Other interest income 209 259
Interest Expenses 23,981 27,821Interest on deposits 19,960 22,956Interest on money market transactions 1,846 2,296Interest on funds borrowed 1,915 2,290Interest on securities issued 25 0Other interest expenses 235 279
Net Interest Income/Expenses 24,362 27,118Net Fees and Commissions Income/Expenses 6,372 6,172
Fees and commissions received 7,489 7,393Fees and commissions paid 1,118 1,220
Dividend Income 522 498Trading Profit/Loss (net) 86 1,072
Profit/loss on trading account securities 1,734 1,769Profit/losses on derivative financial transactions -1,983 -1,157Foreign exchange profit/loss 335 460
Other Operating Income 4,983 2,613Total Operating Income/Expenses 36,325 37,473Provision for Loan Losses or other Receivables (-) 4,330 8,025
Specific provisions of banks loans and other receivables* 3,115 6,126General provision expenses* 712 471
Other Operating Expenses (-) 15,605 14,062Personnel Expenses* 6,895 6,365
Net Operating Profit/Loss 16,389 15,386Surplus written as gain after merger 0 0Profit/losses from equity method applied subsidiaries 0 0Net monetory position gain/loss 0 0Profit/Loss Before Taxes from Continuing Operations 16,389 15,386Provisions for Taxes on Income from Continuing Operations (±) -3,105 -3,049Net Profit/Loss from Continuing Operations 13,284 12,337Net Profit/Loss Before Taxes from Terminated Operations 66 132Provisions for Taxes on Income from Terminated Operations (±) -5 -38Net Profit/Loss from Terminated Operations 60 95
Net Profit/Losses 13,344 12,432
* Used from information and disclosures related to income statement".
II-16
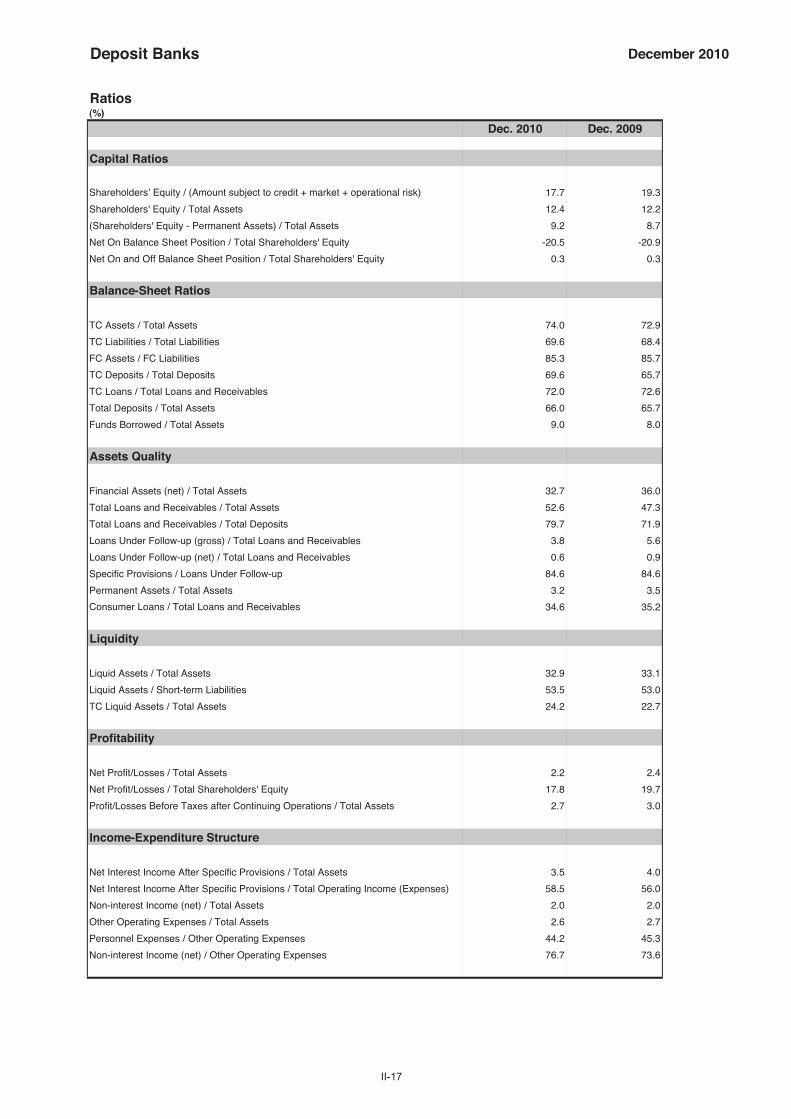
Deposit Banks December 2010
Ratios(%)
Dec. 2010 Dec. 2009
Capital Ratios
Shareholders’ Equity / (Amount subject to credit + market + operational risk) 17.7 19.3
Shareholders' Equity / Total Assets 12.4 12.2
(Shareholders' Equity - Permanent Assets) / Total Assets 9.2 8.7
Net On Balance Sheet Position / Total Shareholders' Equity -20.5 -20.9
Net On and Off Balance Sheet Position / Total Shareholders' Equity 0.3 0.3
Balance-Sheet Ratios
TC Assets / Total Assets 74.0 72.9
TC Liabilities / Total Liabilities 69.6 68.4
FC Assets / FC Liabilities 85.3 85.7
TC Deposits / Total Deposits 69.6 65.7
TC Loans / Total Loans and Receivables 72.0 72.6
Total Deposits / Total Assets 66.0 65.7
Funds Borrowed / Total Assets 9.0 8.0
Assets Quality
Financial Assets (net) / Total Assets 32.7 36.0
Total Loans and Receivables / Total Assets 52.6 47.3
Total Loans and Receivables / Total Deposits 79.7 71.9
Loans Under Follow-up (gross) / Total Loans and Receivables 3.8 5.6
Loans Under Follow-up (net) / Total Loans and Receivables 0.6 0.9
Specific Provisions / Loans Under Follow-up 84.6 84.6
Permanent Assets / Total Assets 3.2 3.5
Consumer Loans / Total Loans and Receivables 34.6 35.2
Liquidity
Liquid Assets / Total Assets 32.9 33.1
Liquid Assets / Short-term Liabilities 53.5 53.0
TC Liquid Assets / Total Assets 24.2 22.7
Profitability
Net Profit/Losses / Total Assets 2.2 2.4
Net Profit/Losses / Total Shareholders' Equity 17.8 19.7
Profit/Losses Before Taxes after Continuing Operations / Total Assets 2.7 3.0
Income-Expenditure Structure
Net Interest Income After Specific Provisions / Total Assets 3.5 4.0
Net Interest Income After Specific Provisions / Total Operating Income (Expenses) 58.5 56.0
Non-interest Income (net) / Total Assets 2.0 2.0
Other Operating Expenses / Total Assets 2.6 2.7
Personnel Expenses / Other Operating Expenses 44.2 45.3
Non-interest Income (net) / Other Operating Expenses 76.7 73.6
Quarterly profitability and income-expenditure ratios, except year-end figures, should be considered periodically.
II-17

State-owned Banks
Assets(USD Million)
Dec. 2010 % Dec. 2009 %TC FC Total Distr. TC FC Total Distr.
Cash and Balances with the Central Bank 8,483 4,239 12,722 6.6 7,491 3,024 10,515 6.3Fin.ass.where fair value cha. is refl.to I/S (Net) 168 61 230 0.1 318 78 396 0.2
Financial assets held for trading 168 61 230 0.1 318 78 396 0.2Public sector debt securities 148 23 171 0.1 316 50 366 0.2Securities representing a share in capital 0 0 0 0.0 0 0 0 0.0Derivative financial assets held for trading 19 38 57 0.0 1 28 29 0.0Other marketable securities 1 0 1 0.0 1 0 1 0.0
Fin.assets clas. as fair value change is refl.to I/S 0 0 0 0.0 0 0 0 0.0Public sector debt securities 0 0 0 0.0 0 0 0 0.0Securities representing a share in capital 0 0 0 0.0 0 0 0 0.0Loans 0 0 0 0.0 0 0 0 0.0Other marketable securities 0 0 0 0.0 0 0 0 0.0
Banks 129 4,361 4,490 2.3 227 6,029 6,256 3.7Money Market Securities 1,445 0 1,445 0.7 2,286 0 2,286 1.4
Interbank money market placements 0 0 0 0.0 2,286 0 2,286 1.4Istanbul Stock Exc. money market placements 0 0 0 0.0 0 0 0 0.0Receiv. from reverse repurchase agreements 1,445 0 1,445 0.7 0 0 0 0.0
Financial Assets Available for Sale (Net) 34,491 5,108 39,599 20.4 24,924 5,584 30,509 18.2Securities representing a share in capital 79 43 122 0.1 19 12 31 0.0Public sector debt securities 34,277 4,990 39,268 20.3 24,882 4,507 29,389 17.5Other marketable securities 134 74 209 0.1 23 1,065 1,088 0.6
Loans 75,298 20,046 95,344 49.2 55,137 14,624 69,761 41.5Loans 74,908 20,046 94,954 49.0 54,723 14,624 69,347 41.3
Loans granted to the Banks risk group 470 314 784 0.4 297 162 459 0.3Public sector debt securities 0 0 0 0.0 0 0 0 0.0Other 74,438 19,731 94,170 48.6 54,426 14,461 68,888 41.0
Loans under follow-up 3,166 7 3,173 1.6 3,114 6 3,121 1.9Specific provisions (-) 2,776 7 2,783 1.4 2,701 6 2,707 1.6
Factoring Receivables 0 0 0 0.0 0 0 0 0.0Investments held to Maturity (Net) 29,949 4,789 34,739 17.9 37,731 5,904 43,635 26.0
Public sector debt securities 29,946 4,765 34,710 17.9 37,728 5,880 43,608 25.9Other marketable securities 4 24 28 0.0 3 24 27 0.0
Investments and Associates (Net) 213 49 262 0.1 210 128 339 0.2Accounted with equity method 0 0 0 0.0 50 128 178 0.1Non-consolidated investments and associates 213 49 262 0.1 160 0 160 0.1
Financial investments and associates 204 49 253 0.1 152 0 152 0.1Non-financial investments and associates 9 0 9 0.0 9 0 9 0.0
Subsidiaries (Net) 812 436 1,249 0.6 430 373 803 0.5Financial subsidiaries 717 436 1,154 0.6 330 373 703 0.4Non-financial subsidiaries 95 0 95 0.0 100 0 100 0.1
Joint Ventures (Business Partners) (Net) 0 28 28 0.0 0 17 17 0.0Accounted with equity method 0 0 0 0.0 0 0 0 0.0Non-consolidated joint ventures 0 28 28 0.0 0 17 17 0.0
Financial joint ventures 0 28 28 0.0 0 17 17 0.0Non-financial joint ventures 0 0 0 0.0 0 0 0 0.0
Recivables From Leasing Transactions 0 0 0 0.0 0 0 0 0.0Finance lease receivables 0 0 0 0.0 0 0 0 0.0Operational leasing receivables 0 0 0 0.0 0 0 0 0.0Others 0 0 0 0.0 0 0 0 0.0Unearned income (-) 0 0 0 0.0 0 0 0 0.0
Derivative Financial Assets Held for Hedging 0 0 0 0.0 0 0 0 0.0Fair value hedges 0 0 0 0.0 0 0 0 0.0Cash flow hedges 0 0 0 0.0 0 0 0 0.0Hedges for invest. made in foreign countries 0 0 0 0.0 0 0 0 0.0
Property and Equipment (Net) 1,872 4 1,876 1.0 2,039 4 2,043 1.2Intangible Assets (Net) 68 1 69 0.0 47 1 49 0.0
Goodwill 0 0 0 0.0 0 0 0 0.0Other 68 1 69 0.0 47 1 49 0.0
Real Estates for Investment Purpose (Net) 0 0 0 0.0 0 0 0 0.0Assets for Tax 407 0 407 0.2 426 0 426 0.3
Current assets for tax 1 0 1 0.0 2 0 2 0.0Deferred assets for tax 406 0 406 0.2 425 0 425 0.3
Prop.&Equ.for Sale p. and from Term.Op.(Net) 74 0 74 0.0 62 0 62 0.0Other Assets 1,187 131 1,318 0.7 791 185 976 0.6
Total Assets 154,597 39,253 193,850 100.0 132,121 35,953 168,074 100.0
II-18
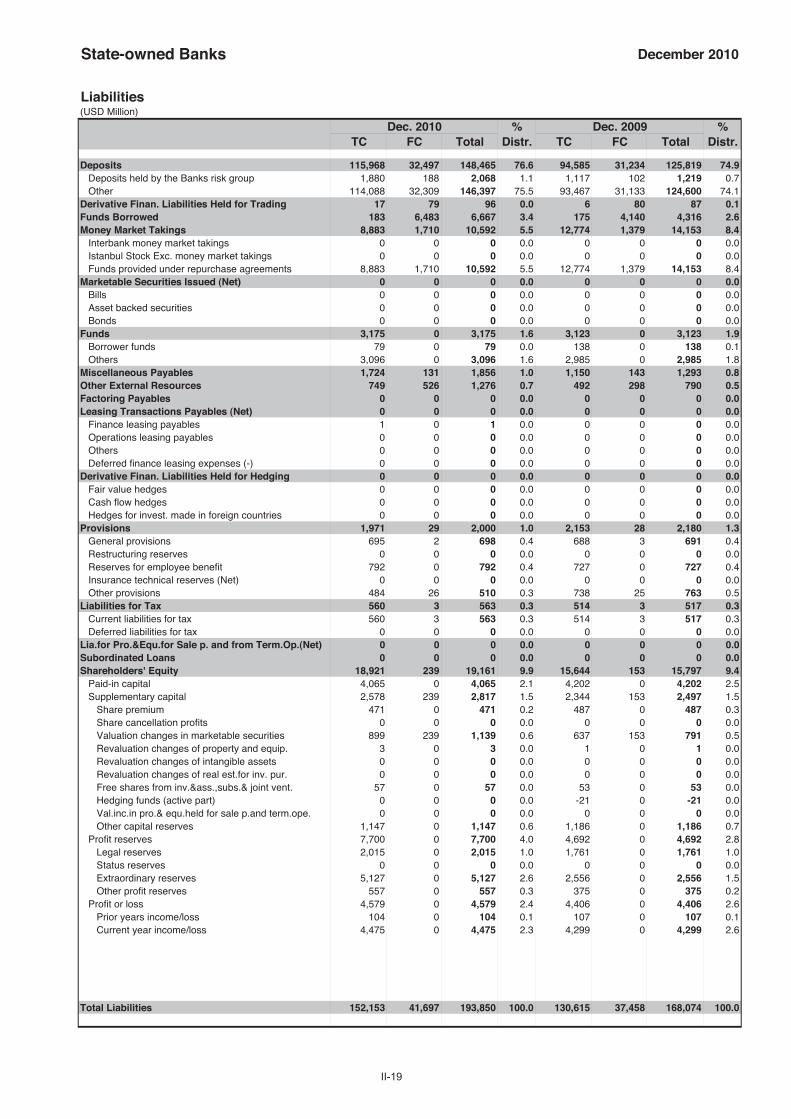
State-owned Banks December 2010
Liabilities(USD Million)
Dec. 2010 % Dec. 2009 %TC FC Total Distr. TC FC Total Distr.
Deposits 115,968 32,497 148,465 76.6 94,585 31,234 125,819 74.9Deposits held by the Banks risk group 1,880 188 2,068 1.1 1,117 102 1,219 0.7Other 114,088 32,309 146,397 75.5 93,467 31,133 124,600 74.1
Derivative Finan. Liabilities Held for Trading 17 79 96 0.0 6 80 87 0.1Funds Borrowed 183 6,483 6,667 3.4 175 4,140 4,316 2.6Money Market Takings 8,883 1,710 10,592 5.5 12,774 1,379 14,153 8.4
Interbank money market takings 0 0 0 0.0 0 0 0 0.0Istanbul Stock Exc. money market takings 0 0 0 0.0 0 0 0 0.0Funds provided under repurchase agreements 8,883 1,710 10,592 5.5 12,774 1,379 14,153 8.4
Marketable Securities Issued (Net) 0 0 0 0.0 0 0 0 0.0Bills 0 0 0 0.0 0 0 0 0.0Asset backed securities 0 0 0 0.0 0 0 0 0.0Bonds 0 0 0 0.0 0 0 0 0.0
Funds 3,175 0 3,175 1.6 3,123 0 3,123 1.9Borrower funds 79 0 79 0.0 138 0 138 0.1Others 3,096 0 3,096 1.6 2,985 0 2,985 1.8
Miscellaneous Payables 1,724 131 1,856 1.0 1,150 143 1,293 0.8Other External Resources 749 526 1,276 0.7 492 298 790 0.5Factoring Payables 0 0 0 0.0 0 0 0 0.0Leasing Transactions Payables (Net) 0 0 0 0.0 0 0 0 0.0
Finance leasing payables 1 0 1 0.0 0 0 0 0.0Operations leasing payables 0 0 0 0.0 0 0 0 0.0Others 0 0 0 0.0 0 0 0 0.0Deferred finance leasing expenses (-) 0 0 0 0.0 0 0 0 0.0
Derivative Finan. Liabilities Held for Hedging 0 0 0 0.0 0 0 0 0.0Fair value hedges 0 0 0 0.0 0 0 0 0.0Cash flow hedges 0 0 0 0.0 0 0 0 0.0Hedges for invest. made in foreign countries 0 0 0 0.0 0 0 0 0.0
Provisions 1,971 29 2,000 1.0 2,153 28 2,180 1.3General provisions 695 2 698 0.4 688 3 691 0.4Restructuring reserves 0 0 0 0.0 0 0 0 0.0Reserves for employee benefit 792 0 792 0.4 727 0 727 0.4Insurance technical reserves (Net) 0 0 0 0.0 0 0 0 0.0Other provisions 484 26 510 0.3 738 25 763 0.5
Liabilities for Tax 560 3 563 0.3 514 3 517 0.3Current liabilities for tax 560 3 563 0.3 514 3 517 0.3Deferred liabilities for tax 0 0 0 0.0 0 0 0 0.0
Lia.for Pro.&Equ.for Sale p. and from Term.Op.(Net) 0 0 0 0.0 0 0 0 0.0Subordinated Loans 0 0 0 0.0 0 0 0 0.0Shareholders' Equity 18,921 239 19,161 9.9 15,644 153 15,797 9.4
Paid-in capital 4,065 0 4,065 2.1 4,202 0 4,202 2.5Supplementary capital 2,578 239 2,817 1.5 2,344 153 2,497 1.5
Share premium 471 0 471 0.2 487 0 487 0.3Share cancellation profits 0 0 0 0.0 0 0 0 0.0Valuation changes in marketable securities 899 239 1,139 0.6 637 153 791 0.5Revaluation changes of property and equip. 3 0 3 0.0 1 0 1 0.0Revaluation changes of intangible assets 0 0 0 0.0 0 0 0 0.0Revaluation changes of real est.for inv. pur. 0 0 0 0.0 0 0 0 0.0Free shares from inv.&ass.,subs.& joint vent. 57 0 57 0.0 53 0 53 0.0Hedging funds (active part) 0 0 0 0.0 -21 0 -21 0.0Val.inc.in pro.& equ.held for sale p.and term.ope. 0 0 0 0.0 0 0 0 0.0Other capital reserves 1,147 0 1,147 0.6 1,186 0 1,186 0.7
Profit reserves 7,700 0 7,700 4.0 4,692 0 4,692 2.8Legal reserves 2,015 0 2,015 1.0 1,761 0 1,761 1.0Status reserves 0 0 0 0.0 0 0 0 0.0Extraordinary reserves 5,127 0 5,127 2.6 2,556 0 2,556 1.5Other profit reserves 557 0 557 0.3 375 0 375 0.2
Profit or loss 4,579 0 4,579 2.4 4,406 0 4,406 2.6Prior years income/loss 104 0 104 0.1 107 0 107 0.1Current year income/loss 4,475 0 4,475 2.3 4,299 0 4,299 2.6
Total Liabilities 152,153 41,697 193,850 100.0 130,615 37,458 168,074 100.0
II-19

State-owned Banks
Off Balance Sheet Commitments(USD Million)
Dec. 2010 Dec. 2009TC FC Total TC FC Total
Guarantees and Warranties 10,286 10,261 20,547 6,644 9,441 16,085Letters of guarantee 9,231 6,163 15,394 6,611 5,284 11,894Bank acceptances 7 244 251 0 409 409Letters of credit 992 3,739 4,731 3 3,655 3,657Prefinancing given as guarantee 0 4 4 0 12 12Endorsements 0 0 0 0 0 0Other guarantees and warrantees 56 111 167 30 81 111
Commitments 23,613 3,562 27,175 18,126 3,864 21,990Irrevocable commitments 16,079 1,096 17,175 11,799 1,049 12,848Revocable commitments 7,534 2,466 10,000 6,327 2,815 9,142
Derivative Financial Instruments 4,226 6,199 10,425 1,707 5,586 7,293Derivative finan. instruments held for hedging 0 0 0 0 0 0Trading transactions 4,226 6,199 10,425 1,707 5,586 7,293
Custody and Pledged Securities 383,812 120,786 504,598 291,906 88,815 380,722Items held in Custody 63,699 5,162 68,861 53,881 4,349 58,230Pledged Items 320,113 115,603 435,715 238,025 84,449 322,475Acccepted independent guaran. and warran. 0 22 22 0 17 17
Total Off Balance Sheet Commitments 421,936 140,809 562,745 318,382 107,706 426,089
Income-Expenditure(USD Million)
Dec. 2010 Dec. 2009
Interest Income 16,015 18,438Interest on loans 9,214 9,645Interest received from reserve deposits 45 77Interest received from banks 166 305Interest received from money market transactions 43 70Interest received from marketable securities portfolio 6,513 8,312Other interest income 36 29
Interest Expenses 8,681 10,198Interest on deposits 7,775 9,032Interest on money market transactions 102 150Interest on funds borrowed 724 916Interest on securities issued 0 0Other interest expenses 81 100
Net Interest Income/Expenses 7,334 8,240Net Fees and Commissions Income/Expenses 962 917
Fees and commissions received 1,167 1,121Fees and commissions paid 205 204
Dividend Income 81 42Trading Profit/Loss (net) 272 172
Profit/loss on trading account securities 397 185Profit/losses on derivative financial transactions -21 -55Foreign exchange profit/loss -104 41
Other Operating Income 1,400 620Total Operating Income/Expenses 10,050 9,989Provision for Loan Losses or other Receivables (-) 1,025 1,519
Specific provisions of banks loans and other receivables* 729 1,024General provision expenses* 144 183
Other Operating Expenses (-) 3,535 3,107Personnel Expenses* 1,683 1,520
Net Operating Profit/Loss 5,490 5,363Surplus written as gain after merger 0 0Profit/losses from equity method applied subsidiaries 0 0Net monetory position gain/loss 0 0Profit/Loss Before Taxes from Continuing Operations 5,490 5,363Provisions for Taxes on Income from Continuing Operations (±) -1,015 -1,064Net Profit/Loss from Continuing Operations 4,475 4,299Net Profit/Loss Before Taxes from Terminated Operations 0 0Provisions for Taxes on Income from Terminated Operations (±) 0 0Net Profit/Loss from Terminated Operations 0 0
Net Profit/Losses 4,475 4,299
* Used from information and disclosures related to income statement".
II-20
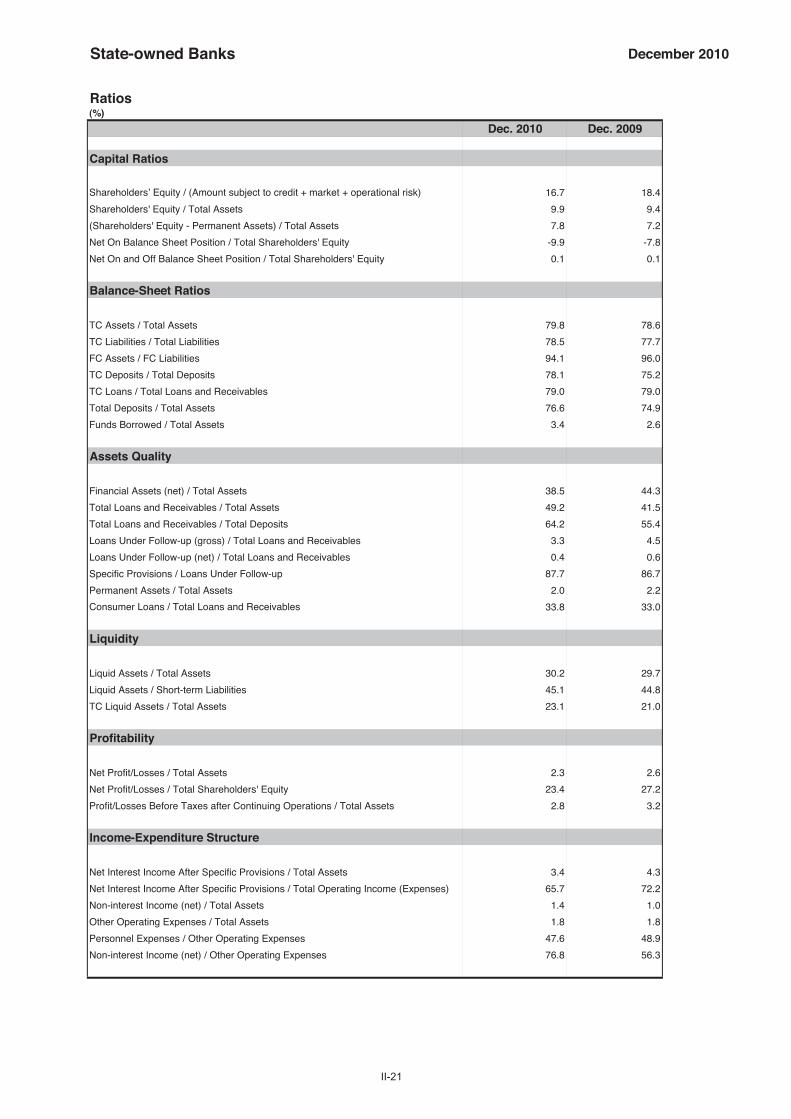
State-owned Banks December 2010
Ratios(%)
Dec. 2010 Dec. 2009
Capital Ratios
Shareholders’ Equity / (Amount subject to credit + market + operational risk) 16.7 18.4
Shareholders' Equity / Total Assets 9.9 9.4
(Shareholders' Equity - Permanent Assets) / Total Assets 7.8 7.2
Net On Balance Sheet Position / Total Shareholders' Equity -9.9 -7.8
Net On and Off Balance Sheet Position / Total Shareholders' Equity 0.1 0.1
Balance-Sheet Ratios
TC Assets / Total Assets 79.8 78.6
TC Liabilities / Total Liabilities 78.5 77.7
FC Assets / FC Liabilities 94.1 96.0
TC Deposits / Total Deposits 78.1 75.2
TC Loans / Total Loans and Receivables 79.0 79.0
Total Deposits / Total Assets 76.6 74.9
Funds Borrowed / Total Assets 3.4 2.6
Assets Quality
Financial Assets (net) / Total Assets 38.5 44.3
Total Loans and Receivables / Total Assets 49.2 41.5
Total Loans and Receivables / Total Deposits 64.2 55.4
Loans Under Follow-up (gross) / Total Loans and Receivables 3.3 4.5
Loans Under Follow-up (net) / Total Loans and Receivables 0.4 0.6
Specific Provisions / Loans Under Follow-up 87.7 86.7
Permanent Assets / Total Assets 2.0 2.2
Consumer Loans / Total Loans and Receivables 33.8 33.0
Liquidity
Liquid Assets / Total Assets 30.2 29.7
Liquid Assets / Short-term Liabilities 45.1 44.8
TC Liquid Assets / Total Assets 23.1 21.0
Profitability
Net Profit/Losses / Total Assets 2.3 2.6
Net Profit/Losses / Total Shareholders' Equity 23.4 27.2
Profit/Losses Before Taxes after Continuing Operations / Total Assets 2.8 3.2
Income-Expenditure Structure
Net Interest Income After Specific Provisions / Total Assets 3.4 4.3
Net Interest Income After Specific Provisions / Total Operating Income (Expenses) 65.7 72.2
Non-interest Income (net) / Total Assets 1.4 1.0
Other Operating Expenses / Total Assets 1.8 1.8
Personnel Expenses / Other Operating Expenses 47.6 48.9
Non-interest Income (net) / Other Operating Expenses 76.8 56.3
Quarterly profitability and income-expenditure ratios, except year-end figures, should be considered periodically.
II-21

Privately-owned Banks
Assets(USD Million)
Dec. 2010 % Dec. 2009 %TC FC Total Distr. TC FC Total Distr.
Cash and Balances with the Central Bank 8,752 11,775 20,526 6.4 9,946 8,188 18,134 6.5Fin.ass.where fair value cha. is refl.to I/S (Net) 2,404 672 3,077 1.0 2,033 459 2,492 0.9
Financial assets held for trading 2,071 672 2,743 0.8 1,690 459 2,149 0.8Public sector debt securities 1,242 192 1,434 0.4 884 162 1,046 0.4Securities representing a share in capital 5 0 5 0.0 1 0 1 0.0Derivative financial assets held for trading 819 480 1,299 0.4 798 297 1,095 0.4Other marketable securities 5 0 5 0.0 6 0 6 0.0
Fin.assets clas. as fair value change is refl.to I/S 333 0 333 0.1 343 0 343 0.1Public sector debt securities 0 0 0 0.0 0 0 0 0.0Securities representing a share in capital 0 0 0 0.0 0 0 0 0.0Loans 333 0 333 0.1 343 0 343 0.1Other marketable securities 0 0 0 0.0 0 0 0 0.0
Banks 2,321 7,987 10,308 3.2 2,342 12,932 15,273 5.5Money Market Securities 617 0 617 0.2 2,132 57 2,189 0.8
Interbank money market placements 0 0 0 0.0 2,112 57 2,169 0.8Istanbul Stock Exc. money market placements 0 0 0 0.0 20 0 20 0.0Receiv. from reverse repurchase agreements 617 0 617 0.2 0 0 0 0.0
Financial Assets Available for Sale (Net) 64,136 11,422 75,557 23.4 48,315 10,547 58,863 21.2Securities representing a share in capital 62 63 125 0.0 52 56 108 0.0Public sector debt securities 62,663 7,875 70,539 21.8 48,088 7,708 55,796 20.1Other marketable securities 1,411 3,483 4,894 1.5 175 2,783 2,959 1.1
Loans 110,540 59,782 170,322 52.7 86,787 45,335 132,123 47.6Loans 109,801 59,761 169,562 52.5 85,948 45,331 131,279 47.2
Loans granted to the Banks risk group 1,100 2,096 3,196 1.0 845 1,178 2,023 0.7Public sector debt securities 0 0 0 0.0 0 0 0 0.0Other 108,701 57,666 166,366 51.5 85,103 44,153 129,256 46.5
Loans under follow-up 5,538 97 5,635 1.7 7,039 86 7,125 2.6Specific provisions (-) 4,798 77 4,875 1.5 6,200 81 6,281 2.3
Factoring Receivables 0 0 0 0.0 0 0 0 0.0Investments held to Maturity (Net) 19,890 6,724 26,615 8.2 24,417 10,184 34,602 12.5
Public sector debt securities 19,884 6,709 26,593 8.2 24,414 9,290 33,704 12.1Other marketable securities 6 15 22 0.0 4 894 898 0.3
Investments and Associates (Net) 510 28 538 0.2 529 29 558 0.2Accounted with equity method 0 0 0 0.0 0 0 0 0.0Non-consolidated investments and associates 510 28 538 0.2 529 29 558 0.2
Financial investments and associates 78 28 106 0.0 82 29 111 0.0Non-financial investments and associates 432 0 432 0.1 446 0 446 0.2
Subsidiaries (Net) 4,954 1,698 6,652 2.1 4,289 1,338 5,627 2.0Financial subsidiaries 3,167 1,698 4,865 1.5 2,971 1,338 4,309 1.6Non-financial subsidiaries 1,787 0 1,787 0.6 1,319 0 1,319 0.5
Joint Ventures (Business Partners) (Net) 16 0 16 0.0 0 0 0 0.0Accounted with equity method 0 0 0 0.0 0 0 0 0.0Non-consolidated joint ventures 16 0 16 0.0 0 0 0 0.0
Financial joint ventures 16 0 16 0.0 0 0 0 0.0Non-financial joint ventures 0 0 0 0.0 0 0 0 0.0
Recivables From Leasing Transactions 0 0 0 0.0 0 0 0 0.0Finance lease receivables 0 0 0 0.0 0 0 0 0.0Operational leasing receivables 0 0 0 0.0 0 0 0 0.0Others 0 0 0 0.0 0 0 0 0.0Unearned income (-) 0 0 0 0.0 0 0 0 0.0
Derivative Financial Assets Held for Hedging 30 2 32 0.0 107 1 108 0.0Fair value hedges 30 0 30 0.0 107 1 108 0.0Cash flow hedges 0 2 2 0.0 0 0 0 0.0Hedges for invest. made in foreign countries 0 0 0 0.0 0 0 0 0.0
Property and Equipment (Net) 3,572 3 3,576 1.1 3,603 4 3,607 1.3Intangible Assets (Net) 923 0 923 0.3 903 0 903 0.3
Goodwill 637 0 637 0.2 659 0 659 0.2Other 286 0 286 0.1 244 0 244 0.1
Real Estates for Investment Purpose (Net) 0 0 0 0.0 0 0 0 0.0Assets for Tax 749 0 749 0.2 649 0 649 0.2
Current assets for tax 0 0 0 0.0 3 0 3 0.0Deferred assets for tax 748 0 748 0.2 646 0 646 0.2
Prop.&Equ.for Sale p. and from Term.Op.(Net) 178 0 178 0.1 160 0 160 0.1Other Assets 2,201 1,032 3,233 1.0 1,905 655 2,560 0.9
Total Assets 221,793 101,126 322,919 100.0 188,116 89,730 277,846 100.0
II-22
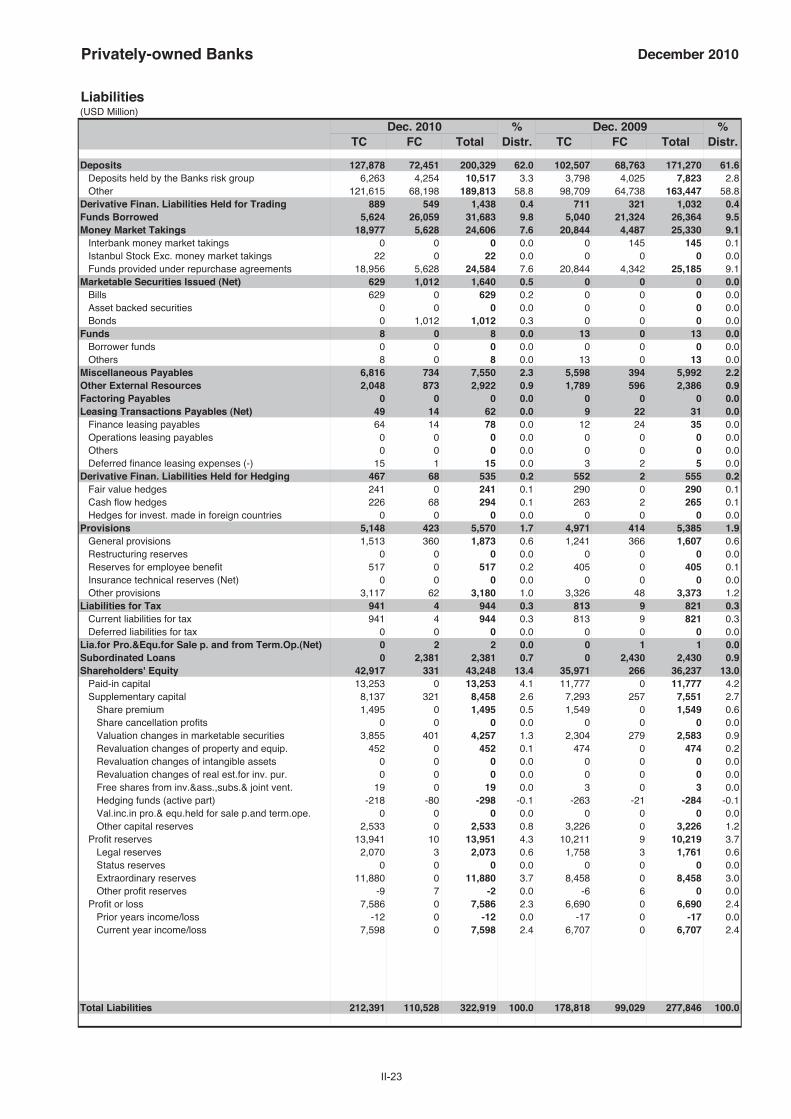
Privately-owned Banks December 2010
Liabilities(USD Million)
Dec. 2010 % Dec. 2009 %TC FC Total Distr. TC FC Total Distr.
Deposits 127,878 72,451 200,329 62.0 102,507 68,763 171,270 61.6Deposits held by the Banks risk group 6,263 4,254 10,517 3.3 3,798 4,025 7,823 2.8Other 121,615 68,198 189,813 58.8 98,709 64,738 163,447 58.8
Derivative Finan. Liabilities Held for Trading 889 549 1,438 0.4 711 321 1,032 0.4Funds Borrowed 5,624 26,059 31,683 9.8 5,040 21,324 26,364 9.5Money Market Takings 18,977 5,628 24,606 7.6 20,844 4,487 25,330 9.1
Interbank money market takings 0 0 0 0.0 0 145 145 0.1Istanbul Stock Exc. money market takings 22 0 22 0.0 0 0 0 0.0Funds provided under repurchase agreements 18,956 5,628 24,584 7.6 20,844 4,342 25,185 9.1
Marketable Securities Issued (Net) 629 1,012 1,640 0.5 0 0 0 0.0Bills 629 0 629 0.2 0 0 0 0.0Asset backed securities 0 0 0 0.0 0 0 0 0.0Bonds 0 1,012 1,012 0.3 0 0 0 0.0
Funds 8 0 8 0.0 13 0 13 0.0Borrower funds 0 0 0 0.0 0 0 0 0.0Others 8 0 8 0.0 13 0 13 0.0
Miscellaneous Payables 6,816 734 7,550 2.3 5,598 394 5,992 2.2Other External Resources 2,048 873 2,922 0.9 1,789 596 2,386 0.9Factoring Payables 0 0 0 0.0 0 0 0 0.0Leasing Transactions Payables (Net) 49 14 62 0.0 9 22 31 0.0
Finance leasing payables 64 14 78 0.0 12 24 35 0.0Operations leasing payables 0 0 0 0.0 0 0 0 0.0Others 0 0 0 0.0 0 0 0 0.0Deferred finance leasing expenses (-) 15 1 15 0.0 3 2 5 0.0
Derivative Finan. Liabilities Held for Hedging 467 68 535 0.2 552 2 555 0.2Fair value hedges 241 0 241 0.1 290 0 290 0.1Cash flow hedges 226 68 294 0.1 263 2 265 0.1Hedges for invest. made in foreign countries 0 0 0 0.0 0 0 0 0.0
Provisions 5,148 423 5,570 1.7 4,971 414 5,385 1.9General provisions 1,513 360 1,873 0.6 1,241 366 1,607 0.6Restructuring reserves 0 0 0 0.0 0 0 0 0.0Reserves for employee benefit 517 0 517 0.2 405 0 405 0.1Insurance technical reserves (Net) 0 0 0 0.0 0 0 0 0.0Other provisions 3,117 62 3,180 1.0 3,326 48 3,373 1.2
Liabilities for Tax 941 4 944 0.3 813 9 821 0.3Current liabilities for tax 941 4 944 0.3 813 9 821 0.3Deferred liabilities for tax 0 0 0 0.0 0 0 0 0.0
Lia.for Pro.&Equ.for Sale p. and from Term.Op.(Net) 0 2 2 0.0 0 1 1 0.0Subordinated Loans 0 2,381 2,381 0.7 0 2,430 2,430 0.9Shareholders' Equity 42,917 331 43,248 13.4 35,971 266 36,237 13.0
Paid-in capital 13,253 0 13,253 4.1 11,777 0 11,777 4.2Supplementary capital 8,137 321 8,458 2.6 7,293 257 7,551 2.7
Share premium 1,495 0 1,495 0.5 1,549 0 1,549 0.6Share cancellation profits 0 0 0 0.0 0 0 0 0.0Valuation changes in marketable securities 3,855 401 4,257 1.3 2,304 279 2,583 0.9Revaluation changes of property and equip. 452 0 452 0.1 474 0 474 0.2Revaluation changes of intangible assets 0 0 0 0.0 0 0 0 0.0Revaluation changes of real est.for inv. pur. 0 0 0 0.0 0 0 0 0.0Free shares from inv.&ass.,subs.& joint vent. 19 0 19 0.0 3 0 3 0.0Hedging funds (active part) -218 -80 -298 -0.1 -263 -21 -284 -0.1Val.inc.in pro.& equ.held for sale p.and term.ope. 0 0 0 0.0 0 0 0 0.0Other capital reserves 2,533 0 2,533 0.8 3,226 0 3,226 1.2
Profit reserves 13,941 10 13,951 4.3 10,211 9 10,219 3.7Legal reserves 2,070 3 2,073 0.6 1,758 3 1,761 0.6Status reserves 0 0 0 0.0 0 0 0 0.0Extraordinary reserves 11,880 0 11,880 3.7 8,458 0 8,458 3.0Other profit reserves -9 7 -2 0.0 -6 6 0 0.0
Profit or loss 7,586 0 7,586 2.3 6,690 0 6,690 2.4Prior years income/loss -12 0 -12 0.0 -17 0 -17 0.0Current year income/loss 7,598 0 7,598 2.4 6,707 0 6,707 2.4
Total Liabilities 212,391 110,528 322,919 100.0 178,818 99,029 277,846 100.0
II-23
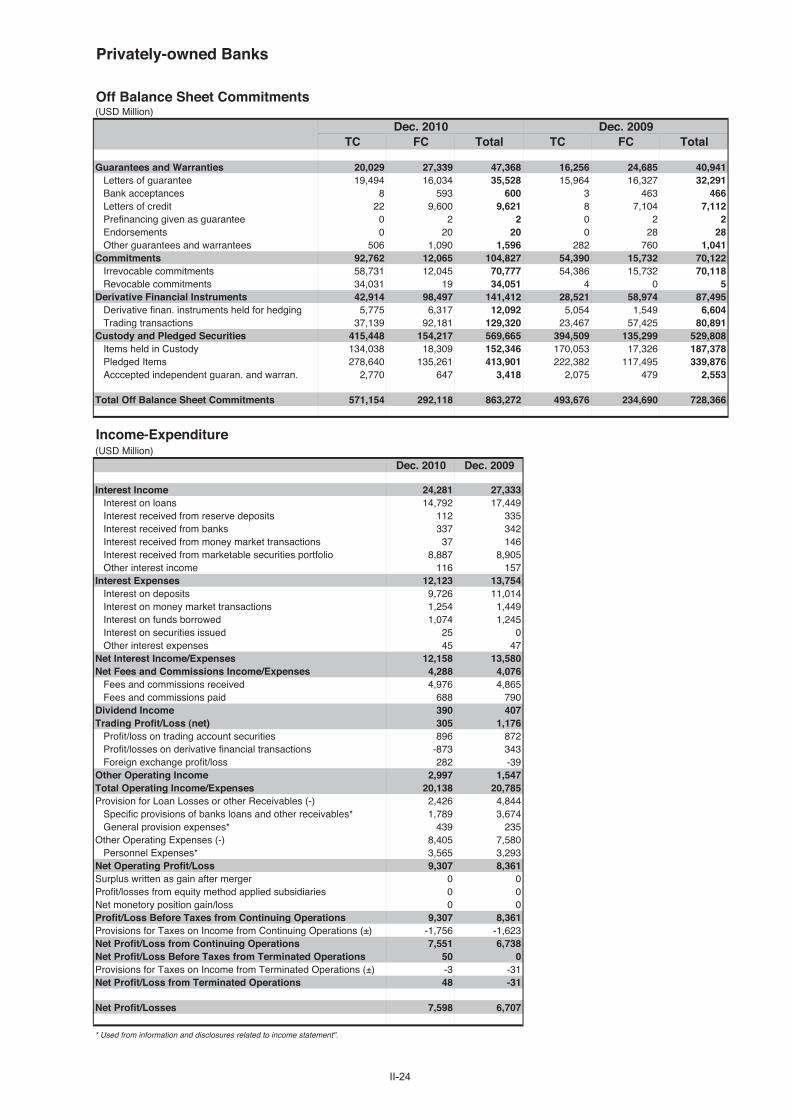
Privately-owned Banks
Off Balance Sheet Commitments(USD Million)
Dec. 2010 Dec. 2009TC FC Total TC FC Total
Guarantees and Warranties 20,029 27,339 47,368 16,256 24,685 40,941Letters of guarantee 19,494 16,034 35,528 15,964 16,327 32,291Bank acceptances 8 593 600 3 463 466Letters of credit 22 9,600 9,621 8 7,104 7,112Prefinancing given as guarantee 0 2 2 0 2 2Endorsements 0 20 20 0 28 28Other guarantees and warrantees 506 1,090 1,596 282 760 1,041
Commitments 92,762 12,065 104,827 54,390 15,732 70,122Irrevocable commitments 58,731 12,045 70,777 54,386 15,732 70,118Revocable commitments 34,031 19 34,051 4 0 5
Derivative Financial Instruments 42,914 98,497 141,412 28,521 58,974 87,495Derivative finan. instruments held for hedging 5,775 6,317 12,092 5,054 1,549 6,604Trading transactions 37,139 92,181 129,320 23,467 57,425 80,891
Custody and Pledged Securities 415,448 154,217 569,665 394,509 135,299 529,808Items held in Custody 134,038 18,309 152,346 170,053 17,326 187,378Pledged Items 278,640 135,261 413,901 222,382 117,495 339,876Acccepted independent guaran. and warran. 2,770 647 3,418 2,075 479 2,553
Total Off Balance Sheet Commitments 571,154 292,118 863,272 493,676 234,690 728,366
Income-Expenditure(USD Million)
Dec. 2010 Dec. 2009
Interest Income 24,281 27,333Interest on loans 14,792 17,449Interest received from reserve deposits 112 335Interest received from banks 337 342Interest received from money market transactions 37 146Interest received from marketable securities portfolio 8,887 8,905Other interest income 116 157
Interest Expenses 12,123 13,754Interest on deposits 9,726 11,014Interest on money market transactions 1,254 1,449Interest on funds borrowed 1,074 1,245Interest on securities issued 25 0Other interest expenses 45 47
Net Interest Income/Expenses 12,158 13,580Net Fees and Commissions Income/Expenses 4,288 4,076
Fees and commissions received 4,976 4,865Fees and commissions paid 688 790
Dividend Income 390 407Trading Profit/Loss (net) 305 1,176
Profit/loss on trading account securities 896 872Profit/losses on derivative financial transactions -873 343Foreign exchange profit/loss 282 -39
Other Operating Income 2,997 1,547Total Operating Income/Expenses 20,138 20,785Provision for Loan Losses or other Receivables (-) 2,426 4,844
Specific provisions of banks loans and other receivables* 1,789 3,674General provision expenses* 439 235
Other Operating Expenses (-) 8,405 7,580Personnel Expenses* 3,565 3,293
Net Operating Profit/Loss 9,307 8,361Surplus written as gain after merger 0 0Profit/losses from equity method applied subsidiaries 0 0Net monetory position gain/loss 0 0Profit/Loss Before Taxes from Continuing Operations 9,307 8,361Provisions for Taxes on Income from Continuing Operations (±) -1,756 -1,623Net Profit/Loss from Continuing Operations 7,551 6,738Net Profit/Loss Before Taxes from Terminated Operations 50 0Provisions for Taxes on Income from Terminated Operations (±) -3 -31Net Profit/Loss from Terminated Operations 48 -31
Net Profit/Losses 7,598 6,707
* Used from information and disclosures related to income statement".
II-24

Privately-owned Banks December 2010
Ratios(%)
Dec. 2010 Dec. 2009
Capital Ratios
Shareholders’ Equity / (Amount subject to credit + market + operational risk) 18.2 19.7
Shareholders' Equity / Total Assets 13.4 13.0
(Shareholders' Equity - Permanent Assets) / Total Assets 9.5 8.8
Net On Balance Sheet Position / Total Shareholders' Equity -5.6 -8.9
Net On and Off Balance Sheet Position / Total Shareholders' Equity 0.4 0.7
Balance-Sheet Ratios
TC Assets / Total Assets 68.7 67.7
TC Liabilities / Total Liabilities 65.8 64.4
FC Assets / FC Liabilities 91.5 90.6
TC Deposits / Total Deposits 63.8 59.9
TC Loans / Total Loans and Receivables 64.9 65.7
Total Deposits / Total Assets 62.0 61.6
Funds Borrowed / Total Assets 9.8 9.5
Assets Quality
Financial Assets (net) / Total Assets 32.6 34.6
Total Loans and Receivables / Total Assets 52.7 47.6
Total Loans and Receivables / Total Deposits 85.0 77.1
Loans Under Follow-up (gross) / Total Loans and Receivables 3.3 5.4
Loans Under Follow-up (net) / Total Loans and Receivables 0.4 0.6
Specific Provisions / Loans Under Follow-up 86.5 88.2
Permanent Assets / Total Assets 3.9 4.2
Consumer Loans / Total Loans and Receivables 32.0 32.9
Liquidity
Liquid Assets / Total Assets 34.1 34.9
Liquid Assets / Short-term Liabilities 56.9 56.7
TC Liquid Assets / Total Assets 24.2 23.3
Profitability
Net Profit/Losses / Total Assets 2.4 2.4
Net Profit/Losses / Total Shareholders' Equity 17.6 18.5
Profit/Losses Before Taxes after Continuing Operations / Total Assets 2.9 3.0
Income-Expenditure Structure
Net Interest Income After Specific Provisions / Total Assets 3.2 3.6
Net Interest Income After Specific Provisions / Total Operating Income (Expenses) 51.5 47.7
Non-interest Income (net) / Total Assets 2.5 2.6
Other Operating Expenses / Total Assets 2.6 2.7
Personnel Expenses / Other Operating Expenses 42.4 43.4
Non-interest Income (net) / Other Operating Expenses 94.9 95.1
Quarterly profitability and income-expenditure ratios, except year-end figures, should be considered periodically.
II-25

II-26
Banks Under the Deposit Insurance Fund
Assets(USD Million)
Dec. 2010 % Dec. 2009 %TC FC Total Distr. TC FC Total Distr.
Cash and Balances with the Central Bank 0 0 0 0.0 0 0 0 0.0Fin.ass.where fair value cha. is refl.to I/S (Net) 135 0 135 26.2 248 0 248 45.6
Financial assets held for trading 135 0 135 26.2 248 0 248 45.6Public sector debt securities 135 0 135 26.2 248 0 248 45.6Securities representing a share in capital 0 0 0 0.0 0 0 0 0.0Derivative financial assets held for trading 0 0 0 0.0 0 0 0 0.0Other marketable securities 0 0 0 0.0 0 0 0 0.0
Fin.assets clas. as fair value change is refl.to I/S 0 0 0 0.0 0 0 0 0.0Public sector debt securities 0 0 0 0.0 0 0 0 0.0Securities representing a share in capital 0 0 0 0.0 0 0 0 0.0Loans 0 0 0 0.0 0 0 0 0.0Other marketable securities 0 0 0 0.0 0 0 0 0.0
Banks 245 59 304 59.1 144 67 211 39.0Money Market Securities 0 0 0 0.0 5 0 5 0.9
Interbank money market placements 0 0 0 0.0 5 0 5 0.9Istanbul Stock Exc. money market placements 0 0 0 0.0 0 0 0 0.0Receiv. from reverse repurchase agreements 0 0 0 0.0 0 0 0 0.0
Financial Assets Available for Sale (Net) 0 0 0 0.0 0 0 0 0.0Securities representing a share in capital 0 0 0 0.0 0 0 0 0.0Public sector debt securities 0 0 0 0.0 0 0 0 0.0Other marketable securities 0 0 0 0.0 0 0 0 0.0
Loans 2 0 2 0.4 8 0 8 1.5Loans 1 0 1 0.1 1 0 1 0.1
Loans granted to the Banks risk group 0 0 0 0.0 0 0 0 0.0Public sector debt securities 0 0 0 0.0 0 0 0 0.0Other 1 0 1 0.1 1 0 1 0.1
Loans under follow-up 28 5 33 6.5 35 6 41 7.6Specific provisions (-) 27 5 32 6.2 28 6 34 6.2
Factoring Receivables 0 0 0 0.0 0 0 0 0.0Investments held to Maturity (Net) 0 0 0 0.0 0 0 0 0.0
Public sector debt securities 0 0 0 0.0 0 0 0 0.0Other marketable securities 0 0 0 0.0 0 0 0 0.0
Investments and Associates (Net) 0 0 0 0.0 0 0 0 0.0Accounted with equity method 0 0 0 0.0 0 0 0 0.0Non-consolidated investments and associates 0 0 0 0.0 0 0 0 0.0
Financial investments and associates 0 0 0 0.0 0 0 0 0.0Non-financial investments and associates 0 0 0 0.0 0 0 0 0.0
Subsidiaries (Net) 0 0 0 0.0 0 0 0 0.0Financial subsidiaries 0 0 0 0.0 0 0 0 0.0Non-financial subsidiaries 0 0 0 0.0 0 0 0 0.0
Joint Ventures (Business Partners) (Net) 0 0 0 0.0 0 0 0 0.0Accounted with equity method 0 0 0 0.0 0 0 0 0.0Non-consolidated joint ventures 0 0 0 0.0 0 0 0 0.0
Financial joint ventures 0 0 0 0.0 0 0 0 0.0Non-financial joint ventures 0 0 0 0.0 0 0 0 0.0
Recivables From Leasing Transactions 0 0 0 0.0 0 0 0 0.0Finance lease receivables 0 0 0 0.0 0 0 0 0.0Operational leasing receivables 0 0 0 0.0 0 0 0 0.0Others 0 0 0 0.0 0 0 0 0.0Unearned income (-) 0 0 0 0.0 0 0 0 0.0
Derivative Financial Assets Held for Hedging 0 0 0 0.0 0 0 0 0.0Fair value hedges 0 0 0 0.0 0 0 0 0.0Cash flow hedges 0 0 0 0.0 0 0 0 0.0Hedges for invest. made in foreign countries 0 0 0 0.0 0 0 0 0.0
Property and Equipment (Net) 35 0 35 6.8 37 0 37 6.8Intangible Assets (Net) 0 0 0 0.0 0 0 0 0.0
Goodwill 0 0 0 0.0 0 0 0 0.0Other 0 0 0 0.0 0 0 0 0.0
Real Estates for Investment Purpose (Net) 0 0 0 0.0 0 0 0 0.0Assets for Tax 7 0 7 1.3 0 0 0 0.1
Current assets for tax 0 0 0 0.0 0 0 0 0.0Deferred assets for tax 7 0 7 1.3 0 0 0 0.1
Prop.&Equ.for Sale p. and from Term.Op.(Net) 0 0 0 0.0 0 0 0 0.0Other Assets 29 3 32 6.3 29 4 33 6.1
Total Assets 452 62 514 100.0 471 72 542 100.0

II-27
Banks Under the Deposit Insurance Fund December 2010
Liabilities(USD Million)
Dec. 2010 % Dec. 2009 %TC FC Total Distr. TC FC Total Distr.
Deposits 7 10 17 3.2 8 11 19 3.5Deposits held by the Banks risk group 0 0 0 0.0 0 0 0 0.0Other 7 10 17 3.2 8 11 19 3.5
Derivative Finan. Liabilities Held for Trading 0 0 0 0.0 0 0 0 0.0Funds Borrowed 0 0 0 0.0 0 0 0 0.0Money Market Takings 2 0 2 0.3 2 0 2 0.4
Interbank money market takings 0 0 0 0.0 0 0 0 0.0Istanbul Stock Exc. money market takings 0 0 0 0.0 0 0 0 0.0Funds provided under repurchase agreements 2 0 2 0.3 2 0 2 0.4
Marketable Securities Issued (Net) 0 0 0 0.0 0 0 0 0.0Bills 0 0 0 0.0 0 0 0 0.0Asset backed securities 0 0 0 0.0 0 0 0 0.0Bonds 0 0 0 0.0 0 0 0 0.0
Funds 0 0 0 0.0 0 0 0 0.0Borrower funds 0 0 0 0.0 0 0 0 0.0Others 0 0 0 0.0 0 0 0 0.0
Miscellaneous Payables 5 27 32 6.3 8 28 36 6.6Other External Resources 3 0 3 0.6 3 0 3 0.5Factoring Payables 0 0 0 0.0 0 0 0 0.0Leasing Transactions Payables (Net) 0 0 0 0.0 0 0 0 0.0
Finance leasing payables 0 0 0 0.0 0 0 0 0.0Operations leasing payables 0 0 0 0.0 0 0 0 0.0Others 0 0 0 0.0 0 0 0 0.0Deferred finance leasing expenses (-) 0 0 0 0.0 0 0 0 0.0
Derivative Finan. Liabilities Held for Hedging 0 0 0 0.0 0 0 0 0.0Fair value hedges 0 0 0 0.0 0 0 0 0.0Cash flow hedges 0 0 0 0.0 0 0 0 0.0Hedges for invest. made in foreign countries 0 0 0 0.0 0 0 0 0.0
Provisions 54 27 81 15.8 23 32 55 10.2General provisions 2 0 2 0.3 3 0 3 0.6Restructuring reserves 0 0 0 0.0 0 0 0 0.0Reserves for employee benefit 3 0 3 0.6 2 0 2 0.5Insurance technical reserves (Net) 0 0 0 0.0 0 0 0 0.0Other provisions 50 27 76 14.9 17 32 49 9.1
Liabilities for Tax 2 0 2 0.4 2 0 2 0.4Current liabilities for tax 2 0 2 0.4 2 0 2 0.4Deferred liabilities for tax 0 0 0 0.0 0 0 0 0.0
Lia.for Pro.&Equ.for Sale p. and from Term.Op.(Net) 0 0 0 0.0 0 0 0 0.0Subordinated Loans 0 0 0 0.0 0 0 0 0.0Shareholders' Equity 377 0 377 73.4 426 0 426 78.4
Paid-in capital 300 0 300 58.2 310 0 310 57.1Supplementary capital 0 0 0 0.0 0 0 0 0.0
Share premium 0 0 0 0.0 0 0 0 0.0Share cancellation profits 0 0 0 0.0 0 0 0 0.0Valuation changes in marketable securities 0 0 0 0.0 0 0 0 0.0Revaluation changes of property and equip. 0 0 0 0.0 0 0 0 0.0Revaluation changes of intangible assets 0 0 0 0.0 0 0 0 0.0Revaluation changes of real est.for inv. pur. 0 0 0 0.0 0 0 0 0.0Free shares from inv.&ass.,subs.& joint vent. 0 0 0 0.0 0 0 0 0.0Hedging funds (active part) 0 0 0 0.0 0 0 0 0.0Val.inc.in pro.& equ.held for sale p.and term.ope. 0 0 0 0.0 0 0 0 0.0Other capital reserves 0 0 0 0.0 0 0 0 0.0
Profit reserves 11,500 0 11,500 2,236.2 11,926 0 11,926 2,198.4Legal reserves 17 0 17 3.4 18 0 18 3.3Status reserves 0 0 0 0.0 0 0 0 0.0Extraordinary reserves 11,483 0 11,483 2,232.8 11,908 0 11,908 2,195.1Other profit reserves 0 0 0 0.0 0 0 0 0.0
Profit or loss -11,422 0 -11,422 -2,221.0 -11,810 0 -11,810 -2,177.1Prior years income/loss -11,424 0 -11,424 -2,221.3 -11,847 0 -11,847 -2,183.8Current year income/loss 1 0 1 0.3 37 0 37 6.8
Total Liabilities 451 64 514 100.0 471 72 542 100.0

Banks Under the Deposit Insurance Fund
Off Balance Sheet Commitments(USD Million)
Dec. 2010 Dec. 2009TC FC Total TC FC Total
Guarantees and Warranties 43 62 105 50 72 122Letters of guarantee 43 62 105 50 72 122Bank acceptances 0 0 0 0 0 0Letters of credit 0 0 0 0 0 0Prefinancing given as guarantee 0 0 0 0 0 0Endorsements 0 0 0 0 0 0Other guarantees and warrantees 0 0 0 0 0 0
Commitments 1,596 0 1,596 2,087 0 2,087Irrevocable commitments 1,596 0 1,596 2,087 0 2,087Revocable commitments 0 0 0 0 0 0
Derivative Financial Instruments 0 0 0 0 0 0Derivative finan. instruments held for hedging 0 0 0 0 0 0Trading transactions 0 0 0 0 0 0
Custody and Pledged Securities 578 89 667 602 93 695Items held in Custody 9 2 10 8 2 10Pledged Items 569 87 656 594 92 685Acccepted independent guaran. and warran. 0 0 1 0 0 0
Total Off Balance Sheet Commitments 2,217 151 2,368 2,739 165 2,905
Income-Expenditure(USD Million)
Dec. 2010 Dec. 2009
Interest Income 25 26Interest on loans 7 1Interest received from reserve deposits 0 0Interest received from banks 17 23Interest received from money market transactions 0 0Interest received from marketable securities portfolio 0 0Other interest income 1 0
Interest Expenses 0 0Interest on deposits 0 0Interest on money market transactions 0 0Interest on funds borrowed 0 0Interest on securities issued 0 0Other interest expenses 0 0
Net Interest Income/Expenses 25 25Net Fees and Commissions Income/Expenses 2 2
Fees and commissions received 2 2Fees and commissions paid 0 0
Dividend Income 0 0Trading Profit/Loss (net) 20 45
Profit/loss on trading account securities 19 45Profit/losses on derivative financial transactions 0 0Foreign exchange profit/loss 0 0
Other Operating Income 28 9Total Operating Income/Expenses 75 82Provision for Loan Losses or other Receivables (-) 54 12
Specific provisions of banks loans and other receivables* 6 3General provision expenses* 0 2
Other Operating Expenses (-) 20 22Personnel Expenses* 11 11
Net Operating Profit/Loss 1 48Surplus written as gain after merger 0 0Profit/losses from equity method applied subsidiaries 0 0Net monetory position gain/loss 0 0Profit/Loss Before Taxes from Continuing Operations 1 48Provisions for Taxes on Income from Continuing Operations (±) 0 -11Net Profit/Loss from Continuing Operations 1 37Net Profit/Loss Before Taxes from Terminated Operations 0 0Provisions for Taxes on Income from Terminated Operations (±) 0 0Net Profit/Loss from Terminated Operations 0 0
Net Profit/Losses 1 37
* Used from information and disclosures related to income statement".
II-28

Banks Under the Deposit Insurance Fund December 2010
Ratios(%)
Dec. 2010 Dec. 2009
Capital Ratios
Shareholders’ Equity / (Amount subject to credit + market + operational risk) 50.6 45.0
Shareholders' Equity / Total Assets 73.4 78.4
(Shareholders' Equity - Permanent Assets) / Total Assets 66.4 70.3
Net On Balance Sheet Position / Total Shareholders' Equity -0.3 -0.1
Net On and Off Balance Sheet Position / Total Shareholders' Equity -0.3 -0.1
Balance-Sheet Ratios
TC Assets / Total Assets 87.9 86.8
TC Liabilities / Total Liabilities 87.6 86.7
FC Assets / FC Liabilities 98.2 99.5
TC Deposits / Total Deposits 40.7 40.7
TC Loans / Total Loans and Receivables 100.0 100.0
Total Deposits / Total Assets 3.2 3.5
Funds Borrowed / Total Assets 0.0 0.0
Assets Quality
Financial Assets (net) / Total Assets 26.2 45.6
Total Loans and Receivables / Total Assets 0.4 1.5
Total Loans and Receivables / Total Deposits 11.3 42.1
Loans Under Follow-up (gross) / Total Loans and Receivables 1,786.0 519.5
Loans Under Follow-up (net) / Total Loans and Receivables 72.1 92.8
Specific Provisions / Loans Under Follow-up 96.0 82.1
Permanent Assets / Total Assets 7.1 8.2
Consumer Loans / Total Loans and Receivables 27.9 7.2
Liquidity
Liquid Assets / Total Assets 85.2 85.5
Liquid Assets / Short-term Liabilities 857.2 809.0
TC Liquid Assets / Total Assets 73.8 73.1
Profitability
Net Profit/Losses / Total Assets 0.3 6.8
Net Profit/Losses / Total Shareholders' Equity 0.3 8.6
Profit/Losses Before Taxes after Continuing Operations / Total Assets 0.2 8.8
Income-Expenditure Structure
Net Interest Income After Specific Provisions / Total Assets 3.7 4.1
Net Interest Income After Specific Provisions / Total Operating Income (Expenses) 25.2 27.1
Non-interest Income (net) / Total Assets 9.7 10.4
Other Operating Expenses / Total Assets 3.9 4.0
Personnel Expenses / Other Operating Expenses 52.5 48.4
Non-interest Income (net) / Other Operating Expenses 249.0 258.6
Quarterly profitability and income-expenditure ratios, except year-end figures, should be considered periodically.
II-29

Foreign Banks
Assets(USD Million)
Dec. 2010 % Dec. 2009 %TC FC Total Distr. TC FC Total Distr.
Cash and Balances with the Central Bank 1,894 3,390 5,284 6.0 2,214 2,306 4,520 6.3Fin.ass.where fair value cha. is refl.to I/S (Net) 3,181 893 4,074 4.6 3,111 454 3,565 4.9
Financial assets held for trading 2,475 893 3,368 3.8 2,002 452 2,453 3.4Public sector debt securities 2,066 377 2,443 2.8 1,634 290 1,924 2.7Securities representing a share in capital 1 0 1 0.0 21 0 21 0.0Derivative financial assets held for trading 318 343 661 0.7 344 157 501 0.7Other marketable securities 91 173 264 0.3 2 5 7 0.0
Fin.assets clas. as fair value change is refl.to I/S 706 0 706 0.8 1,110 2 1,112 1.5Public sector debt securities 71 0 71 0.1 53 2 54 0.1Securities representing a share in capital 0 0 0 0.0 0 0 0 0.0Loans 635 0 635 0.7 1,057 0 1,057 1.5Other marketable securities 0 0 0 0.0 0 0 0 0.0
Banks 1,842 962 2,804 3.2 592 2,451 3,043 4.2Money Market Securities 5,454 0 5,454 6.2 1,958 624 2,582 3.6
Interbank money market placements 150 0 150 0.2 1,958 71 2,029 2.8Istanbul Stock Exc. money market placements 0 0 0 0.0 0 0 0 0.0Receiv. from reverse repurchase agreements 5,304 0 5,304 6.0 0 553 553 0.8
Financial Assets Available for Sale (Net) 11,069 1,210 12,279 13.9 9,389 1,005 10,395 14.4Securities representing a share in capital 12 1 13 0.0 21 1 22 0.0Public sector debt securities 10,959 1,021 11,980 13.6 9,315 829 10,144 14.0Other marketable securities 98 188 286 0.3 54 175 228 0.3
Loans 43,519 9,437 52,956 60.1 35,902 7,308 43,210 59.8Loans 42,819 9,437 52,256 59.3 35,123 7,250 42,374 58.6
Loans granted to the Banks risk group 233 346 580 0.7 112 121 232 0.3Public sector debt securities 0 0 0 0.0 0 0 0 0.0Other 42,586 9,091 51,676 58.6 35,012 7,130 42,141 58.3
Loans under follow-up 3,146 69 3,215 3.6 3,279 111 3,390 4.7Specific provisions (-) 2,447 68 2,515 2.9 2,501 53 2,554 3.5
Factoring Receivables 174 99 272 0.3 110 23 133 0.2Investments held to Maturity (Net) 1,236 242 1,477 1.7 1,308 249 1,557 2.2
Public sector debt securities 1,207 158 1,365 1.5 1,307 175 1,483 2.1Other marketable securities 29 84 113 0.1 0 74 74 0.1
Investments and Associates (Net) 7 0 7 0.0 8 0 8 0.0Accounted with equity method 0 0 0 0.0 0 0 0 0.0Non-consolidated investments and associates 7 0 7 0.0 8 0 8 0.0
Financial investments and associates 0 0 0 0.0 0 0 0 0.0Non-financial investments and associates 7 0 7 0.0 8 0 8 0.0
Subsidiaries (Net) 611 106 717 0.8 544 172 717 1.0Financial subsidiaries 597 106 703 0.8 530 172 702 1.0Non-financial subsidiaries 14 0 14 0.0 14 0 14 0.0
Joint Ventures (Business Partners) (Net) 4 0 4 0.0 1 0 1 0.0Accounted with equity method 0 0 0 0.0 0 0 0 0.0Non-consolidated joint ventures 4 0 4 0.0 1 0 1 0.0
Financial joint ventures 0 0 0 0.0 0 0 0 0.0Non-financial joint ventures 4 0 4 0.0 1 0 1 0.0
Recivables From Leasing Transactions 0 0 0 0.0 0 0 0 0.0Finance lease receivables 0 0 0 0.0 0 0 0 0.0Operational leasing receivables 0 0 0 0.0 0 0 0 0.0Others 0 0 0 0.0 0 0 0 0.0Unearned income (-) 0 0 0 0.0 0 0 0 0.0
Derivative Financial Assets Held for Hedging 141 7 148 0.2 114 12 126 0.2Fair value hedges 19 0 19 0.0 1 3 3 0.0Cash flow hedges 122 7 129 0.1 113 10 123 0.2Hedges for invest. made in foreign countries 0 0 0 0.0 0 0 0 0.0
Property and Equipment (Net) 860 0 860 1.0 905 0 905 1.3Intangible Assets (Net) 224 0 224 0.3 243 0 243 0.3
Goodwill 54 0 54 0.1 56 0 56 0.1Other 170 0 170 0.2 187 0 187 0.3
Real Estates for Investment Purpose (Net) 0 0 0 0.0 7 0 7 0.0Assets for Tax 189 0 189 0.2 217 0 217 0.3
Current assets for tax 2 0 2 0.0 47 0 47 0.1Deferred assets for tax 187 0 187 0.2 170 0 170 0.2
Prop.&Equ.for Sale p. and from Term.Op.(Net) 34 0 34 0.0 15 0 15 0.0Other Assets 903 485 1,388 1.6 821 206 1,028 1.4
Total Assets 71,340 16,831 88,171 100.0 57,459 14,811 72,270 100.0
II-30
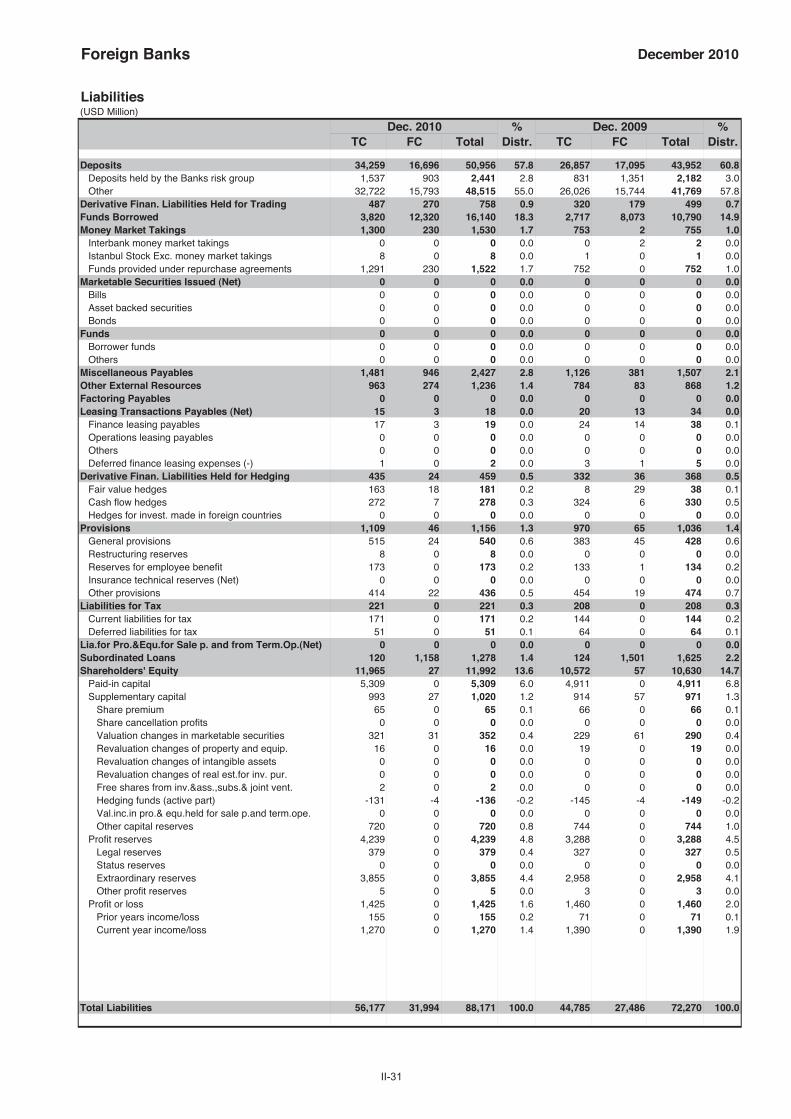
Foreign Banks December 2010
Liabilities(USD Million)
Dec. 2010 % Dec. 2009 %TC FC Total Distr. TC FC Total Distr.
Deposits 34,259 16,696 50,956 57.8 26,857 17,095 43,952 60.8Deposits held by the Banks risk group 1,537 903 2,441 2.8 831 1,351 2,182 3.0Other 32,722 15,793 48,515 55.0 26,026 15,744 41,769 57.8
Derivative Finan. Liabilities Held for Trading 487 270 758 0.9 320 179 499 0.7Funds Borrowed 3,820 12,320 16,140 18.3 2,717 8,073 10,790 14.9Money Market Takings 1,300 230 1,530 1.7 753 2 755 1.0
Interbank money market takings 0 0 0 0.0 0 2 2 0.0Istanbul Stock Exc. money market takings 8 0 8 0.0 1 0 1 0.0Funds provided under repurchase agreements 1,291 230 1,522 1.7 752 0 752 1.0
Marketable Securities Issued (Net) 0 0 0 0.0 0 0 0 0.0Bills 0 0 0 0.0 0 0 0 0.0Asset backed securities 0 0 0 0.0 0 0 0 0.0Bonds 0 0 0 0.0 0 0 0 0.0
Funds 0 0 0 0.0 0 0 0 0.0Borrower funds 0 0 0 0.0 0 0 0 0.0Others 0 0 0 0.0 0 0 0 0.0
Miscellaneous Payables 1,481 946 2,427 2.8 1,126 381 1,507 2.1Other External Resources 963 274 1,236 1.4 784 83 868 1.2Factoring Payables 0 0 0 0.0 0 0 0 0.0Leasing Transactions Payables (Net) 15 3 18 0.0 20 13 34 0.0
Finance leasing payables 17 3 19 0.0 24 14 38 0.1Operations leasing payables 0 0 0 0.0 0 0 0 0.0Others 0 0 0 0.0 0 0 0 0.0Deferred finance leasing expenses (-) 1 0 2 0.0 3 1 5 0.0
Derivative Finan. Liabilities Held for Hedging 435 24 459 0.5 332 36 368 0.5Fair value hedges 163 18 181 0.2 8 29 38 0.1Cash flow hedges 272 7 278 0.3 324 6 330 0.5Hedges for invest. made in foreign countries 0 0 0 0.0 0 0 0 0.0
Provisions 1,109 46 1,156 1.3 970 65 1,036 1.4General provisions 515 24 540 0.6 383 45 428 0.6Restructuring reserves 8 0 8 0.0 0 0 0 0.0Reserves for employee benefit 173 0 173 0.2 133 1 134 0.2Insurance technical reserves (Net) 0 0 0 0.0 0 0 0 0.0Other provisions 414 22 436 0.5 454 19 474 0.7
Liabilities for Tax 221 0 221 0.3 208 0 208 0.3Current liabilities for tax 171 0 171 0.2 144 0 144 0.2Deferred liabilities for tax 51 0 51 0.1 64 0 64 0.1
Lia.for Pro.&Equ.for Sale p. and from Term.Op.(Net) 0 0 0 0.0 0 0 0 0.0Subordinated Loans 120 1,158 1,278 1.4 124 1,501 1,625 2.2Shareholders' Equity 11,965 27 11,992 13.6 10,572 57 10,630 14.7
Paid-in capital 5,309 0 5,309 6.0 4,911 0 4,911 6.8Supplementary capital 993 27 1,020 1.2 914 57 971 1.3
Share premium 65 0 65 0.1 66 0 66 0.1Share cancellation profits 0 0 0 0.0 0 0 0 0.0Valuation changes in marketable securities 321 31 352 0.4 229 61 290 0.4Revaluation changes of property and equip. 16 0 16 0.0 19 0 19 0.0Revaluation changes of intangible assets 0 0 0 0.0 0 0 0 0.0Revaluation changes of real est.for inv. pur. 0 0 0 0.0 0 0 0 0.0Free shares from inv.&ass.,subs.& joint vent. 2 0 2 0.0 0 0 0 0.0Hedging funds (active part) -131 -4 -136 -0.2 -145 -4 -149 -0.2Val.inc.in pro.& equ.held for sale p.and term.ope. 0 0 0 0.0 0 0 0 0.0Other capital reserves 720 0 720 0.8 744 0 744 1.0
Profit reserves 4,239 0 4,239 4.8 3,288 0 3,288 4.5Legal reserves 379 0 379 0.4 327 0 327 0.5Status reserves 0 0 0 0.0 0 0 0 0.0Extraordinary reserves 3,855 0 3,855 4.4 2,958 0 2,958 4.1Other profit reserves 5 0 5 0.0 3 0 3 0.0
Profit or loss 1,425 0 1,425 1.6 1,460 0 1,460 2.0Prior years income/loss 155 0 155 0.2 71 0 71 0.1Current year income/loss 1,270 0 1,270 1.4 1,390 0 1,390 1.9
Total Liabilities 56,177 31,994 88,171 100.0 44,785 27,486 72,270 100.0
II-31
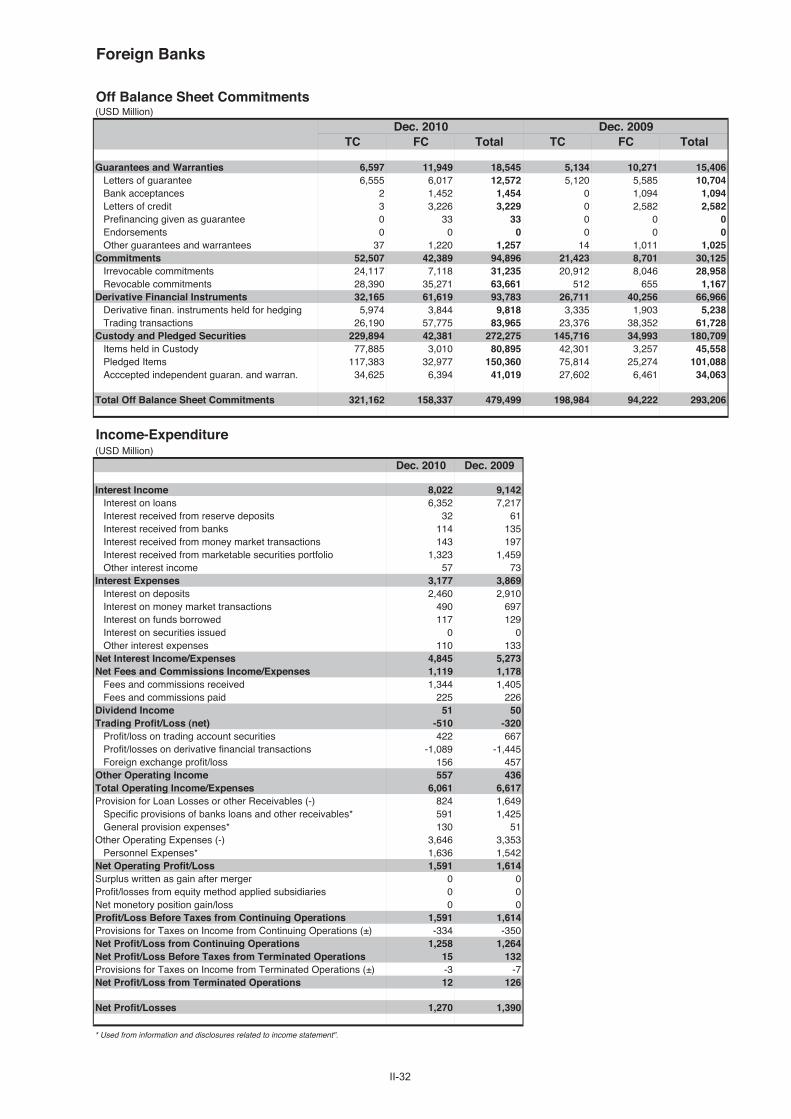
Foreign Banks
Off Balance Sheet Commitments(USD Million)
Dec. 2010 Dec. 2009TC FC Total TC FC Total
Guarantees and Warranties 6,597 11,949 18,545 5,134 10,271 15,406Letters of guarantee 6,555 6,017 12,572 5,120 5,585 10,704Bank acceptances 2 1,452 1,454 0 1,094 1,094Letters of credit 3 3,226 3,229 0 2,582 2,582Prefinancing given as guarantee 0 33 33 0 0 0Endorsements 0 0 0 0 0 0Other guarantees and warrantees 37 1,220 1,257 14 1,011 1,025
Commitments 52,507 42,389 94,896 21,423 8,701 30,125Irrevocable commitments 24,117 7,118 31,235 20,912 8,046 28,958Revocable commitments 28,390 35,271 63,661 512 655 1,167
Derivative Financial Instruments 32,165 61,619 93,783 26,711 40,256 66,966Derivative finan. instruments held for hedging 5,974 3,844 9,818 3,335 1,903 5,238Trading transactions 26,190 57,775 83,965 23,376 38,352 61,728
Custody and Pledged Securities 229,894 42,381 272,275 145,716 34,993 180,709Items held in Custody 77,885 3,010 80,895 42,301 3,257 45,558Pledged Items 117,383 32,977 150,360 75,814 25,274 101,088Acccepted independent guaran. and warran. 34,625 6,394 41,019 27,602 6,461 34,063
Total Off Balance Sheet Commitments 321,162 158,337 479,499 198,984 94,222 293,206
Income-Expenditure(USD Million)
Dec. 2010 Dec. 2009
Interest Income 8,022 9,142Interest on loans 6,352 7,217Interest received from reserve deposits 32 61Interest received from banks 114 135Interest received from money market transactions 143 197Interest received from marketable securities portfolio 1,323 1,459Other interest income 57 73
Interest Expenses 3,177 3,869Interest on deposits 2,460 2,910Interest on money market transactions 490 697Interest on funds borrowed 117 129Interest on securities issued 0 0Other interest expenses 110 133
Net Interest Income/Expenses 4,845 5,273Net Fees and Commissions Income/Expenses 1,119 1,178
Fees and commissions received 1,344 1,405Fees and commissions paid 225 226
Dividend Income 51 50Trading Profit/Loss (net) -510 -320
Profit/loss on trading account securities 422 667Profit/losses on derivative financial transactions -1,089 -1,445Foreign exchange profit/loss 156 457
Other Operating Income 557 436Total Operating Income/Expenses 6,061 6,617Provision for Loan Losses or other Receivables (-) 824 1,649
Specific provisions of banks loans and other receivables* 591 1,425General provision expenses* 130 51
Other Operating Expenses (-) 3,646 3,353Personnel Expenses* 1,636 1,542
Net Operating Profit/Loss 1,591 1,614Surplus written as gain after merger 0 0Profit/losses from equity method applied subsidiaries 0 0Net monetory position gain/loss 0 0Profit/Loss Before Taxes from Continuing Operations 1,591 1,614Provisions for Taxes on Income from Continuing Operations (±) -334 -350Net Profit/Loss from Continuing Operations 1,258 1,264Net Profit/Loss Before Taxes from Terminated Operations 15 132Provisions for Taxes on Income from Terminated Operations (±) -3 -7Net Profit/Loss from Terminated Operations 12 126
Net Profit/Losses 1,270 1,390
* Used from information and disclosures related to income statement".
II-32

Foreign Banks December 2010
Ratios(%)
Dec. 2010 Dec. 2009
Capital Ratios
Shareholders’ Equity / (Amount subject to credit + market + operational risk) 17.3 18.8
Shareholders' Equity / Total Assets 13.6 14.7
(Shareholders' Equity - Permanent Assets) / Total Assets 10.7 10.9
Net On Balance Sheet Position / Total Shareholders' Equity -91.9 -81.9
Net On and Off Balance Sheet Position / Total Shareholders' Equity 0.3 -0.9
Balance-Sheet Ratios
TC Assets / Total Assets 80.9 79.5
TC Liabilities / Total Liabilities 63.7 62.0
FC Assets / FC Liabilities 52.6 53.9
TC Deposits / Total Deposits 67.2 61.1
TC Loans / Total Loans and Receivables 82.2 83.1
Total Deposits / Total Assets 57.8 60.8
Funds Borrowed / Total Assets 18.3 14.9
Assets Quality
Financial Assets (net) / Total Assets 20.4 21.6
Total Loans and Receivables / Total Assets 60.1 59.8
Total Loans and Receivables / Total Deposits 103.9 98.3
Loans Under Follow-up (gross) / Total Loans and Receivables 6.1 7.8
Loans Under Follow-up (net) / Total Loans and Receivables 1.3 1.9
Specific Provisions / Loans Under Follow-up 78.2 75.3
Permanent Assets / Total Assets 2.9 3.8
Consumer Loans / Total Loans and Receivables 44.1 45.5
Liquidity
Liquid Assets / Total Assets 33.9 33.4
Liquid Assets / Short-term Liabilities 61.7 59.1
TC Liquid Assets / Total Assets 26.6 23.9
Profitability
Net Profit/Losses / Total Assets 1.4 1.9
Net Profit/Losses / Total Shareholders' Equity 10.6 13.1
Profit/Losses Before Taxes after Continuing Operations / Total Assets 1.8 2.2
Income-Expenditure Structure
Net Interest Income After Specific Provisions / Total Assets 4.8 5.3
Net Interest Income After Specific Provisions / Total Operating Income (Expenses) 70.2 58.1
Non-interest Income (net) / Total Assets 1.4 1.9
Other Operating Expenses / Total Assets 4.1 4.6
Personnel Expenses / Other Operating Expenses 44.9 46.0
Non-interest Income (net) / Other Operating Expenses 33.4 40.1
Quarterly profitability and income-expenditure ratios, except year-end figures, should be considered periodically.
II-33

Development and Investment Banks
Assets(USD Million)
Dec. 2010 % Dec. 2009 %TC FC Total Distr. TC FC Total Distr.
Cash and Balances with the Central Bank 82 186 268 1.3 89 80 169 0.9Fin.ass.where fair value cha. is refl.to I/S (Net) 323 19 342 1.7 250 12 262 1.4
Financial assets held for trading 323 19 342 1.7 250 12 262 1.4Public sector debt securities 310 2 313 1.6 229 2 231 1.3Securities representing a share in capital 0 0 0 0.0 0 0 0 0.0Derivative financial assets held for trading 12 17 29 0.1 20 10 30 0.2Other marketable securities 0 0 0 0.0 0 0 0 0.0
Fin.assets clas. as fair value change is refl.to I/S 0 0 0 0.0 0 0 0 0.0Public sector debt securities 0 0 0 0.0 0 0 0 0.0Securities representing a share in capital 0 0 0 0.0 0 0 0 0.0Loans 0 0 0 0.0 0 0 0 0.0Other marketable securities 0 0 0 0.0 0 0 0 0.0
Banks 2,869 439 3,307 16.4 1,473 601 2,074 11.4Money Market Securities 558 0 558 2.8 1,704 0 1,704 9.4
Interbank money market placements 526 0 526 2.6 1,699 0 1,699 9.4Istanbul Stock Exc. money market placements 10 0 10 0.0 0 0 0 0.0Receiv. from reverse repurchase agreements 22 0 22 0.1 5 0 5 0.0
Financial Assets Available for Sale (Net) 1,480 349 1,828 9.1 1,250 349 1,598 8.8Securities representing a share in capital 42 8 50 0.3 32 8 41 0.2Public sector debt securities 1,387 233 1,620 8.1 1,200 235 1,436 7.9Other marketable securities 51 107 158 0.8 17 105 122 0.7
Loans 7,302 5,020 12,322 61.3 7,004 4,072 11,076 61.0Loans 7,259 5,020 12,279 61.0 6,949 4,072 11,021 60.7
Loans granted to the Banks risk group 395 158 553 2.7 292 118 410 2.3Public sector debt securities 0 0 0 0.0 0 0 0 0.0Other 6,864 4,862 11,726 58.3 6,657 3,954 10,611 58.4
Loans under follow-up 211 9 221 1.1 217 4 221 1.2Specific provisions (-) 168 9 178 0.9 162 4 166 0.9
Factoring Receivables 1 0 1 0.0 1 0 1 0.0Investments held to Maturity (Net) 791 36 827 4.1 489 43 531 2.9
Public sector debt securities 791 33 824 4.1 489 33 522 2.9Other marketable securities 0 3 3 0.0 0 9 9 0.1
Investments and Associates (Net) 94 1 94 0.5 83 1 83 0.5Accounted with equity method 0 0 0 0.0 0 0 0 0.0Non-consolidated investments and associates 94 1 94 0.5 83 1 83 0.5
Financial investments and associates 89 1 90 0.4 74 1 74 0.4Non-financial investments and associates 4 0 4 0.0 9 0 9 0.0
Subsidiaries (Net) 114 83 196 1.0 134 76 211 1.2Financial subsidiaries 105 77 182 0.9 118 71 190 1.0Non-financial subsidiaries 9 5 14 0.1 16 5 21 0.1
Joint Ventures (Business Partners) (Net) 0 0 0 0.0 0 0 0 0.0Accounted with equity method 0 0 0 0.0 0 0 0 0.0Non-consolidated joint ventures 0 0 0 0.0 0 0 0 0.0
Financial joint ventures 0 0 0 0.0 0 0 0 0.0Non-financial joint ventures 0 0 0 0.0 0 0 0 0.0
Recivables From Leasing Transactions 3 52 54 0.3 1 104 105 0.6Finance lease receivables 2 53 55 0.3 0 110 110 0.6Operational leasing receivables 1 0 1 0.0 0 0 0 0.0Others 0 0 0 0.0 1 0 1 0.0Unearned income (-) 1 2 2 0.0 0 6 6 0.0
Derivative Financial Assets Held for Hedging 0 0 0 0.0 0 0 0 0.0Fair value hedges 0 0 0 0.0 0 0 0 0.0Cash flow hedges 0 0 0 0.0 0 0 0 0.0Hedges for invest. made in foreign countries 0 0 0 0.0 0 0 0 0.0
Property and Equipment (Net) 132 0 132 0.7 149 0 149 0.8Intangible Assets (Net) 12 0 12 0.1 10 0 10 0.1
Goodwill 0 0 0 0.0 0 0 0 0.0Other 12 0 12 0.1 10 0 10 0.1
Real Estates for Investment Purpose (Net) 21 0 21 0.1 7 0 7 0.0Assets for Tax 23 0 23 0.1 83 0 83 0.5
Current assets for tax 0 0 0 0.0 54 0 54 0.3Deferred assets for tax 23 0 23 0.1 29 0 29 0.2
Prop.&Equ.for Sale p. and from Term.Op.(Net) 2 0 2 0.0 2 0 2 0.0Other Assets 37 90 126 0.6 37 65 102 0.6
Total Assets 13,843 6,272 20,115 100.0 12,765 5,403 18,168 100.0
II-34
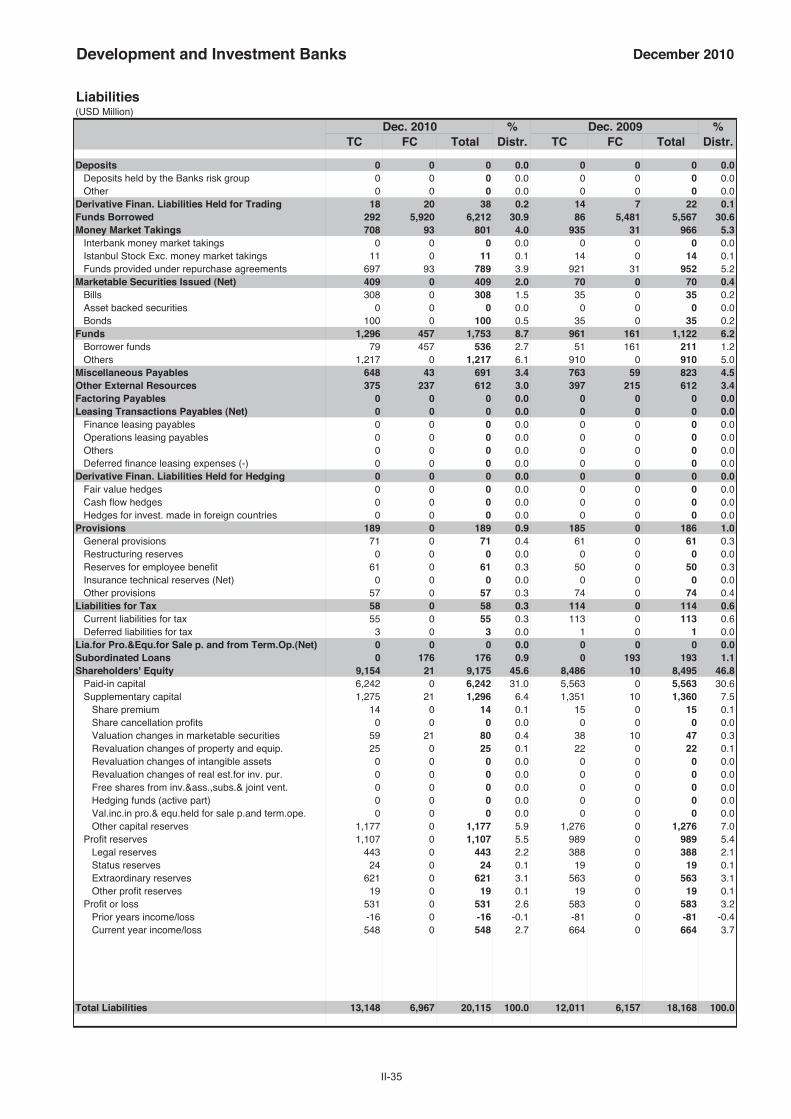
Development and Investment Banks December 2010
Liabilities(USD Million)
Dec. 2010 % Dec. 2009 %TC FC Total Distr. TC FC Total Distr.
Deposits 0 0 0 0.0 0 0 0 0.0Deposits held by the Banks risk group 0 0 0 0.0 0 0 0 0.0Other 0 0 0 0.0 0 0 0 0.0
Derivative Finan. Liabilities Held for Trading 18 20 38 0.2 14 7 22 0.1Funds Borrowed 292 5,920 6,212 30.9 86 5,481 5,567 30.6Money Market Takings 708 93 801 4.0 935 31 966 5.3
Interbank money market takings 0 0 0 0.0 0 0 0 0.0Istanbul Stock Exc. money market takings 11 0 11 0.1 14 0 14 0.1Funds provided under repurchase agreements 697 93 789 3.9 921 31 952 5.2
Marketable Securities Issued (Net) 409 0 409 2.0 70 0 70 0.4Bills 308 0 308 1.5 35 0 35 0.2Asset backed securities 0 0 0 0.0 0 0 0 0.0Bonds 100 0 100 0.5 35 0 35 0.2
Funds 1,296 457 1,753 8.7 961 161 1,122 6.2Borrower funds 79 457 536 2.7 51 161 211 1.2Others 1,217 0 1,217 6.1 910 0 910 5.0
Miscellaneous Payables 648 43 691 3.4 763 59 823 4.5Other External Resources 375 237 612 3.0 397 215 612 3.4Factoring Payables 0 0 0 0.0 0 0 0 0.0Leasing Transactions Payables (Net) 0 0 0 0.0 0 0 0 0.0
Finance leasing payables 0 0 0 0.0 0 0 0 0.0Operations leasing payables 0 0 0 0.0 0 0 0 0.0Others 0 0 0 0.0 0 0 0 0.0Deferred finance leasing expenses (-) 0 0 0 0.0 0 0 0 0.0
Derivative Finan. Liabilities Held for Hedging 0 0 0 0.0 0 0 0 0.0Fair value hedges 0 0 0 0.0 0 0 0 0.0Cash flow hedges 0 0 0 0.0 0 0 0 0.0Hedges for invest. made in foreign countries 0 0 0 0.0 0 0 0 0.0
Provisions 189 0 189 0.9 185 0 186 1.0General provisions 71 0 71 0.4 61 0 61 0.3Restructuring reserves 0 0 0 0.0 0 0 0 0.0Reserves for employee benefit 61 0 61 0.3 50 0 50 0.3Insurance technical reserves (Net) 0 0 0 0.0 0 0 0 0.0Other provisions 57 0 57 0.3 74 0 74 0.4
Liabilities for Tax 58 0 58 0.3 114 0 114 0.6Current liabilities for tax 55 0 55 0.3 113 0 113 0.6Deferred liabilities for tax 3 0 3 0.0 1 0 1 0.0
Lia.for Pro.&Equ.for Sale p. and from Term.Op.(Net) 0 0 0 0.0 0 0 0 0.0Subordinated Loans 0 176 176 0.9 0 193 193 1.1Shareholders' Equity 9,154 21 9,175 45.6 8,486 10 8,495 46.8
Paid-in capital 6,242 0 6,242 31.0 5,563 0 5,563 30.6Supplementary capital 1,275 21 1,296 6.4 1,351 10 1,360 7.5
Share premium 14 0 14 0.1 15 0 15 0.1Share cancellation profits 0 0 0 0.0 0 0 0 0.0Valuation changes in marketable securities 59 21 80 0.4 38 10 47 0.3Revaluation changes of property and equip. 25 0 25 0.1 22 0 22 0.1Revaluation changes of intangible assets 0 0 0 0.0 0 0 0 0.0Revaluation changes of real est.for inv. pur. 0 0 0 0.0 0 0 0 0.0Free shares from inv.&ass.,subs.& joint vent. 0 0 0 0.0 0 0 0 0.0Hedging funds (active part) 0 0 0 0.0 0 0 0 0.0Val.inc.in pro.& equ.held for sale p.and term.ope. 0 0 0 0.0 0 0 0 0.0Other capital reserves 1,177 0 1,177 5.9 1,276 0 1,276 7.0
Profit reserves 1,107 0 1,107 5.5 989 0 989 5.4Legal reserves 443 0 443 2.2 388 0 388 2.1Status reserves 24 0 24 0.1 19 0 19 0.1Extraordinary reserves 621 0 621 3.1 563 0 563 3.1Other profit reserves 19 0 19 0.1 19 0 19 0.1
Profit or loss 531 0 531 2.6 583 0 583 3.2Prior years income/loss -16 0 -16 -0.1 -81 0 -81 -0.4Current year income/loss 548 0 548 2.7 664 0 664 3.7
Total Liabilities 13,148 6,967 20,115 100.0 12,011 6,157 18,168 100.0
II-35

Development and Investment Banks
Off Balance Sheet Commitments(USD Million)
Dec. 2010 Dec. 2009TC FC Total TC FC Total
Guarantees and Warranties 3,206 2,627 5,833 2,620 1,732 4,353Letters of guarantee 1,418 1,292 2,710 1,447 660 2,107Bank acceptances 0 4 4 0 15 15Letters of credit 0 520 520 0 282 282Prefinancing given as guarantee 0 0 0 0 0 0Endorsements 0 448 448 0 324 324Other guarantees and warrantees 1,788 363 2,151 1,173 452 1,625
Commitments 2,624 3,994 6,618 615 994 1,609Irrevocable commitments 531 400 931 472 357 829Revocable commitments 2,092 3,595 5,687 143 637 780
Derivative Financial Instruments 1,010 3,449 4,458 790 2,987 3,777Derivative finan. instruments held for hedging 0 0 0 0 0 0Trading transactions 1,010 3,449 4,458 790 2,987 3,777
Custody and Pledged Securities 5,757,498 33,481 5,790,978 4,427,534 13,559 4,441,093Items held in Custody 5,749,590 212 5,749,803 4,421,572 253 4,421,825Pledged Items 6,713 22,153 28,866 5,367 13,075 18,442Acccepted independent guaran. and warran. 1,194 11,116 12,310 595 232 826
Total Off Balance Sheet Commitments 5,764,337 43,550 5,807,887 4,431,560 19,271 4,450,831
Income-Expenditure(USD Million)
Dec. 2010 Dec. 2009
Interest Income 1,033 1,277Interest on loans 632 867Interest received from reserve deposits 1 2Interest received from banks 94 80Interest received from money market transactions 71 76Interest received from marketable securities portfolio 228 244Other interest income 6 8
Interest Expenses 197 278Interest on deposits 0 0Interest on money market transactions 112 198Interest on funds borrowed 58 66Interest on securities issued 19 2Other interest expenses 9 12
Net Interest Income/Expenses 836 999Net Fees and Commissions Income/Expenses 83 69
Fees and commissions received 96 81Fees and commissions paid 13 11
Dividend Income 26 20Trading Profit/Loss (net) 24 46
Profit/loss on trading account securities 8 11Profit/losses on derivative financial transactions -20 40Foreign exchange profit/loss 35 -5
Other Operating Income 131 110Total Operating Income/Expenses 1,099 1,244Provision for Loan Losses or other Receivables (-) 57 101
Specific provisions of banks loans and other receivables* 34 51General provision expenses* 15 10
Other Operating Expenses (-) 380 347Personnel Expenses* 210 195
Net Operating Profit/Loss 662 796Surplus written as gain after merger 0 0Profit/losses from equity method applied subsidiaries 0 0Net monetory position gain/loss 0 0Profit/Loss Before Taxes from Continuing Operations 662 796Provisions for Taxes on Income from Continuing Operations (±) -113 -132Net Profit/Loss from Continuing Operations 549 664Net Profit/Loss Before Taxes from Terminated Operations 0 0Provisions for Taxes on Income from Terminated Operations (±) -1 0Net Profit/Loss from Terminated Operations -1 0
Net Profit/Losses 548 664
* Used from information and disclosures related to income statement".
II-36

Development and Investment Banks December 2010
Ratios(%)
Dec. 2010 Dec. 2009
Capital Ratios
Shareholders’ Equity / (Amount subject to credit + market + operational risk) 58.6 60.3
Shareholders' Equity / Total Assets 45.6 46.8
(Shareholders' Equity - Permanent Assets) / Total Assets 43.2 44.0
Net On Balance Sheet Position / Total Shareholders' Equity 4.1 4.4
Net On and Off Balance Sheet Position / Total Shareholders' Equity 0.3 0.2
Balance-Sheet Ratios
TC Assets / Total Assets 68.8 70.3
TC Liabilities / Total Liabilities 65.4 66.1
FC Assets / FC Liabilities 90.0 87.7
TC Deposits / Total Deposits - -
TC Loans / Total Loans and Receivables 59.3 63.2
Total Deposits / Total Assets 0.0 0.0
Funds Borrowed / Total Assets 30.9 30.6
Assets Quality
Financial Assets (net) / Total Assets 14.9 13.2
Total Loans and Receivables / Total Assets 61.3 61.0
Total Loans and Receivables / Total Deposits - -
Loans Under Follow-up (gross) / Total Loans and Receivables 1.8 2.0
Loans Under Follow-up (net) / Total Loans and Receivables 0.3 0.5
Specific Provisions / Loans Under Follow-up 80.6 75.1
Permanent Assets / Total Assets 2.4 2.8
Consumer Loans / Total Loans and Receivables 1.9 1.6
Liquidity
Liquid Assets / Total Assets 31.3 32.0
Liquid Assets / Short-term Liabilities 173.8 200.9
TC Liquid Assets / Total Assets 26.4 26.2
Profitability
Net Profit/Losses / Total Assets 2.7 3.7
Net Profit/Losses / Total Shareholders' Equity 6.0 7.8
Profit/Losses Before Taxes after Continuing Operations / Total Assets 3.3 4.4
Income-Expenditure Structure
Net Interest Income After Specific Provisions / Total Assets 4.0 5.2
Net Interest Income After Specific Provisions / Total Operating Income (Expenses) 72.9 76.2
Non-interest Income (net) / Total Assets 1.3 1.3
Other Operating Expenses / Total Assets 1.9 1.9
Personnel Expenses / Other Operating Expenses 55.3 56.2
Non-interest Income (net) / Other Operating Expenses 69.2 70.6
Quarterly profitability and income-expenditure ratios, except year-end figures, should be considered periodically.
II-37


II-39


II-41
• State-owned Banks• Privately-owned Banks• Banks Under the Deposit Insurance Fund• Foreign Banks


II-43

II-44
Türkiye Cumhuriyeti Ziraat Bankası A. .
Assets(USD Million)
Dec. 2010 % Dec. 2009 %TC FC Total Distr. TC FC Total Distr.
Cash and Balances with the Central Bank 4,977 1,699 6,676 6.8 4,954 1,214 6,168 7.4Fin.ass.where fair value cha. is refl.to I/S (Net) 138 18 156 0.2 299 33 332 0.4
Financial assets held for trading 138 18 156 0.2 299 33 332 0.4Public sector debt securities 120 17 137 0.1 299 32 332 0.4Securities representing a share in capital 0 0 0 0.0 0 0 0 0.0Derivative financial assets held for trading 18 1 19 0.0 0 1 1 0.0Other marketable securities 0 0 0 0.0 0 0 0 0.0
Fin.assets clas. as fair value change is refl.to I/S 0 0 0 0.0 0 0 0 0.0Public sector debt securities 0 0 0 0.0 0 0 0 0.0Securities representing a share in capital 0 0 0 0.0 0 0 0 0.0Loans 0 0 0 0.0 0 0 0 0.0Other marketable securities 0 0 0 0.0 0 0 0 0.0
Banks 29 2,990 3,019 3.1 5 3,646 3,651 4.4Money Market Securities 0 0 0 0.0 0 0 0 0.0
Interbank money market placements 0 0 0 0.0 0 0 0 0.0Istanbul Stock Exc. money market placements 0 0 0 0.0 0 0 0 0.0Receiv. from reverse repurchase agreements 0 0 0 0.0 0 0 0 0.0
Financial Assets Available for Sale (Net) 23,376 2,459 25,835 26.3 14,042 3,204 17,246 20.6Securities representing a share in capital 77 30 107 0.1 16 0 16 0.0Public sector debt securities 23,165 2,403 25,568 26.0 14,003 2,156 16,159 19.3Other marketable securities 134 26 160 0.2 23 1,047 1,070 1.3
Loans 33,808 3,551 37,359 38.0 23,309 1,383 24,692 29.5Loans 33,624 3,551 37,176 37.8 23,193 1,383 24,576 29.4
Loans granted to the Banks risk group 0 134 134 0.1 0 24 24 0.0Public sector debt securities 0 0 0 0.0 0 0 0 0.0Other 33,624 3,417 37,041 37.7 23,193 1,360 24,553 29.3
Loans under follow-up 549 7 556 0.6 568 6 575 0.7Specific provisions (-) 366 7 373 0.4 453 6 459 0.5
Factoring Receivables 0 0 0 0.0 0 0 0 0.0Investments held to Maturity (Net) 21,027 2,638 23,665 24.1 26,976 3,176 30,151 36.0
Public sector debt securities 21,023 2,638 23,661 24.1 26,973 3,175 30,148 36.0Other marketable securities 4 0 4 0.0 3 0 3 0.0
Investments and Associates (Net) 34 0 34 0.0 82 0 82 0.1Accounted with equity method 0 0 0 0.0 50 0 50 0.1Non-consolidated investments and associates 34 0 34 0.0 32 0 32 0.0
Financial investments and associates 31 0 31 0.0 29 0 29 0.0Non-financial investments and associates 3 0 3 0.0 3 0 3 0.0
Subsidiaries (Net) 75 339 413 0.4 75 306 381 0.5Financial subsidiaries 71 339 410 0.4 72 306 378 0.5Non-financial subsidiaries 4 0 4 0.0 3 0 3 0.0
Joint Ventures (Business Partners) (Net) 0 28 28 0.0 0 17 17 0.0Accounted with equity method 0 0 0 0.0 0 0 0 0.0Non-consolidated joint ventures 0 28 28 0.0 0 17 17 0.0
Financial joint ventures 0 28 28 0.0 0 17 17 0.0Non-financial joint ventures 0 0 0 0.0 0 0 0 0.0
Recivables From Leasing Transactions 0 0 0 0.0 0 0 0 0.0Finance lease receivables 0 0 0 0.0 0 0 0 0.0Operational leasing receivables 0 0 0 0.0 0 0 0 0.0Others 0 0 0 0.0 0 0 0 0.0Unearned income (-) 0 0 0 0.0 0 0 0 0.0
Derivative Financial Assets Held for Hedging 0 0 0 0.0 0 0 0 0.0Fair value hedges 0 0 0 0.0 0 0 0 0.0Cash flow hedges 0 0 0 0.0 0 0 0 0.0Hedges for invest. made in foreign countries 0 0 0 0.0 0 0 0 0.0
Property and Equipment (Net) 534 3 537 0.5 546 3 549 0.7Intangible Assets (Net) 22 1 23 0.0 11 1 12 0.0
Goodwill 0 0 0 0.0 0 0 0 0.0Other 22 1 23 0.0 11 1 12 0.0
Real Estates for Investment Purpose (Net) 0 0 0 0.0 0 0 0 0.0Assets for Tax 206 0 206 0.2 233 0 233 0.3
Current assets for tax 1 0 1 0.0 2 0 2 0.0Deferred assets for tax 205 0 205 0.2 232 0 232 0.3
Prop.&Equ.for Sale p. and from Term.Op.(Net) 10 0 10 0.0 6 0 6 0.0Other Assets 311 35 347 0.4 192 16 207 0.2
Total Assets 84,546 13,763 98,309 100.0 70,729 12,999 83,728 100.0

II-45
Türkiye Cumhuriyeti Ziraat Bankası A. . December 2010
Liabilities(USD Million)
Dec. 2010 % Dec. 2009 %TC FC Total Distr. TC FC Total Distr.
Deposits 67,229 14,585 81,814 83.2 53,470 12,777 66,247 79.1Deposits held by the Banks risk group 908 86 993 1.0 52 16 68 0.1Other 66,321 14,499 80,820 82.2 53,418 12,761 66,179 79.0
Derivative Finan. Liabilities Held for Trading 4 0 4 0.0 0 0 0 0.0Funds Borrowed 19 46 64 0.1 10 4 14 0.0Money Market Takings 3,254 0 3,254 3.3 6,148 0 6,148 7.3
Interbank money market takings 0 0 0 0.0 0 0 0 0.0Istanbul Stock Exc. money market takings 0 0 0 0.0 0 0 0 0.0Funds provided under repurchase agreements 3,254 0 3,254 3.3 6,148 0 6,148 7.3
Marketable Securities Issued (Net) 0 0 0 0.0 0 0 0 0.0Bills 0 0 0 0.0 0 0 0 0.0Asset backed securities 0 0 0 0.0 0 0 0 0.0Bonds 0 0 0 0.0 0 0 0 0.0
Funds 2,293 0 2,293 2.3 2,182 0 2,182 2.6Borrower funds 0 0 0 0.0 0 0 0 0.0Others 2,293 0 2,293 2.3 2,182 0 2,182 2.6
Miscellaneous Payables 374 90 464 0.5 257 98 355 0.4Other External Resources 408 194 601 0.6 279 134 413 0.5Factoring Payables 0 0 0 0.0 0 0 0 0.0Leasing Transactions Payables (Net) 0 0 0 0.0 0 0 0 0.0
Finance leasing payables 0 0 0 0.0 0 0 0 0.0Operations leasing payables 0 0 0 0.0 0 0 0 0.0Others 0 0 0 0.0 0 0 0 0.0Deferred finance leasing expenses (-) 0 0 0 0.0 0 0 0 0.0
Derivative Finan. Liabilities Held for Hedging 0 0 0 0.0 0 0 0 0.0Fair value hedges 0 0 0 0.0 0 0 0 0.0Cash flow hedges 0 0 0 0.0 0 0 0 0.0Hedges for invest. made in foreign countries 0 0 0 0.0 0 0 0 0.0
Provisions 795 3 799 0.8 1,142 3 1,145 1.4General provisions 166 0 166 0.2 288 0 288 0.3Restructuring reserves 0 0 0 0.0 0 0 0 0.0Reserves for employee benefit 391 0 391 0.4 365 0 365 0.4Insurance technical reserves (Net) 0 0 0 0.0 0 0 0 0.0Other provisions 239 3 242 0.2 489 3 492 0.6
Liabilities for Tax 264 0 264 0.3 261 0 261 0.3Current liabilities for tax 264 0 264 0.3 261 0 261 0.3Deferred liabilities for tax 0 0 0 0.0 0 0 0 0.0
Lia.for Pro.&Equ.for Sale p. and from Term.Op.(Net) 0 0 0 0.0 0 0 0 0.0Subordinated Loans 0 0 0 0.0 0 0 0 0.0Shareholders' Equity 8,631 121 8,753 8.9 6,943 19 6,962 8.3
Paid-in capital 1,626 0 1,626 1.7 1,681 0 1,681 2.0Supplementary capital 847 121 969 1.0 685 19 704 0.8
Share premium 0 0 0 0.0 0 0 0 0.0Share cancellation profits 0 0 0 0.0 0 0 0 0.0Valuation changes in marketable securities 483 121 604 0.6 311 19 330 0.4Revaluation changes of property and equip. 0 0 0 0.0 0 0 0 0.0Revaluation changes of intangible assets 0 0 0 0.0 0 0 0 0.0Revaluation changes of real est.for inv. pur. 0 0 0 0.0 0 0 0 0.0Free shares from inv.&ass.,subs.& joint vent. 11 0 11 0.0 9 0 9 0.0Hedging funds (active part) 0 0 0 0.0 0 0 0 0.0Val.inc.in pro.& equ.held for sale p.and term.ope. 0 0 0 0.0 0 0 0 0.0Other capital reserves 353 0 353 0.4 365 0 365 0.4
Profit reserves 3,640 0 3,640 3.7 2,109 0 2,109 2.5Legal reserves 1,309 0 1,309 1.3 1,182 0 1,182 1.4Status reserves 0 0 0 0.0 0 0 0 0.0Extraordinary reserves 1,951 0 1,951 2.0 722 0 722 0.9Other profit reserves 379 0 379 0.4 204 0 204 0.2
Profit or loss 2,518 0 2,518 2.6 2,468 0 2,468 2.9Prior years income/loss 104 0 104 0.1 107 0 107 0.1Current year income/loss 2,415 0 2,415 2.5 2,361 0 2,361 2.8
Total Liabilities 83,270 15,039 98,309 100.0 70,693 13,035 83,728 100.0
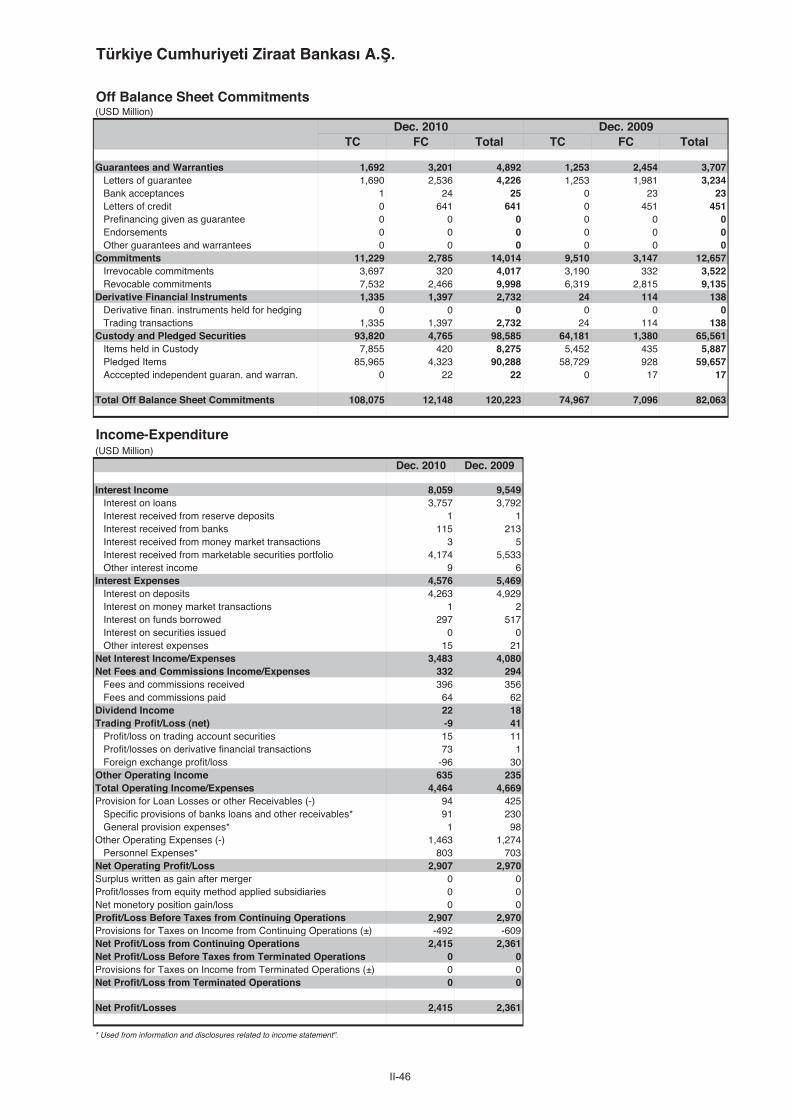
II-46
Türkiye Cumhuriyeti Ziraat Bankası A. .
Off Balance Sheet Commitments(USD Million)
Dec. 2010 Dec. 2009TC FC Total TC FC Total
Guarantees and Warranties 1,692 3,201 4,892 1,253 2,454 3,707Letters of guarantee 1,690 2,536 4,226 1,253 1,981 3,234Bank acceptances 1 24 25 0 23 23Letters of credit 0 641 641 0 451 451Prefinancing given as guarantee 0 0 0 0 0 0Endorsements 0 0 0 0 0 0Other guarantees and warrantees 0 0 0 0 0 0
Commitments 11,229 2,785 14,014 9,510 3,147 12,657Irrevocable commitments 3,697 320 4,017 3,190 332 3,522Revocable commitments 7,532 2,466 9,998 6,319 2,815 9,135
Derivative Financial Instruments 1,335 1,397 2,732 24 114 138Derivative finan. instruments held for hedging 0 0 0 0 0 0Trading transactions 1,335 1,397 2,732 24 114 138
Custody and Pledged Securities 93,820 4,765 98,585 64,181 1,380 65,561Items held in Custody 7,855 420 8,275 5,452 435 5,887Pledged Items 85,965 4,323 90,288 58,729 928 59,657Acccepted independent guaran. and warran. 0 22 22 0 17 17
Total Off Balance Sheet Commitments 108,075 12,148 120,223 74,967 7,096 82,063
Income-Expenditure(USD Million)
Dec. 2010 Dec. 2009
Interest Income 8,059 9,549Interest on loans 3,757 3,792Interest received from reserve deposits 1 1Interest received from banks 115 213Interest received from money market transactions 3 5Interest received from marketable securities portfolio 4,174 5,533Other interest income 9 6
Interest Expenses 4,576 5,469Interest on deposits 4,263 4,929Interest on money market transactions 1 2Interest on funds borrowed 297 517Interest on securities issued 0 0Other interest expenses 15 21
Net Interest Income/Expenses 3,483 4,080Net Fees and Commissions Income/Expenses 332 294
Fees and commissions received 396 356Fees and commissions paid 64 62
Dividend Income 22 18Trading Profit/Loss (net) -9 41
Profit/loss on trading account securities 15 11Profit/losses on derivative financial transactions 73 1Foreign exchange profit/loss -96 30
Other Operating Income 635 235Total Operating Income/Expenses 4,464 4,669Provision for Loan Losses or other Receivables (-) 94 425
Specific provisions of banks loans and other receivables* 91 230General provision expenses* 1 98
Other Operating Expenses (-) 1,463 1,274Personnel Expenses* 803 703
Net Operating Profit/Loss 2,907 2,970Surplus written as gain after merger 0 0Profit/losses from equity method applied subsidiaries 0 0Net monetory position gain/loss 0 0Profit/Loss Before Taxes from Continuing Operations 2,907 2,970Provisions for Taxes on Income from Continuing Operations (±) -492 -609Net Profit/Loss from Continuing Operations 2,415 2,361Net Profit/Loss Before Taxes from Terminated Operations 0 0Provisions for Taxes on Income from Terminated Operations (±) 0 0Net Profit/Loss from Terminated Operations 0 0
Net Profit/Losses 2,415 2,361
* Used from information and disclosures related to income statement".

II-47
Türkiye Cumhuriyeti Ziraat Bankası A. . December 2010
Ratios(%)
Dec. 2010 Dec. 2009
Capital Ratios
Shareholders’ Equity / (Amount subject to credit + market + operational risk) 19.2 23.2
Shareholders' Equity / Total Assets 8.9 8.3
(Shareholders' Equity - Permanent Assets) / Total Assets 7.7 6.9
Net On Balance Sheet Position / Total Shareholders' Equity -13.2 -0.4
Net On and Off Balance Sheet Position / Total Shareholders' Equity 1.2 -0.4
Balance-Sheet Ratios
TC Assets / Total Assets 86.0 84.5
TC Liabilities / Total Liabilities 84.7 84.4
FC Assets / FC Liabilities 91.5 99.7
TC Deposits / Total Deposits 82.2 80.7
TC Loans / Total Loans and Receivables 90.5 94.4
Total Deposits / Total Assets 83.2 79.1
Funds Borrowed / Total Assets 0.1 0.0
Assets Quality
Financial Assets (net) / Total Assets 50.5 57.0
Total Loans and Receivables / Total Assets 38.0 29.5
Total Loans and Receivables / Total Deposits 45.7 37.3
Loans Under Follow-up (gross) / Total Loans and Receivables 1.5 2.3
Loans Under Follow-up (net) / Total Loans and Receivables 0.5 0.5
Specific Provisions / Loans Under Follow-up 67.0 79.9
Permanent Assets / Total Assets 1.3 1.4
Consumer Loans / Total Loans and Receivables 40.6 45.6
Liquidity
Liquid Assets / Total Assets 36.3 32.7
Liquid Assets / Short-term Liabilities 49.6 44.3
TC Liquid Assets / Total Assets 29.0 23.1
Profitability
Net Profit/Losses / Total Assets 2.5 2.8
Net Profit/Losses / Total Shareholders' Equity 27.6 33.9
Profit/Losses Before Taxes after Continuing Operations / Total Assets 3.0 3.5
Income-Expenditure Structure
Net Interest Income After Specific Provisions / Total Assets 3.5 4.6
Net Interest Income After Specific Provisions / Total Operating Income (Expenses) 76.0 82.5
Non-interest Income (net) / Total Assets 1.0 0.7
Other Operating Expenses / Total Assets 1.5 1.5
Personnel Expenses / Other Operating Expenses 54.9 55.2
Non-interest Income (net) / Other Operating Expenses 67.0 46.2
Quarterly profitability and income-expenditure ratios, except year-end figures, should be considered periodically.
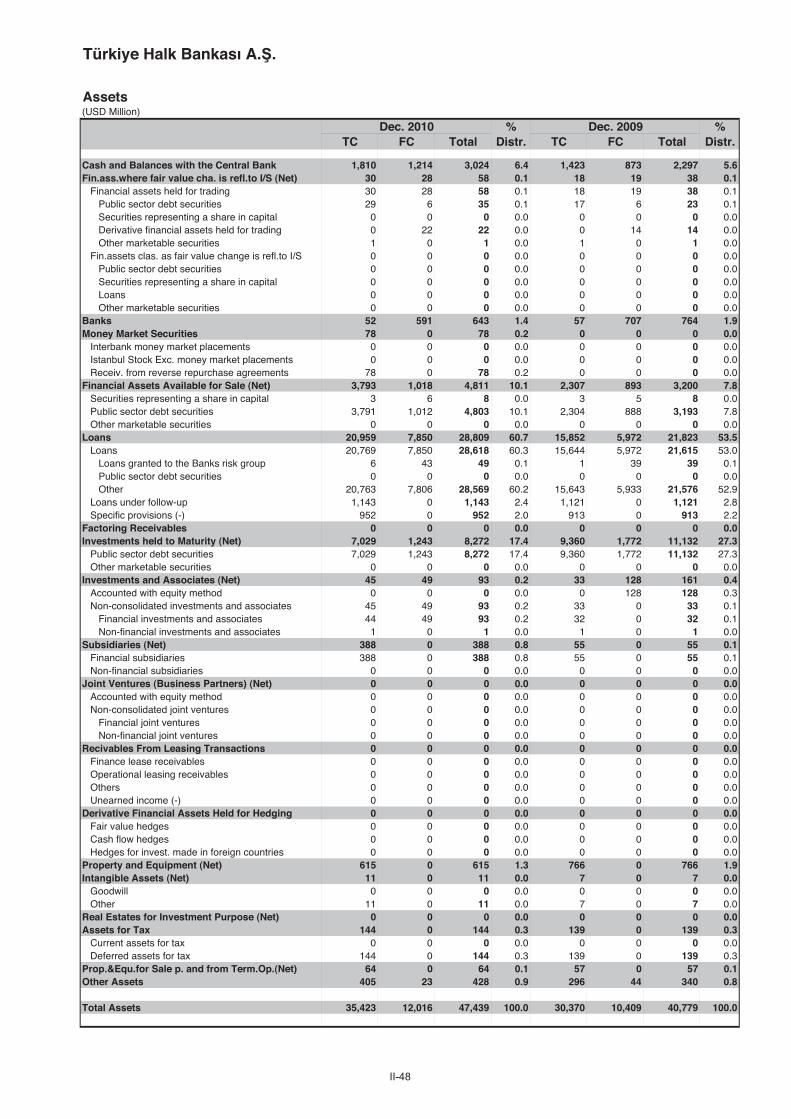
II-48
Türkiye Halk Bankası A. .
Assets(USD Million)
Dec. 2010 % Dec. 2009 %TC FC Total Distr. TC FC Total Distr.
Cash and Balances with the Central Bank 1,810 1,214 3,024 6.4 1,423 873 2,297 5.6Fin.ass.where fair value cha. is refl.to I/S (Net) 30 28 58 0.1 18 19 38 0.1
Financial assets held for trading 30 28 58 0.1 18 19 38 0.1Public sector debt securities 29 6 35 0.1 17 6 23 0.1Securities representing a share in capital 0 0 0 0.0 0 0 0 0.0Derivative financial assets held for trading 0 22 22 0.0 0 14 14 0.0Other marketable securities 1 0 1 0.0 1 0 1 0.0
Fin.assets clas. as fair value change is refl.to I/S 0 0 0 0.0 0 0 0 0.0Public sector debt securities 0 0 0 0.0 0 0 0 0.0Securities representing a share in capital 0 0 0 0.0 0 0 0 0.0Loans 0 0 0 0.0 0 0 0 0.0Other marketable securities 0 0 0 0.0 0 0 0 0.0
Banks 52 591 643 1.4 57 707 764 1.9Money Market Securities 78 0 78 0.2 0 0 0 0.0
Interbank money market placements 0 0 0 0.0 0 0 0 0.0Istanbul Stock Exc. money market placements 0 0 0 0.0 0 0 0 0.0Receiv. from reverse repurchase agreements 78 0 78 0.2 0 0 0 0.0
Financial Assets Available for Sale (Net) 3,793 1,018 4,811 10.1 2,307 893 3,200 7.8Securities representing a share in capital 3 6 8 0.0 3 5 8 0.0Public sector debt securities 3,791 1,012 4,803 10.1 2,304 888 3,193 7.8Other marketable securities 0 0 0 0.0 0 0 0 0.0
Loans 20,959 7,850 28,809 60.7 15,852 5,972 21,823 53.5Loans 20,769 7,850 28,618 60.3 15,644 5,972 21,615 53.0
Loans granted to the Banks risk group 6 43 49 0.1 1 39 39 0.1Public sector debt securities 0 0 0 0.0 0 0 0 0.0Other 20,763 7,806 28,569 60.2 15,643 5,933 21,576 52.9
Loans under follow-up 1,143 0 1,143 2.4 1,121 0 1,121 2.8Specific provisions (-) 952 0 952 2.0 913 0 913 2.2
Factoring Receivables 0 0 0 0.0 0 0 0 0.0Investments held to Maturity (Net) 7,029 1,243 8,272 17.4 9,360 1,772 11,132 27.3
Public sector debt securities 7,029 1,243 8,272 17.4 9,360 1,772 11,132 27.3Other marketable securities 0 0 0 0.0 0 0 0 0.0
Investments and Associates (Net) 45 49 93 0.2 33 128 161 0.4Accounted with equity method 0 0 0 0.0 0 128 128 0.3Non-consolidated investments and associates 45 49 93 0.2 33 0 33 0.1
Financial investments and associates 44 49 93 0.2 32 0 32 0.1Non-financial investments and associates 1 0 1 0.0 1 0 1 0.0
Subsidiaries (Net) 388 0 388 0.8 55 0 55 0.1Financial subsidiaries 388 0 388 0.8 55 0 55 0.1Non-financial subsidiaries 0 0 0 0.0 0 0 0 0.0
Joint Ventures (Business Partners) (Net) 0 0 0 0.0 0 0 0 0.0Accounted with equity method 0 0 0 0.0 0 0 0 0.0Non-consolidated joint ventures 0 0 0 0.0 0 0 0 0.0
Financial joint ventures 0 0 0 0.0 0 0 0 0.0Non-financial joint ventures 0 0 0 0.0 0 0 0 0.0
Recivables From Leasing Transactions 0 0 0 0.0 0 0 0 0.0Finance lease receivables 0 0 0 0.0 0 0 0 0.0Operational leasing receivables 0 0 0 0.0 0 0 0 0.0Others 0 0 0 0.0 0 0 0 0.0Unearned income (-) 0 0 0 0.0 0 0 0 0.0
Derivative Financial Assets Held for Hedging 0 0 0 0.0 0 0 0 0.0Fair value hedges 0 0 0 0.0 0 0 0 0.0Cash flow hedges 0 0 0 0.0 0 0 0 0.0Hedges for invest. made in foreign countries 0 0 0 0.0 0 0 0 0.0
Property and Equipment (Net) 615 0 615 1.3 766 0 766 1.9Intangible Assets (Net) 11 0 11 0.0 7 0 7 0.0
Goodwill 0 0 0 0.0 0 0 0 0.0Other 11 0 11 0.0 7 0 7 0.0
Real Estates for Investment Purpose (Net) 0 0 0 0.0 0 0 0 0.0Assets for Tax 144 0 144 0.3 139 0 139 0.3
Current assets for tax 0 0 0 0.0 0 0 0 0.0Deferred assets for tax 144 0 144 0.3 139 0 139 0.3
Prop.&Equ.for Sale p. and from Term.Op.(Net) 64 0 64 0.1 57 0 57 0.1Other Assets 405 23 428 0.9 296 44 340 0.8
Total Assets 35,423 12,016 47,439 100.0 30,370 10,409 40,779 100.0

II-49
Türkiye Halk Bankası A. . December 2010
Liabilities(USD Million)
Dec. 2010 % Dec. 2009 %TC FC Total Distr. TC FC Total Distr.
Deposits 25,804 9,825 35,628 75.1 19,787 9,763 29,550 72.5Deposits held by the Banks risk group 179 5 185 0.4 68 10 78 0.2Other 25,624 9,819 35,444 74.7 19,719 9,753 29,472 72.3
Derivative Finan. Liabilities Held for Trading 0 25 25 0.1 0 60 60 0.1Funds Borrowed 131 2,356 2,487 5.2 136 1,230 1,366 3.3Money Market Takings 1,653 399 2,052 4.3 3,506 368 3,874 9.5
Interbank money market takings 0 0 0 0.0 0 0 0 0.0Istanbul Stock Exc. money market takings 0 0 0 0.0 0 0 0 0.0Funds provided under repurchase agreements 1,653 399 2,052 4.3 3,506 368 3,874 9.5
Marketable Securities Issued (Net) 0 0 0 0.0 0 0 0 0.0Bills 0 0 0 0.0 0 0 0 0.0Asset backed securities 0 0 0 0.0 0 0 0 0.0Bonds 0 0 0 0.0 0 0 0 0.0
Funds 842 0 842 1.8 885 0 885 2.2Borrower funds 79 0 79 0.2 138 0 138 0.3Others 764 0 764 1.6 747 0 747 1.8
Miscellaneous Payables 471 12 483 1.0 349 11 360 0.9Other External Resources 256 91 347 0.7 110 65 175 0.4Factoring Payables 0 0 0 0.0 0 0 0 0.0Leasing Transactions Payables (Net) 0 0 0 0.0 0 0 0 0.0
Finance leasing payables 1 0 1 0.0 0 0 0 0.0Operations leasing payables 0 0 0 0.0 0 0 0 0.0Others 0 0 0 0.0 0 0 0 0.0Deferred finance leasing expenses (-) 0 0 0 0.0 0 0 0 0.0
Derivative Finan. Liabilities Held for Hedging 0 0 0 0.0 0 0 0 0.0Fair value hedges 0 0 0 0.0 0 0 0 0.0Cash flow hedges 0 0 0 0.0 0 0 0 0.0Hedges for invest. made in foreign countries 0 0 0 0.0 0 0 0 0.0
Provisions 547 10 557 1.2 481 10 491 1.2General provisions 254 0 254 0.5 185 0 185 0.5Restructuring reserves 0 0 0 0.0 0 0 0 0.0Reserves for employee benefit 179 0 179 0.4 163 0 163 0.4Insurance technical reserves (Net) 0 0 0 0.0 0 0 0 0.0Other provisions 114 10 125 0.3 132 10 143 0.4
Liabilities for Tax 175 0 175 0.4 146 0 146 0.4Current liabilities for tax 175 0 175 0.4 146 0 146 0.4Deferred liabilities for tax 0 0 0 0.0 0 0 0 0.0
Lia.for Pro.&Equ.for Sale p. and from Term.Op.(Net) 0 0 0 0.0 0 0 0 0.0Subordinated Loans 0 0 0 0.0 0 0 0 0.0Shareholders' Equity 4,881 -39 4,842 10.2 3,842 31 3,872 9.5
Paid-in capital 813 0 813 1.7 840 0 840 2.1Supplementary capital 911 -39 872 1.8 850 31 881 2.2
Share premium 0 0 0 0.0 0 0 0 0.0Share cancellation profits 0 0 0 0.0 0 0 0 0.0Valuation changes in marketable securities 114 -39 75 0.2 50 31 81 0.2Revaluation changes of property and equip. 0 0 0 0.0 0 0 0 0.0Revaluation changes of intangible assets 0 0 0 0.0 0 0 0 0.0Revaluation changes of real est.for inv. pur. 0 0 0 0.0 0 0 0 0.0Free shares from inv.&ass.,subs.& joint vent. 3 0 3 0.0 0 0 0 0.0Hedging funds (active part) 0 0 0 0.0 -21 0 -21 -0.1Val.inc.in pro.& equ.held for sale p.and term.ope. 0 0 0 0.0 0 0 0 0.0Other capital reserves 794 0 794 1.7 821 0 821 2.0
Profit reserves 1,850 0 1,850 3.9 1,055 0 1,055 2.6Legal reserves 397 0 397 0.8 341 0 341 0.8Status reserves 0 0 0 0.0 0 0 0 0.0Extraordinary reserves 1,422 0 1,422 3.0 682 0 682 1.7Other profit reserves 31 0 31 0.1 32 0 32 0.1
Profit or loss 1,307 0 1,307 2.8 1,097 0 1,097 2.7Prior years income/loss 0 0 0 0.0 0 0 0 0.0Current year income/loss 1,307 0 1,307 2.8 1,097 0 1,097 2.7
Total Liabilities 34,759 12,680 47,439 100.0 29,240 11,538 40,779 100.0

II-50
Türkiye Halk Bankası A. .
Off Balance Sheet Commitments(USD Million)
Dec. 2010 Dec. 2009TC FC Total TC FC Total
Guarantees and Warranties 4,389 3,888 8,277 2,503 3,760 6,263Letters of guarantee 3,343 2,473 5,816 2,475 2,081 4,555Bank acceptances 0 97 97 0 93 93Letters of credit 989 1,207 2,196 0 1,508 1,508Prefinancing given as guarantee 0 0 0 0 0 0Endorsements 0 0 0 0 0 0Other guarantees and warrantees 56 111 167 28 78 106
Commitments 5,982 448 6,431 3,354 557 3,912Irrevocable commitments 5,980 448 6,429 3,352 557 3,909Revocable commitments 2 0 2 2 0 2
Derivative Financial Instruments 744 2,418 3,161 885 4,277 5,162Derivative finan. instruments held for hedging 0 0 0 0 0 0Trading transactions 744 2,418 3,161 885 4,277 5,162
Custody and Pledged Securities 232,336 98,835 331,170 179,327 72,601 251,928Items held in Custody 42,519 4,292 46,810 38,020 3,639 41,659Pledged Items 189,817 94,543 284,360 141,307 68,962 210,269Acccepted independent guaran. and warran. 0 0 0 0 0 0
Total Off Balance Sheet Commitments 243,450 105,589 349,039 186,070 81,195 267,265
Income-Expenditure(USD Million)
Dec. 2010 Dec. 2009
Interest Income 4,130 4,583Interest on loans 2,768 2,841Interest received from reserve deposits 0 0Interest received from banks 46 85Interest received from money market transactions 0 3Interest received from marketable securities portfolio 1,310 1,642Other interest income 5 12
Interest Expenses 2,055 2,493Interest on deposits 1,803 2,160Interest on money market transactions 43 50Interest on funds borrowed 177 223Interest on securities issued 0 0Other interest expenses 32 61
Net Interest Income/Expenses 2,075 2,090Net Fees and Commissions Income/Expenses 342 310
Fees and commissions received 405 365Fees and commissions paid 63 56
Dividend Income 36 7Trading Profit/Loss (net) 75 11
Profit/loss on trading account securities 144 91Profit/losses on derivative financial transactions -47 -51Foreign exchange profit/loss -22 -29
Other Operating Income 374 176Total Operating Income/Expenses 2,903 2,593Provision for Loan Losses or other Receivables (-) 298 434
Specific provisions of banks loans and other receivables* 206 292General provision expenses* 75 41
Other Operating Expenses (-) 972 803Personnel Expenses* 436 400
Net Operating Profit/Loss 1,632 1,356Surplus written as gain after merger 0 0Profit/losses from equity method applied subsidiaries 0 0Net monetory position gain/loss 0 0Profit/Loss Before Taxes from Continuing Operations 1,632 1,356Provisions for Taxes on Income from Continuing Operations (±) -324 -260Net Profit/Loss from Continuing Operations 1,307 1,097Net Profit/Loss Before Taxes from Terminated Operations 0 0Provisions for Taxes on Income from Terminated Operations (±) 0 0Net Profit/Loss from Terminated Operations 0 0
Net Profit/Losses 1,307 1,097
* Used from information and disclosures related to income statement".

II-51
Türkiye Halk Bankası A. . December 2010
Ratios(%)
Dec. 2010 Dec. 2009
Capital Ratios
Shareholders’ Equity / (Amount subject to credit + market + operational risk) 15.9 16.0
Shareholders' Equity / Total Assets 10.2 9.5
(Shareholders' Equity - Permanent Assets) / Total Assets 7.3 6.4
Net On Balance Sheet Position / Total Shareholders' Equity -14.7 -26.6
Net On and Off Balance Sheet Position / Total Shareholders' Equity -4.2 -4.1
Balance-Sheet Ratios
TC Assets / Total Assets 74.7 74.5
TC Liabilities / Total Liabilities 73.3 71.7
FC Assets / FC Liabilities 94.8 90.2
TC Deposits / Total Deposits 72.4 67.0
TC Loans / Total Loans and Receivables 72.8 72.6
Total Deposits / Total Assets 75.1 72.5
Funds Borrowed / Total Assets 5.2 3.3
Assets Quality
Financial Assets (net) / Total Assets 27.7 35.2
Total Loans and Receivables / Total Assets 60.7 53.5
Total Loans and Receivables / Total Deposits 80.9 73.9
Loans Under Follow-up (gross) / Total Loans and Receivables 4.0 5.1
Loans Under Follow-up (net) / Total Loans and Receivables 0.7 1.0
Specific Provisions / Loans Under Follow-up 83.3 81.4
Permanent Assets / Total Assets 2.9 3.1
Consumer Loans / Total Loans and Receivables 25.6 22.5
Liquidity
Liquid Assets / Total Assets 18.2 15.4
Liquid Assets / Short-term Liabilities 28.0 24.2
TC Liquid Assets / Total Assets 12.1 9.3
Profitability
Net Profit/Losses / Total Assets 2.8 2.7
Net Profit/Losses / Total Shareholders' Equity 27.0 28.3
Profit/Losses Before Taxes after Continuing Operations / Total Assets 3.4 3.3
Income-Expenditure Structure
Net Interest Income After Specific Provisions / Total Assets 3.9 4.4
Net Interest Income After Specific Provisions / Total Operating Income (Expenses) 64.4 69.3
Non-interest Income (net) / Total Assets 1.7 1.2
Other Operating Expenses / Total Assets 2.0 2.0
Personnel Expenses / Other Operating Expenses 44.8 49.9
Non-interest Income (net) / Other Operating Expenses 85.1 62.7
Quarterly profitability and income-expenditure ratios, except year-end figures, should be considered periodically.

II-52
Türkiye Vakıflar Bankası T.A.O.
Assets(USD Million)
Dec. 2010 % Dec. 2009 %TC FC Total Distr. TC FC Total Distr.
Cash and Balances with the Central Bank 1,697 1,325 3,022 6.3 1,114 937 2,050 4.7Fin.ass.where fair value cha. is refl.to I/S (Net) 1 15 16 0.0 0 26 26 0.1
Financial assets held for trading 1 15 16 0.0 0 26 26 0.1Public sector debt securities 0 0 0 0.0 0 12 12 0.0Securities representing a share in capital 0 0 0 0.0 0 0 0 0.0Derivative financial assets held for trading 1 15 16 0.0 0 14 14 0.0Other marketable securities 0 0 0 0.0 0 0 0 0.0
Fin.assets clas. as fair value change is refl.to I/S 0 0 0 0.0 0 0 0 0.0Public sector debt securities 0 0 0 0.0 0 0 0 0.0Securities representing a share in capital 0 0 0 0.0 0 0 0 0.0Loans 0 0 0 0.0 0 0 0 0.0Other marketable securities 0 0 0 0.0 0 0 0 0.0
Banks 48 780 827 1.7 165 1,676 1,841 4.2Money Market Securities 1,367 0 1,367 2.8 2,286 0 2,286 5.2
Interbank money market placements 0 0 0 0.0 2,286 0 2,286 5.2Istanbul Stock Exc. money market placements 0 0 0 0.0 0 0 0 0.0Receiv. from reverse repurchase agreements 1,367 0 1,367 2.8 0 0 0 0.0
Financial Assets Available for Sale (Net) 7,322 1,630 8,952 18.6 8,575 1,488 10,062 23.1Securities representing a share in capital 0 7 7 0.0 0 7 7 0.0Public sector debt securities 7,322 1,575 8,897 18.5 8,575 1,463 10,037 23.0Other marketable securities 0 48 48 0.1 0 18 18 0.0
Loans 20,531 8,645 29,176 60.7 15,977 7,269 23,245 53.4Loans 20,515 8,645 29,160 60.6 15,886 7,269 23,155 53.1
Loans granted to the Banks risk group 464 137 601 1.2 296 100 396 0.9Public sector debt securities 0 0 0 0.0 0 0 0 0.0Other 20,051 8,508 28,559 59.4 15,590 7,169 22,759 52.2
Loans under follow-up 1,474 0 1,474 3.1 1,425 0 1,425 3.3Specific provisions (-) 1,458 0 1,458 3.0 1,335 0 1,335 3.1
Factoring Receivables 0 0 0 0.0 0 0 0 0.0Investments held to Maturity (Net) 1,893 908 2,801 5.8 1,396 957 2,352 5.4
Public sector debt securities 1,893 884 2,777 5.8 1,396 932 2,328 5.3Other marketable securities 0 24 24 0.1 0 24 24 0.1
Investments and Associates (Net) 134 0 134 0.3 95 0 95 0.2Accounted with equity method 0 0 0 0.0 0 0 0 0.0Non-consolidated investments and associates 134 0 134 0.3 95 0 95 0.2
Financial investments and associates 129 0 129 0.3 90 0 90 0.2Non-financial investments and associates 5 0 5 0.0 5 0 5 0.0
Subsidiaries (Net) 350 98 448 0.9 300 67 367 0.8Financial subsidiaries 259 98 356 0.7 203 67 270 0.6Non-financial subsidiaries 91 0 91 0.2 97 0 97 0.2
Joint Ventures (Business Partners) (Net) 0 0 0 0.0 0 0 0 0.0Accounted with equity method 0 0 0 0.0 0 0 0 0.0Non-consolidated joint ventures 0 0 0 0.0 0 0 0 0.0
Financial joint ventures 0 0 0 0.0 0 0 0 0.0Non-financial joint ventures 0 0 0 0.0 0 0 0 0.0
Recivables From Leasing Transactions 0 0 0 0.0 0 0 0 0.0Finance lease receivables 0 0 0 0.0 0 0 0 0.0Operational leasing receivables 0 0 0 0.0 0 0 0 0.0Others 0 0 0 0.0 0 0 0 0.0Unearned income (-) 0 0 0 0.0 0 0 0 0.0
Derivative Financial Assets Held for Hedging 0 0 0 0.0 0 0 0 0.0Fair value hedges 0 0 0 0.0 0 0 0 0.0Cash flow hedges 0 0 0 0.0 0 0 0 0.0Hedges for invest. made in foreign countries 0 0 0 0.0 0 0 0 0.0
Property and Equipment (Net) 723 1 724 1.5 728 0 728 1.7Intangible Assets (Net) 34 0 34 0.1 29 0 29 0.1
Goodwill 0 0 0 0.0 0 0 0 0.0Other 34 0 34 0.1 29 0 29 0.1
Real Estates for Investment Purpose (Net) 0 0 0 0.0 0 0 0 0.0Assets for Tax 57 0 57 0.1 54 0 54 0.1
Current assets for tax 0 0 0 0.0 0 0 0 0.0Deferred assets for tax 57 0 57 0.1 54 0 54 0.1
Prop.&Equ.for Sale p. and from Term.Op.(Net) 0 0 0 0.0 0 0 0 0.0Other Assets 471 73 544 1.1 303 126 429 1.0
Total Assets 34,628 13,474 48,102 100.0 31,022 12,545 43,567 100.0
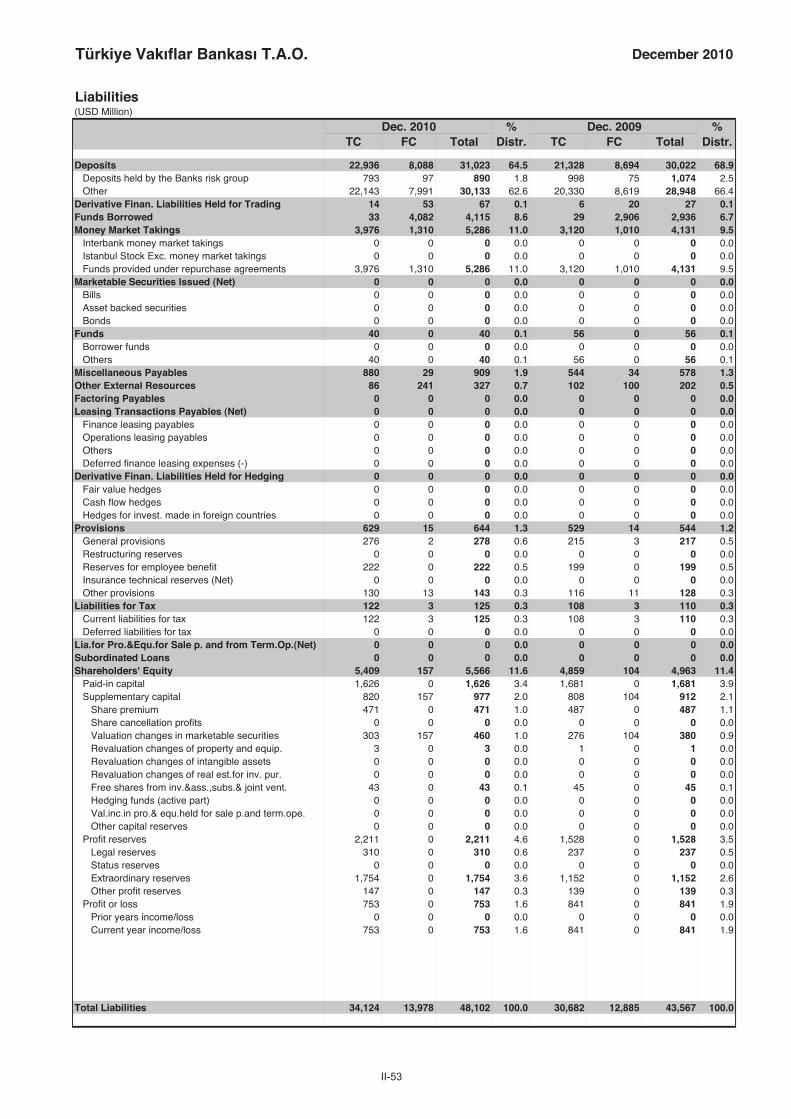
II-53
Türkiye Vakıflar Bankası T.A.O. December 2010
Liabilities(USD Million)
Dec. 2010 % Dec. 2009 %TC FC Total Distr. TC FC Total Distr.
Deposits 22,936 8,088 31,023 64.5 21,328 8,694 30,022 68.9Deposits held by the Banks risk group 793 97 890 1.8 998 75 1,074 2.5Other 22,143 7,991 30,133 62.6 20,330 8,619 28,948 66.4
Derivative Finan. Liabilities Held for Trading 14 53 67 0.1 6 20 27 0.1Funds Borrowed 33 4,082 4,115 8.6 29 2,906 2,936 6.7Money Market Takings 3,976 1,310 5,286 11.0 3,120 1,010 4,131 9.5
Interbank money market takings 0 0 0 0.0 0 0 0 0.0Istanbul Stock Exc. money market takings 0 0 0 0.0 0 0 0 0.0Funds provided under repurchase agreements 3,976 1,310 5,286 11.0 3,120 1,010 4,131 9.5
Marketable Securities Issued (Net) 0 0 0 0.0 0 0 0 0.0Bills 0 0 0 0.0 0 0 0 0.0Asset backed securities 0 0 0 0.0 0 0 0 0.0Bonds 0 0 0 0.0 0 0 0 0.0
Funds 40 0 40 0.1 56 0 56 0.1Borrower funds 0 0 0 0.0 0 0 0 0.0Others 40 0 40 0.1 56 0 56 0.1
Miscellaneous Payables 880 29 909 1.9 544 34 578 1.3Other External Resources 86 241 327 0.7 102 100 202 0.5Factoring Payables 0 0 0 0.0 0 0 0 0.0Leasing Transactions Payables (Net) 0 0 0 0.0 0 0 0 0.0
Finance leasing payables 0 0 0 0.0 0 0 0 0.0Operations leasing payables 0 0 0 0.0 0 0 0 0.0Others 0 0 0 0.0 0 0 0 0.0Deferred finance leasing expenses (-) 0 0 0 0.0 0 0 0 0.0
Derivative Finan. Liabilities Held for Hedging 0 0 0 0.0 0 0 0 0.0Fair value hedges 0 0 0 0.0 0 0 0 0.0Cash flow hedges 0 0 0 0.0 0 0 0 0.0Hedges for invest. made in foreign countries 0 0 0 0.0 0 0 0 0.0
Provisions 629 15 644 1.3 529 14 544 1.2General provisions 276 2 278 0.6 215 3 217 0.5Restructuring reserves 0 0 0 0.0 0 0 0 0.0Reserves for employee benefit 222 0 222 0.5 199 0 199 0.5Insurance technical reserves (Net) 0 0 0 0.0 0 0 0 0.0Other provisions 130 13 143 0.3 116 11 128 0.3
Liabilities for Tax 122 3 125 0.3 108 3 110 0.3Current liabilities for tax 122 3 125 0.3 108 3 110 0.3Deferred liabilities for tax 0 0 0 0.0 0 0 0 0.0
Lia.for Pro.&Equ.for Sale p. and from Term.Op.(Net) 0 0 0 0.0 0 0 0 0.0Subordinated Loans 0 0 0 0.0 0 0 0 0.0Shareholders' Equity 5,409 157 5,566 11.6 4,859 104 4,963 11.4
Paid-in capital 1,626 0 1,626 3.4 1,681 0 1,681 3.9Supplementary capital 820 157 977 2.0 808 104 912 2.1
Share premium 471 0 471 1.0 487 0 487 1.1Share cancellation profits 0 0 0 0.0 0 0 0 0.0Valuation changes in marketable securities 303 157 460 1.0 276 104 380 0.9Revaluation changes of property and equip. 3 0 3 0.0 1 0 1 0.0Revaluation changes of intangible assets 0 0 0 0.0 0 0 0 0.0Revaluation changes of real est.for inv. pur. 0 0 0 0.0 0 0 0 0.0Free shares from inv.&ass.,subs.& joint vent. 43 0 43 0.1 45 0 45 0.1Hedging funds (active part) 0 0 0 0.0 0 0 0 0.0Val.inc.in pro.& equ.held for sale p.and term.ope. 0 0 0 0.0 0 0 0 0.0Other capital reserves 0 0 0 0.0 0 0 0 0.0
Profit reserves 2,211 0 2,211 4.6 1,528 0 1,528 3.5Legal reserves 310 0 310 0.6 237 0 237 0.5Status reserves 0 0 0 0.0 0 0 0 0.0Extraordinary reserves 1,754 0 1,754 3.6 1,152 0 1,152 2.6Other profit reserves 147 0 147 0.3 139 0 139 0.3
Profit or loss 753 0 753 1.6 841 0 841 1.9Prior years income/loss 0 0 0 0.0 0 0 0 0.0Current year income/loss 753 0 753 1.6 841 0 841 1.9
Total Liabilities 34,124 13,978 48,102 100.0 30,682 12,885 43,567 100.0

II-54
Türkiye Vakıflar Bankası T.A.O.
Off Balance Sheet Commitments(USD Million)
Dec. 2010 Dec. 2009TC FC Total TC FC Total
Guarantees and Warranties 4,205 3,173 7,378 2,887 3,227 6,115Letters of guarantee 4,197 1,154 5,352 2,883 1,223 4,105Bank acceptances 6 122 128 0 294 294Letters of credit 2 1,891 1,893 3 1,696 1,698Prefinancing given as guarantee 0 4 4 0 12 12Endorsements 0 0 0 0 0 0Other guarantees and warrantees 0 1 1 2 3 5
Commitments 6,402 328 6,730 5,262 160 5,421Irrevocable commitments 6,402 328 6,730 5,256 160 5,416Revocable commitments 0 0 0 5 0 5
Derivative Financial Instruments 2,147 2,384 4,532 798 1,194 1,992Derivative finan. instruments held for hedging 0 0 0 0 0 0Trading transactions 2,147 2,384 4,532 798 1,194 1,992
Custody and Pledged Securities 57,656 17,187 74,843 48,398 14,834 63,232Items held in Custody 13,326 450 13,776 10,409 275 10,684Pledged Items 44,331 16,737 61,067 37,989 14,559 52,548Acccepted independent guaran. and warran. 0 0 0 0 0 0
Total Off Balance Sheet Commitments 70,411 23,071 93,483 57,345 19,415 76,760
Income-Expenditure(USD Million)
Dec. 2010 Dec. 2009
Interest Income 3,826 4,305Interest on loans 2,689 3,011Interest received from reserve deposits 45 76Interest received from banks 4 7Interest received from money market transactions 39 62Interest received from marketable securities portfolio 1,028 1,137Other interest income 22 12
Interest Expenses 2,051 2,236Interest on deposits 1,709 1,944Interest on money market transactions 57 99Interest on funds borrowed 251 176Interest on securities issued 0 0Other interest expenses 33 18
Net Interest Income/Expenses 1,775 2,069Net Fees and Commissions Income/Expenses 288 313
Fees and commissions received 366 400Fees and commissions paid 77 87
Dividend Income 23 16Trading Profit/Loss (net) 206 120
Profit/loss on trading account securities 238 83Profit/losses on derivative financial transactions -46 -4Foreign exchange profit/loss 14 41
Other Operating Income 391 209Total Operating Income/Expenses 2,683 2,727Provision for Loan Losses or other Receivables (-) 633 660
Specific provisions of banks loans and other receivables* 432 501General provision expenses* 68 44
Other Operating Expenses (-) 1,099 1,031Personnel Expenses* 444 417
Net Operating Profit/Loss 951 1,037Surplus written as gain after merger 0 0Profit/losses from equity method applied subsidiaries 0 0Net monetory position gain/loss 0 0Profit/Loss Before Taxes from Continuing Operations 951 1,037Provisions for Taxes on Income from Continuing Operations (±) -199 -196Net Profit/Loss from Continuing Operations 753 841Net Profit/Loss Before Taxes from Terminated Operations 0 0Provisions for Taxes on Income from Terminated Operations (±) 0 0Net Profit/Loss from Terminated Operations 0 0
Net Profit/Losses 753 841
* Used from information and disclosures related to income statement".
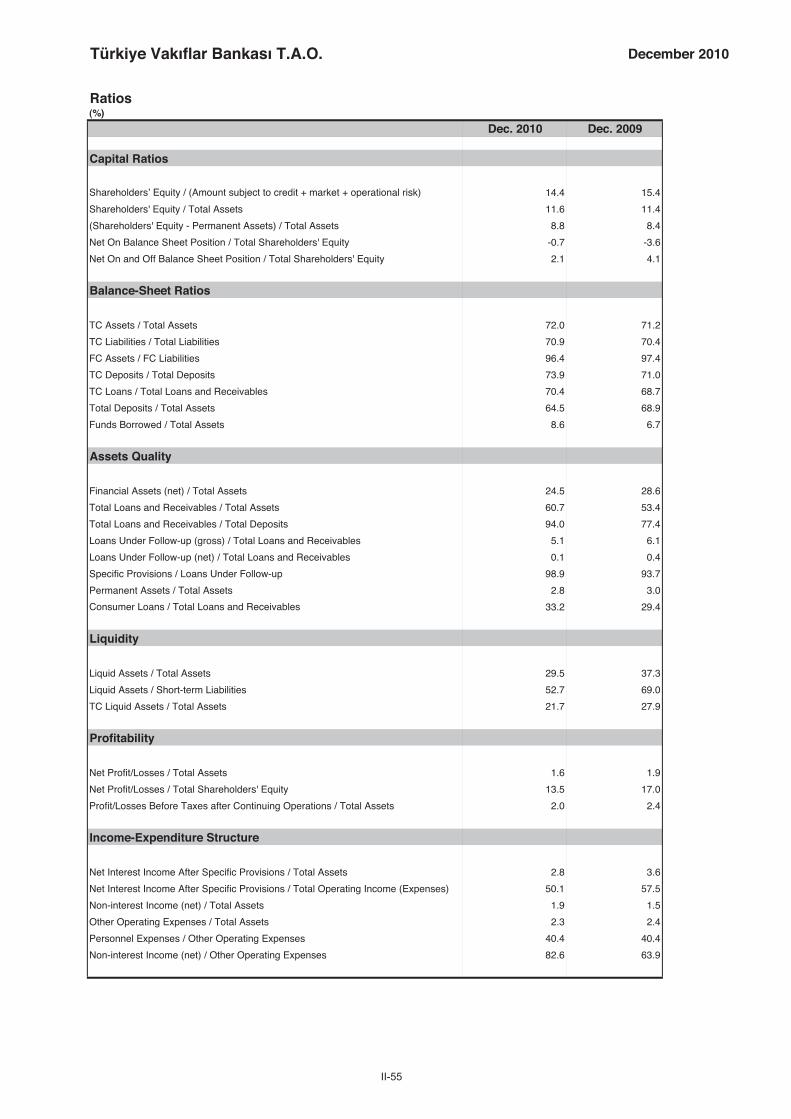
II-55
Türkiye Vakıflar Bankası T.A.O. December 2010
Ratios(%)
Dec. 2010 Dec. 2009
Capital Ratios
Shareholders’ Equity / (Amount subject to credit + market + operational risk) 14.4 15.4
Shareholders' Equity / Total Assets 11.6 11.4
(Shareholders' Equity - Permanent Assets) / Total Assets 8.8 8.4
Net On Balance Sheet Position / Total Shareholders' Equity -0.7 -3.6
Net On and Off Balance Sheet Position / Total Shareholders' Equity 2.1 4.1
Balance-Sheet Ratios
TC Assets / Total Assets 72.0 71.2
TC Liabilities / Total Liabilities 70.9 70.4
FC Assets / FC Liabilities 96.4 97.4
TC Deposits / Total Deposits 73.9 71.0
TC Loans / Total Loans and Receivables 70.4 68.7
Total Deposits / Total Assets 64.5 68.9
Funds Borrowed / Total Assets 8.6 6.7
Assets Quality
Financial Assets (net) / Total Assets 24.5 28.6
Total Loans and Receivables / Total Assets 60.7 53.4
Total Loans and Receivables / Total Deposits 94.0 77.4
Loans Under Follow-up (gross) / Total Loans and Receivables 5.1 6.1
Loans Under Follow-up (net) / Total Loans and Receivables 0.1 0.4
Specific Provisions / Loans Under Follow-up 98.9 93.7
Permanent Assets / Total Assets 2.8 3.0
Consumer Loans / Total Loans and Receivables 33.2 29.4
Liquidity
Liquid Assets / Total Assets 29.5 37.3
Liquid Assets / Short-term Liabilities 52.7 69.0
TC Liquid Assets / Total Assets 21.7 27.9
Profitability
Net Profit/Losses / Total Assets 1.6 1.9
Net Profit/Losses / Total Shareholders' Equity 13.5 17.0
Profit/Losses Before Taxes after Continuing Operations / Total Assets 2.0 2.4
Income-Expenditure Structure
Net Interest Income After Specific Provisions / Total Assets 2.8 3.6
Net Interest Income After Specific Provisions / Total Operating Income (Expenses) 50.1 57.5
Non-interest Income (net) / Total Assets 1.9 1.5
Other Operating Expenses / Total Assets 2.3 2.4
Personnel Expenses / Other Operating Expenses 40.4 40.4
Non-interest Income (net) / Other Operating Expenses 82.6 63.9
Quarterly profitability and income-expenditure ratios, except year-end figures, should be considered periodically.


II-57

II-58
Adabank A. .
Assets(USD Million)
Dec. 2010 % Dec. 2009 %TC FC Total Distr. TC FC Total Distr.
Cash and Balances with the Central Bank 0 0 0 1.2 0 0 0 1.0Fin.ass.where fair value cha. is refl.to I/S (Net) 1 0 1 2.0 27 0 27 80.6
Financial assets held for trading 1 0 1 2.0 27 0 27 80.6Public sector debt securities 1 0 1 2.0 27 0 27 80.6Securities representing a share in capital 0 0 0 0.0 0 0 0 0.0Derivative financial assets held for trading 0 0 0 0.0 0 0 0 0.0Other marketable securities 0 0 0 0.0 0 0 0 0.0
Fin.assets clas. as fair value change is refl.to I/S 0 0 0 0.0 0 0 0 0.0Public sector debt securities 0 0 0 0.0 0 0 0 0.0Securities representing a share in capital 0 0 0 0.0 0 0 0 0.0Loans 0 0 0 0.0 0 0 0 0.0Other marketable securities 0 0 0 0.0 0 0 0 0.0
Banks 30 0 30 90.7 0 0 0 0.8Money Market Securities 0 0 0 0.0 4 0 4 11.3
Interbank money market placements 0 0 0 0.0 4 0 4 11.3Istanbul Stock Exc. money market placements 0 0 0 0.0 0 0 0 0.0Receiv. from reverse repurchase agreements 0 0 0 0.0 0 0 0 0.0
Financial Assets Available for Sale (Net) 0 0 0 0.0 0 0 0 0.0Securities representing a share in capital 0 0 0 0.0 0 0 0 0.0Public sector debt securities 0 0 0 0.0 0 0 0 0.0Other marketable securities 0 0 0 0.0 0 0 0 0.0
Loans 0 0 0 0.0 0 0 0 0.0Loans 0 0 0 0.0 0 0 0 0.0
Loans granted to the Banks risk group 0 0 0 0.0 0 0 0 0.0Public sector debt securities 0 0 0 0.0 0 0 0 0.0Other 0 0 0 0.0 0 0 0 0.0
Loans under follow-up 4 0 4 12.7 6 0 6 18.2Specific provisions (-) 4 0 4 12.7 6 0 6 18.2
Factoring Receivables 0 0 0 0.0 0 0 0 0.0Investments held to Maturity (Net) 0 0 0 0.0 0 0 0 0.0
Public sector debt securities 0 0 0 0.0 0 0 0 0.0Other marketable securities 0 0 0 0.0 0 0 0 0.0
Investments and Associates (Net) 0 0 0 0.0 0 0 0 0.0Accounted with equity method 0 0 0 0.0 0 0 0 0.0Non-consolidated investments and associates 0 0 0 0.0 0 0 0 0.0
Financial investments and associates 0 0 0 0.0 0 0 0 0.0Non-financial investments and associates 0 0 0 0.0 0 0 0 0.0
Subsidiaries (Net) 0 0 0 0.0 0 0 0 0.0Financial subsidiaries 0 0 0 0.0 0 0 0 0.0Non-financial subsidiaries 0 0 0 0.0 0 0 0 0.0
Joint Ventures (Business Partners) (Net) 0 0 0 0.0 0 0 0 0.0Accounted with equity method 0 0 0 0.0 0 0 0 0.0Non-consolidated joint ventures 0 0 0 0.0 0 0 0 0.0
Financial joint ventures 0 0 0 0.0 0 0 0 0.0Non-financial joint ventures 0 0 0 0.0 0 0 0 0.0
Recivables From Leasing Transactions 0 0 0 0.0 0 0 0 0.0Finance lease receivables 0 0 0 0.0 0 0 0 0.0Operational leasing receivables 0 0 0 0.0 0 0 0 0.0Others 0 0 0 0.0 0 0 0 0.0Unearned income (-) 0 0 0 0.0 0 0 0 0.0
Derivative Financial Assets Held for Hedging 0 0 0 0.0 0 0 0 0.0Fair value hedges 0 0 0 0.0 0 0 0 0.0Cash flow hedges 0 0 0 0.0 0 0 0 0.0Hedges for invest. made in foreign countries 0 0 0 0.0 0 0 0 0.0
Property and Equipment (Net) 2 0 2 6.0 2 0 2 6.3Intangible Assets (Net) 0 0 0 0.1 0 0 0 0.1
Goodwill 0 0 0 0.0 0 0 0 0.0Other 0 0 0 0.1 0 0 0 0.1
Real Estates for Investment Purpose (Net) 0 0 0 0.0 0 0 0 0.0Assets for Tax 0 0 0 0.0 0 0 0 0.0
Current assets for tax 0 0 0 0.0 0 0 0 0.0Deferred assets for tax 0 0 0 0.0 0 0 0 0.0
Prop.&Equ.for Sale p. and from Term.Op.(Net) 0 0 0 0.0 0 0 0 0.0Other Assets 0 0 0 0.1 0 0 0 0.1
Total Assets 33 0 33 100.0 34 0 34 100.0
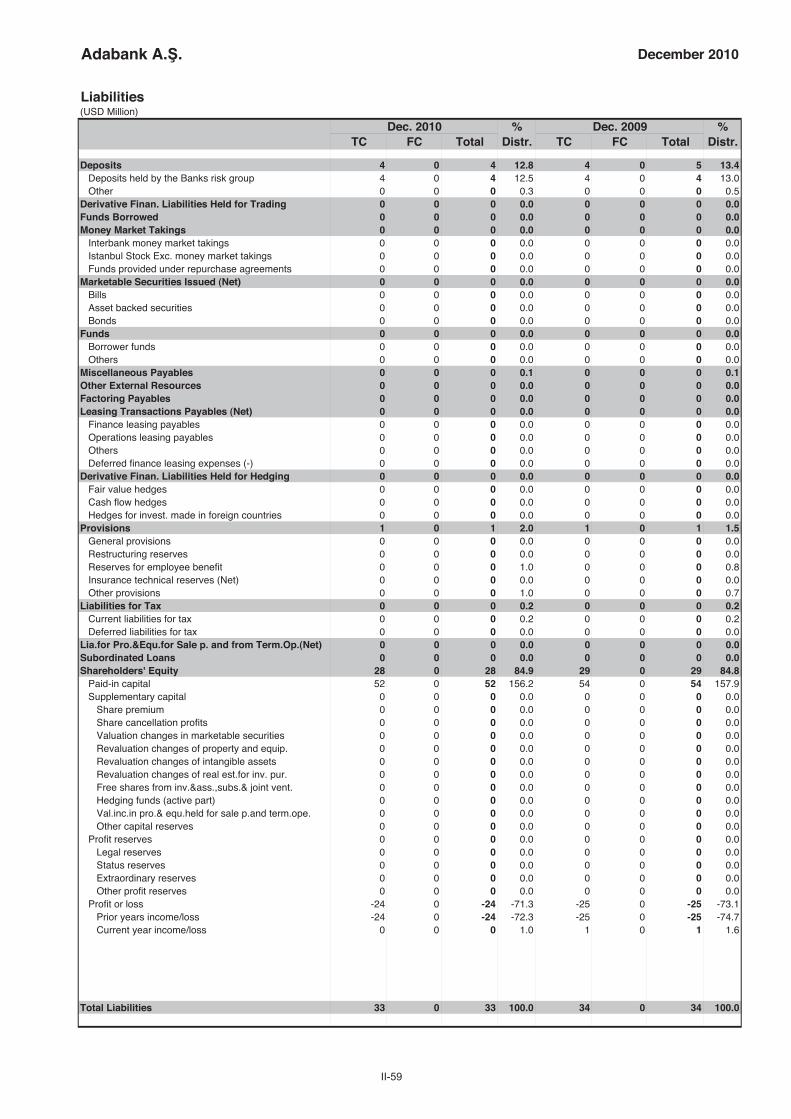
II-59
Adabank A. . December 2010
Liabilities(USD Million)
Dec. 2010 % Dec. 2009 %TC FC Total Distr. TC FC Total Distr.
Deposits 4 0 4 12.8 4 0 5 13.4Deposits held by the Banks risk group 4 0 4 12.5 4 0 4 13.0Other 0 0 0 0.3 0 0 0 0.5
Derivative Finan. Liabilities Held for Trading 0 0 0 0.0 0 0 0 0.0Funds Borrowed 0 0 0 0.0 0 0 0 0.0Money Market Takings 0 0 0 0.0 0 0 0 0.0
Interbank money market takings 0 0 0 0.0 0 0 0 0.0Istanbul Stock Exc. money market takings 0 0 0 0.0 0 0 0 0.0Funds provided under repurchase agreements 0 0 0 0.0 0 0 0 0.0
Marketable Securities Issued (Net) 0 0 0 0.0 0 0 0 0.0Bills 0 0 0 0.0 0 0 0 0.0Asset backed securities 0 0 0 0.0 0 0 0 0.0Bonds 0 0 0 0.0 0 0 0 0.0
Funds 0 0 0 0.0 0 0 0 0.0Borrower funds 0 0 0 0.0 0 0 0 0.0Others 0 0 0 0.0 0 0 0 0.0
Miscellaneous Payables 0 0 0 0.1 0 0 0 0.1Other External Resources 0 0 0 0.0 0 0 0 0.0Factoring Payables 0 0 0 0.0 0 0 0 0.0Leasing Transactions Payables (Net) 0 0 0 0.0 0 0 0 0.0
Finance leasing payables 0 0 0 0.0 0 0 0 0.0Operations leasing payables 0 0 0 0.0 0 0 0 0.0Others 0 0 0 0.0 0 0 0 0.0Deferred finance leasing expenses (-) 0 0 0 0.0 0 0 0 0.0
Derivative Finan. Liabilities Held for Hedging 0 0 0 0.0 0 0 0 0.0Fair value hedges 0 0 0 0.0 0 0 0 0.0Cash flow hedges 0 0 0 0.0 0 0 0 0.0Hedges for invest. made in foreign countries 0 0 0 0.0 0 0 0 0.0
Provisions 1 0 1 2.0 1 0 1 1.5General provisions 0 0 0 0.0 0 0 0 0.0Restructuring reserves 0 0 0 0.0 0 0 0 0.0Reserves for employee benefit 0 0 0 1.0 0 0 0 0.8Insurance technical reserves (Net) 0 0 0 0.0 0 0 0 0.0Other provisions 0 0 0 1.0 0 0 0 0.7
Liabilities for Tax 0 0 0 0.2 0 0 0 0.2Current liabilities for tax 0 0 0 0.2 0 0 0 0.2Deferred liabilities for tax 0 0 0 0.0 0 0 0 0.0
Lia.for Pro.&Equ.for Sale p. and from Term.Op.(Net) 0 0 0 0.0 0 0 0 0.0Subordinated Loans 0 0 0 0.0 0 0 0 0.0Shareholders' Equity 28 0 28 84.9 29 0 29 84.8
Paid-in capital 52 0 52 156.2 54 0 54 157.9Supplementary capital 0 0 0 0.0 0 0 0 0.0
Share premium 0 0 0 0.0 0 0 0 0.0Share cancellation profits 0 0 0 0.0 0 0 0 0.0Valuation changes in marketable securities 0 0 0 0.0 0 0 0 0.0Revaluation changes of property and equip. 0 0 0 0.0 0 0 0 0.0Revaluation changes of intangible assets 0 0 0 0.0 0 0 0 0.0Revaluation changes of real est.for inv. pur. 0 0 0 0.0 0 0 0 0.0Free shares from inv.&ass.,subs.& joint vent. 0 0 0 0.0 0 0 0 0.0Hedging funds (active part) 0 0 0 0.0 0 0 0 0.0Val.inc.in pro.& equ.held for sale p.and term.ope. 0 0 0 0.0 0 0 0 0.0Other capital reserves 0 0 0 0.0 0 0 0 0.0
Profit reserves 0 0 0 0.0 0 0 0 0.0Legal reserves 0 0 0 0.0 0 0 0 0.0Status reserves 0 0 0 0.0 0 0 0 0.0Extraordinary reserves 0 0 0 0.0 0 0 0 0.0Other profit reserves 0 0 0 0.0 0 0 0 0.0
Profit or loss -24 0 -24 -71.3 -25 0 -25 -73.1Prior years income/loss -24 0 -24 -72.3 -25 0 -25 -74.7Current year income/loss 0 0 0 1.0 1 0 1 1.6
Total Liabilities 33 0 33 100.0 34 0 34 100.0

II-60
Adabank A. .
Off Balance Sheet Commitments(USD Million)
Dec. 2010 Dec. 2009TC FC Total TC FC Total
Guarantees and Warranties 3 5 9 4 8 12Letters of guarantee 3 5 9 4 8 12Bank acceptances 0 0 0 0 0 0Letters of credit 0 0 0 0 0 0Prefinancing given as guarantee 0 0 0 0 0 0Endorsements 0 0 0 0 0 0Other guarantees and warrantees 0 0 0 0 0 0
Commitments 0 0 0 1 0 1Irrevocable commitments 0 0 0 1 0 1Revocable commitments 0 0 0 0 0 0
Derivative Financial Instruments 0 0 0 0 0 0Derivative finan. instruments held for hedging 0 0 0 0 0 0Trading transactions 0 0 0 0 0 0
Custody and Pledged Securities 0 0 0 0 0 0Items held in Custody 0 0 0 0 0 0Pledged Items 0 0 0 0 0 0Acccepted independent guaran. and warran. 0 0 0 0 0 0
Total Off Balance Sheet Commitments 3 5 9 5 8 12
Income-Expenditure(USD Million)
Dec. 2010 Dec. 2009
Interest Income 2 4Interest on loans 0 0Interest received from reserve deposits 0 0Interest received from banks 1 0Interest received from money market transactions 0 1Interest received from marketable securities portfolio 1 3Other interest income 0 0
Interest Expenses 0 0Interest on deposits 0 0Interest on money market transactions 0 0Interest on funds borrowed 0 0Interest on securities issued 0 0Other interest expenses 0 0
Net Interest Income/Expenses 2 3Net Fees and Commissions Income/Expenses 0 0
Fees and commissions received 0 0Fees and commissions paid 0 0
Dividend Income 0 0Trading Profit/Loss (net) 0 0
Profit/loss on trading account securities 0 0Profit/losses on derivative financial transactions 0 0Foreign exchange profit/loss 0 0
Other Operating Income 1 0Total Operating Income/Expenses 3 4Provision for Loan Losses or other Receivables (-) 0 0
Specific provisions of banks loans and other receivables* 0 0General provision expenses* 0 0
Other Operating Expenses (-) 3 3Personnel Expenses* 1 1
Net Operating Profit/Loss 0 1Surplus written as gain after merger 0 0Profit/losses from equity method applied subsidiaries 0 0Net monetory position gain/loss 0 0Profit/Loss Before Taxes from Continuing Operations 0 1Provisions for Taxes on Income from Continuing Operations (±) 0 0Net Profit/Loss from Continuing Operations 0 1Net Profit/Loss Before Taxes from Terminated Operations 0 0Provisions for Taxes on Income from Terminated Operations (±) 0 0Net Profit/Loss from Terminated Operations 0 0
Net Profit/Losses 0 1
* Used from information and disclosures related to income statement".

II-61
Adabank A. . December 2010
Ratios(%)
Dec. 2010 Dec. 2009
Capital Ratios
Shareholders’ Equity / (Amount subject to credit + market + operational risk) 150.6 185.9
Shareholders' Equity / Total Assets 84.9 84.8
(Shareholders' Equity - Permanent Assets) / Total Assets 78.9 78.4
Net On Balance Sheet Position / Total Shareholders' Equity 0.9 0.6
Net On and Off Balance Sheet Position / Total Shareholders' Equity 0.9 0.6
Balance-Sheet Ratios
TC Assets / Total Assets 99.1 99.1
TC Liabilities / Total Liabilities 99.8 99.6
FC Assets / FC Liabilities 442.2 241.8
TC Deposits / Total Deposits 98.3 97.1
TC Loans / Total Loans and Receivables - -
Total Deposits / Total Assets 12.8 13.4
Funds Borrowed / Total Assets 0.0 0.0
Assets Quality
Financial Assets (net) / Total Assets 2.0 80.6
Total Loans and Receivables / Total Assets 0.0 0.0
Total Loans and Receivables / Total Deposits 0.0 0.0
Loans Under Follow-up (gross) / Total Loans and Receivables - -
Loans Under Follow-up (net) / Total Loans and Receivables - -
Specific Provisions / Loans Under Follow-up 100.0 100.0
Permanent Assets / Total Assets 6.0 6.4
Consumer Loans / Total Loans and Receivables - -
Liquidity
Liquid Assets / Total Assets 93.9 93.6
Liquid Assets / Short-term Liabilities 726.7 698.1
TC Liquid Assets / Total Assets 93.0 92.6
Profitability
Net Profit/Losses / Total Assets 1.0 1.6
Net Profit/Losses / Total Shareholders' Equity 1.2 1.9
Profit/Losses Before Taxes after Continuing Operations / Total Assets 1.0 1.6
Income-Expenditure Structure
Net Interest Income After Specific Provisions / Total Assets 6.4 9.5
Net Interest Income After Specific Provisions / Total Operating Income (Expenses) 63.1 88.5
Non-interest Income (net) / Total Assets 3.7 0.8
Other Operating Expenses / Total Assets 9.1 8.7
Personnel Expenses / Other Operating Expenses 38.1 41.2
Non-interest Income (net) / Other Operating Expenses 41.1 9.1
Quarterly profitability and income-expenditure ratios, except year-end figures, should be considered periodically.
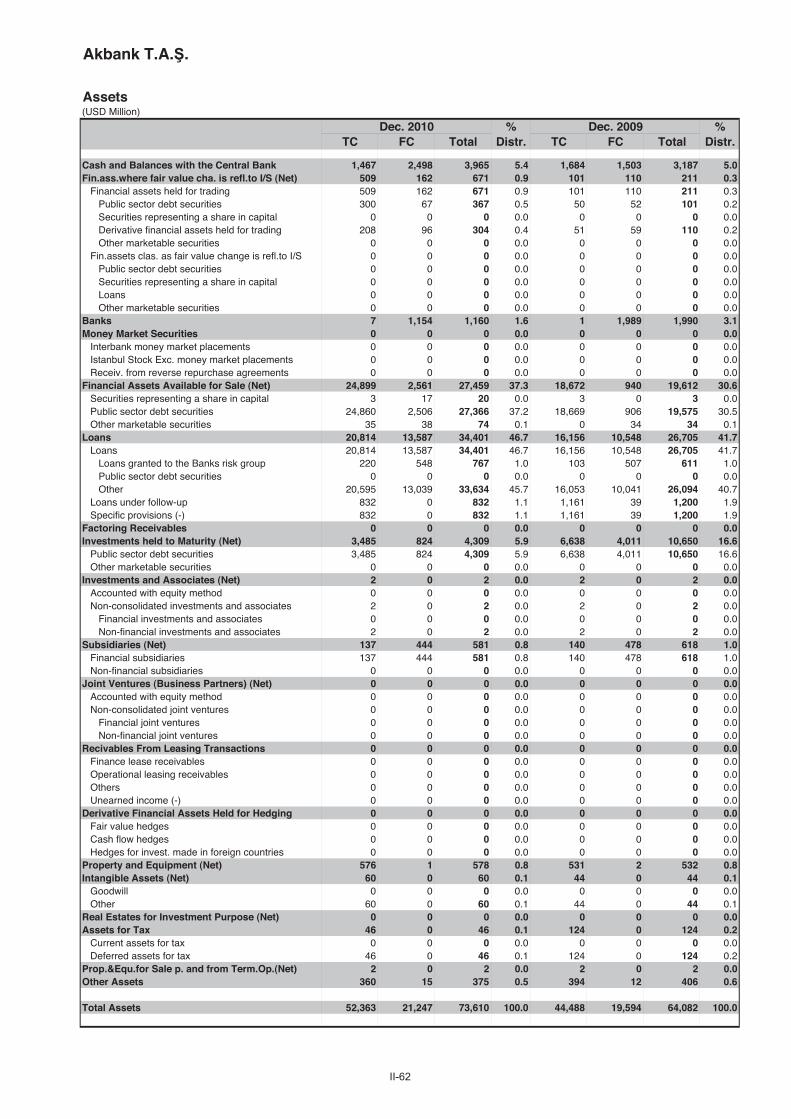
II-62
Akbank T.A. .
Assets(USD Million)
Dec. 2010 % Dec. 2009 %TC FC Total Distr. TC FC Total Distr.
Cash and Balances with the Central Bank 1,467 2,498 3,965 5.4 1,684 1,503 3,187 5.0Fin.ass.where fair value cha. is refl.to I/S (Net) 509 162 671 0.9 101 110 211 0.3
Financial assets held for trading 509 162 671 0.9 101 110 211 0.3Public sector debt securities 300 67 367 0.5 50 52 101 0.2Securities representing a share in capital 0 0 0 0.0 0 0 0 0.0Derivative financial assets held for trading 208 96 304 0.4 51 59 110 0.2Other marketable securities 0 0 0 0.0 0 0 0 0.0
Fin.assets clas. as fair value change is refl.to I/S 0 0 0 0.0 0 0 0 0.0Public sector debt securities 0 0 0 0.0 0 0 0 0.0Securities representing a share in capital 0 0 0 0.0 0 0 0 0.0Loans 0 0 0 0.0 0 0 0 0.0Other marketable securities 0 0 0 0.0 0 0 0 0.0
Banks 7 1,154 1,160 1.6 1 1,989 1,990 3.1Money Market Securities 0 0 0 0.0 0 0 0 0.0
Interbank money market placements 0 0 0 0.0 0 0 0 0.0Istanbul Stock Exc. money market placements 0 0 0 0.0 0 0 0 0.0Receiv. from reverse repurchase agreements 0 0 0 0.0 0 0 0 0.0
Financial Assets Available for Sale (Net) 24,899 2,561 27,459 37.3 18,672 940 19,612 30.6Securities representing a share in capital 3 17 20 0.0 3 0 3 0.0Public sector debt securities 24,860 2,506 27,366 37.2 18,669 906 19,575 30.5Other marketable securities 35 38 74 0.1 0 34 34 0.1
Loans 20,814 13,587 34,401 46.7 16,156 10,548 26,705 41.7Loans 20,814 13,587 34,401 46.7 16,156 10,548 26,705 41.7
Loans granted to the Banks risk group 220 548 767 1.0 103 507 611 1.0Public sector debt securities 0 0 0 0.0 0 0 0 0.0Other 20,595 13,039 33,634 45.7 16,053 10,041 26,094 40.7
Loans under follow-up 832 0 832 1.1 1,161 39 1,200 1.9Specific provisions (-) 832 0 832 1.1 1,161 39 1,200 1.9
Factoring Receivables 0 0 0 0.0 0 0 0 0.0Investments held to Maturity (Net) 3,485 824 4,309 5.9 6,638 4,011 10,650 16.6
Public sector debt securities 3,485 824 4,309 5.9 6,638 4,011 10,650 16.6Other marketable securities 0 0 0 0.0 0 0 0 0.0
Investments and Associates (Net) 2 0 2 0.0 2 0 2 0.0Accounted with equity method 0 0 0 0.0 0 0 0 0.0Non-consolidated investments and associates 2 0 2 0.0 2 0 2 0.0
Financial investments and associates 0 0 0 0.0 0 0 0 0.0Non-financial investments and associates 2 0 2 0.0 2 0 2 0.0
Subsidiaries (Net) 137 444 581 0.8 140 478 618 1.0Financial subsidiaries 137 444 581 0.8 140 478 618 1.0Non-financial subsidiaries 0 0 0 0.0 0 0 0 0.0
Joint Ventures (Business Partners) (Net) 0 0 0 0.0 0 0 0 0.0Accounted with equity method 0 0 0 0.0 0 0 0 0.0Non-consolidated joint ventures 0 0 0 0.0 0 0 0 0.0
Financial joint ventures 0 0 0 0.0 0 0 0 0.0Non-financial joint ventures 0 0 0 0.0 0 0 0 0.0
Recivables From Leasing Transactions 0 0 0 0.0 0 0 0 0.0Finance lease receivables 0 0 0 0.0 0 0 0 0.0Operational leasing receivables 0 0 0 0.0 0 0 0 0.0Others 0 0 0 0.0 0 0 0 0.0Unearned income (-) 0 0 0 0.0 0 0 0 0.0
Derivative Financial Assets Held for Hedging 0 0 0 0.0 0 0 0 0.0Fair value hedges 0 0 0 0.0 0 0 0 0.0Cash flow hedges 0 0 0 0.0 0 0 0 0.0Hedges for invest. made in foreign countries 0 0 0 0.0 0 0 0 0.0
Property and Equipment (Net) 576 1 578 0.8 531 2 532 0.8Intangible Assets (Net) 60 0 60 0.1 44 0 44 0.1
Goodwill 0 0 0 0.0 0 0 0 0.0Other 60 0 60 0.1 44 0 44 0.1
Real Estates for Investment Purpose (Net) 0 0 0 0.0 0 0 0 0.0Assets for Tax 46 0 46 0.1 124 0 124 0.2
Current assets for tax 0 0 0 0.0 0 0 0 0.0Deferred assets for tax 46 0 46 0.1 124 0 124 0.2
Prop.&Equ.for Sale p. and from Term.Op.(Net) 2 0 2 0.0 2 0 2 0.0Other Assets 360 15 375 0.5 394 12 406 0.6
Total Assets 52,363 21,247 73,610 100.0 44,488 19,594 64,082 100.0

II-63
Akbank T.A. . December 2010
Liabilities(USD Million)
Dec. 2010 % Dec. 2009 %TC FC Total Distr. TC FC Total Distr.
Deposits 27,340 16,343 43,683 59.3 23,233 14,319 37,552 58.6Deposits held by the Banks risk group 811 870 1,681 2.3 900 825 1,725 2.7Other 26,529 15,473 42,002 57.1 22,333 13,494 35,827 55.9
Derivative Finan. Liabilities Held for Trading 118 136 254 0.3 125 79 204 0.3Funds Borrowed 170 6,578 6,748 9.2 92 5,389 5,481 8.6Money Market Takings 6,891 400 7,291 9.9 8,445 586 9,031 14.1
Interbank money market takings 0 0 0 0.0 0 135 135 0.2Istanbul Stock Exc. money market takings 0 0 0 0.0 0 0 0 0.0Funds provided under repurchase agreements 6,891 400 7,291 9.9 8,445 451 8,895 13.9
Marketable Securities Issued (Net) 629 1,012 1,640 2.2 0 0 0 0.0Bills 629 0 629 0.9 0 0 0 0.0Asset backed securities 0 0 0 0.0 0 0 0 0.0Bonds 0 1,012 1,012 1.4 0 0 0 0.0
Funds 0 0 0 0.0 0 0 0 0.0Borrower funds 0 0 0 0.0 0 0 0 0.0Others 0 0 0 0.0 0 0 0 0.0
Miscellaneous Payables 981 44 1,025 1.4 805 7 812 1.3Other External Resources 432 89 521 0.7 411 71 482 0.8Factoring Payables 0 0 0 0.0 0 0 0 0.0Leasing Transactions Payables (Net) 45 0 45 0.1 6 2 9 0.0
Finance leasing payables 59 0 59 0.1 9 2 11 0.0Operations leasing payables 0 0 0 0.0 0 0 0 0.0Others 0 0 0 0.0 0 0 0 0.0Deferred finance leasing expenses (-) 14 0 14 0.0 2 0 2 0.0
Derivative Finan. Liabilities Held for Hedging 201 0 201 0.3 263 0 263 0.4Fair value hedges 0 0 0 0.0 0 0 0 0.0Cash flow hedges 201 0 201 0.3 263 0 263 0.4Hedges for invest. made in foreign countries 0 0 0 0.0 0 0 0 0.0
Provisions 400 135 534 0.7 381 110 491 0.8General provisions 184 135 318 0.4 139 110 248 0.4Restructuring reserves 0 0 0 0.0 0 0 0 0.0Reserves for employee benefit 46 0 46 0.1 39 0 39 0.1Insurance technical reserves (Net) 0 0 0 0.0 0 0 0 0.0Other provisions 170 0 170 0.2 203 0 203 0.3
Liabilities for Tax 239 4 243 0.3 208 9 217 0.3Current liabilities for tax 239 4 243 0.3 208 9 217 0.3Deferred liabilities for tax 0 0 0 0.0 0 0 0 0.0
Lia.for Pro.&Equ.for Sale p. and from Term.Op.(Net) 0 0 0 0.0 0 0 0 0.0Subordinated Loans 0 0 0 0.0 0 0 0 0.0Shareholders' Equity 11,403 21 11,424 15.5 9,567 -26 9,541 14.9
Paid-in capital 2,601 0 2,601 3.5 2,017 0 2,017 3.1Supplementary capital 2,973 21 2,994 4.1 2,755 -26 2,730 4.3
Share premium 1,106 0 1,106 1.5 1,143 0 1,143 1.8Share cancellation profits 0 0 0 0.0 0 0 0 0.0Valuation changes in marketable securities 1,122 40 1,162 1.6 539 -6 533 0.8Revaluation changes of property and equip. 2 0 2 0.0 12 0 12 0.0Revaluation changes of intangible assets 0 0 0 0.0 0 0 0 0.0Revaluation changes of real est.for inv. pur. 0 0 0 0.0 0 0 0 0.0Free shares from inv.&ass.,subs.& joint vent. 0 0 0 0.0 0 0 0 0.0Hedging funds (active part) -170 -19 -190 -0.3 -220 -20 -239 -0.4Val.inc.in pro.& equ.held for sale p.and term.ope. 0 0 0 0.0 0 0 0 0.0Other capital reserves 914 0 914 1.2 1,281 0 1,281 2.0
Profit reserves 3,970 0 3,970 5.4 2,962 0 2,962 4.6Legal reserves 600 0 600 0.8 525 0 525 0.8Status reserves 0 0 0 0.0 0 0 0 0.0Extraordinary reserves 3,371 0 3,371 4.6 2,436 0 2,436 3.8Other profit reserves 0 0 0 0.0 0 0 0 0.0
Profit or loss 1,858 0 1,858 2.5 1,833 0 1,833 2.9Prior years income/loss 0 0 0 0.0 0 0 0 0.0Current year income/loss 1,858 0 1,858 2.5 1,833 0 1,833 2.9
Total Liabilities 48,849 24,761 73,610 100.0 43,536 20,546 64,082 100.0

II-64
Akbank T.A. .
Off Balance Sheet Commitments(USD Million)
Dec. 2010 Dec. 2009TC FC Total TC FC Total
Guarantees and Warranties 2,989 3,751 6,741 2,060 3,154 5,215Letters of guarantee 2,636 1,636 4,272 1,893 1,813 3,706Bank acceptances 1 45 46 0 40 40Letters of credit 9 1,788 1,797 1 1,115 1,116Prefinancing given as guarantee 0 0 0 0 0 0Endorsements 0 0 0 0 0 0Other guarantees and warrantees 344 283 627 166 187 353
Commitments 14,634 2,873 17,507 11,390 2,934 14,325Irrevocable commitments 14,634 2,873 17,507 11,390 2,934 14,325Revocable commitments 0 0 0 0 0 0
Derivative Financial Instruments 8,475 18,541 27,016 5,310 11,357 16,667Derivative finan. instruments held for hedging 3,310 0 3,310 3,422 0 3,422Trading transactions 5,165 18,541 23,705 1,888 11,357 13,245
Custody and Pledged Securities 39,754 12,838 52,591 34,987 9,079 44,067Items held in Custody 14,670 1,815 16,485 10,572 1,243 11,816Pledged Items 22,914 10,939 33,852 22,931 7,793 30,724Acccepted independent guaran. and warran. 2,170 84 2,254 1,484 43 1,527
Total Off Balance Sheet Commitments 65,852 38,003 103,855 53,748 26,525 80,274
Income-Expenditure(USD Million)
Dec. 2010 Dec. 2009
Interest Income 5,616 6,156Interest on loans 2,662 3,267Interest received from reserve deposits 0 0Interest received from banks 56 92Interest received from money market transactions 0 0Interest received from marketable securities portfolio 2,896 2,792Other interest income 3 4
Interest Expenses 2,835 3,067Interest on deposits 2,295 2,379Interest on money market transactions 125 181Interest on funds borrowed 384 501Interest on securities issued 25 0Other interest expenses 6 6
Net Interest Income/Expenses 2,781 3,088Net Fees and Commissions Income/Expenses 851 861
Fees and commissions received 995 1,003Fees and commissions paid 143 142
Dividend Income 18 29Trading Profit/Loss (net) 21 104
Profit/loss on trading account securities 277 169Profit/losses on derivative financial transactions -285 -115Foreign exchange profit/loss 29 51
Other Operating Income 562 353Total Operating Income/Expenses 4,234 4,435Provision for Loan Losses or other Receivables (-) 337 751
Specific provisions of banks loans and other receivables* 226 668General provision expenses* 78 0
Other Operating Expenses (-) 1,572 1,468Personnel Expenses* 571 550
Net Operating Profit/Loss 2,324 2,216Surplus written as gain after merger 0 0Profit/losses from equity method applied subsidiaries 0 0Net monetory position gain/loss 0 0Profit/Loss Before Taxes from Continuing Operations 2,324 2,216Provisions for Taxes on Income from Continuing Operations (±) -467 -383Net Profit/Loss from Continuing Operations 1,858 1,833Net Profit/Loss Before Taxes from Terminated Operations 0 0Provisions for Taxes on Income from Terminated Operations (±) 0 0Net Profit/Loss from Terminated Operations 0 0
Net Profit/Losses 1,858 1,833
* Used from information and disclosures related to income statement".

II-65
Akbank T.A. . December 2010
Ratios(%)
Dec. 2010 Dec. 2009
Capital Ratios
Shareholders’ Equity / (Amount subject to credit + market + operational risk) 20.6 22.5
Shareholders' Equity / Total Assets 15.5 14.9
(Shareholders' Equity - Permanent Assets) / Total Assets 13.9 13.0
Net On Balance Sheet Position / Total Shareholders' Equity -25.1 -4.0
Net On and Off Balance Sheet Position / Total Shareholders' Equity 0.2 -0.7
Balance-Sheet Ratios
TC Assets / Total Assets 71.1 69.4
TC Liabilities / Total Liabilities 66.4 67.9
FC Assets / FC Liabilities 85.8 95.4
TC Deposits / Total Deposits 62.6 61.9
TC Loans / Total Loans and Receivables 60.5 60.5
Total Deposits / Total Assets 59.3 58.6
Funds Borrowed / Total Assets 9.2 8.6
Assets Quality
Financial Assets (net) / Total Assets 44.1 47.6
Total Loans and Receivables / Total Assets 46.7 41.7
Total Loans and Receivables / Total Deposits 78.8 71.1
Loans Under Follow-up (gross) / Total Loans and Receivables 2.4 4.5
Loans Under Follow-up (net) / Total Loans and Receivables 0.0 0.0
Specific Provisions / Loans Under Follow-up 100.0 100.0
Permanent Assets / Total Assets 1.7 1.9
Consumer Loans / Total Loans and Receivables 37.3 37.8
Liquidity
Liquid Assets / Total Assets 45.2 39.0
Liquid Assets / Short-term Liabilities 79.3 63.3
TC Liquid Assets / Total Assets 36.5 31.9
Profitability
Net Profit/Losses / Total Assets 2.5 2.9
Net Profit/Losses / Total Shareholders' Equity 16.3 19.2
Profit/Losses Before Taxes after Continuing Operations / Total Assets 3.2 3.5
Income-Expenditure Structure
Net Interest Income After Specific Provisions / Total Assets 3.5 3.8
Net Interest Income After Specific Provisions / Total Operating Income (Expenses) 60.4 54.6
Non-interest Income (net) / Total Assets 2.0 2.1
Other Operating Expenses / Total Assets 2.1 2.3
Personnel Expenses / Other Operating Expenses 36.3 37.4
Non-interest Income (net) / Other Operating Expenses 92.4 91.7
Quarterly profitability and income-expenditure ratios, except year-end figures, should be considered periodically.

II-66
Alternatif Bank A. .
Assets(USD Million)
Dec. 2010 % Dec. 2009 %TC FC Total Distr. TC FC Total Distr.
Cash and Balances with the Central Bank 42 108 150 5.4 61 82 144 5.9Fin.ass.where fair value cha. is refl.to I/S (Net) 115 3 117 4.2 5 2 7 0.3
Financial assets held for trading 115 3 117 4.2 5 2 7 0.3Public sector debt securities 114 0 114 4.1 2 0 2 0.1Securities representing a share in capital 0 0 0 0.0 0 0 0 0.0Derivative financial assets held for trading 1 2 3 0.1 3 2 5 0.2Other marketable securities 0 0 0 0.0 0 0 0 0.0
Fin.assets clas. as fair value change is refl.to I/S 0 0 0 0.0 0 0 0 0.0Public sector debt securities 0 0 0 0.0 0 0 0 0.0Securities representing a share in capital 0 0 0 0.0 0 0 0 0.0Loans 0 0 0 0.0 0 0 0 0.0Other marketable securities 0 0 0 0.0 0 0 0 0.0
Banks 1 31 32 1.2 5 33 38 1.5Money Market Securities 0 0 0 0.0 0 0 0 0.0
Interbank money market placements 0 0 0 0.0 0 0 0 0.0Istanbul Stock Exc. money market placements 0 0 0 0.0 0 0 0 0.0Receiv. from reverse repurchase agreements 0 0 0 0.0 0 0 0 0.0
Financial Assets Available for Sale (Net) 0 0 0 0.0 21 0 21 0.9Securities representing a share in capital 0 0 0 0.0 0 0 0 0.0Public sector debt securities 0 0 0 0.0 21 0 21 0.9Other marketable securities 0 0 0 0.0 0 0 0 0.0
Loans 1,727 384 2,111 76.2 1,533 300 1,833 75.1Loans 1,668 384 2,052 74.1 1,484 300 1,784 73.1
Loans granted to the Banks risk group 12 0 12 0.4 4 0 4 0.2Public sector debt securities 0 0 0 0.0 0 0 0 0.0Other 1,656 384 2,040 73.6 1,480 300 1,780 73.0
Loans under follow-up 98 0 98 3.5 130 0 130 5.3Specific provisions (-) 39 0 39 1.4 81 0 81 3.3
Factoring Receivables 0 0 0 0.0 0 0 0 0.0Investments held to Maturity (Net) 254 0 254 9.2 320 0 320 13.1
Public sector debt securities 254 0 254 9.2 320 0 320 13.1Other marketable securities 0 0 0 0.0 0 0 0 0.0
Investments and Associates (Net) 0 0 0 0.0 0 0 0 0.0Accounted with equity method 0 0 0 0.0 0 0 0 0.0Non-consolidated investments and associates 0 0 0 0.0 0 0 0 0.0
Financial investments and associates 0 0 0 0.0 0 0 0 0.0Non-financial investments and associates 0 0 0 0.0 0 0 0 0.0
Subsidiaries (Net) 16 0 16 0.6 17 0 17 0.7Financial subsidiaries 16 0 16 0.6 17 0 17 0.7Non-financial subsidiaries 0 0 0 0.0 0 0 0 0.0
Joint Ventures (Business Partners) (Net) 0 0 0 0.0 0 0 0 0.0Accounted with equity method 0 0 0 0.0 0 0 0 0.0Non-consolidated joint ventures 0 0 0 0.0 0 0 0 0.0
Financial joint ventures 0 0 0 0.0 0 0 0 0.0Non-financial joint ventures 0 0 0 0.0 0 0 0 0.0
Recivables From Leasing Transactions 0 0 0 0.0 0 0 0 0.0Finance lease receivables 0 0 0 0.0 0 0 0 0.0Operational leasing receivables 0 0 0 0.0 0 0 0 0.0Others 0 0 0 0.0 0 0 0 0.0Unearned income (-) 0 0 0 0.0 0 0 0 0.0
Derivative Financial Assets Held for Hedging 0 0 0 0.0 0 0 0 0.0Fair value hedges 0 0 0 0.0 0 0 0 0.0Cash flow hedges 0 0 0 0.0 0 0 0 0.0Hedges for invest. made in foreign countries 0 0 0 0.0 0 0 0 0.0
Property and Equipment (Net) 12 0 12 0.4 11 0 11 0.5Intangible Assets (Net) 2 0 2 0.1 2 0 2 0.1
Goodwill 0 0 0 0.0 0 0 0 0.0Other 2 0 2 0.1 2 0 2 0.1
Real Estates for Investment Purpose (Net) 0 0 0 0.0 0 0 0 0.0Assets for Tax 4 0 4 0.1 3 0 3 0.1
Current assets for tax 0 0 0 0.0 0 0 0 0.0Deferred assets for tax 4 0 4 0.1 3 0 3 0.1
Prop.&Equ.for Sale p. and from Term.Op.(Net) 19 0 19 0.7 19 0 19 0.8Other Assets 45 8 53 1.9 23 2 25 1.0
Total Assets 2,236 533 2,770 100.0 2,021 419 2,440 100.0

II-67
Alternatif Bank A. . December 2010
Liabilities(USD Million)
Dec. 2010 % Dec. 2009 %TC FC Total Distr. TC FC Total Distr.
Deposits 1,007 581 1,588 57.3 1,012 702 1,713 70.2Deposits held by the Banks risk group 240 74 314 11.3 248 102 350 14.3Other 767 507 1,274 46.0 764 600 1,364 55.9
Derivative Finan. Liabilities Held for Trading 8 2 10 0.4 4 2 6 0.2Funds Borrowed 17 401 418 15.1 26 241 267 10.9Money Market Takings 191 0 191 6.9 59 0 59 2.4
Interbank money market takings 0 0 0 0.0 0 0 0 0.0Istanbul Stock Exc. money market takings 0 0 0 0.0 0 0 0 0.0Funds provided under repurchase agreements 191 0 191 6.9 59 0 59 2.4
Marketable Securities Issued (Net) 0 0 0 0.0 0 0 0 0.0Bills 0 0 0 0.0 0 0 0 0.0Asset backed securities 0 0 0 0.0 0 0 0 0.0Bonds 0 0 0 0.0 0 0 0 0.0
Funds 0 0 0 0.0 0 0 0 0.0Borrower funds 0 0 0 0.0 0 0 0 0.0Others 0 0 0 0.0 0 0 0 0.0
Miscellaneous Payables 39 35 74 2.7 25 13 38 1.6Other External Resources 38 3 41 1.5 24 0 24 1.0Factoring Payables 0 0 0 0.0 0 0 0 0.0Leasing Transactions Payables (Net) 0 1 1 0.0 0 2 2 0.1
Finance leasing payables 0 1 1 0.0 0 2 2 0.1Operations leasing payables 0 0 0 0.0 0 0 0 0.0Others 0 0 0 0.0 0 0 0 0.0Deferred finance leasing expenses (-) 0 0 0 0.0 0 0 0 0.0
Derivative Finan. Liabilities Held for Hedging 0 0 0 0.0 0 0 0 0.0Fair value hedges 0 0 0 0.0 0 0 0 0.0Cash flow hedges 0 0 0 0.0 0 0 0 0.0Hedges for invest. made in foreign countries 0 0 0 0.0 0 0 0 0.0
Provisions 34 0 34 1.2 32 0 32 1.3General provisions 18 0 18 0.6 14 0 14 0.6Restructuring reserves 0 0 0 0.0 0 0 0 0.0Reserves for employee benefit 4 0 4 0.1 3 0 3 0.1Insurance technical reserves (Net) 0 0 0 0.0 0 0 0 0.0Other provisions 13 0 13 0.5 14 0 14 0.6
Liabilities for Tax 5 0 5 0.2 6 0 6 0.2Current liabilities for tax 5 0 5 0.2 6 0 6 0.2Deferred liabilities for tax 0 0 0 0.0 0 0 0 0.0
Lia.for Pro.&Equ.for Sale p. and from Term.Op.(Net) 0 2 2 0.1 0 1 1 0.0Subordinated Loans 0 106 106 3.8 0 0 0 0.0Shareholders' Equity 301 0 301 10.9 292 0 292 12.0
Paid-in capital 195 0 195 7.0 202 0 202 8.3Supplementary capital 0 0 0 0.0 0 0 0 0.0
Share premium 0 0 0 0.0 0 0 0 0.0Share cancellation profits 0 0 0 0.0 0 0 0 0.0Valuation changes in marketable securities 0 0 0 0.0 0 0 0 0.0Revaluation changes of property and equip. 0 0 0 0.0 0 0 0 0.0Revaluation changes of intangible assets 0 0 0 0.0 0 0 0 0.0Revaluation changes of real est.for inv. pur. 0 0 0 0.0 0 0 0 0.0Free shares from inv.&ass.,subs.& joint vent. 0 0 0 0.0 0 0 0 0.0Hedging funds (active part) 0 0 0 0.0 0 0 0 0.0Val.inc.in pro.& equ.held for sale p.and term.ope. 0 0 0 0.0 0 0 0 0.0Other capital reserves 0 0 0 0.0 0 0 0 0.0
Profit reserves 84 0 84 3.0 48 0 48 2.0Legal reserves 4 0 4 0.2 2 0 2 0.1Status reserves 0 0 0 0.0 0 0 0 0.0Extraordinary reserves 80 0 80 2.9 46 0 46 1.9Other profit reserves 0 0 0 0.0 0 0 0 0.0
Profit or loss 21 0 21 0.8 42 0 42 1.7Prior years income/loss 3 0 3 0.1 1 0 1 0.0Current year income/loss 18 0 18 0.7 41 0 41 1.7
Total Liabilities 1,640 1,130 2,770 100.0 1,479 960 2,440 100.0

II-68
Alternatif Bank A. .
Off Balance Sheet Commitments(USD Million)
Dec. 2010 Dec. 2009TC FC Total TC FC Total
Guarantees and Warranties 634 616 1,251 534 524 1,058Letters of guarantee 631 248 879 528 277 805Bank acceptances 3 125 128 0 79 79Letters of credit 0 229 229 6 159 165Prefinancing given as guarantee 0 0 0 0 0 0Endorsements 0 0 0 0 0 0Other guarantees and warrantees 0 14 14 0 9 9
Commitments 357 79 435 573 89 662Irrevocable commitments 357 79 435 573 89 662Revocable commitments 0 0 0 0 0 0
Derivative Financial Instruments 499 610 1,108 246 400 645Derivative finan. instruments held for hedging 0 0 0 0 0 0Trading transactions 499 610 1,108 246 400 645
Custody and Pledged Securities 2,807 522 3,329 2,639 492 3,131Items held in Custody 94 98 193 80 20 100Pledged Items 2,712 424 3,135 2,558 472 3,030Acccepted independent guaran. and warran. 1 0 1 1 0 1
Total Off Balance Sheet Commitments 4,296 1,827 6,123 3,991 1,505 5,496
Income-Expenditure(USD Million)
Dec. 2010 Dec. 2009
Interest Income 219 317Interest on loans 187 254Interest received from reserve deposits 0 4Interest received from banks 2 1Interest received from money market transactions 0 1Interest received from marketable securities portfolio 28 54Other interest income 3 4
Interest Expenses 110 156Interest on deposits 93 133Interest on money market transactions 11 14Interest on funds borrowed 6 8Interest on securities issued 0 0Other interest expenses 0 1
Net Interest Income/Expenses 109 161Net Fees and Commissions Income/Expenses 16 18
Fees and commissions received 18 24Fees and commissions paid 2 5
Dividend Income 0 0Trading Profit/Loss (net) -19 -12
Profit/loss on trading account securities -1 4Profit/losses on derivative financial transactions -28 -24Foreign exchange profit/loss 10 7
Other Operating Income 83 32Total Operating Income/Expenses 190 199Provision for Loan Losses or other Receivables (-) 37 75
Specific provisions of banks loans and other receivables* 21 49General provision expenses* 4 11
Other Operating Expenses (-) 131 72Personnel Expenses* 45 45
Net Operating Profit/Loss 23 52Surplus written as gain after merger 0 0Profit/losses from equity method applied subsidiaries 0 0Net monetory position gain/loss 0 0Profit/Loss Before Taxes from Continuing Operations 23 52Provisions for Taxes on Income from Continuing Operations (±) -4 -10Net Profit/Loss from Continuing Operations 18 41Net Profit/Loss Before Taxes from Terminated Operations 0 0Provisions for Taxes on Income from Terminated Operations (±) 0 0Net Profit/Loss from Terminated Operations 0 0
Net Profit/Losses 18 41
* Used from information and disclosures related to income statement".

II-69
Alternatif Bank A. . December 2010
Ratios(%)
Dec. 2010 Dec. 2009
Capital Ratios
Shareholders’ Equity / (Amount subject to credit + market + operational risk) 15.0 12.8
Shareholders' Equity / Total Assets 10.9 12.0
(Shareholders' Equity - Permanent Assets) / Total Assets 7.0 8.0
Net On Balance Sheet Position / Total Shareholders' Equity -68.0 -58.7
Net On and Off Balance Sheet Position / Total Shareholders' Equity -4.9 4.8
Balance-Sheet Ratios
TC Assets / Total Assets 80.7 82.8
TC Liabilities / Total Liabilities 59.2 60.6
FC Assets / FC Liabilities 47.2 43.7
TC Deposits / Total Deposits 63.4 59.0
TC Loans / Total Loans and Receivables 81.8 83.6
Total Deposits / Total Assets 57.3 70.2
Funds Borrowed / Total Assets 15.1 10.9
Assets Quality
Financial Assets (net) / Total Assets 13.4 14.2
Total Loans and Receivables / Total Assets 76.2 75.1
Total Loans and Receivables / Total Deposits 132.9 107.0
Loans Under Follow-up (gross) / Total Loans and Receivables 4.6 7.1
Loans Under Follow-up (net) / Total Loans and Receivables 2.8 2.6
Specific Provisions / Loans Under Follow-up 40.0 62.5
Permanent Assets / Total Assets 3.9 4.0
Consumer Loans / Total Loans and Receivables 0.8 0.2
Liquidity
Liquid Assets / Total Assets 10.8 8.6
Liquid Assets / Short-term Liabilities 20.2 15.8
TC Liquid Assets / Total Assets 5.7 3.8
Profitability
Net Profit/Losses / Total Assets 0.7 1.7
Net Profit/Losses / Total Shareholders' Equity 6.0 14.2
Profit/Losses Before Taxes after Continuing Operations / Total Assets 0.8 2.1
Income-Expenditure Structure
Net Interest Income After Specific Provisions / Total Assets 3.2 4.6
Net Interest Income After Specific Provisions / Total Operating Income (Expenses) 46.5 56.2
Non-interest Income (net) / Total Assets 2.9 1.5
Other Operating Expenses / Total Assets 4.7 3.0
Personnel Expenses / Other Operating Expenses 34.8 62.1
Non-interest Income (net) / Other Operating Expenses 61.9 52.5
Quarterly profitability and income-expenditure ratios, except year-end figures, should be considered periodically.

II-70
Anadolubank A. .
Assets(USD Million)
Dec. 2010 % Dec. 2009 %TC FC Total Distr. TC FC Total Distr.
Cash and Balances with the Central Bank 112 118 229 7.9 80 89 169 6.6Fin.ass.where fair value cha. is refl.to I/S (Net) 17 64 81 2.8 111 23 134 5.2
Financial assets held for trading 17 64 81 2.8 111 23 134 5.2Public sector debt securities 2 60 62 2.1 92 21 113 4.4Securities representing a share in capital 0 0 0 0.0 0 0 0 0.0Derivative financial assets held for trading 14 5 19 0.6 19 2 21 0.8Other marketable securities 0 0 0 0.0 0 0 0 0.0
Fin.assets clas. as fair value change is refl.to I/S 0 0 0 0.0 0 0 0 0.0Public sector debt securities 0 0 0 0.0 0 0 0 0.0Securities representing a share in capital 0 0 0 0.0 0 0 0 0.0Loans 0 0 0 0.0 0 0 0 0.0Other marketable securities 0 0 0 0.0 0 0 0 0.0
Banks 0 69 69 2.4 0 114 114 4.4Money Market Securities 0 0 0 0.0 0 0 0 0.0
Interbank money market placements 0 0 0 0.0 0 0 0 0.0Istanbul Stock Exc. money market placements 0 0 0 0.0 0 0 0 0.0Receiv. from reverse repurchase agreements 0 0 0 0.0 0 0 0 0.0
Financial Assets Available for Sale (Net) 0 0 0 0.0 0 0 0 0.0Securities representing a share in capital 0 0 0 0.0 0 0 0 0.0Public sector debt securities 0 0 0 0.0 0 0 0 0.0Other marketable securities 0 0 0 0.0 0 0 0 0.0
Loans 1,852 117 1,969 67.4 1,512 122 1,634 63.5Loans 1,843 117 1,960 67.1 1,502 122 1,624 63.1
Loans granted to the Banks risk group 6 0 6 0.2 20 5 24 0.9Public sector debt securities 0 0 0 0.0 0 0 0 0.0Other 1,837 117 1,953 66.9 1,483 117 1,600 62.1
Loans under follow-up 57 0 57 1.9 55 0 55 2.1Specific provisions (-) 48 0 48 1.6 45 0 45 1.7
Factoring Receivables 0 0 0 0.0 0 0 0 0.0Investments held to Maturity (Net) 143 293 436 14.9 211 199 409 15.9
Public sector debt securities 143 286 429 14.7 211 196 407 15.8Other marketable securities 0 7 7 0.3 0 2 2 0.1
Investments and Associates (Net) 0 0 0 0.0 0 0 0 0.0Accounted with equity method 0 0 0 0.0 0 0 0 0.0Non-consolidated investments and associates 0 0 0 0.0 0 0 0 0.0
Financial investments and associates 0 0 0 0.0 0 0 0 0.0Non-financial investments and associates 0 0 0 0.0 0 0 0 0.0
Subsidiaries (Net) 20 40 60 2.1 12 41 53 2.1Financial subsidiaries 20 40 60 2.1 12 41 53 2.1Non-financial subsidiaries 0 0 0 0.0 0 0 0 0.0
Joint Ventures (Business Partners) (Net) 0 0 0 0.0 0 0 0 0.0Accounted with equity method 0 0 0 0.0 0 0 0 0.0Non-consolidated joint ventures 0 0 0 0.0 0 0 0 0.0
Financial joint ventures 0 0 0 0.0 0 0 0 0.0Non-financial joint ventures 0 0 0 0.0 0 0 0 0.0
Recivables From Leasing Transactions 0 0 0 0.0 0 0 0 0.0Finance lease receivables 0 0 0 0.0 0 0 0 0.0Operational leasing receivables 0 0 0 0.0 0 0 0 0.0Others 0 0 0 0.0 0 0 0 0.0Unearned income (-) 0 0 0 0.0 0 0 0 0.0
Derivative Financial Assets Held for Hedging 0 0 0 0.0 0 0 0 0.0Fair value hedges 0 0 0 0.0 0 0 0 0.0Cash flow hedges 0 0 0 0.0 0 0 0 0.0Hedges for invest. made in foreign countries 0 0 0 0.0 0 0 0 0.0
Property and Equipment (Net) 13 0 13 0.4 12 0 12 0.5Intangible Assets (Net) 1 0 1 0.0 1 0 1 0.0
Goodwill 0 0 0 0.0 0 0 0 0.0Other 1 0 1 0.0 1 0 1 0.0
Real Estates for Investment Purpose (Net) 0 0 0 0.0 0 0 0 0.0Assets for Tax 7 0 7 0.3 7 0 7 0.3
Current assets for tax 0 0 0 0.0 0 0 0 0.0Deferred assets for tax 7 0 7 0.3 7 0 7 0.3
Prop.&Equ.for Sale p. and from Term.Op.(Net) 6 0 6 0.2 4 0 4 0.2Other Assets 42 6 48 1.6 36 2 38 1.5
Total Assets 2,213 707 2,919 100.0 1,985 590 2,574 100.0

II-71
Anadolubank A. . December 2010
Liabilities(USD Million)
Dec. 2010 % Dec. 2009 %TC FC Total Distr. TC FC Total Distr.
Deposits 1,078 637 1,715 58.7 939 718 1,657 64.4Deposits held by the Banks risk group 14 12 26 0.9 12 6 19 0.7Other 1,064 624 1,689 57.8 926 712 1,638 63.6
Derivative Finan. Liabilities Held for Trading 50 0 50 1.7 41 1 41 1.6Funds Borrowed 6 171 178 6.1 4 151 154 6.0Money Market Takings 20 318 339 11.6 70 123 193 7.5
Interbank money market takings 0 0 0 0.0 0 10 10 0.4Istanbul Stock Exc. money market takings 0 0 0 0.0 0 0 0 0.0Funds provided under repurchase agreements 20 318 339 11.6 70 113 183 7.1
Marketable Securities Issued (Net) 0 0 0 0.0 0 0 0 0.0Bills 0 0 0 0.0 0 0 0 0.0Asset backed securities 0 0 0 0.0 0 0 0 0.0Bonds 0 0 0 0.0 0 0 0 0.0
Funds 0 0 0 0.0 0 0 0 0.0Borrower funds 0 0 0 0.0 0 0 0 0.0Others 0 0 0 0.0 0 0 0 0.0
Miscellaneous Payables 31 1 32 1.1 19 1 20 0.8Other External Resources 69 10 79 2.7 49 6 54 2.1Factoring Payables 0 0 0 0.0 0 0 0 0.0Leasing Transactions Payables (Net) 0 0 0 0.0 0 0 0 0.0
Finance leasing payables 0 0 0 0.0 0 0 0 0.0Operations leasing payables 0 0 0 0.0 0 0 0 0.0Others 0 0 0 0.0 0 0 0 0.0Deferred finance leasing expenses (-) 0 0 0 0.0 0 0 0 0.0
Derivative Finan. Liabilities Held for Hedging 0 0 0 0.0 0 0 0 0.0Fair value hedges 0 0 0 0.0 0 0 0 0.0Cash flow hedges 0 0 0 0.0 0 0 0 0.0Hedges for invest. made in foreign countries 0 0 0 0.0 0 0 0 0.0
Provisions 26 0 26 0.9 23 0 23 0.9General provisions 13 0 13 0.5 13 0 13 0.5Restructuring reserves 0 0 0 0.0 0 0 0 0.0Reserves for employee benefit 8 0 8 0.3 7 0 7 0.3Insurance technical reserves (Net) 0 0 0 0.0 0 0 0 0.0Other provisions 4 0 4 0.1 3 0 3 0.1
Liabilities for Tax 10 0 10 0.3 8 0 8 0.3Current liabilities for tax 10 0 10 0.3 8 0 8 0.3Deferred liabilities for tax 0 0 0 0.0 0 0 0 0.0
Lia.for Pro.&Equ.for Sale p. and from Term.Op.(Net) 0 0 0 0.0 0 0 0 0.0Subordinated Loans 0 0 0 0.0 0 0 0 0.0Shareholders' Equity 493 -2 491 16.8 426 -2 424 16.5
Paid-in capital 390 0 390 13.4 275 0 275 10.7Supplementary capital 0 -2 -2 -0.1 0 -2 -2 -0.1
Share premium 0 0 0 0.0 0 0 0 0.0Share cancellation profits 0 0 0 0.0 0 0 0 0.0Valuation changes in marketable securities 0 -2 -2 -0.1 -1 -2 -3 -0.1Revaluation changes of property and equip. 0 0 0 0.0 0 0 0 0.0Revaluation changes of intangible assets 0 0 0 0.0 0 0 0 0.0Revaluation changes of real est.for inv. pur. 0 0 0 0.0 0 0 0 0.0Free shares from inv.&ass.,subs.& joint vent. 0 0 0 0.0 0 0 0 0.0Hedging funds (active part) 0 0 0 0.0 0 0 0 0.0Val.inc.in pro.& equ.held for sale p.and term.ope. 0 0 0 0.0 0 0 0 0.0Other capital reserves 0 0 0 0.0 1 0 1 0.0
Profit reserves 23 0 23 0.8 70 0 70 2.7Legal reserves 14 0 14 0.5 10 0 10 0.4Status reserves 0 0 0 0.0 0 0 0 0.0Extraordinary reserves 9 0 9 0.3 60 0 60 2.3Other profit reserves 0 0 0 0.0 0 0 0 0.0
Profit or loss 80 0 80 2.7 81 0 81 3.1Prior years income/loss 0 0 0 0.0 0 0 0 0.0Current year income/loss 80 0 80 2.7 81 0 81 3.1
Total Liabilities 1,783 1,137 2,919 100.0 1,578 997 2,574 100.0

II-72
Anadolubank A. .
Off Balance Sheet Commitments(USD Million)
Dec. 2010 Dec. 2009TC FC Total TC FC Total
Guarantees and Warranties 493 256 749 336 248 584Letters of guarantee 492 95 587 336 100 436Bank acceptances 0 5 5 0 1 1Letters of credit 0 95 95 0 106 106Prefinancing given as guarantee 0 0 0 0 0 0Endorsements 0 0 0 0 0 0Other guarantees and warrantees 1 62 62 0 41 41
Commitments 11,800 6 11,806 270 1 271Irrevocable commitments 273 6 278 266 1 267Revocable commitments 11,527 0 11,527 4 0 4
Derivative Financial Instruments 267 2,081 2,348 304 1,280 1,584Derivative finan. instruments held for hedging 0 0 0 0 0 0Trading transactions 267 2,081 2,348 304 1,280 1,584
Custody and Pledged Securities 4,186 516 4,702 3,104 518 3,622Items held in Custody 2,586 124 2,710 2,030 109 2,140Pledged Items 1,600 392 1,992 1,074 408 1,482Acccepted independent guaran. and warran. 0 0 0 0 0 0
Total Off Balance Sheet Commitments 16,746 2,859 19,605 4,014 2,047 6,061
Income-Expenditure(USD Million)
Dec. 2010 Dec. 2009
Interest Income 278 313Interest on loans 225 246Interest received from reserve deposits 2 3Interest received from banks 0 0Interest received from money market transactions 0 1Interest received from marketable securities portfolio 50 62Other interest income 1 1
Interest Expenses 111 134Interest on deposits 91 106Interest on money market transactions 4 9Interest on funds borrowed 16 19Interest on securities issued 0 0Other interest expenses 0 0
Net Interest Income/Expenses 167 179Net Fees and Commissions Income/Expenses 40 40
Fees and commissions received 46 44Fees and commissions paid 5 4
Dividend Income 9 0Trading Profit/Loss (net) -10 -1
Profit/loss on trading account securities 20 7Profit/losses on derivative financial transactions -39 -6Foreign exchange profit/loss 9 -2
Other Operating Income 10 10Total Operating Income/Expenses 217 227Provision for Loan Losses or other Receivables (-) 10 28
Specific provisions of banks loans and other receivables* 9 25General provision expenses* 1 2
Other Operating Expenses (-) 110 98Personnel Expenses* 72 64
Net Operating Profit/Loss 97 102Surplus written as gain after merger 0 0Profit/losses from equity method applied subsidiaries 0 0Net monetory position gain/loss 0 0Profit/Loss Before Taxes from Continuing Operations 97 102Provisions for Taxes on Income from Continuing Operations (±) -18 -21Net Profit/Loss from Continuing Operations 80 81Net Profit/Loss Before Taxes from Terminated Operations 0 0Provisions for Taxes on Income from Terminated Operations (±) 0 0Net Profit/Loss from Terminated Operations 0 0
Net Profit/Losses 80 81
* Used from information and disclosures related to income statement".

II-73
Anadolubank A. . December 2010
Ratios(%)
Dec. 2010 Dec. 2009
Capital Ratios
Shareholders’ Equity / (Amount subject to credit + market + operational risk) 18.8 20.0
Shareholders' Equity / Total Assets 16.8 16.5
(Shareholders' Equity - Permanent Assets) / Total Assets 13.8 13.4
Net On Balance Sheet Position / Total Shareholders' Equity -45.5 -48.0
Net On and Off Balance Sheet Position / Total Shareholders' Equity -8.0 -2.8
Balance-Sheet Ratios
TC Assets / Total Assets 75.8 77.1
TC Liabilities / Total Liabilities 61.1 61.3
FC Assets / FC Liabilities 62.2 59.2
TC Deposits / Total Deposits 62.9 56.7
TC Loans / Total Loans and Receivables 94.1 92.5
Total Deposits / Total Assets 58.7 64.4
Funds Borrowed / Total Assets 6.1 6.0
Assets Quality
Financial Assets (net) / Total Assets 17.7 21.1
Total Loans and Receivables / Total Assets 67.4 63.5
Total Loans and Receivables / Total Deposits 114.8 98.6
Loans Under Follow-up (gross) / Total Loans and Receivables 2.9 3.3
Loans Under Follow-up (net) / Total Loans and Receivables 0.5 0.6
Specific Provisions / Loans Under Follow-up 84.1 82.1
Permanent Assets / Total Assets 3.0 3.1
Consumer Loans / Total Loans and Receivables 22.6 21.7
Liquidity
Liquid Assets / Total Assets 13.0 16.2
Liquid Assets / Short-term Liabilities 23.2 27.0
TC Liquid Assets / Total Assets 4.4 7.4
Profitability
Net Profit/Losses / Total Assets 2.7 3.1
Net Profit/Losses / Total Shareholders' Equity 16.2 19.1
Profit/Losses Before Taxes after Continuing Operations / Total Assets 3.3 3.9
Income-Expenditure Structure
Net Interest Income After Specific Provisions / Total Assets 5.4 6.0
Net Interest Income After Specific Provisions / Total Operating Income (Expenses) 72.9 67.8
Non-interest Income (net) / Total Assets 1.7 1.9
Other Operating Expenses / Total Assets 3.8 3.8
Personnel Expenses / Other Operating Expenses 65.4 64.8
Non-interest Income (net) / Other Operating Expenses 45.4 49.4
Quarterly profitability and income-expenditure ratios, except year-end figures, should be considered periodically.

II-74
ekerbank T.A. .
Assets(USD Million)
Dec. 2010 % Dec. 2009 %TC FC Total Distr. TC FC Total Distr.
Cash and Balances with the Central Bank 231 220 451 6.1 158 159 316 5.3Fin.ass.where fair value cha. is refl.to I/S (Net) 337 51 388 5.2 428 44 472 7.8
Financial assets held for trading 4 51 54 0.7 86 44 129 2.1Public sector debt securities 3 1 4 0.1 85 1 87 1.4Securities representing a share in capital 0 0 0 0.0 0 0 0 0.0Derivative financial assets held for trading 1 49 50 0.7 0 43 43 0.7Other marketable securities 0 0 0 0.0 0 0 0 0.0
Fin.assets clas. as fair value change is refl.to I/S 333 0 333 4.5 343 0 343 5.7Public sector debt securities 0 0 0 0.0 0 0 0 0.0Securities representing a share in capital 0 0 0 0.0 0 0 0 0.0Loans 333 0 333 4.5 343 0 343 5.7Other marketable securities 0 0 0 0.0 0 0 0 0.0
Banks 0 57 57 0.8 1 38 38 0.6Money Market Securities 0 0 0 0.0 0 0 0 0.0
Interbank money market placements 0 0 0 0.0 0 0 0 0.0Istanbul Stock Exc. money market placements 0 0 0 0.0 0 0 0 0.0Receiv. from reverse repurchase agreements 0 0 0 0.0 0 0 0 0.0
Financial Assets Available for Sale (Net) 978 6 984 13.3 663 29 692 11.5Securities representing a share in capital 0 0 0 0.0 0 0 0 0.0Public sector debt securities 975 6 981 13.3 660 29 689 11.4Other marketable securities 3 0 3 0.0 3 0 3 0.1
Loans 3,744 813 4,557 61.6 2,877 422 3,299 54.8Loans 3,666 813 4,479 60.6 2,807 422 3,229 53.6
Loans granted to the Banks risk group 41 104 145 2.0 54 47 101 1.7Public sector debt securities 0 0 0 0.0 0 0 0 0.0Other 3,626 709 4,335 58.6 2,753 375 3,128 52.0
Loans under follow-up 300 0 300 4.1 270 0 270 4.5Specific provisions (-) 223 0 223 3.0 200 0 200 3.3
Factoring Receivables 0 0 0 0.0 0 0 0 0.0Investments held to Maturity (Net) 636 7 643 8.7 920 0 920 15.3
Public sector debt securities 636 7 643 8.7 920 0 920 15.3Other marketable securities 0 0 0 0.0 0 0 0 0.0
Investments and Associates (Net) 3 0 3 0.0 3 0 3 0.0Accounted with equity method 0 0 0 0.0 0 0 0 0.0Non-consolidated investments and associates 3 0 3 0.0 3 0 3 0.0
Financial investments and associates 0 0 0 0.0 0 0 0 0.0Non-financial investments and associates 3 0 3 0.0 3 0 3 0.0
Subsidiaries (Net) 58 3 61 0.8 37 3 40 0.7Financial subsidiaries 58 3 61 0.8 37 3 40 0.7Non-financial subsidiaries 0 0 0 0.0 1 0 1 0.0
Joint Ventures (Business Partners) (Net) 0 0 0 0.0 0 0 0 0.0Accounted with equity method 0 0 0 0.0 0 0 0 0.0Non-consolidated joint ventures 0 0 0 0.0 0 0 0 0.0
Financial joint ventures 0 0 0 0.0 0 0 0 0.0Non-financial joint ventures 0 0 0 0.0 0 0 0 0.0
Recivables From Leasing Transactions 0 0 0 0.0 0 0 0 0.0Finance lease receivables 0 0 0 0.0 0 0 0 0.0Operational leasing receivables 0 0 0 0.0 0 0 0 0.0Others 0 0 0 0.0 0 0 0 0.0Unearned income (-) 0 0 0 0.0 0 0 0 0.0
Derivative Financial Assets Held for Hedging 0 0 0 0.0 0 0 0 0.0Fair value hedges 0 0 0 0.0 0 0 0 0.0Cash flow hedges 0 0 0 0.0 0 0 0 0.0Hedges for invest. made in foreign countries 0 0 0 0.0 0 0 0 0.0
Property and Equipment (Net) 151 0 151 2.0 139 0 139 2.3Intangible Assets (Net) 12 0 12 0.2 14 0 14 0.2
Goodwill 0 0 0 0.0 0 0 0 0.0Other 12 0 12 0.2 14 0 14 0.2
Real Estates for Investment Purpose (Net) 0 0 0 0.0 0 0 0 0.0Assets for Tax 7 0 7 0.1 7 0 7 0.1
Current assets for tax 0 0 0 0.0 0 0 0 0.0Deferred assets for tax 7 0 7 0.1 7 0 7 0.1
Prop.&Equ.for Sale p. and from Term.Op.(Net) 0 0 0 0.0 3 0 3 0.0Other Assets 37 46 83 1.1 27 50 77 1.3
Total Assets 6,192 1,202 7,394 100.0 5,276 745 6,021 100.0
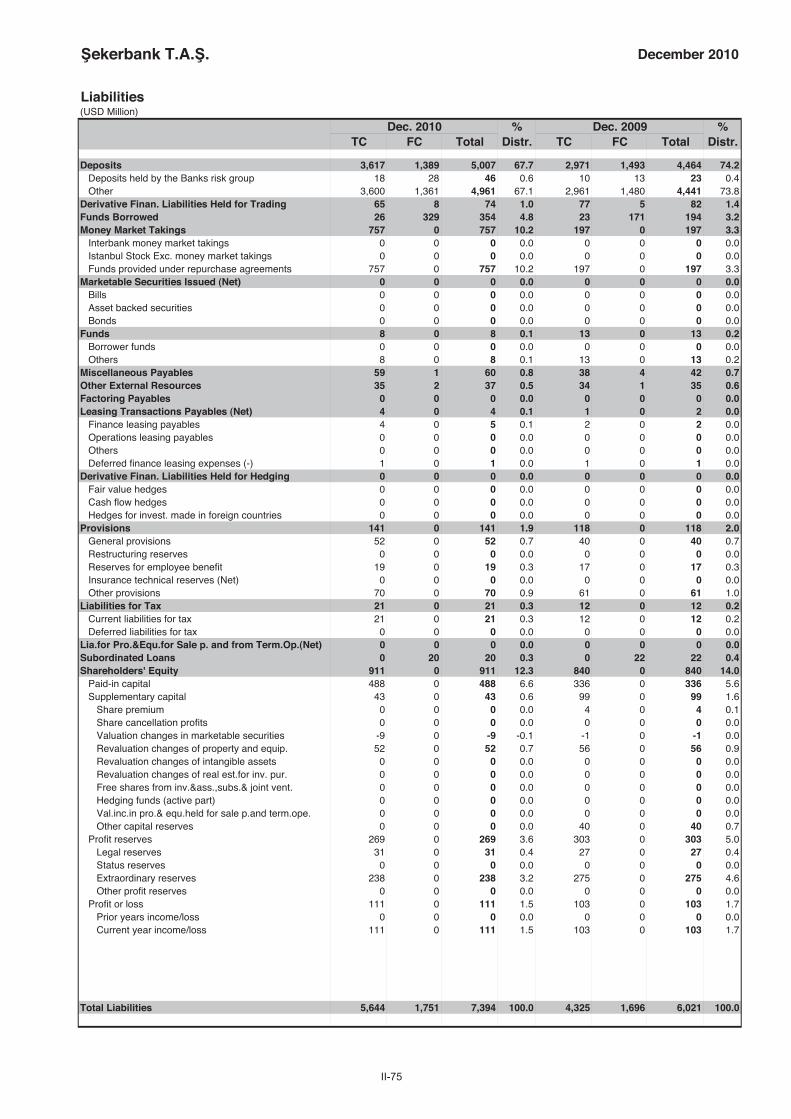
II-75
ekerbank T.A. . December 2010
Liabilities(USD Million)
Dec. 2010 % Dec. 2009 %TC FC Total Distr. TC FC Total Distr.
Deposits 3,617 1,389 5,007 67.7 2,971 1,493 4,464 74.2Deposits held by the Banks risk group 18 28 46 0.6 10 13 23 0.4Other 3,600 1,361 4,961 67.1 2,961 1,480 4,441 73.8
Derivative Finan. Liabilities Held for Trading 65 8 74 1.0 77 5 82 1.4Funds Borrowed 26 329 354 4.8 23 171 194 3.2Money Market Takings 757 0 757 10.2 197 0 197 3.3
Interbank money market takings 0 0 0 0.0 0 0 0 0.0Istanbul Stock Exc. money market takings 0 0 0 0.0 0 0 0 0.0Funds provided under repurchase agreements 757 0 757 10.2 197 0 197 3.3
Marketable Securities Issued (Net) 0 0 0 0.0 0 0 0 0.0Bills 0 0 0 0.0 0 0 0 0.0Asset backed securities 0 0 0 0.0 0 0 0 0.0Bonds 0 0 0 0.0 0 0 0 0.0
Funds 8 0 8 0.1 13 0 13 0.2Borrower funds 0 0 0 0.0 0 0 0 0.0Others 8 0 8 0.1 13 0 13 0.2
Miscellaneous Payables 59 1 60 0.8 38 4 42 0.7Other External Resources 35 2 37 0.5 34 1 35 0.6Factoring Payables 0 0 0 0.0 0 0 0 0.0Leasing Transactions Payables (Net) 4 0 4 0.1 1 0 2 0.0
Finance leasing payables 4 0 5 0.1 2 0 2 0.0Operations leasing payables 0 0 0 0.0 0 0 0 0.0Others 0 0 0 0.0 0 0 0 0.0Deferred finance leasing expenses (-) 1 0 1 0.0 1 0 1 0.0
Derivative Finan. Liabilities Held for Hedging 0 0 0 0.0 0 0 0 0.0Fair value hedges 0 0 0 0.0 0 0 0 0.0Cash flow hedges 0 0 0 0.0 0 0 0 0.0Hedges for invest. made in foreign countries 0 0 0 0.0 0 0 0 0.0
Provisions 141 0 141 1.9 118 0 118 2.0General provisions 52 0 52 0.7 40 0 40 0.7Restructuring reserves 0 0 0 0.0 0 0 0 0.0Reserves for employee benefit 19 0 19 0.3 17 0 17 0.3Insurance technical reserves (Net) 0 0 0 0.0 0 0 0 0.0Other provisions 70 0 70 0.9 61 0 61 1.0
Liabilities for Tax 21 0 21 0.3 12 0 12 0.2Current liabilities for tax 21 0 21 0.3 12 0 12 0.2Deferred liabilities for tax 0 0 0 0.0 0 0 0 0.0
Lia.for Pro.&Equ.for Sale p. and from Term.Op.(Net) 0 0 0 0.0 0 0 0 0.0Subordinated Loans 0 20 20 0.3 0 22 22 0.4Shareholders' Equity 911 0 911 12.3 840 0 840 14.0
Paid-in capital 488 0 488 6.6 336 0 336 5.6Supplementary capital 43 0 43 0.6 99 0 99 1.6
Share premium 0 0 0 0.0 4 0 4 0.1Share cancellation profits 0 0 0 0.0 0 0 0 0.0Valuation changes in marketable securities -9 0 -9 -0.1 -1 0 -1 0.0Revaluation changes of property and equip. 52 0 52 0.7 56 0 56 0.9Revaluation changes of intangible assets 0 0 0 0.0 0 0 0 0.0Revaluation changes of real est.for inv. pur. 0 0 0 0.0 0 0 0 0.0Free shares from inv.&ass.,subs.& joint vent. 0 0 0 0.0 0 0 0 0.0Hedging funds (active part) 0 0 0 0.0 0 0 0 0.0Val.inc.in pro.& equ.held for sale p.and term.ope. 0 0 0 0.0 0 0 0 0.0Other capital reserves 0 0 0 0.0 40 0 40 0.7
Profit reserves 269 0 269 3.6 303 0 303 5.0Legal reserves 31 0 31 0.4 27 0 27 0.4Status reserves 0 0 0 0.0 0 0 0 0.0Extraordinary reserves 238 0 238 3.2 275 0 275 4.6Other profit reserves 0 0 0 0.0 0 0 0 0.0
Profit or loss 111 0 111 1.5 103 0 103 1.7Prior years income/loss 0 0 0 0.0 0 0 0 0.0Current year income/loss 111 0 111 1.5 103 0 103 1.7
Total Liabilities 5,644 1,751 7,394 100.0 4,325 1,696 6,021 100.0
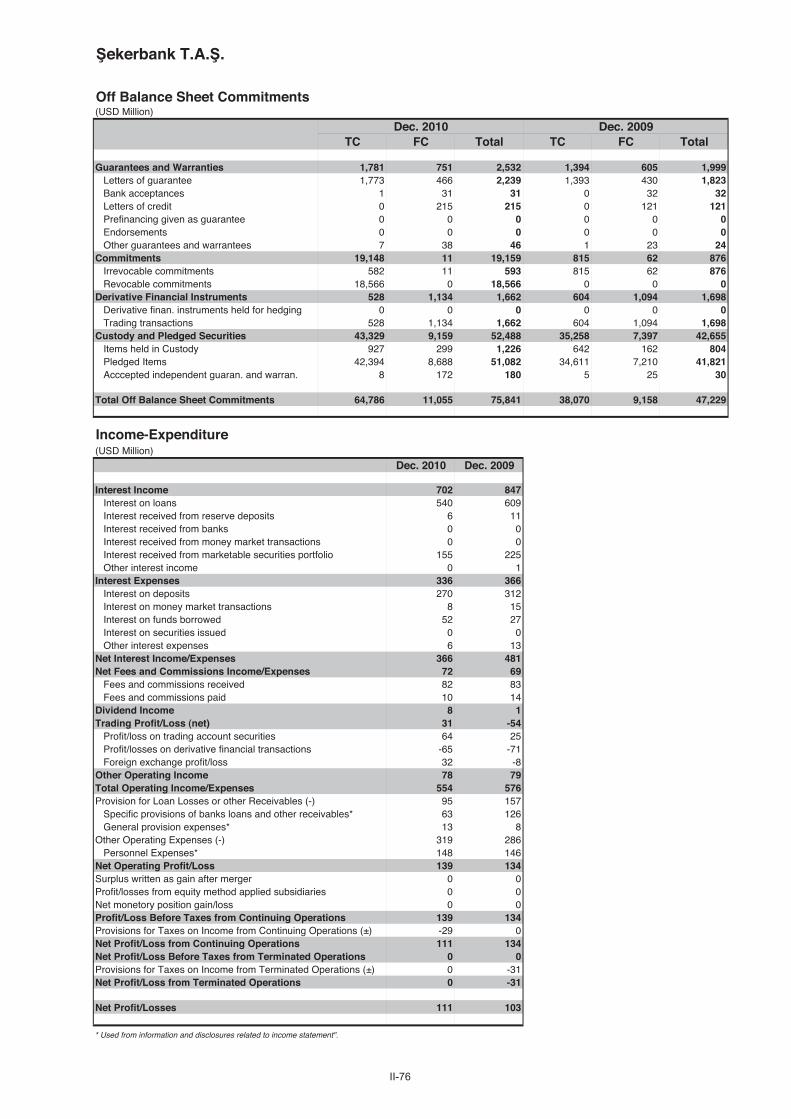
II-76
ekerbank T.A. .
Off Balance Sheet Commitments(USD Million)
Dec. 2010 Dec. 2009TC FC Total TC FC Total
Guarantees and Warranties 1,781 751 2,532 1,394 605 1,999Letters of guarantee 1,773 466 2,239 1,393 430 1,823Bank acceptances 1 31 31 0 32 32Letters of credit 0 215 215 0 121 121Prefinancing given as guarantee 0 0 0 0 0 0Endorsements 0 0 0 0 0 0Other guarantees and warrantees 7 38 46 1 23 24
Commitments 19,148 11 19,159 815 62 876Irrevocable commitments 582 11 593 815 62 876Revocable commitments 18,566 0 18,566 0 0 0
Derivative Financial Instruments 528 1,134 1,662 604 1,094 1,698Derivative finan. instruments held for hedging 0 0 0 0 0 0Trading transactions 528 1,134 1,662 604 1,094 1,698
Custody and Pledged Securities 43,329 9,159 52,488 35,258 7,397 42,655Items held in Custody 927 299 1,226 642 162 804Pledged Items 42,394 8,688 51,082 34,611 7,210 41,821Acccepted independent guaran. and warran. 8 172 180 5 25 30
Total Off Balance Sheet Commitments 64,786 11,055 75,841 38,070 9,158 47,229
Income-Expenditure(USD Million)
Dec. 2010 Dec. 2009
Interest Income 702 847Interest on loans 540 609Interest received from reserve deposits 6 11Interest received from banks 0 0Interest received from money market transactions 0 0Interest received from marketable securities portfolio 155 225Other interest income 0 1
Interest Expenses 336 366Interest on deposits 270 312Interest on money market transactions 8 15Interest on funds borrowed 52 27Interest on securities issued 0 0Other interest expenses 6 13
Net Interest Income/Expenses 366 481Net Fees and Commissions Income/Expenses 72 69
Fees and commissions received 82 83Fees and commissions paid 10 14
Dividend Income 8 1Trading Profit/Loss (net) 31 -54
Profit/loss on trading account securities 64 25Profit/losses on derivative financial transactions -65 -71Foreign exchange profit/loss 32 -8
Other Operating Income 78 79Total Operating Income/Expenses 554 576Provision for Loan Losses or other Receivables (-) 95 157
Specific provisions of banks loans and other receivables* 63 126General provision expenses* 13 8
Other Operating Expenses (-) 319 286Personnel Expenses* 148 146
Net Operating Profit/Loss 139 134Surplus written as gain after merger 0 0Profit/losses from equity method applied subsidiaries 0 0Net monetory position gain/loss 0 0Profit/Loss Before Taxes from Continuing Operations 139 134Provisions for Taxes on Income from Continuing Operations (±) -29 0Net Profit/Loss from Continuing Operations 111 134Net Profit/Loss Before Taxes from Terminated Operations 0 0Provisions for Taxes on Income from Terminated Operations (±) 0 -31Net Profit/Loss from Terminated Operations 0 -31
Net Profit/Losses 111 103
* Used from information and disclosures related to income statement".

II-77
ekerbank T.A. . December 2010
Ratios(%)
Dec. 2010 Dec. 2009
Capital Ratios
Shareholders’ Equity / (Amount subject to credit + market + operational risk) 14.0 16.3
Shareholders' Equity / Total Assets 12.3 14.0
(Shareholders' Equity - Permanent Assets) / Total Assets 8.2 9.5
Net On Balance Sheet Position / Total Shareholders' Equity -24.5 -75.4
Net On and Off Balance Sheet Position / Total Shareholders' Equity -3.8 2.1
Balance-Sheet Ratios
TC Assets / Total Assets 83.7 87.6
TC Liabilities / Total Liabilities 76.3 71.8
FC Assets / FC Liabilities 68.6 43.9
TC Deposits / Total Deposits 72.2 66.6
TC Loans / Total Loans and Receivables 82.2 87.2
Total Deposits / Total Assets 67.7 74.2
Funds Borrowed / Total Assets 4.8 3.2
Assets Quality
Financial Assets (net) / Total Assets 27.2 34.6
Total Loans and Receivables / Total Assets 61.6 54.8
Total Loans and Receivables / Total Deposits 91.0 73.9
Loans Under Follow-up (gross) / Total Loans and Receivables 6.6 8.2
Loans Under Follow-up (net) / Total Loans and Receivables 1.7 2.1
Specific Provisions / Loans Under Follow-up 74.2 74.1
Permanent Assets / Total Assets 4.1 4.5
Consumer Loans / Total Loans and Receivables 18.4 21.3
Liquidity
Liquid Assets / Total Assets 25.4 25.2
Liquid Assets / Short-term Liabilities 38.2 38.8
TC Liquid Assets / Total Assets 20.9 20.8
Profitability
Net Profit/Losses / Total Assets 1.5 1.7
Net Profit/Losses / Total Shareholders' Equity 12.2 12.2
Profit/Losses Before Taxes after Continuing Operations / Total Assets 1.9 2.2
Income-Expenditure Structure
Net Interest Income After Specific Provisions / Total Assets 4.1 5.9
Net Interest Income After Specific Provisions / Total Operating Income (Expenses) 54.7 61.5
Non-interest Income (net) / Total Assets 2.5 1.6
Other Operating Expenses / Total Assets 4.3 4.7
Personnel Expenses / Other Operating Expenses 46.2 51.1
Non-interest Income (net) / Other Operating Expenses 58.9 33.5
Quarterly profitability and income-expenditure ratios, except year-end figures, should be considered periodically.

II-78
Tekstil Bankası A. .
Assets(USD Million)
Dec. 2010 % Dec. 2009 %TC FC Total Distr. TC FC Total Distr.
Cash and Balances with the Central Bank 57 57 114 6.8 40 55 95 6.6Fin.ass.where fair value cha. is refl.to I/S (Net) 3 0 3 0.2 1 2 3 0.2
Financial assets held for trading 3 0 3 0.2 1 2 3 0.2Public sector debt securities 0 0 0 0.0 0 0 0 0.0Securities representing a share in capital 0 0 0 0.0 0 0 0 0.0Derivative financial assets held for trading 3 0 3 0.2 0 2 2 0.1Other marketable securities 0 0 0 0.0 0 0 0 0.0
Fin.assets clas. as fair value change is refl.to I/S 0 0 0 0.0 0 0 0 0.0Public sector debt securities 0 0 0 0.0 0 0 0 0.0Securities representing a share in capital 0 0 0 0.0 0 0 0 0.0Loans 0 0 0 0.0 0 0 0 0.0Other marketable securities 0 0 0 0.0 0 0 0 0.0
Banks 0 49 49 2.9 0 40 40 2.8Money Market Securities 0 0 0 0.0 0 0 0 0.0
Interbank money market placements 0 0 0 0.0 0 0 0 0.0Istanbul Stock Exc. money market placements 0 0 0 0.0 0 0 0 0.0Receiv. from reverse repurchase agreements 0 0 0 0.0 0 0 0 0.0
Financial Assets Available for Sale (Net) 192 13 205 12.3 138 14 151 10.6Securities representing a share in capital 0 0 0 0.0 0 0 0 0.0Public sector debt securities 189 7 196 11.7 138 7 144 10.1Other marketable securities 3 6 9 0.6 0 7 7 0.5
Loans 968 249 1,217 72.7 914 145 1,060 73.9Loans 945 249 1,194 71.3 886 145 1,032 71.9
Loans granted to the Banks risk group 12 0 12 0.7 45 0 45 3.2Public sector debt securities 0 0 0 0.0 0 0 0 0.0Other 934 249 1,182 70.7 841 145 986 68.8
Loans under follow-up 61 0 61 3.7 66 0 66 4.6Specific provisions (-) 38 0 38 2.3 38 0 38 2.6
Factoring Receivables 0 0 0 0.0 0 0 0 0.0Investments held to Maturity (Net) 0 0 0 0.0 0 0 0 0.0
Public sector debt securities 0 0 0 0.0 0 0 0 0.0Other marketable securities 0 0 0 0.0 0 0 0 0.0
Investments and Associates (Net) 0 0 0 0.0 0 0 0 0.0Accounted with equity method 0 0 0 0.0 0 0 0 0.0Non-consolidated investments and associates 0 0 0 0.0 0 0 0 0.0
Financial investments and associates 0 0 0 0.0 0 0 0 0.0Non-financial investments and associates 0 0 0 0.0 0 0 0 0.0
Subsidiaries (Net) 9 0 9 0.5 5 1 7 0.5Financial subsidiaries 9 0 9 0.5 5 1 7 0.5Non-financial subsidiaries 0 0 0 0.0 0 0 0 0.0
Joint Ventures (Business Partners) (Net) 0 0 0 0.0 0 0 0 0.0Accounted with equity method 0 0 0 0.0 0 0 0 0.0Non-consolidated joint ventures 0 0 0 0.0 0 0 0 0.0
Financial joint ventures 0 0 0 0.0 0 0 0 0.0Non-financial joint ventures 0 0 0 0.0 0 0 0 0.0
Recivables From Leasing Transactions 0 0 0 0.0 0 0 0 0.0Finance lease receivables 0 0 0 0.0 0 0 0 0.0Operational leasing receivables 0 0 0 0.0 0 0 0 0.0Others 0 0 0 0.0 0 0 0 0.0Unearned income (-) 0 0 0 0.0 0 0 0 0.0
Derivative Financial Assets Held for Hedging 0 0 0 0.0 0 0 0 0.0Fair value hedges 0 0 0 0.0 0 0 0 0.0Cash flow hedges 0 0 0 0.0 0 0 0 0.0Hedges for invest. made in foreign countries 0 0 0 0.0 0 0 0 0.0
Property and Equipment (Net) 50 0 50 3.0 48 0 48 3.3Intangible Assets (Net) 1 0 1 0.1 1 0 1 0.1
Goodwill 0 0 0 0.0 0 0 0 0.0Other 1 0 1 0.1 1 0 1 0.1
Real Estates for Investment Purpose (Net) 0 0 0 0.0 0 0 0 0.0Assets for Tax 1 0 1 0.1 1 0 1 0.1
Current assets for tax 0 0 0 0.0 0 0 0 0.0Deferred assets for tax 1 0 1 0.1 1 0 1 0.1
Prop.&Equ.for Sale p. and from Term.Op.(Net) 0 0 0 0.0 0 0 0 0.0Other Assets 21 3 24 1.5 26 2 28 2.0
Total Assets 1,302 372 1,674 100.0 1,174 260 1,434 100.0

II-79
Tekstil Bankası A. . December 2010
Liabilities(USD Million)
Dec. 2010 % Dec. 2009 %TC FC Total Distr. TC FC Total Distr.
Deposits 697 468 1,165 69.6 488 487 975 68.0Deposits held by the Banks risk group 30 24 54 3.2 17 8 25 1.8Other 667 444 1,111 66.4 471 478 950 66.2
Derivative Finan. Liabilities Held for Trading 3 1 4 0.3 1 2 2 0.2Funds Borrowed 11 33 44 2.6 5 93 98 6.9Money Market Takings 93 0 93 5.6 4 0 4 0.3
Interbank money market takings 0 0 0 0.0 0 0 0 0.0Istanbul Stock Exc. money market takings 0 0 0 0.0 0 0 0 0.0Funds provided under repurchase agreements 93 0 93 5.6 4 0 4 0.3
Marketable Securities Issued (Net) 0 0 0 0.0 0 0 0 0.0Bills 0 0 0 0.0 0 0 0 0.0Asset backed securities 0 0 0 0.0 0 0 0 0.0Bonds 0 0 0 0.0 0 0 0 0.0
Funds 0 0 0 0.0 0 0 0 0.0Borrower funds 0 0 0 0.0 0 0 0 0.0Others 0 0 0 0.0 0 0 0 0.0
Miscellaneous Payables 4 0 5 0.3 5 0 6 0.4Other External Resources 17 5 22 1.3 15 4 19 1.3Factoring Payables 0 0 0 0.0 0 0 0 0.0Leasing Transactions Payables (Net) 0 0 0 0.0 0 0 0 0.0
Finance leasing payables 0 0 0 0.0 0 0 0 0.0Operations leasing payables 0 0 0 0.0 0 0 0 0.0Others 0 0 0 0.0 0 0 0 0.0Deferred finance leasing expenses (-) 0 0 0 0.0 0 0 0 0.0
Derivative Finan. Liabilities Held for Hedging 0 0 0 0.0 0 0 0 0.0Fair value hedges 0 0 0 0.0 0 0 0 0.0Cash flow hedges 0 0 0 0.0 0 0 0 0.0Hedges for invest. made in foreign countries 0 0 0 0.0 0 0 0 0.0
Provisions 14 0 14 0.9 12 0 12 0.8General provisions 8 0 8 0.5 7 0 7 0.5Restructuring reserves 0 0 0 0.0 0 0 0 0.0Reserves for employee benefit 3 0 3 0.2 3 0 3 0.2Insurance technical reserves (Net) 0 0 0 0.0 0 0 0 0.0Other provisions 3 0 3 0.2 2 0 2 0.1
Liabilities for Tax 4 0 4 0.3 3 0 3 0.2Current liabilities for tax 4 0 4 0.3 3 0 3 0.2Deferred liabilities for tax 0 0 0 0.0 0 0 0 0.0
Lia.for Pro.&Equ.for Sale p. and from Term.Op.(Net) 0 0 0 0.0 0 0 0 0.0Subordinated Loans 0 0 0 0.0 0 0 0 0.0Shareholders' Equity 322 1 323 19.3 314 0 315 21.9
Paid-in capital 273 0 273 16.3 282 0 282 19.7Supplementary capital 14 1 14 0.9 5 0 6 0.4
Share premium -1 0 -1 0.0 -1 0 -1 0.0Share cancellation profits 0 0 0 0.0 0 0 0 0.0Valuation changes in marketable securities 5 1 5 0.3 2 0 3 0.2Revaluation changes of property and equip. 9 0 9 0.6 3 0 3 0.2Revaluation changes of intangible assets 0 0 0 0.0 0 0 0 0.0Revaluation changes of real est.for inv. pur. 0 0 0 0.0 0 0 0 0.0Free shares from inv.&ass.,subs.& joint vent. 0 0 0 0.0 0 0 0 0.0Hedging funds (active part) 0 0 0 0.0 0 0 0 0.0Val.inc.in pro.& equ.held for sale p.and term.ope. 0 0 0 0.0 0 0 0 0.0Other capital reserves 0 0 0 0.0 0 0 0 0.0
Profit reserves 26 0 26 1.5 18 0 18 1.3Legal reserves 3 0 3 0.2 3 0 3 0.2Status reserves 0 0 0 0.0 0 0 0 0.0Extraordinary reserves 23 0 23 1.4 15 0 15 1.1Other profit reserves 0 0 0 0.0 0 0 0 0.0
Profit or loss 9 0 9 0.6 9 0 9 0.6Prior years income/loss 0 0 0 0.0 0 0 0 0.0Current year income/loss 9 0 9 0.6 9 0 9 0.6
Total Liabilities 1,166 507 1,674 100.0 848 586 1,434 100.0

II-80
Tekstil Bankası A. .
Off Balance Sheet Commitments(USD Million)
Dec. 2010 Dec. 2009TC FC Total TC FC Total
Guarantees and Warranties 265 313 578 251 256 506Letters of guarantee 265 202 467 251 190 441Bank acceptances 0 2 2 0 0 0Letters of credit 0 96 96 0 47 47Prefinancing given as guarantee 0 1 1 0 1 1Endorsements 0 0 0 0 0 0Other guarantees and warrantees 0 11 11 0 17 17
Commitments 3,871 36 3,906 207 0 207Irrevocable commitments 216 36 252 207 0 207Revocable commitments 3,655 0 3,655 0 0 0
Derivative Financial Instruments 328 561 889 331 880 1,212Derivative finan. instruments held for hedging 0 0 0 0 0 0Trading transactions 328 561 889 331 880 1,212
Custody and Pledged Securities 1,062 510 1,572 979 487 1,466Items held in Custody 59 12 72 71 17 87Pledged Items 1,002 498 1,500 908 471 1,379Acccepted independent guaran. and warran. 0 0 0 0 0 0
Total Off Balance Sheet Commitments 5,525 1,421 6,946 1,768 1,623 3,391
Income-Expenditure(USD Million)
Dec. 2010 Dec. 2009
Interest Income 121 168Interest on loans 102 138Interest received from reserve deposits 0 0Interest received from banks 1 4Interest received from money market transactions 0 3Interest received from marketable securities portfolio 17 22Other interest income 1 0
Interest Expenses 58 82Interest on deposits 52 71Interest on money market transactions 2 10Interest on funds borrowed 4 1Interest on securities issued 0 0Other interest expenses 0 0
Net Interest Income/Expenses 63 86Net Fees and Commissions Income/Expenses 12 13
Fees and commissions received 14 15Fees and commissions paid 2 3
Dividend Income 0 0Trading Profit/Loss (net) 3 9
Profit/loss on trading account securities 2 5Profit/losses on derivative financial transactions -7 -3Foreign exchange profit/loss 9 7
Other Operating Income 10 9Total Operating Income/Expenses 88 116Provision for Loan Losses or other Receivables (-) 15 37
Specific provisions of banks loans and other receivables* 9 33General provision expenses* 2 0
Other Operating Expenses (-) 61 68Personnel Expenses* 36 41
Net Operating Profit/Loss 13 11Surplus written as gain after merger 0 0Profit/losses from equity method applied subsidiaries 0 0Net monetory position gain/loss 0 0Profit/Loss Before Taxes from Continuing Operations 13 11Provisions for Taxes on Income from Continuing Operations (±) -3 -2Net Profit/Loss from Continuing Operations 9 9Net Profit/Loss Before Taxes from Terminated Operations 0 0Provisions for Taxes on Income from Terminated Operations (±) 0 0Net Profit/Loss from Terminated Operations 0 0
Net Profit/Losses 9 9
* Used from information and disclosures related to income statement".

II-81
Tekstil Bankası A. . December 2010
Ratios(%)
Dec. 2010 Dec. 2009
Capital Ratios
Shareholders’ Equity / (Amount subject to credit + market + operational risk) 19.4 20.8
Shareholders' Equity / Total Assets 19.3 21.9
(Shareholders' Equity - Permanent Assets) / Total Assets 14.3 16.1
Net On Balance Sheet Position / Total Shareholders' Equity 11.7 -48.9
Net On and Off Balance Sheet Position / Total Shareholders' Equity -1.3 -0.1
Balance-Sheet Ratios
TC Assets / Total Assets 77.8 81.9
TC Liabilities / Total Liabilities 69.7 59.1
FC Assets / FC Liabilities 73.3 44.3
TC Deposits / Total Deposits 59.8 50.1
TC Loans / Total Loans and Receivables 79.6 86.3
Total Deposits / Total Assets 69.6 68.0
Funds Borrowed / Total Assets 2.6 6.9
Assets Quality
Financial Assets (net) / Total Assets 12.4 10.7
Total Loans and Receivables / Total Assets 72.7 73.9
Total Loans and Receivables / Total Deposits 104.5 108.7
Loans Under Follow-up (gross) / Total Loans and Receivables 5.0 6.2
Loans Under Follow-up (net) / Total Loans and Receivables 1.9 2.7
Specific Provisions / Loans Under Follow-up 62.5 57.4
Permanent Assets / Total Assets 4.9 5.9
Consumer Loans / Total Loans and Receivables 14.2 13.0
Liquidity
Liquid Assets / Total Assets 22.2 20.1
Liquid Assets / Short-term Liabilities 36.4 39.6
TC Liquid Assets / Total Assets 15.0 12.4
Profitability
Net Profit/Losses / Total Assets 0.6 0.6
Net Profit/Losses / Total Shareholders' Equity 2.9 2.8
Profit/Losses Before Taxes after Continuing Operations / Total Assets 0.8 0.8
Income-Expenditure Structure
Net Interest Income After Specific Provisions / Total Assets 3.2 3.7
Net Interest Income After Specific Provisions / Total Operating Income (Expenses) 61.5 45.8
Non-interest Income (net) / Total Assets 1.5 2.1
Other Operating Expenses / Total Assets 3.7 4.8
Personnel Expenses / Other Operating Expenses 58.8 59.9
Non-interest Income (net) / Other Operating Expenses 41.5 44.2
Quarterly profitability and income-expenditure ratios, except year-end figures, should be considered periodically.

II-82
Turkish Bank A. .
Assets(USD Million)
Dec. 2010 % Dec. 2009 %TC FC Total Distr. TC FC Total Distr.
Cash and Balances with the Central Bank 16 17 33 4.9 9 18 28 4.0Fin.ass.where fair value cha. is refl.to I/S (Net) 0 1 1 0.2 0 0 0 0.0
Financial assets held for trading 0 1 1 0.2 0 0 0 0.0Public sector debt securities 0 0 0 0.0 0 0 0 0.0Securities representing a share in capital 0 0 0 0.0 0 0 0 0.0Derivative financial assets held for trading 0 1 1 0.2 0 0 0 0.0Other marketable securities 0 0 0 0.0 0 0 0 0.0
Fin.assets clas. as fair value change is refl.to I/S 0 0 0 0.0 0 0 0 0.0Public sector debt securities 0 0 0 0.0 0 0 0 0.0Securities representing a share in capital 0 0 0 0.0 0 0 0 0.0Loans 0 0 0 0.0 0 0 0 0.0Other marketable securities 0 0 0 0.0 0 0 0 0.0
Banks 223 54 278 41.5 193 206 399 57.8Money Market Securities 0 0 0 0.0 16 0 16 2.4
Interbank money market placements 0 0 0 0.0 16 0 16 2.4Istanbul Stock Exc. money market placements 0 0 0 0.0 0 0 0 0.0Receiv. from reverse repurchase agreements 0 0 0 0.0 0 0 0 0.0
Financial Assets Available for Sale (Net) 44 11 55 8.3 42 19 61 8.9Securities representing a share in capital 0 0 0 0.0 0 0 0 0.0Public sector debt securities 44 11 55 8.3 42 8 50 7.3Other marketable securities 0 0 0 0.0 0 11 11 1.6
Loans 194 75 270 40.3 91 66 157 22.7Loans 188 75 263 39.3 88 65 153 22.1
Loans granted to the Banks risk group 10 0 10 1.5 8 0 8 1.2Public sector debt securities 0 0 0 0.0 0 0 0 0.0Other 178 75 253 37.8 79 65 144 20.9
Loans under follow-up 9 3 12 1.8 6 4 10 1.4Specific provisions (-) 3 3 5 0.8 3 3 6 0.8
Factoring Receivables 0 0 0 0.0 0 0 0 0.0Investments held to Maturity (Net) 0 0 0 0.0 0 0 0 0.0
Public sector debt securities 0 0 0 0.0 0 0 0 0.0Other marketable securities 0 0 0 0.0 0 0 0 0.0
Investments and Associates (Net) 0 0 0 0.0 0 0 0 0.0Accounted with equity method 0 0 0 0.0 0 0 0 0.0Non-consolidated investments and associates 0 0 0 0.0 0 0 0 0.0
Financial investments and associates 0 0 0 0.0 0 0 0 0.0Non-financial investments and associates 0 0 0 0.0 0 0 0 0.0
Subsidiaries (Net) 17 0 17 2.5 17 0 17 2.5Financial subsidiaries 17 0 17 2.5 17 0 17 2.5Non-financial subsidiaries 0 0 0 0.0 0 0 0 0.0
Joint Ventures (Business Partners) (Net) 0 0 0 0.0 0 0 0 0.0Accounted with equity method 0 0 0 0.0 0 0 0 0.0Non-consolidated joint ventures 0 0 0 0.0 0 0 0 0.0
Financial joint ventures 0 0 0 0.0 0 0 0 0.0Non-financial joint ventures 0 0 0 0.0 0 0 0 0.0
Recivables From Leasing Transactions 0 0 0 0.0 0 0 0 0.0Finance lease receivables 0 0 0 0.0 0 0 0 0.0Operational leasing receivables 0 0 0 0.0 0 0 0 0.0Others 0 0 0 0.0 0 0 0 0.0Unearned income (-) 0 0 0 0.0 0 0 0 0.0
Derivative Financial Assets Held for Hedging 0 0 0 0.0 0 0 0 0.0Fair value hedges 0 0 0 0.0 0 0 0 0.0Cash flow hedges 0 0 0 0.0 0 0 0 0.0Hedges for invest. made in foreign countries 0 0 0 0.0 0 0 0 0.0
Property and Equipment (Net) 7 0 7 1.1 8 0 8 1.2Intangible Assets (Net) 0 0 0 0.0 0 0 0 0.1
Goodwill 0 0 0 0.0 0 0 0 0.0Other 0 0 0 0.0 0 0 0 0.1
Real Estates for Investment Purpose (Net) 0 0 0 0.0 0 0 0 0.0Assets for Tax 0 0 0 0.0 1 0 1 0.1
Current assets for tax 0 0 0 0.0 0 0 0 0.1Deferred assets for tax 0 0 0 0.0 0 0 0 0.0
Prop.&Equ.for Sale p. and from Term.Op.(Net) 0 0 0 0.0 0 0 0 0.0Other Assets 8 0 8 1.2 1 1 2 0.2
Total Assets 511 159 670 100.0 379 311 690 100.0

II-83
Turkish Bank A. . December 2010
Liabilities(USD Million)
Dec. 2010 % Dec. 2009 %TC FC Total Distr. TC FC Total Distr.
Deposits 257 161 418 62.5 148 208 356 51.6Deposits held by the Banks risk group 12 2 13 2.0 21 51 72 10.4Other 246 159 405 60.5 127 157 284 41.1
Derivative Finan. Liabilities Held for Trading 0 0 0 0.0 0 0 0 0.1Funds Borrowed 59 45 104 15.6 95 98 193 27.9Money Market Takings 35 0 35 5.3 35 0 35 5.1
Interbank money market takings 0 0 0 0.0 0 0 0 0.0Istanbul Stock Exc. money market takings 0 0 0 0.0 0 0 0 0.0Funds provided under repurchase agreements 35 0 35 5.3 35 0 35 5.1
Marketable Securities Issued (Net) 0 0 0 0.0 0 0 0 0.0Bills 0 0 0 0.0 0 0 0 0.0Asset backed securities 0 0 0 0.0 0 0 0 0.0Bonds 0 0 0 0.0 0 0 0 0.0
Funds 0 0 0 0.0 0 0 0 0.0Borrower funds 0 0 0 0.0 0 0 0 0.0Others 0 0 0 0.0 0 0 0 0.0
Miscellaneous Payables 1 0 1 0.1 0 0 0 0.0Other External Resources 7 0 7 1.1 1 0 1 0.1Factoring Payables 0 0 0 0.0 0 0 0 0.0Leasing Transactions Payables (Net) 0 0 0 0.0 0 0 0 0.0
Finance leasing payables 0 0 0 0.0 0 0 0 0.0Operations leasing payables 0 0 0 0.0 0 0 0 0.0Others 0 0 0 0.0 0 0 0 0.0Deferred finance leasing expenses (-) 0 0 0 0.0 0 0 0 0.0
Derivative Finan. Liabilities Held for Hedging 0 0 0 0.0 0 0 0 0.0Fair value hedges 0 0 0 0.0 0 0 0 0.0Cash flow hedges 0 0 0 0.0 0 0 0 0.0Hedges for invest. made in foreign countries 0 0 0 0.0 0 0 0 0.0
Provisions 1 0 1 0.2 2 0 2 0.2General provisions 1 0 1 0.1 1 0 1 0.2Restructuring reserves 0 0 0 0.0 0 0 0 0.0Reserves for employee benefit 0 0 0 0.0 0 0 0 0.0Insurance technical reserves (Net) 0 0 0 0.0 0 0 0 0.0Other provisions 0 0 0 0.1 0 0 0 0.0
Liabilities for Tax 1 0 1 0.1 1 0 1 0.1Current liabilities for tax 1 0 1 0.1 1 0 1 0.1Deferred liabilities for tax 0 0 0 0.0 0 0 0 0.0
Lia.for Pro.&Equ.for Sale p. and from Term.Op.(Net) 0 0 0 0.0 0 0 0 0.0Subordinated Loans 0 0 0 0.0 0 0 0 0.0Shareholders' Equity 102 0 102 15.2 102 0 102 14.8
Paid-in capital 52 0 52 7.8 54 0 54 7.8Supplementary capital 37 0 37 5.6 38 0 38 5.5
Share premium 24 0 24 3.6 25 0 25 3.7Share cancellation profits 0 0 0 0.0 0 0 0 0.0Valuation changes in marketable securities 1 0 1 0.1 0 0 0 0.0Revaluation changes of property and equip. 0 0 0 0.0 0 0 0 0.0Revaluation changes of intangible assets 0 0 0 0.0 0 0 0 0.0Revaluation changes of real est.for inv. pur. 0 0 0 0.0 0 0 0 0.0Free shares from inv.&ass.,subs.& joint vent. 0 0 0 0.0 0 0 0 0.0Hedging funds (active part) 0 0 0 0.0 0 0 0 0.0Val.inc.in pro.& equ.held for sale p.and term.ope. 0 0 0 0.0 0 0 0 0.0Other capital reserves 12 0 12 1.8 13 0 13 1.9
Profit reserves 2 0 2 0.3 2 0 2 0.3Legal reserves 2 0 2 0.2 2 0 2 0.2Status reserves 0 0 0 0.0 0 0 0 0.0Extraordinary reserves 0 0 0 0.0 0 0 0 0.0Other profit reserves 0 0 0 0.0 0 0 0 0.0
Profit or loss 10 0 10 1.5 8 0 8 1.2Prior years income/loss 8 0 8 1.2 8 0 8 1.1Current year income/loss 2 0 2 0.3 1 0 1 0.1
Total Liabilities 463 206 670 100.0 384 306 690 100.0

II-84
Turkish Bank A. .
Off Balance Sheet Commitments(USD Million)
Dec. 2010 Dec. 2009TC FC Total TC FC Total
Guarantees and Warranties 22 40 62 26 102 128Letters of guarantee 22 21 42 26 23 49Bank acceptances 0 0 0 0 0 0Letters of credit 0 2 2 0 1 1Prefinancing given as guarantee 0 0 0 0 0 0Endorsements 0 0 0 0 0 0Other guarantees and warrantees 0 17 17 0 78 78
Commitments 19 9 28 17 39 56Irrevocable commitments 19 9 28 17 39 56Revocable commitments 0 0 0 0 0 0
Derivative Financial Instruments 50 252 303 7 154 162Derivative finan. instruments held for hedging 0 0 0 0 0 0Trading transactions 50 252 303 7 154 162
Custody and Pledged Securities 275 384 659 282 348 630Items held in Custody 56 33 89 80 32 111Pledged Items 219 351 570 203 316 519Acccepted independent guaran. and warran. 0 0 0 0 0 0
Total Off Balance Sheet Commitments 366 685 1,051 333 644 976
Income-Expenditure(USD Million)
Dec. 2010 Dec. 2009
Interest Income 32 37Interest on loans 16 16Interest received from reserve deposits 0 1Interest received from banks 11 7Interest received from money market transactions 0 3Interest received from marketable securities portfolio 4 9Other interest income 0 0
Interest Expenses 15 21Interest on deposits 12 16Interest on money market transactions 1 1Interest on funds borrowed 1 3Interest on securities issued 0 0Other interest expenses 0 0
Net Interest Income/Expenses 17 16Net Fees and Commissions Income/Expenses 1 2
Fees and commissions received 2 2Fees and commissions paid 1 0
Dividend Income 1 1Trading Profit/Loss (net) 0 2
Profit/loss on trading account securities 1 1Profit/losses on derivative financial transactions 1 0Foreign exchange profit/loss -3 1
Other Operating Income 2 2Total Operating Income/Expenses 21 22Provision for Loan Losses or other Receivables (-) 1 3
Specific provisions of banks loans and other receivables* 1 1General provision expenses* 0 0
Other Operating Expenses (-) 18 18Personnel Expenses* 9 10
Net Operating Profit/Loss 2 1Surplus written as gain after merger 0 0Profit/losses from equity method applied subsidiaries 0 0Net monetory position gain/loss 0 0Profit/Loss Before Taxes from Continuing Operations 2 1Provisions for Taxes on Income from Continuing Operations (±) 0 0Net Profit/Loss from Continuing Operations 2 1Net Profit/Loss Before Taxes from Terminated Operations 0 0Provisions for Taxes on Income from Terminated Operations (±) 0 0Net Profit/Loss from Terminated Operations 0 0
Net Profit/Losses 2 1
* Used from information and disclosures related to income statement".

II-85
Turkish Bank A. . December 2010
Ratios(%)
Dec. 2010 Dec. 2009
Capital Ratios
Shareholders’ Equity / (Amount subject to credit + market + operational risk) 24.7 28.8
Shareholders' Equity / Total Assets 15.2 14.8
(Shareholders' Equity - Permanent Assets) / Total Assets 10.6 10.4
Net On Balance Sheet Position / Total Shareholders' Equity -47.5 5.3
Net On and Off Balance Sheet Position / Total Shareholders' Equity 0.7 -0.7
Balance-Sheet Ratios
TC Assets / Total Assets 76.3 54.9
TC Liabilities / Total Liabilities 69.2 55.7
FC Assets / FC Liabilities 77.1 101.7
TC Deposits / Total Deposits 61.5 41.6
TC Loans / Total Loans and Receivables 72.1 58.0
Total Deposits / Total Assets 62.5 51.6
Funds Borrowed / Total Assets 15.6 27.9
Assets Quality
Financial Assets (net) / Total Assets 8.5 8.9
Total Loans and Receivables / Total Assets 40.3 22.7
Total Loans and Receivables / Total Deposits 64.5 44.1
Loans Under Follow-up (gross) / Total Loans and Receivables 4.4 6.3
Loans Under Follow-up (net) / Total Loans and Receivables 2.4 2.7
Specific Provisions / Loans Under Follow-up 45.1 56.4
Permanent Assets / Total Assets 4.6 4.4
Consumer Loans / Total Loans and Receivables 1.1 1.7
Liquidity
Liquid Assets / Total Assets 54.9 73.1
Liquid Assets / Short-term Liabilities 70.3 91.4
TC Liquid Assets / Total Assets 42.4 37.7
Profitability
Net Profit/Losses / Total Assets 0.3 0.1
Net Profit/Losses / Total Shareholders' Equity 2.1 0.8
Profit/Losses Before Taxes after Continuing Operations / Total Assets 0.3 0.1
Income-Expenditure Structure
Net Interest Income After Specific Provisions / Total Assets 2.4 2.2
Net Interest Income After Specific Provisions / Total Operating Income (Expenses) 75.3 67.9
Non-interest Income (net) / Total Assets 0.6 0.9
Other Operating Expenses / Total Assets 2.7 2.6
Personnel Expenses / Other Operating Expenses 50.8 55.8
Non-interest Income (net) / Other Operating Expenses 24.0 34.6
Quarterly profitability and income-expenditure ratios, except year-end figures, should be considered periodically.
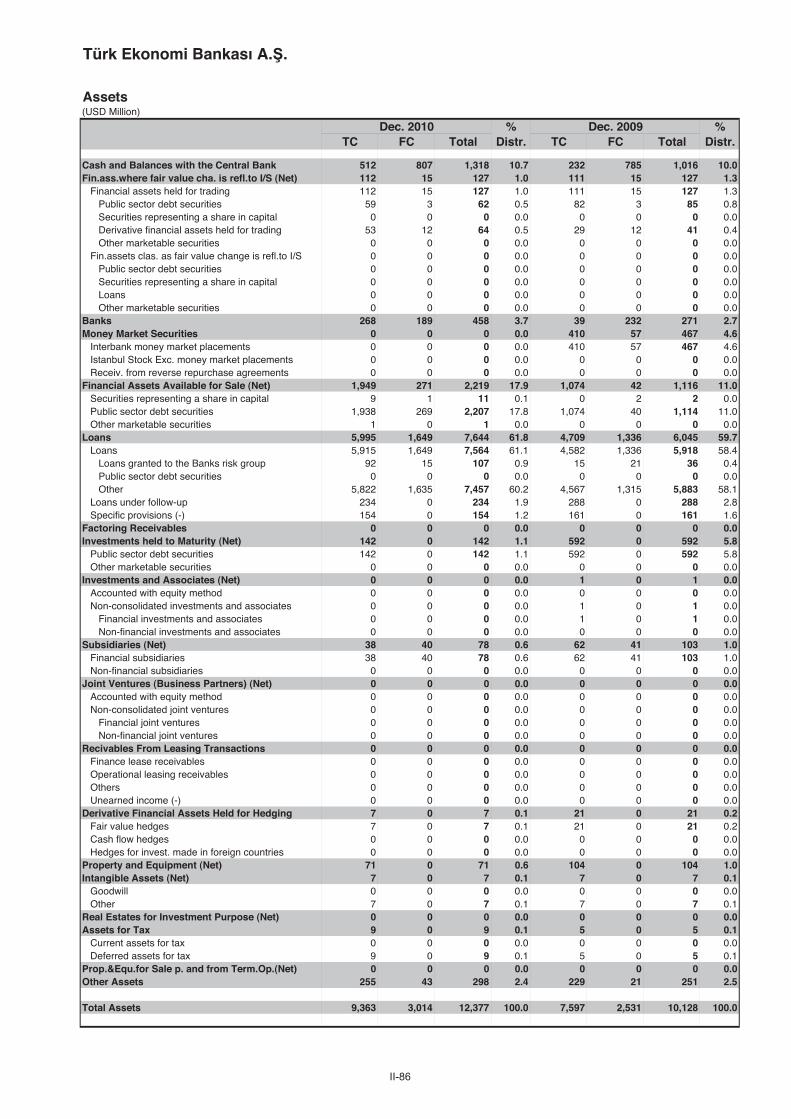
II-86
Türk Ekonomi Bankası A. .
Assets(USD Million)
Dec. 2010 % Dec. 2009 %TC FC Total Distr. TC FC Total Distr.
Cash and Balances with the Central Bank 512 807 1,318 10.7 232 785 1,016 10.0Fin.ass.where fair value cha. is refl.to I/S (Net) 112 15 127 1.0 111 15 127 1.3
Financial assets held for trading 112 15 127 1.0 111 15 127 1.3Public sector debt securities 59 3 62 0.5 82 3 85 0.8Securities representing a share in capital 0 0 0 0.0 0 0 0 0.0Derivative financial assets held for trading 53 12 64 0.5 29 12 41 0.4Other marketable securities 0 0 0 0.0 0 0 0 0.0
Fin.assets clas. as fair value change is refl.to I/S 0 0 0 0.0 0 0 0 0.0Public sector debt securities 0 0 0 0.0 0 0 0 0.0Securities representing a share in capital 0 0 0 0.0 0 0 0 0.0Loans 0 0 0 0.0 0 0 0 0.0Other marketable securities 0 0 0 0.0 0 0 0 0.0
Banks 268 189 458 3.7 39 232 271 2.7Money Market Securities 0 0 0 0.0 410 57 467 4.6
Interbank money market placements 0 0 0 0.0 410 57 467 4.6Istanbul Stock Exc. money market placements 0 0 0 0.0 0 0 0 0.0Receiv. from reverse repurchase agreements 0 0 0 0.0 0 0 0 0.0
Financial Assets Available for Sale (Net) 1,949 271 2,219 17.9 1,074 42 1,116 11.0Securities representing a share in capital 9 1 11 0.1 0 2 2 0.0Public sector debt securities 1,938 269 2,207 17.8 1,074 40 1,114 11.0Other marketable securities 1 0 1 0.0 0 0 0 0.0
Loans 5,995 1,649 7,644 61.8 4,709 1,336 6,045 59.7Loans 5,915 1,649 7,564 61.1 4,582 1,336 5,918 58.4
Loans granted to the Banks risk group 92 15 107 0.9 15 21 36 0.4Public sector debt securities 0 0 0 0.0 0 0 0 0.0Other 5,822 1,635 7,457 60.2 4,567 1,315 5,883 58.1
Loans under follow-up 234 0 234 1.9 288 0 288 2.8Specific provisions (-) 154 0 154 1.2 161 0 161 1.6
Factoring Receivables 0 0 0 0.0 0 0 0 0.0Investments held to Maturity (Net) 142 0 142 1.1 592 0 592 5.8
Public sector debt securities 142 0 142 1.1 592 0 592 5.8Other marketable securities 0 0 0 0.0 0 0 0 0.0
Investments and Associates (Net) 0 0 0 0.0 1 0 1 0.0Accounted with equity method 0 0 0 0.0 0 0 0 0.0Non-consolidated investments and associates 0 0 0 0.0 1 0 1 0.0
Financial investments and associates 0 0 0 0.0 1 0 1 0.0Non-financial investments and associates 0 0 0 0.0 0 0 0 0.0
Subsidiaries (Net) 38 40 78 0.6 62 41 103 1.0Financial subsidiaries 38 40 78 0.6 62 41 103 1.0Non-financial subsidiaries 0 0 0 0.0 0 0 0 0.0
Joint Ventures (Business Partners) (Net) 0 0 0 0.0 0 0 0 0.0Accounted with equity method 0 0 0 0.0 0 0 0 0.0Non-consolidated joint ventures 0 0 0 0.0 0 0 0 0.0
Financial joint ventures 0 0 0 0.0 0 0 0 0.0Non-financial joint ventures 0 0 0 0.0 0 0 0 0.0
Recivables From Leasing Transactions 0 0 0 0.0 0 0 0 0.0Finance lease receivables 0 0 0 0.0 0 0 0 0.0Operational leasing receivables 0 0 0 0.0 0 0 0 0.0Others 0 0 0 0.0 0 0 0 0.0Unearned income (-) 0 0 0 0.0 0 0 0 0.0
Derivative Financial Assets Held for Hedging 7 0 7 0.1 21 0 21 0.2Fair value hedges 7 0 7 0.1 21 0 21 0.2Cash flow hedges 0 0 0 0.0 0 0 0 0.0Hedges for invest. made in foreign countries 0 0 0 0.0 0 0 0 0.0
Property and Equipment (Net) 71 0 71 0.6 104 0 104 1.0Intangible Assets (Net) 7 0 7 0.1 7 0 7 0.1
Goodwill 0 0 0 0.0 0 0 0 0.0Other 7 0 7 0.1 7 0 7 0.1
Real Estates for Investment Purpose (Net) 0 0 0 0.0 0 0 0 0.0Assets for Tax 9 0 9 0.1 5 0 5 0.1
Current assets for tax 0 0 0 0.0 0 0 0 0.0Deferred assets for tax 9 0 9 0.1 5 0 5 0.1
Prop.&Equ.for Sale p. and from Term.Op.(Net) 0 0 0 0.0 0 0 0 0.0Other Assets 255 43 298 2.4 229 21 251 2.5
Total Assets 9,363 3,014 12,377 100.0 7,597 2,531 10,128 100.0

II-87
Türk Ekonomi Bankası A. . December 2010
Liabilities(USD Million)
Dec. 2010 % Dec. 2009 %TC FC Total Distr. TC FC Total Distr.
Deposits 5,468 2,336 7,804 63.1 3,945 2,390 6,335 62.5Deposits held by the Banks risk group 768 165 933 7.5 96 192 288 2.8Other 4,700 2,171 6,871 55.5 3,849 2,197 6,047 59.7
Derivative Finan. Liabilities Held for Trading 42 20 62 0.5 20 15 35 0.3Funds Borrowed 1,308 1,036 2,344 18.9 530 579 1,109 11.0Money Market Takings 48 0 48 0.4 721 0 721 7.1
Interbank money market takings 0 0 0 0.0 0 0 0 0.0Istanbul Stock Exc. money market takings 0 0 0 0.0 0 0 0 0.0Funds provided under repurchase agreements 48 0 48 0.4 721 0 721 7.1
Marketable Securities Issued (Net) 0 0 0 0.0 0 0 0 0.0Bills 0 0 0 0.0 0 0 0 0.0Asset backed securities 0 0 0 0.0 0 0 0 0.0Bonds 0 0 0 0.0 0 0 0 0.0
Funds 0 0 0 0.0 0 0 0 0.0Borrower funds 0 0 0 0.0 0 0 0 0.0Others 0 0 0 0.0 0 0 0 0.0
Miscellaneous Payables 206 13 219 1.8 165 8 173 1.7Other External Resources 198 1 199 1.6 160 0 160 1.6Factoring Payables 0 0 0 0.0 0 0 0 0.0Leasing Transactions Payables (Net) 0 0 0 0.0 0 0 0 0.0
Finance leasing payables 0 0 0 0.0 0 0 0 0.0Operations leasing payables 0 0 0 0.0 0 0 0 0.0Others 0 0 0 0.0 0 0 0 0.0Deferred finance leasing expenses (-) 0 0 0 0.0 0 0 0 0.0
Derivative Finan. Liabilities Held for Hedging 37 0 37 0.3 49 0 49 0.5Fair value hedges 37 0 37 0.3 49 0 49 0.5Cash flow hedges 0 0 0 0.0 0 0 0 0.0Hedges for invest. made in foreign countries 0 0 0 0.0 0 0 0 0.0
Provisions 112 13 124 1.0 81 8 89 0.9General provisions 57 13 69 0.6 42 8 50 0.5Restructuring reserves 0 0 0 0.0 0 0 0 0.0Reserves for employee benefit 37 0 37 0.3 12 0 12 0.1Insurance technical reserves (Net) 0 0 0 0.0 0 0 0 0.0Other provisions 18 0 18 0.1 27 0 27 0.3
Liabilities for Tax 54 0 54 0.4 23 0 23 0.2Current liabilities for tax 54 0 54 0.4 23 0 23 0.2Deferred liabilities for tax 0 0 0 0.0 0 0 0 0.0
Lia.for Pro.&Equ.for Sale p. and from Term.Op.(Net) 0 0 0 0.0 0 0 0 0.0Subordinated Loans 0 307 307 2.5 0 325 325 3.2Shareholders' Equity 1,179 0 1,179 9.5 1,106 3 1,109 10.9
Paid-in capital 715 0 715 5.8 740 0 740 7.3Supplementary capital 62 0 62 0.5 13 3 17 0.2
Share premium 1 0 1 0.0 1 0 1 0.0Share cancellation profits 0 0 0 0.0 0 0 0 0.0Valuation changes in marketable securities 60 0 60 0.5 11 3 14 0.1Revaluation changes of property and equip. 0 0 0 0.0 0 0 0 0.0Revaluation changes of intangible assets 0 0 0 0.0 0 0 0 0.0Revaluation changes of real est.for inv. pur. 0 0 0 0.0 0 0 0 0.0Free shares from inv.&ass.,subs.& joint vent. 0 0 0 0.0 0 0 0 0.0Hedging funds (active part) 0 0 0 0.0 0 0 0 0.0Val.inc.in pro.& equ.held for sale p.and term.ope. 0 0 0 0.0 0 0 0 0.0Other capital reserves 1 0 1 0.0 1 0 1 0.0
Profit reserves 207 0 207 1.7 212 0 212 2.1Legal reserves 30 0 30 0.2 24 0 24 0.2Status reserves 0 0 0 0.0 0 0 0 0.0Extraordinary reserves 177 0 177 1.4 188 0 188 1.9Other profit reserves 0 0 0 0.0 0 0 0 0.0
Profit or loss 195 0 195 1.6 141 0 141 1.4Prior years income/loss 0 0 0 0.0 0 0 0 0.0Current year income/loss 195 0 195 1.6 141 0 141 1.4
Total Liabilities 8,652 3,726 12,377 100.0 6,799 3,329 10,128 100.0

II-88
Türk Ekonomi Bankası A. .
Off Balance Sheet Commitments(USD Million)
Dec. 2010 Dec. 2009TC FC Total TC FC Total
Guarantees and Warranties 1,291 1,355 2,646 1,031 1,275 2,305Letters of guarantee 1,141 824 1,965 951 849 1,801Bank acceptances 0 36 36 0 26 26Letters of credit 0 440 440 0 338 338Prefinancing given as guarantee 0 0 0 0 0 0Endorsements 0 0 0 0 0 0Other guarantees and warrantees 149 55 205 79 61 140
Commitments 2,146 271 2,417 2,069 428 2,497Irrevocable commitments 2,146 271 2,417 2,069 428 2,497Revocable commitments 0 0 0 0 0 0
Derivative Financial Instruments 2,745 4,560 7,306 1,905 2,998 4,902Derivative finan. instruments held for hedging 223 96 319 316 196 512Trading transactions 2,522 4,464 6,986 1,589 2,802 4,390
Custody and Pledged Securities 19,841 4,931 24,771 91,924 5,005 96,929Items held in Custody 4,945 370 5,315 79,946 324 80,271Pledged Items 14,870 4,556 19,425 11,960 4,678 16,638Acccepted independent guaran. and warran. 26 5 32 17 3 20
Total Off Balance Sheet Commitments 26,023 11,117 37,140 96,929 9,705 106,634
Income-Expenditure(USD Million)
Dec. 2010 Dec. 2009
Interest Income 973 1,099Interest on loans 783 853Interest received from reserve deposits 9 18Interest received from banks 5 9Interest received from money market transactions 1 18Interest received from marketable securities portfolio 174 195Other interest income 1 7
Interest Expenses 474 561Interest on deposits 322 400Interest on money market transactions 106 117Interest on funds borrowed 32 30Interest on securities issued 0 0Other interest expenses 13 14
Net Interest Income/Expenses 499 538Net Fees and Commissions Income/Expenses 272 161
Fees and commissions received 359 242Fees and commissions paid 87 81
Dividend Income 9 8Trading Profit/Loss (net) -3 34
Profit/loss on trading account securities 20 41Profit/losses on derivative financial transactions -137 -123Foreign exchange profit/loss 115 116
Other Operating Income 31 22Total Operating Income/Expenses 809 763Provision for Loan Losses or other Receivables (-) 108 119
Specific provisions of banks loans and other receivables* 78 116General provision expenses* 20 -1
Other Operating Expenses (-) 512 471Personnel Expenses* 228 230
Net Operating Profit/Loss 188 173Surplus written as gain after merger 0 0Profit/losses from equity method applied subsidiaries 0 0Net monetory position gain/loss 0 0Profit/Loss Before Taxes from Continuing Operations 188 173Provisions for Taxes on Income from Continuing Operations (±) -41 -31Net Profit/Loss from Continuing Operations 148 141Net Profit/Loss Before Taxes from Terminated Operations 50 0Provisions for Taxes on Income from Terminated Operations (±) -3 0Net Profit/Loss from Terminated Operations 48 0
Net Profit/Losses 195 141
* Used from information and disclosures related to income statement".

II-89
Türk Ekonomi Bankası A. . December 2010
Ratios(%)
Dec. 2010 Dec. 2009
Capital Ratios
Shareholders’ Equity / (Amount subject to credit + market + operational risk) 14.4 17.7
Shareholders' Equity / Total Assets 9.5 10.9
(Shareholders' Equity - Permanent Assets) / Total Assets 7.6 7.6
Net On Balance Sheet Position / Total Shareholders' Equity -15.4 -31.4
Net On and Off Balance Sheet Position / Total Shareholders' Equity 1.4 1.1
Balance-Sheet Ratios
TC Assets / Total Assets 75.6 75.0
TC Liabilities / Total Liabilities 69.9 67.1
FC Assets / FC Liabilities 80.9 76.0
TC Deposits / Total Deposits 70.1 62.3
TC Loans / Total Loans and Receivables 78.4 77.9
Total Deposits / Total Assets 63.1 62.5
Funds Borrowed / Total Assets 18.9 11.0
Assets Quality
Financial Assets (net) / Total Assets 20.2 18.3
Total Loans and Receivables / Total Assets 61.8 59.7
Total Loans and Receivables / Total Deposits 98.0 95.4
Loans Under Follow-up (gross) / Total Loans and Receivables 3.1 4.8
Loans Under Follow-up (net) / Total Loans and Receivables 1.0 2.1
Specific Provisions / Loans Under Follow-up 65.9 56.0
Permanent Assets / Total Assets 1.9 3.4
Consumer Loans / Total Loans and Receivables 26.1 24.4
Liquidity
Liquid Assets / Total Assets 33.3 29.6
Liquid Assets / Short-term Liabilities 52.6 42.9
TC Liquid Assets / Total Assets 22.9 18.4
Profitability
Net Profit/Losses / Total Assets 1.6 1.4
Net Profit/Losses / Total Shareholders' Equity 16.6 12.7
Profit/Losses Before Taxes after Continuing Operations / Total Assets 1.5 1.7
Income-Expenditure Structure
Net Interest Income After Specific Provisions / Total Assets 3.4 4.2
Net Interest Income After Specific Provisions / Total Operating Income (Expenses) 52.1 55.4
Non-interest Income (net) / Total Assets 2.5 2.2
Other Operating Expenses / Total Assets 4.1 4.7
Personnel Expenses / Other Operating Expenses 44.5 48.8
Non-interest Income (net) / Other Operating Expenses 60.4 47.6
Quarterly profitability and income-expenditure ratios, except year-end figures, should be considered periodically.

II-90
Türkiye Garanti Bankası A. .
Assets(USD Million)
Dec. 2010 % Dec. 2009 %TC FC Total Distr. TC FC Total Distr.
Cash and Balances with the Central Bank 2,057 2,827 4,884 6.1 2,588 2,028 4,616 6.5Fin.ass.where fair value cha. is refl.to I/S (Net) 497 141 637 0.8 527 88 615 0.9
Financial assets held for trading 497 141 637 0.8 527 88 615 0.9Public sector debt securities 362 10 373 0.5 213 10 223 0.3Securities representing a share in capital 5 0 5 0.0 1 0 1 0.0Derivative financial assets held for trading 125 130 255 0.3 307 78 385 0.5Other marketable securities 5 0 5 0.0 6 0 6 0.0
Fin.assets clas. as fair value change is refl.to I/S 0 0 0 0.0 0 0 0 0.0Public sector debt securities 0 0 0 0.0 0 0 0 0.0Securities representing a share in capital 0 0 0 0.0 0 0 0 0.0Loans 0 0 0 0.0 0 0 0 0.0Other marketable securities 0 0 0 0.0 0 0 0 0.0
Banks 1,626 3,786 5,412 6.7 1,693 3,911 5,604 7.9Money Market Securities 0 0 0 0.0 672 0 672 0.9
Interbank money market placements 0 0 0 0.0 672 0 672 0.9Istanbul Stock Exc. money market placements 0 0 0 0.0 0 0 0 0.0Receiv. from reverse repurchase agreements 0 0 0 0.0 0 0 0 0.0
Financial Assets Available for Sale (Net) 19,414 1,616 21,030 26.1 16,956 1,934 18,890 26.6Securities representing a share in capital 39 45 84 0.1 37 52 89 0.1Public sector debt securities 18,694 627 19,321 24.0 16,777 706 17,483 24.7Other marketable securities 681 944 1,626 2.0 142 1,176 1,318 1.9
Loans 24,257 17,905 42,161 52.3 19,218 14,220 33,438 47.2Loans 24,028 17,905 41,933 52.0 18,932 14,220 33,153 46.8
Loans granted to the Banks risk group 68 858 927 1.1 171 200 371 0.5Public sector debt securities 0 0 0 0.0 0 0 0 0.0Other 23,960 17,046 41,006 50.9 18,762 14,020 32,782 46.2
Loans under follow-up 1,261 0 1,261 1.6 1,504 0 1,504 2.1Specific provisions (-) 1,032 0 1,032 1.3 1,219 0 1,219 1.7
Factoring Receivables 0 0 0 0.0 0 0 0 0.0Investments held to Maturity (Net) 2,979 854 3,833 4.8 4,007 932 4,939 7.0
Public sector debt securities 2,976 854 3,831 4.8 4,007 932 4,939 7.0Other marketable securities 3 0 3 0.0 0 0 0 0.0
Investments and Associates (Net) 19 0 19 0.0 20 0 20 0.0Accounted with equity method 0 0 0 0.0 0 0 0 0.0Non-consolidated investments and associates 19 0 19 0.0 20 0 20 0.0
Financial investments and associates 18 0 18 0.0 19 0 19 0.0Non-financial investments and associates 1 0 1 0.0 1 0 1 0.0
Subsidiaries (Net) 190 886 1,076 1.3 191 483 675 1.0Financial subsidiaries 179 886 1,065 1.3 182 483 665 0.9Non-financial subsidiaries 11 0 11 0.0 10 0 10 0.0
Joint Ventures (Business Partners) (Net) 0 0 0 0.0 0 0 0 0.0Accounted with equity method 0 0 0 0.0 0 0 0 0.0Non-consolidated joint ventures 0 0 0 0.0 0 0 0 0.0
Financial joint ventures 0 0 0 0.0 0 0 0 0.0Non-financial joint ventures 0 0 0 0.0 0 0 0 0.0
Recivables From Leasing Transactions 0 0 0 0.0 0 0 0 0.0Finance lease receivables 0 0 0 0.0 0 0 0 0.0Operational leasing receivables 0 0 0 0.0 0 0 0 0.0Others 0 0 0 0.0 0 0 0 0.0Unearned income (-) 0 0 0 0.0 0 0 0 0.0
Derivative Financial Assets Held for Hedging 0 0 0 0.0 0 0 0 0.0Fair value hedges 0 0 0 0.0 0 0 0 0.0Cash flow hedges 0 0 0 0.0 0 0 0 0.0Hedges for invest. made in foreign countries 0 0 0 0.0 0 0 0 0.0
Property and Equipment (Net) 781 0 781 1.0 767 1 768 1.1Intangible Assets (Net) 20 0 20 0.0 14 0 14 0.0
Goodwill 0 0 0 0.0 0 0 0 0.0Other 20 0 20 0.0 14 0 14 0.0
Real Estates for Investment Purpose (Net) 0 0 0 0.0 0 0 0 0.0Assets for Tax 69 0 69 0.1 15 0 15 0.0
Current assets for tax 0 0 0 0.0 3 0 3 0.0Deferred assets for tax 69 0 69 0.1 12 0 12 0.0
Prop.&Equ.for Sale p. and from Term.Op.(Net) 64 0 64 0.1 55 0 55 0.1Other Assets 604 30 633 0.8 560 27 587 0.8
Total Assets 52,577 28,045 80,621 100.0 47,284 23,624 70,908 100.0
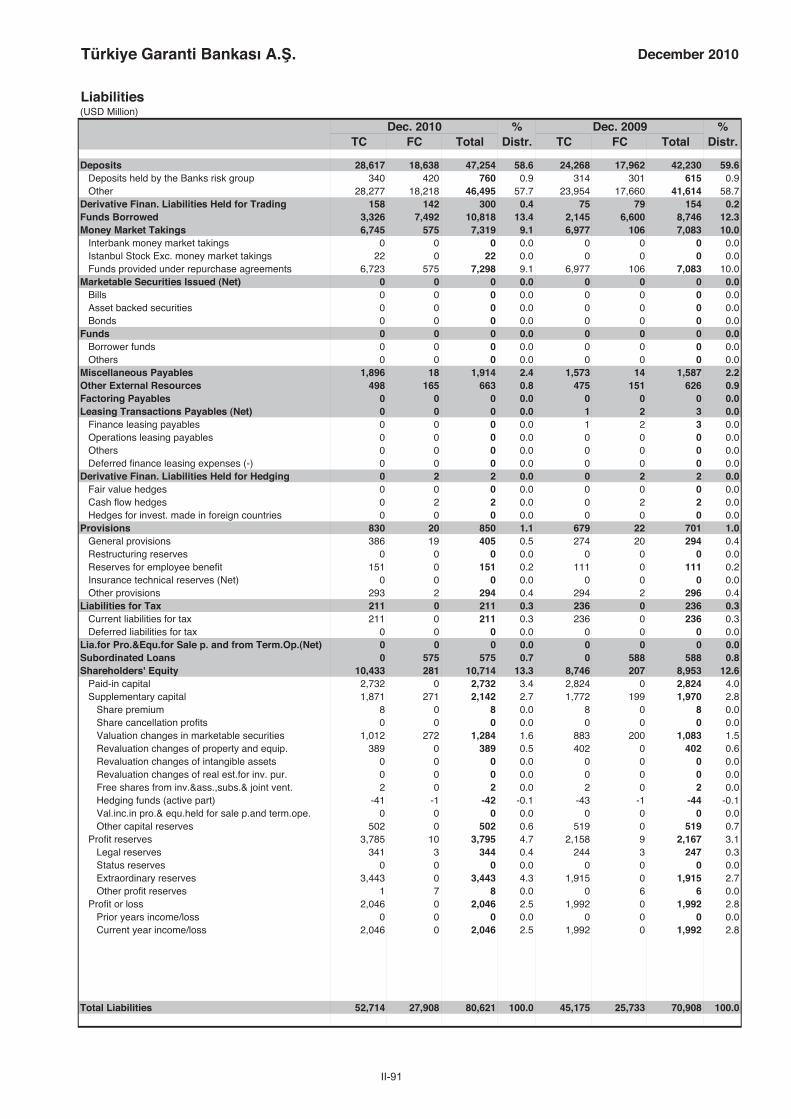
II-91
Türkiye Garanti Bankası A. . December 2010
Liabilities(USD Million)
Dec. 2010 % Dec. 2009 %TC FC Total Distr. TC FC Total Distr.
Deposits 28,617 18,638 47,254 58.6 24,268 17,962 42,230 59.6Deposits held by the Banks risk group 340 420 760 0.9 314 301 615 0.9Other 28,277 18,218 46,495 57.7 23,954 17,660 41,614 58.7
Derivative Finan. Liabilities Held for Trading 158 142 300 0.4 75 79 154 0.2Funds Borrowed 3,326 7,492 10,818 13.4 2,145 6,600 8,746 12.3Money Market Takings 6,745 575 7,319 9.1 6,977 106 7,083 10.0
Interbank money market takings 0 0 0 0.0 0 0 0 0.0Istanbul Stock Exc. money market takings 22 0 22 0.0 0 0 0 0.0Funds provided under repurchase agreements 6,723 575 7,298 9.1 6,977 106 7,083 10.0
Marketable Securities Issued (Net) 0 0 0 0.0 0 0 0 0.0Bills 0 0 0 0.0 0 0 0 0.0Asset backed securities 0 0 0 0.0 0 0 0 0.0Bonds 0 0 0 0.0 0 0 0 0.0
Funds 0 0 0 0.0 0 0 0 0.0Borrower funds 0 0 0 0.0 0 0 0 0.0Others 0 0 0 0.0 0 0 0 0.0
Miscellaneous Payables 1,896 18 1,914 2.4 1,573 14 1,587 2.2Other External Resources 498 165 663 0.8 475 151 626 0.9Factoring Payables 0 0 0 0.0 0 0 0 0.0Leasing Transactions Payables (Net) 0 0 0 0.0 1 2 3 0.0
Finance leasing payables 0 0 0 0.0 1 2 3 0.0Operations leasing payables 0 0 0 0.0 0 0 0 0.0Others 0 0 0 0.0 0 0 0 0.0Deferred finance leasing expenses (-) 0 0 0 0.0 0 0 0 0.0
Derivative Finan. Liabilities Held for Hedging 0 2 2 0.0 0 2 2 0.0Fair value hedges 0 0 0 0.0 0 0 0 0.0Cash flow hedges 0 2 2 0.0 0 2 2 0.0Hedges for invest. made in foreign countries 0 0 0 0.0 0 0 0 0.0
Provisions 830 20 850 1.1 679 22 701 1.0General provisions 386 19 405 0.5 274 20 294 0.4Restructuring reserves 0 0 0 0.0 0 0 0 0.0Reserves for employee benefit 151 0 151 0.2 111 0 111 0.2Insurance technical reserves (Net) 0 0 0 0.0 0 0 0 0.0Other provisions 293 2 294 0.4 294 2 296 0.4
Liabilities for Tax 211 0 211 0.3 236 0 236 0.3Current liabilities for tax 211 0 211 0.3 236 0 236 0.3Deferred liabilities for tax 0 0 0 0.0 0 0 0 0.0
Lia.for Pro.&Equ.for Sale p. and from Term.Op.(Net) 0 0 0 0.0 0 0 0 0.0Subordinated Loans 0 575 575 0.7 0 588 588 0.8Shareholders' Equity 10,433 281 10,714 13.3 8,746 207 8,953 12.6
Paid-in capital 2,732 0 2,732 3.4 2,824 0 2,824 4.0Supplementary capital 1,871 271 2,142 2.7 1,772 199 1,970 2.8
Share premium 8 0 8 0.0 8 0 8 0.0Share cancellation profits 0 0 0 0.0 0 0 0 0.0Valuation changes in marketable securities 1,012 272 1,284 1.6 883 200 1,083 1.5Revaluation changes of property and equip. 389 0 389 0.5 402 0 402 0.6Revaluation changes of intangible assets 0 0 0 0.0 0 0 0 0.0Revaluation changes of real est.for inv. pur. 0 0 0 0.0 0 0 0 0.0Free shares from inv.&ass.,subs.& joint vent. 2 0 2 0.0 2 0 2 0.0Hedging funds (active part) -41 -1 -42 -0.1 -43 -1 -44 -0.1Val.inc.in pro.& equ.held for sale p.and term.ope. 0 0 0 0.0 0 0 0 0.0Other capital reserves 502 0 502 0.6 519 0 519 0.7
Profit reserves 3,785 10 3,795 4.7 2,158 9 2,167 3.1Legal reserves 341 3 344 0.4 244 3 247 0.3Status reserves 0 0 0 0.0 0 0 0 0.0Extraordinary reserves 3,443 0 3,443 4.3 1,915 0 1,915 2.7Other profit reserves 1 7 8 0.0 0 6 6 0.0
Profit or loss 2,046 0 2,046 2.5 1,992 0 1,992 2.8Prior years income/loss 0 0 0 0.0 0 0 0 0.0Current year income/loss 2,046 0 2,046 2.5 1,992 0 1,992 2.8
Total Liabilities 52,714 27,908 80,621 100.0 45,175 25,733 70,908 100.0
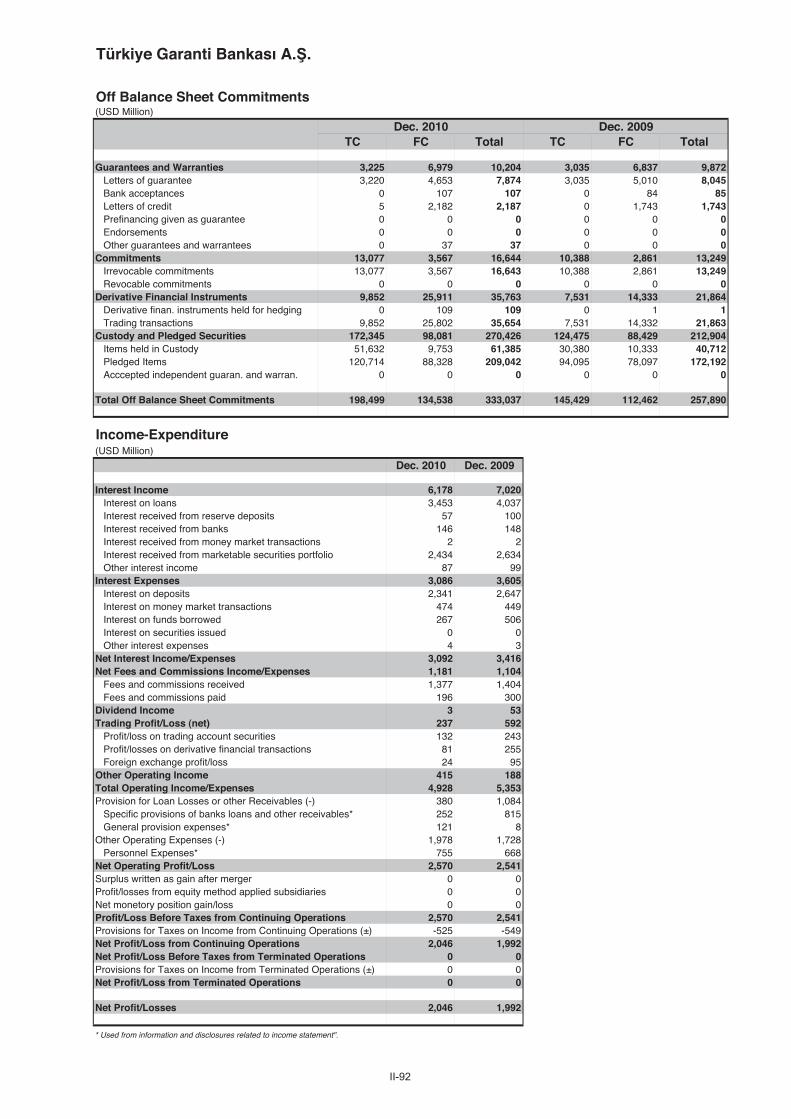
II-92
Türkiye Garanti Bankası A. .
Off Balance Sheet Commitments(USD Million)
Dec. 2010 Dec. 2009TC FC Total TC FC Total
Guarantees and Warranties 3,225 6,979 10,204 3,035 6,837 9,872Letters of guarantee 3,220 4,653 7,874 3,035 5,010 8,045Bank acceptances 0 107 107 0 84 85Letters of credit 5 2,182 2,187 0 1,743 1,743Prefinancing given as guarantee 0 0 0 0 0 0Endorsements 0 0 0 0 0 0Other guarantees and warrantees 0 37 37 0 0 0
Commitments 13,077 3,567 16,644 10,388 2,861 13,249Irrevocable commitments 13,077 3,567 16,643 10,388 2,861 13,249Revocable commitments 0 0 0 0 0 0
Derivative Financial Instruments 9,852 25,911 35,763 7,531 14,333 21,864Derivative finan. instruments held for hedging 0 109 109 0 1 1Trading transactions 9,852 25,802 35,654 7,531 14,332 21,863
Custody and Pledged Securities 172,345 98,081 270,426 124,475 88,429 212,904Items held in Custody 51,632 9,753 61,385 30,380 10,333 40,712Pledged Items 120,714 88,328 209,042 94,095 78,097 172,192Acccepted independent guaran. and warran. 0 0 0 0 0 0
Total Off Balance Sheet Commitments 198,499 134,538 333,037 145,429 112,462 257,890
Income-Expenditure(USD Million)
Dec. 2010 Dec. 2009
Interest Income 6,178 7,020Interest on loans 3,453 4,037Interest received from reserve deposits 57 100Interest received from banks 146 148Interest received from money market transactions 2 2Interest received from marketable securities portfolio 2,434 2,634Other interest income 87 99
Interest Expenses 3,086 3,605Interest on deposits 2,341 2,647Interest on money market transactions 474 449Interest on funds borrowed 267 506Interest on securities issued 0 0Other interest expenses 4 3
Net Interest Income/Expenses 3,092 3,416Net Fees and Commissions Income/Expenses 1,181 1,104
Fees and commissions received 1,377 1,404Fees and commissions paid 196 300
Dividend Income 3 53Trading Profit/Loss (net) 237 592
Profit/loss on trading account securities 132 243Profit/losses on derivative financial transactions 81 255Foreign exchange profit/loss 24 95
Other Operating Income 415 188Total Operating Income/Expenses 4,928 5,353Provision for Loan Losses or other Receivables (-) 380 1,084
Specific provisions of banks loans and other receivables* 252 815General provision expenses* 121 8
Other Operating Expenses (-) 1,978 1,728Personnel Expenses* 755 668
Net Operating Profit/Loss 2,570 2,541Surplus written as gain after merger 0 0Profit/losses from equity method applied subsidiaries 0 0Net monetory position gain/loss 0 0Profit/Loss Before Taxes from Continuing Operations 2,570 2,541Provisions for Taxes on Income from Continuing Operations (±) -525 -549Net Profit/Loss from Continuing Operations 2,046 1,992Net Profit/Loss Before Taxes from Terminated Operations 0 0Provisions for Taxes on Income from Terminated Operations (±) 0 0Net Profit/Loss from Terminated Operations 0 0
Net Profit/Losses 2,046 1,992
* Used from information and disclosures related to income statement".

II-93
Türkiye Garanti Bankası A. . December 2010
Ratios(%)
Dec. 2010 Dec. 2009
Capital Ratios
Shareholders’ Equity / (Amount subject to credit + market + operational risk) 19.6 21.2
Shareholders' Equity / Total Assets 13.3 12.6
(Shareholders' Equity - Permanent Assets) / Total Assets 10.6 10.1
Net On Balance Sheet Position / Total Shareholders' Equity 17.3 -6.4
Net On and Off Balance Sheet Position / Total Shareholders' Equity -1.4 0.4
Balance-Sheet Ratios
TC Assets / Total Assets 65.2 66.7
TC Liabilities / Total Liabilities 65.4 63.7
FC Assets / FC Liabilities 100.5 91.8
TC Deposits / Total Deposits 60.6 57.5
TC Loans / Total Loans and Receivables 57.5 57.5
Total Deposits / Total Assets 58.6 59.6
Funds Borrowed / Total Assets 13.4 12.3
Assets Quality
Financial Assets (net) / Total Assets 31.6 34.5
Total Loans and Receivables / Total Assets 52.3 47.2
Total Loans and Receivables / Total Deposits 89.2 79.2
Loans Under Follow-up (gross) / Total Loans and Receivables 3.0 4.5
Loans Under Follow-up (net) / Total Loans and Receivables 0.5 0.9
Specific Provisions / Loans Under Follow-up 81.9 81.0
Permanent Assets / Total Assets 2.7 2.6
Consumer Loans / Total Loans and Receivables 33.2 33.8
Liquidity
Liquid Assets / Total Assets 39.6 42.9
Liquid Assets / Short-term Liabilities 65.4 66.4
TC Liquid Assets / Total Assets 29.3 31.6
Profitability
Net Profit/Losses / Total Assets 2.5 2.8
Net Profit/Losses / Total Shareholders' Equity 19.1 22.2
Profit/Losses Before Taxes after Continuing Operations / Total Assets 3.2 3.6
Income-Expenditure Structure
Net Interest Income After Specific Provisions / Total Assets 3.5 3.7
Net Interest Income After Specific Provisions / Total Operating Income (Expenses) 57.6 48.6
Non-interest Income (net) / Total Assets 2.3 2.7
Other Operating Expenses / Total Assets 2.5 2.4
Personnel Expenses / Other Operating Expenses 38.2 38.7
Non-interest Income (net) / Other Operating Expenses 92.8 112.1
Quarterly profitability and income-expenditure ratios, except year-end figures, should be considered periodically.

II-94
Türkiye Bankası A. .
Assets(USD Million)
Dec. 2010 % Dec. 2009 %TC FC Total Distr. TC FC Total Distr.
Cash and Balances with the Central Bank 2,595 2,948 5,543 6.5 3,895 1,995 5,890 7.7Fin.ass.where fair value cha. is refl.to I/S (Net) 310 167 477 0.6 273 62 336 0.4
Financial assets held for trading 310 167 477 0.6 273 62 336 0.4Public sector debt securities 297 10 307 0.4 253 2 255 0.3Securities representing a share in capital 0 0 0 0.0 0 0 0 0.0Derivative financial assets held for trading 13 157 170 0.2 20 60 80 0.1Other marketable securities 0 0 0 0.0 0 0 0 0.0
Fin.assets clas. as fair value change is refl.to I/S 0 0 0 0.0 0 0 0 0.0Public sector debt securities 0 0 0 0.0 0 0 0 0.0Securities representing a share in capital 0 0 0 0.0 0 0 0 0.0Loans 0 0 0 0.0 0 0 0 0.0Other marketable securities 0 0 0 0.0 0 0 0 0.0
Banks 120 1,952 2,071 2.4 136 5,534 5,670 7.4Money Market Securities 0 0 0 0.0 0 0 0 0.0
Interbank money market placements 0 0 0 0.0 0 0 0 0.0Istanbul Stock Exc. money market placements 0 0 0 0.0 0 0 0 0.0Receiv. from reverse repurchase agreements 0 0 0 0.0 0 0 0 0.0
Financial Assets Available for Sale (Net) 14,002 6,394 20,396 23.8 10,366 7,103 17,468 22.9Securities representing a share in capital 8 0 8 0.0 8 0 8 0.0Public sector debt securities 13,994 4,098 18,091 21.1 10,357 5,574 15,931 20.9Other marketable securities 0 2,296 2,296 2.7 0 1,529 1,529 2.0
Loans 28,503 13,271 41,774 48.7 23,153 9,345 32,498 42.7Loans 28,503 13,271 41,774 48.7 23,153 9,345 32,498 42.7
Loans granted to the Banks risk group 169 386 555 0.6 111 297 408 0.5Public sector debt securities 0 0 0 0.0 0 0 0 0.0Other 28,335 12,884 41,219 48.1 23,042 9,049 32,090 42.2
Loans under follow-up 1,532 33 1,566 1.8 1,825 36 1,861 2.4Specific provisions (-) 1,532 33 1,566 1.8 1,825 36 1,861 2.4
Factoring Receivables 0 0 0 0.0 0 0 0 0.0Investments held to Maturity (Net) 8,840 8 8,848 10.3 7,802 892 8,693 11.4
Public sector debt securities 8,836 0 8,836 10.3 7,798 0 7,798 10.2Other marketable securities 4 8 12 0.0 4 892 895 1.2
Investments and Associates (Net) 483 0 483 0.6 500 0 500 0.7Accounted with equity method 0 0 0 0.0 0 0 0 0.0Non-consolidated investments and associates 483 0 483 0.6 500 0 500 0.7
Financial investments and associates 57 0 57 0.1 59 0 59 0.1Non-financial investments and associates 426 0 426 0.5 440 0 440 0.6
Subsidiaries (Net) 3,564 27 3,591 4.2 2,855 28 2,883 3.8Financial subsidiaries 1,789 27 1,816 2.1 1,548 28 1,576 2.1Non-financial subsidiaries 1,774 0 1,774 2.1 1,307 0 1,307 1.7
Joint Ventures (Business Partners) (Net) 0 0 0 0.0 0 0 0 0.0Accounted with equity method 0 0 0 0.0 0 0 0 0.0Non-consolidated joint ventures 0 0 0 0.0 0 0 0 0.0
Financial joint ventures 0 0 0 0.0 0 0 0 0.0Non-financial joint ventures 0 0 0 0.0 0 0 0 0.0
Recivables From Leasing Transactions 0 0 0 0.0 0 0 0 0.0Finance lease receivables 0 0 0 0.0 0 0 0 0.0Operational leasing receivables 0 0 0 0.0 0 0 0 0.0Others 0 0 0 0.0 0 0 0 0.0Unearned income (-) 0 0 0 0.0 0 0 0 0.0
Derivative Financial Assets Held for Hedging 0 0 0 0.0 0 0 0 0.0Fair value hedges 0 0 0 0.0 0 0 0 0.0Cash flow hedges 0 0 0 0.0 0 0 0 0.0Hedges for invest. made in foreign countries 0 0 0 0.0 0 0 0 0.0
Property and Equipment (Net) 1,190 2 1,191 1.4 1,250 2 1,252 1.6Intangible Assets (Net) 21 0 21 0.0 22 0 22 0.0
Goodwill 0 0 0 0.0 0 0 0 0.0Other 21 0 21 0.0 22 0 22 0.0
Real Estates for Investment Purpose (Net) 0 0 0 0.0 0 0 0 0.0Assets for Tax 465 0 465 0.5 343 0 343 0.5
Current assets for tax 0 0 0 0.0 0 0 0 0.0Deferred assets for tax 465 0 465 0.5 343 0 343 0.5
Prop.&Equ.for Sale p. and from Term.Op.(Net) 35 0 35 0.0 18 0 18 0.0Other Assets 474 346 821 1.0 321 233 554 0.7
Total Assets 60,603 25,113 85,716 100.0 50,933 25,193 76,127 100.0
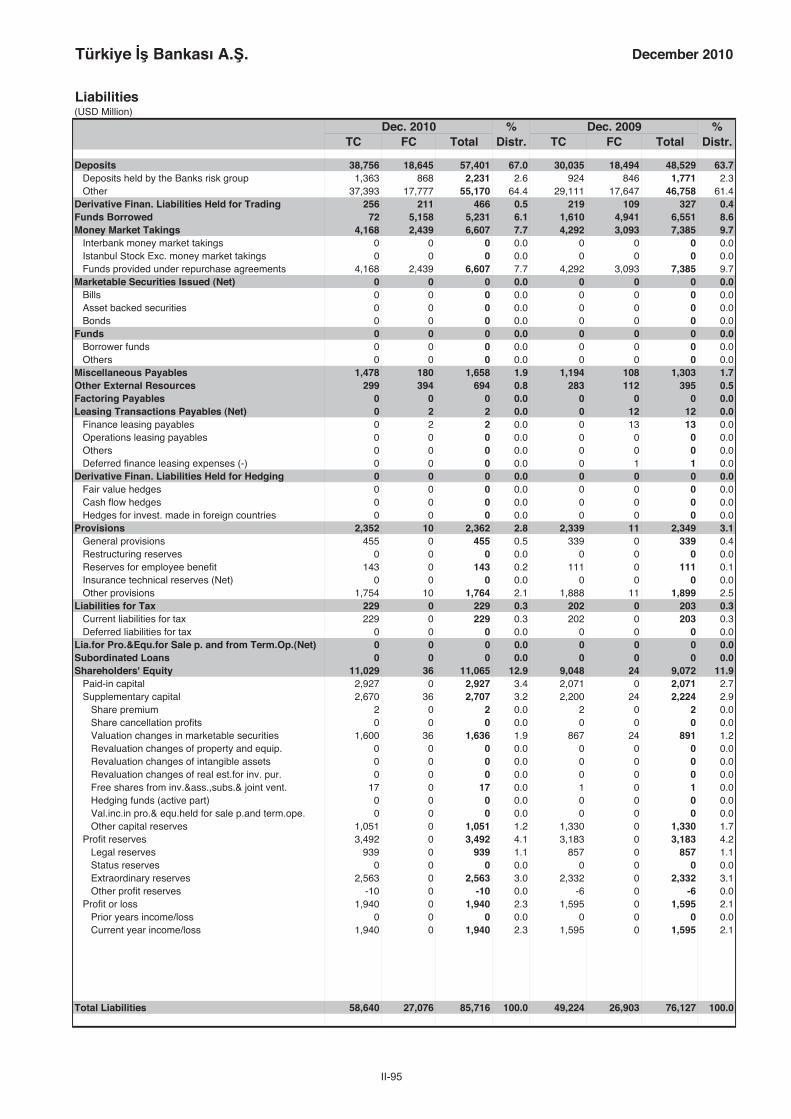
II-95
Türkiye Bankası A. . December 2010
Liabilities(USD Million)
Dec. 2010 % Dec. 2009 %TC FC Total Distr. TC FC Total Distr.
Deposits 38,756 18,645 57,401 67.0 30,035 18,494 48,529 63.7Deposits held by the Banks risk group 1,363 868 2,231 2.6 924 846 1,771 2.3Other 37,393 17,777 55,170 64.4 29,111 17,647 46,758 61.4
Derivative Finan. Liabilities Held for Trading 256 211 466 0.5 219 109 327 0.4Funds Borrowed 72 5,158 5,231 6.1 1,610 4,941 6,551 8.6Money Market Takings 4,168 2,439 6,607 7.7 4,292 3,093 7,385 9.7
Interbank money market takings 0 0 0 0.0 0 0 0 0.0Istanbul Stock Exc. money market takings 0 0 0 0.0 0 0 0 0.0Funds provided under repurchase agreements 4,168 2,439 6,607 7.7 4,292 3,093 7,385 9.7
Marketable Securities Issued (Net) 0 0 0 0.0 0 0 0 0.0Bills 0 0 0 0.0 0 0 0 0.0Asset backed securities 0 0 0 0.0 0 0 0 0.0Bonds 0 0 0 0.0 0 0 0 0.0
Funds 0 0 0 0.0 0 0 0 0.0Borrower funds 0 0 0 0.0 0 0 0 0.0Others 0 0 0 0.0 0 0 0 0.0
Miscellaneous Payables 1,478 180 1,658 1.9 1,194 108 1,303 1.7Other External Resources 299 394 694 0.8 283 112 395 0.5Factoring Payables 0 0 0 0.0 0 0 0 0.0Leasing Transactions Payables (Net) 0 2 2 0.0 0 12 12 0.0
Finance leasing payables 0 2 2 0.0 0 13 13 0.0Operations leasing payables 0 0 0 0.0 0 0 0 0.0Others 0 0 0 0.0 0 0 0 0.0Deferred finance leasing expenses (-) 0 0 0 0.0 0 1 1 0.0
Derivative Finan. Liabilities Held for Hedging 0 0 0 0.0 0 0 0 0.0Fair value hedges 0 0 0 0.0 0 0 0 0.0Cash flow hedges 0 0 0 0.0 0 0 0 0.0Hedges for invest. made in foreign countries 0 0 0 0.0 0 0 0 0.0
Provisions 2,352 10 2,362 2.8 2,339 11 2,349 3.1General provisions 455 0 455 0.5 339 0 339 0.4Restructuring reserves 0 0 0 0.0 0 0 0 0.0Reserves for employee benefit 143 0 143 0.2 111 0 111 0.1Insurance technical reserves (Net) 0 0 0 0.0 0 0 0 0.0Other provisions 1,754 10 1,764 2.1 1,888 11 1,899 2.5
Liabilities for Tax 229 0 229 0.3 202 0 203 0.3Current liabilities for tax 229 0 229 0.3 202 0 203 0.3Deferred liabilities for tax 0 0 0 0.0 0 0 0 0.0
Lia.for Pro.&Equ.for Sale p. and from Term.Op.(Net) 0 0 0 0.0 0 0 0 0.0Subordinated Loans 0 0 0 0.0 0 0 0 0.0Shareholders' Equity 11,029 36 11,065 12.9 9,048 24 9,072 11.9
Paid-in capital 2,927 0 2,927 3.4 2,071 0 2,071 2.7Supplementary capital 2,670 36 2,707 3.2 2,200 24 2,224 2.9
Share premium 2 0 2 0.0 2 0 2 0.0Share cancellation profits 0 0 0 0.0 0 0 0 0.0Valuation changes in marketable securities 1,600 36 1,636 1.9 867 24 891 1.2Revaluation changes of property and equip. 0 0 0 0.0 0 0 0 0.0Revaluation changes of intangible assets 0 0 0 0.0 0 0 0 0.0Revaluation changes of real est.for inv. pur. 0 0 0 0.0 0 0 0 0.0Free shares from inv.&ass.,subs.& joint vent. 17 0 17 0.0 1 0 1 0.0Hedging funds (active part) 0 0 0 0.0 0 0 0 0.0Val.inc.in pro.& equ.held for sale p.and term.ope. 0 0 0 0.0 0 0 0 0.0Other capital reserves 1,051 0 1,051 1.2 1,330 0 1,330 1.7
Profit reserves 3,492 0 3,492 4.1 3,183 0 3,183 4.2Legal reserves 939 0 939 1.1 857 0 857 1.1Status reserves 0 0 0 0.0 0 0 0 0.0Extraordinary reserves 2,563 0 2,563 3.0 2,332 0 2,332 3.1Other profit reserves -10 0 -10 0.0 -6 0 -6 0.0
Profit or loss 1,940 0 1,940 2.3 1,595 0 1,595 2.1Prior years income/loss 0 0 0 0.0 0 0 0 0.0Current year income/loss 1,940 0 1,940 2.3 1,595 0 1,595 2.1
Total Liabilities 58,640 27,076 85,716 100.0 49,224 26,903 76,127 100.0

II-96
Türkiye Bankası A. .
Off Balance Sheet Commitments(USD Million)
Dec. 2010 Dec. 2009TC FC Total TC FC Total
Guarantees and Warranties 4,254 5,685 9,939 3,402 5,003 8,405Letters of guarantee 4,251 3,310 7,561 3,366 3,066 6,431Bank acceptances 3 135 138 2 100 102Letters of credit 0 2,020 2,020 0 1,732 1,732Prefinancing given as guarantee 0 0 0 0 0 0Endorsements 0 20 20 0 28 28Other guarantees and warrantees 1 200 201 34 78 113
Commitments 14,830 3,423 18,254 17,625 7,304 24,929Irrevocable commitments 14,830 3,404 18,235 17,625 7,304 24,929Revocable commitments 0 19 19 0 0 0
Derivative Financial Instruments 7,707 19,092 26,799 4,968 8,464 13,433Derivative finan. instruments held for hedging 0 0 0 0 0 0Trading transactions 7,707 19,092 26,799 4,968 8,464 13,433
Custody and Pledged Securities 66,835 14,088 80,923 53,385 11,801 65,186Items held in Custody 20,832 3,407 24,239 17,231 2,792 20,024Pledged Items 46,003 10,681 56,684 36,154 9,009 45,163Acccepted independent guaran. and warran. 0 0 0 0 0 0
Total Off Balance Sheet Commitments 93,627 42,288 135,915 79,380 32,573 111,953
Income-Expenditure(USD Million)
Dec. 2010 Dec. 2009
Interest Income 6,372 6,858Interest on loans 3,868 4,548Interest received from reserve deposits 0 121Interest received from banks 97 63Interest received from money market transactions 4 58Interest received from marketable securities portfolio 2,385 2,029Other interest income 19 38
Interest Expenses 3,392 3,586Interest on deposits 2,770 3,071Interest on money market transactions 332 394Interest on funds borrowed 283 112Interest on securities issued 0 0Other interest expenses 7 9
Net Interest Income/Expenses 2,980 3,273Net Fees and Commissions Income/Expenses 804 842
Fees and commissions received 879 911Fees and commissions paid 75 69
Dividend Income 240 219Trading Profit/Loss (net) 88 275
Profit/loss on trading account securities 335 285Profit/losses on derivative financial transactions -46 229Foreign exchange profit/loss -201 -240
Other Operating Income 1,021 722Total Operating Income/Expenses 5,132 5,330Provision for Loan Losses or other Receivables (-) 738 1,537
Specific provisions of banks loans and other receivables* 500 989General provision expenses* 152 47
Other Operating Expenses (-) 2,083 1,812Personnel Expenses* 1,057 945
Net Operating Profit/Loss 2,311 1,981Surplus written as gain after merger 0 0Profit/losses from equity method applied subsidiaries 0 0Net monetory position gain/loss 0 0Profit/Loss Before Taxes from Continuing Operations 2,311 1,981Provisions for Taxes on Income from Continuing Operations (±) -371 -385Net Profit/Loss from Continuing Operations 1,940 1,595Net Profit/Loss Before Taxes from Terminated Operations 0 0Provisions for Taxes on Income from Terminated Operations (±) 0 0Net Profit/Loss from Terminated Operations 0 0
Net Profit/Losses 1,940 1,595
* Used from information and disclosures related to income statement".

II-97
Türkiye Bankası A. . December 2010
Ratios(%)
Dec. 2010 Dec. 2009
Capital Ratios
Shareholders’ Equity / (Amount subject to credit + market + operational risk) 17.5 18.3
Shareholders' Equity / Total Assets 12.9 11.9
(Shareholders' Equity - Permanent Assets) / Total Assets 6.7 5.8
Net On Balance Sheet Position / Total Shareholders' Equity -5.1 -7.0
Net On and Off Balance Sheet Position / Total Shareholders' Equity 5.1 1.1
Balance-Sheet Ratios
TC Assets / Total Assets 70.7 66.9
TC Liabilities / Total Liabilities 68.4 64.7
FC Assets / FC Liabilities 92.8 93.6
TC Deposits / Total Deposits 67.5 61.9
TC Loans / Total Loans and Receivables 68.2 71.2
Total Deposits / Total Assets 67.0 63.7
Funds Borrowed / Total Assets 6.1 8.6
Assets Quality
Financial Assets (net) / Total Assets 34.7 34.8
Total Loans and Receivables / Total Assets 48.7 42.7
Total Loans and Receivables / Total Deposits 72.8 67.0
Loans Under Follow-up (gross) / Total Loans and Receivables 3.7 5.7
Loans Under Follow-up (net) / Total Loans and Receivables 0.0 0.0
Specific Provisions / Loans Under Follow-up 100.0 100.0
Permanent Assets / Total Assets 6.2 6.1
Consumer Loans / Total Loans and Receivables 30.3 30.5
Liquidity
Liquid Assets / Total Assets 33.2 38.6
Liquid Assets / Short-term Liabilities 55.7 66.4
TC Liquid Assets / Total Assets 19.9 19.3
Profitability
Net Profit/Losses / Total Assets 2.3 2.1
Net Profit/Losses / Total Shareholders' Equity 17.5 17.6
Profit/Losses Before Taxes after Continuing Operations / Total Assets 2.7 2.6
Income-Expenditure Structure
Net Interest Income After Specific Provisions / Total Assets 2.9 3.0
Net Interest Income After Specific Provisions / Total Operating Income (Expenses) 48.3 42.8
Non-interest Income (net) / Total Assets 2.5 2.7
Other Operating Expenses / Total Assets 2.4 2.4
Personnel Expenses / Other Operating Expenses 50.7 52.1
Non-interest Income (net) / Other Operating Expenses 103.3 113.5
Quarterly profitability and income-expenditure ratios, except year-end figures, should be considered periodically.

II-98
Yapı ve Kredi Bankası A. .
Assets(USD Million)
Dec. 2010 % Dec. 2009 %TC FC Total Distr. TC FC Total Distr.
Cash and Balances with the Central Bank 1,664 2,176 3,839 7.0 1,200 1,473 2,673 6.2Fin.ass.where fair value cha. is refl.to I/S (Net) 506 68 574 1.0 447 114 561 1.3
Financial assets held for trading 506 68 574 1.0 447 114 561 1.3Public sector debt securities 104 40 144 0.3 79 74 153 0.4Securities representing a share in capital 0 0 0 0.0 0 0 0 0.0Derivative financial assets held for trading 402 28 430 0.8 368 40 408 0.9Other marketable securities 0 0 0 0.0 0 0 0 0.0
Fin.assets clas. as fair value change is refl.to I/S 0 0 0 0.0 0 0 0 0.0Public sector debt securities 0 0 0 0.0 0 0 0 0.0Securities representing a share in capital 0 0 0 0.0 0 0 0 0.0Loans 0 0 0 0.0 0 0 0 0.0Other marketable securities 0 0 0 0.0 0 0 0 0.0
Banks 45 647 692 1.3 275 834 1,109 2.6Money Market Securities 617 0 617 1.1 1,029 0 1,029 2.4
Interbank money market placements 0 0 0 0.0 1,009 0 1,009 2.3Istanbul Stock Exc. money market placements 0 0 0 0.0 20 0 20 0.0Receiv. from reverse repurchase agreements 617 0 617 1.1 0 0 0 0.0
Financial Assets Available for Sale (Net) 2,657 551 3,208 5.8 383 467 850 2.0Securities representing a share in capital 2 0 2 0.0 4 1 5 0.0Public sector debt securities 1,969 352 2,321 4.2 350 438 788 1.8Other marketable securities 687 199 885 1.6 30 27 57 0.1
Loans 22,486 11,733 34,219 62.1 16,624 8,830 25,454 58.6Loans 22,230 11,712 33,942 61.6 16,358 8,826 25,183 58.0
Loans granted to the Banks risk group 470 185 655 1.2 314 101 415 1.0Public sector debt securities 0 0 0 0.0 0 0 0 0.0Other 21,760 11,528 33,287 60.4 16,044 8,725 24,768 57.1
Loans under follow-up 1,149 61 1,210 2.2 1,728 7 1,735 4.0Specific provisions (-) 892 41 933 1.7 1,461 3 1,465 3.4
Factoring Receivables 0 0 0 0.0 0 0 0 0.0Investments held to Maturity (Net) 3,411 4,738 8,149 14.8 3,928 4,151 8,078 18.6
Public sector debt securities 3,411 4,738 8,149 14.8 3,928 4,151 8,078 18.6Other marketable securities 0 0 0 0.0 0 0 0 0.0
Investments and Associates (Net) 3 28 31 0.1 3 29 32 0.1Accounted with equity method 0 0 0 0.0 0 0 0 0.0Non-consolidated investments and associates 3 28 31 0.1 3 29 32 0.1
Financial investments and associates 3 28 31 0.1 3 29 32 0.1Non-financial investments and associates 0 0 0 0.0 0 0 0 0.0
Subsidiaries (Net) 906 258 1,164 2.1 953 262 1,215 2.8Financial subsidiaries 904 258 1,163 2.1 951 262 1,213 2.8Non-financial subsidiaries 1 0 1 0.0 2 0 2 0.0
Joint Ventures (Business Partners) (Net) 16 0 16 0.0 0 0 0 0.0Accounted with equity method 0 0 0 0.0 0 0 0 0.0Non-consolidated joint ventures 16 0 16 0.0 0 0 0 0.0
Financial joint ventures 16 0 16 0.0 0 0 0 0.0Non-financial joint ventures 0 0 0 0.0 0 0 0 0.0
Recivables From Leasing Transactions 0 0 0 0.0 0 0 0 0.0Finance lease receivables 0 0 0 0.0 0 0 0 0.0Operational leasing receivables 0 0 0 0.0 0 0 0 0.0Others 0 0 0 0.0 0 0 0 0.0Unearned income (-) 0 0 0 0.0 0 0 0 0.0
Derivative Financial Assets Held for Hedging 22 2 25 0.0 86 1 86 0.2Fair value hedges 22 0 22 0.0 86 1 86 0.2Cash flow hedges 0 2 2 0.0 0 0 0 0.0Hedges for invest. made in foreign countries 0 0 0 0.0 0 0 0 0.0
Property and Equipment (Net) 719 0 719 1.3 730 0 730 1.7Intangible Assets (Net) 800 0 800 1.5 797 0 797 1.8
Goodwill 637 0 637 1.2 659 0 659 1.5Other 163 0 163 0.3 139 0 139 0.3
Real Estates for Investment Purpose (Net) 0 0 0 0.0 0 0 0 0.0Assets for Tax 140 0 140 0.3 142 0 142 0.3
Current assets for tax 0 0 0 0.0 0 0 0 0.0Deferred assets for tax 140 0 140 0.3 142 0 142 0.3
Prop.&Equ.for Sale p. and from Term.Op.(Net) 52 0 52 0.1 58 0 58 0.1Other Assets 356 534 890 1.6 288 304 592 1.4
Total Assets 34,400 20,735 55,135 100.0 26,945 16,463 43,408 100.0

II-99
Yapı ve Kredi Bankası A. . December 2010
Liabilities(USD Million)
Dec. 2010 % Dec. 2009 %TC FC Total Distr. TC FC Total Distr.
Deposits 21,036 13,254 34,290 62.2 15,463 11,991 27,455 63.2Deposits held by the Banks risk group 2,664 1,791 4,455 8.1 1,251 1,679 2,930 6.8Other 18,372 11,463 29,835 54.1 14,213 10,312 24,525 56.5
Derivative Finan. Liabilities Held for Trading 189 28 217 0.4 149 30 180 0.4Funds Borrowed 629 4,816 5,445 9.9 509 3,060 3,569 8.2Money Market Takings 29 1,896 1,925 3.5 44 579 623 1.4
Interbank money market takings 0 0 0 0.0 0 0 0 0.0Istanbul Stock Exc. money market takings 0 0 0 0.0 0 0 0 0.0Funds provided under repurchase agreements 29 1,896 1,925 3.5 44 579 623 1.4
Marketable Securities Issued (Net) 0 0 0 0.0 0 0 0 0.0Bills 0 0 0 0.0 0 0 0 0.0Asset backed securities 0 0 0 0.0 0 0 0 0.0Bonds 0 0 0 0.0 0 0 0 0.0
Funds 0 0 0 0.0 0 0 0 0.0Borrower funds 0 0 0 0.0 0 0 0 0.0Others 0 0 0 0.0 0 0 0 0.0
Miscellaneous Payables 2,121 440 2,562 4.6 1,773 238 2,012 4.6Other External Resources 455 204 659 1.2 337 252 589 1.4Factoring Payables 0 0 0 0.0 0 0 0 0.0Leasing Transactions Payables (Net) 0 10 10 0.0 0 4 4 0.0
Finance leasing payables 0 11 11 0.0 0 4 4 0.0Operations leasing payables 0 0 0 0.0 0 0 0 0.0Others 0 0 0 0.0 0 0 0 0.0Deferred finance leasing expenses (-) 0 0 0 0.0 0 0 0 0.0
Derivative Finan. Liabilities Held for Hedging 229 66 295 0.5 240 0 240 0.6Fair value hedges 204 0 204 0.4 240 0 240 0.6Cash flow hedges 25 66 91 0.2 0 0 0 0.0Hedges for invest. made in foreign countries 0 0 0 0.0 0 0 0 0.0
Provisions 1,238 244 1,483 2.7 1,306 263 1,569 3.6General provisions 339 194 533 1.0 372 228 600 1.4Restructuring reserves 0 0 0 0.0 0 0 0 0.0Reserves for employee benefit 105 0 105 0.2 101 0 101 0.2Insurance technical reserves (Net) 0 0 0 0.0 0 0 0 0.0Other provisions 794 50 844 1.5 833 35 869 2.0
Liabilities for Tax 166 0 166 0.3 113 0 113 0.3Current liabilities for tax 166 0 166 0.3 113 0 113 0.3Deferred liabilities for tax 0 0 0 0.0 0 0 0 0.0
Lia.for Pro.&Equ.for Sale p. and from Term.Op.(Net) 0 0 0 0.0 0 0 0 0.0Subordinated Loans 0 1,372 1,372 2.5 0 1,495 1,495 3.4Shareholders' Equity 6,716 -5 6,710 12.2 5,500 59 5,559 12.8
Paid-in capital 2,827 0 2,827 5.1 2,923 0 2,923 6.7Supplementary capital 466 -5 460 0.8 412 59 470 1.1
Share premium 354 0 354 0.6 366 0 366 0.8Share cancellation profits 0 0 0 0.0 0 0 0 0.0Valuation changes in marketable securities 66 55 120 0.2 4 59 63 0.1Revaluation changes of property and equip. 0 0 0 0.0 0 0 0 0.0Revaluation changes of intangible assets 0 0 0 0.0 0 0 0 0.0Revaluation changes of real est.for inv. pur. 0 0 0 0.0 0 0 0 0.0Free shares from inv.&ass.,subs.& joint vent. 0 0 0 0.0 0 0 0 0.0Hedging funds (active part) -6 -60 -66 -0.1 0 0 0 0.0Val.inc.in pro.& equ.held for sale p.and term.ope. 0 0 0 0.0 0 0 0 0.0Other capital reserves 53 0 53 0.1 42 0 42 0.1
Profit reserves 2,083 0 2,083 3.8 1,255 0 1,255 2.9Legal reserves 107 0 107 0.2 65 0 65 0.1Status reserves 0 0 0 0.0 0 0 0 0.0Extraordinary reserves 1,976 0 1,976 3.6 1,190 0 1,190 2.7Other profit reserves 0 0 0 0.0 0 0 0 0.0
Profit or loss 1,340 0 1,340 2.4 911 0 911 2.1Prior years income/loss 0 0 0 0.0 0 0 0 0.0Current year income/loss 1,340 0 1,340 2.4 911 0 911 2.1
Total Liabilities 32,809 22,327 55,135 100.0 25,435 17,973 43,408 100.0

II-100
Yapı ve Kredi Bankası A. .
Off Balance Sheet Commitments(USD Million)
Dec. 2010 Dec. 2009TC FC Total TC FC Total
Guarantees and Warranties 5,072 7,587 12,658 4,185 6,671 10,856Letters of guarantee 5,060 4,573 9,633 4,182 4,561 8,743Bank acceptances 0 108 108 0 102 102Letters of credit 8 2,533 2,541 1 1,741 1,742Prefinancing given as guarantee 0 1 1 0 1 1Endorsements 0 0 0 0 0 0Other guarantees and warrantees 4 372 375 2 265 267
Commitments 12,881 1,789 14,670 11,035 2,014 13,049Irrevocable commitments 12,598 1,789 14,387 11,035 2,014 13,049Revocable commitments 283 0 283 0 0 0
Derivative Financial Instruments 12,462 25,756 38,218 7,314 18,013 25,327Derivative finan. instruments held for hedging 2,242 6,112 8,353 1,316 1,353 2,669Trading transactions 10,221 19,644 29,865 5,999 16,660 22,659
Custody and Pledged Securities 65,014 13,189 78,204 47,476 11,742 59,218Items held in Custody 38,236 2,398 40,634 29,020 2,294 31,314Pledged Items 26,212 10,406 36,618 17,888 9,041 26,928Acccepted independent guaran. and warran. 566 386 952 568 408 976
Total Off Balance Sheet Commitments 95,429 48,321 143,750 70,010 38,440 108,450
Income-Expenditure(USD Million)
Dec. 2010 Dec. 2009
Interest Income 3,786 4,515Interest on loans 2,957 3,482Interest received from reserve deposits 38 77Interest received from banks 18 18Interest received from money market transactions 29 58Interest received from marketable securities portfolio 744 880Other interest income 1 1
Interest Expenses 1,705 2,176Interest on deposits 1,481 1,880Interest on money market transactions 189 257Interest on funds borrowed 28 38Interest on securities issued 0 0Other interest expenses 7 1
Net Interest Income/Expenses 2,081 2,339Net Fees and Commissions Income/Expenses 1,038 966
Fees and commissions received 1,204 1,138Fees and commissions paid 166 172
Dividend Income 101 96Trading Profit/Loss (net) -43 229
Profit/loss on trading account securities 47 92Profit/losses on derivative financial transactions -349 202Foreign exchange profit/loss 258 -65
Other Operating Income 785 131Total Operating Income/Expenses 3,962 3,760Provision for Loan Losses or other Receivables (-) 704 1,052
Specific provisions of banks loans and other receivables* 630 852General provision expenses* 47 160
Other Operating Expenses (-) 1,618 1,555Personnel Expenses* 644 593
Net Operating Profit/Loss 1,639 1,152Surplus written as gain after merger 0 0Profit/losses from equity method applied subsidiaries 0 0Net monetory position gain/loss 0 0Profit/Loss Before Taxes from Continuing Operations 1,639 1,152Provisions for Taxes on Income from Continuing Operations (±) -299 -241Net Profit/Loss from Continuing Operations 1,340 911Net Profit/Loss Before Taxes from Terminated Operations 0 0Provisions for Taxes on Income from Terminated Operations (±) 0 0Net Profit/Loss from Terminated Operations 0 0
Net Profit/Losses 1,340 911
* Used from information and disclosures related to income statement".

II-101
Yapı ve Kredi Bankası A. . December 2010
Ratios(%)
Dec. 2010 Dec. 2009
Capital Ratios
Shareholders’ Equity / (Amount subject to credit + market + operational risk) 16.1 17.8
Shareholders' Equity / Total Assets 12.2 12.8
(Shareholders' Equity - Permanent Assets) / Total Assets 6.6 5.7
Net On Balance Sheet Position / Total Shareholders' Equity 0.3 -2.6
Net On and Off Balance Sheet Position / Total Shareholders' Equity -3.0 2.7
Balance-Sheet Ratios
TC Assets / Total Assets 62.4 62.1
TC Liabilities / Total Liabilities 59.5 58.6
FC Assets / FC Liabilities 92.9 91.6
TC Deposits / Total Deposits 61.3 56.3
TC Loans / Total Loans and Receivables 65.7 65.3
Total Deposits / Total Assets 62.2 63.2
Funds Borrowed / Total Assets 9.9 8.2
Assets Quality
Financial Assets (net) / Total Assets 21.7 22.1
Total Loans and Receivables / Total Assets 62.1 58.6
Total Loans and Receivables / Total Deposits 99.8 92.7
Loans Under Follow-up (gross) / Total Loans and Receivables 3.5 6.8
Loans Under Follow-up (net) / Total Loans and Receivables 0.8 1.1
Specific Provisions / Loans Under Follow-up 77.1 84.4
Permanent Assets / Total Assets 5.5 7.1
Consumer Loans / Total Loans and Receivables 33.9 37.5
Liquidity
Liquid Assets / Total Assets 16.2 14.3
Liquid Assets / Short-term Liabilities 26.3 23.4
TC Liquid Assets / Total Assets 10.0 7.7
Profitability
Net Profit/Losses / Total Assets 2.4 2.1
Net Profit/Losses / Total Shareholders' Equity 20.0 16.4
Profit/Losses Before Taxes after Continuing Operations / Total Assets 3.0 2.7
Income-Expenditure Structure
Net Interest Income After Specific Provisions / Total Assets 2.6 3.4
Net Interest Income After Specific Provisions / Total Operating Income (Expenses) 36.6 39.5
Non-interest Income (net) / Total Assets 3.4 3.3
Other Operating Expenses / Total Assets 2.9 3.6
Personnel Expenses / Other Operating Expenses 39.8 38.1
Non-interest Income (net) / Other Operating Expenses 116.2 91.4
Quarterly profitability and income-expenditure ratios, except year-end figures, should be considered periodically.


II-103

II-104
Birle ik Fon Bankası A. .
Assets(USD Million)
Dec. 2010 % Dec. 2009 %TC FC Total Distr. TC FC Total Distr.
Cash and Balances with the Central Bank 0 0 0 0.0 0 0 0 0.0Fin.ass.where fair value cha. is refl.to I/S (Net) 135 0 135 26.2 248 0 248 45.6
Financial assets held for trading 135 0 135 26.2 248 0 248 45.6Public sector debt securities 135 0 135 26.2 248 0 248 45.6Securities representing a share in capital 0 0 0 0.0 0 0 0 0.0Derivative financial assets held for trading 0 0 0 0.0 0 0 0 0.0Other marketable securities 0 0 0 0.0 0 0 0 0.0
Fin.assets clas. as fair value change is refl.to I/S 0 0 0 0.0 0 0 0 0.0Public sector debt securities 0 0 0 0.0 0 0 0 0.0Securities representing a share in capital 0 0 0 0.0 0 0 0 0.0Loans 0 0 0 0.0 0 0 0 0.0Other marketable securities 0 0 0 0.0 0 0 0 0.0
Banks 245 59 304 59.1 144 67 211 39.0Money Market Securities 0 0 0 0.0 5 0 5 0.9
Interbank money market placements 0 0 0 0.0 5 0 5 0.9Istanbul Stock Exc. money market placements 0 0 0 0.0 0 0 0 0.0Receiv. from reverse repurchase agreements 0 0 0 0.0 0 0 0 0.0
Financial Assets Available for Sale (Net) 0 0 0 0.0 0 0 0 0.0Securities representing a share in capital 0 0 0 0.0 0 0 0 0.0Public sector debt securities 0 0 0 0.0 0 0 0 0.0Other marketable securities 0 0 0 0.0 0 0 0 0.0
Loans 2 0 2 0.4 8 0 8 1.5Loans 1 0 1 0.1 1 0 1 0.1
Loans granted to the Banks risk group 0 0 0 0.0 0 0 0 0.0Public sector debt securities 0 0 0 0.0 0 0 0 0.0Other 1 0 1 0.1 1 0 1 0.1
Loans under follow-up 28 5 33 6.5 35 6 41 7.6Specific provisions (-) 27 5 32 6.2 28 6 34 6.2
Factoring Receivables 0 0 0 0.0 0 0 0 0.0Investments held to Maturity (Net) 0 0 0 0.0 0 0 0 0.0
Public sector debt securities 0 0 0 0.0 0 0 0 0.0Other marketable securities 0 0 0 0.0 0 0 0 0.0
Investments and Associates (Net) 0 0 0 0.0 0 0 0 0.0Accounted with equity method 0 0 0 0.0 0 0 0 0.0Non-consolidated investments and associates 0 0 0 0.0 0 0 0 0.0
Financial investments and associates 0 0 0 0.0 0 0 0 0.0Non-financial investments and associates 0 0 0 0.0 0 0 0 0.0
Subsidiaries (Net) 0 0 0 0.0 0 0 0 0.0Financial subsidiaries 0 0 0 0.0 0 0 0 0.0Non-financial subsidiaries 0 0 0 0.0 0 0 0 0.0
Joint Ventures (Business Partners) (Net) 0 0 0 0.0 0 0 0 0.0Accounted with equity method 0 0 0 0.0 0 0 0 0.0Non-consolidated joint ventures 0 0 0 0.0 0 0 0 0.0
Financial joint ventures 0 0 0 0.0 0 0 0 0.0Non-financial joint ventures 0 0 0 0.0 0 0 0 0.0
Recivables From Leasing Transactions 0 0 0 0.0 0 0 0 0.0Finance lease receivables 0 0 0 0.0 0 0 0 0.0Operational leasing receivables 0 0 0 0.0 0 0 0 0.0Others 0 0 0 0.0 0 0 0 0.0Unearned income (-) 0 0 0 0.0 0 0 0 0.0
Derivative Financial Assets Held for Hedging 0 0 0 0.0 0 0 0 0.0Fair value hedges 0 0 0 0.0 0 0 0 0.0Cash flow hedges 0 0 0 0.0 0 0 0 0.0Hedges for invest. made in foreign countries 0 0 0 0.0 0 0 0 0.0
Property and Equipment (Net) 35 0 35 6.8 37 0 37 6.8Intangible Assets (Net) 0 0 0 0.0 0 0 0 0.0
Goodwill 0 0 0 0.0 0 0 0 0.0Other 0 0 0 0.0 0 0 0 0.0
Real Estates for Investment Purpose (Net) 0 0 0 0.0 0 0 0 0.0Assets for Tax 7 0 7 1.3 0 0 0 0.1
Current assets for tax 0 0 0 0.0 0 0 0 0.0Deferred assets for tax 7 0 7 1.3 0 0 0 0.1
Prop.&Equ.for Sale p. and from Term.Op.(Net) 0 0 0 0.0 0 0 0 0.0Other Assets 29 3 32 6.3 29 4 33 6.1
Total Assets 452 62 514 100.0 471 72 542 100.0

II-105
Birle ik Fon Bankası A. . December 2010
Liabilities(USD Million)
Dec. 2010 % Dec. 2009 %TC FC Total Distr. TC FC Total Distr.
Deposits 7 10 17 3.2 8 11 19 3.5Deposits held by the Banks risk group 0 0 0 0.0 0 0 0 0.0Other 7 10 17 3.2 8 11 19 3.5
Derivative Finan. Liabilities Held for Trading 0 0 0 0.0 0 0 0 0.0Funds Borrowed 0 0 0 0.0 0 0 0 0.0Money Market Takings 2 0 2 0.3 2 0 2 0.4
Interbank money market takings 0 0 0 0.0 0 0 0 0.0Istanbul Stock Exc. money market takings 0 0 0 0.0 0 0 0 0.0Funds provided under repurchase agreements 2 0 2 0.3 2 0 2 0.4
Marketable Securities Issued (Net) 0 0 0 0.0 0 0 0 0.0Bills 0 0 0 0.0 0 0 0 0.0Asset backed securities 0 0 0 0.0 0 0 0 0.0Bonds 0 0 0 0.0 0 0 0 0.0
Funds 0 0 0 0.0 0 0 0 0.0Borrower funds 0 0 0 0.0 0 0 0 0.0Others 0 0 0 0.0 0 0 0 0.0
Miscellaneous Payables 5 27 32 6.3 8 28 36 6.6Other External Resources 3 0 3 0.6 3 0 3 0.5Factoring Payables 0 0 0 0.0 0 0 0 0.0Leasing Transactions Payables (Net) 0 0 0 0.0 0 0 0 0.0
Finance leasing payables 0 0 0 0.0 0 0 0 0.0Operations leasing payables 0 0 0 0.0 0 0 0 0.0Others 0 0 0 0.0 0 0 0 0.0Deferred finance leasing expenses (-) 0 0 0 0.0 0 0 0 0.0
Derivative Finan. Liabilities Held for Hedging 0 0 0 0.0 0 0 0 0.0Fair value hedges 0 0 0 0.0 0 0 0 0.0Cash flow hedges 0 0 0 0.0 0 0 0 0.0Hedges for invest. made in foreign countries 0 0 0 0.0 0 0 0 0.0
Provisions 54 27 81 15.8 23 32 55 10.2General provisions 2 0 2 0.3 3 0 3 0.6Restructuring reserves 0 0 0 0.0 0 0 0 0.0Reserves for employee benefit 3 0 3 0.6 2 0 2 0.5Insurance technical reserves (Net) 0 0 0 0.0 0 0 0 0.0Other provisions 50 27 76 14.9 17 32 49 9.1
Liabilities for Tax 2 0 2 0.4 2 0 2 0.4Current liabilities for tax 2 0 2 0.4 2 0 2 0.4Deferred liabilities for tax 0 0 0 0.0 0 0 0 0.0
Lia.for Pro.&Equ.for Sale p. and from Term.Op.(Net) 0 0 0 0.0 0 0 0 0.0Subordinated Loans 0 0 0 0.0 0 0 0 0.0Shareholders' Equity 377 0 377 73.4 426 0 426 78.4
Paid-in capital 300 0 300 58.2 310 0 310 57.1Supplementary capital 0 0 0 0.0 0 0 0 0.0
Share premium 0 0 0 0.0 0 0 0 0.0Share cancellation profits 0 0 0 0.0 0 0 0 0.0Valuation changes in marketable securities 0 0 0 0.0 0 0 0 0.0Revaluation changes of property and equip. 0 0 0 0.0 0 0 0 0.0Revaluation changes of intangible assets 0 0 0 0.0 0 0 0 0.0Revaluation changes of real est.for inv. pur. 0 0 0 0.0 0 0 0 0.0Free shares from inv.&ass.,subs.& joint vent. 0 0 0 0.0 0 0 0 0.0Hedging funds (active part) 0 0 0 0.0 0 0 0 0.0Val.inc.in pro.& equ.held for sale p.and term.ope. 0 0 0 0.0 0 0 0 0.0Other capital reserves 0 0 0 0.0 0 0 0 0.0
Profit reserves 11,500 0 11,500 2,236.2 11,926 0 11,926 2,198.4Legal reserves 17 0 17 3.4 18 0 18 3.3Status reserves 0 0 0 0.0 0 0 0 0.0Extraordinary reserves 11,483 0 11,483 2,232.8 11,908 0 11,908 2,195.1Other profit reserves 0 0 0 0.0 0 0 0 0.0
Profit or loss -11,422 0 -11,422 -2,221.0 -11,810 0 -11,810 -2,177.1Prior years income/loss -11,424 0 -11,424 -2,221.3 -11,847 0 -11,847 -2,183.8Current year income/loss 1 0 1 0.3 37 0 37 6.8
Total Liabilities 451 64 514 100.0 471 72 542 100.0

II-106
Birle ik Fon Bankası A. .
Off Balance Sheet Commitments(USD Million)
Dec. 2010 Dec. 2009TC FC Total TC FC Total
Guarantees and Warranties 43 62 105 50 72 122Letters of guarantee 43 62 105 50 72 122Bank acceptances 0 0 0 0 0 0Letters of credit 0 0 0 0 0 0Prefinancing given as guarantee 0 0 0 0 0 0Endorsements 0 0 0 0 0 0Other guarantees and warrantees 0 0 0 0 0 0
Commitments 1,596 0 1,596 2,087 0 2,087Irrevocable commitments 1,596 0 1,596 2,087 0 2,087Revocable commitments 0 0 0 0 0 0
Derivative Financial Instruments 0 0 0 0 0 0Derivative finan. instruments held for hedging 0 0 0 0 0 0Trading transactions 0 0 0 0 0 0
Custody and Pledged Securities 578 89 667 602 93 695Items held in Custody 9 2 10 8 2 10Pledged Items 569 87 656 594 92 685Acccepted independent guaran. and warran. 0 0 1 0 0 0
Total Off Balance Sheet Commitments 2,217 151 2,368 2,739 165 2,905
Income-Expenditure(USD Million)
Dec. 2010 Dec. 2009
Interest Income 25 26Interest on loans 7 1Interest received from reserve deposits 0 0Interest received from banks 17 23Interest received from money market transactions 0 0Interest received from marketable securities portfolio 0 0Other interest income 1 0
Interest Expenses 0 0Interest on deposits 0 0Interest on money market transactions 0 0Interest on funds borrowed 0 0Interest on securities issued 0 0Other interest expenses 0 0
Net Interest Income/Expenses 25 25Net Fees and Commissions Income/Expenses 2 2
Fees and commissions received 2 2Fees and commissions paid 0 0
Dividend Income 0 0Trading Profit/Loss (net) 20 45
Profit/loss on trading account securities 19 45Profit/losses on derivative financial transactions 0 0Foreign exchange profit/loss 0 0
Other Operating Income 28 9Total Operating Income/Expenses 75 82Provision for Loan Losses or other Receivables (-) 54 12
Specific provisions of banks loans and other receivables* 6 3General provision expenses* 0 2
Other Operating Expenses (-) 20 22Personnel Expenses* 11 11
Net Operating Profit/Loss 1 48Surplus written as gain after merger 0 0Profit/losses from equity method applied subsidiaries 0 0Net monetory position gain/loss 0 0Profit/Loss Before Taxes from Continuing Operations 1 48Provisions for Taxes on Income from Continuing Operations (±) 0 -11Net Profit/Loss from Continuing Operations 1 37Net Profit/Loss Before Taxes from Terminated Operations 0 0Provisions for Taxes on Income from Terminated Operations (±) 0 0Net Profit/Loss from Terminated Operations 0 0
Net Profit/Losses 1 37
* Used from information and disclosures related to income statement".

II-107
Birle ik Fon Bankası A. . December 2010
Ratios(%)
Dec. 2010 Dec. 2009
Capital Ratios
Shareholders’ Equity / (Amount subject to credit + market + operational risk) 50.6 45.0
Shareholders' Equity / Total Assets 73.4 78.4
(Shareholders' Equity - Permanent Assets) / Total Assets 66.4 70.3
Net On Balance Sheet Position / Total Shareholders' Equity -0.3 -0.1
Net On and Off Balance Sheet Position / Total Shareholders' Equity -0.3 -0.1
Balance-Sheet Ratios
TC Assets / Total Assets 87.9 86.8
TC Liabilities / Total Liabilities 87.6 86.7
FC Assets / FC Liabilities 98.2 99.5
TC Deposits / Total Deposits 40.7 40.7
TC Loans / Total Loans and Receivables 100.0 100.0
Total Deposits / Total Assets 3.2 3.5
Funds Borrowed / Total Assets 0.0 0.0
Assets Quality
Financial Assets (net) / Total Assets 26.2 45.6
Total Loans and Receivables / Total Assets 0.4 1.5
Total Loans and Receivables / Total Deposits 11.3 42.1
Loans Under Follow-up (gross) / Total Loans and Receivables 1,786.0 519.5
Loans Under Follow-up (net) / Total Loans and Receivables 72.1 92.8
Specific Provisions / Loans Under Follow-up 96.0 82.1
Permanent Assets / Total Assets 7.1 8.2
Consumer Loans / Total Loans and Receivables 27.9 7.2
Liquidity
Liquid Assets / Total Assets 85.2 85.5
Liquid Assets / Short-term Liabilities 857.2 809.0
TC Liquid Assets / Total Assets 73.8 73.1
Profitability
Net Profit/Losses / Total Assets 0.3 6.8
Net Profit/Losses / Total Shareholders' Equity 0.3 8.6
Profit/Losses Before Taxes after Continuing Operations / Total Assets 0.2 8.8
Income-Expenditure Structure
Net Interest Income After Specific Provisions / Total Assets 3.7 4.1
Net Interest Income After Specific Provisions / Total Operating Income (Expenses) 25.2 27.1
Non-interest Income (net) / Total Assets 9.7 10.4
Other Operating Expenses / Total Assets 3.9 4.0
Personnel Expenses / Other Operating Expenses 52.5 48.4
Non-interest Income (net) / Other Operating Expenses 249.0 258.6
Quarterly profitability and income-expenditure ratios, except year-end figures, should be considered periodically.


II-109

II-110
Arap Türk Bankası A. .
Assets(USD Million)
Dec. 2010 % Dec. 2009 %TC FC Total Distr. TC FC Total Distr.
Cash and Balances with the Central Bank 1 46 47 6.3 1 30 31 4.8Fin.ass.where fair value cha. is refl.to I/S (Net) 90 19 109 14.7 99 41 140 21.6
Financial assets held for trading 90 19 109 14.7 99 41 140 21.6Public sector debt securities 88 0 88 11.9 99 41 140 21.6Securities representing a share in capital 0 0 0 0.0 0 0 0 0.0Derivative financial assets held for trading 1 0 1 0.2 0 0 0 0.0Other marketable securities 1 19 20 2.6 0 0 0 0.0
Fin.assets clas. as fair value change is refl.to I/S 0 0 0 0.0 0 0 0 0.0Public sector debt securities 0 0 0 0.0 0 0 0 0.0Securities representing a share in capital 0 0 0 0.0 0 0 0 0.0Loans 0 0 0 0.0 0 0 0 0.0Other marketable securities 0 0 0 0.0 0 0 0 0.0
Banks 1 71 72 9.6 0 33 34 5.2Money Market Securities 0 0 0 0.0 0 0 0 0.0
Interbank money market placements 0 0 0 0.0 0 0 0 0.0Istanbul Stock Exc. money market placements 0 0 0 0.0 0 0 0 0.0Receiv. from reverse repurchase agreements 0 0 0 0.0 0 0 0 0.0
Financial Assets Available for Sale (Net) 0 1 1 0.1 0 1 1 0.1Securities representing a share in capital 0 1 1 0.1 0 1 1 0.1Public sector debt securities 0 0 0 0.0 0 0 0 0.0Other marketable securities 0 0 0 0.0 0 0 0 0.0
Loans 141 181 322 43.5 136 99 235 36.2Loans 141 181 322 43.5 136 99 235 36.2
Loans granted to the Banks risk group 0 2 2 0.2 0 2 2 0.3Public sector debt securities 0 0 0 0.0 0 0 0 0.0Other 141 180 321 43.2 136 97 233 35.9
Loans under follow-up 4 0 4 0.5 4 0 4 0.6Specific provisions (-) 4 0 4 0.5 4 0 4 0.6
Factoring Receivables 0 0 0 0.0 0 0 0 0.0Investments held to Maturity (Net) 71 75 146 19.7 77 91 168 25.8
Public sector debt securities 42 47 89 12.0 77 45 122 18.8Other marketable securities 28 29 57 7.7 0 45 45 7.0
Investments and Associates (Net) 0 0 0 0.0 0 0 0 0.0Accounted with equity method 0 0 0 0.0 0 0 0 0.0Non-consolidated investments and associates 0 0 0 0.0 0 0 0 0.0
Financial investments and associates 0 0 0 0.0 0 0 0 0.0Non-financial investments and associates 0 0 0 0.0 0 0 0 0.0
Subsidiaries (Net) 23 0 23 3.2 22 0 22 3.4Financial subsidiaries 23 0 23 3.2 22 0 22 3.4Non-financial subsidiaries 0 0 0 0.0 0 0 0 0.0
Joint Ventures (Business Partners) (Net) 0 0 0 0.0 0 0 0 0.0Accounted with equity method 0 0 0 0.0 0 0 0 0.0Non-consolidated joint ventures 0 0 0 0.0 0 0 0 0.0
Financial joint ventures 0 0 0 0.0 0 0 0 0.0Non-financial joint ventures 0 0 0 0.0 0 0 0 0.0
Recivables From Leasing Transactions 0 0 0 0.0 0 0 0 0.0Finance lease receivables 0 0 0 0.0 0 0 0 0.0Operational leasing receivables 0 0 0 0.0 0 0 0 0.0Others 0 0 0 0.0 0 0 0 0.0Unearned income (-) 0 0 0 0.0 0 0 0 0.0
Derivative Financial Assets Held for Hedging 0 0 0 0.0 0 0 0 0.0Fair value hedges 0 0 0 0.0 0 0 0 0.0Cash flow hedges 0 0 0 0.0 0 0 0 0.0Hedges for invest. made in foreign countries 0 0 0 0.0 0 0 0 0.0
Property and Equipment (Net) 14 0 14 1.9 15 0 15 2.3Intangible Assets (Net) 1 0 1 0.2 1 0 1 0.2
Goodwill 0 0 0 0.0 0 0 0 0.0Other 1 0 1 0.2 1 0 1 0.2
Real Estates for Investment Purpose (Net) 0 0 0 0.0 0 0 0 0.0Assets for Tax 1 0 1 0.1 1 0 1 0.2
Current assets for tax 0 0 0 0.0 0 0 0 0.0Deferred assets for tax 1 0 1 0.1 1 0 1 0.2
Prop.&Equ.for Sale p. and from Term.Op.(Net) 0 0 0 0.0 0 0 0 0.1Other Assets 4 1 5 0.7 0 1 1 0.2
Total Assets 348 394 742 100.0 354 296 649 100.0
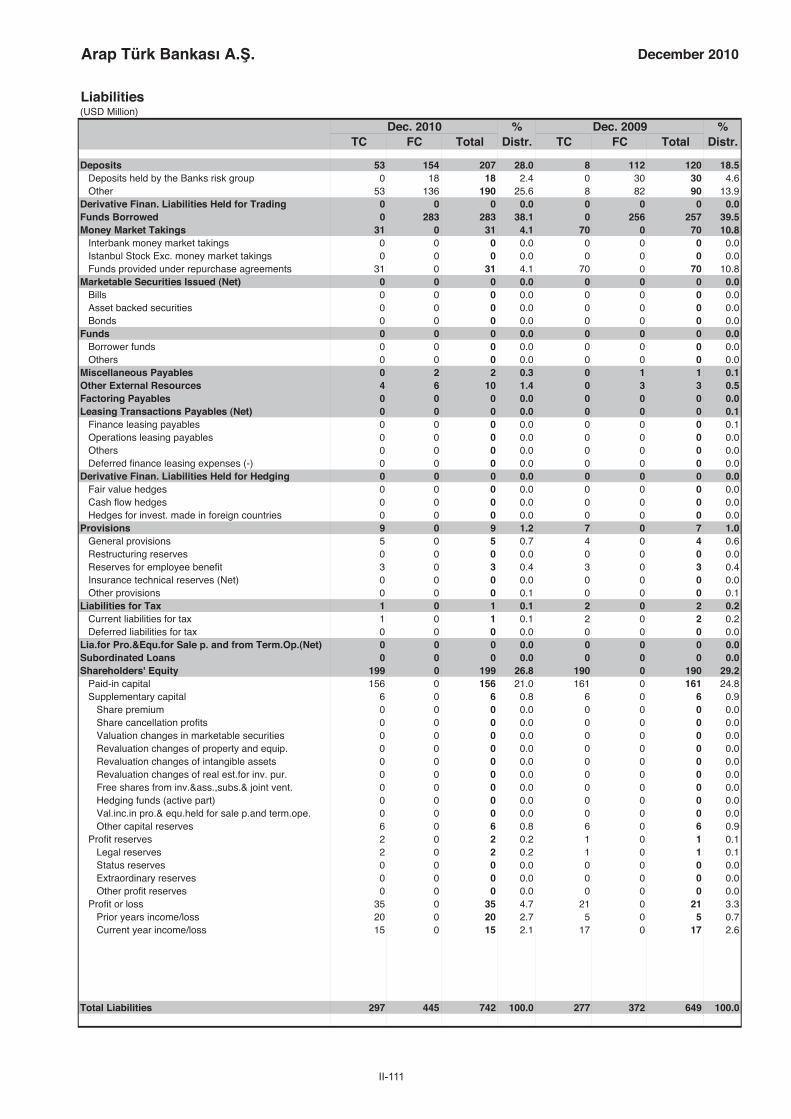
II-111
Arap Türk Bankası A. . December 2010
Liabilities(USD Million)
Dec. 2010 % Dec. 2009 %TC FC Total Distr. TC FC Total Distr.
Deposits 53 154 207 28.0 8 112 120 18.5Deposits held by the Banks risk group 0 18 18 2.4 0 30 30 4.6Other 53 136 190 25.6 8 82 90 13.9
Derivative Finan. Liabilities Held for Trading 0 0 0 0.0 0 0 0 0.0Funds Borrowed 0 283 283 38.1 0 256 257 39.5Money Market Takings 31 0 31 4.1 70 0 70 10.8
Interbank money market takings 0 0 0 0.0 0 0 0 0.0Istanbul Stock Exc. money market takings 0 0 0 0.0 0 0 0 0.0Funds provided under repurchase agreements 31 0 31 4.1 70 0 70 10.8
Marketable Securities Issued (Net) 0 0 0 0.0 0 0 0 0.0Bills 0 0 0 0.0 0 0 0 0.0Asset backed securities 0 0 0 0.0 0 0 0 0.0Bonds 0 0 0 0.0 0 0 0 0.0
Funds 0 0 0 0.0 0 0 0 0.0Borrower funds 0 0 0 0.0 0 0 0 0.0Others 0 0 0 0.0 0 0 0 0.0
Miscellaneous Payables 0 2 2 0.3 0 1 1 0.1Other External Resources 4 6 10 1.4 0 3 3 0.5Factoring Payables 0 0 0 0.0 0 0 0 0.0Leasing Transactions Payables (Net) 0 0 0 0.0 0 0 0 0.1
Finance leasing payables 0 0 0 0.0 0 0 0 0.1Operations leasing payables 0 0 0 0.0 0 0 0 0.0Others 0 0 0 0.0 0 0 0 0.0Deferred finance leasing expenses (-) 0 0 0 0.0 0 0 0 0.0
Derivative Finan. Liabilities Held for Hedging 0 0 0 0.0 0 0 0 0.0Fair value hedges 0 0 0 0.0 0 0 0 0.0Cash flow hedges 0 0 0 0.0 0 0 0 0.0Hedges for invest. made in foreign countries 0 0 0 0.0 0 0 0 0.0
Provisions 9 0 9 1.2 7 0 7 1.0General provisions 5 0 5 0.7 4 0 4 0.6Restructuring reserves 0 0 0 0.0 0 0 0 0.0Reserves for employee benefit 3 0 3 0.4 3 0 3 0.4Insurance technical reserves (Net) 0 0 0 0.0 0 0 0 0.0Other provisions 0 0 0 0.1 0 0 0 0.1
Liabilities for Tax 1 0 1 0.1 2 0 2 0.2Current liabilities for tax 1 0 1 0.1 2 0 2 0.2Deferred liabilities for tax 0 0 0 0.0 0 0 0 0.0
Lia.for Pro.&Equ.for Sale p. and from Term.Op.(Net) 0 0 0 0.0 0 0 0 0.0Subordinated Loans 0 0 0 0.0 0 0 0 0.0Shareholders' Equity 199 0 199 26.8 190 0 190 29.2
Paid-in capital 156 0 156 21.0 161 0 161 24.8Supplementary capital 6 0 6 0.8 6 0 6 0.9
Share premium 0 0 0 0.0 0 0 0 0.0Share cancellation profits 0 0 0 0.0 0 0 0 0.0Valuation changes in marketable securities 0 0 0 0.0 0 0 0 0.0Revaluation changes of property and equip. 0 0 0 0.0 0 0 0 0.0Revaluation changes of intangible assets 0 0 0 0.0 0 0 0 0.0Revaluation changes of real est.for inv. pur. 0 0 0 0.0 0 0 0 0.0Free shares from inv.&ass.,subs.& joint vent. 0 0 0 0.0 0 0 0 0.0Hedging funds (active part) 0 0 0 0.0 0 0 0 0.0Val.inc.in pro.& equ.held for sale p.and term.ope. 0 0 0 0.0 0 0 0 0.0Other capital reserves 6 0 6 0.8 6 0 6 0.9
Profit reserves 2 0 2 0.2 1 0 1 0.1Legal reserves 2 0 2 0.2 1 0 1 0.1Status reserves 0 0 0 0.0 0 0 0 0.0Extraordinary reserves 0 0 0 0.0 0 0 0 0.0Other profit reserves 0 0 0 0.0 0 0 0 0.0
Profit or loss 35 0 35 4.7 21 0 21 3.3Prior years income/loss 20 0 20 2.7 5 0 5 0.7Current year income/loss 15 0 15 2.1 17 0 17 2.6
Total Liabilities 297 445 742 100.0 277 372 649 100.0
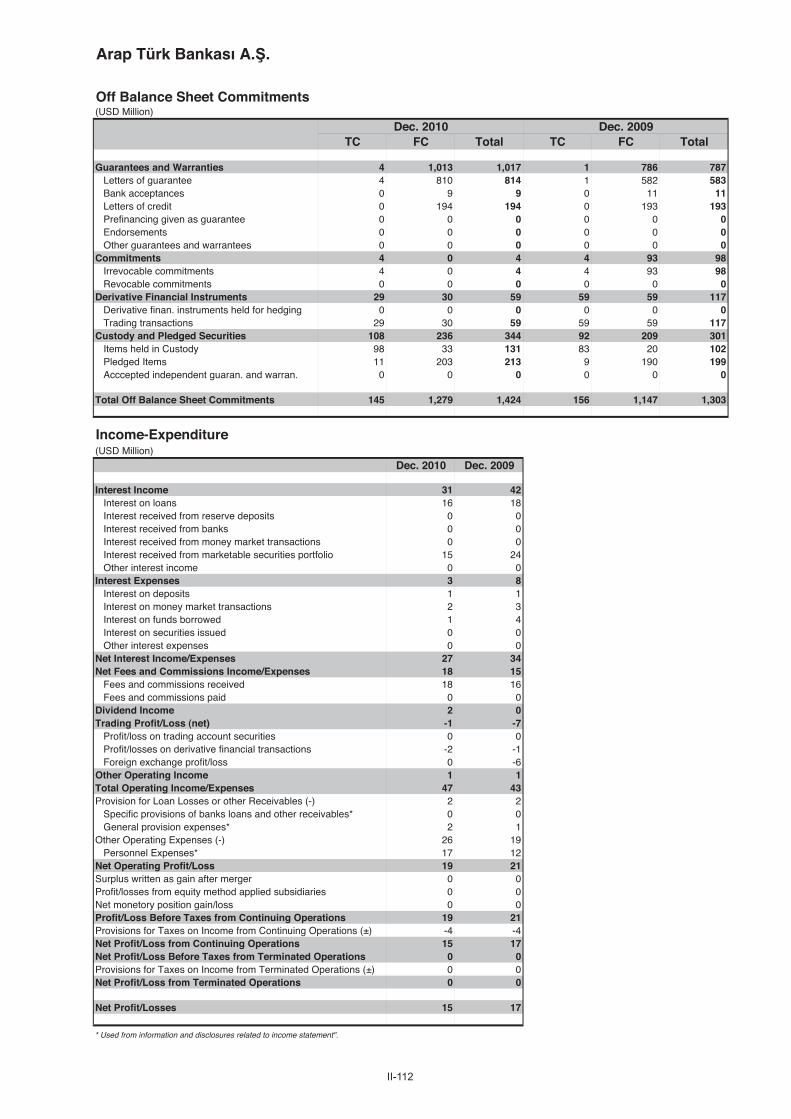
II-112
Arap Türk Bankası A. .
Off Balance Sheet Commitments(USD Million)
Dec. 2010 Dec. 2009TC FC Total TC FC Total
Guarantees and Warranties 4 1,013 1,017 1 786 787Letters of guarantee 4 810 814 1 582 583Bank acceptances 0 9 9 0 11 11Letters of credit 0 194 194 0 193 193Prefinancing given as guarantee 0 0 0 0 0 0Endorsements 0 0 0 0 0 0Other guarantees and warrantees 0 0 0 0 0 0
Commitments 4 0 4 4 93 98Irrevocable commitments 4 0 4 4 93 98Revocable commitments 0 0 0 0 0 0
Derivative Financial Instruments 29 30 59 59 59 117Derivative finan. instruments held for hedging 0 0 0 0 0 0Trading transactions 29 30 59 59 59 117
Custody and Pledged Securities 108 236 344 92 209 301Items held in Custody 98 33 131 83 20 102Pledged Items 11 203 213 9 190 199Acccepted independent guaran. and warran. 0 0 0 0 0 0
Total Off Balance Sheet Commitments 145 1,279 1,424 156 1,147 1,303
Income-Expenditure(USD Million)
Dec. 2010 Dec. 2009
Interest Income 31 42Interest on loans 16 18Interest received from reserve deposits 0 0Interest received from banks 0 0Interest received from money market transactions 0 0Interest received from marketable securities portfolio 15 24Other interest income 0 0
Interest Expenses 3 8Interest on deposits 1 1Interest on money market transactions 2 3Interest on funds borrowed 1 4Interest on securities issued 0 0Other interest expenses 0 0
Net Interest Income/Expenses 27 34Net Fees and Commissions Income/Expenses 18 15
Fees and commissions received 18 16Fees and commissions paid 0 0
Dividend Income 2 0Trading Profit/Loss (net) -1 -7
Profit/loss on trading account securities 0 0Profit/losses on derivative financial transactions -2 -1Foreign exchange profit/loss 0 -6
Other Operating Income 1 1Total Operating Income/Expenses 47 43Provision for Loan Losses or other Receivables (-) 2 2
Specific provisions of banks loans and other receivables* 0 0General provision expenses* 2 1
Other Operating Expenses (-) 26 19Personnel Expenses* 17 12
Net Operating Profit/Loss 19 21Surplus written as gain after merger 0 0Profit/losses from equity method applied subsidiaries 0 0Net monetory position gain/loss 0 0Profit/Loss Before Taxes from Continuing Operations 19 21Provisions for Taxes on Income from Continuing Operations (±) -4 -4Net Profit/Loss from Continuing Operations 15 17Net Profit/Loss Before Taxes from Terminated Operations 0 0Provisions for Taxes on Income from Terminated Operations (±) 0 0Net Profit/Loss from Terminated Operations 0 0
Net Profit/Losses 15 17
* Used from information and disclosures related to income statement".

II-113
Arap Türk Bankası A. . December 2010
Ratios(%)
Dec. 2010 Dec. 2009
Capital Ratios
Shareholders’ Equity / (Amount subject to credit + market + operational risk) 27.7 31.6
Shareholders' Equity / Total Assets 26.8 29.2
(Shareholders' Equity - Permanent Assets) / Total Assets 21.5 23.3
Net On Balance Sheet Position / Total Shareholders' Equity -15.0 -28.9
Net On and Off Balance Sheet Position / Total Shareholders' Equity 0.1 -5.4
Balance-Sheet Ratios
TC Assets / Total Assets 46.8 54.5
TC Liabilities / Total Liabilities 40.0 42.7
FC Assets / FC Liabilities 88.6 79.4
TC Deposits / Total Deposits 25.7 7.0
TC Loans / Total Loans and Receivables 43.7 58.0
Total Deposits / Total Assets 28.0 18.5
Funds Borrowed / Total Assets 38.1 39.5
Assets Quality
Financial Assets (net) / Total Assets 34.5 47.6
Total Loans and Receivables / Total Assets 43.5 36.2
Total Loans and Receivables / Total Deposits 155.5 195.2
Loans Under Follow-up (gross) / Total Loans and Receivables 1.2 1.7
Loans Under Follow-up (net) / Total Loans and Receivables 0.0 0.0
Specific Provisions / Loans Under Follow-up 100.0 100.0
Permanent Assets / Total Assets 5.3 6.0
Consumer Loans / Total Loans and Receivables 0.0 0.1
Liquidity
Liquid Assets / Total Assets 30.7 31.7
Liquid Assets / Short-term Liabilities 76.7 79.7
TC Liquid Assets / Total Assets 12.3 15.4
Profitability
Net Profit/Losses / Total Assets 2.1 2.6
Net Profit/Losses / Total Shareholders' Equity 7.7 8.9
Profit/Losses Before Taxes after Continuing Operations / Total Assets 2.6 3.3
Income-Expenditure Structure
Net Interest Income After Specific Provisions / Total Assets 3.7 5.2
Net Interest Income After Specific Provisions / Total Operating Income (Expenses) 58.5 79.3
Non-interest Income (net) / Total Assets 2.6 1.4
Other Operating Expenses / Total Assets 3.5 3.0
Personnel Expenses / Other Operating Expenses 66.2 63.5
Non-interest Income (net) / Other Operating Expenses 75.9 46.0
Quarterly profitability and income-expenditure ratios, except year-end figures, should be considered periodically.

II-114
Bank Mellat
Assets(USD Million)
Dec. 2010 % Dec. 2009 %TC FC Total Distr. TC FC Total Distr.
Cash and Balances with the Central Bank 7 98 105 8.8 0 21 21 7.8Fin.ass.where fair value cha. is refl.to I/S (Net) 100 153 253 21.2 0 0 0 0.0
Financial assets held for trading 77 153 231 19.4 0 0 0 0.0Public sector debt securities 0 0 0 0.0 0 0 0 0.0Securities representing a share in capital 0 0 0 0.0 0 0 0 0.0Derivative financial assets held for trading 0 0 0 0.0 0 0 0 0.0Other marketable securities 77 153 231 19.4 0 0 0 0.0
Fin.assets clas. as fair value change is refl.to I/S 22 0 22 1.9 0 0 0 0.0Public sector debt securities 22 0 22 1.9 0 0 0 0.0Securities representing a share in capital 0 0 0 0.0 0 0 0 0.0Loans 0 0 0 0.0 0 0 0 0.0Other marketable securities 0 0 0 0.0 0 0 0 0.0
Banks 0 0 0 0.0 17 49 65 24.6Money Market Securities 0 0 0 0.0 0 0 0 0.0
Interbank money market placements 0 0 0 0.0 0 0 0 0.0Istanbul Stock Exc. money market placements 0 0 0 0.0 0 0 0 0.0Receiv. from reverse repurchase agreements 0 0 0 0.0 0 0 0 0.0
Financial Assets Available for Sale (Net) 87 14 101 8.4 20 0 20 7.6Securities representing a share in capital 0 0 0 0.0 0 0 0 0.0Public sector debt securities 67 0 67 5.7 20 0 20 7.6Other marketable securities 20 14 33 2.8 0 0 0 0.0
Loans 6 723 728 61.0 0 152 153 57.5Loans 5 723 728 61.0 0 152 153 57.4
Loans granted to the Banks risk group 0 273 273 22.9 0 89 89 33.7Public sector debt securities 0 0 0 0.0 0 0 0 0.0Other 5 449 455 38.1 0 63 63 23.8
Loans under follow-up 0 0 0 0.0 0 0 0 0.0Specific provisions (-) 0 0 0 0.0 0 0 0 0.0
Factoring Receivables 0 0 0 0.0 0 0 0 0.0Investments held to Maturity (Net) 0 0 0 0.0 0 0 0 0.0
Public sector debt securities 0 0 0 0.0 0 0 0 0.0Other marketable securities 0 0 0 0.0 0 0 0 0.0
Investments and Associates (Net) 0 0 0 0.0 0 0 0 0.0Accounted with equity method 0 0 0 0.0 0 0 0 0.0Non-consolidated investments and associates 0 0 0 0.0 0 0 0 0.0
Financial investments and associates 0 0 0 0.0 0 0 0 0.0Non-financial investments and associates 0 0 0 0.0 0 0 0 0.0
Subsidiaries (Net) 0 0 0 0.0 0 0 0 0.0Financial subsidiaries 0 0 0 0.0 0 0 0 0.0Non-financial subsidiaries 0 0 0 0.0 0 0 0 0.0
Joint Ventures (Business Partners) (Net) 0 0 0 0.0 0 0 0 0.0Accounted with equity method 0 0 0 0.0 0 0 0 0.0Non-consolidated joint ventures 0 0 0 0.0 0 0 0 0.0
Financial joint ventures 0 0 0 0.0 0 0 0 0.0Non-financial joint ventures 0 0 0 0.0 0 0 0 0.0
Recivables From Leasing Transactions 0 0 0 0.0 0 0 0 0.0Finance lease receivables 0 0 0 0.0 0 0 0 0.0Operational leasing receivables 0 0 0 0.0 0 0 0 0.0Others 0 0 0 0.0 0 0 0 0.0Unearned income (-) 0 0 0 0.0 0 0 0 0.0
Derivative Financial Assets Held for Hedging 0 0 0 0.0 0 0 0 0.0Fair value hedges 0 0 0 0.0 0 0 0 0.0Cash flow hedges 0 0 0 0.0 0 0 0 0.0Hedges for invest. made in foreign countries 0 0 0 0.0 0 0 0 0.0
Property and Equipment (Net) 6 0 6 0.5 6 0 6 2.3Intangible Assets (Net) 0 0 0 0.0 0 0 0 0.0
Goodwill 0 0 0 0.0 0 0 0 0.0Other 0 0 0 0.0 0 0 0 0.0
Real Estates for Investment Purpose (Net) 0 0 0 0.0 0 0 0 0.0Assets for Tax 0 0 0 0.0 0 0 0 0.1
Current assets for tax 0 0 0 0.0 0 0 0 0.0Deferred assets for tax 0 0 0 0.0 0 0 0 0.1
Prop.&Equ.for Sale p. and from Term.Op.(Net) 0 0 0 0.0 0 0 0 0.0Other Assets 0 0 0 0.0 0 0 0 0.0
Total Assets 205 988 1,193 100.0 44 222 266 100.0
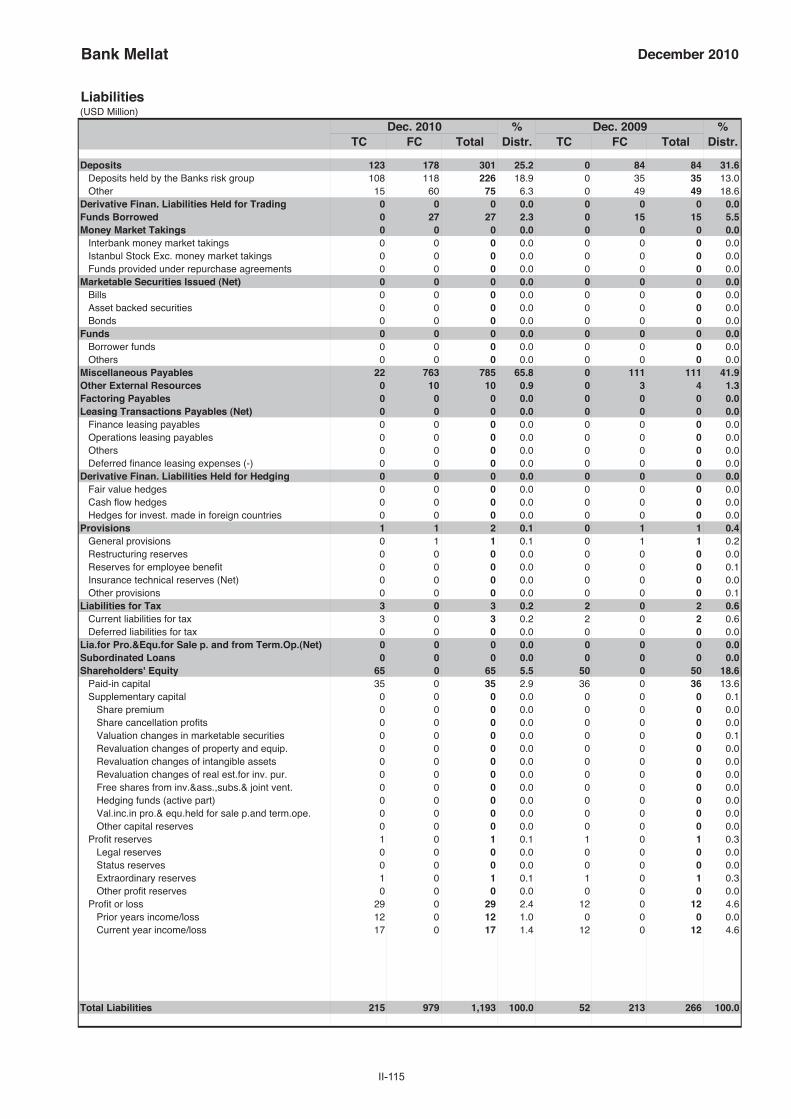
II-115
Bank Mellat December 2010
Liabilities(USD Million)
Dec. 2010 % Dec. 2009 %TC FC Total Distr. TC FC Total Distr.
Deposits 123 178 301 25.2 0 84 84 31.6Deposits held by the Banks risk group 108 118 226 18.9 0 35 35 13.0Other 15 60 75 6.3 0 49 49 18.6
Derivative Finan. Liabilities Held for Trading 0 0 0 0.0 0 0 0 0.0Funds Borrowed 0 27 27 2.3 0 15 15 5.5Money Market Takings 0 0 0 0.0 0 0 0 0.0
Interbank money market takings 0 0 0 0.0 0 0 0 0.0Istanbul Stock Exc. money market takings 0 0 0 0.0 0 0 0 0.0Funds provided under repurchase agreements 0 0 0 0.0 0 0 0 0.0
Marketable Securities Issued (Net) 0 0 0 0.0 0 0 0 0.0Bills 0 0 0 0.0 0 0 0 0.0Asset backed securities 0 0 0 0.0 0 0 0 0.0Bonds 0 0 0 0.0 0 0 0 0.0
Funds 0 0 0 0.0 0 0 0 0.0Borrower funds 0 0 0 0.0 0 0 0 0.0Others 0 0 0 0.0 0 0 0 0.0
Miscellaneous Payables 22 763 785 65.8 0 111 111 41.9Other External Resources 0 10 10 0.9 0 3 4 1.3Factoring Payables 0 0 0 0.0 0 0 0 0.0Leasing Transactions Payables (Net) 0 0 0 0.0 0 0 0 0.0
Finance leasing payables 0 0 0 0.0 0 0 0 0.0Operations leasing payables 0 0 0 0.0 0 0 0 0.0Others 0 0 0 0.0 0 0 0 0.0Deferred finance leasing expenses (-) 0 0 0 0.0 0 0 0 0.0
Derivative Finan. Liabilities Held for Hedging 0 0 0 0.0 0 0 0 0.0Fair value hedges 0 0 0 0.0 0 0 0 0.0Cash flow hedges 0 0 0 0.0 0 0 0 0.0Hedges for invest. made in foreign countries 0 0 0 0.0 0 0 0 0.0
Provisions 1 1 2 0.1 0 1 1 0.4General provisions 0 1 1 0.1 0 1 1 0.2Restructuring reserves 0 0 0 0.0 0 0 0 0.0Reserves for employee benefit 0 0 0 0.0 0 0 0 0.1Insurance technical reserves (Net) 0 0 0 0.0 0 0 0 0.0Other provisions 0 0 0 0.0 0 0 0 0.1
Liabilities for Tax 3 0 3 0.2 2 0 2 0.6Current liabilities for tax 3 0 3 0.2 2 0 2 0.6Deferred liabilities for tax 0 0 0 0.0 0 0 0 0.0
Lia.for Pro.&Equ.for Sale p. and from Term.Op.(Net) 0 0 0 0.0 0 0 0 0.0Subordinated Loans 0 0 0 0.0 0 0 0 0.0Shareholders' Equity 65 0 65 5.5 50 0 50 18.6
Paid-in capital 35 0 35 2.9 36 0 36 13.6Supplementary capital 0 0 0 0.0 0 0 0 0.1
Share premium 0 0 0 0.0 0 0 0 0.0Share cancellation profits 0 0 0 0.0 0 0 0 0.0Valuation changes in marketable securities 0 0 0 0.0 0 0 0 0.1Revaluation changes of property and equip. 0 0 0 0.0 0 0 0 0.0Revaluation changes of intangible assets 0 0 0 0.0 0 0 0 0.0Revaluation changes of real est.for inv. pur. 0 0 0 0.0 0 0 0 0.0Free shares from inv.&ass.,subs.& joint vent. 0 0 0 0.0 0 0 0 0.0Hedging funds (active part) 0 0 0 0.0 0 0 0 0.0Val.inc.in pro.& equ.held for sale p.and term.ope. 0 0 0 0.0 0 0 0 0.0Other capital reserves 0 0 0 0.0 0 0 0 0.0
Profit reserves 1 0 1 0.1 1 0 1 0.3Legal reserves 0 0 0 0.0 0 0 0 0.0Status reserves 0 0 0 0.0 0 0 0 0.0Extraordinary reserves 1 0 1 0.1 1 0 1 0.3Other profit reserves 0 0 0 0.0 0 0 0 0.0
Profit or loss 29 0 29 2.4 12 0 12 4.6Prior years income/loss 12 0 12 1.0 0 0 0 0.0Current year income/loss 17 0 17 1.4 12 0 12 4.6
Total Liabilities 215 979 1,193 100.0 52 213 266 100.0

II-116
Bank Mellat
Off Balance Sheet Commitments(USD Million)
Dec. 2010 Dec. 2009TC FC Total TC FC Total
Guarantees and Warranties 1 68 69 0 24 24Letters of guarantee 0 50 50 0 13 13Bank acceptances 0 0 0 0 0 0Letters of credit 0 18 18 0 11 11Prefinancing given as guarantee 0 0 0 0 0 0Endorsements 0 0 0 0 0 0Other guarantees and warrantees 0 0 0 0 0 0
Commitments 0 0 0 0 25 25Irrevocable commitments 0 0 0 0 25 25Revocable commitments 0 0 0 0 0 0
Derivative Financial Instruments 0 0 0 0 0 0Derivative finan. instruments held for hedging 0 0 0 0 0 0Trading transactions 0 0 0 0 0 0
Custody and Pledged Securities 0 2 2 0 0 0Items held in Custody 0 2 2 0 0 0Pledged Items 0 0 0 0 0 0Acccepted independent guaran. and warran. 0 0 0 0 0 0
Total Off Balance Sheet Commitments 1 70 70 0 49 49
Income-Expenditure(USD Million)
Dec. 2010 Dec. 2009
Interest Income 27 17Interest on loans 19 13Interest received from reserve deposits 0 0Interest received from banks 4 2Interest received from money market transactions 0 0Interest received from marketable securities portfolio 4 3Other interest income 0 0
Interest Expenses 13 7Interest on deposits 2 1Interest on money market transactions 10 6Interest on funds borrowed 0 0Interest on securities issued 0 0Other interest expenses 0 0
Net Interest Income/Expenses 14 11Net Fees and Commissions Income/Expenses 10 7
Fees and commissions received 10 7Fees and commissions paid 0 0
Dividend Income 0 0Trading Profit/Loss (net) 3 1
Profit/loss on trading account securities 0 0Profit/losses on derivative financial transactions 0 0Foreign exchange profit/loss 3 1
Other Operating Income 0 0Total Operating Income/Expenses 27 19Provision for Loan Losses or other Receivables (-) 0 0
Specific provisions of banks loans and other receivables* 0 0General provision expenses* 0 0
Other Operating Expenses (-) 5 4Personnel Expenses* 3 2
Net Operating Profit/Loss 22 15Surplus written as gain after merger 0 0Profit/losses from equity method applied subsidiaries 0 0Net monetory position gain/loss 0 0Profit/Loss Before Taxes from Continuing Operations 22 15Provisions for Taxes on Income from Continuing Operations (±) -4 -3Net Profit/Loss from Continuing Operations 17 12Net Profit/Loss Before Taxes from Terminated Operations 0 0Provisions for Taxes on Income from Terminated Operations (±) 0 0Net Profit/Loss from Terminated Operations 0 0
Net Profit/Losses 17 12
* Used from information and disclosures related to income statement".

II-117
Bank Mellat December 2010
Ratios(%)
Dec. 2010 Dec. 2009
Capital Ratios
Shareholders’ Equity / (Amount subject to credit + market + operational risk) 28.9 49.1
Shareholders' Equity / Total Assets 5.5 18.6
(Shareholders' Equity - Permanent Assets) / Total Assets 5.0 16.3
Net On Balance Sheet Position / Total Shareholders' Equity 18.9 18.3
Net On and Off Balance Sheet Position / Total Shareholders' Equity 18.9 18.3
Balance-Sheet Ratios
TC Assets / Total Assets 17.2 16.5
TC Liabilities / Total Liabilities 18.0 19.7
FC Assets / FC Liabilities 101.0 103.9
TC Deposits / Total Deposits 41.0 0.4
TC Loans / Total Loans and Receivables 0.8 0.2
Total Deposits / Total Assets 25.2 31.6
Funds Borrowed / Total Assets 2.3 5.5
Assets Quality
Financial Assets (net) / Total Assets 29.6 7.6
Total Loans and Receivables / Total Assets 61.0 57.5
Total Loans and Receivables / Total Deposits 241.9 181.8
Loans Under Follow-up (gross) / Total Loans and Receivables 0.0 0.0
Loans Under Follow-up (net) / Total Loans and Receivables 0.0 0.0
Specific Provisions / Loans Under Follow-up 25.0 25.0
Permanent Assets / Total Assets 0.5 2.3
Consumer Loans / Total Loans and Receivables 0.0 0.1
Liquidity
Liquid Assets / Total Assets 38.5 40.1
Liquid Assets / Short-term Liabilities 124.6 103.5
TC Liquid Assets / Total Assets 16.2 14.0
Profitability
Net Profit/Losses / Total Assets 1.4 4.6
Net Profit/Losses / Total Shareholders' Equity 26.3 24.8
Profit/Losses Before Taxes after Continuing Operations / Total Assets 1.8 5.8
Income-Expenditure Structure
Net Interest Income After Specific Provisions / Total Assets 1.2 4.0
Net Interest Income After Specific Provisions / Total Operating Income (Expenses) 52.1 55.6
Non-interest Income (net) / Total Assets 1.1 3.2
Other Operating Expenses / Total Assets 0.4 1.4
Personnel Expenses / Other Operating Expenses 50.4 56.0
Non-interest Income (net) / Other Operating Expenses 252.7 228.4
Quarterly profitability and income-expenditure ratios, except year-end figures, should be considered periodically.

II-118
Citibank A. .
Assets(USD Million)
Dec. 2010 % Dec. 2009 %TC FC Total Distr. TC FC Total Distr.
Cash and Balances with the Central Bank 14 116 131 3.2 121 83 204 6.2Fin.ass.where fair value cha. is refl.to I/S (Net) 410 5 415 10.2 207 10 217 6.6
Financial assets held for trading 410 5 415 10.2 207 10 217 6.6Public sector debt securities 402 1 403 9.9 191 0 192 5.8Securities representing a share in capital 0 0 0 0.0 0 0 0 0.0Derivative financial assets held for trading 8 4 12 0.3 16 10 25 0.8Other marketable securities 0 0 0 0.0 0 0 0 0.0
Fin.assets clas. as fair value change is refl.to I/S 0 0 0 0.0 0 0 0 0.0Public sector debt securities 0 0 0 0.0 0 0 0 0.0Securities representing a share in capital 0 0 0 0.0 0 0 0 0.0Loans 0 0 0 0.0 0 0 0 0.0Other marketable securities 0 0 0 0.0 0 0 0 0.0
Banks 803 48 851 20.8 202 74 276 8.4Money Market Securities 736 0 736 18.0 437 0 437 13.3
Interbank money market placements 0 0 0 0.0 437 0 437 13.3Istanbul Stock Exc. money market placements 0 0 0 0.0 0 0 0 0.0Receiv. from reverse repurchase agreements 736 0 736 18.0 0 0 0 0.0
Financial Assets Available for Sale (Net) 321 0 321 7.9 621 22 643 19.6Securities representing a share in capital 0 0 0 0.0 0 0 0 0.0Public sector debt securities 321 0 321 7.9 621 21 643 19.6Other marketable securities 0 0 0 0.0 0 0 0 0.0
Loans 1,168 330 1,497 36.6 1,092 311 1,403 42.8Loans 1,153 330 1,482 36.3 1,071 311 1,382 42.1
Loans granted to the Banks risk group 10 0 10 0.2 4 0 4 0.1Public sector debt securities 0 0 0 0.0 0 0 0 0.0Other 1,143 330 1,472 36.0 1,067 311 1,378 42.0
Loans under follow-up 211 0 211 5.2 270 0 270 8.2Specific provisions (-) 196 0 196 4.8 250 0 250 7.6
Factoring Receivables 20 79 99 2.4 20 0 20 0.6Investments held to Maturity (Net) 0 0 0 0.0 0 0 0 0.0
Public sector debt securities 0 0 0 0.0 0 0 0 0.0Other marketable securities 0 0 0 0.0 0 0 0 0.0
Investments and Associates (Net) 0 0 0 0.0 0 0 0 0.0Accounted with equity method 0 0 0 0.0 0 0 0 0.0Non-consolidated investments and associates 0 0 0 0.0 0 0 0 0.0
Financial investments and associates 0 0 0 0.0 0 0 0 0.0Non-financial investments and associates 0 0 0 0.0 0 0 0 0.0
Subsidiaries (Net) 0 0 0 0.0 0 0 0 0.0Financial subsidiaries 0 0 0 0.0 0 0 0 0.0Non-financial subsidiaries 0 0 0 0.0 0 0 0 0.0
Joint Ventures (Business Partners) (Net) 0 0 0 0.0 0 0 0 0.0Accounted with equity method 0 0 0 0.0 0 0 0 0.0Non-consolidated joint ventures 0 0 0 0.0 0 0 0 0.0
Financial joint ventures 0 0 0 0.0 0 0 0 0.0Non-financial joint ventures 0 0 0 0.0 0 0 0 0.0
Recivables From Leasing Transactions 0 0 0 0.0 0 0 0 0.0Finance lease receivables 0 0 0 0.0 0 0 0 0.0Operational leasing receivables 0 0 0 0.0 0 0 0 0.0Others 0 0 0 0.0 0 0 0 0.0Unearned income (-) 0 0 0 0.0 0 0 0 0.0
Derivative Financial Assets Held for Hedging 0 0 0 0.0 0 0 0 0.0Fair value hedges 0 0 0 0.0 0 0 0 0.0Cash flow hedges 0 0 0 0.0 0 0 0 0.0Hedges for invest. made in foreign countries 0 0 0 0.0 0 0 0 0.0
Property and Equipment (Net) 6 0 6 0.1 16 0 16 0.5Intangible Assets (Net) 6 0 6 0.1 5 0 5 0.2
Goodwill 0 0 0 0.0 0 0 0 0.0Other 6 0 6 0.1 5 0 5 0.2
Real Estates for Investment Purpose (Net) 0 0 0 0.0 0 0 0 0.0Assets for Tax 3 0 3 0.1 3 0 3 0.1
Current assets for tax 0 0 0 0.0 0 0 0 0.0Deferred assets for tax 3 0 3 0.1 3 0 3 0.1
Prop.&Equ.for Sale p. and from Term.Op.(Net) 0 0 0 0.0 0 0 0 0.0Other Assets 16 5 21 0.5 50 6 56 1.7
Total Assets 3,503 583 4,087 100.0 2,774 506 3,280 100.0

II-119
Citibank A. . December 2010
Liabilities(USD Million)
Dec. 2010 % Dec. 2009 %TC FC Total Distr. TC FC Total Distr.
Deposits 1,771 1,051 2,822 69.1 1,706 725 2,431 74.1Deposits held by the Banks risk group 134 0 134 3.3 150 17 166 5.1Other 1,637 1,051 2,688 65.8 1,556 708 2,264 69.0
Derivative Finan. Liabilities Held for Trading 9 3 13 0.3 18 9 27 0.8Funds Borrowed 135 368 503 12.3 131 1 132 4.0Money Market Takings 0 0 0 0.0 0 0 0 0.0
Interbank money market takings 0 0 0 0.0 0 0 0 0.0Istanbul Stock Exc. money market takings 0 0 0 0.0 0 0 0 0.0Funds provided under repurchase agreements 0 0 0 0.0 0 0 0 0.0
Marketable Securities Issued (Net) 0 0 0 0.0 0 0 0 0.0Bills 0 0 0 0.0 0 0 0 0.0Asset backed securities 0 0 0 0.0 0 0 0 0.0Bonds 0 0 0 0.0 0 0 0 0.0
Funds 0 0 0 0.0 0 0 0 0.0Borrower funds 0 0 0 0.0 0 0 0 0.0Others 0 0 0 0.0 0 0 0 0.0
Miscellaneous Payables 57 0 58 1.4 34 0 34 1.0Other External Resources 35 4 38 0.9 45 3 49 1.5Factoring Payables 0 0 0 0.0 0 0 0 0.0Leasing Transactions Payables (Net) 0 0 0 0.0 0 0 0 0.0
Finance leasing payables 0 0 0 0.0 0 0 0 0.0Operations leasing payables 0 0 0 0.0 0 0 0 0.0Others 0 0 0 0.0 0 0 0 0.0Deferred finance leasing expenses (-) 0 0 0 0.0 0 0 0 0.0
Derivative Finan. Liabilities Held for Hedging 0 0 0 0.0 0 0 0 0.0Fair value hedges 0 0 0 0.0 0 0 0 0.0Cash flow hedges 0 0 0 0.0 0 0 0 0.0Hedges for invest. made in foreign countries 0 0 0 0.0 0 0 0 0.0
Provisions 43 0 43 1.0 32 0 32 1.0General provisions 28 0 28 0.7 21 0 21 0.6Restructuring reserves 0 0 0 0.0 0 0 0 0.0Reserves for employee benefit 1 0 1 0.0 1 0 1 0.0Insurance technical reserves (Net) 0 0 0 0.0 0 0 0 0.0Other provisions 13 0 13 0.3 10 0 10 0.3
Liabilities for Tax 2 0 2 0.1 2 0 2 0.1Current liabilities for tax 2 0 2 0.1 2 0 2 0.1Deferred liabilities for tax 0 0 0 0.0 0 0 0 0.0
Lia.for Pro.&Equ.for Sale p. and from Term.Op.(Net) 0 0 0 0.0 0 0 0 0.0Subordinated Loans 0 0 0 0.0 0 0 0 0.0Shareholders' Equity 608 0 608 14.9 572 1 573 17.5
Paid-in capital 22 0 22 0.5 23 0 23 0.7Supplementary capital 162 0 162 4.0 169 1 170 5.2
Share premium 0 0 0 0.0 0 0 0 0.0Share cancellation profits 0 0 0 0.0 0 0 0 0.0Valuation changes in marketable securities 2 0 2 0.1 3 1 5 0.1Revaluation changes of property and equip. 0 0 0 0.0 0 0 0 0.0Revaluation changes of intangible assets 0 0 0 0.0 0 0 0 0.0Revaluation changes of real est.for inv. pur. 0 0 0 0.0 0 0 0 0.0Free shares from inv.&ass.,subs.& joint vent. 0 0 0 0.0 0 0 0 0.0Hedging funds (active part) 0 0 0 0.0 0 0 0 0.0Val.inc.in pro.& equ.held for sale p.and term.ope. 0 0 0 0.0 0 0 0 0.0Other capital reserves 160 0 160 3.9 165 0 165 5.0
Profit reserves 368 0 368 9.0 329 0 329 10.0Legal reserves 6 0 6 0.2 7 0 7 0.2Status reserves 0 0 0 0.0 0 0 0 0.0Extraordinary reserves 361 0 361 8.8 323 0 323 9.8Other profit reserves 0 0 0 0.0 0 0 0 0.0
Profit or loss 57 0 57 1.4 51 0 51 1.6Prior years income/loss 0 0 0 0.0 0 0 0 0.0Current year income/loss 57 0 57 1.4 51 0 51 1.6
Total Liabilities 2,660 1,426 4,087 100.0 2,540 740 3,280 100.0

II-120
Citibank A. .
Off Balance Sheet Commitments(USD Million)
Dec. 2010 Dec. 2009TC FC Total TC FC Total
Guarantees and Warranties 244 472 716 211 355 566Letters of guarantee 244 192 436 211 214 424Bank acceptances 0 159 159 0 99 99Letters of credit 0 54 54 0 43 43Prefinancing given as guarantee 0 33 33 0 0 0Endorsements 0 0 0 0 0 0Other guarantees and warrantees 0 33 33 0 0 0
Commitments 1,295 463 1,758 885 1 886Irrevocable commitments 1,295 463 1,758 885 1 886Revocable commitments 0 0 0 0 0 0
Derivative Financial Instruments 999 1,567 2,566 2,359 3,078 5,437Derivative finan. instruments held for hedging 0 0 0 0 0 0Trading transactions 999 1,567 2,566 2,359 3,078 5,437
Custody and Pledged Securities 19,677 981 20,658 14,750 925 15,674Items held in Custody 19,561 262 19,823 14,600 227 14,827Pledged Items 116 719 835 150 698 848Acccepted independent guaran. and warran. 0 0 0 0 0 0
Total Off Balance Sheet Commitments 22,216 3,482 25,698 18,204 4,359 22,563
Income-Expenditure(USD Million)
Dec. 2010 Dec. 2009
Interest Income 333 431Interest on loans 204 309Interest received from reserve deposits 4 8Interest received from banks 19 21Interest received from money market transactions 21 47Interest received from marketable securities portfolio 86 45Other interest income 0 0
Interest Expenses 115 188Interest on deposits 109 184Interest on money market transactions 6 4Interest on funds borrowed 0 0Interest on securities issued 0 0Other interest expenses 0 0
Net Interest Income/Expenses 219 242Net Fees and Commissions Income/Expenses -11 -6
Fees and commissions received 3 5Fees and commissions paid 13 10
Dividend Income 0 0Trading Profit/Loss (net) 15 83
Profit/loss on trading account securities 23 54Profit/losses on derivative financial transactions 2 -37Foreign exchange profit/loss -9 66
Other Operating Income 94 87Total Operating Income/Expenses 317 407Provision for Loan Losses or other Receivables (-) 35 119
Specific provisions of banks loans and other receivables* 17 113General provision expenses* 8 0
Other Operating Expenses (-) 209 223Personnel Expenses* 91 91
Net Operating Profit/Loss 73 65Surplus written as gain after merger 0 0Profit/losses from equity method applied subsidiaries 0 0Net monetory position gain/loss 0 0Profit/Loss Before Taxes from Continuing Operations 73 65Provisions for Taxes on Income from Continuing Operations (±) -17 -14Net Profit/Loss from Continuing Operations 57 51Net Profit/Loss Before Taxes from Terminated Operations 0 0Provisions for Taxes on Income from Terminated Operations (±) 0 0Net Profit/Loss from Terminated Operations 0 0
Net Profit/Losses 57 51
* Used from information and disclosures related to income statement".

II-121
Citibank A. . December 2010
Ratios(%)
Dec. 2010 Dec. 2009
Capital Ratios
Shareholders’ Equity / (Amount subject to credit + market + operational risk) 19.5 19.9
Shareholders' Equity / Total Assets 14.9 17.5
(Shareholders' Equity - Permanent Assets) / Total Assets 14.2 16.2
Net On Balance Sheet Position / Total Shareholders' Equity -108.4 -21.6
Net On and Off Balance Sheet Position / Total Shareholders' Equity -4.0 -10.9
Balance-Sheet Ratios
TC Assets / Total Assets 85.7 84.6
TC Liabilities / Total Liabilities 65.1 77.4
FC Assets / FC Liabilities 40.9 68.3
TC Deposits / Total Deposits 62.8 70.2
TC Loans / Total Loans and Receivables 78.0 77.8
Total Deposits / Total Assets 69.1 74.1
Funds Borrowed / Total Assets 12.3 4.0
Assets Quality
Financial Assets (net) / Total Assets 18.0 26.2
Total Loans and Receivables / Total Assets 36.6 42.8
Total Loans and Receivables / Total Deposits 53.1 57.7
Loans Under Follow-up (gross) / Total Loans and Receivables 14.1 19.3
Loans Under Follow-up (net) / Total Loans and Receivables 1.0 1.4
Specific Provisions / Loans Under Follow-up 93.0 92.5
Permanent Assets / Total Assets 0.7 1.3
Consumer Loans / Total Loans and Receivables 40.0 49.1
Liquidity
Liquid Assets / Total Assets 60.1 54.2
Liquid Assets / Short-term Liabilities 90.5 82.2
TC Liquid Assets / Total Assets 55.9 48.4
Profitability
Net Profit/Losses / Total Assets 1.4 1.6
Net Profit/Losses / Total Shareholders' Equity 9.3 8.9
Profit/Losses Before Taxes after Continuing Operations / Total Assets 1.8 2.0
Income-Expenditure Structure
Net Interest Income After Specific Provisions / Total Assets 4.9 3.9
Net Interest Income After Specific Provisions / Total Operating Income (Expenses) 63.4 31.7
Non-interest Income (net) / Total Assets 2.4 5.0
Other Operating Expenses / Total Assets 5.1 6.8
Personnel Expenses / Other Operating Expenses 43.6 40.8
Non-interest Income (net) / Other Operating Expenses 47.1 73.8
Quarterly profitability and income-expenditure ratios, except year-end figures, should be considered periodically.

II-122
Denizbank A. .
Assets(USD Million)
Dec. 2010 % Dec. 2009 %TC FC Total Distr. TC FC Total Distr.
Cash and Balances with the Central Bank 244 866 1,110 6.2 428 487 914 6.4Fin.ass.where fair value cha. is refl.to I/S (Net) 216 169 385 2.1 97 54 151 1.1
Financial assets held for trading 216 169 385 2.1 97 54 151 1.1Public sector debt securities 182 13 195 1.1 57 15 72 0.5Securities representing a share in capital 1 0 1 0.0 0 0 0 0.0Derivative financial assets held for trading 34 156 189 1.1 40 38 78 0.5Other marketable securities 0 0 0 0.0 0 2 2 0.0
Fin.assets clas. as fair value change is refl.to I/S 0 0 0 0.0 0 0 0 0.0Public sector debt securities 0 0 0 0.0 0 0 0 0.0Securities representing a share in capital 0 0 0 0.0 0 0 0 0.0Loans 0 0 0 0.0 0 0 0 0.0Other marketable securities 0 0 0 0.0 0 0 0 0.0
Banks 50 141 192 1.1 0 436 436 3.1Money Market Securities 794 0 794 4.4 471 0 471 3.3
Interbank money market placements 0 0 0 0.0 471 0 471 3.3Istanbul Stock Exc. money market placements 0 0 0 0.0 0 0 0 0.0Receiv. from reverse repurchase agreements 794 0 794 4.4 0 0 0 0.0
Financial Assets Available for Sale (Net) 1,901 163 2,064 11.5 1,233 226 1,459 10.2Securities representing a share in capital 3 0 3 0.0 3 0 3 0.0Public sector debt securities 1,899 161 2,060 11.5 1,230 225 1,455 10.2Other marketable securities 0 2 2 0.0 0 2 2 0.0
Loans 9,234 2,771 12,005 66.7 7,064 2,463 9,528 66.8Loans 9,068 2,771 11,839 65.8 6,868 2,463 9,331 65.4
Loans granted to the Banks risk group 93 41 135 0.7 18 3 21 0.1Public sector debt securities 0 0 0 0.0 0 0 0 0.0Other 8,975 2,729 11,704 65.1 6,849 2,461 9,310 65.3
Loans under follow-up 600 0 600 3.3 592 0 592 4.2Specific provisions (-) 434 0 434 2.4 395 0 395 2.8
Factoring Receivables 0 0 0 0.0 0 0 0 0.0Investments held to Maturity (Net) 468 56 524 2.9 439 29 468 3.3
Public sector debt securities 468 0 468 2.6 439 0 439 3.1Other marketable securities 0 56 56 0.3 0 29 29 0.2
Investments and Associates (Net) 3 0 3 0.0 4 0 4 0.0Accounted with equity method 0 0 0 0.0 0 0 0 0.0Non-consolidated investments and associates 3 0 3 0.0 4 0 4 0.0
Financial investments and associates 0 0 0 0.0 0 0 0 0.0Non-financial investments and associates 3 0 3 0.0 4 0 4 0.0
Subsidiaries (Net) 182 106 288 1.6 188 83 272 1.9Financial subsidiaries 178 106 284 1.6 184 83 268 1.9Non-financial subsidiaries 4 0 4 0.0 4 0 4 0.0
Joint Ventures (Business Partners) (Net) 2 0 2 0.0 1 0 1 0.0Accounted with equity method 0 0 0 0.0 0 0 0 0.0Non-consolidated joint ventures 2 0 2 0.0 1 0 1 0.0
Financial joint ventures 0 0 0 0.0 0 0 0 0.0Non-financial joint ventures 2 0 2 0.0 1 0 1 0.0
Recivables From Leasing Transactions 0 0 0 0.0 0 0 0 0.0Finance lease receivables 0 0 0 0.0 0 0 0 0.0Operational leasing receivables 0 0 0 0.0 0 0 0 0.0Others 0 0 0 0.0 0 0 0 0.0Unearned income (-) 0 0 0 0.0 0 0 0 0.0
Derivative Financial Assets Held for Hedging 122 7 129 0.7 113 10 123 0.9Fair value hedges 0 0 0 0.0 0 0 0 0.0Cash flow hedges 122 7 129 0.7 113 10 123 0.9Hedges for invest. made in foreign countries 0 0 0 0.0 0 0 0 0.0
Property and Equipment (Net) 182 0 182 1.0 156 0 156 1.1Intangible Assets (Net) 22 0 22 0.1 19 0 19 0.1
Goodwill 0 0 0 0.0 0 0 0 0.0Other 22 0 22 0.1 19 0 19 0.1
Real Estates for Investment Purpose (Net) 0 0 0 0.0 0 0 0 0.0Assets for Tax 26 0 26 0.1 48 0 48 0.3
Current assets for tax 0 0 0 0.0 0 0 0 0.0Deferred assets for tax 26 0 26 0.1 48 0 48 0.3
Prop.&Equ.for Sale p. and from Term.Op.(Net) 0 0 0 0.0 0 0 0 0.0Other Assets 190 73 263 1.5 165 43 208 1.5
Total Assets 13,638 4,351 17,989 100.0 10,425 3,832 14,257 100.0

II-123
Denizbank A. . December 2010
Liabilities(USD Million)
Dec. 2010 % Dec. 2009 %TC FC Total Distr. TC FC Total Distr.
Deposits 6,922 3,349 10,271 57.1 4,737 3,086 7,824 54.9Deposits held by the Banks risk group 175 91 267 1.5 85 99 184 1.3Other 6,747 3,258 10,005 55.6 4,653 2,987 7,640 53.6
Derivative Finan. Liabilities Held for Trading 38 76 114 0.6 33 62 95 0.7Funds Borrowed 276 3,520 3,796 21.1 129 2,886 3,014 21.1Money Market Takings 17 0 17 0.1 201 0 201 1.4
Interbank money market takings 0 0 0 0.0 0 0 0 0.0Istanbul Stock Exc. money market takings 0 0 0 0.0 0 0 0 0.0Funds provided under repurchase agreements 17 0 17 0.1 201 0 201 1.4
Marketable Securities Issued (Net) 0 0 0 0.0 0 0 0 0.0Bills 0 0 0 0.0 0 0 0 0.0Asset backed securities 0 0 0 0.0 0 0 0 0.0Bonds 0 0 0 0.0 0 0 0 0.0
Funds 0 0 0 0.0 0 0 0 0.0Borrower funds 0 0 0 0.0 0 0 0 0.0Others 0 0 0 0.0 0 0 0 0.0
Miscellaneous Payables 242 116 358 2.0 176 28 204 1.4Other External Resources 244 186 430 2.4 182 5 187 1.3Factoring Payables 0 0 0 0.0 0 0 0 0.0Leasing Transactions Payables (Net) 15 1 17 0.1 20 7 27 0.2
Finance leasing payables 16 1 18 0.1 23 7 31 0.2Operations leasing payables 0 0 0 0.0 0 0 0 0.0Others 0 0 0 0.0 0 0 0 0.0Deferred finance leasing expenses (-) 1 0 1 0.0 3 0 4 0.0
Derivative Finan. Liabilities Held for Hedging 111 7 117 0.7 116 6 123 0.9Fair value hedges 0 0 0 0.0 0 0 0 0.0Cash flow hedges 111 7 117 0.7 116 6 123 0.9Hedges for invest. made in foreign countries 0 0 0 0.0 0 0 0 0.0
Provisions 289 4 293 1.6 252 6 258 1.8General provisions 119 0 119 0.7 91 0 91 0.6Restructuring reserves 0 0 0 0.0 0 0 0 0.0Reserves for employee benefit 26 0 26 0.1 16 0 16 0.1Insurance technical reserves (Net) 0 0 0 0.0 0 0 0 0.0Other provisions 144 4 148 0.8 145 6 151 1.1
Liabilities for Tax 33 0 33 0.2 44 0 44 0.3Current liabilities for tax 33 0 33 0.2 44 0 44 0.3Deferred liabilities for tax 0 0 0 0.0 0 0 0 0.0
Lia.for Pro.&Equ.for Sale p. and from Term.Op.(Net) 0 0 0 0.0 0 0 0 0.0Subordinated Loans 0 501 501 2.8 0 510 510 3.6Shareholders' Equity 2,028 15 2,043 11.4 1,758 10 1,769 12.4
Paid-in capital 466 0 466 2.6 481 0 481 3.4Supplementary capital 190 15 205 1.1 167 10 177 1.2
Share premium 64 0 64 0.4 66 0 66 0.5Share cancellation profits 0 0 0 0.0 0 0 0 0.0Valuation changes in marketable securities 71 19 90 0.5 49 14 63 0.4Revaluation changes of property and equip. 0 0 0 0.0 0 0 0 0.0Revaluation changes of intangible assets 0 0 0 0.0 0 0 0 0.0Revaluation changes of real est.for inv. pur. 0 0 0 0.0 0 0 0 0.0Free shares from inv.&ass.,subs.& joint vent. 0 0 0 0.0 0 0 0 0.0Hedging funds (active part) -67 -4 -71 -0.4 -75 -4 -79 -0.6Val.inc.in pro.& equ.held for sale p.and term.ope. 0 0 0 0.0 0 0 0 0.0Other capital reserves 123 0 123 0.7 127 0 127 0.9
Profit reserves 1,065 0 1,065 5.9 743 0 743 5.2Legal reserves 52 0 52 0.3 36 0 36 0.3Status reserves 0 0 0 0.0 0 0 0 0.0Extraordinary reserves 1,009 0 1,009 5.6 704 0 704 4.9Other profit reserves 3 0 3 0.0 3 0 3 0.0
Profit or loss 307 0 307 1.7 367 0 367 2.6Prior years income/loss 9 0 9 0.1 10 0 10 0.1Current year income/loss 298 0 298 1.7 358 0 358 2.5
Total Liabilities 10,215 7,775 17,989 100.0 7,650 6,607 14,257 100.0

II-124
Denizbank A. .
Off Balance Sheet Commitments(USD Million)
Dec. 2010 Dec. 2009TC FC Total TC FC Total
Guarantees and Warranties 1,915 2,946 4,861 1,337 2,053 3,390Letters of guarantee 1,913 1,606 3,519 1,337 1,162 2,499Bank acceptances 0 115 115 0 81 81Letters of credit 2 1,046 1,048 0 608 608Prefinancing given as guarantee 0 0 0 0 0 0Endorsements 0 0 0 0 0 0Other guarantees and warrantees 0 179 179 0 203 203
Commitments 17,319 16,348 33,667 3,517 3,154 6,671Irrevocable commitments 3,577 4,376 7,954 3,517 3,154 6,671Revocable commitments 13,742 11,972 25,713 0 0 0
Derivative Financial Instruments 4,782 12,143 16,925 3,271 8,401 11,672Derivative finan. instruments held for hedging 554 1,040 1,595 595 1,074 1,668Trading transactions 4,227 11,103 15,330 2,676 7,327 10,004
Custody and Pledged Securities 37,461 10,957 48,418 26,434 8,902 35,336Items held in Custody 4,983 423 5,407 2,741 369 3,110Pledged Items 32,377 10,468 42,845 23,591 8,446 32,037Acccepted independent guaran. and warran. 101 66 167 103 88 190
Total Off Balance Sheet Commitments 61,478 42,394 103,872 34,559 22,510 57,070
Income-Expenditure(USD Million)
Dec. 2010 Dec. 2009
Interest Income 1,603 1,717Interest on loans 1,280 1,386Interest received from reserve deposits 11 18Interest received from banks 3 8Interest received from money market transactions 11 10Interest received from marketable securities portfolio 283 275Other interest income 15 20
Interest Expenses 571 609Interest on deposits 475 476Interest on money market transactions 78 119Interest on funds borrowed 4 8Interest on securities issued 0 0Other interest expenses 14 6
Net Interest Income/Expenses 1,032 1,107Net Fees and Commissions Income/Expenses 184 174
Fees and commissions received 251 234Fees and commissions paid 66 60
Dividend Income 0 2Trading Profit/Loss (net) -113 -64
Profit/loss on trading account securities 21 90Profit/losses on derivative financial transactions -206 -458Foreign exchange profit/loss 71 304
Other Operating Income 207 140Total Operating Income/Expenses 1,309 1,360Provision for Loan Losses or other Receivables (-) 306 363
Specific provisions of banks loans and other receivables* 237 253General provision expenses* 31 18
Other Operating Expenses (-) 624 549Personnel Expenses* 299 264
Net Operating Profit/Loss 379 447Surplus written as gain after merger 0 0Profit/losses from equity method applied subsidiaries 0 0Net monetory position gain/loss 0 0Profit/Loss Before Taxes from Continuing Operations 379 447Provisions for Taxes on Income from Continuing Operations (±) -82 -90Net Profit/Loss from Continuing Operations 298 358Net Profit/Loss Before Taxes from Terminated Operations 0 0Provisions for Taxes on Income from Terminated Operations (±) 0 0Net Profit/Loss from Terminated Operations 0 0
Net Profit/Losses 298 358
* Used from information and disclosures related to income statement".

II-125
Denizbank A. . December 2010
Ratios(%)
Dec. 2010 Dec. 2009
Capital Ratios
Shareholders’ Equity / (Amount subject to credit + market + operational risk) 16.4 19.0
Shareholders' Equity / Total Assets 11.4 12.4
(Shareholders' Equity - Permanent Assets) / Total Assets 7.7 7.9
Net On Balance Sheet Position / Total Shareholders' Equity -122.0 -103.8
Net On and Off Balance Sheet Position / Total Shareholders' Equity 10.2 1.4
Balance-Sheet Ratios
TC Assets / Total Assets 75.8 73.1
TC Liabilities / Total Liabilities 56.8 53.7
FC Assets / FC Liabilities 56.0 58.0
TC Deposits / Total Deposits 67.4 60.6
TC Loans / Total Loans and Receivables 76.9 74.1
Total Deposits / Total Assets 57.1 54.9
Funds Borrowed / Total Assets 21.1 21.1
Assets Quality
Financial Assets (net) / Total Assets 17.2 15.4
Total Loans and Receivables / Total Assets 66.7 66.8
Total Loans and Receivables / Total Deposits 116.9 121.8
Loans Under Follow-up (gross) / Total Loans and Receivables 5.0 6.2
Loans Under Follow-up (net) / Total Loans and Receivables 1.4 2.1
Specific Provisions / Loans Under Follow-up 72.3 66.8
Permanent Assets / Total Assets 3.7 4.5
Consumer Loans / Total Loans and Receivables 33.1 32.3
Liquidity
Liquid Assets / Total Assets 25.3 24.1
Liquid Assets / Short-term Liabilities 50.5 45.3
TC Liquid Assets / Total Assets 17.8 15.6
Profitability
Net Profit/Losses / Total Assets 1.7 2.5
Net Profit/Losses / Total Shareholders' Equity 14.6 20.2
Profit/Losses Before Taxes after Continuing Operations / Total Assets 2.1 3.1
Income-Expenditure Structure
Net Interest Income After Specific Provisions / Total Assets 4.4 6.0
Net Interest Income After Specific Provisions / Total Operating Income (Expenses) 60.7 62.8
Non-interest Income (net) / Total Assets 1.5 1.8
Other Operating Expenses / Total Assets 3.5 3.8
Personnel Expenses / Other Operating Expenses 48.0 48.1
Non-interest Income (net) / Other Operating Expenses 44.5 46.0
Quarterly profitability and income-expenditure ratios, except year-end figures, should be considered periodically.

II-126
Deutsche Bank A. .
Assets(USD Million)
Dec. 2010 % Dec. 2009 %TC FC Total Distr. TC FC Total Distr.
Cash and Balances with the Central Bank 10 7 18 0.9 9 10 18 1.4Fin.ass.where fair value cha. is refl.to I/S (Net) 227 7 234 11.8 742 3 745 58.0
Financial assets held for trading 227 7 234 11.8 742 3 745 58.0Public sector debt securities 219 0 219 11.0 742 0 742 57.8Securities representing a share in capital 0 0 0 0.0 0 0 0 0.0Derivative financial assets held for trading 0 7 7 0.4 0 3 3 0.2Other marketable securities 8 0 8 0.4 0 0 0 0.0
Fin.assets clas. as fair value change is refl.to I/S 0 0 0 0.0 0 0 0 0.0Public sector debt securities 0 0 0 0.0 0 0 0 0.0Securities representing a share in capital 0 0 0 0.0 0 0 0 0.0Loans 0 0 0 0.0 0 0 0 0.0Other marketable securities 0 0 0 0.0 0 0 0 0.0
Banks 35 1 36 1.8 27 19 47 3.6Money Market Securities 1,525 0 1,525 76.8 315 0 315 24.6
Interbank money market placements 0 0 0 0.0 315 0 315 24.6Istanbul Stock Exc. money market placements 0 0 0 0.0 0 0 0 0.0Receiv. from reverse repurchase agreements 1,525 0 1,525 76.8 0 0 0 0.0
Financial Assets Available for Sale (Net) 0 0 0 0.0 0 0 0 0.0Securities representing a share in capital 0 0 0 0.0 0 0 0 0.0Public sector debt securities 0 0 0 0.0 0 0 0 0.0Other marketable securities 0 0 0 0.0 0 0 0 0.0
Loans 53 57 110 5.5 32 15 46 3.6Loans 53 57 110 5.5 32 15 46 3.6
Loans granted to the Banks risk group 0 0 0 0.0 0 0 0 0.0Public sector debt securities 0 0 0 0.0 0 0 0 0.0Other 53 57 110 5.5 32 15 46 3.6
Loans under follow-up 0 0 0 0.0 0 0 0 0.0Specific provisions (-) 0 0 0 0.0 0 0 0 0.0
Factoring Receivables 0 0 0 0.0 0 0 0 0.0Investments held to Maturity (Net) 0 0 0 0.0 0 0 0 0.0
Public sector debt securities 0 0 0 0.0 0 0 0 0.0Other marketable securities 0 0 0 0.0 0 0 0 0.0
Investments and Associates (Net) 0 0 0 0.0 0 0 0 0.0Accounted with equity method 0 0 0 0.0 0 0 0 0.0Non-consolidated investments and associates 0 0 0 0.0 0 0 0 0.0
Financial investments and associates 0 0 0 0.0 0 0 0 0.0Non-financial investments and associates 0 0 0 0.0 0 0 0 0.0
Subsidiaries (Net) 0 0 0 0.0 0 0 0 0.0Financial subsidiaries 0 0 0 0.0 0 0 0 0.0Non-financial subsidiaries 0 0 0 0.0 0 0 0 0.0
Joint Ventures (Business Partners) (Net) 0 0 0 0.0 0 0 0 0.0Accounted with equity method 0 0 0 0.0 0 0 0 0.0Non-consolidated joint ventures 0 0 0 0.0 0 0 0 0.0
Financial joint ventures 0 0 0 0.0 0 0 0 0.0Non-financial joint ventures 0 0 0 0.0 0 0 0 0.0
Recivables From Leasing Transactions 0 0 0 0.0 0 0 0 0.0Finance lease receivables 0 0 0 0.0 0 0 0 0.0Operational leasing receivables 0 0 0 0.0 0 0 0 0.0Others 0 0 0 0.0 0 0 0 0.0Unearned income (-) 0 0 0 0.0 0 0 0 0.0
Derivative Financial Assets Held for Hedging 0 0 0 0.0 0 0 0 0.0Fair value hedges 0 0 0 0.0 0 0 0 0.0Cash flow hedges 0 0 0 0.0 0 0 0 0.0Hedges for invest. made in foreign countries 0 0 0 0.0 0 0 0 0.0
Property and Equipment (Net) 2 0 2 0.1 3 0 3 0.2Intangible Assets (Net) 30 0 30 1.5 77 0 77 6.0
Goodwill 0 0 0 0.0 0 0 0 0.0Other 30 0 30 1.5 77 0 77 6.0
Real Estates for Investment Purpose (Net) 0 0 0 0.0 0 0 0 0.0Assets for Tax 1 0 1 0.0 0 0 0 0.0
Current assets for tax 1 0 1 0.0 0 0 0 0.0Deferred assets for tax 0 0 0 0.0 0 0 0 0.0
Prop.&Equ.for Sale p. and from Term.Op.(Net) 0 0 0 0.0 0 0 0 0.0Other Assets 3 27 30 1.5 6 26 32 2.5
Total Assets 1,886 99 1,984 100.0 1,212 72 1,284 100.0

II-127
Deutsche Bank A. . December 2010
Liabilities(USD Million)
Dec. 2010 % Dec. 2009 %TC FC Total Distr. TC FC Total Distr.
Deposits 536 628 1,164 58.7 91 292 383 29.8Deposits held by the Banks risk group 340 0 340 17.1 17 0 17 1.3Other 196 628 824 41.5 74 292 366 28.5
Derivative Finan. Liabilities Held for Trading 0 8 8 0.4 0 2 2 0.1Funds Borrowed 520 3 523 26.3 582 0 582 45.3Money Market Takings 13 0 13 0.6 15 0 15 1.2
Interbank money market takings 0 0 0 0.0 0 0 0 0.0Istanbul Stock Exc. money market takings 0 0 0 0.0 0 0 0 0.0Funds provided under repurchase agreements 13 0 13 0.6 15 0 15 1.2
Marketable Securities Issued (Net) 0 0 0 0.0 0 0 0 0.0Bills 0 0 0 0.0 0 0 0 0.0Asset backed securities 0 0 0 0.0 0 0 0 0.0Bonds 0 0 0 0.0 0 0 0 0.0
Funds 0 0 0 0.0 0 0 0 0.0Borrower funds 0 0 0 0.0 0 0 0 0.0Others 0 0 0 0.0 0 0 0 0.0
Miscellaneous Payables 5 0 5 0.2 2 0 2 0.2Other External Resources 0 0 0 0.0 0 0 0 0.0Factoring Payables 0 0 0 0.0 0 0 0 0.0Leasing Transactions Payables (Net) 0 0 0 0.0 0 1 1 0.1
Finance leasing payables 0 0 0 0.0 0 1 1 0.1Operations leasing payables 0 0 0 0.0 0 0 0 0.0Others 0 0 0 0.0 0 0 0 0.0Deferred finance leasing expenses (-) 0 0 0 0.0 0 0 0 0.0
Derivative Finan. Liabilities Held for Hedging 0 0 0 0.0 0 0 0 0.0Fair value hedges 0 0 0 0.0 0 0 0 0.0Cash flow hedges 0 0 0 0.0 0 0 0 0.0Hedges for invest. made in foreign countries 0 0 0 0.0 0 0 0 0.0
Provisions 8 9 16 0.8 9 5 14 1.1General provisions 2 0 2 0.1 2 0 2 0.1Restructuring reserves 0 0 0 0.0 0 0 0 0.0Reserves for employee benefit 0 0 0 0.0 0 0 0 0.0Insurance technical reserves (Net) 0 0 0 0.0 0 0 0 0.0Other provisions 5 9 14 0.7 7 5 12 0.9
Liabilities for Tax 4 0 4 0.2 10 0 10 0.7Current liabilities for tax 3 0 3 0.1 2 0 2 0.2Deferred liabilities for tax 1 0 1 0.1 7 0 7 0.6
Lia.for Pro.&Equ.for Sale p. and from Term.Op.(Net) 0 0 0 0.0 0 0 0 0.0Subordinated Loans 0 0 0 0.0 0 0 0 0.0Shareholders' Equity 250 0 250 12.6 277 0 277 21.6
Paid-in capital 88 0 88 4.4 91 0 91 7.1Supplementary capital 21 0 21 1.0 21 0 21 1.7
Share premium 0 0 0 0.0 0 0 0 0.0Share cancellation profits 0 0 0 0.0 0 0 0 0.0Valuation changes in marketable securities 0 0 0 0.0 0 0 0 0.0Revaluation changes of property and equip. 0 0 0 0.0 0 0 0 0.0Revaluation changes of intangible assets 0 0 0 0.0 0 0 0 0.0Revaluation changes of real est.for inv. pur. 0 0 0 0.0 0 0 0 0.0Free shares from inv.&ass.,subs.& joint vent. 0 0 0 0.0 0 0 0 0.0Hedging funds (active part) 0 0 0 0.0 0 0 0 0.0Val.inc.in pro.& equ.held for sale p.and term.ope. 0 0 0 0.0 0 0 0 0.0Other capital reserves 21 0 21 1.0 21 0 21 1.7
Profit reserves 146 0 146 7.4 94 0 94 7.3Legal reserves 28 0 28 1.4 24 0 24 1.9Status reserves 0 0 0 0.0 0 0 0 0.0Extraordinary reserves 118 0 118 6.0 70 0 70 5.4Other profit reserves 0 0 0 0.0 0 0 0 0.0
Profit or loss -4 0 -4 -0.2 71 0 71 5.5Prior years income/loss 0 0 0 0.0 0 0 0 0.0Current year income/loss -4 0 -4 -0.2 71 0 71 5.5
Total Liabilities 1,336 648 1,984 100.0 985 299 1,284 100.0

II-128
Deutsche Bank A. .
Off Balance Sheet Commitments(USD Million)
Dec. 2010 Dec. 2009TC FC Total TC FC Total
Guarantees and Warranties 28 143 171 14 152 167Letters of guarantee 28 100 128 14 114 128Bank acceptances 0 0 0 0 0 0Letters of credit 0 44 44 0 38 38Prefinancing given as guarantee 0 0 0 0 0 0Endorsements 0 0 0 0 0 0Other guarantees and warrantees 0 0 0 0 0 0
Commitments 660 968 1,628 399 400 799Irrevocable commitments 660 968 1,628 399 400 799Revocable commitments 0 0 0 0 0 0
Derivative Financial Instruments 875 1,564 2,440 725 871 1,596Derivative finan. instruments held for hedging 0 0 0 0 0 0Trading transactions 875 1,564 2,440 725 871 1,596
Custody and Pledged Securities 13,041 10 13,052 10,898 10 10,908Items held in Custody 13,041 10 13,052 10,898 10 10,908Pledged Items 0 0 0 0 0 0Acccepted independent guaran. and warran. 0 0 0 0 0 0
Total Off Balance Sheet Commitments 14,605 2,686 17,291 12,037 1,433 13,470
Income-Expenditure(USD Million)
Dec. 2010 Dec. 2009
Interest Income 67 37Interest on loans 5 6Interest received from reserve deposits 0 0Interest received from banks 2 1Interest received from money market transactions 19 9Interest received from marketable securities portfolio 42 20Other interest income 0 0
Interest Expenses 20 26Interest on deposits 8 8Interest on money market transactions 6 9Interest on funds borrowed 6 9Interest on securities issued 0 0Other interest expenses 0 0
Net Interest Income/Expenses 47 11Net Fees and Commissions Income/Expenses 14 27
Fees and commissions received 22 33Fees and commissions paid 7 5
Dividend Income 0 0Trading Profit/Loss (net) 14 101
Profit/loss on trading account securities 35 109Profit/losses on derivative financial transactions -10 -26Foreign exchange profit/loss -10 18
Other Operating Income 5 4Total Operating Income/Expenses 80 144Provision for Loan Losses or other Receivables (-) 1 2
Specific provisions of banks loans and other receivables* 0 0General provision expenses* 1 1
Other Operating Expenses (-) 83 52Personnel Expenses* 14 12
Net Operating Profit/Loss -3 90Surplus written as gain after merger 0 0Profit/losses from equity method applied subsidiaries 0 0Net monetory position gain/loss 0 0Profit/Loss Before Taxes from Continuing Operations -3 90Provisions for Taxes on Income from Continuing Operations (±) 0 -19Net Profit/Loss from Continuing Operations -4 71Net Profit/Loss Before Taxes from Terminated Operations 0 0Provisions for Taxes on Income from Terminated Operations (±) 0 0Net Profit/Loss from Terminated Operations 0 0
Net Profit/Losses -4 71
* Used from information and disclosures related to income statement".

II-129
Deutsche Bank A. . December 2010
Ratios(%)
Dec. 2010 Dec. 2009
Capital Ratios
Shareholders’ Equity / (Amount subject to credit + market + operational risk) 50.7 49.7
Shareholders' Equity / Total Assets 12.6 21.6
(Shareholders' Equity - Permanent Assets) / Total Assets 11.0 15.4
Net On Balance Sheet Position / Total Shareholders' Equity -203.6 -71.8
Net On and Off Balance Sheet Position / Total Shareholders' Equity 4.2 10.9
Balance-Sheet Ratios
TC Assets / Total Assets 95.0 94.4
TC Liabilities / Total Liabilities 67.3 76.7
FC Assets / FC Liabilities 15.2 24.2
TC Deposits / Total Deposits 46.0 23.7
TC Loans / Total Loans and Receivables 48.3 68.7
Total Deposits / Total Assets 58.7 29.8
Funds Borrowed / Total Assets 26.3 45.3
Assets Quality
Financial Assets (net) / Total Assets 11.8 58.0
Total Loans and Receivables / Total Assets 5.5 3.6
Total Loans and Receivables / Total Deposits 9.4 12.1
Loans Under Follow-up (gross) / Total Loans and Receivables 0.0 0.0
Loans Under Follow-up (net) / Total Loans and Receivables 0.0 0.0
Specific Provisions / Loans Under Follow-up 35.7 -
Permanent Assets / Total Assets 1.6 6.2
Consumer Loans / Total Loans and Receivables 0.1 0.2
Liquidity
Liquid Assets / Total Assets 91.3 87.6
Liquid Assets / Short-term Liabilities 105.8 115.1
TC Liquid Assets / Total Assets 90.5 85.1
Profitability
Net Profit/Losses / Total Assets -0.2 5.5
Net Profit/Losses / Total Shareholders' Equity -1.6 25.6
Profit/Losses Before Taxes after Continuing Operations / Total Assets -0.2 7.0
Income-Expenditure Structure
Net Interest Income After Specific Provisions / Total Assets 2.4 0.9
Net Interest Income After Specific Provisions / Total Operating Income (Expenses) 58.8 7.6
Non-interest Income (net) / Total Assets 1.7 10.3
Other Operating Expenses / Total Assets 4.2 4.0
Personnel Expenses / Other Operating Expenses 16.7 23.2
Non-interest Income (net) / Other Operating Expenses 39.8 256.5
Quarterly profitability and income-expenditure ratios, except year-end figures, should be considered periodically.

II-130
Eurobank Tekfen A. .
Assets(USD Million)
Dec. 2010 % Dec. 2009 %TC FC Total Distr. TC FC Total Distr.
Cash and Balances with the Central Bank 66 71 136 5.1 55 55 111 4.3Fin.ass.where fair value cha. is refl.to I/S (Net) 107 6 113 4.2 77 0 77 3.0
Financial assets held for trading 107 6 113 4.2 77 0 77 3.0Public sector debt securities 102 0 102 3.8 76 0 76 2.9Securities representing a share in capital 0 0 0 0.0 0 0 0 0.0Derivative financial assets held for trading 4 6 11 0.4 1 0 1 0.0Other marketable securities 0 0 0 0.0 0 0 0 0.0
Fin.assets clas. as fair value change is refl.to I/S 0 0 0 0.0 0 0 0 0.0Public sector debt securities 0 0 0 0.0 0 0 0 0.0Securities representing a share in capital 0 0 0 0.0 0 0 0 0.0Loans 0 0 0 0.0 0 0 0 0.0Other marketable securities 0 0 0 0.0 0 0 0 0.0
Banks 318 16 334 12.4 228 136 364 14.0Money Market Securities 0 0 0 0.0 17 0 17 0.6
Interbank money market placements 0 0 0 0.0 17 0 17 0.6Istanbul Stock Exc. money market placements 0 0 0 0.0 0 0 0 0.0Receiv. from reverse repurchase agreements 0 0 0 0.0 0 0 0 0.0
Financial Assets Available for Sale (Net) 149 74 223 8.3 216 87 303 11.7Securities representing a share in capital 2 0 2 0.1 2 0 2 0.1Public sector debt securities 147 74 221 8.2 214 87 301 11.6Other marketable securities 0 0 0 0.0 0 0 0 0.0
Loans 715 339 1,054 39.1 616 234 850 32.8Loans 681 339 1,021 37.8 566 234 800 30.8
Loans granted to the Banks risk group 0 0 0 0.0 0 0 0 0.0Public sector debt securities 0 0 0 0.0 0 0 0 0.0Other 681 339 1,021 37.8 566 234 800 30.8
Loans under follow-up 76 0 76 2.8 106 0 106 4.1Specific provisions (-) 43 0 43 1.6 56 0 56 2.2
Factoring Receivables 54 5 59 2.2 51 5 56 2.2Investments held to Maturity (Net) 624 0 624 23.1 668 0 668 25.7
Public sector debt securities 624 0 624 23.1 668 0 668 25.7Other marketable securities 0 0 0 0.0 0 0 0 0.0
Investments and Associates (Net) 0 0 0 0.0 0 0 0 0.0Accounted with equity method 0 0 0 0.0 0 0 0 0.0Non-consolidated investments and associates 0 0 0 0.0 0 0 0 0.0
Financial investments and associates 0 0 0 0.0 0 0 0 0.0Non-financial investments and associates 0 0 0 0.0 0 0 0 0.0
Subsidiaries (Net) 87 0 87 3.2 90 0 90 3.5Financial subsidiaries 87 0 87 3.2 90 0 90 3.5Non-financial subsidiaries 0 0 0 0.0 0 0 0 0.0
Joint Ventures (Business Partners) (Net) 0 0 0 0.0 0 0 0 0.0Accounted with equity method 0 0 0 0.0 0 0 0 0.0Non-consolidated joint ventures 0 0 0 0.0 0 0 0 0.0
Financial joint ventures 0 0 0 0.0 0 0 0 0.0Non-financial joint ventures 0 0 0 0.0 0 0 0 0.0
Recivables From Leasing Transactions 0 0 0 0.0 0 0 0 0.0Finance lease receivables 0 0 0 0.0 0 0 0 0.0Operational leasing receivables 0 0 0 0.0 0 0 0 0.0Others 0 0 0 0.0 0 0 0 0.0Unearned income (-) 0 0 0 0.0 0 0 0 0.0
Derivative Financial Assets Held for Hedging 0 0 0 0.0 0 0 0 0.0Fair value hedges 0 0 0 0.0 0 0 0 0.0Cash flow hedges 0 0 0 0.0 0 0 0 0.0Hedges for invest. made in foreign countries 0 0 0 0.0 0 0 0 0.0
Property and Equipment (Net) 20 0 20 0.8 26 0 26 1.0Intangible Assets (Net) 12 0 12 0.4 3 0 3 0.1
Goodwill 0 0 0 0.0 0 0 0 0.0Other 12 0 12 0.4 3 0 3 0.1
Real Estates for Investment Purpose (Net) 0 0 0 0.0 0 0 0 0.0Assets for Tax 11 0 11 0.4 15 0 15 0.6
Current assets for tax 0 0 0 0.0 3 0 3 0.1Deferred assets for tax 11 0 11 0.4 12 0 12 0.5
Prop.&Equ.for Sale p. and from Term.Op.(Net) 6 0 6 0.2 1 0 1 0.1Other Assets 16 3 20 0.7 13 0 13 0.5
Total Assets 2,185 515 2,700 100.0 2,076 517 2,593 100.0

II-131
Eurobank Tekfen A. . December 2010
Liabilities(USD Million)
Dec. 2010 % Dec. 2009 %TC FC Total Distr. TC FC Total Distr.
Deposits 752 477 1,228 45.5 725 520 1,245 48.0Deposits held by the Banks risk group 234 99 333 12.3 299 159 458 17.7Other 518 377 895 33.2 426 360 787 30.3
Derivative Finan. Liabilities Held for Trading 6 6 12 0.4 1 0 1 0.0Funds Borrowed 474 116 590 21.9 481 101 582 22.4Money Market Takings 374 0 374 13.8 274 0 274 10.6
Interbank money market takings 0 0 0 0.0 0 0 0 0.0Istanbul Stock Exc. money market takings 0 0 0 0.0 0 0 0 0.0Funds provided under repurchase agreements 374 0 374 13.8 274 0 274 10.6
Marketable Securities Issued (Net) 0 0 0 0.0 0 0 0 0.0Bills 0 0 0 0.0 0 0 0 0.0Asset backed securities 0 0 0 0.0 0 0 0 0.0Bonds 0 0 0 0.0 0 0 0 0.0
Funds 0 0 0 0.0 0 0 0 0.0Borrower funds 0 0 0 0.0 0 0 0 0.0Others 0 0 0 0.0 0 0 0 0.0
Miscellaneous Payables 9 1 10 0.4 4 1 5 0.2Other External Resources 21 4 25 0.9 15 0 15 0.6Factoring Payables 0 0 0 0.0 0 0 0 0.0Leasing Transactions Payables (Net) 0 1 1 0.0 0 1 1 0.1
Finance leasing payables 0 1 1 0.0 0 2 2 0.1Operations leasing payables 0 0 0 0.0 0 0 0 0.0Others 0 0 0 0.0 0 0 0 0.0Deferred finance leasing expenses (-) 0 0 0 0.0 0 0 0 0.0
Derivative Finan. Liabilities Held for Hedging 0 13 13 0.5 0 14 14 0.5Fair value hedges 0 13 13 0.5 0 14 14 0.5Cash flow hedges 0 0 0 0.0 0 0 0 0.0Hedges for invest. made in foreign countries 0 0 0 0.0 0 0 0 0.0
Provisions 20 10 30 1.1 21 9 30 1.2General provisions 8 3 12 0.4 7 3 10 0.4Restructuring reserves 0 0 0 0.0 0 0 0 0.0Reserves for employee benefit 8 0 8 0.3 6 0 6 0.2Insurance technical reserves (Net) 0 0 0 0.0 0 0 0 0.0Other provisions 4 7 10 0.4 9 6 15 0.6
Liabilities for Tax 4 0 4 0.2 4 0 4 0.1Current liabilities for tax 4 0 4 0.2 4 0 4 0.1Deferred liabilities for tax 0 0 0 0.0 0 0 0 0.0
Lia.for Pro.&Equ.for Sale p. and from Term.Op.(Net) 0 0 0 0.0 0 0 0 0.0Subordinated Loans 120 0 120 4.5 124 0 124 4.8Shareholders' Equity 290 1 291 10.8 296 1 297 11.5
Paid-in capital 247 0 247 9.2 255 0 255 9.9Supplementary capital 4 1 5 0.2 10 1 11 0.4
Share premium 0 0 0 0.0 0 0 0 0.0Share cancellation profits 0 0 0 0.0 0 0 0 0.0Valuation changes in marketable securities 1 1 2 0.1 4 1 5 0.2Revaluation changes of property and equip. 2 0 2 0.1 5 0 5 0.2Revaluation changes of intangible assets 0 0 0 0.0 0 0 0 0.0Revaluation changes of real est.for inv. pur. 0 0 0 0.0 0 0 0 0.0Free shares from inv.&ass.,subs.& joint vent. 0 0 0 0.0 0 0 0 0.0Hedging funds (active part) 0 0 0 0.0 0 0 0 0.0Val.inc.in pro.& equ.held for sale p.and term.ope. 0 0 0 0.0 0 0 0 0.0Other capital reserves 1 0 1 0.0 1 0 1 0.0
Profit reserves 29 0 29 1.1 15 0 15 0.6Legal reserves 6 0 6 0.2 5 0 5 0.2Status reserves 0 0 0 0.0 0 0 0 0.0Extraordinary reserves 24 0 24 0.9 10 0 10 0.4Other profit reserves 0 0 0 0.0 0 0 0 0.0
Profit or loss 10 0 10 0.4 15 0 15 0.6Prior years income/loss 0 0 0 0.0 0 0 0 0.0Current year income/loss 10 0 10 0.4 15 0 15 0.6
Total Liabilities 2,071 629 2,700 100.0 1,945 648 2,593 100.0

II-132
Eurobank Tekfen A. .
Off Balance Sheet Commitments(USD Million)
Dec. 2010 Dec. 2009TC FC Total TC FC Total
Guarantees and Warranties 158 688 846 117 632 750Letters of guarantee 157 61 218 116 67 183Bank acceptances 0 20 20 0 13 13Letters of credit 0 108 108 0 66 66Prefinancing given as guarantee 0 0 0 0 0 0Endorsements 0 0 0 0 0 0Other guarantees and warrantees 1 499 499 1 486 487
Commitments 105 70 174 77 25 102Irrevocable commitments 105 70 174 77 25 102Revocable commitments 0 0 0 0 0 0
Derivative Financial Instruments 443 1,738 2,181 95 383 478Derivative finan. instruments held for hedging 0 120 120 0 120 120Trading transactions 443 1,618 2,061 95 263 358
Custody and Pledged Securities 4,011 4,065 8,077 2,593 3,509 6,102Items held in Custody 1,464 202 1,666 760 171 931Pledged Items 2,540 3,858 6,397 1,833 3,338 5,171Acccepted independent guaran. and warran. 7 6 13 0 0 0
Total Off Balance Sheet Commitments 4,717 6,561 11,278 2,882 4,550 7,432
Income-Expenditure(USD Million)
Dec. 2010 Dec. 2009
Interest Income 263 291Interest on loans 97 117Interest received from reserve deposits 2 5Interest received from banks 27 17Interest received from money market transactions 1 1Interest received from marketable securities portfolio 124 145Other interest income 11 6
Interest Expenses 198 221Interest on deposits 75 100Interest on money market transactions 87 93Interest on funds borrowed 25 18Interest on securities issued 0 0Other interest expenses 10 9
Net Interest Income/Expenses 65 70Net Fees and Commissions Income/Expenses 18 21
Fees and commissions received 20 22Fees and commissions paid 2 1
Dividend Income 0 0Trading Profit/Loss (net) 18 26
Profit/loss on trading account securities 15 22Profit/losses on derivative financial transactions 1 1Foreign exchange profit/loss 1 2
Other Operating Income 5 2Total Operating Income/Expenses 106 119Provision for Loan Losses or other Receivables (-) 12 37
Specific provisions of banks loans and other receivables* 10 35General provision expenses* 2 1
Other Operating Expenses (-) 81 63Personnel Expenses* 40 32
Net Operating Profit/Loss 13 19Surplus written as gain after merger 0 0Profit/losses from equity method applied subsidiaries 0 0Net monetory position gain/loss 0 0Profit/Loss Before Taxes from Continuing Operations 13 19Provisions for Taxes on Income from Continuing Operations (±) -3 -4Net Profit/Loss from Continuing Operations 10 15Net Profit/Loss Before Taxes from Terminated Operations 0 0Provisions for Taxes on Income from Terminated Operations (±) 0 0Net Profit/Loss from Terminated Operations 0 0
Net Profit/Losses 10 15
* Used from information and disclosures related to income statement".

II-133
Eurobank Tekfen A. . December 2010
Ratios(%)
Dec. 2010 Dec. 2009
Capital Ratios
Shareholders’ Equity / (Amount subject to credit + market + operational risk) 20.3 26.0
Shareholders' Equity / Total Assets 10.8 11.5
(Shareholders' Equity - Permanent Assets) / Total Assets 4.9 4.9
Net On Balance Sheet Position / Total Shareholders' Equity 12.1 -7.5
Net On and Off Balance Sheet Position / Total Shareholders' Equity -0.3 -5.0
Balance-Sheet Ratios
TC Assets / Total Assets 80.9 80.0
TC Liabilities / Total Liabilities 76.7 75.0
FC Assets / FC Liabilities 81.9 79.8
TC Deposits / Total Deposits 61.2 58.3
TC Loans / Total Loans and Receivables 67.8 72.5
Total Deposits / Total Assets 45.5 48.0
Funds Borrowed / Total Assets 21.9 22.4
Assets Quality
Financial Assets (net) / Total Assets 35.6 40.4
Total Loans and Receivables / Total Assets 39.1 32.8
Total Loans and Receivables / Total Deposits 85.8 68.3
Loans Under Follow-up (gross) / Total Loans and Receivables 7.2 12.4
Loans Under Follow-up (net) / Total Loans and Receivables 3.2 5.9
Specific Provisions / Loans Under Follow-up 55.9 52.8
Permanent Assets / Total Assets 5.9 6.6
Consumer Loans / Total Loans and Receivables 2.4 1.8
Liquidity
Liquid Assets / Total Assets 29.9 33.6
Liquid Assets / Short-term Liabilities 44.8 64.7
TC Liquid Assets / Total Assets 23.7 22.9
Profitability
Net Profit/Losses / Total Assets 0.4 0.6
Net Profit/Losses / Total Shareholders' Equity 3.4 5.0
Profit/Losses Before Taxes after Continuing Operations / Total Assets 0.5 0.7
Income-Expenditure Structure
Net Interest Income After Specific Provisions / Total Assets 2.0 1.3
Net Interest Income After Specific Provisions / Total Operating Income (Expenses) 52.0 29.0
Non-interest Income (net) / Total Assets 1.5 1.9
Other Operating Expenses / Total Assets 3.0 2.4
Personnel Expenses / Other Operating Expenses 48.9 50.3
Non-interest Income (net) / Other Operating Expenses 50.6 77.5
Quarterly profitability and income-expenditure ratios, except year-end figures, should be considered periodically.
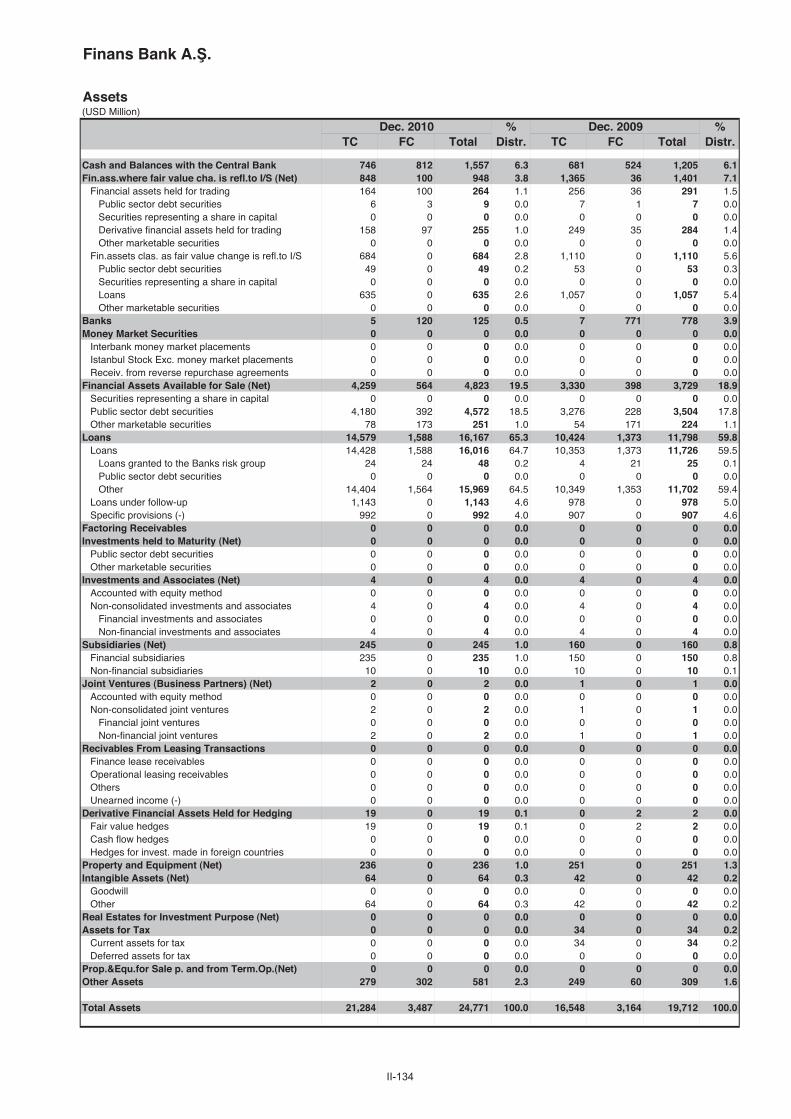
II-134
Finans Bank A. .
Assets(USD Million)
Dec. 2010 % Dec. 2009 %TC FC Total Distr. TC FC Total Distr.
Cash and Balances with the Central Bank 746 812 1,557 6.3 681 524 1,205 6.1Fin.ass.where fair value cha. is refl.to I/S (Net) 848 100 948 3.8 1,365 36 1,401 7.1
Financial assets held for trading 164 100 264 1.1 256 36 291 1.5Public sector debt securities 6 3 9 0.0 7 1 7 0.0Securities representing a share in capital 0 0 0 0.0 0 0 0 0.0Derivative financial assets held for trading 158 97 255 1.0 249 35 284 1.4Other marketable securities 0 0 0 0.0 0 0 0 0.0
Fin.assets clas. as fair value change is refl.to I/S 684 0 684 2.8 1,110 0 1,110 5.6Public sector debt securities 49 0 49 0.2 53 0 53 0.3Securities representing a share in capital 0 0 0 0.0 0 0 0 0.0Loans 635 0 635 2.6 1,057 0 1,057 5.4Other marketable securities 0 0 0 0.0 0 0 0 0.0
Banks 5 120 125 0.5 7 771 778 3.9Money Market Securities 0 0 0 0.0 0 0 0 0.0
Interbank money market placements 0 0 0 0.0 0 0 0 0.0Istanbul Stock Exc. money market placements 0 0 0 0.0 0 0 0 0.0Receiv. from reverse repurchase agreements 0 0 0 0.0 0 0 0 0.0
Financial Assets Available for Sale (Net) 4,259 564 4,823 19.5 3,330 398 3,729 18.9Securities representing a share in capital 0 0 0 0.0 0 0 0 0.0Public sector debt securities 4,180 392 4,572 18.5 3,276 228 3,504 17.8Other marketable securities 78 173 251 1.0 54 171 224 1.1
Loans 14,579 1,588 16,167 65.3 10,424 1,373 11,798 59.8Loans 14,428 1,588 16,016 64.7 10,353 1,373 11,726 59.5
Loans granted to the Banks risk group 24 24 48 0.2 4 21 25 0.1Public sector debt securities 0 0 0 0.0 0 0 0 0.0Other 14,404 1,564 15,969 64.5 10,349 1,353 11,702 59.4
Loans under follow-up 1,143 0 1,143 4.6 978 0 978 5.0Specific provisions (-) 992 0 992 4.0 907 0 907 4.6
Factoring Receivables 0 0 0 0.0 0 0 0 0.0Investments held to Maturity (Net) 0 0 0 0.0 0 0 0 0.0
Public sector debt securities 0 0 0 0.0 0 0 0 0.0Other marketable securities 0 0 0 0.0 0 0 0 0.0
Investments and Associates (Net) 4 0 4 0.0 4 0 4 0.0Accounted with equity method 0 0 0 0.0 0 0 0 0.0Non-consolidated investments and associates 4 0 4 0.0 4 0 4 0.0
Financial investments and associates 0 0 0 0.0 0 0 0 0.0Non-financial investments and associates 4 0 4 0.0 4 0 4 0.0
Subsidiaries (Net) 245 0 245 1.0 160 0 160 0.8Financial subsidiaries 235 0 235 1.0 150 0 150 0.8Non-financial subsidiaries 10 0 10 0.0 10 0 10 0.1
Joint Ventures (Business Partners) (Net) 2 0 2 0.0 1 0 1 0.0Accounted with equity method 0 0 0 0.0 0 0 0 0.0Non-consolidated joint ventures 2 0 2 0.0 1 0 1 0.0
Financial joint ventures 0 0 0 0.0 0 0 0 0.0Non-financial joint ventures 2 0 2 0.0 1 0 1 0.0
Recivables From Leasing Transactions 0 0 0 0.0 0 0 0 0.0Finance lease receivables 0 0 0 0.0 0 0 0 0.0Operational leasing receivables 0 0 0 0.0 0 0 0 0.0Others 0 0 0 0.0 0 0 0 0.0Unearned income (-) 0 0 0 0.0 0 0 0 0.0
Derivative Financial Assets Held for Hedging 19 0 19 0.1 0 2 2 0.0Fair value hedges 19 0 19 0.1 0 2 2 0.0Cash flow hedges 0 0 0 0.0 0 0 0 0.0Hedges for invest. made in foreign countries 0 0 0 0.0 0 0 0 0.0
Property and Equipment (Net) 236 0 236 1.0 251 0 251 1.3Intangible Assets (Net) 64 0 64 0.3 42 0 42 0.2
Goodwill 0 0 0 0.0 0 0 0 0.0Other 64 0 64 0.3 42 0 42 0.2
Real Estates for Investment Purpose (Net) 0 0 0 0.0 0 0 0 0.0Assets for Tax 0 0 0 0.0 34 0 34 0.2
Current assets for tax 0 0 0 0.0 34 0 34 0.2Deferred assets for tax 0 0 0 0.0 0 0 0 0.0
Prop.&Equ.for Sale p. and from Term.Op.(Net) 0 0 0 0.0 0 0 0 0.0Other Assets 279 302 581 2.3 249 60 309 1.6
Total Assets 21,284 3,487 24,771 100.0 16,548 3,164 19,712 100.0

II-135
Finans Bank A. . December 2010
Liabilities(USD Million)
Dec. 2010 % Dec. 2009 %TC FC Total Distr. TC FC Total Distr.
Deposits 11,893 3,996 15,889 64.1 8,746 4,881 13,627 69.1Deposits held by the Banks risk group 248 108 356 1.4 190 834 1,025 5.2Other 11,645 3,888 15,532 62.7 8,556 4,046 12,603 63.9
Derivative Finan. Liabilities Held for Trading 217 91 308 1.2 154 25 179 0.9Funds Borrowed 241 2,029 2,270 9.2 235 1,143 1,378 7.0Money Market Takings 529 202 731 3.0 13 0 13 0.1
Interbank money market takings 0 0 0 0.0 0 0 0 0.0Istanbul Stock Exc. money market takings 0 0 0 0.0 0 0 0 0.0Funds provided under repurchase agreements 529 202 731 3.0 13 0 13 0.1
Marketable Securities Issued (Net) 0 0 0 0.0 0 0 0 0.0Bills 0 0 0 0.0 0 0 0 0.0Asset backed securities 0 0 0 0.0 0 0 0 0.0Bonds 0 0 0 0.0 0 0 0 0.0
Funds 0 0 0 0.0 0 0 0 0.0Borrower funds 0 0 0 0.0 0 0 0 0.0Others 0 0 0 0.0 0 0 0 0.0
Miscellaneous Payables 552 24 576 2.3 380 108 488 2.5Other External Resources 303 7 311 1.3 211 2 213 1.1Factoring Payables 0 0 0 0.0 0 0 0 0.0Leasing Transactions Payables (Net) 0 0 0 0.0 0 3 3 0.0
Finance leasing payables 0 0 0 0.0 0 4 4 0.0Operations leasing payables 0 0 0 0.0 0 0 0 0.0Others 0 0 0 0.0 0 0 0 0.0Deferred finance leasing expenses (-) 0 0 0 0.0 0 0 0 0.0
Derivative Finan. Liabilities Held for Hedging 208 5 213 0.9 0 2 2 0.0Fair value hedges 163 5 167 0.7 0 2 2 0.0Cash flow hedges 45 0 45 0.2 0 0 0 0.0Hedges for invest. made in foreign countries 0 0 0 0.0 0 0 0 0.0
Provisions 316 20 336 1.4 302 22 324 1.6General provisions 153 20 173 0.7 112 22 134 0.7Restructuring reserves 0 0 0 0.0 0 0 0 0.0Reserves for employee benefit 47 0 47 0.2 43 0 43 0.2Insurance technical reserves (Net) 0 0 0 0.0 0 0 0 0.0Other provisions 116 0 116 0.5 147 0 147 0.7
Liabilities for Tax 92 0 92 0.4 56 0 56 0.3Current liabilities for tax 43 0 43 0.2 0 0 0 0.0Deferred liabilities for tax 49 0 49 0.2 56 0 56 0.3
Lia.for Pro.&Equ.for Sale p. and from Term.Op.(Net) 0 0 0 0.0 0 0 0 0.0Subordinated Loans 0 657 657 2.7 0 991 991 5.0Shareholders' Equity 3,381 7 3,387 13.7 2,411 28 2,439 12.4
Paid-in capital 1,434 0 1,434 5.8 1,059 0 1,059 5.4Supplementary capital 152 7 159 0.6 56 28 84 0.4
Share premium 0 0 0 0.0 0 0 0 0.0Share cancellation profits 0 0 0 0.0 0 0 0 0.0Valuation changes in marketable securities 164 7 171 0.7 56 28 84 0.4Revaluation changes of property and equip. 0 0 0 0.0 0 0 0 0.0Revaluation changes of intangible assets 0 0 0 0.0 0 0 0 0.0Revaluation changes of real est.for inv. pur. 0 0 0 0.0 0 0 0 0.0Free shares from inv.&ass.,subs.& joint vent. 2 0 2 0.0 0 0 0 0.0Hedging funds (active part) -14 0 -14 -0.1 0 0 0 0.0Val.inc.in pro.& equ.held for sale p.and term.ope. 0 0 0 0.0 0 0 0 0.0Other capital reserves 0 0 0 0.0 0 0 0 0.0
Profit reserves 1,199 0 1,199 4.8 859 0 859 4.4Legal reserves 119 0 119 0.5 101 0 101 0.5Status reserves 0 0 0 0.0 0 0 0 0.0Extraordinary reserves 1,081 0 1,081 4.4 758 0 758 3.8Other profit reserves 0 0 0 0.0 0 0 0 0.0
Profit or loss 595 0 595 2.4 437 0 437 2.2Prior years income/loss 0 0 0 0.0 0 0 0 0.0Current year income/loss 595 0 595 2.4 437 0 437 2.2
Total Liabilities 17,733 7,037 24,771 100.0 12,508 7,204 19,712 100.0
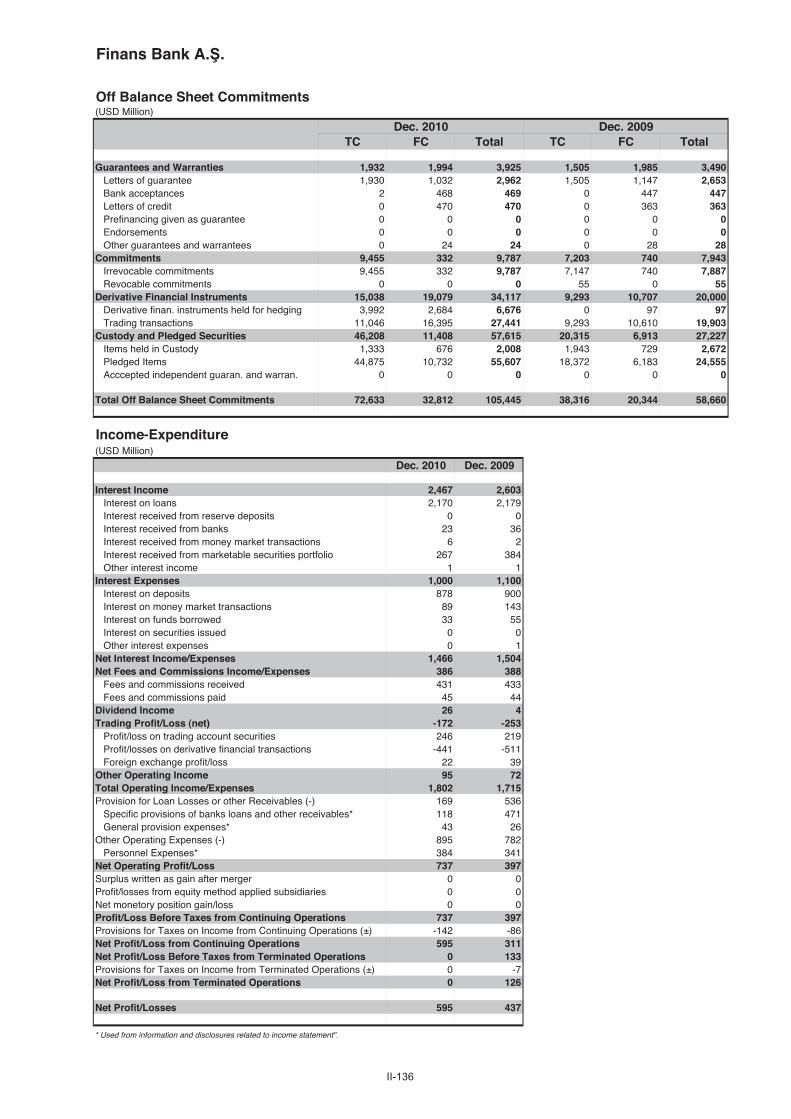
II-136
Finans Bank A. .
Off Balance Sheet Commitments(USD Million)
Dec. 2010 Dec. 2009TC FC Total TC FC Total
Guarantees and Warranties 1,932 1,994 3,925 1,505 1,985 3,490Letters of guarantee 1,930 1,032 2,962 1,505 1,147 2,653Bank acceptances 2 468 469 0 447 447Letters of credit 0 470 470 0 363 363Prefinancing given as guarantee 0 0 0 0 0 0Endorsements 0 0 0 0 0 0Other guarantees and warrantees 0 24 24 0 28 28
Commitments 9,455 332 9,787 7,203 740 7,943Irrevocable commitments 9,455 332 9,787 7,147 740 7,887Revocable commitments 0 0 0 55 0 55
Derivative Financial Instruments 15,038 19,079 34,117 9,293 10,707 20,000Derivative finan. instruments held for hedging 3,992 2,684 6,676 0 97 97Trading transactions 11,046 16,395 27,441 9,293 10,610 19,903
Custody and Pledged Securities 46,208 11,408 57,615 20,315 6,913 27,227Items held in Custody 1,333 676 2,008 1,943 729 2,672Pledged Items 44,875 10,732 55,607 18,372 6,183 24,555Acccepted independent guaran. and warran. 0 0 0 0 0 0
Total Off Balance Sheet Commitments 72,633 32,812 105,445 38,316 20,344 58,660
Income-Expenditure(USD Million)
Dec. 2010 Dec. 2009
Interest Income 2,467 2,603Interest on loans 2,170 2,179Interest received from reserve deposits 0 0Interest received from banks 23 36Interest received from money market transactions 6 2Interest received from marketable securities portfolio 267 384Other interest income 1 1
Interest Expenses 1,000 1,100Interest on deposits 878 900Interest on money market transactions 89 143Interest on funds borrowed 33 55Interest on securities issued 0 0Other interest expenses 0 1
Net Interest Income/Expenses 1,466 1,504Net Fees and Commissions Income/Expenses 386 388
Fees and commissions received 431 433Fees and commissions paid 45 44
Dividend Income 26 4Trading Profit/Loss (net) -172 -253
Profit/loss on trading account securities 246 219Profit/losses on derivative financial transactions -441 -511Foreign exchange profit/loss 22 39
Other Operating Income 95 72Total Operating Income/Expenses 1,802 1,715Provision for Loan Losses or other Receivables (-) 169 536
Specific provisions of banks loans and other receivables* 118 471General provision expenses* 43 26
Other Operating Expenses (-) 895 782Personnel Expenses* 384 341
Net Operating Profit/Loss 737 397Surplus written as gain after merger 0 0Profit/losses from equity method applied subsidiaries 0 0Net monetory position gain/loss 0 0Profit/Loss Before Taxes from Continuing Operations 737 397Provisions for Taxes on Income from Continuing Operations (±) -142 -86Net Profit/Loss from Continuing Operations 595 311Net Profit/Loss Before Taxes from Terminated Operations 0 133Provisions for Taxes on Income from Terminated Operations (±) 0 -7Net Profit/Loss from Terminated Operations 0 126
Net Profit/Losses 595 437
* Used from information and disclosures related to income statement".

II-137
Finans Bank A. . December 2010
Ratios(%)
Dec. 2010 Dec. 2009
Capital Ratios
Shareholders’ Equity / (Amount subject to credit + market + operational risk) 16.7 18.0
Shareholders' Equity / Total Assets 13.7 12.4
(Shareholders' Equity - Permanent Assets) / Total Assets 10.8 9.7
Net On Balance Sheet Position / Total Shareholders' Equity -79.7 -133.8
Net On and Off Balance Sheet Position / Total Shareholders' Equity -8.1 0.4
Balance-Sheet Ratios
TC Assets / Total Assets 85.9 83.9
TC Liabilities / Total Liabilities 71.6 63.5
FC Assets / FC Liabilities 49.5 43.9
TC Deposits / Total Deposits 74.9 64.2
TC Loans / Total Loans and Receivables 90.2 88.4
Total Deposits / Total Assets 64.1 69.1
Funds Borrowed / Total Assets 9.2 7.0
Assets Quality
Financial Assets (net) / Total Assets 23.4 26.0
Total Loans and Receivables / Total Assets 65.3 59.8
Total Loans and Receivables / Total Deposits 101.8 86.6
Loans Under Follow-up (gross) / Total Loans and Receivables 7.1 8.3
Loans Under Follow-up (net) / Total Loans and Receivables 0.9 0.6
Specific Provisions / Loans Under Follow-up 86.8 92.7
Permanent Assets / Total Assets 2.8 2.7
Consumer Loans / Total Loans and Receivables 63.8 66.7
Liquidity
Liquid Assets / Total Assets 30.1 36.1
Liquid Assets / Short-term Liabilities 55.6 66.0
TC Liquid Assets / Total Assets 23.6 27.3
Profitability
Net Profit/Losses / Total Assets 2.4 2.2
Net Profit/Losses / Total Shareholders' Equity 17.6 17.9
Profit/Losses Before Taxes after Continuing Operations / Total Assets 3.0 2.0
Income-Expenditure Structure
Net Interest Income After Specific Provisions / Total Assets 5.4 5.2
Net Interest Income After Specific Provisions / Total Operating Income (Expenses) 74.8 60.2
Non-interest Income (net) / Total Assets 1.4 1.1
Other Operating Expenses / Total Assets 3.6 4.0
Personnel Expenses / Other Operating Expenses 42.9 43.6
Non-interest Income (net) / Other Operating Expenses 37.5 27.0
Quarterly profitability and income-expenditure ratios, except year-end figures, should be considered periodically.

II-138
Fortis Bank A. .
Assets(USD Million)
Dec. 2010 % Dec. 2009 %TC FC Total Distr. TC FC Total Distr.
Cash and Balances with the Central Bank 106 334 440 5.6 198 302 500 6.6Fin.ass.where fair value cha. is refl.to I/S (Net) 160 366 526 6.7 172 242 414 5.5
Financial assets held for trading 160 366 526 6.7 172 241 412 5.4Public sector debt securities 121 344 465 5.9 134 224 359 4.7Securities representing a share in capital 0 0 0 0.0 21 0 21 0.3Derivative financial assets held for trading 39 22 61 0.8 16 16 33 0.4Other marketable securities 0 0 0 0.0 0 0 0 0.0
Fin.assets clas. as fair value change is refl.to I/S 0 0 0 0.0 0 2 2 0.0Public sector debt securities 0 0 0 0.0 0 2 2 0.0Securities representing a share in capital 0 0 0 0.0 0 0 0 0.0Loans 0 0 0 0.0 0 0 0 0.0Other marketable securities 0 0 0 0.0 0 0 0 0.0
Banks 319 25 344 4.4 4 47 50 0.7Money Market Securities 192 0 192 2.4 20 49 70 0.9
Interbank money market placements 65 0 65 0.8 20 0 20 0.3Istanbul Stock Exc. money market placements 0 0 0 0.0 0 0 0 0.0Receiv. from reverse repurchase agreements 127 0 127 1.6 0 49 49 0.7
Financial Assets Available for Sale (Net) 569 75 645 8.2 1,115 176 1,291 17.0Securities representing a share in capital 4 0 4 0.1 13 1 13 0.2Public sector debt securities 565 75 640 8.1 1,102 173 1,276 16.8Other marketable securities 0 0 0 0.0 0 2 2 0.0
Loans 4,426 926 5,352 67.8 4,069 606 4,675 61.7Loans 4,355 926 5,281 66.9 3,920 606 4,526 59.7
Loans granted to the Banks risk group 66 0 66 0.8 0 0 0 0.0Public sector debt securities 0 0 0 0.0 0 0 0 0.0Other 4,290 926 5,215 66.1 3,920 605 4,526 59.7
Loans under follow-up 256 0 256 3.2 376 0 376 5.0Specific provisions (-) 185 0 185 2.3 228 0 228 3.0
Factoring Receivables 0 0 0 0.0 0 0 0 0.0Investments held to Maturity (Net) 41 77 118 1.5 97 96 193 2.5
Public sector debt securities 41 77 118 1.5 97 96 193 2.5Other marketable securities 0 0 0 0.0 0 0 0 0.0
Investments and Associates (Net) 0 0 0 0.0 0 0 0 0.0Accounted with equity method 0 0 0 0.0 0 0 0 0.0Non-consolidated investments and associates 0 0 0 0.0 0 0 0 0.0
Financial investments and associates 0 0 0 0.0 0 0 0 0.0Non-financial investments and associates 0 0 0 0.0 0 0 0 0.0
Subsidiaries (Net) 29 0 29 0.4 39 89 127 1.7Financial subsidiaries 29 0 29 0.4 39 89 127 1.7Non-financial subsidiaries 0 0 0 0.0 0 0 0 0.0
Joint Ventures (Business Partners) (Net) 0 0 0 0.0 0 0 0 0.0Accounted with equity method 0 0 0 0.0 0 0 0 0.0Non-consolidated joint ventures 0 0 0 0.0 0 0 0 0.0
Financial joint ventures 0 0 0 0.0 0 0 0 0.0Non-financial joint ventures 0 0 0 0.0 0 0 0 0.0
Recivables From Leasing Transactions 0 0 0 0.0 0 0 0 0.0Finance lease receivables 0 0 0 0.0 0 0 0 0.0Operational leasing receivables 0 0 0 0.0 0 0 0 0.0Others 0 0 0 0.0 0 0 0 0.0Unearned income (-) 0 0 0 0.0 0 0 0 0.0
Derivative Financial Assets Held for Hedging 0 0 0 0.0 0 0 0 0.0Fair value hedges 0 0 0 0.0 0 0 0 0.0Cash flow hedges 0 0 0 0.0 0 0 0 0.0Hedges for invest. made in foreign countries 0 0 0 0.0 0 0 0 0.0
Property and Equipment (Net) 89 0 89 1.1 106 0 106 1.4Intangible Assets (Net) 5 0 5 0.1 7 0 7 0.1
Goodwill 0 0 0 0.0 0 0 0 0.0Other 5 0 5 0.1 7 0 7 0.1
Real Estates for Investment Purpose (Net) 0 0 0 0.0 0 0 0 0.0Assets for Tax 44 0 44 0.6 32 0 32 0.4
Current assets for tax 0 0 0 0.0 4 0 4 0.0Deferred assets for tax 44 0 44 0.6 29 0 29 0.4
Prop.&Equ.for Sale p. and from Term.Op.(Net) 0 0 0 0.0 11 0 11 0.1Other Assets 90 16 106 1.3 96 8 104 1.4
Total Assets 6,071 1,819 7,891 100.0 5,965 1,615 7,580 100.0

II-139
Fortis Bank A. . December 2010
Liabilities(USD Million)
Dec. 2010 % Dec. 2009 %TC FC Total Distr. TC FC Total Distr.
Deposits 2,685 1,391 4,075 51.6 2,217 1,689 3,906 51.5Deposits held by the Banks risk group 214 10 224 2.8 34 16 51 0.7Other 2,471 1,380 3,851 48.8 2,182 1,673 3,855 50.9
Derivative Finan. Liabilities Held for Trading 68 25 94 1.2 80 21 100 1.3Funds Borrowed 194 1,694 1,888 23.9 237 1,568 1,806 23.8Money Market Takings 56 29 85 1.1 7 0 7 0.1
Interbank money market takings 0 0 0 0.0 0 0 0 0.0Istanbul Stock Exc. money market takings 0 0 0 0.0 0 0 0 0.0Funds provided under repurchase agreements 56 29 85 1.1 7 0 7 0.1
Marketable Securities Issued (Net) 0 0 0 0.0 0 0 0 0.0Bills 0 0 0 0.0 0 0 0 0.0Asset backed securities 0 0 0 0.0 0 0 0 0.0Bonds 0 0 0 0.0 0 0 0 0.0
Funds 0 0 0 0.0 0 0 0 0.0Borrower funds 0 0 0 0.0 0 0 0 0.0Others 0 0 0 0.0 0 0 0 0.0
Miscellaneous Payables 243 14 256 3.2 221 13 234 3.1Other External Resources 55 1 55 0.7 60 1 61 0.8Factoring Payables 0 0 0 0.0 0 0 0 0.0Leasing Transactions Payables (Net) 0 0 0 0.0 0 0 0 0.0
Finance leasing payables 0 0 0 0.0 0 0 0 0.0Operations leasing payables 0 0 0 0.0 0 0 0 0.0Others 0 0 0 0.0 0 0 0 0.0Deferred finance leasing expenses (-) 0 0 0 0.0 0 0 0 0.0
Derivative Finan. Liabilities Held for Hedging 0 0 0 0.0 0 0 0 0.0Fair value hedges 0 0 0 0.0 0 0 0 0.0Cash flow hedges 0 0 0 0.0 0 0 0 0.0Hedges for invest. made in foreign countries 0 0 0 0.0 0 0 0 0.0
Provisions 154 0 154 1.9 129 5 134 1.8General provisions 45 0 45 0.6 33 5 38 0.5Restructuring reserves 8 0 8 0.1 0 0 0 0.0Reserves for employee benefit 36 0 36 0.5 27 0 27 0.4Insurance technical reserves (Net) 0 0 0 0.0 0 0 0 0.0Other provisions 65 0 65 0.8 69 0 69 0.9
Liabilities for Tax 31 0 31 0.4 13 0 13 0.2Current liabilities for tax 31 0 31 0.4 13 0 13 0.2Deferred liabilities for tax 0 0 0 0.0 0 0 0 0.0
Lia.for Pro.&Equ.for Sale p. and from Term.Op.(Net) 0 0 0 0.0 0 0 0 0.0Subordinated Loans 0 0 0 0.0 0 0 0 0.0Shareholders' Equity 1,249 2 1,252 15.9 1,302 17 1,319 17.4
Paid-in capital 683 0 683 8.7 706 0 706 9.3Supplementary capital 145 2 148 1.9 174 17 191 2.5
Share premium 0 0 0 0.0 0 0 0 0.0Share cancellation profits 0 0 0 0.0 0 0 0 0.0Valuation changes in marketable securities 7 2 9 0.1 33 17 49 0.6Revaluation changes of property and equip. 8 0 8 0.1 7 0 7 0.1Revaluation changes of intangible assets 0 0 0 0.0 0 0 0 0.0Revaluation changes of real est.for inv. pur. 0 0 0 0.0 0 0 0 0.0Free shares from inv.&ass.,subs.& joint vent. 0 0 0 0.0 0 0 0 0.0Hedging funds (active part) 0 0 0 0.0 0 0 0 0.0Val.inc.in pro.& equ.held for sale p.and term.ope. 0 0 0 0.0 0 0 0 0.0Other capital reserves 130 0 130 1.6 134 0 134 1.8
Profit reserves 395 0 395 5.0 335 0 335 4.4Legal reserves 33 0 33 0.4 30 0 30 0.4Status reserves 0 0 0 0.0 0 0 0 0.0Extraordinary reserves 362 0 362 4.6 305 0 305 4.0Other profit reserves 0 0 0 0.0 0 0 0 0.0
Profit or loss 26 0 26 0.3 86 0 86 1.1Prior years income/loss 11 0 11 0.1 12 0 12 0.2Current year income/loss 15 0 15 0.2 75 0 75 1.0
Total Liabilities 4,735 3,156 7,891 100.0 4,266 3,314 7,580 100.0

II-140
Fortis Bank A. .
Off Balance Sheet Commitments(USD Million)
Dec. 2010 Dec. 2009TC FC Total TC FC Total
Guarantees and Warranties 540 983 1,524 476 1,321 1,797Letters of guarantee 504 598 1,103 463 714 1,176Bank acceptances 0 183 183 0 103 103Letters of credit 0 198 198 0 441 441Prefinancing given as guarantee 0 0 0 0 0 0Endorsements 0 0 0 0 0 0Other guarantees and warrantees 36 4 40 13 64 77
Commitments 1,989 196 2,185 2,085 486 2,571Irrevocable commitments 1,989 196 2,185 2,085 486 2,571Revocable commitments 0 0 0 0 0 0
Derivative Financial Instruments 2,220 5,550 7,770 1,802 5,404 7,206Derivative finan. instruments held for hedging 0 0 0 0 0 0Trading transactions 2,220 5,550 7,770 1,802 5,404 7,206
Custody and Pledged Securities 5,355 1,238 6,593 5,611 1,336 6,948Items held in Custody 1,768 122 1,890 2,567 97 2,664Pledged Items 3,587 1,116 4,703 3,044 1,239 4,283Acccepted independent guaran. and warran. 0 0 0 0 0 0
Total Off Balance Sheet Commitments 10,105 7,967 18,072 9,974 8,547 18,521
Income-Expenditure(USD Million)
Dec. 2010 Dec. 2009
Interest Income 766 994Interest on loans 607 767Interest received from reserve deposits 6 12Interest received from banks 2 3Interest received from money market transactions 3 21Interest received from marketable securities portfolio 140 177Other interest income 9 13
Interest Expenses 360 503Interest on deposits 204 289Interest on money market transactions 68 95Interest on funds borrowed 11 8Interest on securities issued 0 0Other interest expenses 77 111
Net Interest Income/Expenses 406 491Net Fees and Commissions Income/Expenses 97 115
Fees and commissions received 125 150Fees and commissions paid 28 35
Dividend Income 3 28Trading Profit/Loss (net) 3 -6
Profit/loss on trading account securities 25 13Profit/losses on derivative financial transactions -96 -29Foreign exchange profit/loss 74 9
Other Operating Income 26 14Total Operating Income/Expenses 535 641Provision for Loan Losses or other Receivables (-) 77 108
Specific provisions of banks loans and other receivables* 42 102General provision expenses* 9 -1
Other Operating Expenses (-) 448 442Personnel Expenses* 187 200
Net Operating Profit/Loss 11 91Surplus written as gain after merger 0 0Profit/losses from equity method applied subsidiaries 0 0Net monetory position gain/loss 0 0Profit/Loss Before Taxes from Continuing Operations 11 91Provisions for Taxes on Income from Continuing Operations (±) -9 -16Net Profit/Loss from Continuing Operations 2 75Net Profit/Loss Before Taxes from Terminated Operations 15 0Provisions for Taxes on Income from Terminated Operations (±) -3 0Net Profit/Loss from Terminated Operations 12 0
Net Profit/Losses 15 75
* Used from information and disclosures related to income statement".

II-141
Fortis Bank A. . December 2010
Ratios(%)
Dec. 2010 Dec. 2009
Capital Ratios
Shareholders’ Equity / (Amount subject to credit + market + operational risk) 16.8 16.0
Shareholders' Equity / Total Assets 15.9 17.4
(Shareholders' Equity - Permanent Assets) / Total Assets 13.4 12.1
Net On Balance Sheet Position / Total Shareholders' Equity -66.1 -87.7
Net On and Off Balance Sheet Position / Total Shareholders' Equity -1.6 -2.3
Balance-Sheet Ratios
TC Assets / Total Assets 76.9 78.7
TC Liabilities / Total Liabilities 60.0 56.3
FC Assets / FC Liabilities 57.7 48.7
TC Deposits / Total Deposits 65.9 56.8
TC Loans / Total Loans and Receivables 82.7 87.0
Total Deposits / Total Assets 51.6 51.5
Funds Borrowed / Total Assets 23.9 23.8
Assets Quality
Financial Assets (net) / Total Assets 16.3 25.0
Total Loans and Receivables / Total Assets 67.8 61.7
Total Loans and Receivables / Total Deposits 131.3 119.7
Loans Under Follow-up (gross) / Total Loans and Receivables 4.8 8.1
Loans Under Follow-up (net) / Total Loans and Receivables 1.3 3.2
Specific Provisions / Loans Under Follow-up 72.3 60.5
Permanent Assets / Total Assets 2.5 5.3
Consumer Loans / Total Loans and Receivables 34.8 39.6
Liquidity
Liquid Assets / Total Assets 27.2 30.7
Liquid Assets / Short-term Liabilities 46.3 56.5
TC Liquid Assets / Total Assets 17.1 19.9
Profitability
Net Profit/Losses / Total Assets 0.2 1.0
Net Profit/Losses / Total Shareholders' Equity 1.2 5.7
Profit/Losses Before Taxes after Continuing Operations / Total Assets 0.1 1.2
Income-Expenditure Structure
Net Interest Income After Specific Provisions / Total Assets 4.6 5.1
Net Interest Income After Specific Provisions / Total Operating Income (Expenses) 68.0 60.6
Non-interest Income (net) / Total Assets 1.6 2.0
Other Operating Expenses / Total Assets 5.7 5.8
Personnel Expenses / Other Operating Expenses 41.7 45.2
Non-interest Income (net) / Other Operating Expenses 28.8 34.0
Quarterly profitability and income-expenditure ratios, except year-end figures, should be considered periodically.
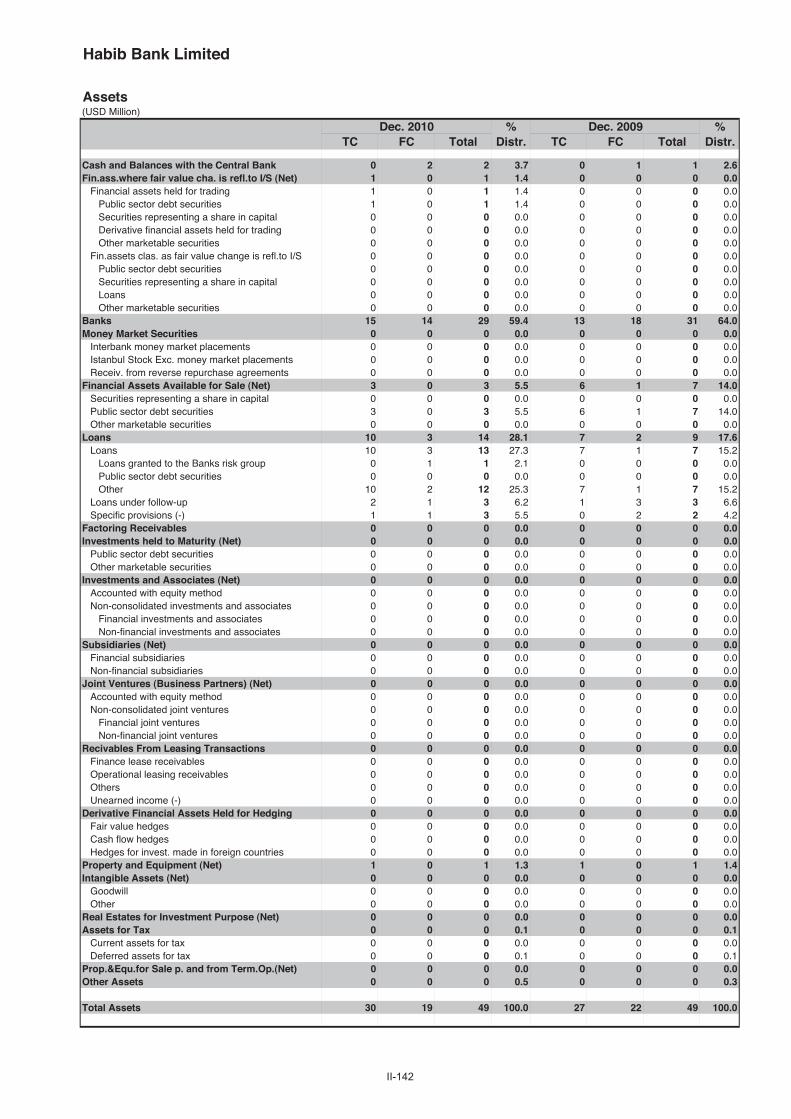
II-142
Habib Bank Limited
Assets(USD Million)
Dec. 2010 % Dec. 2009 %TC FC Total Distr. TC FC Total Distr.
Cash and Balances with the Central Bank 0 2 2 3.7 0 1 1 2.6Fin.ass.where fair value cha. is refl.to I/S (Net) 1 0 1 1.4 0 0 0 0.0
Financial assets held for trading 1 0 1 1.4 0 0 0 0.0Public sector debt securities 1 0 1 1.4 0 0 0 0.0Securities representing a share in capital 0 0 0 0.0 0 0 0 0.0Derivative financial assets held for trading 0 0 0 0.0 0 0 0 0.0Other marketable securities 0 0 0 0.0 0 0 0 0.0
Fin.assets clas. as fair value change is refl.to I/S 0 0 0 0.0 0 0 0 0.0Public sector debt securities 0 0 0 0.0 0 0 0 0.0Securities representing a share in capital 0 0 0 0.0 0 0 0 0.0Loans 0 0 0 0.0 0 0 0 0.0Other marketable securities 0 0 0 0.0 0 0 0 0.0
Banks 15 14 29 59.4 13 18 31 64.0Money Market Securities 0 0 0 0.0 0 0 0 0.0
Interbank money market placements 0 0 0 0.0 0 0 0 0.0Istanbul Stock Exc. money market placements 0 0 0 0.0 0 0 0 0.0Receiv. from reverse repurchase agreements 0 0 0 0.0 0 0 0 0.0
Financial Assets Available for Sale (Net) 3 0 3 5.5 6 1 7 14.0Securities representing a share in capital 0 0 0 0.0 0 0 0 0.0Public sector debt securities 3 0 3 5.5 6 1 7 14.0Other marketable securities 0 0 0 0.0 0 0 0 0.0
Loans 10 3 14 28.1 7 2 9 17.6Loans 10 3 13 27.3 7 1 7 15.2
Loans granted to the Banks risk group 0 1 1 2.1 0 0 0 0.0Public sector debt securities 0 0 0 0.0 0 0 0 0.0Other 10 2 12 25.3 7 1 7 15.2
Loans under follow-up 2 1 3 6.2 1 3 3 6.6Specific provisions (-) 1 1 3 5.5 0 2 2 4.2
Factoring Receivables 0 0 0 0.0 0 0 0 0.0Investments held to Maturity (Net) 0 0 0 0.0 0 0 0 0.0
Public sector debt securities 0 0 0 0.0 0 0 0 0.0Other marketable securities 0 0 0 0.0 0 0 0 0.0
Investments and Associates (Net) 0 0 0 0.0 0 0 0 0.0Accounted with equity method 0 0 0 0.0 0 0 0 0.0Non-consolidated investments and associates 0 0 0 0.0 0 0 0 0.0
Financial investments and associates 0 0 0 0.0 0 0 0 0.0Non-financial investments and associates 0 0 0 0.0 0 0 0 0.0
Subsidiaries (Net) 0 0 0 0.0 0 0 0 0.0Financial subsidiaries 0 0 0 0.0 0 0 0 0.0Non-financial subsidiaries 0 0 0 0.0 0 0 0 0.0
Joint Ventures (Business Partners) (Net) 0 0 0 0.0 0 0 0 0.0Accounted with equity method 0 0 0 0.0 0 0 0 0.0Non-consolidated joint ventures 0 0 0 0.0 0 0 0 0.0
Financial joint ventures 0 0 0 0.0 0 0 0 0.0Non-financial joint ventures 0 0 0 0.0 0 0 0 0.0
Recivables From Leasing Transactions 0 0 0 0.0 0 0 0 0.0Finance lease receivables 0 0 0 0.0 0 0 0 0.0Operational leasing receivables 0 0 0 0.0 0 0 0 0.0Others 0 0 0 0.0 0 0 0 0.0Unearned income (-) 0 0 0 0.0 0 0 0 0.0
Derivative Financial Assets Held for Hedging 0 0 0 0.0 0 0 0 0.0Fair value hedges 0 0 0 0.0 0 0 0 0.0Cash flow hedges 0 0 0 0.0 0 0 0 0.0Hedges for invest. made in foreign countries 0 0 0 0.0 0 0 0 0.0
Property and Equipment (Net) 1 0 1 1.3 1 0 1 1.4Intangible Assets (Net) 0 0 0 0.0 0 0 0 0.0
Goodwill 0 0 0 0.0 0 0 0 0.0Other 0 0 0 0.0 0 0 0 0.0
Real Estates for Investment Purpose (Net) 0 0 0 0.0 0 0 0 0.0Assets for Tax 0 0 0 0.1 0 0 0 0.1
Current assets for tax 0 0 0 0.0 0 0 0 0.0Deferred assets for tax 0 0 0 0.1 0 0 0 0.1
Prop.&Equ.for Sale p. and from Term.Op.(Net) 0 0 0 0.0 0 0 0 0.0Other Assets 0 0 0 0.5 0 0 0 0.3
Total Assets 30 19 49 100.0 27 22 49 100.0

II-143
Habib Bank Limited December 2010
Liabilities(USD Million)
Dec. 2010 % Dec. 2009 %TC FC Total Distr. TC FC Total Distr.
Deposits 4 10 13 27.2 1 5 7 13.4Deposits held by the Banks risk group 0 0 1 1.2 0 0 0 1.0Other 3 9 13 26.0 1 5 6 12.4
Derivative Finan. Liabilities Held for Trading 0 0 0 0.0 0 0 0 0.0Funds Borrowed 0 7 7 14.7 1 11 13 25.8Money Market Takings 0 0 0 0.0 0 2 2 4.1
Interbank money market takings 0 0 0 0.0 0 2 2 4.1Istanbul Stock Exc. money market takings 0 0 0 0.0 0 0 0 0.0Funds provided under repurchase agreements 0 0 0 0.0 0 0 0 0.0
Marketable Securities Issued (Net) 0 0 0 0.0 0 0 0 0.0Bills 0 0 0 0.0 0 0 0 0.0Asset backed securities 0 0 0 0.0 0 0 0 0.0Bonds 0 0 0 0.0 0 0 0 0.0
Funds 0 0 0 0.0 0 0 0 0.0Borrower funds 0 0 0 0.0 0 0 0 0.0Others 0 0 0 0.0 0 0 0 0.0
Miscellaneous Payables 0 1 1 2.7 0 1 1 1.5Other External Resources 0 0 0 0.5 0 0 0 0.3Factoring Payables 0 0 0 0.0 0 0 0 0.0Leasing Transactions Payables (Net) 0 0 0 0.0 0 0 0 0.0
Finance leasing payables 0 0 0 0.0 0 0 0 0.0Operations leasing payables 0 0 0 0.0 0 0 0 0.0Others 0 0 0 0.0 0 0 0 0.0Deferred finance leasing expenses (-) 0 0 0 0.0 0 0 0 0.0
Derivative Finan. Liabilities Held for Hedging 0 0 0 0.0 0 0 0 0.0Fair value hedges 0 0 0 0.0 0 0 0 0.0Cash flow hedges 0 0 0 0.0 0 0 0 0.0Hedges for invest. made in foreign countries 0 0 0 0.0 0 0 0 0.0
Provisions 0 0 0 0.5 0 0 0 0.3General provisions 0 0 0 0.4 0 0 0 0.2Restructuring reserves 0 0 0 0.0 0 0 0 0.0Reserves for employee benefit 0 0 0 0.1 0 0 0 0.1Insurance technical reserves (Net) 0 0 0 0.0 0 0 0 0.0Other provisions 0 0 0 0.0 0 0 0 0.0
Liabilities for Tax 0 0 0 0.2 0 0 0 0.1Current liabilities for tax 0 0 0 0.2 0 0 0 0.1Deferred liabilities for tax 0 0 0 0.0 0 0 0 0.0
Lia.for Pro.&Equ.for Sale p. and from Term.Op.(Net) 0 0 0 0.0 0 0 0 0.0Subordinated Loans 0 0 0 0.0 0 0 0 0.0Shareholders' Equity 26 0 26 54.3 27 0 27 54.3
Paid-in capital 20 0 20 40.0 20 0 20 41.1Supplementary capital 0 0 0 0.0 0 0 0 0.3
Share premium 0 0 0 0.0 0 0 0 0.0Share cancellation profits 0 0 0 0.0 0 0 0 0.0Valuation changes in marketable securities 0 0 0 0.0 0 0 0 0.3Revaluation changes of property and equip. 0 0 0 0.0 0 0 0 0.0Revaluation changes of intangible assets 0 0 0 0.0 0 0 0 0.0Revaluation changes of real est.for inv. pur. 0 0 0 0.0 0 0 0 0.0Free shares from inv.&ass.,subs.& joint vent. 0 0 0 0.0 0 0 0 0.0Hedging funds (active part) 0 0 0 0.0 0 0 0 0.0Val.inc.in pro.& equ.held for sale p.and term.ope. 0 0 0 0.0 0 0 0 0.0Other capital reserves 0 0 0 0.0 0 0 0 0.0
Profit reserves 0 0 0 0.0 0 0 0 0.0Legal reserves 0 0 0 0.0 0 0 0 0.0Status reserves 0 0 0 0.0 0 0 0 0.0Extraordinary reserves 0 0 0 0.0 0 0 0 0.0Other profit reserves 0 0 0 0.0 0 0 0 0.0
Profit or loss 7 0 7 14.2 6 0 6 12.9Prior years income/loss 6 0 6 12.6 4 0 4 8.2Current year income/loss 1 0 1 1.6 2 0 2 4.7
Total Liabilities 31 18 49 100.0 30 19 49 100.0
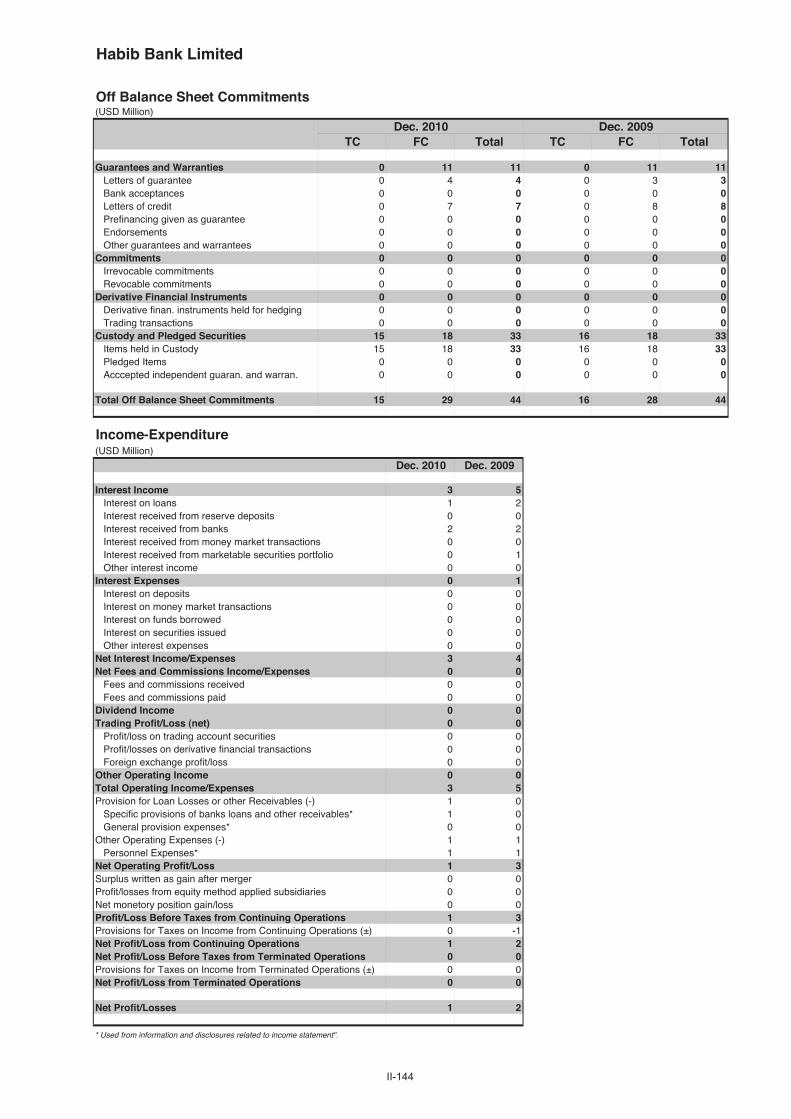
II-144
Habib Bank Limited
Off Balance Sheet Commitments(USD Million)
Dec. 2010 Dec. 2009TC FC Total TC FC Total
Guarantees and Warranties 0 11 11 0 11 11Letters of guarantee 0 4 4 0 3 3Bank acceptances 0 0 0 0 0 0Letters of credit 0 7 7 0 8 8Prefinancing given as guarantee 0 0 0 0 0 0Endorsements 0 0 0 0 0 0Other guarantees and warrantees 0 0 0 0 0 0
Commitments 0 0 0 0 0 0Irrevocable commitments 0 0 0 0 0 0Revocable commitments 0 0 0 0 0 0
Derivative Financial Instruments 0 0 0 0 0 0Derivative finan. instruments held for hedging 0 0 0 0 0 0Trading transactions 0 0 0 0 0 0
Custody and Pledged Securities 15 18 33 16 18 33Items held in Custody 15 18 33 16 18 33Pledged Items 0 0 0 0 0 0Acccepted independent guaran. and warran. 0 0 0 0 0 0
Total Off Balance Sheet Commitments 15 29 44 16 28 44
Income-Expenditure(USD Million)
Dec. 2010 Dec. 2009
Interest Income 3 5Interest on loans 1 2Interest received from reserve deposits 0 0Interest received from banks 2 2Interest received from money market transactions 0 0Interest received from marketable securities portfolio 0 1Other interest income 0 0
Interest Expenses 0 1Interest on deposits 0 0Interest on money market transactions 0 0Interest on funds borrowed 0 0Interest on securities issued 0 0Other interest expenses 0 0
Net Interest Income/Expenses 3 4Net Fees and Commissions Income/Expenses 0 0
Fees and commissions received 0 0Fees and commissions paid 0 0
Dividend Income 0 0Trading Profit/Loss (net) 0 0
Profit/loss on trading account securities 0 0Profit/losses on derivative financial transactions 0 0Foreign exchange profit/loss 0 0
Other Operating Income 0 0Total Operating Income/Expenses 3 5Provision for Loan Losses or other Receivables (-) 1 0
Specific provisions of banks loans and other receivables* 1 0General provision expenses* 0 0
Other Operating Expenses (-) 1 1Personnel Expenses* 1 1
Net Operating Profit/Loss 1 3Surplus written as gain after merger 0 0Profit/losses from equity method applied subsidiaries 0 0Net monetory position gain/loss 0 0Profit/Loss Before Taxes from Continuing Operations 1 3Provisions for Taxes on Income from Continuing Operations (±) 0 -1Net Profit/Loss from Continuing Operations 1 2Net Profit/Loss Before Taxes from Terminated Operations 0 0Provisions for Taxes on Income from Terminated Operations (±) 0 0Net Profit/Loss from Terminated Operations 0 0
Net Profit/Losses 1 2
* Used from information and disclosures related to income statement".

II-145
Habib Bank Limited December 2010
Ratios(%)
Dec. 2010 Dec. 2009
Capital Ratios
Shareholders’ Equity / (Amount subject to credit + market + operational risk) 77.5 94.3
Shareholders' Equity / Total Assets 54.3 54.3
(Shareholders' Equity - Permanent Assets) / Total Assets 52.2 50.4
Net On Balance Sheet Position / Total Shareholders' Equity 12.4 13.2
Net On and Off Balance Sheet Position / Total Shareholders' Equity 12.4 13.2
Balance-Sheet Ratios
TC Assets / Total Assets 61.1 55.0
TC Liabilities / Total Liabilities 63.2 60.5
FC Assets / FC Liabilities 105.5 114.0
TC Deposits / Total Deposits 26.6 18.2
TC Loans / Total Loans and Receivables 75.8 80.2
Total Deposits / Total Assets 27.2 13.4
Funds Borrowed / Total Assets 14.7 25.8
Assets Quality
Financial Assets (net) / Total Assets 6.9 14.0
Total Loans and Receivables / Total Assets 28.1 17.6
Total Loans and Receivables / Total Deposits 103.1 131.2
Loans Under Follow-up (gross) / Total Loans and Receivables 22.0 37.6
Loans Under Follow-up (net) / Total Loans and Receivables 2.6 14.0
Specific Provisions / Loans Under Follow-up 88.2 62.8
Permanent Assets / Total Assets 2.1 3.9
Consumer Loans / Total Loans and Receivables 4.1 3.2
Liquidity
Liquid Assets / Total Assets 70.0 80.6
Liquid Assets / Short-term Liabilities 220.0 243.0
TC Liquid Assets / Total Assets 38.0 39.1
Profitability
Net Profit/Losses / Total Assets 1.6 4.7
Net Profit/Losses / Total Shareholders' Equity 2.9 8.6
Profit/Losses Before Taxes after Continuing Operations / Total Assets 2.0 5.9
Income-Expenditure Structure
Net Interest Income After Specific Provisions / Total Assets 3.7 7.6
Net Interest Income After Specific Provisions / Total Operating Income (Expenses) 56.0 79.6
Non-interest Income (net) / Total Assets 1.3 1.3
Other Operating Expenses / Total Assets 2.8 3.0
Personnel Expenses / Other Operating Expenses 58.1 55.0
Non-interest Income (net) / Other Operating Expenses 46.7 44.4
Quarterly profitability and income-expenditure ratios, except year-end figures, should be considered periodically.
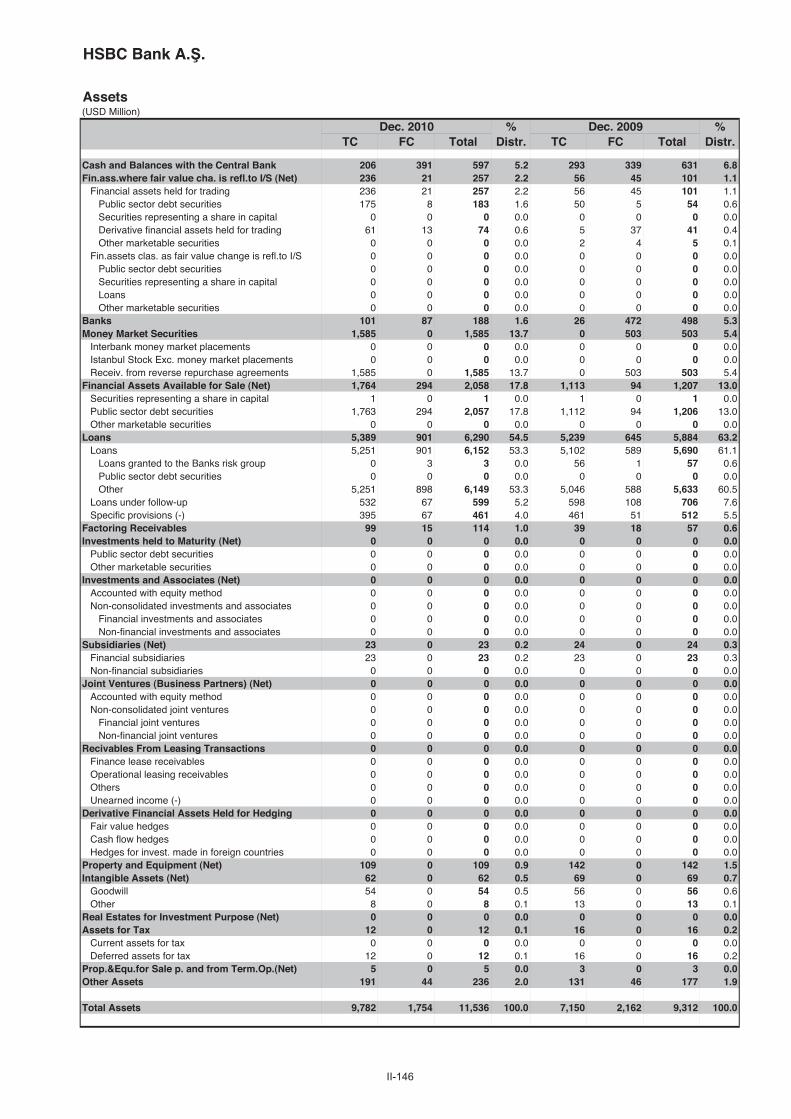
II-146
HSBC Bank A. .
Assets(USD Million)
Dec. 2010 % Dec. 2009 %TC FC Total Distr. TC FC Total Distr.
Cash and Balances with the Central Bank 206 391 597 5.2 293 339 631 6.8Fin.ass.where fair value cha. is refl.to I/S (Net) 236 21 257 2.2 56 45 101 1.1
Financial assets held for trading 236 21 257 2.2 56 45 101 1.1Public sector debt securities 175 8 183 1.6 50 5 54 0.6Securities representing a share in capital 0 0 0 0.0 0 0 0 0.0Derivative financial assets held for trading 61 13 74 0.6 5 37 41 0.4Other marketable securities 0 0 0 0.0 2 4 5 0.1
Fin.assets clas. as fair value change is refl.to I/S 0 0 0 0.0 0 0 0 0.0Public sector debt securities 0 0 0 0.0 0 0 0 0.0Securities representing a share in capital 0 0 0 0.0 0 0 0 0.0Loans 0 0 0 0.0 0 0 0 0.0Other marketable securities 0 0 0 0.0 0 0 0 0.0
Banks 101 87 188 1.6 26 472 498 5.3Money Market Securities 1,585 0 1,585 13.7 0 503 503 5.4
Interbank money market placements 0 0 0 0.0 0 0 0 0.0Istanbul Stock Exc. money market placements 0 0 0 0.0 0 0 0 0.0Receiv. from reverse repurchase agreements 1,585 0 1,585 13.7 0 503 503 5.4
Financial Assets Available for Sale (Net) 1,764 294 2,058 17.8 1,113 94 1,207 13.0Securities representing a share in capital 1 0 1 0.0 1 0 1 0.0Public sector debt securities 1,763 294 2,057 17.8 1,112 94 1,206 13.0Other marketable securities 0 0 0 0.0 0 0 0 0.0
Loans 5,389 901 6,290 54.5 5,239 645 5,884 63.2Loans 5,251 901 6,152 53.3 5,102 589 5,690 61.1
Loans granted to the Banks risk group 0 3 3 0.0 56 1 57 0.6Public sector debt securities 0 0 0 0.0 0 0 0 0.0Other 5,251 898 6,149 53.3 5,046 588 5,633 60.5
Loans under follow-up 532 67 599 5.2 598 108 706 7.6Specific provisions (-) 395 67 461 4.0 461 51 512 5.5
Factoring Receivables 99 15 114 1.0 39 18 57 0.6Investments held to Maturity (Net) 0 0 0 0.0 0 0 0 0.0
Public sector debt securities 0 0 0 0.0 0 0 0 0.0Other marketable securities 0 0 0 0.0 0 0 0 0.0
Investments and Associates (Net) 0 0 0 0.0 0 0 0 0.0Accounted with equity method 0 0 0 0.0 0 0 0 0.0Non-consolidated investments and associates 0 0 0 0.0 0 0 0 0.0
Financial investments and associates 0 0 0 0.0 0 0 0 0.0Non-financial investments and associates 0 0 0 0.0 0 0 0 0.0
Subsidiaries (Net) 23 0 23 0.2 24 0 24 0.3Financial subsidiaries 23 0 23 0.2 23 0 23 0.3Non-financial subsidiaries 0 0 0 0.0 0 0 0 0.0
Joint Ventures (Business Partners) (Net) 0 0 0 0.0 0 0 0 0.0Accounted with equity method 0 0 0 0.0 0 0 0 0.0Non-consolidated joint ventures 0 0 0 0.0 0 0 0 0.0
Financial joint ventures 0 0 0 0.0 0 0 0 0.0Non-financial joint ventures 0 0 0 0.0 0 0 0 0.0
Recivables From Leasing Transactions 0 0 0 0.0 0 0 0 0.0Finance lease receivables 0 0 0 0.0 0 0 0 0.0Operational leasing receivables 0 0 0 0.0 0 0 0 0.0Others 0 0 0 0.0 0 0 0 0.0Unearned income (-) 0 0 0 0.0 0 0 0 0.0
Derivative Financial Assets Held for Hedging 0 0 0 0.0 0 0 0 0.0Fair value hedges 0 0 0 0.0 0 0 0 0.0Cash flow hedges 0 0 0 0.0 0 0 0 0.0Hedges for invest. made in foreign countries 0 0 0 0.0 0 0 0 0.0
Property and Equipment (Net) 109 0 109 0.9 142 0 142 1.5Intangible Assets (Net) 62 0 62 0.5 69 0 69 0.7
Goodwill 54 0 54 0.5 56 0 56 0.6Other 8 0 8 0.1 13 0 13 0.1
Real Estates for Investment Purpose (Net) 0 0 0 0.0 0 0 0 0.0Assets for Tax 12 0 12 0.1 16 0 16 0.2
Current assets for tax 0 0 0 0.0 0 0 0 0.0Deferred assets for tax 12 0 12 0.1 16 0 16 0.2
Prop.&Equ.for Sale p. and from Term.Op.(Net) 5 0 5 0.0 3 0 3 0.0Other Assets 191 44 236 2.0 131 46 177 1.9
Total Assets 9,782 1,754 11,536 100.0 7,150 2,162 9,312 100.0

II-147
HSBC Bank A. . December 2010
Liabilities(USD Million)
Dec. 2010 % Dec. 2009 %TC FC Total Distr. TC FC Total Distr.
Deposits 4,025 2,936 6,961 60.3 2,979 3,018 5,997 64.4Deposits held by the Banks risk group 31 4 35 0.3 20 3 24 0.3Other 3,994 2,932 6,926 60.0 2,959 3,015 5,974 64.1
Derivative Finan. Liabilities Held for Trading 49 13 62 0.5 18 39 57 0.6Funds Borrowed 847 1,374 2,221 19.3 715 289 1,004 10.8Money Market Takings 0 0 0 0.0 0 0 0 0.0
Interbank money market takings 0 0 0 0.0 0 0 0 0.0Istanbul Stock Exc. money market takings 0 0 0 0.0 0 0 0 0.0Funds provided under repurchase agreements 0 0 0 0.0 0 0 0 0.0
Marketable Securities Issued (Net) 0 0 0 0.0 0 0 0 0.0Bills 0 0 0 0.0 0 0 0 0.0Asset backed securities 0 0 0 0.0 0 0 0 0.0Bonds 0 0 0 0.0 0 0 0 0.0
Funds 0 0 0 0.0 0 0 0 0.0Borrower funds 0 0 0 0.0 0 0 0 0.0Others 0 0 0 0.0 0 0 0 0.0
Miscellaneous Payables 239 2 242 2.1 209 97 307 3.3Other External Resources 128 38 166 1.4 108 41 149 1.6Factoring Payables 0 0 0 0.0 0 0 0 0.0Leasing Transactions Payables (Net) 0 0 0 0.0 0 0 0 0.0
Finance leasing payables 0 0 0 0.0 0 0 0 0.0Operations leasing payables 0 0 0 0.0 0 0 0 0.0Others 0 0 0 0.0 0 0 0 0.0Deferred finance leasing expenses (-) 0 0 0 0.0 0 0 0 0.0
Derivative Finan. Liabilities Held for Hedging 0 0 0 0.0 0 0 0 0.0Fair value hedges 0 0 0 0.0 0 0 0 0.0Cash flow hedges 0 0 0 0.0 0 0 0 0.0Hedges for invest. made in foreign countries 0 0 0 0.0 0 0 0 0.0
Provisions 106 1 107 0.9 78 14 92 1.0General provisions 67 0 67 0.6 41 13 54 0.6Restructuring reserves 0 0 0 0.0 0 0 0 0.0Reserves for employee benefit 14 0 14 0.1 9 0 9 0.1Insurance technical reserves (Net) 0 0 0 0.0 0 0 0 0.0Other provisions 24 1 25 0.2 29 1 30 0.3
Liabilities for Tax 21 0 21 0.2 29 0 29 0.3Current liabilities for tax 21 0 21 0.2 29 0 29 0.3Deferred liabilities for tax 0 0 0 0.0 0 0 0 0.0
Lia.for Pro.&Equ.for Sale p. and from Term.Op.(Net) 0 0 0 0.0 0 0 0 0.0Subordinated Loans 0 0 0 0.0 0 0 0 0.0Shareholders' Equity 1,754 2 1,756 15.2 1,676 1 1,677 18.0
Paid-in capital 424 0 424 3.7 439 0 439 4.7Supplementary capital 222 2 223 1.9 230 1 231 2.5
Share premium 0 0 0 0.0 0 0 0 0.0Share cancellation profits 0 0 0 0.0 0 0 0 0.0Valuation changes in marketable securities 45 2 46 0.4 47 1 47 0.5Revaluation changes of property and equip. 0 0 0 0.0 0 0 0 0.0Revaluation changes of intangible assets 0 0 0 0.0 0 0 0 0.0Revaluation changes of real est.for inv. pur. 0 0 0 0.0 0 0 0 0.0Free shares from inv.&ass.,subs.& joint vent. 0 0 0 0.0 0 0 0 0.0Hedging funds (active part) 0 0 0 0.0 0 0 0 0.0Val.inc.in pro.& equ.held for sale p.and term.ope. 0 0 0 0.0 0 0 0 0.0Other capital reserves 177 0 177 1.5 183 0 183 2.0
Profit reserves 950 0 950 8.2 842 0 842 9.0Legal reserves 97 0 97 0.8 92 0 92 1.0Status reserves 0 0 0 0.0 0 0 0 0.0Extraordinary reserves 853 0 853 7.4 750 0 750 8.1Other profit reserves 0 0 0 0.0 0 0 0 0.0
Profit or loss 158 0 158 1.4 166 0 166 1.8Prior years income/loss 0 0 0 0.0 0 0 0 0.0Current year income/loss 158 0 158 1.4 166 0 166 1.8
Total Liabilities 7,169 4,366 11,536 100.0 5,813 3,499 9,312 100.0

II-148
HSBC Bank A. .
Off Balance Sheet Commitments(USD Million)
Dec. 2010 Dec. 2009TC FC Total TC FC Total
Guarantees and Warranties 130 1,239 1,368 99 842 941Letters of guarantee 130 335 464 99 302 401Bank acceptances 0 395 395 0 255 256Letters of credit 0 397 397 0 210 210Prefinancing given as guarantee 0 0 0 0 0 0Endorsements 0 0 0 0 0 0Other guarantees and warrantees 0 111 111 0 74 74
Commitments 4,308 22,988 27,295 4,688 1,253 5,941Irrevocable commitments 4,159 12 4,171 4,688 1,253 5,941Revocable commitments 149 22,975 23,124 0 0 0
Derivative Financial Instruments 3,960 12,257 16,218 4,125 6,295 10,420Derivative finan. instruments held for hedging 0 0 0 0 0 0Trading transactions 3,960 12,257 16,218 4,125 6,295 10,420
Custody and Pledged Securities 32,760 1,065 33,825 5,997 1,398 7,395Items held in Custody 32,749 993 33,742 5,990 1,326 7,315Pledged Items 10 72 82 7 73 80Acccepted independent guaran. and warran. 0 0 0 0 0 0
Total Off Balance Sheet Commitments 41,158 37,548 78,706 14,909 9,788 24,697
Income-Expenditure(USD Million)
Dec. 2010 Dec. 2009
Interest Income 1,066 1,280Interest on loans 850 1,087Interest received from reserve deposits 8 16Interest received from banks 6 9Interest received from money market transactions 38 34Interest received from marketable securities portfolio 143 101Other interest income 21 32
Interest Expenses 358 473Interest on deposits 250 326Interest on money market transactions 102 144Interest on funds borrowed 0 1Interest on securities issued 0 0Other interest expenses 5 2
Net Interest Income/Expenses 708 806Net Fees and Commissions Income/Expenses 230 239
Fees and commissions received 272 285Fees and commissions paid 42 46
Dividend Income 14 12Trading Profit/Loss (net) -40 22
Profit/loss on trading account securities 37 92Profit/losses on derivative financial transactions -79 -75Foreign exchange profit/loss 2 6
Other Operating Income 38 46Total Operating Income/Expenses 949 1,125Provision for Loan Losses or other Receivables (-) 128 320
Specific provisions of banks loans and other receivables* 111 319General provision expenses* 15 0
Other Operating Expenses (-) 621 603Personnel Expenses* 269 264
Net Operating Profit/Loss 199 203Surplus written as gain after merger 0 0Profit/losses from equity method applied subsidiaries 0 0Net monetory position gain/loss 0 0Profit/Loss Before Taxes from Continuing Operations 199 203Provisions for Taxes on Income from Continuing Operations (±) -41 -37Net Profit/Loss from Continuing Operations 158 166Net Profit/Loss Before Taxes from Terminated Operations 0 0Provisions for Taxes on Income from Terminated Operations (±) 0 0Net Profit/Loss from Terminated Operations 0 0
Net Profit/Losses 158 166
* Used from information and disclosures related to income statement".

II-149
HSBC Bank A. . December 2010
Ratios(%)
Dec. 2010 Dec. 2009
Capital Ratios
Shareholders’ Equity / (Amount subject to credit + market + operational risk) 16.5 17.3
Shareholders' Equity / Total Assets 15.2 18.0
(Shareholders' Equity - Permanent Assets) / Total Assets 12.3 13.4
Net On Balance Sheet Position / Total Shareholders' Equity -119.4 -47.8
Net On and Off Balance Sheet Position / Total Shareholders' Equity -4.8 -0.4
Balance-Sheet Ratios
TC Assets / Total Assets 84.8 76.8
TC Liabilities / Total Liabilities 62.1 62.4
FC Assets / FC Liabilities 40.2 61.8
TC Deposits / Total Deposits 57.8 49.7
TC Loans / Total Loans and Receivables 85.7 89.0
Total Deposits / Total Assets 60.3 64.4
Funds Borrowed / Total Assets 19.3 10.8
Assets Quality
Financial Assets (net) / Total Assets 20.1 14.1
Total Loans and Receivables / Total Assets 54.5 63.2
Total Loans and Receivables / Total Deposits 90.4 98.1
Loans Under Follow-up (gross) / Total Loans and Receivables 9.5 12.0
Loans Under Follow-up (net) / Total Loans and Receivables 2.2 3.3
Specific Provisions / Loans Under Follow-up 76.9 72.6
Permanent Assets / Total Assets 2.9 4.6
Consumer Loans / Total Loans and Receivables 51.2 54.0
Liquidity
Liquid Assets / Total Assets 40.6 31.6
Liquid Assets / Short-term Liabilities 76.7 52.9
TC Liquid Assets / Total Assets 33.7 16.0
Profitability
Net Profit/Losses / Total Assets 1.4 1.8
Net Profit/Losses / Total Shareholders' Equity 9.0 9.9
Profit/Losses Before Taxes after Continuing Operations / Total Assets 1.7 2.2
Income-Expenditure Structure
Net Interest Income After Specific Provisions / Total Assets 5.2 5.2
Net Interest Income After Specific Provisions / Total Operating Income (Expenses) 62.9 43.3
Non-interest Income (net) / Total Assets 2.1 3.4
Other Operating Expenses / Total Assets 5.4 6.5
Personnel Expenses / Other Operating Expenses 43.3 43.9
Non-interest Income (net) / Other Operating Expenses 38.8 52.9
Quarterly profitability and income-expenditure ratios, except year-end figures, should be considered periodically.
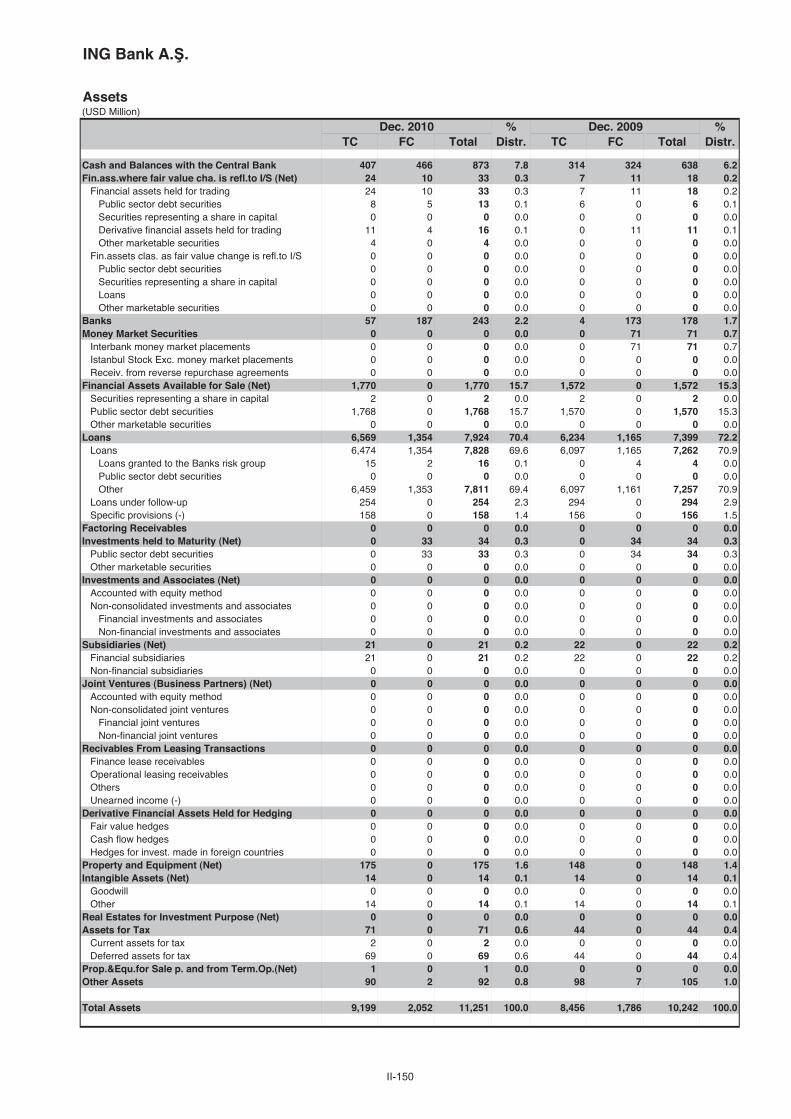
II-150
ING Bank A. .
Assets(USD Million)
Dec. 2010 % Dec. 2009 %TC FC Total Distr. TC FC Total Distr.
Cash and Balances with the Central Bank 407 466 873 7.8 314 324 638 6.2Fin.ass.where fair value cha. is refl.to I/S (Net) 24 10 33 0.3 7 11 18 0.2
Financial assets held for trading 24 10 33 0.3 7 11 18 0.2Public sector debt securities 8 5 13 0.1 6 0 6 0.1Securities representing a share in capital 0 0 0 0.0 0 0 0 0.0Derivative financial assets held for trading 11 4 16 0.1 0 11 11 0.1Other marketable securities 4 0 4 0.0 0 0 0 0.0
Fin.assets clas. as fair value change is refl.to I/S 0 0 0 0.0 0 0 0 0.0Public sector debt securities 0 0 0 0.0 0 0 0 0.0Securities representing a share in capital 0 0 0 0.0 0 0 0 0.0Loans 0 0 0 0.0 0 0 0 0.0Other marketable securities 0 0 0 0.0 0 0 0 0.0
Banks 57 187 243 2.2 4 173 178 1.7Money Market Securities 0 0 0 0.0 0 71 71 0.7
Interbank money market placements 0 0 0 0.0 0 71 71 0.7Istanbul Stock Exc. money market placements 0 0 0 0.0 0 0 0 0.0Receiv. from reverse repurchase agreements 0 0 0 0.0 0 0 0 0.0
Financial Assets Available for Sale (Net) 1,770 0 1,770 15.7 1,572 0 1,572 15.3Securities representing a share in capital 2 0 2 0.0 2 0 2 0.0Public sector debt securities 1,768 0 1,768 15.7 1,570 0 1,570 15.3Other marketable securities 0 0 0 0.0 0 0 0 0.0
Loans 6,569 1,354 7,924 70.4 6,234 1,165 7,399 72.2Loans 6,474 1,354 7,828 69.6 6,097 1,165 7,262 70.9
Loans granted to the Banks risk group 15 2 16 0.1 0 4 4 0.0Public sector debt securities 0 0 0 0.0 0 0 0 0.0Other 6,459 1,353 7,811 69.4 6,097 1,161 7,257 70.9
Loans under follow-up 254 0 254 2.3 294 0 294 2.9Specific provisions (-) 158 0 158 1.4 156 0 156 1.5
Factoring Receivables 0 0 0 0.0 0 0 0 0.0Investments held to Maturity (Net) 0 33 34 0.3 0 34 34 0.3
Public sector debt securities 0 33 33 0.3 0 34 34 0.3Other marketable securities 0 0 0 0.0 0 0 0 0.0
Investments and Associates (Net) 0 0 0 0.0 0 0 0 0.0Accounted with equity method 0 0 0 0.0 0 0 0 0.0Non-consolidated investments and associates 0 0 0 0.0 0 0 0 0.0
Financial investments and associates 0 0 0 0.0 0 0 0 0.0Non-financial investments and associates 0 0 0 0.0 0 0 0 0.0
Subsidiaries (Net) 21 0 21 0.2 22 0 22 0.2Financial subsidiaries 21 0 21 0.2 22 0 22 0.2Non-financial subsidiaries 0 0 0 0.0 0 0 0 0.0
Joint Ventures (Business Partners) (Net) 0 0 0 0.0 0 0 0 0.0Accounted with equity method 0 0 0 0.0 0 0 0 0.0Non-consolidated joint ventures 0 0 0 0.0 0 0 0 0.0
Financial joint ventures 0 0 0 0.0 0 0 0 0.0Non-financial joint ventures 0 0 0 0.0 0 0 0 0.0
Recivables From Leasing Transactions 0 0 0 0.0 0 0 0 0.0Finance lease receivables 0 0 0 0.0 0 0 0 0.0Operational leasing receivables 0 0 0 0.0 0 0 0 0.0Others 0 0 0 0.0 0 0 0 0.0Unearned income (-) 0 0 0 0.0 0 0 0 0.0
Derivative Financial Assets Held for Hedging 0 0 0 0.0 0 0 0 0.0Fair value hedges 0 0 0 0.0 0 0 0 0.0Cash flow hedges 0 0 0 0.0 0 0 0 0.0Hedges for invest. made in foreign countries 0 0 0 0.0 0 0 0 0.0
Property and Equipment (Net) 175 0 175 1.6 148 0 148 1.4Intangible Assets (Net) 14 0 14 0.1 14 0 14 0.1
Goodwill 0 0 0 0.0 0 0 0 0.0Other 14 0 14 0.1 14 0 14 0.1
Real Estates for Investment Purpose (Net) 0 0 0 0.0 0 0 0 0.0Assets for Tax 71 0 71 0.6 44 0 44 0.4
Current assets for tax 2 0 2 0.0 0 0 0 0.0Deferred assets for tax 69 0 69 0.6 44 0 44 0.4
Prop.&Equ.for Sale p. and from Term.Op.(Net) 1 0 1 0.0 0 0 0 0.0Other Assets 90 2 92 0.8 98 7 105 1.0
Total Assets 9,199 2,052 11,251 100.0 8,456 1,786 10,242 100.0

II-151
ING Bank A. . December 2010
Liabilities(USD Million)
Dec. 2010 % Dec. 2009 %TC FC Total Distr. TC FC Total Distr.
Deposits 4,747 1,321 6,068 53.9 4,889 1,534 6,423 62.7Deposits held by the Banks risk group 14 5 19 0.2 17 1 18 0.2Other 4,733 1,316 6,049 53.8 4,872 1,533 6,405 62.5
Derivative Finan. Liabilities Held for Trading 87 11 98 0.9 11 14 24 0.2Funds Borrowed 282 2,646 2,928 26.0 172 1,538 1,710 16.7Money Market Takings 279 0 279 2.5 173 0 173 1.7
Interbank money market takings 0 0 0 0.0 0 0 0 0.0Istanbul Stock Exc. money market takings 8 0 8 0.1 1 0 1 0.0Funds provided under repurchase agreements 271 0 271 2.4 172 0 172 1.7
Marketable Securities Issued (Net) 0 0 0 0.0 0 0 0 0.0Bills 0 0 0 0.0 0 0 0 0.0Asset backed securities 0 0 0 0.0 0 0 0 0.0Bonds 0 0 0 0.0 0 0 0 0.0
Funds 0 0 0 0.0 0 0 0 0.0Borrower funds 0 0 0 0.0 0 0 0 0.0Others 0 0 0 0.0 0 0 0 0.0
Miscellaneous Payables 104 20 124 1.1 95 17 111 1.1Other External Resources 145 3 149 1.3 145 4 148 1.4Factoring Payables 0 0 0 0.0 0 0 0 0.0Leasing Transactions Payables (Net) 0 0 0 0.0 0 0 0 0.0
Finance leasing payables 0 0 0 0.0 0 0 0 0.0Operations leasing payables 0 0 0 0.0 0 0 0 0.0Others 0 0 0 0.0 0 0 0 0.0Deferred finance leasing expenses (-) 0 0 0 0.0 0 0 0 0.0
Derivative Finan. Liabilities Held for Hedging 116 0 116 1.0 207 0 207 2.0Fair value hedges 0 0 0 0.0 0 0 0 0.0Cash flow hedges 116 0 116 1.0 207 0 207 2.0Hedges for invest. made in foreign countries 0 0 0 0.0 0 0 0 0.0
Provisions 114 0 114 1.0 100 0 100 1.0General provisions 67 0 67 0.6 60 0 60 0.6Restructuring reserves 0 0 0 0.0 0 0 0 0.0Reserves for employee benefit 20 0 20 0.2 16 0 16 0.2Insurance technical reserves (Net) 0 0 0 0.0 0 0 0 0.0Other provisions 27 0 27 0.2 24 0 24 0.2
Liabilities for Tax 20 0 20 0.2 34 0 34 0.3Current liabilities for tax 20 0 20 0.2 34 0 34 0.3Deferred liabilities for tax 0 0 0 0.0 0 0 0 0.0
Lia.for Pro.&Equ.for Sale p. and from Term.Op.(Net) 0 0 0 0.0 0 0 0 0.0Subordinated Loans 0 0 0 0.0 0 0 0 0.0Shareholders' Equity 1,356 0 1,356 12.0 1,311 0 1,311 12.8
Paid-in capital 1,235 0 1,235 11.0 1,167 0 1,167 11.4Supplementary capital -26 0 -26 -0.2 -42 0 -42 -0.4
Share premium 0 0 0 0.0 0 0 0 0.0Share cancellation profits 0 0 0 0.0 0 0 0 0.0Valuation changes in marketable securities 24 0 24 0.2 27 0 27 0.3Revaluation changes of property and equip. 0 0 0 0.0 0 0 0 0.0Revaluation changes of intangible assets 0 0 0 0.0 0 0 0 0.0Revaluation changes of real est.for inv. pur. 0 0 0 0.0 0 0 0 0.0Free shares from inv.&ass.,subs.& joint vent. 0 0 0 0.0 0 0 0 0.0Hedging funds (active part) -50 0 -50 -0.4 -70 0 -70 -0.7Val.inc.in pro.& equ.held for sale p.and term.ope. 0 0 0 0.0 0 0 0 0.0Other capital reserves 0 0 0 0.0 0 0 0 0.0
Profit reserves 74 0 74 0.7 61 0 61 0.6Legal reserves 35 0 35 0.3 30 0 30 0.3Status reserves 0 0 0 0.0 0 0 0 0.0Extraordinary reserves 38 0 38 0.3 31 0 31 0.3Other profit reserves 0 0 0 0.0 0 0 0 0.0
Profit or loss 73 0 73 0.6 125 0 125 1.2Prior years income/loss 0 0 0 0.0 0 0 0 0.0Current year income/loss 73 0 73 0.6 125 0 125 1.2
Total Liabilities 7,249 4,002 11,251 100.0 7,135 3,107 10,242 100.0

II-152
ING Bank A. .
Off Balance Sheet Commitments(USD Million)
Dec. 2010 Dec. 2009TC FC Total TC FC Total
Guarantees and Warranties 1,162 1,723 2,885 1,021 1,594 2,615Letters of guarantee 1,162 850 2,011 1,021 929 1,950Bank acceptances 0 55 55 0 62 62Letters of credit 0 521 521 0 485 485Prefinancing given as guarantee 0 0 0 0 0 0Endorsements 0 0 0 0 0 0Other guarantees and warrantees 0 297 298 0 118 118
Commitments 13,272 222 13,493 1,528 118 1,646Irrevocable commitments 2,577 222 2,799 1,528 118 1,646Revocable commitments 10,694 0 10,694 0 0 0
Derivative Financial Instruments 2,953 2,269 5,222 3,564 1,557 5,121Derivative finan. instruments held for hedging 1,427 0 1,427 2,670 0 2,670Trading transactions 1,526 2,269 3,795 894 1,557 2,451
Custody and Pledged Securities 64,431 9,242 73,673 54,304 9,741 64,045Items held in Custody 2,579 195 2,774 2,205 201 2,406Pledged Items 27,335 2,728 30,063 24,616 3,225 27,840Acccepted independent guaran. and warran. 34,518 6,319 40,836 27,483 6,315 33,799
Total Off Balance Sheet Commitments 81,818 13,455 95,273 60,417 13,010 73,428
Income-Expenditure(USD Million)
Dec. 2010 Dec. 2009
Interest Income 1,120 1,427Interest on loans 956 1,185Interest received from reserve deposits 0 0Interest received from banks 11 22Interest received from money market transactions 0 1Interest received from marketable securities portfolio 152 218Other interest income 0 0
Interest Expenses 445 624Interest on deposits 377 534Interest on money market transactions 31 62Interest on funds borrowed 37 26Interest on securities issued 0 0Other interest expenses 0 1
Net Interest Income/Expenses 675 803Net Fees and Commissions Income/Expenses 108 128
Fees and commissions received 125 149Fees and commissions paid 17 20
Dividend Income 5 4Trading Profit/Loss (net) -218 -238
Profit/loss on trading account securities -6 9Profit/losses on derivative financial transactions -219 -252Foreign exchange profit/loss 6 6
Other Operating Income 57 54Total Operating Income/Expenses 626 752Provision for Loan Losses or other Receivables (-) 63 133
Specific provisions of banks loans and other receivables* 44 109General provision expenses* 9 1
Other Operating Expenses (-) 468 436Personnel Expenses* 239 233
Net Operating Profit/Loss 95 183Surplus written as gain after merger 0 0Profit/losses from equity method applied subsidiaries 0 0Net monetory position gain/loss 0 0Profit/Loss Before Taxes from Continuing Operations 95 183Provisions for Taxes on Income from Continuing Operations (±) -22 -57Net Profit/Loss from Continuing Operations 73 125Net Profit/Loss Before Taxes from Terminated Operations 0 0Provisions for Taxes on Income from Terminated Operations (±) 0 0Net Profit/Loss from Terminated Operations 0 0
Net Profit/Losses 73 125
* Used from information and disclosures related to income statement".

II-153
ING Bank A. . December 2010
Ratios(%)
Dec. 2010 Dec. 2009
Capital Ratios
Shareholders’ Equity / (Amount subject to credit + market + operational risk) 14.6 15.6
Shareholders' Equity / Total Assets 12.0 12.8
(Shareholders' Equity - Permanent Assets) / Total Assets 9.3 9.7
Net On Balance Sheet Position / Total Shareholders' Equity -104.1 -63.7
Net On and Off Balance Sheet Position / Total Shareholders' Equity -0.3 -0.5
Balance-Sheet Ratios
TC Assets / Total Assets 81.8 82.6
TC Liabilities / Total Liabilities 64.4 69.7
FC Assets / FC Liabilities 51.3 57.5
TC Deposits / Total Deposits 78.2 76.1
TC Loans / Total Loans and Receivables 82.9 84.3
Total Deposits / Total Assets 53.9 62.7
Funds Borrowed / Total Assets 26.0 16.7
Assets Quality
Financial Assets (net) / Total Assets 16.3 15.9
Total Loans and Receivables / Total Assets 70.4 72.2
Total Loans and Receivables / Total Deposits 130.6 115.2
Loans Under Follow-up (gross) / Total Loans and Receivables 3.2 4.0
Loans Under Follow-up (net) / Total Loans and Receivables 1.2 1.9
Specific Provisions / Loans Under Follow-up 62.2 53.2
Permanent Assets / Total Assets 2.7 3.1
Consumer Loans / Total Loans and Receivables 37.4 35.9
Liquidity
Liquid Assets / Total Assets 25.9 24.2
Liquid Assets / Short-term Liabilities 48.8 40.0
TC Liquid Assets / Total Assets 20.1 18.5
Profitability
Net Profit/Losses / Total Assets 0.6 1.2
Net Profit/Losses / Total Shareholders' Equity 5.4 9.6
Profit/Losses Before Taxes after Continuing Operations / Total Assets 0.8 1.8
Income-Expenditure Structure
Net Interest Income After Specific Provisions / Total Assets 5.6 6.8
Net Interest Income After Specific Provisions / Total Operating Income (Expenses) 100.7 92.3
Non-interest Income (net) / Total Assets -0.4 -0.5
Other Operating Expenses / Total Assets 4.2 4.3
Personnel Expenses / Other Operating Expenses 51.0 53.4
Non-interest Income (net) / Other Operating Expenses -10.3 -11.8
Quarterly profitability and income-expenditure ratios, except year-end figures, should be considered periodically.

II-154
JPMorgan Chase Bank N.A.
Assets(USD Million)
Dec. 2010 % Dec. 2009 %TC FC Total Distr. TC FC Total Distr.
Cash and Balances with the Central Bank 2 38 40 8.8 0 0 0 0.3Fin.ass.where fair value cha. is refl.to I/S (Net) 413 1 414 90.7 53 1 54 40.3
Financial assets held for trading 413 1 414 90.7 53 1 54 40.3Public sector debt securities 413 0 413 90.4 53 0 53 39.5Securities representing a share in capital 0 0 0 0.0 0 0 0 0.0Derivative financial assets held for trading 0 0 0 0.0 0 1 1 0.8Other marketable securities 0 1 1 0.3 0 0 0 0.0
Fin.assets clas. as fair value change is refl.to I/S 0 0 0 0.0 0 0 0 0.0Public sector debt securities 0 0 0 0.0 0 0 0 0.0Securities representing a share in capital 0 0 0 0.0 0 0 0 0.0Loans 0 0 0 0.0 0 0 0 0.0Other marketable securities 0 0 0 0.0 0 0 0 0.0
Banks 0 0 1 0.1 0 73 73 54.3Money Market Securities 0 0 0 0.0 0 0 0 0.0
Interbank money market placements 0 0 0 0.0 0 0 0 0.0Istanbul Stock Exc. money market placements 0 0 0 0.0 0 0 0 0.0Receiv. from reverse repurchase agreements 0 0 0 0.0 0 0 0 0.0
Financial Assets Available for Sale (Net) 0 0 0 0.0 0 0 0 0.0Securities representing a share in capital 0 0 0 0.0 0 0 0 0.0Public sector debt securities 0 0 0 0.0 0 0 0 0.0Other marketable securities 0 0 0 0.0 0 0 0 0.0
Loans 0 0 0 0.0 0 0 0 0.0Loans 0 0 0 0.0 0 0 0 0.0
Loans granted to the Banks risk group 0 0 0 0.0 0 0 0 0.0Public sector debt securities 0 0 0 0.0 0 0 0 0.0Other 0 0 0 0.0 0 0 0 0.0
Loans under follow-up 0 0 0 0.0 0 0 0 0.0Specific provisions (-) 0 0 0 0.0 0 0 0 0.0
Factoring Receivables 0 0 0 0.0 0 0 0 0.0Investments held to Maturity (Net) 0 0 0 0.0 0 0 0 0.0
Public sector debt securities 0 0 0 0.0 0 0 0 0.0Other marketable securities 0 0 0 0.0 0 0 0 0.0
Investments and Associates (Net) 0 0 0 0.0 0 0 0 0.0Accounted with equity method 0 0 0 0.0 0 0 0 0.0Non-consolidated investments and associates 0 0 0 0.0 0 0 0 0.0
Financial investments and associates 0 0 0 0.0 0 0 0 0.0Non-financial investments and associates 0 0 0 0.0 0 0 0 0.0
Subsidiaries (Net) 0 0 0 0.0 0 0 0 0.0Financial subsidiaries 0 0 0 0.0 0 0 0 0.0Non-financial subsidiaries 0 0 0 0.0 0 0 0 0.0
Joint Ventures (Business Partners) (Net) 0 0 0 0.0 0 0 0 0.0Accounted with equity method 0 0 0 0.0 0 0 0 0.0Non-consolidated joint ventures 0 0 0 0.0 0 0 0 0.0
Financial joint ventures 0 0 0 0.0 0 0 0 0.0Non-financial joint ventures 0 0 0 0.0 0 0 0 0.0
Recivables From Leasing Transactions 0 0 0 0.0 0 0 0 0.0Finance lease receivables 0 0 0 0.0 0 0 0 0.0Operational leasing receivables 0 0 0 0.0 0 0 0 0.0Others 0 0 0 0.0 0 0 0 0.0Unearned income (-) 0 0 0 0.0 0 0 0 0.0
Derivative Financial Assets Held for Hedging 0 0 0 0.0 0 0 0 0.0Fair value hedges 0 0 0 0.0 0 0 0 0.0Cash flow hedges 0 0 0 0.0 0 0 0 0.0Hedges for invest. made in foreign countries 0 0 0 0.0 0 0 0 0.0
Property and Equipment (Net) 1 0 1 0.2 2 0 2 1.3Intangible Assets (Net) 0 0 0 0.1 0 0 0 0.2
Goodwill 0 0 0 0.0 0 0 0 0.0Other 0 0 0 0.1 0 0 0 0.2
Real Estates for Investment Purpose (Net) 0 0 0 0.0 0 0 0 0.0Assets for Tax 0 0 0 0.0 5 0 5 3.6
Current assets for tax 0 0 0 0.0 4 0 4 3.3Deferred assets for tax 0 0 0 0.0 0 0 0 0.2
Prop.&Equ.for Sale p. and from Term.Op.(Net) 0 0 0 0.0 0 0 0 0.0Other Assets 0 0 0 0.0 0 0 0 0.1
Total Assets 417 40 456 100.0 60 74 134 100.0
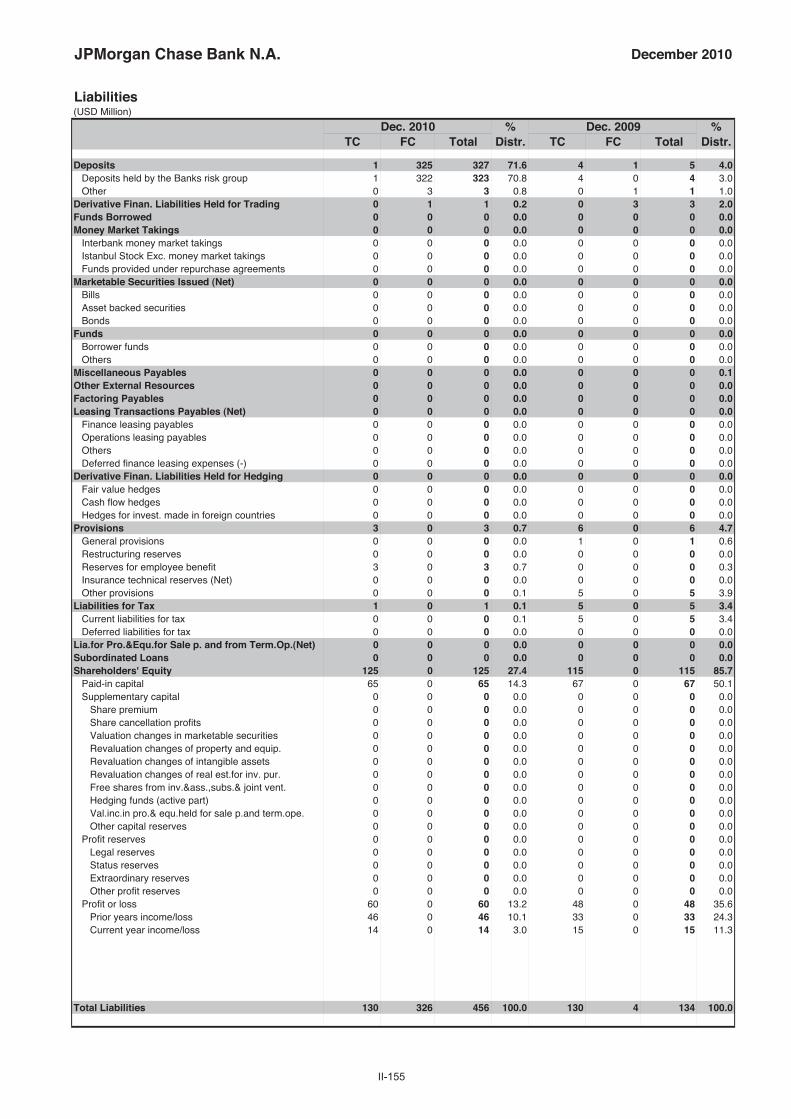
II-155
JPMorgan Chase Bank N.A. December 2010
Liabilities(USD Million)
Dec. 2010 % Dec. 2009 %TC FC Total Distr. TC FC Total Distr.
Deposits 1 325 327 71.6 4 1 5 4.0Deposits held by the Banks risk group 1 322 323 70.8 4 0 4 3.0Other 0 3 3 0.8 0 1 1 1.0
Derivative Finan. Liabilities Held for Trading 0 1 1 0.2 0 3 3 2.0Funds Borrowed 0 0 0 0.0 0 0 0 0.0Money Market Takings 0 0 0 0.0 0 0 0 0.0
Interbank money market takings 0 0 0 0.0 0 0 0 0.0Istanbul Stock Exc. money market takings 0 0 0 0.0 0 0 0 0.0Funds provided under repurchase agreements 0 0 0 0.0 0 0 0 0.0
Marketable Securities Issued (Net) 0 0 0 0.0 0 0 0 0.0Bills 0 0 0 0.0 0 0 0 0.0Asset backed securities 0 0 0 0.0 0 0 0 0.0Bonds 0 0 0 0.0 0 0 0 0.0
Funds 0 0 0 0.0 0 0 0 0.0Borrower funds 0 0 0 0.0 0 0 0 0.0Others 0 0 0 0.0 0 0 0 0.0
Miscellaneous Payables 0 0 0 0.0 0 0 0 0.1Other External Resources 0 0 0 0.0 0 0 0 0.0Factoring Payables 0 0 0 0.0 0 0 0 0.0Leasing Transactions Payables (Net) 0 0 0 0.0 0 0 0 0.0
Finance leasing payables 0 0 0 0.0 0 0 0 0.0Operations leasing payables 0 0 0 0.0 0 0 0 0.0Others 0 0 0 0.0 0 0 0 0.0Deferred finance leasing expenses (-) 0 0 0 0.0 0 0 0 0.0
Derivative Finan. Liabilities Held for Hedging 0 0 0 0.0 0 0 0 0.0Fair value hedges 0 0 0 0.0 0 0 0 0.0Cash flow hedges 0 0 0 0.0 0 0 0 0.0Hedges for invest. made in foreign countries 0 0 0 0.0 0 0 0 0.0
Provisions 3 0 3 0.7 6 0 6 4.7General provisions 0 0 0 0.0 1 0 1 0.6Restructuring reserves 0 0 0 0.0 0 0 0 0.0Reserves for employee benefit 3 0 3 0.7 0 0 0 0.3Insurance technical reserves (Net) 0 0 0 0.0 0 0 0 0.0Other provisions 0 0 0 0.1 5 0 5 3.9
Liabilities for Tax 1 0 1 0.1 5 0 5 3.4Current liabilities for tax 0 0 0 0.1 5 0 5 3.4Deferred liabilities for tax 0 0 0 0.0 0 0 0 0.0
Lia.for Pro.&Equ.for Sale p. and from Term.Op.(Net) 0 0 0 0.0 0 0 0 0.0Subordinated Loans 0 0 0 0.0 0 0 0 0.0Shareholders' Equity 125 0 125 27.4 115 0 115 85.7
Paid-in capital 65 0 65 14.3 67 0 67 50.1Supplementary capital 0 0 0 0.0 0 0 0 0.0
Share premium 0 0 0 0.0 0 0 0 0.0Share cancellation profits 0 0 0 0.0 0 0 0 0.0Valuation changes in marketable securities 0 0 0 0.0 0 0 0 0.0Revaluation changes of property and equip. 0 0 0 0.0 0 0 0 0.0Revaluation changes of intangible assets 0 0 0 0.0 0 0 0 0.0Revaluation changes of real est.for inv. pur. 0 0 0 0.0 0 0 0 0.0Free shares from inv.&ass.,subs.& joint vent. 0 0 0 0.0 0 0 0 0.0Hedging funds (active part) 0 0 0 0.0 0 0 0 0.0Val.inc.in pro.& equ.held for sale p.and term.ope. 0 0 0 0.0 0 0 0 0.0Other capital reserves 0 0 0 0.0 0 0 0 0.0
Profit reserves 0 0 0 0.0 0 0 0 0.0Legal reserves 0 0 0 0.0 0 0 0 0.0Status reserves 0 0 0 0.0 0 0 0 0.0Extraordinary reserves 0 0 0 0.0 0 0 0 0.0Other profit reserves 0 0 0 0.0 0 0 0 0.0
Profit or loss 60 0 60 13.2 48 0 48 35.6Prior years income/loss 46 0 46 10.1 33 0 33 24.3Current year income/loss 14 0 14 3.0 15 0 15 11.3
Total Liabilities 130 326 456 100.0 130 4 134 100.0

II-156
JPMorgan Chase Bank N.A.
Off Balance Sheet Commitments(USD Million)
Dec. 2010 Dec. 2009TC FC Total TC FC Total
Guarantees and Warranties 0 6 6 0 6 6Letters of guarantee 0 6 6 0 6 6Bank acceptances 0 0 0 0 0 0Letters of credit 0 0 0 0 0 0Prefinancing given as guarantee 0 0 0 0 0 0Endorsements 0 0 0 0 0 0Other guarantees and warrantees 0 0 0 0 0 0
Commitments 105 0 105 31 0 31Irrevocable commitments 105 0 105 31 0 31Revocable commitments 0 0 0 0 0 0
Derivative Financial Instruments 434 489 923 411 415 826Derivative finan. instruments held for hedging 0 0 0 0 0 0Trading transactions 434 489 923 411 415 826
Custody and Pledged Securities 2 0 2 128 0 128Items held in Custody 2 0 2 128 0 128Pledged Items 0 0 0 0 0 0Acccepted independent guaran. and warran. 0 0 0 0 0 0
Total Off Balance Sheet Commitments 541 495 1,036 571 421 992
Income-Expenditure(USD Million)
Dec. 2010 Dec. 2009
Interest Income 33 21Interest on loans 0 0Interest received from reserve deposits 0 0Interest received from banks 3 1Interest received from money market transactions 8 11Interest received from marketable securities portfolio 21 9Other interest income 0 0
Interest Expenses 1 2Interest on deposits 1 0Interest on money market transactions 0 0Interest on funds borrowed 0 0Interest on securities issued 0 0Other interest expenses 0 1
Net Interest Income/Expenses 32 19Net Fees and Commissions Income/Expenses 3 1
Fees and commissions received 3 1Fees and commissions paid 0 0
Dividend Income 0 0Trading Profit/Loss (net) -2 21
Profit/loss on trading account securities 10 30Profit/losses on derivative financial transactions 3 -2Foreign exchange profit/loss -15 -7
Other Operating Income 1 0Total Operating Income/Expenses 34 42Provision for Loan Losses or other Receivables (-) 0 2
Specific provisions of banks loans and other receivables* 0 0General provision expenses* 0 1
Other Operating Expenses (-) 17 21Personnel Expenses* 6 6
Net Operating Profit/Loss 17 19Surplus written as gain after merger 0 0Profit/losses from equity method applied subsidiaries 0 0Net monetory position gain/loss 0 0Profit/Loss Before Taxes from Continuing Operations 17 19Provisions for Taxes on Income from Continuing Operations (±) -3 -4Net Profit/Loss from Continuing Operations 14 15Net Profit/Loss Before Taxes from Terminated Operations 0 0Provisions for Taxes on Income from Terminated Operations (±) 0 0Net Profit/Loss from Terminated Operations 0 0
Net Profit/Losses 14 15
* Used from information and disclosures related to income statement".

II-157
JPMorgan Chase Bank N.A. December 2010
Ratios(%)
Dec. 2010 Dec. 2009
Capital Ratios
Shareholders’ Equity / (Amount subject to credit + market + operational risk) 106.9 116.4
Shareholders' Equity / Total Assets 27.4 85.7
(Shareholders' Equity - Permanent Assets) / Total Assets 27.1 84.3
Net On Balance Sheet Position / Total Shareholders' Equity -229.3 62.3
Net On and Off Balance Sheet Position / Total Shareholders' Equity 161.8 -14.8
Balance-Sheet Ratios
TC Assets / Total Assets 91.3 44.7
TC Liabilities / Total Liabilities 28.5 97.0
FC Assets / FC Liabilities 12.2 1,838.2
TC Deposits / Total Deposits 0.4 75.4
TC Loans / Total Loans and Receivables - -
Total Deposits / Total Assets 71.6 4.0
Funds Borrowed / Total Assets 0.0 0.0
Assets Quality
Financial Assets (net) / Total Assets 90.7 40.3
Total Loans and Receivables / Total Assets 0.0 0.0
Total Loans and Receivables / Total Deposits 0.0 0.0
Loans Under Follow-up (gross) / Total Loans and Receivables - -
Loans Under Follow-up (net) / Total Loans and Receivables - -
Specific Provisions / Loans Under Follow-up - -
Permanent Assets / Total Assets 0.3 1.5
Consumer Loans / Total Loans and Receivables - -
Liquidity
Liquid Assets / Total Assets 99.6 94.9
Liquid Assets / Short-term Liabilities 137.8 1,484.1
TC Liquid Assets / Total Assets 91.0 39.6
Profitability
Net Profit/Losses / Total Assets 3.0 11.3
Net Profit/Losses / Total Shareholders' Equity 11.1 13.2
Profit/Losses Before Taxes after Continuing Operations / Total Assets 3.8 14.4
Income-Expenditure Structure
Net Interest Income After Specific Provisions / Total Assets 6.9 14.3
Net Interest Income After Specific Provisions / Total Operating Income (Expenses) 92.7 46.1
Non-interest Income (net) / Total Assets 0.5 16.7
Other Operating Expenses / Total Assets 3.7 15.5
Personnel Expenses / Other Operating Expenses 35.9 28.1
Non-interest Income (net) / Other Operating Expenses 14.8 107.9
Quarterly profitability and income-expenditure ratios, except year-end figures, should be considered periodically.
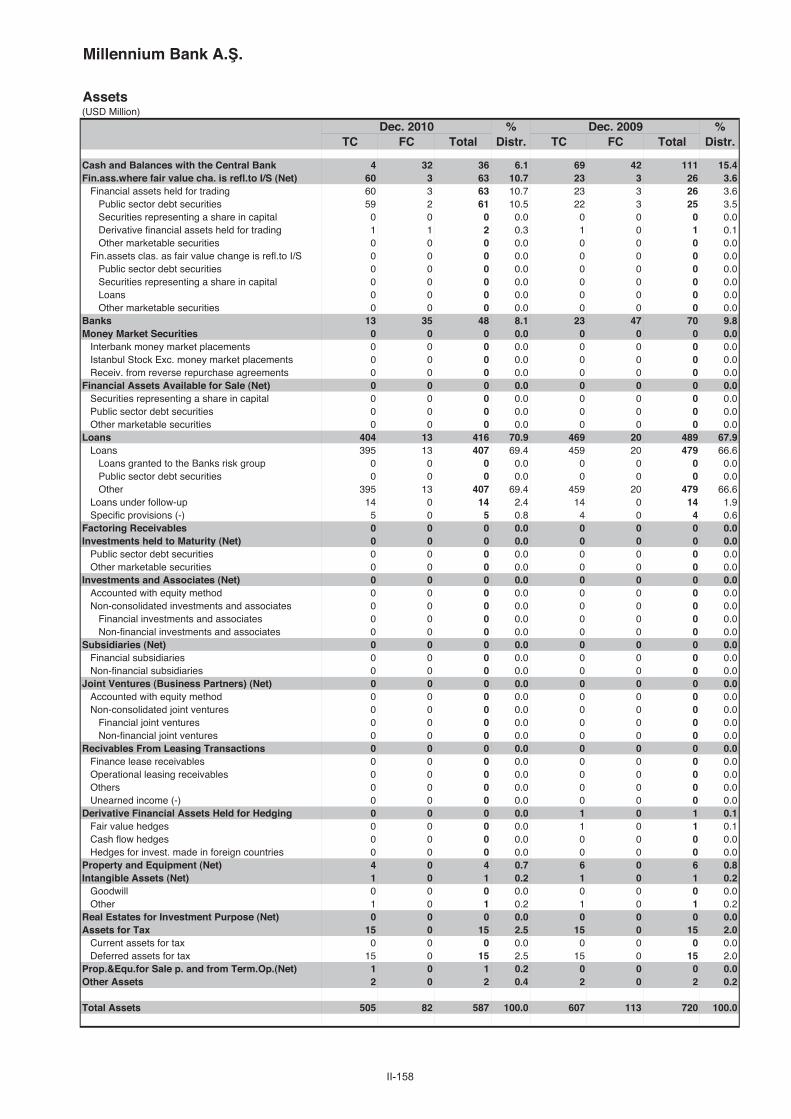
II-158
Millennium Bank A. .
Assets(USD Million)
Dec. 2010 % Dec. 2009 %TC FC Total Distr. TC FC Total Distr.
Cash and Balances with the Central Bank 4 32 36 6.1 69 42 111 15.4Fin.ass.where fair value cha. is refl.to I/S (Net) 60 3 63 10.7 23 3 26 3.6
Financial assets held for trading 60 3 63 10.7 23 3 26 3.6Public sector debt securities 59 2 61 10.5 22 3 25 3.5Securities representing a share in capital 0 0 0 0.0 0 0 0 0.0Derivative financial assets held for trading 1 1 2 0.3 1 0 1 0.1Other marketable securities 0 0 0 0.0 0 0 0 0.0
Fin.assets clas. as fair value change is refl.to I/S 0 0 0 0.0 0 0 0 0.0Public sector debt securities 0 0 0 0.0 0 0 0 0.0Securities representing a share in capital 0 0 0 0.0 0 0 0 0.0Loans 0 0 0 0.0 0 0 0 0.0Other marketable securities 0 0 0 0.0 0 0 0 0.0
Banks 13 35 48 8.1 23 47 70 9.8Money Market Securities 0 0 0 0.0 0 0 0 0.0
Interbank money market placements 0 0 0 0.0 0 0 0 0.0Istanbul Stock Exc. money market placements 0 0 0 0.0 0 0 0 0.0Receiv. from reverse repurchase agreements 0 0 0 0.0 0 0 0 0.0
Financial Assets Available for Sale (Net) 0 0 0 0.0 0 0 0 0.0Securities representing a share in capital 0 0 0 0.0 0 0 0 0.0Public sector debt securities 0 0 0 0.0 0 0 0 0.0Other marketable securities 0 0 0 0.0 0 0 0 0.0
Loans 404 13 416 70.9 469 20 489 67.9Loans 395 13 407 69.4 459 20 479 66.6
Loans granted to the Banks risk group 0 0 0 0.0 0 0 0 0.0Public sector debt securities 0 0 0 0.0 0 0 0 0.0Other 395 13 407 69.4 459 20 479 66.6
Loans under follow-up 14 0 14 2.4 14 0 14 1.9Specific provisions (-) 5 0 5 0.8 4 0 4 0.6
Factoring Receivables 0 0 0 0.0 0 0 0 0.0Investments held to Maturity (Net) 0 0 0 0.0 0 0 0 0.0
Public sector debt securities 0 0 0 0.0 0 0 0 0.0Other marketable securities 0 0 0 0.0 0 0 0 0.0
Investments and Associates (Net) 0 0 0 0.0 0 0 0 0.0Accounted with equity method 0 0 0 0.0 0 0 0 0.0Non-consolidated investments and associates 0 0 0 0.0 0 0 0 0.0
Financial investments and associates 0 0 0 0.0 0 0 0 0.0Non-financial investments and associates 0 0 0 0.0 0 0 0 0.0
Subsidiaries (Net) 0 0 0 0.0 0 0 0 0.0Financial subsidiaries 0 0 0 0.0 0 0 0 0.0Non-financial subsidiaries 0 0 0 0.0 0 0 0 0.0
Joint Ventures (Business Partners) (Net) 0 0 0 0.0 0 0 0 0.0Accounted with equity method 0 0 0 0.0 0 0 0 0.0Non-consolidated joint ventures 0 0 0 0.0 0 0 0 0.0
Financial joint ventures 0 0 0 0.0 0 0 0 0.0Non-financial joint ventures 0 0 0 0.0 0 0 0 0.0
Recivables From Leasing Transactions 0 0 0 0.0 0 0 0 0.0Finance lease receivables 0 0 0 0.0 0 0 0 0.0Operational leasing receivables 0 0 0 0.0 0 0 0 0.0Others 0 0 0 0.0 0 0 0 0.0Unearned income (-) 0 0 0 0.0 0 0 0 0.0
Derivative Financial Assets Held for Hedging 0 0 0 0.0 1 0 1 0.1Fair value hedges 0 0 0 0.0 1 0 1 0.1Cash flow hedges 0 0 0 0.0 0 0 0 0.0Hedges for invest. made in foreign countries 0 0 0 0.0 0 0 0 0.0
Property and Equipment (Net) 4 0 4 0.7 6 0 6 0.8Intangible Assets (Net) 1 0 1 0.2 1 0 1 0.2
Goodwill 0 0 0 0.0 0 0 0 0.0Other 1 0 1 0.2 1 0 1 0.2
Real Estates for Investment Purpose (Net) 0 0 0 0.0 0 0 0 0.0Assets for Tax 15 0 15 2.5 15 0 15 2.0
Current assets for tax 0 0 0 0.0 0 0 0 0.0Deferred assets for tax 15 0 15 2.5 15 0 15 2.0
Prop.&Equ.for Sale p. and from Term.Op.(Net) 1 0 1 0.2 0 0 0 0.0Other Assets 2 0 2 0.4 2 0 2 0.2
Total Assets 505 82 587 100.0 607 113 720 100.0
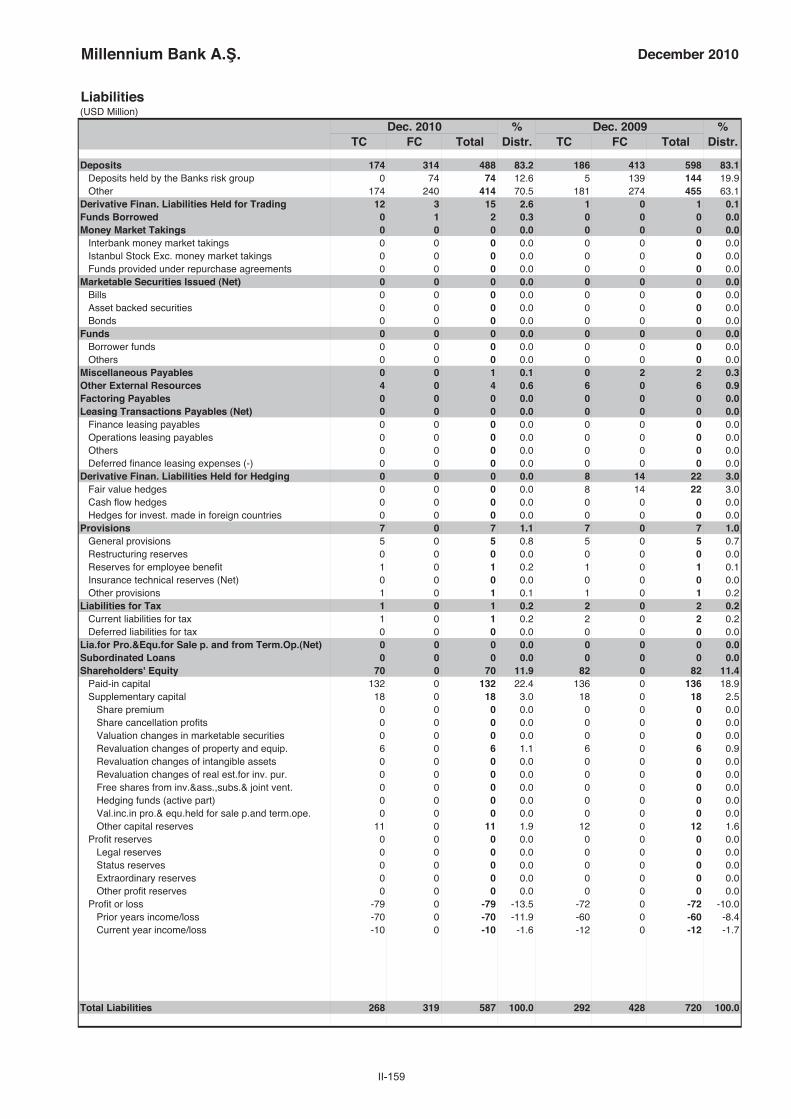
II-159
Millennium Bank A. . December 2010
Liabilities(USD Million)
Dec. 2010 % Dec. 2009 %TC FC Total Distr. TC FC Total Distr.
Deposits 174 314 488 83.2 186 413 598 83.1Deposits held by the Banks risk group 0 74 74 12.6 5 139 144 19.9Other 174 240 414 70.5 181 274 455 63.1
Derivative Finan. Liabilities Held for Trading 12 3 15 2.6 1 0 1 0.1Funds Borrowed 0 1 2 0.3 0 0 0 0.0Money Market Takings 0 0 0 0.0 0 0 0 0.0
Interbank money market takings 0 0 0 0.0 0 0 0 0.0Istanbul Stock Exc. money market takings 0 0 0 0.0 0 0 0 0.0Funds provided under repurchase agreements 0 0 0 0.0 0 0 0 0.0
Marketable Securities Issued (Net) 0 0 0 0.0 0 0 0 0.0Bills 0 0 0 0.0 0 0 0 0.0Asset backed securities 0 0 0 0.0 0 0 0 0.0Bonds 0 0 0 0.0 0 0 0 0.0
Funds 0 0 0 0.0 0 0 0 0.0Borrower funds 0 0 0 0.0 0 0 0 0.0Others 0 0 0 0.0 0 0 0 0.0
Miscellaneous Payables 0 0 1 0.1 0 2 2 0.3Other External Resources 4 0 4 0.6 6 0 6 0.9Factoring Payables 0 0 0 0.0 0 0 0 0.0Leasing Transactions Payables (Net) 0 0 0 0.0 0 0 0 0.0
Finance leasing payables 0 0 0 0.0 0 0 0 0.0Operations leasing payables 0 0 0 0.0 0 0 0 0.0Others 0 0 0 0.0 0 0 0 0.0Deferred finance leasing expenses (-) 0 0 0 0.0 0 0 0 0.0
Derivative Finan. Liabilities Held for Hedging 0 0 0 0.0 8 14 22 3.0Fair value hedges 0 0 0 0.0 8 14 22 3.0Cash flow hedges 0 0 0 0.0 0 0 0 0.0Hedges for invest. made in foreign countries 0 0 0 0.0 0 0 0 0.0
Provisions 7 0 7 1.1 7 0 7 1.0General provisions 5 0 5 0.8 5 0 5 0.7Restructuring reserves 0 0 0 0.0 0 0 0 0.0Reserves for employee benefit 1 0 1 0.2 1 0 1 0.1Insurance technical reserves (Net) 0 0 0 0.0 0 0 0 0.0Other provisions 1 0 1 0.1 1 0 1 0.2
Liabilities for Tax 1 0 1 0.2 2 0 2 0.2Current liabilities for tax 1 0 1 0.2 2 0 2 0.2Deferred liabilities for tax 0 0 0 0.0 0 0 0 0.0
Lia.for Pro.&Equ.for Sale p. and from Term.Op.(Net) 0 0 0 0.0 0 0 0 0.0Subordinated Loans 0 0 0 0.0 0 0 0 0.0Shareholders' Equity 70 0 70 11.9 82 0 82 11.4
Paid-in capital 132 0 132 22.4 136 0 136 18.9Supplementary capital 18 0 18 3.0 18 0 18 2.5
Share premium 0 0 0 0.0 0 0 0 0.0Share cancellation profits 0 0 0 0.0 0 0 0 0.0Valuation changes in marketable securities 0 0 0 0.0 0 0 0 0.0Revaluation changes of property and equip. 6 0 6 1.1 6 0 6 0.9Revaluation changes of intangible assets 0 0 0 0.0 0 0 0 0.0Revaluation changes of real est.for inv. pur. 0 0 0 0.0 0 0 0 0.0Free shares from inv.&ass.,subs.& joint vent. 0 0 0 0.0 0 0 0 0.0Hedging funds (active part) 0 0 0 0.0 0 0 0 0.0Val.inc.in pro.& equ.held for sale p.and term.ope. 0 0 0 0.0 0 0 0 0.0Other capital reserves 11 0 11 1.9 12 0 12 1.6
Profit reserves 0 0 0 0.0 0 0 0 0.0Legal reserves 0 0 0 0.0 0 0 0 0.0Status reserves 0 0 0 0.0 0 0 0 0.0Extraordinary reserves 0 0 0 0.0 0 0 0 0.0Other profit reserves 0 0 0 0.0 0 0 0 0.0
Profit or loss -79 0 -79 -13.5 -72 0 -72 -10.0Prior years income/loss -70 0 -70 -11.9 -60 0 -60 -8.4Current year income/loss -10 0 -10 -1.6 -12 0 -12 -1.7
Total Liabilities 268 319 587 100.0 292 428 720 100.0

II-160
Millennium Bank A. .
Off Balance Sheet Commitments(USD Million)
Dec. 2010 Dec. 2009TC FC Total TC FC Total
Guarantees and Warranties 42 8 50 14 5 18Letters of guarantee 42 7 49 14 4 17Bank acceptances 0 0 0 0 0 0Letters of credit 0 0 0 0 1 1Prefinancing given as guarantee 0 0 0 0 0 0Endorsements 0 0 0 0 0 0Other guarantees and warrantees 0 0 0 0 0 0
Commitments 685 6 690 740 1,561 2,301Irrevocable commitments 65 6 70 437 1,561 1,998Revocable commitments 620 0 620 303 0 303
Derivative Financial Instruments 132 902 1,034 161 1,143 1,304Derivative finan. instruments held for hedging 0 0 0 70 613 683Trading transactions 132 902 1,034 91 531 622
Custody and Pledged Securities 1,854 2,510 4,364 910 1,387 2,298Items held in Custody 18 21 38 46 41 87Pledged Items 1,836 2,489 4,325 849 1,288 2,138Acccepted independent guaran. and warran. 0 0 0 16 58 74
Total Off Balance Sheet Commitments 2,713 3,425 6,138 1,825 4,097 5,922
Income-Expenditure(USD Million)
Dec. 2010 Dec. 2009
Interest Income 47 59Interest on loans 42 49Interest received from reserve deposits 0 1Interest received from banks 2 3Interest received from money market transactions 1 3Interest received from marketable securities portfolio 1 3Other interest income 0 0
Interest Expenses 25 36Interest on deposits 25 36Interest on money market transactions 0 0Interest on funds borrowed 0 0Interest on securities issued 0 0Other interest expenses 0 0
Net Interest Income/Expenses 22 23Net Fees and Commissions Income/Expenses 3 2
Fees and commissions received 3 3Fees and commissions paid 0 1
Dividend Income 0 0Trading Profit/Loss (net) -6 -5
Profit/loss on trading account securities 2 2Profit/losses on derivative financial transactions -6 -22Foreign exchange profit/loss -2 15
Other Operating Income 3 2Total Operating Income/Expenses 21 22Provision for Loan Losses or other Receivables (-) 2 3
Specific provisions of banks loans and other receivables* 2 3General provision expenses* 0 0
Other Operating Expenses (-) 30 33Personnel Expenses* 16 18
Net Operating Profit/Loss -10 -14Surplus written as gain after merger 0 0Profit/losses from equity method applied subsidiaries 0 0Net monetory position gain/loss 0 0Profit/Loss Before Taxes from Continuing Operations -10 -14Provisions for Taxes on Income from Continuing Operations (±) 1 2Net Profit/Loss from Continuing Operations -10 -12Net Profit/Loss Before Taxes from Terminated Operations 0 0Provisions for Taxes on Income from Terminated Operations (±) 0 0Net Profit/Loss from Terminated Operations 0 0
Net Profit/Losses -10 -12
* Used from information and disclosures related to income statement".

II-161
Millennium Bank A. . December 2010
Ratios(%)
Dec. 2010 Dec. 2009
Capital Ratios
Shareholders’ Equity / (Amount subject to credit + market + operational risk) 15.0 19.2
Shareholders' Equity / Total Assets 11.9 11.4
(Shareholders' Equity - Permanent Assets) / Total Assets 9.2 9.1
Net On Balance Sheet Position / Total Shareholders' Equity 73.9 33.6
Net On and Off Balance Sheet Position / Total Shareholders' Equity -1.7 2.6
Balance-Sheet Ratios
TC Assets / Total Assets 86.0 84.3
TC Liabilities / Total Liabilities 45.7 40.5
FC Assets / FC Liabilities 25.7 26.3
TC Deposits / Total Deposits 35.7 31.0
TC Loans / Total Loans and Receivables 97.0 95.9
Total Deposits / Total Assets 83.2 83.1
Funds Borrowed / Total Assets 0.3 0.0
Assets Quality
Financial Assets (net) / Total Assets 10.7 3.7
Total Loans and Receivables / Total Assets 70.9 67.9
Total Loans and Receivables / Total Deposits 85.3 81.8
Loans Under Follow-up (gross) / Total Loans and Receivables 3.3 2.8
Loans Under Follow-up (net) / Total Loans and Receivables 2.2 2.0
Specific Provisions / Loans Under Follow-up 34.7 29.6
Permanent Assets / Total Assets 2.7 2.3
Consumer Loans / Total Loans and Receivables 49.0 56.9
Liquidity
Liquid Assets / Total Assets 25.0 28.7
Liquid Assets / Short-term Liabilities 41.4 62.7
TC Liquid Assets / Total Assets 13.2 15.9
Profitability
Net Profit/Losses / Total Assets -1.6 -1.7
Net Profit/Losses / Total Shareholders' Equity -13.6 -14.6
Profit/Losses Before Taxes after Continuing Operations / Total Assets -1.7 -2.0
Income-Expenditure Structure
Net Interest Income After Specific Provisions / Total Assets 3.4 2.7
Net Interest Income After Specific Provisions / Total Operating Income (Expenses) 92.7 88.0
Non-interest Income (net) / Total Assets 0.0 -0.1
Other Operating Expenses / Total Assets 5.1 4.6
Personnel Expenses / Other Operating Expenses 52.2 53.3
Non-interest Income (net) / Other Operating Expenses -0.5 -1.3
Quarterly profitability and income-expenditure ratios, except year-end figures, should be considered periodically.

II-162
Société Générale (SA)
Assets(USD Million)
Dec. 2010 % Dec. 2009 %TC FC Total Distr. TC FC Total Distr.
Cash and Balances with the Central Bank 30 42 72 16.4 25 17 42 17.4Fin.ass.where fair value cha. is refl.to I/S (Net) 56 0 56 12.8 74 0 74 30.5
Financial assets held for trading 56 0 56 12.8 74 0 74 30.5Public sector debt securities 56 0 56 12.8 73 0 73 30.0Securities representing a share in capital 0 0 0 0.0 0 0 0 0.0Derivative financial assets held for trading 0 0 0 0.0 1 0 1 0.5Other marketable securities 0 0 0 0.0 0 0 0 0.0
Fin.assets clas. as fair value change is refl.to I/S 0 0 0 0.0 0 0 0 0.0Public sector debt securities 0 0 0 0.0 0 0 0 0.0Securities representing a share in capital 0 0 0 0.0 0 0 0 0.0Loans 0 0 0 0.0 0 0 0 0.0Other marketable securities 0 0 0 0.0 0 0 0 0.0
Banks 0 0 0 0.1 0 11 11 4.6Money Market Securities 65 0 65 14.8 0 0 0 0.0
Interbank money market placements 0 0 0 0.0 0 0 0 0.0Istanbul Stock Exc. money market placements 0 0 0 0.0 0 0 0 0.0Receiv. from reverse repurchase agreements 65 0 65 14.8 0 0 0 0.0
Financial Assets Available for Sale (Net) 0 0 0 0.0 0 0 0 0.0Securities representing a share in capital 0 0 0 0.0 0 0 0 0.0Public sector debt securities 0 0 0 0.0 0 0 0 0.0Other marketable securities 0 0 0 0.0 0 0 0 0.0
Loans 212 16 228 52.0 85 20 105 43.5Loans 209 16 225 51.3 83 20 103 42.6
Loans granted to the Banks risk group 25 0 25 5.7 28 0 28 11.6Public sector debt securities 0 0 0 0.0 0 0 0 0.0Other 183 16 200 45.5 55 20 75 31.1
Loans under follow-up 10 0 10 2.2 5 0 6 2.3Specific provisions (-) 7 0 7 1.5 3 0 3 1.4
Factoring Receivables 0 0 0 0.0 0 0 0 0.0Investments held to Maturity (Net) 0 0 0 0.0 0 0 0 0.0
Public sector debt securities 0 0 0 0.0 0 0 0 0.0Other marketable securities 0 0 0 0.0 0 0 0 0.0
Investments and Associates (Net) 0 0 0 0.0 0 0 0 0.0Accounted with equity method 0 0 0 0.0 0 0 0 0.0Non-consolidated investments and associates 0 0 0 0.0 0 0 0 0.0
Financial investments and associates 0 0 0 0.0 0 0 0 0.0Non-financial investments and associates 0 0 0 0.0 0 0 0 0.0
Subsidiaries (Net) 0 0 0 0.0 0 0 0 0.0Financial subsidiaries 0 0 0 0.0 0 0 0 0.0Non-financial subsidiaries 0 0 0 0.0 0 0 0 0.0
Joint Ventures (Business Partners) (Net) 0 0 0 0.0 0 0 0 0.0Accounted with equity method 0 0 0 0.0 0 0 0 0.0Non-consolidated joint ventures 0 0 0 0.0 0 0 0 0.0
Financial joint ventures 0 0 0 0.0 0 0 0 0.0Non-financial joint ventures 0 0 0 0.0 0 0 0 0.0
Recivables From Leasing Transactions 0 0 0 0.0 0 0 0 0.0Finance lease receivables 0 0 0 0.0 0 0 0 0.0Operational leasing receivables 0 0 0 0.0 0 0 0 0.0Others 0 0 0 0.0 0 0 0 0.0Unearned income (-) 0 0 0 0.0 0 0 0 0.0
Derivative Financial Assets Held for Hedging 0 0 0 0.0 0 0 0 0.0Fair value hedges 0 0 0 0.0 0 0 0 0.0Cash flow hedges 0 0 0 0.0 0 0 0 0.0Hedges for invest. made in foreign countries 0 0 0 0.0 0 0 0 0.0
Property and Equipment (Net) 3 0 3 0.8 3 0 3 1.2Intangible Assets (Net) 5 0 5 1.1 3 0 3 1.2
Goodwill 0 0 0 0.0 0 0 0 0.0Other 5 0 5 1.1 3 0 3 1.2
Real Estates for Investment Purpose (Net) 0 0 0 0.0 0 0 0 0.0Assets for Tax 2 0 2 0.5 0 0 0 0.0
Current assets for tax 0 0 0 0.0 0 0 0 0.0Deferred assets for tax 2 0 2 0.5 0 0 0 0.0
Prop.&Equ.for Sale p. and from Term.Op.(Net) 0 0 0 0.0 0 0 0 0.0Other Assets 6 1 6 1.5 1 3 4 1.6
Total Assets 380 59 439 100.0 191 51 242 100.0

II-163
Société Générale (SA) December 2010
Liabilities(USD Million)
Dec. 2010 % Dec. 2009 %TC FC Total Distr. TC FC Total Distr.
Deposits 1 43 43 9.9 47 31 78 32.1Deposits held by the Banks risk group 1 42 43 9.7 0 0 0 0.0Other 0 1 1 0.2 47 31 78 32.1
Derivative Finan. Liabilities Held for Trading 0 0 0 0.1 0 0 0 0.0Funds Borrowed 180 139 319 72.7 2 140 141 58.4Money Market Takings 0 0 0 0.0 0 0 0 0.0
Interbank money market takings 0 0 0 0.0 0 0 0 0.0Istanbul Stock Exc. money market takings 0 0 0 0.0 0 0 0 0.0Funds provided under repurchase agreements 0 0 0 0.0 0 0 0 0.0
Marketable Securities Issued (Net) 0 0 0 0.0 0 0 0 0.0Bills 0 0 0 0.0 0 0 0 0.0Asset backed securities 0 0 0 0.0 0 0 0 0.0Bonds 0 0 0 0.0 0 0 0 0.0
Funds 0 0 0 0.0 0 0 0 0.0Borrower funds 0 0 0 0.0 0 0 0 0.0Others 0 0 0 0.0 0 0 0 0.0
Miscellaneous Payables 1 0 1 0.2 0 0 0 0.1Other External Resources 7 0 7 1.7 1 0 1 0.6Factoring Payables 0 0 0 0.0 0 0 0 0.0Leasing Transactions Payables (Net) 0 0 0 0.0 0 0 0 0.0
Finance leasing payables 0 0 0 0.0 0 0 0 0.0Operations leasing payables 0 0 0 0.0 0 0 0 0.0Others 0 0 0 0.0 0 0 0 0.0Deferred finance leasing expenses (-) 0 0 0 0.0 0 0 0 0.0
Derivative Finan. Liabilities Held for Hedging 0 0 0 0.0 0 0 0 0.0Fair value hedges 0 0 0 0.0 0 0 0 0.0Cash flow hedges 0 0 0 0.0 0 0 0 0.0Hedges for invest. made in foreign countries 0 0 0 0.0 0 0 0 0.0
Provisions 6 1 7 1.7 2 3 5 2.1General provisions 2 0 2 0.5 1 0 1 0.3Restructuring reserves 0 0 0 0.0 0 0 0 0.0Reserves for employee benefit 3 0 3 0.6 1 1 2 0.9Insurance technical reserves (Net) 0 0 0 0.0 0 0 0 0.0Other provisions 2 1 3 0.7 1 1 2 0.8
Liabilities for Tax 1 0 1 0.2 1 0 1 0.5Current liabilities for tax 1 0 1 0.2 1 0 1 0.5Deferred liabilities for tax 0 0 0 0.0 0 0 0 0.0
Lia.for Pro.&Equ.for Sale p. and from Term.Op.(Net) 0 0 0 0.0 0 0 0 0.0Subordinated Loans 0 0 0 0.0 0 0 0 0.0Shareholders' Equity 60 0 60 13.6 15 0 15 6.3
Paid-in capital 86 0 86 19.7 46 0 46 18.8Supplementary capital 13 0 13 2.9 13 0 13 5.4
Share premium 0 0 0 0.0 0 0 0 0.0Share cancellation profits 0 0 0 0.0 0 0 0 0.0Valuation changes in marketable securities 0 0 0 0.0 0 0 0 0.0Revaluation changes of property and equip. 0 0 0 0.0 0 0 0 0.0Revaluation changes of intangible assets 0 0 0 0.0 0 0 0 0.0Revaluation changes of real est.for inv. pur. 0 0 0 0.0 0 0 0 0.0Free shares from inv.&ass.,subs.& joint vent. 0 0 0 0.0 0 0 0 0.0Hedging funds (active part) 0 0 0 0.0 0 0 0 0.0Val.inc.in pro.& equ.held for sale p.and term.ope. 0 0 0 0.0 0 0 0 0.0Other capital reserves 13 0 13 2.9 13 0 13 5.4
Profit reserves 0 0 0 0.0 0 0 0 0.0Legal reserves 0 0 0 0.0 0 0 0 0.0Status reserves 0 0 0 0.0 0 0 0 0.0Extraordinary reserves 0 0 0 0.0 0 0 0 0.0Other profit reserves 0 0 0 0.0 0 0 0 0.0
Profit or loss -39 0 -39 -9.0 -43 0 -43 -17.9Prior years income/loss -42 0 -42 -9.6 -32 0 -32 -13.3Current year income/loss 3 0 3 0.6 -11 0 -11 -4.6
Total Liabilities 255 183 439 100.0 69 173 242 100.0

II-164
Société Générale (SA)
Off Balance Sheet Commitments(USD Million)
Dec. 2010 Dec. 2009TC FC Total TC FC Total
Guarantees and Warranties 1 118 119 2 135 136Letters of guarantee 1 90 91 2 104 106Bank acceptances 0 0 0 0 0 0Letters of credit 0 14 14 0 9 9Prefinancing given as guarantee 0 0 0 0 0 0Endorsements 0 0 0 0 0 0Other guarantees and warrantees 0 14 14 0 22 22
Commitments 0 11 11 13 56 69Irrevocable commitments 0 11 11 13 56 69Revocable commitments 0 0 0 0 0 0
Derivative Financial Instruments 125 149 274 122 125 246Derivative finan. instruments held for hedging 0 0 0 0 0 0Trading transactions 125 149 274 122 125 246
Custody and Pledged Securities 57 0 57 11 0 11Items held in Custody 0 0 0 0 0 0Pledged Items 57 0 57 11 0 11Acccepted independent guaran. and warran. 0 0 0 0 0 0
Total Off Balance Sheet Commitments 183 278 461 147 315 463
Income-Expenditure(USD Million)
Dec. 2010 Dec. 2009
Interest Income 51 33Interest on loans 28 15Interest received from reserve deposits 0 0Interest received from banks 6 4Interest received from money market transactions 11 11Interest received from marketable securities portfolio 6 3Other interest income 0 0
Interest Expenses 8 9Interest on deposits 5 7Interest on money market transactions 3 2Interest on funds borrowed 0 0Interest on securities issued 0 0Other interest expenses 0 0
Net Interest Income/Expenses 44 24Net Fees and Commissions Income/Expenses 4 3
Fees and commissions received 5 4Fees and commissions paid 1 1
Dividend Income 0 0Trading Profit/Loss (net) -20 -12
Profit/loss on trading account securities 0 2Profit/losses on derivative financial transactions -22 2Foreign exchange profit/loss 2 -16
Other Operating Income 3 1Total Operating Income/Expenses 31 15Provision for Loan Losses or other Receivables (-) 5 4
Specific provisions of banks loans and other receivables* 3 3General provision expenses* 1 0
Other Operating Expenses (-) 25 22Personnel Expenses* 14 14
Net Operating Profit/Loss 1 -11Surplus written as gain after merger 0 0Profit/losses from equity method applied subsidiaries 0 0Net monetory position gain/loss 0 0Profit/Loss Before Taxes from Continuing Operations 1 -11Provisions for Taxes on Income from Continuing Operations (±) 2 0Net Profit/Loss from Continuing Operations 3 -11Net Profit/Loss Before Taxes from Terminated Operations 0 0Provisions for Taxes on Income from Terminated Operations (±) 0 0Net Profit/Loss from Terminated Operations 0 0
Net Profit/Losses 3 -11
* Used from information and disclosures related to income statement".

II-165
Société Générale (SA) December 2010
Ratios(%)
Dec. 2010 Dec. 2009
Capital Ratios
Shareholders’ Equity / (Amount subject to credit + market + operational risk) 20.0 10.2
Shareholders' Equity / Total Assets 13.6 6.3
(Shareholders' Equity - Permanent Assets) / Total Assets 11.0 3.0
Net On Balance Sheet Position / Total Shareholders' Equity -208.8 -803.9
Net On and Off Balance Sheet Position / Total Shareholders' Equity -0.1 2.4
Balance-Sheet Ratios
TC Assets / Total Assets 86.6 78.9
TC Liabilities / Total Liabilities 58.2 28.4
FC Assets / FC Liabilities 32.0 29.5
TC Deposits / Total Deposits 1.7 60.1
TC Loans / Total Loans and Receivables 92.9 80.7
Total Deposits / Total Assets 9.9 32.1
Funds Borrowed / Total Assets 72.7 58.4
Assets Quality
Financial Assets (net) / Total Assets 12.8 30.5
Total Loans and Receivables / Total Assets 52.0 43.5
Total Loans and Receivables / Total Deposits 525.7 135.3
Loans Under Follow-up (gross) / Total Loans and Receivables 4.3 5.2
Loans Under Follow-up (net) / Total Loans and Receivables 1.4 1.9
Specific Provisions / Loans Under Follow-up 67.1 62.8
Permanent Assets / Total Assets 2.6 3.3
Consumer Loans / Total Loans and Receivables 80.4 44.7
Liquidity
Liquid Assets / Total Assets 44.2 52.5
Liquid Assets / Short-term Liabilities 170.3 87.9
TC Liquid Assets / Total Assets 34.7 40.9
Profitability
Net Profit/Losses / Total Assets 0.6 -4.6
Net Profit/Losses / Total Shareholders' Equity 4.4 -72.8
Profit/Losses Before Taxes after Continuing Operations / Total Assets 0.1 -4.4
Income-Expenditure Structure
Net Interest Income After Specific Provisions / Total Assets 9.2 8.4
Net Interest Income After Specific Provisions / Total Operating Income (Expenses) 132.0 133.1
Non-interest Income (net) / Total Assets -3.0 -3.4
Other Operating Expenses / Total Assets 5.7 9.3
Personnel Expenses / Other Operating Expenses 55.5 62.2
Non-interest Income (net) / Other Operating Expenses -51.8 -36.8
Quarterly profitability and income-expenditure ratios, except year-end figures, should be considered periodically.

II-166
The Royal Bank of Scotland N.V.
Assets(USD Million)
Dec. 2010 % Dec. 2009 %TC FC Total Distr. TC FC Total Distr.
Cash and Balances with the Central Bank 7 15 22 3.0 8 26 34 4.2Fin.ass.where fair value cha. is refl.to I/S (Net) 14 32 46 6.3 20 6 25 3.1
Financial assets held for trading 14 32 46 6.3 20 6 25 3.1Public sector debt securities 13 0 13 1.8 6 0 6 0.8Securities representing a share in capital 0 0 0 0.0 0 0 0 0.0Derivative financial assets held for trading 1 32 33 4.5 14 6 19 2.4Other marketable securities 0 0 0 0.0 0 0 0 0.0
Fin.assets clas. as fair value change is refl.to I/S 0 0 0 0.0 0 0 0 0.0Public sector debt securities 0 0 0 0.0 0 0 0 0.0Securities representing a share in capital 0 0 0 0.0 0 0 0 0.0Loans 0 0 0 0.0 0 0 0 0.0Other marketable securities 0 0 0 0.0 0 0 0 0.0
Banks 126 140 266 35.9 15 3 17 2.2Money Market Securities 85 0 85 11.4 504 0 504 62.6
Interbank money market placements 85 0 85 11.4 504 0 504 62.6Istanbul Stock Exc. money market placements 0 0 0 0.0 0 0 0 0.0Receiv. from reverse repurchase agreements 0 0 0 0.0 0 0 0 0.0
Financial Assets Available for Sale (Net) 127 0 127 17.2 70 0 70 8.7Securities representing a share in capital 0 0 0 0.0 0 0 0 0.0Public sector debt securities 127 0 127 17.2 70 0 70 8.7Other marketable securities 0 0 0 0.0 0 0 0 0.0
Loans 82 82 163 22.1 63 65 128 15.9Loans 80 82 161 21.8 62 65 127 15.7
Loans granted to the Banks risk group 0 0 0 0.0 1 0 1 0.1Public sector debt securities 0 0 0 0.0 0 0 0 0.0Other 80 82 161 21.8 61 65 126 15.6
Loans under follow-up 19 0 19 2.5 19 0 19 2.4Specific provisions (-) 17 0 17 2.3 17 0 17 2.2
Factoring Receivables 0 0 0 0.0 0 0 0 0.0Investments held to Maturity (Net) 0 0 0 0.0 0 0 0 0.0
Public sector debt securities 0 0 0 0.0 0 0 0 0.0Other marketable securities 0 0 0 0.0 0 0 0 0.0
Investments and Associates (Net) 0 0 0 0.0 0 0 0 0.0Accounted with equity method 0 0 0 0.0 0 0 0 0.0Non-consolidated investments and associates 0 0 0 0.0 0 0 0 0.0
Financial investments and associates 0 0 0 0.0 0 0 0 0.0Non-financial investments and associates 0 0 0 0.0 0 0 0 0.0
Subsidiaries (Net) 0 0 0 0.0 0 0 0 0.0Financial subsidiaries 0 0 0 0.0 0 0 0 0.0Non-financial subsidiaries 0 0 0 0.0 0 0 0 0.0
Joint Ventures (Business Partners) (Net) 0 0 0 0.0 0 0 0 0.0Accounted with equity method 0 0 0 0.0 0 0 0 0.0Non-consolidated joint ventures 0 0 0 0.0 0 0 0 0.0
Financial joint ventures 0 0 0 0.0 0 0 0 0.0Non-financial joint ventures 0 0 0 0.0 0 0 0 0.0
Recivables From Leasing Transactions 0 0 0 0.0 0 0 0 0.0Finance lease receivables 0 0 0 0.0 0 0 0 0.0Operational leasing receivables 0 0 0 0.0 0 0 0 0.0Others 0 0 0 0.0 0 0 0 0.0Unearned income (-) 0 0 0 0.0 0 0 0 0.0
Derivative Financial Assets Held for Hedging 0 0 0 0.0 0 0 0 0.0Fair value hedges 0 0 0 0.0 0 0 0 0.0Cash flow hedges 0 0 0 0.0 0 0 0 0.0Hedges for invest. made in foreign countries 0 0 0 0.0 0 0 0 0.0
Property and Equipment (Net) 1 0 1 0.1 15 0 15 1.9Intangible Assets (Net) 0 0 0 0.1 0 0 0 0.1
Goodwill 0 0 0 0.0 0 0 0 0.0Other 0 0 0 0.1 0 0 0 0.1
Real Estates for Investment Purpose (Net) 0 0 0 0.0 7 0 7 0.9Assets for Tax 3 0 3 0.4 0 0 0 0.0
Current assets for tax 0 0 0 0.0 0 0 0 0.0Deferred assets for tax 3 0 3 0.4 0 0 0 0.0
Prop.&Equ.for Sale p. and from Term.Op.(Net) 21 0 21 2.8 0 0 0 0.0Other Assets 5 0 5 0.7 3 0 3 0.4
Total Assets 471 268 740 100.0 707 98 805 100.0

II-167
The Royal Bank of Scotland N.V. December 2010
Liabilities(USD Million)
Dec. 2010 % Dec. 2009 %TC FC Total Distr. TC FC Total Distr.
Deposits 117 198 315 42.6 125 367 492 61.1Deposits held by the Banks risk group 13 12 25 3.4 3 17 20 2.5Other 104 187 290 39.3 122 350 472 58.6
Derivative Finan. Liabilities Held for Trading 1 31 32 4.4 4 4 8 1.0Funds Borrowed 99 4 103 13.9 24 0 24 3.0Money Market Takings 0 0 0 0.0 0 0 0 0.0
Interbank money market takings 0 0 0 0.0 0 0 0 0.0Istanbul Stock Exc. money market takings 0 0 0 0.0 0 0 0 0.0Funds provided under repurchase agreements 0 0 0 0.0 0 0 0 0.0
Marketable Securities Issued (Net) 0 0 0 0.0 0 0 0 0.0Bills 0 0 0 0.0 0 0 0 0.0Asset backed securities 0 0 0 0.0 0 0 0 0.0Bonds 0 0 0 0.0 0 0 0 0.0
Funds 0 0 0 0.0 0 0 0 0.0Borrower funds 0 0 0 0.0 0 0 0 0.0Others 0 0 0 0.0 0 0 0 0.0
Miscellaneous Payables 2 1 3 0.4 2 1 3 0.4Other External Resources 0 15 15 2.0 1 20 21 2.6Factoring Payables 0 0 0 0.0 0 0 0 0.0Leasing Transactions Payables (Net) 0 0 0 0.0 0 0 0 0.0
Finance leasing payables 0 0 0 0.0 0 0 0 0.1Operations leasing payables 0 0 0 0.0 0 0 0 0.0Others 0 0 0 0.0 0 0 0 0.0Deferred finance leasing expenses (-) 0 0 0 0.0 0 0 0 0.0
Derivative Finan. Liabilities Held for Hedging 0 0 0 0.0 0 0 0 0.0Fair value hedges 0 0 0 0.0 0 0 0 0.0Cash flow hedges 0 0 0 0.0 0 0 0 0.0Hedges for invest. made in foreign countries 0 0 0 0.0 0 0 0 0.0
Provisions 21 0 21 2.8 11 0 11 1.4General provisions 6 0 6 0.8 3 0 3 0.3Restructuring reserves 0 0 0 0.0 0 0 0 0.0Reserves for employee benefit 6 0 6 0.9 8 0 8 1.0Insurance technical reserves (Net) 0 0 0 0.0 0 0 0 0.0Other provisions 8 0 8 1.1 1 0 1 0.1
Liabilities for Tax 3 0 3 0.4 3 0 3 0.4Current liabilities for tax 3 0 3 0.4 3 0 3 0.3Deferred liabilities for tax 0 0 0 0.0 1 0 1 0.1
Lia.for Pro.&Equ.for Sale p. and from Term.Op.(Net) 0 0 0 0.0 0 0 0 0.0Subordinated Loans 0 0 0 0.0 0 0 0 0.0Shareholders' Equity 247 0 247 33.4 242 0 242 30.0
Paid-in capital 70 0 70 9.5 73 0 73 9.0Supplementary capital 46 0 46 6.2 49 0 49 6.1
Share premium 0 0 0 0.0 0 0 0 0.0Share cancellation profits 0 0 0 0.0 0 0 0 0.0Valuation changes in marketable securities 3 0 3 0.4 5 0 5 0.6Revaluation changes of property and equip. 0 0 0 0.0 0 0 0 0.0Revaluation changes of intangible assets 0 0 0 0.0 0 0 0 0.0Revaluation changes of real est.for inv. pur. 0 0 0 0.0 0 0 0 0.0Free shares from inv.&ass.,subs.& joint vent. 0 0 0 0.0 0 0 0 0.0Hedging funds (active part) 0 0 0 0.0 0 0 0 0.0Val.inc.in pro.& equ.held for sale p.and term.ope. 0 0 0 0.0 0 0 0 0.0Other capital reserves 43 0 43 5.8 44 0 44 5.5
Profit reserves 0 0 0 0.0 0 0 0 0.0Legal reserves 0 0 0 0.0 0 0 0 0.0Status reserves 0 0 0 0.0 0 0 0 0.0Extraordinary reserves 0 0 0 0.0 0 0 0 0.0Other profit reserves 0 0 0 0.0 0 0 0 0.0
Profit or loss 131 0 131 17.7 120 0 120 14.9Prior years income/loss 116 0 116 15.6 72 0 72 9.0Current year income/loss 15 0 15 2.0 47 0 47 5.9
Total Liabilities 490 250 740 100.0 413 393 805 100.0
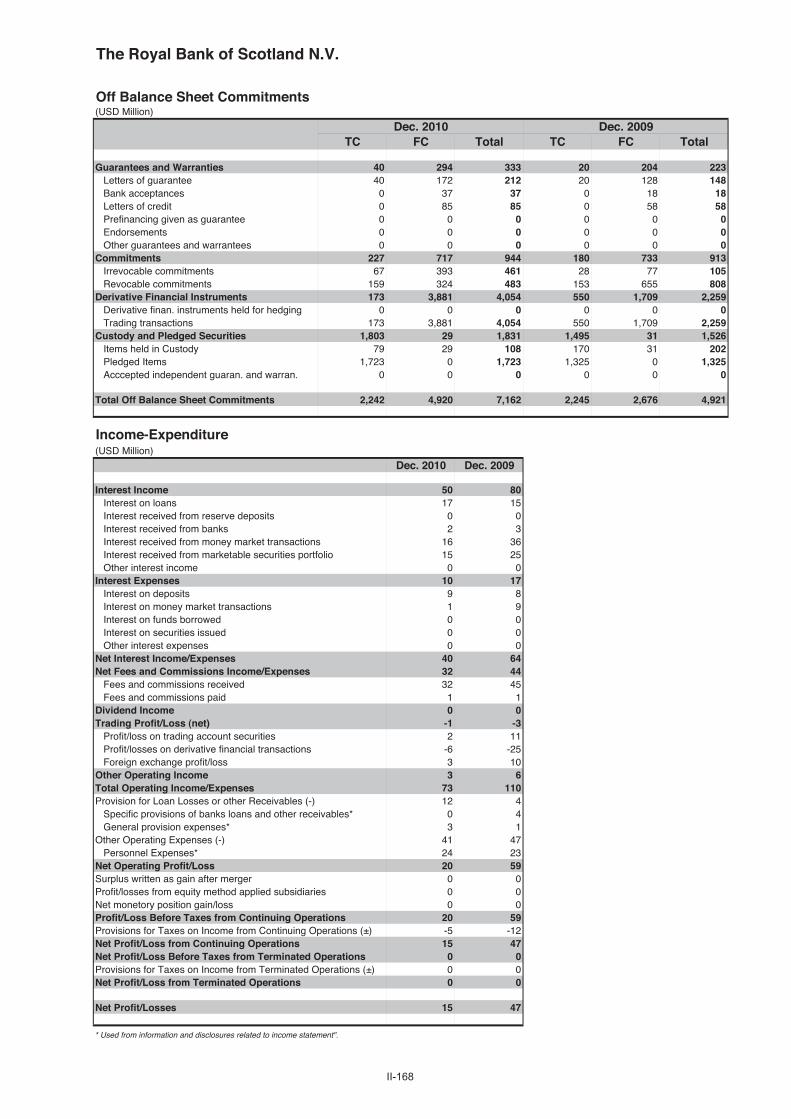
II-168
The Royal Bank of Scotland N.V.
Off Balance Sheet Commitments(USD Million)
Dec. 2010 Dec. 2009TC FC Total TC FC Total
Guarantees and Warranties 40 294 333 20 204 223Letters of guarantee 40 172 212 20 128 148Bank acceptances 0 37 37 0 18 18Letters of credit 0 85 85 0 58 58Prefinancing given as guarantee 0 0 0 0 0 0Endorsements 0 0 0 0 0 0Other guarantees and warrantees 0 0 0 0 0 0
Commitments 227 717 944 180 733 913Irrevocable commitments 67 393 461 28 77 105Revocable commitments 159 324 483 153 655 808
Derivative Financial Instruments 173 3,881 4,054 550 1,709 2,259Derivative finan. instruments held for hedging 0 0 0 0 0 0Trading transactions 173 3,881 4,054 550 1,709 2,259
Custody and Pledged Securities 1,803 29 1,831 1,495 31 1,526Items held in Custody 79 29 108 170 31 202Pledged Items 1,723 0 1,723 1,325 0 1,325Acccepted independent guaran. and warran. 0 0 0 0 0 0
Total Off Balance Sheet Commitments 2,242 4,920 7,162 2,245 2,676 4,921
Income-Expenditure(USD Million)
Dec. 2010 Dec. 2009
Interest Income 50 80Interest on loans 17 15Interest received from reserve deposits 0 0Interest received from banks 2 3Interest received from money market transactions 16 36Interest received from marketable securities portfolio 15 25Other interest income 0 0
Interest Expenses 10 17Interest on deposits 9 8Interest on money market transactions 1 9Interest on funds borrowed 0 0Interest on securities issued 0 0Other interest expenses 0 0
Net Interest Income/Expenses 40 64Net Fees and Commissions Income/Expenses 32 44
Fees and commissions received 32 45Fees and commissions paid 1 1
Dividend Income 0 0Trading Profit/Loss (net) -1 -3
Profit/loss on trading account securities 2 11Profit/losses on derivative financial transactions -6 -25Foreign exchange profit/loss 3 10
Other Operating Income 3 6Total Operating Income/Expenses 73 110Provision for Loan Losses or other Receivables (-) 12 4
Specific provisions of banks loans and other receivables* 0 4General provision expenses* 3 1
Other Operating Expenses (-) 41 47Personnel Expenses* 24 23
Net Operating Profit/Loss 20 59Surplus written as gain after merger 0 0Profit/losses from equity method applied subsidiaries 0 0Net monetory position gain/loss 0 0Profit/Loss Before Taxes from Continuing Operations 20 59Provisions for Taxes on Income from Continuing Operations (±) -5 -12Net Profit/Loss from Continuing Operations 15 47Net Profit/Loss Before Taxes from Terminated Operations 0 0Provisions for Taxes on Income from Terminated Operations (±) 0 0Net Profit/Loss from Terminated Operations 0 0
Net Profit/Losses 15 47
* Used from information and disclosures related to income statement".

II-169
The Royal Bank of Scotland N.V. December 2010
Ratios(%)
Dec. 2010 Dec. 2009
Capital Ratios
Shareholders’ Equity / (Amount subject to credit + market + operational risk) 37.6 53.5
Shareholders' Equity / Total Assets 33.4 30.0
(Shareholders' Equity - Permanent Assets) / Total Assets 30.2 27.9
Net On Balance Sheet Position / Total Shareholders' Equity 7.4 -120.4
Net On and Off Balance Sheet Position / Total Shareholders' Equity 2.2 -4.7
Balance-Sheet Ratios
TC Assets / Total Assets 63.7 87.8
TC Liabilities / Total Liabilities 66.2 51.2
FC Assets / FC Liabilities 107.5 25.1
TC Deposits / Total Deposits 37.1 25.4
TC Loans / Total Loans and Receivables 50.0 49.6
Total Deposits / Total Assets 42.6 61.1
Funds Borrowed / Total Assets 13.9 3.0
Assets Quality
Financial Assets (net) / Total Assets 23.5 11.8
Total Loans and Receivables / Total Assets 22.1 15.9
Total Loans and Receivables / Total Deposits 51.7 26.0
Loans Under Follow-up (gross) / Total Loans and Receivables 11.4 14.8
Loans Under Follow-up (net) / Total Loans and Receivables 1.1 1.2
Specific Provisions / Loans Under Follow-up 90.2 91.9
Permanent Assets / Total Assets 3.2 2.2
Consumer Loans / Total Loans and Receivables 0.5 1.0
Liquidity
Liquid Assets / Total Assets 73.9 80.8
Liquid Assets / Short-term Liabilities 129.3 125.3
TC Liquid Assets / Total Assets 48.6 76.6
Profitability
Net Profit/Losses / Total Assets 2.0 5.9
Net Profit/Losses / Total Shareholders' Equity 6.1 19.5
Profit/Losses Before Taxes after Continuing Operations / Total Assets 2.7 7.3
Income-Expenditure Structure
Net Interest Income After Specific Provisions / Total Assets 5.3 7.4
Net Interest Income After Specific Provisions / Total Operating Income (Expenses) 54.1 54.5
Non-interest Income (net) / Total Assets 4.5 5.7
Other Operating Expenses / Total Assets 5.6 5.8
Personnel Expenses / Other Operating Expenses 58.2 50.2
Non-interest Income (net) / Other Operating Expenses 80.4 99.0
Quarterly profitability and income-expenditure ratios, except year-end figures, should be considered periodically.

II-170
Turkland Bank A. .
Assets(USD Million)
Dec. 2010 % Dec. 2009 %TC FC Total Distr. TC FC Total Distr.
Cash and Balances with the Central Bank 31 42 74 7.5 12 36 47 6.2Fin.ass.where fair value cha. is refl.to I/S (Net) 0 0 0 0.0 1 0 1 0.1
Financial assets held for trading 0 0 0 0.0 1 0 1 0.1Public sector debt securities 0 0 0 0.0 1 0 1 0.1Securities representing a share in capital 0 0 0 0.0 0 0 0 0.0Derivative financial assets held for trading 0 0 0 0.0 0 0 0 0.0Other marketable securities 0 0 0 0.0 0 0 0 0.0
Fin.assets clas. as fair value change is refl.to I/S 0 0 0 0.0 0 0 0 0.0Public sector debt securities 0 0 0 0.0 0 0 0 0.0Securities representing a share in capital 0 0 0 0.0 0 0 0 0.0Loans 0 0 0 0.0 0 0 0 0.0Other marketable securities 0 0 0 0.0 0 0 0 0.0
Banks 0 52 52 5.3 0 45 45 5.9Money Market Securities 9 0 9 0.9 52 0 52 6.8
Interbank money market placements 0 0 0 0.0 52 0 52 6.8Istanbul Stock Exc. money market placements 0 0 0 0.0 0 0 0 0.0Receiv. from reverse repurchase agreements 9 0 9 0.9 0 0 0 0.0
Financial Assets Available for Sale (Net) 118 25 143 14.6 93 0 93 12.1Securities representing a share in capital 0 0 0 0.0 0 0 0 0.0Public sector debt securities 118 25 143 14.6 93 0 93 12.1Other marketable securities 0 0 0 0.0 0 0 0 0.0
Loans 520 133 652 66.4 370 115 486 63.1Loans 505 133 638 64.9 366 115 482 62.6
Loans granted to the Banks risk group 0 0 0 0.0 0 0 0 0.0Public sector debt securities 0 0 0 0.0 0 0 0 0.0Other 505 133 638 64.9 366 115 482 62.6
Loans under follow-up 26 0 26 2.7 23 0 23 3.0Specific provisions (-) 11 0 11 1.1 19 0 19 2.4
Factoring Receivables 0 0 0 0.0 0 0 0 0.0Investments held to Maturity (Net) 31 0 31 3.2 26 0 26 3.4
Public sector debt securities 31 0 31 3.2 26 0 26 3.4Other marketable securities 0 0 0 0.0 0 0 0 0.0
Investments and Associates (Net) 0 0 0 0.0 0 0 0 0.0Accounted with equity method 0 0 0 0.0 0 0 0 0.0Non-consolidated investments and associates 0 0 0 0.0 0 0 0 0.0
Financial investments and associates 0 0 0 0.0 0 0 0 0.0Non-financial investments and associates 0 0 0 0.0 0 0 0 0.0
Subsidiaries (Net) 0 0 0 0.0 0 0 0 0.0Financial subsidiaries 0 0 0 0.0 0 0 0 0.0Non-financial subsidiaries 0 0 0 0.0 0 0 0 0.0
Joint Ventures (Business Partners) (Net) 0 0 0 0.0 0 0 0 0.0Accounted with equity method 0 0 0 0.0 0 0 0 0.0Non-consolidated joint ventures 0 0 0 0.0 0 0 0 0.0
Financial joint ventures 0 0 0 0.0 0 0 0 0.0Non-financial joint ventures 0 0 0 0.0 0 0 0 0.0
Recivables From Leasing Transactions 0 0 0 0.0 0 0 0 0.0Finance lease receivables 0 0 0 0.0 0 0 0 0.0Operational leasing receivables 0 0 0 0.0 0 0 0 0.0Others 0 0 0 0.0 0 0 0 0.0Unearned income (-) 0 0 0 0.0 0 0 0 0.0
Derivative Financial Assets Held for Hedging 0 0 0 0.0 0 0 0 0.0Fair value hedges 0 0 0 0.0 0 0 0 0.0Cash flow hedges 0 0 0 0.0 0 0 0 0.0Hedges for invest. made in foreign countries 0 0 0 0.0 0 0 0 0.0
Property and Equipment (Net) 9 0 9 0.9 9 0 9 1.2Intangible Assets (Net) 1 0 1 0.1 1 0 1 0.1
Goodwill 0 0 0 0.0 0 0 0 0.0Other 1 0 1 0.1 1 0 1 0.1
Real Estates for Investment Purpose (Net) 0 0 0 0.0 0 0 0 0.0Assets for Tax 1 0 1 0.1 3 0 3 0.4
Current assets for tax 0 0 0 0.0 1 0 1 0.2Deferred assets for tax 1 0 1 0.1 1 0 1 0.2
Prop.&Equ.for Sale p. and from Term.Op.(Net) 0 0 0 0.0 0 0 0 0.0Other Assets 10 0 10 1.0 6 0 6 0.8
Total Assets 729 253 982 100.0 573 196 770 100.0

II-171
Turkland Bank A. . December 2010
Liabilities(USD Million)
Dec. 2010 % Dec. 2009 %TC FC Total Distr. TC FC Total Distr.
Deposits 429 315 743 75.7 327 239 566 73.6Deposits held by the Banks risk group 7 0 7 0.7 0 0 0 0.1Other 422 314 736 75.0 327 239 566 73.5
Derivative Finan. Liabilities Held for Trading 0 0 0 0.0 0 0 0 0.0Funds Borrowed 10 50 60 6.1 7 26 33 4.3Money Market Takings 0 0 0 0.0 0 0 0 0.0
Interbank money market takings 0 0 0 0.0 0 0 0 0.0Istanbul Stock Exc. money market takings 0 0 0 0.0 0 0 0 0.0Funds provided under repurchase agreements 0 0 0 0.0 0 0 0 0.0
Marketable Securities Issued (Net) 0 0 0 0.0 0 0 0 0.0Bills 0 0 0 0.0 0 0 0 0.0Asset backed securities 0 0 0 0.0 0 0 0 0.0Bonds 0 0 0 0.0 0 0 0 0.0
Funds 0 0 0 0.0 0 0 0 0.0Borrower funds 0 0 0 0.0 0 0 0 0.0Others 0 0 0 0.0 0 0 0 0.0
Miscellaneous Payables 6 0 6 0.6 3 0 3 0.4Other External Resources 15 1 15 1.6 9 0 9 1.2Factoring Payables 0 0 0 0.0 0 0 0 0.0Leasing Transactions Payables (Net) 0 0 0 0.0 0 1 1 0.1
Finance leasing payables 0 0 0 0.0 0 1 1 0.1Operations leasing payables 0 0 0 0.0 0 0 0 0.0Others 0 0 0 0.0 0 0 0 0.0Deferred finance leasing expenses (-) 0 0 0 0.0 0 0 0 0.0
Derivative Finan. Liabilities Held for Hedging 0 0 0 0.0 0 0 0 0.0Fair value hedges 0 0 0 0.0 0 0 0 0.0Cash flow hedges 0 0 0 0.0 0 0 0 0.0Hedges for invest. made in foreign countries 0 0 0 0.0 0 0 0 0.0
Provisions 11 1 12 1.2 11 0 11 1.5General provisions 6 0 6 0.6 4 0 4 0.6Restructuring reserves 0 0 0 0.0 0 0 0 0.0Reserves for employee benefit 2 0 2 0.2 2 0 2 0.2Insurance technical reserves (Net) 0 0 0 0.0 0 0 0 0.0Other provisions 2 1 3 0.3 5 0 5 0.7
Liabilities for Tax 3 0 3 0.3 2 0 2 0.3Current liabilities for tax 3 0 3 0.3 2 0 2 0.3Deferred liabilities for tax 0 0 0 0.0 0 0 0 0.0
Lia.for Pro.&Equ.for Sale p. and from Term.Op.(Net) 0 0 0 0.0 0 0 0 0.0Subordinated Loans 0 0 0 0.0 0 0 0 0.0Shareholders' Equity 142 0 143 14.5 145 0 145 18.8
Paid-in capital 111 0 111 11.3 114 0 114 14.9Supplementary capital 21 0 22 2.2 21 0 21 2.8
Share premium 0 0 0 0.0 0 0 0 0.0Share cancellation profits 0 0 0 0.0 0 0 0 0.0Valuation changes in marketable securities 5 0 5 0.5 4 0 4 0.5Revaluation changes of property and equip. 0 0 0 0.0 0 0 0 0.0Revaluation changes of intangible assets 0 0 0 0.0 0 0 0 0.0Revaluation changes of real est.for inv. pur. 0 0 0 0.0 0 0 0 0.0Free shares from inv.&ass.,subs.& joint vent. 0 0 0 0.0 0 0 0 0.0Hedging funds (active part) 0 0 0 0.0 0 0 0 0.0Val.inc.in pro.& equ.held for sale p.and term.ope. 0 0 0 0.0 0 0 0 0.0Other capital reserves 17 0 17 1.7 17 0 17 2.2
Profit reserves 9 0 9 0.9 8 0 8 1.0Legal reserves 0 0 0 0.0 0 0 0 0.1Status reserves 0 0 0 0.0 0 0 0 0.0Extraordinary reserves 7 0 7 0.7 7 0 7 0.9Other profit reserves 2 0 2 0.2 0 0 0 0.0
Profit or loss 2 0 2 0.2 2 0 2 0.2Prior years income/loss 0 0 0 0.0 0 0 0 0.0Current year income/loss 2 0 2 0.2 2 0 2 0.2
Total Liabilities 616 366 982 100.0 503 266 770 100.0

II-172
Turkland Bank A. .
Off Balance Sheet Commitments(USD Million)
Dec. 2010 Dec. 2009TC FC Total TC FC Total
Guarantees and Warranties 399 236 635 317 160 477Letters of guarantee 399 96 494 317 90 406Bank acceptances 0 11 11 0 6 6Letters of credit 0 70 70 0 49 49Prefinancing given as guarantee 0 0 0 0 0 0Endorsements 0 0 0 0 0 0Other guarantees and warrantees 0 59 59 0 15 15
Commitments 3,081 69 3,150 47 8 55Irrevocable commitments 56 69 125 47 8 55Revocable commitments 3,025 0 3,025 0 0 0
Derivative Financial Instruments 0 0 0 0 9 9Derivative finan. instruments held for hedging 0 0 0 0 0 0Trading transactions 0 0 0 0 9 9
Custody and Pledged Securities 3,109 619 3,728 2,162 612 2,774Items held in Custody 194 26 220 154 17 172Pledged Items 2,915 593 3,508 2,008 594 2,602Acccepted independent guaran. and warran. 0 0 0 0 0 0
Total Off Balance Sheet Commitments 6,590 924 7,513 2,526 789 3,316
Income-Expenditure(USD Million)
Dec. 2010 Dec. 2009
Interest Income 75 84Interest on loans 60 66Interest received from reserve deposits 1 1Interest received from banks 0 0Interest received from money market transactions 1 3Interest received from marketable securities portfolio 14 14Other interest income 0 0
Interest Expenses 41 41Interest on deposits 37 35Interest on money market transactions 2 6Interest on funds borrowed 0 0Interest on securities issued 0 0Other interest expenses 2 0
Net Interest Income/Expenses 34 43Net Fees and Commissions Income/Expenses 11 9
Fees and commissions received 11 9Fees and commissions paid 1 1
Dividend Income 0 0Trading Profit/Loss (net) 5 7
Profit/loss on trading account securities 6 6Profit/losses on derivative financial transactions -7 -2Foreign exchange profit/loss 7 3
Other Operating Income 19 1Total Operating Income/Expenses 70 60Provision for Loan Losses or other Receivables (-) 11 15
Specific provisions of banks loans and other receivables* 5 11General provision expenses* 4 1
Other Operating Expenses (-) 56 43Personnel Expenses* 26 23
Net Operating Profit/Loss 3 2Surplus written as gain after merger 0 0Profit/losses from equity method applied subsidiaries 0 0Net monetory position gain/loss 0 0Profit/Loss Before Taxes from Continuing Operations 3 2Provisions for Taxes on Income from Continuing Operations (±) -1 0Net Profit/Loss from Continuing Operations 2 2Net Profit/Loss Before Taxes from Terminated Operations 0 0Provisions for Taxes on Income from Terminated Operations (±) 0 0Net Profit/Loss from Terminated Operations 0 0
Net Profit/Losses 2 2
* Used from information and disclosures related to income statement".

II-173
Turkland Bank A. . December 2010
Ratios(%)
Dec. 2010 Dec. 2009
Capital Ratios
Shareholders’ Equity / (Amount subject to credit + market + operational risk) 14.0 19.3
Shareholders' Equity / Total Assets 14.5 18.8
(Shareholders' Equity - Permanent Assets) / Total Assets 12.0 17.0
Net On Balance Sheet Position / Total Shareholders' Equity 0.0 0.1
Net On and Off Balance Sheet Position / Total Shareholders' Equity -0.2 0.1
Balance-Sheet Ratios
TC Assets / Total Assets 74.3 74.5
TC Liabilities / Total Liabilities 62.7 65.4
FC Assets / FC Liabilities 69.0 73.8
TC Deposits / Total Deposits 57.7 57.8
TC Loans / Total Loans and Receivables 79.7 76.3
Total Deposits / Total Assets 75.7 73.6
Funds Borrowed / Total Assets 6.1 4.3
Assets Quality
Financial Assets (net) / Total Assets 17.8 15.6
Total Loans and Receivables / Total Assets 66.4 63.1
Total Loans and Receivables / Total Deposits 87.8 85.8
Loans Under Follow-up (gross) / Total Loans and Receivables 4.0 4.7
Loans Under Follow-up (net) / Total Loans and Receivables 2.3 0.8
Specific Provisions / Loans Under Follow-up 42.7 82.3
Permanent Assets / Total Assets 2.5 1.8
Consumer Loans / Total Loans and Receivables 1.7 1.2
Liquidity
Liquid Assets / Total Assets 28.3 31.0
Liquid Assets / Short-term Liabilities 45.7 53.5
TC Liquid Assets / Total Assets 16.2 20.4
Profitability
Net Profit/Losses / Total Assets 0.2 0.2
Net Profit/Losses / Total Shareholders' Equity 1.1 1.1
Profit/Losses Before Taxes after Continuing Operations / Total Assets 0.3 0.3
Income-Expenditure Structure
Net Interest Income After Specific Provisions / Total Assets 2.9 4.2
Net Interest Income After Specific Provisions / Total Operating Income (Expenses) 41.5 53.3
Non-interest Income (net) / Total Assets 3.6 2.2
Other Operating Expenses / Total Assets 5.7 5.6
Personnel Expenses / Other Operating Expenses 46.5 52.9
Non-interest Income (net) / Other Operating Expenses 63.5 39.3
Quarterly profitability and income-expenditure ratios, except year-end figures, should be considered periodically.

II-174
WestLB AG
Assets(USD Million)
Dec. 2010 % Dec. 2009 %TC FC Total Distr. TC FC Total Distr.
Cash and Balances with the Central Bank 11 13 24 3.1 2 9 11 2.9Fin.ass.where fair value cha. is refl.to I/S (Net) 221 0 221 28.5 119 0 119 31.8
Financial assets held for trading 221 0 221 28.5 119 0 119 31.8Public sector debt securities 221 0 221 28.5 117 0 117 31.3Securities representing a share in capital 0 0 0 0.0 0 0 0 0.0Derivative financial assets held for trading 0 0 0 0.0 2 0 2 0.6Other marketable securities 0 0 0 0.0 0 0 0 0.0
Fin.assets clas. as fair value change is refl.to I/S 0 0 0 0.0 0 0 0 0.0Public sector debt securities 0 0 0 0.0 0 0 0 0.0Securities representing a share in capital 0 0 0 0.0 0 0 0 0.0Loans 0 0 0 0.0 0 0 0 0.0Other marketable securities 0 0 0 0.0 0 0 0 0.0
Banks 0 25 25 3.3 27 43 70 18.7Money Market Securities 463 0 463 59.6 141 0 141 37.8
Interbank money market placements 0 0 0 0.0 141 0 141 37.8Istanbul Stock Exc. money market placements 0 0 0 0.0 0 0 0 0.0Receiv. from reverse repurchase agreements 463 0 463 59.6 0 0 0 0.0
Financial Assets Available for Sale (Net) 0 0 0 0.0 0 0 0 0.0Securities representing a share in capital 0 0 0 0.0 0 0 0 0.0Public sector debt securities 0 0 0 0.0 0 0 0 0.0Other marketable securities 0 0 0 0.0 0 0 0 0.0
Loans 12 21 33 4.2 1 23 24 6.4Loans 12 21 33 4.2 1 23 24 6.4
Loans granted to the Banks risk group 0 0 0 0.0 0 0 0 0.1Public sector debt securities 0 0 0 0.0 0 0 0 0.0Other 11 21 32 4.2 1 23 24 6.3
Loans under follow-up 0 0 0 0.0 0 0 0 0.0Specific provisions (-) 0 0 0 0.0 0 0 0 0.0
Factoring Receivables 0 0 0 0.0 0 0 0 0.0Investments held to Maturity (Net) 0 0 0 0.0 0 0 0 0.0
Public sector debt securities 0 0 0 0.0 0 0 0 0.0Other marketable securities 0 0 0 0.0 0 0 0 0.0
Investments and Associates (Net) 0 0 0 0.0 0 0 0 0.0Accounted with equity method 0 0 0 0.0 0 0 0 0.0Non-consolidated investments and associates 0 0 0 0.0 0 0 0 0.0
Financial investments and associates 0 0 0 0.0 0 0 0 0.0Non-financial investments and associates 0 0 0 0.0 0 0 0 0.0
Subsidiaries (Net) 0 0 0 0.0 0 0 0 0.0Financial subsidiaries 0 0 0 0.0 0 0 0 0.0Non-financial subsidiaries 0 0 0 0.0 0 0 0 0.0
Joint Ventures (Business Partners) (Net) 0 0 0 0.0 0 0 0 0.0Accounted with equity method 0 0 0 0.0 0 0 0 0.0Non-consolidated joint ventures 0 0 0 0.0 0 0 0 0.0
Financial joint ventures 0 0 0 0.0 0 0 0 0.0Non-financial joint ventures 0 0 0 0.0 0 0 0 0.0
Recivables From Leasing Transactions 0 0 0 0.0 0 0 0 0.0Finance lease receivables 0 0 0 0.0 0 0 0 0.0Operational leasing receivables 0 0 0 0.0 0 0 0 0.0Others 0 0 0 0.0 0 0 0 0.0Unearned income (-) 0 0 0 0.0 0 0 0 0.0
Derivative Financial Assets Held for Hedging 0 0 0 0.0 0 0 0 0.0Fair value hedges 0 0 0 0.0 0 0 0 0.0Cash flow hedges 0 0 0 0.0 0 0 0 0.0Hedges for invest. made in foreign countries 0 0 0 0.0 0 0 0 0.0
Property and Equipment (Net) 0 0 0 0.0 0 0 0 0.1Intangible Assets (Net) 0 0 0 0.0 0 0 0 0.0
Goodwill 0 0 0 0.0 0 0 0 0.0Other 0 0 0 0.0 0 0 0 0.0
Real Estates for Investment Purpose (Net) 0 0 0 0.0 0 0 0 0.0Assets for Tax 0 0 0 0.0 0 0 0 0.0
Current assets for tax 0 0 0 0.0 0 0 0 0.0Deferred assets for tax 0 0 0 0.0 0 0 0 0.0
Prop.&Equ.for Sale p. and from Term.Op.(Net) 0 0 0 0.0 0 0 0 0.0Other Assets 0 10 10 1.3 0 8 8 2.2
Total Assets 708 69 777 100.0 290 84 374 100.0
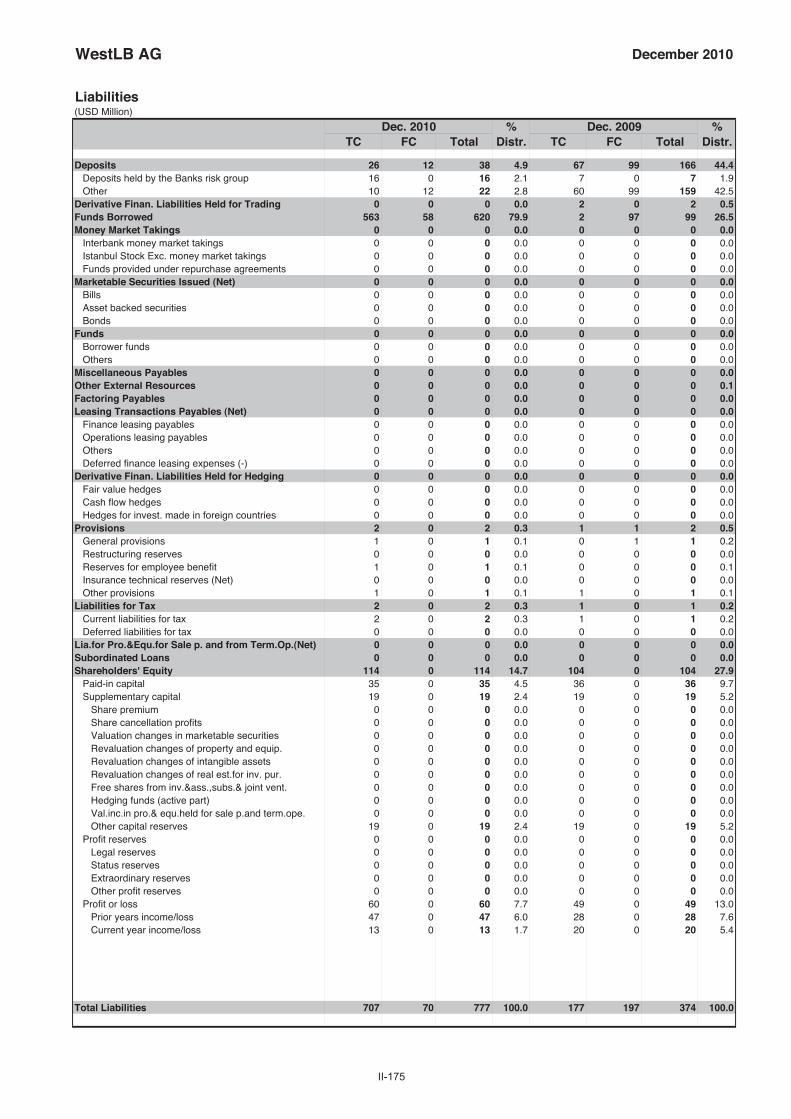
II-175
WestLB AG December 2010
Liabilities(USD Million)
Dec. 2010 % Dec. 2009 %TC FC Total Distr. TC FC Total Distr.
Deposits 26 12 38 4.9 67 99 166 44.4Deposits held by the Banks risk group 16 0 16 2.1 7 0 7 1.9Other 10 12 22 2.8 60 99 159 42.5
Derivative Finan. Liabilities Held for Trading 0 0 0 0.0 2 0 2 0.5Funds Borrowed 563 58 620 79.9 2 97 99 26.5Money Market Takings 0 0 0 0.0 0 0 0 0.0
Interbank money market takings 0 0 0 0.0 0 0 0 0.0Istanbul Stock Exc. money market takings 0 0 0 0.0 0 0 0 0.0Funds provided under repurchase agreements 0 0 0 0.0 0 0 0 0.0
Marketable Securities Issued (Net) 0 0 0 0.0 0 0 0 0.0Bills 0 0 0 0.0 0 0 0 0.0Asset backed securities 0 0 0 0.0 0 0 0 0.0Bonds 0 0 0 0.0 0 0 0 0.0
Funds 0 0 0 0.0 0 0 0 0.0Borrower funds 0 0 0 0.0 0 0 0 0.0Others 0 0 0 0.0 0 0 0 0.0
Miscellaneous Payables 0 0 0 0.0 0 0 0 0.0Other External Resources 0 0 0 0.0 0 0 0 0.1Factoring Payables 0 0 0 0.0 0 0 0 0.0Leasing Transactions Payables (Net) 0 0 0 0.0 0 0 0 0.0
Finance leasing payables 0 0 0 0.0 0 0 0 0.0Operations leasing payables 0 0 0 0.0 0 0 0 0.0Others 0 0 0 0.0 0 0 0 0.0Deferred finance leasing expenses (-) 0 0 0 0.0 0 0 0 0.0
Derivative Finan. Liabilities Held for Hedging 0 0 0 0.0 0 0 0 0.0Fair value hedges 0 0 0 0.0 0 0 0 0.0Cash flow hedges 0 0 0 0.0 0 0 0 0.0Hedges for invest. made in foreign countries 0 0 0 0.0 0 0 0 0.0
Provisions 2 0 2 0.3 1 1 2 0.5General provisions 1 0 1 0.1 0 1 1 0.2Restructuring reserves 0 0 0 0.0 0 0 0 0.0Reserves for employee benefit 1 0 1 0.1 0 0 0 0.1Insurance technical reserves (Net) 0 0 0 0.0 0 0 0 0.0Other provisions 1 0 1 0.1 1 0 1 0.1
Liabilities for Tax 2 0 2 0.3 1 0 1 0.2Current liabilities for tax 2 0 2 0.3 1 0 1 0.2Deferred liabilities for tax 0 0 0 0.0 0 0 0 0.0
Lia.for Pro.&Equ.for Sale p. and from Term.Op.(Net) 0 0 0 0.0 0 0 0 0.0Subordinated Loans 0 0 0 0.0 0 0 0 0.0Shareholders' Equity 114 0 114 14.7 104 0 104 27.9
Paid-in capital 35 0 35 4.5 36 0 36 9.7Supplementary capital 19 0 19 2.4 19 0 19 5.2
Share premium 0 0 0 0.0 0 0 0 0.0Share cancellation profits 0 0 0 0.0 0 0 0 0.0Valuation changes in marketable securities 0 0 0 0.0 0 0 0 0.0Revaluation changes of property and equip. 0 0 0 0.0 0 0 0 0.0Revaluation changes of intangible assets 0 0 0 0.0 0 0 0 0.0Revaluation changes of real est.for inv. pur. 0 0 0 0.0 0 0 0 0.0Free shares from inv.&ass.,subs.& joint vent. 0 0 0 0.0 0 0 0 0.0Hedging funds (active part) 0 0 0 0.0 0 0 0 0.0Val.inc.in pro.& equ.held for sale p.and term.ope. 0 0 0 0.0 0 0 0 0.0Other capital reserves 19 0 19 2.4 19 0 19 5.2
Profit reserves 0 0 0 0.0 0 0 0 0.0Legal reserves 0 0 0 0.0 0 0 0 0.0Status reserves 0 0 0 0.0 0 0 0 0.0Extraordinary reserves 0 0 0 0.0 0 0 0 0.0Other profit reserves 0 0 0 0.0 0 0 0 0.0
Profit or loss 60 0 60 7.7 49 0 49 13.0Prior years income/loss 47 0 47 6.0 28 0 28 7.6Current year income/loss 13 0 13 1.7 20 0 20 5.4
Total Liabilities 707 70 777 100.0 177 197 374 100.0
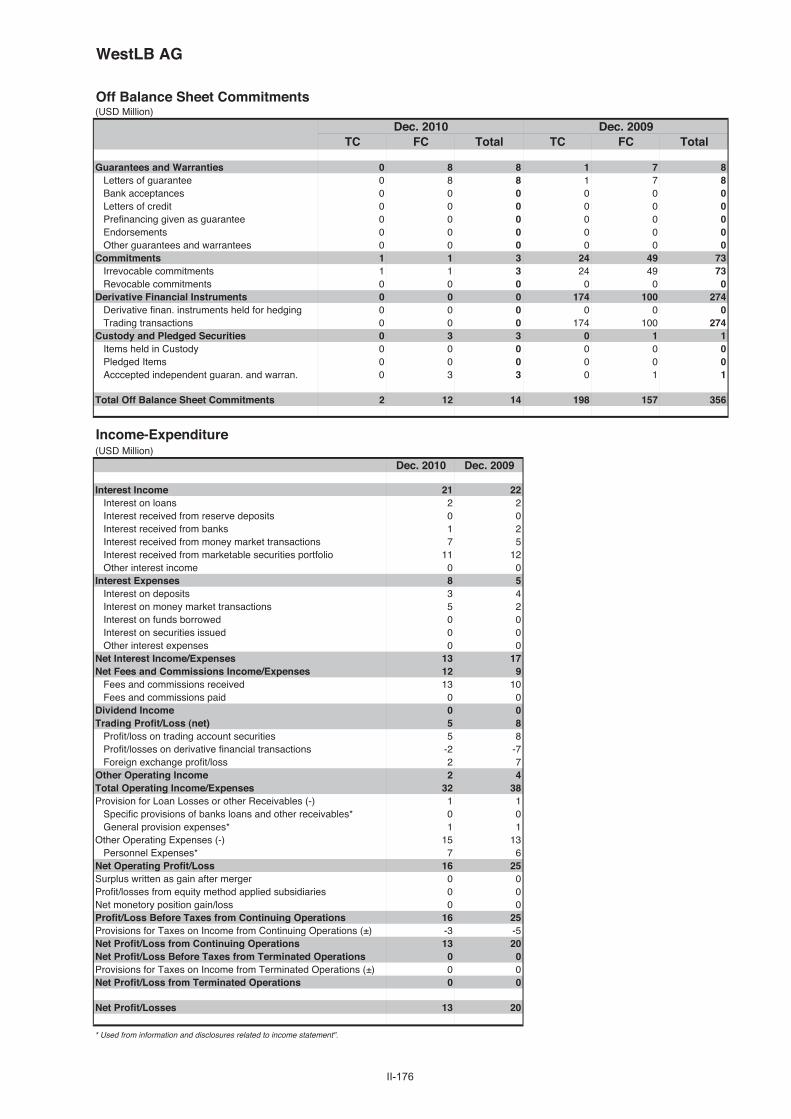
II-176
WestLB AG
Off Balance Sheet Commitments(USD Million)
Dec. 2010 Dec. 2009TC FC Total TC FC Total
Guarantees and Warranties 0 8 8 1 7 8Letters of guarantee 0 8 8 1 7 8Bank acceptances 0 0 0 0 0 0Letters of credit 0 0 0 0 0 0Prefinancing given as guarantee 0 0 0 0 0 0Endorsements 0 0 0 0 0 0Other guarantees and warrantees 0 0 0 0 0 0
Commitments 1 1 3 24 49 73Irrevocable commitments 1 1 3 24 49 73Revocable commitments 0 0 0 0 0 0
Derivative Financial Instruments 0 0 0 174 100 274Derivative finan. instruments held for hedging 0 0 0 0 0 0Trading transactions 0 0 0 174 100 274
Custody and Pledged Securities 0 3 3 0 1 1Items held in Custody 0 0 0 0 0 0Pledged Items 0 0 0 0 0 0Acccepted independent guaran. and warran. 0 3 3 0 1 1
Total Off Balance Sheet Commitments 2 12 14 198 157 356
Income-Expenditure(USD Million)
Dec. 2010 Dec. 2009
Interest Income 21 22Interest on loans 2 2Interest received from reserve deposits 0 0Interest received from banks 1 2Interest received from money market transactions 7 5Interest received from marketable securities portfolio 11 12Other interest income 0 0
Interest Expenses 8 5Interest on deposits 3 4Interest on money market transactions 5 2Interest on funds borrowed 0 0Interest on securities issued 0 0Other interest expenses 0 0
Net Interest Income/Expenses 13 17Net Fees and Commissions Income/Expenses 12 9
Fees and commissions received 13 10Fees and commissions paid 0 0
Dividend Income 0 0Trading Profit/Loss (net) 5 8
Profit/loss on trading account securities 5 8Profit/losses on derivative financial transactions -2 -7Foreign exchange profit/loss 2 7
Other Operating Income 2 4Total Operating Income/Expenses 32 38Provision for Loan Losses or other Receivables (-) 1 1
Specific provisions of banks loans and other receivables* 0 0General provision expenses* 1 1
Other Operating Expenses (-) 15 13Personnel Expenses* 7 6
Net Operating Profit/Loss 16 25Surplus written as gain after merger 0 0Profit/losses from equity method applied subsidiaries 0 0Net monetory position gain/loss 0 0Profit/Loss Before Taxes from Continuing Operations 16 25Provisions for Taxes on Income from Continuing Operations (±) -3 -5Net Profit/Loss from Continuing Operations 13 20Net Profit/Loss Before Taxes from Terminated Operations 0 0Provisions for Taxes on Income from Terminated Operations (±) 0 0Net Profit/Loss from Terminated Operations 0 0
Net Profit/Losses 13 20
* Used from information and disclosures related to income statement".

II-177
WestLB AG December 2010
Ratios(%)
Dec. 2010 Dec. 2009
Capital Ratios
Shareholders’ Equity / (Amount subject to credit + market + operational risk) 72.7 84.1
Shareholders' Equity / Total Assets 14.7 27.9
(Shareholders' Equity - Permanent Assets) / Total Assets 14.6 27.8
Net On Balance Sheet Position / Total Shareholders' Equity -0.3 -108.0
Net On and Off Balance Sheet Position / Total Shareholders' Equity -0.3 -18.8
Balance-Sheet Ratios
TC Assets / Total Assets 91.1 77.7
TC Liabilities / Total Liabilities 91.1 47.3
FC Assets / FC Liabilities 99.6 42.4
TC Deposits / Total Deposits 69.0 40.6
TC Loans / Total Loans and Receivables 35.7 3.6
Total Deposits / Total Assets 4.9 44.4
Funds Borrowed / Total Assets 79.9 26.5
Assets Quality
Financial Assets (net) / Total Assets 28.5 31.8
Total Loans and Receivables / Total Assets 4.2 6.4
Total Loans and Receivables / Total Deposits 85.7 14.4
Loans Under Follow-up (gross) / Total Loans and Receivables 0.0 0.0
Loans Under Follow-up (net) / Total Loans and Receivables 0.0 0.0
Specific Provisions / Loans Under Follow-up - -
Permanent Assets / Total Assets 0.0 0.1
Consumer Loans / Total Loans and Receivables 3.1 3.6
Liquidity
Liquid Assets / Total Assets 94.4 91.3
Liquid Assets / Short-term Liabilities 115.2 138.0
TC Liquid Assets / Total Assets 89.5 77.2
Profitability
Net Profit/Losses / Total Assets 1.7 5.4
Net Profit/Losses / Total Shareholders' Equity 11.4 19.2
Profit/Losses Before Taxes after Continuing Operations / Total Assets 2.1 6.6
Income-Expenditure Structure
Net Interest Income After Specific Provisions / Total Assets 1.7 4.5
Net Interest Income After Specific Provisions / Total Operating Income (Expenses) 41.3 43.8
Non-interest Income (net) / Total Assets 2.4 5.8
Other Operating Expenses / Total Assets 1.9 3.5
Personnel Expenses / Other Operating Expenses 48.4 47.9
Non-interest Income (net) / Other Operating Expenses 123.8 166.9
Quarterly profitability and income-expenditure ratios, except year-end figures, should be considered periodically.


II-179

II-180
Aktif Yatırım Bankası A. .
Assets(USD Million)
Dec. 2010 % Dec. 2009 %TC FC Total Distr. TC FC Total Distr.
Cash and Balances with the Central Bank 28 65 93 9.7 3 9 12 3.1Fin.ass.where fair value cha. is refl.to I/S (Net) 0 0 0 0.0 1 0 1 0.2
Financial assets held for trading 0 0 0 0.0 1 0 1 0.2Public sector debt securities 0 0 0 0.0 1 0 1 0.2Securities representing a share in capital 0 0 0 0.0 0 0 0 0.0Derivative financial assets held for trading 0 0 0 0.0 0 0 0 0.0Other marketable securities 0 0 0 0.0 0 0 0 0.0
Fin.assets clas. as fair value change is refl.to I/S 0 0 0 0.0 0 0 0 0.0Public sector debt securities 0 0 0 0.0 0 0 0 0.0Securities representing a share in capital 0 0 0 0.0 0 0 0 0.0Loans 0 0 0 0.0 0 0 0 0.0Other marketable securities 0 0 0 0.0 0 0 0 0.0
Banks 0 119 119 12.4 4 39 43 11.2Money Market Securities 0 0 0 0.0 18 0 18 4.6
Interbank money market placements 0 0 0 0.0 18 0 18 4.6Istanbul Stock Exc. money market placements 0 0 0 0.0 0 0 0 0.0Receiv. from reverse repurchase agreements 0 0 0 0.0 0 0 0 0.0
Financial Assets Available for Sale (Net) 228 34 262 27.2 71 11 82 21.1Securities representing a share in capital 0 0 0 0.0 0 0 0 0.0Public sector debt securities 228 0 228 23.7 71 0 71 18.4Other marketable securities 0 34 34 3.5 0 11 11 2.7
Loans 414 55 469 48.8 161 39 200 51.5Loans 414 55 469 48.8 161 39 200 51.5
Loans granted to the Banks risk group 194 31 225 23.3 103 23 126 32.4Public sector debt securities 0 0 0 0.0 0 0 0 0.0Other 221 24 245 25.4 58 16 74 19.0
Loans under follow-up 4 0 4 0.4 1 0 1 0.3Specific provisions (-) 4 0 4 0.4 1 0 1 0.3
Factoring Receivables 1 0 1 0.1 1 0 1 0.2Investments held to Maturity (Net) 0 2 2 0.2 0 2 2 0.4
Public sector debt securities 0 0 0 0.0 0 0 0 0.0Other marketable securities 0 2 2 0.2 0 2 2 0.4
Investments and Associates (Net) 0 0 0 0.0 11 0 11 2.8Accounted with equity method 0 0 0 0.0 0 0 0 0.0Non-consolidated investments and associates 0 0 0 0.0 11 0 11 2.8
Financial investments and associates 0 0 0 0.0 11 0 11 2.8Non-financial investments and associates 0 0 0 0.0 0 0 0 0.0
Subsidiaries (Net) 0 0 0 0.0 6 0 6 1.5Financial subsidiaries 0 0 0 0.0 0 0 0 0.0Non-financial subsidiaries 0 0 0 0.0 6 0 6 1.5
Joint Ventures (Business Partners) (Net) 0 0 0 0.0 0 0 0 0.0Accounted with equity method 0 0 0 0.0 0 0 0 0.0Non-consolidated joint ventures 0 0 0 0.0 0 0 0 0.0
Financial joint ventures 0 0 0 0.0 0 0 0 0.0Non-financial joint ventures 0 0 0 0.0 0 0 0 0.0
Recivables From Leasing Transactions 0 2 2 0.3 0 5 5 1.3Finance lease receivables 0 3 3 0.3 0 6 6 1.4Operational leasing receivables 0 0 0 0.0 0 0 0 0.0Others 0 0 0 0.0 0 0 0 0.0Unearned income (-) 0 0 0 0.0 0 1 1 0.2
Derivative Financial Assets Held for Hedging 0 0 0 0.0 0 0 0 0.0Fair value hedges 0 0 0 0.0 0 0 0 0.0Cash flow hedges 0 0 0 0.0 0 0 0 0.0Hedges for invest. made in foreign countries 0 0 0 0.0 0 0 0 0.0
Property and Equipment (Net) 3 0 3 0.3 3 0 3 0.7Intangible Assets (Net) 8 0 8 0.9 5 0 5 1.4
Goodwill 0 0 0 0.0 0 0 0 0.0Other 8 0 8 0.9 5 0 5 1.4
Real Estates for Investment Purpose (Net) 0 0 0 0.0 0 0 0 0.0Assets for Tax 0 0 0 0.0 0 0 0 0.0
Current assets for tax 0 0 0 0.0 0 0 0 0.0Deferred assets for tax 0 0 0 0.0 0 0 0 0.0
Prop.&Equ.for Sale p. and from Term.Op.(Net) 0 0 0 0.0 0 0 0 0.0Other Assets 2 0 2 0.2 1 0 1 0.2
Total Assets 685 277 962 100.0 284 105 389 100.0
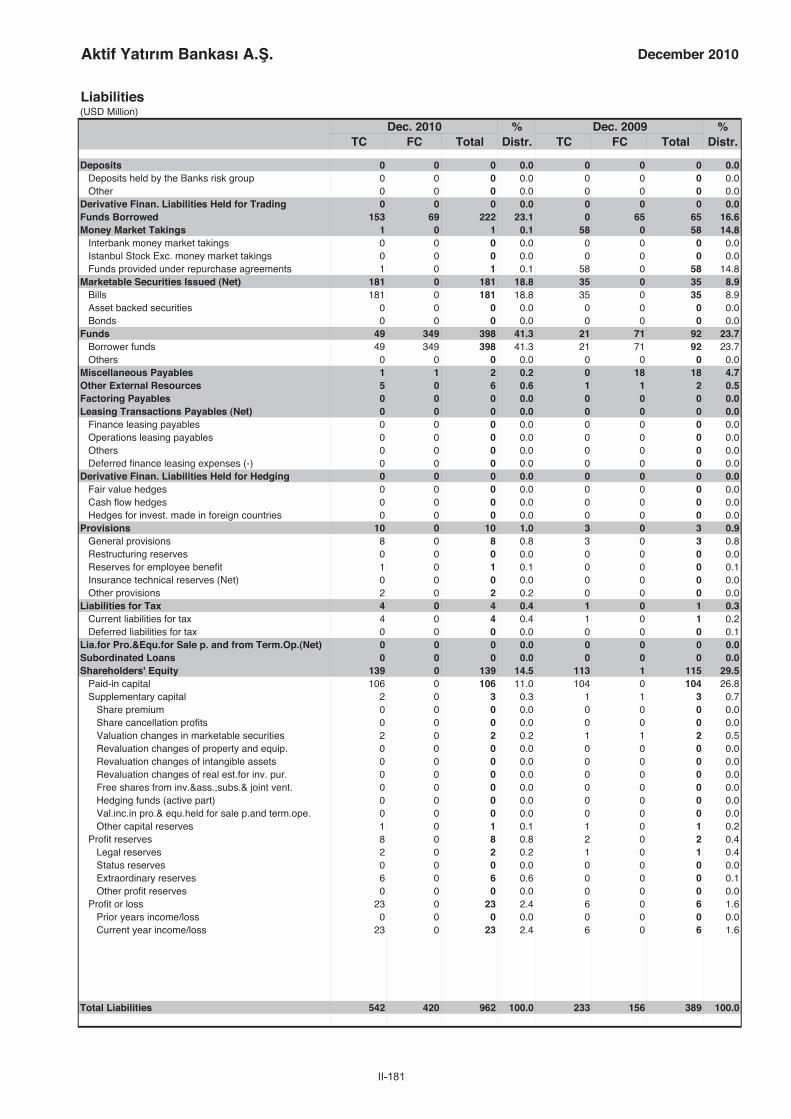
II-181
Aktif Yatırım Bankası A. . December 2010
Liabilities(USD Million)
Dec. 2010 % Dec. 2009 %TC FC Total Distr. TC FC Total Distr.
Deposits 0 0 0 0.0 0 0 0 0.0Deposits held by the Banks risk group 0 0 0 0.0 0 0 0 0.0Other 0 0 0 0.0 0 0 0 0.0
Derivative Finan. Liabilities Held for Trading 0 0 0 0.0 0 0 0 0.0Funds Borrowed 153 69 222 23.1 0 65 65 16.6Money Market Takings 1 0 1 0.1 58 0 58 14.8
Interbank money market takings 0 0 0 0.0 0 0 0 0.0Istanbul Stock Exc. money market takings 0 0 0 0.0 0 0 0 0.0Funds provided under repurchase agreements 1 0 1 0.1 58 0 58 14.8
Marketable Securities Issued (Net) 181 0 181 18.8 35 0 35 8.9Bills 181 0 181 18.8 35 0 35 8.9Asset backed securities 0 0 0 0.0 0 0 0 0.0Bonds 0 0 0 0.0 0 0 0 0.0
Funds 49 349 398 41.3 21 71 92 23.7Borrower funds 49 349 398 41.3 21 71 92 23.7Others 0 0 0 0.0 0 0 0 0.0
Miscellaneous Payables 1 1 2 0.2 0 18 18 4.7Other External Resources 5 0 6 0.6 1 1 2 0.5Factoring Payables 0 0 0 0.0 0 0 0 0.0Leasing Transactions Payables (Net) 0 0 0 0.0 0 0 0 0.0
Finance leasing payables 0 0 0 0.0 0 0 0 0.0Operations leasing payables 0 0 0 0.0 0 0 0 0.0Others 0 0 0 0.0 0 0 0 0.0Deferred finance leasing expenses (-) 0 0 0 0.0 0 0 0 0.0
Derivative Finan. Liabilities Held for Hedging 0 0 0 0.0 0 0 0 0.0Fair value hedges 0 0 0 0.0 0 0 0 0.0Cash flow hedges 0 0 0 0.0 0 0 0 0.0Hedges for invest. made in foreign countries 0 0 0 0.0 0 0 0 0.0
Provisions 10 0 10 1.0 3 0 3 0.9General provisions 8 0 8 0.8 3 0 3 0.8Restructuring reserves 0 0 0 0.0 0 0 0 0.0Reserves for employee benefit 1 0 1 0.1 0 0 0 0.1Insurance technical reserves (Net) 0 0 0 0.0 0 0 0 0.0Other provisions 2 0 2 0.2 0 0 0 0.0
Liabilities for Tax 4 0 4 0.4 1 0 1 0.3Current liabilities for tax 4 0 4 0.4 1 0 1 0.2Deferred liabilities for tax 0 0 0 0.0 0 0 0 0.1
Lia.for Pro.&Equ.for Sale p. and from Term.Op.(Net) 0 0 0 0.0 0 0 0 0.0Subordinated Loans 0 0 0 0.0 0 0 0 0.0Shareholders' Equity 139 0 139 14.5 113 1 115 29.5
Paid-in capital 106 0 106 11.0 104 0 104 26.8Supplementary capital 2 0 3 0.3 1 1 3 0.7
Share premium 0 0 0 0.0 0 0 0 0.0Share cancellation profits 0 0 0 0.0 0 0 0 0.0Valuation changes in marketable securities 2 0 2 0.2 1 1 2 0.5Revaluation changes of property and equip. 0 0 0 0.0 0 0 0 0.0Revaluation changes of intangible assets 0 0 0 0.0 0 0 0 0.0Revaluation changes of real est.for inv. pur. 0 0 0 0.0 0 0 0 0.0Free shares from inv.&ass.,subs.& joint vent. 0 0 0 0.0 0 0 0 0.0Hedging funds (active part) 0 0 0 0.0 0 0 0 0.0Val.inc.in pro.& equ.held for sale p.and term.ope. 0 0 0 0.0 0 0 0 0.0Other capital reserves 1 0 1 0.1 1 0 1 0.2
Profit reserves 8 0 8 0.8 2 0 2 0.4Legal reserves 2 0 2 0.2 1 0 1 0.4Status reserves 0 0 0 0.0 0 0 0 0.0Extraordinary reserves 6 0 6 0.6 0 0 0 0.1Other profit reserves 0 0 0 0.0 0 0 0 0.0
Profit or loss 23 0 23 2.4 6 0 6 1.6Prior years income/loss 0 0 0 0.0 0 0 0 0.0Current year income/loss 23 0 23 2.4 6 0 6 1.6
Total Liabilities 542 420 962 100.0 233 156 389 100.0

II-182
Aktif Yatırım Bankası A. .
Off Balance Sheet Commitments(USD Million)
Dec. 2010 Dec. 2009TC FC Total TC FC Total
Guarantees and Warranties 220 657 878 100 235 335Letters of guarantee 213 523 736 93 161 254Bank acceptances 0 4 4 0 15 15Letters of credit 0 117 117 0 35 35Prefinancing given as guarantee 0 0 0 0 0 0Endorsements 0 0 0 0 0 0Other guarantees and warrantees 7 13 20 8 23 31
Commitments 868 1,648 2,516 49 21 70Irrevocable commitments 190 15 205 49 21 70Revocable commitments 678 1,633 2,311 0 0 0
Derivative Financial Instruments 0 94 94 4 7 11Derivative finan. instruments held for hedging 0 0 0 0 0 0Trading transactions 0 94 94 4 7 11
Custody and Pledged Securities 3,735 371 4,106 60 66 126Items held in Custody 3,384 4 3,388 11 5 17Pledged Items 351 367 718 48 61 109Acccepted independent guaran. and warran. 0 0 0 0 0 0
Total Off Balance Sheet Commitments 4,824 2,771 7,594 214 329 542
Income-Expenditure(USD Million)
Dec. 2010 Dec. 2009
Interest Income 46 27Interest on loans 34 22Interest received from reserve deposits 0 0Interest received from banks 1 0Interest received from money market transactions 0 0Interest received from marketable securities portfolio 10 5Other interest income 1 0
Interest Expenses 21 5Interest on deposits 0 0Interest on money market transactions 7 3Interest on funds borrowed 1 1Interest on securities issued 9 0Other interest expenses 3 2
Net Interest Income/Expenses 25 22Net Fees and Commissions Income/Expenses 18 4
Fees and commissions received 20 4Fees and commissions paid 1 0
Dividend Income 0 3Trading Profit/Loss (net) 4 4
Profit/loss on trading account securities 3 3Profit/losses on derivative financial transactions -3 3Foreign exchange profit/loss 5 -3
Other Operating Income 22 0Total Operating Income/Expenses 70 32Provision for Loan Losses or other Receivables (-) 9 3
Specific provisions of banks loans and other receivables* 2 1General provision expenses* 5 2
Other Operating Expenses (-) 36 21Personnel Expenses* 17 12
Net Operating Profit/Loss 25 8Surplus written as gain after merger 0 0Profit/losses from equity method applied subsidiaries 0 0Net monetory position gain/loss 0 0Profit/Loss Before Taxes from Continuing Operations 25 8Provisions for Taxes on Income from Continuing Operations (±) -3 -2Net Profit/Loss from Continuing Operations 23 6Net Profit/Loss Before Taxes from Terminated Operations 0 0Provisions for Taxes on Income from Terminated Operations (±) 0 0Net Profit/Loss from Terminated Operations 0 0
Net Profit/Losses 23 6
* Used from information and disclosures related to income statement".

II-183
Aktif Yatırım Bankası A. . December 2010
Ratios(%)
Dec. 2010 Dec. 2009
Capital Ratios
Shareholders’ Equity / (Amount subject to credit + market + operational risk) 12.6 21.3
Shareholders' Equity / Total Assets 14.5 29.5
(Shareholders' Equity - Permanent Assets) / Total Assets 13.3 23.2
Net On Balance Sheet Position / Total Shareholders' Equity -3.0 4.7
Net On and Off Balance Sheet Position / Total Shareholders' Equity -0.9 4.6
Balance-Sheet Ratios
TC Assets / Total Assets 71.2 73.1
TC Liabilities / Total Liabilities 56.4 59.9
FC Assets / FC Liabilities 66.1 67.1
TC Deposits / Total Deposits - -
TC Loans / Total Loans and Receivables 88.2 80.5
Total Deposits / Total Assets 0.0 0.0
Funds Borrowed / Total Assets 23.1 16.6
Assets Quality
Financial Assets (net) / Total Assets 27.4 21.7
Total Loans and Receivables / Total Assets 48.8 51.5
Total Loans and Receivables / Total Deposits - -
Loans Under Follow-up (gross) / Total Loans and Receivables 0.8 0.6
Loans Under Follow-up (net) / Total Loans and Receivables 0.0 0.0
Specific Provisions / Loans Under Follow-up 100.0 100.0
Permanent Assets / Total Assets 1.2 6.3
Consumer Loans / Total Loans and Receivables 13.5 0.2
Liquidity
Liquid Assets / Total Assets 49.3 40.1
Liquid Assets / Short-term Liabilities 87.7 102.6
TC Liquid Assets / Total Assets 26.6 24.9
Profitability
Net Profit/Losses / Total Assets 2.4 1.6
Net Profit/Losses / Total Shareholders' Equity 16.4 5.5
Profit/Losses Before Taxes after Continuing Operations / Total Assets 2.6 2.0
Income-Expenditure Structure
Net Interest Income After Specific Provisions / Total Assets 2.3 5.4
Net Interest Income After Specific Provisions / Total Operating Income (Expenses) 31.9 66.3
Non-interest Income (net) / Total Assets 4.7 2.5
Other Operating Expenses / Total Assets 3.7 5.4
Personnel Expenses / Other Operating Expenses 49.1 58.7
Non-interest Income (net) / Other Operating Expenses 126.8 46.2
Quarterly profitability and income-expenditure ratios, except year-end figures, should be considered periodically.

II-184
BankPozitif Kredi ve Kalkınma Bankası A. .
Assets(USD Million)
Dec. 2010 % Dec. 2009 %TC FC Total Distr. TC FC Total Distr.
Cash and Balances with the Central Bank 5 63 68 6.4 3 54 57 5.3Fin.ass.where fair value cha. is refl.to I/S (Net) 11 10 21 2.0 13 1 14 1.3
Financial assets held for trading 11 10 21 2.0 13 1 14 1.3Public sector debt securities 1 0 1 0.1 3 0 3 0.2Securities representing a share in capital 0 0 0 0.0 0 0 0 0.0Derivative financial assets held for trading 9 10 19 1.8 10 1 11 1.0Other marketable securities 0 0 0 0.0 0 0 0 0.0
Fin.assets clas. as fair value change is refl.to I/S 0 0 0 0.0 0 0 0 0.0Public sector debt securities 0 0 0 0.0 0 0 0 0.0Securities representing a share in capital 0 0 0 0.0 0 0 0 0.0Loans 0 0 0 0.0 0 0 0 0.0Other marketable securities 0 0 0 0.0 0 0 0 0.0
Banks 22 2 24 2.3 0 7 7 0.7Money Market Securities 14 0 14 1.4 14 0 14 1.3
Interbank money market placements 0 0 0 0.0 14 0 14 1.3Istanbul Stock Exc. money market placements 10 0 10 0.9 0 0 0 0.0Receiv. from reverse repurchase agreements 5 0 5 0.4 0 0 0 0.0
Financial Assets Available for Sale (Net) 69 5 74 7.0 40 0 40 3.8Securities representing a share in capital 0 0 0 0.0 0 0 0 0.0Public sector debt securities 69 0 69 6.5 40 0 40 3.8Other marketable securities 0 5 5 0.4 0 0 0 0.0
Loans 429 303 733 69.3 529 280 809 75.5Loans 409 303 712 67.4 497 280 777 72.4
Loans granted to the Banks risk group 0 2 2 0.1 3 6 9 0.8Public sector debt securities 0 0 0 0.0 0 0 0 0.0Other 409 302 711 67.2 494 275 768 71.6
Loans under follow-up 41 0 41 3.9 44 0 44 4.1Specific provisions (-) 20 0 20 1.9 11 0 11 1.0
Factoring Receivables 0 0 0 0.0 0 0 0 0.0Investments held to Maturity (Net) 0 0 0 0.0 21 6 28 2.6
Public sector debt securities 0 0 0 0.0 21 0 21 2.0Other marketable securities 0 0 0 0.0 0 6 6 0.6
Investments and Associates (Net) 0 0 0 0.0 0 0 0 0.0Accounted with equity method 0 0 0 0.0 0 0 0 0.0Non-consolidated investments and associates 0 0 0 0.0 0 0 0 0.0
Financial investments and associates 0 0 0 0.0 0 0 0 0.0Non-financial investments and associates 0 0 0 0.0 0 0 0 0.0
Subsidiaries (Net) 3 77 80 7.6 4 71 76 7.1Financial subsidiaries 0 77 77 7.3 1 71 73 6.8Non-financial subsidiaries 3 0 3 0.3 3 0 3 0.3
Joint Ventures (Business Partners) (Net) 0 0 0 0.0 0 0 0 0.0Accounted with equity method 0 0 0 0.0 0 0 0 0.0Non-consolidated joint ventures 0 0 0 0.0 0 0 0 0.0
Financial joint ventures 0 0 0 0.0 0 0 0 0.0Non-financial joint ventures 0 0 0 0.0 0 0 0 0.0
Recivables From Leasing Transactions 1 3 5 0.4 0 6 6 0.6Finance lease receivables 2 4 5 0.5 0 7 7 0.6Operational leasing receivables 0 0 0 0.0 0 0 0 0.0Others 0 0 0 0.0 0 0 0 0.0Unearned income (-) 1 0 1 0.1 0 1 1 0.0
Derivative Financial Assets Held for Hedging 0 0 0 0.0 0 0 0 0.0Fair value hedges 0 0 0 0.0 0 0 0 0.0Cash flow hedges 0 0 0 0.0 0 0 0 0.0Hedges for invest. made in foreign countries 0 0 0 0.0 0 0 0 0.0
Property and Equipment (Net) 3 0 3 0.3 5 0 5 0.5Intangible Assets (Net) 2 0 2 0.2 3 0 3 0.3
Goodwill 0 0 0 0.0 0 0 0 0.0Other 2 0 2 0.2 3 0 3 0.3
Real Estates for Investment Purpose (Net) 0 0 0 0.0 0 0 0 0.0Assets for Tax 0 0 0 0.0 0 0 0 0.0
Current assets for tax 0 0 0 0.0 0 0 0 0.0Deferred assets for tax 0 0 0 0.0 0 0 0 0.0
Prop.&Equ.for Sale p. and from Term.Op.(Net) 2 0 2 0.2 1 0 1 0.1Other Assets 2 29 32 3.0 2 11 13 1.2
Total Assets 563 494 1,057 100.0 636 437 1,073 100.0

II-185
BankPozitif Kredi ve Kalkınma Bankası A. . December 2010
Liabilities(USD Million)
Dec. 2010 % Dec. 2009 %TC FC Total Distr. TC FC Total Distr.
Deposits 0 0 0 0.0 0 0 0 0.0Deposits held by the Banks risk group 0 0 0 0.0 0 0 0 0.0Other 0 0 0 0.0 0 0 0 0.0
Derivative Finan. Liabilities Held for Trading 2 12 14 1.3 9 1 10 0.9Funds Borrowed 0 525 525 49.7 3 629 632 58.9Money Market Takings 24 0 24 2.3 30 0 30 2.8
Interbank money market takings 0 0 0 0.0 0 0 0 0.0Istanbul Stock Exc. money market takings 11 0 11 1.1 14 0 14 1.3Funds provided under repurchase agreements 13 0 13 1.2 16 0 16 1.5
Marketable Securities Issued (Net) 100 0 100 9.5 35 0 35 3.3Bills 0 0 0 0.0 0 0 0 0.0Asset backed securities 0 0 0 0.0 0 0 0 0.0Bonds 100 0 100 9.5 35 0 35 3.3
Funds 14 36 50 4.7 14 30 44 4.1Borrower funds 14 36 50 4.7 14 30 44 4.1Others 0 0 0 0.0 0 0 0 0.0
Miscellaneous Payables 2 1 3 0.3 1 2 3 0.3Other External Resources 1 17 18 1.7 2 1 3 0.3Factoring Payables 0 0 0 0.0 0 0 0 0.0Leasing Transactions Payables (Net) 0 0 0 0.0 0 0 0 0.0
Finance leasing payables 0 0 0 0.0 0 0 0 0.0Operations leasing payables 0 0 0 0.0 0 0 0 0.0Others 0 0 0 0.0 0 0 0 0.0Deferred finance leasing expenses (-) 0 0 0 0.0 0 0 0 0.0
Derivative Finan. Liabilities Held for Hedging 0 0 0 0.0 0 0 0 0.0Fair value hedges 0 0 0 0.0 0 0 0 0.0Cash flow hedges 0 0 0 0.0 0 0 0 0.0Hedges for invest. made in foreign countries 0 0 0 0.0 0 0 0 0.0
Provisions 11 0 11 1.0 15 0 15 1.4General provisions 8 0 8 0.8 9 0 9 0.8Restructuring reserves 0 0 0 0.0 0 0 0 0.0Reserves for employee benefit 3 0 3 0.2 2 0 2 0.2Insurance technical reserves (Net) 0 0 0 0.0 0 0 0 0.0Other provisions 0 0 0 0.0 4 0 4 0.4
Liabilities for Tax 6 0 6 0.6 2 0 2 0.1Current liabilities for tax 3 0 3 0.3 1 0 1 0.1Deferred liabilities for tax 3 0 3 0.3 0 0 0 0.0
Lia.for Pro.&Equ.for Sale p. and from Term.Op.(Net) 0 0 0 0.0 0 0 0 0.0Subordinated Loans 0 0 0 0.0 0 0 0 0.0Shareholders' Equity 305 0 305 28.8 300 -1 299 27.9
Paid-in capital 219 0 219 20.8 227 0 227 21.1Supplementary capital 28 0 27 2.6 28 -1 27 2.5
Share premium 13 0 13 1.2 14 0 14 1.3Share cancellation profits 0 0 0 0.0 0 0 0 0.0Valuation changes in marketable securities 3 0 2 0.2 1 -1 0 0.0Revaluation changes of property and equip. 0 0 0 0.0 0 0 0 0.0Revaluation changes of intangible assets 0 0 0 0.0 0 0 0 0.0Revaluation changes of real est.for inv. pur. 0 0 0 0.0 0 0 0 0.0Free shares from inv.&ass.,subs.& joint vent. 0 0 0 0.0 0 0 0 0.0Hedging funds (active part) 0 0 0 0.0 0 0 0 0.0Val.inc.in pro.& equ.held for sale p.and term.ope. 0 0 0 0.0 0 0 0 0.0Other capital reserves 12 0 12 1.1 14 0 14 1.3
Profit reserves 42 0 42 4.0 28 0 28 2.6Legal reserves 8 0 8 0.7 6 0 6 0.6Status reserves 0 0 0 0.0 0 0 0 0.0Extraordinary reserves 34 0 34 3.2 22 0 22 2.0Other profit reserves 0 0 0 0.0 0 0 0 0.0
Profit or loss 16 0 16 1.5 18 0 18 1.7Prior years income/loss 0 0 0 0.0 0 0 0 0.0Current year income/loss 16 0 16 1.5 18 0 18 1.7
Total Liabilities 466 591 1,057 100.0 411 662 1,073 100.0
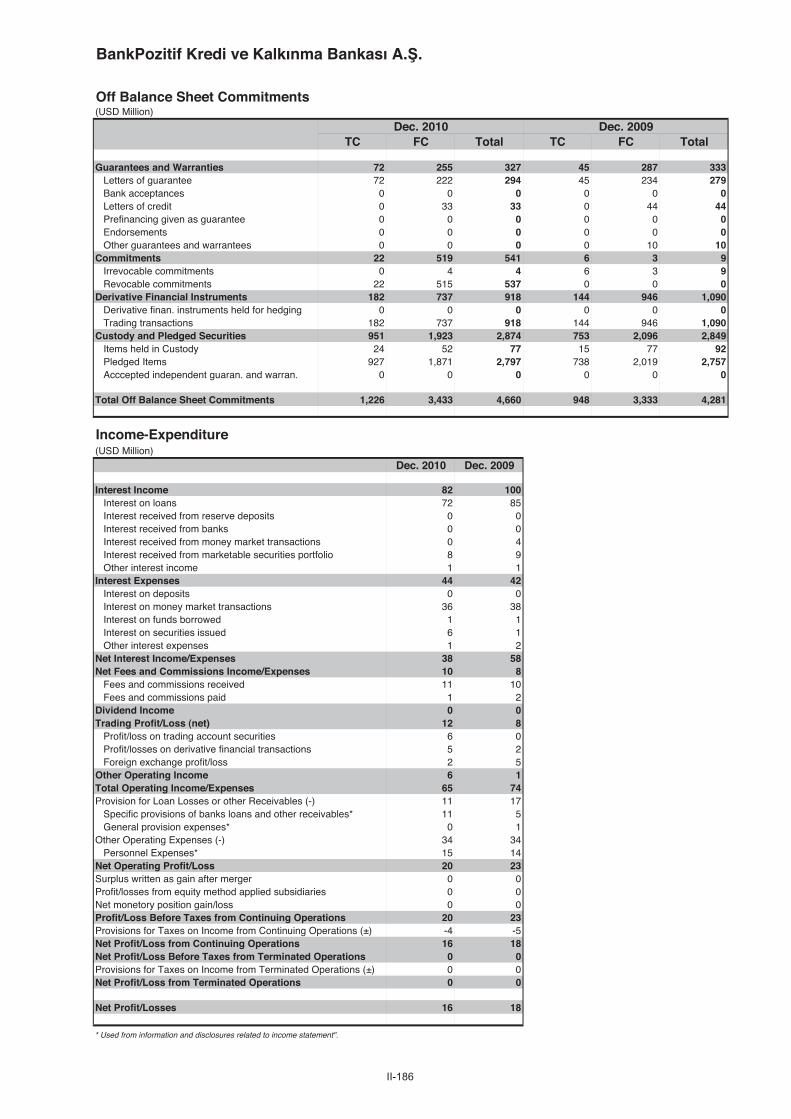
II-186
BankPozitif Kredi ve Kalkınma Bankası A. .
Off Balance Sheet Commitments(USD Million)
Dec. 2010 Dec. 2009TC FC Total TC FC Total
Guarantees and Warranties 72 255 327 45 287 333Letters of guarantee 72 222 294 45 234 279Bank acceptances 0 0 0 0 0 0Letters of credit 0 33 33 0 44 44Prefinancing given as guarantee 0 0 0 0 0 0Endorsements 0 0 0 0 0 0Other guarantees and warrantees 0 0 0 0 10 10
Commitments 22 519 541 6 3 9Irrevocable commitments 0 4 4 6 3 9Revocable commitments 22 515 537 0 0 0
Derivative Financial Instruments 182 737 918 144 946 1,090Derivative finan. instruments held for hedging 0 0 0 0 0 0Trading transactions 182 737 918 144 946 1,090
Custody and Pledged Securities 951 1,923 2,874 753 2,096 2,849Items held in Custody 24 52 77 15 77 92Pledged Items 927 1,871 2,797 738 2,019 2,757Acccepted independent guaran. and warran. 0 0 0 0 0 0
Total Off Balance Sheet Commitments 1,226 3,433 4,660 948 3,333 4,281
Income-Expenditure(USD Million)
Dec. 2010 Dec. 2009
Interest Income 82 100Interest on loans 72 85Interest received from reserve deposits 0 0Interest received from banks 0 0Interest received from money market transactions 0 4Interest received from marketable securities portfolio 8 9Other interest income 1 1
Interest Expenses 44 42Interest on deposits 0 0Interest on money market transactions 36 38Interest on funds borrowed 1 1Interest on securities issued 6 1Other interest expenses 1 2
Net Interest Income/Expenses 38 58Net Fees and Commissions Income/Expenses 10 8
Fees and commissions received 11 10Fees and commissions paid 1 2
Dividend Income 0 0Trading Profit/Loss (net) 12 8
Profit/loss on trading account securities 6 0Profit/losses on derivative financial transactions 5 2Foreign exchange profit/loss 2 5
Other Operating Income 6 1Total Operating Income/Expenses 65 74Provision for Loan Losses or other Receivables (-) 11 17
Specific provisions of banks loans and other receivables* 11 5General provision expenses* 0 1
Other Operating Expenses (-) 34 34Personnel Expenses* 15 14
Net Operating Profit/Loss 20 23Surplus written as gain after merger 0 0Profit/losses from equity method applied subsidiaries 0 0Net monetory position gain/loss 0 0Profit/Loss Before Taxes from Continuing Operations 20 23Provisions for Taxes on Income from Continuing Operations (±) -4 -5Net Profit/Loss from Continuing Operations 16 18Net Profit/Loss Before Taxes from Terminated Operations 0 0Provisions for Taxes on Income from Terminated Operations (±) 0 0Net Profit/Loss from Terminated Operations 0 0
Net Profit/Losses 16 18
* Used from information and disclosures related to income statement".

II-187
BankPozitif Kredi ve Kalkınma Bankası A. . December 2010
Ratios(%)
Dec. 2010 Dec. 2009
Capital Ratios
Shareholders’ Equity / (Amount subject to credit + market + operational risk) 30.1 29.0
Shareholders' Equity / Total Assets 28.8 27.9
(Shareholders' Equity - Permanent Assets) / Total Assets 18.7 17.1
Net On Balance Sheet Position / Total Shareholders' Equity 29.1 10.2
Net On and Off Balance Sheet Position / Total Shareholders' Equity -2.0 -3.9
Balance-Sheet Ratios
TC Assets / Total Assets 53.3 59.3
TC Liabilities / Total Liabilities 44.1 38.3
FC Assets / FC Liabilities 83.6 66.0
TC Deposits / Total Deposits - -
TC Loans / Total Loans and Receivables 58.6 65.4
Total Deposits / Total Assets 0.0 0.0
Funds Borrowed / Total Assets 49.7 58.9
Assets Quality
Financial Assets (net) / Total Assets 8.9 7.6
Total Loans and Receivables / Total Assets 69.3 75.5
Total Loans and Receivables / Total Deposits - -
Loans Under Follow-up (gross) / Total Loans and Receivables 5.6 5.4
Loans Under Follow-up (net) / Total Loans and Receivables 2.8 4.0
Specific Provisions / Loans Under Follow-up 49.8 25.5
Permanent Assets / Total Assets 10.2 10.9
Consumer Loans / Total Loans and Receivables 22.0 20.3
Liquidity
Liquid Assets / Total Assets 19.0 12.3
Liquid Assets / Short-term Liabilities 231.4 124.0
TC Liquid Assets / Total Assets 11.4 6.6
Profitability
Net Profit/Losses / Total Assets 1.5 1.7
Net Profit/Losses / Total Shareholders' Equity 5.3 6.0
Profit/Losses Before Taxes after Continuing Operations / Total Assets 1.9 2.1
Income-Expenditure Structure
Net Interest Income After Specific Provisions / Total Assets 2.5 4.9
Net Interest Income After Specific Provisions / Total Operating Income (Expenses) 41.2 70.9
Non-interest Income (net) / Total Assets 2.6 1.5
Other Operating Expenses / Total Assets 3.2 3.2
Personnel Expenses / Other Operating Expenses 44.3 39.9
Non-interest Income (net) / Other Operating Expenses 81.8 48.0
Quarterly profitability and income-expenditure ratios, except year-end figures, should be considered periodically.

II-188
Credit Agricole Yatırım Bankası Türk A. .
Assets(USD Million)
Dec. 2010 % Dec. 2009 %TC FC Total Distr. TC FC Total Distr.
Cash and Balances with the Central Bank 0 0 0 0.1 0 0 0 0.5Fin.ass.where fair value cha. is refl.to I/S (Net) 0 0 0 0.0 0 0 0 0.0
Financial assets held for trading 0 0 0 0.0 0 0 0 0.0Public sector debt securities 0 0 0 0.0 0 0 0 0.0Securities representing a share in capital 0 0 0 0.0 0 0 0 0.0Derivative financial assets held for trading 0 0 0 0.0 0 0 0 0.0Other marketable securities 0 0 0 0.0 0 0 0 0.0
Fin.assets clas. as fair value change is refl.to I/S 0 0 0 0.0 0 0 0 0.0Public sector debt securities 0 0 0 0.0 0 0 0 0.0Securities representing a share in capital 0 0 0 0.0 0 0 0 0.0Loans 0 0 0 0.0 0 0 0 0.0Other marketable securities 0 0 0 0.0 0 0 0 0.0
Banks 29 2 31 71.6 22 3 25 57.0Money Market Securities 7 0 7 15.5 10 0 10 22.7
Interbank money market placements 7 0 7 15.5 10 0 10 22.7Istanbul Stock Exc. money market placements 0 0 0 0.0 0 0 0 0.0Receiv. from reverse repurchase agreements 0 0 0 0.0 0 0 0 0.0
Financial Assets Available for Sale (Net) 0 0 0 0.0 0 0 0 0.0Securities representing a share in capital 0 0 0 0.0 0 0 0 0.0Public sector debt securities 0 0 0 0.0 0 0 0 0.0Other marketable securities 0 0 0 0.0 0 0 0 0.0
Loans 0 0 0 0.2 0 0 0 0.1Loans 0 0 0 0.2 0 0 0 0.1
Loans granted to the Banks risk group 0 0 0 0.0 0 0 0 0.0Public sector debt securities 0 0 0 0.0 0 0 0 0.0Other 0 0 0 0.2 0 0 0 0.1
Loans under follow-up 3 0 3 7.8 3 0 3 8.0Specific provisions (-) 3 0 3 7.8 3 0 3 8.0
Factoring Receivables 0 0 0 0.0 0 0 0 0.0Investments held to Maturity (Net) 0 0 0 0.0 0 0 0 0.0
Public sector debt securities 0 0 0 0.0 0 0 0 0.0Other marketable securities 0 0 0 0.0 0 0 0 0.0
Investments and Associates (Net) 0 0 0 0.0 0 0 0 0.0Accounted with equity method 0 0 0 0.0 0 0 0 0.0Non-consolidated investments and associates 0 0 0 0.0 0 0 0 0.0
Financial investments and associates 0 0 0 0.0 0 0 0 0.0Non-financial investments and associates 0 0 0 0.0 0 0 0 0.0
Subsidiaries (Net) 0 0 0 0.0 0 0 0 0.0Financial subsidiaries 0 0 0 0.0 0 0 0 0.0Non-financial subsidiaries 0 0 0 0.0 0 0 0 0.0
Joint Ventures (Business Partners) (Net) 0 0 0 0.0 0 0 0 0.0Accounted with equity method 0 0 0 0.0 0 0 0 0.0Non-consolidated joint ventures 0 0 0 0.0 0 0 0 0.0
Financial joint ventures 0 0 0 0.0 0 0 0 0.0Non-financial joint ventures 0 0 0 0.0 0 0 0 0.0
Recivables From Leasing Transactions 0 0 0 0.0 0 0 0 0.0Finance lease receivables 0 0 0 0.0 0 0 0 0.0Operational leasing receivables 0 0 0 0.0 0 0 0 0.0Others 0 0 0 0.0 0 0 0 0.0Unearned income (-) 0 0 0 0.0 0 0 0 0.0
Derivative Financial Assets Held for Hedging 0 0 0 0.0 0 0 0 0.0Fair value hedges 0 0 0 0.0 0 0 0 0.0Cash flow hedges 0 0 0 0.0 0 0 0 0.0Hedges for invest. made in foreign countries 0 0 0 0.0 0 0 0 0.0
Property and Equipment (Net) 2 0 2 4.6 3 0 3 7.6Intangible Assets (Net) 0 0 0 0.1 0 0 0 0.1
Goodwill 0 0 0 0.0 0 0 0 0.0Other 0 0 0 0.1 0 0 0 0.1
Real Estates for Investment Purpose (Net) 1 0 1 2.4 0 0 0 0.0Assets for Tax 1 0 1 1.6 2 0 2 4.0
Current assets for tax 0 0 0 0.0 0 0 0 0.0Deferred assets for tax 1 0 1 1.6 2 0 2 4.0
Prop.&Equ.for Sale p. and from Term.Op.(Net) 0 0 0 0.0 0 0 0 0.0Other Assets 0 2 2 3.9 0 3 4 8.2
Total Assets 39 4 43 100.0 37 6 43 100.0
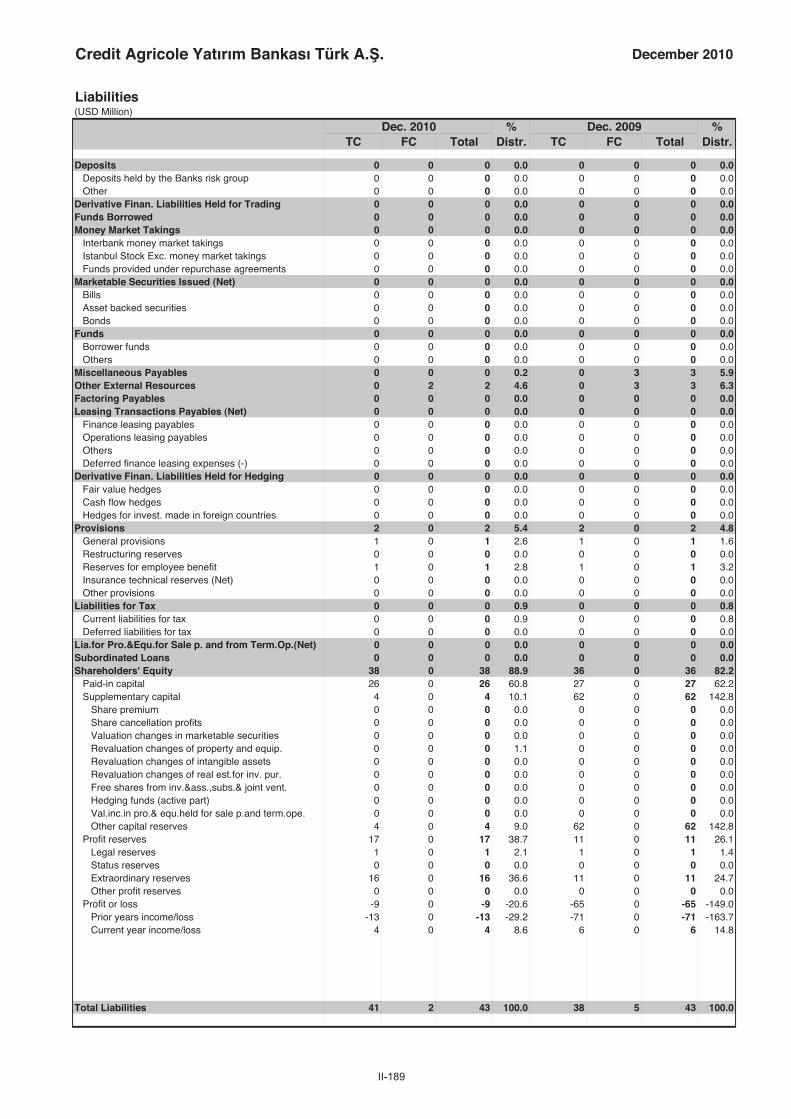
II-189
Credit Agricole Yatırım Bankası Türk A. . December 2010
Liabilities(USD Million)
Dec. 2010 % Dec. 2009 %TC FC Total Distr. TC FC Total Distr.
Deposits 0 0 0 0.0 0 0 0 0.0Deposits held by the Banks risk group 0 0 0 0.0 0 0 0 0.0Other 0 0 0 0.0 0 0 0 0.0
Derivative Finan. Liabilities Held for Trading 0 0 0 0.0 0 0 0 0.0Funds Borrowed 0 0 0 0.0 0 0 0 0.0Money Market Takings 0 0 0 0.0 0 0 0 0.0
Interbank money market takings 0 0 0 0.0 0 0 0 0.0Istanbul Stock Exc. money market takings 0 0 0 0.0 0 0 0 0.0Funds provided under repurchase agreements 0 0 0 0.0 0 0 0 0.0
Marketable Securities Issued (Net) 0 0 0 0.0 0 0 0 0.0Bills 0 0 0 0.0 0 0 0 0.0Asset backed securities 0 0 0 0.0 0 0 0 0.0Bonds 0 0 0 0.0 0 0 0 0.0
Funds 0 0 0 0.0 0 0 0 0.0Borrower funds 0 0 0 0.0 0 0 0 0.0Others 0 0 0 0.0 0 0 0 0.0
Miscellaneous Payables 0 0 0 0.2 0 3 3 5.9Other External Resources 0 2 2 4.6 0 3 3 6.3Factoring Payables 0 0 0 0.0 0 0 0 0.0Leasing Transactions Payables (Net) 0 0 0 0.0 0 0 0 0.0
Finance leasing payables 0 0 0 0.0 0 0 0 0.0Operations leasing payables 0 0 0 0.0 0 0 0 0.0Others 0 0 0 0.0 0 0 0 0.0Deferred finance leasing expenses (-) 0 0 0 0.0 0 0 0 0.0
Derivative Finan. Liabilities Held for Hedging 0 0 0 0.0 0 0 0 0.0Fair value hedges 0 0 0 0.0 0 0 0 0.0Cash flow hedges 0 0 0 0.0 0 0 0 0.0Hedges for invest. made in foreign countries 0 0 0 0.0 0 0 0 0.0
Provisions 2 0 2 5.4 2 0 2 4.8General provisions 1 0 1 2.6 1 0 1 1.6Restructuring reserves 0 0 0 0.0 0 0 0 0.0Reserves for employee benefit 1 0 1 2.8 1 0 1 3.2Insurance technical reserves (Net) 0 0 0 0.0 0 0 0 0.0Other provisions 0 0 0 0.0 0 0 0 0.0
Liabilities for Tax 0 0 0 0.9 0 0 0 0.8Current liabilities for tax 0 0 0 0.9 0 0 0 0.8Deferred liabilities for tax 0 0 0 0.0 0 0 0 0.0
Lia.for Pro.&Equ.for Sale p. and from Term.Op.(Net) 0 0 0 0.0 0 0 0 0.0Subordinated Loans 0 0 0 0.0 0 0 0 0.0Shareholders' Equity 38 0 38 88.9 36 0 36 82.2
Paid-in capital 26 0 26 60.8 27 0 27 62.2Supplementary capital 4 0 4 10.1 62 0 62 142.8
Share premium 0 0 0 0.0 0 0 0 0.0Share cancellation profits 0 0 0 0.0 0 0 0 0.0Valuation changes in marketable securities 0 0 0 0.0 0 0 0 0.0Revaluation changes of property and equip. 0 0 0 1.1 0 0 0 0.0Revaluation changes of intangible assets 0 0 0 0.0 0 0 0 0.0Revaluation changes of real est.for inv. pur. 0 0 0 0.0 0 0 0 0.0Free shares from inv.&ass.,subs.& joint vent. 0 0 0 0.0 0 0 0 0.0Hedging funds (active part) 0 0 0 0.0 0 0 0 0.0Val.inc.in pro.& equ.held for sale p.and term.ope. 0 0 0 0.0 0 0 0 0.0Other capital reserves 4 0 4 9.0 62 0 62 142.8
Profit reserves 17 0 17 38.7 11 0 11 26.1Legal reserves 1 0 1 2.1 1 0 1 1.4Status reserves 0 0 0 0.0 0 0 0 0.0Extraordinary reserves 16 0 16 36.6 11 0 11 24.7Other profit reserves 0 0 0 0.0 0 0 0 0.0
Profit or loss -9 0 -9 -20.6 -65 0 -65 -149.0Prior years income/loss -13 0 -13 -29.2 -71 0 -71 -163.7Current year income/loss 4 0 4 8.6 6 0 6 14.8
Total Liabilities 41 2 43 100.0 38 5 43 100.0

II-190
Credit Agricole Yatırım Bankası Türk A. .
Off Balance Sheet Commitments(USD Million)
Dec. 2010 Dec. 2009TC FC Total TC FC Total
Guarantees and Warranties 1 398 398 0 294 294Letters of guarantee 1 110 111 0 116 116Bank acceptances 0 0 0 0 0 0Letters of credit 0 193 193 0 70 70Prefinancing given as guarantee 0 0 0 0 0 0Endorsements 0 0 0 0 0 0Other guarantees and warrantees 0 95 95 0 108 108
Commitments 2 2 3 1 1 3Irrevocable commitments 2 2 3 1 1 3Revocable commitments 0 0 0 0 0 0
Derivative Financial Instruments 0 7 7 0 7 7Derivative finan. instruments held for hedging 0 0 0 0 0 0Trading transactions 0 7 7 0 7 7
Custody and Pledged Securities 0 0 0 0 0 0Items held in Custody 0 0 0 0 0 0Pledged Items 0 0 0 0 0 0Acccepted independent guaran. and warran. 0 0 0 0 0 0
Total Off Balance Sheet Commitments 2 406 408 2 303 305
Income-Expenditure(USD Million)
Dec. 2010 Dec. 2009
Interest Income 2 3Interest on loans 0 0Interest received from reserve deposits 0 0Interest received from banks 2 3Interest received from money market transactions 0 0Interest received from marketable securities portfolio 0 0Other interest income 0 0
Interest Expenses 0 0Interest on deposits 0 0Interest on money market transactions 0 0Interest on funds borrowed 0 0Interest on securities issued 0 0Other interest expenses 0 0
Net Interest Income/Expenses 2 2Net Fees and Commissions Income/Expenses 10 12
Fees and commissions received 10 12Fees and commissions paid 0 0
Dividend Income 0 0Trading Profit/Loss (net) 0 0
Profit/loss on trading account securities 0 0Profit/losses on derivative financial transactions 0 2Foreign exchange profit/loss 0 -2
Other Operating Income 0 1Total Operating Income/Expenses 12 16Provision for Loan Losses or other Receivables (-) 0 0
Specific provisions of banks loans and other receivables* 0 0General provision expenses* 0 0
Other Operating Expenses (-) 7 8Personnel Expenses* 4 3
Net Operating Profit/Loss 5 8Surplus written as gain after merger 0 0Profit/losses from equity method applied subsidiaries 0 0Net monetory position gain/loss 0 0Profit/Loss Before Taxes from Continuing Operations 5 8Provisions for Taxes on Income from Continuing Operations (±) 0 -1Net Profit/Loss from Continuing Operations 5 6Net Profit/Loss Before Taxes from Terminated Operations 0 0Provisions for Taxes on Income from Terminated Operations (±) -1 0Net Profit/Loss from Terminated Operations -1 0
Net Profit/Losses 4 6
* Used from information and disclosures related to income statement".

II-191
Credit Agricole Yatırım Bankası Türk A. . December 2010
Ratios(%)
Dec. 2010 Dec. 2009
Capital Ratios
Shareholders’ Equity / (Amount subject to credit + market + operational risk) 16.6 19.8
Shareholders' Equity / Total Assets 88.9 82.2
(Shareholders' Equity - Permanent Assets) / Total Assets 84.3 74.6
Net On Balance Sheet Position / Total Shareholders' Equity 4.2 2.9
Net On and Off Balance Sheet Position / Total Shareholders' Equity 0.1 -0.1
Balance-Sheet Ratios
TC Assets / Total Assets 91.7 85.5
TC Liabilities / Total Liabilities 95.4 87.9
FC Assets / FC Liabilities 181.8 119.6
TC Deposits / Total Deposits - -
TC Loans / Total Loans and Receivables 100.0 100.0
Total Deposits / Total Assets 0.0 0.0
Funds Borrowed / Total Assets 0.0 0.0
Assets Quality
Financial Assets (net) / Total Assets 0.0 0.0
Total Loans and Receivables / Total Assets 0.2 0.1
Total Loans and Receivables / Total Deposits - -
Loans Under Follow-up (gross) / Total Loans and Receivables 5,080.2 11,661.4
Loans Under Follow-up (net) / Total Loans and Receivables 0.0 0.0
Specific Provisions / Loans Under Follow-up 100.0 100.0
Permanent Assets / Total Assets 4.6 7.7
Consumer Loans / Total Loans and Receivables 100.0 0.0
Liquidity
Liquid Assets / Total Assets 87.2 80.1
Liquid Assets / Short-term Liabilities 5,199.1 1,187.2
TC Liquid Assets / Total Assets 82.6 73.6
Profitability
Net Profit/Losses / Total Assets 8.6 14.8
Net Profit/Losses / Total Shareholders' Equity 9.6 18.0
Profit/Losses Before Taxes after Continuing Operations / Total Assets 11.2 17.9
Income-Expenditure Structure
Net Interest Income After Specific Provisions / Total Assets 5.5 5.6
Net Interest Income After Specific Provisions / Total Operating Income (Expenses) 19.0 15.2
Non-interest Income (net) / Total Assets 23.5 31.3
Other Operating Expenses / Total Assets 16.7 19.0
Personnel Expenses / Other Operating Expenses 49.1 39.9
Non-interest Income (net) / Other Operating Expenses 140.7 164.8
Quarterly profitability and income-expenditure ratios, except year-end figures, should be considered periodically.

II-192
Diler Yatırım Bankası A. .
Assets(USD Million)
Dec. 2010 % Dec. 2009 %TC FC Total Distr. TC FC Total Distr.
Cash and Balances with the Central Bank 0 0 0 0.7 0 0 1 0.8Fin.ass.where fair value cha. is refl.to I/S (Net) 0 0 1 0.8 0 0 0 0.1
Financial assets held for trading 0 0 1 0.8 0 0 0 0.1Public sector debt securities 0 0 0 0.2 0 0 0 0.0Securities representing a share in capital 0 0 0 0.0 0 0 0 0.0Derivative financial assets held for trading 0 0 0 0.6 0 0 0 0.1Other marketable securities 0 0 0 0.0 0 0 0 0.0
Fin.assets clas. as fair value change is refl.to I/S 0 0 0 0.0 0 0 0 0.0Public sector debt securities 0 0 0 0.0 0 0 0 0.0Securities representing a share in capital 0 0 0 0.0 0 0 0 0.0Loans 0 0 0 0.0 0 0 0 0.0Other marketable securities 0 0 0 0.0 0 0 0 0.0
Banks 0 7 7 11.0 0 0 0 0.8Money Market Securities 0 0 0 0.0 0 0 0 0.1
Interbank money market placements 0 0 0 0.0 0 0 0 0.1Istanbul Stock Exc. money market placements 0 0 0 0.0 0 0 0 0.0Receiv. from reverse repurchase agreements 0 0 0 0.0 0 0 0 0.0
Financial Assets Available for Sale (Net) 0 0 0 0.0 0 0 0 0.0Securities representing a share in capital 0 0 0 0.0 0 0 0 0.0Public sector debt securities 0 0 0 0.0 0 0 0 0.0Other marketable securities 0 0 0 0.0 0 0 0 0.0
Loans 51 6 57 85.1 52 6 57 90.5Loans 51 6 57 85.1 52 6 57 90.5
Loans granted to the Banks risk group 21 0 21 31.3 21 0 21 33.1Public sector debt securities 0 0 0 0.0 0 0 0 0.0Other 30 6 36 53.7 31 6 36 57.4
Loans under follow-up 0 0 0 0.1 0 0 0 0.1Specific provisions (-) 0 0 0 0.1 0 0 0 0.1
Factoring Receivables 0 0 0 0.0 0 0 0 0.0Investments held to Maturity (Net) 0 1 1 1.4 1 1 2 2.7
Public sector debt securities 0 0 0 0.0 1 0 1 1.2Other marketable securities 0 1 1 1.4 0 1 1 1.5
Investments and Associates (Net) 0 0 0 0.0 0 0 0 0.0Accounted with equity method 0 0 0 0.0 0 0 0 0.0Non-consolidated investments and associates 0 0 0 0.0 0 0 0 0.0
Financial investments and associates 0 0 0 0.0 0 0 0 0.0Non-financial investments and associates 0 0 0 0.0 0 0 0 0.0
Subsidiaries (Net) 0 0 0 0.0 0 0 0 0.0Financial subsidiaries 0 0 0 0.0 0 0 0 0.0Non-financial subsidiaries 0 0 0 0.0 0 0 0 0.0
Joint Ventures (Business Partners) (Net) 0 0 0 0.0 0 0 0 0.0Accounted with equity method 0 0 0 0.0 0 0 0 0.0Non-consolidated joint ventures 0 0 0 0.0 0 0 0 0.0
Financial joint ventures 0 0 0 0.0 0 0 0 0.0Non-financial joint ventures 0 0 0 0.0 0 0 0 0.0
Recivables From Leasing Transactions 0 0 0 0.0 0 2 2 3.1Finance lease receivables 0 0 0 0.0 0 2 2 3.5Operational leasing receivables 0 0 0 0.0 0 0 0 0.0Others 0 0 0 0.0 0 0 0 0.0Unearned income (-) 0 0 0 0.0 0 0 0 0.5
Derivative Financial Assets Held for Hedging 0 0 0 0.0 0 0 0 0.0Fair value hedges 0 0 0 0.0 0 0 0 0.0Cash flow hedges 0 0 0 0.0 0 0 0 0.0Hedges for invest. made in foreign countries 0 0 0 0.0 0 0 0 0.0
Property and Equipment (Net) 0 0 0 0.2 0 0 0 0.2Intangible Assets (Net) 0 0 0 0.1 0 0 0 0.1
Goodwill 0 0 0 0.0 0 0 0 0.0Other 0 0 0 0.1 0 0 0 0.1
Real Estates for Investment Purpose (Net) 0 0 0 0.0 0 0 0 0.0Assets for Tax 0 0 0 0.2 0 0 0 0.1
Current assets for tax 0 0 0 0.0 0 0 0 0.0Deferred assets for tax 0 0 0 0.2 0 0 0 0.1
Prop.&Equ.for Sale p. and from Term.Op.(Net) 0 0 0 0.0 0 0 0 0.0Other Assets 0 0 0 0.6 1 0 1 1.5
Total Assets 52 15 67 100.0 54 9 63 100.0

II-193
Diler Yatırım Bankası A. . December 2010
Liabilities(USD Million)
Dec. 2010 % Dec. 2009 %TC FC Total Distr. TC FC Total Distr.
Deposits 0 0 0 0.0 0 0 0 0.0Deposits held by the Banks risk group 0 0 0 0.0 0 0 0 0.0Other 0 0 0 0.0 0 0 0 0.0
Derivative Finan. Liabilities Held for Trading 1 0 1 1.2 0 0 0 0.1Funds Borrowed 0 0 0 0.0 1 3 3 4.9Money Market Takings 0 0 0 0.0 1 0 1 1.1
Interbank money market takings 0 0 0 0.0 0 0 0 0.0Istanbul Stock Exc. money market takings 0 0 0 0.0 0 0 0 0.0Funds provided under repurchase agreements 0 0 0 0.0 1 0 1 1.1
Marketable Securities Issued (Net) 0 0 0 0.0 0 0 0 0.0Bills 0 0 0 0.0 0 0 0 0.0Asset backed securities 0 0 0 0.0 0 0 0 0.0Bonds 0 0 0 0.0 0 0 0 0.0
Funds 0 10 10 14.6 0 3 3 4.5Borrower funds 0 10 10 14.6 0 3 3 4.5Others 0 0 0 0.0 0 0 0 0.0
Miscellaneous Payables 0 0 0 0.0 0 0 0 0.1Other External Resources 0 0 0 0.0 0 0 0 0.0Factoring Payables 0 0 0 0.0 0 0 0 0.0Leasing Transactions Payables (Net) 0 0 0 0.0 0 0 0 0.0
Finance leasing payables 0 0 0 0.0 0 0 0 0.0Operations leasing payables 0 0 0 0.0 0 0 0 0.0Others 0 0 0 0.0 0 0 0 0.0Deferred finance leasing expenses (-) 0 0 0 0.0 0 0 0 0.0
Derivative Finan. Liabilities Held for Hedging 0 0 0 0.0 0 0 0 0.0Fair value hedges 0 0 0 0.0 0 0 0 0.0Cash flow hedges 0 0 0 0.0 0 0 0 0.0Hedges for invest. made in foreign countries 0 0 0 0.0 0 0 0 0.0
Provisions 1 0 1 1.3 1 0 1 1.2General provisions 1 0 1 1.0 1 0 1 1.0Restructuring reserves 0 0 0 0.0 0 0 0 0.0Reserves for employee benefit 0 0 0 0.0 0 0 0 0.0Insurance technical reserves (Net) 0 0 0 0.0 0 0 0 0.0Other provisions 0 0 0 0.2 0 0 0 0.2
Liabilities for Tax 1 0 1 1.1 1 0 1 2.0Current liabilities for tax 1 0 1 1.1 1 0 1 2.0Deferred liabilities for tax 0 0 0 0.0 0 0 0 0.0
Lia.for Pro.&Equ.for Sale p. and from Term.Op.(Net) 0 0 0 0.0 0 0 0 0.0Subordinated Loans 0 0 0 0.0 0 0 0 0.0Shareholders' Equity 55 0 55 81.7 54 0 54 86.2
Paid-in capital 39 0 39 58.2 40 0 40 63.8Supplementary capital 2 0 2 2.3 2 0 2 2.5
Share premium 0 0 0 0.0 0 0 0 0.0Share cancellation profits 0 0 0 0.0 0 0 0 0.0Valuation changes in marketable securities 0 0 0 0.0 0 0 0 0.0Revaluation changes of property and equip. 0 0 0 0.0 0 0 0 0.0Revaluation changes of intangible assets 0 0 0 0.0 0 0 0 0.0Revaluation changes of real est.for inv. pur. 0 0 0 0.0 0 0 0 0.0Free shares from inv.&ass.,subs.& joint vent. 0 0 0 0.0 0 0 0 0.0Hedging funds (active part) 0 0 0 0.0 0 0 0 0.0Val.inc.in pro.& equ.held for sale p.and term.ope. 0 0 0 0.0 0 0 0 0.0Other capital reserves 2 0 2 2.3 2 0 2 2.5
Profit reserves 12 0 12 18.1 8 0 8 12.5Legal reserves 1 0 1 1.1 0 0 0 0.8Status reserves 0 0 0 0.0 0 0 0 0.0Extraordinary reserves 11 0 11 17.0 7 0 7 11.7Other profit reserves 0 0 0 0.0 0 0 0 0.0
Profit or loss 2 0 2 3.2 5 0 5 7.4Prior years income/loss 0 0 0 0.0 0 0 0 0.0Current year income/loss 2 0 2 3.2 5 0 5 7.4
Total Liabilities 57 10 67 100.0 58 5 63 100.0

II-194
Diler Yatırım Bankası A. .
Off Balance Sheet Commitments(USD Million)
Dec. 2010 Dec. 2009TC FC Total TC FC Total
Guarantees and Warranties 32 1 33 34 2 35Letters of guarantee 32 1 33 34 2 35Bank acceptances 0 0 0 0 0 0Letters of credit 0 0 0 0 0 0Prefinancing given as guarantee 0 0 0 0 0 0Endorsements 0 0 0 0 0 0Other guarantees and warrantees 0 0 0 0 0 0
Commitments 0 0 0 4 4 9Irrevocable commitments 0 0 0 4 4 9Revocable commitments 0 0 0 0 0 0
Derivative Financial Instruments 14 113 128 9 44 53Derivative finan. instruments held for hedging 0 0 0 0 0 0Trading transactions 14 113 128 9 44 53
Custody and Pledged Securities 1 0 1 0 0 0Items held in Custody 0 0 0 0 0 0Pledged Items 1 0 1 0 0 0Acccepted independent guaran. and warran. 0 0 0 0 0 0
Total Off Balance Sheet Commitments 48 114 162 47 50 97
Income-Expenditure(USD Million)
Dec. 2010 Dec. 2009
Interest Income 5 7Interest on loans 5 6Interest received from reserve deposits 0 0Interest received from banks 0 0Interest received from money market transactions 0 1Interest received from marketable securities portfolio 0 0Other interest income 0 0
Interest Expenses 0 0Interest on deposits 0 0Interest on money market transactions 0 0Interest on funds borrowed 0 0Interest on securities issued 0 0Other interest expenses 0 0
Net Interest Income/Expenses 5 7Net Fees and Commissions Income/Expenses 0 0
Fees and commissions received 0 0Fees and commissions paid 0 0
Dividend Income 0 0Trading Profit/Loss (net) 0 1
Profit/loss on trading account securities 0 0Profit/losses on derivative financial transactions 0 0Foreign exchange profit/loss 0 0
Other Operating Income 0 0Total Operating Income/Expenses 5 8Provision for Loan Losses or other Receivables (-) 0 0
Specific provisions of banks loans and other receivables* 0 0General provision expenses* 0 0
Other Operating Expenses (-) 2 2Personnel Expenses* 1 1
Net Operating Profit/Loss 3 6Surplus written as gain after merger 0 0Profit/losses from equity method applied subsidiaries 0 0Net monetory position gain/loss 0 0Profit/Loss Before Taxes from Continuing Operations 3 6Provisions for Taxes on Income from Continuing Operations (±) -1 -1Net Profit/Loss from Continuing Operations 2 5Net Profit/Loss Before Taxes from Terminated Operations 0 0Provisions for Taxes on Income from Terminated Operations (±) 0 0Net Profit/Loss from Terminated Operations 0 0
Net Profit/Losses 2 5
* Used from information and disclosures related to income statement".

II-195
Diler Yatırım Bankası A. . December 2010
Ratios(%)
Dec. 2010 Dec. 2009
Capital Ratios
Shareholders’ Equity / (Amount subject to credit + market + operational risk) 62.5 55.4
Shareholders' Equity / Total Assets 81.7 86.2
(Shareholders' Equity - Permanent Assets) / Total Assets 81.5 85.9
Net On Balance Sheet Position / Total Shareholders' Equity 9.9 7.5
Net On and Off Balance Sheet Position / Total Shareholders' Equity 0.7 -2.7
Balance-Sheet Ratios
TC Assets / Total Assets 77.1 85.0
TC Liabilities / Total Liabilities 85.2 91.5
FC Assets / FC Liabilities 154.3 176.2
TC Deposits / Total Deposits - -
TC Loans / Total Loans and Receivables 89.1 90.2
Total Deposits / Total Assets 0.0 0.0
Funds Borrowed / Total Assets 0.0 4.9
Assets Quality
Financial Assets (net) / Total Assets 2.2 2.8
Total Loans and Receivables / Total Assets 85.1 90.5
Total Loans and Receivables / Total Deposits - -
Loans Under Follow-up (gross) / Total Loans and Receivables 0.1 0.1
Loans Under Follow-up (net) / Total Loans and Receivables 0.0 0.0
Specific Provisions / Loans Under Follow-up 100.0 100.0
Permanent Assets / Total Assets 0.2 0.3
Consumer Loans / Total Loans and Receivables 0.0 0.0
Liquidity
Liquid Assets / Total Assets 12.5 1.8
Liquid Assets / Short-term Liabilities 12.5 1.8
TC Liquid Assets / Total Assets 0.3 0.3
Profitability
Net Profit/Losses / Total Assets 3.2 7.4
Net Profit/Losses / Total Shareholders' Equity 3.9 8.5
Profit/Losses Before Taxes after Continuing Operations / Total Assets 4.1 9.2
Income-Expenditure Structure
Net Interest Income After Specific Provisions / Total Assets 7.3 10.7
Net Interest Income After Specific Provisions / Total Operating Income (Expenses) 96.8 84.5
Non-interest Income (net) / Total Assets 0.2 2.0
Other Operating Expenses / Total Assets 3.4 3.1
Personnel Expenses / Other Operating Expenses 46.2 50.6
Non-interest Income (net) / Other Operating Expenses 7.0 62.9
Quarterly profitability and income-expenditure ratios, except year-end figures, should be considered periodically.
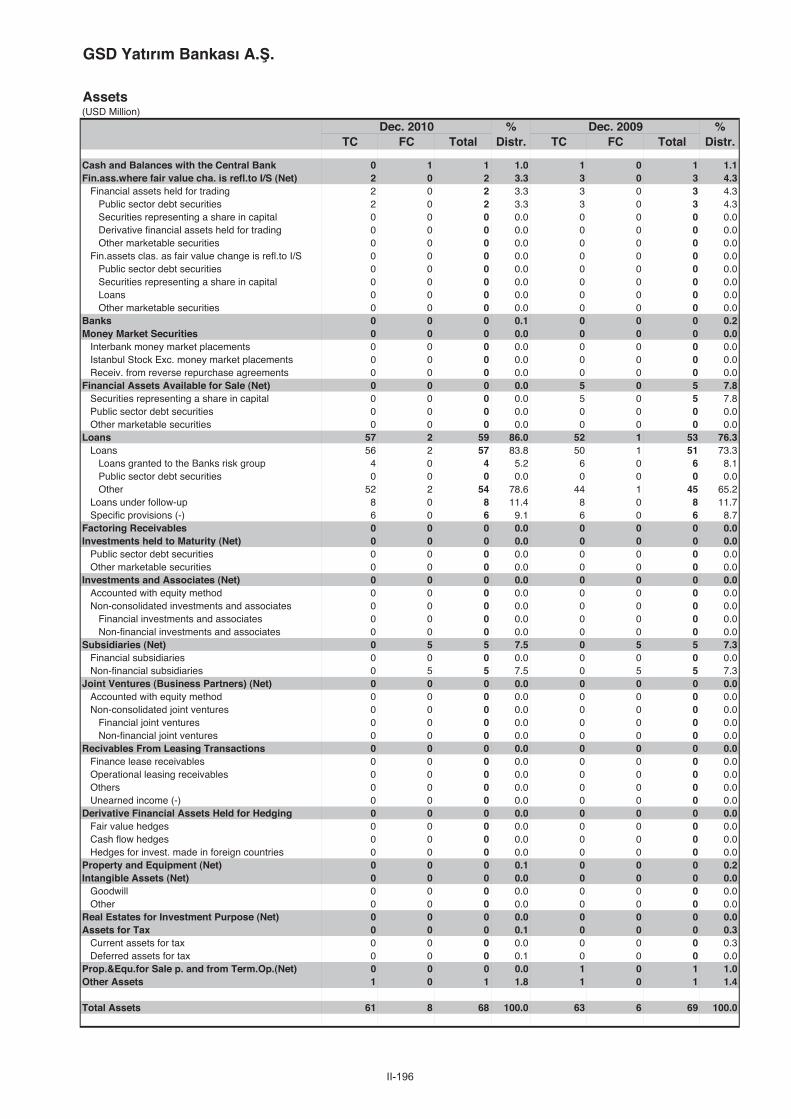
II-196
GSD Yatırım Bankası A. .
Assets(USD Million)
Dec. 2010 % Dec. 2009 %TC FC Total Distr. TC FC Total Distr.
Cash and Balances with the Central Bank 0 1 1 1.0 1 0 1 1.1Fin.ass.where fair value cha. is refl.to I/S (Net) 2 0 2 3.3 3 0 3 4.3
Financial assets held for trading 2 0 2 3.3 3 0 3 4.3Public sector debt securities 2 0 2 3.3 3 0 3 4.3Securities representing a share in capital 0 0 0 0.0 0 0 0 0.0Derivative financial assets held for trading 0 0 0 0.0 0 0 0 0.0Other marketable securities 0 0 0 0.0 0 0 0 0.0
Fin.assets clas. as fair value change is refl.to I/S 0 0 0 0.0 0 0 0 0.0Public sector debt securities 0 0 0 0.0 0 0 0 0.0Securities representing a share in capital 0 0 0 0.0 0 0 0 0.0Loans 0 0 0 0.0 0 0 0 0.0Other marketable securities 0 0 0 0.0 0 0 0 0.0
Banks 0 0 0 0.1 0 0 0 0.2Money Market Securities 0 0 0 0.0 0 0 0 0.0
Interbank money market placements 0 0 0 0.0 0 0 0 0.0Istanbul Stock Exc. money market placements 0 0 0 0.0 0 0 0 0.0Receiv. from reverse repurchase agreements 0 0 0 0.0 0 0 0 0.0
Financial Assets Available for Sale (Net) 0 0 0 0.0 5 0 5 7.8Securities representing a share in capital 0 0 0 0.0 5 0 5 7.8Public sector debt securities 0 0 0 0.0 0 0 0 0.0Other marketable securities 0 0 0 0.0 0 0 0 0.0
Loans 57 2 59 86.0 52 1 53 76.3Loans 56 2 57 83.8 50 1 51 73.3
Loans granted to the Banks risk group 4 0 4 5.2 6 0 6 8.1Public sector debt securities 0 0 0 0.0 0 0 0 0.0Other 52 2 54 78.6 44 1 45 65.2
Loans under follow-up 8 0 8 11.4 8 0 8 11.7Specific provisions (-) 6 0 6 9.1 6 0 6 8.7
Factoring Receivables 0 0 0 0.0 0 0 0 0.0Investments held to Maturity (Net) 0 0 0 0.0 0 0 0 0.0
Public sector debt securities 0 0 0 0.0 0 0 0 0.0Other marketable securities 0 0 0 0.0 0 0 0 0.0
Investments and Associates (Net) 0 0 0 0.0 0 0 0 0.0Accounted with equity method 0 0 0 0.0 0 0 0 0.0Non-consolidated investments and associates 0 0 0 0.0 0 0 0 0.0
Financial investments and associates 0 0 0 0.0 0 0 0 0.0Non-financial investments and associates 0 0 0 0.0 0 0 0 0.0
Subsidiaries (Net) 0 5 5 7.5 0 5 5 7.3Financial subsidiaries 0 0 0 0.0 0 0 0 0.0Non-financial subsidiaries 0 5 5 7.5 0 5 5 7.3
Joint Ventures (Business Partners) (Net) 0 0 0 0.0 0 0 0 0.0Accounted with equity method 0 0 0 0.0 0 0 0 0.0Non-consolidated joint ventures 0 0 0 0.0 0 0 0 0.0
Financial joint ventures 0 0 0 0.0 0 0 0 0.0Non-financial joint ventures 0 0 0 0.0 0 0 0 0.0
Recivables From Leasing Transactions 0 0 0 0.0 0 0 0 0.0Finance lease receivables 0 0 0 0.0 0 0 0 0.0Operational leasing receivables 0 0 0 0.0 0 0 0 0.0Others 0 0 0 0.0 0 0 0 0.0Unearned income (-) 0 0 0 0.0 0 0 0 0.0
Derivative Financial Assets Held for Hedging 0 0 0 0.0 0 0 0 0.0Fair value hedges 0 0 0 0.0 0 0 0 0.0Cash flow hedges 0 0 0 0.0 0 0 0 0.0Hedges for invest. made in foreign countries 0 0 0 0.0 0 0 0 0.0
Property and Equipment (Net) 0 0 0 0.1 0 0 0 0.2Intangible Assets (Net) 0 0 0 0.0 0 0 0 0.0
Goodwill 0 0 0 0.0 0 0 0 0.0Other 0 0 0 0.0 0 0 0 0.0
Real Estates for Investment Purpose (Net) 0 0 0 0.0 0 0 0 0.0Assets for Tax 0 0 0 0.1 0 0 0 0.3
Current assets for tax 0 0 0 0.0 0 0 0 0.3Deferred assets for tax 0 0 0 0.1 0 0 0 0.0
Prop.&Equ.for Sale p. and from Term.Op.(Net) 0 0 0 0.0 1 0 1 1.0Other Assets 1 0 1 1.8 1 0 1 1.4
Total Assets 61 8 68 100.0 63 6 69 100.0
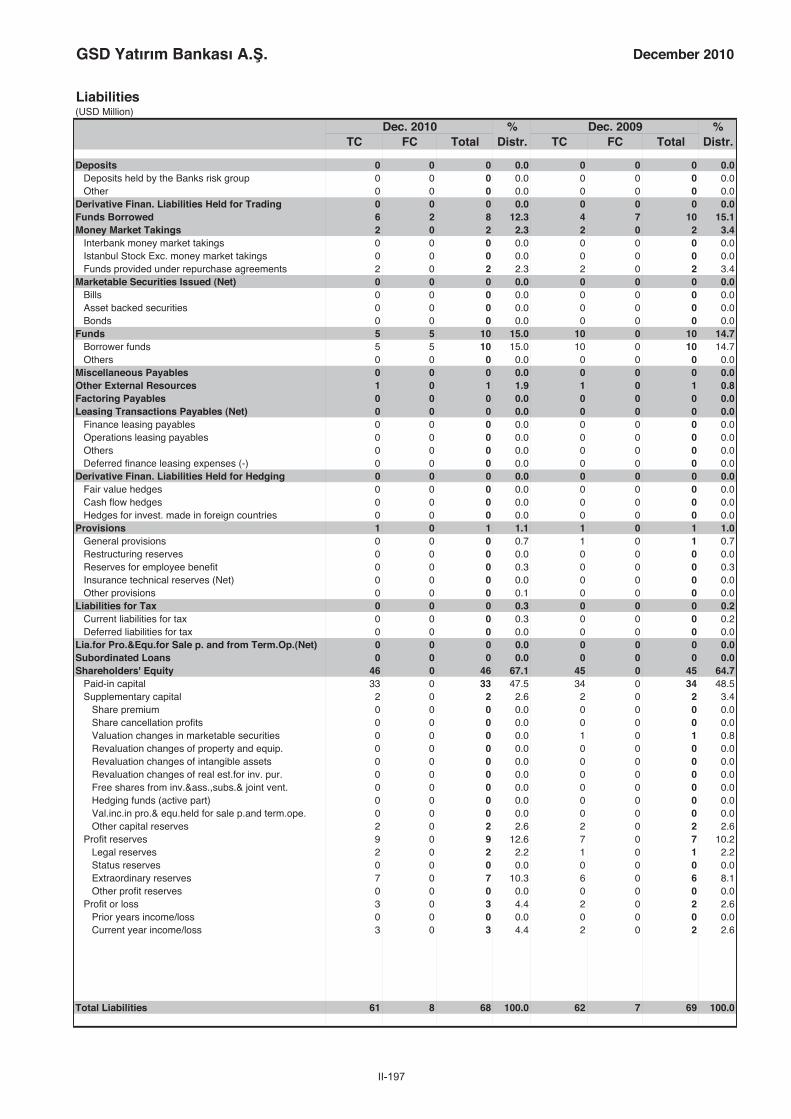
II-197
GSD Yatırım Bankası A. . December 2010
Liabilities(USD Million)
Dec. 2010 % Dec. 2009 %TC FC Total Distr. TC FC Total Distr.
Deposits 0 0 0 0.0 0 0 0 0.0Deposits held by the Banks risk group 0 0 0 0.0 0 0 0 0.0Other 0 0 0 0.0 0 0 0 0.0
Derivative Finan. Liabilities Held for Trading 0 0 0 0.0 0 0 0 0.0Funds Borrowed 6 2 8 12.3 4 7 10 15.1Money Market Takings 2 0 2 2.3 2 0 2 3.4
Interbank money market takings 0 0 0 0.0 0 0 0 0.0Istanbul Stock Exc. money market takings 0 0 0 0.0 0 0 0 0.0Funds provided under repurchase agreements 2 0 2 2.3 2 0 2 3.4
Marketable Securities Issued (Net) 0 0 0 0.0 0 0 0 0.0Bills 0 0 0 0.0 0 0 0 0.0Asset backed securities 0 0 0 0.0 0 0 0 0.0Bonds 0 0 0 0.0 0 0 0 0.0
Funds 5 5 10 15.0 10 0 10 14.7Borrower funds 5 5 10 15.0 10 0 10 14.7Others 0 0 0 0.0 0 0 0 0.0
Miscellaneous Payables 0 0 0 0.0 0 0 0 0.0Other External Resources 1 0 1 1.9 1 0 1 0.8Factoring Payables 0 0 0 0.0 0 0 0 0.0Leasing Transactions Payables (Net) 0 0 0 0.0 0 0 0 0.0
Finance leasing payables 0 0 0 0.0 0 0 0 0.0Operations leasing payables 0 0 0 0.0 0 0 0 0.0Others 0 0 0 0.0 0 0 0 0.0Deferred finance leasing expenses (-) 0 0 0 0.0 0 0 0 0.0
Derivative Finan. Liabilities Held for Hedging 0 0 0 0.0 0 0 0 0.0Fair value hedges 0 0 0 0.0 0 0 0 0.0Cash flow hedges 0 0 0 0.0 0 0 0 0.0Hedges for invest. made in foreign countries 0 0 0 0.0 0 0 0 0.0
Provisions 1 0 1 1.1 1 0 1 1.0General provisions 0 0 0 0.7 1 0 1 0.7Restructuring reserves 0 0 0 0.0 0 0 0 0.0Reserves for employee benefit 0 0 0 0.3 0 0 0 0.3Insurance technical reserves (Net) 0 0 0 0.0 0 0 0 0.0Other provisions 0 0 0 0.1 0 0 0 0.0
Liabilities for Tax 0 0 0 0.3 0 0 0 0.2Current liabilities for tax 0 0 0 0.3 0 0 0 0.2Deferred liabilities for tax 0 0 0 0.0 0 0 0 0.0
Lia.for Pro.&Equ.for Sale p. and from Term.Op.(Net) 0 0 0 0.0 0 0 0 0.0Subordinated Loans 0 0 0 0.0 0 0 0 0.0Shareholders' Equity 46 0 46 67.1 45 0 45 64.7
Paid-in capital 33 0 33 47.5 34 0 34 48.5Supplementary capital 2 0 2 2.6 2 0 2 3.4
Share premium 0 0 0 0.0 0 0 0 0.0Share cancellation profits 0 0 0 0.0 0 0 0 0.0Valuation changes in marketable securities 0 0 0 0.0 1 0 1 0.8Revaluation changes of property and equip. 0 0 0 0.0 0 0 0 0.0Revaluation changes of intangible assets 0 0 0 0.0 0 0 0 0.0Revaluation changes of real est.for inv. pur. 0 0 0 0.0 0 0 0 0.0Free shares from inv.&ass.,subs.& joint vent. 0 0 0 0.0 0 0 0 0.0Hedging funds (active part) 0 0 0 0.0 0 0 0 0.0Val.inc.in pro.& equ.held for sale p.and term.ope. 0 0 0 0.0 0 0 0 0.0Other capital reserves 2 0 2 2.6 2 0 2 2.6
Profit reserves 9 0 9 12.6 7 0 7 10.2Legal reserves 2 0 2 2.2 1 0 1 2.2Status reserves 0 0 0 0.0 0 0 0 0.0Extraordinary reserves 7 0 7 10.3 6 0 6 8.1Other profit reserves 0 0 0 0.0 0 0 0 0.0
Profit or loss 3 0 3 4.4 2 0 2 2.6Prior years income/loss 0 0 0 0.0 0 0 0 0.0Current year income/loss 3 0 3 4.4 2 0 2 2.6
Total Liabilities 61 8 68 100.0 62 7 69 100.0

II-198
GSD Yatırım Bankası A. .
Off Balance Sheet Commitments(USD Million)
Dec. 2010 Dec. 2009TC FC Total TC FC Total
Guarantees and Warranties 61 1 62 41 1 42Letters of guarantee 61 1 62 41 1 42Bank acceptances 0 0 0 0 0 0Letters of credit 0 0 0 0 0 0Prefinancing given as guarantee 0 0 0 0 0 0Endorsements 0 0 0 0 0 0Other guarantees and warrantees 0 0 0 0 0 0
Commitments 122 20 142 0 0 0Irrevocable commitments 0 0 0 0 0 0Revocable commitments 122 20 142 0 0 0
Derivative Financial Instruments 1 1 1 11 11 22Derivative finan. instruments held for hedging 0 0 0 0 0 0Trading transactions 1 1 1 11 11 22
Custody and Pledged Securities 874 290 1,163 729 297 1,026Items held in Custody 0 0 0 3 0 3Pledged Items 160 62 221 132 66 198Acccepted independent guaran. and warran. 714 228 942 594 232 826
Total Off Balance Sheet Commitments 1,057 312 1,369 781 309 1,090
Income-Expenditure(USD Million)
Dec. 2010 Dec. 2009
Interest Income 6 9Interest on loans 6 9Interest received from reserve deposits 0 0Interest received from banks 0 0Interest received from money market transactions 0 0Interest received from marketable securities portfolio 0 0Other interest income 0 0
Interest Expenses 1 1Interest on deposits 0 0Interest on money market transactions 1 1Interest on funds borrowed 0 0Interest on securities issued 0 0Other interest expenses 0 0
Net Interest Income/Expenses 5 8Net Fees and Commissions Income/Expenses 1 1
Fees and commissions received 1 1Fees and commissions paid 0 0
Dividend Income 0 0Trading Profit/Loss (net) 0 0
Profit/loss on trading account securities 0 0Profit/losses on derivative financial transactions 0 0Foreign exchange profit/loss 0 0
Other Operating Income 2 2Total Operating Income/Expenses 8 11Provision for Loan Losses or other Receivables (-) 0 5
Specific provisions of banks loans and other receivables* 0 4General provision expenses* 0 0
Other Operating Expenses (-) 4 4Personnel Expenses* 2 2
Net Operating Profit/Loss 3 2Surplus written as gain after merger 0 0Profit/losses from equity method applied subsidiaries 0 0Net monetory position gain/loss 0 0Profit/Loss Before Taxes from Continuing Operations 3 2Provisions for Taxes on Income from Continuing Operations (±) 0 0Net Profit/Loss from Continuing Operations 3 2Net Profit/Loss Before Taxes from Terminated Operations 0 0Provisions for Taxes on Income from Terminated Operations (±) 0 0Net Profit/Loss from Terminated Operations 0 0
Net Profit/Losses 3 2
* Used from information and disclosures related to income statement".

II-199
GSD Yatırım Bankası A. . December 2010
Ratios(%)
Dec. 2010 Dec. 2009
Capital Ratios
Shareholders’ Equity / (Amount subject to credit + market + operational risk) 41.5 42.8
Shareholders' Equity / Total Assets 67.1 64.7
(Shareholders' Equity - Permanent Assets) / Total Assets 57.2 53.2
Net On Balance Sheet Position / Total Shareholders' Equity 1.0 -1.2
Net On and Off Balance Sheet Position / Total Shareholders' Equity 0.0 0.2
Balance-Sheet Ratios
TC Assets / Total Assets 88.7 90.6
TC Liabilities / Total Liabilities 88.5 89.9
FC Assets / FC Liabilities 97.8 92.6
TC Deposits / Total Deposits - -
TC Loans / Total Loans and Receivables 96.9 98.3
Total Deposits / Total Assets 0.0 0.0
Funds Borrowed / Total Assets 12.3 15.1
Assets Quality
Financial Assets (net) / Total Assets 3.3 12.1
Total Loans and Receivables / Total Assets 86.0 76.3
Total Loans and Receivables / Total Deposits - -
Loans Under Follow-up (gross) / Total Loans and Receivables 13.2 15.3
Loans Under Follow-up (net) / Total Loans and Receivables 2.6 3.9
Specific Provisions / Loans Under Follow-up 80.2 74.7
Permanent Assets / Total Assets 10.0 11.5
Consumer Loans / Total Loans and Receivables 0.2 0.3
Liquidity
Liquid Assets / Total Assets 4.4 13.5
Liquid Assets / Short-term Liabilities 25.4 59.1
TC Liquid Assets / Total Assets 3.3 13.0
Profitability
Net Profit/Losses / Total Assets 4.4 2.6
Net Profit/Losses / Total Shareholders' Equity 6.6 4.0
Profit/Losses Before Taxes after Continuing Operations / Total Assets 5.1 2.9
Income-Expenditure Structure
Net Interest Income After Specific Provisions / Total Assets 7.2 5.2
Net Interest Income After Specific Provisions / Total Operating Income (Expenses) 64.3 33.8
Non-interest Income (net) / Total Assets 3.4 3.8
Other Operating Expenses / Total Assets 5.5 5.7
Personnel Expenses / Other Operating Expenses 54.8 53.0
Non-interest Income (net) / Other Operating Expenses 61.3 67.6
Quarterly profitability and income-expenditure ratios, except year-end figures, should be considered periodically.

II-200
ller Bankası A. .
Assets(USD Million)
Dec. 2010 % Dec. 2009 %TC FC Total Distr. TC FC Total Distr.
Cash and Balances with the Central Bank 0 0 0 0.0 0 0 0 0.0Fin.ass.where fair value cha. is refl.to I/S (Net) 0 0 0 0.0 0 0 0 0.0
Financial assets held for trading 0 0 0 0.0 0 0 0 0.0Public sector debt securities 0 0 0 0.0 0 0 0 0.0Securities representing a share in capital 0 0 0 0.0 0 0 0 0.0Derivative financial assets held for trading 0 0 0 0.0 0 0 0 0.0Other marketable securities 0 0 0 0.0 0 0 0 0.0
Fin.assets clas. as fair value change is refl.to I/S 0 0 0 0.0 0 0 0 0.0Public sector debt securities 0 0 0 0.0 0 0 0 0.0Securities representing a share in capital 0 0 0 0.0 0 0 0 0.0Loans 0 0 0 0.0 0 0 0 0.0Other marketable securities 0 0 0 0.0 0 0 0 0.0
Banks 1,842 5 1,846 29.3 1,078 4 1,082 20.1Money Market Securities 0 0 0 0.0 3 0 3 0.1
Interbank money market placements 0 0 0 0.0 3 0 3 0.1Istanbul Stock Exc. money market placements 0 0 0 0.0 0 0 0 0.0Receiv. from reverse repurchase agreements 0 0 0 0.0 0 0 0 0.0
Financial Assets Available for Sale (Net) 0 0 0 0.0 1 0 1 0.0Securities representing a share in capital 0 0 0 0.0 0 0 0 0.0Public sector debt securities 0 0 0 0.0 0 0 0 0.0Other marketable securities 0 0 0 0.0 1 0 1 0.0
Loans 4,119 218 4,338 68.9 4,012 139 4,152 77.1Loans 4,119 218 4,338 68.9 4,012 139 4,152 77.1
Loans granted to the Banks risk group 0 0 0 0.0 0 0 0 0.0Public sector debt securities 0 0 0 0.0 0 0 0 0.0Other 4,119 218 4,338 68.9 4,012 139 4,152 77.1
Loans under follow-up 0 0 0 0.0 0 0 0 0.0Specific provisions (-) 0 0 0 0.0 0 0 0 0.0
Factoring Receivables 0 0 0 0.0 0 0 0 0.0Investments held to Maturity (Net) 0 0 0 0.0 0 0 0 0.0
Public sector debt securities 0 0 0 0.0 0 0 0 0.0Other marketable securities 0 0 0 0.0 0 0 0 0.0
Investments and Associates (Net) 0 0 0 0.0 0 0 0 0.0Accounted with equity method 0 0 0 0.0 0 0 0 0.0Non-consolidated investments and associates 0 0 0 0.0 0 0 0 0.0
Financial investments and associates 0 0 0 0.0 0 0 0 0.0Non-financial investments and associates 0 0 0 0.0 0 0 0 0.0
Subsidiaries (Net) 0 0 0 0.0 0 0 0 0.0Financial subsidiaries 0 0 0 0.0 0 0 0 0.0Non-financial subsidiaries 0 0 0 0.0 0 0 0 0.0
Joint Ventures (Business Partners) (Net) 0 0 0 0.0 0 0 0 0.0Accounted with equity method 0 0 0 0.0 0 0 0 0.0Non-consolidated joint ventures 0 0 0 0.0 0 0 0 0.0
Financial joint ventures 0 0 0 0.0 0 0 0 0.0Non-financial joint ventures 0 0 0 0.0 0 0 0 0.0
Recivables From Leasing Transactions 1 0 1 0.0 1 0 1 0.0Finance lease receivables 0 0 0 0.0 0 0 0 0.0Operational leasing receivables 1 0 1 0.0 0 0 0 0.0Others 0 0 0 0.0 1 0 1 0.0Unearned income (-) 0 0 0 0.0 0 0 0 0.0
Derivative Financial Assets Held for Hedging 0 0 0 0.0 0 0 0 0.0Fair value hedges 0 0 0 0.0 0 0 0 0.0Cash flow hedges 0 0 0 0.0 0 0 0 0.0Hedges for invest. made in foreign countries 0 0 0 0.0 0 0 0 0.0
Property and Equipment (Net) 73 0 73 1.2 79 0 79 1.5Intangible Assets (Net) 1 0 1 0.0 0 0 0 0.0
Goodwill 0 0 0 0.0 0 0 0 0.0Other 1 0 1 0.0 0 0 0 0.0
Real Estates for Investment Purpose (Net) 12 0 12 0.2 0 0 0 0.0Assets for Tax 4 0 4 0.1 53 0 53 1.0
Current assets for tax 0 0 0 0.0 50 0 50 0.9Deferred assets for tax 4 0 4 0.1 3 0 3 0.1
Prop.&Equ.for Sale p. and from Term.Op.(Net) 0 0 0 0.0 0 0 0 0.0Other Assets 15 3 18 0.3 13 1 14 0.3
Total Assets 6,068 226 6,294 100.0 5,240 145 5,385 100.0
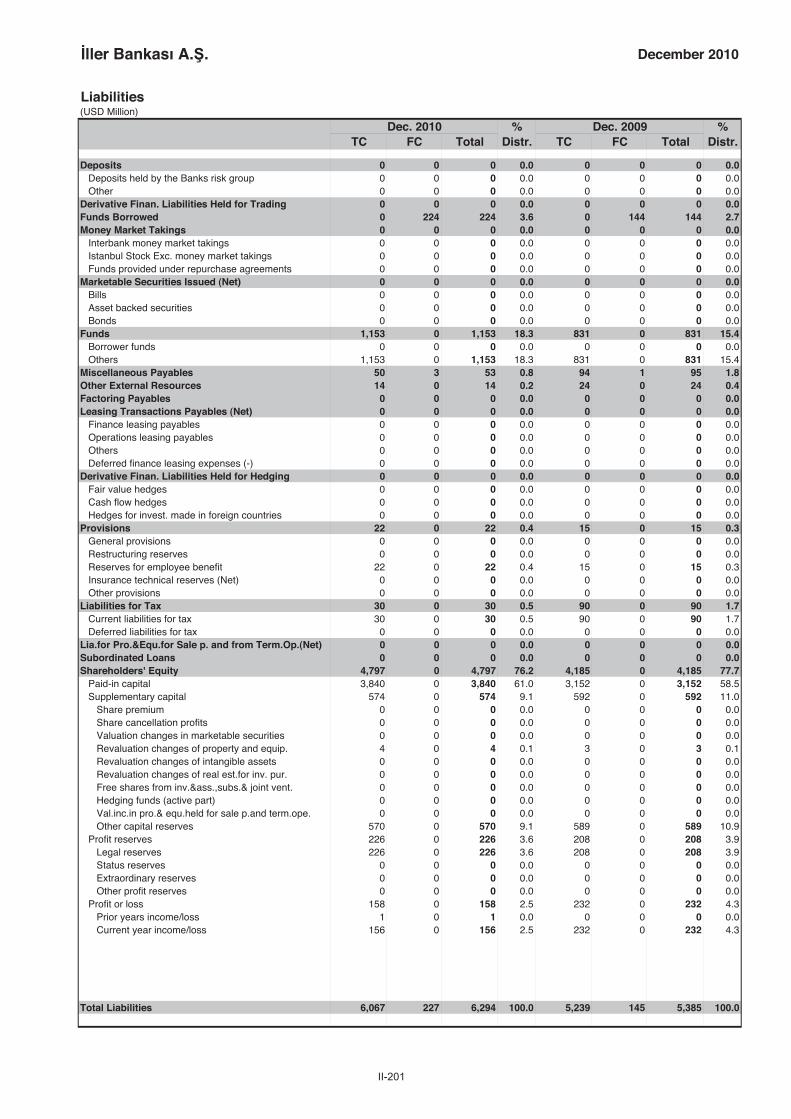
II-201
ller Bankası A. . December 2010
Liabilities(USD Million)
Dec. 2010 % Dec. 2009 %TC FC Total Distr. TC FC Total Distr.
Deposits 0 0 0 0.0 0 0 0 0.0Deposits held by the Banks risk group 0 0 0 0.0 0 0 0 0.0Other 0 0 0 0.0 0 0 0 0.0
Derivative Finan. Liabilities Held for Trading 0 0 0 0.0 0 0 0 0.0Funds Borrowed 0 224 224 3.6 0 144 144 2.7Money Market Takings 0 0 0 0.0 0 0 0 0.0
Interbank money market takings 0 0 0 0.0 0 0 0 0.0Istanbul Stock Exc. money market takings 0 0 0 0.0 0 0 0 0.0Funds provided under repurchase agreements 0 0 0 0.0 0 0 0 0.0
Marketable Securities Issued (Net) 0 0 0 0.0 0 0 0 0.0Bills 0 0 0 0.0 0 0 0 0.0Asset backed securities 0 0 0 0.0 0 0 0 0.0Bonds 0 0 0 0.0 0 0 0 0.0
Funds 1,153 0 1,153 18.3 831 0 831 15.4Borrower funds 0 0 0 0.0 0 0 0 0.0Others 1,153 0 1,153 18.3 831 0 831 15.4
Miscellaneous Payables 50 3 53 0.8 94 1 95 1.8Other External Resources 14 0 14 0.2 24 0 24 0.4Factoring Payables 0 0 0 0.0 0 0 0 0.0Leasing Transactions Payables (Net) 0 0 0 0.0 0 0 0 0.0
Finance leasing payables 0 0 0 0.0 0 0 0 0.0Operations leasing payables 0 0 0 0.0 0 0 0 0.0Others 0 0 0 0.0 0 0 0 0.0Deferred finance leasing expenses (-) 0 0 0 0.0 0 0 0 0.0
Derivative Finan. Liabilities Held for Hedging 0 0 0 0.0 0 0 0 0.0Fair value hedges 0 0 0 0.0 0 0 0 0.0Cash flow hedges 0 0 0 0.0 0 0 0 0.0Hedges for invest. made in foreign countries 0 0 0 0.0 0 0 0 0.0
Provisions 22 0 22 0.4 15 0 15 0.3General provisions 0 0 0 0.0 0 0 0 0.0Restructuring reserves 0 0 0 0.0 0 0 0 0.0Reserves for employee benefit 22 0 22 0.4 15 0 15 0.3Insurance technical reserves (Net) 0 0 0 0.0 0 0 0 0.0Other provisions 0 0 0 0.0 0 0 0 0.0
Liabilities for Tax 30 0 30 0.5 90 0 90 1.7Current liabilities for tax 30 0 30 0.5 90 0 90 1.7Deferred liabilities for tax 0 0 0 0.0 0 0 0 0.0
Lia.for Pro.&Equ.for Sale p. and from Term.Op.(Net) 0 0 0 0.0 0 0 0 0.0Subordinated Loans 0 0 0 0.0 0 0 0 0.0Shareholders' Equity 4,797 0 4,797 76.2 4,185 0 4,185 77.7
Paid-in capital 3,840 0 3,840 61.0 3,152 0 3,152 58.5Supplementary capital 574 0 574 9.1 592 0 592 11.0
Share premium 0 0 0 0.0 0 0 0 0.0Share cancellation profits 0 0 0 0.0 0 0 0 0.0Valuation changes in marketable securities 0 0 0 0.0 0 0 0 0.0Revaluation changes of property and equip. 4 0 4 0.1 3 0 3 0.1Revaluation changes of intangible assets 0 0 0 0.0 0 0 0 0.0Revaluation changes of real est.for inv. pur. 0 0 0 0.0 0 0 0 0.0Free shares from inv.&ass.,subs.& joint vent. 0 0 0 0.0 0 0 0 0.0Hedging funds (active part) 0 0 0 0.0 0 0 0 0.0Val.inc.in pro.& equ.held for sale p.and term.ope. 0 0 0 0.0 0 0 0 0.0Other capital reserves 570 0 570 9.1 589 0 589 10.9
Profit reserves 226 0 226 3.6 208 0 208 3.9Legal reserves 226 0 226 3.6 208 0 208 3.9Status reserves 0 0 0 0.0 0 0 0 0.0Extraordinary reserves 0 0 0 0.0 0 0 0 0.0Other profit reserves 0 0 0 0.0 0 0 0 0.0
Profit or loss 158 0 158 2.5 232 0 232 4.3Prior years income/loss 1 0 1 0.0 0 0 0 0.0Current year income/loss 156 0 156 2.5 232 0 232 4.3
Total Liabilities 6,067 227 6,294 100.0 5,239 145 5,385 100.0
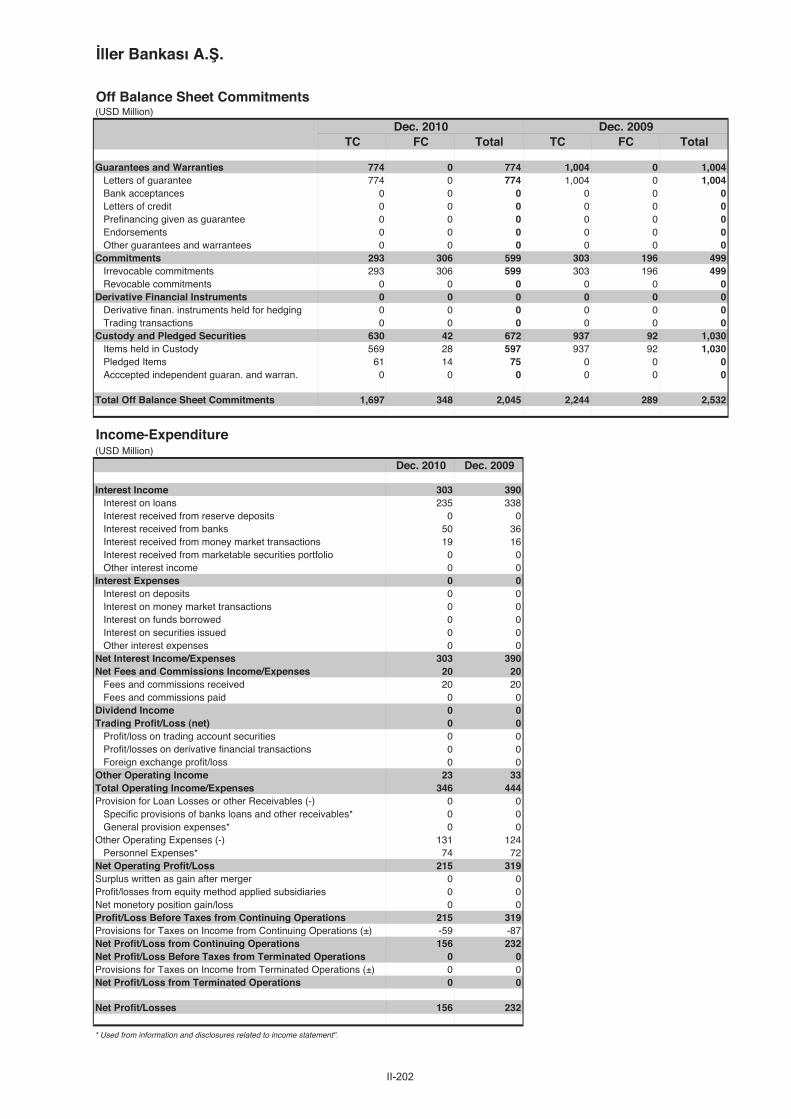
II-202
ller Bankası A. .
Off Balance Sheet Commitments(USD Million)
Dec. 2010 Dec. 2009TC FC Total TC FC Total
Guarantees and Warranties 774 0 774 1,004 0 1,004Letters of guarantee 774 0 774 1,004 0 1,004Bank acceptances 0 0 0 0 0 0Letters of credit 0 0 0 0 0 0Prefinancing given as guarantee 0 0 0 0 0 0Endorsements 0 0 0 0 0 0Other guarantees and warrantees 0 0 0 0 0 0
Commitments 293 306 599 303 196 499Irrevocable commitments 293 306 599 303 196 499Revocable commitments 0 0 0 0 0 0
Derivative Financial Instruments 0 0 0 0 0 0Derivative finan. instruments held for hedging 0 0 0 0 0 0Trading transactions 0 0 0 0 0 0
Custody and Pledged Securities 630 42 672 937 92 1,030Items held in Custody 569 28 597 937 92 1,030Pledged Items 61 14 75 0 0 0Acccepted independent guaran. and warran. 0 0 0 0 0 0
Total Off Balance Sheet Commitments 1,697 348 2,045 2,244 289 2,532
Income-Expenditure(USD Million)
Dec. 2010 Dec. 2009
Interest Income 303 390Interest on loans 235 338Interest received from reserve deposits 0 0Interest received from banks 50 36Interest received from money market transactions 19 16Interest received from marketable securities portfolio 0 0Other interest income 0 0
Interest Expenses 0 0Interest on deposits 0 0Interest on money market transactions 0 0Interest on funds borrowed 0 0Interest on securities issued 0 0Other interest expenses 0 0
Net Interest Income/Expenses 303 390Net Fees and Commissions Income/Expenses 20 20
Fees and commissions received 20 20Fees and commissions paid 0 0
Dividend Income 0 0Trading Profit/Loss (net) 0 0
Profit/loss on trading account securities 0 0Profit/losses on derivative financial transactions 0 0Foreign exchange profit/loss 0 0
Other Operating Income 23 33Total Operating Income/Expenses 346 444Provision for Loan Losses or other Receivables (-) 0 0
Specific provisions of banks loans and other receivables* 0 0General provision expenses* 0 0
Other Operating Expenses (-) 131 124Personnel Expenses* 74 72
Net Operating Profit/Loss 215 319Surplus written as gain after merger 0 0Profit/losses from equity method applied subsidiaries 0 0Net monetory position gain/loss 0 0Profit/Loss Before Taxes from Continuing Operations 215 319Provisions for Taxes on Income from Continuing Operations (±) -59 -87Net Profit/Loss from Continuing Operations 156 232Net Profit/Loss Before Taxes from Terminated Operations 0 0Provisions for Taxes on Income from Terminated Operations (±) 0 0Net Profit/Loss from Terminated Operations 0 0
Net Profit/Losses 156 232
* Used from information and disclosures related to income statement".

II-203
ller Bankası A. . December 2010
Ratios(%)
Dec. 2010 Dec. 2009
Capital Ratios
Shareholders’ Equity / (Amount subject to credit + market + operational risk) 73.1 66.4
Shareholders' Equity / Total Assets 76.2 77.7
(Shareholders' Equity - Permanent Assets) / Total Assets 75.0 76.3
Net On Balance Sheet Position / Total Shareholders' Equity 0.0 0.0
Net On and Off Balance Sheet Position / Total Shareholders' Equity 0.0 0.0
Balance-Sheet Ratios
TC Assets / Total Assets 96.4 97.3
TC Liabilities / Total Liabilities 96.4 97.3
FC Assets / FC Liabilities 99.8 99.6
TC Deposits / Total Deposits - -
TC Loans / Total Loans and Receivables 95.0 96.6
Total Deposits / Total Assets 0.0 0.0
Funds Borrowed / Total Assets 3.6 2.7
Assets Quality
Financial Assets (net) / Total Assets 0.0 0.0
Total Loans and Receivables / Total Assets 68.9 77.1
Total Loans and Receivables / Total Deposits - -
Loans Under Follow-up (gross) / Total Loans and Receivables 0.0 0.0
Loans Under Follow-up (net) / Total Loans and Receivables 0.0 0.0
Specific Provisions / Loans Under Follow-up 100.0 100.0
Permanent Assets / Total Assets 1.2 1.5
Consumer Loans / Total Loans and Receivables 0.2 0.2
Liquidity
Liquid Assets / Total Assets 29.3 20.2
Liquid Assets / Short-term Liabilities 193.5 158.0
TC Liquid Assets / Total Assets 29.3 20.1
Profitability
Net Profit/Losses / Total Assets 2.5 4.3
Net Profit/Losses / Total Shareholders' Equity 3.3 5.5
Profit/Losses Before Taxes after Continuing Operations / Total Assets 3.4 5.9
Income-Expenditure Structure
Net Interest Income After Specific Provisions / Total Assets 4.8 7.2
Net Interest Income After Specific Provisions / Total Operating Income (Expenses) 87.6 88.0
Non-interest Income (net) / Total Assets 0.7 1.0
Other Operating Expenses / Total Assets 2.1 2.3
Personnel Expenses / Other Operating Expenses 56.2 58.2
Non-interest Income (net) / Other Operating Expenses 32.7 42.8
Quarterly profitability and income-expenditure ratios, except year-end figures, should be considered periodically.
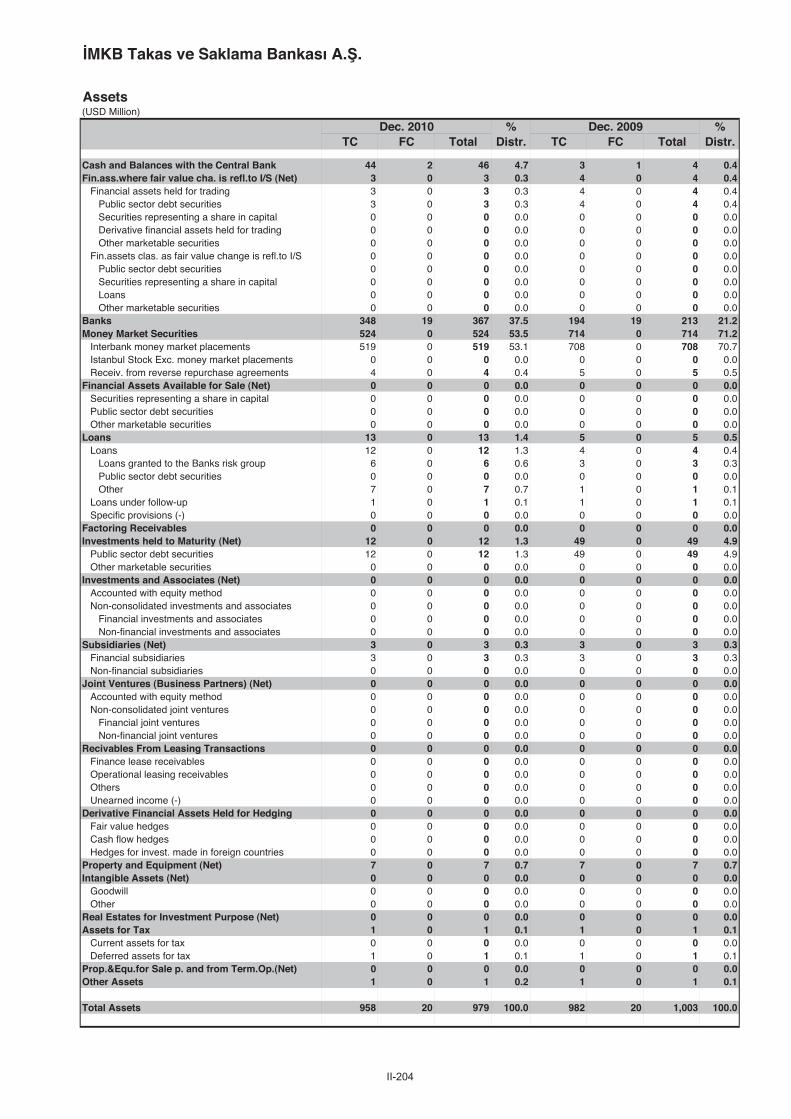
II-204
MKB Takas ve Saklama Bankası A. .
Assets(USD Million)
Dec. 2010 % Dec. 2009 %TC FC Total Distr. TC FC Total Distr.
Cash and Balances with the Central Bank 44 2 46 4.7 3 1 4 0.4Fin.ass.where fair value cha. is refl.to I/S (Net) 3 0 3 0.3 4 0 4 0.4
Financial assets held for trading 3 0 3 0.3 4 0 4 0.4Public sector debt securities 3 0 3 0.3 4 0 4 0.4Securities representing a share in capital 0 0 0 0.0 0 0 0 0.0Derivative financial assets held for trading 0 0 0 0.0 0 0 0 0.0Other marketable securities 0 0 0 0.0 0 0 0 0.0
Fin.assets clas. as fair value change is refl.to I/S 0 0 0 0.0 0 0 0 0.0Public sector debt securities 0 0 0 0.0 0 0 0 0.0Securities representing a share in capital 0 0 0 0.0 0 0 0 0.0Loans 0 0 0 0.0 0 0 0 0.0Other marketable securities 0 0 0 0.0 0 0 0 0.0
Banks 348 19 367 37.5 194 19 213 21.2Money Market Securities 524 0 524 53.5 714 0 714 71.2
Interbank money market placements 519 0 519 53.1 708 0 708 70.7Istanbul Stock Exc. money market placements 0 0 0 0.0 0 0 0 0.0Receiv. from reverse repurchase agreements 4 0 4 0.4 5 0 5 0.5
Financial Assets Available for Sale (Net) 0 0 0 0.0 0 0 0 0.0Securities representing a share in capital 0 0 0 0.0 0 0 0 0.0Public sector debt securities 0 0 0 0.0 0 0 0 0.0Other marketable securities 0 0 0 0.0 0 0 0 0.0
Loans 13 0 13 1.4 5 0 5 0.5Loans 12 0 12 1.3 4 0 4 0.4
Loans granted to the Banks risk group 6 0 6 0.6 3 0 3 0.3Public sector debt securities 0 0 0 0.0 0 0 0 0.0Other 7 0 7 0.7 1 0 1 0.1
Loans under follow-up 1 0 1 0.1 1 0 1 0.1Specific provisions (-) 0 0 0 0.0 0 0 0 0.0
Factoring Receivables 0 0 0 0.0 0 0 0 0.0Investments held to Maturity (Net) 12 0 12 1.3 49 0 49 4.9
Public sector debt securities 12 0 12 1.3 49 0 49 4.9Other marketable securities 0 0 0 0.0 0 0 0 0.0
Investments and Associates (Net) 0 0 0 0.0 0 0 0 0.0Accounted with equity method 0 0 0 0.0 0 0 0 0.0Non-consolidated investments and associates 0 0 0 0.0 0 0 0 0.0
Financial investments and associates 0 0 0 0.0 0 0 0 0.0Non-financial investments and associates 0 0 0 0.0 0 0 0 0.0
Subsidiaries (Net) 3 0 3 0.3 3 0 3 0.3Financial subsidiaries 3 0 3 0.3 3 0 3 0.3Non-financial subsidiaries 0 0 0 0.0 0 0 0 0.0
Joint Ventures (Business Partners) (Net) 0 0 0 0.0 0 0 0 0.0Accounted with equity method 0 0 0 0.0 0 0 0 0.0Non-consolidated joint ventures 0 0 0 0.0 0 0 0 0.0
Financial joint ventures 0 0 0 0.0 0 0 0 0.0Non-financial joint ventures 0 0 0 0.0 0 0 0 0.0
Recivables From Leasing Transactions 0 0 0 0.0 0 0 0 0.0Finance lease receivables 0 0 0 0.0 0 0 0 0.0Operational leasing receivables 0 0 0 0.0 0 0 0 0.0Others 0 0 0 0.0 0 0 0 0.0Unearned income (-) 0 0 0 0.0 0 0 0 0.0
Derivative Financial Assets Held for Hedging 0 0 0 0.0 0 0 0 0.0Fair value hedges 0 0 0 0.0 0 0 0 0.0Cash flow hedges 0 0 0 0.0 0 0 0 0.0Hedges for invest. made in foreign countries 0 0 0 0.0 0 0 0 0.0
Property and Equipment (Net) 7 0 7 0.7 7 0 7 0.7Intangible Assets (Net) 0 0 0 0.0 0 0 0 0.0
Goodwill 0 0 0 0.0 0 0 0 0.0Other 0 0 0 0.0 0 0 0 0.0
Real Estates for Investment Purpose (Net) 0 0 0 0.0 0 0 0 0.0Assets for Tax 1 0 1 0.1 1 0 1 0.1
Current assets for tax 0 0 0 0.0 0 0 0 0.0Deferred assets for tax 1 0 1 0.1 1 0 1 0.1
Prop.&Equ.for Sale p. and from Term.Op.(Net) 0 0 0 0.0 0 0 0 0.0Other Assets 1 0 1 0.2 1 0 1 0.1
Total Assets 958 20 979 100.0 982 20 1,003 100.0

II-205
MKB Takas ve Saklama Bankası A. . December 2010
Liabilities(USD Million)
Dec. 2010 % Dec. 2009 %TC FC Total Distr. TC FC Total Distr.
Deposits 0 0 0 0.0 0 0 0 0.0Deposits held by the Banks risk group 0 0 0 0.0 0 0 0 0.0Other 0 0 0 0.0 0 0 0 0.0
Derivative Finan. Liabilities Held for Trading 0 0 0 0.0 0 0 0 0.0Funds Borrowed 114 0 114 11.7 61 0 61 6.0Money Market Takings 0 0 0 0.0 0 0 0 0.0
Interbank money market takings 0 0 0 0.0 0 0 0 0.0Istanbul Stock Exc. money market takings 0 0 0 0.0 0 0 0 0.0Funds provided under repurchase agreements 0 0 0 0.0 0 0 0 0.0
Marketable Securities Issued (Net) 0 0 0 0.0 0 0 0 0.0Bills 0 0 0 0.0 0 0 0 0.0Asset backed securities 0 0 0 0.0 0 0 0 0.0Bonds 0 0 0 0.0 0 0 0 0.0
Funds 0 0 0 0.0 0 0 0 0.0Borrower funds 0 0 0 0.0 0 0 0 0.0Others 0 0 0 0.0 0 0 0 0.0
Miscellaneous Payables 551 19 570 58.3 619 19 639 63.7Other External Resources 92 0 92 9.4 109 0 109 10.9Factoring Payables 0 0 0 0.0 0 0 0 0.0Leasing Transactions Payables (Net) 0 0 0 0.0 0 0 0 0.0
Finance leasing payables 0 0 0 0.0 0 0 0 0.0Operations leasing payables 0 0 0 0.0 0 0 0 0.0Others 0 0 0 0.0 0 0 0 0.0Deferred finance leasing expenses (-) 0 0 0 0.0 0 0 0 0.0
Derivative Finan. Liabilities Held for Hedging 0 0 0 0.0 0 0 0 0.0Fair value hedges 0 0 0 0.0 0 0 0 0.0Cash flow hedges 0 0 0 0.0 0 0 0 0.0Hedges for invest. made in foreign countries 0 0 0 0.0 0 0 0 0.0
Provisions 6 0 6 0.7 5 0 5 0.5General provisions 4 0 4 0.4 2 0 2 0.2Restructuring reserves 0 0 0 0.0 0 0 0 0.0Reserves for employee benefit 3 0 3 0.3 2 0 2 0.2Insurance technical reserves (Net) 0 0 0 0.0 0 0 0 0.0Other provisions 0 0 0 0.0 0 0 0 0.0
Liabilities for Tax 2 0 2 0.2 2 0 2 0.2Current liabilities for tax 2 0 2 0.2 2 0 2 0.2Deferred liabilities for tax 0 0 0 0.0 0 0 0 0.0
Lia.for Pro.&Equ.for Sale p. and from Term.Op.(Net) 0 0 0 0.0 0 0 0 0.0Subordinated Loans 0 0 0 0.0 0 0 0 0.0Shareholders' Equity 194 0 194 19.8 188 0 188 18.8
Paid-in capital 39 0 39 4.0 40 0 40 4.0Supplementary capital 63 0 63 6.4 65 0 65 6.5
Share premium 0 0 0 0.0 0 0 0 0.0Share cancellation profits 0 0 0 0.0 0 0 0 0.0Valuation changes in marketable securities 0 0 0 0.0 0 0 0 0.0Revaluation changes of property and equip. 0 0 0 0.0 0 0 0 0.0Revaluation changes of intangible assets 0 0 0 0.0 0 0 0 0.0Revaluation changes of real est.for inv. pur. 0 0 0 0.0 0 0 0 0.0Free shares from inv.&ass.,subs.& joint vent. 0 0 0 0.0 0 0 0 0.0Hedging funds (active part) 0 0 0 0.0 0 0 0 0.0Val.inc.in pro.& equ.held for sale p.and term.ope. 0 0 0 0.0 0 0 0 0.0Other capital reserves 63 0 63 6.4 65 0 65 6.5
Profit reserves 72 0 72 7.4 57 0 57 5.7Legal reserves 12 0 12 1.2 11 0 11 1.1Status reserves 0 0 0 0.0 0 0 0 0.0Extraordinary reserves 59 0 59 6.0 43 0 43 4.3Other profit reserves 2 0 2 0.2 2 0 2 0.2
Profit or loss 19 0 19 2.0 26 0 26 2.6Prior years income/loss 1 0 1 0.1 1 0 1 0.1Current year income/loss 18 0 18 1.9 25 0 25 2.5
Total Liabilities 959 19 979 100.0 983 19 1,003 100.0
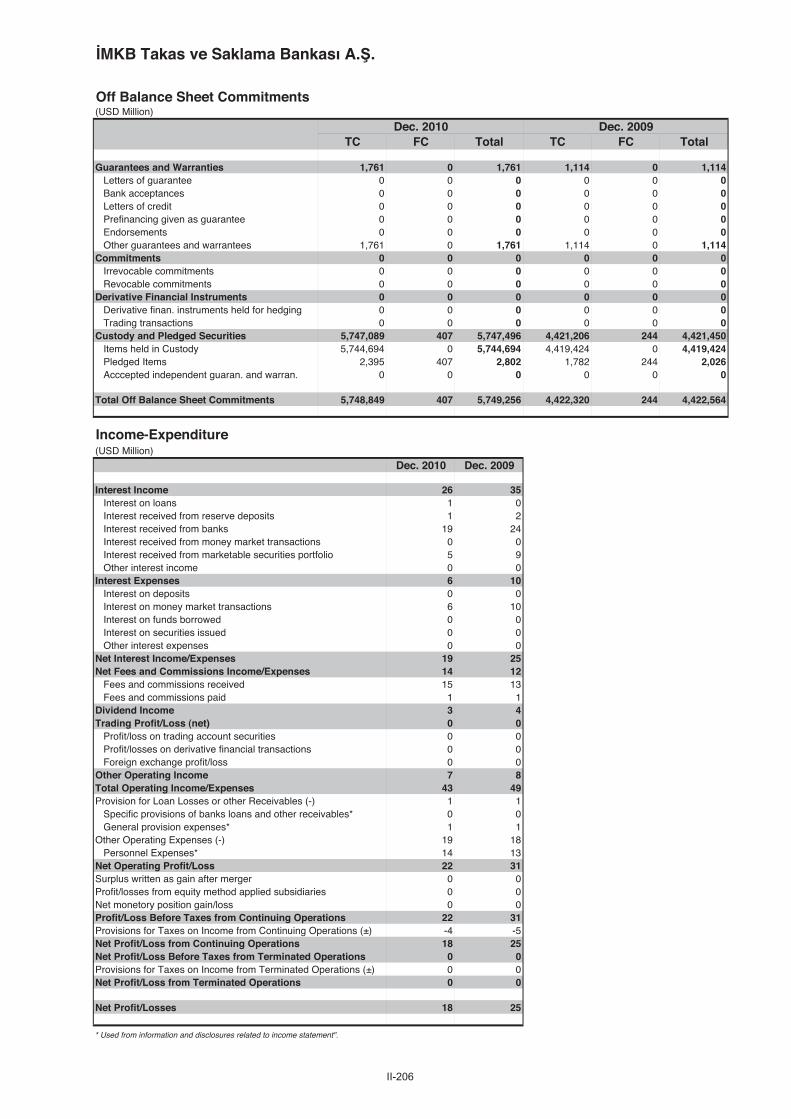
II-206
MKB Takas ve Saklama Bankası A. .
Off Balance Sheet Commitments(USD Million)
Dec. 2010 Dec. 2009TC FC Total TC FC Total
Guarantees and Warranties 1,761 0 1,761 1,114 0 1,114Letters of guarantee 0 0 0 0 0 0Bank acceptances 0 0 0 0 0 0Letters of credit 0 0 0 0 0 0Prefinancing given as guarantee 0 0 0 0 0 0Endorsements 0 0 0 0 0 0Other guarantees and warrantees 1,761 0 1,761 1,114 0 1,114
Commitments 0 0 0 0 0 0Irrevocable commitments 0 0 0 0 0 0Revocable commitments 0 0 0 0 0 0
Derivative Financial Instruments 0 0 0 0 0 0Derivative finan. instruments held for hedging 0 0 0 0 0 0Trading transactions 0 0 0 0 0 0
Custody and Pledged Securities 5,747,089 407 5,747,496 4,421,206 244 4,421,450Items held in Custody 5,744,694 0 5,744,694 4,419,424 0 4,419,424Pledged Items 2,395 407 2,802 1,782 244 2,026Acccepted independent guaran. and warran. 0 0 0 0 0 0
Total Off Balance Sheet Commitments 5,748,849 407 5,749,256 4,422,320 244 4,422,564
Income-Expenditure(USD Million)
Dec. 2010 Dec. 2009
Interest Income 26 35Interest on loans 1 0Interest received from reserve deposits 1 2Interest received from banks 19 24Interest received from money market transactions 0 0Interest received from marketable securities portfolio 5 9Other interest income 0 0
Interest Expenses 6 10Interest on deposits 0 0Interest on money market transactions 6 10Interest on funds borrowed 0 0Interest on securities issued 0 0Other interest expenses 0 0
Net Interest Income/Expenses 19 25Net Fees and Commissions Income/Expenses 14 12
Fees and commissions received 15 13Fees and commissions paid 1 1
Dividend Income 3 4Trading Profit/Loss (net) 0 0
Profit/loss on trading account securities 0 0Profit/losses on derivative financial transactions 0 0Foreign exchange profit/loss 0 0
Other Operating Income 7 8Total Operating Income/Expenses 43 49Provision for Loan Losses or other Receivables (-) 1 1
Specific provisions of banks loans and other receivables* 0 0General provision expenses* 1 1
Other Operating Expenses (-) 19 18Personnel Expenses* 14 13
Net Operating Profit/Loss 22 31Surplus written as gain after merger 0 0Profit/losses from equity method applied subsidiaries 0 0Net monetory position gain/loss 0 0Profit/Loss Before Taxes from Continuing Operations 22 31Provisions for Taxes on Income from Continuing Operations (±) -4 -5Net Profit/Loss from Continuing Operations 18 25Net Profit/Loss Before Taxes from Terminated Operations 0 0Provisions for Taxes on Income from Terminated Operations (±) 0 0Net Profit/Loss from Terminated Operations 0 0
Net Profit/Losses 18 25
* Used from information and disclosures related to income statement".
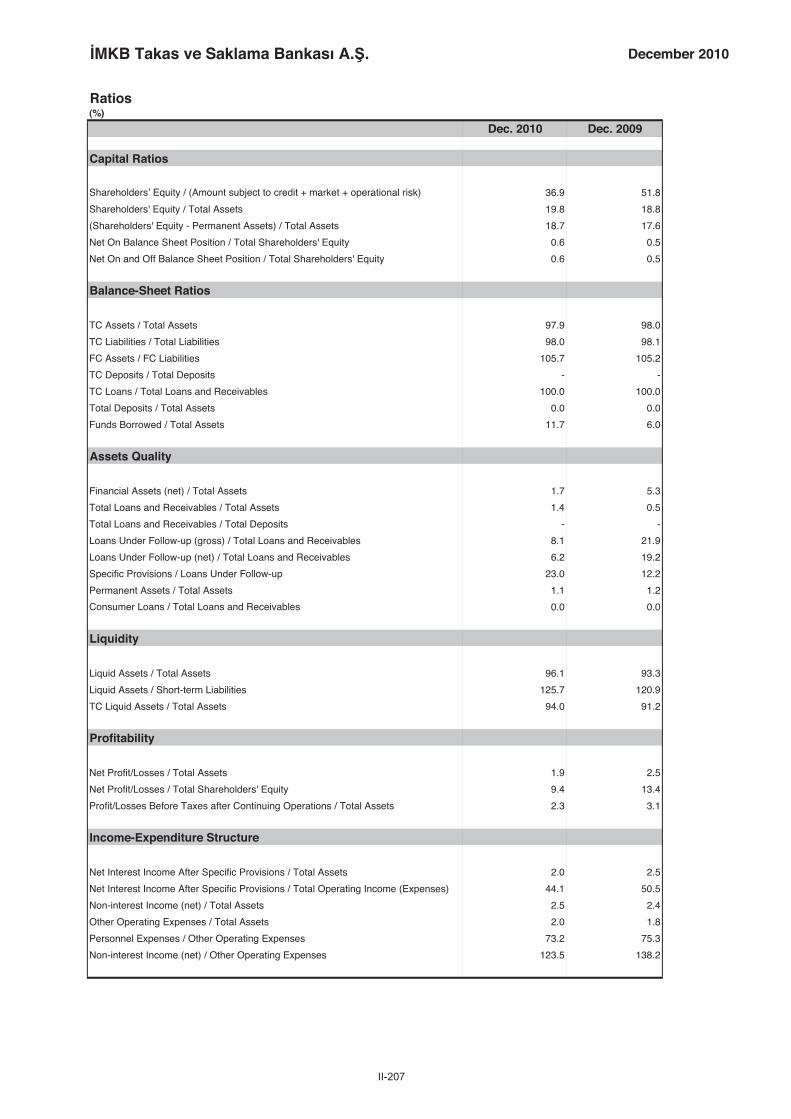
II-207
MKB Takas ve Saklama Bankası A. . December 2010
Ratios(%)
Dec. 2010 Dec. 2009
Capital Ratios
Shareholders’ Equity / (Amount subject to credit + market + operational risk) 36.9 51.8
Shareholders' Equity / Total Assets 19.8 18.8
(Shareholders' Equity - Permanent Assets) / Total Assets 18.7 17.6
Net On Balance Sheet Position / Total Shareholders' Equity 0.6 0.5
Net On and Off Balance Sheet Position / Total Shareholders' Equity 0.6 0.5
Balance-Sheet Ratios
TC Assets / Total Assets 97.9 98.0
TC Liabilities / Total Liabilities 98.0 98.1
FC Assets / FC Liabilities 105.7 105.2
TC Deposits / Total Deposits - -
TC Loans / Total Loans and Receivables 100.0 100.0
Total Deposits / Total Assets 0.0 0.0
Funds Borrowed / Total Assets 11.7 6.0
Assets Quality
Financial Assets (net) / Total Assets 1.7 5.3
Total Loans and Receivables / Total Assets 1.4 0.5
Total Loans and Receivables / Total Deposits - -
Loans Under Follow-up (gross) / Total Loans and Receivables 8.1 21.9
Loans Under Follow-up (net) / Total Loans and Receivables 6.2 19.2
Specific Provisions / Loans Under Follow-up 23.0 12.2
Permanent Assets / Total Assets 1.1 1.2
Consumer Loans / Total Loans and Receivables 0.0 0.0
Liquidity
Liquid Assets / Total Assets 96.1 93.3
Liquid Assets / Short-term Liabilities 125.7 120.9
TC Liquid Assets / Total Assets 94.0 91.2
Profitability
Net Profit/Losses / Total Assets 1.9 2.5
Net Profit/Losses / Total Shareholders' Equity 9.4 13.4
Profit/Losses Before Taxes after Continuing Operations / Total Assets 2.3 3.1
Income-Expenditure Structure
Net Interest Income After Specific Provisions / Total Assets 2.0 2.5
Net Interest Income After Specific Provisions / Total Operating Income (Expenses) 44.1 50.5
Non-interest Income (net) / Total Assets 2.5 2.4
Other Operating Expenses / Total Assets 2.0 1.8
Personnel Expenses / Other Operating Expenses 73.2 75.3
Non-interest Income (net) / Other Operating Expenses 123.5 138.2
Quarterly profitability and income-expenditure ratios, except year-end figures, should be considered periodically.

II-208
Merrill Lynch Yatırım Bank A. .
Assets(USD Million)
Dec. 2010 % Dec. 2009 %TC FC Total Distr. TC FC Total Distr.
Cash and Balances with the Central Bank 0 9 10 4.3 72 7 79 56.9Fin.ass.where fair value cha. is refl.to I/S (Net) 36 0 36 16.4 14 0 14 10.0
Financial assets held for trading 36 0 36 16.4 14 0 14 10.0Public sector debt securities 36 0 36 16.3 14 0 14 9.9Securities representing a share in capital 0 0 0 0.0 0 0 0 0.0Derivative financial assets held for trading 0 0 0 0.1 0 0 0 0.1Other marketable securities 0 0 0 0.0 0 0 0 0.0
Fin.assets clas. as fair value change is refl.to I/S 0 0 0 0.0 0 0 0 0.0Public sector debt securities 0 0 0 0.0 0 0 0 0.0Securities representing a share in capital 0 0 0 0.0 0 0 0 0.0Loans 0 0 0 0.0 0 0 0 0.0Other marketable securities 0 0 0 0.0 0 0 0 0.0
Banks 116 0 116 52.7 14 0 14 10.0Money Market Securities 13 0 13 5.9 0 0 0 0.0
Interbank money market placements 0 0 0 0.0 0 0 0 0.0Istanbul Stock Exc. money market placements 0 0 0 0.0 0 0 0 0.0Receiv. from reverse repurchase agreements 13 0 13 5.9 0 0 0 0.0
Financial Assets Available for Sale (Net) 0 0 0 0.0 0 0 0 0.0Securities representing a share in capital 0 0 0 0.0 0 0 0 0.0Public sector debt securities 0 0 0 0.0 0 0 0 0.0Other marketable securities 0 0 0 0.0 0 0 0 0.0
Loans 0 0 0 0.0 0 0 0 0.0Loans 0 0 0 0.0 0 0 0 0.0
Loans granted to the Banks risk group 0 0 0 0.0 0 0 0 0.0Public sector debt securities 0 0 0 0.0 0 0 0 0.0Other 0 0 0 0.0 0 0 0 0.0
Loans under follow-up 0 0 0 0.0 0 0 0 0.0Specific provisions (-) 0 0 0 0.0 0 0 0 0.0
Factoring Receivables 0 0 0 0.0 0 0 0 0.0Investments held to Maturity (Net) 0 0 0 0.0 0 0 0 0.0
Public sector debt securities 0 0 0 0.0 0 0 0 0.0Other marketable securities 0 0 0 0.0 0 0 0 0.0
Investments and Associates (Net) 0 0 0 0.0 0 0 0 0.0Accounted with equity method 0 0 0 0.0 0 0 0 0.0Non-consolidated investments and associates 0 0 0 0.0 0 0 0 0.0
Financial investments and associates 0 0 0 0.0 0 0 0 0.0Non-financial investments and associates 0 0 0 0.0 0 0 0 0.0
Subsidiaries (Net) 2 0 2 0.9 2 0 2 1.5Financial subsidiaries 2 0 2 0.9 2 0 2 1.5Non-financial subsidiaries 0 0 0 0.0 0 0 0 0.0
Joint Ventures (Business Partners) (Net) 0 0 0 0.0 0 0 0 0.0Accounted with equity method 0 0 0 0.0 0 0 0 0.0Non-consolidated joint ventures 0 0 0 0.0 0 0 0 0.0
Financial joint ventures 0 0 0 0.0 0 0 0 0.0Non-financial joint ventures 0 0 0 0.0 0 0 0 0.0
Recivables From Leasing Transactions 0 0 0 0.0 0 0 0 0.0Finance lease receivables 0 0 0 0.0 0 0 0 0.0Operational leasing receivables 0 0 0 0.0 0 0 0 0.0Others 0 0 0 0.0 0 0 0 0.0Unearned income (-) 0 0 0 0.0 0 0 0 0.0
Derivative Financial Assets Held for Hedging 0 0 0 0.0 0 0 0 0.0Fair value hedges 0 0 0 0.0 0 0 0 0.0Cash flow hedges 0 0 0 0.0 0 0 0 0.0Hedges for invest. made in foreign countries 0 0 0 0.0 0 0 0 0.0
Property and Equipment (Net) 1 0 1 0.4 1 0 1 1.1Intangible Assets (Net) 0 0 0 0.1 0 0 0 0.2
Goodwill 0 0 0 0.0 0 0 0 0.0Other 0 0 0 0.1 0 0 0 0.2
Real Estates for Investment Purpose (Net) 0 0 0 0.0 0 0 0 0.0Assets for Tax 1 0 1 0.6 1 0 1 0.6
Current assets for tax 0 0 0 0.0 0 0 0 0.0Deferred assets for tax 1 0 1 0.6 1 0 1 0.6
Prop.&Equ.for Sale p. and from Term.Op.(Net) 0 0 0 0.0 0 0 0 0.0Other Assets 3 39 41 18.8 5 22 27 19.7
Total Assets 172 48 220 100.0 110 29 139 100.0
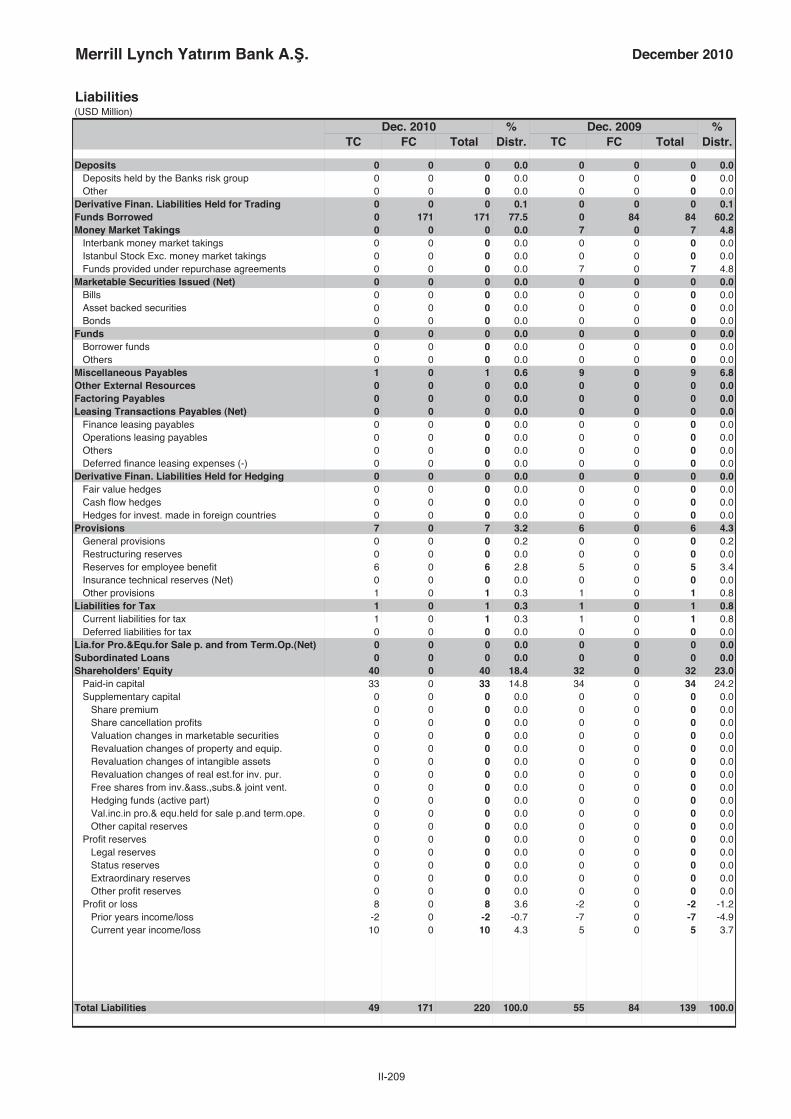
II-209
Merrill Lynch Yatırım Bank A. . December 2010
Liabilities(USD Million)
Dec. 2010 % Dec. 2009 %TC FC Total Distr. TC FC Total Distr.
Deposits 0 0 0 0.0 0 0 0 0.0Deposits held by the Banks risk group 0 0 0 0.0 0 0 0 0.0Other 0 0 0 0.0 0 0 0 0.0
Derivative Finan. Liabilities Held for Trading 0 0 0 0.1 0 0 0 0.1Funds Borrowed 0 171 171 77.5 0 84 84 60.2Money Market Takings 0 0 0 0.0 7 0 7 4.8
Interbank money market takings 0 0 0 0.0 0 0 0 0.0Istanbul Stock Exc. money market takings 0 0 0 0.0 0 0 0 0.0Funds provided under repurchase agreements 0 0 0 0.0 7 0 7 4.8
Marketable Securities Issued (Net) 0 0 0 0.0 0 0 0 0.0Bills 0 0 0 0.0 0 0 0 0.0Asset backed securities 0 0 0 0.0 0 0 0 0.0Bonds 0 0 0 0.0 0 0 0 0.0
Funds 0 0 0 0.0 0 0 0 0.0Borrower funds 0 0 0 0.0 0 0 0 0.0Others 0 0 0 0.0 0 0 0 0.0
Miscellaneous Payables 1 0 1 0.6 9 0 9 6.8Other External Resources 0 0 0 0.0 0 0 0 0.0Factoring Payables 0 0 0 0.0 0 0 0 0.0Leasing Transactions Payables (Net) 0 0 0 0.0 0 0 0 0.0
Finance leasing payables 0 0 0 0.0 0 0 0 0.0Operations leasing payables 0 0 0 0.0 0 0 0 0.0Others 0 0 0 0.0 0 0 0 0.0Deferred finance leasing expenses (-) 0 0 0 0.0 0 0 0 0.0
Derivative Finan. Liabilities Held for Hedging 0 0 0 0.0 0 0 0 0.0Fair value hedges 0 0 0 0.0 0 0 0 0.0Cash flow hedges 0 0 0 0.0 0 0 0 0.0Hedges for invest. made in foreign countries 0 0 0 0.0 0 0 0 0.0
Provisions 7 0 7 3.2 6 0 6 4.3General provisions 0 0 0 0.2 0 0 0 0.2Restructuring reserves 0 0 0 0.0 0 0 0 0.0Reserves for employee benefit 6 0 6 2.8 5 0 5 3.4Insurance technical reserves (Net) 0 0 0 0.0 0 0 0 0.0Other provisions 1 0 1 0.3 1 0 1 0.8
Liabilities for Tax 1 0 1 0.3 1 0 1 0.8Current liabilities for tax 1 0 1 0.3 1 0 1 0.8Deferred liabilities for tax 0 0 0 0.0 0 0 0 0.0
Lia.for Pro.&Equ.for Sale p. and from Term.Op.(Net) 0 0 0 0.0 0 0 0 0.0Subordinated Loans 0 0 0 0.0 0 0 0 0.0Shareholders' Equity 40 0 40 18.4 32 0 32 23.0
Paid-in capital 33 0 33 14.8 34 0 34 24.2Supplementary capital 0 0 0 0.0 0 0 0 0.0
Share premium 0 0 0 0.0 0 0 0 0.0Share cancellation profits 0 0 0 0.0 0 0 0 0.0Valuation changes in marketable securities 0 0 0 0.0 0 0 0 0.0Revaluation changes of property and equip. 0 0 0 0.0 0 0 0 0.0Revaluation changes of intangible assets 0 0 0 0.0 0 0 0 0.0Revaluation changes of real est.for inv. pur. 0 0 0 0.0 0 0 0 0.0Free shares from inv.&ass.,subs.& joint vent. 0 0 0 0.0 0 0 0 0.0Hedging funds (active part) 0 0 0 0.0 0 0 0 0.0Val.inc.in pro.& equ.held for sale p.and term.ope. 0 0 0 0.0 0 0 0 0.0Other capital reserves 0 0 0 0.0 0 0 0 0.0
Profit reserves 0 0 0 0.0 0 0 0 0.0Legal reserves 0 0 0 0.0 0 0 0 0.0Status reserves 0 0 0 0.0 0 0 0 0.0Extraordinary reserves 0 0 0 0.0 0 0 0 0.0Other profit reserves 0 0 0 0.0 0 0 0 0.0
Profit or loss 8 0 8 3.6 -2 0 -2 -1.2Prior years income/loss -2 0 -2 -0.7 -7 0 -7 -4.9Current year income/loss 10 0 10 4.3 5 0 5 3.7
Total Liabilities 49 171 220 100.0 55 84 139 100.0

II-210
Merrill Lynch Yatırım Bank A. .
Off Balance Sheet Commitments(USD Million)
Dec. 2010 Dec. 2009TC FC Total TC FC Total
Guarantees and Warranties 0 0 0 0 0 0Letters of guarantee 0 0 0 0 0 0Bank acceptances 0 0 0 0 0 0Letters of credit 0 0 0 0 0 0Prefinancing given as guarantee 0 0 0 0 0 0Endorsements 0 0 0 0 0 0Other guarantees and warrantees 0 0 0 0 0 0
Commitments 0 0 0 6 0 6Irrevocable commitments 0 0 0 6 0 6Revocable commitments 0 0 0 0 0 0
Derivative Financial Instruments 123 123 245 55 55 109Derivative finan. instruments held for hedging 0 0 0 0 0 0Trading transactions 123 123 245 55 55 109
Custody and Pledged Securities 26 0 26 25 0 25Items held in Custody 26 0 26 25 0 25Pledged Items 0 0 0 0 0 0Acccepted independent guaran. and warran. 0 0 0 0 0 0
Total Off Balance Sheet Commitments 149 123 272 85 55 140
Income-Expenditure(USD Million)
Dec. 2010 Dec. 2009
Interest Income 17 10Interest on loans 0 0Interest received from reserve deposits 0 0Interest received from banks 7 6Interest received from money market transactions 2 0Interest received from marketable securities portfolio 7 4Other interest income 1 0
Interest Expenses 4 2Interest on deposits 0 0Interest on money market transactions 1 0Interest on funds borrowed 3 0Interest on securities issued 0 0Other interest expenses 0 2
Net Interest Income/Expenses 13 8Net Fees and Commissions Income/Expenses 2 1
Fees and commissions received 3 2Fees and commissions paid 0 1
Dividend Income 5 0Trading Profit/Loss (net) -5 0
Profit/loss on trading account securities 1 2Profit/losses on derivative financial transactions -20 -10Foreign exchange profit/loss 14 8
Other Operating Income 14 14Total Operating Income/Expenses 30 23Provision for Loan Losses or other Receivables (-) 0 0
Specific provisions of banks loans and other receivables* 0 0General provision expenses* 0 0
Other Operating Expenses (-) 19 16Personnel Expenses* 13 10
Net Operating Profit/Loss 11 7Surplus written as gain after merger 0 0Profit/losses from equity method applied subsidiaries 0 0Net monetory position gain/loss 0 0Profit/Loss Before Taxes from Continuing Operations 11 7Provisions for Taxes on Income from Continuing Operations (±) -1 -1Net Profit/Loss from Continuing Operations 10 5Net Profit/Loss Before Taxes from Terminated Operations 0 0Provisions for Taxes on Income from Terminated Operations (±) 0 0Net Profit/Loss from Terminated Operations 0 0
Net Profit/Losses 10 5
* Used from information and disclosures related to income statement".

II-211
Merrill Lynch Yatırım Bank A. . December 2010
Ratios(%)
Dec. 2010 Dec. 2009
Capital Ratios
Shareholders’ Equity / (Amount subject to credit + market + operational risk) 55.9 72.1
Shareholders' Equity / Total Assets 18.4 23.0
(Shareholders' Equity - Permanent Assets) / Total Assets 17.0 20.3
Net On Balance Sheet Position / Total Shareholders' Equity -302.8 -171.3
Net On and Off Balance Sheet Position / Total Shareholders' Equity 0.0 -0.8
Balance-Sheet Ratios
TC Assets / Total Assets 78.0 79.0
TC Liabilities / Total Liabilities 22.4 39.7
FC Assets / FC Liabilities 28.4 34.8
TC Deposits / Total Deposits - -
TC Loans / Total Loans and Receivables - -
Total Deposits / Total Assets 0.0 0.0
Funds Borrowed / Total Assets 77.5 60.2
Assets Quality
Financial Assets (net) / Total Assets 16.4 10.0
Total Loans and Receivables / Total Assets 0.0 0.0
Total Loans and Receivables / Total Deposits - -
Loans Under Follow-up (gross) / Total Loans and Receivables - -
Loans Under Follow-up (net) / Total Loans and Receivables - -
Specific Provisions / Loans Under Follow-up - -
Permanent Assets / Total Assets 1.4 2.7
Consumer Loans / Total Loans and Receivables - -
Liquidity
Liquid Assets / Total Assets 79.3 76.9
Liquid Assets / Short-term Liabilities 129.6 134.7
TC Liquid Assets / Total Assets 74.9 71.8
Profitability
Net Profit/Losses / Total Assets 4.3 3.7
Net Profit/Losses / Total Shareholders' Equity 23.5 16.1
Profit/Losses Before Taxes after Continuing Operations / Total Assets 4.9 4.8
Income-Expenditure Structure
Net Interest Income After Specific Provisions / Total Assets 5.9 5.9
Net Interest Income After Specific Provisions / Total Operating Income (Expenses) 43.8 35.5
Non-interest Income (net) / Total Assets 7.6 10.6
Other Operating Expenses / Total Assets 8.4 11.6
Personnel Expenses / Other Operating Expenses 68.8 64.8
Non-interest Income (net) / Other Operating Expenses 90.2 92.0
Quarterly profitability and income-expenditure ratios, except year-end figures, should be considered periodically.

II-212
Nurol Yatırım Bankası A. .
Assets(USD Million)
Dec. 2010 % Dec. 2009 %TC FC Total Distr. TC FC Total Distr.
Cash and Balances with the Central Bank 0 7 7 5.0 6 7 12 10.4Fin.ass.where fair value cha. is refl.to I/S (Net) 1 0 1 0.5 3 0 3 2.4
Financial assets held for trading 1 0 1 0.5 3 0 3 2.4Public sector debt securities 1 0 1 0.5 3 0 3 2.4Securities representing a share in capital 0 0 0 0.0 0 0 0 0.0Derivative financial assets held for trading 0 0 0 0.0 0 0 0 0.0Other marketable securities 0 0 0 0.0 0 0 0 0.0
Fin.assets clas. as fair value change is refl.to I/S 0 0 0 0.0 0 0 0 0.0Public sector debt securities 0 0 0 0.0 0 0 0 0.0Securities representing a share in capital 0 0 0 0.0 0 0 0 0.0Loans 0 0 0 0.0 0 0 0 0.0Other marketable securities 0 0 0 0.0 0 0 0 0.0
Banks 10 23 33 23.5 0 14 14 11.7Money Market Securities 0 0 0 0.0 0 0 0 0.0
Interbank money market placements 0 0 0 0.0 0 0 0 0.0Istanbul Stock Exc. money market placements 0 0 0 0.0 0 0 0 0.0Receiv. from reverse repurchase agreements 0 0 0 0.0 0 0 0 0.0
Financial Assets Available for Sale (Net) 7 6 13 9.5 7 6 14 11.6Securities representing a share in capital 5 6 11 7.9 4 6 11 9.2Public sector debt securities 2 0 2 1.5 3 0 3 2.5Other marketable securities 0 0 0 0.0 0 0 0 0.0
Loans 35 43 78 54.9 22 41 64 54.1Loans 33 43 76 53.5 22 41 63 53.3
Loans granted to the Banks risk group 23 35 58 41.1 19 37 56 47.4Public sector debt securities 0 0 0 0.0 0 0 0 0.0Other 10 7 18 12.5 3 4 7 6.0
Loans under follow-up 18 0 18 12.4 16 0 16 13.7Specific provisions (-) 16 0 16 11.0 15 0 15 12.9
Factoring Receivables 0 0 0 0.0 0 0 0 0.0Investments held to Maturity (Net) 0 0 0 0.0 0 0 0 0.0
Public sector debt securities 0 0 0 0.0 0 0 0 0.0Other marketable securities 0 0 0 0.0 0 0 0 0.0
Investments and Associates (Net) 0 0 0 0.0 0 0 0 0.0Accounted with equity method 0 0 0 0.0 0 0 0 0.0Non-consolidated investments and associates 0 0 0 0.0 0 0 0 0.0
Financial investments and associates 0 0 0 0.0 0 0 0 0.0Non-financial investments and associates 0 0 0 0.0 0 0 0 0.0
Subsidiaries (Net) 0 0 0 0.0 0 0 0 0.0Financial subsidiaries 0 0 0 0.0 0 0 0 0.0Non-financial subsidiaries 0 0 0 0.0 0 0 0 0.0
Joint Ventures (Business Partners) (Net) 0 0 0 0.0 0 0 0 0.0Accounted with equity method 0 0 0 0.0 0 0 0 0.0Non-consolidated joint ventures 0 0 0 0.0 0 0 0 0.0
Financial joint ventures 0 0 0 0.0 0 0 0 0.0Non-financial joint ventures 0 0 0 0.0 0 0 0 0.0
Recivables From Leasing Transactions 0 0 0 0.1 0 0 0 0.3Finance lease receivables 0 0 0 0.1 0 0 0 0.3Operational leasing receivables 0 0 0 0.0 0 0 0 0.0Others 0 0 0 0.0 0 0 0 0.0Unearned income (-) 0 0 0 0.0 0 0 0 0.0
Derivative Financial Assets Held for Hedging 0 0 0 0.0 0 0 0 0.0Fair value hedges 0 0 0 0.0 0 0 0 0.0Cash flow hedges 0 0 0 0.0 0 0 0 0.0Hedges for invest. made in foreign countries 0 0 0 0.0 0 0 0 0.0
Property and Equipment (Net) 0 0 0 0.3 0 0 0 0.2Intangible Assets (Net) 0 0 0 0.3 0 0 0 0.1
Goodwill 0 0 0 0.0 0 0 0 0.0Other 0 0 0 0.3 0 0 0 0.1
Real Estates for Investment Purpose (Net) 7 0 7 4.8 7 0 7 6.0Assets for Tax 1 0 1 0.5 0 0 0 0.0
Current assets for tax 0 0 0 0.0 0 0 0 0.0Deferred assets for tax 1 0 1 0.5 0 0 0 0.0
Prop.&Equ.for Sale p. and from Term.Op.(Net) 0 0 0 0.0 0 0 0 0.0Other Assets 1 0 1 0.8 2 2 4 3.2
Total Assets 62 79 141 100.0 47 70 117 100.0

II-213
Nurol Yatırım Bankası A. . December 2010
Liabilities(USD Million)
Dec. 2010 % Dec. 2009 %TC FC Total Distr. TC FC Total Distr.
Deposits 0 0 0 0.0 0 0 0 0.0Deposits held by the Banks risk group 0 0 0 0.0 0 0 0 0.0Other 0 0 0 0.0 0 0 0 0.0
Derivative Finan. Liabilities Held for Trading 0 0 0 0.0 0 0 0 0.0Funds Borrowed 13 18 31 22.2 0 11 11 9.0Money Market Takings 2 0 2 1.6 5 0 5 4.0
Interbank money market takings 0 0 0 0.0 0 0 0 0.0Istanbul Stock Exc. money market takings 0 0 0 0.0 0 0 0 0.0Funds provided under repurchase agreements 2 0 2 1.6 5 0 5 4.0
Marketable Securities Issued (Net) 0 0 0 0.0 0 0 0 0.0Bills 0 0 0 0.0 0 0 0 0.0Asset backed securities 0 0 0 0.0 0 0 0 0.0Bonds 0 0 0 0.0 0 0 0 0.0
Funds 11 57 68 48.4 5 57 62 53.1Borrower funds 11 57 68 48.4 5 57 62 53.1Others 0 0 0 0.0 0 0 0 0.0
Miscellaneous Payables 1 1 2 1.1 0 2 2 1.9Other External Resources 0 0 0 0.1 0 0 0 0.1Factoring Payables 0 0 0 0.0 0 0 0 0.0Leasing Transactions Payables (Net) 0 0 0 0.0 0 0 0 0.0
Finance leasing payables 0 0 0 0.0 0 0 0 0.0Operations leasing payables 0 0 0 0.0 0 0 0 0.0Others 0 0 0 0.0 0 0 0 0.0Deferred finance leasing expenses (-) 0 0 0 0.0 0 0 0 0.0
Derivative Finan. Liabilities Held for Hedging 0 0 0 0.0 0 0 0 0.0Fair value hedges 0 0 0 0.0 0 0 0 0.0Cash flow hedges 0 0 0 0.0 0 0 0 0.0Hedges for invest. made in foreign countries 0 0 0 0.0 0 0 0 0.0
Provisions 1 0 1 0.9 1 0 1 1.1General provisions 1 0 1 0.4 1 0 1 0.7Restructuring reserves 0 0 0 0.0 0 0 0 0.0Reserves for employee benefit 0 0 0 0.3 0 0 0 0.3Insurance technical reserves (Net) 0 0 0 0.0 0 0 0 0.0Other provisions 0 0 0 0.2 0 0 0 0.1
Liabilities for Tax 0 0 0 0.2 0 0 0 0.2Current liabilities for tax 0 0 0 0.2 0 0 0 0.1Deferred liabilities for tax 0 0 0 0.0 0 0 0 0.1
Lia.for Pro.&Equ.for Sale p. and from Term.Op.(Net) 0 0 0 0.0 0 0 0 0.0Subordinated Loans 0 0 0 0.0 0 0 0 0.0Shareholders' Equity 36 0 36 25.6 36 0 36 30.6
Paid-in capital 29 0 29 20.7 30 0 30 25.8Supplementary capital 4 0 4 2.5 3 0 3 2.1
Share premium 0 0 0 0.0 0 0 0 0.0Share cancellation profits 0 0 0 0.0 0 0 0 0.0Valuation changes in marketable securities 4 0 4 2.5 3 0 3 2.1Revaluation changes of property and equip. 0 0 0 0.0 0 0 0 0.0Revaluation changes of intangible assets 0 0 0 0.0 0 0 0 0.0Revaluation changes of real est.for inv. pur. 0 0 0 0.0 0 0 0 0.0Free shares from inv.&ass.,subs.& joint vent. 0 0 0 0.0 0 0 0 0.0Hedging funds (active part) 0 0 0 0.0 0 0 0 0.0Val.inc.in pro.& equ.held for sale p.and term.ope. 0 0 0 0.0 0 0 0 0.0Other capital reserves 0 0 0 0.0 0 0 0 0.0
Profit reserves 0 0 0 0.3 0 0 0 0.4Legal reserves 0 0 0 0.3 0 0 0 0.4Status reserves 0 0 0 0.0 0 0 0 0.0Extraordinary reserves 0 0 0 0.0 0 0 0 0.0Other profit reserves 0 0 0 0.0 0 0 0 0.0
Profit or loss 3 0 3 2.0 3 0 3 2.3Prior years income/loss 3 0 3 1.9 1 0 1 1.0Current year income/loss 0 0 0 0.2 2 0 2 1.3
Total Liabilities 65 76 141 100.0 47 70 117 100.0

II-214
Nurol Yatırım Bankası A. .
Off Balance Sheet Commitments(USD Million)
Dec. 2010 Dec. 2009TC FC Total TC FC Total
Guarantees and Warranties 57 125 182 50 91 141Letters of guarantee 57 122 178 50 87 137Bank acceptances 0 0 0 0 0 0Letters of credit 0 3 3 0 4 4Prefinancing given as guarantee 0 0 0 0 0 0Endorsements 0 0 0 0 0 0Other guarantees and warrantees 0 0 0 0 0 0
Commitments 917 0 917 0 0 0Irrevocable commitments 0 0 0 0 0 0Revocable commitments 916 0 916 0 0 0
Derivative Financial Instruments 0 0 0 0 0 0Derivative finan. instruments held for hedging 0 0 0 0 0 0Trading transactions 0 0 0 0 0 0
Custody and Pledged Securities 39 51 90 21 36 57Items held in Custody 13 8 21 1 7 7Pledged Items 26 44 70 21 29 50Acccepted independent guaran. and warran. 0 0 0 0 0 0
Total Off Balance Sheet Commitments 1,012 177 1,189 72 127 198
Income-Expenditure(USD Million)
Dec. 2010 Dec. 2009
Interest Income 7 9Interest on loans 6 7Interest received from reserve deposits 0 0Interest received from banks 0 1Interest received from money market transactions 0 0Interest received from marketable securities portfolio 1 1Other interest income 0 1
Interest Expenses 4 4Interest on deposits 0 0Interest on money market transactions 3 3Interest on funds borrowed 0 0Interest on securities issued 0 0Other interest expenses 0 0
Net Interest Income/Expenses 3 6Net Fees and Commissions Income/Expenses 2 1
Fees and commissions received 2 2Fees and commissions paid 0 0
Dividend Income 0 0Trading Profit/Loss (net) 1 1
Profit/loss on trading account securities 0 0Profit/losses on derivative financial transactions 0 0Foreign exchange profit/loss 0 1
Other Operating Income 1 0Total Operating Income/Expenses 7 8Provision for Loan Losses or other Receivables (-) 1 1
Specific provisions of banks loans and other receivables* 1 1General provision expenses* 0 0
Other Operating Expenses (-) 6 5Personnel Expenses* 3 3
Net Operating Profit/Loss 0 2Surplus written as gain after merger 0 0Profit/losses from equity method applied subsidiaries 0 0Net monetory position gain/loss 0 0Profit/Loss Before Taxes from Continuing Operations 0 2Provisions for Taxes on Income from Continuing Operations (±) 0 0Net Profit/Loss from Continuing Operations 0 2Net Profit/Loss Before Taxes from Terminated Operations 0 0Provisions for Taxes on Income from Terminated Operations (±) 0 0Net Profit/Loss from Terminated Operations 0 0
Net Profit/Losses 0 2
* Used from information and disclosures related to income statement".

II-215
Nurol Yatırım Bankası A. . December 2010
Ratios(%)
Dec. 2010 Dec. 2009
Capital Ratios
Shareholders’ Equity / (Amount subject to credit + market + operational risk) 18.6 24.7
Shareholders' Equity / Total Assets 25.6 30.6
(Shareholders' Equity - Permanent Assets) / Total Assets 23.6 29.6
Net On Balance Sheet Position / Total Shareholders' Equity 7.2 0.9
Net On and Off Balance Sheet Position / Total Shareholders' Equity 7.2 0.9
Balance-Sheet Ratios
TC Assets / Total Assets 44.1 40.2
TC Liabilities / Total Liabilities 45.9 40.4
FC Assets / FC Liabilities 103.3 100.4
TC Deposits / Total Deposits - -
TC Loans / Total Loans and Receivables 44.8 35.3
Total Deposits / Total Assets 0.0 0.0
Funds Borrowed / Total Assets 22.2 9.0
Assets Quality
Financial Assets (net) / Total Assets 10.0 14.0
Total Loans and Receivables / Total Assets 54.9 54.1
Total Loans and Receivables / Total Deposits - -
Loans Under Follow-up (gross) / Total Loans and Receivables 22.6 25.3
Loans Under Follow-up (net) / Total Loans and Receivables 2.6 1.4
Specific Provisions / Loans Under Follow-up 88.7 94.5
Permanent Assets / Total Assets 2.0 1.0
Consumer Loans / Total Loans and Receivables 0.3 0.3
Liquidity
Liquid Assets / Total Assets 38.5 36.1
Liquid Assets / Short-term Liabilities 71.6 130.6
TC Liquid Assets / Total Assets 12.9 13.4
Profitability
Net Profit/Losses / Total Assets 0.2 1.3
Net Profit/Losses / Total Shareholders' Equity 0.6 4.4
Profit/Losses Before Taxes after Continuing Operations / Total Assets -0.1 1.7
Income-Expenditure Structure
Net Interest Income After Specific Provisions / Total Assets 1.7 4.3
Net Interest Income After Specific Provisions / Total Operating Income (Expenses) 36.0 63.1
Non-interest Income (net) / Total Assets 2.3 2.1
Other Operating Expenses / Total Assets 4.0 4.5
Personnel Expenses / Other Operating Expenses 44.9 47.9
Non-interest Income (net) / Other Operating Expenses 56.8 46.7
Quarterly profitability and income-expenditure ratios, except year-end figures, should be considered periodically.

II-216
Taib Yatırım Bank A. .
Assets(USD Million)
Dec. 2010 % Dec. 2009 %TC FC Total Distr. TC FC Total Distr.
Cash and Balances with the Central Bank 0 0 0 1.5 0 0 0 2.2Fin.ass.where fair value cha. is refl.to I/S (Net) 0 0 0 3.4 0 0 0 1.1
Financial assets held for trading 0 0 0 3.4 0 0 0 1.1Public sector debt securities 0 0 0 3.4 0 0 0 1.1Securities representing a share in capital 0 0 0 0.0 0 0 0 0.0Derivative financial assets held for trading 0 0 0 0.0 0 0 0 0.0Other marketable securities 0 0 0 0.1 0 0 0 0.0
Fin.assets clas. as fair value change is refl.to I/S 0 0 0 0.0 0 0 0 0.0Public sector debt securities 0 0 0 0.0 0 0 0 0.0Securities representing a share in capital 0 0 0 0.0 0 0 0 0.0Loans 0 0 0 0.0 0 0 0 0.0Other marketable securities 0 0 0 0.0 0 0 0 0.0
Banks 0 0 0 0.6 0 0 0 1.6Money Market Securities 0 0 0 0.0 0 0 0 2.4
Interbank money market placements 0 0 0 0.0 0 0 0 2.4Istanbul Stock Exc. money market placements 0 0 0 0.0 0 0 0 0.0Receiv. from reverse repurchase agreements 0 0 0 0.0 0 0 0 0.0
Financial Assets Available for Sale (Net) 0 0 0 0.0 0 0 0 0.0Securities representing a share in capital 0 0 0 0.0 0 0 0 0.0Public sector debt securities 0 0 0 0.0 0 0 0 0.0Other marketable securities 0 0 0 0.0 0 0 0 0.0
Loans 0 0 0 0.0 0 0 0 0.6Loans 0 0 0 0.0 0 0 0 0.6
Loans granted to the Banks risk group 0 0 0 0.0 0 0 0 0.0Public sector debt securities 0 0 0 0.0 0 0 0 0.0Other 0 0 0 0.0 0 0 0 0.6
Loans under follow-up 0 0 0 0.4 0 0 0 0.2Specific provisions (-) 0 0 0 0.4 0 0 0 0.2
Factoring Receivables 0 0 0 0.0 0 0 0 0.0Investments held to Maturity (Net) 0 0 0 0.0 0 0 0 0.0
Public sector debt securities 0 0 0 0.0 0 0 0 0.0Other marketable securities 0 0 0 0.0 0 0 0 0.0
Investments and Associates (Net) 0 0 0 0.0 0 0 0 0.0Accounted with equity method 0 0 0 0.0 0 0 0 0.0Non-consolidated investments and associates 0 0 0 0.0 0 0 0 0.0
Financial investments and associates 0 0 0 0.0 0 0 0 0.0Non-financial investments and associates 0 0 0 0.0 0 0 0 0.0
Subsidiaries (Net) 8 0 8 92.2 15 0 15 90.4Financial subsidiaries 3 0 3 35.1 10 0 10 59.0Non-financial subsidiaries 5 0 5 57.1 5 0 5 31.5
Joint Ventures (Business Partners) (Net) 0 0 0 0.0 0 0 0 0.0Accounted with equity method 0 0 0 0.0 0 0 0 0.0Non-consolidated joint ventures 0 0 0 0.0 0 0 0 0.0
Financial joint ventures 0 0 0 0.0 0 0 0 0.0Non-financial joint ventures 0 0 0 0.0 0 0 0 0.0
Recivables From Leasing Transactions 0 0 0 0.0 0 0 0 0.0Finance lease receivables 0 0 0 0.0 0 0 0 0.0Operational leasing receivables 0 0 0 0.0 0 0 0 0.0Others 0 0 0 0.0 0 0 0 0.0Unearned income (-) 0 0 0 0.0 0 0 0 0.0
Derivative Financial Assets Held for Hedging 0 0 0 0.0 0 0 0 0.0Fair value hedges 0 0 0 0.0 0 0 0 0.0Cash flow hedges 0 0 0 0.0 0 0 0 0.0Hedges for invest. made in foreign countries 0 0 0 0.0 0 0 0 0.0
Property and Equipment (Net) 0 0 0 1.1 0 0 0 0.9Intangible Assets (Net) 0 0 0 0.2 0 0 0 0.2
Goodwill 0 0 0 0.0 0 0 0 0.0Other 0 0 0 0.2 0 0 0 0.2
Real Estates for Investment Purpose (Net) 0 0 0 0.0 0 0 0 0.0Assets for Tax 0 0 0 0.0 0 0 0 0.0
Current assets for tax 0 0 0 0.0 0 0 0 0.0Deferred assets for tax 0 0 0 0.0 0 0 0 0.0
Prop.&Equ.for Sale p. and from Term.Op.(Net) 0 0 0 0.0 0 0 0 0.0Other Assets 0 0 0 0.9 0 0 0 0.6
Total Assets 9 0 9 100.0 17 0 17 100.0
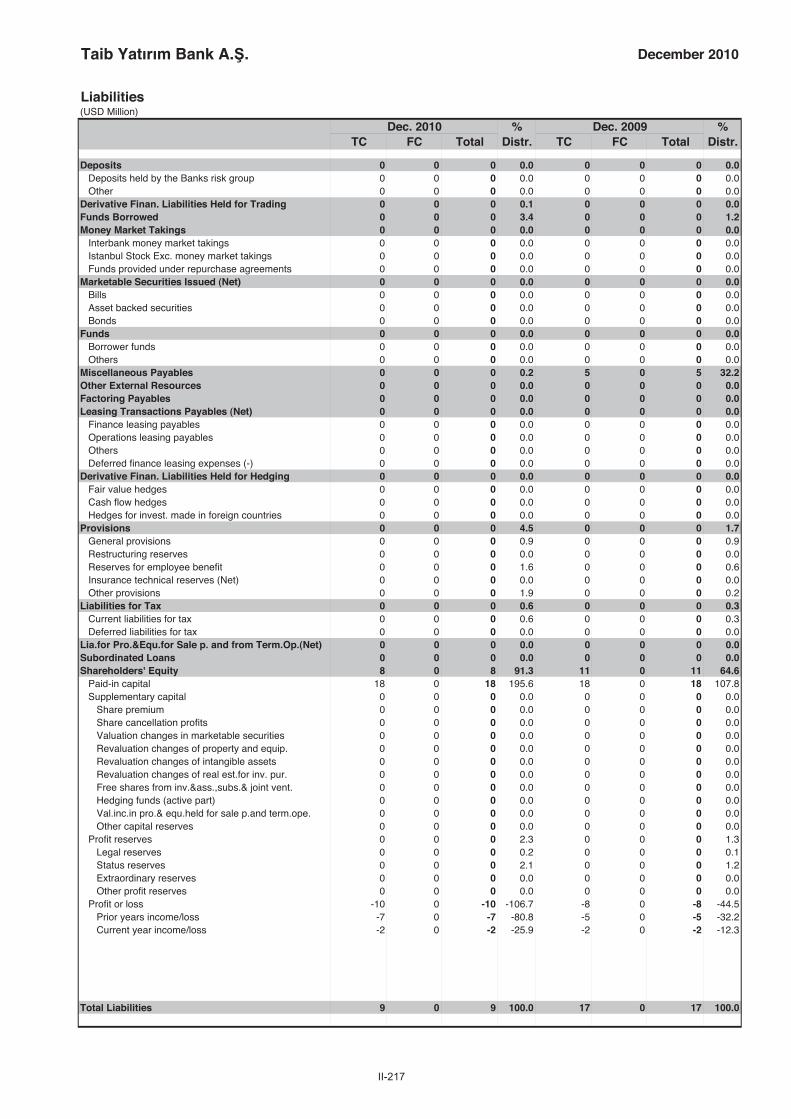
II-217
Taib Yatırım Bank A. . December 2010
Liabilities(USD Million)
Dec. 2010 % Dec. 2009 %TC FC Total Distr. TC FC Total Distr.
Deposits 0 0 0 0.0 0 0 0 0.0Deposits held by the Banks risk group 0 0 0 0.0 0 0 0 0.0Other 0 0 0 0.0 0 0 0 0.0
Derivative Finan. Liabilities Held for Trading 0 0 0 0.1 0 0 0 0.0Funds Borrowed 0 0 0 3.4 0 0 0 1.2Money Market Takings 0 0 0 0.0 0 0 0 0.0
Interbank money market takings 0 0 0 0.0 0 0 0 0.0Istanbul Stock Exc. money market takings 0 0 0 0.0 0 0 0 0.0Funds provided under repurchase agreements 0 0 0 0.0 0 0 0 0.0
Marketable Securities Issued (Net) 0 0 0 0.0 0 0 0 0.0Bills 0 0 0 0.0 0 0 0 0.0Asset backed securities 0 0 0 0.0 0 0 0 0.0Bonds 0 0 0 0.0 0 0 0 0.0
Funds 0 0 0 0.0 0 0 0 0.0Borrower funds 0 0 0 0.0 0 0 0 0.0Others 0 0 0 0.0 0 0 0 0.0
Miscellaneous Payables 0 0 0 0.2 5 0 5 32.2Other External Resources 0 0 0 0.0 0 0 0 0.0Factoring Payables 0 0 0 0.0 0 0 0 0.0Leasing Transactions Payables (Net) 0 0 0 0.0 0 0 0 0.0
Finance leasing payables 0 0 0 0.0 0 0 0 0.0Operations leasing payables 0 0 0 0.0 0 0 0 0.0Others 0 0 0 0.0 0 0 0 0.0Deferred finance leasing expenses (-) 0 0 0 0.0 0 0 0 0.0
Derivative Finan. Liabilities Held for Hedging 0 0 0 0.0 0 0 0 0.0Fair value hedges 0 0 0 0.0 0 0 0 0.0Cash flow hedges 0 0 0 0.0 0 0 0 0.0Hedges for invest. made in foreign countries 0 0 0 0.0 0 0 0 0.0
Provisions 0 0 0 4.5 0 0 0 1.7General provisions 0 0 0 0.9 0 0 0 0.9Restructuring reserves 0 0 0 0.0 0 0 0 0.0Reserves for employee benefit 0 0 0 1.6 0 0 0 0.6Insurance technical reserves (Net) 0 0 0 0.0 0 0 0 0.0Other provisions 0 0 0 1.9 0 0 0 0.2
Liabilities for Tax 0 0 0 0.6 0 0 0 0.3Current liabilities for tax 0 0 0 0.6 0 0 0 0.3Deferred liabilities for tax 0 0 0 0.0 0 0 0 0.0
Lia.for Pro.&Equ.for Sale p. and from Term.Op.(Net) 0 0 0 0.0 0 0 0 0.0Subordinated Loans 0 0 0 0.0 0 0 0 0.0Shareholders' Equity 8 0 8 91.3 11 0 11 64.6
Paid-in capital 18 0 18 195.6 18 0 18 107.8Supplementary capital 0 0 0 0.0 0 0 0 0.0
Share premium 0 0 0 0.0 0 0 0 0.0Share cancellation profits 0 0 0 0.0 0 0 0 0.0Valuation changes in marketable securities 0 0 0 0.0 0 0 0 0.0Revaluation changes of property and equip. 0 0 0 0.0 0 0 0 0.0Revaluation changes of intangible assets 0 0 0 0.0 0 0 0 0.0Revaluation changes of real est.for inv. pur. 0 0 0 0.0 0 0 0 0.0Free shares from inv.&ass.,subs.& joint vent. 0 0 0 0.0 0 0 0 0.0Hedging funds (active part) 0 0 0 0.0 0 0 0 0.0Val.inc.in pro.& equ.held for sale p.and term.ope. 0 0 0 0.0 0 0 0 0.0Other capital reserves 0 0 0 0.0 0 0 0 0.0
Profit reserves 0 0 0 2.3 0 0 0 1.3Legal reserves 0 0 0 0.2 0 0 0 0.1Status reserves 0 0 0 2.1 0 0 0 1.2Extraordinary reserves 0 0 0 0.0 0 0 0 0.0Other profit reserves 0 0 0 0.0 0 0 0 0.0
Profit or loss -10 0 -10 -106.7 -8 0 -8 -44.5Prior years income/loss -7 0 -7 -80.8 -5 0 -5 -32.2Current year income/loss -2 0 -2 -25.9 -2 0 -2 -12.3
Total Liabilities 9 0 9 100.0 17 0 17 100.0

II-218
Taib Yatırım Bank A. .
Off Balance Sheet Commitments(USD Million)
Dec. 2010 Dec. 2009TC FC Total TC FC Total
Guarantees and Warranties 0 0 0 0 0 0Letters of guarantee 0 0 0 0 0 0Bank acceptances 0 0 0 0 0 0Letters of credit 0 0 0 0 0 0Prefinancing given as guarantee 0 0 0 0 0 0Endorsements 0 0 0 0 0 0Other guarantees and warrantees 0 0 0 0 0 0
Commitments 0 0 0 0 0 0Irrevocable commitments 0 0 0 0 0 0Revocable commitments 0 0 0 0 0 0
Derivative Financial Instruments 0 5 5 0 0 0Derivative finan. instruments held for hedging 0 0 0 0 0 0Trading transactions 0 5 5 0 0 0
Custody and Pledged Securities 1 0 1 1 0 1Items held in Custody 0 0 0 1 0 1Pledged Items 0 0 0 0 0 0Acccepted independent guaran. and warran. 0 0 0 0 0 0
Total Off Balance Sheet Commitments 1 5 6 1 0 1
Income-Expenditure(USD Million)
Dec. 2010 Dec. 2009
Interest Income 0 0Interest on loans 0 0Interest received from reserve deposits 0 0Interest received from banks 0 0Interest received from money market transactions 0 0Interest received from marketable securities portfolio 0 0Other interest income 0 0
Interest Expenses 0 0Interest on deposits 0 0Interest on money market transactions 0 0Interest on funds borrowed 0 0Interest on securities issued 0 0Other interest expenses 0 0
Net Interest Income/Expenses 0 0Net Fees and Commissions Income/Expenses 0 0
Fees and commissions received 0 0Fees and commissions paid 0 0
Dividend Income 0 0Trading Profit/Loss (net) 0 1
Profit/loss on trading account securities 0 0Profit/losses on derivative financial transactions 0 0Foreign exchange profit/loss 0 0
Other Operating Income 0 0Total Operating Income/Expenses 0 1Provision for Loan Losses or other Receivables (-) 0 0
Specific provisions of banks loans and other receivables* 0 0General provision expenses* 0 0
Other Operating Expenses (-) 3 3Personnel Expenses* 1 1
Net Operating Profit/Loss -2 -2Surplus written as gain after merger 0 0Profit/losses from equity method applied subsidiaries 0 0Net monetory position gain/loss 0 0Profit/Loss Before Taxes from Continuing Operations -2 -2Provisions for Taxes on Income from Continuing Operations (±) 0 0Net Profit/Loss from Continuing Operations -2 -2Net Profit/Loss Before Taxes from Terminated Operations 0 0Provisions for Taxes on Income from Terminated Operations (±) 0 0Net Profit/Loss from Terminated Operations 0 0
Net Profit/Losses -2 -2
* Used from information and disclosures related to income statement".

II-219
Taib Yatırım Bank A. . December 2010
Ratios(%)
Dec. 2010 Dec. 2009
Capital Ratios
Shareholders’ Equity / (Amount subject to credit + market + operational risk) 76.5 60.2
Shareholders' Equity / Total Assets 91.3 64.6
(Shareholders' Equity - Permanent Assets) / Total Assets -2.2 -26.9
Net On Balance Sheet Position / Total Shareholders' Equity -1.6 0.7
Net On and Off Balance Sheet Position / Total Shareholders' Equity -1.6 0.7
Balance-Sheet Ratios
TC Assets / Total Assets 97.8 97.9
TC Liabilities / Total Liabilities 96.4 98.0
FC Assets / FC Liabilities 61.3 105.6
TC Deposits / Total Deposits - -
TC Loans / Total Loans and Receivables - 100.0
Total Deposits / Total Assets 0.0 0.0
Funds Borrowed / Total Assets 3.4 1.2
Assets Quality
Financial Assets (net) / Total Assets 3.4 1.1
Total Loans and Receivables / Total Assets 0.0 0.6
Total Loans and Receivables / Total Deposits - -
Loans Under Follow-up (gross) / Total Loans and Receivables - 41.1
Loans Under Follow-up (net) / Total Loans and Receivables - 0.0
Specific Provisions / Loans Under Follow-up 100.0 100.0
Permanent Assets / Total Assets 93.5 91.4
Consumer Loans / Total Loans and Receivables - 0.0
Liquidity
Liquid Assets / Total Assets 5.6 7.3
Liquid Assets / Short-term Liabilities 131.0 317.1
TC Liquid Assets / Total Assets 3.6 5.4
Profitability
Net Profit/Losses / Total Assets -25.9 -12.3
Net Profit/Losses / Total Shareholders' Equity -28.3 -19.1
Profit/Losses Before Taxes after Continuing Operations / Total Assets -25.9 -12.3
Income-Expenditure Structure
Net Interest Income After Specific Provisions / Total Assets -1.7 0.0
Net Interest Income After Specific Provisions / Total Operating Income (Expenses) -35.2 0.8
Non-interest Income (net) / Total Assets 6.4 4.9
Other Operating Expenses / Total Assets 31.4 16.3
Personnel Expenses / Other Operating Expenses 45.8 46.1
Non-interest Income (net) / Other Operating Expenses 20.5 29.9
Quarterly profitability and income-expenditure ratios, except year-end figures, should be considered periodically.

II-220
Türk Eximbank
Assets(USD Million)
Dec. 2010 % Dec. 2009 %TC FC Total Distr. TC FC Total Distr.
Cash and Balances with the Central Bank 0 0 0 0.0 0 0 0 0.0Fin.ass.where fair value cha. is refl.to I/S (Net) 199 2 202 4.9 104 8 112 2.6
Financial assets held for trading 199 2 202 4.9 104 8 112 2.6Public sector debt securities 198 2 201 4.9 99 2 101 2.3Securities representing a share in capital 0 0 0 0.0 0 0 0 0.0Derivative financial assets held for trading 1 0 1 0.0 5 6 11 0.3Other marketable securities 0 0 0 0.0 0 0 0 0.0
Fin.assets clas. as fair value change is refl.to I/S 0 0 0 0.0 0 0 0 0.0Public sector debt securities 0 0 0 0.0 0 0 0 0.0Securities representing a share in capital 0 0 0 0.0 0 0 0 0.0Loans 0 0 0 0.0 0 0 0 0.0Other marketable securities 0 0 0 0.0 0 0 0 0.0
Banks 321 255 576 14.1 75 438 513 11.8Money Market Securities 0 0 0 0.0 871 0 871 20.0
Interbank money market placements 0 0 0 0.0 871 0 871 20.0Istanbul Stock Exc. money market placements 0 0 0 0.0 0 0 0 0.0Receiv. from reverse repurchase agreements 0 0 0 0.0 0 0 0 0.0
Financial Assets Available for Sale (Net) 10 0 10 0.2 9 0 9 0.2Securities representing a share in capital 10 0 10 0.2 9 0 9 0.2Public sector debt securities 0 0 0 0.0 0 0 0 0.0Other marketable securities 0 0 0 0.0 0 0 0 0.0
Loans 911 1,794 2,705 66.1 898 1,730 2,628 60.2Loans 911 1,794 2,705 66.1 898 1,730 2,628 60.2
Loans granted to the Banks risk group 0 0 0 0.0 0 0 0 0.0Public sector debt securities 0 0 0 0.0 0 0 0 0.0Other 911 1,794 2,705 66.1 898 1,730 2,628 60.2
Loans under follow-up 79 0 79 1.9 70 0 70 1.6Specific provisions (-) 79 0 79 1.9 70 0 70 1.6
Factoring Receivables 0 0 0 0.0 0 0 0 0.0Investments held to Maturity (Net) 547 33 580 14.2 174 33 208 4.8
Public sector debt securities 547 33 580 14.2 174 33 208 4.8Other marketable securities 0 0 0 0.0 0 0 0 0.0
Investments and Associates (Net) 0 0 0 0.0 0 0 0 0.0Accounted with equity method 0 0 0 0.0 0 0 0 0.0Non-consolidated investments and associates 0 0 0 0.0 0 0 0 0.0
Financial investments and associates 0 0 0 0.0 0 0 0 0.0Non-financial investments and associates 0 0 0 0.0 0 0 0 0.0
Subsidiaries (Net) 0 0 0 0.0 0 0 0 0.0Financial subsidiaries 0 0 0 0.0 0 0 0 0.0Non-financial subsidiaries 0 0 0 0.0 0 0 0 0.0
Joint Ventures (Business Partners) (Net) 0 0 0 0.0 0 0 0 0.0Accounted with equity method 0 0 0 0.0 0 0 0 0.0Non-consolidated joint ventures 0 0 0 0.0 0 0 0 0.0
Financial joint ventures 0 0 0 0.0 0 0 0 0.0Non-financial joint ventures 0 0 0 0.0 0 0 0 0.0
Recivables From Leasing Transactions 0 0 0 0.0 0 0 0 0.0Finance lease receivables 0 0 0 0.0 0 0 0 0.0Operational leasing receivables 0 0 0 0.0 0 0 0 0.0Others 0 0 0 0.0 0 0 0 0.0Unearned income (-) 0 0 0 0.0 0 0 0 0.0
Derivative Financial Assets Held for Hedging 0 0 0 0.0 0 0 0 0.0Fair value hedges 0 0 0 0.0 0 0 0 0.0Cash flow hedges 0 0 0 0.0 0 0 0 0.0Hedges for invest. made in foreign countries 0 0 0 0.0 0 0 0 0.0
Property and Equipment (Net) 5 0 5 0.1 5 0 5 0.1Intangible Assets (Net) 0 0 0 0.0 0 0 0 0.0
Goodwill 0 0 0 0.0 0 0 0 0.0Other 0 0 0 0.0 0 0 0 0.0
Real Estates for Investment Purpose (Net) 0 0 0 0.0 0 0 0 0.0Assets for Tax 0 0 0 0.0 0 0 0 0.0
Current assets for tax 0 0 0 0.0 0 0 0 0.0Deferred assets for tax 0 0 0 0.0 0 0 0 0.0
Prop.&Equ.for Sale p. and from Term.Op.(Net) 0 0 0 0.0 0 0 0 0.0Other Assets 6 6 12 0.3 8 7 15 0.3
Total Assets 1,999 2,091 4,090 100.0 2,146 2,216 4,362 100.0

II-221
Türk Eximbank December 2010
Liabilities(USD Million)
Dec. 2010 % Dec. 2009 %TC FC Total Distr. TC FC Total Distr.
Deposits 0 0 0 0.0 0 0 0 0.0Deposits held by the Banks risk group 0 0 0 0.0 0 0 0 0.0Other 0 0 0 0.0 0 0 0 0.0
Derivative Finan. Liabilities Held for Trading 14 3 16 0.4 0 3 4 0.1Funds Borrowed 0 1,044 1,044 25.5 0 1,220 1,220 28.0Money Market Takings 0 0 0 0.0 0 0 0 0.0
Interbank money market takings 0 0 0 0.0 0 0 0 0.0Istanbul Stock Exc. money market takings 0 0 0 0.0 0 0 0 0.0Funds provided under repurchase agreements 0 0 0 0.0 0 0 0 0.0
Marketable Securities Issued (Net) 0 0 0 0.0 0 0 0 0.0Bills 0 0 0 0.0 0 0 0 0.0Asset backed securities 0 0 0 0.0 0 0 0 0.0Bonds 0 0 0 0.0 0 0 0 0.0
Funds 4 0 4 0.1 5 0 5 0.1Borrower funds 0 0 0 0.0 0 0 0 0.0Others 4 0 4 0.1 5 0 5 0.1
Miscellaneous Payables 5 4 10 0.2 7 4 11 0.2Other External Resources 258 218 476 11.6 258 209 467 10.7Factoring Payables 0 0 0 0.0 0 0 0 0.0Leasing Transactions Payables (Net) 0 0 0 0.0 0 0 0 0.0
Finance leasing payables 0 0 0 0.0 0 0 0 0.0Operations leasing payables 0 0 0 0.0 0 0 0 0.0Others 0 0 0 0.0 0 0 0 0.0Deferred finance leasing expenses (-) 0 0 0 0.0 0 0 0 0.0
Derivative Finan. Liabilities Held for Hedging 0 0 0 0.0 0 0 0 0.0Fair value hedges 0 0 0 0.0 0 0 0 0.0Cash flow hedges 0 0 0 0.0 0 0 0 0.0Hedges for invest. made in foreign countries 0 0 0 0.0 0 0 0 0.0
Provisions 53 0 53 1.3 55 0 55 1.3General provisions 16 0 16 0.4 17 0 17 0.4Restructuring reserves 0 0 0 0.0 0 0 0 0.0Reserves for employee benefit 11 0 11 0.3 10 0 10 0.2Insurance technical reserves (Net) 0 0 0 0.0 0 0 0 0.0Other provisions 27 0 27 0.7 28 0 28 0.6
Liabilities for Tax 1 0 1 0.0 1 0 1 0.0Current liabilities for tax 1 0 1 0.0 1 0 1 0.0Deferred liabilities for tax 0 0 0 0.0 0 0 0 0.0
Lia.for Pro.&Equ.for Sale p. and from Term.Op.(Net) 0 0 0 0.0 0 0 0 0.0Subordinated Loans 0 126 126 3.1 0 142 142 3.3Shareholders' Equity 2,360 0 2,360 57.7 2,458 0 2,459 56.4
Paid-in capital 1,301 0 1,301 31.8 1,345 0 1,345 30.8Supplementary capital 395 0 396 9.7 408 0 408 9.4
Share premium 0 0 0 0.0 0 0 0 0.0Share cancellation profits 0 0 0 0.0 0 0 0 0.0Valuation changes in marketable securities 5 0 6 0.1 5 0 5 0.1Revaluation changes of property and equip. 0 0 0 0.0 0 0 0 0.0Revaluation changes of intangible assets 0 0 0 0.0 0 0 0 0.0Revaluation changes of real est.for inv. pur. 0 0 0 0.0 0 0 0 0.0Free shares from inv.&ass.,subs.& joint vent. 0 0 0 0.0 0 0 0 0.0Hedging funds (active part) 0 0 0 0.0 0 0 0 0.0Val.inc.in pro.& equ.held for sale p.and term.ope. 0 0 0 0.0 0 0 0 0.0Other capital reserves 390 0 390 9.5 403 0 403 9.2
Profit reserves 497 0 497 12.2 476 0 476 10.9Legal reserves 127 0 127 3.1 102 0 102 2.3Status reserves 0 0 0 0.0 0 0 0 0.0Extraordinary reserves 356 0 356 8.7 358 0 358 8.2Other profit reserves 15 0 15 0.4 15 0 15 0.4
Profit or loss 167 0 167 4.1 230 0 230 5.3Prior years income/loss 0 0 0 0.0 0 0 0 0.0Current year income/loss 167 0 167 4.1 230 0 230 5.3
Total Liabilities 2,695 1,395 4,090 100.0 2,784 1,579 4,362 100.0

II-222
Türk Eximbank
Off Balance Sheet Commitments(USD Million)
Dec. 2010 Dec. 2009TC FC Total TC FC Total
Guarantees and Warranties 0 702 702 0 566 566Letters of guarantee 0 0 0 0 0 0Bank acceptances 0 0 0 0 0 0Letters of credit 0 0 0 0 0 0Prefinancing given as guarantee 0 0 0 0 0 0Endorsements 0 448 448 0 324 324Other guarantees and warrantees 0 254 254 0 242 242
Commitments 7 222 229 1 9 10Irrevocable commitments 1 0 1 1 9 10Revocable commitments 6 222 227 0 0 0
Derivative Financial Instruments 410 522 932 377 530 907Derivative finan. instruments held for hedging 0 0 0 0 0 0Trading transactions 410 522 932 377 530 907
Custody and Pledged Securities 20 107 127 21 114 135Items held in Custody 0 0 0 0 0 0Pledged Items 20 107 127 21 114 135Acccepted independent guaran. and warran. 0 0 0 0 0 0
Total Off Balance Sheet Commitments 438 1,552 1,990 399 1,219 1,618
Income-Expenditure(USD Million)
Dec. 2010 Dec. 2009
Interest Income 205 294Interest on loans 112 217Interest received from reserve deposits 0 0Interest received from banks 8 7Interest received from money market transactions 46 45Interest received from marketable securities portfolio 39 25Other interest income 0 0
Interest Expenses 18 34Interest on deposits 0 0Interest on money market transactions 18 34Interest on funds borrowed 0 0Interest on securities issued 0 0Other interest expenses 0 0
Net Interest Income/Expenses 188 260Net Fees and Commissions Income/Expenses -6 -4
Fees and commissions received 1 2Fees and commissions paid 6 6
Dividend Income 0 0Trading Profit/Loss (net) 12 27
Profit/loss on trading account securities 0 2Profit/losses on derivative financial transactions -3 41Foreign exchange profit/loss 16 -16
Other Operating Income 28 24Total Operating Income/Expenses 222 307Provision for Loan Losses or other Receivables (-) 14 37
Specific provisions of banks loans and other receivables* 14 33General provision expenses* 0 3
Other Operating Expenses (-) 41 39Personnel Expenses* 16 15
Net Operating Profit/Loss 167 230Surplus written as gain after merger 0 0Profit/losses from equity method applied subsidiaries 0 0Net monetory position gain/loss 0 0Profit/Loss Before Taxes from Continuing Operations 167 230Provisions for Taxes on Income from Continuing Operations (±) 0 0Net Profit/Loss from Continuing Operations 167 230Net Profit/Loss Before Taxes from Terminated Operations 0 0Provisions for Taxes on Income from Terminated Operations (±) 0 0Net Profit/Loss from Terminated Operations 0 0
Net Profit/Losses 167 230
* Used from information and disclosures related to income statement".

II-223
Türk Eximbank December 2010
Ratios(%)
Dec. 2010 Dec. 2009
Capital Ratios
Shareholders’ Equity / (Amount subject to credit + market + operational risk) 142.8 125.7
Shareholders' Equity / Total Assets 57.7 56.4
(Shareholders' Equity - Permanent Assets) / Total Assets 57.6 56.2
Net On Balance Sheet Position / Total Shareholders' Equity 18.4 15.3
Net On and Off Balance Sheet Position / Total Shareholders' Equity 0.6 0.5
Balance-Sheet Ratios
TC Assets / Total Assets 48.9 49.2
TC Liabilities / Total Liabilities 65.9 63.8
FC Assets / FC Liabilities 149.9 140.4
TC Deposits / Total Deposits - -
TC Loans / Total Loans and Receivables 33.7 34.2
Total Deposits / Total Assets 0.0 0.0
Funds Borrowed / Total Assets 25.5 28.0
Assets Quality
Financial Assets (net) / Total Assets 19.4 7.5
Total Loans and Receivables / Total Assets 66.1 60.2
Total Loans and Receivables / Total Deposits - -
Loans Under Follow-up (gross) / Total Loans and Receivables 2.9 2.6
Loans Under Follow-up (net) / Total Loans and Receivables 0.0 0.0
Specific Provisions / Loans Under Follow-up 100.0 100.0
Permanent Assets / Total Assets 0.1 0.1
Consumer Loans / Total Loans and Receivables 0.1 0.1
Liquidity
Liquid Assets / Total Assets 19.3 34.5
Liquid Assets / Short-term Liabilities 5,372.4 12,739.0
TC Liquid Assets / Total Assets 13.0 24.3
Profitability
Net Profit/Losses / Total Assets 4.1 5.3
Net Profit/Losses / Total Shareholders' Equity 7.1 9.4
Profit/Losses Before Taxes after Continuing Operations / Total Assets 4.1 5.3
Income-Expenditure Structure
Net Interest Income After Specific Provisions / Total Assets 4.3 5.2
Net Interest Income After Specific Provisions / Total Operating Income (Expenses) 78.6 74.2
Non-interest Income (net) / Total Assets 0.8 1.1
Other Operating Expenses / Total Assets 1.0 0.9
Personnel Expenses / Other Operating Expenses 37.8 37.6
Non-interest Income (net) / Other Operating Expenses 82.0 118.6
Quarterly profitability and income-expenditure ratios, except year-end figures, should be considered periodically.

II-224
Türkiye Kalkınma Bankası A. .
Assets(USD Million)
Dec. 2010 % Dec. 2009 %TC FC Total Distr. TC FC Total Distr.
Cash and Balances with the Central Bank 0 0 0 0.0 0 0 0 0.0Fin.ass.where fair value cha. is refl.to I/S (Net) 32 0 32 3.1 83 0 83 9.6
Financial assets held for trading 32 0 32 3.1 83 0 83 9.6Public sector debt securities 32 0 32 3.1 83 0 83 9.6Securities representing a share in capital 0 0 0 0.0 0 0 0 0.0Derivative financial assets held for trading 0 0 0 0.0 0 0 0 0.0Other marketable securities 0 0 0 0.0 0 0 0 0.0
Fin.assets clas. as fair value change is refl.to I/S 0 0 0 0.0 0 0 0 0.0Public sector debt securities 0 0 0 0.0 0 0 0 0.0Securities representing a share in capital 0 0 0 0.0 0 0 0 0.0Loans 0 0 0 0.0 0 0 0 0.0Other marketable securities 0 0 0 0.0 0 0 0 0.0
Banks 81 1 82 7.9 4 53 57 6.6Money Market Securities 0 0 0 0.0 74 0 74 8.6
Interbank money market placements 0 0 0 0.0 74 0 74 8.6Istanbul Stock Exc. money market placements 0 0 0 0.0 0 0 0 0.0Receiv. from reverse repurchase agreements 0 0 0 0.0 0 0 0 0.0
Financial Assets Available for Sale (Net) 80 0 80 7.7 3 0 3 0.4Securities representing a share in capital 1 0 1 0.1 1 0 1 0.1Public sector debt securities 77 0 77 7.4 0 0 0 0.0Other marketable securities 3 0 3 0.2 2 0 2 0.3
Loans 144 622 766 73.8 163 377 539 62.3Loans 126 622 748 72.0 144 377 521 60.2
Loans granted to the Banks risk group 0 0 0 0.0 1 0 1 0.1Public sector debt securities 0 0 0 0.0 0 0 0 0.0Other 126 622 748 72.0 143 377 520 60.1
Loans under follow-up 51 0 51 4.9 63 0 63 7.3Specific provisions (-) 33 0 33 3.2 44 0 44 5.1
Factoring Receivables 0 0 0 0.0 0 0 0 0.0Investments held to Maturity (Net) 33 0 33 3.2 54 0 54 6.2
Public sector debt securities 33 0 33 3.2 54 0 54 6.2Other marketable securities 0 0 0 0.0 0 0 0 0.0
Investments and Associates (Net) 4 1 4 0.4 3 1 4 0.5Accounted with equity method 0 0 0 0.0 0 0 0 0.0Non-consolidated investments and associates 4 1 4 0.4 3 1 4 0.5
Financial investments and associates 0 1 1 0.1 0 1 1 0.1Non-financial investments and associates 4 0 4 0.3 3 0 3 0.4
Subsidiaries (Net) 5 0 5 0.5 8 0 8 0.9Financial subsidiaries 4 0 4 0.4 6 0 6 0.7Non-financial subsidiaries 0 0 0 0.0 2 0 2 0.2
Joint Ventures (Business Partners) (Net) 0 0 0 0.0 0 0 0 0.0Accounted with equity method 0 0 0 0.0 0 0 0 0.0Non-consolidated joint ventures 0 0 0 0.0 0 0 0 0.0
Financial joint ventures 0 0 0 0.0 0 0 0 0.0Non-financial joint ventures 0 0 0 0.0 0 0 0 0.0
Recivables From Leasing Transactions 0 0 0 0.0 0 0 0 0.0Finance lease receivables 0 0 0 0.0 0 0 0 0.0Operational leasing receivables 0 0 0 0.0 0 0 0 0.0Others 0 0 0 0.0 0 0 0 0.0Unearned income (-) 0 0 0 0.0 0 0 0 0.0
Derivative Financial Assets Held for Hedging 0 0 0 0.0 0 0 0 0.0Fair value hedges 0 0 0 0.0 0 0 0 0.0Cash flow hedges 0 0 0 0.0 0 0 0 0.0Hedges for invest. made in foreign countries 0 0 0 0.0 0 0 0 0.0
Property and Equipment (Net) 28 0 28 2.7 29 0 29 3.4Intangible Assets (Net) 0 0 0 0.0 0 0 0 0.0
Goodwill 0 0 0 0.0 0 0 0 0.0Other 0 0 0 0.0 0 0 0 0.0
Real Estates for Investment Purpose (Net) 2 0 2 0.2 0 0 0 0.0Assets for Tax 4 0 4 0.4 10 0 10 1.1
Current assets for tax 0 0 0 0.0 4 0 4 0.4Deferred assets for tax 4 0 4 0.4 6 0 6 0.7
Prop.&Equ.for Sale p. and from Term.Op.(Net) 0 0 0 0.0 0 0 0 0.0Other Assets 2 1 3 0.2 1 1 2 0.2
Total Assets 414 625 1,039 100.0 434 432 865 100.0

II-225
Türkiye Kalkınma Bankası A. . December 2010
Liabilities(USD Million)
Dec. 2010 % Dec. 2009 %TC FC Total Distr. TC FC Total Distr.
Deposits 0 0 0 0.0 0 0 0 0.0Deposits held by the Banks risk group 0 0 0 0.0 0 0 0 0.0Other 0 0 0 0.0 0 0 0 0.0
Derivative Finan. Liabilities Held for Trading 0 0 0 0.0 0 0 0 0.0Funds Borrowed 0 622 622 59.9 1 426 427 49.4Money Market Takings 0 0 0 0.0 0 0 0 0.0
Interbank money market takings 0 0 0 0.0 0 0 0 0.0Istanbul Stock Exc. money market takings 0 0 0 0.0 0 0 0 0.0Funds provided under repurchase agreements 0 0 0 0.0 0 0 0 0.0
Marketable Securities Issued (Net) 0 0 0 0.0 0 0 0 0.0Bills 0 0 0 0.0 0 0 0 0.0Asset backed securities 0 0 0 0.0 0 0 0 0.0Bonds 0 0 0 0.0 0 0 0 0.0
Funds 59 0 59 5.7 75 0 75 8.7Borrower funds 0 0 0 0.0 0 0 0 0.0Others 59 0 59 5.7 75 0 75 8.7
Miscellaneous Payables 2 0 2 0.2 2 0 2 0.2Other External Resources 3 0 3 0.3 3 1 4 0.5Factoring Payables 0 0 0 0.0 0 0 0 0.0Leasing Transactions Payables (Net) 0 0 0 0.0 0 0 0 0.0
Finance leasing payables 0 0 0 0.0 0 0 0 0.0Operations leasing payables 0 0 0 0.0 0 0 0 0.0Others 0 0 0 0.0 0 0 0 0.0Deferred finance leasing expenses (-) 0 0 0 0.0 0 0 0 0.0
Derivative Finan. Liabilities Held for Hedging 0 0 0 0.0 0 0 0 0.0Fair value hedges 0 0 0 0.0 0 0 0 0.0Cash flow hedges 0 0 0 0.0 0 0 0 0.0Hedges for invest. made in foreign countries 0 0 0 0.0 0 0 0 0.0
Provisions 15 0 15 1.5 17 0 17 1.9General provisions 4 0 4 0.4 5 0 5 0.6Restructuring reserves 0 0 0 0.0 0 0 0 0.0Reserves for employee benefit 12 0 12 1.1 12 0 12 1.3Insurance technical reserves (Net) 0 0 0 0.0 0 0 0 0.0Other provisions 0 0 0 0.0 0 0 0 0.0
Liabilities for Tax 3 0 3 0.3 5 0 5 0.6Current liabilities for tax 3 0 3 0.3 5 0 5 0.6Deferred liabilities for tax 0 0 0 0.0 0 0 0 0.0
Lia.for Pro.&Equ.for Sale p. and from Term.Op.(Net) 0 0 0 0.0 0 0 0 0.0Subordinated Loans 0 0 0 0.0 0 0 0 0.0Shareholders' Equity 334 0 334 32.2 336 0 336 38.8
Paid-in capital 104 0 104 10.0 108 0 108 12.4Supplementary capital 137 0 137 13.2 142 0 142 16.4
Share premium 1 0 1 0.1 1 0 1 0.1Share cancellation profits 0 0 0 0.0 0 0 0 0.0Valuation changes in marketable securities 2 0 2 0.2 2 0 2 0.2Revaluation changes of property and equip. 0 0 0 0.0 0 0 0 0.0Revaluation changes of intangible assets 0 0 0 0.0 0 0 0 0.0Revaluation changes of real est.for inv. pur. 0 0 0 0.0 0 0 0 0.0Free shares from inv.&ass.,subs.& joint vent. 0 0 0 0.0 0 0 0 0.0Hedging funds (active part) 0 0 0 0.0 0 0 0 0.0Val.inc.in pro.& equ.held for sale p.and term.ope. 0 0 0 0.0 0 0 0 0.0Other capital reserves 134 0 134 12.9 139 0 139 16.0
Profit reserves 80 0 80 7.7 69 0 69 8.0Legal reserves 18 0 18 1.7 18 0 18 2.0Status reserves 0 0 0 0.0 0 0 0 0.0Extraordinary reserves 62 0 62 5.9 51 0 51 5.9Other profit reserves 0 0 0 0.0 0 0 0 0.0
Profit or loss 14 0 14 1.3 17 0 17 2.0Prior years income/loss 0 0 0 0.0 0 0 0 0.0Current year income/loss 14 0 14 1.3 17 0 17 2.0
Total Liabilities 417 622 1,039 100.0 439 427 865 100.0

II-226
Türkiye Kalkınma Bankası A. .
Off Balance Sheet Commitments(USD Million)
Dec. 2010 Dec. 2009TC FC Total TC FC Total
Guarantees and Warranties 0 5 5 0 7 7Letters of guarantee 0 0 0 0 0 0Bank acceptances 0 0 0 0 0 0Letters of credit 0 5 5 0 7 7Prefinancing given as guarantee 0 0 0 0 0 0Endorsements 0 0 0 0 0 0Other guarantees and warrantees 0 0 0 0 0 0
Commitments 57 864 921 16 409 424Irrevocable commitments 1 12 13 0 14 14Revocable commitments 56 851 908 16 395 410
Derivative Financial Instruments 6 5 11 0 0 0Derivative finan. instruments held for hedging 0 0 0 0 0 0Trading transactions 6 5 11 0 0 0
Custody and Pledged Securities 1,622 3,190 4,811 1,984 2,685 4,669Items held in Custody 4 0 5 10 0 10Pledged Items 1,616 3,189 4,806 1,974 2,685 4,659Acccepted independent guaran. and warran. 1 0 1 1 0 1
Total Off Balance Sheet Commitments 1,684 4,064 5,748 2,000 3,101 5,101
Income-Expenditure(USD Million)
Dec. 2010 Dec. 2009
Interest Income 52 56Interest on loans 35 31Interest received from reserve deposits 0 0Interest received from banks 2 0Interest received from money market transactions 3 9Interest received from marketable securities portfolio 12 16Other interest income 0 0
Interest Expenses 11 15Interest on deposits 0 0Interest on money market transactions 7 9Interest on funds borrowed 0 0Interest on securities issued 0 0Other interest expenses 4 5
Net Interest Income/Expenses 41 41Net Fees and Commissions Income/Expenses 3 10
Fees and commissions received 3 10Fees and commissions paid 0 1
Dividend Income 2 0Trading Profit/Loss (net) 2 4
Profit/loss on trading account securities 0 3Profit/losses on derivative financial transactions 0 0Foreign exchange profit/loss 1 1
Other Operating Income 11 10Total Operating Income/Expenses 59 65Provision for Loan Losses or other Receivables (-) 3 8
Specific provisions of banks loans and other receivables* 0 6General provision expenses* 0 2
Other Operating Expenses (-) 38 36Personnel Expenses* 27 26
Net Operating Profit/Loss 19 21Surplus written as gain after merger 0 0Profit/losses from equity method applied subsidiaries 0 0Net monetory position gain/loss 0 0Profit/Loss Before Taxes from Continuing Operations 19 21Provisions for Taxes on Income from Continuing Operations (±) -5 -4Net Profit/Loss from Continuing Operations 14 17Net Profit/Loss Before Taxes from Terminated Operations 0 0Provisions for Taxes on Income from Terminated Operations (±) 0 0Net Profit/Loss from Terminated Operations 0 0
Net Profit/Losses 14 17
* Used from information and disclosures related to income statement".

II-227
Türkiye Kalkınma Bankası A. . December 2010
Ratios(%)
Dec. 2010 Dec. 2009
Capital Ratios
Shareholders’ Equity / (Amount subject to credit + market + operational risk) 75.2 70.0
Shareholders' Equity / Total Assets 32.2 38.8
(Shareholders' Equity - Permanent Assets) / Total Assets 26.9 31.8
Net On Balance Sheet Position / Total Shareholders' Equity 1.0 1.4
Net On and Off Balance Sheet Position / Total Shareholders' Equity 1.0 1.4
Balance-Sheet Ratios
TC Assets / Total Assets 39.9 50.1
TC Liabilities / Total Liabilities 40.1 50.7
FC Assets / FC Liabilities 100.4 101.1
TC Deposits / Total Deposits - -
TC Loans / Total Loans and Receivables 18.8 30.1
Total Deposits / Total Assets 0.0 0.0
Funds Borrowed / Total Assets 59.9 49.4
Assets Quality
Financial Assets (net) / Total Assets 14.0 16.2
Total Loans and Receivables / Total Assets 73.8 62.3
Total Loans and Receivables / Total Deposits - -
Loans Under Follow-up (gross) / Total Loans and Receivables 6.6 11.7
Loans Under Follow-up (net) / Total Loans and Receivables 2.3 3.5
Specific Provisions / Loans Under Follow-up 64.9 70.3
Permanent Assets / Total Assets 5.3 7.0
Consumer Loans / Total Loans and Receivables 0.4 0.6
Liquidity
Liquid Assets / Total Assets 18.7 25.2
Liquid Assets / Short-term Liabilities 282.7 2,877.8
TC Liquid Assets / Total Assets 18.6 19.1
Profitability
Net Profit/Losses / Total Assets 1.3 2.0
Net Profit/Losses / Total Shareholders' Equity 4.1 5.1
Profit/Losses Before Taxes after Continuing Operations / Total Assets 1.8 2.4
Income-Expenditure Structure
Net Interest Income After Specific Provisions / Total Assets 3.9 4.1
Net Interest Income After Specific Provisions / Total Operating Income (Expenses) 68.3 54.4
Non-interest Income (net) / Total Assets 1.8 2.7
Other Operating Expenses / Total Assets 3.6 4.2
Personnel Expenses / Other Operating Expenses 72.6 73.1
Non-interest Income (net) / Other Operating Expenses 48.7 65.7
Quarterly profitability and income-expenditure ratios, except year-end figures, should be considered periodically.
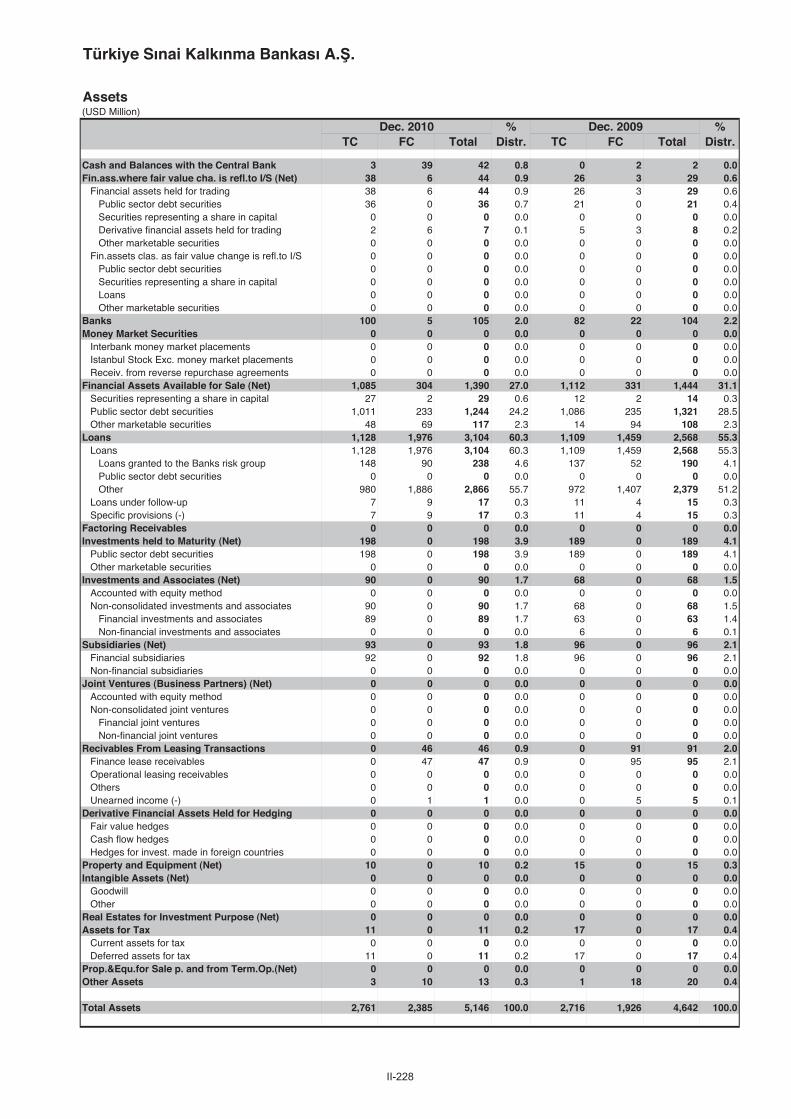
II-228
Türkiye Sınai Kalkınma Bankası A. .
Assets(USD Million)
Dec. 2010 % Dec. 2009 %TC FC Total Distr. TC FC Total Distr.
Cash and Balances with the Central Bank 3 39 42 0.8 0 2 2 0.0Fin.ass.where fair value cha. is refl.to I/S (Net) 38 6 44 0.9 26 3 29 0.6
Financial assets held for trading 38 6 44 0.9 26 3 29 0.6Public sector debt securities 36 0 36 0.7 21 0 21 0.4Securities representing a share in capital 0 0 0 0.0 0 0 0 0.0Derivative financial assets held for trading 2 6 7 0.1 5 3 8 0.2Other marketable securities 0 0 0 0.0 0 0 0 0.0
Fin.assets clas. as fair value change is refl.to I/S 0 0 0 0.0 0 0 0 0.0Public sector debt securities 0 0 0 0.0 0 0 0 0.0Securities representing a share in capital 0 0 0 0.0 0 0 0 0.0Loans 0 0 0 0.0 0 0 0 0.0Other marketable securities 0 0 0 0.0 0 0 0 0.0
Banks 100 5 105 2.0 82 22 104 2.2Money Market Securities 0 0 0 0.0 0 0 0 0.0
Interbank money market placements 0 0 0 0.0 0 0 0 0.0Istanbul Stock Exc. money market placements 0 0 0 0.0 0 0 0 0.0Receiv. from reverse repurchase agreements 0 0 0 0.0 0 0 0 0.0
Financial Assets Available for Sale (Net) 1,085 304 1,390 27.0 1,112 331 1,444 31.1Securities representing a share in capital 27 2 29 0.6 12 2 14 0.3Public sector debt securities 1,011 233 1,244 24.2 1,086 235 1,321 28.5Other marketable securities 48 69 117 2.3 14 94 108 2.3
Loans 1,128 1,976 3,104 60.3 1,109 1,459 2,568 55.3Loans 1,128 1,976 3,104 60.3 1,109 1,459 2,568 55.3
Loans granted to the Banks risk group 148 90 238 4.6 137 52 190 4.1Public sector debt securities 0 0 0 0.0 0 0 0 0.0Other 980 1,886 2,866 55.7 972 1,407 2,379 51.2
Loans under follow-up 7 9 17 0.3 11 4 15 0.3Specific provisions (-) 7 9 17 0.3 11 4 15 0.3
Factoring Receivables 0 0 0 0.0 0 0 0 0.0Investments held to Maturity (Net) 198 0 198 3.9 189 0 189 4.1
Public sector debt securities 198 0 198 3.9 189 0 189 4.1Other marketable securities 0 0 0 0.0 0 0 0 0.0
Investments and Associates (Net) 90 0 90 1.7 68 0 68 1.5Accounted with equity method 0 0 0 0.0 0 0 0 0.0Non-consolidated investments and associates 90 0 90 1.7 68 0 68 1.5
Financial investments and associates 89 0 89 1.7 63 0 63 1.4Non-financial investments and associates 0 0 0 0.0 6 0 6 0.1
Subsidiaries (Net) 93 0 93 1.8 96 0 96 2.1Financial subsidiaries 92 0 92 1.8 96 0 96 2.1Non-financial subsidiaries 0 0 0 0.0 0 0 0 0.0
Joint Ventures (Business Partners) (Net) 0 0 0 0.0 0 0 0 0.0Accounted with equity method 0 0 0 0.0 0 0 0 0.0Non-consolidated joint ventures 0 0 0 0.0 0 0 0 0.0
Financial joint ventures 0 0 0 0.0 0 0 0 0.0Non-financial joint ventures 0 0 0 0.0 0 0 0 0.0
Recivables From Leasing Transactions 0 46 46 0.9 0 91 91 2.0Finance lease receivables 0 47 47 0.9 0 95 95 2.1Operational leasing receivables 0 0 0 0.0 0 0 0 0.0Others 0 0 0 0.0 0 0 0 0.0Unearned income (-) 0 1 1 0.0 0 5 5 0.1
Derivative Financial Assets Held for Hedging 0 0 0 0.0 0 0 0 0.0Fair value hedges 0 0 0 0.0 0 0 0 0.0Cash flow hedges 0 0 0 0.0 0 0 0 0.0Hedges for invest. made in foreign countries 0 0 0 0.0 0 0 0 0.0
Property and Equipment (Net) 10 0 10 0.2 15 0 15 0.3Intangible Assets (Net) 0 0 0 0.0 0 0 0 0.0
Goodwill 0 0 0 0.0 0 0 0 0.0Other 0 0 0 0.0 0 0 0 0.0
Real Estates for Investment Purpose (Net) 0 0 0 0.0 0 0 0 0.0Assets for Tax 11 0 11 0.2 17 0 17 0.4
Current assets for tax 0 0 0 0.0 0 0 0 0.0Deferred assets for tax 11 0 11 0.2 17 0 17 0.4
Prop.&Equ.for Sale p. and from Term.Op.(Net) 0 0 0 0.0 0 0 0 0.0Other Assets 3 10 13 0.3 1 18 20 0.4
Total Assets 2,761 2,385 5,146 100.0 2,716 1,926 4,642 100.0

II-229
Türkiye Sınai Kalkınma Bankası A. . December 2010
Liabilities(USD Million)
Dec. 2010 % Dec. 2009 %TC FC Total Distr. TC FC Total Distr.
Deposits 0 0 0 0.0 0 0 0 0.0Deposits held by the Banks risk group 0 0 0 0.0 0 0 0 0.0Other 0 0 0 0.0 0 0 0 0.0
Derivative Finan. Liabilities Held for Trading 2 5 7 0.1 5 3 8 0.2Funds Borrowed 7 3,244 3,250 63.2 16 2,894 2,910 62.7Money Market Takings 679 93 771 15.0 833 31 864 18.6
Interbank money market takings 0 0 0 0.0 0 0 0 0.0Istanbul Stock Exc. money market takings 0 0 0 0.0 0 0 0 0.0Funds provided under repurchase agreements 679 93 771 15.0 833 31 864 18.6
Marketable Securities Issued (Net) 127 0 127 2.5 0 0 0 0.0Bills 127 0 127 2.5 0 0 0 0.0Asset backed securities 0 0 0 0.0 0 0 0 0.0Bonds 0 0 0 0.0 0 0 0 0.0
Funds 0 0 0 0.0 0 0 0 0.0Borrower funds 0 0 0 0.0 0 0 0 0.0Others 0 0 0 0.0 0 0 0 0.0
Miscellaneous Payables 35 13 48 0.9 25 10 35 0.8Other External Resources 0 0 0 0.0 0 0 0 0.0Factoring Payables 0 0 0 0.0 0 0 0 0.0Leasing Transactions Payables (Net) 0 0 0 0.0 0 0 0 0.0
Finance leasing payables 0 0 0 0.0 0 0 0 0.0Operations leasing payables 0 0 0 0.0 0 0 0 0.0Others 0 0 0 0.0 0 0 0 0.0Deferred finance leasing expenses (-) 0 0 0 0.0 0 0 0 0.0
Derivative Finan. Liabilities Held for Hedging 0 0 0 0.0 0 0 0 0.0Fair value hedges 0 0 0 0.0 0 0 0 0.0Cash flow hedges 0 0 0 0.0 0 0 0 0.0Hedges for invest. made in foreign countries 0 0 0 0.0 0 0 0 0.0
Provisions 59 0 59 1.1 65 0 65 1.4General provisions 29 0 29 0.6 22 0 22 0.5Restructuring reserves 0 0 0 0.0 0 0 0 0.0Reserves for employee benefit 2 0 2 0.0 2 0 2 0.0Insurance technical reserves (Net) 0 0 0 0.0 0 0 0 0.0Other provisions 27 0 27 0.5 41 0 41 0.9
Liabilities for Tax 10 0 10 0.2 10 0 10 0.2Current liabilities for tax 10 0 10 0.2 10 0 10 0.2Deferred liabilities for tax 0 0 0 0.0 0 0 0 0.0
Lia.for Pro.&Equ.for Sale p. and from Term.Op.(Net) 0 0 0 0.0 0 0 0 0.0Subordinated Loans 0 51 51 1.0 0 51 51 1.1Shareholders' Equity 801 21 822 16.0 691 9 700 15.1
Paid-in capital 455 0 455 8.8 403 0 403 8.7Supplementary capital 64 21 85 1.7 46 9 55 1.2
Share premium 0 0 0 0.0 0 0 0 0.0Share cancellation profits 0 0 0 0.0 0 0 0 0.0Valuation changes in marketable securities 44 21 65 1.3 27 9 36 0.8Revaluation changes of property and equip. 20 0 20 0.4 19 0 19 0.4Revaluation changes of intangible assets 0 0 0 0.0 0 0 0 0.0Revaluation changes of real est.for inv. pur. 0 0 0 0.0 0 0 0 0.0Free shares from inv.&ass.,subs.& joint vent. 0 0 0 0.0 0 0 0 0.0Hedging funds (active part) 0 0 0 0.0 0 0 0 0.0Val.inc.in pro.& equ.held for sale p.and term.ope. 0 0 0 0.0 0 0 0 0.0Other capital reserves 0 0 0 0.0 0 0 0 0.0
Profit reserves 144 0 144 2.8 124 0 124 2.7Legal reserves 48 0 48 0.9 38 0 38 0.8Status reserves 24 0 24 0.5 19 0 19 0.4Extraordinary reserves 70 0 70 1.4 65 0 65 1.4Other profit reserves 2 0 2 0.0 2 0 2 0.0
Profit or loss 138 0 138 2.7 118 0 118 2.5Prior years income/loss 0 0 0 0.0 0 0 0 0.0Current year income/loss 138 0 138 2.7 118 0 118 2.5
Total Liabilities 1,719 3,426 5,146 100.0 1,644 2,998 4,642 100.0

II-230
Türkiye Sınai Kalkınma Bankası A. .
Off Balance Sheet Commitments(USD Million)
Dec. 2010 Dec. 2009TC FC Total TC FC Total
Guarantees and Warranties 228 483 711 232 250 482Letters of guarantee 208 313 521 180 60 241Bank acceptances 0 0 0 0 0 0Letters of credit 0 169 169 0 121 121Prefinancing given as guarantee 0 0 0 0 0 0Endorsements 0 0 0 0 0 0Other guarantees and warrantees 20 1 21 51 68 120
Commitments 336 414 750 228 350 578Irrevocable commitments 44 61 105 101 108 209Revocable commitments 292 353 645 127 242 369
Derivative Financial Instruments 274 1,842 2,116 190 1,387 1,578Derivative finan. instruments held for hedging 0 0 0 0 0 0Trading transactions 274 1,842 2,116 190 1,387 1,578
Custody and Pledged Securities 2,510 27,100 29,610 1,796 7,929 9,725Items held in Custody 875 119 994 1,146 71 1,217Pledged Items 1,156 16,093 17,249 650 7,858 8,509Acccepted independent guaran. and warran. 479 10,887 11,367 0 0 0
Total Off Balance Sheet Commitments 3,349 29,839 33,188 2,447 9,916 12,363
Income-Expenditure(USD Million)
Dec. 2010 Dec. 2009
Interest Income 282 336Interest on loans 127 152Interest received from reserve deposits 0 0Interest received from banks 5 3Interest received from money market transactions 0 0Interest received from marketable securities portfolio 147 174Other interest income 3 6
Interest Expenses 88 164Interest on deposits 0 0Interest on money market transactions 32 99Interest on funds borrowed 52 65Interest on securities issued 4 0Other interest expenses 0 0
Net Interest Income/Expenses 194 172Net Fees and Commissions Income/Expenses 9 5
Fees and commissions received 11 5Fees and commissions paid 3 1
Dividend Income 15 13Trading Profit/Loss (net) -2 2
Profit/loss on trading account securities -2 1Profit/losses on derivative financial transactions 1 1Foreign exchange profit/loss -2 -1
Other Operating Income 17 17Total Operating Income/Expenses 231 207Provision for Loan Losses or other Receivables (-) 16 29
Specific provisions of banks loans and other receivables* 6 1General provision expenses* 8 1
Other Operating Expenses (-) 41 37Personnel Expenses* 23 22
Net Operating Profit/Loss 175 142Surplus written as gain after merger 0 0Profit/losses from equity method applied subsidiaries 0 0Net monetory position gain/loss 0 0Profit/Loss Before Taxes from Continuing Operations 175 142Provisions for Taxes on Income from Continuing Operations (±) -37 -24Net Profit/Loss from Continuing Operations 138 118Net Profit/Loss Before Taxes from Terminated Operations 0 0Provisions for Taxes on Income from Terminated Operations (±) 0 0Net Profit/Loss from Terminated Operations 0 0
Net Profit/Losses 138 118
* Used from information and disclosures related to income statement".

II-231
Türkiye Sınai Kalkınma Bankası A. . December 2010
Ratios(%)
Dec. 2010 Dec. 2009
Capital Ratios
Shareholders’ Equity / (Amount subject to credit + market + operational risk) 22.7 24.9
Shareholders' Equity / Total Assets 16.0 15.1
(Shareholders' Equity - Permanent Assets) / Total Assets 12.2 11.2
Net On Balance Sheet Position / Total Shareholders' Equity -4.1 0.3
Net On and Off Balance Sheet Position / Total Shareholders' Equity 1.9 1.3
Balance-Sheet Ratios
TC Assets / Total Assets 53.7 58.5
TC Liabilities / Total Liabilities 33.4 35.4
FC Assets / FC Liabilities 69.6 64.3
TC Deposits / Total Deposits - -
TC Loans / Total Loans and Receivables 36.3 43.2
Total Deposits / Total Assets 0.0 0.0
Funds Borrowed / Total Assets 63.2 62.7
Assets Quality
Financial Assets (net) / Total Assets 31.7 35.8
Total Loans and Receivables / Total Assets 60.3 55.3
Total Loans and Receivables / Total Deposits - -
Loans Under Follow-up (gross) / Total Loans and Receivables 0.5 0.6
Loans Under Follow-up (net) / Total Loans and Receivables 0.0 0.0
Specific Provisions / Loans Under Follow-up 100.0 100.0
Permanent Assets / Total Assets 3.8 3.9
Consumer Loans / Total Loans and Receivables 0.0 0.0
Liquidity
Liquid Assets / Total Assets 30.7 34.0
Liquid Assets / Short-term Liabilities 171.1 164.7
TC Liquid Assets / Total Assets 23.8 26.3
Profitability
Net Profit/Losses / Total Assets 2.7 2.5
Net Profit/Losses / Total Shareholders' Equity 16.7 16.8
Profit/Losses Before Taxes after Continuing Operations / Total Assets 3.4 3.0
Income-Expenditure Structure
Net Interest Income After Specific Provisions / Total Assets 3.7 3.7
Net Interest Income After Specific Provisions / Total Operating Income (Expenses) 81.2 82.4
Non-interest Income (net) / Total Assets 0.7 0.8
Other Operating Expenses / Total Assets 0.8 0.8
Personnel Expenses / Other Operating Expenses 57.6 59.7
Non-interest Income (net) / Other Operating Expenses 92.8 96.8
Quarterly profitability and income-expenditure ratios, except year-end figures, should be considered periodically.


II-233

II-234
Tab
le 1
Tu
rkis
h B
anks
- R
anke
d b
y T
ota
l Ass
ets,
as
of
Dec
emb
er 3
1, 2
010
Ban
ksG
rou
ps
Dat
e o
f E
stab
lish
.
To
tal
Ass
ets
(US
DM
illio
n)
To
tal
Lo
ans
and
Rec
eiv.
*(U
SD
Mill
ion
)
To
tal
Dep
osi
ts(U
SD
Mill
ion
)
To
tal
Sh
are-
ho
lder
s'E
qu
ity
(US
DM
illio
n)
Pai
d-i
nC
apit
al(U
SD
Mill
ion
)
Net
Inco
me/
Lo
ss(U
SD
Mill
ion
)
Off
Bal
ance
Sh
eet
Co
mm
it.
(US
DM
illio
n)
No
.of
Bra
nch
Off
ices
No
.of
Em
p'e
es
1T
ürki
ye C
umhu
riyet
i Zira
at B
anka
sı A
..
Sta
te-o
wne
d D
epos
it B
.18
6398
,309
37,3
5981
,814
8,75
31,
626
2,41
512
0,22
31,
399
22,7
08
2T
ürki
ye
Ban
kası
A.
.P
rivat
ely-
owne
d D
epos
it B
.19
2485
,716
41,7
7457
,401
11,0
652,
927
1,94
013
5,91
51,
142
23,9
44
3T
ürki
ye G
aran
ti B
anka
sı A
..
Priv
atel
y-ow
ned
Dep
osit
B.
1946
80,6
2142
,161
47,2
5410
,714
2,73
22,
046
333,
037
859
16,6
75
4A
kban
k T
.A.
.P
rivat
ely-
owne
d D
epos
it B
.19
4873
,610
34,4
0143
,683
11,4
242,
601
1,85
810
3,85
591
315
,330
5Y
apı v
e K
redi
Ban
kası
A.
.P
rivat
ely-
owne
d D
epos
it B
.19
4455
,135
34,2
1934
,290
6,71
02,
827
1,34
014
3,75
086
814
,411
6T
ürki
ye V
akıfl
ar B
anka
sı T
.A.O
.S
tate
-ow
ned
Dep
osit
B.
1954
48,1
0229
,176
31,0
235,
566
1,62
675
393
,483
636
11,0
77
7T
ürki
ye H
alk
Ban
kası
A.
.S
tate
-ow
ned
Dep
osit
B.
1938
47,4
3928
,809
35,6
284,
842
813
1,30
734
9,03
970
913
,450
8F
inan
s B
ank
A.
.F
orei
gn B
.19
8724
,771
16,1
6715
,889
3,38
71,
434
595
105,
445
503
11,7
34
9D
eniz
bank
A.
.F
orei
gn B
.19
9717
,989
12,0
0510
,271
2,04
346
629
810
3,87
250
08,
573
10T
ürk
Eko
nom
i Ban
kası
A.
.P
rivat
ely-
owne
d D
epos
it B
.19
2712
,377
7,64
47,
804
1,17
971
519
537
,140
335
5,64
6
11H
SB
C B
ank
A.
.F
orei
gn B
.19
9011
,536
6,29
06,
961
1,75
642
415
878
,706
333
6,57
0
12IN
G B
ank
A.
.F
orei
gn B
.19
8411
,251
7,92
46,
068
1,35
61,
235
7395
,273
323
5,86
5
13F
ortis
Ban
k A
..
For
eign
B.
1964
7,89
15,
352
4,07
51,
252
683
1518
,072
269
4,57
2
14ek
erba
nk T
.A.
.P
rivat
ely-
owne
d D
epos
it B
.19
537,
394
4,55
75,
007
911
488
111
75,8
4126
03,
485
15lle
r B
anka
sı A
..
Dev
't an
d In
v't
B.
1933
6,29
44,
338
04,
797
3,84
015
62,
045
192,
971
16T
ürki
ye Sın
ai K
alkı
nma
Ban
kası
A.
.D
ev't
and
Inv'
t B
.19
505,
146
3,10
40
822
455
138
33,1
884
347
17T
ürk
Exi
mba
nkD
ev't
and
Inv'
t B
.19
874,
090
2,70
50
2,36
01,
301
167
1,99
02
360
18C
itiba
nk A
..
For
eign
B.
1980
4,08
71,
497
2,82
260
822
5725
,698
372,
116
19A
nado
luba
nk A
..
Priv
atel
y-ow
ned
Dep
osit
B.
1996
2,91
91,
969
1,71
549
139
080
19,6
0586
1,83
4
20A
ltern
atif
Ban
k A
..
Priv
atel
y-ow
ned
Dep
osit
B.
1992
2,77
02,
111
1,58
830
119
518
6,12
353
1,08
6
21E
urob
ank
Tek
fen
A.
.F
orei
gn B
.19
922,
700
1,05
41,
228
291
247
1011
,278
5487
5
22D
euts
che
Ban
k A
..
For
eign
B.
1988
1,98
411
01,
164
250
88-4
17,2
911
101
23T
ekst
il B
anka
sı A
..
Priv
atel
y-ow
ned
Dep
osit
B.
1986
1,67
41,
217
1,16
532
327
39
6,94
644
903
24B
ank
Mel
lat
For
eign
B.
1982
1,19
372
830
165
3517
703
51

II-235
Ban
ksG
rou
ps
Dat
e o
f E
stab
lish
.
To
tal
Ass
ets
(US
DM
illio
n)
To
tal
Lo
ans
and
Rec
eiv.
*(U
SD
Mill
ion
)
To
tal
Dep
osi
ts(U
SD
Mill
ion
)
To
tal
Sh
are-
ho
lder
s'E
qu
ity
(US
DM
illio
n)
Pai
d-i
nC
apit
al(U
SD
Mill
ion
)
Net
Inco
me/
Lo
ss(U
SD
Mill
ion
)
Off
Bal
ance
Sh
eet
Co
mm
it.
(US
DM
illio
n)
No
.of
Bra
nch
Off
ices
No
.of
Em
p'e
es
25B
ankP
oziti
f Kre
di v
e K
alkı
nma
Ban
kası
AD
ev't
and
Inv'
t B
.19
991,
057
733
030
521
916
4,66
02
288
26T
ürki
ye K
alkı
nma
Ban
kası
A.
.D
ev't
and
Inv'
t B
.19
751,
039
766
033
410
414
5,74
81
712
27T
urkl
and
Ban
k A
..
For
eign
B.
1991
982
652
743
143
111
27,
513
2751
0
28M
KB
Tak
as v
e S
akla
ma
Ban
kası
A.
.D
ev't
and
Inv'
t B
.19
9597
913
019
439
185,
749,
256
121
1
29A
ktif
Yatırım
Ban
kası
A.
.D
ev't
and
Inv'
t B
.19
9996
246
90
139
106
237,
594
631
6
30W
estL
B A
GF
orei
gn B
.19
8577
733
3811
435
1314
142
31A
rap
Tür
k B
anka
sı A
..
For
eign
B.
1977
742
322
207
199
156
151,
424
625
5
32T
he R
oyal
Ban
k of
Sco
tland
N.V
.F
orei
gn B
.19
2174
016
331
524
770
157,
162
312
9
33T
urki
sh B
ank
A.
.P
rivat
ely-
owne
d D
epos
it B
.19
8267
027
041
810
252
21,
051
2127
3
34M
illen
nium
Ban
k A
..
For
eign
B.
1984
587
416
488
7013
2-1
06,
138
1829
2
35B
irle
ik F
on B
anka
sı A
..
B. U
nder
the
Dep
.Ins.
Fun
d19
5851
42
1737
730
01
2,36
81
252
36JP
Mor
gan
Cha
se B
ank
N.A
.F
orei
gn B
.19
8445
60
327
125
6514
1,03
61
53
37S
ocié
té G
énér
ale
(SA
)F
orei
gn B
.19
8943
922
843
6086
346
116
259
38M
erril
l Lyn
ch Y
atırım
Ban
k A
..
Dev
't an
d In
v't
B.
1992
220
00
4033
1027
21
33
39N
urol
Yatırım
Ban
kası
A.
.D
ev't
and
Inv'
t B
.19
9914
178
036
290
1,18
92
49
40G
SD
Yatırım
Ban
kası
A.
.D
ev't
and
Inv'
t B
.19
9868
590
4633
31,
369
128
41D
iler
Yatırım
Ban
kası
A.
.D
ev't
and
Inv'
t B
.19
9867
570
5539
216
21
18
42H
abib
Ban
k Li
mite
dF
orei
gn B
.19
8349
1413
2620
144
116
43C
redi
t Agr
icol
e Y
atırım
Ban
kası
Tür
k A
.D
ev't
and
Inv'
t B
.19
9043
00
3826
440
81
20
44A
daba
nk A
..
Priv
atel
y-ow
ned
Dep
osit
B.
1985
330
428
520
91
46
45T
aib
Yatırım
Ban
k A
..
Dev
't an
d In
v't
B.
1987
90
08
18-2
61
17
To
tal
625,
570
330,
946
399,
766
83,9
5429
,167
13,8
927,
715,
771
9,46
517
8,50
3
* T
otal
Loa
ns a
nd R
ecei
vabl
es =
Loa
ns a
nd R
ecei
vabl
es +
Loa
ns u
nder
Fol
low
up
- S
peci
fic P
rovi
sion
s
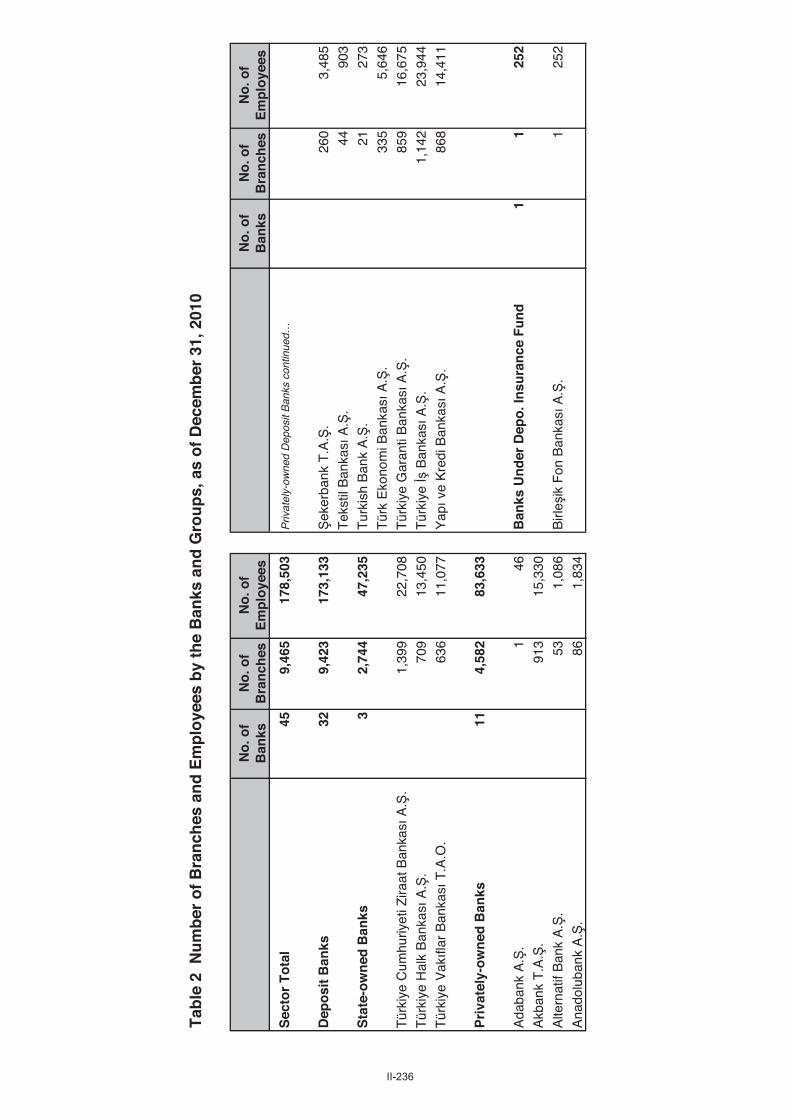
II-236
Tab
le 2
Nu
mb
er o
f B
ran
ches
an
d E
mp
loye
es b
y th
e B
anks
an
d G
rou
ps,
as
of
Dec
emb
er 3
1, 2
010
No
. of
Ban
ksN
o. o
f B
ran
ches
No
. of
Em
plo
yees
No
. of
Ban
ksN
o. o
f B
ran
ches
No
. of
Em
plo
yees
Sec
tor
To
tal
459,
465
178,
503
Priv
atel
y-ow
ned
Dep
osit
Ban
ks c
ontin
ued…
Dep
osi
t B
anks
329,
423
173,
133
eker
bank
T.A
..
260
3,48
5
Tek
stil
Ban
kası
A.
. 44
903
Sta
te-o
wn
ed B
anks
32,
744
47,2
35T
urki
sh B
ank
A.
.21
273
Tür
k E
kono
mi B
anka
sı A
..
335
5,64
6
Tür
kiye
Cum
huriy
eti Z
iraat
Ban
kası
A.
.1,
399
22,7
08T
ürki
ye G
aran
ti B
anka
sı A
..
859
16,6
75
Tür
kiye
Hal
k B
anka
sı A
..
709
13,4
50T
ürki
ye
Ban
kası
A.
.1,
142
23,9
44
Tür
kiye
Vakıfl
ar B
anka
sı T
.A.O
.63
611
,077
Yapı v
e K
redi
Ban
kası
A.
.86
814
,411
Pri
vate
ly-o
wn
ed B
anks
114,
582
83,6
33
Ada
bank
A.
.1
46B
anks
Un
der
Dep
o. I
nsu
ran
ce F
un
d1
125
2A
kban
k T
.A.
.91
315
,330
Alte
rnat
if B
ank
A.
.53
1,08
6B
irle
ik F
on B
anka
sı A
..
125
2
Ana
dolu
bank
A.
.86
1,83
4
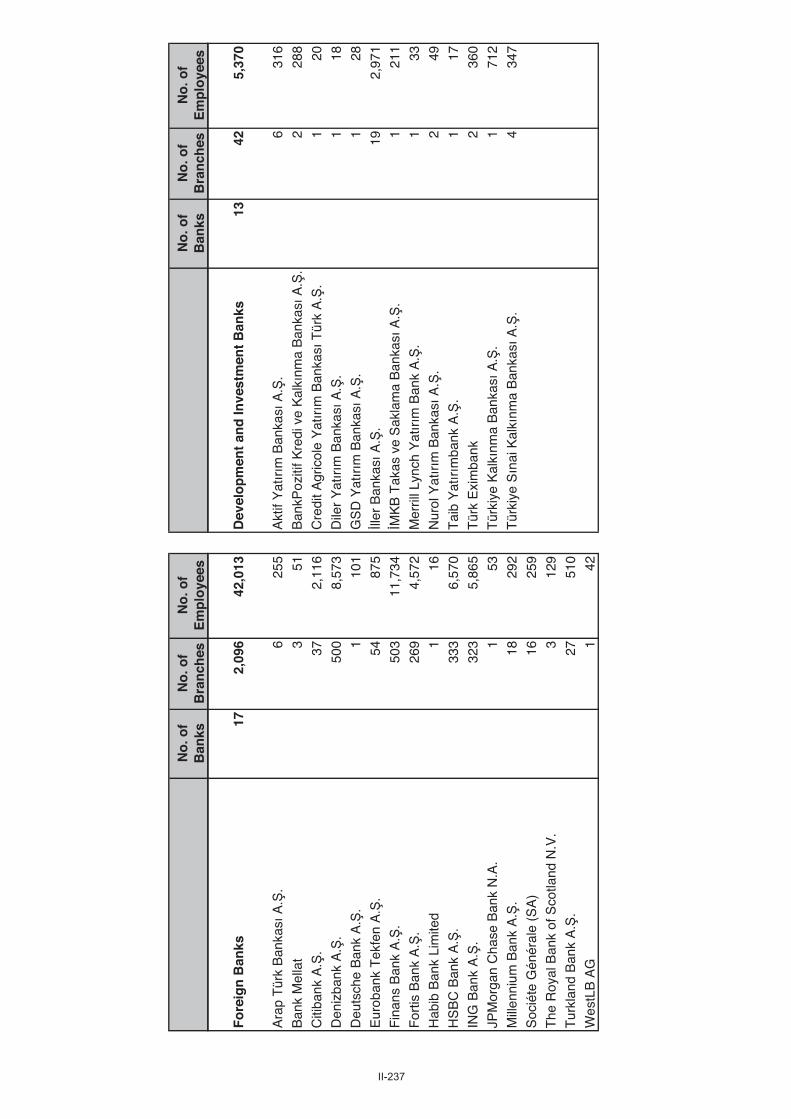
II-237
No
. of
Ban
ksN
o. o
f B
ran
ches
No
. of
Em
plo
yees
No
. of
Ban
ksN
o. o
f B
ran
ches
No
. of
Em
plo
yees
Fo
reig
n B
anks
172,
096
42,0
13D
evel
op
men
t an
d In
vest
men
t B
anks
1342
5,37
0
Ara
p T
ürk
Ban
kası
A.
.6
255
Akt
if Y
atırım
Ban
kası
A.
.6
316
Ban
k M
ella
t3
51B
ankP
oziti
f Kre
di v
e K
alkı
nma
Ban
kası
A.
.2
288
Citi
bank
A.
.37
2,11
6C
redi
t Agr
icol
e Y
atırım
Ban
kası
Tür
k A
..
120
Den
izba
nk A
..
500
8,57
3D
iler
Yatırım
Ban
kası
A.
.1
18
Deu
tsch
e B
ank
A.
.1
101
GS
D Y
atırım
Ban
kası
A.
.1
28
Eur
oban
k T
ekfe
n A
..
5487
5lle
r B
anka
sı A
..
192,
971
Fin
ans
Ban
k A
..
50
311
,734
MK
B T
akas
ve
Sak
lam
a B
anka
sı A
..
121
1
For
tis B
ank
A.
.26
94,
572
Mer
rill L
ynch
Yatırım
Ban
k A
..
133
Hab
ib B
ank
Lim
ited
1
16N
urol
Yatırım
Ban
kası
A.
.2
49
HS
BC
Ban
k A
..
333
6,57
0T
aib
Yatırım
bank
A.
.1
17
ING
Ban
k A
..
323
5,86
5T
ürk
Exi
mba
nk2
360
JPM
orga
n C
hase
Ban
k N
.A.
153
Tür
kiye
Kal
kınm
a B
anka
sı A
..
171
2
Mill
enni
um B
ank
A.
.18
292
Tür
kiye
Sın
ai K
alkı
nma
Ban
kası
A.
.4
347
Soc
iéte
Gén
éral
e (S
A)
1625
9
The
Roy
al B
ank
of S
cotla
nd N
.V.
312
9
Tur
klan
d B
ank
A.
.27
510
Wes
tLB
AG
142

II-238
Tab
le 3
Pre
sen
tati
on
of
Ass
ets
and
Lia
bili
ties
Acc
ord
ing
to
th
eir
Ou
tsta
nd
ing
Mat
uri
ties
, as
of
Dec
emb
er 3
1, 2
010
(US
D M
illio
n)
Dem
and
Up
to
1
Mo
nth
1-3
Mo
nth
s3
– 12
M
on
ths
1 –
5 Y
ears
5 Y
ears
an
d
Ove
rU
nd
istr
ibu
ted
To
tal
Ass
ets
Cas
h (c
ash
in v
ault,
effe
ctiv
es, m
oney
in
tran
sit,
cheq
ues
purc
hase
d) a
nd B
alan
ces
with
the
Cen
tral
Ban
k of
Tur
key
27,7
569,
504
1,24
128
711
00
38,8
00D
ue fr
om b
anks
4,
231
12,2
241,
005
694
1,70
51,
584
121
,444
Fin
anci
al a
sset
s w
here
fair
valu
e ch
ange
is
refle
cted
to in
com
e st
atem
ent
51,
066
990
1,32
52,
771
1,13
11
7,28
9M
oney
mar
ket p
lace
men
ts14
8,08
20
00
00
8,09
6
Mar
keta
ble
secu
ritie
s av
aila
ble
for
sale
343
5,39
83,
322
19,5
8171
,815
28,6
2817
612
9,26
4Lo
ans
6,69
955
,807
30,8
3478
,442
120,
639
37,4
671,
354
331,
242
Inve
stm
ents
hel
d to
mat
urity
0
7,43
91,
392
4,58
838
,608
11,6
300
63,6
57O
ther
ass
ets
1,48
42,
516
137
153
673
198
20,6
1625
,777
To
tal a
sset
s40
,534
102,
036
38,9
2110
5,07
023
6,22
280
,639
22,1
4862
5,57
0
Lia
bili
ties
Inte
rban
k de
posi
ts3,
101
12,4
632,
046
746
175
00
18,5
31O
ther
dep
osits
59,8
2724
4,80
462
,320
13,5
0366
911
20
381,
235
Fun
ds p
rovi
ded
from
oth
er fi
nanc
ial
inst
rum
ents
7
6,55
26,
557
21,7
8719
,478
9,96
110
64,3
52M
oney
mar
ket t
akin
gs24
30,1
233,
387
2,92
256
550
90
37,5
30M
arke
tabl
e se
curit
ies
issu
ed0
117
129
727
1,07
70
02,
049
Mis
cella
neou
s pa
yabl
es2,
710
8,30
256
572
883
022
712
,617
Oth
er li
abili
ties
3,56
33,
489
1,46
82,
176
4,95
92,
509
91,0
9010
9,25
5T
ota
l lia
bili
ties
69,2
3330
5,85
176
,472
42,5
8927
,007
13,0
9191
,327
625,
570
Liq
uid
ity
Gap
-28,
700
-203
,815
-37,
551
62,4
8120
9,21
567
,548
-69,
179
0
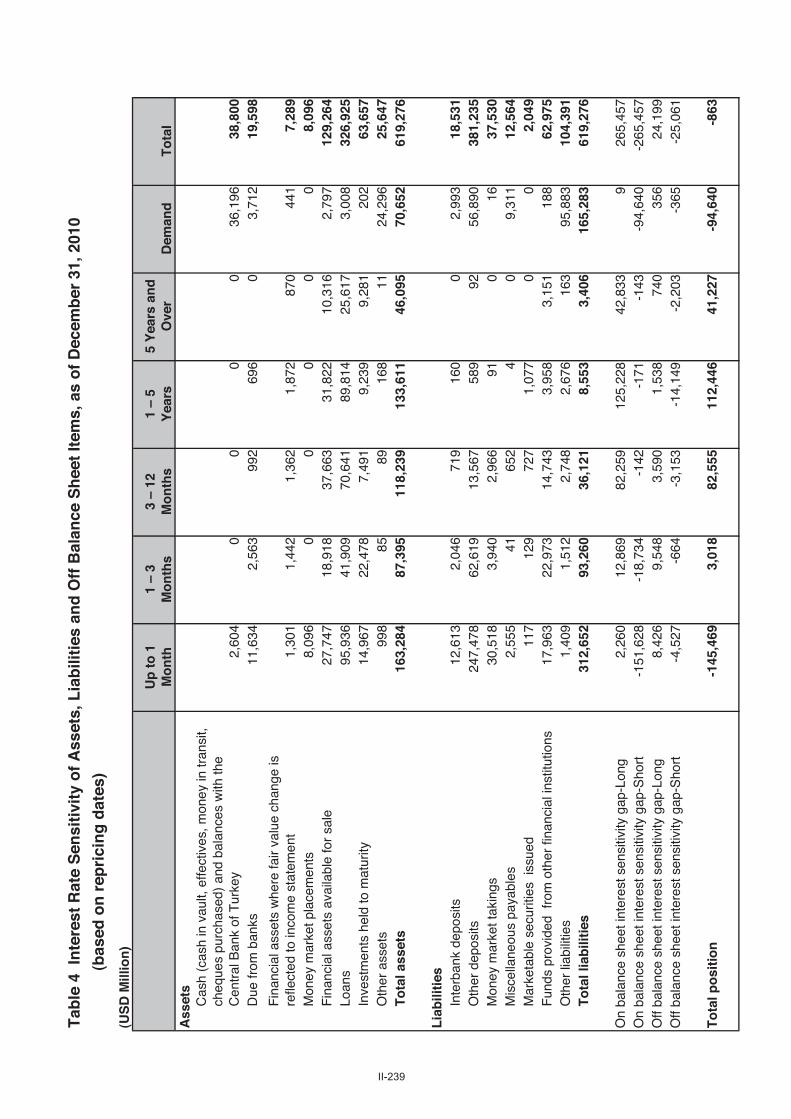
II-239
Tab
le 4
In
tere
st R
ate
Sen
siti
vity
of
Ass
ets,
Lia
bili
ties
an
d O
ff B
alan
ce S
hee
t It
ems,
as
of
Dec
emb
er 3
1, 2
010
(b
ased
on
rep
rici
ng
dat
es)
(US
D M
illio
n)
Up
to
1
Mo
nth
1 –
3M
on
ths
3 –
12
Mo
nth
s1
– 5
Yea
rs5
Yea
rs a
nd
O
ver
Dem
and
To
tal
Ass
ets
Cas
h (c
ash
in v
ault,
effe
ctiv
es, m
oney
in tr
ansi
t, ch
eque
s pu
rcha
sed)
and
bal
ance
s w
ith th
e C
entr
al B
ank
of T
urke
y2,
604
00
00
36,1
9638
,800
Due
from
ban
ks
11,6
342,
563
992
696
03,
712
19,5
98
Fin
anci
al a
sset
s w
here
fair
valu
e ch
ange
is
refle
cted
to in
com
e st
atem
ent
1,30
11,
442
1,36
21,
872
870
441
7,28
9M
oney
mar
ket p
lace
men
ts8,
096
00
00
08,
096
Fin
anci
al a
sset
s av
aila
ble
for
sale
27,7
4718
,918
37,6
6331
,822
10,3
162,
797
129,
264
Loan
s95
,936
41,9
0970
,641
89,8
1425
,617
3,00
832
6,92
5In
vest
men
ts h
eld
to m
atur
ity
14,9
6722
,478
7,49
19,
239
9,28
120
263
,657
Oth
er a
sset
s99
885
8916
811
24,2
9625
,647
To
tal a
sset
s16
3,28
487
,395
118,
239
133,
611
46,0
9570
,652
619,
276
Lia
bili
ties
Inte
rban
k de
posi
ts12
,613
2,04
671
916
00
2,99
318
,531
Oth
er d
epos
its24
7,47
862
,619
13,5
6758
992
56,8
9038
1,23
5M
oney
mar
ket t
akin
gs30
,518
3,94
02,
966
910
1637
,530
Mis
cella
neou
s pa
yabl
es
2,55
541
652
40
9,31
112
,564
Mar
keta
ble
secu
ritie
s is
sued
117
129
727
1,07
70
02,
049
Fun
ds p
rovi
ded
from
oth
er fi
nanc
ial i
nstit
utio
ns17
,963
22,9
7314
,743
3,95
83,
151
188
62,9
75O
ther
liab
ilitie
s1,
409
1,51
22,
748
2,67
616
395
,883
104,
391
To
tal l
iab
iliti
es31
2,65
293
,260
36,1
218,
553
3,40
616
5,28
361
9,27
6
On
bala
nce
shee
t int
eres
t sen
sitiv
ity g
ap-L
ong
2,26
012
,869
82,2
5912
5,22
842
,833
926
5,45
7O
n ba
lanc
e sh
eet i
nter
est s
ensi
tivity
gap
-Sho
rt-1
51,6
28-1
8,73
4-1
42-1
71-1
43-9
4,64
0-2
65,4
57O
ff ba
lanc
e sh
eet i
nter
est s
ensi
tivity
gap
-Lon
g8,
426
9,54
83,
590
1,53
874
035
624
,199
Off
bala
nce
shee
t int
eres
t sen
sitiv
ity g
ap-S
hort
-4,5
27-6
64-3
,153
-14,
149
-2,2
03-3
65-2
5,06
1
To
tal p
osi
tio
n-1
45,4
693,
018
82,5
5511
2,44
641
,227
-94,
640
-863

II-240
Tab
le 5
In
form
atio
n o
n C
urr
ency
Ris
k, a
s o
f D
ecem
ber
31,
201
0
(US
D M
illio
n)
EU
RO
US
DY
enO
ther
FC
To
tal
Ass
ets
Cas
h (c
ash
in v
ault,
effe
ctiv
es, m
oney
in tr
ansi
t, ch
eque
s pu
rcha
sed)
an
d ba
lanc
es w
ith th
e C
entr
al B
ank
of T
urke
y11
,921
7,21
63
448
19,5
89D
ue fr
om b
anks
5,
341
7,80
065
756
13,9
62
Fin
anci
al a
sset
s w
here
fair
valu
e ch
ange
is r
efle
cted
to in
com
e st
atem
ent
217
870
41
1,09
2M
oney
mar
ket p
lace
men
ts0
00
00
Fin
anci
al a
sset
s av
aila
ble
for
sale
5,03
513
,048
00
18,0
82Lo
ans
35,9
9067
,499
526
2,01
510
6,03
0In
vest
. and
ass
ocia
tes,
sub
sidi
arie
s an
d jo
int v
entu
res
(bus
. par
tner
s)1,
962
365
053
2,37
9In
vest
men
ts h
eld
to m
atur
ity2,
447
9,34
00
311
,791
Der
ivat
ive
finan
cial
ass
ets
held
for
hedg
ing
010
00
10P
rope
rty
and
equi
pmen
t2
30
16
Inta
ngib
le a
sset
s0
10
01
Oth
er a
sset
s50
61,
019
319
11,
719
To
tal A
sset
s63
,422
107,
169
601
3,46
917
4,66
1
Lia
bili
ties
Inte
rban
k de
posi
ts3,
144
5,36
02
601
9,10
8F
orei
gn c
urre
ncy
depo
sits
42,9
7165
,596
813,
594
112,
242
Mon
ey m
arke
t tak
ings
731
6,93
00
07,
661
Fun
ds p
rovi
ded
from
oth
er fi
nanc
ial i
nstit
utio
ns21
,145
31,7
0069
8452
,999
Mar
keta
ble
secu
ritie
s is
sued
0
1,01
20
01,
012
Mis
cella
neou
s pa
yabl
es
1,12
475
323
376
2,27
6D
eriv
ativ
e fin
anci
al li
abili
ties
held
for
hedg
ing
192
00
92O
ther
liab
ilitie
s1,
884
1,98
06
358
4,22
8T
ota
l lia
bili
ties
70,9
9911
3,42
218
35,
013
189,
617
Net
On
Bal
ance
Sh
eet
Po
siti
on
-7,5
77-6
,253
418
-1,5
44-1
4,95
6N
et O
ff B
alan
ce S
heet
Pos
ition
8,24
26,
053
-673
1,58
915
,210
Fin
anci
al d
eriv
ativ
e as
sets
22,2
5850
,916
1,20
65,
009
79,3
90F
inan
cial
der
ivat
ive
liabi
litie
s14
,016
44,8
631,
879
3,42
164
,179
Non
-cas
h lo
ans
14,0
4029
,571
620
1,01
545
,246
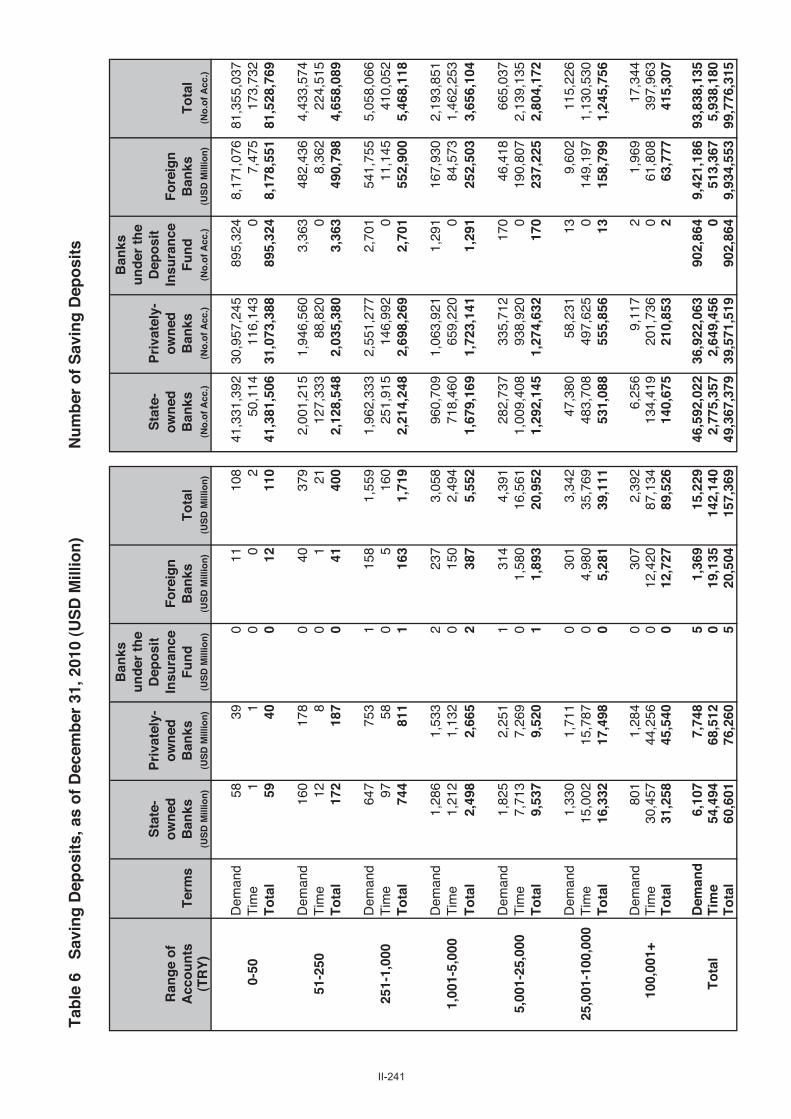
II-241
Tab
le 6
S
avin
g D
epo
sits
, as
of
Dec
emb
er 3
1, 2
010
(US
D M
illio
n)
Nu
mb
er o
f S
avin
g D
epo
sits
(TR
Y)
(US
D M
illio
n)
(US
D M
illio
n)
(US
D M
illio
n)
(US
D M
illio
n)
(US
D M
illio
n)
(No
.of
Acc
.)(N
o.o
f A
cc.)
(No
.of
Acc
.)(U
SD
Mill
ion
)(N
o.o
f A
cc.)
Dem
and
5839
011
108
41,3
31,3
9230
,957
,245
895,
324
8,17
1,07
681
,355
,037
0-5
0T
ime
11
00
250
,114
116,
143
07,
475
173,
732
To
tal
5940
012
110
41,3
81,5
0631
,073
,388
895,
324
8,17
8,55
181
,528
,769
Dem
and
160
178
040
379
2,00
1,21
51,
946,
560
3,36
348
2,43
64,
433,
574
51-2
50T
ime
128
01
2112
7,33
388
,820
08,
362
224,
515
To
tal
172
187
041
400
2,12
8,54
82,
035,
380
3,36
349
0,79
84,
658,
089
Dem
and
647
753
115
81,
559
1,96
2,33
32,
551,
277
2,70
154
1,75
55,
058,
066
251-
1,00
0T
ime
9758
05
160
251,
915
146,
992
011
,145
410,
052
To
tal
744
811
116
31,
719
2,21
4,24
82,
698,
269
2,70
155
2,90
05,
468,
118
Dem
and
1,28
61,
533
223
73,
058
960,
709
1,06
3,92
11,
291
167,
930
2,19
3,85
11,
001-
5,00
0T
ime
1,21
21,
132
015
02,
494
718,
460
659,
220
084
,573
1,46
2,25
3T
ota
l2,
498
2,66
52
387
5,55
21,
679,
169
1,72
3,14
11,
291
252,
503
3,65
6,10
4
Dem
and
1,82
52,
251
131
44,
391
282,
737
335,
712
170
46,4
1866
5,03
75,
001-
25,0
00T
ime
7,71
37,
269
01,
580
16,5
611,
009,
408
938,
920
019
0,80
72,
139,
135
To
tal
9,53
79,
520
11,
893
20,9
521,
292,
145
1,27
4,63
217
023
7,22
52,
804,
172
Dem
and
1,33
01,
711
030
13,
342
47,3
8058
,231
139,
602
115,
226
25,0
01-1
00,0
00T
ime
15,0
0215
,787
04,
980
35,7
6948
3,70
849
7,62
50
149,
197
1,13
0,53
0T
ota
l16
,332
17,4
980
5,28
139
,111
531,
088
555,
856
1315
8,79
91,
245,
756
Dem
and
801
1,28
40
307
2,39
26,
256
9,11
72
1,96
917
,344
100
,001
+T
ime
30,4
5744
,256
012
,420
87,1
3413
4,41
920
1,73
60
61,8
0839
7,96
3T
ota
l31
,258
45,5
400
12,7
2789
,526
140,
675
210,
853
263
,777
415,
307
Dem
and
6,10
77,
748
51,
369
15,2
2946
,592
,022
36,9
22,0
6390
2,86
49,
421,
186
93,8
38,1
35T
ota
lT
ime
54,4
9468
,512
019
,135
142,
140
2,77
5,35
72,
649,
456
051
3,36
75,
938,
180
To
tal
60,6
0176
,260
520
,504
157,
369
49,3
67,3
7939
,571
,519
902,
864
9,93
4,55
399
,776
,315
Ran
ge
of
Acc
ou
nts
Ter
ms
Sta
te-
ow
ned
Ban
ksT
ota
lF
ore
ign
Ban
ks
Pri
vate
ly-
ow
ned
Ban
ks
Ban
ksu
nd
er t
he
Dep
osi
tIn
sura
nce
Fu
nd
To
tal
Sta
te-
ow
ned
Ban
ks
Pri
vate
ly-
ow
ned
Ban
ks
Ban
ksu
nd
er t
he
Dep
osi
tIn
sura
nce
Fu
nd
Fo
reig
nB
anks

II-242
Tab
le 7
Nu
mb
er o
f D
epo
sit
Acc
ou
nts
, as
of
Dec
emb
er 3
1, 2
010
Ban
ksS
avin
gD
epo
sits
Pu
blic
Sec
tor
Dep
osi
tsC
om
mer
cial
Dep
osi
tsIn
terb
ank
Dep
osi
ts
Fo
reig
nC
urr
ency
Dep
osi
ts
Oth
erIn
stit
uti
on
sD
epo
sits
Pre
cio
us
Met
als
Dep
osi
tsT
ota
l
Dep
osi
t B
anks
99
,776
,315
269,
770
6,71
6,96
720
,635
12,0
28,8
3649
5,74
939
7,18
411
9,70
5,45
6
Sta
te-o
wn
ed B
anks
49,3
67,3
7920
5,71
42,
000,
502
2,18
83,
627,
868
322,
861
256,
555
55,7
83,0
67
Tür
kiye
Cum
huriy
eti Z
iraat
Ban
kası
A.
.36
,201
,772
113,
720
466,
569
656
2,04
9,95
418
2,93
70
39,0
15,6
08T
ürki
ye H
alk
Ban
kası
A.
.5,
553,
786
26,1
311,
018,
948
354
623,
754
39,5
9225
6,55
57,
519,
120
Tür
kiye
Vakıfl
ar B
anka
sı T
.A.O
.
7,
611,
821
65,8
6351
4,98
51,
178
954,
160
100,
332
09,
248,
339
Pri
vate
ly-o
wn
ed B
anks
39,5
71,5
1955
,091
3,87
4,03
414
,744
6,56
9,14
915
2,03
313
3,00
650
,369
,576
Ada
bank
A.
.68
015
029
00
112
Akb
ank
T.A
..
14,3
48,7
0413
,639
1,20
0,83
886
61,
018,
071
38,7
220
16,6
20,8
40A
ltern
atif
Ban
k A
..
19,9
3716
7,63
726
12,6
9517
70
40,4
88A
nado
luba
nk A
..
123,
264
1732
,317
6225
,813
517
018
1,99
0ek
erba
nk T
.A.
.32
4,49
166
366
,217
7278
,590
9,50
72,
378
481,
918
Tek
stil
Ban
kası
A.
. 12
,514
213,
171
117,
455
283
023
,455
Tur
kish
Ban
k A
..
22,2
9619
02,
916
4810
,682
40
36,1
36T
ürk
Eko
nom
i Ban
kası
A.
.1,
917,
495
2,98
340
2,63
41,
400
389,
879
4,20
76,
204
2,72
4,80
2T
ürki
ye G
aran
ti B
anka
sı A
..
3,83
3,61
13,
726
350,
354
534
611,
355
10,3
6632
,563
4,84
2,50
9T
ürki
ye B
anka
sı A
..
16,0
39,6
5532
,819
1,35
2,84
011
,372
3,91
4,90
880
,021
72,4
9521
,504
,110
Yapı v
e K
redi
Ban
kası
A.
.2,
929,
484
1,01
745
5,09
535
349
9,67
28,
229
19,3
663,
913,
216

II-243
Ban
ksS
avin
gD
epo
sits
Pu
blic
Sec
tor
Dep
osi
tsC
om
mer
cial
Dep
osi
tsIn
terb
ank
Dep
osi
ts
Fo
reig
nC
urr
ency
Dep
osi
ts
Oth
erIn
stit
uti
on
sD
epo
sits
Pre
cio
us
Met
als
Dep
osi
tsT
ota
l
Ban
ks U
nd
er D
epo
. In
sura
nce
Fu
nd
902,
864
258,
816
435,
034
1917
391
6,97
4
Birl
eik
Fon
Ban
kası
A.
.90
2,86
425
8,81
643
5,03
419
173
916,
974
Fo
reig
n B
anks
9,93
4,55
38,
940
833,
615
3,66
01,
826,
785
20,8
367,
450
12,6
35,8
39
Ara
p T
ürk
Ban
kası
A.
.92
30
625
482,
466
110
4,07
3B
ank
Mel
lat
184
070
160
2,90
35
03,
853
Citi
bank
A.
.25
,085
02,
395
188
20,2
7718
047
,963
Den
izba
nk A
..
870,
429
1,69
120
1,64
519
011
8,71
84,
463
844
1,19
7,98
0D
euts
che
Ban
k A
..
00
459
385
822
214
01,
880
Eur
oban
k T
ekfe
n A
..
51,3
6220
6,67
338
9,22
035
60
67,6
69F
inan
s B
ank
A.
.1,
102,
617
1,07
913
9,51
828
620
3,72
82,
762
1,21
51,
451,
205
For
tis B
ank
A.
. 35
2,22
256
074
,020
149
51,5
931,
956
5,19
648
5,69
6H
abib
Ban
k Li
mite
d
920
800
233
00
405
HS
BC
Ban
k A
..
3,49
6,61
21,
665
168,
709
546
694,
782
2,89
619
54,
365,
405
ING
Ban
k A
..
4,00
8,73
23,
917
232,
697
1,69
370
6,16
68,
099
04,
961,
304
JPM
orga
n C
hase
Ban
k N
.A.
00
67
20
015
Mill
enni
um B
ank
A.
.17
,453
02,
600
2111
,456
180
31,5
48S
ocié
te G
énér
ale
(SA
)0
050
427
00
81T
he R
oyal
Ban
k of
Sco
tland
N.V
.5
039
123
439
10
859
Tur
klan
d B
ank
A.
.8,
837
82,
975
183,
890
360
15,7
64W
estL
B A
G0
071
463
10
139

II-244
Tab
le 8
Mat
uri
ty S
tru
ctu
re o
f D
epo
sits
, as
of
Dec
emb
er 3
1, 2
010
(US
D M
illio
n)
Dem
and
Dep
osi
ts
Wit
h 7
d
ays
mat
uri
tyU
p t
o 1
m
on
th1-
3 M
on
th3-
6 M
on
th6
Mo
nth
-1
Yea
r1
Yea
r an
d
ove
rC
um
ula
tive
dep
osi
tT
ota
lD
epo
sits
Sta
te-o
wn
ed B
anks
22,7
270
29,8
9981
,341
8,01
72,
300
4,12
951
148,
465
Sav
ing
Dep
osits
6,10
70
10,5
5240
,835
2,25
138
642
544
60,6
01P
ublic
Sec
tor
Dep
osits
6,10
00
1,99
36,
095
868
2415
015
,095
Com
mer
cial
Dep
osits
3,54
30
6,23
414
,321
998
201
270
25,3
23In
terb
ank
Dep
osits
809
03,
205
690
3727
50
05,
016
For
eign
Cur
renc
y D
epos
its4,
001
06,
528
12,4
052,
350
1,36
33,
645
730
,298
Oth
er In
stitu
tions
Dep
osits
1,86
00
1,38
76,
995
1,51
451
170
11,8
24P
reci
ous
Met
als
Dep
osits
308
00
00
00
030
8
Pri
vate
ly-o
wn
ed B
anks
31,8
790
58,7
4895
,888
6,67
83,
356
3,71
763
200,
329
Sav
ing
Dep
osits
7,74
80
26,2
1839
,169
2,01
956
153
86
76,2
60P
ublic
Sec
tor
Dep
osits
1,17
10
109
112
31
50
1,40
0C
omm
erci
al D
epos
its9,
053
09,
161
18,8
021,
067
190
141
038
,414
Inte
rban
k D
epos
its1,
127
03,
396
4,35
522
337
529
80
9,77
3F
orei
gn C
urre
ncy
Dep
osits
11,7
240
18,6
4628
,570
2,43
32,
212
2,71
357
66,3
55O
ther
Inst
itutio
ns D
epos
its29
20
1,20
74,
849
921
35
07,
277
Pre
ciou
s M
etal
s D
epos
its76
40
1032
1214
170
850
Ban
ks U
nd
er t
he
Dep
. In
s. F
un
d17
00
00
00
017
Sav
ing
Dep
osits
50
00
00
00
5P
ublic
Sec
tor
Dep
osits
00
00
00
00
0C
omm
erci
al D
epos
its2
00
00
00
02
Inte
rban
k D
epos
its0
00
00
00
00
For
eign
Cur
renc
y D
epos
its10
00
00
00
010
Oth
er In
stitu
tions
Dep
osits
00
00
00
00
0P
reci
ous
Met
als
Dep
osits
00
00
00
00
0

II-245
Dem
and
Dep
osi
ts
Wit
h 7
d
ays
mat
uri
tyU
p t
o 1
m
on
th1-
3 M
on
th3-
6 M
on
th6
Mo
nth
-1
Yea
r1
Yea
r an
d
ove
rC
um
ula
tive
dep
osi
tT
ota
lD
epo
sits
Fo
reig
n B
anks
8,30
50
15,2
6924
,668
1,71
669
328
915
50,9
56
Sav
ing
Dep
osits
1,36
90
4,98
413
,398
558
155
2911
20,5
04P
ublic
Sec
tor
Dep
osits
345
07
111
140
00
477
Com
mer
cial
Dep
osits
2,02
80
3,47
94,
408
435
8612
60
10,5
61In
terb
ank
Dep
osits
1,16
50
1,81
048
115
211
915
03,
743
For
eign
Cur
renc
y D
epos
its3,
246
04,
922
5,55
647
731
211
94
14,6
36O
ther
Inst
itutio
ns D
epos
its73
056
713
8121
10
945
Pre
ciou
s M
etal
s D
epos
its78
010
10
00
089
To
tal
62,9
280
103,
916
201,
897
16,4
116,
349
8,13
513
039
9,76
6
Sav
ing
Dep
osits
15,2
290
41,7
5593
,402
4,82
81,
102
992
6115
7,36
9P
ublic
Sec
tor
Dep
osits
7,61
60
2,10
96,
317
885
2620
016
,973
Com
mer
cial
Dep
osits
14,6
260
18,8
7437
,532
2,49
947
629
30
74,3
00In
terb
ank
Dep
osits
3,10
10
8,41
25,
526
412
769
313
018
,532
For
eign
Cur
renc
y D
epos
its18
,980
030
,096
46,5
315,
260
3,88
76,
478
6811
1,30
0O
ther
Inst
itutio
ns D
epos
its2,
224
02,
651
12,5
572,
516
7522
020
,045
Pre
ciou
s M
etal
s D
epos
its1,
151
020
3312
1517
01,
247

II-246
Tab
le 9
C
lass
ific
atio
n o
f D
epo
sits
, as
of
Dec
emb
er 3
1, 2
010
(US
D M
illio
n)
Ban
ksS
avin
gD
epo
sits
Pu
blic
Sec
tor
Dep
osi
tsC
om
mer
cial
Dep
osi
tsIn
terb
ank
Dep
osi
ts
Fo
reig
nC
urr
ency
Dep
osi
ts
Oth
erIn
stit
uti
on
sD
epo
sits
Pre
cio
us
Met
als
Dep
osi
tsT
ota
l
Sec
tor
To
tal
157,
369
16,9
7374
,300
18,5
3211
1,30
020
,045
1,24
739
9,76
6
Sta
te-o
wn
ed D
epo
sit
Ban
ks60
,601
15,0
9525
,323
5,01
630
,298
11,8
2430
814
8,46
5
Tür
kiye
Cum
huriy
eti Z
iraat
Ban
kası
A.
.38
,121
8,45
712
,414
1,60
914
,355
6,85
80
81,8
14T
ürki
ye H
alk
Ban
kası
A.
.14
,407
2,15
16,
308
2,09
78,
321
2,03
830
835
,628
Tür
kiye
Vakıfl
ar B
anka
sı T
.A.O
.
8,07
44,
488
6,60
21,
310
7,62
22,
927
031
,023
Pri
vate
ly-o
wn
ed D
epo
sit
Ban
ks76
,260
1,40
038
,414
9,77
366
,355
7,27
785
020
0,32
9
Ada
bank
A.
.0
04
00
00
4A
kban
k T
.A.
.
16,2
8626
68,
740
4,79
912
,891
702
043
,683
Alte
rnat
if B
ank
A.
.58
723
386
557
610
01,
588
Ana
dolu
bank
A.
.76
817
260
5061
27
01,
715
eker
bank
T.A
..
2,01
829
1,06
882
1,36
542
718
5,00
7T
ekst
il B
anka
sı A
..
418
427
15
463
40
1,16
5T
urki
sh B
ank
A.
.97
122
186
110
30
418
Tür
k E
kono
mi B
anka
sı A
..
2,37
582
2,15
678
82,
211
108
847,
804
Tür
kiye
Gar
anti
Ban
kası
A.
.17
,450
357
9,58
11,
566
17,6
7532
130
547
,254
Tür
kiye
Ban
kası
A.
.24
,892
364
7,84
81,
606
17,8
194,
654
219
57,4
01Y
apı v
e K
redi
Ban
kası
A.
.11
,370
258
8,07
868
612
,634
1,04
122
434
,290
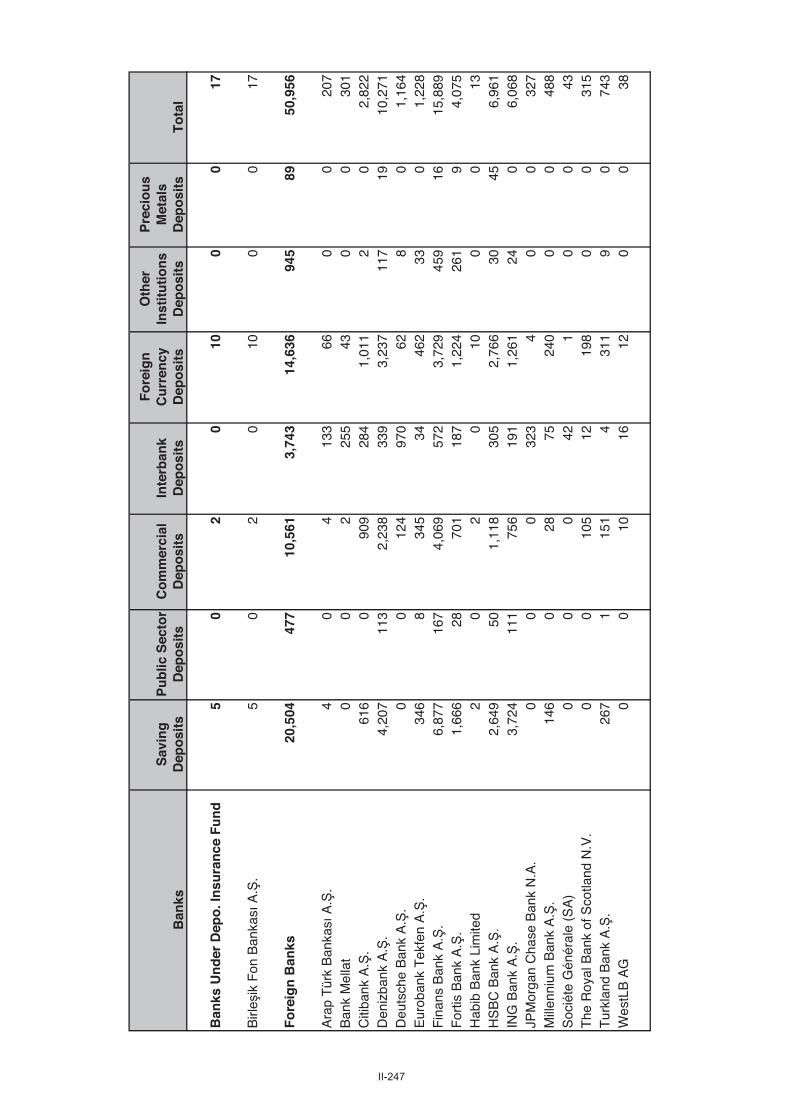
II-247
Ban
ksS
avin
gD
epo
sits
Pu
blic
Sec
tor
Dep
osi
tsC
om
mer
cial
Dep
osi
tsIn
terb
ank
Dep
osi
ts
Fo
reig
nC
urr
ency
Dep
osi
ts
Oth
erIn
stit
uti
on
sD
epo
sits
Pre
cio
us
Met
als
Dep
osi
tsT
ota
l
Ban
ks U
nd
er D
epo
. In
sura
nce
Fu
nd
50
20
100
017
Birl
eik
Fon
Ban
kası
A.
.5
02
010
00
17
Fo
reig
n B
anks
20,5
0447
710
,561
3,74
314
,636
945
8950
,956
Ara
p T
ürk
Ban
kası
A.
.4
04
133
660
020
7B
ank
Mel
lat
0
02
255
430
030
1C
itiba
nk A
..
61
60
909
284
1,01
12
02,
822
Den
izba
nk A
..
4,20
711
32,
238
339
3,23
711
719
10,2
71D
euts
che
Ban
k A
..
00
124
970
628
01,
164
Eur
oban
k T
ekfe
n A
..
346
834
534
462
330
1,22
8F
inan
s B
ank
A.
.
6,87
716
74,
069
572
3,72
945
916
15,8
89F
ortis
Ban
k A
..
1,
666
2870
118
71,
224
261
94,
075
Hab
ib B
ank
Lim
ited
2
02
010
00
13H
SB
C B
ank
A.
.2,
649
501,
118
305
2,76
630
456,
961
ING
Ban
k A
..
3,72
411
175
619
11,
261
240
6,06
8JP
Mor
gan
Cha
se B
ank
N.A
.0
00
323
40
032
7M
illen
nium
Ban
k A
..
146
028
7524
00
048
8S
ocié
te G
énér
ale
(SA
)0
00
421
00
43T
he R
oyal
Ban
k of
Sco
tland
N.V
.0
010
512
198
00
315
Tur
klan
d B
ank
A.
.26
71
151
431
19
074
3W
estL
B A
G0
010
1612
00
38
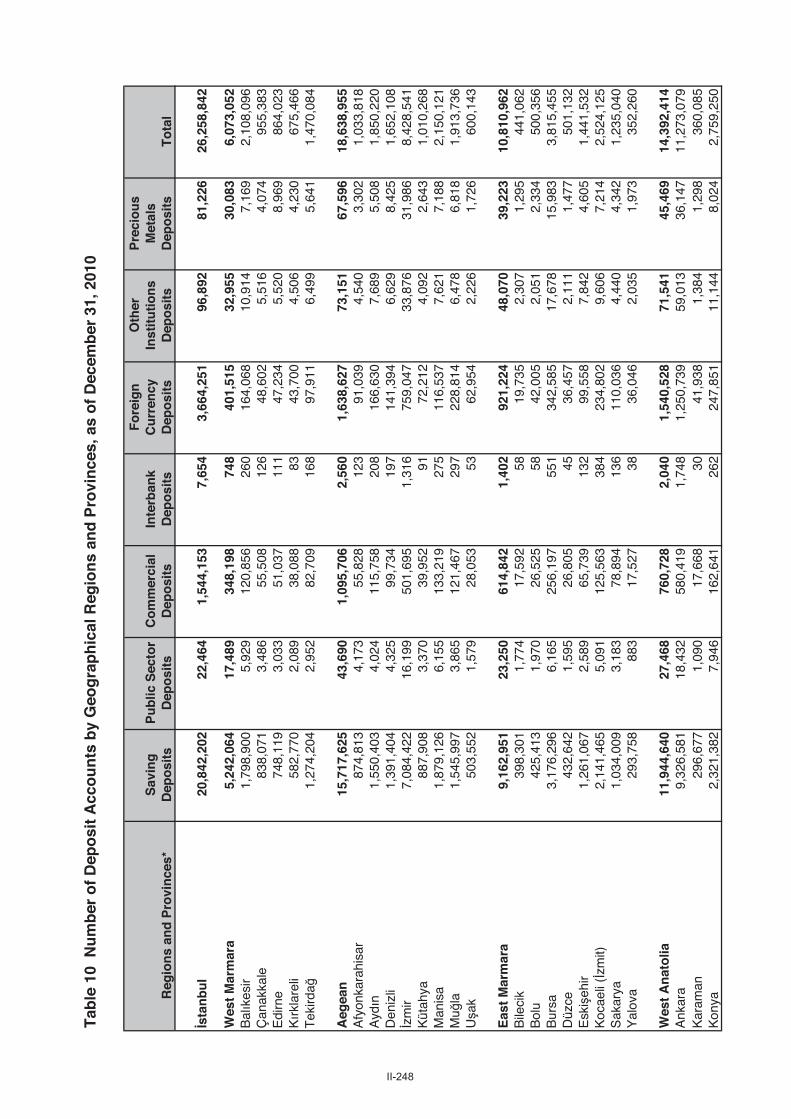
II-248
Tab
le 1
0 N
um
ber
of
Dep
osi
t A
cco
un
ts b
y G
eog
rap
hic
al R
egio
ns
and
Pro
vin
ces,
as
of
Dec
emb
er 3
1, 2
010
Reg
ion
s an
d P
rovi
nce
s*S
avin
gD
epo
sits
Pu
blic
Sec
tor
Dep
osi
tsC
om
mer
cial
Dep
osi
tsIn
terb
ank
Dep
osi
ts
Fo
reig
nC
urr
ency
Dep
osi
ts
Oth
erIn
stit
uti
on
sD
epo
sits
Pre
cio
us
Met
als
Dep
osi
tsT
ota
l
stan
bu
l20
,842
,202
22,4
641,
544,
153
7,65
43,
664,
251
96,8
9281
,226
26,2
58,8
42
Wes
t M
arm
ara
5,24
2,06
417
,489
348,
198
748
401,
515
32,9
5530
,083
6,07
3,05
2B
alık
esir
1,79
8,90
05,
929
120,
856
260
164,
068
10,9
147,
169
2,10
8,09
6Ç
anak
kale
838,
071
3,48
655
,508
126
48,6
025,
516
4,07
495
5,38
3E
dirn
e74
8,11
93,
033
51,0
3711
147
,234
5,52
08,
969
864,
023
Kır
klar
eli
582,
770
2,08
938
,088
8343
,700
4,50
64,
230
675,
466
Tek
irda
1,
274,
204
2,95
282
,709
168
97,9
116,
499
5,64
11,
470,
084
Aeg
ean
15,7
17,6
2543
,690
1,09
5,70
62,
560
1,63
8,62
773
,151
67,5
9618
,638
,955
Afy
onka
rahi
sar
874,
813
4,17
355
,828
123
91,0
394,
540
3,30
21,
033,
818
Aydın
1,55
0,40
34,
024
115,
758
208
166,
630
7,68
95,
508
1,85
0,22
0D
eniz
li1,
391,
404
4,32
599
,734
197
141,
394
6,62
98,
425
1,65
2,10
8zm
ir7,
084,
422
16,1
9950
1,69
51,
316
759,
047
33,8
7631
,986
8,42
8,54
1K
ütah
ya88
7,90
83,
370
39,9
5291
72,2
124,
092
2,64
31,
010,
268
Man
isa
1,87
9,12
66,
155
133,
219
275
116,
537
7,62
17,
188
2,15
0,12
1M
ula
1,54
5,99
73,
865
121,
467
297
228,
814
6,47
86,
818
1,91
3,73
6U
ak50
3,55
21,
579
28,0
5353
62,9
542,
226
1,72
660
0,14
3
Eas
t M
arm
ara
9,16
2,95
123
,250
614,
842
1,40
292
1,22
448
,070
39,2
2310
,810
,962
Bile
cik
398,
301
1,77
417
,592
5819
,735
2,30
71,
295
441,
062
Bol
u42
5,41
31,
970
26,5
2558
42,0
052,
051
2,33
450
0,35
6B
ursa
3,
176,
296
6,16
525
6,19
755
134
2,58
517
,678
15,9
833,
815,
455
Düz
ce43
2,64
21,
595
26,8
0545
36,4
572,
111
1,47
750
1,13
2E
ski
ehir
1,26
1,06
72,
589
65,7
3913
299
,558
7,84
24,
605
1,44
1,53
2K
ocae
li (
zmit)
2,14
1,46
55,
091
125,
563
384
234,
802
9,60
67,
214
2,52
4,12
5S
akar
ya1,
034,
009
3,18
378
,894
136
110,
036
4,44
04,
342
1,23
5,04
0Y
alov
a29
3,75
888
317
,527
3836
,046
2,03
51,
973
352,
260
Wes
t A
nat
olia
11,9
44,6
4027
,468
760,
728
2,04
01,
540,
528
71,5
4145
,469
14,3
92,4
14A
nkar
a9,
326,
581
18,4
3258
0,41
91,
748
1,25
0,73
959
,013
36,1
4711
,273
,079
Kar
aman
296,
677
1,09
017
,668
3041
,938
1,38
41,
298
360,
085
Kon
ya2,
321,
382
7,94
616
2,64
126
224
7,85
111
,144
8,02
42,
759,
250
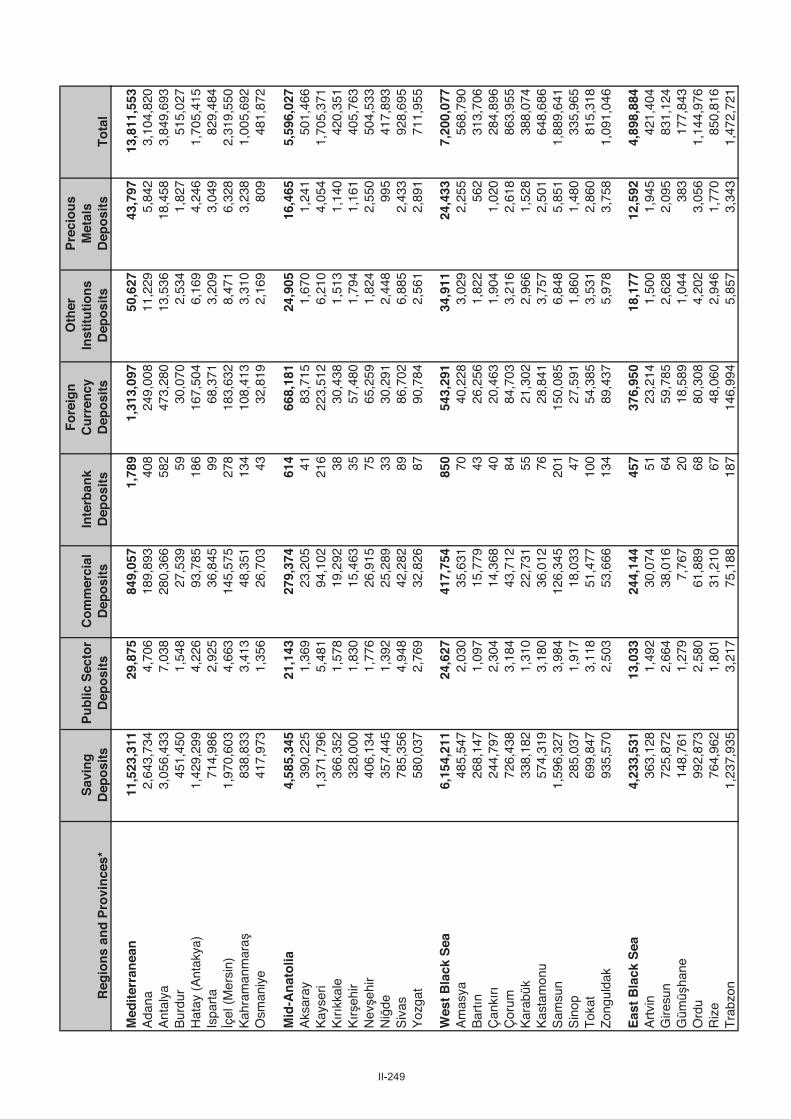
II-249
Reg
ion
s an
d P
rovi
nce
s*S
avin
gD
epo
sits
Pu
blic
Sec
tor
Dep
osi
tsC
om
mer
cial
Dep
osi
tsIn
terb
ank
Dep
osi
ts
Fo
reig
nC
urr
ency
Dep
osi
ts
Oth
erIn
stit
uti
on
sD
epo
sits
Pre
cio
us
Met
als
Dep
osi
tsT
ota
l
Med
iter
ran
ean
11,5
23,3
1129
,875
849,
057
1,78
91,
313,
097
50,6
2743
,797
13,8
11,5
53A
dana
2,64
3,73
44,
706
189,
893
408
249,
008
11,2
295,
842
3,10
4,82
0A
ntal
ya3,
056,
433
7,03
828
0,36
658
247
3,28
013
,536
18,4
583,
849,
693
Bur
dur
451,
450
1,54
827
,539
5930
,070
2,53
41,
827
515,
027
Hat
ay (
Ant
akya
)1,
429,
299
4,22
693
,785
186
167,
504
6,16
94,
246
1,70
5,41
5Is
part
a71
4,98
62,
925
36,8
4599
68,3
713,
209
3,04
982
9,48
4çe
l (M
ersi
n)1,
970,
603
4,66
314
5,57
527
818
3,63
28,
471
6,32
82,
319,
550
Kah
ram
anm
ara
838,
833
3,41
348
,351
134
108,
413
3,31
03,
238
1,00
5,69
2O
sman
iye
417,
973
1,35
626
,703
4332
,819
2,16
980
948
1,87
2
Mid
-An
ato
lia4,
585,
345
21,1
4327
9,37
461
466
8,18
124
,905
16,4
655,
596,
027
Aks
aray
390,
225
1,36
923
,205
4183
,715
1,67
01,
241
501,
466
Kay
seri
1,37
1,79
65,
481
94,1
0221
622
3,51
26,
210
4,05
41,
705,
371
Kırık
kale
366,
352
1,57
819
,292
3830
,438
1,51
31,
140
420,
351
Kır
ehir
328,
000
1,83
015
,463
3557
,480
1,79
41,
161
405,
763
Nev
ehir
406,
134
1,77
626
,915
7565
,259
1,82
42,
550
504,
533
Ni
de35
7,44
51,
392
25,2
8933
30,2
912,
448
995
417,
893
Siv
as78
5,35
64,
948
42,2
8289
86,7
026,
885
2,43
392
8,69
5Y
ozga
t58
0,03
72,
769
32,8
2687
90,7
842,
561
2,89
171
1,95
5
Wes
t B
lack
Sea
6,15
4,21
124
,627
417,
754
850
543,
291
34,9
1124
,433
7,20
0,07
7A
mas
ya48
5,54
72,
030
35,6
3170
40,2
283,
029
2,25
556
8,79
0B
artın
268,
147
1,09
715
,779
4326
,256
1,82
256
231
3,70
6Ç
ankı
rı24
4,79
72,
304
14,3
6840
20,4
631,
904
1,02
028
4,89
6Ç
orum
726,
438
3,18
443
,712
8484
,703
3,21
62,
618
863,
955
Kar
abük
338,
182
1,31
022
,731
5521
,302
2,96
61,
528
388,
074
Kas
tam
onu
574,
319
3,18
036
,012
7628
,841
3,75
72,
501
648,
686
Sam
sun
1,59
6,32
73,
984
126,
345
201
150,
085
6,84
85,
851
1,88
9,64
1S
inop
285,
037
1,91
718
,033
4727
,591
1,86
01,
480
335,
965
Tok
at69
9,84
73,
118
51,4
7710
054
,385
3,53
12,
860
815,
318
Zon
guld
ak93
5,57
02,
503
53,6
6613
489
,437
5,97
83,
758
1,09
1,04
6
Eas
t B
lack
Sea
4,23
3,53
113
,033
244,
144
457
376,
950
18,1
7712
,592
4,89
8,88
4A
rtvi
n36
3,12
81,
492
30,0
7451
23,2
141,
500
1,94
542
1,40
4G
iresu
n72
5,87
22,
664
38,0
1664
59,7
852,
628
2,09
583
1,12
4G
ümü
hane
148,
761
1,27
97,
767
2018
,589
1,04
438
317
7,84
3O
rdu
992,
873
2,58
061
,889
6880
,308
4,20
23,
056
1,14
4,97
6R
ize
764,
962
1,80
131
,210
6748
,060
2,94
61,
770
850,
816
Tra
bzon
1,23
7,93
53,
217
75,1
8818
714
6,99
45,
857
3,34
31,
472,
721

II-250
Reg
ion
s an
d P
rovi
nce
s*S
avin
gD
epo
sits
Pu
blic
Sec
tor
Dep
osi
tsC
om
mer
cial
Dep
osi
tsIn
terb
ank
Dep
osi
ts
Fo
reig
nC
urr
ency
Dep
osi
ts
Oth
erIn
stit
uti
on
sD
epo
sits
Pre
cio
us
Met
als
Dep
osi
tsT
ota
l
No
rth
Eas
t A
nat
olia
2,28
0,86
513
,488
98,8
7925
617
0,19
712
,013
7,35
52,
583,
053
Arı
331,
421
1,62
312
,207
4821
,731
1,41
31,
116
369,
559
Ard
ahan
151,
379
935
5,48
58
6,44
065
242
816
5,32
7B
aybu
rt91
,964
1,10
05,
485
1313
,385
788
888
113,
623
Erz
inca
n33
1,01
12,
950
15,5
5333
32,1
882,
289
1,07
138
5,09
5E
rzur
um87
6,37
14,
160
38,7
8193
57,6
304,
817
2,48
598
4,33
7I
dır
155,
876
945
7,26
314
17,6
9076
036
618
2,91
4K
ars
342,
843
1,77
514
,105
4721
,133
1,29
41,
001
382,
198
Mid
dle
Eas
t A
nat
olia
3,00
3,81
815
,073
131,
996
291
231,
759
13,2
0810
,054
3,40
6,19
9B
ingö
l19
4,05
61,
181
7,42
616
20,0
1881
421
622
3,72
7B
itlis
224,
266
1,35
49,
216
2810
,928
1,18
885
124
7,83
1E
lazı
612,
204
4,13
029
,567
5366
,699
2,71
31,
603
716,
969
Hak
kari
166,
023
1,03
04,
942
206,
187
586
842
179,
630
Mal
atya
768,
818
2,67
541
,399
6963
,815
4,39
73,
528
884,
701
Mu
237,
724
1,24
98,
353
1715
,901
649
798
264,
691
Tun
celi
158,
433
1,16
13,
711
1615
,775
840
590
180,
526
Van
642,
294
2,29
327
,382
7232
,436
2,02
11,
626
708,
124
So
uth
-Eas
t A
nat
olia
4,88
4,99
918
,028
315,
993
623
416,
149
18,2
0718
,714
5,67
2,71
3A
dıya
man
464,
404
1,87
125
,379
5034
,532
1,76
22,
498
530,
496
Bat
man
301,
426
1,52
815
,708
2620
,925
712
733
341,
058
Diy
arba
kır
983,
692
3,26
654
,494
8970
,803
3,90
82,
918
1,11
9,17
0G
azia
ntep
1,32
7,33
33,
445
120,
650
256
151,
941
5,12
97,
151
1,61
5,90
5K
ilis
110,
008
760
6,09
88
8,95
467
458
112
7,08
3M
ardi
n40
5,97
51,
953
25,3
8659
37,6
191,
734
1,55
247
4,27
8S
iirt
211,
428
1,16
37,
236
2312
,761
782
555
233,
948
anlıu
rfa
841,
013
2,80
951
,946
8548
,254
2,70
81,
885
948,
700
ırna
k23
9,72
01,
233
9,09
627
30,3
6079
884
128
2,07
5
Tu
rkis
h R
epu
blic
of
No
rth
ern
Cyp
rus
199,
509
140
13,2
0625
011
8,99
079
617
733
3,06
8F
ore
ign
Co
un
trie
s1,
244
22,
937
1,10
124
,077
296
029
,657
To
tal*
*99
,776
,315
269,
770
6,71
6,96
720
,635
12,0
28,8
3649
5,74
939
7,18
411
9,70
5,45
6*
The
cla
ssifi
catio
n of
"S
tatis
tical
Reg
iona
l Uni
ts",
whi
ch is
def
ined
with
the
Dec
ree
No.
2002
/472
0 of
Cou
ncil
of M
inis
ters
and
pub
lishe
d in
the
Offi
cial
Gaz
ette
dat
ed S
epte
mbe
r 22
, 200
2 an
d N
o.24
884
is
used
in th
is ta
ble.
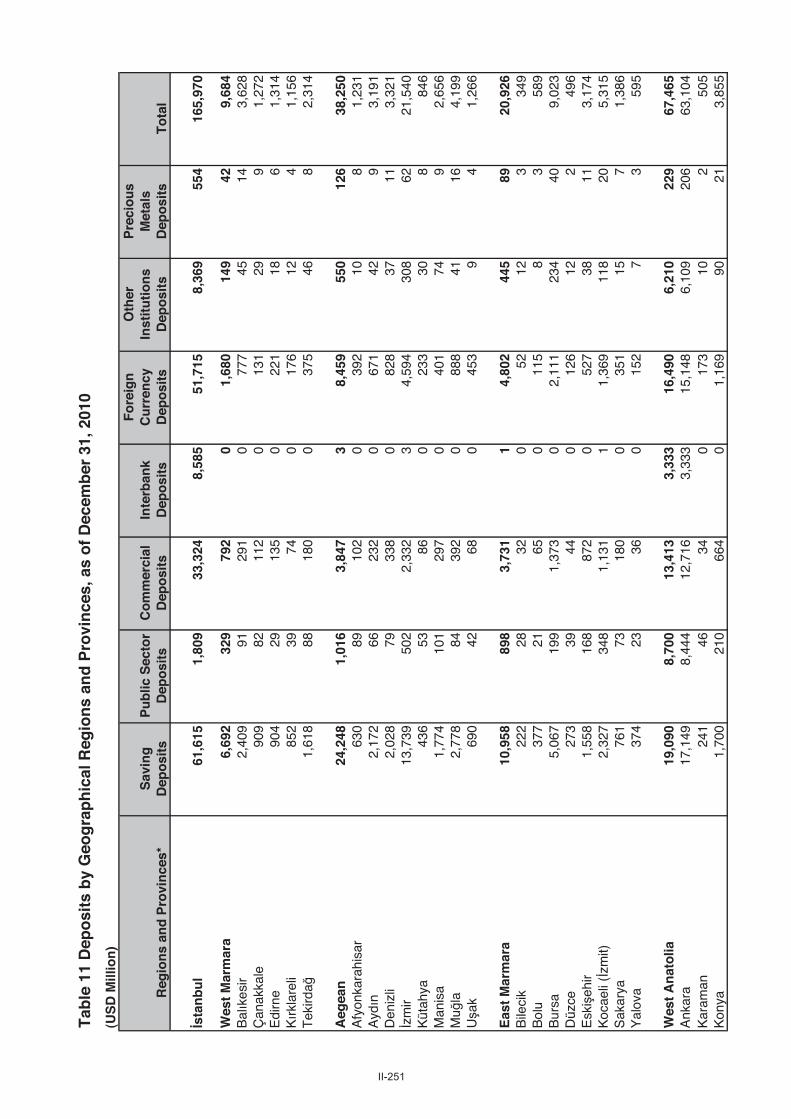
II-251
Tab
le 1
1 D
epo
sits
by
Geo
gra
ph
ical
Reg
ion
s an
d P
rovi
nce
s, a
s o
f D
ecem
ber
31,
201
0
(US
D M
illio
n)
Reg
ion
s an
d P
rovi
nce
s*S
avin
gD
epo
sits
Pu
blic
Sec
tor
Dep
osi
tsC
om
mer
cial
Dep
osi
tsIn
terb
ank
Dep
osi
ts
Fo
reig
nC
urr
ency
Dep
osi
ts
Oth
erIn
stit
uti
on
sD
epo
sits
Pre
cio
us
Met
als
Dep
osi
tsT
ota
l
stan
bu
l61
,615
1,80
933
,324
8,58
551
,715
8,36
955
416
5,97
0
Wes
t M
arm
ara
6,69
232
979
20
1,68
014
942
9,68
4B
alık
esir
2,40
991
291
077
745
143,
628
Çan
akka
le90
982
112
013
129
91,
272
Edi
rne
904
2913
50
221
186
1,31
4Kır
klar
eli
852
3974
017
612
41,
156
Tek
irda
1,
618
8818
00
375
468
2,31
4
Aeg
ean
24,2
481,
016
3,84
73
8,45
955
012
638
,250
Afy
onka
rahi
sar
630
8910
20
392
108
1,23
1A
ydın
2,17
266
232
067
142
93,
191
Den
izli
2,02
879
338
082
837
113,
321
zmir
13,7
3950
22,
332
34,
594
308
6221
,540
Küt
ahya
436
5386
023
330
884
6M
anis
a1,
774
101
297
040
174
92,
656
Mu
la2,
778
8439
20
888
4116
4,19
9U
ak69
042
680
453
94
1,26
6
Eas
t M
arm
ara
10,9
5889
83,
731
14,
802
445
8920
,926
Bile
cik
222
2832
052
123
349
Bol
u37
721
650
115
83
589
Bur
sa
5,06
719
91,
373
02,
111
234
409,
023
Düz
ce27
339
440
126
122
496
Esk
ieh
ir1,
558
168
872
052
738
113,
174
Koc
aeli
(zm
it)2,
327
348
1,13
11
1,36
911
820
5,31
5S
akar
ya76
173
180
035
115
71,
386
Yal
ova
374
2336
015
27
359
5
Wes
t A
nat
olia
19,0
908,
700
13,4
133,
333
16,4
906,
210
229
67,4
65A
nkar
a17
,149
8,44
412
,716
3,33
315
,148
6,10
920
663
,104
Kar
aman
241
4634
017
310
250
5K
onya
1,70
021
066
40
1,16
990
213,
855

II-252
Reg
ion
s an
d P
rovi
nce
s*S
avin
gD
epo
sits
Pu
blic
Sec
tor
Dep
osi
tsC
om
mer
cial
Dep
osi
tsIn
terb
ank
Dep
osi
ts
Fo
reig
nC
urr
ency
Dep
osi
ts
Oth
erIn
stit
uti
on
sD
epo
sits
Pre
cio
us
Met
als
Dep
osi
tsT
ota
l
Med
iter
ran
ean
15,9
1292
22,
377
06,
263
406
6825
,949
Ada
na4,
207
218
686
01,
014
9215
6,23
3A
ntal
ya5,
116
201
684
02,
691
135
238,
850
Bur
dur
399
2652
013
714
363
1H
atay
(A
ntak
ya)
1,76
611
631
70
867
556
3,12
6Is
part
a73
047
960
291
106
1,17
9çe
l (M
ersi
n)2,
935
189
339
081
363
114,
348
Kah
ram
anm
ara
479
9616
80
394
294
1,17
0O
sman
iye
280
2836
057
81
411
Mid
-An
ato
lia3,
747
445
901
03,
269
111
268,
499
Aks
aray
301
3445
046
97
285
7K
ayse
ri1,
458
148
495
01,
338
488
3,49
4Kırık
kale
235
3531
063
83
375
Kır
ehir
251
2641
026
55
258
9N
eveh
ir28
339
830
349
73
764
Ni
de29
034
480
104
102
489
Siv
as63
394
104
038
520
41,
239
Yoz
gat
297
3655
029
57
269
1
Wes
t B
lack
Sea
5,70
155
096
70
2,02
452
644
9,81
2A
mas
ya33
020
840
116
83
561
Bar
tın37
226
330
126
41
563
Çan
kırı
166
2622
046
62
268
Çor
um52
257
930
273
156
966
Kar
abük
330
4448
071
133
510
Kas
tam
onu
460
4569
082
185
680
Sam
sun
1,52
612
438
20
571
4411
2,65
8S
inop
283
3633
010
55
246
5T
okat
431
4674
012
614
569
6Z
ongu
ldak
1,28
212
512
80
508
398
52,
446
Eas
t B
lack
Sea
2,89
835
644
70
1,18
376
194,
979
Art
vin
207
3634
052
42
335
Gire
sun
537
6055
024
219
391
5G
ümü
hane
7718
200
363
115
4O
rdu
648
5985
017
317
498
6R
ize
330
5759
011
711
357
6T
rabz
on1,
099
126
194
056
422
72,
011

II-253
Reg
ion
s an
d P
rovi
nce
s*S
avin
gD
epo
sits
Pu
blic
Sec
tor
Dep
osi
tsC
om
mer
cial
Dep
osi
tsIn
terb
ank
Dep
osi
ts
Fo
reig
nC
urr
ency
Dep
osi
ts
Oth
erIn
stit
uti
on
sD
epo
sits
Pre
cio
us
Met
als
Dep
osi
tsT
ota
l
No
rth
Eas
t A
nat
olia
1,14
937
131
80
480
7510
2,40
2A
rı16
170
460
9511
238
4A
rdah
an82
289
010
30
133
Ba y
burt
3615
100
401
010
3E
rzin
can
235
4138
013
116
246
2E
rzur
um34
616
114
70
112
324
802
Idı
r10
126
130
646
121
1K
ars
188
2954
028
61
306
Mid
dle
Eas
t A
nat
olia
1,81
547
549
70
742
6519
3,61
3B
ingö
l77
3524
042
41
182
Bitl
is82
3134
013
112
173
Ela
zı42
774
101
027
111
388
7H
akka
ri70
8120
011
21
184
Mal
atya
651
9411
70
265
178
1,15
2M
u75
4423
026
31
172
Tun
celi
169
4013
063
61
292
Van
265
7616
50
5112
257
1
So
uth
-Eas
t A
nat
olia
2,81
71,
032
984
21,
305
166
216,
327
Adı
yam
an22
380
530
747
243
9B
atm
an13
210
345
047
41
332
Diy
arba
kır
600
216
225
016
944
51,
259
Gaz
iant
ep1,
121
183
418
076
864
62,
559
Kili
s44
109
016
80
87M
ardi
n17
993
630
919
243
7S
iirt
6653
211
168
116
5an
lıurf
a38
519
712
60
9119
382
1ır
nak
6798
230
335
122
7
Tu
rkis
h R
epu
blic
of
No
rth
ern
Cyp
rus
529
6774
1552
552
11,
262
Fo
reig
n C
ou
ntr
ies
134
012
,609
6,59
212
,343
2,82
30
34,5
01
To
tal*
*15
7,30
616
,969
74,2
8318
,532
111,
280
20,0
221,
247
399,
640
* T
he c
lass
ifica
tion
of "
Sta
tistic
al R
egio
nal U
nits
", w
hich
is d
efin
ed w
ith th
e D
ecre
e N
o.20
02/4
720
of C
ounc
il of
Min
iste
rs a
nd p
ublis
hed
in th
e O
ffici
al G
azet
te d
ated
Sep
tem
ber
22, 2
002
and
No.
2488
4 is
us
ed in
this
tabl
e.

II-254
Tab
le 1
2 L
oan
s b
y G
eog
rap
hic
al R
egio
ns
and
Pro
vin
ces,
as
of
Dec
emb
er 3
1, 2
010
(US
D M
illio
n)
Ag
ricu
ltu
reR
eal E
stat
eV
oca
tio
nal
Mar
itim
eT
ou
rism
Oth
er
stan
bu
l15
80
628
128
175
125,
828
126,
817
Wes
t M
arm
ara
946
010
70
113
47,
252
8,44
0B
alık
esir
324
045
00
452,
460
2,87
4Ç
anak
kale
172
020
01
321,
021
1,24
6E
dirn
e18
30
90
019
946
1,15
8Kır
klar
eli
980
90
017
767
891
Tek
irda
16
80
230
021
2,05
82,
271
Aeg
ean
2,59
40
393
030
471
28,9
4732
,435
Afy
on18
70
460
034
1,04
61,
312
Aydın
365
033
05
462,
334
2,78
3D
eniz
li23
80
480
043
2,81
13,
140
zmir
998
014
20
1319
915
,978
17,3
30K
ütah
ya77
013
00
1583
894
3M
anis
a43
00
380
395
2,55
03,
116
Mu
la19
40
570
929
2,76
33,
051
Uak
107
015
00
1162
776
0
Eas
t M
arm
ara
1,01
50
307
013
218
20,1
5421
,707
Bile
cik
510
80
08
392
459
Bol
u75
027
012
1055
467
8B
ursa
45
50
119
01
128
8,28
78,
989
Düz
ce50
020
00
1357
966
2E
ski
ehir
153
040
00
172,
126
2,33
6K
ocae
li (
zmit)
770
510
022
6,03
26,
183
Sak
arya
123
024
00
181,
706
1,87
1Y
alov
a32
017
00
347
753
0
Wes
t A
nat
olia
1,00
40
450
00
290
35,1
4536
,889
Ank
ara
422
039
60
023
231
,432
32,4
82K
aram
an65
06
00
430
137
5K
onya
518
048
00
553,
412
4,03
2
Reg
ion
s an
d P
rovi
nce
s*S
pec
ializ
ed L
oan
sN
on
-sp
ecia
lized
Lo
ans
To
tal*
**
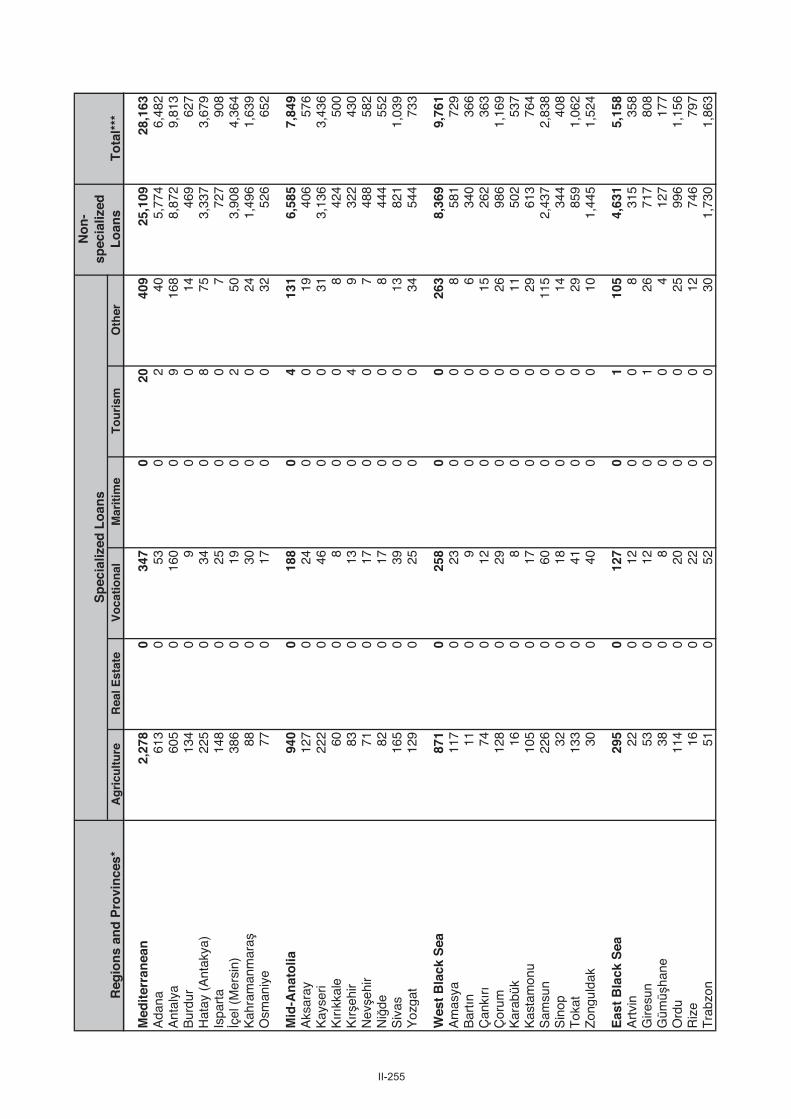
II-255
Ag
ricu
ltu
reR
eal E
stat
eV
oca
tio
nal
Mar
itim
eT
ou
rism
Oth
erR
egio
ns
and
Pro
vin
ces*
Sp
ecia
lized
Lo
ans
No
n-
spec
ializ
edL
oan
sT
ota
l***
Med
iter
ran
ean
2,27
80
347
020
409
25,1
0928
,163
Ada
na61
30
530
240
5,77
46,
482
Ant
alya
605
016
00
916
88,
872
9,81
3B
urdu
r13
40
90
014
469
627
Hat
ay (
Ant
akya
)22
50
340
875
3,33
73,
679
Ispa
rta
148
025
00
772
790
8çe
l (M
ersi
n)38
60
190
250
3,90
84,
364
Kah
ram
anm
ara
880
300
024
1,49
61,
639
Osm
aniy
e77
017
00
3252
665
2
Mid
-An
ato
lia94
00
188
04
131
6,58
57,
849
Aks
aray
127
024
00
1940
657
6K
ayse
ri22
20
460
031
3,13
63,
436
Kırık
kale
600
80
08
424
500
Kır
ehir
830
130
49
322
430
Nev
ehir
710
170
07
488
582
Ni
de82
017
00
844
455
2S
ivas
165
039
00
1382
11,
039
Yoz
gat
129
025
00
3454
473
3
Wes
t B
lack
Sea
871
025
80
026
38,
369
9,76
1A
mas
ya11
70
230
08
581
729
Bar
tın11
09
00
634
036
6Ç
ankı
rı74
012
00
1526
236
3Ç
orum
128
029
00
2698
61,
169
Kar
abük
160
80
011
502
537
Kas
tam
onu
105
017
00
2961
376
4S
amsu
n22
60
600
011
52,
437
2,83
8S
inop
320
180
014
344
408
Tok
at13
30
410
029
859
1,06
2Z
ongu
ldak
300
400
010
1,44
51,
524
Eas
t B
lack
Sea
295
012
70
110
54,
631
5,15
8A
rtvi
n22
012
00
831
535
8G
iresu
n53
012
01
2671
780
8G
ümü
hane
380
80
04
127
177
Ord
u11
40
200
025
996
1,15
6R
ize
160
220
012
746
797
Tra
bzon
510
520
030
1,73
01,
863

II-256
Ag
ricu
ltu
reR
eal E
stat
eV
oca
tio
nal
Mar
itim
eT
ou
rism
Oth
erR
egio
ns
and
Pro
vin
ces*
Sp
ecia
lized
Lo
ans
No
n-
spec
ializ
edL
oan
sT
ota
l***
No
rth
Eas
t A
nat
olia
324
065
00
301,
986
2,40
6A
rı21
016
00
421
725
8A
rdah
an42
01
00
188
132
Bay
burt
160
60
02
8210
5E
rzin
can
490
160
04
268
337
Erz
urum
940
150
014
906
1,02
9I
dır
270
40
01
168
199
Kar
s75
07
00
425
834
5
Mid
dle
Eas
t A
nat
olia
369
012
40
060
2,84
73,
401
Bin
göl
110
120
00
183
208
Bitl
is53
07
00
1118
125
2E
lazı
720
300
05
655
761
Hak
kari
100
60
03
9110
9M
alat
ya15
20
250
012
934
1,12
3M
u26
011
00
711
916
4T
unce
li11
05
00
111
012
8V
an35
029
00
2057
465
8
So
uth
-Eas
t A
nat
olia
732
020
20
1227
18,
763
9,98
0A
dıya
man
680
320
010
567
677
Bat
man
240
110
06
327
368
Diy
arba
kır
130
052
00
221,
378
1,58
2G
azia
ntep
189
057
012
109
4,60
84,
974
Kili
s39
04
00
186
131
Mar
din
940
80
014
469
586
Siir
t11
05
00
415
117
1an
lıurf
a16
80
170
010
099
51,
281
ırna
k9
015
00
618
121
1
ller
Ban
kası
A.
.**
00
00
04,
329
94,
338
Tu
rkis
h R
epu
blic
of
No
rth
ern
Cyp
rus
20
00
052
575
630
Fo
reig
n C
ou
ntr
ies
00
00
00
31,7
5731
,757
To
tal*
***
11,5
290
3,19
61
108
6,93
930
7,95
932
9,73
1
** B
ecau
se th
e di
strib
utio
n of
the
loan
whi
ch is
ext
ende
d by
lle
r B
anka
sı A
.. t
o th
e pr
ovin
ces
does
not
exi
st,
it is
sho
wn
as a
sep
arat
e lin
e.**
* T
otal
Loa
ns =
Loa
ns e
xcep
t "Lo
ans
unde
r fo
llow
-up"
and
"S
peci
fic p
rovi
sion
s"**
**T
wo
of th
e ba
nk's
tota
l loa
ns in
clud
e "L
oans
" sh
own
unde
r "F
inan
cial
ass
ets
whe
re fa
ir va
lue
chan
ge is
ref
lect
ed to
inco
me
stat
emen
t".
* T
he c
lass
ifica
tion
of "
Sta
tistic
al R
egio
nal U
nits
", w
hich
is d
efin
ed w
ith th
e D
ecre
e N
o.20
02/4
720
of C
ounc
il of
Min
iste
rs a
nd p
ublis
hed
in th
e O
ffici
al G
azet
te d
ated
Sep
tem
ber
22, 2
002
and
No.
2488
4 is
us
ed in
this
tabl
e.
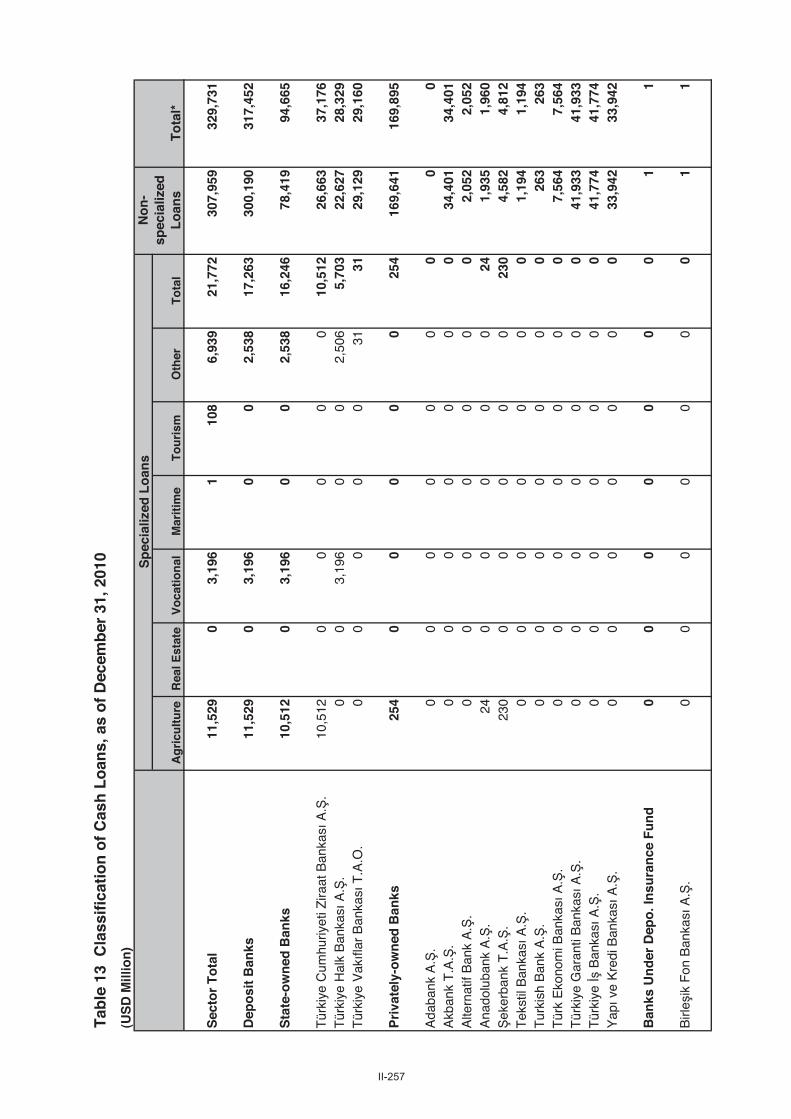
II-257
Tab
le 1
3 C
lass
ific
atio
n o
f C
ash
Lo
ans,
as
of
Dec
emb
er 3
1, 2
010
(US
D M
illio
n)
Sec
tor
To
tal
11,5
290
3,19
61
108
6,93
921
,772
307,
959
329,
731
Dep
osi
t B
anks
11,5
290
3,19
60
02,
538
17,2
6330
0,19
031
7,45
2
Sta
te-o
wn
ed B
anks
10,5
120
3,19
60
02,
538
16,2
4678
,419
94,6
65
Tür
kiye
Cum
huriy
eti Z
iraat
Ban
kası
A.
.10
,512
00
00
010
,512
26,6
6337
,176
Tür
kiye
Hal
k B
anka
sı A
..
00
3,19
60
02,
506
5,70
322
,627
28,3
29T
ürki
ye V
akıfl
ar B
anka
sı T
.A.O
.
00
00
031
3129
,129
29,1
60
Pri
vate
ly-o
wn
ed B
anks
254
00
00
025
416
9,64
116
9,89
5
Ada
bank
A.
.0
00
00
00
00
Akb
ank
T.A
..
0
00
00
00
34,4
0134
,401
Alte
rnat
if B
ank
A.
.0
00
00
00
2,05
22,
052
Ana
dolu
bank
A.
.24
00
00
024
1,93
51,
960
eker
bank
T.A
..
230
00
00
023
04,
582
4,81
2T
ekst
il B
anka
sı A
..
00
00
00
01,
194
1,19
4T
urki
sh B
ank
A.
.0
00
00
00
263
263
Tür
k E
kono
mi B
anka
sı A
..
00
00
00
07,
564
7,56
4T
ürki
ye G
aran
ti B
anka
sı A
..
00
00
00
041
,933
41,9
33T
ürki
ye B
anka
sı A
..
00
00
00
041
,774
41,7
74Y
apı v
e K
redi
Ban
kası
A.
.0
00
00
00
33,9
4233
,942
Ban
ks U
nd
er D
epo
. In
sura
nce
Fu
nd
00
00
00
01
1
Birl
eik
Fon
Ban
kası
A.
.0
00
00
00
11
No
n-
spec
ializ
edL
oan
sT
ota
l*
Sp
ecia
lized
Lo
ans
Ag
ricu
ltu
reR
eal E
stat
eV
oca
tio
nal
Mar
itim
eT
ou
rism
Oth
erT
ota
l
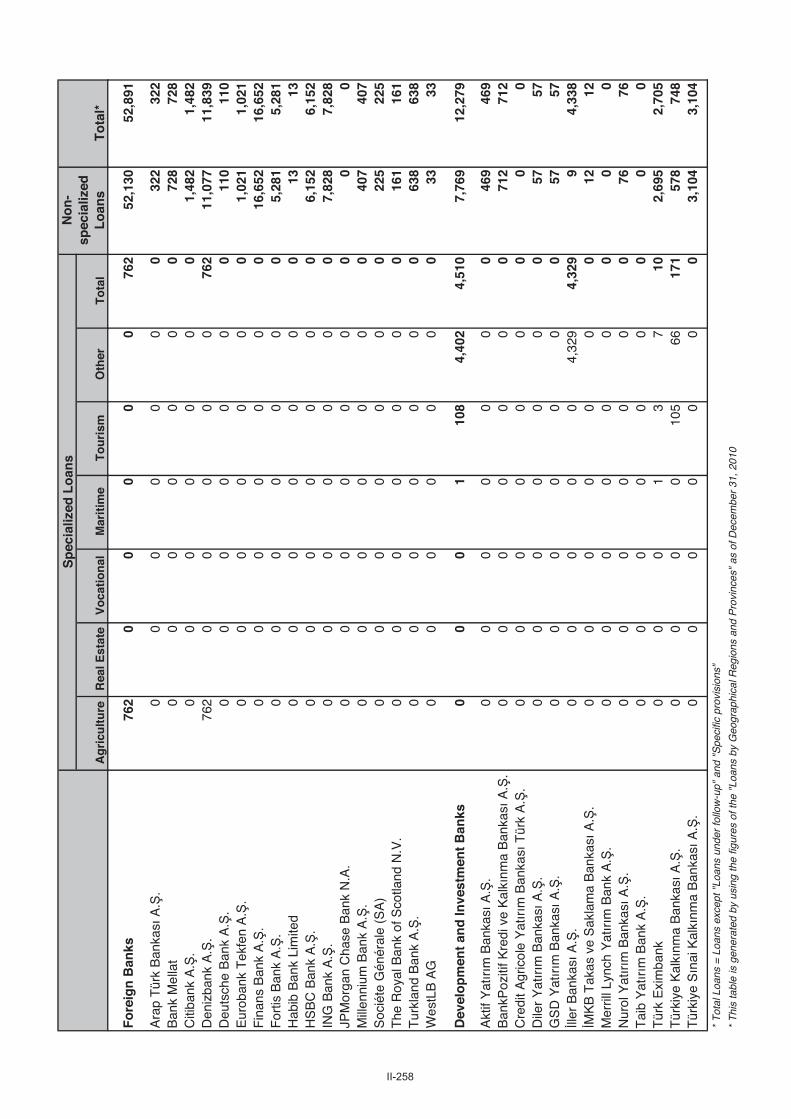
II-258
No
n-
spec
ializ
edL
oan
sT
ota
l*
Sp
ecia
lized
Lo
ans
Ag
ricu
ltu
reR
eal E
stat
eV
oca
tio
nal
Mar
itim
eT
ou
rism
Oth
erT
ota
l
Fo
reig
n B
anks
762
00
00
076
252
,130
52,8
91
Ara
p T
ürk
Ban
kası
A.
.0
00
00
00
322
322
Ban
k M
ella
t
0
00
00
00
728
728
Citi
bank
A.
.0
00
00
00
1,48
21,
482
Den
izba
nk A
..
762
00
00
076
211
,077
11,8
39D
euts
che
Ban
k A
..
00
00
00
011
011
0E
urob
ank
Tek
fen
A.
. 0
00
00
00
1,02
11,
021
Fin
ans
Ban
k A
..
0
00
00
00
16,6
5216
,652
For
tis B
ank
A.
.0
00
00
00
5,28
15,
281
Hab
ib B
ank
Lim
ited
0
00
00
00
1313
HS
BC
Ban
k A
..
00
00
00
06,
152
6,15
2IN
G B
ank
A.
.0
00
00
00
7,82
87,
828
JPM
orga
n C
hase
Ban
k N
.A.
00
00
00
00
0M
illen
nium
Ban
k A
..
00
00
00
040
740
7S
ocié
te G
énér
ale
(SA
)0
00
00
00
225
225
The
Roy
al B
ank
of S
cotla
nd N
.V.
00
00
00
016
116
1T
urkl
and
Ban
k A
..
00
00
00
063
863
8W
estL
B A
G0
00
00
00
3333
Dev
elo
pm
ent
and
Inve
stm
ent
Ban
ks0
00
110
84,
402
4,51
07,
769
12,2
79
Akt
if Y
atırım
Ban
kası
A.
.0
00
00
00
469
469
Ban
kPoz
itif K
redi
ve
Kal
kınm
a B
anka
sı A
..
00
00
00
071
271
2C
redi
t Agr
icol
e Y
atırım
Ban
kası
Tür
k A
..
00
00
00
00
0D
iler
Yatırım
Ban
kası
A.
.0
00
00
00
5757
GS
D Y
atırım
Ban
kası
A.
.0
00
00
00
5757
ller
Ban
kası
A.
.0
00
00
4,32
94,
329
94,
338
MK
B T
akas
ve
Sak
lam
a B
anka
sı A
..
00
00
00
012
12M
erril
l Lyn
ch Y
atırım
Ban
k A
..
00
00
00
00
0N
urol
Yatırım
Ban
kası
A.
.0
00
00
00
7676
Tai
b Y
atırım
Ban
k A
..
00
00
00
00
0T
ürk
Exi
mba
nk0
00
13
710
2,69
52,
705
Tür
kiye
Kal
kınm
a B
anka
sı A
..
00
00
105
6617
157
874
8T
ürki
ye Sın
ai K
alkı
nma
Ban
kası
A.
.0
00
00
00
3,10
43,
104
* T
otal
Loa
ns =
Loa
ns e
xcep
t "Lo
ans
unde
r fo
llow
-up"
and
"S
peci
fic p
rovi
sion
s"
* T
his
tabl
e is
gen
erat
ed b
y us
ing
the
figur
es o
f the
"Lo
ans
by G
eogr
aphi
cal R
egio
ns a
nd P
rovi
nces
" as
of D
ecem
ber
31, 2
010

II-259
Tab
le 1
4 S
ecto
r C
on
cen
trat
ion
s fo
r C
ash
Lo
ans,
as
of
Dec
emb
er 3
1, 2
010
(US
D M
illio
n)
TC
(%)
FC
(%)
To
tal
(%)
Ag
ricu
ltu
ral
14,3
476.
292
91.
015
,275
4.7
Far
min
g an
d R
aisi
ng li
vest
ock
13,8
256.
077
30.
814
,597
4.5
For
estr
y29
40.
180
0.1
374
0.1
Fis
hing
228
0.1
760.
130
40.
1
Man
ufa
ctu
rin
g33
,650
14.5
42,3
2745
.075
,977
23.3
Min
ing
1,45
30.
61,
962
2.1
3,41
51.
0
Pro
duct
ion
30,8
6713
.331
,611
33.6
62,4
7819
.2
Ele
ctric
, gas
and
wat
er1,
330
0.6
8,75
59.
310
,085
3.1
Co
nst
ruct
ion
9,21
24.
07,
576
8.1
16,7
875.
2
Ser
vice
s52
,564
22.7
33,5
1335
.686
,077
26.4
Who
lesa
le a
nd r
etai
l tra
de25
,615
11.0
7,88
48.
433
,499
10.3
Hot
el, f
ood
and
beve
rage
ser
vice
s2,
479
1.1
4,64
54.
97,
124
2.2
Tra
nspo
rtat
ion
and
tele
com
mun
icat
ion
6,30
62.
78,
913
9.5
15,2
204.
7
Fin
anci
al In
stitu
tions
10,1
444.
46,
442
6.8
16,5
865.
1
Rea
l est
ate
and
rent
ing
serv
ices
2,81
01.
22,
297
2.4
5,10
71.
6
Sel
f-em
ploy
emen
t ser
vice
s1,
191
0.5
269
0.3
1,46
00.
4
Edu
catio
n se
rvic
es59
10.
325
10.
384
20.
3
Hea
lth a
nd s
ocia
l ser
vice
s3,
428
1.5
2,81
23.
06,
240
1.9
Oth
er12
2,04
652
.69,
721
10.3
131,
767
40.4
To
tal
231,
818
100.
094
,065
100.
032
5,88
410
0.0
Cu
rren
t P
erio
d

II-260
Tab
le 1
5 S
ecto
ral R
isk
Co
nce
ntr
atio
ns
of
No
n-c
ash
Lo
ans,
as
of
Dec
emb
er 3
1, 2
010
(US
D M
illio
n)
TC
(%)
FC
(%)
To
tal
(%)
Ag
ricu
ltu
ral
413
1.0
510
1.0
923
1.0
Far
min
g an
d R
aisi
ng li
vest
ock
318
0.8
474
0.9
793
0.9
For
estr
y83
0.2
260.
010
90.
1
Fis
hing
110.
010
0.0
210.
0
Man
ufa
ctu
rin
g12
,871
32.6
24,5
3847
.037
,409
40.8
Min
ing
794
2.0
1,24
32.
42,
037
2.2
Pro
duct
ion
9,87
825
.019
,266
36.9
29,1
4431
.8
Ele
ctric
, gas
and
wat
er2,
199
5.6
4,02
97.
76,
228
6.8
Co
nst
ruct
ion
8,02
820
.48,
525
16.3
16,5
5318
.1
Ser
vice
s16
,424
41.6
14,3
6927
.530
,793
33.6
Who
lesa
le a
nd r
etai
l tra
de7,
780
19.7
4,74
69.
112
,527
13.7
Hot
el, f
ood
and
beve
rage
ser
vice
s39
21.
037
80.
777
10.
8
Tra
nspo
rtat
ion
and
tele
com
mun
icat
ion
1,43
23.
62,
006
3.8
3,43
83.
8
Fin
anci
al In
stitu
tions
5,27
213
.46,
049
11.6
11,3
2112
.4
Rea
l est
ate
and
rent
ing
serv
ices
496
1.3
414
0.8
909
1.0
Sel
f-em
ploy
emen
t ser
vice
s35
60.
923
30.
458
90.
6
Edu
catio
n se
rvic
es48
0.1
210.
069
0.1
Hea
lth a
nd s
ocia
l ser
vice
s64
81.
652
11.
01,
169
1.3
Oth
er1,
705
4.3
4,27
28.
25,
978
6.5
To
tal
39,4
4210
0.0
52,2
1410
0.0
91,6
5510
0.0
Cu
rren
t P
erio
d

II-261
Tab
le 1
6 S
har
e in
Gro
up
an
d S
har
e in
Sec
tor,
as
of
Dec
emb
er 3
1, 2
010
(%)
Ban
ksT
ota
lA
sset
sT
ota
lL
oan
sT
ota
lD
epo
sits
To
tal
Ass
ets
To
tal
Lo
ans
To
tal
Dep
osi
tsB
anks
To
tal
Ass
ets
To
tal
Lo
ans
To
tal
Dep
osi
tsT
ota
lA
sset
sT
ota
lL
oan
sT
ota
lD
epo
sits
Dep
osi
t B
anks
100.
010
0.0
100.
096
.896
.310
0.0
Fo
reig
n B
anks
14.6
16.6
12.7
14.1
16.0
12.7
Sta
te-o
wn
ed B
anks
32.0
29.9
37.1
31.0
28.8
37.1
Ara
p T
ürk
Ban
kası
A.
.0.
10.
10.
10.
10.
10.
1B
ank
Mel
lat
0.2
0.2
0.1
0.2
0.2
0.1
Tür
kiye
Cum
huriy
eti Z
iraat
Ban
kası
16.2
11.7
20.5
15.7
11.3
20.5
Citi
bank
A.
.0.
70.
50.
70.
70.
50.
7T
ürki
ye H
alk
Ban
kası
A.
.7.
89.
08.
97.
68.
78.
9D
eniz
bank
A.
.3.
03.
82.
62.
93.
62.
6T
ürki
ye V
akıfl
ar B
anka
sı T
.A.O
.7.
99.
27.
87.
78.
87.
8D
euts
che
Ban
k A
..
0.3
0.0
0.3
0.3
0.0
0.3
Eur
oban
k T
ekfe
n A
..
0.4
0.3
0.3
0.4
0.3
0.3
Pri
vate
ly-o
wn
ed B
anks
53.3
53.5
50.1
51.6
51.5
50.1
Fin
ans
Ban
k A
..
4.1
5.1
4.0
4.0
4.9
4.0
For
tis B
ank
A.
.1.
31.
71.
01.
31.
61.
0A
daba
nk A
..
0.0
0.0
0.0
0.0
0.0
0.0
Hab
ib B
ank
Lim
ited
0.0
0.0
0.0
0.0
0.0
0.0
Akb
ank
T.A
..
12.2
10.8
10.9
11.8
10.4
10.9
HS
BC
Ban
k A
..
1.9
2.0
1.7
1.8
1.9
1.7
Alte
rnat
if B
ank
A.
.0.
50.
70.
40.
40.
60.
4JP
Mor
gan
Cha
se B
ank
N.A
.0.
10.
00.
10.
10.
00.
1A
nado
luba
nk A
..
0.5
0.6
0.4
0.5
0.6
0.4
Mill
enni
um B
ank
A.
.0.
10.
10.
10.
10.
10.
1ek
erba
nk T
.A.
.1.
21.
41.
31.
21.
41.
3IN
G B
ank
A.
.1.
92.
51.
51.
82.
41.
5T
ekst
il B
anka
sı A
..
0.3
0.4
0.3
0.3
0.4
0.3
Soc
iété
Gén
éral
e (S
A)
0.1
0.1
0.0
0.1
0.1
0.0
Tur
kish
Ban
k A
..
0.1
0.1
0.1
0.1
0.1
0.1
The
Roy
al B
ank
of S
cotla
nd N
.V.
0.1
0.1
0.1
0.1
0.0
0.1
Tür
k E
kono
mi B
anka
sı A
..
2.0
2.4
2.0
2.0
2.3
2.0
Tur
klan
d B
ank
A.
.0.
20.
20.
20.
20.
20.
2T
ürki
ye G
aran
ti B
anka
sı A
..
13.3
13.2
11.8
12.9
12.7
11.8
Wes
tLB
AG
0.1
0.0
0.0
0.1
0.0
0.0
Tür
kiye
Ban
kası
A.
.14
.213
.114
.413
.712
.614
.4Y
apı v
e K
redi
Ban
kası
A.
.9.
110
.78.
68.
810
.38.
6D
evel
op
men
t an
d In
vest
men
t B
anks
100.
010
0.0
-3.
23.
7-
Ban
ks U
nd
er D
epo
. In
s. F
un
d0.
10.
00.
00.
10.
00.
0A
ktif
Yatırım
Ban
kası
A.
.4.
83.
8-
0.2
0.1
-B
ankP
oziti
f Kre
di v
e K
alkı
nma
Ban
kası
A.
.5.
35.
9-
0.2
0.2
-B
irle
ik F
on B
anka
sı A
..
0.1
0.0
0.0
0.1
0.0
0.0
Cre
dit A
gric
ole
Yatırım
Ban
kası
Tür
k A
..
0.2
0.0
-0.
00.
0-
Dile
r Y
atırım
Ban
kası
A.
.0.
30.
5-
0.0
0.0
-G
SD
Yatırım
Ban
kası
A.
.0.
30.
5-
0.0
0.0
-lle
r B
anka
sı A
..
31.3
35.2
-1.
01.
3-
MK
B T
akas
ve
Sak
lam
a B
anka
sı A
..
4.9
0.1
-0.
20.
0-
Mer
rill L
ynch
Yatırım
Ban
k A
..
1.1
0.0
-0.
00.
0-
Nur
ol Y
atırım
Ban
kası
A.
.0.
70.
6-
0.0
0.0
-T
aib
Yatırım
Ban
k A
..
0.0
0.0
-0.
00.
0-
Tür
k E
xim
bank
20.3
22.0
-0.
70.
8-
Tür
kiye
Kal
kınm
a B
anka
sı A
..
5.2
6.2
-0.
20.
2-
Tür
kiye
Sın
ai K
alkı
nma
Ban
kası
A.
.25
.625
.2-
0.8
0.9
-
Sh
are
in G
rou
pS
har
e in
Sec
tor
Sh
are
in G
rou
pS
har
e in
Sec
tor
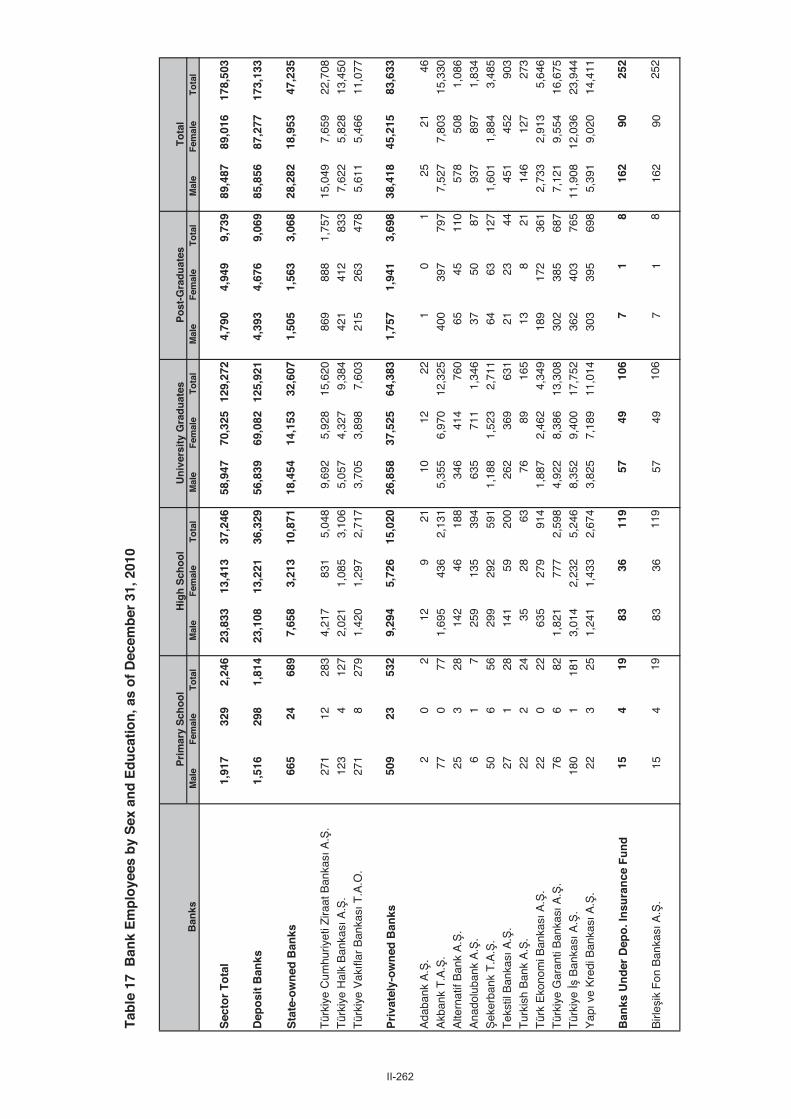
II-262
Tab
le 1
7 B
ank
Em
plo
yees
by
Sex
an
d E
du
cati
on
, as
of
Dec
emb
er 3
1, 2
010
Ban
ksM
ale
Fem
ale
To
tal
Mal
eF
emal
eT
ota
lM
ale
Fem
ale
To
tal
Mal
eF
emal
eT
ota
lM
ale
Fem
ale
To
tal
Sec
tor
To
tal
1,91
732
92,
246
23,8
3313
,413
37,2
4658
,947
70,3
2512
9,27
24,
790
4,94
99,
739
89,4
8789
,016
178,
503
Dep
osi
t B
anks
1,51
629
81,
814
23,1
0813
,221
36,3
2956
,839
69,0
8212
5,92
14,
393
4,67
69,
069
85,8
5687
,277
173,
133
Sta
te-o
wn
ed B
anks
665
2468
97,
658
3,21
310
,871
18,4
5414
,153
32,6
071,
505
1,56
33,
068
28,2
8218
,953
47,2
35
Tür
kiye
Cum
huriy
eti Z
iraat
Ban
kası
A.
.27
112
283
4,21
783
15,
048
9,69
25,
928
15,6
2086
988
81,
757
15,0
497,
659
22,7
08
Tür
kiye
Hal
k B
anka
sı A
..
123
412
72,
021
1,08
53,
106
5,05
74,
327
9,38
442
141
283
37,
622
5,82
813
,450
Tür
kiye
Vakıfl
ar B
anka
sı T
.A.O
.
271
827
91,
420
1,29
72,
717
3,70
53,
898
7,60
321
526
347
85,
611
5,46
611
,077
Pri
vate
ly-o
wn
ed B
anks
509
2353
29,
294
5,72
615
,020
26,8
5837
,525
64,3
831,
757
1,94
13,
698
38,4
1845
,215
83,6
33
Ada
bank
A.
.2
02
129
2110
1222
10
125
2146
Akb
ank
T.A
..
770
771,
695
436
2,13
15,
355
6,97
012
,325
400
397
797
7,52
77,
803
15,3
30
Alte
rnat
if B
ank
A.
.25
328
142
4618
834
641
476
065
4511
057
850
81,
086
Ana
dolu
bank
A.
.6
17
259
135
394
635
711
1,34
637
5087
937
897
1,83
4
eker
bank
T.A
..
506
5629
929
259
11,
188
1,52
32,
711
6463
127
1,60
11,
884
3,48
5
Tek
stil
Ban
kası
A.
. 27
128
141
5920
026
236
963
121
2344
451
452
903
Tur
kish
Ban
k A
..
222
2435
2863
7689
165
138
2114
612
727
3
Tür
k E
kono
mi B
anka
sı A
..
220
2263
527
991
41,
887
2,46
24,
349
189
172
361
2,73
32,
913
5,64
6
Tür
kiye
Gar
anti
Ban
kası
A.
.76
682
1,82
177
72,
598
4,92
28,
386
13,3
0830
238
568
77,
121
9,55
416
,675
Tür
kiye
Ban
kası
A.
.18
01
181
3,01
42,
232
5,24
68,
352
9,40
017
,752
362
403
765
11,9
0812
,036
23,9
44
Yapı v
e K
redi
Ban
kası
A.
.22
325
1,24
11,
433
2,67
43,
825
7,18
911
,014
303
395
698
5,39
19,
020
14,4
11
Ban
ks U
nd
er D
epo
. In
sura
nce
Fu
nd
154
1983
3611
957
4910
67
18
162
9025
2
Birl
eik
Fon
Ban
kası
A.
.15
419
8336
119
5749
106
71
816
290
252
To
tal
Hig
h S
cho
ol
Pri
mar
y S
cho
ol
Un
iver
sity
Gra
du
ates
Po
st-G
rad
uat
es
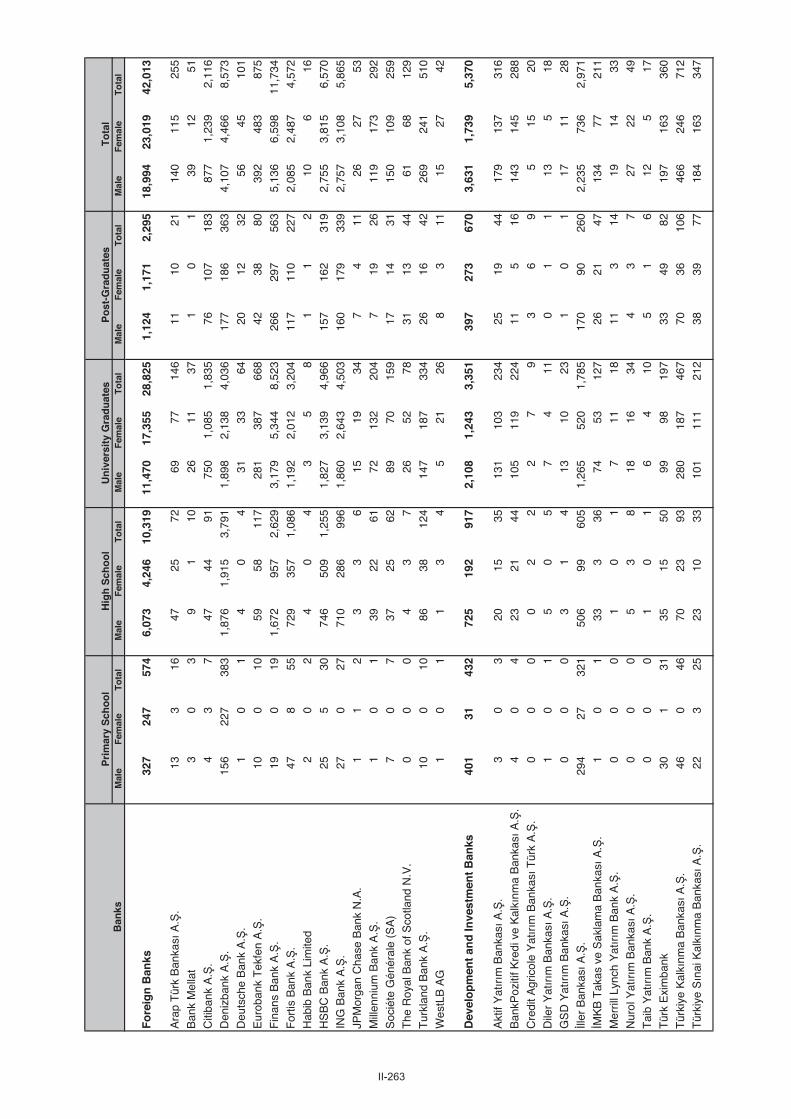
II-263
Ban
ksM
ale
Fem
ale
To
tal
Mal
eF
emal
eT
ota
lM
ale
Fem
ale
To
tal
Mal
eF
emal
eT
ota
lM
ale
Fem
ale
To
tal
To
tal
Hig
h S
cho
ol
Pri
mar
y S
cho
ol
Un
iver
sity
Gra
du
ates
Po
st-G
rad
uat
es
Fo
reig
n B
anks
327
247
574
6,07
34,
246
10,3
1911
,470
17,3
5528
,825
1,12
41,
171
2,29
518
,994
23,0
1942
,013
Ara
p T
ürk
Ban
kası
A.
.13
316
4725
7269
7714
611
1021
140
115
255
Ban
k M
ella
t
3
03
91
1026
1137
10
139
1251
Citi
bank
A.
.
43
747
4491
750
1,08
51,
835
7610
718
387
71,
239
2,11
6
Den
izba
nk A
..
156
227
383
1,87
61,
915
3,79
11,
898
2,13
84,
036
177
186
363
4,10
74,
466
8,57
3
Deu
tsch
e B
ank
A.
.1
01
40
431
3364
2012
3256
4510
1
Eur
oban
k T
ekfe
n A
..
100
1059
5811
728
138
766
842
3880
392
483
875
Fin
ans
Ban
k A
..
19
019
1,67
295
72,
629
3,17
95,
344
8,52
326
629
756
35,
136
6,59
811
,734
For
tis B
ank
A.
.47
855
729
357
1,08
61,
192
2,01
23,
204
117
110
227
2,08
52,
487
4,57
2
Hab
ib B
ank
Lim
ited
20
24
04
35
81
12
106
16
HS
BC
Ban
k A
..
255
3074
650
91,
255
1,82
73,
139
4,96
615
716
231
92,
755
3,81
56,
570
ING
Ban
k A
..
270
2771
028
699
61,
860
2,64
34,
503
160
179
339
2,75
73,
108
5,86
5
JPM
orga
n C
hase
Ban
k N
.A.
11
23
36
1519
347
411
2627
53
Mill
enni
um B
ank
A.
.1
01
3922
6172
132
204
719
2611
917
329
2
Soc
iéte
Gén
éral
e (S
A)
70
737
2562
8970
159
1714
3115
010
925
9
The
Roy
al B
ank
of S
cotla
nd N
.V.
00
04
37
2652
7831
1344
6168
129
Tur
klan
d B
ank
A.
.10
010
8638
124
147
187
334
2616
4226
924
151
0
Wes
tLB
AG
10
11
34
521
268
311
1527
42
Dev
elo
pm
ent
and
Inve
stm
ent
Ban
ks40
131
432
725
192
917
2,10
81,
243
3,35
139
727
367
03,
631
1,73
95,
370
Akt
if Y
atırım
Ban
kası
A.
.3
03
2015
3513
110
323
425
1944
179
137
316
Ban
kPoz
itif K
redi
ve
Kal
kınm
a B
anka
sı A
..
40
423
2144
105
119
224
115
1614
314
528
8
Cre
dit A
gric
ole
Yatırım
Ban
kası
Tür
k A
..
00
00
22
27
93
69
515
20
Dile
r Y
atırım
Ban
kası
A.
.1
01
50
57
411
01
113
518
GS
D Y
atırım
Ban
kası
A.
.0
00
31
413
1023
10
117
1128
ller
Ban
kası
A.
.29
427
321
506
9960
51,
265
520
1,78
517
090
260
2,23
573
62,
971
MK
B T
akas
ve
Sak
lam
a B
anka
sı A
..
10
133
336
7453
127
2621
4713
477
211
Mer
rill L
ynch
Yatırım
Ban
k A
..
00
01
01
711
1811
314
1914
33
Nur
ol Y
atırım
Ban
kası
A.
.0
00
53
818
1634
43
727
2249
Tai
b Y
atırım
Ban
k A
..
00
01
01
64
105
16
125
17
Tür
k E
xim
bank
301
3135
1550
9998
197
3349
8219
716
336
0
Tür
kiye
Kal
kınm
a B
anka
sı A
..
460
4670
2393
280
187
467
7036
106
466
246
712
Tür
kiye
Sın
ai K
alkı
nma
Ban
kası
A.
.22
325
2310
3310
111
121
238
3977
184
163
347

II-264
Tab
lo 1
8 B
ank
Em
plo
yees
by
Geo
gra
ph
ical
Reg
ion
s an
d P
rovi
nce
s, a
s o
f D
ecem
ber
31,
201
0
Reg
ion
s an
d P
rovi
nce
sN
o. o
f E
mp
loye
esR
egio
ns
and
Pro
vin
ces
No
. of
Em
plo
yees
Reg
ion
s an
d P
rovi
nce
sN
o. o
f E
mp
loye
es
stan
bu
l77
,814
Med
iter
ran
ean
14,5
26N
ort
h E
ast
An
ato
lia2,
244
Ada
na3,
699
Arı
216
Wes
t M
arm
ara
5,10
0A
ntal
ya5,
184
Ard
ahan
90B
alık
esir
1,71
9B
urdu
r37
6B
aybu
rt72
Çan
akka
le78
6H
atay
(A
ntak
ya)
1,39
3E
rzin
can
264
Edi
rne
752
Ispa
rta
595
Erz
urum
1,21
2Kır
klar
eli
569
çel (
Mer
sin)
2,23
5I
dır
140
Tek
irda
1,27
4K
ahra
man
mar
a72
1K
ars
250
Osm
aniy
e32
3A
egea
n19
,054
Mid
dle
Eas
t A
nat
olia
2,38
6A
fyon
kara
hisa
r81
6M
id-A
nat
olia
4,74
4B
ingö
l11
6A
ydın
1,67
4A
ksar
ay31
3B
itlis
179
Den
izli
1,61
5K
ayse
ri1,
915
Ela
zı61
3zm
ir10
,176
Kırık
kale
312
Hak
kari
92K
ütah
ya
599
Kır
ehir
245
Mal
atya
597
Man
isa
1,76
9N
eveh
ir38
7M
u14
0M
ula
1,97
3N
ide
295
Tun
celi
113
Uak
432
Siv
as80
6V
an53
6Y
ozga
t47
1E
ast
Mar
mar
a13
,891
So
uth
-Eas
t A
nat
olia
5,08
7B
ileci
k28
6W
est
An
ato
lia23
,361
Adı
yam
an36
3B
olu
430
Ank
ara
20,6
20B
atm
an23
3B
ursa
5,10
3K
aram
an23
4D
iyar
bakı
r1,
121
Düz
ce35
8K
onya
2,50
7G
azia
ntep
1,94
7E
ski
ehir
1,39
7K
ilis
90K
ocae
li (
zmit)
4,99
4W
est
Bla
ck S
ea6,
210
Mar
din
362
Sak
arya
1,03
7A
mas
ya42
0S
iirt
134
Yal
ova
286
Bar
tın23
4an
lıurf
a66
2Ç
ankı
rı23
1ır
nak
175
Eas
t B
lack
Sea
3,49
5Ç
orum
642
Art
vin
282
Kar
abük
319
Tu
rkis
h R
epu
blic
of
No
rth
ern
Cyp
rus
381
Gire
sun
522
Kas
tam
onu
540
Fo
reig
n C
ou
ntr
ies
210
Güm
üha
ne13
1S
amsu
n2,
020
Ord
u71
1S
inop
260
Riz
e42
1T
okat
646
Tra
bzon
1,42
8Z
ongu
ldak
898
To
tal
178,
503

II-265
Tab
le 1
9 N
um
ber
of
AT
M, P
OS
an
d b
y G
eog
rap
hic
al R
egio
ns
and
Pro
vin
ces,
as
of
Dec
emb
er 3
1, 2
010
Reg
ion
s an
d
Pro
vin
ces
No
. of
AT
MN
o. o
f P
OS
No
. of
Mer
chan
tsR
egio
ns
and
P
rovi
nce
sN
o. o
f A
TM
No
. of
PO
SN
o. o
f M
erch
ants
Reg
ion
s an
d P
rovi
nce
sN
o. o
f A
TM
No
. of
PO
SN
o. o
f M
erch
ants
stan
bu
l7,
180
571,
331
431,
893
Med
iter
ran
ean
3,03
032
9,67
125
5,81
2N
ort
h E
ast
An
ato
lia41
626
,978
23,7
58A
dana
598
52,2
6942
,178
Arı
512,
283
2,07
3W
est
Mar
mar
a1,
375
84,7
4472
,152
Ant
alya
1,21
991
,609
75,0
49A
rdah
an20
727
683
Balık
esir
496
32,5
6627
,646
Bur
dur
886,
560
6,03
2B
aybu
rt16
918
873
Çan
akka
le19
513
,637
12,1
28H
atay
(A
ntak
ya)
286
24,9
7421
,967
Erz
inca
n67
4,32
13,
731
Edi
rne
171
10,5
608,
802
Ispa
rta
155
11,0
439,
521
Erz
urum
180
12,1
5910
,521
Kır
klar
eli
135
7,15
16,
161
çel (
Mer
sin)
447
123,
188
83,1
16I
dır
252,
557
2,33
9T
ekird
a37
820
,830
17,4
15K
ahra
man
mar
a16
412
,619
11,4
09K
ars
574,
013
3,53
8O
sman
iye
737,
409
6,54
0A
egea
n4,
257
289,
282
239,
888
Mid
dle
Eas
t A
nat
olia
553
39,5
3034
,534
Afy
onka
rahi
sar
179
12,9
8411
,162
Mid
-An
ato
lia96
573
,792
63,5
65B
ingö
l35
1,37
01,
236
Aydın
442
31,2
8926
,791
Aks
aray
756,
081
5,22
6B
itlis
422,
093
1,83
4D
eniz
li31
025
,102
21,0
65K
ayse
ri34
525
,606
21,0
98E
lazı
112
9,05
77,
895
zmir
1,98
813
1,31
610
5,86
7Kırık
kale
886,
785
5,76
7H
akka
ri34
804
768
Küt
ahya
15
011
,643
10,1
08Kır
ehir
533,
387
3,15
1M
alat
ya15
216
,296
14,0
48M
anis
a38
824
,924
21,8
20N
eveh
ir89
7,52
36,
579
Mu
381,
833
1,66
1M
ula
711
44,5
7836
,645
Ni
de72
5,85
95,
133
Tun
celi
3386
579
8U
ak89
7,44
66,
430
Siv
as15
711
,569
10,1
37V
an10
77,
212
6,29
4Y
ozga
t86
6,98
26,
474
Eas
t M
arm
ara
2,73
418
5,52
315
3,74
9S
ou
th-E
ast
An
ato
lia1,
032
92,8
5778
,879
Bile
cik
673,
983
3,65
3W
est
An
ato
lia3,
037
226,
788
183,
297
Adı
yam
an81
6,61
55,
948
Bol
u10
07,
742
6,79
0A
nkar
a2,
536
180,
609
143,
988
Bat
man
585,
100
4,42
0B
ursa
1,01
471
,744
58,4
61K
aram
an49
4,56
54,
160
Diy
arba
kır
229
14,1
0011
,896
Düz
ce10
08,
239
7,35
4K
onya
452
41,6
1435
,149
Gaz
iant
ep32
929
,364
24,2
83E
ski
ehir
326
21,5
5217
,659
Kili
s23
8,73
07,
048
Koc
aeli
(zm
it)76
543
,070
35,6
67W
est
Bla
ck S
ea1,
254
111,
140
98,2
04M
ardi
n82
12,4
0410
,471
Sak
arya
276
22,2
3018
,572
Am
asya
978,
051
7,34
9S
iirt
353,
463
3,11
4Y
alov
a86
6,96
35,
593
Bar
tın57
4,65
54,
251
anlıu
rfa
144
10,9
309,
714
Çan
kırı
493,
205
2,96
1ır
nak
512,
151
1,98
5E
ast
Bla
ck S
ea70
861
,046
54,5
40Ç
orum
128
11,6
0910
,288
Art
vin
613,
630
3,44
7K
arab
ük75
5,85
95,
158
Tur
kish
Rep
ublic
of N
orth
ern
Cyp
rus
151
9,90
38,
241
Gire
sun
113
9,30
48,
495
Kas
tam
onu
105
12,3
4910
,556
For
eign
Cou
ntrie
s0
00
Güm
üha
ne31
1,71
91,
647
Sam
sun
337
33,2
0028
,647
Ord
u14
614
,526
13,1
64S
inop
543,
917
3,58
5R
ize
113
9,28
98,
199
Tok
at14
012
,610
11,6
98T
rabz
on24
422
,578
19,5
88Z
ongu
ldak
212
15,6
8513
,711
To
tal
26,6
922,
102,
585
1,69
8,51
2

II-266
Tab
le 2
0 E
qu
ity
Par
tici
pat
ion
s an
d A
ffili
ated
Co
mp
anie
s o
f T
urk
ish
Ban
ks A
bro
ad, a
s o
f D
ecem
ber
31,
201
0
Ban
ksF
ield
of
Act
ivit
yD
ate
of
Est
ablis
.D
ate
of
Par
tici
p.
Ch
airm
an o
f th
e B
oar
dG
ener
al M
anag
erA
dd
ress
Ph
on
eF
ax
Akb
ank
T.A
..
Ak
Glo
bal F
undi
ng B
.V. (
AC
)Is
suin
g B
onds
2001
2001
-B
anu
Özc
anA
kban
k N
.V. R
embr
andt
Tow
er
Am
stel
plei
n 1,
109
6 H
A A
mst
erda
m, T
he
Net
herla
nds
31-2
0-59
0095
031
-20-
5900
901
Akb
ank
AG
(A
C)
Ban
king
2005
2006
Bül
ent A
danı
rK
arl F
riedr
ich
Rie
ger
Bül
ent M
enem
enci
Akb
ank
AG
Tau
nust
or 2
D-6
0311
Fra
nkfu
rt
am M
ain
Ger
man
y49
-69-
2971
7100
49-6
9-29
7171
04
Akb
ank
N.V
. (A
C)
Ban
king
2000
2000
Bül
ent A
danı
rB
anu
Özc
anA
kban
k N
.V. R
embr
andt
Tow
er
Am
stel
plei
n 1,
109
6 H
A A
mst
erda
m, T
he
Net
herla
nds
31-2
0-59
0095
031
-20-
5900
901
Akb
ank
(Dub
ai)
Lim
ited
(AC
)B
anki
ng20
0920
09B
ülen
t Ada
nır
Cem
Ata
çD
IFC
, Gat
e V
illag
e 06
, Lev
el 0
3, D
ubai
, U
nite
d A
rab
Em
irate
s97
1-44
4 86
466
971-
4448
6465
An
ado
lub
ank
A.
.
Ana
dolu
bank
Inte
rnat
iona
l Ban
king
U
nit L
td. (
AC
)B
anki
ng20
0320
03P
ulat
Akç
inP
ulat
Akç
inS
abri
Kaz
mao
lu S
ok. A
sım
Süt
çü A
pt.
Lefk
oa
K.K
.T.C
.39
2-22
8235
139
2-22
8256
9
Ana
dolu
bank
Ned
erla
nd B
.V. (
AC
)B
anki
ng20
0620
06M
ehm
et R
ütü
Ba
aran
Sar
p A
kkar
tal
Dirk
Van
Lee
uwen
De
Boe
lela
an 7
108
3 H
J A
mst
erda
m, T
he
Net
herla
nds
31-2
0- 5
1719
0031
-20-
517
1909
Ban
kPo
ziti
f K
red
i ve
Kal
kın
ma
Ban
kası
A.
.
JSC
Ban
kpoz
itiv
(AC
)B
anki
ng19
9220
07sm
ail H
asan
A
kçak
ayalıo
luM
urat
Bet
oner
83, T
ole
bi S
tree
t Alm
aty
Kaz
akhs
tan
7-72
7-24
4924
37-
727-
2449
235
Den
izb
ank
A.
.
CJS
C D
exia
Ban
k R
ussi
a (A
C)
Ban
king
1998
2003
Hak
an A
teA
. Mes
ut E
rsoy
2nd
Zve
nigo
rods
kaya
Str
. H.1
3, B
l.42
Fl.6
12
3022
Mos
cow
Rus
sian
Fed
erat
ion
7-49
5-72
5102
07-
495-
7251
025
Den
izba
nk A
G. (
AC
)B
anki
ng19
9620
02H
akan
Ate
Mar
tijn
Van
Man
cius
Tho
mas
Kle
stil
Pla
tz 1
A 1
030
Vie
nna
Aus
tria
43-1
-505
1052
021
43-1
-505
1052
029
Eur
o D
eniz
Inte
rnat
iona
l Ban
king
U
nit L
td. (
AC
)B
anki
ng19
9620
02-
-14
. er
if A
rzık
Sok
. Lef
koa
K.K
.T.C
.39
2-22
8315
339
2-22
7254
2
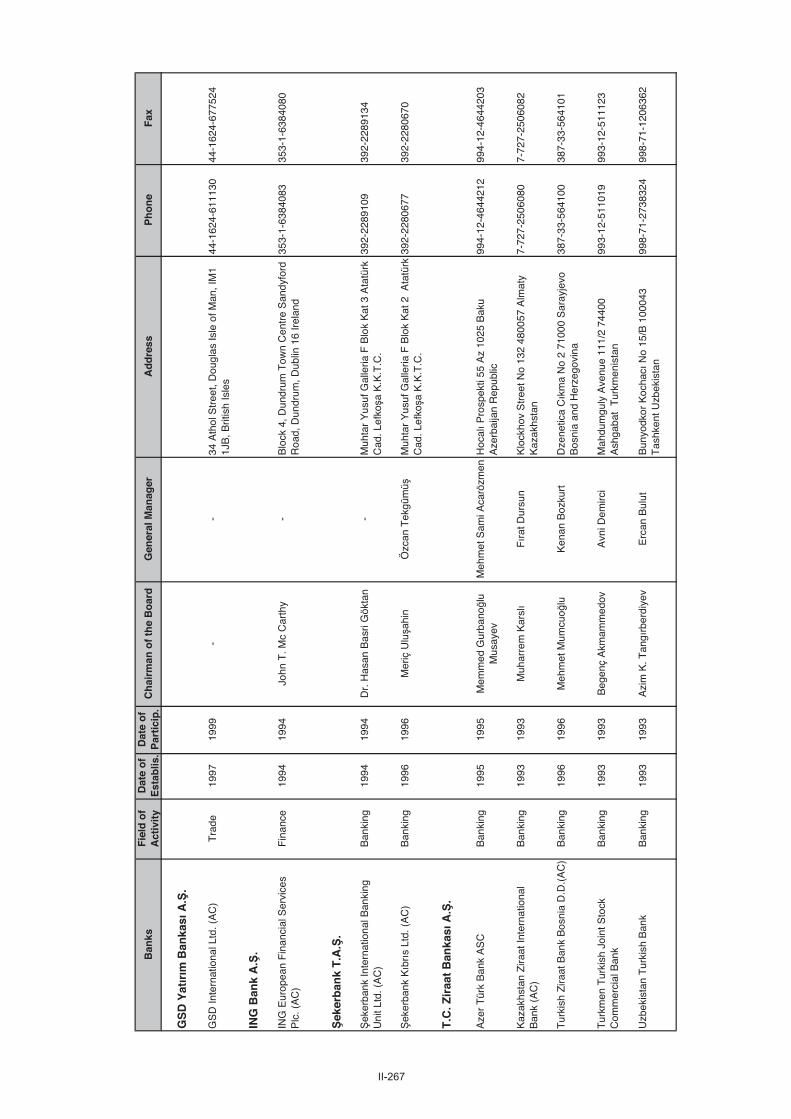
II-267
Ban
ksF
ield
of
Act
ivit
yD
ate
of
Est
ablis
.D
ate
of
Par
tici
p.
Ch
airm
an o
f th
e B
oar
dG
ener
al M
anag
erA
dd
ress
Ph
on
eF
ax
GS
D Y
atırım
Ban
kası
A.
.
GS
D In
tern
atio
nal L
td. (
AC
)T
rade
1997
1999
--
34 A
thol
Str
eet,
Dou
glas
Isle
of M
an, I
M1
1JB
, Brit
ish
Isle
s44
-162
4-61
1130
44-1
624-
6775
24
ING
Ban
k A
..
ING
Eur
opea
n F
inan
cial
Ser
vice
s P
lc. (
AC
)F
inan
ce19
9419
94Jo
hn T
. Mc
Car
thy
-B
lock
4, D
undr
um T
own
Cen
tre
San
dyfo
rd
Roa
d, D
undr
um, D
ublin
16
Irel
and
353-
1-63
8408
335
3-1-
6384
080
eker
ban
k T
.A.
.
eker
bank
Inte
rnat
iona
l Ban
king
U
nit L
td. (
AC
)B
anki
ng19
9419
94D
r. H
asan
Bas
ri G
ökta
n-
Muh
tar
Yus
uf G
alle
ria F
Blo
k K
at 3
Ata
türk
C
ad. L
efko
a K
.K.T
.C.
392-
2289
109
392-
2289
134
eker
bank
Kıb
rıs
Ltd.
(A
C)
Ban
king
1996
1996
Mer
iç U
luah
inÖ
zcan
Tek
güm
üM
uhta
r Y
usuf
Gal
leria
F B
lok
Kat
2 A
tatü
rk
Cad
. Lef
koa
K.K
.T.C
.39
2-22
8067
739
2-22
8067
0
T.C
. Zir
aat
Ban
kası
A.
.
Aze
r T
ürk
Ban
k A
SC
Ban
king
1995
1995
Mem
med
Gur
bano
luM
usay
evM
ehm
et S
ami A
carö
zmen
Hoc
alı P
rosp
ekti
55 A
z 10
25 B
aku
Aze
rbai
jan
Rep
ublic
994-
12-4
6442
1299
4-12
-464
4203
Kaz
akhs
tan
Zira
at In
tern
atio
nal
Ban
k (A
C)
Ban
king
1993
1993
Muh
arre
m K
arslı
Fır
at D
ursu
nK
lock
hov
Str
eet N
o 13
2 48
0057
Alm
aty
Kaz
akhs
tan
7-72
7-25
0608
07-
727-
2506
082
Tur
kish
Zira
at B
ank
Bos
nia
D.D
.(A
C)
Ban
king
1996
1996
Meh
met
Mum
cuo
luK
enan
Boz
kurt
Dze
netic
a Cık
ma
No
2 71
000
Sar
ayje
vo
Bos
nia
and
Her
zego
vina
387-
33-5
6410
038
7-33
-564
101
Tur
kmen
Tur
kish
Joi
nt S
tock
C
omm
erci
al B
ank
Ban
king
1993
1993
Beg
enç
Akm
amm
edov
Avn
i Dem
irci
Mah
dum
guly
Ave
nue
111/
2 74
400
Ash
gaba
t T
urkm
enis
tan
993-
12-5
1101
999
3-12
-511
123
Uzb
ekis
tan
Tur
kish
Ban
kB
anki
ng19
9319
93A
zim
K. T
angı
rber
diye
vE
rcan
Bul
utB
unyo
dkor
Koc
hacı
No
15/B
100
043
Tas
hken
t Uzb
ekis
tan
998-
71-2
7383
2499
8-71
-120
6362

II-268
Ban
ksF
ield
of
Act
ivit
yD
ate
of
Est
ablis
.D
ate
of
Par
tici
p.
Ch
airm
an o
f th
e B
oar
dG
ener
al M
anag
erA
dd
ress
Ph
on
eF
ax
* T
.C. Z
iraat
Ban
kası
A.
. con
tinue
d...
Zira
at B
ank
(Mos
cow
) C
JSC
(A
C)
Ban
king
1993
1993
Muh
arre
m K
arslı
Zaf
er B
asri
Yük
sel
Mos
alar
ko P
laza
One
, Mar
ksis
tkay
a 10
9147
Mos
cow
Rus
sian
Fed
erat
ion
7-49
5-23
2673
77-
495-
2326
736
Zira
at B
ank
Inte
rnat
iona
l AG
(A
C)
Ban
king
2001
2001
Muh
arre
m K
arslı
Atil
la Ç
etin
er,
Han
s M
icha
el S
ona
Am
Hau
ptba
hnho
f 16
6032
9 F
rank
furt
Am
M
ain
Ger
man
y49
-69-
2980
5049
-69-
2801
22
Zira
at B
anka
AD
Sko
pje
(AC
)B
anki
ng20
0820
08H
ayre
ttin
Kap
lan
Tur
han
Ade
mi,
Cen
giz
Üna
lZ
elez
niçk
a B
r.8
1000
Sko
pje
Mac
edon
ia38
9-2-
3111
337
389-
2-31
1001
3
Tek
stil
Ban
kası
A.
.
The
Eur
o T
extil
e In
tern
atio
nal
Ban
king
Uni
t Ltd
. (A
C)
Ban
king
1992
1992
Hat
ice
Çim
Güz
elay
dınlı
-2.
Sel
im C
ad. N
o 49
Arc
a A
pt. D
.4 L
efko
aK
.K.T
.C.
392-
2287
505
392-
2287
531
Tü
rk E
kon
om
i Ban
kası
A.
The
Eco
nom
y B
ank
N.V
. (A
C)
Ban
king
1998
1998
Yav
uz C
anev
iÖ
zden
Ba
aran
Oda
baı
Prf
W.H
. Kee
som
laan
s 5,
118
3 D
J A
mst
elve
en, T
he N
ethe
rland
s31
-20-
5039
010
31-2
0-50
3902
0
Tü
rkiy
e G
aran
ti B
anka
sı A
.
Gar
anti
Ban
k In
tern
atio
nal N
V. (
AC
)B
anki
ng19
9019
90S
üley
man
Söz
enB
ahadır
Ate
,M
arc
P. P
adbe
rgK
eize
rsgr
acht
569
- 5
75 A
mst
erda
m T
he
Net
herla
nds
31-2
0-55
3970
031
-20-
6242
466
Gar
anti
Ban
k M
osco
w (
AC
)B
anki
ng19
9519
96S
üley
man
Söz
enA
li N
iyaz
i Gür
can
Cap
ital P
laza
4, 4
th L
esno
y P
er. 8
th F
loor
12
5047
Mos
cow
Rus
sian
Fed
erat
ion
74-9
5-98
8070
774
-95-
9880
606
D N
ethe
rland
s H
oldi
ng B
.V. (
AC
)B
anki
ng20
0720
10-
Zek
eriy
a Ö
ztür
k,M
arcu
s P
. Pad
berg
Kei
zers
grac
ht 5
69 -
575
101
7 D
R
Am
ster
dam
The
Net
herla
nds
31-2
0- 6
7211
0931
-20-
553
9990
Tü
rkiy
e H
alk
Ban
kası
A.
.
Dem
ir -
Hal
k B
ank
(Ned
erla
nd)
N.V
.B
anki
ng19
9219
92T
heo
Bar
kS
elçu
k al
dıra
kP
arkl
aan
8 B
B 3
016
Rot
terd
am, T
he
Net
herla
nds
31-1
0-43
6915
131
-10-
4369
252
Tü
rkiy
e B
anka
sı A
..
bank
Gm
bh (
AC
)B
anki
ng19
9219
92A
.Ayk
ut D
emira
yB
ayra
m Ö
ztür
kH
aupt
verw
altu
ng R
ossm
arkt
9 6
0311
F
rank
furt
Mai
n D
euts
chla
nd49
-69-
2990
1049
-69-
2875
87

II-269
Ban
ksF
ield
of
Act
ivit
yD
ate
of
Est
ablis
.D
ate
of
Par
tici
p.
Ch
airm
an o
f th
e B
oar
dG
ener
al M
anag
erA
dd
ress
Ph
on
eF
ax
Tü
rkiy
e K
alkı
nm
a B
anka
sı A
..
stan
bul V
entu
re C
apita
l In
itiat
ive(
vcl)
Ven
ture
Cap
ital
2007
2007
Hak
an T
okaç
-69
, Rou
te d
'Esc
h L-
147
0 Lu
xem
bour
g R
.C.S
. Lux
embo
urg
B. 1
3354
8 35
2-42
6688
294
352-
4266
8830
1
Tü
rkiy
e V
akıf
lar
Ban
kası
Kıb
rıs
Vakıfl
ar B
anka
sı L
td.
Ban
king
1982
1989
Der
vi B
esim
ler
Ayt
aç S
önm
ezA
tatü
rk C
ad. 6
6 P
O.B
ox. 2
12 N
icos
ia
T.R
.N.C
.39
2-22
8587
1-72
392-
2275
169
Vakıfb
ank
Inte
rnat
iona
l A.G
.(A
C)
Ban
king
1999
1999
Ragıp
Do
uN
uman
Bek
Kar
ntne
r R
ing
18 1
010
Wie
n A
ustr
ia43
-1-5
1235
2043
-1-5
1235
2020
Wor
ld V
akıf
UB
B L
td. (
AC
)B
anki
ng19
9319
93Y
usuf
Ye
ilırm
ak-
Vakıfl
ar P
asajı 3
5, P
K 2
93 N
icos
ia
T.R
.N.C
.39
2-22
8871
039
2-22
8874
1
Yapı v
e K
red
i Ban
kası
A.
.
Ban
que
De
Com
mer
ce E
t De
Pla
cem
ents
S.A
.B
anki
ng19
6319
96F
ranz
Buc
her
Nac
i Sıın
1, R
ue D
e la
Fon
tain
, PO
Box
306
9 12
11
Gen
eva
3 S
witz
erla
nd41
-22-
9091
919
41-2
2-90
9190
0
Yapı K
redi
Ban
k A
zerb
ayca
n C
lose
d Jo
int S
tock
Com
pany
(A
C)
Ban
king
1998
1998
Tay
fun
Bay
azıt
Co
kun
Bul
akY
asam
al D
istr
ict C
afer
Cab
barlı
Str
. 32/
12
AZ
108
5 B
aku
Aze
rbai
jan
Rep
ublic
99-4
12-4
9777
9599
-412
-497
0276
Yapı K
redi
Ban
k N
eder
land
N.V
. (A
C)
Ban
king
2001
2001
Tay
fun
Bay
azıt
Özg
ür M
ara
Rem
bran
dt T
ower
Am
stel
plei
n 1,
109
6 H
A
Am
ster
dam
, The
Net
herla
nds
31-2
0-34
4555
531
-20-
6631
331
Yapı K
redi
Hol
ding
BV
. (A
C)
Fin
ance
1999
1999
Tay
fun
Bay
azıt
-R
embr
andt
Tow
er A
mst
elpl
ein
1, 1
096
HA
A
mst
erda
m, T
he N
ethe
rland
s31
-20-
3445
555
31-2
0-66
3133
1
Yapı K
redi
Ban
k M
osco
w (
AC
)B
anki
ng19
9419
94T
ayfu
n B
ayazıt
Boz
kurt
Kap
langı
1 B
uild
ing
2, G
onch
arna
ya N
aber
ezhn
aya
1151
72 M
osco
w R
ussi
an F
eder
atio
n74
-95-
2349
889
74-9
5-95
6197
2
AC
: A
ffilia
ted
Com
pany

II-270
Tab
le 2
1 B
ran
ches
an
d R
epre
sen
tati
ve O
ffic
es o
f T
urk
ish
Ban
ks A
bro
ad, a
s o
f D
ecem
ber
31,
201
0
Co
un
try
Cit
yB
anks
Ad
dre
ssP
ho
ne
Fax
Bul
garia
Plo
vdiv
T.C
.Zira
at B
anka
sı (
B)*
*4
Tsa
brib
rod
4000
Plo
vdiv
Bul
garia
359-
32-5
1192
1-24
359-
32-5
1192
5
Kar
dzha
liT
.C.Z
iraat
Ban
kası
(B
)**
2A B
ulai
r S
tr. K
ardz
hali
6600
Bul
garia
359-
361-
5465
0-58
359-
361-
5465
9
Sof
iaT
.C.Z
iraat
Ban
kası
(B
)T
odor
Ale
xand
rov
Blv
d. T
zar
Sam
uil S
tr. N
o 87
130
1 S
ofia
Bul
garia
359-
2-98
0666
135
9-2-
9802
113
Var
naT
.C.Z
iraat
Ban
kası
(B
)**
24 S
livni
tza
Str
. Var
na B
ulga
ria35
9-52
-912
505
359-
52-9
1250
0
Egy
ptC
airo
Tür
kiye
Ban
kası
(R
)N
ile C
ity T
ower
s, 2
005
C C
orni
sh E
l Nil,
Nor
th T
ower
, 27t
h F
loor
Cai
ro E
gypt
20-2
2-46
1981
320
-22-
4619
810
Geo
rgia
Tbi
lisi
T.C
.Zira
at B
anka
sı (
B)
Uzn
adze
117
Dav
id A
gmas
hene
beli
Ave
nue
No
148
0164
Tbi
lisi G
eorg
ia99
5-32
-943
704
995-
32-9
4383
4
Ger
man
yB
erlin
Tek
stil
Ban
kası
(R
)B
astia
n S
tr. 3
. 133
57 B
erlin
Deu
tsch
land
49-3
0-46
6016
0949
-30-
4660
1619
Dor
tmun
tT
ürki
ye H
alk
Ban
kası
(R
)*S
chüt
zen
Str
. 22
4414
7 D
ortm
unt D
euts
chla
nd49
-231
-820
062
49-2
31-8
2009
5
Düs
seld
orf
Tür
kiye
Gar
anti
Ban
kası
(R
)H
einr
ich-
Hei
ne A
llee
1 40
213
Düs
seld
orf
Deu
tsch
land
49-2
11-8
6222
301
49-2
11-8
6222
350
Köl
nT
ürki
ye H
alk
Ban
kası
(R
)*B
ahnh
ofsv
orpl
atz
1 5
0667
Köl
n D
euts
chla
nd49
-221
-136
545-
5549
-221
-125
246
eker
bank
(R
)K
omöd
ien
Str
. 9 5
0667
Köl
n D
euts
chla
nd49
-221
-735
573
49-2
21-7
3168
2
Man
nhei
mT
ürki
ye H
alk
Ban
kası
(R
)*G
2, 7
(M
arkt
plat
z) 6
8159
Man
nhei
m D
euts
chla
nd49
-621
-102
625
49-6
21-1
0246
9
Gre
ece
Ath
ens
T.C
.Zira
at B
anka
sı (
B)
Erm
ou 2
5th
Flo
or 1
0563
Ath
ens
Gre
ece
30-2
10-3
2230
3830
-210
-322
1796
Kom
otin
iT
.C.Z
iraat
Ban
kası
(B
)P
latia
Irin
is 1
7 &
Pap
afle
sa 1
T.K
. 691
00 K
omot
ini G
reec
e30
-253
-108
5930
30-2
53-1
0859
27
Xan
thi
T.C
.Zira
at B
anka
sı (
B)
M. K
arao
li 68
671
00 X
anth
i Gre
ece
30-2
54-1
0694
2030
-254
-106
6641
Iran
Teh
ran
T.C
.Zira
at B
anka
sı (
R)
Afr
ica
Blv
d. A
nahi
ta T
ower
No:
184
Sui
t 604
6th
Flo
or, T
ehra
n Ir
an98
-21-
8878
3417
/18
98-2
1-88
7835
26
Tür
kiye
Hal
k B
anka
sı (
R)
3rd
Flo
or B
uild
ing
130,
Gha
em M
agha
m F
arah
ani A
ve. T
ehra
n Ir
an98
-21-
8830
4715
98-2
1-88
3010
00
Iraq
Bag
hdad
T.C
.Zira
at B
anka
sı (
B)
Wez
iriye
Are
a 30
1St.
Dis
tric
t No
19 B
aghd
ad Ir
aq96
4-79
0-41
8139
0-
Kin
gdom
of
Bah
rain
Man
ama
Den
izba
nk (
B)
Al J
asra
h T
ower
6 th
Flo
or O
ffice
No
62/6
3 P
.O.B
ox 1
0357
Dip
lom
atic
Are
a
Man
ama
Kin
gdom
of B
ahra
in97
3-17
-541
137
973-
17-5
4113
9
Fin
ans
Ban
k (B
)U
nita
g H
ouse
5th
Flo
or P
.O.B
ox 2
435
Man
ama
Kin
gdom
of B
ahra
in97
3-17
-211
322
973-
17-2
1133
9
ING
Ban
k (B
)U
nita
g H
ouse
, 8th
Flo
or G
over
nmen
t Ave
nue,
Man
ama
Kin
gdom
of B
ahra
in97
3-17
-215
300
973-
17-2
1790
0
Tür
k E
kono
mi B
anka
sı (
B)
Al J
asra
h T
ower
9 th
Flo
or, D
iplo
mat
ic A
rea
Man
ama
Kin
gdom
of B
ahra
in97
3-17
-540
070
973-
17-5
4007
1
Tür
kiye
Hal
k B
anka
sı (
B)
Kin
gdom
of B
ahra
in D
evel
opm
ent B
ank
Bui
ldin
g 6t
h F
l. D
iplo
mat
ic A
rea,
PO
.Box
11
378
Man
ama
Kin
gdom
of B
ahra
in97
3-17
-537
711
973-
17-5
3546
3
Tür
kiye
Ban
kası
(B
)A
l Jas
rah
Tow
er 8
th F
loor
, Dip
lom
atic
Are
a P
.O. B
ox 1
0205
Man
ama
Kin
gdom
of
Bah
rain
973-
17-5
4922
297
3-17
-549
218
Tür
kiye
Sın
ai K
alkı
nma
Ban
kası
(B
)A
l Roa
ssis
Tow
er 1
0th
Flo
or, D
iplo
mat
ic A
rea
P.O
. Box
102
15 M
anam
a K
ingd
om
of B
ahra
in97
3-17
-531
530
973-
17-5
3185
3
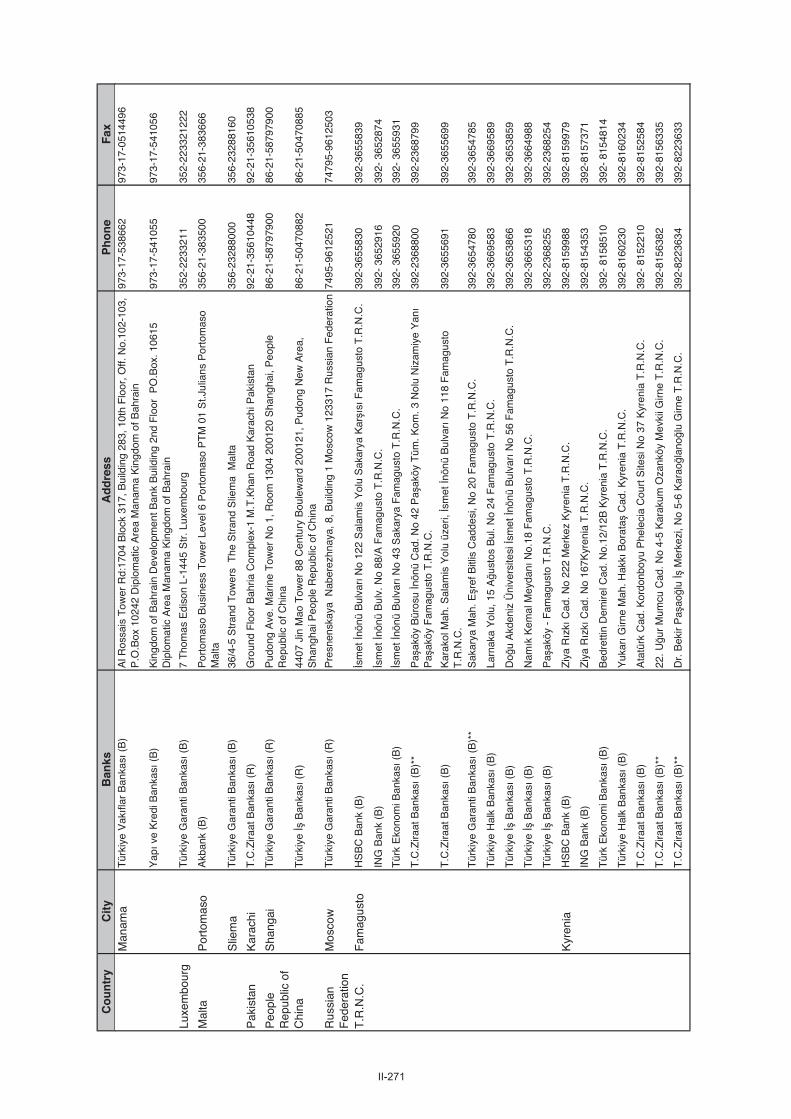
II-271
Co
un
try
Cit
yB
anks
Ad
dre
ssP
ho
ne
Fax
Man
ama
Tür
kiye
Vakıfl
ar B
anka
sı (
B)
Al R
ossa
is T
ower
Rd:
1704
Blo
ck 3
17, B
uild
ing
283,
10t
h F
loor
, Off.
No.
102-
103,
P
.O.B
ox 1
0242
Dip
lom
atic
Are
a M
anam
a K
ingd
om o
f Bah
rain
973-
17-5
3866
297
3-17
-051
4496
Yapı v
e K
redi
Ban
kası
(B
)K
ingd
om o
f Bah
rain
Dev
elop
men
t Ban
k B
uild
ing
2nd
Flo
or P
O.B
ox. 1
0615
D
iplo
mat
ic A
rea
Man
ama
Kin
gdom
of B
ahra
in97
3-17
-541
055
973-
17-5
4105
6
Luxe
mbo
urg
Tür
kiye
Gar
anti
Ban
kası
(B
)7
Tho
mas
Edi
son
L-14
45 S
tr. L
uxem
bour
g35
2-22
3321
135
2-22
3321
222
Mal
taP
orto
mas
oA
kban
k (B
) P
orto
mas
o B
usin
ess
Tow
er L
evel
6 P
orto
mas
o P
TM
01
St.J
ulia
ns P
orto
mas
o M
alta
356-
21-3
8350
035
6-21
-383
666
Slie
ma
Tür
kiye
Gar
anti
Ban
kası
(B
)36
/4-5
Str
and
Tow
ers
The
Str
and
Slie
ma
Mal
ta35
6-23
2880
0035
6-23
2881
60
Pak
ista
nK
arac
hiT
.C.Z
iraat
Ban
kası
(R
)G
roun
d F
loor
Bah
ria C
ompl
ex-1
M.T
.Kha
n R
oad
Kar
achi
Pak
ista
n92
-21-
3561
0448
92-2
1-35
6105
38
Sha
ngai
Tür
kiye
Gar
anti
Ban
kası
(R
)P
udon
g A
ve. M
arin
e T
ower
No
1, R
oom
130
4 20
0120
Sha
ngha
i, P
eopl
e R
epub
lic o
f Chi
na86
-21-
5879
7900
86-2
1-58
7979
00
Tür
kiye
Ban
kası
(R
)44
07 J
in M
ao T
ower
88
Cen
tury
Bou
lew
ard
2001
21, P
udon
g N
ew A
rea,
S
hang
hai P
eopl
e R
epub
lic o
f Chi
na86
-21-
5047
0882
86-2
1-50
4708
85
Rus
sian
Fed
erat
ion
Mos
cow
Tür
kiye
Gar
anti
Ban
kası
(R
)P
resn
ensk
aya
Nab
erez
hnay
a, 8
, Bui
ldin
g 1
Mos
cow
123
317
Rus
sian
Fed
erat
ion
7495
-961
2521
7479
5-96
1250
3
T.R
.N.C
.F
amag
usto
HS
BC
Ban
k (B
)sm
etnö
nü B
ulva
rı N
o 12
2 S
alam
is Y
olu
Sak
arya
Karısı F
amag
usto
T.R
.N.C
.39
2-36
5583
039
2-36
5583
9
ING
Ban
k (B
)sm
etnö
nü B
ulv.
No
88/A
Fam
agus
to T
.R.N
.C.
392-
365
2916
392-
365
2874
Tür
k E
kono
mi B
anka
sı (
B)
smet
nönü
Bul
varı
No
43 S
akar
ya F
amag
usto
T.R
.N.C
.39
2- 3
6559
2039
2- 3
6559
31
T.C
.Zira
at B
anka
sı (
B)*
*P
aak
öy B
üros
u nö
nü C
ad. N
o 42
Pa
aköy
Tüm
. Kom
. 3 N
olu
Niz
amiy
e Y
anı
Pa
aköy
Fam
agus
to T
.R.N
.C.
392-
2368
800
392-
2368
799
T.C
.Zira
at B
anka
sı (
B)
Kar
akol
Mah
. Sal
amis
Yol
u üz
eri,
smet
nönü
Bul
varı
No
118
Fam
agus
to
T.R
.N.C
.39
2-36
5569
139
2-36
5569
9
Tür
kiye
Gar
anti
Ban
kası
(B
)**
Sak
arya
Mah
. Ere
f Bitl
is C
adde
si, N
o 20
Fam
agus
to T
.R.N
.C.
392-
3654
780
392-
3654
785
Tür
kiye
Hal
k B
anka
sı (
B)
Larn
aka
Yol
u, 1
5 A
usto
s B
ul. N
o 24
Fam
agus
to T
.R.N
.C.
392-
3669
583
392-
3669
589
Tür
kiye
Ban
kası
(B
)D
ou
Akd
eniz
Üni
vers
itesi
sm
etnö
nü B
ulva
rı N
o 56
Fam
agus
to T
.R.N
.C.
392-
3653
866
392-
3653
859
Tür
kiye
Ban
kası
(B
)N
amık
Kem
al M
eyda
nı N
o.18
Fam
agus
to T
.R.N
.C.
392-
3665
318
392-
3664
988
Tür
kiye
Ban
kası
(B
)P
aak
öy -
Fam
agus
to T
.R.N
.C.
392-
2368
255
392-
2368
254
Kyr
enia
HS
BC
Ban
k (B
)Z
iya
Rız
kı C
ad. N
o 22
2 M
erke
z K
yren
ia T
.R.N
.C.
392-
8159
988
392-
8159
979
ING
Ban
k (B
)Z
iya
Rız
kı C
ad. N
o 16
7Kyr
enia
T.R
.N.C
.39
2-81
5435
339
2-81
5737
1
Tür
k E
kono
mi B
anka
sı (
B)
Bed
retti
n D
emire
l Cad
. No.
12/1
2B K
yren
ia T
.R.N
.C.
392-
815
8510
392-
815
4814
Tür
kiye
Hal
k B
anka
sı (
B)
Yuk
arı G
irne
Mah
. Hak
kı B
orat
a C
ad. K
yren
ia T
.R.N
.C.
392-
8160
230
392-
8160
234
T.C
.Zira
at B
anka
sı (
B)
Ata
türk
Cad
. Kor
donb
oyu
Phe
leci
a C
ourt
Site
si N
o 37
Kyr
enia
T.R
.N.C
.39
2- 8
1522
1039
2-81
5258
4
T.C
.Zira
at B
anka
sı (
B)*
*22
. Uur
Mum
cu C
ad. N
o 4-
5 K
arak
um O
zank
öy M
evki
i Girn
e T
.R.N
.C.
392-
8156
382
392-
8156
335
T.C
.Zira
at B
anka
sı (
B)*
*D
r. B
ekir
Pa
aolu
Mer
kezi
, No
5-6
Kar
aola
nolu
Girn
e T
.R.N
.C.
392-
8223
634
392-
8223
633
Peo
ple
Rep
ublic
of
Chi
na
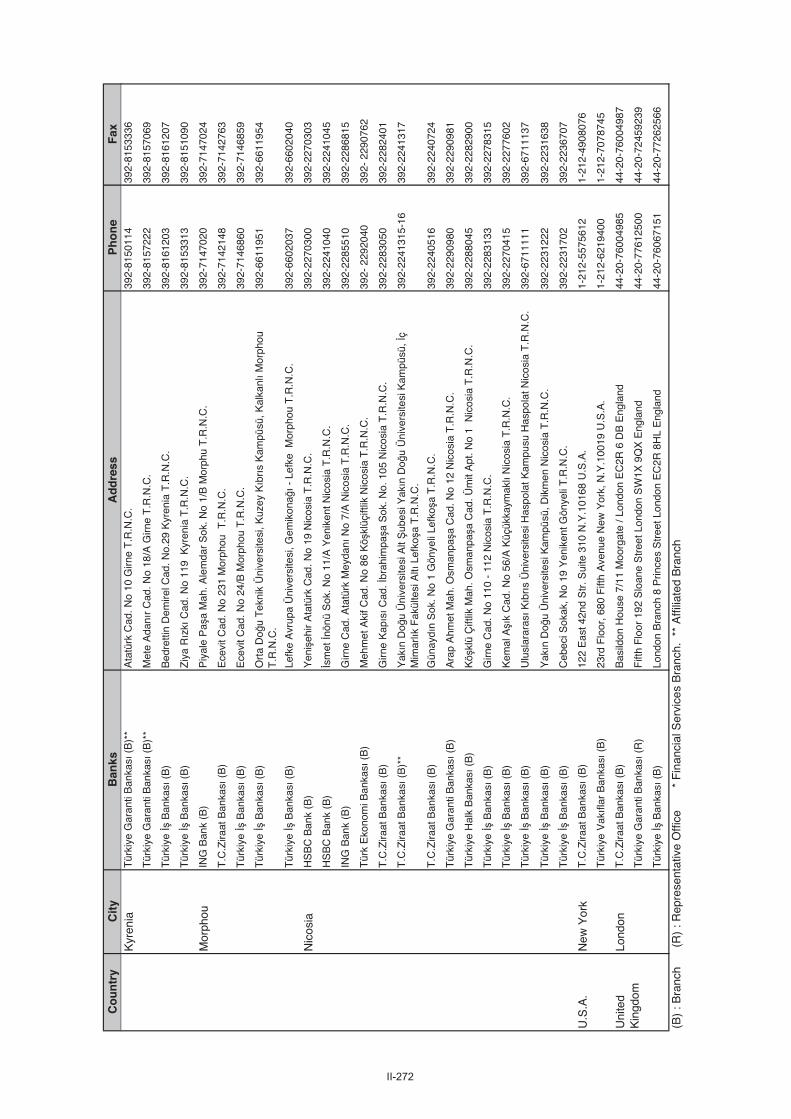
II-272
Co
un
try
Cit
yB
anks
Ad
dre
ssP
ho
ne
Fax
Kyr
enia
Tür
kiye
Gar
anti
Ban
kası
(B
)**
Ata
türk
Cad
. No
10 G
irne
T.R
.N.C
.39
2-81
5011
439
2-81
5333
6
Tür
kiye
Gar
anti
Ban
kası
(B
)**
Met
e A
danı
r C
ad. N
o 18
/A G
irne
T.R
.N.C
.39
2-81
5722
239
2-81
5706
9
Tür
kiye
Ban
kası
(B
)B
edre
ttin
Dem
irel C
ad. N
o.29
Kyr
enia
T.R
.N.C
.39
2-81
6120
339
2-81
6120
7
Tür
kiye
Ban
kası
(B
)Z
iya
Rız
kı C
ad. N
o 11
9 K
yren
ia T
.R.N
.C.
392-
8153
313
392-
8151
090
Mor
phou
ING
Ban
k (B
)P
iyal
e P
aa
Mah
. Ale
mda
r S
ok. N
o 1/
B M
orph
u T
.R.N
.C.
392-
7147
020
392-
7147
024
T.C
.Zira
at B
anka
sı (
B)
Ece
vit C
ad. N
o 23
1 M
orph
ou T
.R.N
.C.
392-
7142
148
392-
7142
763
Tür
kiye
Ban
kası
(B
)E
cevi
t Cad
. No
24/B
Mor
phou
T.R
.N.C
.39
2-71
4686
039
2-71
4685
9
Tür
kiye
Ban
kası
(B
)O
rta
Do
u T
ekni
k Ü
nive
rsite
si, K
uzey
Kıb
rıs
Kam
püsü
, Kal
kanlı M
orph
ou
T.R
.N.C
.39
2-66
1195
139
2-66
1195
4
Tür
kiye
Ban
kası
(B
)Le
fke
Avr
upa
Üni
vers
itesi
, Gem
ikon
aı -
Lef
ke M
orph
ou T
.R.N
.C.
392-
6602
037
392-
6602
040
Nic
osia
HS
BC
Ban
k (B
)Y
eni
ehir
Ata
türk
Cad
. No
19 N
icos
ia T
.R.N
.C.
392-
2270
300
392-
2270
303
HS
BC
Ban
k (B
)sm
etnö
nü S
ok. N
o 11
/A Y
enik
ent N
icos
ia T
.R.N
.C.
392-
2241
040
392-
2241
045
ING
Ban
k (B
)G
irne
Cad
. Ata
türk
Mey
danı
No
7/A
Nic
osia
T.R
.N.C
.39
2-22
8551
039
2-22
8681
5
Tür
k E
kono
mi B
anka
sı (
B)
Meh
met
Aki
f Cad
. No
86 K
ökl
üçift
lik N
icos
ia T
.R.N
.C.
392-
229
2040
392-
229
0762
T.C
.Zira
at B
anka
sı (
B)
Girn
e K
apısı C
ad.
brah
impa
a S
ok. N
o. 1
05 N
icos
ia T
.R.N
.C.
392-
2283
050
392-
2282
401
T.C
.Zira
at B
anka
sı (
B)*
*Y
akın
Do
u Ü
nive
rsite
si A
lt ub
esi Y
akın
Do
u Ü
nive
rsite
si K
ampü
sü,
çM
imar
lık F
akül
tesi
Altı
Lef
koa
T.R
.N.C
.39
2-22
4131
5-16
392-
2241
317
T.C
.Zira
at B
anka
sı (
B)
Gün
aydı
n S
ok. N
o 1
Gön
yeli
Lefk
oa
T.R
.N.C
.39
2-22
4051
639
2-22
4072
4
Tür
kiye
Gar
anti
Ban
kası
(B
)A
rap
Ahm
et M
ah. O
sman
paa
Cad
. No
12 N
icos
ia T
.R.N
.C.
392-
2290
980
392-
2290
981
Tür
kiye
Hal
k B
anka
sı (
B)
Kö
klü
Çift
lik M
ah. O
sman
paa
Cad
. Üm
it A
pt. N
o 1
Nic
osia
T.R
.N.C
.39
2-22
8804
539
2-22
8290
0
Tür
kiye
Ban
kası
(B
)G
irne
Cad
. No
110
- 11
2 N
icos
ia T
.R.N
.C.
392-
2283
133
392-
2278
315
Tür
kiye
Ban
kası
(B
)K
emal
Aık
Cad
. No
56/A
Küç
ükka
ymak
lı N
icos
ia T
.R.N
.C.
392-
2270
415
392-
2277
602
Tür
kiye
Ban
kası
(B
)U
lusl
arar
ası Kıb
rıs
Üni
vers
itesi
Has
pola
t Kam
pusu
Has
pola
t Nic
osia
T.R
.N.C
.39
2-67
1111
139
2-67
1113
7
Tür
kiye
Ban
kası
(B
)Y
akı n
Do
u Ü
nive
rsite
si K
ampü
sü, D
ikm
en N
icos
ia T
.R.N
.C.
392-
2231
222
392-
2231
638
Tür
kiye
Ban
kası
(B
)C
ebec
i Sok
ak, N
o 19
Yen
iken
t Gön
yeli
T.R
.N.C
.39
2-22
3170
239
2-22
3670
7
U.S
.A.
New
Yor
kT
.C.Z
iraat
Ban
kası
(B
)12
2 E
ast 4
2nd
Str
. Sui
te 3
10 N
.Y.1
0168
U.S
.A.
1-21
2-55
7561
21-
212-
4908
076
Tür
kiye
Vakıfl
ar B
anka
sı (
B)
23rd
Flo
or, 6
80 F
ifth
Ave
nue
New
Yor
k, N
.Y.1
0019
U.S
.A.
1-21
2-62
1940
01-
212-
7078
745
Lond
onT
.C.Z
iraat
Ban
kası
(B
)B
asild
on H
ouse
7/1
1 M
oorg
ate
/ Lon
don
EC
2R 6
DB
Eng
land
44-2
0-76
0049
8544
-20-
7600
4987
Tür
kiye
Gar
anti
Ban
kası
(R
)F
ifth
Flo
or 1
92 S
loan
e S
tree
t Lon
don
SW
1X 9
QX
Eng
land
44
-20-
7761
2500
44-2
0-72
4592
39
Tür
kiye
Ban
kası
(B
)Lo
ndon
Bra
nch
8 P
rince
s S
tree
t Lon
don
EC
2R 8
HL
Eng
land
44
-20-
7606
7151
44-2
0-77
2625
66
(B)
: Bra
nch
(
R)
: Rep
rese
ntat
ive
Offi
ce
*
Fin
anci
al S
ervi
ces
Bra
nch.
**
Affi
liate
d B
ranc
h
Uni
ted
Kin
gdom

II-273
Table 22 Representative Offices in Turkey, as of December, 31 2010
Banks Head Office Address Phone FaxAareal Bank A.G. Germany Ebulula Mardin Cad. Maya Meridyen Merkezi D 2
Blok 11 Akatlar stanbul212-349 02 00 212-349 02 99
ABC International Bank PLC United Kingdom Eski Büyükdere Cad. Ayaza a Yolu Sok. z Plaza No 9 Kat 19 Daire 69 34398 Maslak stanbul
212-290 68 90 212-290 68 91
Axion Swiss Bank SA Türkiye Temsilcili i Switzerland Barbaros Bulvarı Morbasan Sokak Koza Merkezi B Blok Kat 5 Be ikta stanbul
212-274 38 72 212-274 49 94
Banca Infrastrutture Innovazione E Sviluppo S.P.A.
Italy Sümer Plaza Askeroca ı Caddesi Kat 18 No 1802 Elmada 34367 stanbul
212-249 23 74 212- 249 23 75
Banca Monte Dei Paschi di Siena S.P.A. Italy Askeroca ı Cad. Süzer Plaza No 9 Kat 25 Daire No 2505 34367 i li stanbul
212-251 40 87 212-251 40 88
212-251 30 01
Banco Sabadell S.A. Spain Mete Cad. Yeni Apt. No 10/4 Taksim stanbul 212-249 78 92 212-249 78 90
Bank Julius Baer&Co.Ltd. Switzerland Maçka Cad. No 22/7 Vehbi Bey Apt. 34367 Te vikiyei li stanbul
212-368 82 13 212-296 79 72
Banque Internationale de Commerce-BRED France Süleyman Seba Cad. No 48 BJK Plaza A-56 34357 Akaretler Be ikta stanbul
212-327 42 80 212-327 42 81
212-327 42 82
BNP Paribas S.A. France Mete Cad. No 16 Kat 3 34437 Taksim stanbul 212-293 00 32 212-251 74 47
212-251 43 85
Caja de Ahorros Y Pensiones de Barcelona (La Caixa)
Spain Büyükdere Cad. Yapı ve Kredi Plaza C Blok Kat 12 34330 Levent stanbul
212-279 95 02212-279 95 03
212-279 95 80
Citibank N.A. U.S.A. Süleyman Seba Cad. No 44 D B-1-S80 34357 Be iktastanbul
212-261 42 30 212-261 42 67
Commerzbank A.G. Germany Yapı Kredi Plaza B Blok Kat 7 No 19/B 34330 Levent stanbul
212-280 55 24 212-279 41 76
Credit Europe Bank (Suisse) S.A. Switzerland Vi nezade Mah. BJK Plaza A Blok No 35-36 Be iktastanbul
212-227 59 29 212-258 35 76
Credit Europe Bank N.V. Hollanda Migün Mah. Eski Büyükdere Cad. No 22 Park Plaza Kat 10 No 24-25 Maslak stanbul
212-366 01 00 212-366 01 50
Credit Industriel et Commercial France Süleyman Seba Cad. No 48 BJK Plaza A Blok K4 D41 34357 Akaretler Be ikta stanbul
212-227 67 39212-227 67 40
212-227 67 44
Credit Suisse AG Switzerland Yıldırım O uz Göker Cad. Maya Plaza Kat 9 Akatlar 80630 Be ikta stanbul
212-351 86 00 212-351 87 00
Deg-Deutsche Investitions-und Entwicklungsgesellschaft MBH
Germany Kanyon Ofis Blo u Büyükdere Cad. Kat 7 No 185 34394 Levent stanbul
212-317 81 91 212- 353 52 40
Demir-Halk Bank (Nederland) N.V. Netherlands Süzer Plaza Askeroca ı Cad. No 15 Kat 24 Oda 2406 34367 Elmada i li stanbul
212-292 12 20 212-292 19 40
Doha Bank Qatar Süzer Plaza Askeroca ı Cad. No 15 Kat 18 D 1804 34367 Elmada i li stanbul
212-243 92 19 212-243 92 17
Dubai Islamic Bank United Arab Emirates Ömer Avni Mah. nebolu Sok. Sümbülkonak Apt. No 69 Kat 5 Beyo lu stanbul
212-293 70 65 212-293 70 66
212-293 70 50
DZ Bank A.G. Germany Mete Cad. No 14/1 Ayano lu Merkezi 34437 Taksim stanbul
212-249 77 22 212-249 77 44
212-249 77 55
Euro Hypo A.G. Germany Kanyon Ofis Blo u Büyükdere Cad. No 185 34394 Levent stanbul
212-317 22 00 212-317 22 10
Garantibank International N.V. Netherlands Ayaza a Yolu No 4 z Plaza Giz Kat 18 Maslak stanbul 212-366 43 01 212-366 43 20
HSBC Private Bank (Suisse) S.A. Switzerland Süleyman Seba Cad. Akaretler Yoku u BJK Plaza No 48 A Blok Daire 124 Akaretler Be ikta stanbul
212-327 41 27 212-327 41 30
ING Bank N.V. Netherlands Eski Büyükdere Cad. Ayaza a Köy Yolu No 6 A Kat 10 34398 Maslak stanbul
212-276 58 46 212-276 58 47
Intesa Sanpaolo S.P.A. Italy Askeroca ı Cad. Süzer Plaza Kat 18 No 1802 34367 Elmada stanbul
212-251 28 40 212-251 28 41
KBC Bank N.V. Belgium Bayraklı Sok. No 28/3 06670 G.Osmanpa a Ankara 312- 447 09 93 312- 447 09 96
KFW (Kreditanstalt Für Wiederaufbau) IPEX-Bank GMBH
Germany Kanyon Ofis Blo u Kat 7 Büyükdere Cad. No 185 34394 Levent stanbul
212-317 90 91 212-353 10 36
Qinvest LLC Qatar Büyükdere Cad. No 127 Astoria Residence A Blok D 1901 Esentepe stanbul
212-215 20 66 212- 215 20 63
Rabobank International Netherlands Süleyman Seba Cad. Akaretler Sıraevleri No 23 34357 Be ikta stanbul
212-326 72 00 212-326 72 02
Standard Bank PLC United Kingdom Maslak Mah. Polaris Plaza Ahi Evren Cad. No 21 B i listanbul
212-367 36 25 212-346 09 39
Standard Chartered Bank United Kingdom Kuleleri Kule 2 K 12 34330 4. Levent stanbul 212-283 40 31 212-283 07 58
State Bank of India India Cumhuriyet Cad. 171/3 Park Apt. Elmada i li stanbul 212-296 03 50 212-296 66 32
The Bank of New York Mellon U.S.A. Süleyman Seba Cad. BJK Plaza B Blok No 48 Kat 6 34357 Akaretler Be ikta stanbul
212-259 04 66 212-259 04 67
212-259 04 47
The Bank of Nova Scotia Türkiye Canada Büyükdere Cad. Tekfen Tower No 209 Kat 17 4 Levent stanbul
212-251 00 49 212-251 00 47
The Bank of Tokyo-Mitsubishi UFJ, Ltd. Japan Büyükdere Cad. No 100-102 Maya Akar Center B Blok Kat 20 Daire 79 Esentepe stanbul
212-288 56 45 212-288 56 46
The Economy Bank N.V. Netherlands Re itpa a Mah. Eski Büyükdere Cad. Park Plaza No 14 Kat 5 Sarıyer stanbul
212-345 03 55 212-345 03 54
UBS A.G. Switzerland Büyükdere Cad. Kanyon Ofis Blo u No 185 Kat 7 34394 Levent stanbul
212-319 20 50 212-319 20 55
Union Bancaire Privée, UBP SA Switzerland Maçka Cad. Feza Apt. No 1 D 2 34353 Maçka stanbul 212-296 20 40 212-296 35 70
UPS Capital Business Credit U.S.A. Büyükdere Cad. No 24 34330 1. Levent stanbul 212-278 91 21 212-270 03 11
212-282 33 72
Wells Fargo Bank N.A. U.S.A. Kuleleri Büyükdere Cad. Kule 2 Kat 9 34335 Levent stanbul
212-324 88 83212-324 88 88
212-324 88 39
Source: Banking Regulation and Supervision Agency

II-274


MAY 2011
MA
Y 2
011
The Banks Assoc›at›on
of Turkey
Nispetiye CaddesiAkmerkez B3 Blok Kat 13
Etiler 34340 Istanbul - TurkeyTel: +90 212 282 09 73Fax: +90 212 282 09 46E-mail: [email protected]
www.tbb.org.tr
BA
NK
S IN
TU
RK
EY
201
0B
AN
KS
IN T
UR
KE
Y 2
010
20102010BANKS IN TURKEYBANKS IN TURKEY