banque fédérative du crédit mutuel...nrj mobile eii (euroinformation int.) factor soft gacm acm...
TRANSCRIPT

Investor Presentation – Nov 2012 1
Banque Fédérative du Crédit Mutuel www.bfcm.creditmutuel.fr
Interim figures 2012

Investor Presentation – Nov 2012 2
DISCLAIMER
• This presentation has been prepared by Banque Fédérative du Crédit Mutuel ("BFCM") solely for use in the presentation
• CM10-CIC is constituted by the addition of 10 Crédit Mutuel federations : Centre-Est-Europe, Sud-est, Ile de France, Savoie Mont-Blanc, Midi-Atlantique , Loire Atlantique, Normandie, Centre, Dauphiné-Vivarais and Méditerranée
• As of January 2012, Anjou federation has joined the Group : Crédit Mutuel-CIC represents the perimeter of CM10-CIC until the December 2011 and of CM11-CIC starting as of January 2012
• Statements that are not historical facts, including statements about Crédit Mutuel-CIC’s and BFCM’s beliefs and expectations, are forward-looking statements. These statements are based on current plans, estimates and projections, and therefore undue reliance should not be placed on them
• Forward-looking statements are only valid as of the date they are made, and neither CM11-CIC Group nor BFCM undertakes any obligation to update publicly any of them in light of new information or future events
• This presentation is confidential and is neither to be reproduced by any person, nor be distributed to any person other than its original recipient. Crédit Mutuel-CIC and BFCM take no responsibility for the use of these materials by any such person
• This presentation is not an offer to sell or the solicitation of an offer to purchase any notes and no part of it shall form the basis of or be relied upon in connection with any contract or commitment whatsoever
• Limited review for H1 2012 financial data

Investor Presentation – Nov 2012 3
Origins of Crédit Mutuel
Cooperative roots
> At the end of the 19th century, Frédéric-Guillaume Raiffeisen (1818-1888) elaborated a new concept to fight against the poverty of farmers and handworkers
> He imagined and encouraged the creation of mutual local banks managing the deposits and loans of their members, financing the local farming sector and development of new technologies, under the responsibility of the community members
The framework of the Crédit Mutuel is founded:
> 1882, creation of the first Caisse de Crédit Mutuel in Alsace (North-Eastern part of France)
> Loans are granted only to members
> Each member of the Caisse has only one vote
> The elected members are volonteers, not remunerated (pro-bono)
> The financial surplus is not distributed to the members but placed into a non distributable reserve
These principles still apply today
> Crédit Mutuel is a co-operative group at the service of its members and clients
> Which promotes a rationale development

Investor Presentation – Nov 2012 4
1. Crédit Mutuel-CIC : a cooperative Group
2. Activity, Results and Risks
3. Asset Portfolio : a moderate risk profile
4. High level of capitalisation
5. Proven and solid liquidity
Appendices

Investor Presentation – Nov 2012 5
Crédit Mutuel-CIC Group: a cooperative group 1.

Investor Presentation – Nov 2012 6
About Crédit Mutuel-CIC Group
A cooperative bank-insurance group
23.7 million clients, with a strong member-clients base
89%* of the NBI in bank-insurance
93%* of NBI in France, Germany, Switzerland and Luxemburg
A major player in France
Top 3 in: home loans, consumer finance, SMEs
2nd in: electronic banking & IT and farming sector
1st bank insurer for non-life insurance
Pioneer in phone financial services
Leader in alarm systems
Gradual European growth well under control
Solid positions in Germany, Switzerland and Luxemburg
Gradual development in Spain in retail banking
Top 4 in consumer finance in Europe
Strong capacity to generate recurrent profits
Solid and dynamic franchise
€ 1.8 Bn net results in FY 2011
€ 0.9 Bn net results in H1 2012
High level of capitalisation
13% T1 as at June 2012
Strong capitalisation of results
Active liquidity management
One of the best credit ratings in Europe
Moody’s S&P Fitch Ratings
Short term P-1 A-1 F1+
Long term Aa3 A+ A+
Outlook Negative Negative Stable
since Nov 2012 Oct 2012 Oct 2012
* : excl. Holding co. expenses

Investor Presentation – Nov 2012 7
Banque Fédérative du Crédit Mutuel (BFCM)
A cooperative banking group
CM11-CIC group – June 2012
elect their representatives own the “Caisses de Crédit Mutuel ”
- funding arm of the Group
- manages the group’s liquidity
- Unique issuer of the Group
on capital markets
The Caisse Fédérale de Crédit Mutuel (CFdeCM)
4,6 million members stakeholders
own the capital of their jointly owned bank
CFdeCM and the CCM share a unique banking license
1,348 Caisses de Crédit Mutuel (CCM)
The CFdeCM owns 92,81 % of Banque Fédérative du Crédit Mutuel
Holding company
23,7 million customers 4,6 million members stakeholders 4,638 branches 16,139 non executive directors 65,848 employees

Investor Presentation – Nov 2012 8
20 %
Caisses 82 %
50 %
(Espagne)
* = CM-CIC…
Holding, tête de réseau
Réseau Ile-de-France Métiers spécialisés
* Asset Management
* Bail
* Épargne Salariale
* Gestion
* Factor
* Securities
* Titres
* Aidexport
BECM
Groupe SOFEMO
Filaction
ESN
C2C, Cartes et Crédits à
la Consommation
Euro Information
EID - EIP
EIS - Sicorfé
EP Surveillance
EIDS
ETS
Euro GDS
Euro P3C
Euro TVS
EurAfric Information
IID / DPS
Keynectis
CardProcess
NRJ Mobile
Axxès
EP Services
EII (EuroInformation Int.)
Factor Soft
GACM
ACM Vie SAM
ACM Vie SA
Sérénis Vie
ICM Life
ACM IARD
Sérénis Assurances
Partners Assurances
ACM Ré
ACM Services
Procourtage
Atlancourtage
AMCI
ACMN IARD
RACC Seguros
RMA-Watanya
Astree
Desjardins
* Aménagement foncier (Sarest)
* Ataraxia (Promotion immobilière)
* Participations
immobilières (Soparim)
* Réalisations
immobilières (Sofedim)
* Agence Immobilière (Afedim)
* Gestion immobilière
* Capital Finance
93 %
Technologie Assurance Immobilier Financier Gestion privée
100 %
100 %
100 %
51 %
93 %
Nord
CIC Nord Ouest
100 %
100 %
100 %
100 % Sud Est
CIC Lyonnaise
de banque
Sud Ouest
CIC Sud Ouest
Ouest
CIC Ouest
Est
CIC Est
25 %
11 Fédérations Adhésion
Caisses de
Crédit Mutuel des
11 Fédérations :
Capital dévpt
Caisse Fédérale
de Crédit Mutuel
(Allemagne)
6,60%
4,5 %
50 %
Banque Fédérative du Crédit Mutuel
(BFCM)
CIC Banque Privée
CIC Banque
Transatlantique (France, Luxembourg,
Belgique, Singapour,
Montréal)
Banque de
Luxembourg
CIC Suisse
Banque Pasche
Dubly Douilhet
Sud Est
Midi Atlantique
Île-de-France
Savoie-Mont Blanc
Loire Atl. Centre Ouest
Centre Est Europe
Centre
Méditerranéen
Dauphiné Vivarais
Normandie
6 %
Anjou
Groupe CM11-CIC July 2012 50 %
Caisses
Régionales et Caisses locales
* Lease
CMH
ACM 18 %
Crédit Mutuel – CIC
Home Loan SFH

Investor Presentation – Nov 2012 9
Crédit Mutuel-CIC Group: CM11-CIC : Gradual European growth well under control

Investor Presentation – Nov 2012 10
Activity, Results and Risks
2.

Investor Presentation – Nov 2012 11
100
287 297
100
150
200
250
300
350
31/12/2007 31/12/2008 31/12/2009 31/12/2010 31/12/2011 30/06/2012
100
136 138
100
105
110
115
120
125
130
135
140
145
31/12/2007 31/12/2008 31/12/2009 31/12/2010 31/12/2011 30/06/2012
A dynamic development
Number of customers Index 100 in 2007
23,7 million customers
Number of branches & agencies Index 100 in 2007
4 638 Branches
Loans 2010-H1 2012
Savings 2010-H1 2012
€Bn
229
263 269
277
318 330

Investor Presentation – Nov 2012 12
Pioneer and major player in banking, insurance and technological services
Insurance contracts Index 100 in 2007
24.4 million contracts
Insurance Complete range of life and non-life insurance products French pioneer in bank-insurance : first bank-insurer in
non-life insurance and fifth in life insurance 7 million customers 24,4 million contracts as at Dec 2011
Electronic banking Second bank in electronic banking More than 2 billion transactions per year Technical service provider for other banks or major
corporations
Telephony Pioneer in mobile telephony bank services with a target
of contactless payment Sales have risen from € 31 mio in 2007 to € 321 mio in 2011
Remote contact offering For 90% of customer transactions
Home alarm system
French leader in “ home CCTV “with 260.600 customers
House sales Promoting the cross-selling of products and services
(loans, insurance, protection against theft, etc.)
Mobile telephony Index 100 in 2007
1,1 million
CCTV number of clients Index 100 in 2007
260.600

Investor Presentation – Nov 2012 13
A constant growth for loans and deposits while reducing the market funding exposure
Crédit Mutuel-CIC Group: Activity, Results and Risks
Good profitability driven by a solid franchise in retail bankinsurance
Good risk control representing 27% of EBITDA
Total balance sheet : € 483 Bn (Vs € 413 Bn in 2007)
Bank-insurance NBI represents 89% of H1 2012 consolidated NBI
The cost to income ratio of 64,8% proves an operating efficiency
(Excluding SFEF € 4 Bn)

Investor Presentation – Nov 2012 14
89% of the consolidated NBI comes from bank-insurance activities
bank-insurance: 89% * of H1 12 consolidated NBI Including private banking excl. holding co. expenses
Retail Banking 49%
Insurance 23%
Private Banking
5%
CIB 18%
Private Equity
5%
Retail Banking 74%
Insurance 11%
Private Banking
4% CIB 10% Private
Equity 1%
bank-insurance : 77% of H1 12 consolidated Net Profit Including private banking excl. holding co. expenses
Retail Banking activities, down due to market conditions, stays notably profitable
> NBI down 6,2% (down 7,9% in constant perimeter)
> Commercial dynamism offset by reductions in interest margins and commissions perceived
> Lower cost of risk
Good resistance of Insurance activities
> In a context of weaker demand for Insurance
> NBI down 3.7% excl. Greece
Strong performance of Private Banking activities
> a 7% drop in commissions compensated by a 21% raise in interest margin
CIB and PE still positive despite…
> … a difficult environment
> … a basis effect with a very good H1 2011
Investor Presentation – Nov 2012 15
Assets portfolio : moderate risk profile 3.

Investor Presentation – Nov 2012 16
H1 2012 Loans portfolio : € 268.8 Bn
A significant drop in doubtful debts :
1.49% vs 1.51% in H1 2011 vs 1.60% in 2010 (rounded on the chart at 1%)
CM-CIC 3rd biggest French home-loans provider with a market share of 20% (2011)
52% of outstanding loans: € 140 Bn
Equipment
17% of outstanding loans : € 45 Bn
4th biggest player in consumer finance in Europe
11% of outstanding loans :
€ 29 Bn
Overdrafts
3% of outstanding loans : € 8 Bn
(*)Net Doubtful loans
H1 2011
H1 2012

Investor Presentation – Nov 2012 17
Moderate exposure to Eurozone P.I.I.G.S’ govies Bank portfolio - as at June 2012
CM11-CIC is actively monitoring its exposure to the downside on Italy and Spain Almost 30% of the exposure to Italy matures in 2012 (including € 1,2 Bn in sept. 2012)
CM11-CIC Group, € mio as at June 2012 as at December 2011
Greece 0 206
Portugal 128 154
Ireland 102 99
Sub-total / Greece, Portugal, Ireland 230 459
Italy 4,676 4,495
Spain 214 261
Sub-total Italy and Spain 4,890 4,756

Investor Presentation – Nov 2012 18
Monitoring the Credit Risks
Slight decrease in the proportion of doubtful debts
Centralised management of risks
CIB: Reduction in equity allocated to market activities
French “Best-in-class” based on cost of risk/gross operating income
% - Cost of risk/EBITDA
*** Large companies + International (incl. foreign branches) + Specialized Financing (excl. CM-CIC Marchés)
** Excluding Targobank Germany, Cofidis and the banking network subsidiaries
* Excluding Impacts on Sovereign Greek Bonds
Client Cost of Risk, in bp * 2009 2010 2011 H1 2012 Perimeter CM4-CIC CM5-CIC CM10-CIC CM11-CIC
Retail banking** 34bps 18bps 12bps 14bps
Individuals 11bps 11bps 7bps 6bps
Home Loans 10bps 10bps 4bps 4bps
Retailer. Craftsmen…. 57bps 41bps 24bps 25bps
SME 88bps 38bps 32bps 26bps
CIB*** 93bps 22bps 19bps 49bps
Private Banking -6bps 26bps 10bps 1bp
Consumer Finance Targobank 372bps 302bps 192bps 187bps
Consumer Finance Cofidis 547bps 553bps 448bps 417bps
Total Client Cost of Risk 77bps 54bps 37bps 38bps
Doubtful loans & credit reserves - € bn
2009 2010 2011 H1 2012
Gross costumer loans outstanding 218 229,3 263,9 269
Non Performing Loans (NPL) 10.5 10,9 11,3 11,3
Loans loss reserves 6,6 7,2 7,5 7,5
Doubtful loan ratio 4.7% 4.6% 4,2% 4,1%
Stock of provisions to NPL 63,0% 66,3% 66,7% 66,5%
27,7 %

Investor Presentation – Nov 2012 19
A high level of capitalisation 4.

Investor Presentation – Nov 2012 20
Group’s equity capital : 13% T1 ratio
Due to cooperative status, core capital is constituted by members shares and reserves
Each member can hold up to € 50,000 Average investment is € 16,000
Low pay-out policy and automatic capitalization more than 90% of annual net profit are locked in by- law non-
distributable reserves
Regulatory capital Basel II - June 2012 13 % tier-1 € 22.3 Bn Reg capital
CM11-CIC has significant room to improve its ratios to comply on Basel III requirements
Approval of the Basel corporate portfolio for IRB (internal ratings-based approach)
Total Tier 1 Capital (€ bn)
Investor Presentation – Nov 2012 21
Proven & solid liquidity 5.

Investor Presentation – Nov 2012 22
Geographic area
Currencies
Products
Short Term : 37%
MLT Unsecured : 37%
The Group has a solid deposits base :
Retail banking business financed by client deposits
EUR 208 bn in client deposits as at June 2012, + € 21.5bn yoy ( 10,3% constant scope)
The deposit base represents 42 % of the balance sheet
The Group has access to a stable source of funding :
BFCM issues for the CM11-CIC network
Significant reserves of financial savings by clients
Numerous and diversified debt programs
Crédit Mutuel-CIC Group: Proven and solid liquidity
As at June 2012

Investor Presentation – Nov 2012 23
AA BFCM Size
Currency
Size Format
Maturity
Public Senior
Unsecured Bonds
(‘000 000) (‘000 000) (years to maturity)
Currency
issue €
janv-11 1 750 EUR 1 750 2Y juil-13
mars-11 500 EUR 500 2Y juil-13
juil-11 12 300 JPY 108 2Y juil-13
juil-11 3 500 JPY 31 3Y juil-14
juil-11 11 200 JPY 98 5Y juil-16
TOTAL 2 487
janv-12 40,0 EUR 40 1 juil-13
janv-12 125,0 EUR 125 1 juil-13
janv-12 210,0 EUR 210 1 juil-13
janv-12 1 830,0 JPY 19 1 juil-13
janv-12 250,0 EUR 250 1 juil-13
janv-12 150,0 EUR 150 2 Feb-14
janv-12 100,0 EUR 100 1 juil-13
Feb-12 150,0 EUR 150 1 janv-13
mars-12 100,0 EUR 100 2 Feb-14
Aug-12 750 EUR 750 5 juin-17
Aug-12 900 EUR 900 12 Aug-22
Sept-12 14 000 JPY 140 2 Sept-14
Sept- 12 4 800 JPY 48 3 Sept-15
Sept-12 2 900 JPY 29 5 Sept-17
AAA CM-CIC HL SHF
Main Issues
Size (‘000.000)
Currency Format
(years to maturity)
Maturity
Jan-11 1 000 EUR 12 Jan-23
Jan-11 500 EUR 9,5 Jul-20
Feb-11 250 EUR 12 Feb-23
Feb-11 1 500 EUR 3 Feb-14
Mar-11 1 500 EUR 10 Mar-21
Jul-11 1 500 EUR 5 Jul-16
Jul-11 400 EUR 11,5 Dec-23
TOTAL 6 650
Jan-12 1 250 EUR 12 Jan-24 Jan-12 68 EUR 2 Jan-14
Jan-12 100 EUR 4 Jul-16
Mar-12 300 EUR 5 Mar-17
Mar-12 300 EUR 6 Mar-18
TOTAL 2 018
Covered Bonds
Medium Long Term issuing policy
2011 -2012 Senior Bonds – (major issues for 2012)
MLT debt issue policy from Jan. to Aug. 2012
€ 11,5 bn already raised (29% collateralised issues,
67% unsecured issues and 4% through retail network issues)
€ 9,5 bn debt maturing in 2012
66% MLT funding vs 34% ST (repo excluded)

Investor Presentation – Nov 2012 24
CM11-CIC and Basel III requirements as at June 2012
Improving Loan to deposit ratio (1,32 at june 30th 2012 vs 1,36 at dec 31st 2011)
Reduction of wholesale debt over the past 2 years
€ 79 Bn liquid assets covering 168% of the group’s short term funding
as at June 2012 € Bn
16
47
Potential collateral
Liquid assets buffer € Bn
Short Term Funding € Bn
Excess liquidity 48
79
ECB Eligible assets
Customer deposits
208*
* : incl. SFEF
LT funding 67
Repo 15
ST funding 32
Market funding/Total Funding
Short-Term market funding/Market funding
LT Market
Funding
€ 67 Bn
59%
ST Market
Funding
€ 47 Bn
41%
Customer
Deposit
€ 208 Bn
65%
Market
Funding
€ 114 Bn
35%

Investor Presentation – Nov 2012 25
Conclusion
• A group with a strong identity recognised for its robustness
• An image of a safe retail bank reinforced during the financial crisis
• A business model used to help member-clients, combining constant progress with prudence
• A well-balanced asset portfolio with high quality standards
• A strong level of capitalisation, Tier One of 13%
• A good access to liquidity both internally and externally
• With human, material and financial resources to pursue growth

Investor Presentation – Sept 2012 26
Bank of the year FRANCE 2011, The Banker Dec 2011 (Bank of the year FRANCE 2010, The Banker Dec 2010)
Top 5 best capitalised bank in Eurozone , S&P 2011
Best Developed Market Banks in France, Global Finance March 2012
"We recognize these banks for their outstanding accomplishments," says Global Finance's publisher, Joseph D. Giarraputo. "Global financial markets are extremely difficult and conditions in each market may have differed but the winning banks were all noteworthy in their dedication to satisfying their customers' needs.”
https://www.creditmutuel.fr/groupecm/fr/images/fichier_pdf/communique_presse/Best_Banks_Developed_2012.pdf
Group Awards

Investor Presentation – Nov 2012 27
Appendices

Investor Presentation – Nov 2012 28
Consolidated account statements
H1 2012 CM11-CIC P&L (€ m) Retail Banking
Insurance Private banking
CIB Private Equity
Holding Interco TOTAL
NBI 4 356 639 248 562 72 243 (289) 5 831
% of consolidated NBI 71,2% 10,4% 4,1% 9,2% 1,2% 4,0% 100,0%
Overheads (2 959) (186) (167) (154) (17) (586) 289 (3 780)
Cost-to-income ratio -67,9% -29,1% -67,3% -27,4% -23,6% -241,2% -64,8%
EBITDA 1 397 453 81 408 55 (344) 2 051
Cost of risk (456) 0 0 (49) 0 (63) 0
OPERATING PROFIT 941 453 81 359 55 (407) 1 482
Net gains/losses on other assets & equity accounted cies 6 5 7 (63) (46)
PRE TAX PROFIT 947 458 88 359 55 (470) 1 437
Income tax (329) (167) (21) (136) 1 131 (521)
NET PROFIT 618 290 67 223 56 (339) 916
H1-11 CM10-CIC P&L (€ m) Retail Banking
Insurance Private banking
CIB Private Equity
Holding Interco TOTAL
NBI 4 645 693 233 632 95 94 (296) 6 096
% of consolidated NBI 72,7% 10,8% 3,6% 9,9% 1,5% 1,5% 100,0%
Overheads (2 858) (188) (158) (143) (18) (509) 296 (3 579)
Cost-to-income ratio -61,5% -27,1% -67,8% -22,6% -18,9% -541,5% -58,7%
EBITDA 1 787 505 75 489 77 (415) 2 518
Cost of risk (459) (39) (48) (46) (86) (678)
OPERATING PROFIT 1 328 466 27 443 77 (501) 1 840
Net gains/losses on other assets & equity accounted cies 42 47 0 0 (38) 51
PRE TAX PROFIT 1 371 513 27 443 77 (540) 1 891
Income tax (452) (163) (6) (149) 0 145 (625)
NET PROFIT 919 350 21 293 77 (395) 1 266
Investor Presentation – Nov 2012 29
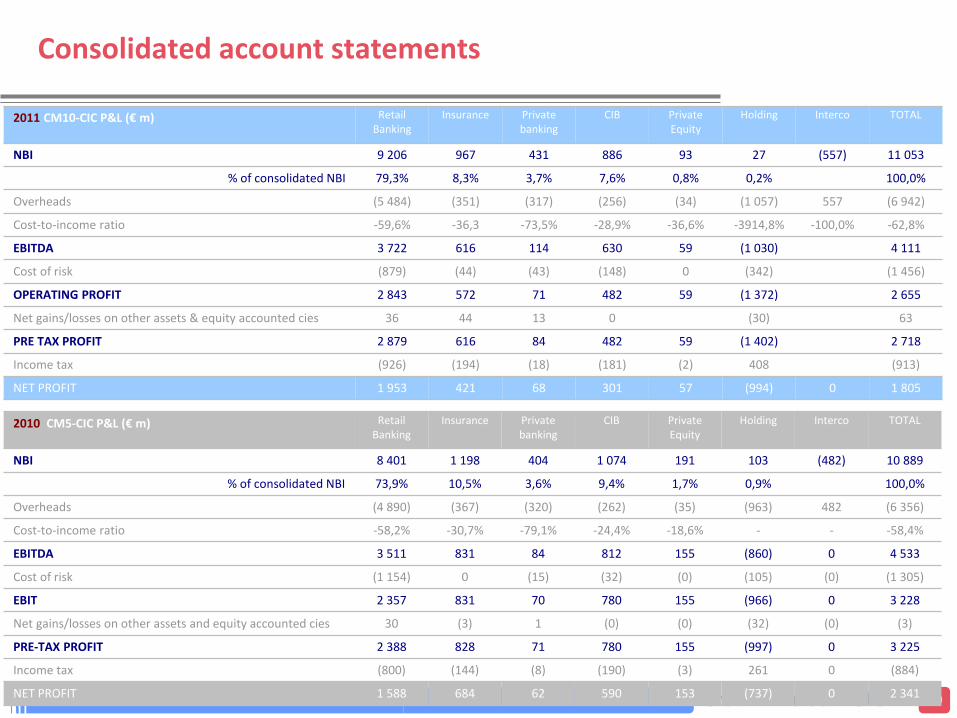
Consolidated account statements
2010 CM5-CIC P&L (€ m) Retail Banking
Insurance Private banking
CIB Private Equity
Holding Interco TOTAL
NBI 8 401 1 198 404 1 074 191 103 (482) 10 889
% of consolidated NBI 73,9% 10,5% 3,6% 9,4% 1,7% 0,9% 100,0%
Overheads (4 890) (367) (320) (262) (35) (963) 482 (6 356)
Cost-to-income ratio -58,2% -30,7% -79,1% -24,4% -18,6% - - -58,4%
EBITDA 3 511 831 84 812 155 (860) 0 4 533
Cost of risk (1 154) 0 (15) (32) (0) (105) (0) (1 305)
EBIT 2 357 831 70 780 155 (966) 0 3 228
Net gains/losses on other assets and equity accounted cies 30 (3) 1 (0) (0) (32) (0) (3)
PRE-TAX PROFIT 2 388 828 71 780 155 (997) 0 3 225
Income tax (800) (144) (8) (190) (3) 261 0 (884)
NET PROFIT 1 588 684 62 590 153 (737) 0 2 341
2011 CM10-CIC P&L (€ m) Retail Banking
Insurance Private banking
CIB Private Equity
Holding Interco TOTAL
NBI 9 206 967 431 886 93 27 (557) 11 053
% of consolidated NBI 79,3% 8,3% 3,7% 7,6% 0,8% 0,2% 100,0%
Overheads (5 484) (351) (317) (256) (34) (1 057) 557 (6 942)
Cost-to-income ratio -59,6% -36,3 -73,5% -28,9% -36,6% -3914,8% -100,0% -62,8%
EBITDA 3 722 616 114 630 59 (1 030) 4 111
Cost of risk (879) (44) (43) (148) 0 (342) (1 456)
OPERATING PROFIT 2 843 572 71 482 59 (1 372) 2 655
Net gains/losses on other assets & equity accounted cies 36 44 13 0 (30) 63
PRE TAX PROFIT 2 879 616 84 482 59 (1 402) 2 718
Income tax (926) (194) (18) (181) (2) 408 (913)
NET PROFIT 1 953 421 68 301 57 (994) 0 1 805

Investor Presentation – Nov 2012 30
• Christian Klein, Deputy CEO
[email protected] / T : +33 (0) 1 45 96 79 01
• Christian Ander, Director, Head of Funding & Capital Raising
[email protected] / T : +33 (0) 1 45 96 79 20
• Jerome Linder, Head of FIG
[email protected] / T : +33 (0) 1 40 16 28 30
• Eric Cuzzucoli, Head of Funding
[email protected] / T : +33 (0) 1 40 16 28 11
• Sandrine Cao-Dac Viola, Head of Investor Relations
[email protected] / T : +33 (0) 1 40 16 28 13
• David Herault, Senior Vice President Investor Relations
[email protected]/ T : +33 (0) 1 45 96 78 07
Contact details
www.bfcm.creditmutuel.fr
www.creditmutuelcic-SFH.com