bar graph with quarterly average in...
TRANSCRIPT

Bar Graph With Quarterly
Average in Minitab®
A “How To” Worked Example
M. A. Sibley Consulting – All Rights Reserved Bar Line Graph in Minitab 1

Our Data
Here is part of our example data:
M. A. Sibley Consulting – All Rights Reserved Bar Line Graph in Minitab 2
This data shows Natural Gas Consumption for my house and the
number of degrees days for the corresponding period.
We want to create some new variables based on this information.

Bar Graph with Average Line
M. A. Sibley Consulting – All Rights Reserved Bar Line Graph in Minitab 3
First we round the dates to the start of the
month and also the start of the quarter.

Bar Graph with Average Line
M. A. Sibley Consulting – All Rights Reserved Bar Line Graph in Minitab 4
Here is the result:
Note that 3 months are in each quarter. (Obviously!)

Bar Graph with Average Line
M. A. Sibley Consulting – All Rights Reserved Bar Line Graph in Minitab 5
Next we want the average consumption for each Quarter:

Bar Graph with Average Line
M. A. Sibley Consulting – All Rights Reserved Bar Line Graph in Minitab 6
This has put the average MetersCubed for the Quarter beside the
corresponding quarter on each line.
Mean 1 is a non descriptive name so we interactively change it to QtrAvg

Bar Graph with Average Line
M. A. Sibley Consulting – All Rights Reserved Bar Line Graph in Minitab 7
Graph > Scatterplots:
Bar Graph with Average Line
M. A. Sibley Consulting – All Rights Reserved Bar Line Graph in Minitab 8
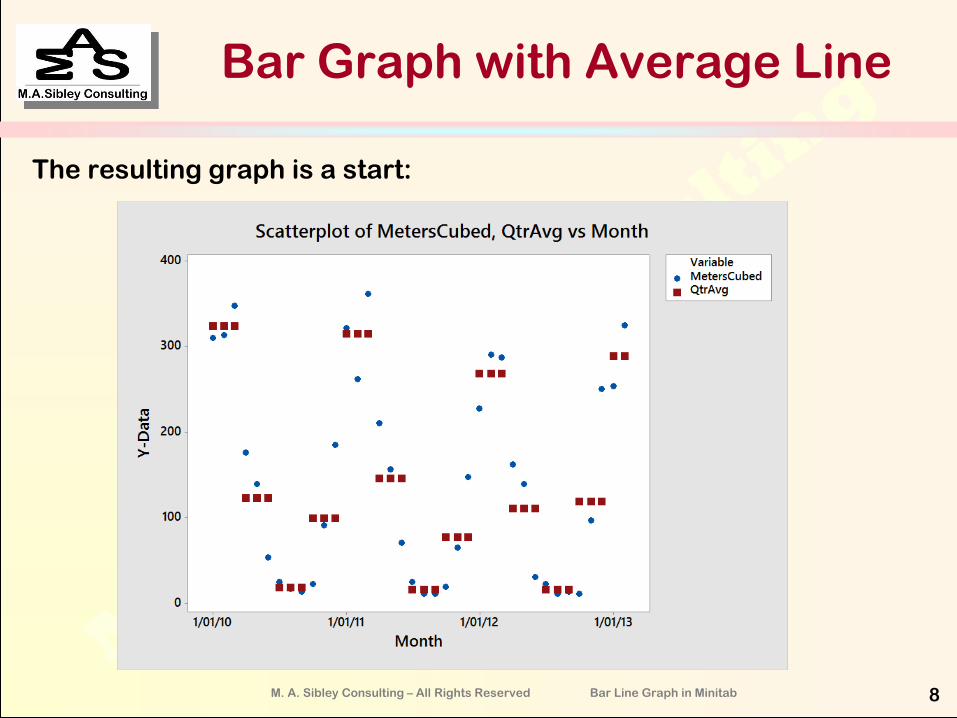
The resulting graph is a start:
Bar Graph with Average Line
M. A. Sibley Consulting – All Rights Reserved Bar Line Graph in Minitab 9
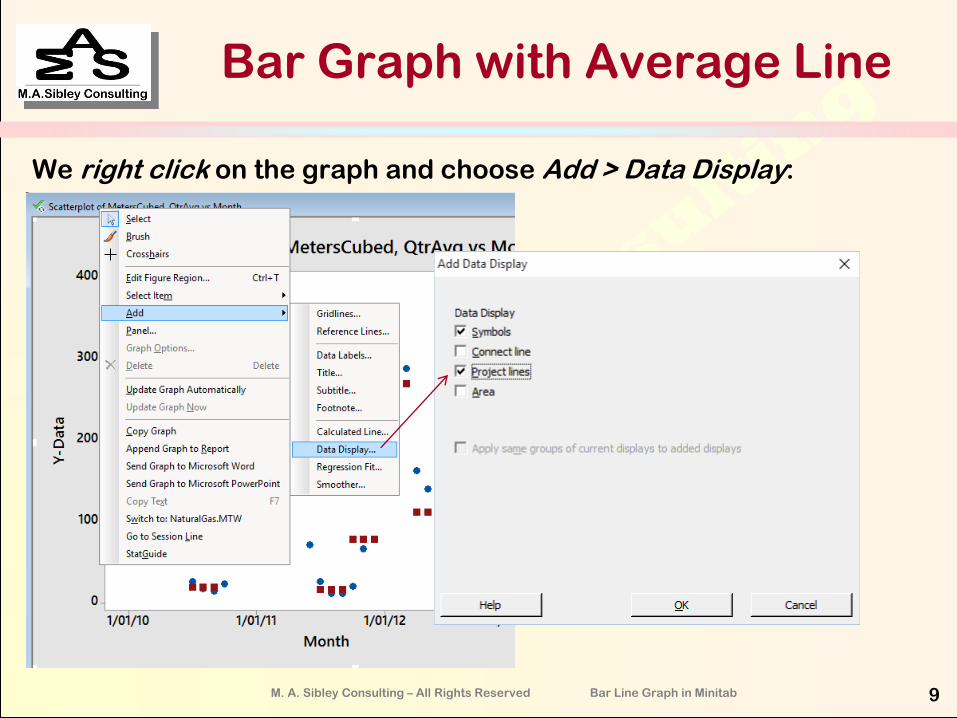
We right click on the graph and choose Add > Data Display:
Bar Graph with Average Line
M. A. Sibley Consulting – All Rights Reserved Bar Line Graph in Minitab 10
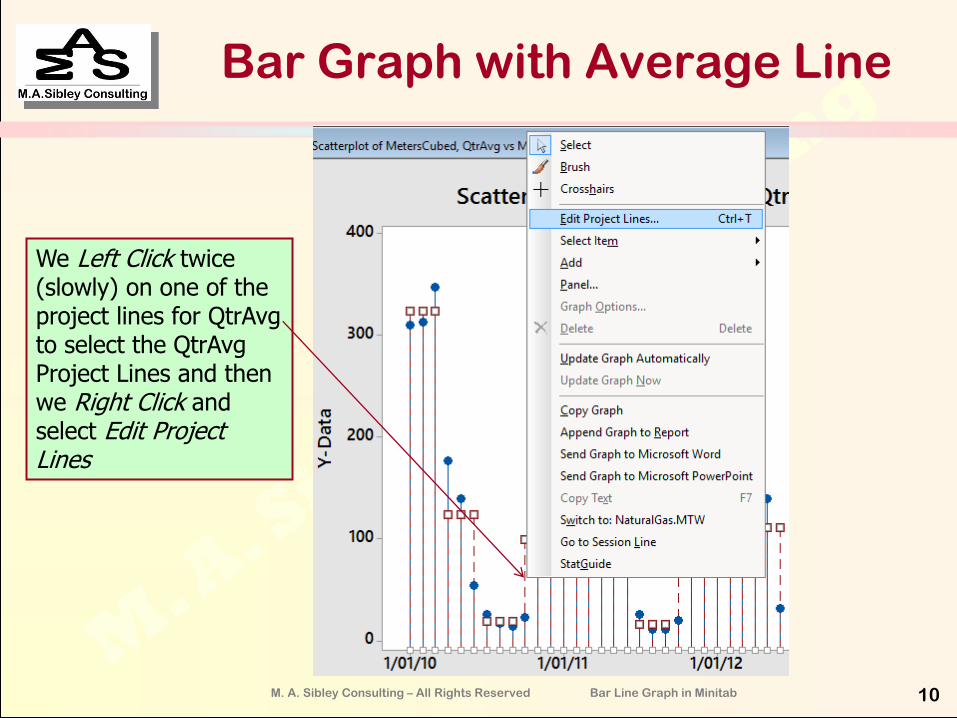
We Left Click twice (slowly) on one of the project lines for QtrAvg to select the QtrAvg Project Lines and then we Right Click and select Edit Project Lines
Bar Graph with Average Line
M. A. Sibley Consulting – All Rights Reserved Bar Line Graph in Minitab 11
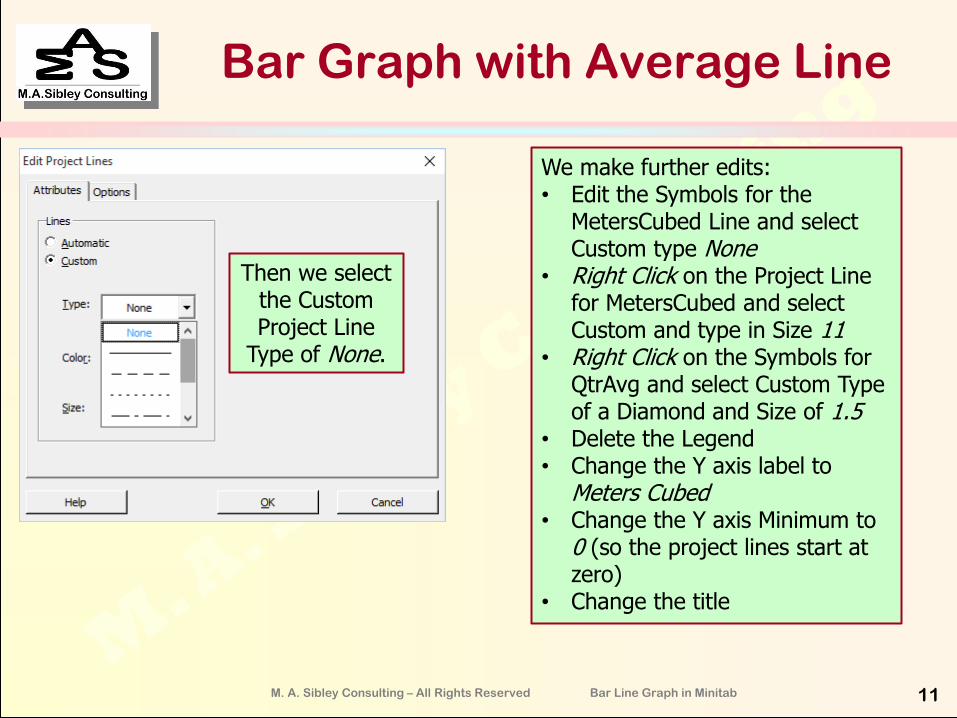
We make further edits: • Edit the Symbols for the
MetersCubed Line and select Custom type None
• Right Click on the Project Line for MetersCubed and select Custom and type in Size 11
• Right Click on the Symbols for QtrAvg and select Custom Type of a Diamond and Size of 1.5
• Delete the Legend • Change the Y axis label to
Meters Cubed • Change the Y axis Minimum to
0 (so the project lines start at zero)
• Change the title
Then we select the Custom Project Line
Type of None.

Bar Graph with Average Line
M. A. Sibley Consulting – All Rights Reserved Bar Line Graph in Minitab 12
We don’t have an Quarterly
Average line per se, but this graph
gets the point across.
Using the techniques shown elsewhere on this
web site you could capture the
macro code so that it is easy to
recreate this graph.

Bar Graph with Average Line
M. A. Sibley Consulting – All Rights Reserved Bar Line Graph in Minitab 13
With a little macro programming we can get a nicer
result.