barclays mlp corporate access day - mplx · barclays mlp corporate access day ... including...
TRANSCRIPT
Barclays MLP Corporate Access Day
March 4, 2015
Forward‐Looking Statements
This presentation contains forward-looking statements within the meaning of federal securities laws regarding both MPLX and MPC. These forward-looking statements
relate to, among other things, expectations, estimates and projections concerning the business and operations of MPLX and MPC. You can identify forward-looking
statements by words such as "anticipate," "believe," "estimate," "objective," "expect," "forecast," “plan,” "project," "poten tial," “target,” "could," "may," "should," "would,"
"will" or other similar expressions that convey the uncertainty of future events or outcomes. Such forward-looking statements are not guarantees of future performance
and are subject to risks, uncertainties and other factors, some of which are beyond the issuer's control and are difficult to predict. Factors that could cause MPLX’s
actual results to differ materially from those in the forward-looking statements include: the adequacy of our capital resources and liquidity, including, but not limited to,
availability of sufficient cash flow to pay distributions and execute our business plan; the timing and extent of changes in commodity prices and demand for crude oil,
refined products, feedstocks or other hydrocarbon-based products; volatility in and/or degradation of market and industry conditions; completion of pipeline capacity by
our competitors; disruptions due to equipment interruption or failure, including electrical shortages and power grid failures; the suspension, reduction or termination of
MPC's obligations under our commercial agreements; our ability to successfully implement our growth plan, whether through organic growth or acquisitions;
modifications to earnings and distribution growth objectives; federal and state environmental, economic, health and safety, energy and other policies and regulations;
changes to MPLX’s capital plan; other risk factors inherent to our industry; and the factors set forth under the heading "Risk Factors" in MPLX's Annual Report on Form
10-K for the year ended Dec. 31, 2014, filed with the Securities and Exchange Commission (SEC). Factors that could cause MPC’s actual results to differ materially
from those in the forward-looking statements include: changes to the expected construction costs and timing of pipeline projects; volatility in and/or degradation of
market and industry conditions; the availability and pricing of crude oil and other feedstocks; slower growth in domestic and Canadian crude supply; an easing or lifting
of the U.S. crude oil export ban; completion of pipeline capacity to areas outside the U.S. Midwest; consumer demand for refined products; transportation logistics; the
reliability of processing units and other equipment; MPC’s ability to successfully implement growth opportunities; modifications to MPLX earnings and distribution
growth objectives; impacts from MPC’s repurchases of shares of MPC common stock under its share repurchase authorizations, including the timing and amounts of
any common stock repurchases; federal and state environmental, economic, health and safety, energy and other policies and regulations ; MPC’s ability to successfully
integrate the acquired Hess retail operations and achieve the strategic and other expected objectives relating to the acquisition; changes to MPC’s capital plan; other
risk factors inherent to MPC’s industry; and the factors set forth under the heading "Risk Factors" in MPC's Annual Report on Form 10-K for the year ended Dec. 31,
2014, filed with SEC. Unpredictable or unknown factors not discussed here, in MPLX’s Form 10-K or in MPC’s Form 10-K could also have material adverse effects on
forward-looking statements.
Non GAAP Financial Measures
EBITDA, free cash flow and distributable cash flow are non-GAAP financial measures provided in this presentation. EBITDA, free cash flow and distributable cash flow
reconciliations to the nearest GAAP financial measure are included in the Appendix to this presentation. EBITDA, free cash flow and distributable cash flow are not defined by
GAAP and should not be considered in isolation or as an alternative to net income, net cash provided by (used in) operating activities or other financial measures prepared in accordance with GAAP.
2
Key Investment Highlights
Announced plans to substantially accelerate the growth of MPLX
Accelerated growth supports significant increase in distribution growth rate
Substantial portfolio of MLP-qualifying assets held by sponsor
Strategically located, high-quality, well-maintained assets
Predictable cash flows with fee-based revenues and minimal direct commodity
exposure
Visibility to significant organic growth in addition to potential drop portfolio
Strong financial and liquidity position
3
Substantial Acceleration of MPLX Growth
Acquired additional 30.5% interest in MPLX Pipe Line Holdings on
December 1, 2014 for $800 MM (represents ~10.0x multiple of NTM EBITDA)
Distributable cash flow growth supports accelerated distribution growth over the next
five years
Rapidly changing midstream business environment creates multiple opportunities where
size matters
Accelerated growth provides increased size and scale – Enhances MPLX’s capacity to undertake projects independently
– Better access to capital markets
Sponsor’s acquisition of Hess retail has expanded its strategic options and increased
qualifying income for fuels distribution
MPLX expected to evolve into large-cap, diversified logistics MLP
4

Substantial Acceleration of MPLX Growth
~$450 MM of run-rate Adjusted EBITDA by
end of 2015
Annual LP distribution growth rate to average
mid-20% over next five years
– ~29% distribution growth for 2015
Executed first step of accelerated growth
strategy
MPC has $1.6 B of MLP-eligible EBITDA
5
111
170
450
0
100
200
300
400
500
$M
M
Adjusted EBITDA Attributable to MPLX
>2x 4Q 2014 EBITDA
Annualized
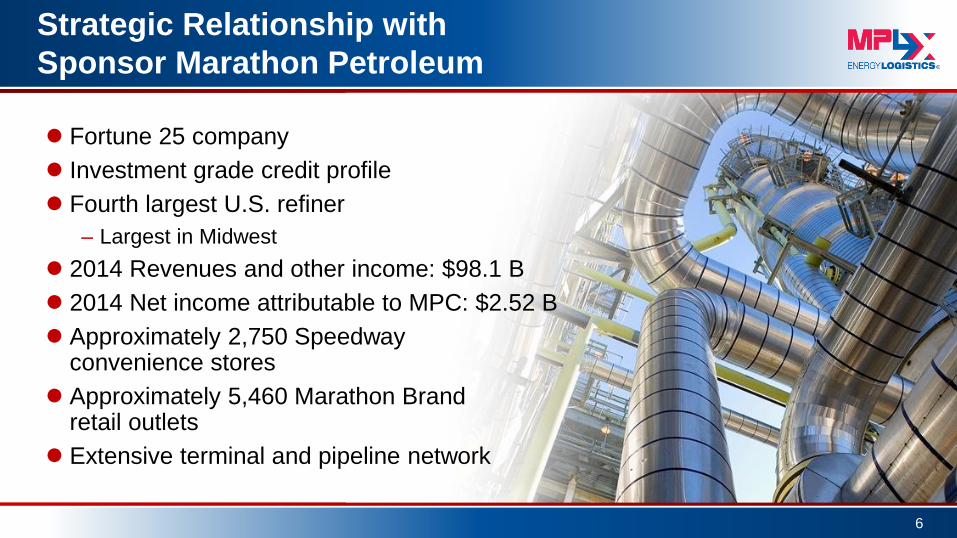
Strategic Relationship with
Sponsor Marathon Petroleum
Fortune 25 company
Investment grade credit profile
Fourth largest U.S. refiner
– Largest in Midwest
2014 Revenues and other income: $98.1 B
2014 Net income attributable to MPC: $2.52 B
Approximately 2,750 Speedway convenience stores
Approximately 5,460 Marathon Brand retail outlets
Extensive terminal and pipeline network
6
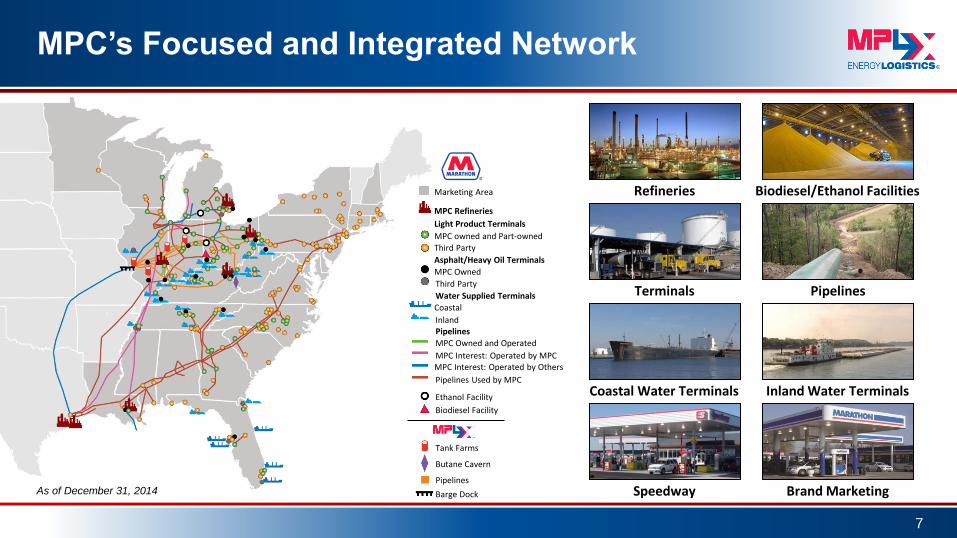
MPC’s Focused and Integrated Network
7
As of December 31, 2014
Marketing Area
MPC Refineries
Light Product Terminals
MPC owned and Part-owned
Third Party
Asphalt/Heavy Oil Terminals
MPC Owned
Third Party
Water Supplied Terminals
Coastal
Inland Pipelines
MPC Owned and Operated
MPC Interest: Operated by MPC MPC Interest: Operated by Others
Pipelines Used by MPC
Ethanol Facility
Biodiesel Facility
Tank Farms
Butane Cavern
Pipelines
Barge Dock
Pipelines Terminals
Coastal Water Terminals Inland Water Terminals
Refineries
Speedway Brand Marketing
Biodiesel/Ethanol Facilities
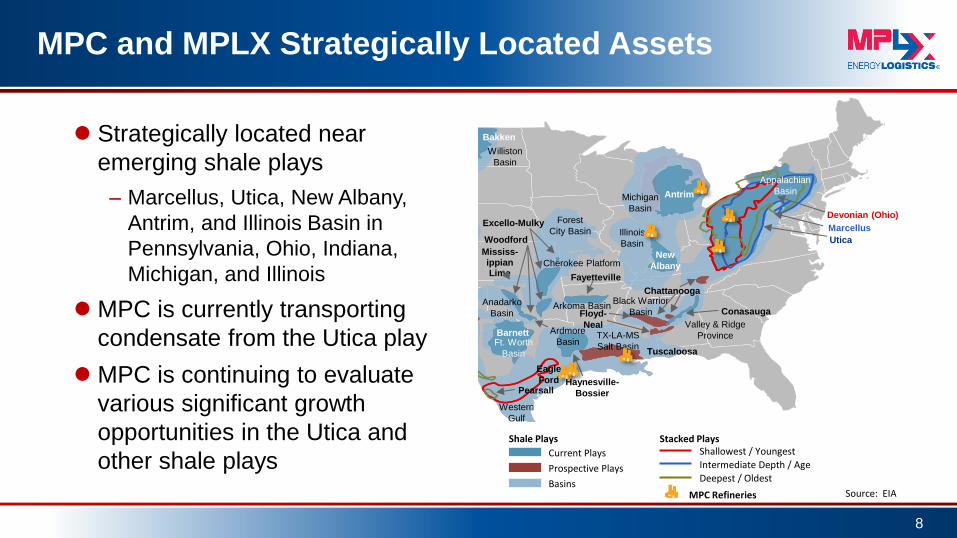
MPC and MPLX Strategically Located Assets
Strategically located near
emerging shale plays
– Marcellus, Utica, New Albany,
Antrim, and Illinois Basin in
Pennsylvania, Ohio, Indiana,
Michigan, and Illinois
MPC is currently transporting
condensate from the Utica play
MPC is continuing to evaluate
various significant growth
opportunities in the Utica and
other shale plays
8
Bakken
Ardmore
Basin
Anadarko
Basin
Barnett
Pearsall
Eagle
Ford Haynesville-
Bossier
Ft. Worth
Basin
TX-LA-MS
Salt Basin Tuscaloosa
Floyd-
Neal
Woodford
Arkoma Basin
Fayetteville
Cherokee Platform
Excello-Mulky
Williston
Basin
Forest
City Basin Illinois
Basin
Michigan
Basin
Antrim
Appalachian
Basin
New
Albany
Chattanooga Black Warrior
Basin Conasauga
Valley & Ridge
Province
Devonian (Ohio)
Marcellus
Utica
Western
Gulf
Mississ- ippian Lime
Current Plays
Prospective Plays
Basins
Shale Plays Shallowest / Youngest
Intermediate Depth / Age
Deepest / Oldest
Stacked Plays
Source: EIA MPC Refineries
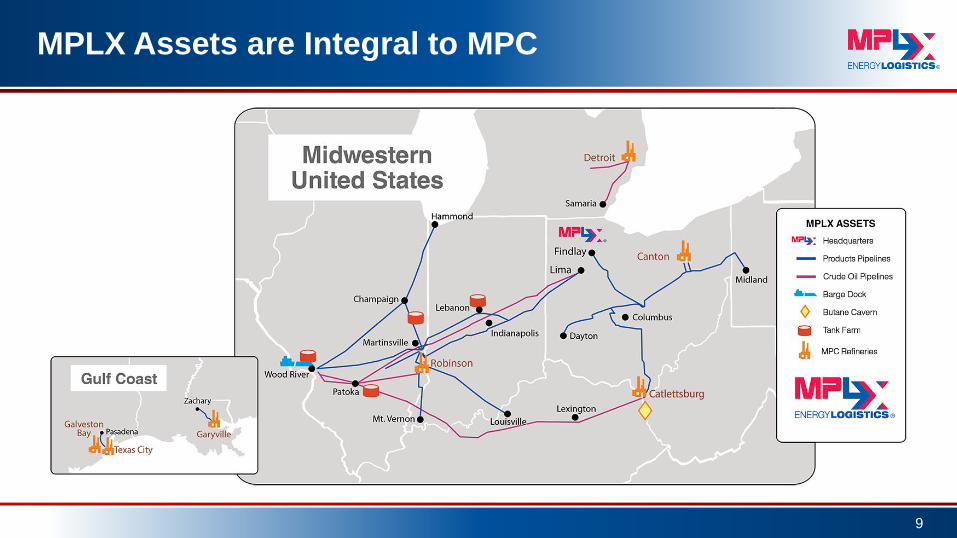
MPLX Assets are Integral to MPC
9
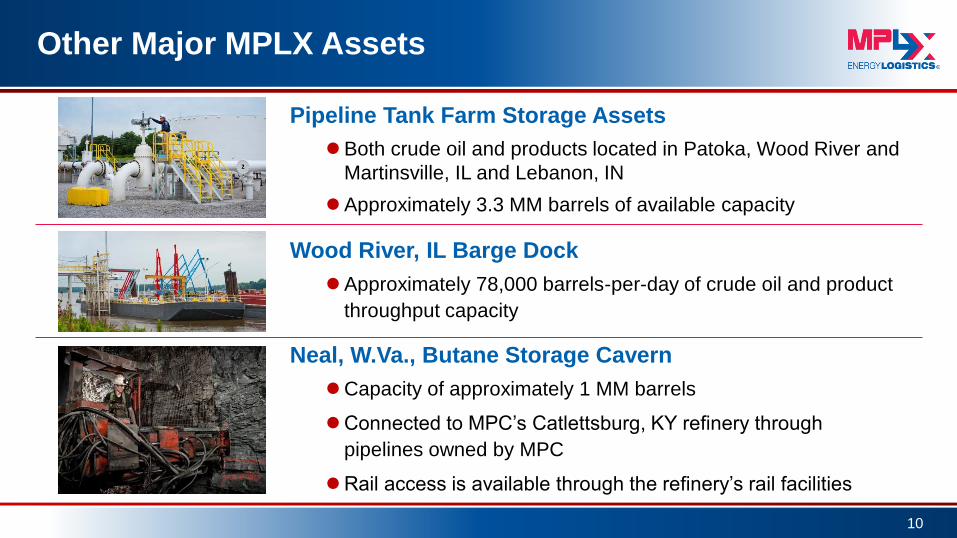
Other Major MPLX Assets
Pipeline Tank Farm Storage Assets
Both crude oil and products located in Patoka, Wood River and
Martinsville, IL and Lebanon, IN
Approximately 3.3 MM barrels of available capacity
10
Neal, W.Va., Butane Storage Cavern
Capacity of approximately 1 MM barrels
Connected to MPC’s Catlettsburg, KY refinery through
pipelines owned by MPC
Rail access is available through the refinery’s rail facilities
Wood River, IL Barge Dock
Approximately 78,000 barrels-per-day of crude oil and product
throughput capacity
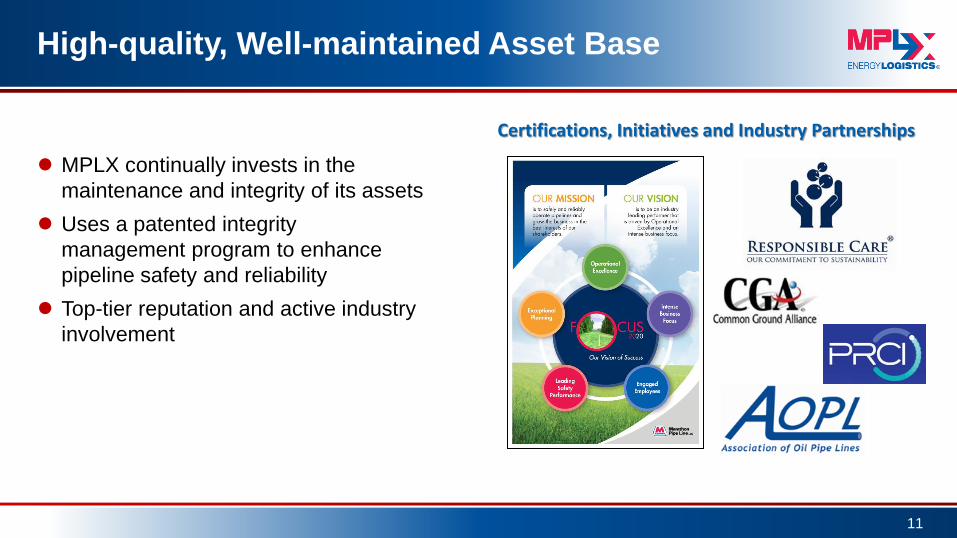
High-quality, Well-maintained Asset Base
MPLX continually invests in the
maintenance and integrity of its assets
Uses a patented integrity
management program to enhance
pipeline safety and reliability
Top-tier reputation and active industry
involvement
11
Certifications, Initiatives and Industry Partnerships

Significant Capital Plan
Major growth projects
– Cornerstone Pipeline and Utica build-out
– Patoka to Lima capacity expansion
– Robinson butane cavern
Maintenance capital
– 16% of 2014 Adjusted EBITDA
12
2015 Capital Plan $260 MM
Maintenance
$38 MM
Growth
$222 MM
71%
20%
9%
MPC Commited MPC Additional Third Party
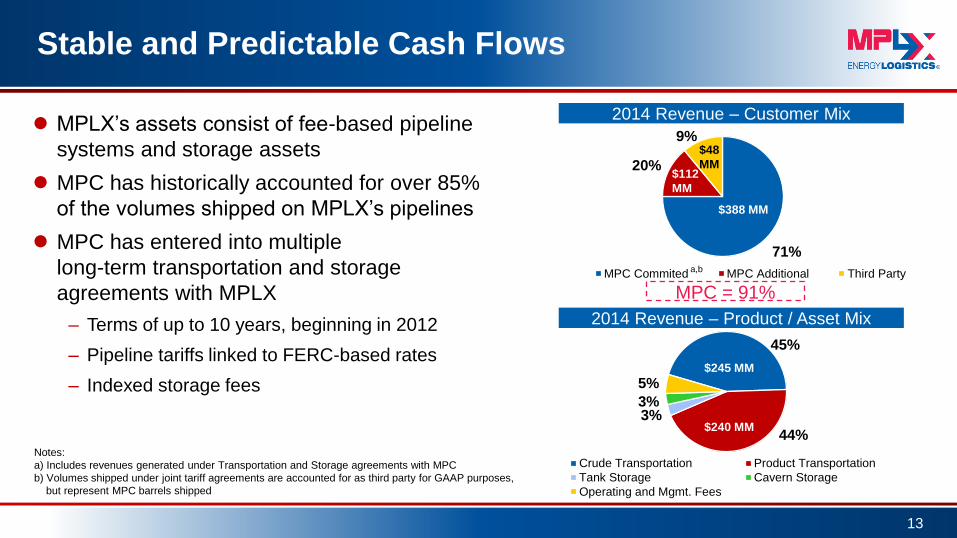
Stable and Predictable Cash Flows
MPLX’s assets consist of fee-based pipeline
systems and storage assets
MPC has historically accounted for over 85%
of the volumes shipped on MPLX’s pipelines
MPC has entered into multiple
long-term transportation and storage
agreements with MPLX
– Terms of up to 10 years, beginning in 2012
– Pipeline tariffs linked to FERC-based rates
– Indexed storage fees
13
2014 Revenue – Product / Asset Mix
2014 Revenue – Customer Mix
MPC = 91%
45%
44%
3% 3%
5%
Crude Transportation Product Transportation
Tank Storage Cavern Storage
Operating and Mgmt. Fees
$245 MM
$240 MM
$388 MM
$112
MM
$48
MM
a,b
Notes:
a) Includes revenues generated under Transportation and Storage agreements with MPC
b) Volumes shipped under joint tariff agreements are accounted for as third party for GAAP purposes,
but represent MPC barrels shipped

MPC’s Currently Identified Eligible MLP EBITDA
Sources of ~$1.6 B
14
Retained by MPC
● 59 MMBBL storage (tanks and caverns)
● 25 rail loading racks and 24 truck loading racks ● 7 owned and 11 non-owned docks
● 2 condensate splitter investments
● 27 owned and 2,183 leased
● 794 general service; 1,171 high pressure; 245 open-top hoppers
● ~ 5,400 miles of additional crude and products pipelines – Owns, leases or has an ownership interest in these pipelines
– 0.5% of MPLX Pipe Line Holdings LP
● Southern Access Extension, Sandpiper and Utica investments
Railcars
Pipelines
● 63 light product; ~20 MMBBL storage; 192 loading lanes
● 18 asphalt; ~5 MMBBL storage; 65 loading lanes Terminals
● 199 owned and 12 leased inland barges; 5.3 MMBBL capacity
● 18 owned and one leased inland towboats Marine
Refineries
● 20 B gallons of fuels distribution volume – Existing MPC and Speedway volumes; ~17 B gallons refined products
– Acquisition of Hess’ retail operations adds ~3 B gallons refined products
Fuels
Distribution
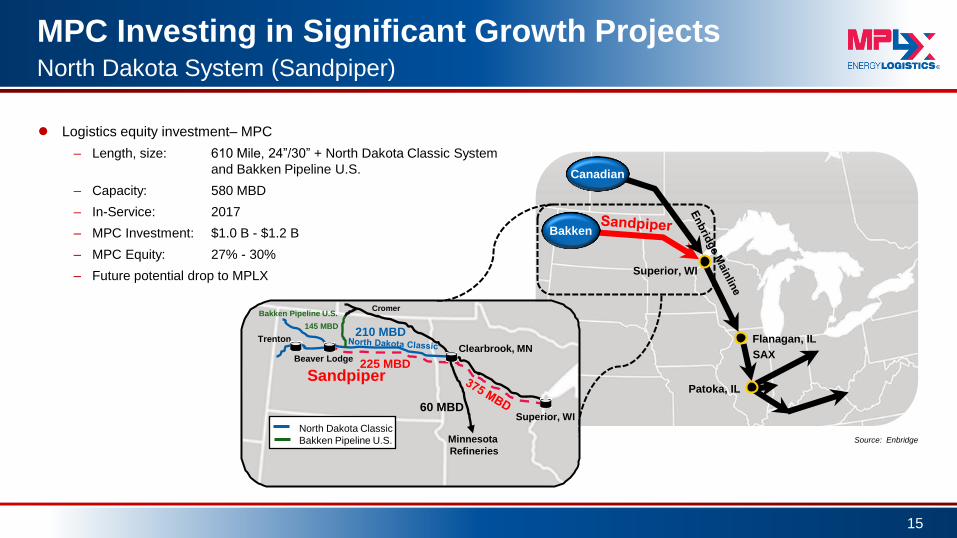
MPC Investing in Significant Growth Projects
15
North Dakota System (Sandpiper)
Logistics equity investment– MPC
– Length, size: 610 Mile, 24”/30” + North Dakota Classic System
and Bakken Pipeline U.S.
– Capacity: 580 MBD
– In-Service: 2017
– MPC Investment: $1.0 B - $1.2 B
– MPC Equity: 27% - 30%
– Future potential drop to MPLX
Superior, WI
SAX
Canadian
Bakken
Flanagan, IL
Patoka, IL
225 MBD
210 MBD
Clearbrook, MN Trenton
Superior, WI 60 MBD
Sandpiper
Minnesota
Refineries
Beaver Lodge
Cromer Bakken Pipeline U.S.
145 MBD
North Dakota Classic
Bakken Pipeline U.S. Source: Enbridge
Superior, WI
Canadian
Bakken
Flanagan, IL
Patoka,
IL
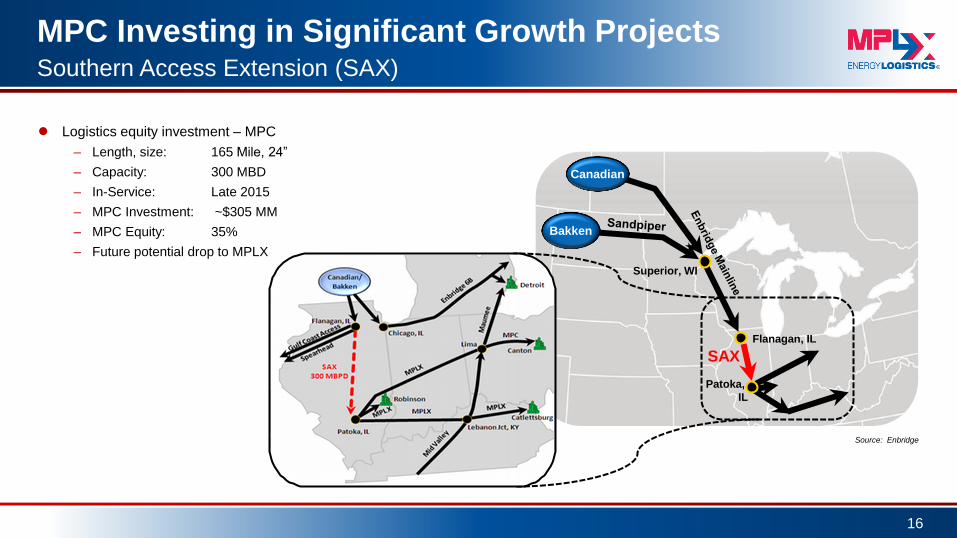
MPC Investing in Significant Growth Projects
16
Southern Access Extension (SAX)
Logistics equity investment – MPC
– Length, size: 165 Mile, 24”
– Capacity: 300 MBD
– In-Service: Late 2015
– MPC Investment: ~$305 MM
– MPC Equity: 35%
– Future potential drop to MPLX
SAX
Source: Enbridge
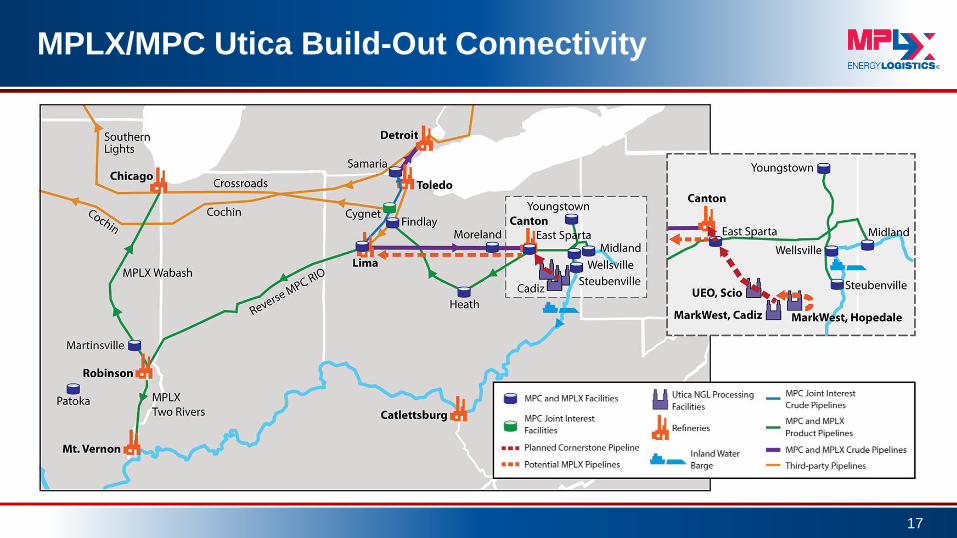
MPLX/MPC Utica Build-Out Connectivity
17
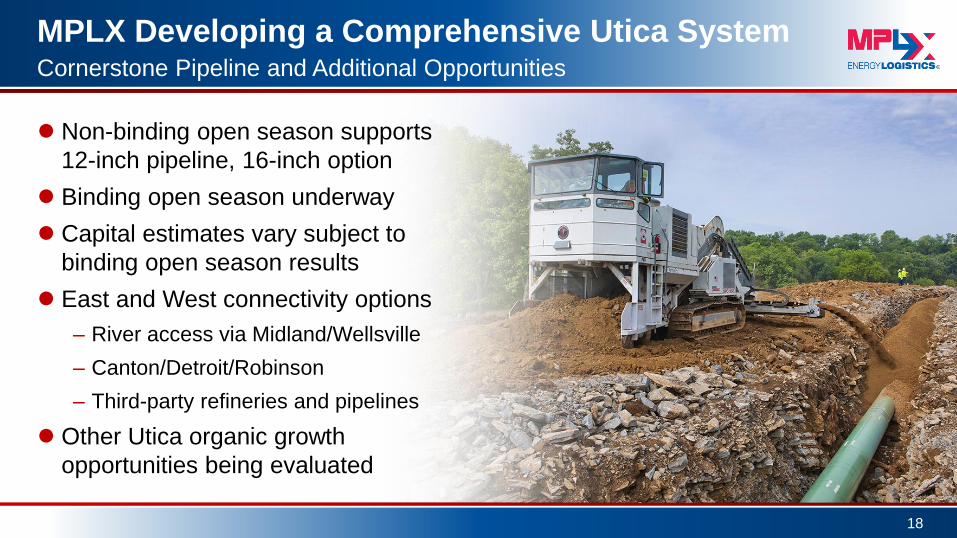
MPLX Developing a Comprehensive Utica System
18
Cornerstone Pipeline and Additional Opportunities
Non-binding open season supports
12-inch pipeline, 16-inch option
Binding open season underway
Capital estimates vary subject to
binding open season results
East and West connectivity options
– River access via Midland/Wellsville
– Canton/Detroit/Robinson
– Third-party refineries and pipelines
Other Utica organic growth
opportunities being evaluated

MPLX Strong Financial Flexibility to
Manage and Grow Asset Base
19
($MM except ratio data) As of
12/31/14
Cash and cash equivalents 27.3
Total assets 1,214.5
Long-term debt(a) 644.8
Total equity 463.7
Consolidated total debt to consolidated EBITDA ratio (covenant basis)(b) 2.8x
Undrawn bank revolving credit agreement 615.0
a) Includes amounts due within one year
b) Maximum covenant ratio <= 5.0 or 5.5 during the six month period following certain acquisitions

Distribution Growth per Unit
0.2625*
(MQD) 0.2725
0.2850 0.2975
0.3125 0.3275
0.3425 0.3575
0.3825
0.20
0.22
0.24
0.26
0.28
0.30
0.32
0.34
0.36
0.38
0.40
4Q12 1Q13 2Q13 3Q13 4Q13 1Q14 2Q14 3Q14 4Q14
$/U
nit
1.49x 1.37x
*Represents minimum quarter distribution (MQD) for 4Q12, actual $0.1769 equal to MQD prorated
Coverage
Ratio 1.36x 1.25x 1.25x 1.38x 1.19x
IPO
10/31/12
1st acquisition
5/1/13 $100 MM
2nd acquisition
3/1/14 $310 MM
0.97x 1.18x
3rd acquisition
12/1/14 $800 MM
20
MPC Drop-down Strategy Considerations
MPC created MPLX to grow midstream business and create a funding
mechanism for strategic opportunities
MPLX investors highly value a consistent, long-term growth strategy
Committed to significant acceleration of MPLX’s annual LP distribution
growth rate
– Average annual LP distribution growth rate of mid-20% over next five years
MPLX is establishing an optimized capital structure
Preparing MPC retained assets to be dropped, including tax considerations
21
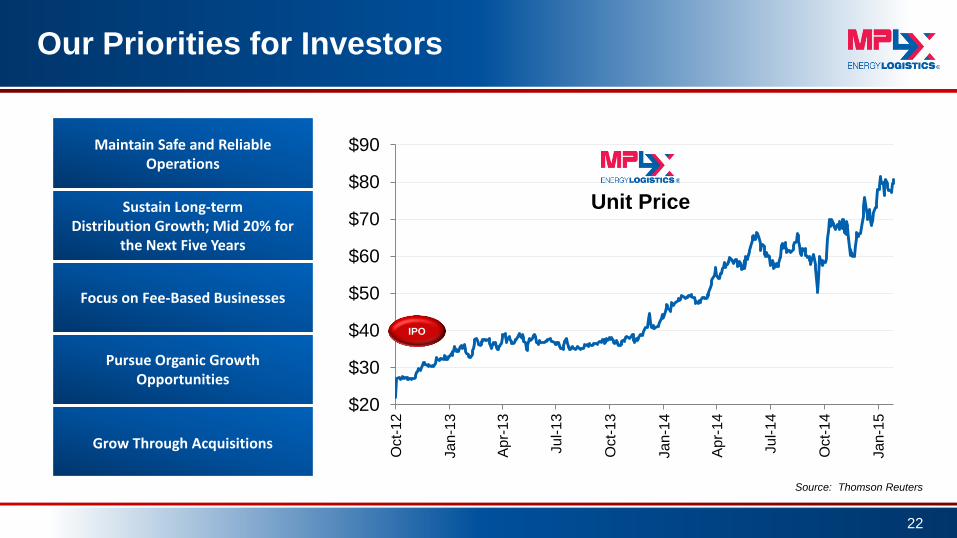
Our Priorities for Investors
22
Maintain Safe and Reliable Operations
Sustain Long-term Distribution Growth; Mid 20% for
the Next Five Years
Focus on Fee-Based Businesses
Pursue Organic Growth Opportunities
Grow Through Acquisitions
$20
$30
$40
$50
$60
$70
$80
$90
Oct-
12
Ja
n-1
3
Ap
r-1
3
Ju
l-1
3
Oct-
13
Ja
n-1
4
Ap
r-1
4
Ju
l-1
4
Oct-
14
Ja
n-1
5
Unit Price
IPO
Source: Thomson Reuters
23
Appendix
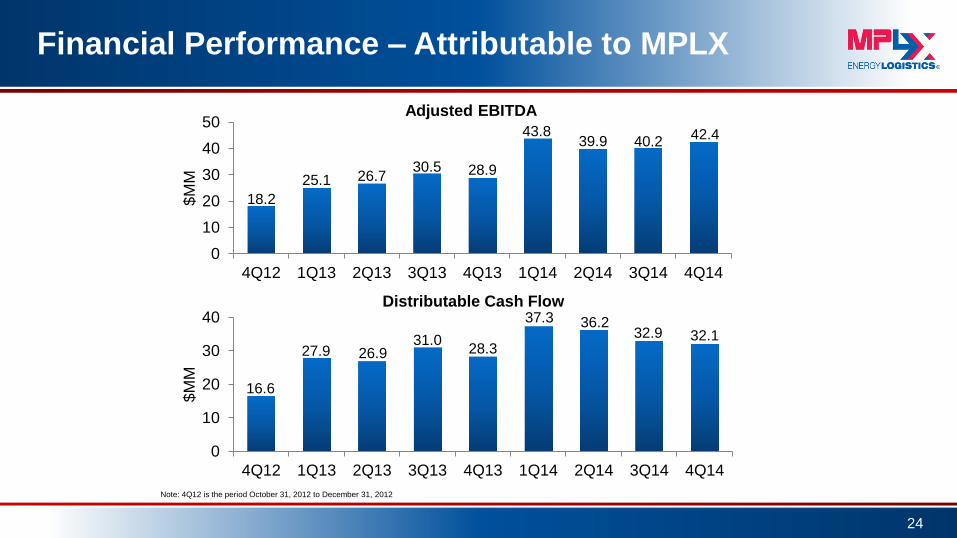
Financial Performance – Attributable to MPLX
24
18.2
25.1 26.7 30.5 28.9
43.8 39.9 40.2
42.4
0
10
20
30
40
50
4Q12 1Q13 2Q13 3Q13 4Q13 1Q14 2Q14 3Q14 4Q14
$M
M
Adjusted EBITDA
16.6
27.9 26.9 31.0
28.3
37.3 36.2 32.9 32.1
0
10
20
30
40
4Q12 1Q13 2Q13 3Q13 4Q13 1Q14 2Q14 3Q14 4Q14
$M
M
Distributable Cash Flow
Note: 4Q12 is the period October 31, 2012 to December 31, 2012
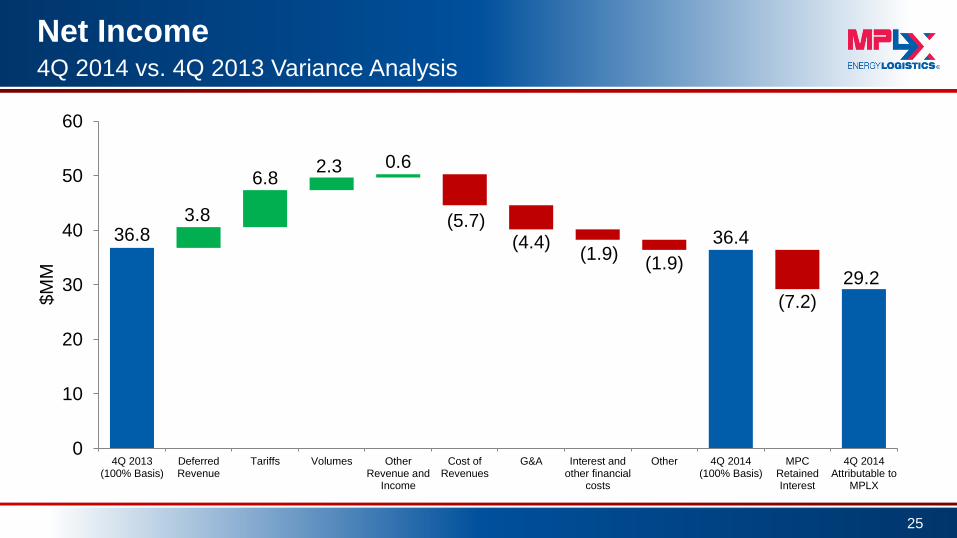
Net Income
25
4Q 2014 vs. 4Q 2013 Variance Analysis
36.8 3.8
6.8 2.3 0.6
(5.7) (4.4)
(1.9) (1.9)
36.4
(7.2)
29.2
0
10
20
30
40
50
60
4Q 2013(100% Basis)
DeferredRevenue
Tariffs Volumes OtherRevenue and
Income
Cost ofRevenues
G&A Interest andother financial
costs
Other 4Q 2014(100% Basis)
MPCRetainedInterest
4Q 2014Attributable to
MPLX
$M
M
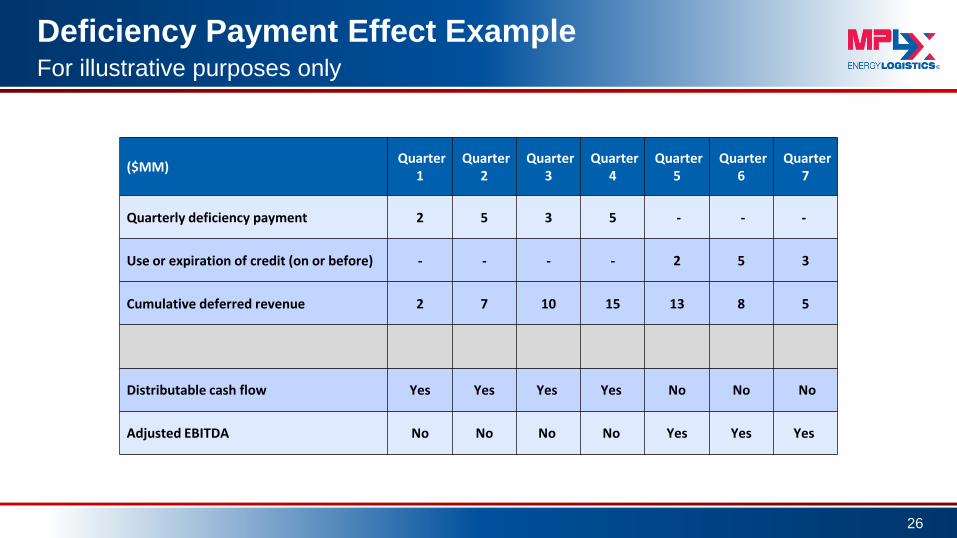
Deficiency Payment Effect Example
26
For illustrative purposes only
($MM) Quarter
1 Quarter
2 Quarter
3 Quarter
4 Quarter
5 Quarter
6 Quarter
7
Quarterly deficiency payment 2 5 3 5 - - -
Use or expiration of credit (on or before) - - - - 2 5 3
Cumulative deferred revenue 2 7 10 15 13 8 5
Distributable cash flow Yes Yes Yes Yes No No No
Adjusted EBITDA No No No No Yes Yes Yes
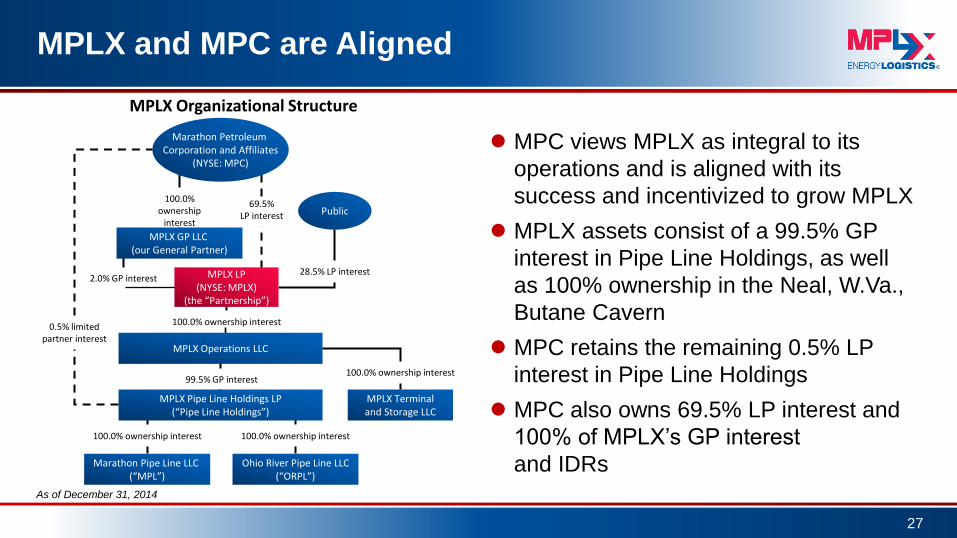
MPLX and MPC are Aligned
MPC views MPLX as integral to its
operations and is aligned with its
success and incentivized to grow MPLX
MPLX assets consist of a 99.5% GP
interest in Pipe Line Holdings, as well
as 100% ownership in the Neal, W.Va.,
Butane Cavern
MPC retains the remaining 0.5% LP
interest in Pipe Line Holdings
MPC also owns 69.5% LP interest and
100% of MPLX’s GP interest
and IDRs
27
0.5% limited partner interest
100.0% ownership interest
100.0% ownership interest
MPLX Operations LLC
r
MPLX Terminal and Storage LLC
100.0% ownership
interest Public
100.0% ownership interest
2.0% GP interest 28.5% LP interest
Marathon Pipe Line LLC (“MPL”)
99.5% GP interest
Ohio River Pipe Line LLC (“ORPL”)
MPLX GP LLC (our General Partner)
69.5% LP interest
100.0% ownership interest
MPLX LP (NYSE: MPLX)
(the “Partnership”)
MPLX Pipe Line Holdings LP (“Pipe Line Holdings”)
Marathon Petroleum Corporation and Affiliates
(NYSE: MPC)
MPLX Organizational Structure
As of December 31, 2014
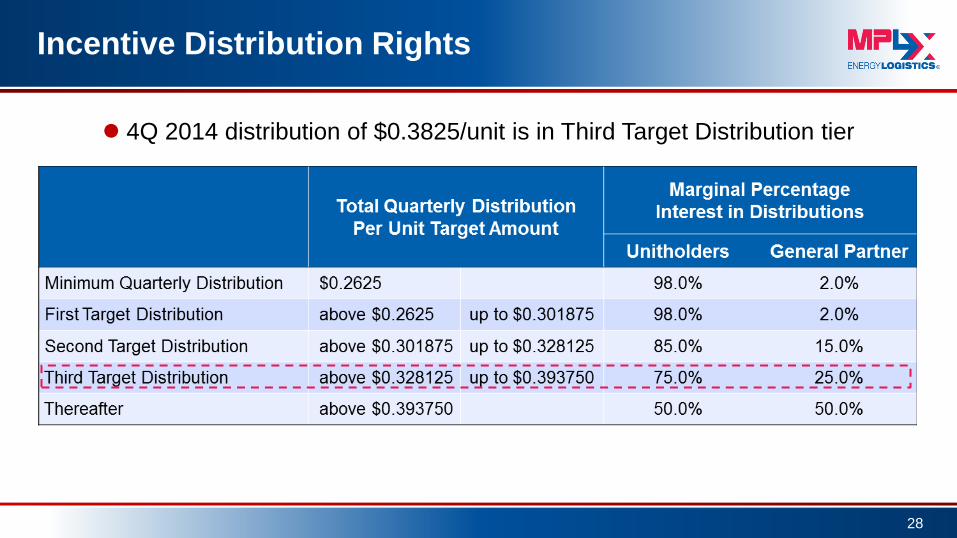
Incentive Distribution Rights
4Q 2014 distribution of $0.3825/unit is in Third Target Distribution tier
28
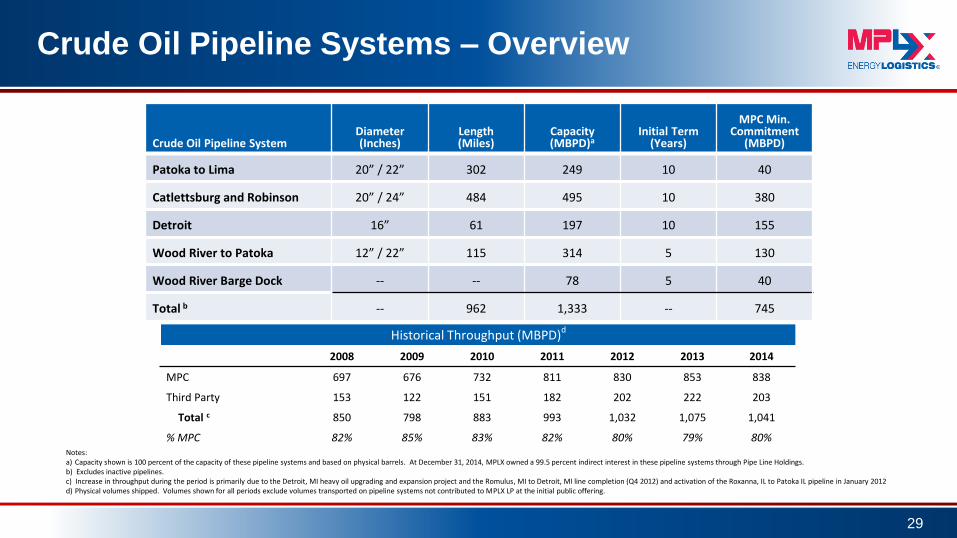
Crude Oil Pipeline System Diameter (Inches)
Length (Miles)
Capacity (MBPD)a
Initial Term (Years)
MPC Min. Commitment
(MBPD)
Patoka to Lima 20” / 22” 302 249 10 40
Catlettsburg and Robinson 20” / 24” 484 495 10 380
Detroit 16” 61 197 10 155
Wood River to Patoka 12” / 22” 115 314 5 130
Wood River Barge Dock -- -- 78 5 40
Total b -- 962 1,333 -- 745
2008 2009 2010 2011 2012 2013 2014
MPC 697 676 732 811 830 853 838
Third Party 153 122 151 182 202 222 203
Total c 850 798 883 993 1,032 1,075 1,041
% MPC 82% 85% 83% 82% 80% 79% 80% Notes: a) Capacity shown is 100 percent of the capacity of these pipeline systems and based on physical barrels. At December 31, 2014, MPLX owned a 99.5 percent indirect interest in these pipeline systems through Pipe Line Holdings. b) Excludes inactive pipelines. c) Increase in throughput during the period is primarily due to the Detroit, MI heavy oil upgrading and expansion project and the Romulus, MI to Detroit, MI line completion (Q4 2012) and activation of the Roxanna, IL to Patoka IL pipeline in January 2012 d) Physical volumes shipped. Volumes shown for all periods exclude volumes transported on pipeline systems not contributed to MPLX LP at the initial public offering.
Crude Oil Pipeline Systems – Overview
Historical Throughput (MBPD)d
29
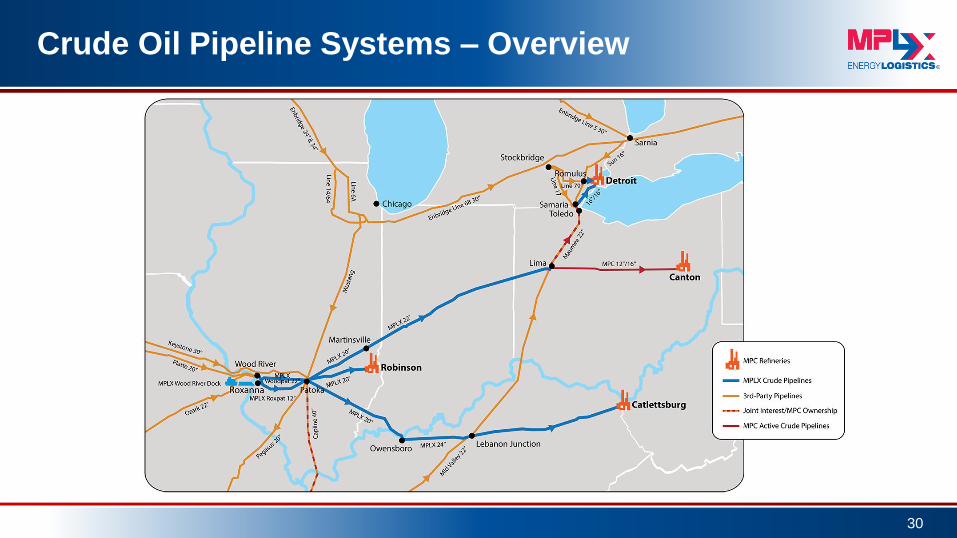
Crude Oil Pipeline Systems – Overview
30

Patoka to Lima Crude System
76 miles of 20-inch pipeline extending from Patoka, IL to
Martinsville, IL
226 miles of 22-inch pipeline extending from Martinsville
to Lima, OH
– Includes related breakout tankage at Martinsville
From MPC's tank farm in Lima, crude can be shipped to:
– MPC’s Canton, OH and Detroit, MI refineries
– Other third-party refineries
Current capacity of 249 MBPD
Initial MPC minimum throughput commitment term of
10 years for 40 MBPD
Estimated minimum cash commitment related to MPC’s
throughput commitment of $7.6 MM
31
Source: Oil & Gas Journal effective December 31, 2014
Refineries Served (MBPCD)
MPC Detroit 130
MPC Canton 90
PBF Toledo 170
BP/Husky Toledo 152
Husky Lima 160

Catlettsburg and Robinson Crude System
Primary pipelines supplying crude oil for MPC's Catlettsburg,
KY and Robinson, IL refineries
Patoka to Catlettsburg System
– 140 miles of 20-inch pipeline from Patoka to
Owensboro, KY
– 266 miles of 24-inch pipeline from Owensboro to Catlettsburg
– Entry points at Patoka and Lebanon Junction, KY from the Mid
Valley system
– Current capacity of 270 MBPD
Patoka to Robinson System
– 78 miles of 20-inch pipeline that delivers crude oil to MPC’s
Robinson refinery
– Current capacity of 225 MBPD
Initial MPC minimum throughput commitment term of 10 years
for 380 MBPD
Estimated cash commitment related to MPC’s throughput
commitment of $101.4 MM
32
Refineries Served (MBPCD)
MPC Catlettsburg 242
MPC Robinson 212
Source: Oil & Gas Journal effective December 31, 2014
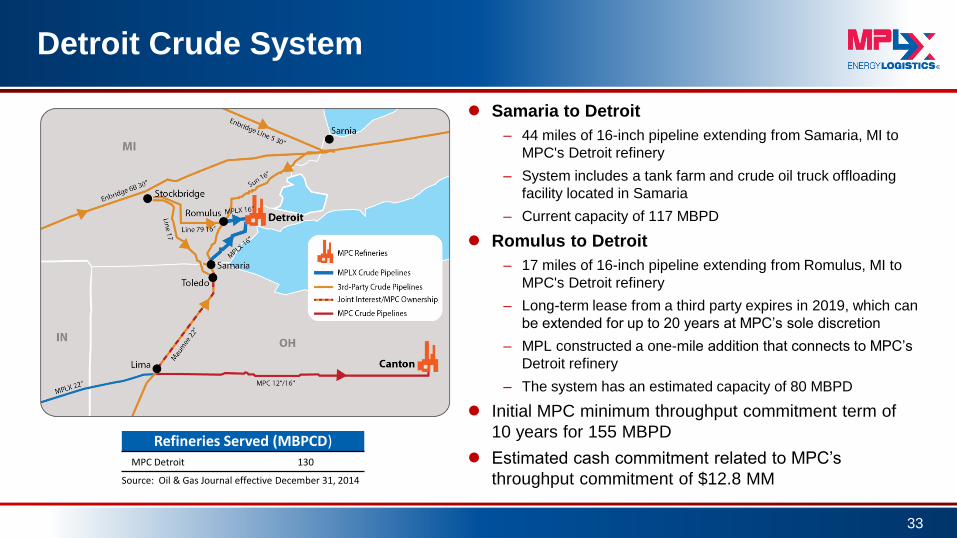
Detroit Crude System
Samaria to Detroit
– 44 miles of 16-inch pipeline extending from Samaria, MI to
MPC's Detroit refinery
– System includes a tank farm and crude oil truck offloading
facility located in Samaria
– Current capacity of 117 MBPD
Romulus to Detroit
– 17 miles of 16-inch pipeline extending from Romulus, MI to
MPC's Detroit refinery
– Long-term lease from a third party expires in 2019, which can
be extended for up to 20 years at MPC’s sole discretion
– MPL constructed a one-mile addition that connects to MPC’s
Detroit refinery
– The system has an estimated capacity of 80 MBPD
Initial MPC minimum throughput commitment term of
10 years for 155 MBPD
Estimated cash commitment related to MPC’s
throughput commitment of $12.8 MM
Refineries Served (MBPCD)
MPC Detroit 130
Source: Oil & Gas Journal effective December 31, 2014
33

Wood River to Patoka Crude System
Wood River to Patoka System
– 57 miles of 22-inch pipeline extending from Wood
River, IL to Patoka
– Current capacity of 215 MBPD
Roxanna to Patoka System
– 58 miles of 12-inch pipeline extending from
Roxanna, IL (Enbridge Energy Partner’s Ozark
pipeline system) to an MPLX tank farm in Patoka
– Pipeline system is leased from a third party under a
long-term lease
– This crude oil line was placed into service in
January 2012
– Current capacity of 99 MBPD
Initial MPC minimum throughput commitment
term of 5 years for 130 MBPD
Estimated cash commitment related to MPC's
throughput commitment of $10.5 MM
34
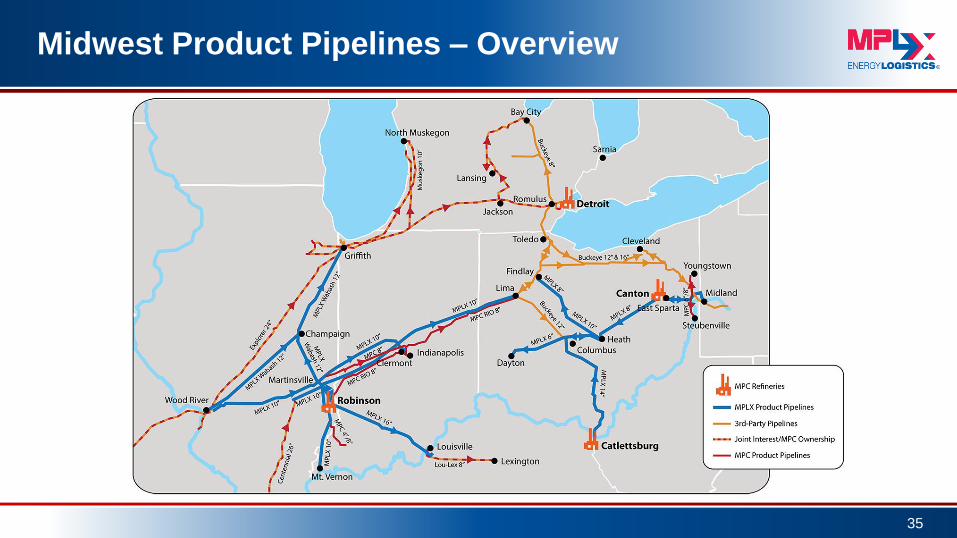
Midwest Product Pipelines – Overview
35
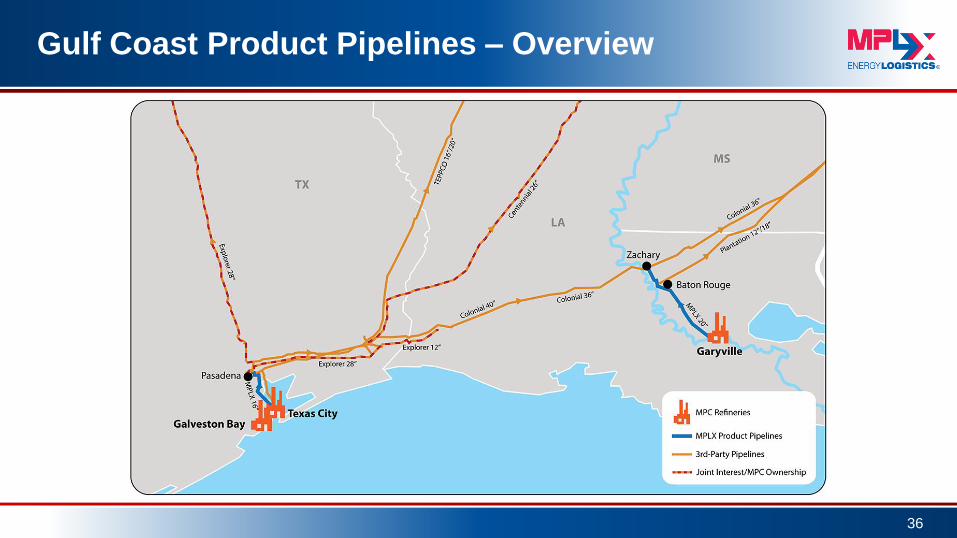
Gulf Coast Product Pipelines – Overview
36
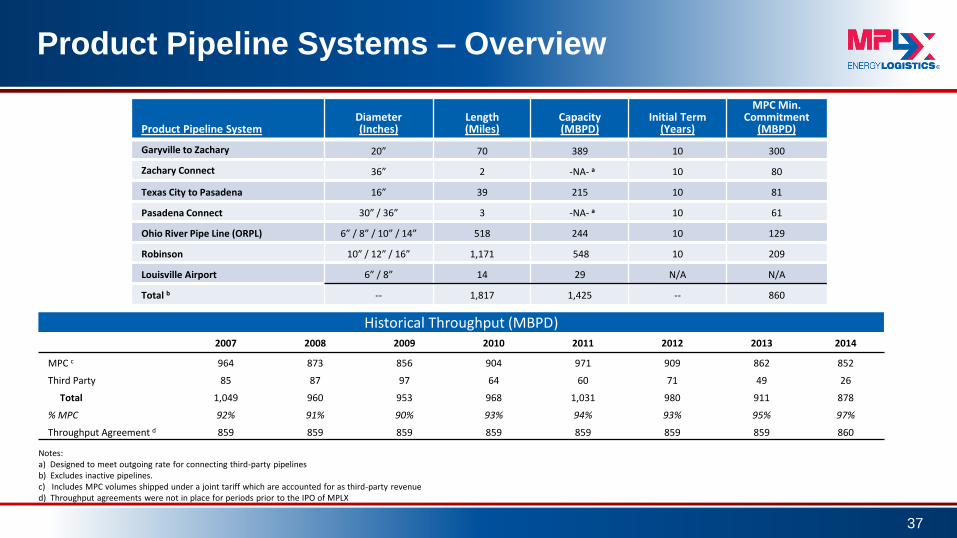
Product Pipeline Systems – Overview
37
Notes: a) Designed to meet outgoing rate for connecting third-party pipelines b) Excludes inactive pipelines. c) Includes MPC volumes shipped under a joint tariff which are accounted for as third-party revenue d) Throughput agreements were not in place for periods prior to the IPO of MPLX
2007 2008 2009 2010 2011 2012 2013 2014
MPC c 964 873 856 904 971 909 862 852
Third Party 85 87 97 64 60 71 49 26
Total 1,049 960 953 968 1,031 980 911 878
% MPC 92% 91% 90% 93% 94% 93% 95% 97%
Throughput Agreement d 859 859 859 859 859 859 859 860
Product Pipeline System
Diameter (Inches)
Length (Miles)
Capacity (MBPD)
Initial Term (Years)
MPC Min. Commitment
(MBPD)
Garyville to Zachary 20” 70 389 10 300
Zachary Connect 36” 2 -NA- a 10 80
Texas City to Pasadena 16” 39 215 10 81
Pasadena Connect 30” / 36” 3 -NA- a 10 61
Ohio River Pipe Line (ORPL) 6” / 8” / 10” / 14” 518 244 10 129
Robinson 10” / 12” / 16” 1,171 548 10 209
Louisville Airport 6” / 8” 14 29 N/A N/A
Total b -- 1,817 1,425 -- 860
Historical Throughput (MBPD)

Garyville Products System
Primary pathway for the distribution of refined
products from the Garyville, LA refinery
Garyville to Zachary
– 70 miles of 20-inch pipeline extending from MPC's
Garyville refinery to either the Plantation Pipeline in
Baton Rouge, LA or the MPC Zachary breakout tank
farm in Zachary, LA
– Current capacity of 389 MBPD
Zachary Connect
– 2 miles of 36-inch pipeline that delivers refined products
from the MPC tank farm to Colonial Pipeline in Zachary
Initial MPC minimum throughput commitment term
of 10 years for 300 MBPD and 80 MBPD for
Garyville to Zachary and Zachary Connect,
respectively
Estimated cash commitment related to MPC’s
throughput commitment of $61.1 MM from the
combined system
38
Refineries Served (MBPCD) MPC Garyville 522
Source: Oil & Gas Journal effective December 31, 2014

Texas City Products System
Primary pathway for the distribution of refined products
from MPC's Texas City refinery
Texas City to Pasadena
– 39 miles of 16-inch pipeline extending from refineries owned
by MPC and third parties in Texas City, TX to the MPC
Pasadena breakout tank farm and third-party terminals in
Pasadena, TX
– Current capacity of 215 MBPD
Pasadena Connect
– 3 miles of 30 / 36-inch pipeline that delivers refined products
from the MPC tank farm in Pasadena to the third-party
Enterprise, Colonial, and Centennial pipeline systems
Initial MPC minimum throughput commitment term of
10 years for 81 MBPD and 61 MBPD for Texas City to
Pasadena and Pasadena Connect, respectively
Estimated cash commitment related to MPC’s
throughput commitment of $9.4 MM from the
combined system
39
Source: Oil & Gas Journal effective December 31, 2014
Refineries Served (MBPCD) MPC Texas City 84
MPC Galveston Bay 451
Valero Texas City 250

Ohio River Pipe Line (ORPL) Products Systems
System of single and bi-directional pipelines that connect
MPC's Canton and Catlettsburg refineries with MPC and
third-party terminals
Current combined capacity of 244 MBPD
MPC minimum throughput commitment term of 10 years
for 129 MBPD
Estimated cash commitment related to MPC's
throughput commitment of $58.2 MM
40
Pipeline Detail Diameter (inches)
Length (miles)
Capacity (MBPD)
Kenova to Columbus a 14” 150 68
Canton to East Sparta 6” 17 73
East Sparta to Heath 8” 81 29
East Sparta to Midland 8” 62 32
Heath to Dayton 6” 108 24
Heath to Findlay 8”/10” 100 18
Note: a) Kenova to Columbus pipeline originates at the Catlettsburg refinery
Refineries Served (MBPCD) MPC Catlettsburg 242
MPC Canton 90
Source: Oil & Gas Journal effective December 31, 2014
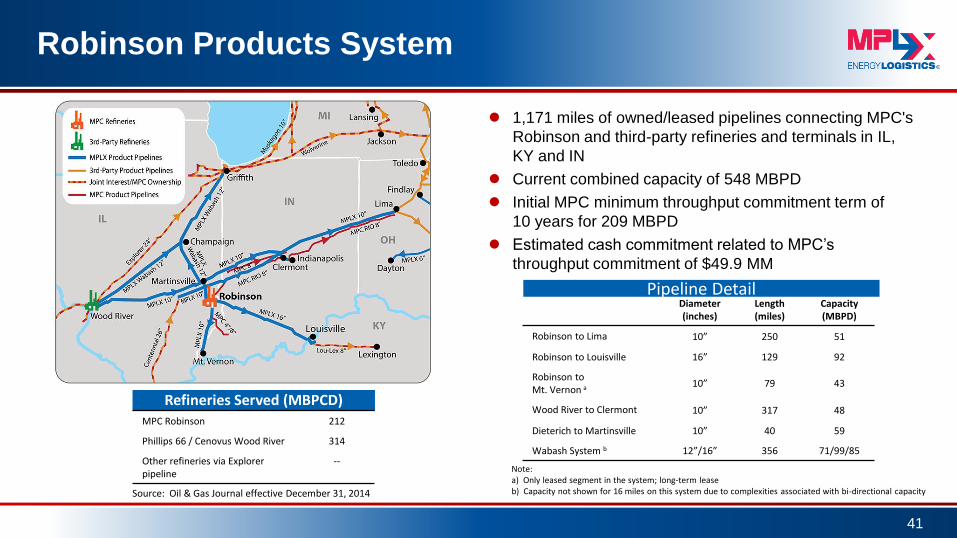
Robinson Products System
1,171 miles of owned/leased pipelines connecting MPC's
Robinson and third-party refineries and terminals in IL,
KY and IN
Current combined capacity of 548 MBPD
Initial MPC minimum throughput commitment term of
10 years for 209 MBPD
Estimated cash commitment related to MPC’s
throughput commitment of $49.9 MM
41
Note: a) Only leased segment in the system; long-term lease b) Capacity not shown for 16 miles on this system due to complexities associated with bi-directional capacity
Diameter (inches)
Length (miles)
Capacity (MBPD)
Robinson to Lima 10” 250 51
Robinson to Louisville 16” 129 92
Robinson to Mt. Vernon a 10” 79 43
Wood River to Clermont 10” 317 48
Dieterich to Martinsville 10” 40 59
Wabash System b 12”/16” 356 71/99/85
Pipeline Detail
Refineries Served (MBPCD) MPC Robinson 212
Phillips 66 / Cenovus Wood River 314
Other refineries via Explorer pipeline
--
Source: Oil & Gas Journal effective December 31, 2014

Other Major MPLX Assets
MPC's commitments account for total annual revenue of $34 MM from
these “Other” major assets
Neal, W.Va., Butane Storage Cavern – Capacity of ~1 MMBBL
with an initial 10-year term
– Connected to MPC’s Catlettsburg, KY refinery through pipelines owned by MPC
– Rail access is available through the refinery’s rail facilities
Tank Farm Storage Assets
– Several pipeline storage facilities (tank farms) for both crude oil and products
located in Patoka, Wood River and Martinsville, IL and Lebanon, IN with
~3.3 MM barrels of available capacity that will be provided to MPC on a
firm basis
42
Asset
Capacity
Initial Term (Years)
Asset
Capacity
Initial Term (Years)
Patoka Tank Farm 1,386 MBBL 3 Martinsville Tank Farm 738 MBBL 3
Wood River Tank Farm 419 MBBL 3 Lebanon Tank Farm 750 MBBL 3
Neal Butane Cavern
Tank Farm Storage
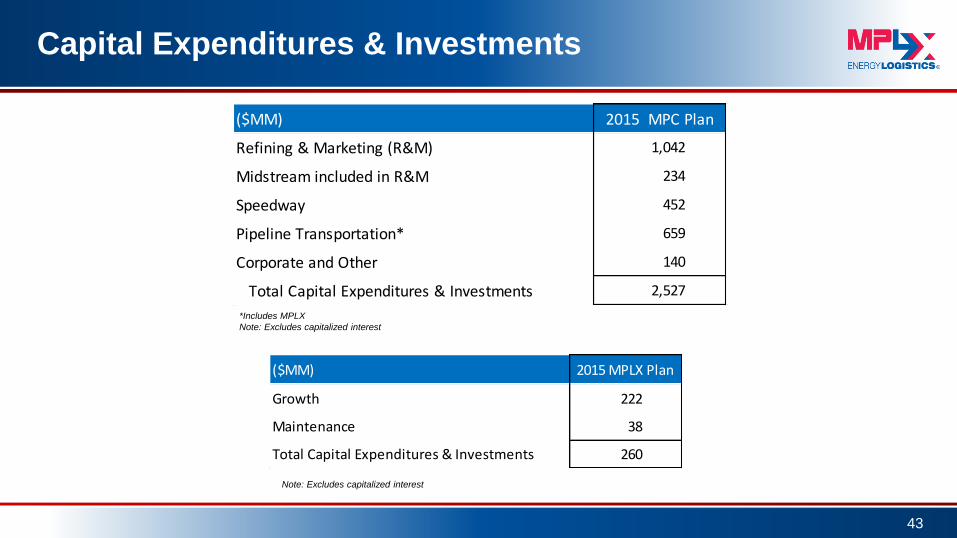
Capital Expenditures & Investments
43
($MM) 2015 MPLX Plan
Growth 222
Maintenance 38
Total Capital Expenditures & Investments 260
($MM) 2015 MPC Plan
Refining & Marketing (R&M) 1,042
Midstream included in R&M 234
Speedway 452
Pipeline Transportation* 659
Corporate and Other 140
Total Capital Expenditures & Investments 2,527
Note: Excludes capitalized interest
*Includes MPLX
Note: Excludes capitalized interest
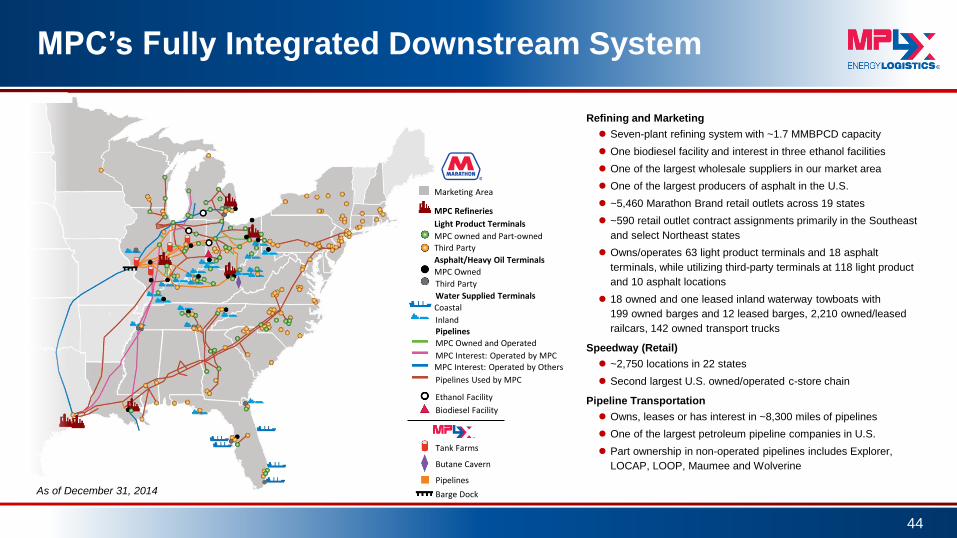
MPC’s Fully Integrated Downstream System
44
Refining and Marketing
Seven-plant refining system with ~1.7 MMBPCD capacity
One biodiesel facility and interest in three ethanol facilities
One of the largest wholesale suppliers in our market area
One of the largest producers of asphalt in the U.S.
~5,460 Marathon Brand retail outlets across 19 states
~590 retail outlet contract assignments primarily in the Southeast
and select Northeast states
Owns/operates 63 light product terminals and 18 asphalt
terminals, while utilizing third-party terminals at 118 light product
and 10 asphalt locations
18 owned and one leased inland waterway towboats with
199 owned barges and 12 leased barges, 2,210 owned/leased
railcars, 142 owned transport trucks
Speedway (Retail)
~2,750 locations in 22 states
Second largest U.S. owned/operated c-store chain
Pipeline Transportation
Owns, leases or has interest in ~8,300 miles of pipelines
One of the largest petroleum pipeline companies in U.S.
Part ownership in non-operated pipelines includes Explorer,
LOCAP, LOOP, Maumee and Wolverine
Marketing Area
MPC Refineries
Light Product Terminals
MPC owned and Part-owned
Third Party
Asphalt/Heavy Oil Terminals
MPC Owned
Third Party
Water Supplied Terminals
Coastal
Inland Pipelines
MPC Owned and Operated
MPC Interest: Operated by MPC MPC Interest: Operated by Others
Pipelines Used by MPC
Ethanol Facility
Biodiesel Facility
Tank Farms
Butane Cavern
Pipelines
Barge Dock As of December 31, 2014
MPC 2015 Value Drivers
Top-tier safety and environmental performance
Accelerate growth of Midstream/MPLX
Capital return to shareholders
– Strong and growing dividend
– Share repurchase program
Speedway – Hess integration
Increasing light crude processing and export capabilities
Enhancing margins in our refining operations
Integrated downstream system
45
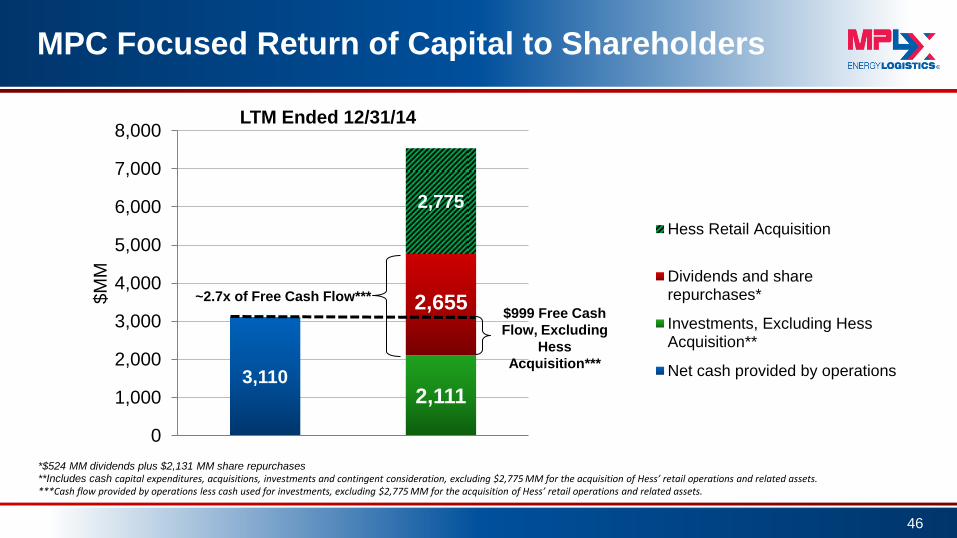
MPC Focused Return of Capital to Shareholders
46
3,110 2,111
2,655
2,775
0
1,000
2,000
3,000
4,000
5,000
6,000
7,000
8,000
$M
M
Hess Retail Acquisition
Dividends and sharerepurchases*
Investments, Excluding HessAcquisition**
Net cash provided by operations
*$524 MM dividends plus $2,131 MM share repurchases **Includes cash capital expenditures, acquisitions, investments and contingent consideration, excluding $2,775 MM for the acquisition of Hess’ retail operations and related assets. ***Cash flow provided by operations less cash used for investments, excluding $2,775 MM for the acquisition of Hess’ retail operations and related assets.
~2.7x of Free Cash Flow***
$999 Free Cash
Flow, Excluding
Hess
Acquisition***
LTM Ended 12/31/14

2.1% 2.7% 2.4% 2.0% 2.3%
4.3%
8.6%
1.5%
5.2% 6.5% 4.4%
0.0%
2.0%
4.0%
6.0%
8.0%
10.0%
12.0%
MPC HFC PSX TSO VLO
Dividend Yield Special Dividend Yield 2014 Share Repurchase/Share Yield
MPC Delivering Peer Leading Return of Capital Twelve months ended December 31, 2014
47
10.7%
8.5%
7.6%
8.5%
6.7%
*Total Capital Return Yield: Twelve months ended December 31, 2014 dividends per share, plus twelve months ended December 31, 2014 special dividends per share, plus twelve
months ended December 31, 2014 share repurchase per share, all divided by twelve month average share price from December 30, 2013 through December 31, 2014. Share
repurchase cost for Q4 2014 is estimated for Valero.

MPC Performing Consistently in the Top Tier
48
Engine behind MPC’s focus on capital returns
Source: Company Reports
MPC’s Rank
Competitor Range
Operating Income Per Barrel of Crude Throughput**
*Current companies ranked: BP, CVX, HFC, MPC, PSX, TSO, VLO, XOM
**Adjusted domestic operating income per barrel of crude oil throughput
11 Companies
Ranked* 12 11 9 10 9 8 9 9 8 10 8 8 8 8 8 8
-5
0
5
10
15
20
1998 1999 2000 2001 2002 2003 2004 2005 2006 2007 2008 2009 2010 2011 2012 2013 2014
$/B
BL
3 3
2 1
2 3
7
2
1
5
3
1 3
1
2
2 3
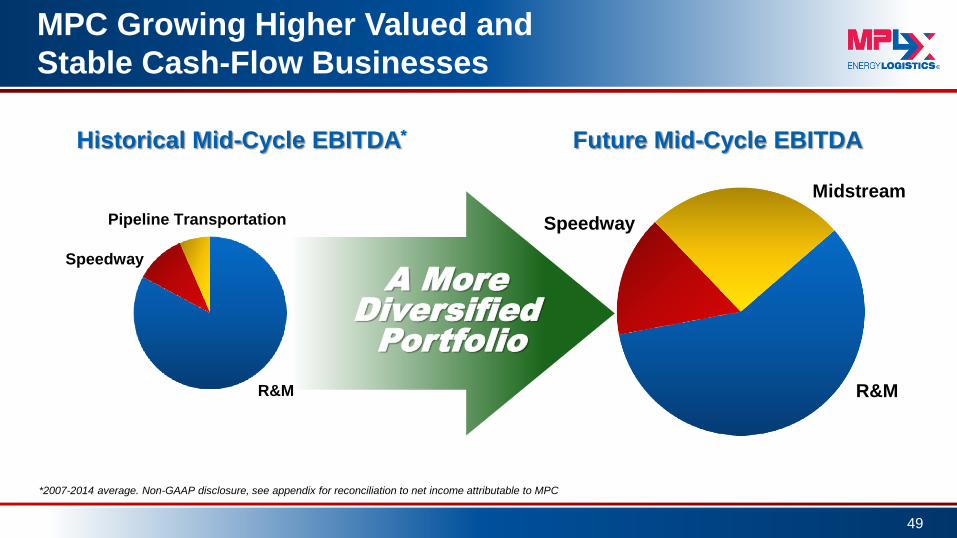
MPC Growing Higher Valued and
Stable Cash-Flow Businesses
Speedway
Pipeline Transportation
R&M R&M
Speedway
Midstream
Historical Mid-Cycle EBITDA*
A More
Diversified
Portfolio
Future Mid-Cycle EBITDA
*2007-2014 average. Non-GAAP disclosure, see appendix for reconciliation to net income attributable to MPC
49

MPC Allocating Capital to
Higher Valued Businesses
50
Excludes Galveston Bay and Hess retail acquisitions
2012 – 2015 Capital Investment Profile
0
500
1,000
1,500
2,000
2,500
3,000
2012 2013 2014 2015E
$M
M
Refining & Marketing, excluding Midstream Midstream Pipeline Transportation Speedway Other

Growing Global Product Demand
Distillate and gasoline
demand continues to
rise
Fuel oil continues
to decline on
economics and
emissions issues
51
Sources: BP Statistical Review Estimate of World Energy, MPC
Gasoline
Distillate
Fuel Oil
Other +1.2%
-1.1%
+1.3%
+0.8%
Compounded
Annual
Growth Rates
2030 vs. 2014
“Other” consists of refinery gas, liquefied petroleum gas (LPG), solvents, petroleum coke, lubricants, wax, and other refined products and refinery fuel
“Distillate” includes jet fuel
“Gasoline” includes naphtha
0
20
40
60
80
100
120Forecast Actual
Gasoline
Distillate
Fuel Oil
Other
MM
BD
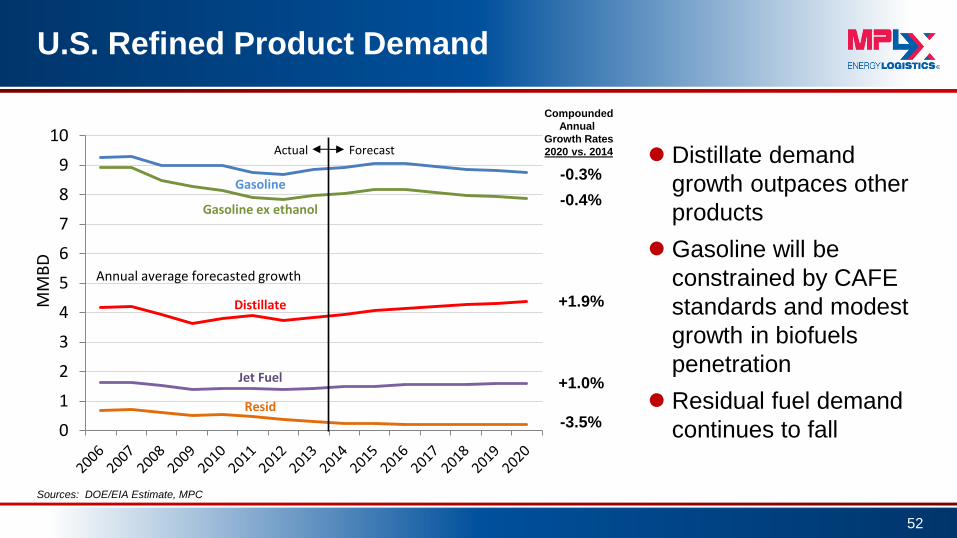
U.S. Refined Product Demand
Distillate demand
growth outpaces other
products
Gasoline will be
constrained by CAFE
standards and modest
growth in biofuels
penetration
Residual fuel demand
continues to fall
52
-0.3%
-0.4%
+1.9%
+1.0%
-3.5%
Compounded
Annual
Growth Rates
2020 vs. 2014
Sources: DOE/EIA Estimate, MPC
0
1
2
3
4
5
6
7
8
9
10
Gasoline
Gasoline ex ethanol
Distillate
Jet Fuel
Resid
Forecast Actual
Annual average forecasted growth
MM
BD

Capitalizing on Global Growth in Diesel Demand
Garyville +35 MBD ULSD in 2014-16
– $232 MM investment
– ~45% ROI
Galveston Bay +9 MBD ULSD in 2015
– $16 MM investment
– ~50% ROI
Robinson +5 MBD ULSD in 2015
– $77 MM investment
– ~30% ROI
53
32
34
36
38
2012 2013 2014 2015E 2016E 2017E
% o
f C
rude T
hro
ughput Distillate Production
300
400
500
600
700
2012 2013 2014 2015E 2016E 2017E
MB
D
Distillate Production

Crude Oil Inventory Impacting Differentials
54
150
160
170
180
190
200
210
220
MM
B
PADD 3 Crude Stocks
17
27
37
47
57
MM
B
Cushing Crude Stocks
Source: EIA

Forward Curves
55
Sources: CME, ICE, futures as of Feb. 13, 2015
Forward curves show some price recovery, but not a return to $100/BBL
Forward values for the Brent-WTI differential are favorable
$/B
BL
$/B
BL
$/B
BL
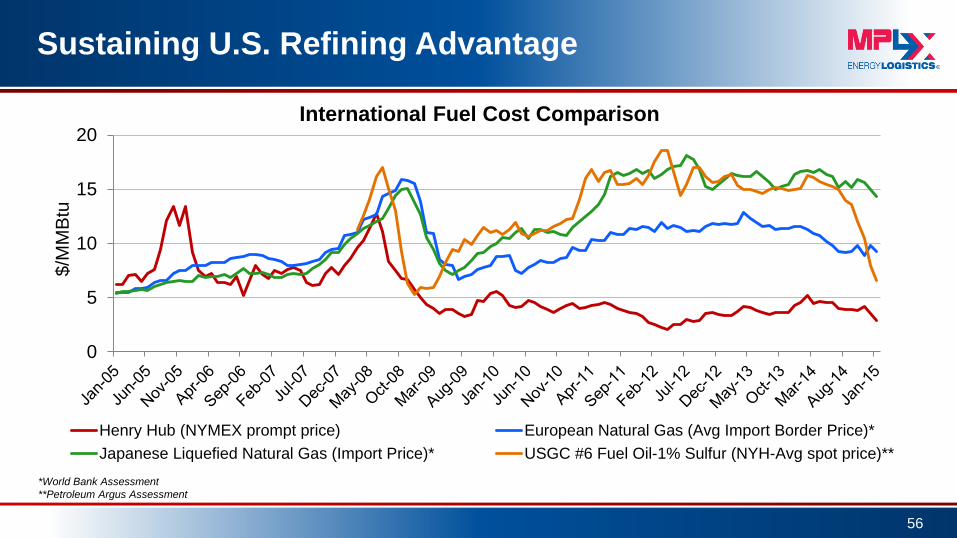
Sustaining U.S. Refining Advantage
56
0
5
10
15
20
$/M
MB
tu
International Fuel Cost Comparison
Henry Hub (NYMEX prompt price) European Natural Gas (Avg Import Border Price)*
Japanese Liquefied Natural Gas (Import Price)* USGC #6 Fuel Oil-1% Sulfur (NYH-Avg spot price)**
*World Bank Assessment
**Petroleum Argus Assessment
0.0
0.5
1.0
1.5
2.0
2.5
3.0
3.5
4.0
MM
BD
Gasolines
Kero-Jet
Diesels
Product Exports
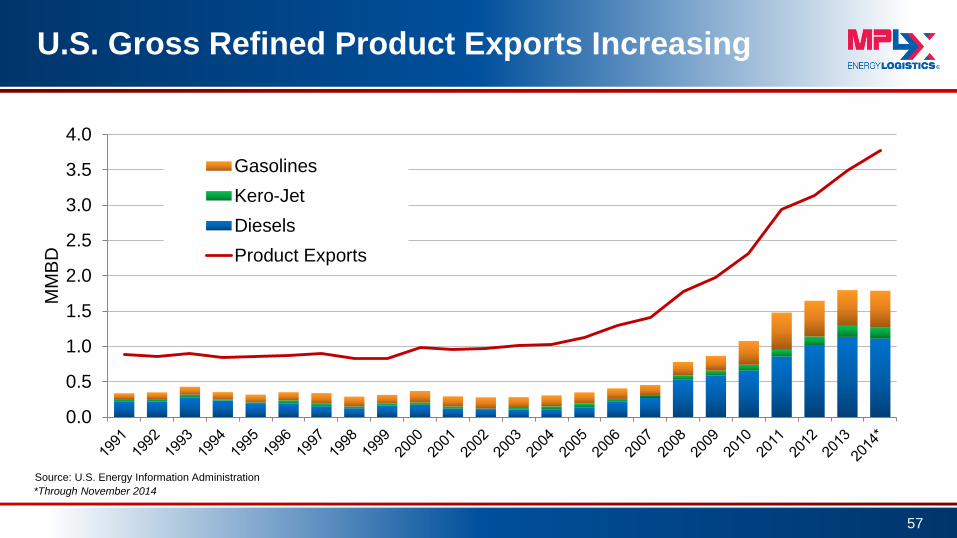
U.S. Gross Refined Product Exports Increasing
57
Source: U.S. Energy Information Administration
*Through November 2014
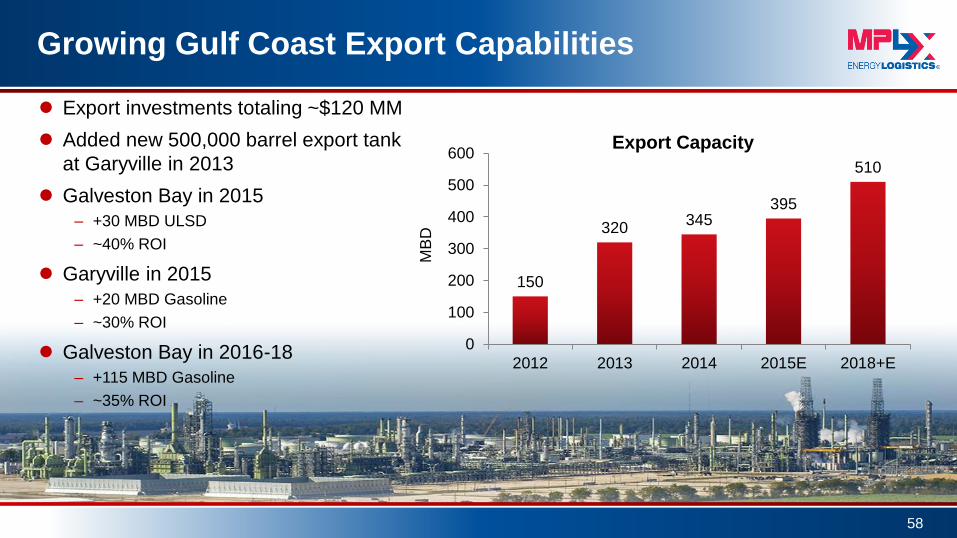
Growing Gulf Coast Export Capabilities
58
Export investments totaling ~$120 MM
Added new 500,000 barrel export tank
at Garyville in 2013
Galveston Bay in 2015
– +30 MBD ULSD
– ~40% ROI
Garyville in 2015
– +20 MBD Gasoline
– ~30% ROI
Galveston Bay in 2016-18
– +115 MBD Gasoline
– ~35% ROI
150
320 345
395
510
0
100
200
300
400
500
600
2012 2013 2014 2015E 2018+E
MB
D
Export Capacity
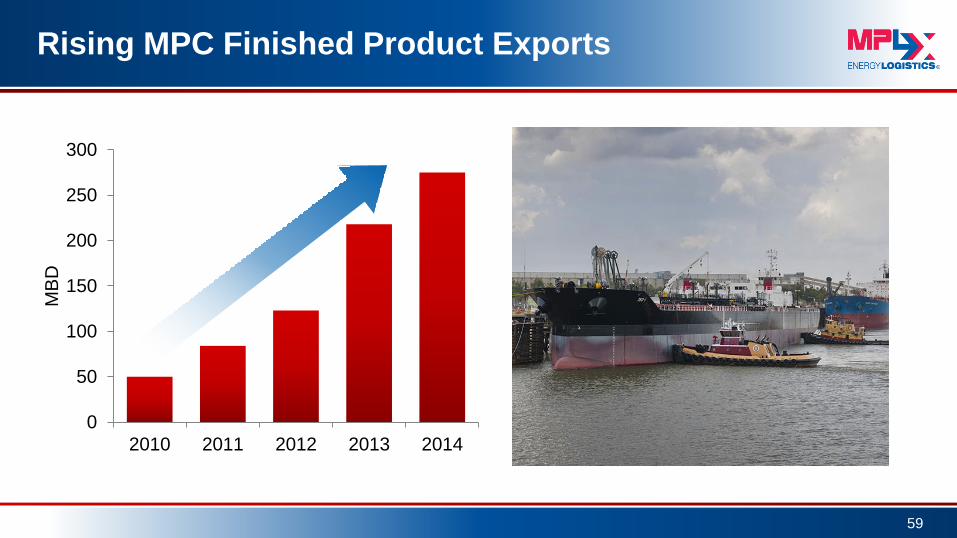
Rising MPC Finished Product Exports
59
0
50
100
150
200
250
300
2010 2011 2012 2013 2014
MB
D
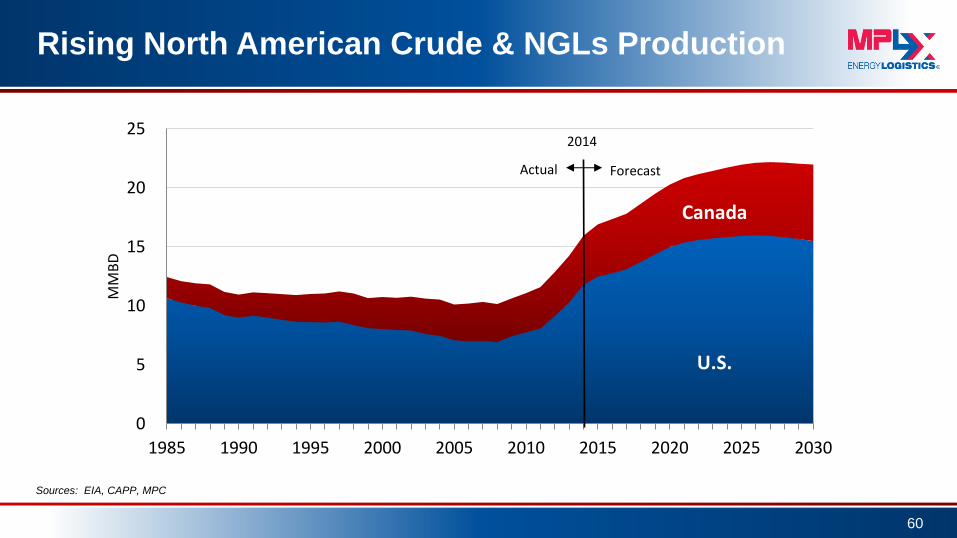
Rising North American Crude & NGLs Production
60
Sources: EIA, CAPP, MPC
0
5
10
15
20
25
1985 1990 1995 2000 2005 2010 2015 2020 2025 2030
MM
BD
U.S.
Canada
Forecast Actual
2014

0
300
600
900
1,200
1,500
1,800
1990 2000 2010 2020 2030
MB
D
North Dakota
← Actual Forecast →
2014
0
1,000
2,000
3,000
4,000
5,000
1990 2000 2010 2020 2030
MB
D
Texas
← Actual Forecast →
2014
0
25
50
75
100
125
150
1990 2000 2010 2020 2030
MB
D
Ohio
← Actual Forecast →
2014
Total Growth 2014 – 2030 +4,600 MBD
MPC Refinery
Utica
+78 MBD
Growing Crude Oil Supply
61
Canada
+2,667 MBD Bakken
+604 MBD
Permian +648 MBD
Eagle Ford +411 MBD
Total U.S. Growth +1,934 MBD
Niobrara +163 MBD
Sources: EIA, CAPP, MPC

Refining Capacity in Advantaged Regions
62
100% in PADDs II and III
PADD III
PADD V
PADD IV PADD II
Canadian Bakken
Utica
Permian Basin Eagle Ford Gulf of Mexico Canadian
PADD I
0%
20%
40%
60%
80%
100%
MPC VLO HFC PSX TSO
PADD II PADD III PADD I PADD IV PADD V
Source: Oil & Gas Journal effective December 31, 2014

Compelling Advantage for Pipeline and Marine
63
All costs shown as $/BBL
Pipeline costs exclude any storage or transfer fees and line loss
Sources: MPC, publicly available information
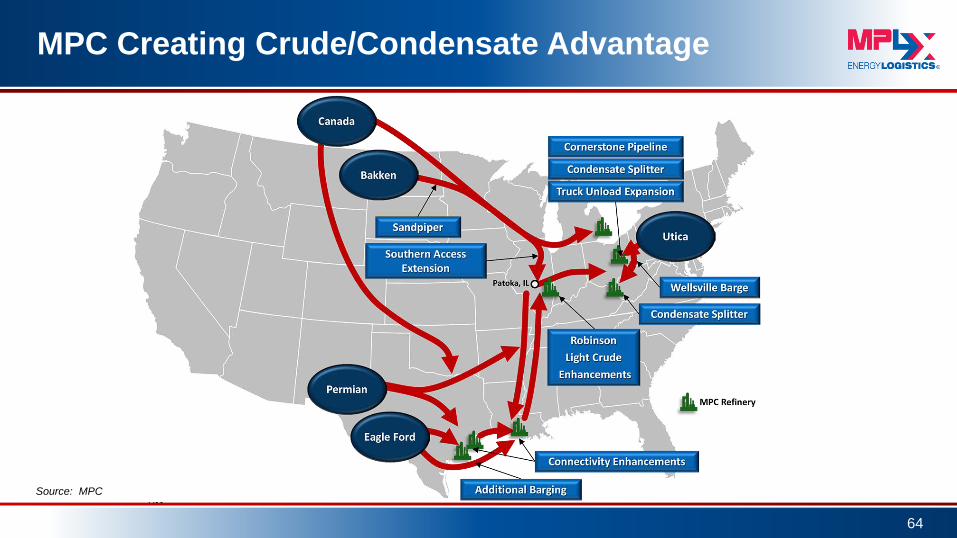
MPC Creating Crude/Condensate Advantage
64
Source: MPC

U.S./Canada Key Existing and Planned Pipelines
65
MBPD Pipeline In Service
Date
300 Line 9 Reversal 2015
300 SAX 2015
200 Diamond 2016
450 Dakota Access 2016
450 ETCO
(Trunkline Conversion)
2016
225-375 Sandpiper 2017
300
+590
Trans Mountain
Trans Mountain Expansion
Current
2017
830 Keystone XL 2018
1,100 Energy East 2018
525 Northern Gateway 2018+
Sources: Publicly available Information

MPC Balance in Refining Network
66
Midwest Capacity
674,000 BPCD
Louisiana Capacity
522,000 BPCD Texas Capacity
535,000 BPCD
Source: MPC data as reported in the Oil & Gas Journal effective December 31, 2014
Canton (Ohio) 90,000
Catlettsburg (Ky.) 242,000
Detroit (Mich.) 130,000
Robinson (Ill.) 212,000
Galveston Bay
(Texas) 451,000
Texas City (Texas) 84,000
Garyville (La.) 522,000
Total 1,731,000
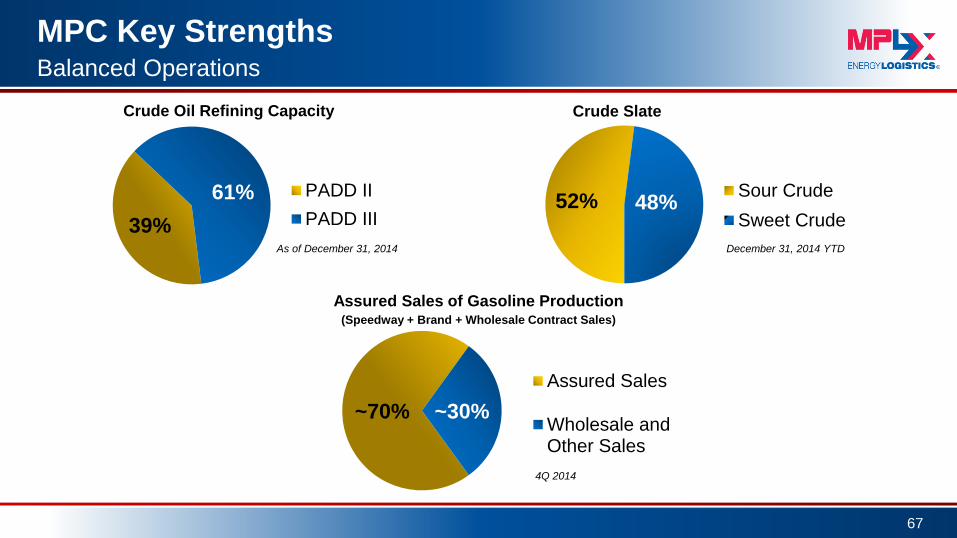
MPC Key Strengths
67
Balanced Operations
39%
61%
Crude Oil Refining Capacity
PADD II
PADD III52% 48%
Crude Slate
Sour Crude
Sweet Crude
~70% ~30%
Assured Sales
Wholesale andOther Sales
Assured Sales of Gasoline Production (Speedway + Brand + Wholesale Contract Sales)
4Q 2014
As of December 31, 2014 December 31, 2014 YTD
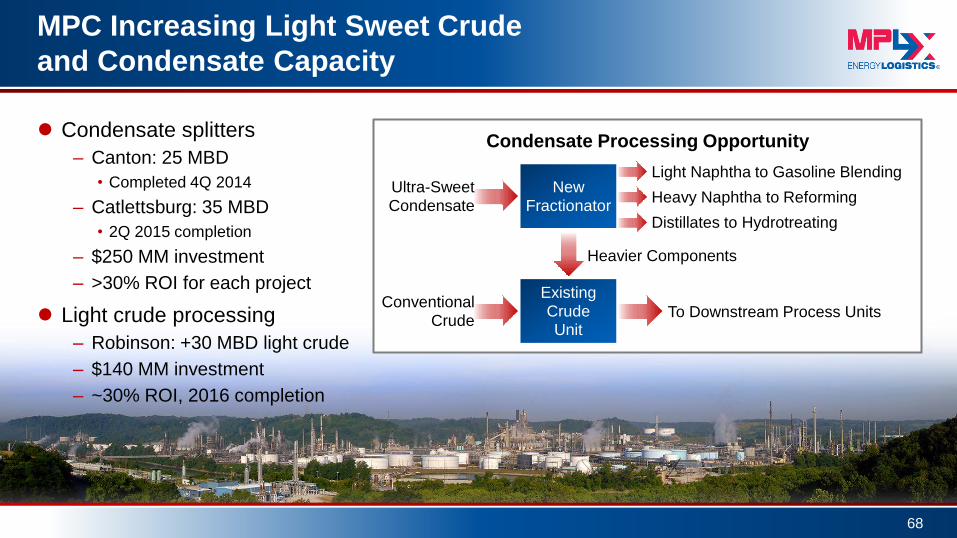
MPC Increasing Light Sweet Crude
and Condensate Capacity
68
Condensate splitters
– Canton: 25 MBD
• Completed 4Q 2014
– Catlettsburg: 35 MBD
• 2Q 2015 completion
– $250 MM investment
– >30% ROI for each project
Light crude processing
– Robinson: +30 MBD light crude
– $140 MM investment
– ~30% ROI, 2016 completion
Condensate Processing Opportunity
Existing Crude Unit
New Fractionator
Light Naphtha to Gasoline Blending
Heavy Naphtha to Reforming
Heavier Components
To Downstream Process Units
Distillates to Hydrotreating
Ultra-Sweet Condensate
Conventional Crude

MPC Leveraging Existing Capacity
to Run Light Sweet Crude
48% sweet crude oil throughput
2014 versus 68% sweet crude oil capacity
Reformer capacity captures full
value of light crude processing
Additional value added through aromatics
production
69
0
5
10
15
20
25
30
MPC Midwest MPC USGC
% o
f C
rude
Ca
pa
city Reforming Capacity
Source: 2015 Oil & Gas Journal
Industry
Average
Sources: Argus DeWitt Aromatics Reports 2011-12 and MPC internal data. Benzene, toluene, mixed xylenes, and cumene shown. Xylene revised.
0
40
80
120
MB
PC
D
U.S. Aromatics Capacity
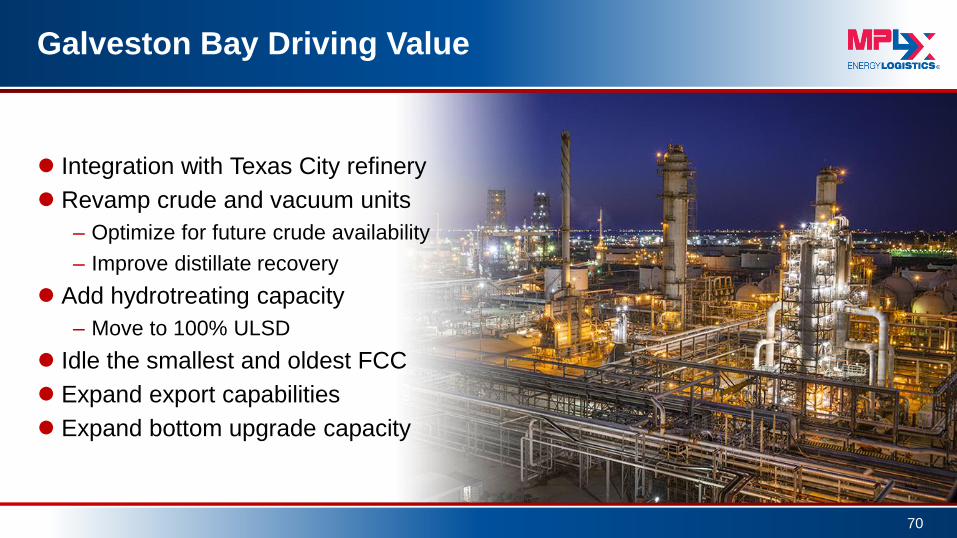
Galveston Bay Driving Value
70
Integration with Texas City refinery
Revamp crude and vacuum units
– Optimize for future crude availability
– Improve distillate recovery
Add hydrotreating capacity
– Move to 100% ULSD
Idle the smallest and oldest FCC
Expand export capabilities
Expand bottom upgrade capacity

Speedway Value
Top-tier performance in the
convenience store industry
Scalable technology and
organizational infrastructure
Disciplined expense control
Highly successful consumer loyalty program
Leverage integration value within MPC’s
infrastructure
71
63%
37%
Total Gross Margin Mix
Light
Product
Merchandise
2011-2014 Average
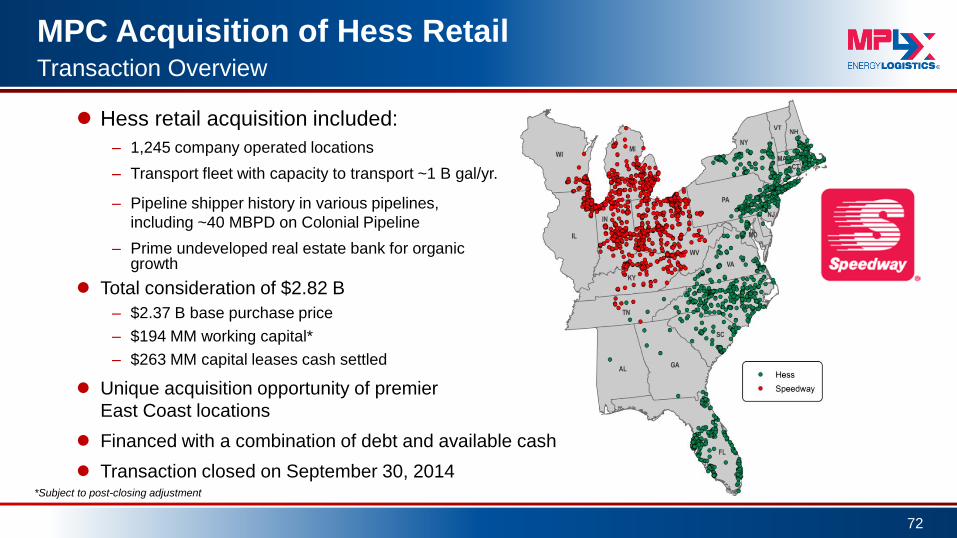
MPC Acquisition of Hess Retail
72
Transaction Overview
Hess retail acquisition included:
– 1,245 company operated locations
– Transport fleet with capacity to transport ~1 B gal/yr.
– Pipeline shipper history in various pipelines,
including ~40 MBPD on Colonial Pipeline
– Prime undeveloped real estate bank for organic growth
Total consideration of $2.82 B
– $2.37 B base purchase price
– $194 MM working capital*
– $263 MM capital leases cash settled
Unique acquisition opportunity of premier
East Coast locations
Financed with a combination of debt and available cash
Transaction closed on September 30, 2014 *Subject to post-closing adjustment
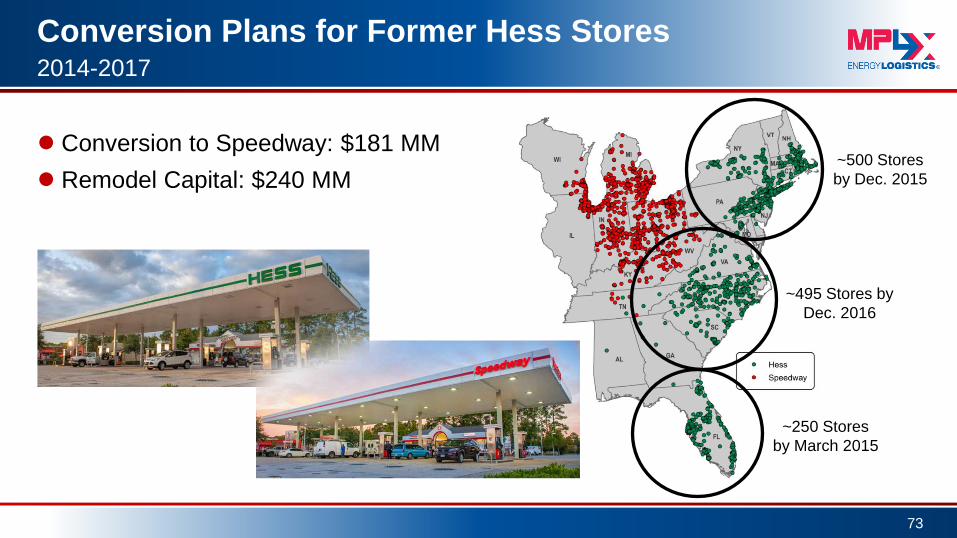
Conversion Plans for Former Hess Stores
73
2014-2017
Conversion to Speedway: $181 MM
Remodel Capital: $240 MM
~250 Stores
by March 2015
~500 Stores
by Dec. 2015
~495 Stores by
Dec. 2016
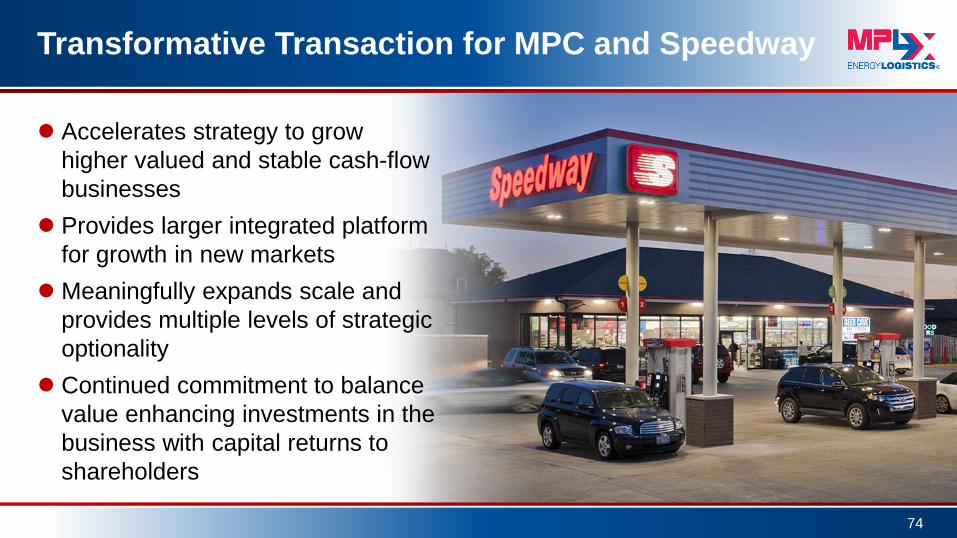
Transformative Transaction for MPC and Speedway
74
Accelerates strategy to grow
higher valued and stable cash-flow
businesses
Provides larger integrated platform
for growth in new markets
Meaningfully expands scale and
provides multiple levels of strategic
optionality
Continued commitment to balance
value enhancing investments in the
business with capital returns to
shareholders
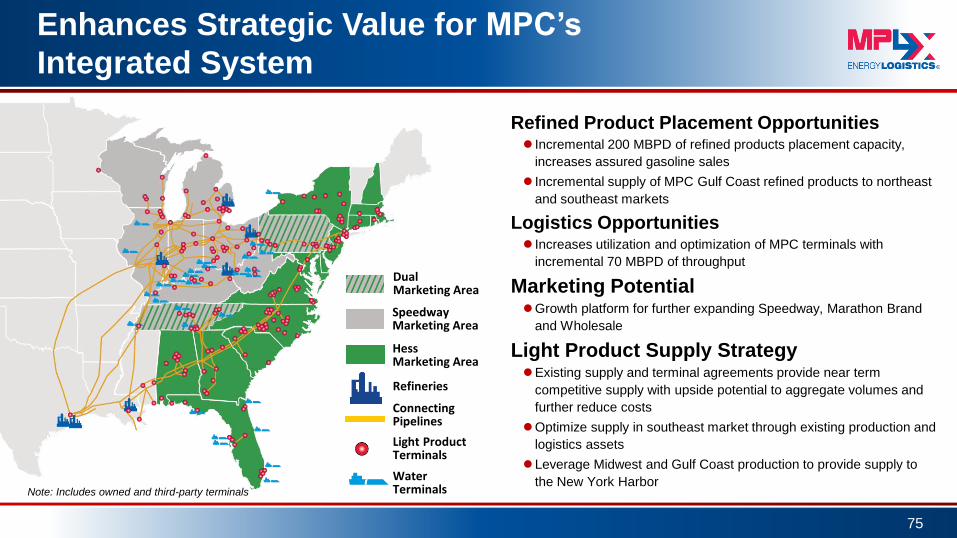
Enhances Strategic Value for MPC’s
Integrated System
Refined Product Placement Opportunities Incremental 200 MBPD of refined products placement capacity,
increases assured gasoline sales
Incremental supply of MPC Gulf Coast refined products to northeast
and southeast markets
Logistics Opportunities Increases utilization and optimization of MPC terminals with
incremental 70 MBPD of throughput
Marketing Potential Growth platform for further expanding Speedway, Marathon Brand
and Wholesale
Light Product Supply Strategy Existing supply and terminal agreements provide near term
competitive supply with upside potential to aggregate volumes and
further reduce costs
Optimize supply in southeast market through existing production and
logistics assets
Leverage Midwest and Gulf Coast production to provide supply to
the New York Harbor
75
Note: Includes owned and third-party terminals
Water Terminals
Light Product Terminals
Connecting Pipelines
Refineries
Hess Marketing Area
Speedway Marketing Area
Dual Marketing Area
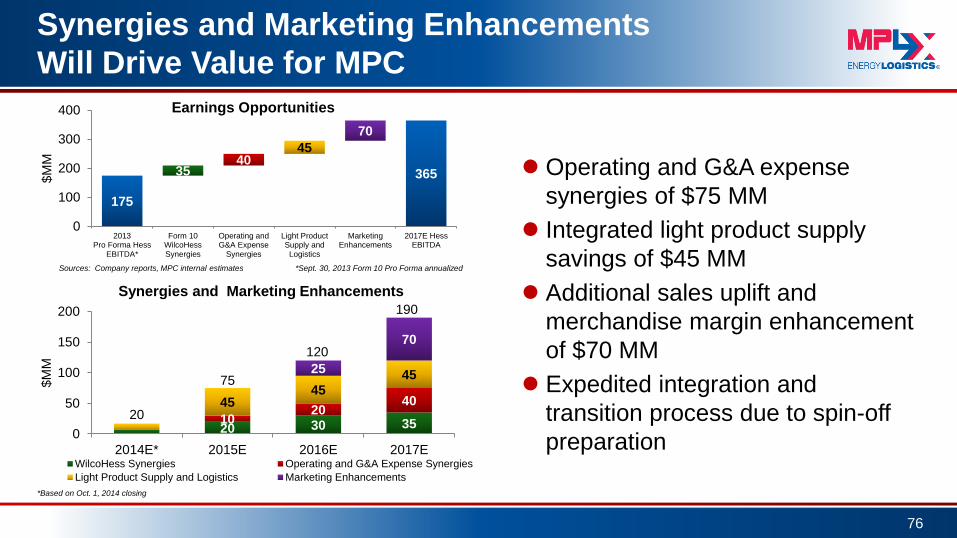
Synergies and Marketing Enhancements
Will Drive Value for MPC
Operating and G&A expense
synergies of $75 MM
Integrated light product supply
savings of $45 MM
Additional sales uplift and
merchandise margin enhancement
of $70 MM
Expedited integration and
transition process due to spin-off
preparation
76
175
365 35 40
45
70
0
100
200
300
400
2013Pro Forma Hess
EBITDA*
Form 10WilcoHessSynergies
Operating andG&A Expense
Synergies
Light ProductSupply and
Logistics
MarketingEnhancements
2017E HessEBITDA
$M
M
Earnings Opportunities
20 30 35 10 20
40 45 45
45 25
70
0
50
100
150
200
2014E* 2015E 2016E 2017E
$M
M
Synergies and Marketing Enhancements
WilcoHess Synergies Operating and G&A Expense Synergies
Light Product Supply and Logistics Marketing Enhancements
Sources: Company reports, MPC internal estimates *Sept. 30, 2013 Form 10 Pro Forma annualized
*Based on Oct. 1, 2014 closing
20
75
120
190
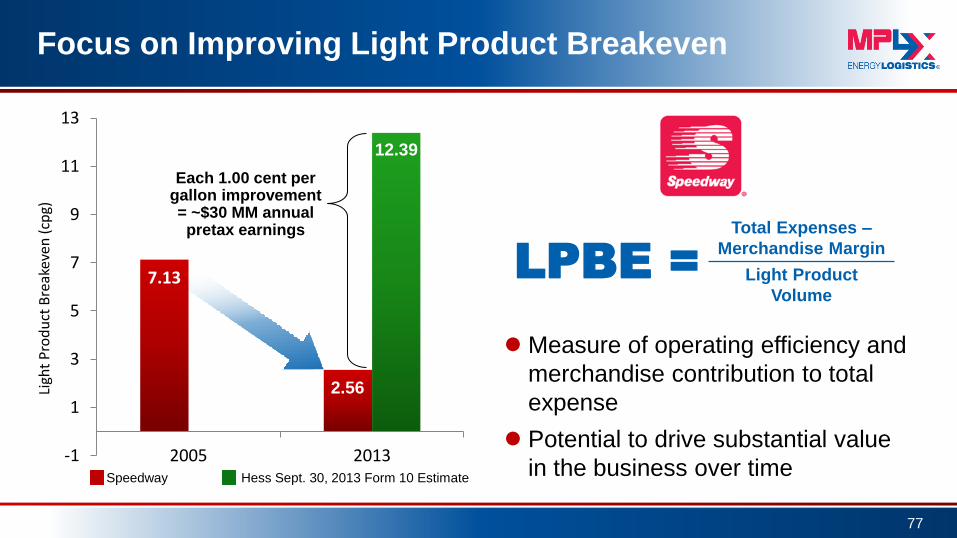
Focus on Improving Light Product Breakeven
Measure of operating efficiency and
merchandise contribution to total
expense
Potential to drive substantial value
in the business over time
77
7.13
-1
1
3
5
7
9
11
13
2005 2013
Ligh
t P
rod
uct
Bre
akev
en (
cpg)
2.56
12.39
Each 1.00 cent per gallon improvement = ~$30 MM annual pretax earnings
Speedway Hess Sept. 30, 2013 Form 10 Estimate
LPBE =
Total Expenses –
Merchandise Margin
Light Product
Volume

Speedway and Hess Side-by-Side Comparison
Speedway generates an incremental $17,300 of merchandise margin per store per month
~$250 MM of additional annual merchandise margin potential across Hess retail
78
Hessa Speedwayb
Company Operated Sites 1,255 1,478
Fuel Sales (gallons/store/month)
198,500 177,400
Fuel Margin ($/gallon)
$0.137 $0.144
Merchandise Sales ($/store/month)
$111,000 $176,800
Merchandise Margin ($/store/month)
$29,200 $46,500
a) 2013PF data provided in Hess retail Corporation Form 10 SEC filing
b) 2013 data provided in Marathon Petroleum Company 10K SEC filing

MPC Annual Price and Margin Sensitivities
79
$MM (After Tax)
LLS 6-3-2-1 Crack Spread* Sensitivity ~$450
(per $1.00/barrel change)
Sweet/Sour Differential** Sensitivity ~$200 (per $1.00/barrel change)
LLS-WTI Spread*** Sensitivity ~$100 (per $1.00/barrel change)
Natural Gas Price Sensitivity ~$140
(per $1.00/MMbtu change in Henry Hub)
*Weighted 38% Chicago and 62% USGC LLS 6-3-2-1 crack spreads and assumes all other differentials and pricing relationships remain unchanged
**Light Louisiana Sweet (prompt) - [Delivered cost of sour crudes: Arab Light + Kuwait + Maya + Western Canadian Select + Mars]
***Assumes 20% of crude throughput volumes are WTI-based domestic crudes

MPLX Adjusted EBITDA Reconciliation
from Net Income
80
($MM) 2013 4Q 2014
Annualized
Dec. 2015
Annualized
Net income 146 146 305
Less: Net income attributable to MPC-
retainretained interest 68 29 1
Net income attributable to MPLX LP 78 117 304
Plus: Net income attributable to MPC-
retained interest 68 29 1
Depreciation 49 51 71
Provision for income taxes - (1) 4
Non-cash equity-based compensation 1 3 -
Net interest and other financial costs 1 9 71
Adjusted EBITDA 197 208 451
Less: Adjusted EBITDA attributable to MPC-
retainretained interest 86 38 1
Adjusted EBITDA attributable to MPLX LP 111 170 450
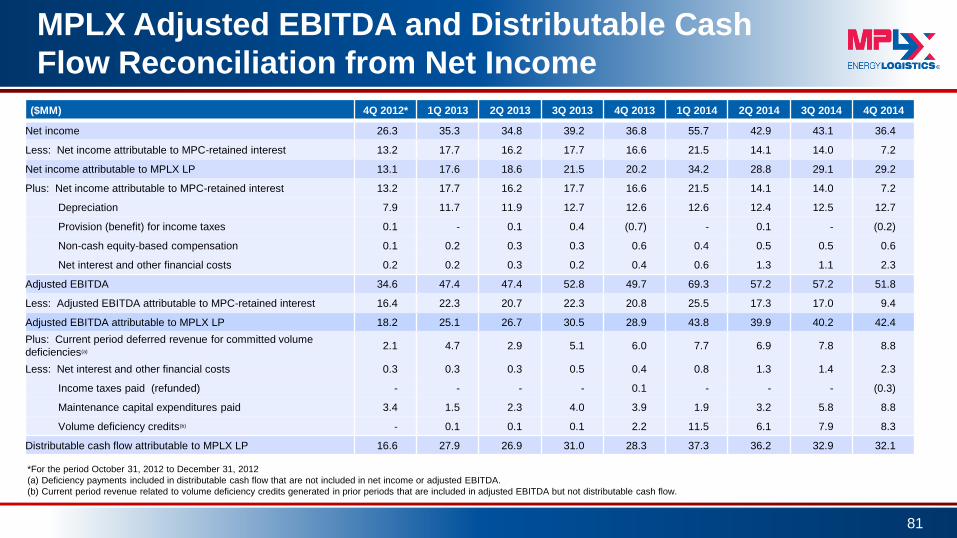
MPLX Adjusted EBITDA and Distributable Cash
Flow Reconciliation from Net Income
81
($MM) 4Q 2012* 1Q 2013 2Q 2013 3Q 2013 4Q 2013 1Q 2014 2Q 2014 3Q 2014 4Q 2014
Net income 26.3 35.3 34.8 39.2 36.8 55.7 42.9 43.1 36.4
Less: Net income attributable to MPC-retained interest 13.2 17.7 16.2 17.7 16.6 21.5 14.1 14.0 7.2
Net income attributable to MPLX LP 13.1 17.6 18.6 21.5 20.2 34.2 28.8 29.1 29.2
Plus: Net income attributable to MPC-retained interest 13.2 17.7 16.2 17.7 16.6 21.5 14.1 14.0 7.2
Depreciation 7.9 11.7 11.9 12.7 12.6 12.6 12.4 12.5 12.7
Provision (benefit) for income taxes 0.1 - 0.1 0.4 (0.7) - 0.1 - (0.2)
Non-cash equity-based compensation 0.1 0.2 0.3 0.3 0.6 0.4 0.5 0.5 0.6
Net interest and other financial costs 0.2 0.2 0.3 0.2 0.4 0.6 1.3 1.1 2.3
Adjusted EBITDA 34.6 47.4 47.4 52.8 49.7 69.3 57.2 57.2 51.8
Less: Adjusted EBITDA attributable to MPC-retained interest 16.4 22.3 20.7 22.3 20.8 25.5 17.3 17.0 9.4
Adjusted EBITDA attributable to MPLX LP 18.2 25.1 26.7 30.5 28.9 43.8 39.9 40.2 42.4
Plus: Current period deferred revenue for committed volume
deficiencies(a) 2.1 4.7 2.9 5.1 6.0 7.7 6.9 7.8 8.8
Less: Net interest and other financial costs 0.3 0.3 0.3 0.5 0.4 0.8 1.3 1.4 2.3
Income taxes paid (refunded) - - - - 0.1 - - - (0.3)
Maintenance capital expenditures paid 3.4 1.5 2.3 4.0 3.9 1.9 3.2 5.8 8.8
Volume deficiency credits(b) - 0.1 0.1 0.1 2.2 11.5 6.1 7.9 8.3
Distributable cash flow attributable to MPLX LP 16.6 27.9 26.9 31.0 28.3 37.3 36.2 32.9 32.1
*For the period October 31, 2012 to December 31, 2012
(a) Deficiency payments included in distributable cash flow that are not included in net income or adjusted EBITDA.
(b) Current period revenue related to volume deficiency credits generated in prior periods that are included in adjusted EBITDA but not distributable cash flow.
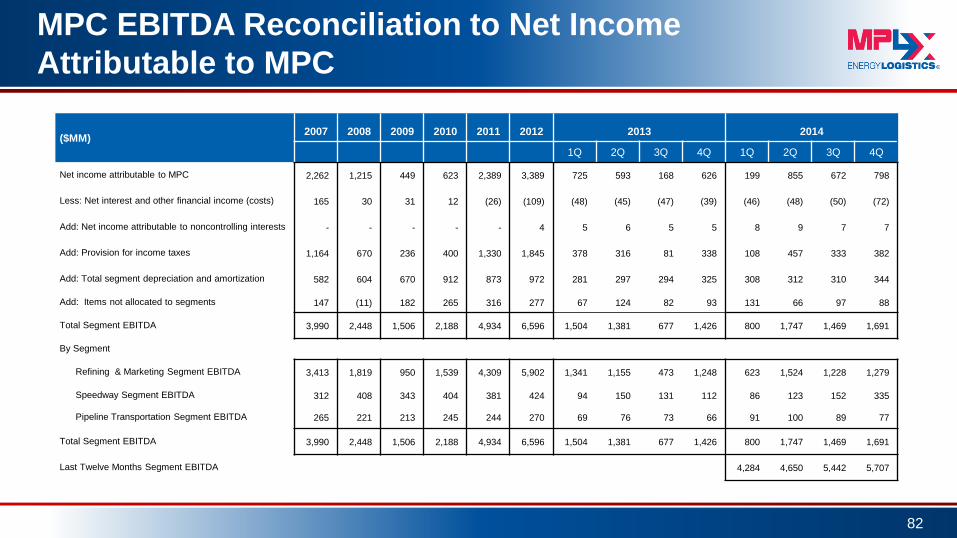
MPC EBITDA Reconciliation to Net Income
Attributable to MPC
82
($MM) 2007 2008 2009 2010 2011 2012 2013 2014
1Q 2Q 3Q 4Q 1Q 2Q 3Q 4Q
Net income attributable to MPC 2,262 1,215 449 623 2,389 3,389 725 593 168 626 199 855 672 798
Less: Net interest and other financial income (costs) 165 30 31 12 (26) (109) (48) (45) (47) (39) (46) (48) (50) (72)
Add: Net income attributable to noncontrolling interests - - - - - 4 5 6 5 5 8 9 7 7
Add: Provision for income taxes 1,164 670 236 400 1,330 1,845 378 316 81 338 108 457 333 382
Add: Total segment depreciation and amortization 582 604 670 912 873 972 281 297 294 325 308 312 310 344
Add: Items not allocated to segments 147 (11) 182 265 316 277 67 124 82 93 131 66 97 88
Total Segment EBITDA 3,990 2,448 1,506 2,188 4,934 6,596 1,504 1,381 677 1,426 800 1,747 1,469 1,691
By Segment
Refining & Marketing Segment EBITDA 3,413 1,819 950 1,539 4,309 5,902 1,341 1,155 473 1,248 623 1,524 1,228 1,279
Speedway Segment EBITDA 312 408 343 404 381 424 94 150 131 112 86 123 152 335
Pipeline Transportation Segment EBITDA 265 221 213 245 244 270 69 76 73 66 91 100 89 77
Total Segment EBITDA 3,990 2,448 1,506 2,188 4,934 6,596 1,504 1,381 677 1,426 800 1,747 1,469 1,691
Last Twelve Months Segment EBITDA 4,284 4,650 5,442 5,707

Reconciliation
83
MPC Free Cash Flow to Net Cash Provided by Operations
($MM) 2014
(For the Quarter) 1Q 2Q 3Q 4Q
Net cash provided by operating
activities 766 878 1,078 388
Additions to property, plant and
equipment (267) (302) (383) (528)
Acquisitions* - (42) (4) -
Investments (123) (41) (177) (72)
Contingent Consideration - - (172) -
Free cash flow 376 493 342 (212)
Last twelve months free cash flow 999
*Represents cash paid, excludes acquisition of Hess’ retail operations and related assets.
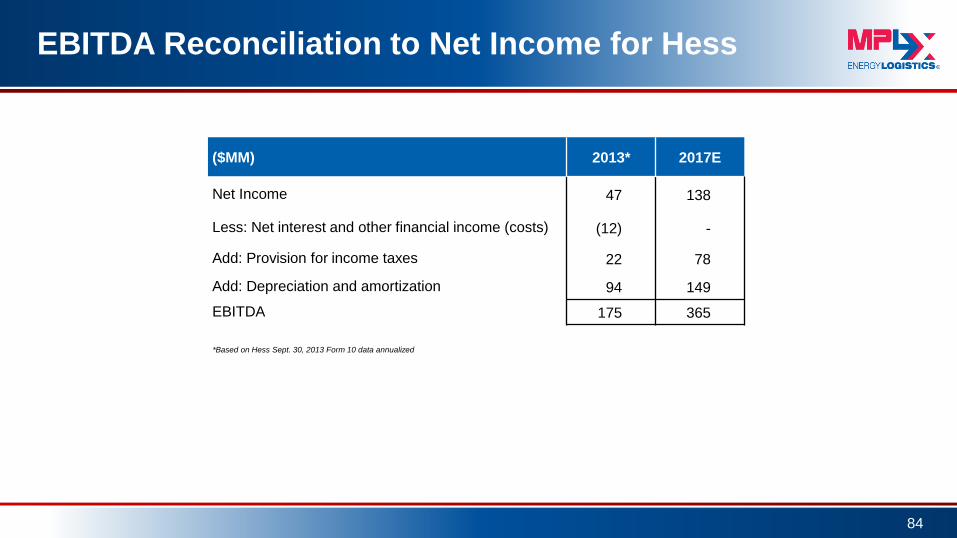
EBITDA Reconciliation to Net Income for Hess
84
($MM) 2013* 2017E
Net Income 47 138
Less: Net interest and other financial income (costs) (12) -
Add: Provision for income taxes 22 78
Add: Depreciation and amortization 94 149
EBITDA 175 365
*Based on Hess Sept. 30, 2013 Form 10 data annualized
85