barclays plc annual report 2018 · barclays bank plc is the non-ring-fenced bank of barclays plc...
TRANSCRIPT
Barclays Bank PLC Annual Report
31 December 2018
home.barclays/annualreport Barclays Bank PLC Annual Report 1

home.barclays/annualreport Barclays Bank PLC Annual Report 2

Table of Contents
Page Strategic Report Performance review 4 Operational performance 6 Risk management 9 Performance measures 11 Governance Chairman’s introduction 16 Corporate governance statement 19 Directors’ reports 25 People 29 Risk review Risk review contents 31 Risk management strategy 34 Material existing and emerging risks 37 Principal risk management 45 Risk performance 60 Supervision and regulation 123 Financial statements Financial statements contents 133 Consolidated financial statements 145 Notes to the financial statements 157
home.barclays/annualreport Barclays Bank PLC Annual Report 3

Strategic report Performance review
The Strategic Report was approved by the Board of Directors on 20 February 2019 and signed on their behalf by the Chairman. Overview Barclays Bank PLC is the non-ring-fenced bank of Barclays PLC and consists of the Corporate and Investment Bank (CIB), Consumer, Cards and Payments (CCP) and the Head Office. Whereas Barclays Bank PLC is the legal entity non-ring-fenced bank of Barclays PLC, Barclays International is the managed division of Barclays PLC, representing CIB and CCP. Following the court approval of the ring-fencing transfer scheme in March 2018, the UK banking business largely comprising Personal Banking, Barclaycard Consumer UK and Business Banking was transferred from Barclays Bank PLC to Barclays Bank UK PLC, the ring-fenced bank, on 1 April 2018 to meet the regulatory ring-fencing requirement in accordance with the Financial Services (Banking Reform) Act 2013 and related legislation. The net assets transferred from Barclays Bank PLC to Barclays Bank UK PLC amounted to £15.9bn comprising all the assets and liabilities of the Barclays UK division. From that point, Barclays Bank UK PLC ceased to be a subsidiary of Barclays Bank PLC and became a direct subsidiary of the ultimate parent, Barclays PLC. The consolidation of the parent entity, Barclays Bank PLC and its subsidiaries, is referred to as Barclays Bank Group. Strategy Barclays Bank Group has a unique transatlantic footprint anchored in the world’s deepest and most sophisticated capital markets, London and New York. With relentless focus on delivering for customers and clients in our UK and US home markets and around the world, Barclays Bank Group’s diversified business portfolio provides balance, resilience and exciting growth opportunities. Barclays Bank PLC has strong global market positions, and continues to invest in people and technology in order to deliver sustainably improved returns. We are making strategic investments to seize the clear growth prospects each business presents. Similarly, we continue to build a great culture where our strong conduct and rigorous controls environment enable us to deliver the right outcomes for all our stakeholders. Business Model Barclays Bank Group’s diversified business model offers products and services designed for larger corporate, wholesale and international banking customers and clients around the world, and provides Barclays PLC’s shareholders a mix of revenue streams that benefit from different stages of the economic cycle. The business structure comprises the Corporate and Investment Bank, Consumer, Cards and Payments and the Head Office. CIB includes Banking, Corporate Banking and Markets businesses which aid institutions, governments and corporate clients in managing their funding, financing, and risk management needs. CCP includes Cards & Payments and Private Bank & Overseas Services offering consumer credit cards and banking, and private banking, investment and wealth management services, in addition to payment solutions to clients. The Head Office function contains the central operations of Barclays Bank Group.
Customers and clients
Products and Services Value Creation Contribution to Barclays Group
• Consumers • Corporates • Financial institutions • Governments • High and ultra-high net
worth individuals and family offices
• Money managers and Institutional investors
• Corporate banking • Investment banking • Non-UK consumer
banking, cards and lending
• Payments • Securities sales, trading
and research • Wealth management
• To our customers and clients – we connect providers and users of capital, and provide access to banking products to customers
• To society – we facilitate sustainable economic growth
• To Barclays PLC – we deliver sustainable returns from our diversified portfolio of businesses
• Income: £13,600m • PBT: £1,268m
home.barclays/annualreport Barclays Bank PLC Annual Report 4

Market and operating environment The markets in 2018 were characterised by US economic outperformance, including further labour market improvements and on-target inflation rates. Against this backdrop, short-term US interest rates increased further, ahead of other core markets, and the US dollar strengthened. While market volatility remained generally low, isolated bouts of volatility resulted in a more uneven equity performance. In the UK, growth softened further amid heightened uncertainty around Brexit developments, reflected in a volatile and depreciating sterling.
Alongside establishing the ring fenced bank and non-ringfenced bank in April 2018 in response to the UK government’s ring-fencing legislation, we have also been working on plans with respect to the UK’s departure from the European Union (EU) in 2019. Our plans are driven by an overriding commitment to preserve seamless ongoing EU market access for Barclays Bank PLC and our customers and clients. A key element of our plans was to seek regulatory authorisations from the Central Bank of Ireland and the European Central Bank to expand the operations of Barclays Bank Ireland PLC: Barclays PLC has had a banking licence in Ireland for almost 40 years. During 2018, we received the necessary authorisations, scaled up our presence in Ireland, and began the transfer of our European branches from Barclays Bank PLC to Barclays Bank Ireland PLC. We remain confident in our ability to serve our customers and clients once the UK’s withdrawal is complete.
Our US Intermediate Holding Company (IHC) received positive feedback from the US Federal Reserve on the IHC’s first-ever public stress test submissions, indicating the strength of the IHC’s capital position. The IHC, which we established in 2016, is an umbrella holding company for our US subsidiaries including the US broker-dealer that operates key investment banking businesses and the entity that operates Cards & Payments in the US. Risks to the operating model Geopolitical and macroeconomic uncertainty in some markets remain a risk, while the volume and reach of regulatory change continues to require significant attention.
The potential impact of longer term uncertainty is a sustained low rate environment predominately impacting revenues and driving cautious market activity. This was evident in 2018, and created a challenging operating environment for corporate and investment banking activities in particular. As we accelerated our growth efforts in 2018, we increased our focus on ensuring that new revenue opportunities do not compromise our prudent approach to risk, or our ability to generate sustainable returns. Coupled with our cost efficiency programmes, this balanced approach is designed to deliver a more attractive bottom line.
We have a conservative risk profile, and continue to work to maintain the quality of our lending book. The quality of our US credit card portfolios has been consistent with the overall industry and key competitors. After an increase in delinquency rates in 2017, rates moderated for both the industry and Barclays in 2018. Loss and arrears rates are still below the long term average and below pre-recession levels, driven in part by favourable US GDP growth and low unemployment rates. We continue to monitor overall growth in unsecured debt across the industry, particularly relative to wage growth, and during 2018 unsecured debt growth slowed to 4.9% compared with 6.7% in 2017.
We continue to invest to ensure our infrastructure is resilient to cyber-crime, conducting comprehensive penetration testing, supported by the deployment of a number of best-in-class malware detection tools. Key highlights of the year Barclays Bank Group delivered profit before tax across all four quarters in CIB and CCP, while absorbing in the Head Office the £1.4bn settlement with the US Department of Justice (DoJ) relating to Residential Mortgage-Backed Securities (RMBS). This demonstrates the increasing ability of our diversified portfolio of businesses to deliver sustainable growth.
We continually evaluate our entire portfolio of businesses for capital, leverage, risk assets and funding across all jurisdictions and legal entities. This helps us to further enhance both our operational discipline and precision in our capital allocation to deliver stronger returns.
Identifying the right talent to execute on our ambitions remains fundamental to our growth strategy. Over the course of the year, we hired several experienced professionals to bring complementary skills to our leadership team, and made strategic appointments in areas where we see opportunities for growth, including a significant number of internal promotions.
To enable our people to deliver the best outcomes for our customers and clients, we focused our technology investment on commercially impactful enhancements, and this focus remains a hallmark of our strategy for the year ahead. Key initiatives ranged from new data science and algorithmic capabilities, to an enhanced digital experience for our customers and clients.
We are already seeing results of investing in our businesses. For example, our Equities franchise delivered a standout performance this year, with revenue growth outpacing competitors. Similarly, we are seeing growth in our newly launched US consumer loans product, which complements our US cards business.
During the year, we also continued to contribute to society, from launching a new housing development fund to creating pathways to employment, and from mentoring entrepreneurs to structuring sustainability-linked loans.
Building on our progress is the mission of every colleague in Barclays Bank Group. We are confident in our ability to build on the commercial focus we demonstrated in 2018, and to deliver the right outcomes for all our stakeholders.
home.barclays/annualreport Barclays Bank PLC Annual Report 5
Strategic report Operational performance
Corporate and Investment Bank The Corporate and Investment Bank comprises principally of the Banking, Corporate Banking and Markets businesses which aid money managers institutions, governments and corporate clients in managing their funding, financing, and risk management needs. Banking Banking provides clients with long-term strategic advice on mergers and acquisitions (M&A), corporate finance and financial risk management solutions, as well as equity and debt capital raising services. In 2018 across the industry, fees were down approximately 4% globally, with some products and regions down double digits. Barclays’ global investment banking fee share was 4.2%, consistent with our performance in 2017. In Europe and the Middle East, we ranked fifth for all Banking products, our highest ever full-year ranking. In the Americas we ranked sixth, and remain the highest-ranked European investment bank. Our Asia Pacific franchise continues to perform well. Our performance was bolstered by a standout year in M&A, where we attained our highest global fee share in four years and ranked top five in Americas M&A for the third consecutive year. In Debt Underwriting we ranked in the top four in global fee share for the third consecutive year, driven by a continued strong presence in both the leveraged finance and investment grade primary debt markets. Our Equity Underwriting business performed well in a very challenging market environment, winning our highest ever ranking in European rights offerings, and continued to demonstrate momentum in initial public offerings (IPOs), where we book-ran five of the year’s ten largest IPOs from the Americas, Europe and the Middle East. During 2018 our new Social Impact Banking group structured the first sustainability-linked loans in the US. More than 100 of our Banking colleagues mentored entrepreneurs as part of the third annual Unreasonable Impact programme, the world’s first international network of accelerators focused on scaling up entrepreneurial businesses that will help employ thousands worldwide while solving some of society’s most pressing challenges. Barclays Bank Group was the recipient of multiple industry awards in 2018, including being named by Euromoney as the UK’s Best Investment Bank for the third consecutive year (and sixth time in the last seven years), and as Western Europe’s Best Bank for Financing. In addition, Global Capital ranked Barclays Bank Group as the Best Corporate Broker in the UK for the third year running, and IFR magazine named Barclays Bank Group its North America Asset-Backed Securitisation House of the Year. In the year ahead, we see opportunities to improve further the performance of Banking by investing in talent in key products and sectors and continuing to build on our historical strength in debt underwriting. Corporate Banking Our Corporate Banking business provides GBP and EUR working capital and transaction banking services, including trade and payments, for multinational corporates and institutions, and UK large and medium size corporate clients. Our new Corporate Banking leadership is focused on enhancing our offering. During the year, we developed a new multi-country digital banking platform, primarily supporting Corporate and Investment Bank clients, which was most recently rolled out in Ireland and Germany. In Q3 2018 Corporate Banking and the UK government launched a £1bn housing development fund to boost the delivery of new housing in England, and also launched a £300m ENABLE Guarantee cashback scheme with the British Business Bank to boost asset finance lending to SMEs. Corporate Banking has also driven stronger client relationships through innovative programmes like Connect with Work, which builds bridges between people who face barriers to getting into work and businesses that are recruiting but struggling to find suitable candidates. Through significant investments in our technology, we are increasing the resiliency and performance of our digital client experience. These investments will continue to be a focus for the year ahead, alongside enhancing our competitive position in the UK, and growing our transaction banking revenues globally, expanding our European cash management platform, and continuing to enhance the commercial effectiveness of our lending book. Markets Our Markets business provides a broad range of clients with market insight, execution services, and tailored risk management and financing solutions across equities, credit, rates and foreign exchange (FX) products. We made good progress in 2018 on our strategy to rebuild our franchise and transform performance over the long term. Supported by our investments in financial resources, technology, and human capital, our business this year increased market share across each asset class and delivered five consecutive quarters of outperformance vs. our peers. In a year of challenging market conditions, our Credit and Macro (Rates and FX) businesses - which we report as FICC (Fixed Income, Credit and Commodities) - produced steady performances, driven by revenue diversification in Credit and market share gains in Macro. Revenue growth in our Equities franchise outperformed our competitors, driven by strong performances in derivatives and equity financing. We also made significant progress in building out our electronic platform capabilities across all asset classes enabling best-in-class execution for clients. We continued to help clients navigate market events and volatility, and maintained or improved our position in a number of markets. For example, Barclays was one of three banks chosen to execute the first-ever bond issue and the first-ever asset backed commercial paper transaction, based on the new Secured Overnight Financing Rate (SOFR). Additionally, we are a top-three ranked broker by traded notional on the Tokyo Stock Exchange (TSE) with over 100 trillion yen traded for our clients in 2018, equating to a more than 10% market share.
home.barclays/annualreport Barclays Bank PLC Annual Report 6

The clients who generate the highest returns for market-making businesses consistently allocate the greatest and most profitable share of their activity to full service markets franchises. To better meet the needs of these clients – typically the world’s largest money managers – and therefore to improve returns, in 2019 we plan to pursue targeted growth and diversification opportunities. Our dialogue with clients regarding these initiatives gives us confidence that these investments will drive the right commercial outcomes. Research Our Research team's mission is to affect clients' decision-making through independent, thought-leading, differentiated insights on equity and debt, as well as on the macro trends shaping the global economy. To enhance our relevance to clients, particularly after the implementation of MiFID II, we continue to invest in our analysts and the digital capabilities supporting their work, as well as in best-in-class platforms to disseminate their insights. The Research Data Science Platform we are building will become an increasingly important differentiator for us, with state-of-the-art data infrastructure operated by leading data scientists and leveraging alternative data sets in innovative ways. Partnerships with research aggregators and new multimedia capabilities are helping clients interact with us in the channels of their choice, and report enhanced categorisation is bringing our best content to a broader audience. The insights generated by our analysts drive connectivity with clients across the Investment Bank, with particularly strong client engagement on cross-asset, cross-regional perspectives, and our teams' industry rankings demonstrate their relevance in helping clients understand the markets in a challenging year.
home.barclays/annualreport Barclays Bank PLC Annual Report 7

Strategic report Operational performance
Consumer, Cards and Payments Consumer, Cards and Payments includes Cards & Payments, and Private Bank & Overseas Services. Cards & Payments provides branded and co-branded consumer credit cards, lending and deposit accounts to our customers in the US and Germany, and payment solutions to our customers and clients in the UK. Private Bank & Overseas Services provides banking, credit and investment services to retail, high-net worth and ultra-high net worth clients, family offices, businesses, corporates and fiduciaries internationally. Cards & Payments Our Cards & Payments business operates across five business units: US Consumer Bank, Barclaycard Payment Solutions, Barclays Partner Finance, Barclaycard Commercial Payments and Barclaycard Germany. US Consumer Bank offers co-branded and branded credit cards in the US, along with consumer loans and online retail deposits. Across all credit card products, US Consumer Bank added over two million new accounts in 2018 while growing our consumer retail deposits to over US$14bn. We are among the top-ten credit card issuers in the market by total outstandings as at the end of 2018. Our strong position in the travel and entertainment industry continued with the launch of a new Frontier Airlines co-brand credit card. Our Uber Visa card and our JetBlue Plus Card appeared in U.S. News & World Report’s list of Best Travel Rewards Credit Cards. We also maintained our number three position in the 2018 J.D. Power US Credit Card Satisfaction Study. Driving continued strong growth in our US Consumer Bank – across online consumer banking and our partner cards franchise – is a strategic priority for us in 2019. Barclaycard Payment Solutions provides merchant acquiring, payments integration and acceptance, and payment gateway products in the UK. In 2018, we processed over £250bn in payments, making us one of the largest payment acceptance providers in Europe. During the year, we successfully migrated over 100,000 clients from across our small business and corporate client base onto our new BankWORKS platform. Clients now enjoy better and more resilient service, including new and improved statements and simplified and flexible pricing. Barclays Partner Finance provides point of sale finance products to consumers in the UK through a network of retailers and car dealerships. In 2018, we grew our existing partnerships, built relationships with new clients, won a number of industry awards, and retained our position as the market leader in the UK retail market. Barclaycard Commercial Payments provides commercial cards and virtual payment products in the UK. In 2018 we launched the UK’s first co-branded trade credit card partnership with Travis Perkins Group, and strengthened our presence in the travel industry by signing new partnerships with Amadeus, Paxport and Voxel. Barclaycard Germany is now over a quarter of a century old and serves over 1.3 million credit card, deposit and loan customers. We are the leading issuer of revolving credit cards in the country by outstanding balances. We also have a growing instalment loans business as well as an online deposit product. In 2018 we launched a new Barclaycard Visa credit card, and expanded our unique Equal Payment Plan (EPP) offering by enabling credit card customers to repay their credit card balance in fixed instalments. Barclaycard Germany continues to drive exceptional customer satisfaction rankings (RNPS), with the business ranking in the top two for both cards and loans. Barclays Bank Group is also a leading provider of credit cards and lending in Norway, Sweden and Denmark via our EnterCard joint venture with Swedbank. Private Bank & Overseas Services In the Private Bank we focus on bespoke solutions, ranging from standard to sophisticated, for our high net worth, ultra-high net worth and family office clients. Overseas services offers banking, investment and credit products and services to local residents and businesses based in Jersey, Guernsey and the Isle of Man, and serves non-UK based corporates and fiduciaries who have UK banking, credit and investment requirements. International Banking delivers banking, savings, mortgages and investment products to affluent international customers. Private Bank & Overseas Services delivered a strong performance during 2018. We continued to enhance our client offering with new products and services, which drove an underlying increase in client balances. The business delivered strong revenue growth year on year, and a good return on equity. We strive to build long-term value creation with our clients. Central to our strategy is continually enhancing our investment, banking and credit propositions. We have been developing differentiated capabilities in discretionary portfolio management, foreign exchange and real estate, and in bringing investment opportunities from our world-class Investment Bank.
home.barclays/annualreport Barclays Bank PLC Annual Report 8
Strategic report Risk management
Risk Management
Barclays Bank Group is exposed to internal and external risks as part of our on-going activities. These risks are managed as part of our business model.
Enterprise Risk Management Framework At Barclays Bank Group, risks are identified and overseen through the Enterprise Risk Management Framework (ERMF), which supports the business in its aim to embed effective risk management and a strong risk management culture. The ERMF is approved by the Barclays PLC board on recommendation of the Barclays Group Risk Officer; it is then adopted by the Barclays Bank Group with minor modifications where needed. The ERMF specifies the Principal Risks of Barclays Bank Group and the approach to managing them. Risk Appetite Risk Appetite defines the level of risk we are willing to take across the different risk types, taking into consideration varying levels of financial and operational stress. Risk Appetite is key for our decision making process, including ongoing business planning, new product approvals and business change initiatives. In recent years we have taken significant steps to de-risk our business, setting us up for sustainable growth in the future.
The management of risk is embedded into each level of the business, with all colleagues being responsible for identifying and controlling risks. Three Lines of Defence The First Line of Defence is comprised of the revenue generating and client facing areas, along with all associated support functions, including Finance, Treasury, Human Resources and Operations and Technology. The First Line identifies its risks, and sets the policies, standards and controls, within the criteria set by the Second Line of Defence. The Second Line of Defence is comprised of Risk and Compliance and oversees the First Line by setting the limits, rules and constraints on their operation, consistent with the Risk Appetite. The Third Line of Defence is comprised of Internal Audit, providing independent assurance to the Board and Executive Management. Although the Legal function does not sit in any of the three lines, it works to support them all and plays a key role in overseeing Legal Risk throughout the bank. The Legal function is also subject to oversight from the Risk and Compliance functions with respect to the management of operational and conduct risks.
Monitoring the Risk Profile Together with a strong governance process using Business and Group-level Risk Committees as well as Board level forums, the Barclays Bank PLC Board receives regular information in respect of the risk profile of Barclays Bank Group, and has ultimate responsibility for Risk Appetite and capital plans. We believe that our structure and governance will assist us in managing risk in changing economic, political and market environments.
home.barclays/annualreport Barclays Bank PLC Annual Report 9

Strategic report Risk management
Principal Risks are overseen by a dedicated Second Line function Risks are classified into Principal Risks, as below How risks are managed
Fina
ncia
l Pri
ncip
al R
isks
Credit Risk The risk of loss to the firm from the failure of clients, customers or counterparties, including sovereigns, to fully honour their obligations to the firm, including the whole and timely payment of principal, interest, collateral and other receivables.
Credit risk teams identify, evaluate, sanction, limit and monitor various forms of credit exposure, individually and in aggregate.
Market Risk
The risk of loss arising from potential adverse changes in the value of the firm’s assets and liabilities from fluctuation in market variables including, but not limited to, interest rates, foreign exchange, equity prices, commodity prices, credit spreads, implied volatilities and asset correlations.
A range of complementary approaches to identify and evaluate market risk are used to capture exposure to market risk. These are measured, limited and monitored by market risk specialists.
Treasury and Capital Risk
Liquidity risk: The risk that the firm is unable to meet its contractual or contingent obligations or that it does not have the appropriate amount, tenor and composition of funding and liquidity to support its assets.
Capital risk: The risk that the firm has an insufficient level or composition of capital to support its normal business activities and to meet its regulatory capital requirements under normal operating environments or stressed conditions (both actual and as defined for internal planning or regulatory testing purposes). This includes the risk from the firm’s pension plans.
Interest rate risk in the Banking Book: The risk that the firm is exposed to capital or income volatility because of a mismatch between the interest rate exposures of its (non-traded) assets and liabilities.
Treasury and capital risk is identified and managed by specialists in Capital Planning, Liquidity, Asset and Liability Management and Market Risk. A range of approaches are used appropriate to the risk, such as; limits; plan monitoring; and stress testing.
Non
-Fin
anci
al P
rinci
pal R
isks
Operational Risk
The risk of loss to the firm from inadequate or failed processes or systems, human factors or due to external events (e.g. fraud or cyber risk) where the root cause is not due to credit or market risks.
Barclays Bank Group assesses its operational risk and control environment across its businesses and functions with a view to maintaining an acceptable level of residual risk.
Model Risk The risk of the potential adverse consequences from financial assessments or decisions based on incorrect or misused model outputs and reports.
Models are evaluated for approval prior to implementation, and on an ongoing basis.
Reputation Risk
The risk that an action, transaction, investment or event will reduce trust in the firm’s integrity and competence by clients, counterparties, investors, regulators, employees or the public.
Reputation risk is managed by maintaining a controlled culture within Barclays Bank Group, with the objective of acting with integrity, enabling strong and trusted relationships to be built with customers and clients, colleagues and broader society.
Conduct Risk
The risk of detriment to customers, clients, market integrity, competition or Barclays Bank Group from the inappropriate supply of financial services, including instances of wilful or negligent misconduct.
The Compliance function sets the minimum standards required, and provide oversight to monitor that these risks are effectively managed and escalated where appropriate.
Legal Risk The risk of loss or imposition of penalties, damages or fines from the failure of the firm to meet its legal obligations including regulatory or contractual requirements.
The Legal function supports colleagues in identifying and limiting legal risks.
home.barclays/annualreport Barclays Bank PLC Annual Report 10

Strategic report Performance measures
Performance measurement The performance of Barclays Bank PLC contributes to the Barclays PLC Group, upon which the delivery of strategy is measured. Barclays PLC Group benefits from diversification and balance provided from both Barclays Bank UK PLC and Barclays Bank PLC, and the performance measures reflect this benefit. For the purposes of subsidiary reporting, the relevant measures have been isolated and disclosed below.
Financial performance measures Barclays Bank PLC Financial Performance measures are calculated at a specific legal entity basis and disclosed below.
Income Statement
Barclays Bank Group results 2018 2017 2016
For the year ended 31 December £m £m £m
Total income 13,600 13,730 14,202 Credit impairment charges and other provisions (643) (1,553) (1,477) Net operating income 12,957 12,177 12,725 Operating expenses (9,893) (10,230) (11,146) GMP chargeb (140) - - Litigation and conduct (1,706) (448) (321) Total operating expenses (11,739) (10,678) (11,467) Other net income 68 259 636 Profit before tax 1,286 1,758 1,894 Tax charge (404) (1,526) (302) Profit after tax in respect of continuing operations 882 232 1,592 (Loss)/profit after tax in respect of discontinued operationsa (47) (1,386) 2,137 Non-controlling interests in respect of continuing operations - (4) (3) Non-controlling interests in respect of discontinued operationsa - (140) (402) Other equity instrument holders (647) (639) (457) Attributable profit/(loss) 188 (1,937) 2,867
Notes a Barclays Bank PLC transferred its UK banking business on 1 April 2018 to Barclays Bank UK PLC. Results relating to the UK banking business for the three months ended 31 March
2018 and for the years ended 31 December 2017 and 2016 have been reported as a discontinued operation. The comparative period also included results relating to Barclays Africa Group Limited (BAGL) for the five months ended 31 May 2017 and for the year end 2016.
b A £140m charge for Guaranteed Minimum Pensions in relation to the equalisation of obligations for members of the Barclays Bank UKRF. There was no capital impact of this charge as at 31 December 2018, as the Barclays Bank UKRF remained in accounting surplus.
The financial information above is extracted from the published accounts. This information should be read together with the information included in the accompanying consolidated financial statements.
home.barclays/annualreport Barclays Bank PLC Annual Report 11
Strategic report Performance measures repo
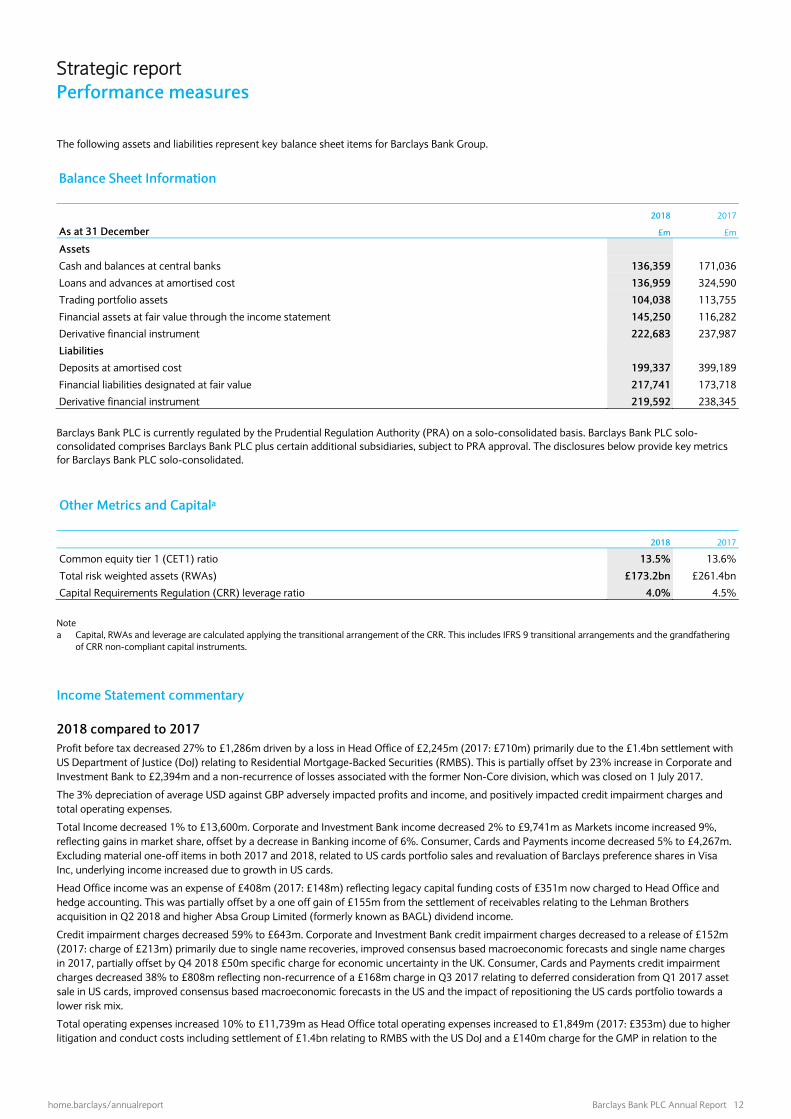
The following assets and liabilities represent key balance sheet items for Barclays Bank Group. Balance Sheet Information
2018 2017
As at 31 December £m £m
Assets
Cash and balances at central banks 136,359 171,036
Loans and advances at amortised cost 136,959 324,590
Trading portfolio assets 104,038 113,755
Financial assets at fair value through the income statement 145,250 116,282
Derivative financial instrument 222,683 237,987
Liabilities
Deposits at amortised cost 199,337 399,189
Financial liabilities designated at fair value 217,741 173,718
Derivative financial instrument 219,592 238,345
Barclays Bank PLC is currently regulated by the Prudential Regulation Authority (PRA) on a solo-consolidated basis. Barclays Bank PLC solo-consolidated comprises Barclays Bank PLC plus certain additional subsidiaries, subject to PRA approval. The disclosures below provide key metrics for Barclays Bank PLC solo-consolidated.
Other Metrics and Capitala
2018 2017
Common equity tier 1 (CET1) ratio 13.5% 13.6%
Total risk weighted assets (RWAs) £173.2bn £261.4bn
Capital Requirements Regulation (CRR) leverage ratio 4.0% 4.5%
Note a Capital, RWAs and leverage are calculated applying the transitional arrangement of the CRR. This includes IFRS 9 transitional arrangements and the grandfathering
of CRR non-compliant capital instruments.
Income Statement commentary 2018 compared to 2017 Profit before tax decreased 27% to £1,286m driven by a loss in Head Office of £2,245m (2017: £710m) primarily due to the £1.4bn settlement with US Department of Justice (DoJ) relating to Residential Mortgage-Backed Securities (RMBS). This is partially offset by 23% increase in Corporate and Investment Bank to £2,394m and a non-recurrence of losses associated with the former Non-Core division, which was closed on 1 July 2017.
The 3% depreciation of average USD against GBP adversely impacted profits and income, and positively impacted credit impairment charges and total operating expenses.
Total Income decreased 1% to £13,600m. Corporate and Investment Bank income decreased 2% to £9,741m as Markets income increased 9%, reflecting gains in market share, offset by a decrease in Banking income of 6%. Consumer, Cards and Payments income decreased 5% to £4,267m. Excluding material one-off items in both 2017 and 2018, related to US cards portfolio sales and revaluation of Barclays preference shares in Visa Inc, underlying income increased due to growth in US cards.
Head Office income was an expense of £408m (2017: £148m) reflecting legacy capital funding costs of £351m now charged to Head Office and hedge accounting. This was partially offset by a one off gain of £155m from the settlement of receivables relating to the Lehman Brothers acquisition in Q2 2018 and higher Absa Group Limited (formerly known as BAGL) dividend income.
Credit impairment charges decreased 59% to £643m. Corporate and Investment Bank credit impairment charges decreased to a release of £152m (2017: charge of £213m) primarily due to single name recoveries, improved consensus based macroeconomic forecasts and single name charges in 2017, partially offset by Q4 2018 £50m specific charge for economic uncertainty in the UK. Consumer, Cards and Payments credit impairment charges decreased 38% to £808m reflecting non-recurrence of a £168m charge in Q3 2017 relating to deferred consideration from Q1 2017 asset sale in US cards, improved consensus based macroeconomic forecasts in the US and the impact of repositioning the US cards portfolio towards a lower risk mix.
Total operating expenses increased 10% to £11,739m as Head Office total operating expenses increased to £1,849m (2017: £353m) due to higher litigation and conduct costs including settlement of £1.4bn relating to RMBS with the US DoJ and a £140m charge for the GMP in relation to the
home.barclays/annualreport Barclays Bank PLC Annual Report 12

equalisation of obligations for members of the Barclays Bank UKRF. Operating expenses decreased 3% to £9,893m due to lower restructuring and structural reform costs, and a reduced impact from the change in compensation awards introduced in Q4 2016.
Other net income decreased to £68m (2017: £259m) primarily reflecting the non-recurrence of gains on the sale of Barclays’ share in Vocalink to MasterCard and a joint venture in Japan in Q2 2017.
Loss after tax in respect of discontinued operations of £47m (2017: £1,386m) included the results of the three months ended 31 March 2018 relating to the UK banking business that was transferred to Barclays Bank UK PLC. 2017 included results relating to BAGL and the UK banking business.
The effective tax rate decreased to 31.4% (2017: 86.8%). This rate includes the impact of litigation and conduct and, in 2017, a one-off net charge due to the re-measurement of US deferred tax assets (DTAs).
2017 compared to 2016 Profit before tax decreased 7% to £1,758m driven by a 3% reduction in income and lower other net income, partially offset by a 7% reduction in total operating expenses. Results were impacted by the appreciation of average USD and EUR against GBP of 5% and 7% respectively, compared to 2016, which positively impacted income and adversely affected impairment and total operating expenses.
Following the closure of Barclays Non-Core on 1 July 2017, Barclays Bank Group results for 2017 included a Barclays Non-Core loss before tax for the six months ended 30 June 2017 of £639m, compared to a loss before tax of £2,809m for the full year in 2016. From 1 July 2017, residual Barclays Non-Core assets and liabilities were reintegrated into, and associated financial performance subsequently reported in Corporate and Investment Bank, Head Office and Barclays Bank UK PLC.
Total income decreased to £13,730m (2016: £14,202m) reflecting a £651m reduction in Corporate and Investment Bank and a £502m decrease in Head Office, partially offset by a reduction in losses related to Non-Core.
Credit impairment charges increased 5% to £1,553m primarily due to an increase in Consumer, Cards and Payments offset by a reduction in Corporate and Investment Bank and impairment charges related to Non-Core.
Total operating expenses decreased 7% to £10,678m driven primarily by lower Non-Core related operating expenses.
Other net income of £259m (2016: £636m) primarily reflected a gain of £109m on the sale of Barclays’ share in VocaLink to MasterCard and a gain of £76m on the sale of a joint venture in Japan.
Balance Sheet commentary 2018 compared to 2017 Cash and balances at central banks decreased £35bn to £136bn as a result of the disposal of Barclays UK business to Barclays Bank UK PLC.
Loans and advances at amortised cost decreased £187.6bn to £137.0bn (December 2017: £324.6n) following the transfer of the UK banking business from Barclays Bank PLC to Barclays Bank UK PLC as part of structural reform, and the impact of the transition to a new accounting standard.
Derivative financial instrument assets and liabilities decreased £15.3bn to £222.7bn and £18.8bn to £219.6bn respectively, due to a decrease in interest rate derivatives driven by increase in major interest rate forward curves and the adoption of daily settlement under the London Clearing House (LCH) rules, partially offset by increased foreign exchange and equity derivative volumes.
Financial assets at fair value through the income statement increased £29.0bn to £145.3bn primarily due to the impact of the transition to a new accounting standard and increased reverse repurchase agreements activity, partially offset by the transfer of the UK banking business from Barclays Bank PLC to Barclays Bank UK PLC as part of structural reform.
Deposits at amortised cost decreased £199.9bn to £199.3bn following the transfer of the UK banking business from Barclays Bank PLC to Barclays Bank UK PLC as part of structural reform and impact of the transition to a new accounting standard, offset partially by a strong and targeted increase in deposits.
Financial liabilities designated at fair value increased £44bn to £218bn primarily as a result of the effects of transition to a new accounting standard and additional client margin deposits from the growth of the Equities business.
home.barclays/annualreport Barclays Bank PLC Annual Report 13

Strategic report Performance measures repo
Non-financial performance measures Our performance measurement framework builds on our stakeholder engagement to align Barclays performance to their ambitions. We reflect a balance of key financial performance metrics and broader strategic non-financial measures which focus on the impact we have on our customers and clients, colleagues, and the benefit we bring to society via our citizenship activity. These measures are underpinned by how we behave towards all our stakeholders, through our conduct and our culture. To assess our performance, we use a number of sources including dashboards of our performance metrics and measures, regular management reporting and external measures to provide a balanced review of performance during the year, while additionally monitoring for emerging trends. Below we focus on the Customer and Client measures specific to Barclays Bank PLC as contained in the Barclays PLC Group key performance indicators. Colleague and Citizenship are reviewed in Barclays Group PLC Annual Report. Barclays Bank PLC has addressed the Non-Financial Reporting requirements contained in sections 414CA and 414CB of the Companies Act 2006 through the disclosure contained in Barclays PLC Annual report on pages 44 to 46. Customer and client Key outcomes we will look to achieve include:
Building trust with our customers and clients, such that they are happy to recommend us to others Successfully innovating and developing products and services that meet their needs Offering suitable products and services in an accessible way, ensuring excellent customer and client experience
How we measure success Measures used in our evaluation include, but are not limited to:
Client rankings and market shares Digital engagement Conduct indicators
How we are doing Areas of encouragement: Client rankings and market shares The Banking franchise maintained its 6th rank by fee share in our UK and US home market (2017: 6th) and retained its top 3 position in the UK.
Our Markets franchise delivered strong results: it maintained its 4th position in Global Fixed Income (Greenwich) and improved its Coalition franchise ranka to 7th (2017 FY: 8th) strengthening its position in all individual asset classes.
95% of our largest UK corporate clients considered the service they receive from Barclays Bank Group to be good, very good or excellent, up from 88% in 2017 (Charterhouseb).
Digital engagement In 2018, 69% of the US Consumer Bank customers are now digitally active (vs. 66% in 2017), and 57% now receive paperless statements. Our strategy and customer centricity is encouraged by the prestigious 3rd place in J.D. Power's 2018 Credit Card Satisfaction Survey. To maintain and improve this position, we continue to work on building our single, integrated native app to provide our customers an effortless experience. The app will allow customers to apply for products, manage their accounts, and track rewards earned all in one convenient place.
Areas of continued focus: Conduct Indicators Barclays Bank Group has operated at the overall set tolerance for Conduct Risk throughout 2018. The tolerance is assessed by the business through Key Indicators which are aggregated and provide an overall rating which is reported to the Board Reputation Committee as part of the Conduct Dashboard. We remain focused on the continuous improvement being made to manage Conduct Risk effectively, with an emphasis on enhancing governance and management information to facilitate the identification of risks at earlier stages. For further information on the management and performance of Conduct Risk, please refer to the Risk Review section on page 57.
a Markets ranking and share source: Coalition, FY18 Preliminary Competitor Analysis based on the Coalition Index and Barclays’ internal business structure b Charterhouse Research based on 683 interviews (173 Barclays £25m+) with companies turning over between £25m and £1bn carried out in year end 2018. Survey data is weighted by turnover and region to be representative of the total market in Great Britain. % Responses – Excellent, Very Good and Good.
home.barclays/annualreport Barclays Bank PLC Annual Report 14

Colleague Our Colleague agenda is set at the Barclays PLC level, and implemented throughout the subsidiaries, regardless of legal entity. Further information on our people at Barclays Bank Group on page 29 of this report.
Citizenship Our Citizenship agenda is set at the Barclays PLC level, and implemented throughout the subsidiaries, regardless of legal entity. Further information on our Citizenship and Environmental Social Governance (ESG) activity available in the Barclays PLC 2018 Annual Report pages 22 to 27. Barclays PLC also publishes an annual ESG Report, where additional detail on material ESG themes are available. Reports are available at home.barclays/annualreport
Sir Gerry Grimstone
Chairman – Barclays Bank PLC
20 February 2019
home.barclays/annualreport Barclays Bank PLC Annual Report 15

Governance Chairman’s introduction
It is my pleasure to present the 2018 corporate governance report for Barclays Bank PLC (‘BBPLC’ or the ’Company’), the first since the Company was established as Barclays’ non-ring fenced bank on 1 April 2018. This year has been very busy for the BBPLC Board and the executive, with a significant amount of change and focus on establishing an effective new structure following structural reform. The Bank began the year by overseeing the transfer of Barclays Bank UK retail banking business to Barclays Bank UK PLC, the first UK bank to deliver a ring fenced banking structure. The Board oversaw the successful implementation of a governance framework that establishes the interactions between the Boards and executives of the Company, Barclays and Barclays Bank UK. This included a wholesale overhaul of the Board whereby all directors common to the Barclays PLC Board, with the exception of myself, Jes Staley and Tushar Morzaria* stepped away from the Company’s Board. This signified the separation of the governance of the main operating business from Barclays. In the months preceding structural reform, I was engaged in setting up a divisional board of independent non-executive directors in waiting. The divisional directors were recruited, inducted and prepared for their role as the Company’s Board following separation, effective 1 April 2018. The Company’s independent Board, together with a dedicated executive management, are charged with delivering the strategic objectives of the Barclays International business through the Company and its operating subsidiaries. Since the new structure was implemented, the members of the Board have adhered to the highest standards of corporate governance in directing the Company’s affairs in discharge of their statutory duties and regulated responsibilities. As a Board, we aspire to meet the highest standards of corporate governance and as a non-premium listed company, whilst we do not choose to voluntarily comply with the UK Corporate Governance Code (the Code), we have established a governance framework based on the standards of good practice set out in the Code. The Board does have a statutory duty to promote the success of the Company and to have regard to the long-term consequences of its decisions, and the impact of those decisions, on stakeholder interests. The Board is absolutely committed to ensuring the Company is able to meet its regulatory responsibilities and maintains an open and transparent dialogue with the regulators. Board Activities The Board has spent time familiarising itself with the business and has received a number of targeted inductions and teach-ins from the Barclays International businesses and functions. The Board has considered a number of specific business items including the Barclays International Strategy and Medium Term Plan that were both considered at a number of meetings before approval. The resilience of the Barclays International controls environment and technology has been an item of focus, so too has the Company’s ability to provide products and services to clients following the UK’s decision to leave the European Union. Our Company’s culture is built on a set of strong values and we embody these values in everything that we do. I believe that the Board plays a vital role through effective governance and the measurement of conduct to ensure this continues. During the year, the Board has considered the Company’s culture, values and behaviours, which are set out in Barclays’ Purpose and Values and The Barclays Way, and embedded throughout Barclays International. The CEO, Compliance and HR teams have spent considerable time developing the approach and the Board has played an active and engaged role in helping to shape that direction. The Board has also reviewed and approved the Barclays International Reward Policy, following recommendation from the Remuneration Committee. Leadership Individual roles on the Board and their responsibilities are set out in the Barclays Bank Charter of Expectations. Directors are expected to provide rigorous and constructive challenge on matters that, owing to their strategic, financial or reputational implications or consequences, are considered significant to the Company. Appointment and Retirement of Directors The appointment and retirement of directors is governed by the company’s articles of association (the articles), the Companies act 2006 and related legislation. The articles may only be amended by a special resolution of the shareholders. The BBPLC Board has the power to appoint additional Directors or to fill a casual vacancy amongst the Directors. Any such Director holds office only until the next AGM and may offer himself/herself for re-election. All Directors will stand for election or re-election at the 2019 AGM. * Tushar Morzaria resigned from the BBPLC Board on 10 August 2018 when regulatory approval was received for Steven Ewart as BBPLC CFO. Jes Staley resigned from the BBPLC Board on 31 January 2019 when regulatory approval was received for Tim Throsby as BBPLC CEO.
home.barclays/annualreport Barclays Bank PLC Annual Report 16

Effectiveness The skills, knowledge and experience needed for an effective BBPLC Board are recorded on a skills matrix, which is used by the BBPLC Board Nominations Committee to inform Director recruitment, induction and ongoing development. The BBPLC Board Nominations Committee regularly considers BBPLC Board and senior management succession plans. Appointments to the BBPLC Board were made via a formal, rigorous and transparent process, based on merit, taking into account the skills, experience and diversity needed on the BBPLC Board in the context of Barclays’ Group strategic direction. As at the date of this report, there are three female directors on the Board meaning we have achieved our goal of 33% female representation on the Board ahead of the 2020 target date. The BBPLC Board is committed to regularly reviewing its broad diversity profile. We stood up the BBPLC Board in April this year and it now comprises six independent non-executive directors, two executive directors and myself as Chairman. The Company considers the composition of principal BBPLC Board Committees to meet the independence criteria of the Code and there is appropriate cross-membership on the BBPLC Board Committees to further promote effectiveness.
All directors are expected to commit sufficient time to fulfil their duties to Barclays Bank PLC. This includes attending, and being well-prepared for, all Board and Board Committee meetings, as well as making time to understand the business and meet with executives. The Barclays Bank BBPLC Charter of Expectations sets out responsibilities for providing the BBPLC Board with accurate, timely and high-quality information necessary for it to fulfil its duties. The BBPLC Board takes the quality of its performance seriously and despite the fact that the BBPLC Board has effectively changed almost entirely during the year, I considered it beneficial to engage an independent person to conduct an evaluation of the BBPLC Board in early 2019 to assess the performance and functionality of the BBPLC Board and the individual BBPLC Board members. Accountability The BBPLC Board is responsible for setting Barclays Bank Group risk appetite within the overall parameters set by the Barclays Group, that is, the level of risk it is prepared to take in the context of achieving Barclays’ Group strategic objectives. Barclays’ Group Enterprise Risk Management Framework is designed to identify and set minimum requirements in respect of the main risks to achieving the Barclays’ strategic objectives and to provide reasonable assurance that internal controls are effective. The BBPLC Board, assisted by its Risk Committee, conducts robust assessments of the principal risks facing Barclays Bank PLC, including those that would threaten its business model, future performance, solvency or liquidity. The BBPLC Board Audit Committee, comprising independent non-executive Directors, oversees the effectiveness of Barclays Bank PLC internal and external auditors. The Directors also review the effectiveness of the Barclays Bank Group’s systems of internal control and risk management. The BBPLC Board has put in place processes to support the presentation to stakeholders of fair, balanced and understandable information. Controls over financial reporting A framework of disclosure controls and procedures is in place to support the approval of the financial statements of the Barclays Bank Group. Specific governance committees are responsible for examining the financial reports and disclosures to ensure that they have been subject to adequate verification and comply with applicable standards and legislation. These committees report their conclusions to the BBPLC Board Audit Committee, which debates its conclusions and provides further challenge. Finally, the BBPLC Board scrutinises and approves results announcements and the Barclays Bank PLC Annual Report, and ensures that appropriate disclosures have been made. This governance process ensures that both management and the BBPLC Board are given sufficient opportunity to debate and challenge the financial statements of the Barclays Bank Group and other significant disclosures before they are made public. Management’s report on internal control over financial reporting Management is responsible for establishing and maintaining adequate internal control over financial reporting. Internal control over financial reporting is a process designed under the supervision of the principal executive and principal financial officers to provide reasonable assurance regarding the reliability of financial reporting and the preparation of financial statements for external reporting purposes in accordance with International Financial Reporting Standards (IFRS) as adopted by the European Union and issued by the International Accounting Standards Board (IASB).
home.barclays/annualreport Barclays Bank PLC Annual Report 17

Governance Chairman’s introduction
Internal control over financial reporting includes policies and procedures that pertain to the maintenance of records that, in reasonable detail, Accurately and fairly reflect transactions and dispositions of assets. Provide reasonable assurances that transactions are recorded as necessary to permit preparation of financial statements in accordance with
IFRS and that receipts and expenditures are being made only in accordance with authorisations of management and the respective Directors. Provide reasonable assurance regarding prevention or timely detection of unauthorised acquisition, use or disposition of assets that could
have a material effect on the financial statements. Internal control systems, no matter how well designed, have inherent limitations and may not prevent or detect misstatements. Also, projections of any evaluation of effectiveness to future periods are subject to the risk that internal controls may become inadequate because of changes in conditions, or that the degree of compliance with the policies or procedures may deteriorate. Management has assessed the internal control over financial reporting as of 31 December 2018. In making its assessment, management utilised the criteria set out in the 2013 COSO framework and concluded that, based on its assessment, the internal control over financial reporting was effective as of 31 December 2018. The system of internal financial and operational controls is also subject to regulatory oversight in the UK and overseas. Further information on supervision by the financial services regulators is provided under Supervision and Regulation in the Risk review section on pages 122 to 131. Changes in internal control over financial reporting There have been no changes in the Barclays Bank Group’s internal control over financial reporting which have materially affected or are reasonably likely to materially affect the Barclays Bank Group’s internal control over financial reporting during the year. The Barclays Bank Group adopted IFRS 9 on 1 January 2019 and has updated and modified certain controls over financial reporting as a result of the new accounting standard, embedding them into the existing control environment. Remuneration The BBPLC Board Remuneration Committee (Remuneration Committee), comprising independent non-executive Directors, reviews and adopts the Group Remuneration Policy for use in the Barclays Bank Group. Engagement In a business like ours where the Company is dependent on client relationships and the services provided to our clients, it is vital that we hold true to our values and do the right thing. This extends to engaging meaningfully with our stakeholders. Together with the Chief Executive Officer, I have been actively engaging with clients across our diversified transatlantic Bank, in many of our international locations, illustrating our commitment to clients and our people in the jurisdictions in which we operate. As a Board, we regularly hold and attend employee and citizenship events, to encourage the culture of inclusiveness and ensure employees are engaged and aligned to the strategy of the business. In 2018 the BBPLC Board members attended a number of key initiatives for clients and employees, these range from talent events, the inaugural Women’s Managing Director Conference held in London, a Citizenship programme in New York showcasing Unreasonable Impact Brain Trust and opening the proceedings at the Barclays Asia Forum in Singapore. The Company has been through an enormous amount of change in the year and our people have been asked to do an awful lot to make the transition to an independent Barclays Bank PLC Board effective. There is still a significant amount to do in 2019 as we look to execute the Barclays International strategy. Sir Gerry Grimstone Chairman 20 February 2019
home.barclays/annualreport Barclays Bank PLC Annual Report 18

Governance Corporate governance statement
Current Directors Sir Gerry Grimstone - Chairman Jeremy Scott - Board Audit Committee Chair Peter Bernard - Board Risk Committee Chair Hélène Vletter-van Dort - Board Remuneration Committee Chair Steven Ewart - CFO Helen Keelan Maria Richter Tim Throsby - CEO Alex Thursby The Board We act in a way that we consider promotes the success of Barclays Bank PLC (the ‘Company’ or ‘BBPLC’) for the benefit of its shareholder, and are accountable to our shareholder for creating and delivering sustainable value. It is our responsibility as the BBPLC Board to ensure that management deliver on short-term objectives, whilst promoting the long-term growth of the Company and the Barclays Group. We are also responsible for ensuring that management maintains an effective system of internal control. An effective system of internal control should provide assurance of effective and efficient operations, internal financial controls and compliance with law and regulation. In meeting this responsibility, we consider what is appropriate for the Company’s business and reputation, the materiality of financial and other risks and the relevant costs and benefits of implementing controls. As part of the Barclays Group Structural Reform Programme (SRP), the current BBPLC Board was stood up on 1 April 2018#. Prior to 1 April 2018, the Company’s Board mirrored that of Barclays PLC (BPLC), however, with the exception of Sir Gerry Grimstone, all other directors of BPLC have resigned from the Board. The current Board had previously operated as a non-statutory divisional board for the Barclays International business division with the primary focus of becoming familiar with the Company’s business, risk, control and governance arrangements ahead of stand up post SRP. The Board has approved a Schedule of Matters Reserved to the Board which specifies those decisions to be taken by the Board, including but not limited to material decisions relating to strategy, risk appetite, medium term plans, capital and liquidity plans, risk management and controls frameworks, approval of financial statements, approval of share allotments and dividends. The Board is also responsible for the establishment and composition of the Board Committees, succession planning for the BBPLC Board and certain senior management, approval of major transactions and the appointment and removal of certain senior executives. The Board has delegated the responsibility for making and implementing operational decisions and running the Company’s business on a day-to-day basis to the BBPLC Chief Executive and his senior management team.
Director Eligible Meeting Attendance John McFarlane* 4/4 Mike Ashley* 4/4 Tim Breedon* 4/4 Sir Ian Cheshire* 4/4 Mary Francis* 4/4 Crawford Gillies* 4/4 Michael Turner* 4/4 Reuben Jeffrey III* 4/4 Matthew Lester* 4/4 Tushar Morzaria** 5/8 Dambisa Moyo* 3/4 Diane Schueneman* 4/4 Jes Staley*** 8/11 Sir Gerry Grimstone 11/11 Peter Bernard 7/7 Steven Ewart** 3/3 Helen Keelan 7/7 Maria Richter 6/7 Jeremy Scott 7/7 Tim Throsby*** 7/7 Alex Thursby 7/7 Hélène Vletter-van Dort 7/7
# On 1 April 2018, the only Directors of Barclays PLC that remained on the Barclays Bank PLC Board were Sir Gerry Grimstone (Chairman), Jes Staley and Tushar Morzaria in their capacities as BBPLC CEO and BBPLC CFO respectively. Jes Staley resigned from the BBPLC Board on 31 January 2019 when regulatory approval was received for Tim Throsby as BBPLC CEO. Tushar Morzaria resigned from the BBPLC Board on 10 August 2018 when regulatory approval was received for Steven Ewart as BBPLC CFO. * Following the implementation of Structural Reform the Barclays PLC Directors resigned from the Barclays Bank PLC Board once the Barclays International Divisional Board were appointed. ** Following Steven Ewart’s appointment as Chief Financial Officer of Barclays Bank PLC and required regulatory approval, Tushar Morzaria resigned as Chief Financial Officer and Director Barclays Bank PLC, remaining as Finance Director of Barclays PLC. *** Following Tim Throsby’s appointment as Chief Executive Officer of Barclays Bank PLC and required regulatory approval, Jes Staley resigned as Chief Executive Officer and Director Barclays Bank PLC, remaining as Chief Executive Officer and Director of Barclays PLC.
home.barclays/annualreport Barclays Bank PLC Annual Report 19

Governance Corporate governance statement
What we did in 2018 During 2018, the Board focused on the following specific areas:
Strategy formulation and monitoring Received deep dive presentations by each area of the Barclays International business and functions, this included but was not restricted to
Banking, Markets, Corporate Banking, Private Banking and Overseas Services and Cards & Payments. Provided with an overview of Structural Reform and their legal and regulatory duties as directors of a non-ring-fenced bank. Discussed and debated strategic projects and provided input to management on the formulation of the Company’s strategy as part of the
overall Barclays Group strategy, and reflected on the Company’s strategy with longer-term views on what could be done to accelerate returns and build allocated capital effectively. Discussed and considered the transfer of the Barclays UK business from the Company to Barclays Bank UK PLC under the Ring-fencing
Transfer Scheme. Discussed and considered the impact of the UK’s decision to leave the EU and the transfer of the Company’s European business to Barclays
Bank Ireland PLC under the European Referendum Response Programme. Discussed regular updates from the BBPLC Chief Executive and BBPLC President/Barclays International CEO on the progress being made
against the BBPLC strategy, key strategic projects and the recruitment of the top industry talent. Finance and Liquidity Debated, assessed and approved the BBPLC Medium Term Plan for 2018-2020. Regularly assessed financial performance of the various businesses, the BBPLC results through reports from the BBPLC Chief Finance Officer
and within the business specific updates to the Board and furthermore providing guidance to senior management. Reviewed and approved BBPLC’s financial results prior to publication, including approving the interim announcement and dividend to the
shareholder. Provided input, guidance and advice to senior management on the BBPLC Medium Term Plan 2019-2021 and subsequently approved the final
plan.
Governance and risk (including regulatory issues) Delegated authority to the BBPLC Board Risk Committee to consider and recommend, on behalf of the Board, the adoption by the Company of
the Internal Capital Adequacy Assessment Process and Internal Liquidity Adequacy Assessment Process. Received reports on Barclays’ operational and technology capability, including specific updates on cyber risk capability and resilience, and a
service management update from services provided by Barclays Services Limited, the Group services company. Considered and approved appointments to the BBPLC Board and BBPLC Board Committees following recommendation from the BBPLC Board
Nominations Committee. Received regular reports from the Chairs of each BBPLC Board Committee. See the reports from the BBPLC Board Committee Chairs below and
on the following page. Discussed the BBPLC Board and BBPLC Board Committee governance framework in the context of structural reform and other corporate
governance matters. Adopted the risk limits and mandates within the parameters of the risk appetite set by the Barclays Group.
Board Committees The main BBPLC Board Committees are the BBPLC Board Audit Committee, the BBPLC Board Nominations Committee, the BBPLC Board Remuneration Committee, and the BBPLC Board Risk Committee. Pursuant to authority granted under our Articles of Association, each BBPLC Board Committee has had specific responsibilities delegated to it by the BBPLC Board. You can read about what each of the BBPLC Board Committees did during 2018 on the following pages. Board Audit Committee On 1 April 2018 with the completion of structural reform the separate board of Barclays Bank PLC and its Committees was stood up, including the BBPLC Board Audit Committee (Audit Committee). As part of this process the Audit charter for the Audit Committee and the working arrangements and allocation of responsibilities between the Barclays PLC Board Audit Committee and the Barclays Bank PLC Board Audit Committee were agreed. The Chairs of these two committees along with the Chair of the Barclays Bank UK PLC Board Audit Committee have met regularly to share relevant information and to ensure both the efficient workings of the respective committees as well as the appropriate coverage of responsibilities. In addition, regular dialogue has been held with the Audit Committees of Barclays Bank PLC's major subsidiaries. The BBPLC Board Audit Committee is composed solely of independent non-executive Directors, with membership designed to provide the breadth of financial expertise and commercial acumen it needs to fulfil its responsibilities. Its members as a whole have recent and relevant experience of the banking and financial services sector, in addition to general management and commercial experience, and are financially literate. The Audit Committee is chaired by Jeremy Scott who has over 40 years accounting and audit experience. Peter Bernard, Helen Keelan and Alex Thursby are also members. The Audit Committee met three times prior to the stand-up of the new BBPLC Board and BBPLC Board Committees in April 2018, and since stand-up has met five times, with two of the meetings held in New York and one in Hong Kong. Audit Committee meetings are attended by management, including the Chief Financial Officer, Chief Compliance Officer, Chief Controls Officer, Chief Operating Officer, Chief Internal Auditor and BBPLC General Counsel and the Company’s External Auditors, KPMG, as appropriate. The Audit Committee held a number of separate private sessions with each of the Chief Internal Auditor and the lead external audit partner, which were not attended by management.
home.barclays/annualreport Barclays Bank PLC Annual Report 20

Governance: Directors’ report
Member Eligible Meeting Attendance Mike Ashley 3/3 Tim Breedon 3/3 Crawford Gillies 3/3 Matthew Lester 3/3 Diane Schueneman 3/3 Jeremy Scott 5/5 Peter Bernard 5/5 Helen Keelan 5/5 Alex Thursby 5/5
The principal role and responsibilities of the Audit Committee, pursuant to the Terms of Reference, are: Financial Reporting: assessing the integrity of the Barclays Bank Group’s financial statements and reviewing any significant financial reporting
issues and judgments encountered or made in the preparation of the Company’s, interim report, annual report and accounts; Internal Controls: reviewing the effectiveness of the Barclays Bank Group’s system of internal controls; Internal Audit: monitoring and reviewing the effectiveness, independence and objectivity of the Internal Audit function and reviewing reports on
internal audit activities and the responsiveness of management to internal audit findings and recommendations; Regulatory Reporting: reviewing arrangements established by management for compliance with regulatory financial reporting; External Audit: reviewing and monitoring the independence, objectivity and effectiveness of the external auditor’s audit process, including
oversight of the provision of non-audit services for Barclays Bank Group; Whistleblowing: reviewing the integrity, independence and effectiveness of the Barclays Bank Group’s policies and procedures on whistleblowing;
and Material Legal Matters: maintaining oversight of material legal contentious matters and current or emerging legal risks. During 2018, the principal activities of the Audit Committee included: Monitoring the implementation of IFRS9 and the transitional impact; Assessing the appropriateness of key management judgments and any material conduct provisions; Monitored the valuation methods applied by management to significant valuation items; Overseeing the performance of the internal audit function, including the consideration of an independent quality assurance report on its
performance; Receiving deep dives reviews into areas of the business where adverse internal audit reports have been issued and monitoring the progress of
management to implement suggested improvements; Discussing and receiving updates from the BBPLC Chief Controls Officer on the BBPLC internal controls and framework; Monitoring management progress on the development of the Barclays Control Framework and the Risk Control Self-Assessment framework; Considering and adopting the Barclays Group policy on the provision of non-audit services by the Barclays Group’s statutory auditor; Monitoring the Whistleblowing programme and receiving regular Whistleblowing metrics as they relate to the Barclays Bank Group and ensuring
that the procedures for protection from detrimental treatment of staff who raise concerns continue to be effective; Reviewing the interim results, including considering the half-year dividend to shareholders; and Receiving updates on financial crime activity impacting the Barclays Bank Group during 2018.
A comprehensive internal control framework is in place in the Barclays Bank Group and the Audit Committee receives regular reports on its operation (and its continued enhancement). This includes reports from both the Internal Audit function and External Auditors as well as related plans and management actions to remediate control recommendations raised in those reports. The Audit Committee receives reports at a majority of the meetings from the Chief Controls Officer on the control environment with briefings on relevant topics as processes and approaches are refined within the new post Structural Reform framework. The Chief Controls Officer has kept the Audit Committee apprised of the results of Risk and Control Self Assessments and improvements made in these processes. The Audit Committee has requested, and received, deep dives on particular business units, including where audit reports highlighted particular control enhancements being desirable.
home.barclays/annualreport Barclays Bank PLC Annual Report 21

Governance Corporate governance statement
Board Nominations Committee The BBPLC Board Nominations Committee (Nominations Committee) is composed of a majority of independent non-executive directors. Sir Gerry Grimstone, as Chairman of the BBPLC Board, Peter Bernard, Jeremy Scott and Hélène Vletter-van Dort, being the Chairs of each of the other BBPLC Board Committees are also members. The Nominations Committee met once prior to the stand-up of the new BBPLC Board and BBPLC Board Committees in April 2018 and since stand-up has met once at the Barclays’ offices in New York. Attendance by the Nominations Committee members is shown in the table below, and Nominations Committee meetings are attended by the Chief Executive Officer, President of BBPLC, BBPLC HR Director, the BBPLC Head of Talent as appropriate.
Member Eligible Meeting Attendance John McFarlane 1/1 Mike Ashley 1/1 Tim Breedon 1/1 Sir Ian Cheshire 1/1 Crawford Gillies 1/1 Reuben Jeffrey III 1/1 Sir Gerry Grimstone 2/2 Jeremy Scott 1/1 Peter Bernard 1/1 Hélène Vletter-van Dort 1/1
The principal role and responsibilities of the Nominations Committee, pursuant to the Terms of Reference, are: Board Appointments to the BBPLC Board, its Committees and its significant subsidiaries; Composition of the BBPLC Board and its Committees; Succession planning and talent management; Board Effectiveness; Serving Directors tenure; Board induction and training; Conflicts of Interest; and Governance Matters.
During 2018, the principal activities of the Committee included: Reviewing the Senior Manager appointments for BBPLC, and monitoring the progress of any remaining applications. Reviewing the BBPLC Board and BBPLC Board Committee composition, taking into account time commitment, skills, knowledge, experience and
diversity of the Directors, and identifying any desirable skills to aid the Company in operating and competing effectively. Review and approval of proposed changes to the Board of a number of the Company’s significant subsidiaries, including but not limited to
reviewing the composition of the Board of Barclays Bank Ireland PLC, and approving the appointment of additional directors to ensure the company has sufficient skills and experience to take forward and implement the Barclays Group strategy in Europe. Receiving updates on the talent and succession management principles in place for the Company, the succession planning review process for the
BBPLC Executive Committee and the global Group campaigns to promote a diverse and inclusive workforce, including the Barclays Encore Programme.
Board Remuneration Committee Following the completion of structural reform on 1 April 2018, the Barclays Bank PLC Remuneration Committee was stood up. In the first year of operation, the Barclays Bank PLC Remuneration Committee has initially focused on reviewing and adopting Barclays Group Remuneration Policies and Standards, the Remuneration Control Framework and the Material Risk Takers methodology. As part of this process, consideration was given to the appropriateness of the Barclays Group approach at the operating entity level. During the year there has been close collaboration between the Barclays Bank PLC Remuneration Committee and the Barclays PLC Remuneration Committee in establishing the delegated authority decisions framework exercised by Barclays Bank PLC Remuneration Committee as part of the wider Barclays Group Remuneration process. This collaboration has extended to careful agenda setting to ensure efficient workings and sequencing of approvals between the Barclays Bank PLC Remuneration Committee and the Barclays PLC Remuneration Committee. In addition, there has been open dialogue between the Chairs of the Barclays Bank PLC Remuneration Committee and the Barclays PLC Remuneration Committee. The BBPLC Board Remuneration Committee (Remuneration Committee) is comprised solely of independent non-executive directors of the BBPLC Board. The Remuneration Committee is chaired by Hélène Vletter-van Dort. Helen Keelan, Maria Richter and Alex Thursby are also members. The principle role and responsibilities of the Remuneration Committee, pursuant to the Terms of Reference, is to: Adopt the over-arching principles of remuneration policy for the Barclays Bank Group within the parameters set by the BPLC Remuneration
Committee; Consider and endorse the incentive pool for the Company and its subsidiaries and the remuneration of key BBPLC executives and other specified
individuals as determined by the Remuneration Committee from time to time; Exercise oversight of remuneration issues within the Barclays Bank Group and of matters that more generally concern people and culture within
the Barclays Bank Group; and Approve the remuneration and compensation arrangement of employees that fall within the remit of the Remuneration Committee.
home.barclays/annualreport Barclays Bank PLC Annual Report 22

Governance: Directors’ report
The Remuneration Committee met three times prior to the stand-up of the new BBPLC Board and Committees in April 2018 and since stand-up has met three times. Attendance by the Remuneration Committee members is shown in the table below. Remuneration Committee meetings are attended by management, including the Chief Executive Officer and the Human Resources Director.
Member Eligible Meeting Attendance Crawford Gillies 2/2 Tim Breedon 2/2 Mary Francis 2/2 Dambisa Moyo 2/2 Hélène Vletter-van Dort 3/3 Helen Keelan 3/3 Maria Richter 2/3 Alex Thursby 3/3
During the period, the Remuneration Committee’s activities have included: Approving the Terms of Reference, Reward Policy and Standard Remuneration Committee Control Framework (and revisions), Material Risk
Taker Identification Methodology, 2018 Incentive Funding Frameworks; Endorsing the funding ratio; Approving the 2018 Ex Ante Risk Adjustment Approach and US Covered employee methodology; Receiving regular stakeholder, regulatory and legal updates, financial and risk performance updates, pay round timings and approach, Fair Pay
Agenda; and Reviewing specific remuneration arrangements for individuals within the Remuneration Committee’s remit. Board Risk Committee On 1 April 2018 with the completion of structural reform, the separate board of Barclays Bank PLC and its Committees were stood up, including the Barclays Bank PLC Board Risk Committee (Risk Committee). Unlike the Board and Committee structure of Barclays PLC, Barclays Bank PLC does not have a separate Board Reputation Committee, and instead oversight of Reputation and Conduct matters are considered at the Barclays Bank PLC Board Risk Committee. As part of the stand-up process, there has been close collaboration in Agenda setting to ensure efficient workings and sequencing of approvals between the Barclays Bank PLC Board Risk Committee and the Barclays PLC Board Risk Committee. In addition, there is open dialogue between the Chairs of the Barclays Bank PLC Board Risk Committee and the Barclays PLC Board Risk and Reputation Committee Chairs. The BBPLC Board Risk Committee is composed solely of independent non-executive directors and is chaired by Peter Bernard. Jeremy Scott, Maria Richter and Hélène Vletter-van Dort are also members. The Risk Committee met three times prior to the stand-up of the new BBPLC Board and Committees in April 2018 and since stand-up has met five times, with two of the meetings held in New York and one in Hong Kong. The Risk Committee has spent its time reviewing the risk profile and risk appetite of the Barclays Bank Group key risk issues and internal control and risk policies. Risk Committee meetings are attended by management, including the Chief Financial Officer, Chief Risk Officer, Chief Compliance Officer, Chief Internal Auditor and BBPLC General Counsel and the Company’s External Auditors, KPMG.
Member Eligible Meeting Attendance Tim Breedon 3/3 Mike Ashley 3/3 Reuben Jeffrey III 2/3 Matthew Lester 3/3 Diane Schueneman 3/3 Peter Bernard 5/5 Jeremy Scott 5/5 Maria Richter 5/5 Hélène Vletter-van Dort 5/5
The principal role and responsibilities of the Risk Committee, pursuant to the Terms of Reference, are: Risk Appetite and Risk Profile: reviewing and recommending to the BBPLC Board the risk appetite, reviewing and adopting risk limits and
mandates for financial and non-financial risk, monitoring the risk profile, and receiving and considering reports on key risk issues; Regulatory: reviewing and monitoring BBPLC’s capital and liquidity position including considering both the existing and forecasted BBPLC risk
profile and the potential impact of stress; Internal control and risk control framework: reviewing the Enterprise Risk Management Framework, approval of underlying frameworks and
policies as they apply to the Company, and review of the effectiveness of the Company’s risk management systems; Conduct Risk: reviewing effectiveness of the management of Conduct Risk and reviewing the effectiveness of the Conduct Risk Management
framework as it applies to BBPLC and its subsidiaries; Reputation Risk: reviewing the effectiveness of the management of reputation risk within Barclays Bank Group and receiving reports on
significant business decisions that may impact BBPLC or Barclays reputation; and Risk and Compliance Functions: overseeing the BBPLC Risk and Compliance functions, ensuring they are appropriately resourced and operating
effectively.
home.barclays/annualreport Barclays Bank PLC Annual Report 23

Governance Corporate governance statement
During 2018, the principal activities of the Risk Committee included: Reviewing regular financial and non-financial risk reporting on each of the principal risks and monitoring the risk profile in accordance with 2018
limits and mandates and monitoring compliance with key portfolio metrics; Reviewing the capital and liquidity position of BBPLC and any challenges to the capital position; Reviewing the key risk themes impacting BBPLC and the Barclays Group, including the impact and risks associated with the geopolitical
landscape and the exposures held by the Company in certain jurisdictions and industries; Reviewing the potential impact of European Referendum to BBPLC and the work that has been undertaken by Barclays to analyse the key risks
and impacts to the Barclays Bank Group; Reviewing and adopting relevant Group Policies, including the Enterprise Risk Management Framework and the associated frameworks; Reviewing significant conduct and reputational risks facing Barclays Bank Group, monitoring the Conduct Risk assessment of the business to
understand the Barclays Bank Group Conduct Risk profile and reviewing reports from the Transaction Review Committee on key themes and significant business transactions that have been considered from which may have a reputational impact on BBPLC or Barclays reputation; and Keeping under review the internal audit assessment of the Risk Function and the risks associated with internal audit findings.
The Risk Committee have considered focused presentations in a number of areas specific to the business and activities of Barclays Bank Group, including a joint session held with the BBPLC Board Audit Committee on the risks and controls associated with Algo and Electronic trading, the Leveraged Finance business and the risks associated with the UK Retirement Fund which is held by BBPLC. The Risk Committee continually considers the impact of issues on the Barclays Bank Group and reviews steps taken by the business to reduce exposures with higher levels of risk. Diversity and Inclusion The Board recognises the importance of ensuring that there is broad diversity among the Directors inclusive of, but not limited to, gender, ethnicity, geography and business experience. In addition, we aim to ensure that employees of all backgrounds are treated equally and have the opportunity to be successful. The Group’s global Diversity and Inclusion (D&I) strategy sets objectives, initiatives and plans across five core pillars: Gender, LGBT, Disability, Multicultural and Multigenerational, in support of that ambition. Further information on the Group’s Board Diversity Policy and D&I strategy can be found on pages 68 and 69 of the Barclays PLC Annual Report 2018.
home.barclays/annualreport Barclays Bank PLC Annual Report 24

Governance Directors’ report
The Directors present their report together with the audited accounts for Barclays Bank PLC (‘BBPLC’ or the ‘Company’) for the year ended 31 December 2018. Section 414A of the Companies Act requires the Directors to present a Strategic Report in the Annual Report and Financial Statements. The information which fulfils this requirement can be found on pages 4 to 15. BBPLC has addressed the Non-Financial Reporting requirements contained in sections 414CA and 414CB of the Act through the disclosure contained in the Barclays PLC Annual Report on pages 40 to 41. In addition, the Company has chosen, in accordance with section 414 C(11) of the Companies Act 2006, and as noted in this Directors’ report, to include certain additional matters in its Strategic Report that would otherwise be required to be disclosed in this Directors’ Report. The Directors’ Report together with the Strategic Report constitute the management report for the purpose of DTR 4.1.8R. The particulars of important events affecting the Company since the financial year end can be found in notes to the financial statements. An indication of likely future developments may be found in the Strategic Report. Other information that is relevant to the Directors’ Report, and which is incorporated by reference into this report, can be located as follows:
Pages
Employee involvement 29
Disability 30
Performance measures 11
Risk management 34
Principal risks 45
Profits and dividends The Barclays Bank Group operates through branches, offices and subsidiaries in the UK and overseas. The results of the Barclays Bank Group show profit after tax of £835m (2017: loss after tax of £1,154m). The Barclays Bank Group had net assets of £47,711m at 31 December 2018 (2017: £65,734m). Barclays PLC will pay a full year dividend in respect of 2018 of 4 pence per ordinary share on 5 April 2019 to shareholders on the share register on 1 March 2019. The Company can contribute a payment towards the Barclays PLC external dividend payment, however, in this case a contribution was not required and the Directors of BBPLC do not recommend the payment of a dividend to Barclays PLC. Further details on total dividends on ordinary shares paid due 2018 are set out in Note 12 to the accounts. Dividends paid on preference shares for the year ended 31 December 2018 amounted to £204m (2017: £242m). Share Capital There was no increase in ordinary share capital during the year. Barclays PLC owns 100% of the issued ordinary shares. There are no restrictions on the transfer of securities or agreements between holders of securities known to the Company which may result in restrictions on the transfer of securities or voting rights. Further information on the Company’s share capital can be found in note 30. In 2018, the Company reduced its share capital by £12,092m by cancelling share premium and creating distributable reserves of the same amount. The capital reduction was carried out via a court-approved reduction of capital, approved by the Company’s shareholder at a general meeting on 17 July 2018. On 11 September 2018, the capital reduction became effective following confirmation by the High Court of Justice in England and Wales which was registered with the Registrar of Companies on the same day. Repurchase of shares The Company did not repurchase any of its ordinary shares during 2018 (2017: none). On 15 December 2018, 106,000,000 Series 5 non-cumulative callable US Dollar preference shares of US$0.25 nominal value each were redeemed in full at the option of the Company. Powers of Directors to issue or buy back the Company’s shares The powers of the Directors are determined by the Companies Act 2006 and the Company’s Articles of Association. No shares were issued or bought back in 2018. The Directors are authorised to issue and allot shares and to buy back shares subject to annual shareholder approval at the AGM. Such authorities were granted by shareholders at the 2018 AGM. It will be proposed at the 2019 AGM that the Directors be granted new authorities to allot and buy-back shares.
home.barclays/annualreport Barclays Bank PLC Annual Report 25

Governance Directors’ report
Directors The Directors of the Company are listed on page 19. Changes to Directors during the year and up to the date of signing this report are set out below.
Name Role Effective date of appointment/resignation
Mike Ashley Non- executive Director Resigned 1 April 2018 Peter Bernard Non- executive Director Appointed 1 April 2018 Tim Breedon Non- executive Director Resigned 1 April 2018 Sir Ian Cheshire Non- executive Director Resigned 1 April 2018 Steven Ewart Executive Director Appointed 9 August 2018 Mary Francis Non- executive Director Resigned 1 April 2018 Crawford Gillies Non- executive Director Resigned 1 April 2018 Reuben Jeffrey III Non- executive Director Resigned 1 April 2018 Helen Keelan Non- executive Director Appointed 1 April 2018 Matthew Lester Non- executive Director Resigned 1 April 2018 John McFarlane Non- executive Director Resigned 1 April 2018 Dambisa Moyo Non- executive Director Resigned 1 April 2018 Tushar Morzaria Executive Director Resigned 10 August 2018 Maria Richter Non- executive Director Appointed 1 April 2018 Diane Schueneman Non- executive Director Resigned 1 April 2018 Jeremy Scott Non- executive Director Appointed 1 April 2018 Tim Throsby Executive Director Appointed 1 May 2018 Alexander Thursby Non- executive Director Appointed 1 April 2018 Michael Turner Non- executive Director Resigned 1 April 2018 Helene Vletter Van Dort Non- executive Director Appointed 1 April 2018 Jes Staley Executive Director Resigned 31 January 2019
Directors’ Indemnities Qualifying third party indemnity provisions (as defined by section 234 of the Companies Act 2006) were in force during the course of the financial year ended 31 December 2018 for the benefit of the then Directors and, at the date of this report, are in force for the benefit of the Directors in relation to certain losses and liabilities which they may incur (or have incurred) in connection with their duties, powers or office. In addition, the Company maintains Directors’ & Officers’ Liability Insurance which gives appropriate cover for legal action brought against its Directors. Qualifying pension scheme indemnity provisions (as defined by section 235 of the Companies Act 2006) were in force during the course of the financial year ended 31 December 2018 for the benefit of the then Directors, and at the date of this report are in force for the benefit of Directors of Barclays Pension Funds Trustees Limited as Trustee of the Barclays Bank UK Retirement Fund. The Directors of the Trustee are indemnified against liability incurred in connection with the company’s activities as Trustee of the Barclays Bank UK Retirement Fund. Similarly, qualifying pension scheme indemnities were in force during 2017 for the benefit of Directors of Barclays Executive Schemes Trustees Limited as Trustee of Barclays Bank International Limited Zambia Staff Pension Fund (1965), Barclays Capital International Pension Scheme (No.1), and Barclays PLC Funded Unapproved Retirement Benefits Scheme. The Directors of the Trustee are indemnified against liability incurred in connection with the Company’s activities as Trustee of the schemes above. Political contributions The Barclays Bank Group did not give any money for political purposes in the UK, the rest of the EU or outside of the EU, nor did it make any political donations to political parties or other political organisations, or to any independent election candidates, or incur any political expenditure during the year. Details of any political contributions made by the wider Barclays Group can be found in the 2018 Barclays PLC Annual Report. Environment Barclays focuses on addressing environmental issues where we believe we have the greatest potential to make a difference. We focus on managing our own carbon footprint and reducing our absolute carbon emissions, developing products and services to help enable the transition to a low-carbon economy, and managing the risks of climate change to our operations, clients, customers and society at large. Disclosure of global greenhouse gas emissions (GHG) is done at a Barclays Group level with information available in the Barclays PLC 2018 Annual Report with fuller disclosure available on our website at home.barclays.com/citizenship. Research and Development In the ordinary course of business the Barclays Bank Group develops new products and services in each of its business divisions. Financial Instruments The Barclays Bank Groups’ financial risk management objectives and policies, including the policy for hedging each major type of forecasted transaction for which hedge accounting is used, and the exposure to market risk, credit risk and liquidity risk are set out in pages 45 to 52. Change of control There are no significant agreements to which the Company is a party that are affected by a change of control of the Company following a takeover bid. There are no agreements between the Company and its Directors or employees providing for compensation for loss of office or employment that occurs because of a takeover bid.
home.barclays/annualreport Barclays Bank PLC Annual Report 26

Governance: Directors’ report
The Auditors The Barclays PLC Audit Committee reviews the appointment of the external auditors, as well as their relationship with the Barclays Group, including monitoring the Barclays Group’s use of the external auditors for non-audit services and the balance of audit and non-audit fees paid to them. The BBPLC Audit Committee forms part of the governance process for the appointment of external auditors and also monitors the use of the external auditors for non-audit services within BBPLC. More details on this can be found in Note 42 to the accounts.
With effect from the beginning of the 2017 financial year, KPMG was appointed as Barclays’ statutory auditor, replacing PwC following an external audit tender conducted in 2015. Non-audit services In order to safeguard the Auditor’s independence and objectivity, Barclays Group has in place a policy setting out the circumstances in which the Auditor may be engaged to provide services other than those covered by the Barclays Group audit. The Barclays Group Policy on the Provision of Services by the Group Statutory Auditor (the Policy) applies to all Barclays’ subsidiaries and other material entities over which Barclays has significant influence. The core principle of the Policy is that non-audit services (other than those legally required to be carried out by the Barclays Group’s Auditor) should only be performed by the Auditor in certain, controlled circumstances. The Policy sets out those types of services that are strictly prohibited and those that are allowable in principle. Any service types that do not fall within either list are considered by the Barclays PLC Audit Committee Chair on a case by case basis, supported by a risk assessment provided by management. Under the Policy the Barclays PLC Audit Committee has pre-approved all allowable services for which fees are less than £100,000. All requests to engage the Auditor are assessed by independent management before work can commence. Requests for allowable service types in respect of which the fees are expected to meet or exceed the above threshold must be approved by the Chair of the Barclays PLC Audit Committee before work is permitted to begin. Services where the fees are expected to be £250,000 or higher must be approved by the Barclays PLC Audit Committee as a whole. All expenses and disbursements must be included in the fees calculation. More information on this can be found in the Barclays PLC 2018 Annual Report. The fees payable to KPMG for the year ended 31 December 2018 amounted to £31m, of which £7m (2017: £10m) was payable in respect of non-audit services. A breakdown of the fees payable to the Auditor for statutory audit and non-audit work can be found in Note 42. Going concern BBPLC’s business activities, financial position, capital, factors likely to affect its future development and performance and its objectives and policies in managing the financial risks to which it is exposed are discussed in the Strategic Report and Risk Management sections. The Directors considered it appropriate to prepare the financial statements on a going concern basis. In preparing each of the Barclays Bank Group and parent Company financial statements, the directors are required to: assess the Barclays Bank Group and parent Company’s ability to continue as a going concern, disclosing, as applicable, matters related to going
concern; and use the going concern basis of accounting unless they either intend to liquidate the Barclays Bank Group or the parent Company or to cease
operations, or have no realistic alternative but to do so. The Barclays Bank Group’s business activities, financial position (including the implications of the UK’s decision to leave the European Union), capital, factors likely to affect its future development and performance and its objectives and policies in managing the financial risks to which it is exposed are discussed in the Strategic Report and Risk Management sections. The Directors have evaluated these risks in the preparation of the financial statements and consider it appropriate to prepare the financial statements on a going concern basis. Disclosure of Information to the Auditor Each Director confirms that, so far as he/she is aware, there is no relevant audit information of which the Company’s auditors are unaware and that each of the Directors has taken all the steps that he/she ought to have taken as a Director to make himself /herself aware of any relevant audit information and to establish that the Company's auditors are aware of that information. This confirmation is given pursuant to section 418 of the Companies Act 2006 and should be interpreted in accordance with and subject to those provisions. Directors’ responsibilities The following statement, which should be read in conjunction with the Auditors’ report set out on page 133 to 144, is made with a view to distinguishing for shareholders the respective responsibilities of the Directors and of the auditors in relation to the accounts. The Directors are required by the Companies Act 2006 to prepare the Company and the Barclays Bank Group accounts for each financial year and, with regards to Barclays Bank Group accounts, in accordance with Article 4 of the IAS regulation. The Directors have prepared these accounts in accordance with IFRS as adopted by the EU. Under the Companies Act 2006, the Directors must not approve the accounts unless they are satisfied that they give a true and fair view of the state of affairs of the Company and the Barclays Bank Group of their profit or loss for that period. The Directors consider that, in preparing the financial statements on pages 145 to 284, the Barclays Bank Group has used appropriate accounting policies, supported by reasonable judgements and estimates, and that all accounting standards which they consider to be applicable have been followed. Having taken all the matters considered by the Board and brought to the attention of the Board during the year into account, the Directors are satisfied that the Annual Report and Financial Statements, taken as a whole, are fair, balanced and understandable, and provide the information necessary for shareholders to assess the Company’s position and performance, business model and strategy.
home.barclays/annualreport Barclays Bank PLC Annual Report 27

Governance Directors’ report
Directors are responsible for such internal control as they determine is necessary to enable the preparation of financial statements that are free from material misstatement, whether due to fraud or error. Directors’ responsibility statement The Directors have responsibility for ensuring that the Company keeps accounting records which disclose with reasonable accuracy the financial position of the Company and which enable them to ensure that the accounts comply with the Companies Act 2006. The Directors are also responsible for preparing a Strategic Report and Directors’ Report in accordance with applicable law and regulations. The Directors are responsible for the maintenance and integrity of the Annual Report and Financial Statements as they appear on the Company’s website. Legislation in the UK governing the preparation and dissemination of financial statements may differ from legislation in other jurisdictions. The Directors have a general responsibility for taking such steps as are reasonably open to them to safeguard the assets of the Company and to prevent and detect fraud and other irregularities. The Directors, whose names are set out on page 19, confirm to the best of their knowledge that: (a) The financial statements, prepared in accordance with the applicable set of accounting standards, give a true and fair view of the assets,
liabilities, financial position and profit or loss of the Company and the undertakings included in the consolidation taken as a whole; and (b) The management report on pages 4 to 15 which is incorporated in the Directors’ Report, includes a fair review of the development and
performance of the business and the position of the Company and the undertakings included in the consolidation taken as a whole, together with a description of the principal risks and uncertainties that they face.
By order of the Board Jason Wright Company Secretary 20 February 2019 Barclays Bank PLC Registered in England. Company No. 1026167
home.barclays/annualreport Barclays Bank PLC Annual Report 28

Governance People We place a great deal of importance in providing all colleagues with the right support and frameworks to maximise their career goals and opportunities. Barclays Bank PLC colleague themes and initiatives are aligned to Barclays Group values and Barclays Group strategic goals. The following sub-sections are therefore consistent with those detailed in the People Section of the Barclays PLC Annual Report and figures mentioned are for Barclays PLC Group. Industrial Relations and Workforce Barclays places great importance on our constructive approach to global employee and industrial relations. During 2018 we continued to work with Unite, our recognised trade union in the UK and with 9 other unions and staff associations directly or through works councils internationally. In the UK, we consulted extensively with Unite on a wide range of restructuring proposals and in respect of changes to compensation structures. Our shared aim where there is restructuring - consistent with our partnership approach to industrial relations - is to minimise compulsory job losses wherever possible. This is achieved through voluntary redundancy and extensive redeployment processes and arrangements. In Europe we held regular consultations with our European Works Council (the Barclays Group European Forum) on a wide range of topics including transnational restructuring proposals, in addition to local consultation with in-country works councils. All colleagues who are displaced as a result of restructuring are offered career transition support. In 2018 c.900 colleagues were supported globally (a take up rate of over 80% of those impacted by restructuring), with over 95% satisfied with the career transition support provided. Performance Management Effective Performance management underpins our values-based culture. To support our success, colleagues align their objectives to business and team goals, this is ‘what’ they will deliver. Behavioural expectations are set in the context of our values, this is ‘how’ they will achieve their objectives. We encourage connected performance conversations throughout the year and we continue to run our global recognition programme to recognise the achievements of those who have demonstrated our values in the workplace. Colleagues are also encouraged to be involved with the Company’s performance by participating in our all-employee share plans, which have been running successfully for over 10 years. Employee Communications Barclays regularly updates employees on the financial and economic factors affecting the company’s performance and the delivery of the strategy through Barclays Group CEO and senior leader communications, line manager briefing packs, infographics, videos, interviews and talking points distributed to employees every quarter in accordance with our financial reporting calendar. We also hold a variety of events for employees so they can hear directly from the Group Executive Committee and employees are kept regularly informed about what is happening in their area and across Barclays through regular local engagement initiatives and communications that allow for discussion and build awareness and understanding. Campaigns and colleague stories throughout the year bring to life how we are living Barclays’ Purpose, ‘Creating opportunities to rise’ and Values: Respect, Integrity, Service, Excellence and Stewardship on a daily basis, providing ongoing evidence of how we are supporting our colleagues, customers and clients and the communities and societies in which we work. Be Well – Barclays Wellbeing Programme Barclays global wellbeing programme “Be Well” has focused on two key areas in 2018; a refreshed commitment to make Barclays a “mental health confident” organisation, further development of our supportive culture and the implementation of new global digital infrastructure as the gateway to the programme. The mental health confident agenda has worked to address both the stigma that can prevent open conversations about mental health – building on Barclays “This is Me” programme – while developing colleagues’ capability to understand, identify and take appropriate action where others need help. The global launch campaign involved a film of senior leaders and Board members sharing their personal reflections on mental health issues and the important role that support from colleagues can play in helping others. The call to action to colleagues was to become mental health confident themselves by completing new online development programmes on “mental health awareness” and “mental health confident”. By year end over 16,000 colleagues had completed “awareness” and c.3,500 had completed the “confident” module. 85% of colleagues already feel that their line manager takes a sincere interest in their wellbeing according to the 2018 Your View survey. To help translate this consistently into practical action, a new guide “Leading our supportive culture” was launched in November for managers, addressing key scenarios and the range of supportive actions that they can take. The launch in November of a new global Be Well portal and online health check has provided access to all Barclays wellbeing content and support in one place. The portal incorporates an interactive health check tool which targets content in the portal according to colleagues’ identified health risks.
home.barclays/annualreport Barclays Bank PLC Annual Report 29

Governance People Gender Pay Reporting Barclays PLC is publishing a Gender Pay Gap report on 21 February 2019. This document will contain Gender Pay Gap information for the Company. The results will also be uploaded to the Government’s Gender Pay Gap reporting portal to meet statutory reporting requirements. Disability & Mental Health Supporting colleagues with disabilities and mental health conditions to achieve their goals is a key priority. As part of our role as a Disability Confident Leader under the UK Government’s Department of Work and Pensions Disability Confident scheme, Barclays has taken an active role in encouraging more businesses to join the scheme, which now exceeds 7,000. To mark International Day of Persons with Disabilities we launched a paper “Building disability and mental health confidence” which documents our journey to becoming a more accessible and inclusive business. Our policies for hiring and selection, and in the broad management of our teams, require all employees at Barclays to give full and fair consideration of disabled persons on the basis of their skills and aptitudes. As part of the Disability Confident scheme we actively encourage applications from those with a disability or health condition, and we continually develop different recruitment models to remove the barriers to work for people of all abilities. Our Able to Enable internship is just one example. We encourage everyone who is either working with Barclays, or considering doing so, to open up and share information that will help us to provide the support and adjustments, including appropriate training, that they need to be able to feel valued and fulfilled at work. Barclays’ policies are designed to provide training, career development and promotion opportunities for all, including employees with a disability or health condition. Reach, the disability and mental health network Reach, our disability and mental health colleague network, supports colleagues with disabilities, and physical and mental health conditions, to develop and grow their careers within Barclays. It has engaged colleagues through a range of campaigns during 2018 including World Autism Week, Deaf Awareness Week and World Sight Day. They have grown the number of colleague-led mental health peer support groups both within the UK and in the US. In July, they launched a new global interactive version of the Workplace Adjustment Passport to create an even simpler way for colleagues to record their adjustments and make for easier conversations as they move through their careers at Barclays. Through the ‘Your View’ survey 6% of respondents disclosed a disability or mental health condition and the number of colleagues registering as allies through our Reach Purple Champions initiative doubled during 2018 with over 1,600 colleagues registering.
home.barclays/annualreport Barclays Bank PLC Annual Report 30

Risk review Content
The management of risk is a critical underpinning to the execution of Barclays Bank Group’s strategy. The material risks and uncertainties Barclays Bank Group faces across its business and portfolios are key areas of management focus.
Risk management Annual Report
Overview of Barclays Bank Group’s approach to risk management.
Enterprise Risk Management Framework (ERMF) Principal risks Risk appetite for the principal risks Roles and responsibilities in the management of risk Barclays Group’s risk culture
34
34
34
34
36
Material existing and emerging risks
Insight into the level of risk across our business and portfolios, the material existing and emerging risks and uncertainties we face and the key areas of management focus.
Material existing and emerging risks potentially impacting more than one principal risk
37
Credit risk 40
Market risk 40
Treasury and capital risk 40
Operational risk 41
Model risk 42
Conduct risk 43
Reputation risk 43
Legal risk and legal, competition and regulatory matters 43
Principal Risk management
Barclays Bank Group’s approach to risk management for each principal risk with focus on organisation and structure and roles and responsibilities.
Credit risk management 45
Market risk management 48
Treasury and capital risk management 50
Operational risk management 53
Model risk management 55
Conduct risk management 57
Reputation risk management 58
Legal risk management 59
Risk performance
Credit risk: The risk of loss to the firm from the failure of clients, customers or counterparties, including sovereigns, to fully honour their obligations to the firm, including the whole and timely payment of principal, interest, collateral and other receivables.
Credit risk overview and summary of performance 61
Maximum exposure and effects of netting, collateral and risk transfer
62
Expected credit losses 67
Movement in gross exposure and impairment allowance including provisions for loan commitments and financial guarantees
68
Measurement uncertainty and sensitivity analysis 76
Analysis of the concentration of credit risk 81
Approach to the management and representation of credit quality 87
Analysis of specific portfolios and asset types 94
home.barclays/annualreport Barclays Bank PLC Annual Report 31

Risk review Content
Risk performance continued
Annual Report
Market risk: The risk of a loss arising from potential adverse changes in the value of the firm’s assets and liabilities from fluctuation in market variables including, but not limited to, interest rates, foreign exchange, equity prices, commodity prices, credit spreads, implied volatilities and asset correlations.
Market risk overview and summary of performance Review of management measures
96 97
Treasury and capital risk – Liquidity: The risk that the firm is unable to meet its contractual or contingent obligations or that it does not have the appropriate amount, tenor and composition of funding and liquidity to support its assets.
Liquidity risk overview Liquidity risk stress testing Contractual maturity of financial assets and liabilities
99 99 99
Treasury and capital risk – Capital: The risk that the firm has an insufficient level or composition of capital to support its normal business activities and to meet its regulatory capital requirements under normal operating environments or stressed conditions (both actual and as defined for internal planning or regulatory testing purposes). This includes the risk from the firm’s pension plans.
Capital risk overview Foreign exchange risk Pension risk review
108 109 110
Treasury and capital risk – Interest rate risk in the banking book The risk that the firm is exposed to capital or income volatility because of a mismatch between the interest rate exposures of its (non-traded) assets and liabilities.
Interest rate risk in the banking book overview and summary of performance
Net interest income sensitivity Analysis of equity sensitivity Volatility of the FVOCI portfolio in the liquidity pool
112
113 114 115
Operational risk: The risk of loss to the firm from inadequate or failed processes or systems, human factors or due to external events (for example fraud) where the root cause is not due to credit or market risks.
Operational risk overview and summary of performance Operational risk profile
116 116
Model risk: The risk of the potential adverse consequences from financial assessments or decisions based on incorrect or misused model outputs and reports.
Model risk overview and summary of performance 118
Conduct risk: The risk of detriment to customers, clients, market integrity, competition or Barclays from the inappropriate supply of financial services, including instances of wilful or negligent misconduct.
Conduct risk overview and summary of performance 119
Reputation risk: The risk that an action, transaction, investment or event will reduce trust in the firm’s integrity and competence by clients, counterparties, investors, regulators, employees or the public.
Reputation risk overview and summary of performance 120
home.barclays/annualreport Barclays Bank PLC Annual Report 32

Risk review Co Credit risk mana
Legal risk: The risk of loss or imposition of penalties, damages or fines from the failure of the firm to meet its legal obligations including regulatory or contractual requirements.
Legal risk overview and summary of performance
121
Supervision and regulation
Barclays Bank Group’s operations, including its overseas offices, subsidiaries and associates, are subject to a significant body of rules and regulations.
Supervision of Barclays Bank Group Global regulatory developments Financial regulatory framework
122 124 124
home.barclays/annualreport Barclays Bank PLC Annual Report 33

Risk review Risk management Barclays’ risk management strategy
Barclays Bank Group’s risk management strategy
Introduction
The activities of Barclays Bank Group entail risk taking, every day, throughout its business. This section introduces these risks, and outlines arrangements for identifying and managing them. Barclays Bank Group's approach to fostering a strong risk culture is also described.
Enterprise Risk Management Framework (ERMF)
The ERMF sets the strategic direction for risk management by defining standards, objectives and responsibilities for all areas of Barclays Group. It is approved by the Barclays PLC Board on recommendation of the Barclays Group Chief Risk Officer; it is then adopted by the Barclays Bank Group with modifications where needed. It supports senior management in effective risk management and developing a strong risk culture.
The ERMF sets out:
Principal risks faced by Barclays Bank Group Risk appetite requirements Roles and responsibilities for risk management Risk committee structure
Principal risks
The ERMF identifies eight principal risks (see table on page 10 of this report) and sets out associated responsibilities and risk management standards.
Risk appetite for the principal risks Risk appetite is defined as the level of risk which Barclays Bank Group’s businesses are prepared to accept in the conduct of their activities.
Risk appetite is approved by the Barclays PLC Board and disseminated across legal entities, including Barclays Bank Group. Total Barclays Group appetite and its allocation to Barclays Bank Group are supported by limits to control exposures and activities that have material concentration risk implications.
Roles and responsibilities in the management of risk
The Three Lines of Defence
All colleagues are responsible for understanding and managing risks within the context of their individual roles and responsibilities, as set out below.
First Line of Defence The First Line of Defence comprises all employees engaged in the revenue generating and client facing areas of Barclays Bank Group and all associated support functions, including Finance, Treasury, Human Resources and the Chief Operating Office (COO) function. Employees in the First Line are responsible for:
identifying the risks in their activities and developing appropriate policies, standards and controls operating within any and all limits which the Risk and Compliance functions establish over the exposures and activities of the first line; and escalating risk events to senior managers in Risk and Compliance.
Second Line of Defence The Second Line of Defence comprises employees of Risk and Compliance. The role of the Second Line is to establish the limits, rules and constraints under which First Line activities shall be performed, consistent with the risk appetite of Barclays Bank Group, and to monitor the performance of the First Line against these limits and constraints. Note that the First Line may also set limits for a number of their activities related to Operational Risk. These will remain subject to supervision by the Second Line.
Third Line of Defence The Third Line of Defence comprises employees of Internal Audit. They provide independent assurance to the Barclays Bank PLC Board and Executive Management over the effectiveness of governance, risk management and control.
The Legal function does not sit in any of the three lines, but supports them all. The Legal function is, however, subject to oversight from Risk and Compliance with respect to operational and conduct risks
Risk Committees Barclays Bank Group Product/Risk Type Committees consider risk matters relevant to their business, and escalate as required to the Barclays International Risk Committee, whose Chairman, in turn, escalates to the Barclays Group Risk Committee, Barclays Bank PLC Board Committees and the Barclays Bank PLC Board.
There are two Board-level forums which oversee the application of the ERMF and review and monitor risk across the Barclays Bank Group. These are: the Barclays Bank PLC Board Risk Committee and the Barclays Bank PLC Board Audit Committee. Additionally, the Barclays Bank PLC Board Remuneration Committee oversees pay practices focusing on aligning pay to sustainable performance in line with Group Policies. Finally, the Barclays Bank PLC Board receives regular information on the risk profile of Barclays Bank Group, and has ultimate responsibility for risk appetite and capital plans, within the parameters set by the Barclays PLC Board.
home.barclays/annualreport Barclays Bank PLC Annual Report 34

Risk review Risk management Barclays’ risk management strategy
The Barclays Bank PLC Board One of the Board’s responsibilities is the approval of risk appetite allocated to Barclays Bank Group. The Board is also responsible for the adoption of the ERMF.
The Barclays Bank PLC Board Risk Committee (BRC) The BRC monitors Barclays Bank Group’s risk profile against the agreed appetite. Where actual performance differs from expectations, the actions taken by management are reviewed to ascertain that the BRC is comfortable with them. The Barclays Bank PLC CRO regularly presents a report to the BRC summarising developments in the risk environment and performance trends in the key portfolios. The BRC receives regular reports on risk methodologies, the effectiveness of the risk management framework, and Barclays Bank Group’s risk profile, including the material issues affecting each business portfolio and forward risk trends. The committee also commissions in-depth analyses of significant risk topics, which are presented by the Barclays Bank PLC CRO or senior risk managers in the businesses. The Chairman of the BRC provides a verbal update at Barclays Bank PLC Board meetings.
All members are independent non-executive Directors. The Chairman of the BRC also sits on the BAC.
The Barclays Bank PLC Board Audit Committee (BAC) The BAC receives regular reports on the effectiveness of internal control systems, on material control issues of significance, and on accounting judgements (including impairment). It also receives a half-yearly review of the adequacy of impairment allowances, which it reviews relative to the risk inherent in the portfolios, the business environment and Barclays Bank Group’s policies and methodologies. The Chairman of the BAC also sits on the BRC.
The Barclays Bank PLC Board Remuneration Committee (RemCo) The RemCo receives a detailed report on risk management performance and risk profile, and proposals on ex-ante and ex-post risk adjustments to variable remuneration. These inputs are considered in the setting of performance incentives.
Role of Barclays Group Risk Management Processes and Forums in Barclays Bank Group The Barclays Group Risk teams and Board Committees conduct risk management activity, and oversight, in respect of Barclays Bank Group: Barclays Group Board allocates a portion of the overall risk appetite to Barclays Bank Group; Certain Barclays Group Committees and executives review, and take decisions on, matters, events or transactions originating in Barclays Bank
Group that are relevant to the risk profile of the Barclays Group Barclays Group-wide risk policies are owned by the Barclays Group Risk Function teams, and adopted by Barclays Bank Group. Entity-specific
addenda are agreed with the Barclays Group where local regulations would otherwise preclude adoption, or to clarify or emphasise particular aspects.
home.barclays/annualreport Barclays Bank PLC Annual Report 35

Risk review Risk management Barclays’ risk management strategy
Barclays’ Group risk culture
Risk culture can be defined as the “norms, attitudes and behaviours related to risk awareness, risk taking and risk management”. This is reflected in how Barclays Bank Group identifies, escalates and manages risk matters.
Our Code of Conduct – the Barclays Way Globally, all colleagues must attest to the “Barclays Way”, our Code of Conduct, and all frameworks, policies and standards applicable to their roles. The Code of Conduct outlines the Purpose and Values which govern our Barclays Way of working across our business globally. It constitutes a reference point covering the aspects of colleagues’ working relationships, with other Barclays Bank Group employees, customers and clients, governments and regulators, business partners, suppliers, competitors and the broader community.
Embedding of a values-based, conduct culture Conduct, Culture and Values remain a priority of the Barclays Bank PLC Executive Committee who receive regular, detailed information from the business lines, and clearly communicate their intentions and Barclays Bank Group’s progress to all colleagues. The effectiveness of the Risk and Control environment, for which all colleagues are responsible, depends on the continued embedment of strong values. Colleagues must be willing to meet their risk management responsibilities and escalate issues on a timely basis.
Induction programmes support new colleagues in understanding how risk management culture and practices support how Barclays Bank Group does business and the link to Barclays’ values. The Leadership Curriculum covers the building, sustaining and supporting of a trustworthy organisation and is offered to colleagues globally.
Other risk culture drivers In addition to values and conduct, we consider the following determinants of risk culture:
Management and governance: This means a consistent tone from the top and clear responsibilities to enable risk identification and challenge. Motivation and incentives: The right behaviours are rewarded and modelled. Competence and effectiveness: This means that colleagues are enabled to identify, escalate and resolve risk and control matters. Integrity: Colleagues are willing to meet their risk management responsibilities, and escalate issues on a timely basis.
home.barclays/annualreport Barclays Bank PLC Annual Report 36

Risk review Material existing and emerging risks
Material existing and emerging risks to Barclays Bank Group’s future performance
Material risks are those to which senior management pay particular attention and which could cause the delivery of Barclays Bank Group’s strategy, results of operations, financial condition and/or prospects to differ materially from current expectations.
Emerging risks are those which have largely unknown components, the impact of which could crystallise over a longer time horizon. These could currently be considered immaterial but over time may individually or cumulatively affect Barclays Bank Group’s strategy and cause the same outcomes as material risks. In addition, certain factors beyond Barclays Bank Group’s control, including escalation of terrorism or global conflicts, natural disasters and similar calamities, although not detailed below, could have a similar impact on Barclays Bank Group.
The risks described below are material existing and emerging risks which senior management has identified with respect to Barclays Bank Group.
Material existing and emerging risks potentially impacting more than one principal risk
i) Business conditions, general economy and geopolitical issues
Barclays Bank Group’s business mix spreads across multiple geographies and client types. The breadth of these operations means that deterioration in the economic environment, or an increase in political instability in countries where Barclays Bank Group is active, or in any systemically important economy, could adversely affect Barclays Bank Group’s operating performance, financial condition and prospects.
Although economic activity continued to strengthen globally in 2018, a change in global economic conditions and the reversal of the improving trend may result in lower client activity in Barclays Bank Group, including lower demand for borrowing from creditworthy customers, and/or a reduction in the value of related collateral and/or an increase of Barclays Bank Group’s default rates, delinquencies, write-offs, and impairment charges, which in turn could adversely affect Barclays Bank Group’s performance and prospects. Deteriorating economic conditions could also impact the ability of Barclays Bank Group to raise funding from external investors. In addition, a shift in the forward looking consensus view of economic conditions may materially impact the models used to calculate expected credit losses (ECL), where an increase in ECLs could adversely affect Barclays Bank Group’s profitability.
In several countries, reversals of capital inflows, as well as fiscal austerity, have already caused deterioration in political stability. This could be exacerbated by a renewed rise in asset price volatility or sustained pressure on government finances. In addition, geopolitical tensions in some areas of the world are at risk of further deterioration, thus potentially increasing market uncertainties and causing adverse global economic and market conditions, which in turn could adversely affect Barclays Bank Group’s profitability in certain geographical locations.
In the UK, the vote in favour of leaving the European Union (EU), see ii) Process of UK withdrawal from the European Union below, has given rise to political uncertainty with potential consequences for investment and market confidence. The initial impact was a depreciation of Sterling resulting in higher costs for companies exposed to imports and a more favourable environment for exporters. Rising domestic costs resulting from higher import prices may impact household incomes and the affordability of consumer loans and mortgages. In turn this may affect businesses dependent on consumers for revenue, exacerbated by current pressures on businesses dependent on discretionary purchases, potentially resulting in increased impairment in Barclays Bank Group’s portfolios. There has also been a reduction in activity in both commercial and residential real estate markets which has the potential to impact the value of real estate assets and adversely affect mortgage assets. Furthermore, continued uncertainty in the withdrawal process could have a detrimental effect in the economic environment in continental Europe, which may negatively impact Barclays Bank Group’s business in specific Eurozone countries.
In the US, where the economy outperformed other key markets in 2018, there is the possibility of significant continued changes in policy in sectors including trade, healthcare and commodities which may have an impact on associated Barclays Bank Group portfolios. A significant proportion of Barclays Bank Group’s portfolio is located in the US, including a major credit card portfolio and a range of corporate and investment banking exposures. Stress in the US economy, weakening GDP and the associated exchange rate fluctuations, heightened trade tensions, an unexpected rise in unemployment and/or an increase in interest rates could lead to increased levels of impairment, resulting in a negative impact on Barclays Bank Group’s profitability.
As anticipated, most major central banks have started tightening their monetary policies in 2018 and there remains a possibility that this will continue. The risk of large capital flows spawned by divergent or differently timed policies remains, and this will continue to provide financial market turbulence, in particular in emerging market economies. This may negatively impact Barclays Bank Group’s business in the affected regions, under both profiles of credit and market risk.
Sentiment towards emerging markets as a whole continues to be driven in large part by developments in China, where there is some concern around the ability of authorities to manage growth while transitioning from manufacturing towards services. Although the Chinese government’s efforts to stably increase the weight of domestic demand have had some success, the pace of credit growth remains a concern, given the high level of leverage and despite regulatory action. A stronger than expected slowdown could result if authorities fail to appropriately manage the end of the investment and credit-led boom. Deterioration in emerging markets could affect Barclays Bank Group if it results in higher impairment charges for Barclays Bank Group via sovereign or counterparty defaults.
More broadly, a deterioration of conditions in the key markets where Barclays Bank Group operates could affect performance in a number of ways including, for example: (i) deteriorating business, consumer or investor confidence indirectly having a material adverse impact on GDP growth in significant markets and therefore on Barclays Bank Group’s performance; (ii) mark to market losses in trading portfolios resulting from changes in factors such as credit ratings, share prices and solvency of counterparties; (iii) reduced ability to obtain capital from other financial institutions for Barclays Bank Group’s operations; and (iv) lower levels of fixed asset investment and productivity growth overall.
ii) Process of UK withdrawal from the European Union
The uncertainty around Brexit spanned the whole of 2018, and intensified in the second half of the year. The full impact of the withdrawal may only be realised in years to come, as the economy adjusts to the new regime, but Barclays Bank Group continues to monitor the most relevant risks, including those that may have a more immediate impact, for its business:
home.barclays/annualreport Barclays Bank PLC Annual Report 37

Risk review Material existing and emerging risks Header level 3: Expert Sans Regular, Size 10, Light Blue
Market volatility, including in currencies and interest rates, might increase which could have an impact on the value of Barclays Bank Group’s trading book positions.
Potential UK financial institutions credit spread widening could lead to reduced investor appetite for Barclays Bank Group’s debt securities; this could negatively impact the cost of, and/or access to, funding. There is potential for continued market and interest rate volatility. This volatility could affect underlying interest rate risk value of the assets in the banking book, and securities held by Barclays Bank Group for liquidity purposes.
A credit rating agency downgrade applied directly to Barclays Bank Group, or indirectly as a result of a credit rating agency downgrade to the UK Government, could significantly increase Barclays Bank Group’s borrowing costs, credit spreads and materially adversely affect Barclays Bank Group’s interest margins and liquidity position.
Changes in the long-term outlook for UK interest rates may adversely affect pension liabilities and the market value of investments funding those liabilities.
Increased risk of a UK recession with lower growth, higher unemployment and falling UK house prices. This would likely negatively impact a number of Barclays Bank Group’s portfolios.
The implementation of trade and customs barriers between the UK and EU could lead to delays and increased costs in the passage of goods for corporate banking customers. This could negatively impact the levels of customer defaults and business volumes which may result in an increase in Barclays Bank Group’s impairment charges and a reduction in revenues.
Changes to current EU ‘Passporting’ rights may require further adjustment to the current model for Barclays Bank Group’s cross-border banking operation which could increase operational complexity and/or costs.
The ability to attract, or prevent the departure of, qualified and skilled employees may be impacted by the UK’s and the EU’s future approach to the EU freedom of movement and immigration from the EU countries and this may impact Barclays’ access to the EU talent pool.
The legal framework within which Barclays Bank Group operates could change and become more uncertain if the UK takes steps to replace or repeal certain laws currently in force, which are based on EU legislation and regulation (including EU regulation of the banking sector) following its withdrawal from the EU. Certainty around the ability to perform existing contracts, enforceability of certain legal obligations and uncertainty around the jurisdiction of the UK courts may be affected until the impacts of the loss of the current legal and regulatory arrangements between the UK and EU and the enforceability of UK judgements across the EU are fully known.
Should the UK lose automatic qualification to be part of Single Euro Payments Area there could be a resultant impact on the efficiency of, and access to, European payment systems. In addition, loss of automatic qualification to the European Economic Area (EEA) or access to Financial Markets Infrastructure including exchanges, central counterparties and payments services could impact service provision for clients, likely resulting in reduced market share and revenue and increased operating costs for Barclays Bank Group.
There are certain execution risks relating to the transfer of Barclays Bank Group’s European businesses to Barclays Bank Ireland. Technology change could result in outages or operational errors leading to delays in the transfer of assets and liabilities to Barclays Bank Ireland, and delayed delivery could lead to European clients losing access to products and service and increased reputational risk.
iii) Interest rate rises adversely impacting credit conditions
To the extent that central banks increase interest rates particularly in Barclays Bank Group’s main markets, in the UK and the US, there could be an impact on consumer debt affordability and corporate profitability.
While interest rate rises could positively impact Barclays Bank Group’s profitability, as retail and corporate business income may increase due to margin de-compression, future interest rate increases, if larger or more frequent than expectations, could cause stress in the lending portfolio and underwriting activity of Barclays Bank Group. Higher credit losses driving an increased impairment allowance would most notably impact retail unsecured portfolios and wholesale non-investment grade lending.
Changes in interest rates could also have an adverse impact on the value of high quality liquid assets which are part of Barclays Bank Group Treasury function’s investment activity. Consequently, this could create more volatility than expected through Barclays Bank Group’s FVOCI reserves.
iv) Regulatory change agenda and impact on business model
Barclays Bank Group remains subject to ongoing significant levels of regulatory change and scrutiny in many of the countries in which it operates (including, in particular, the UK and the US). As a result, regulatory risk will remain a focus for senior management and consume significant levels of business resources. Furthermore, a more intensive regulatory approach and enhanced requirements together with the uncertainty (particularly in light of the UK’s withdrawal from the EU) and potential lack of international regulatory co-ordination as enhanced supervisory standards are developed and implemented may adversely affect Barclays Bank Group’s business, capital and risk management strategies and/or may result in Barclays Bank Group deciding to modify its legal entity, capital and funding structures and business mix, or to exit certain business activities altogether or not to expand in areas despite otherwise attractive potential.
Barclays Bank UK Group was established on 1 April 2018 as the ring-fenced entity under Barclays Group. The transfer of the assets and liabilities of the Barclays UK division from Barclays Bank Group means that the Barclays Bank Group is less diversified than Barclays as a whole. Barclays Bank Group is not the parent of Barclays Bank UK Group and thus does not have recourse to the assets of Barclays Bank UK Group. Relative to Barclays Group, Barclays Bank Group is, amongst other things:
more focused on businesses outside the UK, particularly in the US, and thus more exposed to the US economy and more affected by movements in the US Dollar (and other non-Sterling currencies) relative to Sterling, with a relatively larger portion of its business exposed to US regulation.
more focused on wholesale businesses, such as corporate and investment banking and capital markets, which expose Barclays Bank Group to a broader range of market conditions, and to counterparty and operational risks. As such, the financial performance of Barclays Bank Group may be subject to greater fluctuations relative to that of Barclays as a whole or that of Barclays Bank UK Group.
home.barclays/annualreport Barclays Bank PLC Annual Report 38

Risk review Material existing and emerging risks Header level 3: Expert Sans Regular, Size 10, Light Blue
more dependent on wholesale funding sources, as the UK retail deposit base has been transferred to the Barclays Bank UK Group. The UK retail mortgage assets have also been transferred to Barclays Bank UK Group, which reduces Barclays Bank Group’s access to funding sources reliant on residential mortgage collateral. Barclays Bank Group may therefore experience more difficult financing conditions and/or higher costs of funding including in situations of stress. As a result of the implementation of ring-fencing, different Barclays Group entities, such as Barclays Bank Group, may be assessed differently by credit rating agencies, which may result in different, and possibly more negative, assessments of Barclays Bank Group’s credit and thus in lower credit ratings than the credit ratings of Barclays Group, which in turn could adversely affect the sources and costs of funding for Barclays Bank Group.
potentially subject to different regulatory obligations, including different liquidity requirements and capital buffers.
There are several other significant pieces of legislation and areas of focus which will require significant management attention, cost and resource, including:
Changes in prudential requirements (including the risk reduction measures package recently adopted in the EU to amend the Capital Requirements Directive (CRD IV) and the Bank Recovery and Resolution Directive (BRRD)) may impact minimum requirements for own funds and eligible liabilities (MREL) (including requirements for internal MREL), leverage, liquidity or funding requirements, applicable buffers and/or add-ons to such minimum requirements and risk weighted assets calculation methodologies all as may be set by international, EU or national authorities. Such or similar changes to prudential requirements or additional supervisory and prudential expectations, either individually or in aggregate, may result in, among other things, a need for further management actions to meet the changed requirements, such as: increasing capital, MREL or liquidity resources, reducing leverage and risk weighted assets; restricting distributions on capital instruments; modifying the terms of outstanding capital instruments; modifying legal entity structure (including with regard to issuance and deployment of capital, MREL and funding); changing Barclays Bank Group’s business mix or exiting other businesses; and/or undertaking other actions to strengthen Barclays Bank Group’s position. (See Treasury and capital risk on pages 99 to 116 and Supervision and regulation on pages 123 to 132 for more information).
The derivatives market has been the subject of particular focus for regulators in recent years across the G20 countries and beyond, with regulations introduced which require the reporting and clearing of standardised over the counter (OTC) derivatives and the mandatory margining of non-cleared OTC derivatives. Other regulations applicable to swap dealers, including those promulgated by the US Commodity Futures Trading Commission, have imposed significant costs on Barclays Bank Group’s derivatives business. The increased regulation of swaps and security-based swaps may also result in other increases in costs for market participants, as well as reduced liquidity in the markets for such instruments, which could cause further increases in costs and volatility. These and any future requirements, including the US SEC’s regulations relating to security-based swaps and the possibility of overlapping and/or contradictory requirements imposed on derivative transactions by regulators in different jurisdictions, are expected to continue to impact such business in the same manner.
More broadly, compliance with the evolving regulatory framework entails significant costs for market participants and is having a significant impact on certain markets in which Barclays Bank Group operates. The recast Markets in Financial Instruments Directive in Europe (MiFID II), which came into force in January 2018, has fundamentally changed the European regulatory framework entailing significant operational changes for market participants in a wide range of financial instruments as well as changes in market structures and practices. In addition, the EU Benchmarks Regulation, which also came into force in January 2018, regulates the use of benchmarks in the EU. In particular, after 1 January 2020 certain Barclays Bank Group entities will not be permitted to use benchmarks unless the relevant administrator is authorised, registered or qualifies under a third party regime. This may necessitate adapting processes and systems to transition to new alternative benchmarks, which would be a very time consuming and costly process. Separately, the transition to risk-free rates as part of a wider benchmark reform is also expected to be impactful to Barclays Bank Group in respect of the timing of the development of a robust risk free rate market, an unfavourable market reaction and/or inconsistencies in the adoption of products using the new risk free rates, and also in respect of the costs and uncertainties involved in managing and/or changing historical products to reference risk free rates as a result of the proposed discontinuation of certain existing benchmarks.
Barclays Bank Group and certain of its members are subject to supervisory stress testing exercises in a number of jurisdictions. These exercises currently include the programmes of the BoE, the EBA, the FDIC and the FRB. These exercises are designed to assess the resilience of banks to adverse economic or financial developments and enforce robust, forward looking capital and liquidity management processes that account for the risks associated with their business profile. Assessment by regulators is on both a quantitative and qualitative basis, the latter focusing on Barclays Bank Group’s or certain of its members’ business model, data provision, stress testing capability and internal management processes and controls. The stress testing requirements to which Barclays Bank Group and its members are subject are becoming increasingly stringent. Failure to meet requirements of regulatory stress tests, or the failure by regulators to approve the stress test results and capital plans of Barclays Bank Group, could result in Barclays Bank Group being required to enhance its capital position, limit capital distributions or position additional capital in specific subsidiaries. For more information on stress testing, please see Supervision and regulation on page 125.
The introduction and implementation of Payments Service Directive 2 (PSD2) with delivery across 2019 provides third parties and banks with opportunities to change and enhance the relationship between a customer and their bank. It does this by providing customers with the ability to share their transactional data with authorised third party service providers either for aggregation or payment services. It is anticipated that payment services will be offered by third parties to Barclay Bank Group’s customers. PSD2 will also introduce new requirements to the authentication process for a number of actions customers take, including ecommerce transactions. A failure to comply with PSD2 could expose Barclays Bank Group to regulatory sanction. Further, the regime could mean that actions or omissions by third party service providers could expose Barclays Bank Group to potential financial loss from third party fraud, misuse of customer data, litigation and reputational detriment, amongst other things. The changes to authentication may change the fraud environment across the industry as providers implement different approaches to comply.
home.barclays/annualreport Barclays Bank PLC Annual Report 39

Risk review Material existing and emerging risks Header level 3: Expert Sans Regular, Size 10, Light Blue
Material existing and emerging risks impacting individual principal risks
i) Credit risk
a) Impairment
The introduction of the impairment requirements of IFRS 9 Financial Instruments, implemented on 1 January 2018, results in impairment loss allowances that are recognised earlier, on a more forward looking basis and on a broader scope of financial instruments than has been the case under IAS 39 and has had, and may continue to have, a material impact on Barclays Bank Group’s financial condition.
Measurement involves increased complex judgement and impairment charges will tend to be more volatile, particularly under stressed conditions. Unsecured products with longer expected lives, such as revolving credit cards, are the most impacted. Taking into account the transitional regime, the capital treatment on the increased reserves has the potential to adversely impact regulatory capital ratios.
In addition, the move from incurred to expected credit losses has the potential to impact Barclays Bank Group’s performance under stressed economic conditions or regulatory stress tests. For more information, please refer to Note 1 on pages 157 to 161.
b) Specific sectors and concentrations
Barclays Bank Group is subject to risks arising from changes in credit quality and recovery rate of loans and advances due from borrowers and counterparties in a specific portfolio. Any deterioration in credit quality could lead to lower recoverability and higher impairment in a specific sector. The following are areas of uncertainties to Barclays Bank Group’s portfolio which could have a material impact on performance:
UK retailers. Softening demand, rising costs and a structural shift to online is fuelling pressure on the UK High Street. Whilst we have not seen any material impact, as the UK retailer market repositions itself the trend represents a potential risk in our UK corporate portfolio.
Consumer affordability has remained a key area of focus for regulators, particularly in unsecured lending, driven by the growth in levels of borrowing. Macroeconomic factors, such as rising unemployment, that impact a customer’s ability to service unsecured debt payments could lead to increased arrears in unsecured products.
UK real estate market. UK property represents a significant portion of the overall Barclays Bank Group corporate credit exposure. In 2018, property price growth across the UK continued, however, this growth has slowed in London and the South East where the Barclays Bank Group exposure has high concentration. Barclays Bank Group is at risk of increased impairment from a material fall in property prices due to the depreciation in value of the underlying loan security.
Leverage finance underwriting. Barclays Bank Group takes on sub-investment grade underwriting exposure, including single name risk, particularly in the US and Europe. Barclays Bank Group is exposed to credit events and market volatility during the underwriting period. Any adverse events during this period may potentially result in loss for Barclays Bank Group or an increased capital requirement should there be a need to hold the exposure for an extended period.
Italian portfolio. Barclays Bank Group is exposed to a decline in the Italian economic environment through a mortgage portfolio in run-off and positions to wholesale customers. The Italian economy tipped into an official recession at the end of 2018 and should the economy deteriorate further, there could be a material adverse effect on Barclays Bank Group’s results including, but not limited to, increased credit losses and higher impairment charges.
Barclays Bank Group also has large individual exposures to single name counterparties, both in its lending activities and in its financial services and trading activities, including transactions in derivatives and transactions with brokers, central clearing houses, dealers, other banks, mutual and hedge funds and other institutional clients. The default of such counterparties could have a significant impact on the carrying value of these assets. In addition, where such counterparty risk has been mitigated by taking collateral, credit risk may remain high if the collateral held cannot be realised, or has to be liquidated at prices which are insufficient to recover the full amount of the loan or derivative exposure. Any such defaults could have a material adverse effect on Barclays Bank Group’s results due to, for example, increased credit losses and higher impairment charges.
c) Environmental risk Barclays Bank Group is exposed to credit risks arising from energy and climate change. Indirect risks may be incurred as a result of environmental issues impacting the credit worthiness of the borrower resulting in higher impairment. ii) Market risk
Market volatility An uncertain outlook for the direction of monetary policy, the US-China trade conflict, slowing global growth and political concerns in the US and Europe (including Brexit) are some of the factors that could heighten market risks for Barclays Bank Group’s portfolios.
In addition, Barclays Bank Group’s trading business is generally exposed to a prolonged period of elevated asset price volatility, particularly if it negatively affects the depth of marketplace liquidity. Such a scenario could impact Barclays Bank Group’s ability to execute client trades and may also result in lower client flow-driven income and/or market-based losses on its existing portfolio of market risks. These can include having to absorb higher hedging costs from rebalancing risks that need to be managed dynamically as market levels and their associated volatilities change.
iii) Treasury and capital risk
Barclays Bank Group may not be able to achieve its business plans due to: a) inability to maintain appropriate capital ratios; b) inability to meet its obligations as they fall due; c) rating agency downgrades; d) adverse changes in foreign exchange rates on capital ratios; e) adverse movements in the pension fund; f) non-traded market risk/interest rate risk in the banking book.
a) Inability to maintain prudential ratios and other regulatory requirements This could lead to Barclays Bank Group’s inability to support business activity; a failure to meet regulatory capital requirements including any additional capital add-ons or the requirements set for regulatory stress tests; increased cost of funding due to deterioration in investor appetite or credit ratings; restrictions on distributions including the ability to meet dividend targets; and/or the need to take additional measures to strengthen Barclays Bank Group's capital or leverage position.
home.barclays/annualreport Barclays Bank PLC Annual Report 40

Risk review Material existing and emerging risks Header level 3: Expert Sans Regular, Size 10, Light Blue
b) Inability to manage liquidity and funding risk effectively This may result in Barclays Bank Group either not having sufficient financial resources to meet its payment obligations as they fall due or, although solvent, only being able to meet these obligations at excessive cost. This could cause Barclays Bank Group to fail to meet regulatory liquidity standards or be unable to support day-to-day banking activities.
The stability of Barclays Bank Group’s current funding profile, in particular that part which is based on accounts and deposits payable on demand or at short notice, could be affected by Barclays Bank Group failing to preserve the current level of customer and investor confidence. Barclays Bank Group also regularly accesses the capital markets to provide short-term and long-term funding to support its operations. Several factors, including adverse macroeconomic conditions, adverse outcomes in legal, regulatory or conduct matters and loss of confidence by investors, counterparties and/or customers in Barclays Bank Group, can affect the ability of Barclays Bank Group to access the capital markets and/or the cost and other terms upon which Barclays Bank Group is able to obtain market funding.
c) Credit rating changes and the impact on funding costs Any potential or actual credit rating agency downgrades could significantly increase Barclays Bank Group’s borrowing costs, credit spreads and materially adversely affect Barclays Bank Group’s interest margins and liquidity position. Consequently, this may result in reduced profitability for Barclays Bank Group.
d) Adverse changes in FX rates impacting capital ratios Barclays Bank Group has capital resources, risk weighted assets and leverage exposures denominated in foreign currencies. Changes in foreign currency exchange rates may adversely impact the Sterling equivalent value of these items. As a result, Barclays Bank Group’s regulatory capital ratios are sensitive to foreign currency movements. Failure to appropriately manage Barclays Bank Group’s balance sheet to take account of foreign currency movements could result in an adverse impact on regulatory capital and leverage ratios.
e) Adverse movements in the pension fund Adverse movements in pension assets and liabilities for defined benefit pension schemes could result in deficits on a funding and/or accounting basis. This could lead to Barclays Bank Group making substantial additional contributions to its pension plans and/or a deterioration in its capital position. Under IAS 19 the liabilities discount rate is derived from the yields of high quality corporate bonds.
Therefore, the valuation of Barclays Bank Group’s defined benefits schemes would be adversely affected by a prolonged fall in the discount rate due to a persistent low rate and/or credit spread environment. Inflation is another significant risk driver to the pension fund as the liabilities are adversely impacted by an increase in long-term inflation expectations.
f) Non-traded market risk/interest rate risk in the banking book A shortfall in the liquidity pool investment return could increase Barclays Bank Group’s cost of funds and impact the capital ratios. Barclays Bank Group’s structural hedge programmes for interest rate risk in the banking book rely on behavioural assumptions, as a result, the success of the hedging strategy is not guaranteed. A potential mismatch in the balance or duration of the hedge assumptions could lead to earnings deterioration.
iv) Operational risk
a) Cyber threat The frequency of cyber-attacks continues to grow and is a global threat which is inherent across all industries, including the financial sector and is a key area of focus for Barclays Bank Group. The financial sector remains a primary target for cyber criminals. There is an increasing level of sophistication in both criminal and nation state hacking for the purpose of stealing money, stealing, destroying or manipulating data, including customer data, and/or disrupting operations, where multiple threats exist including threats arising from malicious emails, distributed denial of service (DDoS) attacks, payment system compromises, supply chain and vulnerability exploitation. Other events have a compounding impact on services and customers, e.g. data breaches in social networking sites, retail companies and payments networks.
Failure to adequately manage this threat could result in increased fraud losses, inability to perform critical economic functions, customer detriment, potential regulatory censure or penalties, legal liability, reduction in shareholder value and reputational damage.
b) Fraud The level and nature of fraud threats continues to evolve, particularly with the increasing use of digital products and the greater functionality available online. Criminals continue to adapt their techniques and are increasingly focused on targeting customers and clients through ever more sophisticated methods of social engineering. External data breaches also provide criminals with the opportunity to exploit the growing levels of compromised data. These threats could lead to customer detriment, loss of business, regulatory censure, missed business opportunity and reputational damage.
c) Operational resilience The loss of or disruption to Barclays Bank Group’s business processing is a material inherent risk theme within Barclays Bank Group and across the financial services industry, whether arising through impacts on technology systems, real estate services, personnel availability or the support of major suppliers.
Failure to build resilience into business processes or into the services of technology, real estate or suppliers on which Barclays Bank Group business processes depend may result in significant customer detriment, costs to reimburse losses incurred by our customers, potential regulatory censure or penalties, and reputational damage.
d) Supplier exposure Barclays Bank Group depends on suppliers, including Barclays Services Limited, for the provision of many of its services and the development of technology. Even though Barclays Bank Group depends on suppliers, it continues to be accountable for risk arising from the actions of such suppliers.
Failure to monitor and control Barclays Bank Group’s suppliers could potentially lead to client information, or critical infrastructures and services, not being adequately protected or available when required. The dependency on suppliers and sub-contracting of outsourced services introduces concentration risk where the failure of specific suppliers could have an impact on our ability to continue to provide services that are material to
home.barclays/annualreport Barclays Bank PLC Annual Report 41

Risk review Material existing and emerging risks Header level 3: Expert Sans Regular, Size 10, Light Blue
Barclays Bank Group.
Failure to adequately manage outsourcing risk could result in increased losses, inability to perform critical economic functions, customer detriment, potential regulatory censure, legal liability and reputational damage.
e) Processing error As a large, complex bank, Barclays Bank Group faces the risk of material errors in operational processes, including payments and client transactions.
Material operational or payment errors could disadvantage Barclays Bank Group’s customers, clients or counterparties and could result in regulatory censure, legal liability, reputational damage and financial loss for Barclays Bank Group.
f) New and emergent technology Technological advancements present opportunities to develop new and innovative ways of doing business across Barclays Bank Group, with new solutions being developed both in-house and in association with third party companies. Introducing new forms of technology, however, also has the potential to increase inherent risk.
Failure to evaluate, actively manage and closely monitor risk exposure during all phases of business development could lead to customer detriment, loss of business, regulatory censure, missed business opportunity and reputational damage.
g) Ability to hire and retain appropriately qualified employees As a regulated financial institution, Barclays Bank Group requires diversified and specialist skilled colleagues. Barclays Bank Group’s ability to attract, develop and retain a diverse mix of talent is key to the delivery of its core business activity and strategy. This is impacted by a range of external and internal factors, such as the UK’s decision to leave the EU and the enhanced individual accountability applicable to the banking industry.
Failure to attract or prevent the departure of appropriately qualified and skilled employees could negatively impact our financial performance, control environment and level of employee engagement. Additionally, this may result in disruption to service which could in turn lead to disenfranchising certain customer groups, customer detriment and reputational damage.
h) Tax risk Barclays Bank Group is required to comply with the domestic and international tax laws and practice of all countries in which it has business operations. The Tax Cuts and Jobs Act has introduced substantial changes to the US tax system, including the introduction of a new tax, the Base Erosion Anti-Abuse Tax. These changes have increased Barclays Bank Group’s tax compliance obligations and require a number of system and process changes which introduce additional operational risk. In addition, increasing customer tax reporting requirements around the world and the digitisation of the administration of tax has potential to increase Barclays Bank Group’s tax compliance obligations further. In light of the above, there is a risk that Barclays Bank Group could suffer losses due to additional tax charges, other financial costs or reputational damage as a result of failing to comply with such laws and practice, or by failing to manage its tax affairs in an appropriate manner, with much of this risk attributable to the international structure of Barclays Bank Group.
i) Critical accounting estimates and judgements The preparation of financial statements in accordance with IFRS requires the use of estimates. It also requires management to exercise judgement in applying relevant accounting policies. The key areas involving a higher degree of judgement or complexity, or areas where assumptions are significant to the consolidated and individual financial statements include credit impairment charges for amortised cost assets, taxes, fair value of financial instruments, pensions and post-retirement benefits, and provisions including conduct and legal, competition and regulatory matters. There is a risk that if the judgement exercised, or the estimates or assumptions used, subsequently turn out to be incorrect, this could result in significant loss to Barclays Bank Group, beyond what was anticipated or provided for.
The further development of standards and interpretations under IFRS could also significantly impact the financial results, condition and prospects of Barclays Bank Group.
j) Data management and information protection Barclays Bank Group holds and processes large volumes of data, including personally identifiable information, intellectual property, and financial data. Failure to accurately collect and maintain this data, protect it from breaches of confidentiality and interference with its availability exposes Barclays Bank Group to the risk of loss or unavailability of data (including customer data covered under vi), c) Data protection and privacy, below) or data integrity issues. This could result in regulatory censure, legal liability and reputational damage, including the risk of substantial fines under the General Data Protection Regulation (GDPR), which strengthens the data protection rights for customers and increases the accountability of Barclays Bank Group in its management of that data.
k) Unauthorised or rogue trading Unauthorised trading, such as a large unhedged position, which arises through a failure of preventative controls or deliberate actions of the trader, may result in large financial losses for Barclays Bank Group, loss of business, damage to investor confidence and reputational damage.
l) Algorithmic trading In some areas of the investment banking business, trading algorithms are used to price and risk manage client and principal transactions. An algorithmic error could result in increased market exposure and subsequent financial losses for Barclays Bank Group and potential loss of business, damage to investor confidence and reputational damage.
v) Model risk
Enhanced model risk management requirements
Barclays Bank Group relies on models to support a broad range of business and risk management activities, including informing business decisions and strategies, measuring and limiting risk, valuing exposures (including the calculation of impairment), conducting stress testing, assessing capital adequacy, supporting new business acceptance and risk and reward evaluation, managing client assets, and meeting reporting requirements.
home.barclays/annualreport Barclays Bank PLC Annual Report 42

Risk review Material existing and emerging risks Header level 3: Expert Sans Regular, Size 10, Light Blue
Models are, by their nature, imperfect and incomplete representations of reality because they rely on assumptions and inputs, and so they may be subject to errors affecting the accuracy of their outputs. For instance, the quality of the data used in models across Barclays Bank Group has a material impact on the accuracy and completeness of our risk and financial metrics.
Models may also be misused. Model errors or misuse may result in Barclays Bank Group making inappropriate business decisions and being subject to financial loss, regulatory risk, reputational risk and/or inadequate capital reporting.
vi) Conduct risk
There is the risk of detriment to customers, clients, market integrity, effective competition or Barclays Bank Group from the inappropriate supply of financial services, including instances of wilful or negligent misconduct. This risk could manifest itself in a variety of ways:
a) Product governance and life cycle Ineffective product governance, including design, approval and review of products, inappropriate controls over internal and third party sales channels and post sales services, such as complaints handling, collections and recoveries, could lead to poor customer outcomes, as well as regulatory sanctions, financial loss and reputational damage.
b) Financial crime Barclays Bank Group may be adversely affected if it fails to effectively mitigate the risk that third parties or its employees facilitate, or that its products and services are used to facilitate financial crime (money laundering, terrorist financing and proliferation financing, breaches of economic and financial sanctions, bribery and corruption, and the facilitation of tax evasion). UK and US regulations concerning financial institutions continue to focus on combating financial crime. Failure to comply may lead to enforcement action by Barclays Bank Group’s regulators together with severe penalties, affecting Barclays Bank Group’s reputation and financial results.
c) Data protection and privacy Proper handling of personal data is critical to sustaining long-term relationships with our customers and clients and to meeting privacy laws and obligations. Failure to protect personal data can lead to potential detriment to our customers and clients, reputational damage, regulatory sanctions and financial loss, which under the GDPR may be substantial (see iv (j) Data management and information protection, above).
d) Regulatory focus on culture and accountability Regulators around the world continue to emphasise the importance of culture and personal accountability and the adoption and enforcement of adequate internal reporting and whistleblowing procedures in helping to promote appropriate conduct and drive positive outcomes for customers, colleagues, clients and markets. Failure to meet the requirements and expectations of the UK Senior Managers Regime, Certification Regime and Conduct Rules may lead to regulatory sanctions, both for the individuals and Barclays Bank Group.
vii) Reputation risk
Barclays’ association with sensitive sectors and its impact on reputation
A risk arising in one business area can have an adverse effect upon Barclays Bank Group’s overall reputation; any one transaction, investment or event that, in the perception of key stakeholders reduces their trust in Barclays Bank Group’s integrity and competence.
Barclays Bank Group’s association with sensitive topics and sectors is an area of concern for stakeholders, including:
Disclosure of climate risks and opportunities, including the activities of certain sections of the client base, which has become the subject of increased scrutiny from regulators, NGOs and other stakeholders.
The risks of association with human rights violations through the perceived indirect involvement in human rights abuses committed by clients and customers.
The manufacture and export of military and riot control goods and services by clients and customers.
These associations have the potential to give rise to reputation risk for Barclays Bank Group and may result in loss of business, regulatory censure and missed business opportunity.
In addition to the above, Reputation risk has the potential to arise from operational issues or conduct matters which cause detriment to customers, clients, market integrity, effective competition or Barclays Bank Group (see iv a) Cyber threat, iv j) Data management and information protection, and vi) Conduct risk, above).
viii) Legal risk and legal, competition and regulatory matters
Legal disputes, regulatory investigations, fines and other sanctions relating to conduct of business and breaches of legislation and/or regulations may negatively affect Barclays Bank Group’s results, reputation and ability to conduct its business.
Barclays Bank Group conducts diverse activities in a highly regulated global market and therefore is exposed to the risk of fines and other sanctions. Authorities have continued to investigate past practices, pursued alleged breaches and imposed heavy penalties on financial services firms. A breach of applicable legislation and/or regulations could result in Barclays Bank Group or its staff being subject to criminal prosecution, regulatory censure, fines and other sanctions in the jurisdictions in which it operates. Where clients, customers or other third parties are harmed by Barclays Bank Group’s conduct, this may also give rise to legal proceedings, including class actions. Other legal disputes may also arise between Barclays Bank Group and third parties relating to matters such as breaches, enforcement of legal rights or obligations arising under contracts, statutes or common law. Adverse findings in any such matters may result in Barclays Bank Group being liable to third parties or may result in Barclays Bank Group’s rights not being enforced as intended.
Details of legal, competition and regulatory matters to which Barclays Bank Group is currently exposed are set out in Note 28. In addition to matters specifically described in Note 28, Barclays Bank Group is engaged in various other legal proceedings which arise in the ordinary course of business. Barclays Bank Group is also subject to requests for information, investigations and other reviews by regulators, governmental and other public bodies in connection with business activities in which Barclays Bank Group is, or has been, engaged.
home.barclays/annualreport Barclays Bank PLC Annual Report 43

Risk review Material existing and emerging risks Header level 3: Expert Sans Regular, Size 10, Light Blue
The outcome of legal, competition and regulatory matters, both those to which Barclays Bank Group is currently exposed and any others which may arise in the future, is difficult to predict. In connection with such matters, Barclays Bank Group may incur significant expense, regardless of the ultimate outcome, and any such matters could expose Barclays Bank Group to any of the following outcomes: substantial monetary damages, settlements and/or fines; remediation of affected customers and clients; other penalties and injunctive relief; additional litigation; criminal prosecution; the loss of any existing agreed protection from prosecution; regulatory restrictions on Barclays Bank Group’s business operations including the withdrawal of authorisations; increased regulatory compliance requirements; suspension of operations; public reprimands; loss of significant assets or business; a negative effect on Barclays Bank Group’s reputation; loss of confidence by investors, counterparties, clients and/or customers; risk of credit rating agency downgrades; potential negative impact on the availability and/or cost of funding and liquidity; and/or dismissal or resignation of key individuals. In light of the uncertainties involved in legal, competition and regulatory matters, there can be no assurance that the outcome of a particular matter or matters will not be material to Barclays Bank Group’s results of operations or cash flow for a particular period.
In January 2017, Barclays Group was sentenced to serve three years of probation from the date of the sentencing order in accordance with the terms of its May 2015 plea agreement with the Department of Justice (DOJ). During the term of probation Barclays Group must, among other things, (i) commit no crime whatsoever in violation of the federal laws of the US, (ii) implement and continue to implement a compliance program designed to prevent and detect the conduct that gave rise to the plea agreement, and (iii) strengthen its compliance and internal controls as required by relevant regulatory or enforcement agencies. Potential consequences of Barclays Group, including Barclays Bank Group, breaching the plea agreement include the imposition of additional terms and conditions on Barclays Group, an extension of the agreement, or the criminal prosecution of Barclays Group, which could, in turn, entail further financial penalties and collateral consequences and have a material adverse effect on Barclays Group’s business, operating results or financial position.
There is also a risk that the outcome of any legal, competition or regulatory matters in which Barclays Bank Group is involved may give rise to changes in law or regulation as part of a wider response by relevant law makers and regulators. A decision in any matter, either against Barclays Bank Group or another financial institution facing similar claims, could lead to further claims against Barclays Bank Group.
home.barclays/annualreport Barclays Bank PLC Annual Report 44

Risk review Principal Risk management Credit risk management
Credit risk (audited)
The risk of loss to the firm from the failure of clients, customers or counterparties, including sovereigns, to fully honour their obligations to the firm, including the whole and timely payment of principal, interest, collateral and other receivables.
Overview
The credit risk that Barclays Bank Group faces arises from wholesale and retail loans and advances together with the counterparty credit risk arising from derivative contracts with clients; trading activities, including: debt securities, settlement balances with market counterparties, FVOCI assets and reverse repurchase loans.
Credit risk management objectives are to:
maintain a framework of controls to oversee credit risk;
identify, assess and measure credit risk clearly and accurately across Barclays Bank Group and within each separate business, from the level of individual facilities up to the total portfolio;
control and plan credit risk taking in line with external stakeholder expectations and avoiding undesirable concentrations;
monitor credit risk and adherence to agreed controls;
enable risk-reward objectives to be met.
Organisation and structure
Wholesale and retail portfolios are managed separately to reflect the differing nature of the assets; wholesale balances tend to be larger and are managed on an individual basis, while retail balances are greater in number but lesser in value and are, therefore, managed in aggregated segments.
The credit risk management teams in Barclays Bank Group are accountable to the Barclays Bank PLC CRO, who reports to the Barclays Group CRO.
Roles and responsibilities
The responsibilities of the credit risk management teams in the businesses, the sanctioning team and other shared services include: sanctioning new credit agreements (principally wholesale); setting strategies for approval of transactions (principally retail); setting risk appetite; monitoring risk against limits and other parameters; maintaining robust processes, data gathering, quality, storage and reporting methods for effective credit risk management; performing effective turnaround and workout scenarios for wholesale portfolios via dedicated restructuring and recoveries teams; maintaining robust collections and recovery processes/units for retail portfolios; and development of credit risk measurement models.
home.barclays/annualreport Barclays Bank PLC Annual Report 45

Risk review Principal Risk management Credit risk management
For wholesale portfolios, credit risk approval is undertaken by experienced credit risk professionals operating within a clearly defined delegated authority framework, with only the most senior credit officers assigned the higher levels of delegated authority. The largest credit exposures, which are outside the Risk Sanctioning Unit or Risk Distribution Committee authority, require the support of the Barclays Bank PLC Senior Credit Officer. For exposures in excess of the Barclays Bank PLC Senior Credit Officer’s authority, approval by the Barclays Group Senior Credit Officer/Barclays PLC Board Risk Committee is also required. Barclays Group Credit Risk Committee, attended by the Barclays Bank PLC Senior Credit Officer, provides a formal mechanism for the Barclays Group Senior Credit Officer to exercise the highest level of credit authority over the most material Barclays Group single name exposures.
In the wholesale portfolios, credit risk managers are organised in sanctioning teams by geography, industry and/or product.
The role of the Central Risk function is to provide Barclays Group-wide direction, oversight and challenge of credit risk taking. Central Risk sets the Credit Risk Control Framework, which provides the structure within which credit risk is managed, together with supporting credit risk policies and standards.
Governance and oversight of expected credit losses
Barclays Bank Group relies on Barclays Group processes in overseeing the estimation of ECL, including: i) setting requirements in policy, including key assumptions and the application of key judgements; and ii) the design and execution of models.
i. Impairment policy requirements are set and reviewed regularly by Barclays Group, at a minimum annually, to maintain adherence to accounting standards. Key judgements inherent in policy, including the estimated life of revolving credit facilities and the quantitative criteria for assessing the significant increase in credit risk (SICR), are separately supported by analytical study. In particular, the quantitative thresholds used for assessing SICR are subject to a number of internal validation criteria, particularly in retail portfolios where thresholds decrease as the origination PD of each facility increases. Key policy requirements are also typically aligned to Barclays Bank Group’s credit risk management strategy and practices, for example, wholesale customers that are risk managed on an individual basis are assessed for ECL on an individual basis upon entering Stage 3; furthermore, key internal risk management indicators of high risk are used to set SICR policy, for example, retail customers identified as High Risk Management Accounts are automatically deemed to have met the SICR criteria.
ii. ECL is estimated in line with internal policy requirements using models which are validated by a qualified independent party to the model development area, the Independent Validation Unit (IVU), before first use and at a minimum annually thereafter. The IVU is a Barclays Group function. Each model is designated an owner who is responsible for: Monitoring the performance of the model, which includes comparing predicted ECL versus flow into Stage 3 and coverage ratios; and Proposing post-model adjustments (PMA) to address model weaknesses or to account for situations where known or expected risk factors
and information have not been considered in the modelling process. Each PMA above an absolute and relative threshold is approved by the IVU for a set time period (usually a maximum of six months) together with a plan for remediation. The most material PMAs are reviewed by the Barclays Bank PLC Chief Risk Officer.
Models must also assess ECL across a range of future economic conditions. These economic scenarios are generated via an independent model and ultimately set by the Senior Scenario Review Committee, run by Barclays Group. Economic scenarios are regenerated at a minimum annually, to align with Barclays Group’s medium term planning exercise, but also if the external consensus of the UK or US economy materially worsen. The scenario probability weights are also updated when scenarios are regenerated and reviewed by the Senior Scenario Committee. Each model used in the estimation of ECL, including key inputs, are governed by a series of internal controls, which include the validation of completeness and accuracy of data in golden source systems, documented data transformations and documented lineage of data transfers between systems.
iii. The Barclays Bank Group’s organisational structure and internal governance processes oversee the review of impairment results. The Barclays Bank Group Impairment Forum, formed of members from both Finance and Risk, is responsible for overseeing impairment policy and practice across Barclays Bank Group and will approve impairment results. Reported results and key messages are communicated to the Barclays Bank PLC Board Audit Committee, which has an oversight role and provides challenge of key assumptions, including the basis of the scenarios adopted.
Credit risk mitigation Barclays Bank Group employs a range of techniques and strategies to actively mitigate credit risks. These can broadly be divided into three types:
netting and set-off
collateral
risk transfer.
Netting and set-off In most jurisdictions in which Barclays Bank Group operates, credit risk exposures can be reduced by applying netting and set-off. In exposure terms, this credit risk mitigation technique has the largest overall impact on net exposure to derivative transactions, compared with other risk mitigation techniques.
For derivative transactions, Barclays Bank Group’s normal practice is to enter into standard master agreements with counterparties (e.g. ISDAs). These master agreements typically allow for netting of credit risk exposure to a counterparty resulting from derivative transactions against the obligations to the counterparty in the event of default, and so produce a lower net credit exposure. These agreements may also reduce settlement exposure (e.g. for foreign exchange transactions) by allowing payments on the same day in the same currency to be set-off against one another.
home.barclays/annualreport Barclays Bank PLC Annual Report 46

Risk review Risk management Credit risk management
Collateral Barclays Bank Group has the ability to call on collateral in the event of default of the counterparty, comprising:
home loans: a fixed charge over residential property in the form of houses, flats and other dwellings. The value of collateral is impacted by property market conditions which drive demand and therefore value of the property. Other regulatory interventions on ability to repossess, longer period to repossession and granting of forbearance may also affect the collateral value.
wholesale lending: a fixed charge over commercial property and other physical assets, in various forms.
other retail lending: includes charges over motor vehicle and other physical assets; second lien charges over residential property, which are subordinate to first charges held either by Barclays Bank Group or by another party; and finance lease receivables, for which typically Barclays Bank Group retains legal title to the leased asset and has the right to repossess the asset on the default of the borrower.
derivatives: Barclays Bank Group also often seeks to enter into a margin agreement (e.g. Credit Support Annex) with counterparties with which Barclays Bank Group has master netting agreements in place. These annexes to master agreements provide a mechanism for further reducing credit risk, whereby collateral (margin) is posted on a regular basis (typically daily) to collateralise the mark to market exposure of a derivative portfolio measured on a net basis. Barclays Bank Group may additionally negotiate the receipt of an independent amount further mitigating risk by collateralising potential mark to market exposure moves.
reverse repurchase agreements: collateral typically comprises highly liquid securities which have been legally transferred to Barclays Bank Group subject to an agreement to return them for a fixed price.
financial guarantees and similar off-balance sheet commitments: cash collateral may be held against these arrangements.
Risk transfer A range of instruments including guarantees, credit insurance, credit derivatives and securitisation can be used to transfer credit risk from one counterparty to another. These mitigate credit risk in two main ways:
if the risk is transferred to a counterparty which is more creditworthy than the original counterparty, then overall credit risk is reduced
where recourse to the first counterparty remains, both counterparties must default before a loss materialises. This is less likely than the default of either counterparty individually so credit risk is reduced.
home.barclays/annualreport Barclays Bank PLC Annual Report 47

Risk review Principal Risk management Market risk management
Market risk (audited)
The risk of loss arising from potential adverse changes in the value of the firm’s assets and liabilities from fluctuation in market variables including, but not limited to, interest rates, foreign exchange, equity prices, commodity prices, credit spreads, implied volatilities and asset correlations.
Overview
Market risk arises primarily as a result of client facilitation in wholesale markets, involving market making activities, risk management solutions and execution of syndications. Upon execution of a trade with a client, Barclays Bank Group will look to hedge against the risk of the trade moving in an adverse direction. Mismatches between client transactions and hedges result in market risk due to changes in asset prices, volatility or correlations.
Organisation and structure
Market risk oversight and challenge is provided by business committees and Barclays Group committees, including the Market Risk Committee.
Roles and responsibilities
The objectives of market risk management are to:
understand and control market risk by robust measurement, limit setting, reporting and oversight facilitate business growth within a controlled and transparent risk management framework control market risk in the businesses according to the allocated appetite.
To meet the above objectives, a well-established governance structure is in place to manage these risks consistent with the ERMF.
The Barclays Bank PLC Board Risk Committee recommends market risk appetite to the Barclays Bank PLC Board for their approval, within the parameters set by the Barclays PLC Board.
The Market Risk Committee approves and makes recommendations concerning the Barclays Group-wide market risk profile to the Barclays Group Risk Committee. This includes overseeing the operation of the Market Risk Framework and associated standards and policies; reviewing market or regulatory issues and limits and utilisation. The committee is chaired by the Market Risk Principal Risk Lead.
Management Value at Risk
estimates the potential loss arising from unfavourable market movements, over one day for a given confidence level differs from the Regulatory VaR used for capital purposes in scope, confidence level and horizon back testing is performed to evaluate that the model is fit for purpose.
VaR is an estimate of the potential loss arising from unfavourable market movements if the current positions were to be held unchanged for one business day. For internal market risk management purposes, a historical simulation methodology with a two-year equally weighted historical period, at the 95% confidence level is used for all trading books and some banking books.
The Management VaR model in some instances may not appropriately measure some market risk exposures, especially for market moves that are not directly observable via prices. Market risk managers are required to identify risks which are not adequately captured in VaR (‘risks not in VaR’ or ‘RNIVs’).
When reviewing VaR estimates, the following considerations are taken into account:
the historical simulation uses the most recent two years of past data to generate possible future market moves, but the past may not be a good indicator of the future
home.barclays/annualreport Barclays Bank PLC Annual Report 48

Risk review Risk management Treasury and capital risk management
the one-day time horizon may not fully capture the market risk of positions that cannot be closed out or hedged within one day VaR is based on positions as at close of business and consequently, it is not an appropriate measure for intra-day risk arising from a position
bought and sold on the same day VaR does not indicate the potential loss beyond the VaR confidence level.
Limits are applied at the total level as well as by risk factor type, which are then cascaded down to particular trading desks and businesses by the market risk management function.
home.barclays/annualreport Barclays Bank PLC Annual Report 49

Risk review Principal Risk management Treasury and Capital risk management
Treasury and capital risk
Liquidity risk: The risk that the firm is unable to meet its contractual or contingent obligations or that it does not have the appropriate amount, tenor and composition of funding and liquidity to support its assets.
Capital risk: The risk that the firm has an insufficient level or composition of capital to support its normal business activities and to meet its regulatory capital requirements under normal operating environments or stressed conditions (both actual and as defined for internal planning or regulatory testing purposes). This includes the risk from the firm’s pension plans.
Interest rate risk in the banking book: The risk that the firm is exposed to capital or income volatility because of a mismatch between the interest rate exposures of its (non-traded) assets and liabilities.
Overview
Barclays Bank Group Treasury manages Treasury and Capital Risk exposure on a day-to-day basis with the Barclays Group Treasury Committee acting as the principal management body. To enforce effective oversight and segregation of duties and in line with the ERMF, the Barclays Group Treasury and Capital Risk function is responsible for oversight of key capital, liquidity, interest rate risk in the banking book (IRRBB) and pension risk management activities. The following describes the structure and governance associated with the risk types within the Treasury and Capital risk function.
Organisation and structure
Liquidity risk management (audited)
Overview
The efficient management of liquidity is essential to Barclays Bank Group in retaining the confidence of the financial markets and maintaining the sustainability of the business. There is a control framework in place for managing liquidity risk and this is designed to maintain liquidity resources that are sufficient in amount and quality and funding tenor profile that is adequate to meet the liquidity risk appetite as expressed by the Barclays Bank PLC Board based on internal and regulatory liquidity metrics.
This is achieved via a combination of policy formation, review and governance, analysis, stress testing, limit setting and monitoring. Together, these meet internal and regulatory requirements.
Roles and responsibilities
The Treasury and Capital Risk function is responsible for the management and governance of the liquidity risk mandate defined by the Barclays Bank PLC Board and the production of ILAAPs. Treasury has the primary responsibility for managing liquidity risk within the set risk appetite.
Barclays’ comprehensive control framework for managing Barclays Bank Group’s liquidity risk is designed to deliver the appropriate term and structure of funding, consistent with the liquidity risk appetite set by the Barclays Bank PLC Board.
home.barclays/annualreport Barclays Bank PLC Annual Report 50

Risk review Risk management Treasury and capital risk management
The control framework incorporates a range of ongoing business management tools to monitor, limit and stress test Barclays Bank Group balance sheet and contingent liabilities. Limit setting and transfer pricing are tools that are designed to control the level of liquidity risk taken and drive the appropriate mix of funds. In addition, Barclays maintains a Group Recovery Plan which includes application to Barclays Bank Group. Together, these tools reduce the likelihood that a liquidity stress event could lead to an inability to meet Barclays Bank Group’s obligations as they fall due. The control framework is subject to internal conformance testing and internal audit review.
The Barclays Bank PLC Board approves the Barclays Bank Group funding plan, internal stress tests and results of regulatory stress tests. The Barclays Bank PLC Asset Liability Committee is responsible for monitoring and managing liquidity risk in line with Barclays Bank Group’s funding management objectives, funding plan and risk frameworks. The Barclays Group Treasury and Capital Risk Committee monitors and reviews the liquidity risk profile and control environment, providing Second Line oversight of the management of liquidity risk. The Barclays Bank PLC Board Risk Committee reviews the risk profile, and annually reviews risk appetite and the impact of stress scenarios on the Barclays Bank Group funding plan/forecast in order to agree Barclays Bank Group’s projected funding abilities.
Barclays Bank Group maintains a range of management actions for use in a liquidity stress, these are documented in the Barclays Group Recovery Plan. Since the precise nature of any stress event cannot be known in advance, the actions are designed to be flexible to the nature and severity of the stress event and provide a menu of options that can be drawn upon as required. The Barclays Group Recovery Plan also contains more severe recovery options to generate additional liquidity in order to facilitate recovery in a severe stress. Any stress event would be regularly monitored and reviewed using key management information by Treasury, Risk and business representatives.
Capital risk management (audited)
Overview
Capital risk is managed through ongoing monitoring and management of the capital position, regular stress testing and a robust capital governance framework.
Roles and responsibilities
The management of capital risk is integral to Barclays Bank Group’s approach to financial stability and sustainability management, and is embedded in the way Barclays Bank Group and its businesses operate.
Capital risk management is underpinned by a control framework and policy. The capital management strategy, outlined in the relevant legal entity capital plans, is developed in alignment with the control framework and policy for capital risk, and is implemented consistently in order to deliver on Barclays Bank Group’s objectives, which are aligned to those of the Barclays Group.
The Barclays Bank PLC Board approves the Barclays Bank PLC capital plan, internal stress tests and results of regulatory stress tests and those of relevant Barclays Bank Group entities. The Barclays PLC Board also approves the Barclays Group recovery plan which takes into account management actions identified at the Barclays Bank Group level. Barclays International (BI) Asset and Liability Committee (ALCO) together with the Barclays Group Treasury Committee are responsible for monitoring and managing capital risk in line with Barclays Bank Group’s capital management objectives, capital plan and risk frameworks. The Barclays Bank PLC Board Risk Committee monitors and reviews the capital risk profile and control environment, providing Second Line oversight of the management of capital risk.
For relevant Barclays Bank Group subsidiaries, local management assures compliance with an entity’s minimum regulatory capital requirements by reporting to local ALCOs (or equivalents) with oversight by the BI ALCO and the Barclays Group Treasury Committee, as required.
Barclays Bank Group Treasury has the primary responsibility for managing and monitoring capital. The Barclays Group Treasury and Capital Risk function has responsibility for BI capital risk oversight. Production of the Barclays Bank PLC Solo ICAAP is the joint responsibility of Barclays Bank Group Risk and Barclays Bank Group Finance.
In 2018, Barclays complied with all regulatory minimum capital requirements.
home.barclays/annualreport Barclays Bank PLC Annual Report 51

Risk review Principal Risk management Treasury and Capital risk management
Pension risk
Barclays Bank Group maintains a number of defined benefit pension schemes for past and current employees. The ability of the pension fund to meet pension payments is maintained through investments and contributions.
Pension risk arises because the estimated market value of the pension fund assets might decline; investment returns might reduce; or the estimated value of the pension liabilities might increase. Barclays Bank Group monitors the pension risks arising from its defined benefit pension schemes and works with Trustees to address shortfalls. In these circumstances Barclays Bank Group could be required or might choose to make extra contributions to the pension fund. Barclays Bank Group’s main defined benefit scheme was closed to new entrants in 2012.
Interest rate risk in the banking book management
Overview
Banking book operations generate non-traded market risk, primarily through the mismatch between the duration of assets and liabilities and where interest rates on products reset at different dates. As per Barclays Bank Group’s policy to remain within the defined risk appetite, interest rate and FX risks residing in the banking books of the businesses are transferred to Treasury where they are centrally managed. Currently, these risks are transferred to Treasury via funding arrangements, interest rate or FX swaps. However, the businesses remain susceptible to market risk from seven key sources:
repricing/residual risk: the impact from the mismatch between the run-off of product balances and the associated interest rate hedges or from unhedged liquidity buffer investments.
structural risk: the change to the net interest income on hedge replenishment due to adverse movements in interest rates, assuming that the balance sheet remains constant.
prepayment risk: the potential loss in value if actual prepayment or early withdrawal behaviour from customers deviates from the expected or contractually agreed behaviour, which may result in a hedge or funding adjustment at a cost to Barclays Bank Group. Exposures are typically considered (where appropriate) net of any applicable offsetting early repayment charges. This risk principally relates to early repayment of fixed rate loans or withdrawal from fixed rate savings products.
recruitment risk: the potential loss in value if the actual completion or drawdown behaviour from customers deviates from the expected behaviour, which may result in a hedge or funding adjustment at a cost to Barclays Bank Group. This risk principally relates to the completion timing around the Barclays Bank Group’s fixed rate mortgage pipeline process.
margin compression risk: the effect of internal or market forces on Barclays Bank Group’s net margin where, for example, in a low rate environment any fall in rates will further decrease interest income earned on the assets whereas funding cost cannot be reduced as it is already at the minimum level.
lag risk: arises from the delay in repricing customer rates for certain variable/managed rate products, following an underlying change to market interest rates. This is typically driven by either regulatory constraint around customer notification on pricing changes, processing time for Barclays Bank Group’s notification systems or contractual agreements within a product’s terms and conditions.
asset swap spread risk: the spread between Libor and sovereign bond yields that arises from the management of the liquidity buffer investments and its associated hedges.
Furthermore, liquidity buffer investments are generally subject to fair value through other comprehensive income (FVOCI) accounting rules, whereby changes in the value of these assets impact capital via other comprehensive income (OCI), creating volatility in capital directly.
Roles and responsibilities
The non-traded market risk team provides risk management oversight and monitoring of all traded and non-traded market risk in Treasury and customer banking books, which specifically includes:
interest rate risk assessment in the customer banking books review and challenge the behavioural assumptions used in hedging and transfer pricing risk management of the liquidity buffer investments and funding activities oversight of balance sheet hedging review of residual risk in the hedge accounting solution and hedging of net investments proposes and monitors risk limits to manage traded and non-traded market risk within the agreed risk appetite.
The Barclays International (BI) Asset and Liability Committee (ALCO), together with the Barclays Group Treasury Committee, are responsible for monitoring and managing IRRBB risk in line with Barclays Bank Group’s management objectives and risk frameworks. The Barclays International Risk Committee monitors and reviews the IRRBB risk profile and control environment, providing Second Line oversight of the management of IRRBB risk. The Barclays Bank PLC Board Risk Committee reviews the interest rate risk profile, including annual review of the risk appetite and the impact of stress scenarios on the interest rate risk of the Barclays Bank Group.
home.barclays/annualreport Barclays Bank PLC Annual Report 52

Risk review Principal Risk management Operational risk management
Operational risk
The risk of loss to the firm from inadequate or failed processes, systems, human factors or due to external events (for example, fraud) where the root cause is not due to credit or market risks.
Overview
The management of operational risk has three key objectives:
Deliver an operational risk capability owned and used by business leaders which is pragmatic, relevant, and enables business leaders to make sound risk decisions over the long term. Provide the frameworks and policies to enable management to meet their risk management responsibilities while the second line of defence
provides robust, independent, and effective oversight and challenge. Deliver a consistent and aggregated measurement of operational risk that will provide clear and relevant insights, so that the right management
actions can be taken to keep the operational risk profile consistent with Barclays Bank Group’s strategy, the stated risk tolerance and stakeholder needs.
Following submission of an application to the PRA relating to Barclays Group’s Advanced Measurement Approach (AMA) permission, Barclays Group received PRA’s approval to use the Standardised Approach (TSA) for operational risk regulatory capital purposes with effect from 1 April 2018. Barclays Group has conservatively elected to retain its previous operational risk RWA amount unchanged for 2018.
Barclays Bank Group is committed to operating within a strong system of internal controls that enables business to be transacted and risk taken without exposing Barclays International to unacceptable potential losses or reputational damages. Barclays Group has an overarching Enterprise Risk Management Framework (ERMF) that sets out the approach to internal governance which Barclays Bank Group adopted.
Organisation and structure
home.barclays/annualreport Barclays Bank PLC Annual Report 53

Risk review Principal Risk management Operational risk management
Operational risk comprises a number of specific risk categories defined as follow:
Data Management & Information Risk: The risk that Barclays Bank Group’s information is not captured, retained, used or protected in accordance with its value and legal and regulatory requirements.
Financial Reporting Risk: The risk of a material misstatement or omission within Barclays Bank Group’s external financial reporting, regulatory reporting or internal financial management reporting.
Fraud Risk: The risk of financial loss when an internal or external party acts dishonestly with the intent to obtain an undue benefit, cause a loss to, or to expose either Barclays Bank Group or its customers and clients to a risk of loss.
Payments Process Risk: The risk of payments being processed inaccurately, with delays or without appropriate authentication and authorisation. It includes payments processes from initiation through to external settlement, including any repairs or amendments.
People Risk: The set of risks associated with employing and managing people, including compliance with regulations, appropriate resourcing for requirements, recruitment and development risks (excluding health and safety related risk).
Premises Risk: The risk of business detriment or harm to people due to premises and infrastructure issues.
Physical Security Risk: The risk of business detriment, financial loss or harm to people as a result of any physical security incident impacting Barclays Bank Group or a Barclays Bank Group employee - relating to harm to people, unauthorised access, intentional damage to premises or theft or intentional damage to moveable assets.
Supplier Risk: The risk that is introduced to Barclays Bank Group as a consequence of obtaining services or goods from another legal entity, or entities, whether external or internal as a result of inadequate selection, inadequate management or inadequate exit management.
Tax Risk: The risk of unexpected tax cost in relation to any tax for which Barclays Bank Group is liable, or of reputational damage on tax matters with key stakeholders such as tax authorities, regulators, shareholders or the public. Tax cost includes tax, interest or penalties levied by a taxing authority.
Technology Risk: The risk of dependency on technological solutions and failure to develop, deploy and maintain technology solutions that are stable, reliable and deliver business need.
Transaction Operations Risk: The risk of customer/client or Barclays Bank Group detriment due to unintentional error and/or failure in the end-to-end process of initiation, processing and fulfilment of an interaction between a customer/client and Barclays Bank Group with an underlying financial instrument (e.g. mortgage, derivative product, trade product etc.) in consideration.
In addition to the above, operational risk encompasses risks associated with prudential regulation. This includes the risk of failing to: adhere to prudential regulatory requirements, including capital adequacy requirements; provide regulatory submissions; or monitor and manage adherence to new prudential regulatory requirements.
These risks may result in financial and/or non-financial impacts including legal/regulatory breaches or reputational damage.
Barclays Bank Group also recognises that there are certain threats/risk drivers that are more thematic and have the potential to impact Barclays Bank Group’s strategic objectives. These are Enterprise Risk Themes which require an overarching and integrated risk management approach. Including:
Cyber: The potential loss or detriment to Barclays Bank Group caused by individuals or groups (threat actors) with the capabilities and intention to cause harm or to profit from attacks committed via network information systems against us, our suppliers, or customers/clients.
Data: Aligned to the Data Strategy of the firm and encompassing Data risks to the firm from multiple risk categories, including Data Management, Data Architecture, Data Security & Protection, Data Resilience, Data Retention and Data Privacy.
Execution: The risk of failing to deliver and implement the agreed initiatives, priorities and business outcomes required to deliver Barclays Bank Group’s Strategy within agreed timelines.
Resilience: The risk of the organisation’s ability to survive and prosper in its commercial endeavours in the presence of adverse events, shocks and chronic or incremental changes.
Roles and responsibilities
The prime responsibility for the management of operational risk and the compliance with control requirements rests with the business and functional units where the risk arises. The operational risk profile and control environment is reviewed by business management through specific meetings which cover these items. Businesses and functions are required to report their operational risks on both a regular and an event-driven basis. The reports include a profile of the material risks that may threaten the achievement of their objectives and the effectiveness of key controls, operational risk events and a review of scenarios.
The Barclays Group Head of Operational Risk is responsible for establishing, owning and maintaining an appropriate Barclays Group-wide Operational Risk Management Framework, meanwhile the Barclays Bank PLC Head of Operational Risk is responsible for overseeing the portfolio of operational risk across all businesses.
Operational Risk Management (ORM) acts in a Second Line of Defence capacity, and is responsible for defining and overseeing the implementation of the framework and monitoring Barclays Bank Group’s operational risk profile. ORM alerts management when risk levels exceed acceptable tolerance in order to drive timely decision making and actions by the first line of defence. Operational risk issues escalated from these meetings are considered through the second line of defence review meetings. Depending on their nature, the outputs of these meetings are presented to the Barclays International Risk Committee, Barclays Bank PLC Board Risk Committee and Barclays Bank PLC Board Audit Committee.
Specific reports are prepared by the business and Barclays Bank PLC Head of Operational Risk on a regular basis for the Barclays International Risk Committee and Barclays Bank PLC Board Risk Committee.
home.barclays/annualreport Barclays Bank PLC Annual Report 54

Risk review Principal Risk management Model risk management
Model risk
The risk of the potential adverse consequences from financial assessments or decisions based on incorrect or misused model outputs and reports.
Overview
Barclays Bank Group uses models to support a broad range of activities, including informing business decisions and strategies, measuring and limiting risk, valuing exposures, conducting stress testing, assessing capital adequacy, managing client assets, and meeting reporting requirements.
Since models are imperfect and incomplete representations of reality, they may be subject to errors affecting the accuracy of their output. Model errors can result in inappropriate business decisions being made, financial loss, regulatory risk, reputational risk and/or inadequate capital reporting. Models may also be misused, for instance applied to products that they were not intended for, or not adjusted, where fundamental changes to their environment would justify re-evaluating their core assumptions. Errors and misuse are the primary sources of model risk.
Robust model risk management is crucial to assessing and managing model risk within a defined risk appetite. Strong model risk culture, appropriate technology environment, and adequate focus on understanding and resolving model limitations are crucial components.
Organisation and structure
Barclays Group allocates substantial resources to identify and record models and their usage, document and monitor the performance of models, validate models and adequately address model limitations. Barclays manages model risk as an enterprise level risk similar to other principal risks.
Barclays Group has a dedicated Model Risk Management (MRM) function that consists of two main units: the Independent Validation Unit (IVU), responsible for model validation and approval, and Model Governance and Controls (MGC), covering model risk governance, controls and reporting, including ownership of model risk policy and the model inventory.
The model risk management framework consists of the model risk policy and standards. The policy prescribes Barclays Group-wide, end-to-end requirements for the identification, measurement and management of model risk, covering model documentation, development, implementation, monitoring, annual review, independent validation and approval, change and reporting processes. The policy is supported by global standards covering model inventory, documentation, validation, complexity and materiality, testing and monitoring, overlays, risk appetite, as well as vendor models and stress testing challenger models.
Barclays Group is continuously enhancing model risk management. The function reports to the Barclays Group CRO and operates a global framework. Implementation of best practice standards is a central objective of Barclays Group. Model risk reporting flows to senior management as depicted below.
home.barclays/annualreport Barclays Bank PLC Annual Report 55

Risk review Principal Risk management Model risk management
Roles and responsibilities
The key model risk management activities include:
Correctly identifying models across all relevant areas of the Barclays Bank Group, and recording models in the Barclays Group Models Database (GMD), the Barclays Group-wide model inventory. The heads of the relevant model ownership areas annually attest to the completeness and accuracy of the model inventory. MGC undertakes regular conformance reviews on the model inventory.
Enforcing that every model has a model owner who is accountable for the model. The model owner must sign off models prior to submission to IVU for validation. The model owner works with the relevant technical teams (model developers, implementation, monitoring, data services, regulatory) to maintain that the model presented to IVU is and remains fit for purpose.
Overseeing that every model is subject to validation and approval by IVU, prior to being implemented and on a continual basis. While all models are reviewed and re-approved for continued use each year, the validation frequency and the level of review and challenge applied by IVU is tailored to the materiality and complexity of each model. Validation includes a review of the model assumptions, conceptual soundness, data, design, performance testing, compliance with external requirements if applicable, as well as any limitations, proposed remediation and overlays with supporting rationale. Material model changes are subject to prioritised validation and approval.
Defining model risk appetite in terms of risk tolerance, and qualitative metrics which are used to track and report model risk.
Maintaining specific standards that cover model risk management activities relating to stress testing challenger models, model overlays, vendor models, and model complexity and materiality.
home.barclays/annualreport Barclays Bank PLC Annual Report 56

Risk review Principal Risk management Conduct risk management
Conduct risk
The risk of detriment to customers, clients, market integrity, effective competition or Barclays from the inappropriate supply of financial services, including instances of wilful or negligent misconduct.
Overview
Barclays Bank Group defines, manages and mitigates conduct risk with the goal of providing positive customer and client outcomes, protecting market integrity and promoting effective competition. This includes taking reasonable steps to assure that Barclays Bank Group culture and strategy are appropriately aligned to these goals; its products and services are reasonably designed and delivered to meet the needs of customers and clients; promoting the fair and orderly operation of the markets in which Barclays Bank Group does business; and Barclays Bank Group does not commit or facilitate money laundering, terrorist financing, bribery and corruption or breaches of economic sanctions.
Product Lifecycle, Culture and Strategy and Financial Crime are the risk categories under conduct risk within the Barclays Group definition of conduct risk.
Organisation and structure
The governance of conduct risk within Barclays Bank Group is fulfilled through management committees and forums operated by the First and Second Lines of Defence with clear escalation and reporting lines to the Barclays Bank PLC Board committees.
The Barclays International Risk Committee is the most senior executive body responsible for reviewing and monitoring the effectiveness of Barclays Bank Group management of conduct risk.
Roles and responsibilities
The Conduct Risk Management Framework (CRMF) comprises a number of elements that allow Barclays Bank Group to manage and measure its conduct risk profile.
Senior Managers have ownership within their areas for managing conduct risk. These individuals have a Statement of Responsibilities identifying the activities and areas for which they are accountable. The primary responsibility for managing conduct risk and compliance with control requirements sits with the business where the risk arises. The Barclays Bank PLC Controls Committee provides oversight of controls relating to conduct risk.
The Barclays Bank PLC Chief Compliance Officer is responsible for providing effective oversight, management and escalation of Conduct Risk in line with the CRMF. This includes overseeing the development and maintenance of the relevant Conduct Risk Policies and Standards and monitoring and reporting on the consistent application and effectiveness of the implementation of controls to manage Conduct Risk.
Businesses are required to report their conduct risks on both a quarterly and an event-driven basis. The quarterly reports detail conduct risks inherent within the business strategy and include forward looking horizon scanning analysis as well as backward looking evidence-based indicators from both internal and external sources.
The Barclays International Risk Committee is the primary Second Line governance forum for oversight of conduct risk profile and implementation of the CRMF. The responsibilities of the Barclays International Risk Committee include approval of the conduct risk tolerance and the business defined key indicators. Additional responsibilities include the identification and discussion of any emerging conduct risks exposures that have been identified.
home.barclays/annualreport Barclays Bank PLC Annual Report 57

Risk review Principal Risk management Reputation risk management
Reputation risk
The risk that an action, transaction, investment or event will reduce trust in the firm’s integrity and competence by clients, counterparties, investors, regulators, employees or the public.
Overview
A reduction of trust in Barclays Bank Group’s integrity and competence may reduce the attractiveness of Barclays Bank Group to customers and clients and other stakeholders and could lead to negative publicity, loss of revenue, regulatory or legislative action, loss of existing and potential client business, reduce workforce morale and difficulties in recruiting talent.
Organisation and structure
The governance of reputation risk within Barclays Bank Group is fulfilled through management committees and forums operated by the First and Second Lines of Defence, with clear escalation and reporting lines to the relevant Barclays Bank PLC Board committees.
The Barclays International Risk Committee is the most senior executive body responsible for reviewing and monitoring the effectiveness of Barclays Bank Group management of reputation risk.
Roles and responsibilities
The Reputation Risk Management Framework (RRMF) comprises a number of elements that allow Barclays Bank Group to manage and measure its reputation risk profile.
Reputation risk is by nature pervasive and can be difficult to quantify, requiring more subjective judgement than many other risks. The RRMF sets out what is required to manage reputation risk effectively.
The Barclays Bank PLC Chief Compliance Officer is responsible for maintaining and assessing the appropriateness of the relevant reputation risk policies and oversight of the implementation of controls to manage the risk. Barclays Bank Group is required to prepare reports for the Barclays Group Risk and Barclays PLC Board Risk Committees highlighting the most significant current and potential reputation risks and issues and how they are being managed.
home.barclays/annualreport Barclays Bank PLC Annual Report 58

Risk review Principal Risk management Legal risk management
Legal risk
The risk of loss or imposition of penalties, damages or fines from the failure of the firm to meet its legal obligations including regulatory or contractual requirements.
Overview
Overall, Barclays Bank Group has limited tolerance for legal risk, however the multitude of laws and regulations across the globe are highly dynamic and their application to particular circumstances is often unclear. This results in a degree of legal risk. The Barclays Group-wide Legal Risk Management Framework (LRMF), which applies to Barclays Bank Group, comprises a number of integrated components that allows Barclays to identify, manage and measure its legal risk profile, supported by legal risk policies and associated standards aligned to the following legal risks:
contractual arrangements – failure to engage Barclays’ Legal Function in relation to contractual arrangements litigation management – litigation not being managed by or with the support of Barclays’ Legal Function intellectual property (IP) – failure to protect Barclays’ IP assets or infringement of third party IP rights competition/anti-trust – failure to identify and escalate competition/anti-trust issues to Barclays’ Legal Function or inappropriate interactions with
competition/anti-trust authorities use of law firms – inappropriate instruction of external legal advisors contact with regulators – inappropriate interactions with regulators or inappropriate handling of confidential supervisory information from
regulatory or government agencies legal engagement – failure to appropriately engage Barclays’ Legal Function in relation to key business decisions.
Organisation and structure
The Legal Executive Committee oversees, monitors and challenges legal risk across Barclays Group. The Barclays Bank PLC Board Risk Committee is the most senior body within Barclays Bank Group responsible for reviewing and monitoring the effectiveness of management of risk across Barclays Bank Group. Escalation paths also exist to the Barclays Group Risk Committee, which oversees, monitors and challenges the effectiveness of risk management across Barclays Group.
Roles and responsibilities
The LRMF requires Barclays’ businesses and functions to integrate the management of legal risk within their strategic planning and business decision making including managing adherence to minimum control requirements. The Barclays Bank Group businesses are accountable and have primary responsibility for identifying legal risk in their area as well as responsibility for adherence to the minimum control requirements and compliance with the LRMF and legal risk policies.
All employees, regardless of their position, business or function or location, must play a part in the Barclays Bank Group’s legal risk management. Employees are responsible for understanding and taking reasonable steps to manage and minimise legal risk that may arise in the context of their individual roles and responsibilities. Employees are required to be familiar with the LRMF and legal risk policies and to know how to escalate actual or potential legal risk issues.
Legal risk management is everyone’s responsibility, as part of a risk culture aligned to Barclays’ values, promoting transparency and timely escalation and management of risks and issues, supported by clearly defined roles and responsibilities across the Three Lines of Defence.
The Legal Function does not sit in any of the Three Lines of Defence but supports them all. The LRMF details the main activities the Legal Function undertakes to support the Barclays Bank Group in managing risk, including the identification of issues and risks, coverage with appropriate expertise and escalation. The LRMF, legal risk policies and activities of the Legal Function are designed so that the Barclays Bank Group receives advice from appropriate legal professionals in circumstances that are most likely to give rise to legal risk.
The Group General Counsel, supported by the Legal Executive Committee and the Global Head of Legal Risk, Governance and Control, is responsible for maintaining an appropriate LRMF, developing non-financial legal risk tolerances and for overseeing legal risk management.
home.barclays/annualreport Barclays Bank PLC Annual Report 59

Risk review Risk performance Credit risk
Summary of Contents Page
Credit risk represents a significant risk to the Barclays Bank Group and mainly arises from exposure to wholesale and retail loans and advances together with the counterparty credit risk arising from derivative contracts entered into with clients.
Credit risk overview and summary of performance Maximum exposure and effects of netting, collateral and risk transfer
61 62
This section outlines the expected credit loss allowances, the movements in allowances during the period, material management adjustments to model output and measurement uncertainty and sensitivity analysis.
Expected credit losses - Loans and advances at amortised cost by product - Movement in gross exposures and impairment allowance
including provisions for loan commitments and financial guarantees
- Stage 2 decomposition Management adjustments to models for impairment Measurement uncertainty and sensitivity analysis
67 67 68 74 75 76
The Barclays Bank Group reviews and monitors risk concentrations in a variety of ways. This section outlines performance against key concentration risks.
Analysis of the concentration of credit risk - Geographic concentrations - Industry concentrations
Approach to management and representation of credit quality - Asset credit quality - Debt securities - Balance sheet credit quality - Credit exposures by internal PD grade
81 81 83 87 87 87 87 92
Credit Risk monitors exposure performance across a range of significant portfolios.
Analysis of specific portfolios and asset types - Credit cards, unsecured loans and other retail lending
94 94
home.barclays/annualreport Barclays Bank PLC Annual Report 60

Risk review Risk performance Credit risk
Credit risk
The risk of loss to the firm from the failure of clients, customers or counterparties, including sovereigns, to fully honour their obligations to the firm, including the whole and timely payment of principal, interest, collateral and other receivables.
All disclosures in this section (pages 61-94) are unaudited unless otherwise stated.
Overview
Credit risk represents a significant risk to the Barclays Bank Group and mainly arises from exposure to wholesale and retail loans and advances together with the counterparty credit risk arising from derivative contracts entered into with clients.
IFRS 9 Financial Instruments is effective from 1 January 2018, introducing an expected credit loss model using forward looking information which replaces an incurred loss model. The presentation of credit risk within this risk performance section provides additional disclosures under the new standard. Further detail can be found in the Financial statements section in Note 1 Significant accounting policies, Note 9 Credit impairment charges and other provisions and Note 43 Transition disclosures. Descriptions of IFRS 9 terminology can be found in the glossary, available at home.barclays/annualreport.
Summary of performance in the period
Credit impairment charges and other provisions for Barclays Bank Group decreased to £643m in 2018 (2017: £1,553m) reflecting the transfer of the UK banking business on 1 April 2018 to Barclays Bank UK Group. The reduction is further due to single name charges in 2017, the non-recurrence of a £168m charge in Q317 relating to deferred consideration from the Q117 asset sale in US cards, and improved consensus-based macroeconomic forecasts since the adoption of IFRS 9.
Key metrics
Reduction of £3,259m impairment allowance
Impairment allowances on loans and advances at amortised cost in Barclays Bank Group decreased by £3,259m to £3,843m (1 January 2018: £7,102m) reflecting the transfer of the UK banking business on 1 April 2018 to Barclays Bank UK Group.
Please see credit risk management section on pages 45 to 47 for details of governance, policies and procedures.
home.barclays/annualreport Barclays Bank PLC Annual Report 61

Risk review Risk performance Credit risk
Analysis of the Balance Sheet
Maximum exposure and effects of netting, collateral and risk transfer
The following tables present a reconciliation between the Barclays Bank Group’s maximum exposure and its net exposure to credit risk, reflecting the financial effects of risk mitigation reducing the Barclays Bank Group’s exposure.
For financial assets recognised on the balance sheet, maximum exposure to credit risk represents the balance sheet carrying value after allowance for impairment. For off-balance sheet guarantees, the maximum exposure is the maximum amount that the Barclays Bank Group would have to pay if the guarantees were to be called upon. For loan and other credit related commitments, the maximum exposure is the full amount of the committed facilities. This and subsequent analyses of credit risk exclude other financial assets not subject to credit risk, mainly equity securities. The Barclays Bank Group mitigates the credit risk to which it is exposed through netting and set-off, collateral and risk transfer. Further detail on these forms of credit enhancement is presented on page 46 of the credit risk management section.
Overview As at 31 December 2018, the Barclays Bank Group’s net exposure to credit risk, after taking into account credit risk mitigation, decreased 17% to £655.0bn, driven by the transfer of the UK banking business. Overall, the extent to which the Barclays Bank Group holds mitigation against its total exposure decreased to 40% (2017: 43%). Of the unmitigated on balance sheet exposure, a significant portion relates to cash held at central banks, cash collateral and settlement balances, and debt securities issued by governments, all of which are considered to be lower risk. Decreases in cash and balances at central banks, loans and advances at amortised cost and off balance sheet loan commitments have driven the decrease in the Barclays Bank Group’s net exposure to credit risk. Trading portfolio liability positions, which to a significant extent economically hedge trading portfolio assets but which are not held specifically for risk management purposes, are excluded from the analysis. The credit quality of counterparties to derivatives, financial investments and wholesale loan assets are predominantly investment grade and there are no significant changes from prior year. Further analysis on the credit quality of assets is presented on pages 88 to 94. Where collateral has been obtained in the event of default, the Barclays Bank Group does not, ordinarily, use such assets for its own operations and they are usually sold on a timely basis. The carrying value of assets held by the Barclays Bank Group as at 31 December 2018, as a result of the enforcement of collateral, was £6m (2017: £nil).
home.barclays/annualreport Barclays Bank PLC Annual Report 62

Risk review Risk performance Credit risk
Maximum exposure and effect of netting, collateral and risk transfer (audited)
Maximum exposure
Netting and set-off
Cash collateral
Non-cash collateral Risk transfer Net exposure Barclays Bank Group
As at 31 December 2018 £m £m £m £m £m £m
On-balance sheet:
Cash and balances at central banks 136,359 - - - - 136,359
Cash collateral and settlement balances 74,352 - - - - 74,352
Loans and advances at amortised cost:
Home loans 13,160 - (294) (12,675) (129) 62
Credit cards, unsecured and other retail lending 33,791 - (607) (5,063) (427) 27,694
Corporate loans 90,008 (7,546) (63) (27,853) (3,971) 50,575
Total loans and advances at amortised cost 136,959 (7,546) (964) (45,591) (4,527) 78,331
Of which credit-impaired (Stage 3):
Home loans 887 - (3) (854) (30) -
Credit cards, unsecured and other retail lending 645 - (6) (231) (38) 370
Corporate loans 558 - - (150) (17) 391
Total credit-impaired loans and advances at amortised cost 2,090 - (9) (1,235) (85) 761
Reverse repurchase agreements and other similar secured lending 1,613 - (17) (1,565) - 31
Trading portfolio assets:
Debt securities 57,134 - - (451) - 56,683
Traded loans 7,234 - - (154) - 7,080
Total trading portfolio assets 64,368 - - (605) - 63,763
Financial assets at fair value through the income statement:
Loans and advances 15,644 - (11) (9,690) - 5,943
Debt securities 4,515 - - (445) - 4,070
Reverse repurchase agreements 119,391 - (2,996) (115,951) - 444
Other financial assets 528 - - - - 528
Total financial assets at fair value through the income statement 140,078 - (3,007) (126,086) - 10,985
Derivative financial instruments 222,683 (172,014) (31,475) (5,502) (4,712) 8,980
Financial assets at fair value through other comprehensive income 44,983 - - - (399) 44,584
Other assets 699 - - - - 699
Total on-balance sheet 822,094 (179,560) (35,463) (179,349) (9,638) 418,084
Off-balance sheet:
Contingent liabilities 19,394 - (399) (1,418) (190) 17,387
Loan commitments 257,768 - (89) (36,852) (1,288) 219,539
Total off-balance sheet 277,162 - (488) (38,270) (1,478) 236,926
Total 1,099,256 (179,560) (35,951) (217,619) (11,116) 655,010 Off-balance sheet exposures are shown gross of provisions of £217m (2017: £79m). See Note 27 for further details. In addition to the above, Barclays Bank Group holds forward starting reverse repos amounting to £35.5bn (2017: £31.4bn). The balances are fully collateralised.
home.barclays/annualreport Barclays Bank PLC Annual Report 63

Risk review Risk performance Credit risk
Maximum exposure and effects of netting, collateral and risk transfer (audited)
Maximum exposure
Netting and set-off
Cash collateral
Non-cash collateral Risk transfer Net exposure Barclays Bank Group
As at 31 December 2017 £m £m £m £m £m £m
On-balance sheet:
Cash and balances at central banks 171,036 - - - - 171,036
Cash collateral and settlement balances 77,172 - - - - 77,172
Loans and advances at amortised cost:
Home loans 147,002 - (158) (146,554) - 290
Credit cards, unsecured and other retail lending 55,767 - (228) (3,995) (16) 51,528
Corporate loans 121,821 (6,617) (230) (46,402) (4,378) 64,194
Total loans and advances at amortised cost 324,590 (6,617) (616) (196,951) (4,394) 116,012
Reverse repurchase agreements and other similar secured lending 12,546 - - (12,226) - 320
Trading portfolio assets:
Debt securities 51,195 - - - - 51,195
Traded loans 3,140 - - (128) - 3,012
Total trading portfolio assets 54,335 - - (128) - 54,207
Financial assets at fair value through the income statement:
Loans and advances 11,037 - (440) (5,497) (344) 4,756
Debt securities 15 - - - - 15
Reverse repurchase agreements 100,040 - (426) (99,428) - 186
Other financial assets 519 - - - - 519
Total financial assets at fair value through the income statement 111,611 - (866) (104,925) (344) 5,476
Derivative financial instruments 237,987 (184,265) (33,092) (6,170) (5,885) 8,575
Financial assets at fair value through other comprehensive income 57,129 - - (463) (853) 55,813
Other assets 2,994 - - - - 2,994
Total on-balance sheet 1,049,400 (190,882) (34,574) (320,863) (11,476) 491,605
Off-balance sheet:
Contingent liabilities 19,012 - (318) (1,482) (228) 16,984
Loan commitments 315,573 - (73) (31,069) (1,757) 282,674
Total off-balance sheet 334,585 - (391) (32,551) (1,985) 299,658
Total 1,383,985 (190,882) (34,965) (353,414) (13,461) 791,263
home.barclays/annualreport Barclays Bank PLC Annual Report 64

Risk review Risk performance Credit risk
Maximum exposure and effects of netting, collateral and risk transfer (audited) Maximum
exposure Netting and
set-off Cash
collateral Non-cash collateral Risk transfer Net exposure Barclays Bank PLC
As at 31 December 2018 £m £m £m £m £m £m
On-balance sheet:
Cash and balances at central banks 126,002 - - - - 126,002
Cash collateral and settlement balances 66,196 - - - - 66,196
Loans and advances at amortised cost:
Home loans 12,229 - (267) (11,820) (95) 47
Credit cards, unsecured and other retail lending 4,716 - (532) (2,437) (305) 1,442
Corporate loans 139,819 (7,548) (7,856) (25,579) (3,934) 94,902
Total loans and advances at amortised cost 156,764 (7,548) (8,655) (39,836) (4,334) 96,391
Of which credit-impaired (Stage 3):
Home loans 828 - (3) (795) (30) -
Credit cards, unsecured and other retail lending 270 - (6) (220) (38) 6
Corporate loans 554 - - (149) (17) 388
Total credit-impaired loans and advances at amortised cost 1,652 - (9) (1,164) (85) 394
Reverse repurchase agreements and other similar secured lending 5,766 - - (5,766) - -
Trading portfolio assets:
Debt securities 37,812 - - (451) - 37,361
Traded loans 7,234 - - (154) - 7,080
Total trading portfolio assets 45,046 - - (605) - 44,441
Financial assets at fair value through the income statement:
Loans and advances 31,902 - (11) (7,452) - 24,439
Debt securities 3,997 - - - - 3,997
Reverse repurchase agreements 143,277 - (799) (142,478) - -
Other financial assets 57 - - - - 57
Total financial assets at fair value through the income statement 179,233 - (810) (149,930) - 28,493
Derivative financial instruments 221,247 (171,095) (31,191) (5,474) (4,712) 8,775
Financial assets at fair value through other comprehensive income 43,697 - - - (399) 43,298
Other assets 762 - - (15) - 747
Total on-balance sheet 844,713 (178,643) (40,656) (201,626) (9,445) 414,343
Off-balance sheet:
Contingent liabilities 25,652 - (390) (1,348) (187) 23,727
Loan commitments 191,732 - (57) (38,756) (1,286) 151,633
Total off-balance sheet 217,384 - (447) (40,104) (1,473) 175,360
Total 1,062,097 (178,643) (41,103) (241,730) (10,918) 589,703 Off-balance sheet exposures are shown gross of provisions of £174m (2017: £79m). See Note 27 for further details. In addition to the above, Barclays Bank PLC holds forward starting reverse repos amounting to £33.4bn (2017: £24.3bn). The balances are fully collateralised.
home.barclays/annualreport Barclays Bank PLC Annual Report 65

Risk review Risk performance Credit risk
Maximum exposure and effects of netting, collateral and risk transfer (audited)
Maximum exposure
Netting and set-off
Cash collateral
Non-cash collateral Risk transfer Net exposure Barclays Bank PLC
As at 31 December 2017 £m £m £m £m £m £m
On-balance sheet:
Cash and balances at central banks 165,713 - - - - 165,713
Cash collateral and settlement balances 70,960 - - - - 70,960
Loans and advances at amortised cost:
Home loans 146,052 - (158) (145,616) (21) 257
Credit cards, unsecured and other retail lending 31,542 - (235) (1,732) (16) 29,559
Corporate loans 177,661 (6,783) (14,150) (54,714) (4,033) 97,981
Total loans and advances at amortised cost 355,255 (6,783) (14,543) (202,062) (4,070) 127,797
Reverse repurchase agreements and other similar secured lending 22,964 - - (22,964) - -
Trading portfolio assets:
Debt securities 35,753 - - - - 35,753
Traded loans 3,137 - - (126) - 3,011
Total trading portfolio assets 38,890 - - (126) - 38,764
Financial assets at fair value through the income statement:
Loans and advances 22,395 - (440) (5,497) (344) 16,114
Debt securities 3,307 (2,016) - - - 1,291
Reverse repurchase agreements 91,443 - (352) (91,091) - -
Other financial assets 29 - - - - 29
Total financial assets at fair value through the income statement 117,174 (2,016) (792) (96,588) (344) 17,434
Derivative financial instruments 232,288 (178,496) (32,061) (6,170) (5,494) 10,067
Financial assets at fair value through other comprehensive income 54,306 - - - (853) 53,453
Other assets 3,991 - - - - 3,991
Total on-balance sheet 1,061,541 (187,295) (47,396) (327,910) (10,761) 488,179
Off-balance sheet:
Contingent liabilities 27,417 - (310) (1,431) (179) 25,497
Loan commitments 252,921 - (54) (23,669) (1,736) 227,462
Total off-balance sheet 280,338 - (364) (25,100) (1,915) 252,959
Total 1,341,879 (187,295) (47,760) (353,010) (12,676) 741,138
home.barclays/annualreport Barclays Bank PLC Annual Report 66

Risk review Risk performance Credit risk
Expected Credit Losses Loans and advances at amortised cost by product (audited) The table below presents a breakdown of loans and advances at amortised cost and the impairment allowance with stage allocation by asset classification. Barclays Bank Group does not hold any material purchased or originated credit-impaired assets as at year end. Barclays Bank Group Stage 2
As at 31 December 2018 Stage 1 Not past due <=30 days
past due >30 days past
due Total Stage 3 Totala
Gross exposure £m £m £m £m £m £m £m
Home loans 11,486 663 50 147 860 1,194 13,540 Credit cards, unsecured loans and other retail lending 29,548 4,381 305 240 4,926 2,078 36,552 Corporate loans 81,555 7,480 315 443 8,238 917 90,710 Total 122,589 12,524 670 830 14,024 4,189 140,802 Impairment allowance Home loans 26 29 9 9 47 307 380 Credit cards, unsecured loans and other retail lending 356 694 118 160 972 1,433 2,761 Corporate loans 107 214 11 11 236 359 702 Total 489 937 138 180 1,255 2,099 3,843 Net exposure Home loans 11,460 634 41 138 813 887 13,160 Credit cards, unsecured loans and other retail lending 29,192 3,687 187 80 3,954 645 33,791 Corporate loans 81,448 7,266 304 432 8,002 558 90,008 Total 122,100 11,587 532 650 12,769 2,090 136,959 Coverage ratio % % % % % % % Home loans 0.2 4.4 18.0 6.1 5.5 25.7 2.8 Credit cards, unsecured loans and other retail lending 1.2 15.8 38.7 66.7 19.7 69.0 7.6 Corporate loans 0.1 2.9 3.5 2.5 2.9 39.1 0.8 Total 0.4 7.5 20.6 21.7 8.9 50.1 2.7
Barclays Bank PLC Stage 2
As at 31 December 2018 Stage 1 Not past due <=30 days
past due >30 days past
due Total Stage 3 Totalb
Gross exposure £m £m £m £m £m £m £m
Home loans 10,673 604 49 146 799 1,134 12,606 Credit cards, unsecured loans and other retail lending 3,915 548 10 34 592 383 4,890 Corporate loans 131,654 7,197 307 429 7,933 907 140,494 Total 146,242 8,349 366 609 9,324 2,424 157,990 Impairment allowance Home loans 24 29 9 9 47 306 377 Credit cards, unsecured loans and other retail lending 19 29 7 6 42 113 174 Corporate loans 99 201 11 11 223 353 675 Total 142 259 27 26 312 772 1,226 Net exposure Home loans 10,649 575 40 137 752 828 12,229 Credit cards, unsecured loans and other retail lending 3,896 519 3 28 550 270 4,716 Corporate loans 131,555 6,996 296 418 7,710 554 139,819 Total 146,100 8,090 339 583 9,012 1,652 156,764 Coverage ratio % % % % % % % Home loans 0.2 4.8 18.4 6.2 5.9 27.0 3.0 Credit cards, unsecured loans and other retail lending 0.5 5.3 70.0 17.6 7.1 29.5 3.6 Corporate loans 0.1 2.8 3.6 2.6 2.8 38.9 0.5 Total 0.1 3.1 7.4 4.3 3.3 31.8 0.8 Note a Other financial assets subject to impairment not included in the table above include cash collateral and settlement balances, financial assets at fair value through other
comprehensive income, accrued income and sundry debtors. These have a total gross exposure of £120.1bn (1 January 2018: £128.1bn) and impairment allowance of £11m (1 January 2018: £9m). This comprises £9m ECL on £119.6bn stage 1 assets and £2m on £0.5bn stage 2 fair value through other comprehensive income assets.
b Other financial assets subject to impairment not included in the table above include cash collateral and settlement balances, financial assets at fair value through other comprehensive income, accrued income and sundry debtors. These have a total gross exposure of £110.7bn and impairment allowance of £12m. This comprises £10m ECL on £110.2bn stage 1 assets and £2m on £0.5bn stage 2 fair value through other comprehensive income assets.
home.barclays/annualreport Barclays Bank PLC Annual Report 67

Risk review Risk performance Credit risk
Movement in gross exposures and impairment allowance including provisions for loan commitments and financial guarantees The following tables present a reconciliation of the opening to the closing balance of the exposure and impairment allowance. Explanation of the terms: 12-month ECL, lifetime ECL and credit-impaired are included in Note 9 on page 173.
Gross exposure for loans and advances at amortised cost (audited)
Barclays Bank Group Stage 1 Stage 2 Stage 3 Total
£m £m £m £m
As at 1 January 2018 266,173 49,592 9,081 324,846 Disposal of business to Barclays Bank UK PLC (155,390) (27,978) (4,202) (187,570) Net transfers between stages 4,999 (6,196) 1,197 - Business activity in the year 51,044 1,650 122 52,816 Net drawdowns and repayments (5,635) 767 155 (4,713) Final repayments (33,493) (3,811) (654) (37,958) Disposals (5,109) - (54) (5,163) Write-offs - - (1,456) (1,456) As at 31 December 2018 122,589 14,024 4,189 140,802
Impairment allowance on loans and advances at amortised cost (audited)
Barclays Bank Group Stage 1 Stage 2 Stage 3 Total
£m £m £m £m
As at 1 January 2018 608 3,112 3,382 7,102 Disposal of business to Barclays Bank UK PLC (168) (1,490) (1,278) (2,936) Net transfers between stages 664 (995) 331 - Business activity in the year 191 114 57 362 Net re-measurement and movement due to exposure and risk parameter changes
(740) 597 1,189 1,046
UK economic uncertainty adjustment - 50 - 50 Final repayments (66) (133) (72) (271) Disposals - - (54) (54) Write-offs - - (1,456) (1,456) As at 31 December 2018a 489 1,255 2,099 3,843
Reconciliation of ECL movement to impairment charge/(release) for the period ECL movement excluding assets derecognised due to disposals and write-offs
1,187
Net recoveries post write-offs (86) Exchange and other adjustments (212) Impairment release on loan commitments and financial guaranteesb (48) Impairment charge on other financial assets 3 Income statement charge/(release) for the periodc 844
Note a Other financial assets subject to impairment not included in the table above include cash collateral and settlement balances, financial assets at fair value through other
comprehensive income, accrued income and sundry debtors. These have a total gross exposure of £120.1bn (1 January 2018: £128.1bn) and impairment allowance of £11m (1 January 2018: £9m). This comprises £9m ECL on £119.6bn stage 1 assets and £2m on £0.5bn stage 2 fair value through other comprehensive income assets.
b Impairment release of £48m on loan commitments and financial guarantees represents reduction in impairment allowance excluding disposal of business to Barclays Bank UK PLC of £116m and exchange and other adjustments of £68m.
c Barclays Bank PLC transferred its UK banking business on 1 April 2018 to Barclays Bank UK PLC. Net impairment charge of £201m (Impairment charges: £217m and recoveries: £16m) relating to the UK banking business for the three months ended 31 March 2018 is included in the reconciliation in “Income statement charge/(release) for the period”
Gross exposure on loans and advances has decreased by £184.0bn in 2018 due to the disposal of business to Barclays Bank UK PLC. Excluding this disposal, gross exposure grew by £3.5bn from new lending net of repayments offset by the disposal of a long dated liquidity buffer portfolio of UK gilts. Net transfers between stages represents the movements of positions from, for example, Stage 1 to Stage 2 following a Significant Increase in Credit Risk (SICR) or to Stage 3 as positions move into default. Equally, improvement in credit quality will result in positions moving to lower stages. These are the primary driver for the changes in impairment allowance and the income statement charge. The improvement in PDs and macroeconomic variables during 2018 resulted in net exposures moving from Stage 2 into Stage 1. The transfers into Stage 3 was from defaulted assets moving mainly from stage 2. Disposals includes the sale of a long dated liquidity buffer portfolio and debt sale activity. Write-offs represent the gross asset write-down during the period.
Excluding the disposal of business to Barclays Bank UK PLC, the impairment allowance decreased by £323m in the period. This is predominantly from write-offs and a positive impact of macroeconomic variables changes during the year, offset by a £50m charge in UK Corporate loans from anticipated economic uncertainty in the UK. Credit quality across wholesale portfolios and underlying arrears rates in the retail portfolio have been relatively stable over the period.
home.barclays/annualreport Barclays Bank PLC Annual Report 68

Risk review Risk performance Credit risk
Gross exposure for loan commitments and financial guarantees (audited)
Barclays Bank Group Stage 1 Stage 2 Stage 3 Total
£m £m £m £m
As at 1 January 2018 275,364 38,867 1,442 315,673 Disposal of business to Barclays Bank UK PLC (60,848) (6,113) (294) (67,255) Net transfers between stages 14,517 (14,577) 60 - Business activity in the year 64,155 749 - 64,904 Net drawdowns and repayments (16,826) 5,505 (562) (11,883) Final repayments (27,772) (7,987) (225) (35,984) As at 31 December 2018 248,590 16,444 421 265,455
Impairment allowance on loan commitments and financial guarantees (audited)
Barclays Bank Group Stage 1 Stage 2 Stage 3 Total
£m £m £m £m
As at 1 January 2018 133 259 28 420 Disposal of business to Barclays Bank UK PLC (36) (51) - (87) Net transfers between stages 42 (43) 1 - Business activity in the year 18 - - 18 Net re-measurement and movement due to exposure and risk parameter changes
(51) (17) 44 (24)
Final repayments (15) (44) (51) (110) As at 31 December 2018 91 104 22 217
home.barclays/annualreport Barclays Bank PLC Annual Report 69

Risk review Risk performance Credit risk
Gross exposure for loans and advances at amortised cost Continuing operations
Barclays Bank Group Stage 1 Stage2 Stage3 Total
£m £m £m £m
As at 1 January 2018 113,375 19,913 4,831 138,119 Net transfers between stages 3,795 (4,588) 793 - Business activity in the year 43,520 1,188 48 44,756 Net drawdowns and repayments (2,773) 1,117 486 (1,170) Final repayments (30,219) (3,606) (590) (34,415) Disposals (5,109) - (54) (5,163) Write-offs - - (1,325) (1,325) As at 31 December 2018 122,589 14,024 4,189 140,802
Impairment allowance on loans and advances at amortised cost Continuing operations
Barclays Bank Group Stage 1 Stage2 Stage3 Total
£m £m £m £m
As at 1 January 2018 437 1,713 2,108 4,258 Net transfers between stages 446 (697) 251 - Business activity in the year 167 86 30 283 Net re-measurement and movement due to exposure and risk parameter changes
(506) 220 1,151 865
UK economic uncertainty adjustment - 50 - 50 Final repayments (55) (117) (62) (234) Disposals - - (54) (54) Write-offs - - (1,325) (1,325) As at 31 December 2018 489 1,255 2,099 3,843
Gross exposure for loans and advances at amortised cost Discontinued operations
Barclays Bank Group Stage 1 Stage2 Stage3 Total
£m £m £m £m
As at 1 January 2018 152,798 29,679 4,250 186,727 Net transfers between stages 1,204 (1,608) 404 - Business activity in the year 7,524 462 74 8,060 Net drawdowns and repayments (2,862) (350) (331) (3,543) Final repayments (3,274) (205) (64) (3,543) Write-offs - - (131) (131) Transferred to Barclays Bank UK PLC on 1 April 2018 155,390 27,978 4,202 187,570
Impairment allowance on loans and advances at amortised cost Discontinued operations
Barclays Bank Group Stage 1 Stage2 Stage3 Total
£m £m £m £m
As at 1 January 2018 171 1,399 1,274 2,844 Net transfers between stages 218 (298) 80 - Business activity in the year 24 28 27 79 Net re-measurement and movement due to exposure and risk parameter changes
(234) 377 38 181
Final repayments (11) (16) (10) (37) Write-offs - - (131) (131) Transferred to Barclays Bank UK PLC on 1 April 2018 168 1,490 1,278 2,936
home.barclays/annualreport Barclays Bank PLC Annual Report 70

Risk review Risk performance Credit risk
Gross exposure for loans and advances at amortised cost (audited)
Barclays Bank PLC Stage 1 Stage 2 Stage 3 Total
£m £m £m £m
As at 1 January 2018 303,609 43,447 7,759 354,815 Disposal of businessa (157,618) (29,226) (4,367) (191,211) Net transfers between stages 4,045 (4,528) 483 - Business activity in the year 57,094 1,406 110 58,610 Net drawdowns and repayments (1,972) 1,536 (316) (752) Final repayments (53,807) (3,311) (629) (57,747) Disposals (5,109) - (51) (5,160) Write-offs - - (565) (565) As at 31 December 2018 146,242 9,324 2,424 157,990
Impairment allowance on loans and advances at amortised cost (audited)
Barclays Bank PLC Stage 1 Stage 2 Stage 3 Total
£m £m £m £m
As at 1 January 2018 337 2,023 2,427 4,787 Disposal of businessa (186) (1,621) (1,385) (3,192) Net transfers between stages 372 (493) 121 - Business activity in the year 83 64 48 195 Net re-measurement and movement due to exposure and risk parameter changes
(427) 389 236 198
UK economic uncertainty adjustment - 50 - 50 Final repayments (37) (100) (59) (196) Disposals - - (51) (51) Write-offs - - (565) (565) As at 31 December 2018b 142 312 772 1,226
Reconciliation of ECL movement to impairment charge/(release) for the period ECL movement excluding assets derecognised due to disposals and write-offs
247
Net recoveries post write-offs (50) Exchange and other adjustments (101) Impairment release on loan commitments and financial guaranteesc (22) Impairment charge on other financial assets 4 Income statement charge/(release) for the periodd 78
Note a Disposal of business represents transfer of 1) UK banking business by Barclays Bank PLC to Barclays Bank UK PLC on 1 April 2018 with Gross exposures for loans and advances at
amortised cost of £187.7bn and associated impairment allowance of £2.9bn, and 2) the German business largely comprising of Barclaycard and Business Banking to Barclays Bank Ireland PLC on 1 December 2018 with Gross exposures for loans and advances at amortised cost of £3.5bn and associated impairment allowance of £0.3bn.
b Other financial assets subject to impairment not included in the table above include cash collateral and settlement balances, financial assets at fair value through other comprehensive income, accrued income and sundry debtors. These have a total gross exposure of £110.7bn and impairment allowance of £12m This comprises £10m ECL on £110.2bn stage 1 assets and £2m on £0.5bn stage 2 fair value through other comprehensive income assets.
c Impairment release of £22m on loan commitments and financial guarantees represents reduction in impairment allowance excluding disposal of business to Barclays Bank UK PLC of £90m and exchange and other adjustments of £68m.
d Barclays Bank PLC transferred its UK banking business on 1 April 2018 to Barclays Bank UK PLC. Net impairment charge of £201m (Impairment charges: £217m and recoveries: £16m) relating to the UK banking business for the three months ended 31 March 2018 is included in the reconciliation in “Income statement charge/(release) for the period”
home.barclays/annualreport Barclays Bank PLC Annual Report 71

Risk review Risk performance Credit risk
Gross exposure for loan commitments and financial guarantees (audited)
Barclays Bank PLC Stage 1 Stage 2 Stage 3 Total
£m £m £m £m
As at 1 January 2018 230,630 29,259 1,442 261,331 Disposal of business (64,643) (6,345) (341) (71,329) Net transfers between stages 9,658 (9,151) (507) - Business activity in the year 55,720 606 1 56,327 Net drawdowns and repayments (13,478) 5,895 4 (7,579) Final repayments (25,707) (7,142) (224) (33,073) As at 31 December 2018 192,180 13,122 375 205,677
Impairment allowance on loan commitments and financial guarantees (audited)
Barclays Bank PLC Stage 1 Stage 2 Stage 3 Total
£m £m £m £m
As at 1 January 2018 116 225 10 351 Disposal of business (36) (51) - (87) Net transfers between stages 42 (43) 1 - Business activity in the year 17 - - 17 Net re-measurement and movement due to exposure and risk parameter changes
(63) 2 62 1
Final repayments (14) (43) (51) (108) As at 31 December 2018 62 90 22 174
home.barclays/annualreport Barclays Bank PLC Annual Report 72

Risk review Risk performance Credit risk
Gross exposure for loans and advances at amortised cost Continuing operations
Barclays Bank PLC Stage 1 Stage 2 Stage 3 Total
£m £m £m £m
As at 1 January 2018 148,891 12,370 3,334 164,595 Net transfers between stages 2,811 (2,784) (27) - Business activity in the year 49,008 875 32 49,915 Net drawdowns and repayments 1,027 1,940 34 3,001 Final repayments (50,386) (3,077) (555) (54,018) Disposals (5,109) - - (5,109) Write-offs - - (394) (394) As at 31 December 2018 146,242 9,324 2,424 157,990
Impairment allowance on loans and advances at amortised cost Continuing operations
Barclays Bank PLC Stage 1 Stage 2 Stage 3 Total
£m £m £m £m
As at 1 January 2018 149 418 1,035 1,602 Net transfers between stages 111 (130) 19 - Business activity in the year 53 30 19 102 Net re-measurement and movement due to exposure and risk parameter changes
(147) 26 136 15
UK economic uncertainty adjustment - 50 - 50 Final repayments (24) (82) (43) (149) Write-offs - - (394) (394) As at 31 December 2018 142 312 772 1,226
Gross exposure for loans and advances at amortised cost Discontinued operations
Barclays Bank PLC Stage 1 Stage 2 Stage 3 Total
£m £m £m £m
As at 1 January 2018 154,718 31,077 4,425 190,220 Net transfers between stages 1,234 (1,744) 510 - Business activity in the year 8,086 531 78 8,695 Net drawdowns and repayments (2,999) (404) (350) (3,753) Final repayments (3,421) (234) (74) (3,729) Write-offs - - (222) (222) Disposal of business 157,618 29,226 4,367 191,211
Impairment allowance on loans and advances at amortised cost Discontinued operations
Barclays Bank PLC Stage 1 Stage 2 Stage 3 Total
£m £m £m £m
As at 1 January 2018 188 1,605 1,392 3,185 Net transfers between stages 261 (363) 102 - Business activity in the year 30 34 29 93 Net re-measurement and movement due to exposure and risk parameter changes
(280) 363 100 183
Final repayments (13) (18) (16) (47) Write-offs - - (222) (222) Disposal of business 186 1,621 1,385 3,192
home.barclays/annualreport Barclays Bank PLC Annual Report 73

Risk review Risk performance Credit risk
Stage 2 decompositiona
Net Exposure ECL As at 31 December 2018 £m £m Quantitative test 9,241 1,116 Qualitative test 3,206 118 30 dpd backstop 322 21 Total Stage 2 12,769 1,255
Note a Where balances satisfy more than one of the above three criteria for determining a significant increase in credit risk, the corresponding net exposure and ECL has been assigned in
order of categories presented. Stage 2 exposures are predominantly identified using quantitative tests where the lifetime PD has deteriorated more than a pre-determined amount since origination. This is augmented by inclusion of accounts meeting the designated high risk criteria (including watchlist) for the portfolio under the qualitative test. A small number of other accounts (2% of impairment allowances and 3% of net exposure) are included in stage 2. These accounts are not otherwise identified by the quantitative or qualitative tests but are more than 30 days past due. The percentage triggered by these backstop criteria is a measure of the effectiveness of the stage 2 criteria in identifying deterioration prior to delinquency.
For further detail on the three criteria for determining a significant increase in credit risk required for Stage 2 classification, refer to Note 9 on page 173 to 178.
home.barclays/annualreport Barclays Bank PLC Annual Report 74

Risk review Risk performance Credit risk
Management adjustments to models for impairment (audited)
Management adjustments to impairment models are applied in order to factor in certain conditions or changes in policy that are not incorporated into the relevant impairment models, or to reflect additionally known facts and circumstances at the period end. Where applicable, management adjustments are reviewed and incorporated into future model development.
Portfolios that have total management adjustments to impairment allowance of more than £10m are presented by product below. Information as at 31 December 2018 is prepared on a IFRS 9 basis and information as at 31 December 2017 is prepared on an IAS 39 basis.
During 2018, models have continued to develop and a number of adjustments that were required on IFRS 9 adoption have been incorporated in impairment modelling.
Portfolios that have management adjustments greater than £10m by producta (audited) As at 31 December 2018 As at 31 December 2017
Management adjustments to
impairment allowances,
including forbearance
Proportion of total impairment
allowances
Management adjustments to
impairment allowances,
including forbearance
Proportion of total impairment
allowances
£m % £m %
Credit cards, unsecured loans and other retail lending (23) (0.8) 24 0.8
Corporate loans (11) (1.6) 68 6.0 Note a Positive values relate to an increase in impairment allowance.
Credit cards, unsecured loans and other retail lending: Model adjustments were applied to reflect staging criteria updates during the year.
Corporate loans: Includes a £50m ECL adjustment held in Corporate Bank for the anticipated economic uncertainty in the UK, offset by a material release in the Investment Bank to reduce inappropriate ECL sensitivity to an expanded macroeconomic variable.
home.barclays/annualreport Barclays Bank PLC Annual Report 75
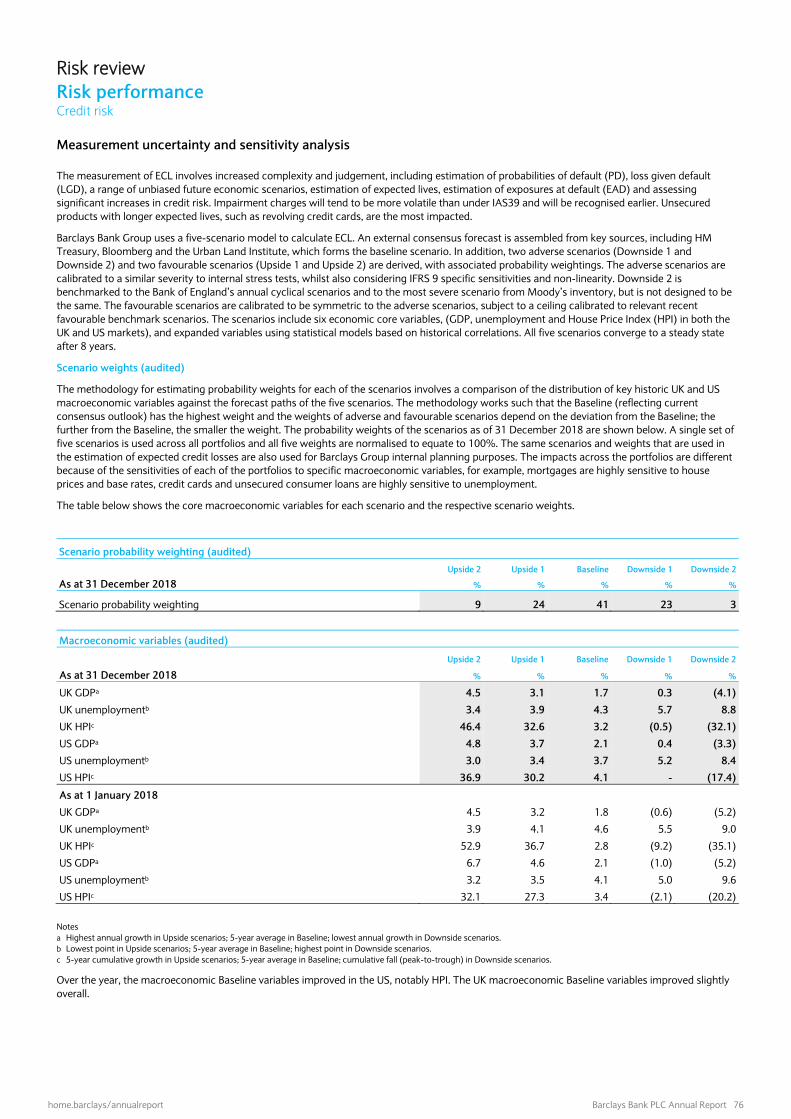
Risk review Risk performance Credit risk
Measurement uncertainty and sensitivity analysis
The measurement of ECL involves increased complexity and judgement, including estimation of probabilities of default (PD), loss given default (LGD), a range of unbiased future economic scenarios, estimation of expected lives, estimation of exposures at default (EAD) and assessing significant increases in credit risk. Impairment charges will tend to be more volatile than under IAS39 and will be recognised earlier. Unsecured products with longer expected lives, such as revolving credit cards, are the most impacted.
Barclays Bank Group uses a five-scenario model to calculate ECL. An external consensus forecast is assembled from key sources, including HM Treasury, Bloomberg and the Urban Land Institute, which forms the baseline scenario. In addition, two adverse scenarios (Downside 1 and Downside 2) and two favourable scenarios (Upside 1 and Upside 2) are derived, with associated probability weightings. The adverse scenarios are calibrated to a similar severity to internal stress tests, whilst also considering IFRS 9 specific sensitivities and non-linearity. Downside 2 is benchmarked to the Bank of England’s annual cyclical scenarios and to the most severe scenario from Moody’s inventory, but is not designed to be the same. The favourable scenarios are calibrated to be symmetric to the adverse scenarios, subject to a ceiling calibrated to relevant recent favourable benchmark scenarios. The scenarios include six economic core variables, (GDP, unemployment and House Price Index (HPI) in both the UK and US markets), and expanded variables using statistical models based on historical correlations. All five scenarios converge to a steady state after 8 years.
Scenario weights (audited)
The methodology for estimating probability weights for each of the scenarios involves a comparison of the distribution of key historic UK and US macroeconomic variables against the forecast paths of the five scenarios. The methodology works such that the Baseline (reflecting current consensus outlook) has the highest weight and the weights of adverse and favourable scenarios depend on the deviation from the Baseline; the further from the Baseline, the smaller the weight. The probability weights of the scenarios as of 31 December 2018 are shown below. A single set of five scenarios is used across all portfolios and all five weights are normalised to equate to 100%. The same scenarios and weights that are used in the estimation of expected credit losses are also used for Barclays Group internal planning purposes. The impacts across the portfolios are different because of the sensitivities of each of the portfolios to specific macroeconomic variables, for example, mortgages are highly sensitive to house prices and base rates, credit cards and unsecured consumer loans are highly sensitive to unemployment.
The table below shows the core macroeconomic variables for each scenario and the respective scenario weights.
Scenario probability weighting (audited)
Upside 2 Upside 1 Baseline Downside 1 Downside 2
As at 31 December 2018 % % % % %
Scenario probability weighting 9 24 41 23 3
Macroeconomic variables (audited)
Upside 2 Upside 1 Baseline Downside 1 Downside 2
As at 31 December 2018 % % % % %
UK GDPa 4.5 3.1 1.7 0.3 (4.1)
UK unemploymentb 3.4 3.9 4.3 5.7 8.8
UK HPIc 46.4 32.6 3.2 (0.5) (32.1)
US GDPa 4.8 3.7 2.1 0.4 (3.3)
US unemploymentb 3.0 3.4 3.7 5.2 8.4
US HPIc 36.9 30.2 4.1 - (17.4)
As at 1 January 2018
UK GDPa 4.5 3.2 1.8 (0.6) (5.2)
UK unemploymentb 3.9 4.1 4.6 5.5 9.0
UK HPIc 52.9 36.7 2.8 (9.2) (35.1)
US GDPa 6.7 4.6 2.1 (1.0) (5.2)
US unemploymentb 3.2 3.5 4.1 5.0 9.6
US HPIc 32.1 27.3 3.4 (2.1) (20.2)
Notes a Highest annual growth in Upside scenarios; 5-year average in Baseline; lowest annual growth in Downside scenarios. b Lowest point in Upside scenarios; 5-year average in Baseline; highest point in Downside scenarios. c 5-year cumulative growth in Upside scenarios; 5-year average in Baseline; cumulative fall (peak-to-trough) in Downside scenarios.
Over the year, the macroeconomic Baseline variables improved in the US, notably HPI. The UK macroeconomic Baseline variables improved slightly overall.
home.barclays/annualreport Barclays Bank PLC Annual Report 76

Risk review Risk performance Credit risk
ECL under 100% weighted scenarios for key principal portfolios (audited)
The table below shows the ECL for key principal portfolios assuming scenarios have been 100% weighted. Gross exposures are allocated to a stage based on the individual scenario rather than through a probability-weighted approach as is required for Barclays actual impairment allowances. As a result, it is not possible to back solve the weighted ECL from the individual scenarios as a balance may be assigned to a different stage dependent on the scenario.
Portfolios where the risk resides outside of the UK or the US, certain less material portfolios and exposures where ECL estimation methods are based on benchmark approaches or assigned proxy coverage ratios, have been excluded from the below analysis. Material post-model adjustments have also been excluded so that the scenario specific results are comparable. Portfolio adjustments of greater than £10m can be found on page 75.
Balances allocated to Stage 3 do not change in any of the scenarios as the transition criteria relies only on observable evidence of default as at 31 December 2018 and not on macroeconomic scenarios.
The Downside 2 scenario represents a severe global recession with substantial falls in both UK and US GDP. Unemployment in both markets rises towards 9% and there are substantial falls in asset prices including housing.
Under the Downside 2 scenario, balances move between stages as the economic environment weakens. This can be seen in the movement of £10.4bn of gross exposure into stage 2 between the Weighted and Downside 2 scenario. ECL increases in Stage 2 predominantly due to unsecured portfolios as economic conditions deteriorate.
Scenarios
As at 31 December 2018 Weighted Upside 2 Upside 1 Baseline Downside 1 Downside 2
Stage 1 Gross Exposure (£m) Credit cards, unsecured loans and other retail lending 15,399 16,345 15,629 15,437 15,063 12,125
Corporate loans 80,835 81,346 81,180 80,941 80,517 73,715
Stage 1 ECL (£m)
Credit cards, unsecured loans and other retail lending 208 168 202 205 212 231
Corporate loans 175 161 163 162 203 242
Stage 1 Coverage (%)
Credit cards, unsecured loans and other retail lending 1.4 1.0 1.3 1.3 1.4 1.9
Corporate loans 0.2 0.2 0.2 0.2 0.3 0.3 Stage 2 Gross Exposure (£m) Credit cards, unsecured loans and other retail lending 4,084 3,138 3,853 4,046 4,420 7,358
Corporate loans 11,377 10,866 11,031 11,271 11,694 18,496
Stage 2 ECL (£m)
Credit cards, unsecured loans and other retail lending 937 719 830 901 1,111 2,414
Corporate loans 323 277 290 302 397 813
Stage 2 Coverage (%)
Credit cards, unsecured loans and other retail lending 22.9 22.9 21.5 22.3 25.1 32.8
Corporate loans 2.8 2.5 2.6 2.7 3.4 4.4 Stage 3 Gross Exposure (£m) Credit cards, unsecured loans and other retail lending 1,396 1,396 1,396 1,396 1,396 1,396
Corporate loansa 1,165 n/a n/a 1,165 n/a n/a
Stage 3 ECL (£m)
Credit cards, unsecured loans and other retail lending 1,181 1,168 1,174 1,181 1,189 1,207
Corporate loansa 333 n/a n/a 323 n/a n/a
Stage 3 Coverage (%)
Credit cards, unsecured loans and other retail lending 84.6 83.7 84.1 84.6 85.2 86.5
Corporate loansa 28.6 n/a n/a 27.7 n/a n/a Total ECL (£m) Credit cards, unsecured loans and other retail lending 2,326 2,055 2,206 2,287 2,512 3,852
Corporate loansa 831 n/a n/a 787 n/a n/a Note a Material corporate loan defaults are individually assessed across different recovery strategies which are impacted by the macroeconomic variables. As a result, only the Baseline
scenario is shown together with the weighted estimate which reflects alternative recovery paths.
For the portfolios in scope, the total weighted ECL represents a 3% uplift from the Baseline ECL, largely driven by credit card losses which have more linear loss profiles than corporate loans positions.
home.barclays/annualreport Barclays Bank PLC Annual Report 77

Risk review Risk performance Credit risk
Credit cards, unsecured loans and other retail lending: Total weighted ECL of £2,326m represents a 2% increase over the Baseline ECL (£2,287m) reflecting the range of economic scenarios used. Total ECL increases to £3,852m under Downside 2 scenario, mainly driven by Stage 2, where coverage rates increase by 988bps to 32.8% from a Weighted scenario approach (22.9%) and a £3,274m increase in balances that meet the criteria for a significant increase in credit risk and transition from Stage 1 to Stage 2.
Corporate loans: The total weighted ECL excludes a model adjustment release (£72m) made as part of the scenario regeneration. Total weighted ECL of £831m represents a 6% increase over the Baseline ECL (£787m) reflecting the range of economic scenarios used, with exposures in the Investment Bank particularly sensitive to the Downside 2 scenario. Cases in Stage 3 are assessed on an individual basis and cases where the Baseline ECL is greater than £10m are also assessed against a less favourable and a more favourable scenario, based on alternative recovery outcomes in addition to macroeconomic scenarios. Total weighted ECL excludes model adjustments, including the £50m adjustment for anticipated economic uncertainty in the UK.
Staging sensitivity (audited)
An increase of 1% (£1,408m) of total gross exposure into Stage 2 (from Stage 1), would result in an increase in ECL impairment allowance of £120m based on applying the difference in Stage 2 and Stage 1 average impairment coverage ratios to the movement in gross exposure (refer to Loans and advances at amortised cost by product on page 67.
ECL sensitivity analysis
The tables on pages 80 and 81 show the estimated ECL impact on key principal portfolios in the event that the UK/US consensus was instead for i) positive growth (Upward scenario); and ii) a mild downturn (Downward scenario). These scenarios assume a moderate upturn and downturn for the UK and the US respectively but with no contagion or headwinds in other economies.
The gross exposures in scope are aligned to those presented in the ECL under 100% weighted scenarios sensitivity analysis but based on portfolio positions as at 30 September 2018 due to operational complexity in scenario regeneration. The portfolios included in scenarios remain broadly stable during Q4 18 and therefore the scenario results are considered representative of year end position. Material post-model adjustments have been excluded from the below analysis to allow the scenario specific results to be comparable. Further detail on management adjustments to impairment allowances can be found on page 75.
Gross exposures allocated to Stage 3 do not change in any of the scenarios as the transition criteria relies only on observable evidence of default and not on macroeconomic scenarios. For individual cases with ECL greater than £10m, three scenarios are assessed taking into account the macroeconomic scenarios and alternative recovery strategies. For these specific cases, the less favourable scenario is assumed to occur in the UK/US Downward scenario (and the more favourable scenario is assumed to occur in the UK/US Upward scenario) which is a conservative upper estimate as certain recovery strategies are idiosyncratic in nature and independent of the macroeconomic economy.
home.barclays/annualreport Barclays Bank PLC Annual Report 78

Risk review Risk performance Credit risk
ECL sensitivity analysis to UK economic forecasts for key principal portfolios
The table below shows the estimated ECL impact on key principal portfolios for both a positive growth (Upward scenario) and a downturn (Downward scenario) of UK consensus macroeconomic variables. The inputs for the Downward scenario have been modelled by replacing the Baseline macroeconomic variables with the Downside 1 variables (with no changes to US and other non-UK macroeconomic variables, as highlighted below). Similarly, the Upward scenario uses Upside 1 UK macroeconomic variables for the Baseline scenario. The Downside 2, Downside 1, Upside 1 and Upside 2 macroeconomic variables are held constant but the probability weights have been re-calibrated.
Barclays Bank Group impairment as at 31 December 2018 includes an adjustment of £50m representing a charge for the estimated impact of current economic uncertainty in the UK. This adjustment was estimated broadly on the output of the UK Downward scenario below.
Scenario probability weighting
Upside 2 Upside 1 Baseline Downside 1 Downside 2
% % % % %
UK Upward scenario 18 33 36 11 2
UK Downward scenario 8 18 40 28 6
Macroeconomic variables
Upside 2 Upside 1 Baseline Downside 1 Downside 2
As at 31 December 2018 % % % % %
UK Upward scenario
UK GDP 4.5 3.1 3.1 0.3 (4.1)
UK unemployment 3.4 3.9 3.9 5.7 8.8
UK HPI 46.4 32.6 32.6 (0.5) (32.1)
US GDP 4.8 3.7 2.1 0.4 (3.3)
US unemployment 3.0 3.4 3.7 5.2 8.4
US HPI 36.9 30.2 4.1 - (17.4)
UK Downward scenario
UK GDP 4.5 3.1 0.3 0.3 (4.1)
UK unemployment 3.4 3.9 5.7 5.7 8.8
UK HPI 46.4 32.6 (0.5) (0.5) (32.1)
US GDP 4.8 3.7 2.1 0.4 (3.3)
US unemployment 3.0 3.4 3.7 5.2 8.4
US HPI 36.9 30.2 4.1 - (17.4)
Sensitivity to UK economic forecasts
Stage 1 Stage 2 Stage 3 Total
Δ UK
Upward scenario
Δ UK Downward
scenario
Δ UK Upward
scenario
Δ UK Downward
scenario
Δ UK Upward
scenario
Δ UK Downward
scenario
Δ UK Upward
scenario
Δ UK Downward
scenario Gross Exposure (£m) Corporate loans 79 (13) (79) 13 - - - - ECL (£m) Corporate loans 1 7 (4) 13 (46) 28 (49) 48
Corporate loans: Total ECL decreases by £49m in the Upward scenario predominately driven by more favourable recovery outcomes for large single-names in Stage 3. The Downward scenario results in total ECL impact of £48m, driven by higher coverage (13bps increase) in Stage 2 and less favourable recovery outcomes for large single names in Stage 3.
home.barclays/annualreport Barclays Bank PLC Annual Report 79

Risk review Risk performance Credit risk
ECL sensitivity analysis to US economic forecasts for key principal portfolios
The table below shows the estimated ECL impact on key principal portfolios for both positive growth (Upward scenario) and a downturn (Downward scenario) of US consensus macroeconomic variables. The inputs for the Downward scenario have been modelled by replacing the Baseline macroeconomic variables by the Downside 1 variables (with no changes to UK and other non-US macroeconomic variables, as highlighted below.) Similarly, the Upward scenario uses Upside 1 UK macroeconomic variables for the Baseline scenario. The Downside 2, Downside 1, Upside 1 and Upside 2 macroeconomic variables are held constant but the probability weights have been re-calibrated. Changes in credit cards, unsecured loans and other retail lending are measured for US cards only.
Scenario probability weighting
Upside 2 Upside 1 Baseline Downside 1 Downside 2
% % % % %
US Upward scenario 18 33 36 11 2
US Downward scenario 5 14 40 34 7
Macroeconomic variables for US Downward scenario
Upside 2 Upside 1 Baseline Downside 1 Downside 2
As at 31 December 2018 % % % % %
US Upward scenario
UK GDP 4.5 3.1 1.7 0.3 (4.1)
UK unemployment 3.4 3.9 4.3 5.7 8.8
UK HPI 46.4 32.6 3.2 (0.5) (32.1)
US GDP 4.8 3.7 3.7 0.4 (3.3)
US unemployment 3.0 3.4 3.4 5.2 8.4
US HPI 36.9 30.2 30.2 - (17.4)
US Downward scenario
UK GDP 4.5 3.1 1.7 0.3 (4.1)
UK unemployment 3.4 3.9 4.3 5.7 8.8
UK HPI 46.4 32.6 3.2 (0.5) (32.1)
US GDP 4.8 3.7 0.4 0.4 (3.3)
US unemployment 3.0 3.4 5.2 5.2 8.4
US HPI 36.9 30.2 - - (17.4)
Sensitivity to US economic forecasts
Stage 1 Stage 2 Stage 3 Total
Δ US
Upward scenario
Δ US Downward
scenario
Δ US Upward
scenario
Δ US Downward
scenario
Δ US Upward
scenario
Δ US Downward
scenario
Δ US Upward
scenario
Δ US Downward
scenario
Gross Exposure (£m) Credit cards, unsecured loans and other retail lending 214 (312) (214) 312 - - - - Corporate loans 83 (46) (83) 46 - - - - ECL (£m) Credit cards, unsecured loans and other retail lending (4) 6 (76) 144 (6) 7 (86) 157 Corporate loans (3) 10 (15) 34 (35) 54 (53) 98
Credit cards, unsecured loans and other retail lending: Total ECL decreases by £86m in Upward scenario driven by £214m of balance migration as assets transition from Stage 2 to Stage 1 and lower coverage on Stage 2 assets driven by the more favourable consensus forecast. Total ECL impact of £157m in Downward scenario is greater than the Upward scenario, driven by non-linearity effects and the relative severity of the Downward scenario.
Corporate loans: Total ECL increases by £98m in the Downward scenario driven by a less favourable recovery outcome for one large single name in Stage 3, where Barclays estimated additional losses of £39m in addition to the loss estimated under the Baseline scenario, and higher coverage in Stage 2 assets driven by the less favourable consensus forecast. There is a greater impact on coverage ratios (Stage 2 in particular) than the UK scenarios driven largely by the underlying portfolio quality, with the US portfolio possessing a higher proportion of unsecured leveraged lending.
home.barclays/annualreport Barclays Bank PLC Annual Report 80

Risk review Risk performance Credit risk
Analysis of the concentration of credit risk
A concentration of credit risk exists when a number of counterparties are located in a common geographical region or are engaged in similar activities and have similar economic characteristics that would cause their ability to meet contractual obligations to be similarly affected by changes in economic or other conditions. Barclays Bank Group implements limits on concentrations in order to mitigate the risk. The analyses of credit risk concentrations presented below are based on the location of the counterparty or customer or the industry in which they are engaged. Geographic concentrations As at 31 December 2018, the geographic concentration of Barclays Bank Group’s assets decreased in the UK following the transfer of business to Barclays Bank UK PLC. Exposure is concentrated in the Americas 43% (2017: 33%), in the UK 26% (2017: 42%) and Europe 25% (2017: 21%).
Credit risk concentrations by geography (audited)
Barclays Bank Group United
Kingdom Europe Americas Africa and
Middle East Asia Total As at 31 December 2018 £m £m £m £m £m £m
On-balance sheet: Cash and balances at central banks 39,143 51,395 36,045 712 9,064 136,359 Cash collateral and settlement balances 24,611 22,309 22,184 376 4,872 74,352 Loans and advances at amortised cost 54,700 27,470 46,799 3,038 4,952 136,959 Reverse repurchase agreements and other similar secured lending 45 97 68 1,320 83 1,613 Trading portfolio assets 12,296 13,374 34,369 713 3,616 64,368 Financial assets at fair value through the income statement 30,305 20,984 73,475 1,758 13,556 140,078 Derivative financial instruments 69,943 80,003 58,699 1,866 12,172 222,683 Financial assets at fair value through other comprehensive income 9,529 21,546 10,959 163 2,786 44,983 Other assets 448 137 110 1 3 699 Total on-balance sheet 241,020 237,315 282,708 9,947 51,104 822,094 Off-balance sheet: Contingent liabilities 5,001 3,572 8,996 536 1,289 19,394 Loan commitments 42,224 34,447 175,951 1,836 3,310 257,768 Total off-balance sheet 47,225 38,019 184,947 2,372 4,599 277,162 Total 288,245 275,334 467,655 12,319 55,703 1,099,256 Credit risk concentrations by geography (audited)
Barclays Bank Group United
Kingdom Europe Americas Africa and
Middle East Asia Total As at 31 December 2017 £m £m £m £m £m £m
On-balance sheet: Cash and balances at central banks 53,069 57,158 56,034 57 4,718 171,036 Cash collateral and settlement balances 23,856 24,311 23,440 870 4,695 77,172 Loans and advances at amortised cost 240,689 27,211 47,850 3,385 5,455 324,590 Reverse repurchase agreements and other similar secured lending 203 375 10,521 32 1,415 12,546 Trading portfolio assets 10,604 13,621 25,679 473 3,958 54,335 Financial assets at fair value through the income statement 33,923 23,724 46,288 1,611 6,065 111,611 Derivative financial instruments 81,974 81,566 57,858 2,792 13,797 237,987 Financial investments - debt securities 17,471 23,598 14,110 114 1,836 57,129 Other assets 1,551 1,179 148 33 83 2,994
Total on-balance sheet 463,340 252,743 281,928 9,367 42,022 1,049,400
Off-balance sheet: Contingent liabilities 7,603 3,039 6,708 529 1,133 19,012 Loan commitments 105,912 36,084 168,003 1,608 3,966 315,573
Total off-balance sheet 113,515 39,123 174,711 2,137 5,099 334,585
Total 576,855 291,866 456,639 11,504 47,121 1,383,985
home.barclays/annualreport Barclays Bank PLC Annual Report 81

Risk review Risk performance Credit risk
Credit risk concentrations by geography (audited)
Barclays Bank PLC United
Kingdom Europe Americas Africa and
Middle East Asia Total As at 31 December 2018 £m £m £m £m £m £m
On-balance sheet: Cash and balances at central banks 39,142 45,336 32,241 711 8,572 126,002 Cash collateral and settlement balances 22,728 21,782 18,070 328 3,288 66,196 Loans and advances at amortised cost 94,810 30,471 23,447 2,580 5,456 156,764 Reverse repurchase agreements and other similar secured lending 63 80 815 1,320 3,488 5,766 Trading portfolio assets 12,255 13,131 16,771 693 2,196 45,046 Financial assets at fair value through the income statement 67,657 33,438 60,032 1,716 16,390 179,233 Derivative financial instruments 77,140 80,037 50,548 1,860 11,662 221,247 Financial assets at fair value through other comprehensive income 9,219 20,637 10,954 163 2,724 43,697 Other assets 702 39 18 1 2 762 Total on-balance sheet 323,716 244,951 212,896 9,372 53,778 844,713 Off-balance sheet: Contingent liabilities 11,504 3,332 8,993 534 1,289 25,652 Loan commitments 46,109 27,253 113,637 1,436 3,297 191,732 Total off-balance sheet 57,613 30,585 122,630 1,970 4,586 217,384 Total 381,329 275,536 335,526 11,342 58,364 1,062,097 Credit risk concentrations by geography (audited)
Barclays Bank PLC United
Kingdom Europe Americas Africa and
Middle East Asia Total As at 31 December 2017 £m £m £m £m £m £m
On-balance sheet: Cash and balances at central banks 52,958 56,188 52,298 56 4,213 165,713 Cash collateral and settlement balances 23,845 25,132 17,376 817 3,790 70,960 Loans and advances at amortised cost 259,989 52,275 34,565 3,021 5,405 355,255 Reverse repurchase agreements and other similar secured lending 4,553 2,914 9,185 5 6,307 22,964 Trading portfolio assets 10,558 13,441 12,001 443 2,447 38,890 Financial assets at fair value through the income statement 52,072 23,014 23,682 1,611 16,795 117,174 Derivative financial instruments 85,520 81,307 50,198 2,785 12,478 232,288 Financial investments - debt securities 16,940 21,912 13,573 114 1,767 54,306 Other assets 3,677 230 - 34 50 3,991
Total on-balance sheet 510,112 276,413 212,878 8,886 53,252 1,061,541
Off-balance sheet: Contingent Liabilities 13,713 2,789 9,256 526 1,133 27,417 Loan Commitments 105,222 32,949 109,386 1,419 3,945 252,921
Total off-balance sheet 118,935 35,738 118,642 1,945 5,078 280,338
Total 629,047 312,151 331,520 10,831 58,330 1,341,879
home.barclays/annualreport Barclays Bank PLC Annual Report 82

Risk review Risk performance Credit risk
Industry concentrations As at 31 December 2018, the concentration of Barclays Bank Group’s assets by industry increased in banks and other financial institutions following the transfer of business to Barclays Bank UK PLC. Total assets concentrated in banks and other financial institutions is 46% (2017: 36%), predominantly within derivative financial instruments and financial assets. The proportion of the overall balance concentrated in governments and central banks is 21% (2017: 20%). Credit risk concentrations by industry (audited) Barclays Bank Group
Banks
Other financial
insti-tutions
Manu- facturing
Const- ruction
and property
Govern- ment and
central bank
Energy and
water
Wholesale and retail
distribution and leisure
Business and other
services Home loans
Cards, unsecured loans and
other personal
lending Other Total
As at 31 December 2018 £m £m £m £m £m £m £m £m £m £m £m £m
On-balance sheet:
Cash and balances at central banks - - - - 136,359 - - - - - - 136,359 Cash collateral and settlement balances 17,294 48,340 498 75 6,470 386 223 717 - - 349 74,352 Loans and advances at amortised cost 9,692 17,734 8,379 13,143 3,474 5,442 9,678 17,222 13,160 32,818 6,217 136,959 Reverse repurchase agreements and other similar secured lending 1,369 169 - 37 38 - - - - - - 1,613 Trading portfolio assets 3,502 9,550 3,825 897 34,817 4,202 1,202 3,481 - - 2,892 64,368 Financial assets at fair value through the income statement 30,374 96,708 - 5,371 5,295 31 13 1,881 405 - - 140,078 Derivative financial instruments 123,999 80,302 2,390 1,974 5,987 2,791 486 2,012 - - 2,742 222,683 Financial assets at fair value through other comprehensive income 11,066 1,880 - 200 31,701 - - 136 - - - 44,983 Other assets 288 411 - - - - - - - - - 699 Total on-balance sheet 197,584 255,094 15,092 21,697 224,141 12,852 11,602 25,449 13,565 32,818 12,200 822,094 Off-balance sheet: Contingent liabilities 939 3,841 3,470 626 980 3,491 952 3,455 - 116 1,524 19,394 Loan commitments 1,265 42,844 39,827 12,280 1,629 26,520 14,127 21,702 1,409 71,781 24,384 257,768 Total off-balance sheet 2,204 46,685 43,297 12,906 2,609 30,011 15,079 25,157 1,409 71,897 25,908 277,162 Total 199,788 301,779 58,389 34,603 226,750 42,863 26,681 50,606 14,974 104,715 38,108 1,099,256
home.barclays/annualreport Barclays Bank PLC Annual Report 83

Risk review Risk performance Credit risk
Credit risk concentrations by industry (audited) Barclays Bank Group
Banks
Other financial
insti-tutions
Manu- facturing
Const- ruction
and property
Govern- ment and
central bank
Energy and
water
Wholesale and retail
distribution and leisure
Business and other
services Home loans
Cards, unsecured loans and
other personal
lending Other Total
As at 31 December 2017 £m £m £m £m £m £m £m £m £m £m £m £m
On-balance sheet: Cash and balances at central banks - - - - 171,036 - - - - - - 171,036 Cash collateral and settlement balances 18,395 48,586 124 233 8,219 585 75 577 - - 378 77,172 Loans and advances at amortised cost 9,931 26,338 9,125 23,473 9,097 5,519 12,375 19,906 147,002 54,205 7,619 324,590 Reverse repurchase agreements and other similar secured lending 7,241 4,844 - 153 307 - - 1 - - - 12,546 Trading portfolio assets 4,683 10,666 3,311 807 26,030 3,900 598 3,324 128 - 888 54,335 Financial assets at fair value through the income statement 21,468 78,506 38 4,666 4,812 2 3 2,083 28 - 5 111,611 Derivative financial instruments 126,248 87,466 2,383 2,103 5,811 8,179 576 3,096 - - 2,125 237,987 Financial investments - debt securities 10,193 1,379 - - 44,780 103 - 674 - - - 57,129 Other assets 2,229 744 - - 21 - - - - - - 2,994 Total on-balance sheet 200,388 258,529 14,981 31,435 270,113 18,288 13,627 29,661 147,158 54,205 11,015 1,049,400
Off-balance sheet: Contingent liabilities 1,572 3,556 3,236 675 8 2,605 969 4,947 4 389 1,051 19,012 Loan commitments 1,550 31,427 38,105 12,956 384 31,702 14,507 34,415 10,785 126,169 13,573 315,573 Total off-balance sheet 3,122 34,983 41,341 13,631 392 34,307 15,476 39,362 10,789 126,558 14,624 334,585 Total 203,510 293,512 56,322 45,066 270,505 52,595 29,103 69,023 157,947 180,763 25,639 1,383,985
home.barclays/annualreport Barclays Bank PLC Annual Report 84

Risk review Risk performance Credit risk
Credit risk concentrations by industry (audited)
Barclays Bank PLC Banks
Other financial
insti-tutions
Manu- facturing
Const- ruction
and property
Govern- ment and
central bank
Energy and
water
Wholesale and retail
distribution and leisure
Business and other
services Home loans
Cards, unsecured loans and
other personal
lending Other Total As at 31 December 2018 £m £m £m £m £m £m £m £m £m £m £m £m
On-balance sheet: Cash and balances at central banks - - - - 126,002 - - - - - - 126,002 Cash collateral and settlement balances 16,452 41,821 386 50 6,442 356 87 262 - - 340 66,196 Loans and advances at amortised cost 13,471 68,312 7,942 12,535 3,060 5,030 9,100 15,560 12,229 3,778 5,747 156,764 Reverse repurchase agreements and other similar secured lending 1,320 4,371 - 37 38 - - - - - - 5,766 Trading portfolio assets 3,487 4,920 3,168 836 22,644 3,646 1,177 2,497 - - 2,671 45,046 Financial assets at fair value through the income statement 19,732 146,973 - 5,371 5,295 25 13 1,423 401 - - 179,233 Derivative financial instruments 124,499 78,384 2,390 1,974 5,987 2,791 478 2,004 - - 2,740 221,247 Financial assets at fair value through other comprehensive income 10,183 1,865 - 200 31,313 - - 136 - - - 43,697 Other assets 493 269 - - - - - - - - - 762 Total on-balance sheet 189,637 346,915 13,886 21,003 200,781 11,848 10,855 21,882 12,630 3,778 11,498 844,713 Off-balance sheet: Contingent Liabilities 1,795 9,471 3,456 614 978 3,445 877 3,408 - 90 1,518 25,652 Loan commitments 6,033 44,522 39,288 12,129 1,629 26,471 13,816 21,039 1,397 1,086 24,322 191,732 Total off-balance sheet 7,828 53,993 42,744 12,743 2,607 29,916 14,693 24,447 1,397 1,176 25,840 217,384 Total 197,465 400,908 56,630 33,746 203,388 41,764 25,548 46,329 14,027 4,954 37,338 1,062,097
home.barclays/annualreport Barclays Bank PLC Annual Report 85

Risk review Risk performance Credit risk
Credit risk concentrations by industry (audited) Barclays Bank PLC
Banks
Other financial
insti-tutions
Manu- facturing
Const- ruction
and property
Govern- ment and
central bank
Energy and
water
Wholesale and retail
distribution and leisure
Business and other
services Home loans
Cards, unsecured loans and
other personal
lending Other Total
As at 31 December 2017 £m £m £m £m £m £m £m £m £m £m £m £m
On-balance sheet: Cash and balances at central banks - - - - 165,713 - - - - - - 165,713 Cash collateral and settlement balances 18,257 42,969 106 206 8,209 576 74 218 - - 345 70,960 Loans and advances at amortised cost 11,125 84,662 8,729 22,776 9,030 5,378 11,745 18,400 146,052 30,119 7,239 355,255 Reverse repurchase agreements and other similar secured lending 189 22,485 - 153 137 - - - - - - 22,964 Trading portfolio assets 4,356 4,343 2,940 744 19,369 3,755 581 1,828 126 - 848 38,890 Financial assets designated at fair value through the income statement 15,565 90,078 1 4,666 4,812 2 3 2,014 28 - 5 117,174 Derivative financial instruments 125,319 82,710 2,383 2,102 5,811 8,179 565 3,094 - - 2,125 232,288 Financial investments - debt securities 10,117 894 - - 42,979 - - 316 - - - 54,306 Other assets 3,290 603 - - 98 - - - - - - 3,991
Total on-balance sheet 188,218 328,744 14,159 30,647 256,158 17,890 12,968 25,870 146,206 30,119 10,562 1,061,541
Off-balance sheet: Contingent liabilities 1,542 10,810 4,623 667 7 2,569 907 4,869 4 377 1,042 27,417 Loan commitments 1,549 38,101 37,812 12,822 362 31,676 14,222 33,843 10,354 58,672 13,508 252,921
Total off-balance sheet 3,091 48,911 42,435 13,489 369 34,245 15,129 38,712 10,358 59,049 14,550 280,338
Total 191,309 377,655 56,594 44,136 256,527 52,135 28,097 64,582 156,564 89,168 25,112 1,341,879
home.barclays/annualreport Barclays Bank PLC Annual Report 86

Risk review Risk performance Credit risk
Approach to management and representation of credit quality
Asset credit quality
The credit quality distribution is based on the IFRS 9 12-month probability of default (PD) at the reporting date. Comparatives are based on the regulatory capital point in time probability of default (PD).
The Barclays Bank Group uses the following internal measures to determine credit quality for loans:
Retail and Wholesale
lending
Default Grade Probability of default Credit Quality Description
1-3 0.0 to < 0.05% Strong
4-5 0.05 to < 0.15% 6-8 0.15 to < 0.30% 9-11 0.30 to < 0.60% 12-14 0.60 to < 2.15% Satisfactory
15-19 2.15 to < 11.35% 20-21 11.35% to < 100% Higher Risk 22 100% Credit Impaired
For retail clients, a range of analytical tools is used to derive the probability of default of clients at inception and on an ongoing basis. These credit quality descriptions can be summarised as follows:
Strong: there is a very high likelihood of the asset being recovered in full.
Satisfactory: while there is a high likelihood that the asset will be recovered and therefore, of no cause for concern to the Barclays Bank Group, the asset may not be collateralised, or may relate to unsecured retail facilities. At the lower end of this grade there are customers that are being more carefully monitored, for example, corporate customers which are indicating some evidence of deterioration, mortgages with a high loan to value, and unsecured retail loans operating outside normal product guidelines.
Higher risk: there is concern over the obligor’s ability to make payments when due. However, these have not yet converted to actual delinquency. There may also be doubts over the value of collateral or security provided. However, the borrower or counterparty is continuing to make payments when due and is expected to settle all outstanding amounts of principal and interest. Debt securities For assets held at fair value, the carrying value on the balance sheet will include, among other things, the credit risk of the issuer. Most listed and some unlisted securities are rated by external rating agencies. The Barclays Bank Group mainly uses external credit ratings provided by Standard & Poor’s, Fitch or Moody’s. Where such ratings are not available or are not current, the Barclays Bank Group will use its own internal ratings for the securities.
Balance sheet credit quality The following tables present the credit quality of Barclays Bank Group assets exposed to credit risk.
Overview As at 31 December 2018, the ratio of the Barclays Bank Group’s on-balance sheet assets classified as strong (0.0 < 0.60%) remained stable at 86% (2017: 87%) of total assets exposed to credit risk.
home.barclays/annualreport Barclays Bank PLC Annual Report 87
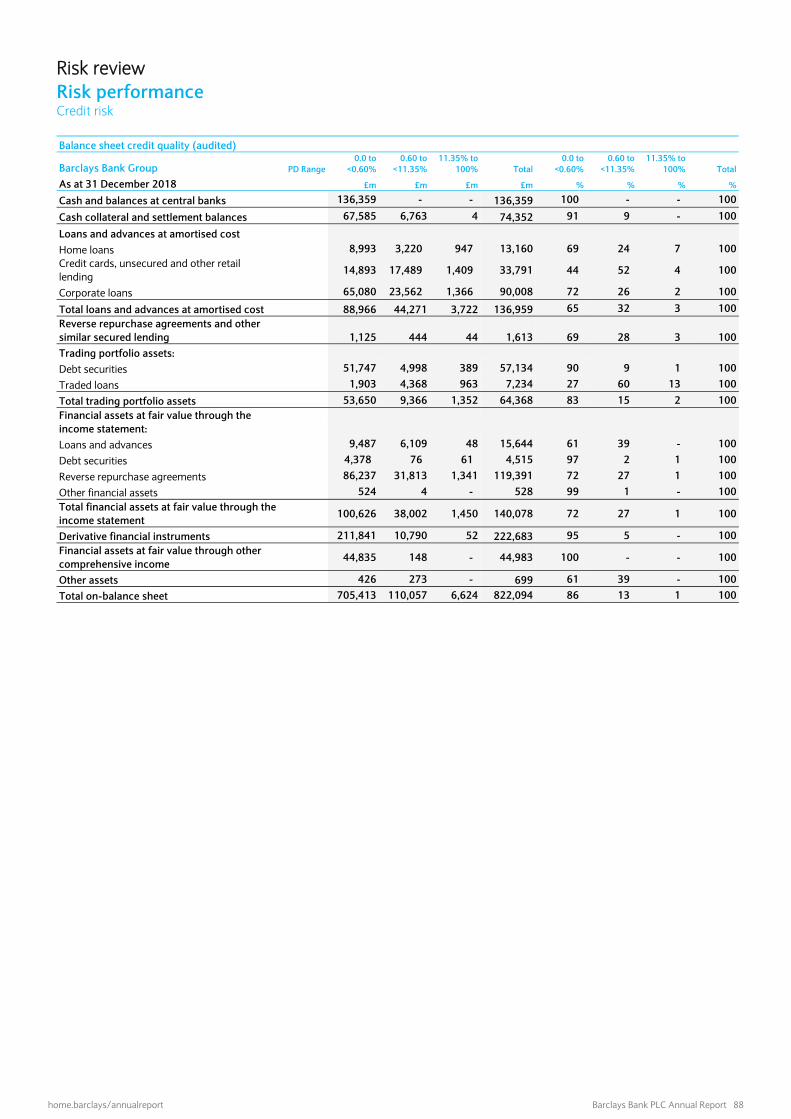
Risk review Risk performance Credit risk
Balance sheet credit quality (audited)
Barclays Bank Group PD Range 0.0 to
<0.60% 0.60 to
<11.35% 11.35% to
100% Total 0.0 to
<0.60% 0.60 to
<11.35% 11.35% to
100% Total
As at 31 December 2018 £m £m £m £m % % % %
Cash and balances at central banks 136,359 - - 136,359 100 - - 100
Cash collateral and settlement balances 67,585 6,763 4 74,352 91 9 - 100
Loans and advances at amortised cost Home loans 8,993 3,220 947 13,160 69 24 7 100 Credit cards, unsecured and other retail lending
14,893 17,489 1,409 33,791 44 52 4 100
Corporate loans 65,080 23,562 1,366 90,008 72 26 2 100
Total loans and advances at amortised cost 88,966 44,271 3,722 136,959 65 32 3 100 Reverse repurchase agreements and other similar secured lending 1,125 444 44 1,613 69 28 3 100 Trading portfolio assets:
Debt securities 51,747 4,998 389 57,134 90 9 1 100
Traded loans 1,903 4,368 963 7,234 27 60 13 100
Total trading portfolio assets 53,650 9,366 1,352 64,368 83 15 2 100 Financial assets at fair value through the income statement:
Loans and advances 9,487 6,109 48 15,644 61 39 - 100
Debt securities 4,378 76 61 4,515 97 2 1 100
Reverse repurchase agreements 86,237 31,813 1,341 119,391 72 27 1 100
Other financial assets 524 4 - 528 99 1 - 100 Total financial assets at fair value through the income statement 100,626 38,002 1,450 140,078 72 27 1 100
Derivative financial instruments 211,841 10,790 52 222,683 95 5 - 100 Financial assets at fair value through other comprehensive income
44,835 148 - 44,983 100 - - 100
Other assets 426 273 - 699 61 39 - 100
Total on-balance sheet 705,413 110,057 6,624 822,094 86 13 1 100
home.barclays/annualreport Barclays Bank PLC Annual Report 88

Risk review Risk performance Credit risk
Balance sheet credit quality (audited)
Barclays Bank Group PD range 0.0 to
<0.60% 0.60 to
<11.35% 11.35% to
100% Total 0.0 to
<0.60% 0.60 to
<11.35% 11.35% to
100% Total
As at 31 December 2017 £m £m £m £m % % % %
Cash and balances at central banks 171,036 - - 171,036 100 - - 100
Cash collateral and settlement balances 72,281 4,619 272 77,172 94 6 - 100
Loans and advances at amortised cost
Home loans 135,576 5,781 5,645 147,002 92 4 4 100 Credit cards, unsecured and other retail lendinga 13,195 34,897 7,675 55,767 24 63 13 100
Corporate loans 76,361 33,093 12,367 121,821 63 27 10 100
Total loans and advances at amortised cost 225,132 73,771 25,687 324,590 69 23 8 100
Reverse repurchase agreements and other similar secured lending 11,430 1,101 15 12,546 91 9 - 100
Trading portfolio assets:
Debt securities 48,484 2,085 626 51,195 95 4 1 100
Traded loans 1,432 1,189 519 3,140 45 38 17 100
Total trading portfolio assets 49,916 3,274 1,145 54,335 92 6 2 100
Financial assets designated at fair value:
Loans and advances 9,457 817 763 11,037 86 7 7 100
Debt securities - 15 - 15 - 100 - 100
Reverse repurchase agreements 82,263 17,692 85 100,040 82 18 - 100
Other financial assets 482 37 - 519 93 7 - 100
Total financial assets designated at fair value 92,202 18,561 848 111,611 82 17 1 100
Derivative financial instruments 229,580 7,863 544 237,987 97 3 - 100
Financial investments - debt securities 57,107 18 4 57,129 100 - - 100
Other assets 2,544 409 41 2,994 85 14 1 100
Total on-balance sheet 911,228 109,616 28,556 1,049,400 87 10 3 100
Note a 2017 figures restated to more accurately reflect the credit quality distribution within credit cards, unsecured and other retail lending
home.barclays/annualreport Barclays Bank PLC Annual Report 89

Risk review Risk performance Credit risk
Balance sheet credit quality (audited)
Barclays Bank PLC PD Range 0.0 to
<0.60% 0.60 to
<11.35% 11.35% to
100% Total 0.0 to
<0.60% 0.60 to
<11.35% 11.35% to
100% Total
As at 31 December 2018 £m £m £m £m % % % %
Cash and balances at central banks 126,002 - - 126,002 100 - - 100
Cash collateral and settlement balances 62,702 3,494 - 66,196 95 5 - 100
Loans and advances at amortised cost Home loans 8,226 3,117 886 12,229 68 25 7 100 Credit cards, unsecured and other retail lending
3,656 764 296 4,716 78 16 6 100
Corporate loans 115,484 23,003 1,332 139,819 83 16 1 100
Total loans and advances at amortised cost 127,366 26,884 2,514 156,764 81 17 2 100 Reverse repurchase agreements and other similar secured lending 5,260 462 44 5,766 91 8 1 100 Trading portfolio assets:
Debt securities 34,115 3,311 386 37,812 90 9 1 100
Traded loans 1,903 4,368 963 7,234 27 60 13 100
Total trading portfolio assets 36,018 7,679 1,349 45,046 80 17 3 100 Financial assets at fair value through the income statement:
Loans and advances 18,718 13,136 48 31,902 59 41 - 100
Debt securities 3,871 76 50 3,997 97 2 1 100
Reverse repurchase agreements 106,645 35,291 1,341 143,277 74 25 1 100
Other financial assets 57 - - 57 100 - - 100 Total financial assets at fair value through the income statement 129,291 48,503 1,439 179,233 72 27 1 100
Derivative financial instruments 211,580 9,617 50 221,247 96 4 - 100 Financial assets at fair value through other comprehensive income
43,549 148 - 43,697 100 - - 100
Other assets 498 264 - 762 65 35 - 100
Total on-balance sheet 742,266 97,051 5,396 844,713 88 11 1 100
home.barclays/annualreport Barclays Bank PLC Annual Report 90

Risk review Risk performance Credit risk
Balance sheet credit quality (audited)
Barclays Bank PLC PD range 0.0 to
<0.60% 0.60 to
<11.35% 11.35% to
100% Total 0.0 to
<0.60% 0.60 to
<11.35% 11.35% to
100% Total
As at 31 December 2017 £m £m £m £m % % % %
Cash and balances at central banks 165,713 - - 165,713 100 - - 100
Cash collateral and settlement balances 66,968 3,720 272 70,960 94 6 - 100
Loans and advances at amortised cost
Home loans 134,852 5,615 5,585 146,052 92 4 4 100 Credit cards, unsecured and other retail lending 9,088 19,180 3,274 31,542 29 61 10 100
Corporate loans 138,196 28,720 10,745 177,661 78 16 6 100
Total loans and advances at amortised cost 282,136 53,515 19,604 355,255 79 15 6 100 Reverse repurchase agreements and other similar secured lending 22,096 853 15 22,964 96 4 - 100
Trading portfolio assets:
Debt securities 33,220 1,931 602 35,753 93 5 2 100
Traded loans 1,431 1,189 517 3,137 46 38 16 100
Total trading portfolio assets 34,651 3,120 1,119 38,890 89 8 3 100
Financial assets designated at fair value:
Loans and advances 20,816 816 763 22,395 93 4 3 100
Debt securities 3,307 - - 3,307 100 - - 100
Reverse repurchase agreements 77,367 13,991 85 91,443 85 15 - 100
Other financial assets 29 - - 29 100 - - 100
Total financial assets designated at fair value 101,519 14,807 848 117,174 86 13 1 100
Derivative financial instruments 226,788 4,956 544 232,288 98 2 - 100
Financial investments - debt securities 54,294 12 - 54,306 100 - - 100
Other assets 3,734 243 14 3,991 94 6 - 100
Total on balance sheet 957,899 81,226 22,416 1,061,541 90 8 2 100
home.barclays/annualreport Barclays Bank PLC Annual Report 91

Risk review Risk performance Credit risk
Credit exposures by internal PD grade
Credit risk profile by internal PD grade for loans and advances at amortised cost (audited)
Gross carrying amount Allowance for ECL Net
exposure ECL
coverage Barclays Bank Group PD range Stage 1 Stage 2 Stage 3 Total Stage 1 Stage 2 Stage 3 Total Credit quality description % £m £m £m £m £m £m £m £m £m %
Strong 0.0 to < 0.60% 86,875 2,223 - 89,098 106 26 - 132 88,966 0.1
Satisfactory 0.60 to < 11.35% 35,475 9,752 - 45,227 356 600 - 956 44,271 2.1
Higher Risk 11.35% to < 100% 239 2,049 - 2,288 27 629 - 656 1,632 28.7
Credit Impaired 100% - - 4,189 4,189 - - 2,099 2,099 2,090 50.1
Total 122,589 14,024 4,189 140,802 489 1,255 2,099 3,843 136,959 2.7
Credit risk profile by internal PD grade for contingent liabilitiesa (audited)
Gross carrying amount Allowance for ECL Net
exposure ECL
coverage Barclays Bank Group PD range Stage 1 Stage 2 Stage 3 Total Stage 1 Stage 2 Stage 3 Total Credit quality description % £m £m £m £m £m £m £m £m £m %
Strong 0.0 to < 0.60% 14,089 444 - 14,533 5 3 - 8 14,525 0.1
Satisfactory 0.60 to < 11.35% 3,542 964 - 4,506 11 13 - 24 4,482 0.5
Higher Risk 11.35% to < 100% 48 229 - 277 - 11 - 11 266 4.0
Credit Impaired 100% - - 74 74 - - 2 2 72 2.7
Total 17,679 1,637 74 19,390 16 27 2 45 19,345 0.2
Credit risk profile by internal PD grade for loan commitmentsa (audited)
Gross carrying amount Allowance for ECL Net
exposure ECL
coverage Barclays Bank Group PD range Stage 1 Stage 2 Stage 3 Total Stage 1 Stage 2 Stage 3 Total Credit quality description % £m £m £m £m £m £m £m £m £m %
Strong 0.0 to < 0.60% 172,159 4,584 - 176,743 17 4 - 21 176,722 -
Satisfactory 0.60 to < 11.35% 58,084 7,750 - 65,834 55 40 - 95 65,739 0.1
Higher Risk 11.35% to < 100% 668 2,473 - 3,141 3 33 - 36 3,105 1.1
Credit Impaired 100% - - 347 347 - - 20 20 327 5.8
Total 230,911 14,807 347 246,065 75 77 20 172 245,893 0.1
Credit risk profile by internal PD grade for loans and advances at amortised cost (audited)
Gross carrying amount Allowance for ECL Net
exposure ECL
coverage Barclays Bank PLC PD range Stage 1 Stage 2 Stage 3 Total Stage 1 Stage 2 Stage 3 Total Credit quality description % £m £m £m £m £m £m £m £m £m %
Strong 0.0 to < 0.60% 125,374 2,078 - 127,452 62 24 - 86 127,366 0.1
Satisfactory 0.60 to < 11.35% 20,756 6,418 - 27,174 77 213 - 290 26,884 1.1
Higher Risk 11.35% to < 100% 112 828 - 940 3 75 - 78 862 8.3
Credit Impaired 100% - - 2,424 2,424 - - 772 772 1,652 31.8
Total 146,242 9,324 2,424 157,990 142 312 772 1,226 156,764 0.8
Credit risk profile by internal PD grade for contingent liabilitiesa (audited)
Gross carrying amount Allowance for ECL Net
exposure ECL
coverage Barclays Bank PLC PD range Stage 1 Stage 2 Stage 3 Total Stage 1 Stage 2 Stage 3 Total Credit quality description % £m £m £m £m £m £m £m £m £m %
Strong 0.0 to < 0.60% 20,387 411 - 20,798 5 3 - 8 20,790 -
Satisfactory 0.60 to < 11.35% 3,537 962 - 4,499 11 13 - 24 4,475 0.5
Higher Risk 11.35% to < 100% 48 229 - 277 - 11 - 11 266 4.0
Credit Impaired 100% - - 74 74 - - 2 2 72 2.7
Total 23,972 1,602 74 25,648 16 27 2 45 25,603 0.2
home.barclays/annualreport Barclays Bank PLC Annual Report 92

Risk review Risk performance Credit risk
Credit risk profile by internal PD grade for loan commitmentsa (audited)
Gross carrying amount Allowance for ECL Net
exposure ECL
coverage Barclays Bank PLC PD range Stage 1 Stage 2 Stage 3 Total Stage 1 Stage 2 Stage 3 Total Credit quality description % £m £m £m £m £m £m £m £m £m %
Strong 0.0 to < 0.60% 145,364 4,517 - 149,881 12 4 - 16 149,865 -
Satisfactory 0.60 to < 11.35% 22,575 5,562 - 28,137 33 35 - 68 28,069 0.2
Higher Risk 11.35% to < 100% 269 1,441 - 1,710 1 24 - 25 1,685 1.5
Credit Impaired 100% - - 301 301 - - 20 20 281 6.6
Total 168,208 11,520 301 180,029 46 63 20 129 179,900 0.1
Note a Excludes loan commitments and financial guarantees carried at fair value amounting £11.7bn for Barclays Bank Group and Barclays Bank PLC
Stage 1 higher risk assets, presented gross of associated collateral held, are of weaker credit quality but have not significantly deteriorated since origination. Examples would include leveraged corporate loans or non-prime credit cards.
IFRS 9 Stage 1 and Stage 2 classification is not dependent solely on the absolute probability of default but on elements that determine a Significant Increase in Credit Risk (see Note 9 on page 173), including relative movement in probability of default since initial recognition. There is therefore no direct relationship between credit quality and IFRS 9 stage classification.
home.barclays/annualreport Barclays Bank PLC Annual Report 93

Risk review Risk performance Credit risk
Analysis of specific portfolios and asset types
Credit cards, unsecured loans and other retail lending
The principal portfolios listed below accounted for 82% of Barclays Bank Group’s total credit cards, unsecured loans and other retail lending.
Credit cards and unsecured loans principal portfolios
Gross loans and
advances
30 day arrears, excluding
recovery book
90 day arrears, excluding
recovery book Annualised gross
charge-off rate
£m % % %
As at 31 December 2018 US cards 22,178 2.7 1.4 5.7
Barclays partner finance 4,216 1.1 0.4 2.3
Germany consumer lending 3,545 1.9 0.8 2.9
As at 31 December 2017
US cards 21,350 2.6 1.3 5.0
Barclays partner finance 3,814 1.3 0.5 2.6
Germany consumer lending 3,384 2.3 1.0 3.2
US cards: The annualised gross charge-off rate increased to 5.7% (2017: 5.0%) broadly in line with trends across the industry and change in portfolio mix reflecting a one-off asset sale benefitting 2017. Barclays partner finance: 30 and 90 day arrears rates reduced driven by improved quality of new business and better arrears management. Germany consumer lending: Arrears and charge-off rates reduced due to improved performance in collections along with booking lower risk business.
home.barclays/annualreport Barclays Bank PLC Annual Report 94

Risk review Risk performance Market risk
Summary of Contents Page Market risk overview and summary of performance 96
Outlines key measures used to summarise the market risk profile of the bank such as value at risk (VaR). A distinction is made between management and regulatory measures.
Traded market risk Review of management measures
- The daily average, maximum and minimum values of management VaR
- Business scenario stresses
97 97 97 97
Barclays Bank Group discloses details on management measures of market risk. Total management VaR includes all trading positions and is presented on a diversified basis by risk factor. This section also outlines the macroeconomic conditions modelled as part of Barclays Bank Group’s risk management framework.
home.barclays/annualreport Barclays Bank PLC Annual Report 95

Risk review Risk performance Market risk
Market risk
The risk of loss arising from potential adverse changes in the value of the firm’s assets and liabilities from fluctuation in market variables including, but not limited to, interest rates, foreign exchange, equity prices, commodity prices, credit spreads, implied volatilities and asset correlations.
All disclosures in this section (pages 96-97) are unaudited unless otherwise stated.
Overview
This section contains key statistics describing the market risk profile of Barclays Bank Group:
page 48 covers the management of market risk. Management measures are shown on page 98.
Measures of market risk in Barclays Bank Group and accounting measures
Traded market risk measures such as VaR and balance sheet exposure measures have fundamental differences:
balance sheet measures show accruals-based balances or marked to market values as at the reporting date
VaR measures also take account of current marked to market values, but in addition hedging effects between positions are considered
market risk measures are expressed in terms of changes in value or volatilities as opposed to static values.
For these reasons, it is not possible to present direct reconciliations of traded market risk and accounting measures.
Summary of performance in the period
Overall, Barclays Bank Group has maintained a steady risk profile
Measures of traded market risk have been relatively stable over 2018.
Key metrics
Average management Value at Risk in 2018 at £20m (2017: £19m) remained relatively stable:
+5%
This small increase was driven by a higher volatility environment compared to 2017.
home.barclays/annualreport Barclays Bank PLC Annual Report 96

Risk review Risk performance Market risk
Traded market risk review
Review of management measures The following disclosures provide details on management measures of market risk.
The table below shows the total management VaR on a diversified basis by risk factor. Total management VaR includes all trading positions in CIB and the supporting Barclays Bank Group Treasury desks.
Limits are applied against each risk factor VaR as well as total Management VaR, which are then cascaded further by risk managers to each business.
The daily average, maximum and minimum values of management VaR Management VaR (95%, one day) (audited)
2018 2017
Average Highb Lowb Average Highb Lowb
For the year ended 31 Decembera £m £m £m £m £m £m
Credit risk 11 16 8 12 18 8 Interest rate risk 8 18 3 8 15 4 Equity risk 7 14 4 8 14 4 Basis risk 6 8 4 5 6 3 Spread risk 6 9 3 5 8 3 Foreign exchange risk 3 7 1 3 7 2 Commodity risk 1 2 - 2 3 1 Inflation risk 3 4 2 2 4 1 Diversification effectb (25) n/a n/a (26) n/a n/a
Total management VaR 20 27 15 19 26 14
Notes a Excludes BAGL from 23 July 2018. b Diversification effects recognise that forecast losses from different assets or businesses are unlikely to occur concurrently, hence the expected aggregate loss is lower than the
sum of the expected losses from each area. Historical correlations between losses are taken into account in making these assessments. The high and low VaR figures reported for each category did not necessarily occur on the same day as the high and low VaR reported as a whole. Consequently, a diversification effect balance for the high and low VaR figures would not be meaningful and is therefore omitted from the above table.
Management VaR remained relatively stable year–on–year. The marginal increase in average management VaR in 2018 was due to a higher volatility environment compared to 2017. Barclays Bank Group Management VaRa (£m)
a Excludes BAGL from 23 July 2018.
Business scenario stresses As part of Barclays Bank Group’s risk management framework, on a regular basis the performance of the trading business in hypothetical scenarios characterised by severe macroeconomic conditions is modelled. Up to seven global scenarios are modelled on a regular basis, for example, a sharp deterioration in liquidity, a slowdown in the global economy, global recession, and a sharp increase in economic growth. In 2018, the scenario analyses showed that the largest market risk related impacts would be due to a severe deterioration in financial liquidity and global recession.
0
20
40
60
Jan 2017 Jan 2018 Dec 2018
home.barclays/annualreport Barclays Bank PLC Annual Report 97

Risk review Risk performance Treasury and Capital risk
Summary of Contents Page
Liquidity risk performance
Liquidity risk overview Liquidity risk stress testing
99 99
The risk that the firm is unable to meet its contractual or contingent obligations or that it does not have the appropriate amount, tenor and composition of funding and liquidity to support its assets. This section provides an overview of the Barclays Bank Group’s liquidity risk.
Contractual maturity of financial assets and liabilities 99 Provides details on the contractual maturity of all financial instruments and other assets and liabilities.
Capital risk performance
Capital risk overview - Capital ratios - Capital resources - Capital Requirements Regulation leverage ratio
108 108 108 108
Capital risk is the risk that the firm has an insufficient level or composition of capital to support its normal business activities and to meet its regulatory capital requirements under normal operating environments or stressed conditions (both actual and as defined for internal planning or regulatory testing purposes). This also includes the risk from the firm’s pension plans. This section details Barclays Bank Group’s capital and leverage position.
Foreign exchange risk - Transactional foreign currency exposure - Translational foreign exchange exposure - Functional currency of operations
109 109 109 109
Barclays Bank Group discloses the two sources of foreign exchange risk that it is exposed to.
Pension risk review - Assets and liabilities - IAS 19 position - Risk measurement
110 110 111 111
A review focusing on the UK retirement fund, which represents the majority of Barclays Bank Group’s total retirement benefit obligation.
Interest rate risk in the banking book performance
Interest rate risk in the banking book overview and summary of performance Net interest income sensitivity Analysis of equity sensitivity Volatility of the FVOCI portfolio in the liquidity pool
112 113 114 115
A description of the non-traded market risk framework is provided.
Barclays Bank Group discloses a sensitivity analysis on pre-tax net interest income for non-trading financial assets and liabilities. The analysis is carried out by currency.
Barclays Bank Group discloses the overall impact of a parallel shift in interest rates on other comprehensive income and cash flow hedges.
Barclays Bank Group measures the volatility of the value of the FVOCI instruments in the liquidity pool through non-traded market risk VaR.
home.barclays/annualreport Barclays Bank PLC Annual Report 98

Risk review Risk performance Treasury and Capital risk
Liquidity risk
The risk that the firm is unable to meet its contractual or contingent obligations or that it does not have the appropriate amount, tenor and composition of funding and liquidity to support its assets.
All disclosures in this section (pages 99 to 107) are unaudited unless otherwise stated.
Overview
The liquidity pool increased to £182bn (June 2018: £171bn) driven largely by franchise led net deposit growth during the period. The strong liquidity position reflects the Barclays Bank Group’s prudent approach given the continued macroeconomic uncertainty.
For the purpose of liquidity management, Barclays Bank PLC and its subsidiary Barclays Capital Securities Limited, a UK broker dealer entity, are monitored on a combined basis by the PRA under a Domestic Liquidity Sub-Group (Barclays Bank PLC DoLSub) arrangement.
Liquidity risk stress testing
The liquidity risk assessment measures the potential contractual and contingent stress outflows under a range of stress scenarios, which are then used to determine the size of the liquidity pool that is immediately available to meet anticipated outflows if a stress occurs. The scenarios include a 30 day Barclays-specific stress event, a 90 day market-wide stress event and a 30 day combined scenario consisting of both a Barclays specific and market-wide stress event. The CRD IV Delegated Act Liquidity Coverage Ratio (LCR) requirement takes into account the relative stability of different sources of funding and potential incremental funding requirements in a stress. The LCR is designed to promote short-term resilience of a bank’s liquidity risk profile by holding sufficient high quality liquid assets to survive an acute stress scenario lasting for 30 days.
As at 31 December 2018, Barclays Bank PLC DoLSub held eligible liquidity assets in excess of 100% of the net stress outflows to its internal and external regulatory requirements. The proportion of the liquidity pool between cash and deposits with central banks, government bonds and other eligible securities is broadly similar to that for the Barclays Group.
A significant portion of the liquidity pool is located in Barclays Bank PLC. The residual portion of the liquidity pool, which is predominantly in the US subsidiaries, is held against entity-specific stress outflows and local regulatory requirements.
As at 31.12.18 £bn
Barclays Bank Group liquidity pool 182
%
Barclays Bank PLC DoLSub liquidity coverage ratio 147
Contractual maturity of financial assets and liabilities
The table below provides detail on the contractual maturity of all financial instruments and other assets and liabilities. Derivatives (other than those designated in a hedging relationship) and trading portfolio assets and liabilities are included in the ‘on demand’ column at their fair value. Liquidity risk on these items is not managed on the basis of contractual maturity since they are not held for settlement according to such maturity and will frequently be settled before contractual maturity at fair value. Derivatives designated in a hedging relationship are included according to their contractual maturity.
home.barclays/annualreport Barclays Bank PLC Annual Report 99
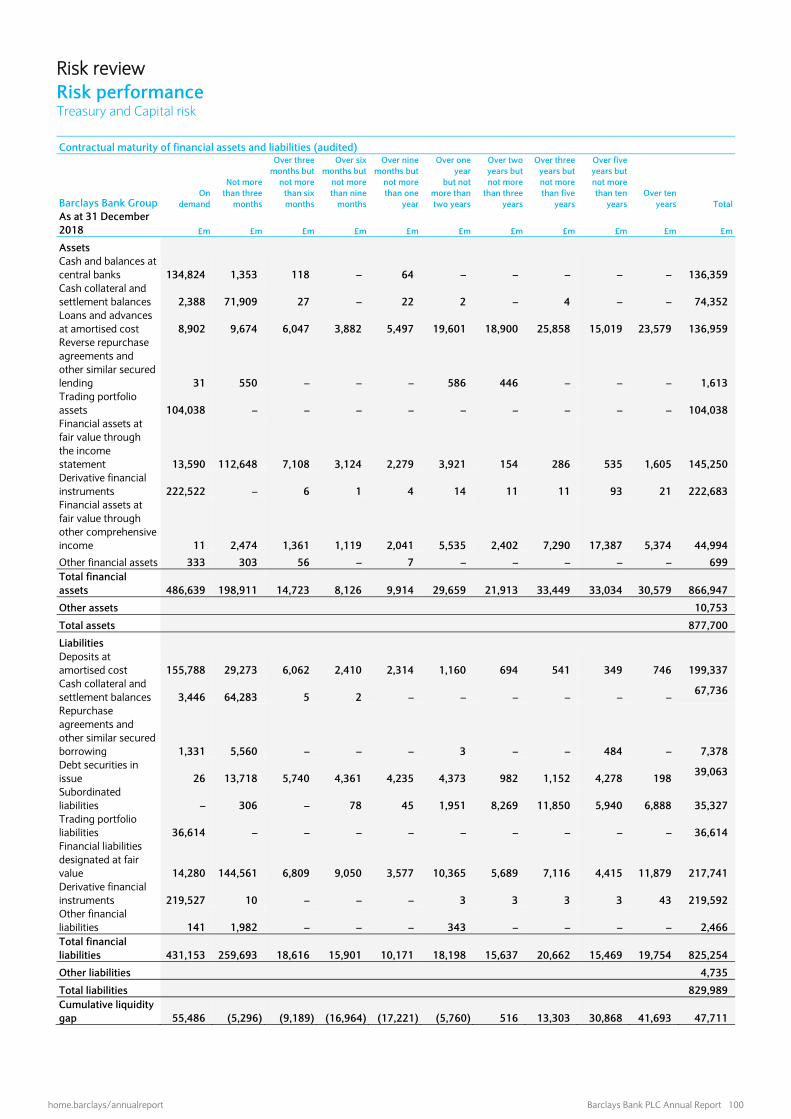
Risk review Risk performance Treasury and Capital risk
Contractual maturity of financial assets and liabilities (audited)
Barclays Bank Group On
demand
Not more than three
months
Over three months but
not more than six months
Over six months but
not more than nine
months
Over nine months but
not more than one
year
Over one year
but not more than two years
Over two years but not more
than three years
Over three years but not more than five
years
Over five years but not more than ten
years Over ten
years Total As at 31 December 2018 £m £m £m £m £m £m £m £m £m £m £m
Assets Cash and balances at central banks 134,824 1,353 118 – 64 – – – – – 136,359 Cash collateral and settlement balances 2,388 71,909 27 – 22 2 – 4 – – 74,352 Loans and advances at amortised cost 8,902 9,674 6,047 3,882 5,497 19,601 18,900 25,858 15,019 23,579 136,959 Reverse repurchase agreements and other similar secured lending 31 550 – – – 586 446 – – – 1,613 Trading portfolio assets 104,038 – – – – – – – – – 104,038 Financial assets at fair value through the income statement 13,590 112,648 7,108 3,124 2,279 3,921 154 286 535 1,605 145,250 Derivative financial instruments 222,522 – 6 1 4 14 11 11 93 21 222,683 Financial assets at fair value through other comprehensive income 11 2,474 1,361 1,119 2,041 5,535 2,402 7,290 17,387 5,374 44,994
Other financial assets 333 303 56 – 7 – – – – – 699 Total financial assets 486,639 198,911 14,723 8,126 9,914 29,659 21,913 33,449 33,034 30,579 866,947
Other assets 10,753
Total assets 877,700
Liabilities Deposits at amortised cost 155,788 29,273 6,062 2,410 2,314 1,160 694 541 349 746 199,337 Cash collateral and settlement balances 3,446 64,283 5 2 – – – – – –
67,736
Repurchase agreements and other similar secured borrowing 1,331 5,560 – – – 3 – – 484 – 7,378 Debt securities in issue 26 13,718 5,740 4,361 4,235 4,373 982 1,152 4,278 198
39,063
Subordinated liabilities – 306 – 78 45 1,951 8,269 11,850 5,940 6,888 35,327 Trading portfolio liabilities 36,614 – – – – – – – – – 36,614 Financial liabilities designated at fair value 14,280 144,561 6,809 9,050 3,577 10,365 5,689 7,116 4,415 11,879 217,741 Derivative financial instruments 219,527 10 – – – 3 3 3 3 43 219,592 Other financial liabilities 141 1,982 – – – 343 – – – – 2,466 Total financial liabilities 431,153 259,693 18,616 15,901 10,171 18,198 15,637 20,662 15,469 19,754 825,254
Other liabilities 4,735
Total liabilities 829,989 Cumulative liquidity gap 55,486 (5,296) (9,189) (16,964) (17,221) (5,760) 516 13,303 30,868 41,693 47,711
home.barclays/annualreport Barclays Bank PLC Annual Report 100

Risk review Risk performance Treasury and Capital risk
Contractual maturity of financial assets and liabilities (audited)
Barclays Bank Group On
demand
Not more than three
months
Over three months but
not more than six months
Over six months but
not more than nine
months
Over nine months but
not more than one
year
Over one year
but not more than two years
Over two years but not more
than three years
Over three years but not more than five
years
Over five years but not more than ten
years Over ten
years Total As at 31 December 2017 £m £m £m £m £m £m £m £m £m £m £m
Assets Cash and balances at central banks 170,190 846 – – – – – – – – 171,036 Cash collateral and settlement balances 1,794 75,327 32 2 14 3 – – – – 77,172 Loans and advances at amortised cost 13,551 25,845 9,735 5,594 7,733 36,213 26,244 39,978 48,382 111,315 324,590 Reverse repurchase agreements and other similar secured lending 7,522 4,446 578 – – – – – – – 12,546
Trading portfolio assets 113,755 – – – – – – – – – 113,755 Financial assets at fair value through the income statement 14,800 77,289 8,828 4,570 1,252 2,095 160 196 557 6,535 116,282 Derivative financial instruments 237,741 41 81 – – 71 22 15 1 15 237,987
Financial investments 30 2,378 2,717 97 504 5,675 3,928 16,162 17,107 10,365 58,963 Financial assets at fair value through other comprehensive income – – – – – – – – – – –
Other financial assets 2,153 725 – – – 116 – – – – 2,994
Total financial assets 561,536 186,897 21,971 10,263 9,503 44,173 30,354 56,351 66,047 128,230 1,115,325
Other assets 14,018
Total assets 1,129,343
Liabilities Deposits at amortised cost 338,550 39,405 8,083 3,820 3,823 2,754 634 1,198 266 656 399,189 Cash collateral and settlement balances 1,808 66,291 16 4 19 4 1 – – – 68,143 Repurchase agreements and other similar secured borrowing 3,550 17,841 4,516 2,136 1,396 310 93 10,006 490 – 40,338
Debt securities in issue 907 17,025 8,395 5,107 1,562 6,654 3,881 11,944 9,502 4,409 69,386
Subordinated liabilities – 2,402 791 7 23 57 1,949 8,751 5,866 4,347 24,193 Trading portfolio liabilities 37,352 – – – – – – – – – 37,352 Financial liabilities designated at fair value 13,298 102,860 10,570 5,918 3,139 10,515 7,281 5,879 4,923 9,335 173,718 Derivative financial instruments 237,242 10 3 – – 10 5 4 41 1,030 238,345 Other financial liabilities 446 4,557 – – – 671 – – – – 5,674 Total financial liabilities 633,153 250,391 32,374 16,992 9,962 20,975 13,844 37,782 21,088 19,777 1,056,338
Other liabilities 7,271
Total liabilities 1,063,609 Cumulative liquidity gap (71,617) (135,111) (145,514) (152,243) (152,702) (129,504) (112,994) (94,425) (49,466) 58,987 65,734
home.barclays/annualreport Barclays Bank PLC Annual Report 101

Risk review Risk performance Treasury and Capital risk
Contractual maturity of financial assets and liabilities (audited)
Barclays Bank PLC On
demand
Not more than three
months
Over three months but
not more than six months
Over six months but
not more than nine
months
Over nine months but
not more than one
year
Over one year
but not more than two years
Over two years but not more
than three years
Over three years but not more than five
years
Over five years but not more than ten
years Over ten
years Total
As at 31 December 2018 £m £m £m £m £m £m £m £m £m £m £m
Assets Cash and balances at central banks 124,467 1,353 118 – 64 – – – – – 126,002 Cash collateral and settlement balances 3,499 62,548 23 5 8 30 83 – – – 66,196 Loans and advances at amortised cost 7,226 45,573 4,065 3,534 5,762 20,108 14,961 20,758 16,400 18,377 156,764 Reverse repurchase agreements and other similar secured lending – 4,734 – – – 586 446 – – – 5,766
Trading portfolio assets 73,480 – – – – – – – – – 73,480 Financial assets at fair value through the income statement – 140,213 10,172 10,279 5,146 6,671 337 1,742 677 4,128 179,365 Derivative financial instruments 221,086 – 6 1 4 14 11 11 93 21 221,247
Financial investments – – – – – – – – – – – Financial assets at fair value through other comprehensive 7 1,334 1,328 1,115 2,039 5,479 2,385 7,258 17,387 5,374 43,706
Other financial assets 229 533 – – – – – – – – 762
Total financial assets 429,994 256,288 15,712 14,934 13,023 32,888 18,223 29,769 34,557 27,900 873,288
Other assets 20,108
Total assets 893,396
Liabilities
Deposits at amortised cost 143,896 53,144 6,473 3,752 2,858 1,615 489 1,502 5,298 11,990 231,017 Cash collateral and settlement balances 2,418 53,766 109 8 25 31 – 1 – – 56,358 Repurchase agreements and other similar secured borrowing – 10,626 – – – 3 – – 484 – 11,113
Debt securities in issue – 8,002 4,589 3,511 4,456 3,231 750 180 1,634 38 26,391
Subordinated liabilities – – – – 45 1,951 8,269 11,851 5,940 7,029 35,085
Trading portfolio liabilities 46,626 – – – – – – – – – 46,626 Financial liabilities designated at fair value 15 152,553 8,646 9,788 5,150 11,696 5,088 7,689 4,521 11,820 216,966 Derivative financial instruments 221,476 10 – – – 3 3 3 3 92 221,590
Other financial liabilities 145 1,621 – – – 44 – – – – 1,810
Total financial liabilities 414,576 279,722 19,817 17,059 12,534 18,574 14,599 21,226 17,880 30,969 846,956
Other liabilities 2,803
Total liabilities 849,759
Cumulative liquidity gap 15,418 (8,016) (12,121) (14,246) (13,757) 557 4,181 12,724 29,401 26,332 43,637
home.barclays/annualreport Barclays Bank PLC Annual Report 102

Risk review Risk performance Treasury and Capital risk
Contractual maturity of financial assets and liabilities (audited)
Barclays Bank PLC
On
demand
Not more than three
months
Over three months but
not more than six months
Over six months but
not more than nine
months
Over nine months but
not more than one
year
Over one year
but not more than two years
Over two years but not more
than three years
Over three years but not more than five
years
Over five years but not more than ten
years Over ten
years Total As at 31 December 2017 £m £m £m £m £m £m £m £m £m £m £m
Assets Cash and balances at central banks 164,867 846 – – – – – – – – 165,713 Cash collateral and settlement balances – 70,898 8 7 20 27 – – – – 70,960 Loans and advances at amortised cost 13,804 63,385 10,459 7,540 7,587 43,116 24,087 35,195 43,120 106,962 355,255 Reverse repurchase agreements and other similar secured lending – 22,256 608 100 – – – – – – 22,964 Trading portfolio assets 79,836 – – – – – – – – – 79,836 Financial assets at fair value through the income statement 128 85,892 9,023 5,359 2,026 3,570 1,837 479 2,134 6,734 117,182 Derivative financial instruments 232,042 41 81 – – 71 22 15 1 15 232,288
Financial investments 12 1,203 1,674 96 482 5,608 3,804 16,130 17,010 8,564 54,583 Financial assets at fair value through other comprehensive income – – – – – – – – – – –
Other financial assets 1,011 2,050 – – – 443 – – – – 3,504
Total financial assets 491,700 246,571 21,853 13,102 10,115 52,835 29,750 51,819 62,265 122,275 1,102,285
Other assets 22,715
Total assets 1,125,000
Liabilities Deposits at amortised cost 328,142 68,355 8,494 4,361 3,854 2,361 3,161 773 5,534 867 425,902 Cash collateral and settlement balances 152 60,219 16 10 125 9 10 – – – 60,541 Repurchase agreements and other similar secured borrowing – 29,516 4,837 3,125 1,506 310 93 10,006 490 – 49,883 Debt securities in issue 874 11,025 7,269 4,889 1,555 4,988 2,865 11,825 6,738 3,846 55,874
Subordinated liabilities – 2,392 785 – – 44 1,949 8,727 5,936 4,370 24,203 Trading portfolio liabilities 41,542 – – – – – – – – – 41,542 Financial liabilities designated at fair value 111 110,715 11,290 5,858 3,373 9,557 8,065 4,806 6,150 9,119 169,044 Derivative financial instruments 228,124 10 3 – – 10 5 4 41 1,030 229,227 Other financial liabilities 446 4,128 – – – 306 – – – – 4,880 Total financial liabilities 599,391 286,360 32,694 18,243 10,413 17,585 16,148 36,141 24,889 19,232 1,061,096
Other liabilities 5,870
Total liabilities 1,066,966 Cumulative liquidity gap (107,691) (147,480) (158,321) (163,462) (163,760) (128,510) (114,908) (99,230) (61,854) 41,189 58,034
home.barclays/annualreport Barclays Bank PLC Annual Report 103

Risk review Risk performance Treasury and Capital risk
Expected maturity date may differ from the contractual dates, to account for:
trading portfolio assets and liabilities and derivative financial instruments, which may not be held to maturity as part of Barclays Bank Group’s trading strategies corporate and retail deposits, which are included within deposits at amortised cost, are repayable on demand or at short notice on a contractual
basis. In practice, these instruments form a stable base for Barclays Bank Group’s operations and liquidity needs because of the broad base of customers, both numerically and by depositor type loans to corporate and retail customers, which are included within loans and advances at amortised cost and financial assets at fair value, may be
repaid earlier in line with terms and conditions of the contract debt securities in issue, subordinated liabilities, and financial liabilities designated at fair value, may include early redemption features. Contractual maturity of financial liabilities on an undiscounted basis The table below presents the cash flows payable by the Barclays Bank Group under financial liabilities by remaining contractual maturities at the balance sheet date. The amounts disclosed in the table are the contractual undiscounted cash flows of all financial liabilities (i.e. nominal values). The balances in the below table do not agree directly to the balances in the consolidated balance sheet as the table incorporates all cash flows, on an undiscounted basis, related to both principal as well as those associated with all future coupon payments. Derivative financial instruments held for trading and trading portfolio liabilities are included in the on demand column at their fair value. Contractual maturity of financial liabilities - undiscounted (audited)
Barclays Bank Group On
demand
Not more than three
months
Over three months but
not more than six months
Over six months but
not more than one
year
Over one year
but not more than
three years
Over three years but not more than five
years
Over five years but not more than ten
years Over ten
years Total
£m £m £m £m £m £m £m £m £m
As at 31 December 2018 Deposits at amortised cost 155,788 29,301 6,066 4,739 1,887 568 412 816 199,577 Cash collateral and settlement balances 3,446 64,295 5 2 – – – – 67,748 Repurchase agreements and other similar secured borrowing 1,331 5,561 – – 3 – 486 – 7,381 Debt securities in issue 26 13,749 5,779 8,637 5,454 1,195 4,519 229 39,588 Subordinated liabilities – 306 – 123 10,477 12,420 6,867 10,393 40,586 Trading portfolio liabilities 36,614 – – – – – – – 36,614 Financial liabilities designated at fair value 14,280 144,693 6,948 12,731 16,528 7,679 5,008 17,621 225,488 Derivative financial instruments 219,527 13 – – 6 3 4 59 219,612 Other financial liabilities 141 1,982 – – 343 – – – 2,466 Total financial liabilities 431,153 259,900 18,798 26,232 34,698 21,865 17,296 29,118 839,060
As at 31 December 2017
Deposits at amortised cost 338,550 39,421 8,087 7,650 3,405 1,200 267 725 399,305 Cash collateral and settlement balances 1,808 66,298 16 24 5 – – – 68,151 Repurchase agreements and other similar secured borrowing 3,550 17,846 4,526 3,557 410 10,259 490 – 40,638
Debt securities in issue 907 17,205 8,497 6,810 10,983 12,053 9,726 4,465 70,646
Subordinated liabilities – 2,790 1,739 559 4,985 9,789 5,929 6,208 31,999
Trading portfolio liabilities 37,352 – – – – – – – 37,352 Financial liabilities designated at fair value 13,298 102,982 10,609 9,118 18,142 6,177 5,490 12,827 178,643
Derivative financial instruments 237,242 9 3 – 15 5 48 1,755 239,077
Other financial liabilities 446 4,557 – – 671 – – – 5,674
Total financial liabilities 633,153 251,108 33,477 27,718 38,616 39,483 21,950 25,980 1,071,485
home.barclays/annualreport Barclays Bank PLC Annual Report 104

Risk review Risk performance Treasury and Capital risk
Contractual maturity of financial liabilities - undiscounted (audited)
On
demand
Not more than three
months
Over three months but
not more than six months
Over six months but
not more than one
year
Over one year
but not more than
three years
Over three years but not more than five
years
Over five years but not more than ten
years Over ten
years Total
Barclays Bank PLC £m £m £m £m £m £m £m £m £m
As at 31 December 2018
Deposits at amortised cost 143,896 53,184 6,479 6,640 2,147 1,638 5,527 19,340 238,851 Cash collateral and settlement balances 2,418 53,784 109 33 32 1 – – 56,377 Repurchase agreements and other similar secured borrowing – 10,630 – – 3 – 486 – 11,119
Debt securities in issue – 8,013 4,626 8,019 4,071 191 1,717 38 26,675
Subordinated liabilities – – – 45 10,477 12,420 6,867 10,597 40,406
Trading portfolio liabilities 46,626 – – – – – – – 46,626 Financial liabilities designated at fair value 15 152,713 8,790 15,095 17,310 8,294 5,131 17,553 224,901
Derivative financial instruments 221,476 13 – – 6 3 4 107 221,609
Other financial liabilities 145 1,621 – – 44 – – – 1,810
Total financial liabilities 414,576 279,958 20,004 29,832 34,090 22,547 19,732 47,635 868,374
As at 31 December 2017
Deposits at amortised cost 328,142 70,477 8,686 8,531 9,686 2,086 6,450 1,861 435,919 Cash collateral and settlement balances 152 60,226 16 136 20 – – – 60,550 Repurchase agreements and other similar secured borrowing – 29,525 4,850 4,659 410 10,259 490 – 50,193
Debt securities in issue 874 11,195 7,361 6,568 8,263 11,934 6,963 3,902 57,060
Subordinated liabilities – 2,780 1,732 529 4,972 9,765 5,998 6,231 32,007
Trading portfolio liabilities 41,542 – – – – – – – 41,542 Financial liabilities designated at fair value 111 110,792 11,323 9,294 17,992 5,114 6,770 12,660 174,056
Derivative financial instruments 228,124 9 3 – 15 5 48 1,755 229,959
Other financial liabilities 446 4,128 – – 306 – – – 4,880
Total financial liabilities 599,391 289,132 33,971 29,717 41,664 39,163 26,719 26,409 1,086,166
home.barclays/annualreport Barclays Bank PLC Annual Report 105

Risk review Risk performance Treasury and Capital risk
Maturity of off-balance sheet commitments received and given (audited) The table below presents the maturity split of the Barclays Bank Group’s off-balance sheet commitments received and given at the balance sheet date. The amounts disclosed in the table are the undiscounted cash flows (i.e. nominal values) on the basis of earliest opportunity at which they are available. Maturity analysis of off-balance sheet commitments received (audited)
On
demand
Not more than three
months
Over three months but
not more than six months
Over six months but
not more than nine
months
Over nine months but
not more than one
year
Over one year but
not more than two
years
Over two years but not more
than three years
Over three years but not more than five
years
Over five years but not more than ten
years Over ten
years Total
Barclays Bank Group £m £m £m £m £m £m £m £m £m £m £m
As at 31 December 2018 Guarantees, letters of credit and credit insurance 5,581 110 20 13 16 65 10 33 10 5 5,863 Other commitments received 93 42 – – – – – – – – 135 Total off-balance sheet commitments received 5,674 152 20 13 16 65 10 33 10 5 5,998
As at 31 December 2017 Guarantees, letters of credit and credit insurance 6,373 5 2 3 1 8 7 5 3 4 6,411 Other commitments received – 29 – – – – – – – – 29 Total off-balance sheet commitments received 6,373 34 2 3 1 8 7 5 3 4 6,440
Maturity analysis of off-balance sheet commitments given (audited)
On
demand
Not more than three
months
Over three months but
not more than six months
Over six months but
not more than nine
months
Over nine months but
not more than one
year
Over one year but
not more than two
years
Over two years but not more
than three years
Over three years but not more than five
years
Over five years but not more than ten
years Over ten
years Total
Barclays Bank Group £m £m £m £m £m £m £m £m £m £m £m
As at 31 December 2018
Contingent liabilities 15,435 1,102 553 145 170 415 435 641 319 179 19,394 Documentary credits and other short-term trade related transactions 70 1,263 325 55 14 11 3 – – – 1,741 Standby facilities, credit lines and other commitments 250,802 1,734 1,311 397 667 311 257 424 19 105 256,027 Total off-balance sheet commitments given 266,307 4,099 2,189 597 851 737 695 1,065 338 284 277,162
As at 31 December 2017
Contingent liabilities 16,047 1,085 560 92 242 346 80 59 245 256 19,012 Documentary credits and other short-term trade related transactions 34 593 147 26 6 5 1 – – – 812 Standby facilities, credit lines and other commitments 311,481 1,144 883 77 778 44 47 259 2 46 314,761 Total off-balance sheet commitments given 327,562 2,822 1,590 195 1,026 395 128 318 247 302 334,585
home.barclays/annualreport Barclays Bank PLC Annual Report 106

Risk review Risk performance Treasury and Capital risk
Maturity analysis of off-balance sheet commitments received (audited)
On
demand Not more than three months
Over three months but not
more than six months
Over six months but not more than one
year
Over one year but not more
than three years
Over three years but not
more than five years
Over five years but not more
than ten years Over ten
years Total
Barclays Bank PLC £m £m £m £m £m £m £m £m £m
As at 31 December 2018 Guarantees, letters of credit and credit insurance 5,539 16 4 17 55 22 9 5 5,667 Other commitments received – – – – – – – – – Total off balance sheet commitments received 5,539 16 4 17 55 22 9 5 5,667
As at 31 December 2017 Guarantees, letters of credit and credit insurance 5,409 4 1 3 11 5 3 4 5,440 Other commitments received - 5 - - - - - - 5 Total off balance sheet commitments received 5,409 9 1 3 11 5 3 4 5,445
Maturity analysis of off-balance sheet commitments given (audited)
On
demand
Not more than three
months
Over three months but not
more than six months
Over six months but
not more than nine
months
Over nine months but
not more than one
year
Over one year but
not more than two
years
Over two years but not more
than three years
Over three years but not more than five
years
Over five years but not more than ten
years Over ten
years Total
Barclays Bank PLC £m £m £m £m £m £m £m £m £m £m £m
As at 31 December 2018
Contingent liabilities 21,720 1,075 553 145 170 415 435 641 319 179 25,652 Documentary credits and other short-term trade related transactions 70 1,263 325 55 14 11 3 – – – 1,741 Standby facilities, credit lines and other commitments 184,979 1,718 1,311 397 667 311 60 424 19 105 189,991 Total off-balance sheet commitments given 206,769 4,056 2,189 597 851 737 498 1,065 338 284 217,384
As at 31 December 2017
Contingent liabilities 22,979 1,706 734 609 242 425 80 117 269 256 27,417 Documentary credits and other short-term trade related transactions 34 593 147 26 6 5 1 - - - 812 Standby facilities, credit lines and other commitments 249,122 1,121 883 77 758 44 43 13 2 46 252,109 Total off-balance sheet commitments given 272,135 3,420 1,764 712 1,006 474 124 130 271 302 280,338
home.barclays/annualreport Barclays Bank PLC Annual Report 107

Risk review Risk performance Treasury and Capital risk
Capital risk
The risk that the firm has an insufficient level or composition of capital to support its normal business activities and to meet its regulatory capital requirements under normal operating environments or stressed conditions (both actual and as defined for internal planning or regulatory testing purposes). This includes the risk from the firm’s pension plans.
All disclosures in this section (pages 108) are unaudited unless otherwise stated.
Overview
Barclays Bank PLC is currently regulated by the Prudential Regulation Authority (PRA) on a solo-consolidated basis. Barclays Bank PLC solo-consolidated comprises Barclays Bank PLC plus certain additional subsidiaries, subject to PRA approval. The disclosures below provide key capital metrics for Barclays Bank PLC solo-consolidated with further information on its risk profile included in the Barclays PLC Pillar 3 Report FY 2018.
As at 31 December 2018, Barclays Bank PLC Solo’s transitional CET1 ratio was 13.5% which exceeded the 2018 transitional minimum requirement. Capital ratiosa,b,c
As at 31 December 2018 2017
Common equity tier 1 (CET1) 13.5% 13.6%
Tier 1 (T1) 18.4% 18.0%
Total regulatory capital 22.2% 22.9%
Capital resourcesa (audited)
2018 2017
As at 31 December £bn £bn
CET1 capital 23.4 35.5
T1 capital 31.9 47.0
Total regulatory capital 38.4 59.8
Total risk weighted assets (unaudited) 173.2 261.4
Capital Requirements Regulation (CRR) leverage ratioa
2018 2017
As at 31 December £bn £bn
CRR leverage ratio 4.0% 4.5%
T1 capital 31.9 47.0
CRR leverage exposure 791 1,038
a Capital, RWAs and leverage are calculated applying the transitional arrangements of the CRR. This includes IFRS 9 transitional arrangements and the grandfathering of CRR non-compliant capital instruments. b The fully loaded CET1 ratio was 12.6%, with £21.5bn of CET1 capital and £170.0bn of RWAs calculated without applying the transitional arrangements of the CRR. c The Barclays PLC CET1 ratio, as is relevant for assessing against the conversion trigger in Barclays Bank PLC Tier 2 Contingent Capital Notes, was 13.5%. For this calculation CET1 capital and RWAs are calculated applying the transitional arrangements under the CRR, including the IFRS 9 transitional arrangements. The benefit of the Financial Services Authority (FSA) October 2012 interpretation of the transitional provisions, relating to the implementation of CRD IV, expired in December 2017.
home.barclays/annualreport Barclays Bank PLC Annual Report 108

Risk review Risk performance Treasury and Capital risk
Foreign exchange risk (audited)
Barclays Bank Group is exposed to two sources of foreign exchange risk.
a) Transactional foreign currency exposure Transactional foreign currency exposures represent exposure on banking assets and liabilities, denominated in currencies other than the functional currency of the transacting entity.
Barclays Bank Group risk management policies prevent the holding of significant open positions in foreign currencies outside the trading portfolio managed by Barclays International which is monitored through VaR.
Banking book transactional foreign exchange risk outside of Barclays International is monitored on a daily basis by the market risk function and minimised by the businesses.
b) Translational foreign exchange exposure Barclays Bank Group investments in overseas subsidiaries and branches create capital resources denominated in foreign currencies, principally USD and EUR. Changes in the GBP value of the net investments due to foreign currency movements are captured in the currency translation reserve, resulting in a movement in CET1 capital.
Barclays Bank Group strategy is to minimise the volatility of the capital ratios caused by foreign exchange movements, by matching the CET1 capital movements to the revaluation of Barclays Bank Group foreign currency RWA exposures.
Functional currency of operations (audited)
Foreign currency
net investments
Borrowings which hedge
the net investments
Derivatives which hedge
the net investments
Structural currency
exposures pre- economic
hedges Economic
hedges
Remaining structural currency
exposures
£m £m £m £m £m £m
As at 31 December 2018
USD 28,857 (12,322) (2,931) 13,604 (4,827) 8,777
EUR 2,672 (3) - 2,669 (2,146) 523
ZAR 5 - - 5 - 5
JPY 489 - - 489 - 489
Other 2,021 - (37) 1,984 - 1,984
Total 34,044 (12,325) (2,968) 18,751 (6,973) 11,778
As at 31 December 2017
USD 27,848 (12,404) (540) 14,904 (6,153) 8,751
EUR 2,489 (3) - 2,486 (2,127) 359
ZAR 8 - - 8 - 8
JPY 467 (152) (301) 14 - 14
Other 2,475 - (1,299) 1,176 - 1,176
Total 33,287 (12,559) (2,140) 18,588 (8,280) 10,308
The economic hedges primarily represent the USD and EUR preference shares and Additional Tier 1 (AT1) instruments that are held as equity. These are accounted for at historical cost under IFRS and do not qualify as hedges for accounting purposes. During 2018, total structural currency exposure net of hedging instruments increased by £1.5bn to £11.8bn (2017: £10.3bn). Foreign currency net investments increased by £0.7bn to £34bn (2017: £33.3bn) driven predominantly by a £1bn increase in US Dollars and a £0.2bn increase in Euro offset by a £0.5bn decrease in other currencies. The hedges associated with these investments increased by £0.6bn to £15.3bn (2017: £14.7bn).
home.barclays/annualreport Barclays Bank PLC Annual Report 109

Risk review Risk performance Treasury and Capital risk
Pension risk review
The UK Retirement Fund (UKRF) represents approximately 99% of Barclays Bank Group’s total retirement benefit obligations. As such this risk review section focuses exclusively on the UKRF. The UKRF is closed to new entrants and there is no new final salary benefit being accrued. Existing active members accrue a combination of a cash balance benefit and a defined contribution element. Pension risk arises as the market value of the pension fund assets may decline, investment returns may reduce or the estimated value of the pension liabilities may increase.
Assets The Trustee Board of the UKRF defines its overall long-term investment strategy with investments across a broad range of asset classes. This results in an appropriate mix of return seeking assets as well as liability matching assets to better match future pension obligations. The main market risks within the asset portfolio are interest rates and equities. The split of scheme assets is shown within Note 35. The fair value of the UKRF assets was £29.0bn as at 31 December 2018 (2017: £30.1bn).
Liabilities The UKRF retirement benefit obligations are a series of future cash flows with relatively long duration. On an IAS 19 basis these cash flows are sensitive to changes in the expected long-term price inflation rate (RPI) and the discount rate (AA corporate bond yield):
an increase in long-term expected inflation corresponds to an increase in liabilities; a decrease in the discount rate corresponds to an increase in liabilities.
Pension risk is generated through Barclays Bank Group’s defined benefit schemes and this risk is set to reduce over time as the main defined benefit scheme is closed to new entrants. The chart below outlines the shape of the UKRF’s liability cash flow profile as at 31 December 2018 that takes account of the future inflation indexing of payments to beneficiaries. The majority of the cash flows (approximately 92%) fall between 0 and 40 years, peaking between 11 and 20 years and reducing thereafter. The shape may vary depending on changes to inflation and longevity expectations and any members who elect to transfer out. Transfers out will bring forward the liability cash flows.
For more detail on the UKRF’s financial and demographic assumptions see Note 35 to the financial statements.
Proportion of liability cash flows
1.4%
6.6%
14.5%
25.2%
29.1%
23.2%0‐10 Years
11‐20 Years
21‐30 Years
31‐40 Years
41‐50 Years
51 Years +
home.barclays/annualreport Barclays Bank PLC Annual Report 110

Risk review Risk performance Treasury and Capital risk
IAS 19 pension position in 2018
The graph above shows the UKRF’s net IAS 19 pension position at each month-end for the past two years. During 2017 and 2018 the net improvement in the IAS 19 position was largely driven by bank contributions and credit spreads widening. Changes from other market levels, in particular equity prices and interest rates, were offset by updates to demographic assumptions.
Please see Note 35 for the sensitivity of the UKRF to changes in key assumptions.
Risk measurement In line with Barclays Bank Group’s risk management framework the assets and liabilities of the UKRF are modelled within a VaR framework to show the volatility of the pension position at a total portfolio level. This enables the risks, diversification and liability matching characteristics of the UKRF obligations and investments to be adequately captured. VaR is measured and monitored on a monthly basis. Risks are reviewed and reported regularly at forums including the Barclays Bank PLC Board Risk Committee, the Barclays International Risk Committee, the Pensions Management Group and the Pension Executive Board. The VaR model takes into account the valuation of the liabilities on an IAS 19 basis (see Note 35). The Trustee receives quarterly VaR measures on a funding basis.
The pension liability is also sensitive to post-retirement mortality assumptions which are reviewed regularly. See Note 35 for more details.
In addition, the impact of pension risk to the Barclays Bank Group is taken into account as part of the stress testing process. Stress testing is performed internally on at least an annual basis. The UKRF exposure is also included as part of regulatory stress tests.
Barclays Bank Group’s defined benefit pension schemes affects capital in two ways:
An IAS 19 deficit is treated as a liability on Barclays Bank Group’s balance sheet. Movement in a deficit due to remeasurements, including actuarial losses, are recognised immediately through Other Comprehensive Income and as such reduces shareholders’ equity and CET1 capital. An IAS 19 surplus is treated as an asset on the balance sheet and increases shareholders’ equity; however, it is deducted for the purposes of determining CET1 capital.
In Barclays Bank Group’s statutory balance sheet an IAS 19 surplus or deficit is partially offset by a deferred tax liability or asset respectively. These may or may not be recognised for calculating CET1 capital depending on the overall deferred tax position of Barclays Bank Group at the particular time.
Pension risk is taken into account in the Pillar 2A capital assessment undertaken by the PRA at least annually. The Pillar 2A requirement forms part of Barclays Bank Group’s overall regulatory minimum requirement for CET1 capital, Tier 1 capital and total capital.
home.barclays/annualreport Barclays Bank PLC Annual Report 111

Risk review Risk performance Treasury and Capital risk
Interest rate risk in the banking book
The risk that the firm is exposed to capital or income volatility because of a mismatch between the interest rate exposures of its (non-traded) assets and liabilities.
All disclosures in this section (pages 112-115) are unaudited unless otherwise stated.
Overview
The non-traded market risk framework covers exposures in the banking book, mostly relating to accrual accounted and FVOCI instruments. The potential volatility of net interest income is measured by an Annual Earnings at Risk (AEaR) metric which is monitored regularly and reported to senior management and the Barclays Bank PLC Board Risk Committee as part of the limit monitoring framework.
Summary of performance in the period
Annual Earnings at Risk (AEaR), is a key measure of interest rate risk in the banking book (IRRBB).
Key metrics
+£23m
AEaR across Barclays Bank Group from a positive 25bps shock in interest rates.
home.barclays/annualreport Barclays Bank PLC Annual Report 112

Risk review Risk performance Treasury and Capital risk
Net interest income sensitivity
The table below shows a sensitivity analysis on pre-tax net interest income for non-trading financial assets and financial liabilities, including the effect of any hedging. The sensitivity has been measured using the Annual Earnings at Risk (AEaR) methodology. Note that this metric assumes an instantaneous parallel change to interest rate forward curves. The model floors shocked market rates at zero; changes in Net Interest Income (NII) sensitivity are only observed where forward rates are greater than zero. The main model assumptions are: (i) one-year time horizon; (ii) balance sheet is held constant; (iii) balances are adjusted for assumed behavioural profiles; and (iv) behavioural assumptions are kept unchanged in all rate scenarios.
Net Interest Income Sensitivity (AEaR) by currencya 2018 2017
+25 basis
points -25 basis
points +25 basis
points -25 basis
points
Barclays Bank Group £m £m £m £m
GBP 13 (26) 12 (76)
USD 1 (1) 1 (1)
EUR 6 (3) 4 (1)
Other currencies 3 (5) 3 (5)
Total 23 (35) 20 (83)
As percentage of net interest income 0.73% (1.12%) 0.20% (0.84%)
Net Interest Income Sensitivity (AEaR) by currencya 2018 2017
+25 basis
points -25 basis
points +25 basis
points -25 basis
points
Barclays Bank PLC £m £m £m £m
GBP 4 (7) 15 (63)
USD - - - -
EUR 1 (1) - -
Other currencies 1 (1) - -
Total 6 (9) 15 (63)
As percentage of net interest income 0.73% 1.10% 0.21% (0.85%) Note a Barclays International sensitivity (excluding Investment Banking business and Treasury).
home.barclays/annualreport Barclays Bank PLC Annual Report 113

Risk review Risk performance Treasury and Capital risk
Analysis of equity sensitivity Equity sensitivity table measures the overall impact of a +/- 25bps movement in interest rates on retained earnings, fair value through other comprehensive income (FVOCI) and cash flow hedge reserves. This data is captured using DV01 metric which is an indicator of the shift in value for a 1 basis point in the yield curve.
Analysis of equity sensitivity (audited) 31 December 2018 31 December 2017
+25 basis
points -25 basis
points +25 basis
points -25 basis
points
Barclays Bank Group £m £m £m £m
Net interest income 23 (35) 20 (83) Taxation effects on the above (6) 9 (6) 25 Effect on profit for the year 17 (26) 14 (58) As percentage of net profit after tax 2.04% 3.11% (1.22%) 5.05%
Effect on profit for the year (per above) 17 (26) 14 (58) Fair value through other comprehensive income reserve (128) 241 (164) 219 Cash flow hedge reserve (446) 431 (616) 598 Taxation effects on the above 144 (168) 195 (204) Effect on equity (413) 478 (571) 555 As percentage of equity (0.87%) 1.00% (0.87%) 0.84%
Analysis of equity sensitivity (audited) 31 December 2018 31 December 2017
+25 basis
points -25 basis
points +25 basis
points -25 basis
points
Barclays Bank PLC £m £m £m £m
Net interest income 6 (9) 15 (63) Taxation effects on the above (2) 2 (4) 19 Effect on profit for the year 4 (7) 11 (44) As percentage of net profit after tax 0.58% (1.01%) (1.66%) (6.98%)
Effect on profit for the year (per above) 4 (7) 11 (44) Fair value through other comprehensive income reserve (128) 241 (164) 219 Cash flow hedge reserve (446) 431 (491) 473 Taxation effects on the above 144 (168) 164 (173) Effect on equity (426) 497 (480) 475 As percentage of equity (0.98%) 1.14% (0.83%) 0.82%
Movements in the FVOCI reserve would impact CET1 capital, however the movement in the cash flow hedge reserve would not impact CET1 capital.
home.barclays/annualreport Barclays Bank PLC Annual Report 114

Risk review Risk performance Treasury and Capital risk
Volatility of the FVOCI portfolio in the liquidity pool
Changes in value of FVOCI exposures flow directly through capital via the FVOCI reserve. The volatility of the value of the FVOCI investments in the liquidity pool is captured and managed through a value measure rather than an earning measure, i.e. the non-traded market risk VaR.
Although the underlying methodology to calculate the non-traded VaR is identical to the one used in traded management VaR, the two measures are not directly comparable. The non-traded VaR represents the volatility to capital driven by the FVOCI exposures. These exposures are in the banking book and do not meet the criteria for trading book treatment.
Non-traded value at risk (£m)
Analysis of volatility of the FVOCI portfolio in the liquidity pool
2018 2017
Average High Low Average High Low
For the year ended 31 December £m £m £m £m £m £m
Non-traded market value at risk (daily, 95%) 42 56 27 36 50 27
The volatility in the FVOCI portfolio was primarily driven by changes in interest rate risk exposure taken in the liquid asset buffer.
0
60
Jan‐18 Dec‐18
Daily Value at Risk (£m)
home.barclays/annualreport Barclays Bank PLC Annual Report 115

Risk review Risk performance Operational risk
Operational risk
The risk of loss to the firm from inadequate or failed processes or systems, human factors or due to external events (for example fraud) where the root cause is not due to credit or market risks.
All disclosures in this section are unaudited unless otherwise stated.
Overview
Operational risks are inherent in Barclays Bank Group’s business activities and it is not always cost effective or possible to attempt to eliminate all operational risks. The Operational Risk Management Framework is therefore focused on identifying operational risks, assessing them and managing them within the Barclays Bank Group’s approved risk appetite. The operational risk principal risk comprises the following risks: data management and information, financial reporting, fraud, payments process, people, physical security, premises, prudential regulation, supplier, tax, technology and transaction operations.
For definitions of these risks see page 53. In order to provide complete coverage of the potential adverse impacts on Barclays Bank Group arising from operational risk, the operational risk taxonomy extends beyond the risks listed above to cover operational risks associated with other principal risks too.
This section provides an analysis of Barclays Bank Group’s operational risk profile, including events above Barclays Bank Group’s reportable threshold, which have had a financial impact in 2018.
For information on conduct risk please see page 57.
Summary of performance in the period
During 2018, total operational risk losses amounted to £126m and the number of recorded events for 2018 was 1,354. The total operational risk losses for the year were primarily driven by events falling within the Execution, Delivery and Process Management and External Fraud categories, which tend to be high volume but low impact events.
Key metrics
82% of Barclays Bank Group’s reportable operational risk events had a loss value of £50,000 or less
56% of events by number are due to External Fraud
b Operational risk profile
Within operational risk, a high proportion of risk events have a low financial impact whilst a very small proportion of operational risk events will have a material impact on the financial results of Barclays Bank Group. In 2018, 82% of Barclays Bank Group’s reportable operational risk events by volume had a value of less than £50,000, although this type of event accounted for only 16% of Barclays Bank Group’s total net operational risk losses.
The analysis below presents Barclays Bank Group’s operational risk events by Basel event category:
Execution, Delivery and Process Management impacts totalled £89m and accounted for 70% of total operational risk losses. The events in this category are typical of the banking industry as a whole where high volumes of transactions are processed on a daily basis. The volume of events in this category was 478, only 35% of total events.
External Fraud represents the highest volume of events with 759 in 2018 (56% of total volume) however impacts of £23m only accounted for 18% of total operational risk losses. In this category, high volume, low value events are driven by transactional fraud often related to credit card usage.
Business Disruption and System Failures impacts amounted to £10m accounting for 8% of total operational risk losses in 2018. The level of losses was heavily driven by a single event with significant impact which accounted for 55% of total 2018 impacts in this category.
Barclays Bank Group’s operational risk profile is informed by bottom-up risk assessments undertaken by each business unit and top-down qualitative review by the Operational Risk specialists for each risk type. Fraud, Transaction Operations and Technology continue to be highlighted as key operational risk exposures. The operational risk profile is also informed by a number of risk themes: Cyber, Data, Execution and Resilience. These represent threats to Barclays Bank Group that extend across multiple risk types, and therefore require an integrated risk management approach.
Investment continues to be made in improving the control environment across Barclays Bank Group. Particular areas of focus include new and enhanced fraud prevention systems and tools to combat the increasing level of fraud attempts being made and to minimise any disruption to genuine transactions. Fraud remains an industry wide threat and Barclays Bank Group continues to work closely with external partners on various prevention initiatives. Technology, resilience and cyber security risks evolve rapidly so Barclays Bank Group maintains continued focus and investment in our control environment to manage these risks, and actively partners with peers and relevant organisations to understand and disrupt threats originating outside Barclays Bank Group.
home.barclays/annualreport Barclays Bank PLC Annual Report 116

Risk review Risk performance Operational risk
Cyber threats, which are evolving and increasing in sophistication and frequency, continue to be a threat across multiple industries globally. Barclays Bank Group recognises the potential impact of cyber security threats on all areas of its business. This extends to third party suppliers and service providers which also presents a potential source of cyber security threats, leading to the need for increased scrutiny of Barclays Bank Group’s relationships with third parties. The potential impact of cyber security threats includes the potential for operational disruption, reputational harm, and costs associated with possible litigation, regulatory investigation, and remediation. The Regulators in Europe and the US have been increasingly focused on cyber security risk management and operational resilience for banking organisations given the complexity of the transactions they process, the number of jurisdictions in which they operate, and the quantities of sensitive data they hold and process. This has resulted in a number of proposed laws, regulations and other requirements that necessitate implementation of a variety of increased controls and enhancement activities for regulated Barclays Bank Group entities. These include, among others, the adoption of cyber security policies and procedures meeting specified criteria, minimum required security measures, controls and procedures for enhanced reporting and public disclosures, compliance certification requirements, and other cyber and information risk governance measures. Further to this, Barclays Bank Group continues to use an intelligence-driven defence approach, analysing external events for current and emerging cyber threats which allows the delivery of proactive counter measures; Barclays Bank Group also completes cyber threat scenarios and incident playbooks to assess our security posture and business impacts and runs an internal adversarial capability which simulates hackers to proactively test controls and responses. The increased control environment has enhanced and will continue to enhance our security posture and our ability to better protect the organisation and our customers. Cyber-attacks however are increasingly sophisticated and there can be no assurance that the measures implemented will be fully effective to prevent or mitigate future attacks, the consequences of which could be significant to Barclays Bank Group. Furthermore, such measures have resulted and will result in increased technology and other costs in connection with cyber security mitigation and compliance for Barclays Bank Group. Barclays Bank Group currently incurs an additional cost in mitigating its cyber risk via insurance. For further information, see operational risk management section (pages 53-54).
Notes a The data disclosed includes operational risk losses for reportable events impacting Barclays Bank Group business areas, having impact of > £10,000 and excludes
events that are conduct or legal risk, aggregate and boundary events. A boundary event is an operational risk event that results in a credit risk impact. b Amendments were made to the combination of organisational units that make up this entity across 2018 hence prior year comparative values are not reported here.
home.barclays/annualreport Barclays Bank PLC Annual Report 117

Risk review Risk performance Model risk
Model risk
The risk of the potential adverse consequences from financial assessments or decisions based on incorrect or misused model outputs and reports.
All disclosures in this section are unaudited unless otherwise stated.
Overview
Model risk is a focus area for management and the Barclays Bank PLC Board. It is an important component of regulators’ assessment of Barclays Bank Group’s risk management capabilities. Models are used to support a broad range of business and risk management activities, including informing business decisions and strategies, measuring and limiting risks, valuing exposures, conducting stress testing, assessing capital adequacy, supporting new business acceptance and risk/reward evaluation, managing client assets, or meeting reporting requirements.
Summary of performance in the period
The principal risk framework for model risk in Barclays Group was established in 2016. In 2017, the framework was enhanced and governance and controls capabilities were established. In 2018 the framework was embedded further in the organisation and governance was improved by:
strengthening of the Barclays Group-wide Model Risk Management (MRM) framework, policy and associated standards, validation templates and procedures broadening governance of models to include qualitative estimation approaches called ‘non-modelled methods’, which cover material decision
making and financial and regulatory reporting functions of Barclays Bank Group, such as the primary stress testing programmes and impairment estimations enhancement of Barclays Bank PLC Board oversight of model risk, through the reporting of the model risk tolerance framework and periodic
updates to the Barclays Bank PLC Board on the progress of the MRM implementation improved collection and attestation of Barclays Group’s global inventory of models reporting metrics on policy adherence and breaches enhancement of model development and model identification processes, with the areas of model ownership throughout Barclays Bank Group
embedding and improving their own model control functions.
In addition to the governance outlined above, which details how new models are validated and existing models are internally controlled and assessed, models have been classified based on their materiality (the level of reliance placed on the model output for decision making or reporting), and their complexity. A strengthened programme of review and validation for such material models commenced during 2017 and has made significant progress in 2018. In 2019 through to 2020, model risk governance will continue with the programme of model documentation and reviews, targeting prioritised models across Barclays Bank Group as well as focusing on performance monitoring of models already brought into governance to assess compliance with the framework.
home.barclays/annualreport Barclays Bank PLC Annual Report 118

Risk review Risk performance Conduct risk
Conduct risk
The risk of detriment to customers, clients, market integrity, effective competition or Barclays from the inappropriate supply of financial services, including instances of wilful or negligent misconduct.
All disclosures in this section are unaudited unless otherwise stated.
Overview
Barclays Bank Group strives to create and maintain mutually beneficial long-term relationships with its customers and clients. This means taking appropriate steps to understand their needs and providing them with products and services that meet those needs appropriately and help them manage their financial affairs.
As a transatlantic consumer, corporate and investment bank, Barclays Bank Group also plays a critical role in promoting fair, open and transparent markets, as well as fostering shared growth for all.
Summary of performance in the period
Barclays Bank Group is committed to continuing to drive the right culture throughout all levels of the organisation. Barclays Bank Group will continue to enhance effective management of conduct risk and appropriately consider the relevant tools, governance and management information in decision-making processes. Focus on management of conduct risk is ongoing and the Barclays Bank Group Conduct Dashboards are a key component of this.
The entity continues to review the role and impact of conduct issues in the remuneration process at both the individual and business level.
Businesses have continued to assess the potential customer, client and market impacts of strategic change. As part of the 2018 Medium-Term Planning Process, material conduct risks associated with strategic and financial plans were assessed.
Throughout 2018, conduct risks were raised by businesses for consideration by the Barclays Bank PLC Board Risk Committee. The Committee reviewed the risks raised and whether management’s proposed actions were appropriate to mitigate the risks effectively. Barclays Bank PLC Board Risk Committee received regular updates with regards to key risks and issues including those relating to structural reform and regulatory change.
Although certain legacy litigation and conduct issues have been resolved, Barclays Bank Group continued to incur costs in relation to litigation and conduct matters, please refer to Note 28 Legal, competition and regulatory matters and Note 26 Provisions, for further details. Costs include customer redress and remediation, as well as fines and settlements. Resolution of these matters remains a necessary and important part of delivering the Barclays Bank Group strategy and an ongoing commitment to improve oversight of culture and conduct.
The Barclays Bank PLC Board and senior management received Conduct Dashboards setting out key indicators in relation to conduct, financial crime, culture, and complaints. These continue to be evolved and enhanced to allow effective oversight and decision-making. Barclays Bank Group has operated at the overall set tolerance for conduct risk throughout 2018. The tolerance is assessed by the business through Key Indicators which are aggregated and provide an overall rating which is reported to the Barclays Bank PLC Board Risk Committee as part of the Conduct Dashboard.
Barclays Bank Group remained focused on the continuous improvements being made to manage risk effectively, with an emphasis on enhancing governance and management information to help identify risks at earlier stages.
For further details on the non-financial performance measures, please refer to page 14 of the Strategic Report.
home.barclays/annualreport Barclays Bank PLC Annual Report 119
Risk review Risk performance Reputation risk
Reputation risk
The risk that an action, transaction, investment or event will reduce trust in the firm’s integrity and competence by clients, counterparties, investors, regulators, employees or the public.
All disclosures in this section are unaudited unless otherwise stated.
Overview
Reputation risk may arise from any business decision or activity. It may also arise as a result of issues and incidents relevant to other principal risks, in particular other non-financial risks e.g. conduct or operational risk. Reputation risks and issues are identified via regular information gathering from within the business and from external stakeholders. Some risks and issues are specific to Barclays Bank Group, while others are also relevant to the Barclays Group and to the banking sector more generally.
Barclays Bank Group has set tolerances for reputation risk, which take into account the risks arising from specific events or decisions and longer-term strategic themes. The primary responsibility for managing reputation risk lies with each component Barclays Bank Group business where there are processes in place to identify, assess and manage reputation risks and issues.
Barclays Bank Group strives to create and maintain mutually beneficial long-term relationships with its customers and clients. This means taking accountability for understanding their needs and providing them with products and services that meet those needs appropriately and help them manage their financial affairs.
As a transatlantic consumer, corporate and investment bank, Barclays Bank Group also plays a critical role in promoting fair, open and transparent markets, as well as fostering shared growth for all.
Summary of performance in the period
Barclays Bank Group is committed to continuing to drive the right culture throughout all levels of the organisation. Barclays Bank Group will continue to enhance effective management of reputation risk and appropriately consider the relevant tools, governance and management information in decision-making processes.
The Barclays Bank PLC Board Risk Committee was stood up in April 2018 and has since considered reputation risks raised by businesses. This committee has also considered whether management’s proposed actions have been appropriate to mitigate the risks effectively. Finally, the Barclays Bank PLC Board Risk Committee received regular updates on key risks and issues relating to structural reform and regulatory change.
Barclays Bank Group continued to incur significant costs in relation to litigation and conduct matters, please refer to Note 28 Legal, competition and regulatory matters and Note 26 Provisions, for further details. Costs include customer redress and remediation, as well as fines and settlements. Resolution of these matters remains a necessary and important part of delivering Barclays Bank Group’s strategy and an ongoing commitment to improve oversight of culture and conduct and management of reputation risks arising.
Barclays Bank Group remained focused on the continuous improvements being made to manage risk effectively, with an emphasis on enhancing governance and management information to help identify risks at earlier stages.
For further details on the non-financial performance measures, please refer to page 14 of the Strategic Report.
home.barclays/annualreport Barclays Bank PLC Annual Report 120

Risk review Risk performance Legal risk
Legal risk
The risk of loss or imposition of penalties, damages or fines from the failure of the firm to meet its legal obligations including regulatory or contractual requirements.
All disclosures in this section are unaudited unless otherwise stated.
Overview
The Barclays Bank Group conducts diverse activities in a highly regulated global market and therefore is exposed to the risk of loss or imposition of penalties, damages, fines, and sanctions relating to a failure to meet its legal obligations in the conduct of its business. Legal risk encompasses the failure of Barclays Group to appropriately seek legal advice, escalate or manage contractual arrangements, litigation, intellectual property, competition/anti-trust issues, its use of law firms and its contact with regulators. Barclays Bank Group has limited tolerance for legal risk, however the multitude of laws and regulations pertaining to its activities across the globe are highly dynamic and their application to particular circumstances is often unclear. A Legal Risk Management Framework (LRMF) includes Barclays Group-wide requirements covering how legal risks are identified, managed and measured to support effective management of legal risk.
Summary of performance in the period
In 2018, Barclays Group remained focused on continuous improvements to manage legal risk effectively, with an emphasis on enhancing and establishing processes to help identify risks at earlier stages and escalate as appropriate.
This is supported by the LRMF, which was reviewed and enhanced to clarify Barclays Group-wide requirements relating to the identification, management and measurement of legal risk. The LRMF is supported by legal risk policies and associated standards covering areas of identified legal risk and mandatory minimum control requirements. An additional legal risk policy has been created and implemented in relation to the engagement of the Legal Function with respect to key business decisions. For further information on the legal risk policies, see legal risk management on page 59. Refreshed legal risk mandatory training was also implemented across Barclays Group, reinforced by ongoing engagement and education of Barclays Group’s businesses and functions.
The Legal Function organisation and coverage model aligns expertise to businesses, functions, products, activities and geographic locations. It continues to provide legal support, oversight, monitoring and challenge across the organisation, including advising on appropriate identification, management and escalation of legal risk. The Legal Executive Committee continues to oversee, monitor and challenge legal risk across Barclays Group.
home.barclays/annualreport Barclays Bank PLC Annual Report 121

Risk review Supervision and regulation
Supervision of Barclays Bank Group Barclays Bank Group’s operations, including its overseas branches, subsidiaries and associates, are subject to a large number of rules and regulations that are a condition for authorisations to conduct banking and financial services business in each of the jurisdictions in which Barclays Bank Group operates. These apply to business operations, impact financial returns and include capital, leverage and liquidity requirements, authorisation, registration and reporting requirements, restrictions on certain activities, conduct of business regulations and many others. These requirements are set in legislation and by the relevant central banks and regulatory authorities that authorise, regulate and supervise Barclays Bank Group in the jurisdictions in which it operates. Often, the requirements may reflect global standards developed by international bodies such as the G20, the Financial Stability Board (FSB), the Basel Committee on Banking Supervision (BCBS), and the International Organisation of Securities Commissions (lOSCO). Various bodies, such as central banks and self-regulatory organisations (SROs), also create voluntary Codes of Conduct which affect the way Barclays Bank Group does business. Regulatory developments impact Barclays Bank Group globally. We focus particularly on EU, UK and US regulation due to the location of Barclays Bank Group’s principal areas of business. Regulations elsewhere may also have a significant impact on Barclays Bank Group due to the location of its branches, subsidiaries and, in some cases, clients. For more information on the risks related to the supervision and regulation of Barclays Bank Group, including regulatory change, please see the Risk Factor entitled ‘Regulatory Change agenda and impact on Business Model’ on page 38. Supervision in the UK and EU Financial regulation in the UK is to a significant degree shaped and influenced by EU legislation. This provides the structure of the European Single Market, an important feature of which is the framework for the regulation of authorised firms in the EU. This framework is designed to enable a credit institution or investment firm authorised in one EU member state to conduct banking or investment business in another member state through the establishment of branches or by the provision of services on a cross-border basis without the need for local authorisation. Barclays Bank Group’s operations in Europe are authorised and regulated by a combination of both home and host regulators. The impact of the UK’s departure from the EU in this respect and, more broadly, its impact on the UK domestic regulatory framework, is yet to be finally determined. In the UK, the Bank of England (BoE) has responsibility for monitoring the UK financial system as a whole, including by way of conducting annual stress tests on UK banks. The day-to-day regulation and supervision of Barclays Bank Group is divided between the Prudential Regulation Authority (PRA) (a division of the BoE) and the Financial Conduct Authority (FCA). In addition, the Financial Policy Committee (FPC) of the BoE has influence on the prudential requirements that may be imposed on the banking system through its powers of direction and recommendation. Barclays Bank PLC is authorised and subject to solo-consolidated prudential supervision by the PRA, which comprises Barclays Bank PLC plus certain additional subsidiaries, and subject to conduct regulation and supervision by the FCA. Barclays Group is also subject to prudential supervision by the PRA on a group consolidated basis. Barclays Services Limited is an appointed representative of Barclays Bank PLC and Clydesdale Financial Services Limited (the principals). This status enables Barclays Services Limited to undertake activities which would otherwise require authorisation, with the principals assuming regulatory responsibility for the conduct of Barclays Services Limited as their appointed representative. Barclays Bank Ireland PLC is licensed as a credit institution by the Central Bank of Ireland and has recently been designated as a significant institution falling under direct supervision on a solo basis by the European Central Bank (ECB) from 1 January 2019. Barclays Bank Ireland PLC has recently acquired an extension of its current licence to support Barclays Bank Group’s ability to provide services to EU clients after Brexit. Barclays Bank Ireland PLC’s German branch is supervised by the ECB as part of Barclays Bank Ireland PLC and is also subject to direct supervision for local conduct purposes by the German Federal Financial Supervisory Authority (BaFIN) in accordance with EU credit institution branch passporting rules. It is expected that all the remaining EU branches of Barclays Bank PLC will have been transferred to Barclays Bank Ireland PLC by the end of Q1 2019 and will, following such transfer, be supervised by the ECB as part of Barclays Bank Ireland PLC and also be subject to direct supervision for local conduct purposes in accordance with EU credit institution branch passporting rules, by national supervisory authorities in the jurisdiction where they are established. Barclays Bank Group is also subject to regulatory initiatives undertaken by the UK Payment Systems Regulator (PSR), as a participant in payment systems regulated by the PSR. In its role as supervisor, the PRA seeks to maintain the safety and soundness of financial institutions with the aim of strengthening, but not guaranteeing, the protection of customers and the financial system. The PRA’s continuing supervision of financial institutions is conducted through a variety of regulatory tools, including the collection of information by way of prudential returns, reports obtained from skilled persons, visits to firms and regular meetings with management and non-executive directors to discuss issues such as strategy, operational resilience, risk management, and recovery and resolution. The regulation and supervision of market conduct matters is the responsibility of the FCA. The FCA’s regulation of the UK firms in Barclays Bank Group is carried out through a combination of proactive engagement, regular thematic work and project work based on the FCA’s sector assessments, which analyse the different areas of the market and the risks that may lie ahead. Both the PRA and the FCA have continued to develop and apply a more pre-emptive approach to supervision and the application of existing standards. This may include the application of standards that either anticipate or go beyond requirements established by global or EU standards, whether in relation to capital, leverage and liquidity, resolvability and resolution or matters of conduct. The FCA has retained an approach to enforcement based on credible deterrence that has seen significant growth in the size of regulatory fines. The approach appears to be trending towards a more US model of enforcement including vigorous enforcement of criminal and regulatory breaches, heightened fines and proposed measures related to increased corporate criminal liability. The FCA has focused strongly on conduct risk and on customer outcomes and will continue to do so. This has included a focus on the design and operation of products, the behaviour of customers and the operation of markets. Recently, the FCA has increased its focus on fair pricing in financial
home.barclays/annualreport Barclays Bank PLC Annual Report 122

Risk review Supervision and regulation
services. The FCA is also reviewing whether vulnerable customers pay more for financial services products. These initiatives may affect both the incidence of conduct costs and increase the cost of remediation. The FCA and the PRA have also increasingly focused on individual accountability within firms. This focus is reflected in the Senior Managers and Certification Regime (the SMCR) which came into force in 2016. The SMCR, which implements the recommendations in the final report of the Parliamentary Commission on Banking Standards relating to individual accountability in banks, imposes a regulatory approval, accountability and fitness and propriety framework in respect of senior or key individuals within relevant firms. The UK Serious Fraud Office (SFO) has played an active role in recent years in investigating and prosecuting complex fraud, bribery and corruption. If, as a result of an investigation, the SFO determines that it has sufficient evidence to support a realistic prospect of conviction, and to prosecute would be in the public interest, the SFO may bring forward a prosecution. Alternatively, the SFO may consider using a Deferred Prosecution Agreement (DPA). DPAs, which were introduced in February 2014, are judicially supervised agreements between the SFO and organisations that could be prosecuted whereby the SFO suspends prosecution while the organisation in question complies with conditions imposed on it by the DPA, such as the payment of fines. Supervision in the US Barclays Bank Group’s US activities and operations are subject to umbrella supervision by the Board of Governors of the Federal Reserve System (FRB), as well as additional supervision, requirements and restrictions imposed by other federal and state regulators and SROs. Barclays PLC, Barclays Bank PLC and their US branches and subsidiaries are subject to a comprehensive regulatory framework involving numerous statutes, rules and regulations, including the International Banking Act of 1978, the Bank Holding Company Act of 1956 (BHC Act), the USA PATRIOT Act of 2001, the Commodity Exchange Act, the federal securities laws, and the Dodd-Frank Wall Street Reform and Consumer Protection Act of 2010 (DFA), which comprehensively amended the regulation of financial institutions in the US in response to the financial crisis, including by amending the other aforementioned statutes. In some cases, US requirements may impose restrictions on Barclays Bank Group’s global activities in addition to its activities in the US. Barclays PLC and Barclays Bank PLC, along with Barclays US LLC (BUSL), Barclays Bank Group’s top-tier US holding company that holds substantially all of Barclays Bank Group’s US subsidiaries (including Barclays Capital Inc. and Barclays Bank Delaware), are regulated as bank holding companies (BHCs) by the FRB. BUSL is subject to requirements that are similar to those applicable to large US domestic bank holding companies, including in respect of capital adequacy, capital planning and stress testing (including FRB non-objection to proposed capital distributions), risk management and governance, liquidity, leverage limits and financial regulatory reporting. Barclays Bank PLC’s US branches are also subject to enhanced prudential supervision requirements relating to, among others, liquidity and risk management. Because the BHC Act generally restricts the activities of BHCs to banking and activities closely related to banking, Barclays PLC, Barclays Bank PLC and BUSL have elected to be treated as financial holding companies under the BHC Act. Financial holding company status allows these entities to engage in a variety of financial and related activities, directly or through subsidiaries, including underwriting, dealing and market making in securities. Failure to maintain financial holding company status could result in increasingly stringent penalties and ultimately, in the closure or cessation of certain operations in the US. To qualify as a financial holding company, Barclays PLC and Barclays Bank PLC, as foreign banking organisations and BHCs, and BUSL, as a BHC, must maintain certain regulatory capital ratios above minimum requirements and must be deemed to be ‘well managed’ for US bank regulatory purposes. In addition, any US depository institution subsidiaries of the foreign banking organisation or BHC must also maintain certain regulatory capital ratios above minimum requirements and be deemed to be ‘well managed’ and must have at least a ‘satisfactory’ rating under the Community Reinvestment Act of 1977. In addition to umbrella oversight by the FRB (and applicable Federal Reserve Banks), certain of Barclays Bank Group’s branches and subsidiaries are regulated by additional authorities based on the location or activities of those entities. The New York and Florida branches of Barclays Bank PLC are subject to extensive supervision and regulation by, as applicable, the New York State Department of Financial Services (NYSDFS) and the Florida Office of Financial Regulation. Barclays Bank Delaware, a Delaware chartered commercial bank, is subject to supervision and regulation by the Delaware Office of the State Bank Commissioner. The deposits of Barclays Bank Delaware are insured by the Federal Deposit Insurance Corporation (FDIC) pursuant to the Federal Deposit Insurance Act, which also provides for FDIC supervisory authority over Barclays Bank Delaware and requires that Barclays PLC, Barclays Bank PLC and BUSL act as a source of strength for the insured bank. This could, among other things, require these entities to inject capital into Barclays Bank Delaware if it fails to meet applicable regulatory capital requirements. Barclays Bank Group’s US securities broker/dealer and investment banking operations, primarily conducted through Barclays Capital Inc., are also subject to ongoing supervision and regulation by the Securities and Exchange Commission (SEC), the Financial Industry Regulatory Authority (FINRA) and other government agencies and SROs as part of a comprehensive scheme of regulation of all aspects of the securities and commodities business under US federal and state securities laws. Similarly, Barclays Bank Group’s US commodity futures, commodity options and swaps-related and client clearing operations are subject to ongoing supervision and regulation by the Commodity Futures Trading Commission (CFTC), the National Futures Association and other SROs. Barclays Bank PLC is also prudentially regulated as a swaps dealer and is subject to the FRB swaps rules with respect to margin and capital requirements. Barclays Bank Group’s US retail and consumer activities, including the US credit card operations of Barclays Bank Delaware, are subject to direct supervision and regulation by the Consumer Financial Protection Bureau (CFPB). The CFPB has the authority to examine and take enforcement action related to compliance with federal laws and regulations regarding the provision of consumer financial services and the prohibition of ‘unfair, deceptive or abusive acts and practices’. Supervision in Asia Pacific Barclays Bank Group’s operations in Asia Pacific are supervised and regulated by a broad range of national regulators including: the Japan Financial Services Agency, the Bank of Japan, the Hong Kong Monetary Authority, the Securities and Futures Commission of Hong Kong, the Monetary
home.barclays/annualreport Barclays Bank PLC Annual Report 123

Risk review Supervision and regulation Model risk management
Authority of Singapore, the Reserve Bank of India, the Securities and Exchange Board of India, the People’s Bank of China, the State Administration of Foreign Exchange of the People’s Republic of China and the China Banking and Insurance Regulatory Commission. Such supervision and regulation extends to activities conducted through branches of Barclays Bank PLC in the Asia Pacific region as well as subsidiaries of Barclays Bank Group as applicable. Global regulatory developments Regulatory change continues to affect all large financial institutions. Such change emanates from global institutions such as the G20, FSB, BCBS and IOSCO, the EU regionally, and national regulators, especially in the UK and US. The level of regulatory and supervisory uncertainty faced by Barclays Bank Group, and the financial markets more broadly, continues to remain elevated in our primary markets. In the EU, the legislative and regulatory bodies have been implementing, and continue to propose, multiple financial regulatory reforms. There remains much uncertainty regarding the state of the future relationship between the UK and the EU and therefore the potential impact of the UK's withdrawal from the EU on the financial regulatory framework in the UK. There are several possible outcomes. First, the UK could leave the EU with no deal or arrangement covering financial services in place. At the time of writing, this will happen on 29 March 2019. Under such a scenario, with no ability to passport, and no third country "equivalence"-based recognition in place, Barclays Bank Group entities in the UK would no longer be able to provide certain of their services from the UK into the EU27 in the way in which these services are currently provided. As a result of the onshoring of EU legislation in the UK, UK firms would (at least initially) be subject to substantially the same rules and regulations as before Brexit, albeit with EU entities, exposures and assets ceasing to enjoy preferential treatment under the UK’s financial regulatory framework (including for capital and liquidity purposes), given that the EU will become a third country for the purposes of such framework. The UK regulators have indicated that they will mitigate the impact of the removal of preferential treatment by providing transitional relief for a period of up to two years during which preferential treatment will continue to apply. The UK may seek to make changes to these rules going forward, particularly in the event of "no deal", where they are not subject to any requirements to maintain particular rules or standards for equivalence purposes. Secondly, the UK and EU could agree a deal. This could either take the form of a general withdrawal agreement (such as the draft Withdrawal Agreement that Parliament voted against on 15 January 2019) or could be a series of specific bilateral agreements or unilateral measures on financial services topics to facilitate continued provision of services to and from the UK. In either case, such a deal would likely permit the provision of certain services between the UK and the EU. In this scenario, firms incorporated and authorised in the UK would be able to continue to provide services into the EU27, and firms incorporated and authorised in the EU27 would be able to continue to provide services into the UK in accordance with the terms of such agreement. UK firms would again be subject to substantially the same rules and regulations as before Brexit as a result of the onshoring of EU legislation in the UK. There would likely be less scope for regulatory change in the UK as continued access to the EU27 would depend on the UK maintaining equivalence with the EU (and vice versa) and other constraints as may be agreed in such an agreement. Thirdly, the UK could decide to delay its withdrawal. This would require the unanimous consent of all other EU member states. In this scenario, UK firms would continue to be subject to EU27 law and services could continue to be provided between the UK and EU on the basis of the existing passporting arrangements until such time as the UK finally withdraws from the EU – in which case one of the two scenarios described above will apply – unless it revokes its intention to do so. Finally, the UK could decide to revoke its intention to withdraw from the EU. This would likely only happen for the purposes of holding a second referendum, if a delay is not agreed to unanimously by the EU member states. In this scenario, the status quo in relation to the financial regulatory framework would prevail until the result of that referendum was known and action taken to implement such result. In the US, the financial regulatory environment continues to evolve due to political developments and the ongoing implementation of regulations arising from the DFA and recent amendments to the DFA. Furthermore, the application of various regional rules on a cross-border basis increases regulatory complexity for global financial institutions. For more information, please see the Risk Factor entitled ‘Regulatory Change agenda and impact on Business Model’ on page 38. The programme of reform of the global regulatory framework previously agreed by the G20 Heads of Government in April 2009 has continued to be taken forward throughout 2018. The G20 continues to monitor emerging risks and vulnerabilities in the financial system and has stated that it will take action to address them if necessary. The FSB has been designated by the G20 as the body responsible for co-ordinating the delivery of the global reform programme in relation to the financial services industry. It has focused particularly on the risks posed by systemically important financial institutions. In 2011, the G20 Heads of Government adopted FSB proposals to reform the regulation of global systemically important financial institutions (G-SIFIs), including global systemically important banks (G-SIBs), such as Barclays Group. In December 2017, the BCBS finalised ‘Basel III’ (the BCBS international regulatory framework for banks), with the majority of the December 2017 changes expected to be implemented by 1 January 2022, including by regulators in many jurisdictions where Barclays Bank Group operates. Various other measures have been agreed at FSB and BCBS level on capital, including those relating to recovery and resolution planning of CCPs, the identification and management of step-in risk, and TLAC (discussed in detail below). In December 2018, the Council of the EU and the European Parliament announced they had reached a provisional political agreement on the proposed Risk Reduction Measures package, which includes the CRD V Directive and CRR II Regulation and will transpose many of the Basel III measures into EU law. Financial regulatory framework Financial services regulation can broadly be categorised as follows: (a) prudential regulation, which aims to promote safety and soundness of financial institutions and reduce risk in the financial system; (b) recovery and resolution, a key aspect of which is to ensure that G-SIFIs are capable of being resolved without recourse to taxpayer support and minimising market disruption; (c) structural reform and the Volcker rule, aimed at structurally separating certain wholesale activities (such as proprietary trading) from retail-focused activities (such as taking retail deposits); (d) market infrastructure regulation, aimed at enhancing client protection, financial stability and market integrity; and (e) conduct, culture and other regulation,
home.barclays/annualreport Barclays Bank PLC Annual Report 124

Risk review Supervision and regulation
which includes regulatory initiatives designed to pursue any other aims not falling within the previous categories (such as improving standards of conduct within financial services firms, ensuring the right culture in firms, and protecting personal data). (a) Prudential regulation Certain Basel III standards were implemented in EU law through the Capital Requirements Directive IV (CRD IV), which came into effect in 2014 and included new or enhanced requirements for the quality and quantity of capital, liquidity and leverage. Beyond the minimum standards required by CRD IV, the PRA has expected Barclays Group, in common with other major UK banks and building societies, to meet a 7% Common Equity Tier 1 (CET1) ratio at the level of the consolidated group since 1 January 2016. G-SIBs are subject to a number of additional prudential requirements, including the requirement to hold additional loss-absorbing capacity and additional capital buffers above the level required by Basel III standards. The level of the G-SIB buffer is set by the FSB according to a bank’s systemic importance and can range from 1% to 3.5% of risk-weighted assets. The G-SIB buffer must be met with common equity. In November 2018, the FSB published an update to its list of G-SIBs, maintaining the 1.5% G-SIB buffer that applies to Barclays Group. The additional G-SIB buffer was subject to phase-in arrangements, with 50% of the buffer requirement applying in 2017, 75% in 2018 and 100% in January 2019. Barclays Group is also subject to, among other buffers, a countercyclical capital buffer (CCyB) based on rates determined by the regulatory authorities in each jurisdiction in which Barclays Group maintains exposures. These rates may vary in either direction. On 27 June 2017, the FPC raised the UK CCyB rate from 0% to 0.5% with binding effect from 27 June 2018. In November 2017, the FPC raised the UK CCyB rate from 0.5% to 1% with binding effect from 28 November 2018. Final BCBS standards on securitisation have been implemented under EU law from 1 January 2019, with a one-year grandfathering period for existing transactions. Final BCBS standards on counterparty credit risk, leverage, large exposures and a Net Stable Funding Ratio (NSFR) are being implemented under EU law via the Risk Reduction Measures package. The Risk Reduction Measures package also requires certain credit institutions or investment firms established in the EU with a common parent undertaking established outside the EU to establish an intermediate parent undertaking, authorised and established in, and subject to the supervision of, an EU member state. The BCBS’s finalisation of Basel III, noted above, among other things, eliminated model-based approaches for certain categories of risk-weighted assets (RWAs), (for example, operational risk RWAs, CVA volatility and credit risk RWAs for equity exposures), revised the standardised approach’s risk weights for a variety of exposure categories, replaced the four current approaches for operational risk (including the advanced measurement approach) with a single standardised measurement approach, established 72.5% of standardised approach RWAs for exposure categories as a floor for RWAs calculated under advanced approaches (referred to as the ‘output floor’), and for G-SIBs introduced a leverage ratio buffer in an amount equal to 50% of the applicable G-SIB buffer used for RWA purposes (meaning, for Barclays Group, a leverage ratio buffer of 0.75%). The majority of the final Basel III changes are expected to be implemented commencing 1 January 2022, with a five-year phase-in period for the output floor. The new market risk framework, including rules made as a result of the ‘fundamental review of the trading book’, is also expected to be implemented from 1 January 2022 (with a potential transitional period until 1 January 2023), following a recalibration of the requirements agreed in January 2019. Precise implementation details will be confirmed once the finalised Basel III requirements are transposed into national and EU law in the jurisdictions where Barclays Bank Group operates. IFRS 9 (an accounting standard that covers accounting for financial instruments) came into force under EU law on 1 January 2018. A separate EU regulation has provided transitional arrangements for mitigating the impact of the introduction of IFRS 9, largely in relation to CET1 capital arising from the expected credit loss accounting measures set out in IFRS 9. The BCBS is continuing to assess whether permanent changes to the recognition of expected credit loss provisions in regulatory capital are necessary, as well as any corresponding changes to the risk-weighting framework. In the US, BUSL and Barclays Bank PLC’s US branches are subject to enhanced prudential supervision requirements as required by the DFA and described above in ‘Supervision in the US’. In addition to prudential regulations already promulgated under the DFA, the FRB has issued proposed regulations for NSFR implementation. The NSFR, as originally proposed by the FRB and other US regulatory agencies, would have applied to US bank holding companies with more than $250bn in total assets or $10bn or more in on-balance sheet foreign exposures, including BUSL, and consolidated depositary institution subsidiaries of such banking organisations with more than $10bn in assets, including Barclays Bank Delaware. Under the proposed rule, such entities would be required to maintain a minimum level of available stable funding that equals or exceeds the amount of required stable funding over a one-year period. In October 2018, the FRB and other US regulatory agencies released proposals to tailor the applicability of prudential requirements, including the proposed NSFR, for large domestic US banking organisations. The FRB has stated that it is working to develop a separate proposal relating to the application of prudential requirements to foreign banks, including Barclays Bank Group. Although the NSFR proposal provided for an effective date of 1 January 2018, the FRB has not finalised its NSFR proposal and the schedule for finalisation is uncertain. In June 2018, the FRB finalised rules regarding single counterparty credit limit (SCCL). The SCCL applies single counterparty credit limits to the largest US bank holding companies (BHCs) and foreign banks’ (including Barclays Bank Group) US operations. The SCCL creates two separate limits for foreign banks, the first on combined US operations (CUSO) and the second on the US intermediate holding company (BUSL). The SCCL requires that no counterparty of BUSL can exceed 25% of BUSL’s total regulatory capital plus the balance of its allowance for loan and lease losses not included in tier 2 capital. With respect to the CUSO, the SCCL rule allows foreign banks to comply with the rule by certifying to the Federal Reserve that they comply with comparable home country regulation. Stress testing Barclays Group and certain of its members are subject to supervisory stress testing exercises in a number of jurisdictions. These exercises currently include the annual stress testing programmes of the BoE and the FRB and the biennial stress testing programme of the EBA. These exercises are designed to assess the resilience of banks to adverse economic or financial developments and ensure that they have robust, forward-looking capital planning processes that account for the risks associated with their business profile. Assessment by regulators is on both a quantitative and qualitative
home.barclays/annualreport Barclays Bank PLC Annual Report 125

Risk review Supervision and regulation Model risk management
basis, the latter focusing on Barclays Group’s data provision, stress testing capability including model risk management and internal management processes and controls. Failure to meet requirements of regulatory stress tests, or the failure by regulators to approve the stress test results and capital plans of Barclays Group or its members subject to these exercises, could result in Barclays Group or certain of its members being required to enhance its capital position or limit capital distributions, to any external holders of its equity or capital or within Barclays Group. In the US, BUSL participates in the FRB’s Comprehensive Capital Analysis and Review (CCAR) process. In June 2018, the FRB issued its first public CCAR assessment of BUSL. The 2018 results indicated BUSL’s capital ratios would remain above all regulatory minimum required levels and the FRB did not object to BUSL’s capital plan on either a quantitative or qualitative basis. In April 2018, the FRB proposed to amend its CCAR process to combine the CCAR quantitative assessment and the buffer requirements in the FRB’s capital adequacy rules to create a single integrated capital requirement. (b) Recovery and Resolution Stabilisation and resolution framework An important component of the EU legislative framework is the 2014 Bank Recovery and Resolution Directive (BRRD) which establishes a framework for the recovery and resolution of EU credit institutions and investment firms. The UK implemented the BRRD through the Bank Recovery and Resolution Order 2014, which amended the Banking Act 2009 (the Banking Act) and the Financial Services and Markets Act 2000 (FSMA), and the Banks and Building Societies (Depositor Preference and Priorities) Order 2014, which amended the Insolvency Act 1986 (among other insolvency legislation). In November 2016, the European Commission proposed a package of amendments to the BRRD, including the introduction of two new moratorium tools. Political agreement on this package was reached in December 2018. On 28 December 2017, an EU directive came into force harmonising the priority ranking of unsecured debt instruments under national insolvency laws. All member states were required to transpose the directive by 29 December 2018 and it has been transposed into national law in the UK under the Banks and Building Societies (Priorities on Insolvency) Order 2018. Under the Banking Act, UK resolution authorities are empowered to intervene in and resolve a UK financial institution that is no longer viable. Pursuant to these laws, the BoE (in consultation with the PRA and HM Treasury as appropriate) has several stabilisation options where a banking institution is failing or likely to fail: (i) transfer some or all of the securities or business of the bank to a commercial purchaser; (ii) transfer some or all of the property, rights and liabilities of the bank to a ‘bridge bank’ wholly owned by the BoE or to a commercial purchaser; (iii) transfer the impaired or problem assets to an asset management vehicle to allow them to be managed over time; (iv) cancel or reduce certain liabilities of the institution or convert liabilities to equity to absorb losses and recapitalise the institution; and (v) transfer the banking institution into temporary public ownership. In addition, the BoE may apply for a court insolvency order in order to wind up or liquidate the institution or to put the institution into special administration. When exercising any of its stabilisation powers, the BoE must generally provide that shareholders bear first losses, followed by creditors in accordance with the priority of their claims under normal insolvency proceedings. In order to enable the exercise of its stabilisation powers, the BoE may impose a temporary stay on the rights of creditors to terminate, accelerate or close out contracts, and in some cases to override events of default or termination rights that might otherwise be invoked as a result of a resolution action. In addition, the Banking Act gives the BoE the power to override, vary, or impose conditions or contractual obligations between a UK bank, its holding company and its group undertakings, in order to enable any transferee or successor bank to operate effectively after any of the resolution tools have been applied. There is also power for HM Treasury to amend the law (excluding provisions made by or under the Banking Act) for the purpose of enabling it to use its powers under this regime effectively, potentially with retrospective effect. The Banking Act powers apply regardless of any contractual restrictions and compensation that may be payable. The BoE’s preferred approach for the resolution of Barclays Group is a bail-in strategy with a single point of entry at Barclays PLC. Under such a strategy, Barclays PLC’s subsidiaries would remain operational while Barclays PLC’s eligible liabilities would be written down or converted to equity in order to recapitalise Barclays Group and allow for the continued provision of services and operations throughout the resolution. In July 2016, the PRA issued final rules on ensuring operational continuity in resolution. The rules apply from 1 January 2019 and require banks to ensure that their operational structures facilitate effective recovery and resolution planning and the continued provision of functions critical to the economy in a resolution scenario. In June 2018 the BoE finalised its policy on Minimum Requirement for own funds and Eligible Liabilities (MREL) for UK banks and published indicative MREL levels for UK G-SIBs and D-SIBs, including Barclays Group, to be reached in 2019, 2020 and 2022 (see section on TLAC/ MREL below). Additionally, the BoE finalised its policy on Valuations in Resolution in June 2018 with an expected compliance timeline of 1 January 2021. The PRA has made rules that require authorised firms to draw up recovery plans and resolution packs, as required by the BRRD. Recovery plans are designed to outline credible actions that authorised firms could implement in the event of severe stress in order to restore their business to a stable and sustainable condition. The resolution pack contains detailed information on the group, and its significant legal entities (including, in the case of Barclays Group, material subsidiaries within Barclays Bank Group) which will be used to develop resolution strategies for that firm, assess its current level of resolvability against the strategy, and to inform work on identifying barriers to the implementation of operational resolution plans. In the UK, recovery and resolution planning (RRP) work is considered part of continuing supervision. Removal of potential impediments to an orderly resolution of Barclays Group or one or more of its subsidiaries is considered as part of the BoE’s and PRA’s supervisory strategy for each firm, and the PRA can require firms to make significant changes in order to enhance resolvability. Barclays Group currently provides the PRA with a recovery plan annually and with a resolution pack as requested. In December 2018, the BoE and PRA released a package of consultations setting out how they propose to increase transparency and accountability and clarify the responsibilities on firms with regards to resolution. The package comprises three main components: (i) a BoE Consultation Paper (CP) which proposes how the BoE, as resolution authority, intends to assess individual banks' resolvability; (ii) a PRA CP which contains proposed
home.barclays/annualreport Barclays Bank PLC Annual Report 126

Risk review Supervision and regulation
requirements for banks to assess their preparations for resolution, identifying any risks to implementation and their plans to address these; (iii) proposals for future public disclosures. The final policy will apply to Barclays Group when published. While regulators in many jurisdictions have indicated a preference for single point of entry resolution, additional resolution or bankruptcy provisions may apply to certain of Barclays Bank PLC’s subsidiaries or branches. In the US, Title II of the DFA established the Orderly Liquidation Authority, a regime for the orderly liquidation of systemically important financial institutions, which could apply to BUSL. Specifically, when a systemically important financial institution is in default or in danger of default, the FDIC may be appointed as receiver under the Orderly Liquidation Authority instead of the institution being resolved through a voluntary or involuntary proceeding under the US Bankruptcy Code. In certain circumstances, including insolvency, violations of law and unsafe business practices, the licensing authorities of each US branch of Barclays Bank PLC and of Barclays Bank Delaware have the authority to take possession of the business and property of the applicable Barclays Bank Group entity they license or to revoke or suspend such licence. Specific resolution regimes may apply to certain Barclays Bank Group entities or branches in other jurisdictions in which Barclays Bank Group does business. In the US, Title I of the DFA and the implementing regulations issued by the FRB and the FDIC require each bank holding company with assets of $50bn or more, including those within Barclays Group, to prepare and submit a plan for the orderly resolution of subsidiaries and operations in the event of future material financial distress or failure. Barclays Group submitted its US Resolution Plan in respect of its US operations on 1 July 2018. Barclays Group’s next submission of the US Resolution Plan in respect of its US operations will be due on 1 July 2020. Barclays Group's 2018 US Resolution Plan in respect of its US operations included two strategies. The first is the global preferred resolution strategy, which is the BoE's preferred resolution strategy of single point of entry with bail-in at Barclays PLC. The 2018 US Resolution Plan also included a US-specific resolution strategy, which would involve a single-point-of-entry resolution of Barclays Group's US operations with only BUSL entering bankruptcy or insolvency proceedings. The US-specific resolution strategy is intended as an additional option in case the global preferred resolution strategy is not successful. In Ireland, as a result of the transfer of Barclays Bank Group’s European businesses to Barclays Bank Ireland PLC, that entity has been designated by the ECB as a significant institution coming under the direct supervision of the ECB for prudential supervisory purposes. As a significant institution, Barclays Bank Ireland PLC now faces the Single Resolution Board (SRB) as the Eurozone resolution authority. The ECB has required Barclays Bank Ireland PLC to submit a standalone BRRD compliant recovery plan on an annual basis. The SRB has the power to require data submissions specific to Barclays Bank Ireland PLC under powers conferred upon it by the BRRD and the Single Resolution Mechanism Regulation (SRMR). The SRB will exercise these powers to determine the optimal resolution strategy for Barclays Bank Ireland PLC in the context of the BoE’s preferred resolution strategy of single point of entry with bail-in at Barclays PLC. The SRB also has the power under the BRRD and the SRMR to develop a resolution plan for Barclays Bank Ireland PLC. TLAC and MREL The BRRD requires competent authorities to impose a Minimum Requirement for own funds and Eligible Liabilities (MREL) on financial institutions to facilitate their orderly resolution without broader financial disruption or recourse to public funds. In November 2015, the FSB finalised its proposals to enhance the loss-absorbing capacity of G-SIBs to ensure that there is sufficient loss-absorbing and recapitalisation capacity available in resolution to implement an orderly resolution which minimises the impact on financial stability, ensures the continuity of critical functions and avoids exposing taxpayers to losses. To this end, the FSB has set a new minimum requirement for ‘total loss-absorbing capacity’ (TLAC). As the TLAC standard requires a certain amount of those loss-absorbing resources to be committed to subsidiaries or sub-groups that are located in host jurisdictions and deemed material for the resolution of the G-SIB as a whole, the FSB published guiding principles on internal TLAC on 6 July 2017. These provide guidance on the size and composition of the internal TLAC requirement, cooperation and co-ordination between home and host authorities and the trigger mechanism for internal TLAC. The EU is implementing the TLAC standard (including internal TLAC) via the MREL requirement and the relevant amendments are contained in the Risk Reduction Measures package. Under the BoE’s statement of policy on MREL, the BoE will set MREL for UK G-SIBs as necessary to implement the TLAC standard and institution or group-specific MREL requirements will depend on the preferred resolution strategy for that institution or group. Internal MREL for operating subsidiaries will be scaled within a 75-90% range of the external requirement that would apply to the subsidiary if it were a resolution entity. The starting point for the scalar will be 90% for ring-fenced bank sub-groups. The MREL requirements are being phased in as from 1 January 2019 and will be fully implemented by 1 January 2022, at which time G-SIBs with resolution entities incorporated in the UK, including Barclays Group, will be required to meet an MREL equivalent to the higher of: (i) two times the sum of its Pillar 1 and Pillar 2A requirements; or (ii) the higher of two times its leverage ratio or 6.75% of leverage exposures. However, the PRA plans to review the MREL calibration by the end of 2020, including assessing the proposal for Pillar 2A recapitalisation which may drive a different 1 January 2022 MREL requirement than currently proposed. In June 2018, the BoE published indicative MREL levels for UK G-SIBs, including Barclays Group, to be reached in 2020 and 2022. Barclays Bank Ireland PLC is subject to the SRB’s MREL policy, as issued in January 2019, in respect of the internal MREL that it will be required to issue to Barclays Bank Group. The SRB’s MREL policy will be revised in the near future to reflect the implementation of the Risk Reduction Measures package in the EU. The SRB’s current calibration of MREL is two times the sum of: (i) the firm’s Pillar 1 requirement; (ii) its Pillar 2 requirement; and (iii) its combined buffer requirement, minus 125 basis points. The SRB’s policy does not envisage the application of any scalar in respect of the internal MREL requirement. In October 2016, the BCBS published its final standard on the prudential treatment of banks’ investments in TLAC instruments issued by other institutions, confirming that internationally active banks (both G-SIBs and non-G-SIBs) must deduct their holdings of TLAC instruments that do not otherwise qualify as regulatory capital from their own Tier 2 capital. Where the investing bank owns less than 10% of the issuing bank’s common
home.barclays/annualreport Barclays Bank PLC Annual Report 127

Risk review Supervision and regulation Model risk management
shares, TLAC holdings are to be deducted from Tier 2 capital only to the extent that they exceed 10% of the investing bank’s common equity (or 5% for non-regulatory capital TLAC holdings). Below this threshold, holdings would instead be subjected to risk-weighting. G-SIBs may only apply risk-weighting to non-regulatory capital TLAC holdings by the 5% threshold where those holdings are in the trading book and are sold within 30 business days. The EU’s Risk Reduction Measures package requires firms to deduct external MREL holdings from equivalent MREL capital of the firm. In December 2016, the FRB issued final regulations for TLAC, which apply to BUSL commencing 1 January 2019. The FRB’s final TLAC rule, while generally following the FSB term sheet, contains a number of provisions that are more restrictive. For example, the FRB’s TLAC rule includes provisions that require BUSL (the Barclays IHC) to have: (i) a specified outstanding amount of eligible long-term debt; (ii) a specified outstanding amount of TLAC (consisting of common and preferred equity regulatory capital plus eligible long-term debt); and (iii) a specified common equity buffer. In addition, the FRB’s TLAC rule would prohibit BUSL, for so long as Barclays Group’s overall resolution plan treats BUSL as a non-resolution entity, from issuing TLAC to entities other than Barclays Group and its non-US subsidiaries. Bank Levy and FSCS The BRRD requires EU member states to establish a pre-funded resolution financing arrangement with funding equal to 1% of covered deposits by 31 December 2024 to cover the costs of bank resolutions. Where the amount of such pre-funding is insufficient, the BRRD requires that EU member states raise subsequent contributions. The UK government raises both pre-funded and subsequent contributions that would be required were the pre-funded contributions not to cover costs or other expenses incurred by use of the resolution funds by way of a tax on the balance sheets of banks known as the ‘Bank Levy’. In addition, the UK has a statutory compensation fund called the Financial Services Compensation Scheme (FSCS), which is funded by way of annual levies on most financial services firms authorised under FSMA. The levies consist of a management expenses levy (which funds the costs of running the FSCS) and a compensation costs levy (which funds the costs incurred by the FSCS in paying compensation). Similar requirements, which include powers for competent authorities to adopt resolution measures, are in force or expected to come into force imminently in various other jurisdictions. These requirements will affect Barclays Bank Group to the extent it has operations in a relevant jurisdiction. (c) Structural reform Recent developments in banking law and regulation in the UK have included legislation designed to ring-fence the retail and smaller deposit-taking businesses of large banks. The Financial Services (Banking Reform) Act 2013 put in place a framework for this ring-fencing and secondary legislation passed in 2014 elaborated on the operation and application of the ring-fence. Ring-fencing requires, among other things, the separation of the retail and smaller deposit-taking business activities of UK banks in the UK and branches of UK banks in the European Economic Area (EEA) into a legally distinct, operationally separate and economically independent entity, which is not permitted to undertake a range of activities. Ring-fencing rules have been published by the PRA, further determining how ring-fenced banks will be permitted to operate. Further rules published by the FCA set out the disclosures that non-ring-fenced banks are required to make to prospective account holders of non-ring-fenced banks who are individuals. In the EU, following the publishing of the Liikanen Report in October 2012, the European Commission adopted a legislative proposal for a regulation on structural measures to improve the resilience of EU banks in January 2014. The reforms included ring-fencing of retail activities from risky trading activities and a ban on proprietary trading for certain banks. However, the legislative proposal was formally withdrawn in July 2018 as a result of the European Parliament and the Council of the EU failing to reach a political agreement. US regulation places further substantive limits on the activities that may be conducted by banks and holding companies, including foreign banking organisations such as Barclays Group. The ‘Volcker Rule’, which was part of the DFA and which came into effect in the US in 2015, prohibits banking entities from undertaking certain proprietary trading activities and limits such entities’ ability to sponsor or invest in certain private equity funds and hedge funds (in each case broadly defined). As required by the rule, Barclays Group has developed and implemented an extensive compliance and monitoring programme addressing proprietary trading and covered fund activities (both inside and outside of the US). Proposed amendments to the Volcker Rule were published in the Federal Register in July 2018. The existing Volcker framework and implemented processes will remain unchanged until amendments to the regulations become effective. We do not expect any changes to the Volcker rule to be effective prior to Q4 2019. (d) Market infrastructure regulation In recent years, regulators as well as global-standard setting bodies such as IOSCO have focused on improving transparency and reducing risk in markets, particularly risks related to over-the-counter (OTC) transactions. This focus has resulted in a variety of new regulations across the G20 countries and beyond that require or encourage on-venue trading, clearing, posting of margin and disclosure of information related to many derivatives transactions. Some of the most significant developments are described below. The European Market Infrastructure Regulation (EMIR) has introduced requirements designed to improve transparency and reduce the risks associated with the derivatives market, some of which are still to be fully implemented. EMIR requires that certain entities that enter into derivative contracts: report such transactions; clear certain over the counter (OTC) transactions where mandated to do so; and implement risk mitigation standards in respect of uncleared OTC trades. The obligation to clear derivatives only applies to certain counterparties and specified types of derivatives. In October 2016, the European Commission adopted a delegated regulation relating to the exchange of collateral, one of the risk mitigation techniques under EMIR. Provisions relating to initial margin have entered into force, subject to a phase-in until 1 September 2020. Provisions relating to variation margin have already entered into force. EMIR has potential operational and financial impacts on Barclays Bank Group, including by imposing collateral requirements. The European Commission has recently proposed two sets of changes to EMIR, one containing technical changes to EMIR, and another measure which could result in certain central counterparties (CCPs) used by Barclays Bank Group being forced to relocate to an EU jurisdiction in order to continue clearing for EU members. The changes proposed may have additional operational and financial impacts on Barclays Bank Group’s derivatives business.
home.barclays/annualreport Barclays Bank PLC Annual Report 128

Risk review Supervision and regulation
CRD IV aims to complement EMIR by applying higher capital requirements for bilateral, uncleared OTC derivative trades. Lower capital requirements for cleared derivative trades are only available if the CCP through which the trade is cleared is recognised as a ‘qualifying central counterparty’ (QCCP) which has been authorised or recognised under EMIR. Higher capital requirements may apply to Barclays Bank Group following the UK’s departure from the EU if UK CCPs are then no longer regarded as QCCPs and vice versa. The Markets in Financial Instruments Directive and Markets in Financial Instruments Regulation (collectively referred to as MiFID II) have largely been applicable since 3 January 2018. MiFID II affects many of the investment markets in which Barclays Bank Group operates, the instruments in which it trades and the way it transacts with market counterparties and other customers. Changes introduced by MiFID II include: the introduction of a new type of trading venue (the organised trading facility), capturing non-equity trading that falls outside the MiFID I regime; the strengthening of conduct of business requirements, including in relation to conflicts of interest; the expansion of the concept of, and requirements applicable to, firms which systematically trade against proprietary capital (systematic internalisers); and increased obligations on firms to secure best execution for their clients. Additionally, MiFID II mandates a trading obligation for certain types of cleared derivatives. MiFID II strengthens investor protections, imposes new curbs on high frequency and commodity trading, increases pre- and post-trade transparency reporting and introduces a new regime for third country (non-EU) firms. MiFID II also includes new requirements relating to non-discriminatory access to trading venues, CCPs and benchmarks, research unbundling and harmonised supervisory powers and sanctions across the EU. US regulators have imposed similar rules as the EU with respect to the mandatory on-venue trading and clearing of certain derivatives, and post-trade transparency, as well as in relation to the margining of OTC derivatives. US regulators have addressed the applicability of certain of their regulations to cross-border transactions, and are continuing to review and consider their rules with respect to their application on a cross-border basis, including with respect to their registration requirements in relation to non-US swap dealers and security-based swap dealers. The regulators may adopt further rules, or provide further guidance, regarding the cross-border applicability of such rules. In December 2017, the CFTC and the European Commission recognised the trading venues of each other’s jurisdiction to allow market participants to comply with mandatory on-venue trading requirements while trading on certain venues recognised by the other jurisdiction. The EU Benchmarks Regulation came into force in June 2016. Although some provisions have applied since 2016, the majority of provisions have applied since 3 January 2018, subject to transitional provisions. This regulation applies to the administration, contribution of data to and use of benchmarks within the EU. Financial institutions within the EU will be prohibited from using benchmarks unless their administrators are authorised, registered or otherwise recognised in the EU. This may impact the ability of Barclays Bank Group to use certain benchmarks in the future. For example, EURIBOR will, as currently stands, no longer be compliant with the Benchmarks Regulation on 1 January 2020, and the FCA has stated that it does not intend to support LIBOR after the end of 2021. International initiatives are therefore underway to develop alternative benchmarks and backstop arrangements. However, adapting processes and systems to transition to these new benchmarks is likely to be a very time-consuming and costly task on an industry-wide basis. In 2015, the European Commission launched work on establishing a Capital Markets Union (CMU) within the EU. The CMU aims to increase the availability of non-bank financing in the EU, deepen the EU single market for financial services and promote growth and financial stability. The CMU work programme is now being considered in light of Brexit. Recent proposals have therefore included considerably broadened central supervisory powers for the European Supervisory Authorities (ESAs) (including in relation to outsourcing, and delegation and risk transfer by entities authorised in the EU to entities or branches in third countries) and an increased focus by the ESAs on ongoing equivalence assessments in the context of third country regimes in various EU regulations and directives. Certain participants in US swap markets are required to register with the CFTC as ‘swap dealers’ or ‘major swap participants’ and/or, following the compliance date for relevant SEC rules, with the SEC as ‘security-based swap dealers’ or ‘major security-based swap participants’. Such registrants are subject to CFTC, and would be subject to SEC, regulation and oversight. Entities required to register as swap dealers are subject to business conduct, recordkeeping and reporting requirements under CFTC rules and will be subject to capital and margin requirements in connection with transactions with certain US and non-US counterparties. Barclays Bank PLC has provisionally registered with the CFTC as a swap dealer and is subject to CFTC rules on business conduct, record-keeping and reporting. With respect to margin and capital, Barclays Bank Group is subject to the rules of the FRB in connection with its swap dealer business. The CFTC has approved certain comparability determinations that permit substituted compliance with non-US regulatory regimes for certain swap regulations related to business conduct and other requirements, while other determinations remain pending. Substituted compliance is permitted, where applicable, only with respect to transactions between a non-US swap dealer and a non-US counterparty. In addition, the CFTC has issued proposed rules that would require a non-US swap dealer to comply with certain CFTC rules in connection with transactions that are “arranged, negotiated or executed” from the US. It is unclear whether the proposed rules will be adopted in the form proposed. Most recently, in October 2017, the CFTC issued an order permitting substituted compliance with EU margin rules for certain uncleared derivatives. However, as Barclays Bank Group is subject to the margin rules of the FRB, it will not benefit from the CFTC’s action unless the FRB takes a similar approach. It is unclear whether further changes will be made to the CFTC’s proposed rules or when they will become effective. In addition, it is uncertain whether and to what degree other US regulators, such as the FRB, will take an approach similar to the CFTC’s regarding substituted compliance. The SEC finalised the rules governing security based swap dealer registration in 2015 but clarified that registration timing is contingent upon the finalisation of certain additional rules under Title VII of DFA, several of which are still pending. In particular, the SEC has stated that registration will be required at the later of the SEC’s adoption of final rules on capital and margin, or the compliance dates for the SEC’s rules on recordkeeping and reporting, business conduct or employment of statutorily disqualified persons. Therefore, there is currently no specific timetable for the effectiveness of the security-based swap dealer registration requirement. However, the SEC has recently proposed additional rules, and republished prior proposed
home.barclays/annualreport Barclays Bank PLC Annual Report 129

Risk review Supervision and regulation Model risk management
rules, regarding security-based swap dealers, and has indicated that it may take the actions that will trigger the registration requirement in the near future. When security-based swap dealer registration is required, it is anticipated that Barclays Bank PLC and/or one or more of its affiliates will be required to register in that capacity and thus will be required to comply with the SEC’s rules for security-based swap dealers. These rules may impose costs and other requirements or restrictions that could impact our business. In addition, the SEC has provided some limited guidance regarding certain aspects of the cross-border applicability of its security-based swaps rules, including a final rule addressing transactions of a non-US person arranged, negotiated, or executed by personnel located in a US branch or office. However, it remains unclear as to how or when substituted compliance may be available, and which of the SEC’s rules will be eligible. (e) Conduct, culture and other regulation Conduct and culture On 7 March 2016, the PRA and FCA introduced measures to increase the individual accountability of senior managers and other covered individuals in the banking sector. The new regime comprises: the ‘Senior Managers Regime’, which applies to a limited number of individuals with senior management responsibilities within a firm; the ‘Certification Regime’, which is intended to assess and monitor the fitness and propriety of a wider range of employees who could pose a risk of significant harm to the firm or its customers; and conduct rules that individuals subject to either regime must comply with. From March 2017, the conduct rules have applied more widely to other staff of firms within the scope of the regime. The regime will be expanded to apply to all firms authorised under FSMA from 9 December 2019. The Financial Services Act 2010, among other things, requires the UK regulators to make rules about remuneration and to require regulated firms to have a remuneration policy that is consistent with effective risk management. The Banking Act also amended FSMA to allow the FCA to make rules requiring firms to operate a collective consumer redress scheme to deal with cases of widespread failure by regulated firms to meet regulatory requirements that may have created consumer detriment. Our regulators have also enhanced their focus on the promotion of cultural values as a key area for banks, although they generally view the responsibility for reforming culture as primarily sitting with the industry. Data protection and PSD2 Most countries in which Barclays Bank Group has a presence already have privacy laws governing the collection, use and disclosure of personal data, or are considering their introduction. The harmonisation of the European privacy regime through the introduction of the General Data Protection Regulation (GDPR) was a major focus in 2018. However, new laws have also recently been introduced in California, the Cayman Islands, and Brazil, and existing laws in Japan, Guernsey, Jersey and the Isle of Man have been updated. The global nature of our business and IT infrastructure means personal information may be made available or stored in countries other than where it was originally collected. The proper handling and protection of personal data is very important to our clients, employees and to regulators, and there can be considerable regulatory fines for breaches (for example, up to 4% of global turnover under GDPR). A number of recent developments have indicated a clear political and regulatory desire to make customer account information and transactional services more easily accessible to customers and parties providing services to them, such as the revised Payment Services Directive (PSD2). PSD2 replaced the previous Payment Services Directive and, with respect to certain requirements, has a wider scope, applying transparency and information requirements to payment transactions in all currencies where the provider of at least one leg of the payment service is located in the EU. PSD2 also requires banks which provide accounts to enable access to those accounts through dedicated technology to allow third parties to provide account information and payment initiation services. The requirements relating to this technology will come into effect in September 2019. Cyber security and operational resilience Regulators in Europe and the US have been increasingly focused on cyber security risk management and operational resilience for banking organisations. This has resulted in a number of proposed laws, regulations and other requirements that necessitate the implementation of a variety of increased controls and enhancement activities for regulated Barclays Bank Group entities. These include, among others, the adoption of cyber security policies and procedures meeting specified criteria, minimum required security measures, controls and procedures for enhanced reporting and public disclosures, compliance certification requirements, and other cyber and information risk governance measures. These increased controls will enhance our security posture and increase our ability to protect the organisation and our customers. Such measures may result in increased technology and compliance costs for Barclays Bank Group. Sanctions and financial crime The UK Bribery Act 2010 introduced a new form of corporate criminal liability focused broadly on a company’s failure to prevent bribery on its behalf. The legislation has broad application and in certain circumstances may have extra-territorial impact on entities, persons or activities located outside the UK, including Barclays PLC and its subsidiaries. In practice, the legislation requires Barclays Bank Group to have adequate procedures to prevent bribery which, due to the extra-territorial nature of the status, makes this both complex and costly. On 30 September 2017, the Criminal Finances Act 2017 introduced new corporate criminal offences of failing to prevent the facilitation of UK and overseas tax evasion. The legislation has very broad extra-territorial application and may impact entities, persons or activities located outside the UK, including Barclays PLC and its subsidiaries. It also requires Barclays Bank Group to have reasonable prevention procedures in place to prevent the criminal facilitation of tax evasion by persons acting for, or on behalf of, Barclays Bank Group. In the US, the Bank Secrecy Act, the USA PATRIOT Act 2001 and regulations thereunder contain numerous anti-money laundering and anti-terrorist financing requirements for financial institutions. In addition, Barclays Bank Group is subject to the US Foreign Corrupt Practices Act, which prohibits certain payments to foreign officials, as well as rules and regulations relating to economic sanctions and embargo programs administered by the US Office of Foreign Assets Control which restrict certain business activities with certain individuals, entities, groups, countries and territories.
home.barclays/annualreport Barclays Bank PLC Annual Report 130

Risk review Supervision and regulation
Two significant new regulatory rules came into force in the US in 2018: the New York Department of Financial Services (DFS) Rule 504 and the US Department of Treasury’s Financial Crime Enforcement Network (FinCEN) Customer Due Diligence (CDD) Rule. Rule 504 enumerates detailed transaction filtering and screening requirements for potential Bank Secrecy Act and anti-money laundering violations and transactions with sanctioned entities, applicable to institutions regulated by the DFS (including Barclays Bank PLC, New York branch) and requires a senior bank official to certify compliance. The CDD Rule requires Barclays Bank Group US entities to identify natural beneficial owners above a certain threshold for clients that are legal entities. In some cases, US state and federal regulations addressing sanctions, money laundering and other financial crimes may impact entities, persons or activities located outside the US, including Barclays PLC and its subsidiaries. The enforcement of these regulations has been a major focus of US state and federal government policy relating to financial institutions in recent years, and failure of a financial institution to ensure compliance could have serious legal, financial and reputational consequences for the institution.
home.barclays/annualreport Barclays Bank PLC Annual Report 131

Financial statements Contents Credit risk management
Detailed analysis of our statutory accounts, independently audited and providing in-depth disclosure on the financial performance of Barclays Bank Group.
Page Note
Consolidated financial statements Independent Auditor’s Report 133 n/a Consolidated income statement 145 n/a Consolidated statement of comprehensive income 146 n/a Consolidated balance sheet 147 n/a Consolidated statement of changes in equity 148 n/a Consolidated cash flow statement 150 n/a Parent company accounts 152 n/a
Notes to the financial statements
Significant accounting policies Disposal of business and transfer of ownership of subsidiary Discontinued operations and assets included in disposal groups classified
as held for sale and associated liabilities
157161164
123
Performance/return Segmental reporting 168 4 Net interest income 170 5 Net fee and commission income 171 6 Net trading income 172 7 Net investment income 173 8 Credit impairment charges and other provisions 173 9 Operating expenses 178 10 Tax 178 11 Dividends on ordinary shares 184 12
Assets and liabilities held at fair value Trading portfolio 185 13 Financial assets at fair value through the income statement 185 14 Derivative financial instruments 186 15
Financial assets at fair value through other comprehensive income and Financial Investments
197 16
Financial liabilities designated at fair value 198 17 Fair value of financial instruments 199 18 Offsetting financial assets and financial liabilities 216 19
Financial instruments held at Loans and advances and deposits at amortised cost 218 20amortised cost Finance leases 220 21
Non-current assets and other Property, plant and equipment 221 22investments Goodwill and intangible assets 223 23
Operating leases 226 24
Accruals, provisions, contingent Other liabilities 227 25liabilities and legal proceedings Provisions 227 26
Contingent liabilities and commitments 229 27 Legal, competition and regulatory matters 229 28
Capital instruments, equity and Subordinated liabilities 237 29reserves Ordinary shares, share premium and other equity 241 30
Reserves 244 31 Non-controlling interests 245 32
Employee benefits Staff costs 246 33
Share-based payments 246 34
Pensions and post-retirement benefits 249 35
Scope of consolidation Principal subsidiaries 255 36 Structured entities 256 37 Investments in associates and joint ventures 259 38 Securitisations 260 39 Assets pledged 262 40
Other disclosure matters Related party transactions and Directors’ remuneration 263 41 Auditors’ remuneration 266 42
Transition disclosures Related undertakings
267281
4344
home.barclays/annualreport Barclays Bank PLC Annual Report 132

Independent Auditor’s report Independent Auditor’s report to the members of Barclays Bank PLC Credit risk management
Our opinion is unmodified We have audited the financial statements of Barclays Bank PLC (“the Company”) for the year ended 31 December 2018 which comprise the consolidated and parent company balance sheets as at 31 December 2018 and the consolidated income statement and statement of comprehensive income, the consolidated and parent company cash flow statements and statements of changes in equity for the year then ended, and the related notes, including the accounting policies in note 1. In our opinion: the financial statements give a true and fair view of the state of the group’s and of the parent company’s affairs as at 31 December 2018 and of
the group’s profit for the year then ended; the group financial statements have been properly prepared in accordance with International Financial Reporting Standards as adopted by the
European Union (IFRSs as adopted by the EU); the parent Company financial statements have been properly prepared in accordance with IFRSs as adopted by the EU and as applied in
accordance with the provisions of the Companies Act 2006; and the financial statements have been prepared in accordance with the requirements of the Companies Act 2006 and, as regards the Group financial
statements, Article 4 of the IAS Regulation.
Basis for opinion We conducted our audit in accordance with International Standards on Auditing (UK) (“ISAs (UK)”) and applicable law. Our responsibilities are described below. We believe that the audit evidence we have obtained is a sufficient and appropriate basis for our opinion. Our audit opinion is consistent with our report to the Board Audit Committee. We were first appointed as auditor by the directors on 31 March 2017. The period of total uninterrupted engagement is for the 2 financial years ended 31 December 2018. We have fulfilled our ethical responsibilities under, and we remain independent of the group in accordance with, UK ethical requirements including the FRC Ethical Standard as applied to listed public interest entities. No non-audit services prohibited by that standard were provided. Key audit matters: our assessment of risks of material misstatement Key audit matters are those matters that, in our professional judgment, were of most significance in the audit of the financial statements and include the most significant assessed risks of material misstatement (whether or not due to fraud) identified by us, including those which had the greatest effect on: the overall audit strategy; the allocation of resources in the audit; and directing the efforts of the engagement team. We summarise below the key audit matters, in arriving at our audit opinion above, together with our key audit procedures to address those matters and, as required for public interest entities, our results from those procedures. These matters were addressed, and our results are based on procedures undertaken, in the context of, and solely for the purpose of, our audit of the financial statements as a whole, and in forming our opinion thereon, and consequently are incidental to that opinion, and we do not provide a separate opinion on these matters.
home.barclays/annualreport Barclays Bank PLC Annual Report 133

Independent Auditor’s report Independent Auditor’s report to the members of Barclays Bank PLC Credit risk management
Key audit matter How our audit addressed the key audit matter
The impact of uncertainties due to Britain exiting the European Union on our audit Reference to Risk review page 37
Unprecedented levels of uncertainty
All audits assess and challenge the reasonableness of estimates, in particular as described in impairment of loans and advances to customers below and related disclosures and the appropriateness of the going concern basis of preparation of the financial statements (see below). All of these depend on assessments of the future economic environment and the group’s future prospects and performance. In addition, we are required to consider the directors’ statement that the annual report and financial statements taken as a whole is fair, balanced and understandable and provides the information necessary to assess the group’s and parent’s position and performance, business model and strategy. Brexit is one of the most significant economic events for the UK and at the date of this report its effects are subject to unprecedented levels of uncertainty of outcomes, with the full range of possible effects unknown..
We developed a standardised firm-wide approach to the consideration of the uncertainties arising from Brexit in planning and performing our audits. Our procedures included:
Our Brexit knowledge: We considered the directors’ assessment of Brexit-related sources of risk for the group’s and parent’s business and financial resources compared with our own understanding of the risks. We considered the directors’ plans to take action to mitigate the risks.
Sensitivity analysis: When addressing impairment of loans and advances to customers and other areas that depend on forecasts, we compared the directors’ analysis to our assessment of the full range of reasonably possible scenarios resulting from Brexit uncertainty and, where forecast cash flows are required to be discounted at a rate other than the original effective interest rate, considered adjustments to discount rates for the level of remaining uncertainty.
Assessing transparency: As well as assessing individual disclosures as part of our procedures on impairment of loans and advances to customers, we considered all of the Brexit related disclosures together, including those in the strategic report, comparing the overall picture against our understanding of the risks.
Our results:
As reported under impairment of loans and advances to customers, we found the resulting estimates and related disclosures of impairment of loans and advances to customers and disclosures in relation to going concern to be acceptable. However, no audit should be expected to predict the unknowable factors or all possible future implications for a company and this is particularly the case in relation to Brexit.
home.barclays/annualreport Barclays Bank PLC Annual Report 134

Independent Auditor’s report Independent Auditor’s report to the members of Barclays Bank PLC Credit risk management
Key audit matter How our audit addressed the key audit matter Impairment allowances on loans and advances at amortised cost including off-balance sheet elements of the allowance Refer to accounting policy page 173 (accounting policy on accounting for the impairment of financial assets under IFRS 9), page 60 (credit risk disclosures), and page 174 (financial disclosures note 9 Credit Impairment charges and other provisions)
Subjective estimate IFRS 9 was implemented by the group and parent on 1 January 2018. This new and complex standard requires the group and parent to recognise expected credit losses (“ECL”) on financial instruments which involves significant judgement and estimates and resulted in an increase in credit loss provisions from £4.7 billion as at 31 December 2017 under IAS 39 to £7.1 billion as at 1 January 2018 under IFRS 9. During 2018 there was a reduction in provisions of £2.9 billion due to the disposal of business to Barclays Bank UK PLC and as at 31 December 2018 the credit loss provision was £3.8 billion. The key areas where we identified greater levels of management judgement and therefore increased levels of audit focus in the group’s and parent’s implementation of IFRS 9 are:
Economic scenarios – IFRS 9 requires the group and parent to measure ECLs on a forward-looking basis reflecting a range of future economic conditions. Significant management judgment is applied to determining the economic scenarios used and the probability weightings applied to them especially for the credit card and corporate portfolios.
Significant Increase in Credit Risk (“SICR”) – For the credit card and corporate portfolios the criteria selected to identify a significant increase in credit risk is a key area of judgement within the group’s and parent’s ECL calculation as these criteria determine whether a 12 month or lifetime provision is recorded.
Model estimations – Inherently judgemental modelling is used to estimate ECLs which involves determining Probabilities of Default (“PD”), Loss Given Default (“LGD”), and Exposures at Default (“EAD”). The PD models used in the credit card and corporate portfolios are the key drivers of the group’s and parent’s ECL results and are therefore the most significant judgemental aspect of the group’s and parent’s ECL modelling approach
Qualitative adjustments – Adjustments to the model-driven ECL results are raised by management to address known impairment model limitations or emerging trends. They represent 1% net of the ECL. Such adjustments are inherently uncertain and significant management judgement is involved in estimating these amounts especially in relation to the credit card and corporate portfolios.
The effect of these matters is that, as part of our risk assessment, we determined that the impairment of loans and advances to customers has a high degree of estimation uncertainty, with a potential range of reasonable outcomes greater than our materiality for the financial statements as a whole, and possibly many times that amount. The credit risk sections of the financial statements disclose the sensitivities estimated by the Group. Disclosure quality The disclosures regarding the group’s and parent’s application of IFRS 9 are key to understanding the change from IAS 39 as well as explaining the key judgements and material inputs to the IFRS 9 ECL results.
Our procedures included: Controls testing: We performed end to end process
walkthroughs to identify the key systems, applications and controls used in the ECL processes. We tested the relevant general IT and applications controls over key systems used in the ECL process.
Key aspects of our controls testing involved the following:
o For the relevant portfolios, testing the design and operating effectiveness of the key controls over the completeness and accuracy of the key inputs and assumptions into the IFRS 9 impairment models;
o Testing the design and operating effectiveness of the key controls over the authorisation and application of the SICR criteria;
o Evaluating controls over model monitoring and validation;
o Evaluating controls over authorisation and calculation of post model adjustments and management overlays; and
o Testing key controls relating to selection and implementation of material macro-economic variables and the controls over the scenario selection and probabilities.
Our financial risk modelling expertise: For the credit card and corporate portfolios we involved our own financial risk modelling specialists in evaluating the appropriateness of the group’s and parent’s IFRS 9 impairment methodologies (including the SICR criteria used). We used our experience to independently assess probability of default, loss given default and exposure at default assumptions. For a sample of models we assessed the reasonableness of the model predictions by comparing them against actual results.
Our economic scenario expertise: We involved our own economic specialists to assist us in assessing the appropriateness of the group’s and parent’s methodology for determining the economic scenarios used and the probability weightings applied to them. We also assessed key economic variables used, which included agreeing samples of economic variables to external sources, as well as the overall reasonableness of the economic forecasts by comparing the group’s and parent’s forecasts to our own modelled forecasts with a focus on the credit card and corporate portfolios. As part of this work we assessed the reasonableness of the group’s and parent’s considerations of the ECL impact of economic uncertainty, including Brexit.
Tests of details: Key aspects of our testing involved:
o Sample testing over key inputs and assumptions impacting ECL calculations to assess the reasonableness of economic forecasts, weights, and PD assumptions applied;
home.barclays/annualreport Barclays Bank PLC Annual Report 135

Independent Auditor’s report Independent Auditor’s report to the members of Barclays Bank PLC Credit risk management
o Re-performing key aspects of the Group’s SICR determinations;
o Assessing model predictions against actual results; and
o Selecting a sample of post model adjustments, considering the size and complexity of management overlays, in order to assess the reasonableness of the adjustments by challenging key assumptions, inspecting the calculation methodology and tracing a sample back to source data.
Assessing transparency: We assessed whether the disclosures appropriately disclose and address the uncertainty which exists when determining the expected credit losses. As a part of this, we assessed the sensitivity analysis that is disclosed. In addition, we assessed whether the disclosure of the key judgements and assumptions made was sufficiently clear.
Our results:
The results of our testing were satisfactory and we considered the ECL charge, provision recognised and the related disclosures to be acceptable
home.barclays/annualreport Barclays Bank PLC Annual Report 136

Independent Auditor’s report Independent Auditor’s report to the members of Barclays Bank PLC Credit risk management
Key audit matter How our audit addressed the key audit matter
Valuation of financial instruments held at fair value
Refer to page 199 (accounting policy on accounting for financial assets and liabilities) and financial disclosure note 18 (fair value of financial instruments)
Subjective estimate The fair value of the group’s and parent’s financial instruments is determined through the application of valuation techniques which often involve the exercise of judgement by management and the use of assumptions, estimates and valuation models. Where significant pricing inputs are unobservable management has no reliable, relevant market data available in determining the fair value and hence estimation uncertainty can be high. These financial instruments are classified as Level 3, with management having controls in place over the boundary between Level 2 and 3 positions. Our significant audit risk is therefore over significant Level 3 portfolios. We performed risk assessment procedures over the entire level 3 balance within the group’s and parent’s financial statements. As part of these risk assessment procedures we identified which portfolios have a risk of material misstatement including those arising from significant judgements over valuation either due to unobservable inputs or complex models. At 31 December 2018, Level 3 instruments (£13.8 billion) represented 2.7% of the Group’s financial instrument assets carried at fair value and 1.3% of the Group’s financial instrument liabilities carried at fair value. Within this Level 3 population the fair value instrument portfolios in the group and parent with the most significant judgements include:
Education, Social Housing and Local Authority (ESHLA) loan portfolio – as at 31 December 2018 the group and parent has outstanding ESHLA loans which require significant judgement in the valuation due to the long dated nature of the portfolio, the lack of a secondary market in the relevant loans and unobservable loan spreads.
Longer-dated derivative portfolios – we identified three portfolios (two derivative portfolios and a bond package) each with a significant risk attached to the valuation methodology due to the lack of observable pricing inputs. The bond and derivatives package also includes a long standing valuation disparity with the counterparty.
The effect of these matters is that, as part of our risk assessment, we determined that the subjective estimates in fair value measurement of the above portfolios have a high degree of estimation uncertainty, with a potential range of reasonable outcomes greater than our materiality for the financial statements as a whole, and possibly many times that amount.
Our procedures included:
Control testing: We tested the design and operating effectiveness of key controls relating specifically to the ESHLA and the three longer- dated portfolios. These included:
o Controls over price verification (IPV), performed by a control function, of key inputs, including completeness of positions and valuation inputs subject to IPV;
o For ESHLA we tested controls over the gilt asset swap curve and credit spreads. For the long dated portfolios we tested material risk parameters used in valuation models;
o Controls over fair value adjustments (FVA). For ESHLA these related to pre-payments. For the longer-dated portfolios these related to exit adjustments (to mark the portfolio to bid or offer prices) and model shortcoming reserves to address model limitations. In addition, we tested funding and credit adjustments for all significant risk portfolios;
o Controls over the validation, completeness, implementation and usage of valuation models. This included controls over assessment of model limitations and assumptions; and
o Controls over the levelling classification applied to trades within these portfolios in line with IFRS 13 disclosure requirements.
Independent re-performance: With the assistance of our own valuation specialists we independently re-priced a selection of trades from the ESHLA and three longer dated portfolios and challenged management on the valuations where they were outside our expected tolerance.
Methodology choice: In the context of observed industry practice, our own valuation specialists assisted us in challenging the appropriateness of significant models and methodologies used in calculating fair values, risk exposures, appropriateness of risk factors, and in calculating FVAs;
Comparing valuations: For a selection of material collateral disputes within the longer-dated portfolios we challenged management’s valuation methodology where significant fair value differences were observable with the market participant on the other side of the trade;
Historical comparison: We inspected significant
gains and losses on trade exits or restructurings
home.barclays/annualreport Barclays Bank PLC Annual Report 137

Independent Auditor’s report Independent Auditor’s report to the members of Barclays Bank PLC Credit risk management
Disclosure quality The IFRS 13 fair value measurement disclosures are key to explaining the valuation techniques, key judgements, assumptions and material inputs. The financial statements, note 19, includes disclosure of sensitivity of valuation inputs to fair value measurement by the Group.
and challenged whether these data points indicate elements of fair value not incorporated in the current valuation methodologies.
We inspected movements in unobservable pricing
inputs throughout the period to challenge whether any gain or loss generated was appropriate.
Our results:
The results of our testing were satisfactory and we considered the fair value of level 3 financial instrument assets and liabilities recognised to be acceptable (2017 result: acceptable).
home.barclays/annualreport Barclays Bank PLC Annual Report 138

Independent Auditor’s report Independent Auditor’s report to the members of Barclays Bank PLC Credit risk management
Key audit matter How our audit addressed the key audit matter
Legal, competition and regulatory matters Refer to page 227 (accounting policy on accounting for provisions), page 229 (accounting policy on contingent liabilities and commitments), page 227 (financial disclosures note 26 Provisions), and page 229 (financial disclosures note 28 Legal, competition and regulatory matters)
Exposure completeness The group and parent operate in a highly litigious and regulated environment and face legal, competition and regulatory challenges which can lead to potential claims and exposures (together “litigation and regulatory matters”). In certain litigation and regulatory matters significant judgement is required by the directors to determine if there is a present obligation under relevant accounting standards. Subjective estimate If there is a present obligation the amounts involved can be potentially significant, and the application of accounting standards to estimate the expected outflow of any liability to be recognised, if any, is inherently subjective. The effect of these matters is that, as part of our risk assessment, we determined that the litigation liability has a high degree of estimation uncertainty, with a potential range of reasonable outcomes greater than our materiality for the financial statements as a whole.
Disclosure quality When a liability is not recognised for possible significant outflows but there is more than a remote likelihood of an adverse outcome, the related disclosure is key to understanding the risks and potential effect on the group and parent.
Our procedures included:
Inspection of board of directors meeting minutes: We inspected the board of directors meeting minutes to obtain an understanding of the status of all significant litigation and regulatory matters;
Inspection of regulatory correspondence: We inspected correspondence with the relevant regulatory authorities to identify actual or possible non-compliance with laws and regulations that may have a material effect on the financial statements;
Enquiry of lawyers: For significant litigation and regulatory matters we enquired of the group’s and parent’s internal legal counsel and inspected internal notes and reports. We also received formal confirmations from external counsel. For the most significant litigation and regulatory matters we also had discussions with external counsel. Based on these procedures we challenged the timing of the recognition of provisions where there is potential exposure but it is not clear whether a present obligation exists or where the directors have determined a reliable estimate is not possible.
Test of details: For the significant provisions we independently assessed the estimated value of the provision, based on our enquiries of lawyers and information obtained from our other procedures;
Assessing transparency: Assessed whether the disclosures detailing significant litigation and regulatory matters adequately disclose the potential liabilities and the significant uncertainties that exist.
Our results:
The results of our testing were satisfactory and we considered the provisions recognised, and the disclosures made, to be acceptable. (2017 result: acceptable).
home.barclays/annualreport Barclays Bank PLC Annual Report 139

Independent Auditor’s report Independent Auditor’s
Key audit matter How our audit addressed the key audit matter
User Access Management
Control performance The group’s and parent’s accounting and reporting processes are dependent on automated controls enabled by IT systems. User access management controls are an important component of the general IT control environment assuring that unauthorised access to systems does not impact the effective operation of the automated controls in the financial reporting processes. In prior years key user access management controls were reported as not consistently implemented and not effectively operated across the group. Ineffective controls included developer access to production, logging/monitoring of user activities and segregation of duties. A series of remediation programmes were completed to address previously identified control deficiencies. The group has also implemented further compensating controls to address the issues raised in the current year, most of them relating to user access management. If the above controls for user access management are deficient and not remediated or adequately mitigated the pervasive nature of these controls may undermine our ability to place some reliance on automated and IT dependent controls in our audit.
Our procedures included:
Control testing: We tested the design and operating effectiveness of key controls over user access management including controls over:
o Authorising access for new joiners; o Removal of user access rights on a
timely basis; o Inappropriate privileged and developer
access to production systems, the procedures to assess potential use, and the removal of these access rights;
o Segregation of duties including access to multiple systems that could circumvent segregation controls; and
o Recertification of user access rights.
Control reperformance: To assess whether additional detective compensating controls adequately address the risk of unauthorised access, we re-performed on a sample basis management’s assessment of potential unauthorised access by privileged accounts and users, whose access rights were not recertified.
Our results:
Our testing did not identify unauthorised user activities in the systems relevant to financial reporting which would have required us to expand the extent of our planned detailed testing. (2017: Our testing did not identify developers who had access and used the access without authorisation that would have required us to expand the extent of our planned detailed testing.)
Our application of materiality and an overview of the scope of our audit
Materiality Materiality for the group financial statements as a whole was set at £145 million, determined with reference to a benchmark of group profit before tax from continuing operations, normalised to exclude charges related to litigation and conduct as disclosed in the consolidated income statement, of £2,992 million, of which it represents 4.8%.
Materiality for the parent company financial statements as a whole was set at £144 million, determined with reference to a benchmark of net assets, of which it represents 0.3%.
We agreed to report to the Board Audit Committee any corrected or uncorrected identified misstatements exceeding £7 million, in addition to other identified misstatements that warranted reporting on qualitative grounds
home.barclays/annualreport Barclays Bank PLC Annual Report 140

Independent Auditor’s report Independent Auditor’s report to the members of Barclays Bank PLC Credit risk management
Scope – general We subjected three of the group’s reporting components to full scope audits for group purposes and four to specified risk-focused audit procedures. Two of the components subject to risk-focused audit procedures focused on the loans and advances at amortised cost and interest income financial statement captions, and one of these components focused on financial assets designated at fair value financial statement caption. The fourth component subject to risk-focused audit procedures focused on loans and advances at amortised cost, interest income as well as financial assets designated at fair value. The remaining 17% (2017: 19%) of total group income and 8% (2017: 11%) of total group assets is represented by a number of other components, none of which are individually significant. For these residual components, we performed analysis at an aggregated group level to re-examine our assessment that there were no significant risks of material misstatement within these. The work on four components was performed by component auditors and the remaining work, including the audit of the parent company, was performed by the group team. For those items excluded from normalised group profit before tax, the component teams performed procedures on items relating to their components. The group team performed procedures on the remaining excluded items. The components within the scope of our work accounted for the percentages illustrated below.
79
2
79
2
Group total income
87
2
86
4
Group total assets
** Prior year amount includes the UK banking business *normalised to exclude charges related to litigation and conduct
Profit before tax fromcontinuing operations*Group materiality
Profit before tax from continuing operations
£2,992m (2017: £4,748m)**
Group Materiality£145m (2017: £225m)**
£145mWhole financial statements materiality (2017: £225m)**
£100m Range of materiality at 7 components (£25m-£100m) (2017: £25m to £165m)
£7mMisstatements reported to the Board Audit Committee (2017: £11m)**
81% (2017: 81%) 90%
(2017: 89%)
Full scope for group audit purposes 2018
Specified risk-focused audit procedures 2018
Full scope for group audit purposes 2017
Specified risk-focused audit procedures 2017
Residual components
home.barclays/annualreport Barclays Bank PLC Annual Report 141

Independent Auditor’s report Independent Auditor’s
Team structure The group team led a global planning conference to discuss key audit risks and to obtain input from component and other participating locations. The group team instructed component auditors as to the significant areas to be covered, including the relevant key audit matters detailed above and the information to be reported back. The group team approved the component materiality for each component, which ranged from £25 million to £100 million, having regard to the mix of size and risk profile across the components. The group team visited all of the components in scope for group reporting purposes to assess the audit risk and strategy. Conference meetings and calls were also held with these component auditors throughout the conduct of the audit. At these visits and meetings, we reviewed the components’ key working papers, the findings reported to the group team were discussed in more detail, and any further work required by the group team was then performed by the component auditor. The Group has centralised certain group-wide processes in India, the outputs of which are included in the financial information of the reporting components it services and therefore it is not a separate reporting component. These group-wide processes are subject to specified audit procedures, predominantly the testing of transaction processing, reconciliations and review controls. Additional procedures are performed at certain reporting components to address the audit risks not covered by the work performed over these group-wide processes in India. The group team and certain component teams visited the locations in India where these group-wide processes reside and performed consistent procedures as described above for component site visits. We have nothing to report on going concern The directors have prepared the financial statements on the going concern basis as they do not intend to liquidate the company or the group or to cease their operations, and as they have concluded that the company’s and the group’s financial position means that this is realistic. They have also concluded that there are no material uncertainties that could have cast significant doubt over their ability to continue as a going concern for at least a year from the date of approval of the financial statements (“the going concern period”).
Our responsibility is to conclude on the appropriateness of the directors’ conclusions and, had there been a material uncertainty related to going concern, to make reference to that in this audit report. However, as we cannot predict all future events or conditions and as subsequent events may result in outcomes that are inconsistent with judgements that were reasonable at the time they were made, the absence of reference to a material uncertainty in this auditor's report is not a guarantee that the group or the company will continue in operation.
In our evaluation of the directors’ conclusions, we considered the inherent risks to the group’s and company’s business model and analysed how those risks might affect the group’s and company’s financial resources or ability to continue operations over the going concern period. The risks that we considered most likely to adversely affect the group’s and company’s available financial resources over this period were:
Availability of funding and liquidity in the event of a market wide stress scenario including the impact of Brexit; and Impact on regulatory capital requirements in the event of an economic slowdown / recession.
As these were risks that could potentially cast significant doubt on the group’s and the company's ability to continue as a going concern, we considered sensitivities over the level of available financial resources indicated by the group’s financial forecasts taking account of reasonably possible (but not unrealistic) adverse effects that could arise from these risks individually and collectively and evaluated the achievability of the actions the directors consider they would take to improve the position should the risks materialise. Based on this work, we are required to report to you if we have anything material to add or draw attention to in relation to the directors’ statement in note 1 to the financial statements on the use of the going concern basis of accounting with no material uncertainties that may cast significant doubt over the group and company’s use of that basis for a period of at least twelve months from the date of approval of the financial statements. We have nothing to report in these respects, and we did not identify going concern as a key audit matter. We have nothing to report on the strategic report and directors’ report: The directors are responsible for the strategic report and the directors’ report. Our opinion on the financial statements does not cover those reports and we do not express an audit opinion or except as explicitly stated below, any form of assurance conclusion thereon. Our responsibility is to read the strategic report and the directors’ report and, in doing so, consider whether, based on our financial statements audit work, the information therein is materially misstated or inconsistent with the financial statements or our audit knowledge. Based solely on that work: we have not identified material misstatements in the strategic report and directors’ report; in our opinion the information given in those reports for the financial year is consistent with the financial statements; and in our opinion those reports have been prepared in accordance with the Companies Act 2006.
home.barclays/annualreport Barclays Bank PLC Annual Report 142

Independent Auditor’s report Independent Auditor’s report to the members of Barclays Bank PLC Credit risk management
We have nothing to report on the other matters on which we are required to report by exception Under the Companies Act 2006, we are required to report to you if, in our opinion: adequate accounting records have not been kept by the parent Company, or returns adequate for our audit have not been received from
branches not visited by us; or the parent Company financial statements are not in agreement with the accounting records and returns; or certain disclosures of directors’ remuneration specified by law are not made; or we have not received all the information and explanations we require for our audit.
We have nothing to report in these respects.
Respective responsibilities Directors’ responsibilities As explained more fully in their statement set out on going concern and directors’ responsibilities statements set out on pages 27 and 28, the directors are responsible for: the preparation of the financial statements including being satisfied that they give a true and fair view; such internal control as they determine is necessary to enable the preparation of financial statements that are free from material misstatement, whether due to fraud or error; assessing the Group and Parent Company’s ability to continue as a going concern, disclosing, as applicable, matters related to going concern; and using the going concern basis of accounting unless they either intend to liquidate the Group or the Parent Company or to cease operations, or have no realistic alternative but to do so. Auditor’s responsibilities Our objectives are to obtain reasonable assurance about whether the financial statements as a whole are free from material misstatement, whether due to fraud or other irregularities (see below), or error, and to issue our opinion in an auditor’s report. Reasonable assurance is a high level of assurance, but does not guarantee that an audit conducted in accordance with ISAs (UK) will always detect a material misstatement when it exists. Misstatements can arise from fraud, other irregularities or error and are considered material if, individually or in aggregate, they could reasonably be expected to influence the economic decisions of users taken on the basis of the financial statements. A fuller description of our responsibilities is provided on the FRC’s website at www.frc.org.uk/auditorsresponsibilities.
Irregularities – ability to detect We identified areas of laws and regulations that could reasonably be expected to have a material effect on the financial statements from our general commercial and sector experience, through discussion with the directors and other management (as required by auditing standards), from inspection of the group’s regulatory correspondence and discussed with the directors and other management the policies and procedures regarding compliance with laws and regulations. We communicated identified laws and regulations throughout our team and remained alert to any indications of non-compliance throughout the audit. This included communication from the group to component audit teams of relevant laws and regulations identified at the group level.
The potential effect of these laws and regulations on the financial statements varies considerably.
Firstly, the group is subject to laws and regulations that directly affect the financial statements including financial reporting legislation (including related companies legislation), distributable profits legislation, and taxation legislation. We assessed the extent of compliance with these laws and regulations as part of our procedures on the related financial statement items.
Secondly, the group is subject to many other laws and regulations where the consequences of non-compliance could have a material effect on amounts or disclosures in the financial statements, for instance through the imposition of fines or litigation or the loss of the group’s license to operate. We identified the following areas as those most likely to have such an effect: specific areas of regulatory capital and liquidity, conduct, money laundering, sanctions list and financial crime, market abuse regulations and certain aspects of company legislation recognising the financial and regulated nature of the group’s activities. Auditing standards limit the required audit procedures to identify non-compliance with these laws and regulations to enquiry of the directors and other management and inspection of regulatory and legal correspondence, if any. These limited procedures did not identify actual or suspected non-compliance.
Owing to the inherent limitations of an audit, there is an unavoidable risk that we may not have detected some material misstatements in the financial statements, even though we have properly planned and performed our audit in accordance with auditing standards. For example, the further removed non-compliance with laws and regulations (irregularities) is from the events and transactions reflected in the financial statements, the less likely the inherently limited procedures required by auditing standards would identify it. In addition, as with any audit, there remains a higher risk of non-detection of irregularities, as these may involve collusion, forgery, intentional omissions, misrepresentations, or the override of internal controls. We are not responsible for preventing non-compliance and cannot be expected to detect non-compliance with all laws and regulations.
home.barclays/annualreport Barclays Bank PLC Annual Report 143

Independent Auditor’s report Independent Auditor’s
The purpose of our audit work and to whom we owe our responsibilities This report is made solely to the Company’s members, as a body, in accordance with Chapter 3 of Part 16 of the Companies Act 2006. Our audit work has been undertaken so that we might state to the Company’s members those matters we are required to state to them in an auditor’s report and for no other purpose. To the fullest extent permitted by law, we do not accept or assume responsibility to anyone other than the Company and the Company’s members, as a body, for our audit work, for this report, or for the opinions we have formed. Karim Haji (Senior Statutory Auditor) for and on behalf of KPMG LLP, Statutory Auditor Chartered Accountants 15 Canada Square London E14 5GL 20 February 2019
home.barclays/annualreport Barclays Bank PLC Annual Report 144

Consolidated financial statements Consolidated income statement
2018 2017a 2016a
For the year ended 31 December Notes £m £m £m
Continuing operations
Interest income 5 7,459 6,917 6,891
Interest expense 5 (4,329) (3,041) (2,115)
Net interest income 3,130 3,876 4,776
Fee and commission income 6 7,392 7,424 7,215
Fee and commission expense 6 (1,785) (1,726) (1,626)
Net fee and commission income 5,607 5,698 5,589
Net trading income 7 4,364 3,396 2,716
Net investment income 8 394 699 1,077
Other income 105 61 44
Total income 13,600 13,730 14,202
Credit impairment charges and other provisions 9 (643) (1,553) (1,477)
Net operating income 12,957 12,177 12,725
Staff costs 33 (4,874) (4,393) (6,832)
Infrastructure costs 10 (935) (1,696) (2,339)
Administration and general expensesb 10 (4,224) (4,141) (1,975)
Litigation and conductb (1,706) (448) (321)
Operating expenses (11,739) (10,678) (11,467)
Share of post-tax results of associates and joint ventures 68 75 71
Profit on disposal of subsidiaries, associates and joint ventures - 184 565
Profit before tax 1,286 1,758 1,894
Taxation 11 (404) (1,526) (302)
Profit after tax in respect of continuing operations 882 232 1,592
(Loss)/profit after tax in respect of discontinued operations 3 (47) (1,386) 2,137
Profit/(loss) after tax 835 (1,154) 3,729
Attributable to:
Equity holders of the parent 188 (1,937) 2,867
Other equity instrument holders 647 639 457
Total equity holders of the parent 835 (1,298) 3,324
Non-controlling interests in respect of continuing operations 32 - 4 3
Non-controlling interests in respect of discontinued operations 32 - 140 402
Profit/(loss) after tax 835 (1,154) 3,729
Note a Following the sale of the UK banking business on 1 April 2018 by the Group, the continuing operations for 2016 and 2017 have been restated to disclose the UK banking business
as a discontinued operation. Further detail on the discontinued operations can be found in Note 3 on pages 164 to 167. b The presentation of administration and general expenses has been amended to include litigation and conduct as a separate line item. The prior year comparatives within
administration and general expenses categories have been adjusted accordingly.
home.barclays/annualreport Barclays Bank PLC Annual Report 145

Consolidated financial statements Consolidated statement of comprehensive income
2018 2017a 2016a
For the year ended 31 December £m £m £m
Profit/(loss) after tax 835 (1,154) 3,729
Profit after tax in respect of continuing operations 882 232 1,592
(Loss)/profit after tax in respect of discontinuing operations (47) (1,386) 2,137
Other comprehensive income/(loss) that may be recycled to profit or loss from continuing operations:
Currency translation reserve
Currency translation differencesb 844 (1,310) 3,027
Available for sale reservec
Net gains from changes in fair value - 404 2,178
Net (gains) transferred to net profit on disposal - (294) (912)
Net losses transferred to net profit due to impairment - 3 20
Net losses/(gains) transferred to net profit due to fair value hedging - 283 (1,677)
Changes in insurance liabilities and other liabilities - 60 53
Tax - (27) (18)
Fair value through other comprehensive income reservec
Net losses from changes in fair value (475) - -
Net losses transferred to net profit on disposal 74 - -
Net losses transferred to net profit due to impairment 4 - -
Net losses transferred to net profit due to fair value hedging 165 - -
Other movements (25) - -
Tax 53 - -
Cash flow hedging reserve
Net (losses)/gains from changes in fair value (197) (428) 689
Net gains transferred to net profit (213) (602) (431)
Tax 103 256 (59)
Other 27 (7) 47Other comprehensive income/(loss) that may be recycled to profit or loss from continuing operations 360 (1,662) 2,917
Other comprehensive income/(loss) not recycled to profit or loss from continuing operations:
Retirement benefit remeasurements 412 115 (1,309)
Fair value through other comprehensive income reservec (141) - -
Own credit 77 (7) -
Tax (118) (66) 329
Other comprehensive income/(loss) not recycled to profit or loss from continuing operations 230 42 (980)
Other comprehensive income/(loss) for the year from continuing operations 590 (1,620) 1,937
Other comprehensive (loss)/income for the year from discontinued operation (3) 1,301 1,520
Total comprehensive income/(loss) for the year
Total comprehensive income/(loss) for the year, net of tax from continuing operations 1,472 (1,388) 3,529
Total comprehensive (loss)/income for the year, net of tax from discontinued operation (50) (85) 3,657
Total comprehensive income/(loss) for the year 1,422 (1,473) 7,186
Attributable to:
Equity holders of the parent 1,422 (1,585) 5,947
Non-controlling interests - 112 1,239
Total comprehensive income/(loss) for the year 1,422 (1,473) 7,186 Note a Following the sale of the UK banking business on 1 April 2018 by the Group, the continuing operations for 2016 and 2017 have been restated to disclose the UK banking business
as a discontinued operation. Further detail on the discontinued operations can be found in Note 3 on pages 164 to 167. b Includes £41m loss (2017: £189m loss) on recycling of currency translation differences. c Following the adoption of IFRS 9, Financial Instruments on 1 January 2018, the fair value through other comprehensive income reserve was introduced replacing the available for
sale reserve.
home.barclays/annualreport Barclays Bank PLC Annual Report 146

Consolidated financial statements Consolidated balance sheet
2018 2017a
As at 31 December Notes £m £m
Assets Cash and balances at central banks 136,359 171,036Cash collateral and settlement balances 74,352 77,172Loans and advances at amortised cost 20 136,959 324,590Reverse repurchase agreements and other similar secured lending 1,613 12,546Trading portfolio assets 13 104,038 113,755Financial assets at fair value through the income statement 14 145,250 116,282Derivative financial instruments 15 222,683 237,987Financial investments 16 - 58,963Financial assets at fair value through other comprehensive income 16 44,994 -Investments in associates and joint ventures 38 762 718Goodwill and intangible assets 23 1,327 4,885Property, plant and equipment 22 947 1,519Current tax assets 11 1,713 376Deferred tax assets 11 2,970 3,352Retirement benefit assets 35 1,768 966Other assets 1,965 4,003Assets included in disposal groups classified as held for sale - 1,193Total assets 877,700 1,129,343Liabilities Deposits at amortised cost 199,337 399,189Cash collateral and settlement balances 67,736 68,143Repurchase agreements and other similar secured borrowing 7,378 40,338Debt securities in issue 39,063 69,386Subordinated liabilities 29 35,327 24,193Trading portfolio liabilities 13 36,614 37,352Financial liabilities designated at fair value 17 217,741 173,718Derivative financial instruments 15 219,592 238,345Current tax liabilities 11 621 494Retirement benefit liabilities 35 283 287Other liabilities 25 5,170 8,862Provisions 26 1,127 3,302Total liabilities 829,989 1,063,609Equity Called up share capital and share premium 30 2,348 14,453Other equity instruments 30 7,595 8,982Other reserves 31 3,361 3,808Retained earnings 34,405 38,490Total equity excluding non-controlling interests 47,709 65,733Non-controlling interests 32 2 1Total equity 47,711 65,734Total liabilities and equity 877,700 1,129,343
The Board of Directors approved the financial statements on pages 145 to 284 on 20 February 2019. Sir Gerry Grimstone Barclays Bank Group Chairman Tim Throsby Barclays Bank Group Chief Executive Steven Ewart Barclays Bank Group Chief Financial Officer Note a Barclays introduced changes to the balance sheet presentation as at 31 December 2017 as a result of the adoption of new accounting policies on 1 January 2018. Further detail on
the adoption of new accounting policies can be found in Note 1 on pages 157 to 162, Note 43 on pages 267 to 280 and the Credit risk disclosures on pages 60 to 94.
home.barclays/annualreport Barclays Bank PLC Annual Report 147

Consolidated financial statements Consolidated statement of changes in equity
Called up share
capital and share premiuma
Other equity
instrumentsa
Available for sale
reserveb
Fair value through other
comprehensive income reserve
Cashflow
hedgingreserveb
Currencytranslation
reserveb
Otherreserves
and othershare-holders'
equitya
Own credit
reservea Retained earnings
Total equity excluding
non-controlling
interests
Non-controlling
interestsTotal
equity £m £m £m £m £m £m £m £m £m £m £m £m
Balance as at 31 December 2017 14,453 8,982 396 - 184 3,084 323 (179) 38,490 65,733 1 65,734Effects of changes in accounting policiesd - - (396) 260 - - - - (2,014) (2,150) - (2,150)Balance as at 1 January 2018 14,453 8,982 - 260 184 3,084 323 (179) 36,476 63,583 1 63,584Profit after tax - 647 - - - - - - 235 882 - 882Currency translation movements - - - - - 844 - - - 844 - 844Fair value through other comprehensive income reserve - - - (345) - - - - - (345) - (345)Cash flow hedges - - - - (307) - - - - (307) - (307)Pension remeasurement - - - - - - - - 313 313 - 313Own credit reserve - - - - - - - 58 - 58 - 58Other - - - - - - - - 27 27 - 27Total comprehensive income net of tax from continuing operations - 647 - (345) (307) 844 - 58 575 1,472 - 1,472Total comprehensive income net of tax from discontinued operations - - - (3) - - - - (47) (50) - (50)Total comprehensive income for the year - 647 - (348) (307) 844 - 58 528 1,422 - 1,422Issue and exchange of other equity instruments - 683 - - - - - - (312) 371 - 371Capital reorganisation (12,092) - - - - - - - 12,092 - - - Other equity instruments coupons paid - (647) - - - - - - 175 (472) - (472)Redemption of preference shares (13) - - - - - 21 - (2,048) (2,040) - (2,040)Equity to debt reclassificationc - - - - - - (272) - - (272) - (272)Equity settled share schemes - - - - - - - - 373 373 - 373Vesting of Barclays PLC shares under share-based payment schemes - - - - - - - - (418) (418) - (418)Dividends on ordinary shares - - - - - - - - (14,585) (14,585) - (14,585)Dividends on preference shares and other shareholders equity - - - - - - - - (204) (204) - (204)Capital contribution from Barclays Plc - - - - - - - - 3,000 3,000 - 3,000Net equity impact of intra-group transfers - (2,070) - (210) - (1) (96) - (638) (3,015) - (3,015)Other reserve movements - - - - - - - - (34) (34) 1 (33)Balance as at 31 December 2018 2,348 7,595 - (298) (123) 3,927 (24) (121) 34,405 47,709 2 47,711
Notes a For further details refer to Note 30. b For further details refer to Note 31. c Following a review of certain equity instruments, certain instruments have been deemed to have characteristics that would qualify them as debt and have subsequently been
reclassified. d Following the adoption of IFRS 9 Financial Instruments on 1 January 2018, the fair value through other comprehensive income reserve was introduced replacing the available for
sale reserve. £260m was reclassified to the fair value through other comprehensive income reserve; £139m reclassified to retained earnings and an impairment charge of £3m through to retained earnings.
home.barclays/annualreport Barclays Bank PLC Annual Report 148

Consolidated financial statements Consolidated statement of changes in equity
Called up share
capital and
share premiuma
Other equity
instrumentsa
Available for sale
reserveb
Fair value through other
comprehensive income reserve
Cashflow
hedgingreserveb
Currencytranslation
reserveb
Otherreserves
and othershareholders'
equitya
Own credit
reservea
Retained earnings
Total equity excluding
non-controlling
interests
Non-controlling
interestsTotal
equity
£m £m £m £m £m £m £m £m £m £m £m £m
Balance as at 31 December 2016 14,462 6,486 (22) - 954 3,054 309 - 42,190 67,433 3,522 70,955Effects of changes in accounting policiesc - - - - - - - (175) 175 - - -Balance as at 1 January 2017 14,462 6,486 (22) - 954 3,054 309 (175) 42,365 67,433 3,522 70,955Profit after tax - 639 - - - - - - (411) 228 4 232Currency translation movements - - - - - (1,309) - - - (1,309) (1) (1,310)Available for sale investments - - 429 - - - - - - 429 - 429Cash flow hedges - - - - (774) - - - - (774) - (774)Pension remeasurement - - - - - - - - 53 53 - 53Own credit reserve - - - - - - - (11) - (11) - (11)Other - - - - - - - - (7) (7) - (7)Total comprehensive income net of tax from continuing operations - 639 429 - (774) (1,309) - (11) (365) (1,391) 3 (1,388)Total comprehensive income net of tax from discontinued operations - - (11) - 4 1,339 - - (1,526) (194) 109 (85)Total comprehensive income for the year - 639 418 - (770) 30 - (11) (1,891) (1,585) 112 (1,473)Issue and exchange of other equity instruments - 2,496 - - - - - - - 2,496 - 2,496Other equity instruments coupons paid - (639) - - - - - - 174 (465) - (465)Redemption of preference shares (9) - - - - - 14 - (1,343) (1,338) - (1,338)Equity settled share schemes - - - - - - - - 550 550 - 550Vesting of Barclays PLC shares under share-based payment schemes - - - - - - - - (78) (78) - (78)Dividends on ordinary shares - - - - - - - - (674) (674) (173) (847)Dividends on preference shares and other shareholders equity - - - - - - - - (242) (242) - (242)Net equity impact of partial BAGL disposal - - - - - - - - (359) (359) (3,462) (3,821)Other reserve movements - - - - - - - 7 (12) (5) 2 (3)Balance as at 31 December 2017 14,453 8,982 396 - 184 3,084 323 (179) 38,490 65,733 1 65,734
Notes a For further details refer to Note 30. b For further details refer to Note 31. c As a result of the early adoption of the own credit provisions of IFRS 9 on 1 January 2017, own credit which was previously recorded in the income statement is now recognised
within other comprehensive income. The cumulative unrealised own credit net loss of £175m has therefore been reclassified from retained earnings to a separate own credit reserve, within other reserves. During 2017 a £3m loss (net of tax) on own credit has been booked in the reserve.
home.barclays/annualreport Barclays Bank PLC Annual Report 149

Consolidated financial statements Consolidated cash flow statement
2018 2017a 2016a
For the year ended 31 December Notes £m £m £m
Continuing operations Reconciliation of profit before tax to net cash flows from operating activities: Profit before tax 1,286 1,758 1,894Adjustment for non-cash items: Allowance for impairment 643 1,553 1,461Depreciation, amortisation and impairment of property, plant, equipment and intangibles 397 663 1,073Other provisions, including pensions 2,274 770 463Net profit on disposal of investments and property, plant and equipment - (314) (708)Other non-cash movements including exchange rate movements (3,877) 1,565 (24,732)Changes in operating assets and liabilities Net (increase)/decrease in cash collateral and settlement balances (5,606) (3,912) 503Net decrease/(increase) in loans and advances (3,890) 26,062 (19,204)Net (increase)/decrease in reverse repurchase agreements and other similar lending (434) (1,827) 14,733Net increase in deposits and debt securities in issue 16,330 938 54,629Net increase/(decrease) in repurchase agreements and other similar borrowing 2 16,978 (4,852)Net (increase)/decrease in derivative financial instruments (6,419) 6,770 (2,370)Net decrease/(increase) in trading assets 10,102 (33,179) (5,531)Net increase in trading liabilities 1,688 2,665 880Net (increase)/decrease in financial assets and liabilities at fair value through income statement (6,284) 39,507 854Net decrease/(increase) in other assets 949 (721) (9,805)Net (decrease)/increase in other liabilities (6,099) (2,014) 925Corporate income tax paid 11 (409) 59 (254)
Net cash from operating activities 653 57,321 9,959
Net cash disposed of due to the disposal of the UK banking business - - -Purchase of available for sale investments - (83,233) (65,086)Purchase of financial assets at fair value through other comprehensive income (106,330) - -Proceeds from sale or redemption of available for sale investments - 88,298 102,384Proceeds from sale or redemption of financial assets at fair value through other comprehensive income 108,038 - -Purchase of property, plant and equipment and intangibles (422) (714) (1,718)Proceeds from sale of property, plant and equipment and intangibles 35 2,150 7Disposal of discontinued operation, net of cash disposed (39,703) (1,060) -Disposal of subsidiaries, net of cash disposed - 358 595Other cash flows associated with investing activities 1,191 693 32
Net cash from investing activities (37,191) 6,492 36,214
Dividends paid (1,142) (1,427) (1,186)Issuance of subordinated debt 29 221 3,041 857Redemption of subordinated debt 29 (3,246) (1,378) (1,143)Net issue of shares and other equity instruments 1,925 2,495 1,125Redemption of shares and other equity instruments (3,588) (1,339) (1,378)Capital contribution from Barclays PLC 2,000 - 114Vesting of shares under employee share schemes (418) - -
Net cash from financing activities (4,248) 1,392 (1,611)
Effect of exchange rates on cash and cash equivalents 4,159 (4,773) 10,468
Net (decrease)/increase in cash and cash equivalents from continuing operations (36,627) 60,432 55,030
Net cash from discontinued operation 3 (468) 88 2,346
Net (decrease)/ increase in cash and cash equivalents (37,095) 60,520 57,376
Cash and cash equivalents at beginning of year 204,452 143,932 86,556
Cash and cash equivalents at end of year 167,357 204,452 143,932
Cash and cash equivalents comprise: Cash and balances at central banks 136,359 171,036 102,328Loans and advances to banks with original maturity less than three months 7,404 8,050 9,073Cash collateral and settlement balances with banks with original maturity less than three months 22,677 24,656 29,026Available for sale treasury and other eligible bills with original maturity less than three months 917 682 356Trading portfolio assets with original maturity less than three months - 28 -Cash and cash equivalents held for sale - - 3,149
167,357 204,452 143,932
Note a Following the sale of the UK banking business on 1 April 2018 by the Group, the continuing operations for 2016 and 2017 have been restated to disclose the UK banking business
as a discontinued operation. Further detail on the discontinued operations can be found in Note 3 on pages 164 to 167.
home.barclays/annualreport Barclays Bank PLC Annual Report 150

Consolidated financial statements Consolidated cash flow statement
Interest received by Barclays Bank Group was £18,990m (2017: £21,783m) and interest paid by Barclays Bank Group was £14,800m (2017: £10,388m). Barclays Bank Group is required to maintain balances with central banks and other regulatory authorities and these amounted to £4,716m (2017: £3,360m). For the purposes of the cash flow statement, cash comprises cash on hand and demand deposits and cash equivalents comprise highly liquid investments that are convertible into cash with an insignificant risk of changes in value with original maturities of three months or less. Repurchase and reverse repurchase agreements are not considered to be part of cash equivalents.
home.barclays/annualreport Barclays Bank PLC Annual Report 151

Financial statements of Barclays Bank PLC Parent company accounts
Balance sheet
2018 2017b
As at 31 December Notes £m £m
Assets Cash and balances at central banks 126,002 165,713Cash collateral and settlement balances 66,196 70,960Loans and advances at amortised cost 20 156,764 355,255Reverse repurchase agreements and other similar secured lending 5,766 22,964Trading portfolio assets 13 73,480 79,836Financial assets at fair value through the income statement 14 179,365 117,182Derivative financial instruments 15 221,247 232,288Financial investments 16 - 54,583Financial assets at fair value through other comprehensive income 16 43,706 -Investments in associates and joint ventures 38 140 165Investment in subsidiaries 14,958 14,614Goodwill and intangible assets 23 123 3,498Property, plant and equipment 22 103 565Current tax assets 11 1,439 115Deferred tax assets 11 1,249 1,863Retirement benefit assets 35 1,748 959Other assets 1,110 4,440Total assets 893,396 1,125,000Liabilities Deposits at amortised cost 231,017 425,902Cash collateral and settlement balances 56,358 60,541Repurchase agreements and other similar secured borrowing 11,113 49,883Debt securities in issue 26,391 55,874Subordinated liabilities 29 35,085 24,203Trading portfolio liabilities 13 46,626 41,542Financial liabilities designated at fair value 17 216,966 169,044Derivative financial instruments 15 221,590 229,227Current tax liabilities 11 376 242Retirement benefit liabilities 35 124 149Other liabilities 25 3,295 7,331Provisions 26 818 3,028Total liabilities 849,759 1,066,966Equity Called up share capital and share premium 30 2,348 14,453Other equity instruments 30 10,361 8,982Other reserves 31 383 1,093Retained earnings 30,545 33,506Total equity 43,637 58,034Total liabilities and equity 893,396 1,125,000 Notes a As permitted by section 408 of the Companies Act 2006 an income statement for the parent company has not been presented. Included in shareholders’ equity for Barclays Bank
PLC is a profit after tax for the year ended 31 December 2018 of £693m (2017: £608m). b Barclays introduced changes to the balance sheet presentation as at 31 December 2017 as a result of the adoption of new accounting policies on 1 January 2018. Further detail on
the adoption of new accounting policies can be found in Note 1 on pages 157 to 161, Note 43 on pages 267 to 280 and the Credit risk disclosures on pages 60 to 94.
home.barclays/annualreport Barclays Bank PLC Annual Report 152

Financial statements of Barclays Bank PLC Parent company accounts
Statement of changes in equity Called up
share capital
and share premiuma
Other equity
instruments
Available for sale
reserveb
Fair value through other
comprehensive income reserveb
Cashflow
hedgingreserveb
Currencytranslation
reserveb
Other reserves
and other shareholders'
equityb
Own credit
reserveb Retainedearnings Total equity
£m £m £m £m £m £m £m £m £m £m
Balance as at 31 December 2017 14,453 8,982 (19) - 185 719 386 (178) 33,506 58,034Effects of changes in accounting policiese - - 19 (136) - - - - (1,335) (1,452)Balance as at 1 January 2018 14,453 8,982 - (136) 185 719 386 (178) 32,171 56,582Profit after tax - 647 - - - - - - 82 729Currency translation movements - - - - - 138 - - - 138Fair value through other comprehensive income reserve - - - (179) - - - - - (179)Cash flow hedges - - - - (308) - - - - (308)Pension remeasurement - - - - - - - - 290 290Own credit reserve - - - - - - - 57 - 57Other - - - - - - - - 18 18Total comprehensive income net of tax from continuing operations - 647 - (179) (308) 138 - 57 390 745Total comprehensive income net of tax from discontinued operations - - - (3) - - - - (36) (39)Total comprehensive income for the year - 647 - (182) (308) 138 - 57 354 706Issue and exchange of other equity instruments - 3,449 - - - - - - (312) 3,137Capital reorganisation (12,092) - - - - - - 12,092 -Other equity instruments coupons paidd - (647) - - - - - - 175 (472)Redemption of preference shares (13) - - - - - 21 - (2,048) (2,040)Equity to debt reclassificationc - - - - - (335) - - (335)Equity settled share schemes - - - - - - - - 373 373Vesting of Barclays PLC shares under share-based payment schemes - - - - - - - - (418) (418)Dividends paid on ordinary shares - - - - - - - - (14,585) (14,585)Dividends paid on preference shares and other shareholders' equity - - - - - - - - (204) (204)Capital contribution from Barclays Plc - - - - - - - - 3,000 3,000Net equity impact of intra-group transfers - (2,070) - 16 - - - - (46) (2,100)Other reserve movements - - - - - - - - (7) (7)Balance as at 31 December 2018 2,348 10,361 - (302) (123) 857 72 (121) 30,545 43,637 Notes a For further details refer to Note 30. b For further details refer to Note 31. c Following a review of certain equity instruments, certain instruments have been deemed to have characteristics that would qualify them as debt and have subsequently been
reclassified. d Other equity instruments include AT1 securities issued by Barclays Bank PLC and borrowings of $3.5bn from a wholly-owned, indirect subsidiary of BBPLC. The borrowings have
been recorded as equity since, under their terms, interest payments are non-cumulative and discretionary whilst repayment of principal is perpetually deferrable by BBPLC. Should BBPLC make a discretionary dividend payment on its ordinary shares in the 6 months preceding the date of an interest payment, it will be obliged to make that interest payment.
e Following the adoption of IFRS 9 Financial Instruments on 1 January 2018, the fair value through other comprehensive income reserve was introduced replacing the available for sale reserve. £136m was reclassified to the fair value through other comprehensive income reserve; £139m reclassified to retained earnings and an impairment charge of £3m through to retained earnings.
home.barclays/annualreport Barclays Bank PLC Annual Report 153

Financial statements of Barclays Bank PLC Parent company accounts
Statement of changes in equity
Called up share
capital and share premiuma
Other equity
instruments
Available for sale
reserveb
Cashflow
hedgingreserveb
Currencytranslation
reserveb
Other reserves
and other shareholders'
equityb
Own credit
reserveb Retainedearnings Total equity
£m £m £m £m £m £m £m £m £m
Balance as at 31 December 2016 14,462 6,486 (131) 962 896 373 - 34,950 57,998Effects of changes in accounting policiesc - - - - - - (175) 175 -Balance as at 1 January 2017 14,462 6,486 (131) 962 896 373 (175) 35,125 57,998Profit after tax - 639 - - - - - (817) (178)Currency translation movements - - - - (177) - - - (177)Available for sale investments - - 112 - - - - - 112Cash flow hedges - - - (777) - - - - (777)Pension remeasurement - - - - - - - 44 44Own credit reserve - - - - - - (10) - (10)Other - - - - - - - (3) (3)Total comprehensive income net of tax from continuing operations - 639 112 (777) (177) - (10) (776) (989)Total comprehensive income net of tax from discontinued operations - - - - - - - 786 786Total comprehensive income for the year - 639 112 (777) (177) - (10) 10 (203)Issue and exchange of other equity instruments - 2,496 - - - - - - 2,496Other equity instruments coupons paid - (639) - - - - - 174 (465)Redemption of preference shares (9) - - - - 13 - (1,343) (1,339)Equity settled share schemes - - - - - - - 556 556Vesting of Barclays PLC shares under share-based payment schemes - - - - - - - (78) (78)Dividends paid on ordinary shares - - - - - - - (242) (242)Dividends paid on preference shares and other shareholders' equity - - - - - - - (675) (675)Other reserve movements - - - - - - 7 (21) (14)Balance as at 31 December 2017 14,453 8,982 (19) 185 719 386 (178) 33,506 58,034 Notes a For further details refer to Note 30. b For further details refer to Note 31. c As a result of the early adoption of the own credit provisions of IFRS 9 on 1 January 2017, own credit which was previously recorded in the income statement is now recognised
within other comprehensive income. The cumulative unrealised own credit net loss of £175m has therefore been reclassified from retained earnings to a separate own credit reserve, within other reserves. During 2017 a £3m loss (net of tax) on own credit has been booked in the reserve.
home.barclays/annualreport Barclays Bank PLC Annual Report 154

Financial statements of Barclays Bank PLC Parent company accounts
Cash flow statement 2018 2017a 2016a
For the year ended 31 December Notes £m £m £m
Continuing operations Reconciliation of profit before tax to net cash flows from operating activities: Profit before tax 697 192 2Adjustment for non-cash items: Allowance for impairment (123) 258 476Depreciation, amortisation and impairment of property, plant, equipment and intangibles 41 289 430Other provisions, including pensions 1,312 766 574Net profit on disposal of investments and property, plant and equipment - (255) 204Other non-cash movements including exchange rate movements (4,111) 934 (24,160)Changes in operating assets and liabilities - - -Net (increase)/decrease in cash collateral and settlement balances (4,049) 7,407 1,558Net decrease/(increase) in loans and advances 8,246 31,575 (6,353)Net (increase)/decrease in reverse repurchase agreements and other similar lending 2,870 (11) 5,862Net increase in deposits and debt securities in issue 18,100 666 28,262Net (decrease)/increase in repurchase agreements and other similar borrowing (6,034) 16,946 3,062Net decrease/(increase) in derivative financial instruments 9,242 6,452 (3,484)Net decrease/(increase) in trading assets 6,751 (43,284) (3,612)Net increase in trading liabilities 7,509 9,838 8,432Net (increase)/decrease in financial assets and liabilities at fair value through income statement
(30,019) 30,892 2,301
Net decrease/(increase) in other assets 2,444 2,703 (398)Net decrease in other liabilities (6,463) (4,125) (5,781)Corporate income tax paid 11 (150) 462 247Net cash from operating activities 6,263 61,705 7,622Net cash disposed of due to the disposal of the UK banking business - - -Purchase of available for sale investments - (78,524) (64,086)Purchase of financial assets at fair value through other comprehensive income (101,046) - -Proceeds from sale or redemption of available for sale investments - 84,927 100,438Proceeds from sale or redemption of financial assets at fair value through other comprehensive income
101,683 - -
Purchase of property, plant and equipment and intangibles (235) (406) (714)Proceeds from sale of property, plant and equipment and intangibles 63 2,074 (139)Disposal of discontinued operation, net of cash disposed (39,679) - -Disposal of subsidiaries and/or branches, net of cash disposed (2,189) 1,880 595Net (increase)/decrease in investment in subsidiaries (859) (183) 3,344Other cash flows associated with investing activities - 569 (13)Net cash from investing activities (42,262) 10,337 39,425Dividends paid (1,142) (1,428) (982)Issuance of subordinated debt 29 - 3,041 857Redemption of subordinated debt 29 (3,246) (1,371) (1,105)Net issue of shares and other equity instruments 4,691 2,495 1,255Redemption of shares and other equity instruments (3,588) (1,339) (1,378)Capital contribution from Barclays PLC 2,000 - 114Vesting of shares under employee share schemes (418) - -Net cash from financing activities (1,703) 1,398 (1,239)Effect of exchange rates on cash and cash equivalents 3,580 (2,501) 7,400Net (decrease)/increase in cash and cash equivalents from continuing operations (34,122) 70,939 53,208Net cash from discontinued operation 3 (528) 604 2,004Net (decrease)/increase in cash and cash equivalents (34,650) 71,543 55,212Cash and cash equivalents at beginning of year 193,693 122,150 66,938Cash and cash equivalents at end of year 159,043 193,693 122,150Cash and cash equivalents comprise: Cash and balances at central banks 126,002 165,713 97,466Loans and advances to banks with original maturity less than three months 10,648 8,996 8,014Cash collateral and settlement balances with banks with original maturity less than three months
21,476 18,313 16,314
Available for sale treasury and other eligible bills with original maturity less than three months
917 643 356
Trading portfolio assets with original maturity less than three months - 28 -Cash and cash equivalents held for sale - - - 159,043 193,693 122,150 Note a Following the sale of the UK banking business on 1 April 2018 by the Group, the continuing operations for 2016 and 2017 have been restated to disclose the UK banking business
as a discontinued operation. Further detail on the discontinued operations can be found in Note 3 on pages 164 to 167.
home.barclays/annualreport Barclays Bank PLC Annual Report 155

Financial statements of Barclays Bank PLC Parent company accounts
Interest received by Barclays Bank PLC was £18,020m (2017: £13,536m) and interest paid by Barclays Bank PLC was £16,610m (2017: £5,651m). Barclays Bank PLC was required to maintain balances with central banks and other regulatory authorities of £2,261m (2017: £1,207m). For the purposes of the cash flow statement, cash comprises cash on hand and demand deposits and cash equivalents comprise highly liquid investments that are convertible into cash with an insignificant risk of changes in value with original maturities of three months or less. Repurchase and reverse repurchase agreements are not considered to be part of cash equivalents.
home.barclays/annualreport Barclays Bank PLC Annual Report 156

Notes to the financial statements For the year ended 31 December 2018
This section describes Barclays Bank Group’s significant policies and critical accounting estimates that relate to the financial statements and notes as a whole. If an accounting policy or a critical accounting estimate relates to a particular note, the accounting policy and/or critical accounting estimate is contained with the relevant note. 1 Significant accounting policies 1. Reporting entity Barclays Bank PLC is a public limited company, registered in England under company number 1026167. These financial statements are prepared for Barclays Bank PLC and its subsidiaries (the Barclays Bank Group) under Section 399 of the Companies Act 2006. The Barclays Bank Group is a major global financial services provider engaged in credit cards, wholesale banking, investment banking, wealth management and investment management services. In addition, individual financial statements have been presented for the holding company. 2. Compliance with International Financial Reporting Standards The consolidated financial statements of the Barclays Bank Group, and the individual financial statements of Barclays Bank PLC, have been prepared in accordance with International Financial Reporting Standards (IFRS) and interpretations (IFRICs) issued by the Interpretations Committee, as published by the International Accounting Standards Board (IASB). They are also in accordance with IFRS and IFRIC interpretations endorsed by the European Union. The principal accounting policies applied in the preparation of the consolidated and individual financial statements are set out below, and in the relevant notes to the financial statements. These policies have been consistently applied with the exception of the adoption of IFRS 9 Financial Instruments including the early adoption of Prepayment Features with Negative Compensation (Amendments to IFRS 9), IFRS 15 Revenue from Contracts with Customers and the amendments to IFRS 2 Share-based Payment from 1 January 2018. 3. Basis of preparation The consolidated and individual financial statements have been prepared under the historical cost convention modified to include the fair valuation of investment property, and particular financial instruments, to the extent required or permitted under IFRS as set out in the relevant accounting policies. They are stated in millions of pounds Sterling (£m), the functional currency of Barclays Bank PLC. The financial statements have been prepared on a going concern basis, in accordance with the Companies Act 2006 as applicable to companies using IFRS. 4. Accounting policies The Barclays Bank Group prepares financial statements in accordance with IFRS. The Barclays Bank Group’s significant accounting policies relating to specific financial statement items, together with a description of the accounting estimates and judgements that were critical to preparing them, are set out under the relevant notes. Accounting policies that affect the financial statements as a whole are set out below. (i) Consolidation Barclays Bank Group applies IFRS 10 Consolidated financial statements. The consolidated financial statements combine the financial statements of Barclays Bank PLC and all its subsidiaries. Subsidiaries are entities over which Barclays Bank PLC has control. The Barclays Bank Group has control over another entity when the Barclays Bank Group has all of the following: 1) power over the relevant activities of the investee, for example through voting or other rights 2) exposure to, or rights to, variable returns from its involvement with the investee and 3) the ability to affect those returns through its power over the investee. The assessment of control is based on the consideration of all facts and circumstances. The Barclays Bank Group reassesses whether it controls an investee if facts and circumstances indicate that there are changes to one or more of the three elements of control. Intra-group transactions and balances are eliminated on consolidation. Consistent accounting policies are used throughout the Barclays Bank Group for the purposes of the consolidation. Changes in ownership interests in subsidiaries are accounted for as equity transactions if they occur after control has already been obtained and they do not result in loss of control. As the consolidated financial statements include partnerships where the Barclays Bank Group member is a partner, advantage has been taken of the exemption under Regulation 7 of the Partnership (Accounts) Regulations 2008 with regard to preparing and filing of individual partnership financial statements. Details of the principal subsidiaries are given in Note 36, and a complete list of all subsidiaries is presented in Note 44. (ii) Foreign currency translation The Barclays Bank Group applies IAS 21 The Effects of Changes in Foreign Exchange Rates. Transactions in foreign currencies are translated into Sterling at the rate ruling on the date of the transaction. Foreign currency monetary balances are translated into Sterling at the period end exchange rates. Exchange gains and losses on such balances are taken to the income statement. Non-monetary foreign currency balances are carried at historical transaction date exchange rates.
home.barclays/annualreport Barclays Bank PLC Annual Report 157

Notes to the financial statements For the year ended 31 December 2018
1 Significant accounting policies continued The Barclays Bank Group’s foreign operations (including subsidiaries, joint ventures, associates and branches) based mainly outside the UK may have different functional currencies. The functional currency of an operation is the currency of the main economy to which it is exposed. Prior to consolidation (or equity accounting) the assets and liabilities of non-Sterling operations are translated at the period end exchange rate and items of income, expense and other comprehensive income are translated into Sterling at the rate on the date of the transactions. Exchange differences arising on the translation of foreign operations are included in currency translation reserves within equity. These are transferred to the income statement when the Barclays Bank Group disposes of the entire interest in a foreign operation, when partial disposal results in the loss of control of an interest in a subsidiary, when an investment previously accounted for using the equity method is accounted for as a financial asset, or on the disposal of an autonomous foreign operation within a branch. (iii) Financial assets and liabilities The Barclays Bank Group applies IFRS 9 Financial Instruments to the recognition, classification and measurement, and derecognition of financial assets and financial liabilities and the impairment of financial assets. The Barclays Bank Group applies the requirements of IAS 39 Financial Instruments: Recognition and Measurement for hedge accounting purposes. Recognition The Barclays Bank Group recognises financial assets and liabilities when it becomes a party to the terms of the contract. Trade date or settlement date accounting is applied depending on the classification of the financial asset. Classification and measurement Financial assets are classified on the basis of two criteria: i) the business model within which financial assets are managed; and ii) their contractual cash flow characteristics (whether the cash flows represent ‘solely payments of principal and interest’ (SPPI)). The Barclays Bank Group assesses the business model criteria at a portfolio level. Information that is considered in determining the applicable business model includes (i) policies and objectives for the relevant portfolio, (ii) how the performance and risks of the portfolio are managed, evaluated and reported to management, and (iii) the frequency, volume and timing of sales in prior periods, sales expectation for future periods, and the reasons for such sales. The contractual cash flow characteristics of financial assets are assessed with reference to whether the cash flows represent SPPI. In assessing whether contractual cash flows are SPPI compliant, interest is defined as consideration primarily for the time value of money and the credit risk of the principal outstanding. The time value of money is defined as the element of interest that provides consideration only for the passage of time and not consideration for other risks or costs associated with holding the financial asset. Terms that could change the contractual cash flows so that it would not meet the condition for SPPI are considered, including: (i) contingent and leverage features, (ii) non-recourse arrangements and (iii) features that could modify the time value of money. Financial assets will be measured at amortised cost if they are held within a business model whose objective is to hold financial assets in order to collect contractual cash flows, and their contractual cash flows represent SPPI. Financial assets will be measured at fair value through other comprehensive income if they are held within a business model whose objective is achieved by both collecting contractual cash flows and selling financial assets, and their contractual cash flows represent SPPI. Other financial assets are measured at fair value through profit and loss. There is an option to make an irrevocable election on initial recognition for non-traded equity investments to be measured at fair value through other comprehensive income, in which case dividends are recognised in profit or loss, but gains or losses are not reclassified to profit or loss upon derecognition, and impairment is not recognised in the income statement. The accounting policy for each type of financial asset or liability is included within the relevant note for the item. The Barclays Bank Group’s policies for determining the fair values of the assets and liabilities are set out in Note 18. Derecognition The Barclays Bank Group derecognises a financial asset, or a portion of a financial asset, from its balance sheet where the contractual rights to cash flows from the asset have expired, or have been transferred, usually by sale, and with them either substantially all the risks and rewards of the asset or significant risks and rewards, along with the unconditional ability to sell or pledge the asset. Financial liabilities are de-recognised when the liability has been settled, has expired or has been extinguished. An exchange of an existing financial liability for a new liability with the same lender on substantially different terms – generally a difference of 10% in the present value of the cash flows or a substantive qualitative amendment – is accounted for as an extinguishment of the original financial liability and the recognition of a new financial liability. Transactions in which the Barclays Bank Group transfers assets and liabilities, portions of them, or financial risks associated with them can be complex and it may not be obvious whether substantially all of the risks and rewards have been transferred. It is often necessary to perform a quantitative analysis. Such an analysis compares the Barclays Bank Group’s exposure to variability in asset cash flows before the transfer with its retained exposure after the transfer. A cash flow analysis of this nature may require judgement. In particular, it is necessary to estimate the asset’s expected future cash flows as well as potential variability around this expectation. The method of estimating expected future cash flows depends on the nature of the asset, with market and market-implied data used to the greatest extent possible. The potential variability around this expectation is typically determined by stressing
home.barclays/annualreport Barclays Bank PLC Annual Report 158

1 Significant accounting policies continued underlying parameters to create reasonable alternative upside and downside scenarios. Probabilities are then assigned to each scenario. Stressed parameters may include default rates, loss severity, or prepayment rates. Accounting for reverse repurchase and repurchase agreements including other similar lending and borrowing Reverse repurchase agreements (and stock borrowing or similar transaction) are a form of secured lending whereby the Barclays Bank Group provides a loan or cash collateral in exchange for the transfer of collateral, generally in the form of marketable securities subject to an agreement to transfer the securities back at a fixed price in the future. Repurchase agreements are where the Barclays Bank Group obtains such loans or cash collateral, in exchange for the transfer of collateral. The Barclays Bank Group purchases (a reverse repurchase agreement) or borrows securities subject to a commitment to resell or return them. The securities are not included in the balance sheet as the Barclays Bank Group does not acquire the risks and rewards of ownership. Consideration paid (or cash collateral provided) is accounted for as a loan asset at amortised cost, unless it is designated at fair value through profit and loss. The Barclays Bank Group may also sell (a repurchase agreement) or lend securities subject to a commitment to repurchase or redeem them. The securities are retained on the balance sheet as the Barclays Bank Group retains substantially all the risks and rewards of ownership. Consideration received (or cash collateral provided) is accounted for as a financial liability at amortised cost, unless it is designated at fair value through profit and loss. (iv) Issued debt and equity instruments The Barclays Bank Group applies IAS 32, Financial Instruments: Presentation, to determine whether funding is either a financial liability (debt) or equity. Issued financial instruments or their components are classified as liabilities if the contractual arrangement results in the Barclays Bank Group having an obligation to either deliver cash or another financial asset, or a variable number of equity shares, to the holder of the instrument. If this is not the case, the instrument is generally an equity instrument and the proceeds included in equity, net of transaction costs. Dividends and other returns to equity holders are recognised when paid or declared by the members at the AGM and treated as a deduction from equity. Where issued financial instruments contain both liability and equity components, these are accounted for separately. The fair value of the debt is estimated first and the balance of the proceeds is included within equity. 5. New and amended standards and interpretations The accounting policies adopted are consistent with those of the previous financial year, with the exception of the adoption of IFRS 9 Financial Instruments including the early adoption of Prepayment Features with Negative Compensation (Amendments to IFRS 9), IFRS 15 Revenue from Contracts with Customers and the amendments to IFRS 2 Share-based Payment from 1 January 2018. IFRS 9 – Financial Instruments IFRS 9 Financial Instruments replaces IAS 39 Financial Instruments: Recognition and Measurement. IFRS 9 introduces key changes in the following areas: Classification and measurement – requiring asset classification and measurement based upon both business model and product characteristics Impairment – introducing an expected credit loss model using forward looking information which replaces an incurred loss model. The expected
credit loss model introduces a three-stage approach to impairment as follows: Stage 1 – the recognition of 12 month expected credit losses (ECL), that is the portion of lifetime expected credit losses from default events that are expected within 12 months of the reporting date, if credit risk has not increased significantly since initial recognition; Stage 2 – lifetime expected credit losses for financial instruments for which credit risk has increased significantly since initial recognition; and Stage 3 – lifetime expected credit losses for financial instruments which are credit impaired. Refer to note 9 for further details regarding the impairment requirements of IFRS 9. As required by IFRS 9 the Barclays Bank Group applied IFRS 9 retrospectively by adjusting the opening balance sheet at the date of initial application, and comparative periods have not been restated; for more detail refer to Note 43. IFRS 15 – Revenue from Contracts with Customers IFRS 15 Revenue from Contracts with Customers replaces IAS 18 Revenue and IAS 11 Construction Contracts. IFRS 15 establishes a more systematic approach for revenue measurement and recognition by introducing a five-step model governing revenue recognition. The five-step model includes: 1) identifying the contract with the customer, 2) identifying each of the performance obligations included in the contract, 3) determining the amount of consideration in the contract, 4) allocating the consideration to each of the identified performance obligations and 5) recognising revenue as each performance obligation is satisfied. The Barclays Bank Group elected the cumulative effect transition method with a transition adjustment calculated as of 1 January 2018, and recognised in retained earnings without restating comparative periods. There were no significant impacts from the adoption of IFRS 15 in relation to the timing of when the Barclays Bank Group recognises revenues or when revenue should be recognised gross as a principal or net as an agent; for more detail refer to Note 43. IFRS 2 – Share-based Payment – Amendments to IFRS 2 The IASB issued amendments to IFRS 2 Share-based Payment that address three main areas: the effects of vesting conditions on the measurement of a cash-settled share-based payment transaction; the classification of a share-based payment transaction with net settlement features for withholding tax obligations; and accounting where a modification to the terms and conditions of a share-based payment transaction changes its classification from cash settled to equity settled. The amendments are effective for annual periods beginning on or after 1 January 2018. Adoption of the amendments did not have a significant impact on the Barclays Bank Group.
home.barclays/annualreport Barclays Bank PLC Annual Report 159

Notes to the financial statements For the year ended 31 December 2018
1 Significant accounting policies continued Future accounting developments There have been and are expected to be a number of significant changes to the Barclays Bank Group’s financial reporting after 2018 as a result of amended or new accounting standards that have been or will be issued by the IASB. The most significant of these are as follows: IFRS 16 – Leases In January 2016 the IASB issued IFRS 16 Leases, which was subsequently endorsed by the EU in November 2017, and will replace IAS 17 Leases for period beginning on or after 1 January 2019. IFRS 16 will apply to all leases with the exception of licenses of intellectual property, rights held by licensing agreement within the scope of IAS 38 Intangible Assets, service concession arrangements, leases of biological assets within the scope of IAS 41 Agriculture, and leases of minerals, oil, natural gas and similar non-regenerative resources. A lessee may elect not to apply IFRS 16 to remaining assets within the scope of IAS 38 Intangible Assets. IFRS 16 will not result in a significant change to lessor accounting; however for lessee accounting there will no longer be a distinction between operating and finance leases. Lessees will be required to recognise both: a lease liability, measured at the present value of remaining cash flows on the lease, and; a right of use (ROU) asset, measured at the amount of the initial measurement of the lease liability, plus any lease payments made prior to
commencement date, initial direct costs, and estimated costs of restoring the underlying asset to the condition required by the lease, less any lease incentives received.
There is a recognition exception for leases with a term not exceeding 12 months which allows the lessee to apply similar accounting as an operating lease under IAS 17. Subsequently the lease liability will increase for the accrual of interest, resulting in a constant rate of return throughout the life of the lease, and reduce when payments are made. The right of use asset will amortise to the income statement over the life of the lease. The Barclays Bank Group IFRS 16 implementation and governance programme has been led by Finance with representation from all impacted departments. The project has identified the contracts impacted by IFRS 16, which are predominantly existing property leases. Other lease types are not material. The project has also established appropriate accounting policies, determined the appropriate transition options to apply, and updated Finance systems and processes to reflect the new accounting and disclosure requirements. As permitted by the standard, the Barclays Bank Group intends to apply IFRS 16 on a retrospective basis but to take advantage of the option not to restate comparative periods by applying the modified retrospective approach. The Barclays Bank Group intends to take advantage of the following transition options available under the modified retrospective approach: To calculate the right of use asset equal to the lease liability, adjusted for prepaid or accrued payments; To rely on the previous assessment of whether leases are onerous in accordance with IAS 37 immediately before the date of initial application as
an alternative to performing an impairment review. The Barclays Bank Group will adjust the carrying amount of the ROU asset at the date of initial application by the previous carrying amount of its onerous lease provision; Apply the recognition exception for leases with a term not exceeding 12 months; and Use hindsight in determining the lease term if the contract contains options to extend or terminate the lease. The expected impact of adopting IFRS 16 is an increase in assets of £0.4bn, an increase in liabilities of £0.4bn with no material impact on retained earnings. This impact assessment has been estimated under an interim control environment. The implementation of the comprehensive end state control environment will continue as the Barclays Bank Group introduces business as usual controls through 2019. IFRS 17 – Insurance contracts In May 2017, the IASB issued IFRS 17 Insurance Contracts, a comprehensive new accounting standard for insurance contracts covering recognition and measurement, presentation and disclosure. Once effective, IFRS 17 will replace IFRS 4 Insurance Contracts that was issued in 2005. IFRS 17 applies to all types of insurance contracts (i.e. life, non-life, direct insurance and re-insurance), regardless of the type of entities that issue them, as well as to certain guarantees and financial instruments with discretionary participation features. A few scope exceptions will apply. The standard is currently effective from 1 January 2021, and the standard has not yet been endorsed by the EU. The Barclays Bank Group is currently assessing the expected impact of adopting this standard. IFRIC Interpretation 23 – Uncertainty over Income Tax Treatment IFRIC 23 clarifies the application of IAS 12 to accounting for income tax treatments that have yet to be accepted by tax authorities, in scenarios where it may be unclear how tax law applies to a particular transaction or circumstance, or whether a taxation authority will accept an entity’s tax treatment. The effective date is 1 January 2019. The Barclays Bank Group has considered the guidance included within the interpretation and concluded that the prescribed approach under IFRIC 23 is not expected to have a material impact on the Barclays Bank Group’s financial position. IAS 12 – Income Taxes – Amendments to IAS 12 In December 2017, as part of the Annual Improvements to IFRS Standards 2015-2017 Cycle, the IASB amended IAS 12 in order to clarify the accounting treatment of the income tax consequences of dividends. Effective from 1 January 2019 the tax consequences of all payments on financial instruments that are classified as equity for accounting purposes, where those payments are considered to be a distribution of profit, will be included in, and will reduce, the income statement tax charge. Refer to note 11 for the expected impact of adopting the amendments of IAS 12.
home.barclays/annualreport Barclays Bank PLC Annual Report 160

1 Significant accounting policies continued IAS 19 – Employee Benefits – Amendments to IAS 19 In February 2018 the IASB issued amendments to the guidance in IAS 19 Employee Benefits, in connection with accounting for plan amendments, curtailments and settlements. The amendments must be applied to plan amendments, curtailments or settlements occurring on or after the beginning of the first annual reporting period that begins on or after 1 January 2019. The amendments have not yet been endorsed by the EU. Adoption of the amendments is not expected to have significant impact on the Barclays Bank Group. 6. Critical accounting estimates and judgements The preparation of financial statements in accordance with IFRS requires the use of estimates. It also requires management to exercise judgement in applying the accounting policies. The key areas involving a higher degree of judgement or complexity, or areas where assumptions are significant to the consolidated and individual financial statements are highlighted under the relevant note. Critical accounting estimates and judgements are disclosed in: Credit impairment charges on pages 173 to 178 Tax on pages 178 to 184 Fair value of financial instruments on pages 199 to 215 Pensions and post-retirement benefits – obligations on pages 249 to 254 Provisions including conduct and legal, competition and regulatory matters on pages 227 to 236 7. Other disclosures To improve transparency and ease of reference, by concentrating related information in one place, certain disclosures required under IFRS have been included within the Risk review section as follows: Credit risk on pages 45 to 47 and on pages 60 to 94 Market risk on pages 48 to 49 and on pages 96 to 97 Treasury and capital risk – liquidity on pages 50 to 51 and on pages 99 to 107 Treasury and capital risk – capital on pages 51 to 52 and pages 108 to 115 These disclosures are covered by the Audit opinion (included on pages 133 to 144) where referenced as audited. 2 Disposal of business and transfer of ownership of subsidiary Following the court approval of the ring-fencing transfer scheme on 9 March 2018, the UK banking business largely comprising Personal Banking, Barclaycard Consumer UK and Business Banking customers, and related assets and liabilities was transferred to Barclays Bank UK PLC on 1 April 2018, to meet the regulatory ring-fencing requirement under the Financial Services (Banking Reform) Act 2013 and related legislation. The net assets transferred to Barclays Bank UK PLC on 1 April 2018 amounted to £15.9bn of which £12.9bn was transferred in exchange for one ordinary share with the remaining net assets transferred for no consideration. Following the transfer of the UK banking business on 1 April 2018, Barclays Bank PLC transferred the equity ownership in Barclays Bank UK PLC to Barclays PLC through a dividend in specie on the same day. The equity ownership in Barclays Bank UK PLC comprised net assets of £16.2bn, of which £0.3bn was already held by Barclays Bank UK PLC prior to the transfer of the UK banking business. Accordingly, Barclays Bank UK PLC ceased to be a subsidiary of Barclays Bank PLC and became a direct subsidiary of the ultimate parent, Barclays PLC. The consolidated financial statements of Barclays Bank Group as at 31 December 2018 include the results of Barclays Bank UK PLC and its subsidiaries for the three months ended 31 March 2018, the date prior to the transfer of ownership to Barclays PLC.
home.barclays/annualreport Barclays Bank PLC Annual Report 161

Notes to the financial statements For the year ended 31 December 2018For the year ended 31 December 2018
The transfer of the ownership of Barclays Bank UK PLC to Barclays PLC has resulted in a material change to the consolidated financial position and results of Barclays Bank Group in comparison to the prior period. The impact on the individual balance sheet line items as a result of the transfer of ownership is explained below: Barclays Bank Group Disposal of Barclays Bank
UK PLCa Other disposalsb Total
Assets £m £m £m
Cash and balances at central banks 37,380 - 37,380Cash collateral and settlement balances 2,317 - 2,317Loans and advances at amortised cost 184,634 - 184,634Reverse repurchase agreements and other similar secured lending 415 - 415Financial assets at fair value through the income statement 5,616 536 6,152Derivative financial instruments 108 - 108Financial assets at fair value through other comprehensive income 5,544 1,261 6,805Goodwill and intangible assets 3,537 - 3,537Property, plant and equipment 510 - 510Current tax assets - 15 15Deferred tax assets 747 - 747Other assets 1,402 6 1,408Total assets 242,210 1,818 244,028 Liabilities Deposits at amortised cost 192,087 643 192,730Repurchase agreements and other similar secured borrowing 11,567 - 11,567Debt securities in issue 12,303 - 12,303Subordinated liabilities 3,001 - 3,001Trading portfolio liabilities 1,765 - 1,765Financial liabilities designated at fair value - 18 18Derivative financial instruments 6 - 6Current tax liabilities 677 3 680Other liabilities 1,642 5 1,647Provisions 2,305 1 2,306Total liabilities 225,353 670 226,023 Notes a The movement in net assets relating to the disposal of Barclays Bank UK PLC of £16,865m is stated after the elimination of internal balances between Barclays Bank PLC and
Barclays Bank UK PLC on 1 April 2018 of £615m. b The movement in net assets relating to the disposal of BAGHL is presented in Other disposals. The movement is stated after the elimination of internal balances of £88m.
The narrative below provides further granularity of the items transferred as part of the disposal of the UK banking business to Barclays Bank UK PLC. The items transferred included (but were not limited to): Loans and advances at amortised cost of £184,634m related to the UK banking business. The portfolio transferred included home loans of
£133,641m, credit cards and unsecured loans of £22,621m, and corporate loans of £27,396m The disposed assets measured at fair value through the income statement consisted of loans and advances of £4,233m, and reverse repurchase
agreements and other similar secured lending of £1,383m Derivative assets and liabilities disposed consisted of those designated in hedge accounting relationships. The notional amount at the date of
transfer was £3,313m, the fair value of the derivative assets was £108m and the fair value of the derivative liabilities was £6m Goodwill relating to the UK banking business with a net book value of £3,526m and licences and other intangible assets with a net book value
amounting to £11m (gross cost of £90m and accumulated amortisation and impairment of £79m) Property, plant and equipment with a net book value of £510m (gross cost of £971m and accumulated depreciation of £461m) Deferred tax asset balances of £747m and current tax liabilities of £677m relating to the UK banking business Other assets of £1,402m included prepayments of £106m, items in the course of collection of £588m, sundry receivables of £535m and accrued
income of £146m Deposits at amortised cost of £192,087m consisted of current, savings and time deposits of UK banking business customers and deposits with
banks Debt securities in issue transferred consisted of covered bonds of £8,302m and other debt securities of £4,001m Other liabilities of £1,642m included accruals and deferred income of £278m, and sundry creditors of £1,160m
home.barclays/annualreport Barclays Bank PLC Annual Report 162

2 Disposal of business and transfer of ownership of subsidiary continued The transfer of equity ownership in Barclays Bank UK PLC had no impact on the share capital and share premium of Barclays Bank Group. Other equity instruments reduced by £2,070m relating to additional tier 1 (AT1) securities transferred to Barclays Bank UK PLC. The fair value through other comprehensive income reserve increased £16m and retained earnings reduced £14,187m. On 1 August 2018 Barclays Bank PLC transferred the equity ownership of its subsidiary Barclays Africa Group Holdings Limited (BAGHL) to Barclays PLC through a dividend in specie. Accordingly, BAGHL ceased to be a subsidiary of Barclays Bank PLC and became a direct subsidiary of the ultimate parent, Barclays PLC. The value of this dividend, representing the historic cost of investment of Barclays Bank PLC in BAGHL was £269m. The movement is presented within Other disposals. Barclays Bank PLC Disposal of Barclays Bank
UK PLCa Other disposalsb Total
Assets £m £m
Cash and balances at central banks 37,299 2,503 39,802Cash collateral and settlement balances 2,338 - 2,338Loans and advances at amortised cost 184,732 3,287 188,019Reverse repurchase agreements and other similar secured lending 423 - 423Financial assets at fair value through the income statement 5,616 - 5,616Derivative financial instruments 24 - 24Financial assets at fair value through other comprehensive income 5,539 - 5,539Investment in subsidiaries 246 269 515Goodwill and intangible assets 3,390 36 3,426Property, plant and equipment 510 10 520Deferred tax assets 747 62 809Other assets 1,166 48 1,214Total assets 242,030 6,215 248,245 Liabilities Deposits at amortised cost 193,247 5,418 198,665Repurchase agreements and other similar secured borrowing 11,567 - 11,567Debt securities in issue 11,552 - 11,552Subordinated liabilities 3,001 - 3,001Trading portfolio liabilities 1,765 - 1,765Derivative financial instruments 6 - 6Current tax liabilities 676 - 676Retirement benefit liabilities - 25 25Other liabilities 1,341 184 1,525Provisions 2,230 8 2,238Total liabilities 225,385 5,635 231,020 Notes a The movement in net assets relating to the disposal of Barclays Bank UK PLC of £16,645m is stated after the elimination of internal balances between Barclays Bank PLC and
Barclays Bank UK PLC on 1 April 2018 of £519m. b The movement relating to the disposal of BAGHL and the BBPLC German branch is presented in Other disposals.
Following a decision to move all European operations to Barclays Bank Ireland PLC, the German business largely comprising of Barclaycard and Corporate Banking customers was acquired from Barclays Bank PLC on 1 December 2018. The assets and liabilities were recognised by Barclays Bank Ireland PLC at their predecessor book values in the consolidated financial statements of Barclays Bank PLC on the date of transfer. The total net assets transferred to Barclays Bank Ireland PLC were £312m. The net assets were transferred in exchange for 350m ordinary shares issued by Barclays Bank Ireland PLC and £1.3m of cash. The movement in net assets related to this transfer is presented within Other disposals.
home.barclays/annualreport Barclays Bank PLC Annual Report 163

Notes to the financial statements For the year ended 31 December 2018For the year ended 31 December 2018
3 Discontinued operations and assets included in disposal groups classified as held for sale and associated liabilities Accounting for non-current assets held for sale and associated liabilities The Barclays Bank Group applies IFRS 5 Non-current Assets Held for Sale and Discontinued Operations. Non-current assets (or disposal groups) are classified as held for sale when their carrying amount is to be recovered principally through a sale transaction rather than continuing use. In order to be classified as held for sale, the asset must be available for immediate sale in its present condition subject only to terms that are usual and customary and the sale must be highly probable. Non-current assets (or disposal groups) held for sale are measured at the lower of carrying amount and fair value less cost to sell. A component of the Barclays Bank Group that has either been disposed of or is classified as held for sale is presented as a discontinued operation if it represents a separate major line of business or geographical area of operations, is part of a single coordinated plan to dispose of the separate major line or geographical area of operations, or if it is a subsidiary acquired exclusively with a view to re-sale. Barclays Bank Group Assets included in disposal groups classified as held for sale
2018 2017
£m £m
Financial assets at fair value through the income statement - 3
Loans and advances at amortised cost - 1,164
Property, plant and equipment - 26
Total assets included in disposal groups classified as held for sale - 1,193
During the period year the non-current assets held for sale balance decreased from £1,193m to £nil driven by the disposal of Barclaycard US receivables portfolio of £1,164m. Discontinued operations The loss or profit in respect of discontinued operations for each of the years comprises as follows: for 2018 discontinued operations relating to the UK banking business incurred a loss after tax of £47m; for 2017 discontinued operations incurred a loss after tax of £1,386m made up from a £2,195 loss relating to BAGL partially offset by a profit of £809m relating to the UK banking business; and for 2016 discontinued operations incurred a profit after tax of £2,137m made up from a £1,546m profit relating to UK banking business and a profit of £591m relating to BAGL. UK banking business As noted in Note 2, following the court approval of the ring-fencing transfer scheme on 9 March 2018, the UK banking business largely comprising Personal Banking, Barclaycard Consumer UK and Business Banking customers, and related assets and liabilities was transferred to Barclays Bank UK PLC on 1 April 2018, to meet the regulatory ring-fencing requirement under the Financial Services (Banking Reform) Act 2013 and related legislation. Barclays Bank PLC transferred the equity ownership in Barclays Bank UK PLC to Barclays PLC through a dividend in specie on the same day. Accordingly, Barclays Bank UK PLC ceased to be a subsidiary of Barclays Bank PLC and became a direct subsidiary of the ultimate parent, Barclay PLC. Upon disposal of those shares on 1 April 2018, the UK banking business met the requirements for presentation as a discontinued operation. As such, the results, which have been presented as the profit after tax in respect of the discontinued operation on the face of the Barclays Bank Group income statement, are analysed in the income statement below. The income statement, statement of other comprehensive income and cash flow statement below represent three months of results as a discontinued operation to 31 March 2018, compared to the full years ended 31 December 2017 and 31 December 2016.
home.barclays/annualreport Barclays Bank PLC Annual Report 164

UK banking business disposal group income statement
2018 2017 2016
For the year ended 31 December £m £m £m
Net interest income 1,449 5,872 6,681
Net fee and commission income 296 1,176 1,247
Net trading income (5) (9) 79
Net investment income 6 160 247
Other income 2 8 13
Total income 1,748 7,207 8,267
Credit impairment charges and other provisions (201) (783) (896)
Net operating income 1,547 6,424 7,371
Staff costs (321) (2,052) (2,379)
Administration and general expenses (1,135) (2,959) (2,502)
Operating expenses (1,456) (5,011) (4,881)
Share of post-tax results of associates and joint ventures - (5) (1)
Profit before tax 91 1,408 2,489
Taxation (138) (599) (943)
(Loss)/profit after tax (47) 809 1,546
Attributable to:
Equity holders of the parent (47) 809 1,546
Non-controlling interests - - -
(Loss)/profit after tax (47) 809 1,546
Other comprehensive loss relating to UK banking business discontinued operations is as follows:
2018 2017 2016
For the year ended 31 December £m £m £m
Available for sale assets - - -
Fair value through other comprehensive income reserve (3) - -
Currency translation reserves - - -
Cash flow hedge reserves - - -
Other comprehensive loss, net of tax from discontinued operations (3) - -
The cash flows attributed to the UK banking business discontinued operation are as follows:
2018 2017 2016
For the year ended 31 December £m £m £m
Net cash flows from operating activities (522) (355) 1,319
Net cash flows from investing activities 54 470 22
Net cash flows from financing activities - (128) 600
Net (decrease)/increase in cash and cash equivalents (468) (13) 1,941
home.barclays/annualreport Barclays Bank PLC Annual Report 165

Notes to the financial statements For the year ended 31 December 2018For the year ended 31 December 2018
The following table contains a reconciliation between the Barclays Bank Group continuing operations income statement for 2017 and 2016, which has been restated to show the UK banking business as a discontinued operation, and the equivalent income statement as published in the prior periods. Reconciliation of consolidated income statement to prior periods
Published
annual report
UK banking business
discontinued operationsa
Restated continuing operations
Published annual report
UK banking business
discontinued operationsa
Restated continuing operations
2017 2017 2017 2016 2016 2016For the year ended 31 December £m £m £m £m £m £m
Interest income 13,631 6,714 6,917 14,423 7,532 6,891
Interest expense (3,883) (842) (3,041) (2,966) (851) (2,115)
Net interest income 9,748 5,872 3,876 11,457 6,681 4,776
Fee and commission income 8,775 1,351 7,424 8,625 1,410 7,215
Fee and commission expense (1,901) (175) (1,726) (1,789) (163) (1,626)
Net fee and commission income 6,874 1,176 5,698 6,836 1,247 5,589
Net trading income 3,387 (9) 3,396 2,795 79 2,716
Net investment income 859 160 699 1,324 247 1,077
Other income 69 8 61 57 13 44
Total income 20,937 7,207 13,730 22,469 8,267 14,202
Credit impairment charges and other provisions (2,336) (783) (1,553) (2,373) (896) (1,477)
Net operating income 18,601 6,424 12,177 20,096 7,371 12,725
Staff costs (6,445) (2,052) (4,393) (9,211) (2,379) (6,832)
Infrastructure costs (2,068) (372) (1,696) (2,937) (598) (2,339)
Administration and general expensesb (5,969) (1,828) (4,141) (2,837) (862) (1,975)
Litigation and conductb (1,207) (759) (448) (1,363) (1,042) (321)
Operating expenses (15,689) (5,011) (10,678) (16,348) (4,881) (11,467)
Share of post-tax results of associates and joint ventures 70 (5) 75 70 (1) 71
Profit on disposal of subsidiaries, associates and joint ventures 184 - 184 565 - 565
Profit before tax 3,166 1,408 1,758 4,383 2,489 1,894
Tax charge (2,125) (599) (1,526) (1,245) (943) (302)
Profit after tax 1,041 809 232 3,138 1,546 1,592
Notes a Adjustment for restatement of UK banking business as discontinued operation. b The presentation of administration and general expenses has been amended to include litigation and conduct as a separate line item. The prior year comparatives within
administration and general expenses categories have been adjusted accordingly. Barclays Africa Group Limited Following the reduction of the Barclays Bank Group’s interest in BAGL in 2017, Barclays Bank Groups remaining interest in BAGL was reported as a financial asset at fair value through other comprehensive income. On 1 August 2018 Barclays Bank PLC transferred the equity ownership of its subsidiary Barclays Africa Group Holdings (BAGHL) to Barclays PLC through a dividend in specie. Prior to the disposal of shares on 1 June 2017, BAGL met the requirements for presentation as a discontinued operation. As such, the results, which have been presented as the profit after tax and non-controlling interest in respect of the discontinued operation on the face of the Barclays Bank Group income statement, are analysed in the income statement below. The income statement, statement of other comprehensive income and cash flow statement below represent five months of results as a discontinued operation to 31 May 2017, compared to the full year ended 31 December 2016.
home.barclays/annualreport Barclays Bank PLC Annual Report 166

Barclays Africa disposal group income statement
2018 2017 2016
For the year ended 31 December £m £m £m
Net interest income - 1,024 2,169
Net fee and commission income - 522 1,072
Net trading income - 149 281
Net investment income - 30 45
Net premiums from insurance contracts - 161 362
Other income - (16) 8
Total income - 1,870 3,937
Net claims and benefits incurred on insurance contracts - (84) (191)
Total income net of insurance claims - 1,786 3,746
Credit impairment charges and other provisions - (177) (445)
Net operating income - 1,609 3,301
Staff costs - (586) (1,186)
Administration and general expensesa - (1,634) (1,224)
Operating expenses - (2,220) (2,410)
Share of post-tax results of associates and joint ventures - 5 6
(Loss)/profit before tax - (606) 897
Taxation - (154) (306)
(Loss)/profit after taxb - (760) 591
Attributable to:
Equity holders of the parent - (900) 189
Non-controlling interests - 140 402
(Loss)/profit after taxb - (760) 591 Notes a Includes impairment of £nil (2017: £1,090m; 2016: £nil). b Total loss in respect of the discontinued operation was £2,195m which included the £60m loss on sale and £1,375m loss on recycling of other comprehensive loss on reserves.
Other comprehensive income relating to Barclays Africa discontinued operations is as follows:
2018 2017 2016
For the year ended 31 December £m £m £m
Available for sale assets - (3) (9)
Currency translation reserves - (38) 1,451
Cash flow hedge reserves - 19 89
Other comprehensive (loss)/income, net of tax from discontinued operations - (22) 1,531
The cash flows attributed to the Barclays Africa discontinued operation are as follows:
2018 2017 2016
For the year ended 31 December £m £m £m
Net cash flows from operating activities - 540 1,164
Net cash flows from investing activities - (245) (691)
Net cash flows from financing activities - (165) (105)
Effect of exchange rates on cash and cash equivalents - (29) 37
Net increase in cash and cash equivalents - 101 405
home.barclays/annualreport Barclays Bank PLC Annual Report 167

Notes to the financial statements Performance/return
The notes included in this section focus on the results and performance of the Barclays Bank Group. Information on the segmental performance, income generated, expenditure incurred, tax, and dividends are included here. For further detail on performance, please see Strategic Report on pages 4 -15. 4 Segmental reporting Presentation of segmental reporting The Barclays Bank Group’s segmental reporting is in accordance with IFRS 8 Operating Segments. Operating segments are reported in a manner consistent with the internal reporting provided to the Executive Committee, which is responsible for allocating resources and assessing performance of the operating segments, and has been identified as the chief operating decision maker. All transactions between business segments are conducted on an arm’s-length basis, with intra-segment revenue and costs being eliminated in Head Office. Income and expenses directly associated with each segment are included in determining business segment performance. Following the transfer of the UK banking business which largely comprised of Personal Banking, Barclaycard Consumer UK and Business Banking to Barclays Bank UK PLC on 1 April 2018 and the subsequent transfer of ownership of Barclays Bank UK PLC to Barclays PLC on the same day, the Barclays Bank Group divisions have been for segmental reporting purposes defined as Corporate and Investment Bank and Consumer, Cards and Payments. Comparatives have been restated to reflect the new segmentation. Corporate and Investment Bank which includes the international Corporate business and the Investment Bank. Consumer, Cards and Payments which includes Barclays US Consumer Bank, Barclaycard Germany, Barclays Partner Finance, Barclaycard
Commercial Payments, Barclaycard Payment Solutions and the international Wealth business.
The below table also includes Head Office which comprises head office and central support functions. The segment results below reflect the continuing operations of Barclays Bank Group and hence the UK banking business is excluded as it meets the requirement to be presented as a discontinued operation under IFRS 5, Non-current Assets Held for Sale and Discontinued Operations. Analysis of results by business
Corporate and Investment Bank
Consumer, Cards and Payments
Head Office
Barclays Bank Group
£m £m £m £m
For the year ended 31 December 2018
Total incomea 9,741 4,267 (408) 13,600Credit impairment releases/(charges) and other provisions 152 (808) 13 (643)Net operating income/(expenses) 9,893 3,459 (395) 12,957Operating expenses (7,459) (2,304) (130) (9,893)GMP charge - - (140) (140)Litigation and conduct (68) (59) (1,579) (1,706)Total operating expenses (7,527) (2,363) (1,849) (11,739)Other net income/(expenses)b 28 41 (1) 68Profit/(loss) before tax from continuing operations 2,394 1,137 (2,245) 1,286Total assets £792.5bn £71.6bn £13.6bn £877.7bnNumber of employees (full time equivalent) 9,100 3,300 10,000 22,400
Corporate and Investment Bank
Consumer, Cards and Payments
Head Office
Barclays Non-Corec
Barclays Bank Group
£m £m £m £m £m
For the year ended 31 December 2017 Total income 9,901 4,504 (148) (527) 13,730Credit impairment charges and other provisions (213) (1,293) (17) (30) (1,553)Net operating income/(expenses) 9,688 3,211 (165) (557) 12,177Operating expenses (7,610) (2,167) (202) (251) (10,230)Litigation and conduct (267) (2) (151) (28) (448)Total operating expenses (7,877) (2,169) (353) (279) (10,678)Other net income/(expenses)b 133 121 (192) 197 259Profit/(Loss) before tax from continuing operations 1,944 1,163 (710) (639) 1,758Total assetsd £788.7bn £67.4bn £35.8bn - £1,129.3bnNumber of employees (full time equivalent) 8,800 2,700 10,300 - 21,800 Notes a £351m of certain capital instrument funding costs are now charged to Head Office, the impact of which would have been materially the same if the charges had been included in
full year 2017. b Other net income/(expenses) represents the share of post-tax results of associates and joint ventures, profit (or loss) on disposal of subsidiaries, associates and joint ventures,
and gains on acquisitions. c Barclays Non-Core segment was closed on 1 July 2017, with financial performance subsequently reported in CIB, Head Office and Barclays Bank UK PLC. d Total assets for UK banking business are included within Barclays Bank Group for 2017.
home.barclays/annualreport Barclays Bank PLC Annual Report 168

4 Segmental reporting continued
Corporate and Investment Bank
Consumer, Cards and Payments
Head Office
Barclays Non-Core
Barclays Bank Group
£m £m £m £m £m
For the year ended 31 December 2016
Total income 10,552 4,462 354 (1,166) 14,202
Credit impairment charges and other provisions (260) (1,095) - (122) (1,477)
Net operating income/(expenses) 10,292 3,367 354 (1,288) 12,725
Operating expenses (7,588) (1,828) (124) (1,606) (11,146)Litigation and conduct (45) (3) (27) (246) (321)
Total operating expenses (7,633) (1,831) (151) (1,852) (11,467)
Other net incomea 1 31 273 331 636
Profit before tax from continuing operations 2,660 1,567 476 (2,809) 1,894
Total assetsb,c £589.3bn £58.5bn £76.8bn £279.7bn £1,214.0bn
Number of employees (full time equivalent) 28,800 8,100 100 5,500 42,500
Notes a Other net income represents the share of post-tax results of associates and joint ventures, profit (or loss) on disposal of subsidiaries, associates and joint ventures,
and gains on acquisitions. b Africa Banking assets held for sale are reported in Head Office 2016. c Total assets for UK banking business are included within Barclays Bank Group for 2016.
Income by geographic region
2018 2017 2016
For the year ended 31 December £m £m £m
Continuing operations United Kingdom 4,532 3,844 3,856Europe 1,434 1,663 2,078Americas 6,936 7,443 7,278Africa and Middle East 142 251 419Asia 556 529 571Total 13,600 13,730 14,202
Income from individual countries which represent more than 5% of total incomea 2018 2017 2016
For the year ended 31 December £m £m £m
Continuing operations United Kingdom 4,532 3,844 3,856United States 6,676 6,871 6,876 Note a Total income is based on counterparty location. Income from each single external customer does not amount to 10% or greater of the Barclays Bank Group total income.
home.barclays/annualreport Barclays Bank PLC Annual Report 169
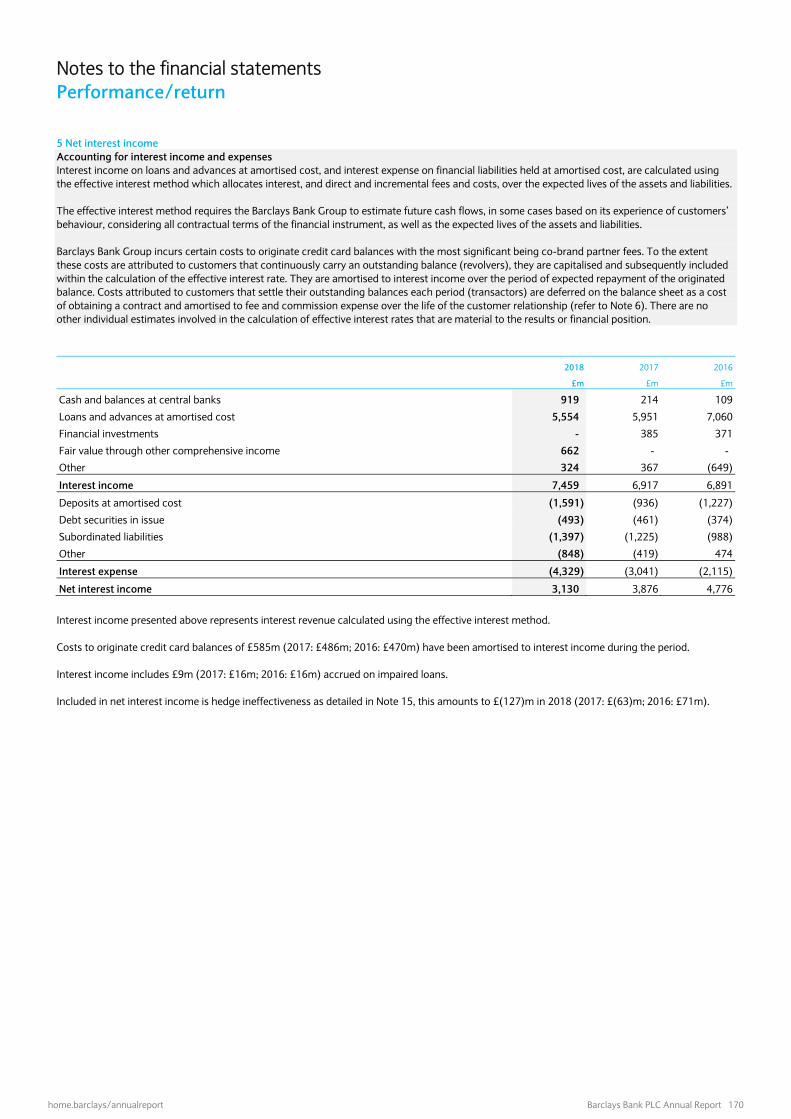
Notes to the financial statements Performance/return
5 Net interest income Accounting for interest income and expenses Interest income on loans and advances at amortised cost, and interest expense on financial liabilities held at amortised cost, are calculated using the effective interest method which allocates interest, and direct and incremental fees and costs, over the expected lives of the assets and liabilities. The effective interest method requires the Barclays Bank Group to estimate future cash flows, in some cases based on its experience of customers’ behaviour, considering all contractual terms of the financial instrument, as well as the expected lives of the assets and liabilities. Barclays Bank Group incurs certain costs to originate credit card balances with the most significant being co-brand partner fees. To the extent these costs are attributed to customers that continuously carry an outstanding balance (revolvers), they are capitalised and subsequently included within the calculation of the effective interest rate. They are amortised to interest income over the period of expected repayment of the originated balance. Costs attributed to customers that settle their outstanding balances each period (transactors) are deferred on the balance sheet as a cost of obtaining a contract and amortised to fee and commission expense over the life of the customer relationship (refer to Note 6). There are no other individual estimates involved in the calculation of effective interest rates that are material to the results or financial position. 2018 2017 2016
£m £m £m
Cash and balances at central banks 919 214 109
Loans and advances at amortised cost 5,554 5,951 7,060
Financial investments - 385 371
Fair value through other comprehensive income 662 - -
Other 324 367 (649)
Interest income 7,459 6,917 6,891
Deposits at amortised cost (1,591) (936) (1,227)
Debt securities in issue (493) (461) (374)
Subordinated liabilities (1,397) (1,225) (988)
Other (848) (419) 474
Interest expense (4,329) (3,041) (2,115)
Net interest income 3,130 3,876 4,776
Interest income presented above represents interest revenue calculated using the effective interest method. Costs to originate credit card balances of £585m (2017: £486m; 2016: £470m) have been amortised to interest income during the period. Interest income includes £9m (2017: £16m; 2016: £16m) accrued on impaired loans. Included in net interest income is hedge ineffectiveness as detailed in Note 15, this amounts to £(127)m in 2018 (2017: £(63)m; 2016: £71m).
home.barclays/annualreport Barclays Bank PLC Annual Report 170

Credit risk management
6 Net fee and commission income Accounting for net fee and commission income under IFRS 15 effective from 1 January 2018 The Barclays Bank Group applies IFRS 15 Revenue from Contracts with Customers. The standard establishes a five-step model governing revenue recognition. The five-step model requires Barclays Bank Group to (i) identify the contract with the customer, (ii) identify each of the performance obligations included in the contract, (iii) determine the amount of consideration in the contract, (iv) allocate the consideration to each of the identified performance obligations and (v) recognise revenue as each performance obligation is satisfied. Barclays Bank Group recognises fee and commission income charged for services provided by the Barclays Bank Group as the services are provided, for example on completion of the underlying transaction. Accounting for net fee and commission income under IAS 18 for 2017 and 2016 The Barclays Bank Group applies IAS 18 Revenue. Fees and commissions charged for services provided or received by the Barclays Bank Group are recognised as the services are provided, for example on completion of the underlying transaction. Fee and commission income is disaggregated below by fee types that reflect the nature of the services offered across the Barclays Bank Group and operating segments, in accordance with IFRS 15. It includes a total for fees in scope of IFRS 15. Refer to Note 4 for more detailed information about operating segments. 2018
Corporate and
Investment Bank
Consumer, Cards and Payments Head Office Total
£m £m £m £m
Fee type
Transactional 366 2,248 - 2,614
Advisory 772 78 - 850
Brokerage and execution 1,002 71 - 1,073
Underwriting and syndication 2,462 - - 2,462
Other 24 222 29 275
Total revenue from contracts with customers 4,626 2,619 29 7,274
Other non-contract fee income 114 4 - 118
Fee and commission income 4,740 2,623 29 7,392
Fee and commission expense (657) (1,128) - (1,785)
Net fee and commission income 4,083 1,495 29 5,607
2017a 2016a
£m £m
Fee and commission income
Banking, investment management and credit related fees and commissions 7,352 7,161
Foreign exchange commission 72 54
Fee and commission income 7,424 7,215
Fee and commission expense (1,726) (1,626)
Net fee and commission income 5,698 5,589 Note a The Barclays Group elected the cumulative effect transition method on adoption of IFRS 15 from 1 January 2018, and recognised in retained earnings without restating
comparative periods. The comparative figures are reported under IAS 18. Fee types Transactional Transactional fees are service charges on deposit accounts, cash management services and transactional processing fees including interchange and merchant fee income generated from credit and bank card usage. Transaction and processing fees are recognised at the point in time the transaction occurs or service is performed. They include banking services such as wire transfer fees, balance transfer fees, overdraft or late fees and foreign exchange fees, among others. Interchange and merchant fees are recognised upon settlement of the card transaction payment. Barclays incurs certain card related costs including those related to cardholder reward programmes and various payments made to co-brand partners. To the extent cardholder reward programmes costs are attributed to customers that settle their outstanding balance each period (transactors) they are expensed when incurred and presented in fee and commission expense while costs related to customers who continuously carry an outstanding balance (revolvers) are included in the effective interest rate of the receivable (refer to note 5). Payments to partners for new cardholder account originations for transactor accounts are deferred as costs to obtain a contract under IFRS 15 while those costs related to revolver accounts are included in the effective interest rate of the receivable (refer to note 5). Those costs deferred under IFRS 15 are capitalised and amortised over the estimated cardholder relationship. Payments to co-brand partners based on revenue sharing are presented as a reduction of fee and commission income while payments based on profitability are presented in fee and commission expense.
home.barclays/annualreport Barclays Bank PLC Annual Report 171

Notes to the financial statements Performance/return
6 Net fee and commission income continued Advisory Advisory fees are generated from wealth management services and investment banking advisory services related to mergers, acquisitions and financial restructurings. Wealth management advisory fees primarily consists of asset-based fees for advisory accounts of wealth management clients and are based on the market value of client assets. They are earned over the period the services are provided and are generally recognised quarterly when the market value of client assets is determined. Investment banking advisory fees are recognised at the point in time when the services related to the transaction have been completed under the terms of the engagement. Investment banking advisory costs are recognised as incurred in fee and commission expense if direct and incremental to the advisory services or otherwise recognised in operating expenses. Brokerage and execution Brokerage and execution fees are earned for executing client transactions with various exchanges and over-the-counter markets and assisting clients in clearing transactions. Brokerage and execution fees are recognised at the point in time the associated service has been completed which is generally the trade date of the transaction. Underwriting and syndication Underwriting and syndication fees are earned for the distribution of client equity or debt securities and the arrangement and administration of a loan syndication. This includes commitment fees to provide loan financing. Underwriting fees are generally recognised on trade date if there is no remaining contingency, such as the transaction being conditional on closing of an acquisition or other transaction. Underwriting costs are deferred and recognised in fee and commission expense when the associated underwriting fees are recorded. Syndication fees are earned for arranging and administering a loan syndication; however, the associated fee may be subject to variability until the loan has been syndicated to other syndicate members or until other contingencies (such as a successful M&A closing) have been resolved and therefore the fee revenue is deferred until the uncertainty is resolved. Underwriting and syndication fees were previously reported on a net basis in the income statement. Following the adoption of IFRS 15, expenses associated with underwriting and syndication of £38m are now reported in fee and commission expense. Including in the underwriting and syndication, commitment fees to provide loan financing includes fees which are not presented as part of the effective interest rate of a loan in accordance with IFRS 9. Loan commitment fees included as IFRS 15 revenues are fees for loan commitments that are not expected to fund, fees received as compensation for unfunded commitments and the applicable portion of fees received for a revolving loan facility, which for that period, are undrawn. Such commitment fees are recognised over time through to the contractual maturity of the commitment. Contract assets and contract liabilities The Barclays Bank Group had no material contract assets or contract liabilities as at 31 December 2018. Impairment on fee receivables and contract assets During 2018, there have been no material impairments recognised in relation to fees receivable and contract assets. Fees in relation to transactional business can be added to outstanding customer balances. These amounts may be subsequently impaired as part of the overall loans and advances balance. Remaining performance obligations The Barclays Bank Group applies the practical expedient of IFRS 15 and does not disclose information about remaining performance obligations that have original expected durations of one year or less or because the Barclays Bank Group has a right to consideration that corresponds directly with the value of the service provided to the client or customer. Costs incurred in obtaining or fulfilling a contract The Barclays Bank Group expects that incremental costs of obtaining a contract such as success fee and commission fees paid are recoverable and therefore capitalised such contract costs in the amount of £125.4m at 31 December 2018. Capitalised contract costs are amortised based on the transfer of services to which the asset relates which typically ranges over the expected life of the relationship. In 2018, the amount of amortisation was £30.4m and there was no impairment loss recognised in connection with the capitalised contract costs.
7 Net trading income Accounting for net trading income In accordance with IFRS 9, trading positions are held at fair value, and the resulting gains and losses are included in the income statement, together with interest and dividends arising from long and short positions and funding costs relating to trading activities. Income arises from both the sale and purchase of trading positions, margins which are achieved through market making and customer business and from changes in fair value caused by movements in interest and exchange rates, equity prices and other market variables. Gains or losses on non-trading financial instruments designated or mandatorily at fair value with changes in fair value recognised in the income statement are included in net trading income where the business model is to manage assets and liabilities on a fair value basis which includes use of derivatives or where an instrument is designated at fair value to eliminate an accounting mismatch and the related instrument's gain and losses are reported in trading income.
home.barclays/annualreport Barclays Bank PLC Annual Report 172

Credit risk management
7 Net trading income continued
2018 2017 2016
£m £m £m
Net gains from financial instruments held for trading 3,101 2,280 2,371
Net gains from financial instruments designated at fair value 259 1,116 380
Net gains from financial instruments mandatorily at fair value 1,004 - -
Own credit losses a - - (35)
Net trading income 4,364 3,396 2,716 Note a Following the early adoption of the own credit provisions of IFRS 9 on 1 January 2017, own credit on financial liabilities designated at fair value through profit and loss, which was previously reported in income statement, is now recognised in other comprehensive income. 8 Net investment income Accounting for net investment income Dividends are recognised when the right to receive the dividend has been established. Other accounting policies relating to net investment income are set out in Note 14 and Note 16. 2018 2017 2016
£m £m £m
Net gains from disposal of available for sale investments a - 298 762
Net gains from disposal of debt instruments at fair value through other comprehensive income 131 - -
Dividend income 55 48 8
Net gains from financial instruments designated at fair value b - 281 151
Net gains from financial assets mandatorily at fair value 172 - -
Other investment income 36 72 156
Net investment income 394 699 1,077 Notes a Following the adoption of IFRS 9, available for sale classification is no longer applicable. b Following the adoption of IFRS9 this category only includes financial assets designated at fair value to eliminate or reduce an accounting mismatch. The net gain on such instruments are recognised in net trading income where doing so helps to reduce an income statement presentation mismatch. 9 Credit impairment charges and other provisions Accounting for the impairment of financial assets under IFRS 9 effective from 1 January 2018 Impairment The Barclays Bank Group is required to recognise expected credit losses (ECLs) based on unbiased forward-looking information for all financial assets at amortised cost, lease receivables, debt financial assets at fair value through other comprehensive income, loan commitments and financial guarantee contracts. Intercompany exposures in the individual financial statements, including loan commitments and financial guarantee contracts, are also in scope of IFRS 9 for ECL purposes. At the reporting date, an allowance (or provision for loan commitments and financial guarantees) is required for the 12 month (Stage 1) ECLs. If the credit risk has significantly increased since initial recognition (Stage 2), or if the financial instrument is credit impaired (Stage 3), an allowance (or provision) should be recognised for the lifetime ECLs. The measurement of ECL is calculated using three main components: (i) probability of default (PD) (ii) loss given default (LGD) and (iii) the exposure at default (EAD).
The 12 month ECL is calculated by multiplying the 12 month PD, LGD and the EAD. The 12 month and lifetime PDs represent the PD occurring over the next 12 months and the remaining maturity of the instrument respectively. The EAD represents the expected balance at default, taking into account the repayment of principal and interest from the balance sheet date to the default event together with any expected drawdowns of committed facilities. The LGD represents expected losses on the EAD given the event of default, taking into account, among other attributes, the mitigating effect of collateral value at the time it is expected to be realised and the time value of money. Determining a significant increase in credit risk since initial recognition: The Barclays Bank Group assesses when a significant increase in credit risk has occurred based on quantitative and qualitative assessments. The credit risk of an exposure is considered to have significantly increased when: i) Quantitative test The annualised lifetime PD has increased by more than an agreed threshold relative to the equivalent at origination.
home.barclays/annualreport Barclays Bank PLC Annual Report 173

Notes to the financial statements Performance/return
9 Credit impairment charges and other provisions continued PD deterioration thresholds are defined as percentage increases, and are set at an origination score band and segment level to ensure the test appropriately captures significant increases in credit risk at all risk levels. Generally, thresholds are inversely correlated to the origination PD, i.e. as the origination PD increases, the threshold value reduces. The assessment of the point at which a PD increase is deemed ‘significant’, is based upon analysis of the portfolios’ risk profile against a common set of principles and performance metrics (consistent across both retail and wholesale businesses), incorporating expert credit judgement where appropriate.
Wholesale assets apply a 100% increase in PD and 0.2% PD floor to determine a significant increase in credit risk.
Retail assets apply bespoke relative increase and absolute PD thresholds based on product type and origination PD. Thresholds are subject to maximums defined by Barclays Group policy and typically apply minimum relative thresholds of 50-100% and a maximum relative threshold of 400%. For existing/historical exposures where origination point scores or data are no longer available or do not represent a comparable estimate of lifetime PD, a proxy origination score is defined, based upon: Back-population of the approved lifetime PD score either to origination date or, where this is not feasible, as far back as possible, (subject to a
data start point no later than 1 January 2015); or Use of available historical account performance data and other customer information, to derive a comparable ‘proxy’ estimation of origination
PD. ii) Qualitative test Relevant for accounts that meet the portfolio’s ‘high risk’ criteria and are subject to closer credit monitoring.
High risk customers may not be in arrears but either through an event or an observed behaviour exhibit credit distress. The definition and assessment of high risk includes as wide a range of information as reasonably available, such as industry and Group-wide customer level data, including but not limited to bureau scores and high consumer indebtedness index, wherever possible or relevant.
Whilst the high risk populations applied for IFRS 9 impairment purposes are aligned with risk management processes, they are also regularly reviewed and validated to ensure that they capture any incremental segments where there is evidence of credit deterioration. iii) Backstop criteria Relevant for accounts that are more than 30 calendar days past due. The 30 days past due criteria is a backstop rather than a primary driver of moving exposures into Stage 2.
Exposures will move back to Stage 1 once they no longer meet the criteria for a significant increase in credit risk. This means that, at a minimum: all payments must be up-to-date, the PD deterioration test is no longer met, the account is no longer classified as high risk, and the customer has evidenced an ability to maintain future payments. Management overlays and other exceptions to model outputs are applied only if consistent with the objective of identifying significant increases in credit risk. Forward-looking information The measurement of ECL involves complexity and judgement, including estimation of PD, LGD, a range of unbiased future economic scenarios, estimation of expected lives (where contractual life is not appropriate), and estimation of EAD and assessing significant increases in credit risk. Credit losses are the expected cash shortfalls from what is contractually due over the expected life of the financial instrument, discounted at the original effective interest rate (EIR). ECLs are the unbiased probability-weighted credit losses determined by evaluating a range of possible outcomes and considering future economic conditions. Barclays Group uses a five-scenario model to calculate ECL. An external consensus forecast is assembled from key sources, including HM Treasury, Bloomberg and the Urban Land Institute, which forms the baseline scenario. In addition, two adverse scenarios (Downside 1 and Downside 2) and two favourable scenarios (Upside 1 and Upside 2) are derived, with associated probability weightings. The adverse scenarios are calibrated to a similar severity to internal stress tests, whilst also considering IFRS 9 specific sensitivities and non-linearity. Downside 2 is benchmarked to the Bank of England’s annual cyclical scenarios and to the most severe scenario from Moody’s inventory, but is not designed to be the same. The favourable scenarios are calibrated to be symmetric to the adverse scenarios, subject to a ceiling calibrated to relevant recent favourable benchmark scenarios. The scenarios include six economic core variables, (GDP, unemployment and House Price Index (HPI) in both the UK and US markets), and expanded variables using statistical models based on historical correlations. All five scenarios converge to a steady state after eight years. The methodology for estimating probability weights for each of the scenarios involves a comparison of the distribution of key historic UK and US macroeconomic variables against the forecast paths of the five scenarios. The methodology works such that the baseline (reflecting current consensus outlook) has the highest weight and the weights of adverse and favourable scenarios depend on the deviation from the baseline; the further from the baseline, the smaller the weight. A single set of five scenarios is used across all portfolios and all five weights are normalised to equate to 100%. The impacts across the portfolios are different because of the sensitivities of each of the portfolios to specific macroeconomic variables, for example, mortgages are highly sensitive to house prices and base rates, credit cards and unsecured consumer loans are highly sensitive to unemployment.
home.barclays/annualreport Barclays Bank PLC Annual Report 174

Credit risk management
9 Credit impairment charges and other provisions continued Definition of default, credit impaired assets, write-offs, and interest income recognition The definition of default for the purpose of determining ECLs, and for internal credit risk management purposes, has been aligned to the Regulatory Capital CRR Article 178 definition of default, to maintain a consistent approach with IFRS 9 and associated regulatory guidance. The Regulatory Capital CRR Article 178 definition of default considers indicators that the debtor is unlikely to pay, includes exposures in forbearance and is no later than when the exposure is more than 90 days past due or 180 days past due in the case of UK mortgages. When exposures are identified as credit impaired or purchased or originated as such interest income is calculated on the carrying value net of the impairment allowance.
Credit impaired is when the exposure has defaulted which is also anticipated to align to when an exposure is identified as individually impaired.
Uncollectible loans are written off against the related allowance for loan impairment on completion of the Barclays Bank Group’s internal processes and when all reasonably expected recoverable amounts have been collected. Subsequent recoveries of amounts previously written off are credited to the income statement. The timing and extent of write-offs may involve some element of subjective judgement. Nevertheless, a write-off will often be prompted by a specific event, such as the inception of insolvency proceedings or other formal recovery action, which makes it possible to establish that some or the entire advance is beyond realistic prospect of recovery. Loan modifications and renegotiations that are not credit-impaired When modification of a loan agreement occurs as a result of commercial restructuring activity rather than due to the credit risk of the borrower, an assessment must be performed to determine whether the terms of the new agreement are substantially different from the terms of the existing agreement. This assessment considers both the change in cash flows arising from the modified terms as well as the change in overall instrument risk profile. Where terms are substantially different, the existing loan will be derecognised and a new loan will be recognised at fair value. Where terms are not substantially different, the loan carrying value will be adjusted to reflect the present value of modified cash flows discounted at the original EIR, with any resulting gain or loss recognised immediately within the income statement as a modification gain or loss. Expected life Lifetime ECLs must be measured over the expected life. This is restricted to the maximum contractual life and takes into account expected prepayment, extension, call and similar options. The exceptions are certain revolver financial instruments, such as credit cards and bank overdrafts, that include both a drawn and an undrawn component where the entity’s contractual ability to demand repayment and cancel the undrawn commitment does not limit the entity’s exposure to credit losses to the contractual notice period. For revolving facilities, expected life is analytically derived to reflect behavioural life of the asset, i.e. the full period over which the business expects to be exposed to credit risk. Behavioural life is typically based upon historical analysis of the average time to default, closure or withdrawal of facility. Where data is insufficient or analysis inconclusive, an additional ‘maturity factor’ may be incorporated to reflect the full estimated life of the exposures, based upon experienced judgement and/or peer analysis. Potential future modifications of contracts are not taken into account when determining the expected life or EAD until they occur. Discounting ECLs are discounted at the EIR at initial recognition or an approximation thereof and consistent with income recognition. For loan commitments the EIR is the rate that is expected to apply when the loan is drawn down and a financial asset is recognised. Issued financial guarantee contracts are discounted at the risk free rate. Lease receivables are discounted at the rate implicit in the lease. For variable/floating rate financial assets, the spot rate at the reporting date is used and projections of changes in the variable rate over the expected life are not made to estimate future interest cash flows or for discounting. Modelling techniques ECLs are calculated by multiplying three main components, being the PD, LGD and the EAD, discounted at the original EIR. The regulatory Basel Committee of Banking Supervisors (BCBS) ECL calculations are leveraged for IFRS 9 modelling but adjusted for key differences which include: BCBS requires 12 month through the economic cycle losses whereas IFRS 9 requires 12 months or lifetime point in time losses based on
conditions at the reporting date and multiple forecasts of the future economic conditions over the expected lives; IFRS 9 models do not include certain conservative BCBS model floors and downturn assessments and require discounting to the reporting date at
the original EIR rather than using the cost of capital to the date of default; Management adjustments are made to modelled output to account for situations where known or expected risk factors and information have not
been considered in the modelling process, for example forecast economic scenarios for uncertain political events; and ECL is measured at the individual financial instrument level, however a collective approach where financial instruments with similar risk
characteristics are grouped together, with apportionment to individual financial instruments, is used where effects can only be seen at a collective level, for example for forward-looking information.
For the IFRS 9 impairment assessment, Barclays Bank Group’ risk models are used to determine the PD, LGD and EAD. For Stage 2 and 3, Barclays Bank Group applies lifetime PDs but uses 12 month PDs for Stage 1. The ECL drivers of PD, EAD and LGD are modelled at an account level which considers vintage, among other credit factors. Also, the assessment of significant increase in credit risk is based on the initial lifetime PD curve, which accounts for the different credit risk underwritten over time. Forbearance A financial asset is subject to forbearance when it is modified due to the credit distress of the borrower. A modification made to the terms of an asset due to forbearance will typically be assessed as a non-substantial modification that does not result in derecognition of the original loan, except in circumstances where debt is exchanged for equity.
home.barclays/annualreport Barclays Bank PLC Annual Report 175

Notes to the financial statements Performance/return
9 Credit impairment charges and other provisions continued Both performing and non-performing forbearance assets are classified as Stage 3 except where it is established that the concession granted has not resulted in diminished financial obligation and that no other regulatory definitions of default criteria has been triggered, in which case the asset is classified as Stage 2. The minimum probationary period for non-performing forbearance is 12 months and for performing forbearance, 24 months. Hence, a minimum of 36 months is required for non-performing forbearance to move out of a forborne state. No financial instrument in forbearance can transfer back to Stage 1 until all of the Stage 2 thresholds are no longer met and can only move out of Stage 3 when no longer credit impaired. Accounting for the impairment of financial assets under IAS 39 for 2017 and 2016 Loans and other assets held at amortised cost In accordance with IAS 39, the Barclays Bank Group assesses at each balance sheet date whether there is objective evidence that loan assets will not be recovered in full and, wherever necessary, recognises an impairment loss in the income statement.
An impairment loss is recognised if there is objective evidence of impairment as a result of events that have occurred and these have adversely impacted the estimated future cash flows from the assets. These events include: becoming aware of significant financial difficulty of the issuer or obligor a breach of contract, such as a default or delinquency in interest or principal payments the Group, for economic or legal reasons relating to the borrower’s financial difficulty, grants a concession that it would not otherwise consider it becomes probable that the borrower will enter bankruptcy or other financial reorganisation the disappearance of an active market for that financial asset because of financial difficulties observable data at a portfolio level indicating that there is a measurable decrease in the estimated future cash flows, although the decrease
cannot yet be ascribed to individual financial assets in the portfolio – such as adverse changes in the payment status of borrowers in the portfolio or national or local economic conditions that correlate with defaults on the assets in the portfolio.
Impairment assessments are conducted individually for significant assets, which comprise all wholesale customer loans and larger retail business loans, and collectively for smaller loans and for portfolio level risks, such as country or sectoral risks. For the purposes of the assessment, loans with similar credit risk characteristics are grouped together – generally on the basis of their product type, industry, geographical location, collateral type, past due status and other factors relevant to the evaluation of expected future cash flows. The impairment assessment includes estimating the expected future cash flows from the asset or the group of assets, which are then discounted using the original effective interest rate calculated for the asset. If this is lower than the carrying value of the asset or the portfolio, an impairment allowance is raised. If, in a subsequent period, the amount of the impairment loss decreases, and the decrease can be related objectively to an event occurring after the impairment was recognised, the previously recognised impairment loss is reversed by adjusting the allowance account. The amount of the reversal is recognised in the income statement. Following impairment, interest income continues to be recognised at the original effective interest rate on the restated carrying amount, representing the unwind of the discount of the expected cash flows, including the principal due on non-accrual loans. Uncollectable loans are written off against the related allowance for loan impairment on completion of the Barclays Bank Group’s internal processes when all reasonably expected recoverable amounts have been collected. Subsequent recoveries of amounts previously written off are credited to the income statement. Available for sale financial assets Impairment of available for sale debt instruments Debt instruments are assessed for impairment in the same way as loans. If impairment is deemed to have occurred, the cumulative decline in the fair value of the instrument that has previously been recognised in the available for sale reserve is removed from reserves and recognised in the income statement. This may be reversed if there is evidence that the circumstances of the issuer have improved. Impairment of available for sale equity instruments Where there has been a prolonged or significant decline in the fair value of an equity instrument below its acquisition cost, it is deemed to be impaired. The cumulative net loss that has been previously recognised directly in the available for sale reserve is removed from reserves and recognised in the income statement. Increases in the fair value of equity instruments after impairment are recognised directly in other comprehensive income. Further declines in the fair value of equity instruments after impairment are recognised in the income statement. Critical accounting estimates and judgements IFRS 9 impairment involves several important areas of judgement, including estimating forward looking modelled parameters (PD, LGD and EAD), developing a range of unbiased future economic scenarios, estimating expected lives and assessing significant increases in credit risk, based on the Barclays Bank Group’s experience of managing credit risk. The determination of expected life is most material for Barclays credit card portfolios which is obtained via behavioural life analysis. As a result, the expected life of credit card portfolios is currently modelled over 10 years to materially capture the risk of these facilities. Within the retail and small businesses portfolios, which comprise large numbers of small homogenous assets with similar risk characteristics, the impairment allowance is calculated using forward looking modelled parameters which are typically run at account level. There are many models in use, each tailored to a product, line of business or customer category. Judgement and knowledge is needed in selecting the statistical methods to
home.barclays/annualreport Barclays Bank PLC Annual Report 176

Credit risk management
9 Credit impairment charges and other provisions continued use when the models are developed or revised. The impairment allowance reflected in the financial statements for these portfolios is therefore considered to be reasonable and supportable. For individually significant assets in stage 3, impairment allowances are calculated on an individual basis and all relevant considerations that have a bearing on the expected future cash flows across a range of economic scenarios are taken into account. These considerations can be subjective and can include the business prospects for the customer, the realisable value of collateral, the Barclays Bank Group’s position relative to other claimants, the reliability of customer information and the likely cost and duration of the work-out process. The economic scenarios considered are the same as those used in Barclays Group’s ECL models. The level of the impairment allowance is the difference between the value of the discounted expected future cash flows (discounted at the loan’s original effective interest rate), and its carrying amount. Furthermore, judgements change with time as new information becomes available or as work-out strategies evolve, resulting in frequent revisions to the impairment allowance as individual decisions are taken. Changes in these estimates would result in a change in the allowances and have a direct impact on the impairment charge.
2018 2017a 2016a
Impairment
ChargesRecoveriesb Total
Impairment Charges
Recoveriesb Total Impairment
Charges Recoveriesb Total
£m £m £m £m £m £m £m £m £m
Loans and advances 774 (86) 688 1,724 (188) 1,536 1,641 (194) 1,447Provision for undrawn contractually committed facilities and guarantees provided (48) - (48) 14 - 14 9 - 9Loans impairment 726 (86) 640 1,738 (188) 1,550 1,650 (194) 1,456Cash collateral and Settlement balances (1) - (1) - - - - - -Financial investments - - - 3 - 3 21 - 21Financial instruments at fair value through OCI 4 - 4 - - - - - -Credit impairment charges and other provisionsc 729 (86) 643 1,741 (188) 1,553 1,671 (194) 1,477 Notes a 2017 and 2016 numbers are presented on an IAS 39 basis b Cash recoveries of previously written off amounts c Barclays Bank PLC transferred its UK banking business on 1 April 2018 to Barclays Bank UK PLC. Results relating to the UK banking business for the three months ended 31 March
2018 (Impairment charges: £217m and recoveries: £16m) and for the twelve months ended 31 December 2017 (Impairment charges: £929m and recoveries: £146m) and 31 December 2016 (Impairment charges: £1,067m and recoveries: £171m) have been reported as discontinued operations
The movement in gross exposures and impairment allowance for loans and advances at amortised cost table under IFRS 9 is presented on pages 67 to 72 in the Credit Risk section. The prior year comparative table for movement in allowance under IAS 39 is presented below. Movements in allowance for impairment by asset class
At beginning
of year
Acquisitionsand
disposalsUnwind of
discount
Exchangeand other
adjustmentsAmounts
written off Recoveries
Amountscharged to
incomestatement
Balance at31 December
Barclays Bank Group £m £m £m £m £m £m £m £m
2017 Home loans 467 - (5) (4) (29) - 29 458Credit cards, unsecured and other retail lending
3,060 - (43) (223) (2,042) 252 2,051 3,055
Corporate loans 1,093 (5) - (13) (258) 82 240 1,139Total impairment allowance 4,620 (5) (48) (240) (2,329) 334 2,320 4,652
Movements in allowance for impairment by asset class
At beginning
of year
Acquisitionsand
disposalsUnwind of
discount
Exchangeand other
adjustmentsAmounts
written off Recoveries
Amountscharged to
incomestatement
Balance at31 December
Barclays Bank PLC £m £m £m £m £m £m £m £m
2017 Home loans 461 - (5) (2) (29) - 28 453Credit cards, unsecured and other retail lending
1,773 - (31) (101) (930) 141 891 1,743
Corporate loans 1,019 (1) - (17) (255) 82 107 935Total impairment allowance 3,253 (1) (36) (120) (1,214) 223 1,026 3,131
Write-offs subject to enforcement activity
The contractual amount outstanding on financial assets that were written off during the period ended 31 December 2018 and that are still subject to enforcement activity is £1,152m. This is lower than the write-offs presented in the movement in gross exposures and impairment allowance table due to assets sold during the year post write-offs and post write-off recoveries.
home.barclays/annualreport Barclays Bank PLC Annual Report 177

Notes to the financial statements Performance/return
9 Credit impairment charges and other provisions continued Modification of financial assets Financial assets of £784m were subject to non-substantial modification during the period, with a resulting loss of £19m. The gross carrying amount at 31 December 2018 of financial assets for which the loss allowance has changed to a 12 month ECL during the year amounts to £114m. 10 Operating expenses
2018 2017 2016
£m £m £m
Infrastructure costs
Property and equipment 380 792 853
Depreciation of property, plant and equipment 119 275 469
Operating lease rentals 158 248 410
Amortisation of intangible assets 276 362 515
Impairment of property, equipment and intangible assets 2 19 92
Total infrastructure costs 935 1,696 2,339
Administration and general costs
Consultancy, legal and professional feesa 400 505 486
Subscriptions, publications, stationery and communications 285 330 567
Marketing, advertising and sponsorship 316 292 320
Travel and accommodation 108 86 98
UK bank levy 223 306 362
Other administration and general expensesa 2,892 2,622 142
Total administration and general costs 4,224 4,141 1,975
Staff costs 4,874 4,393 6,832
Provisions for litigation and conducta 1,706 448 321
Operating expenses 11,739 10,678 11,467 Note a The presentation of other costs has been amended to include litigation and conduct as a separate line item. The prior year comparatives within other cost categories have been
adjusted accordingly.
For further details on staff costs including accounting policies, refer to Note 33. 11 Tax Accounting for income taxes Barclays Bank Group applies IAS 12 Income Taxes in accounting for taxes on income. Income tax payable on taxable profits (current tax) is recognised as an expense in the periods in which the profits arise. Withholding taxes are also treated as income taxes. Income tax recoverable on tax allowable losses is recognised as a current tax asset only to the extent that it is regarded as recoverable by offsetting against taxable profits arising in the current or prior periods. Current tax is measured using tax rates and tax laws that have been enacted or substantively enacted at the balance sheet date. Deferred tax assets are recognised to the extent that it is probable that taxable profit will be available against which the deductible temporary differences, and the carry forward of unused tax credits and unused tax losses can be utilised, except in certain circumstances where the deferred tax asset relating to the deductible temporary difference arises from the initial recognition of an asset or liability in a transaction that is not a business combination and, at the time of the transaction, affects neither the accounting profit nor taxable profit or loss. Deferred tax is determined using tax rates and legislation enacted or substantively enacted by the balance sheet date which are expected to apply when the deferred tax asset is realised or the deferred tax liability is settled. Deferred tax assets and liabilities are only offset when there is both a legal right to set-off and an intention to settle on a net basis. Barclays Bank Group considers an uncertain tax position to exist when it considers that ultimately, in the future, the amount of profit subject to tax may be greater than the amount initially reflected in the Barclays Bank Group’s tax returns. The Barclays Bank Group accounts for provisions in respect of uncertain tax positions in two different ways. A current tax provision is recognised when it is considered probable that the outcome of a review by a tax authority of an uncertain tax position will alter the amount of cash tax due to, or from, a tax authority in the future. From recognition, the current tax provision is then measured at the amount the Barclays Bank Group ultimately expects to pay the tax authority to resolve the position, taking into account any interest and penalties potentially payable to the tax authority.
home.barclays/annualreport Barclays Bank PLC Annual Report 178

Credit risk management
11 Tax continued Deferred tax provisions are adjustments made to the carrying value of deferred tax assets in respect of uncertain tax positions. A deferred tax provision is recognised when it is considered probable that the outcome of a review by a tax authority of an uncertain tax position will result in a reduction in the carrying value of the deferred tax asset. From recognition of a provision, measurement of the underlying deferred tax asset is adjusted to take into account the expected impact of resolving the uncertain tax position on the loss or temporary difference giving rise to the deferred tax asset. The approach taken to measurement takes account of whether the uncertain tax position is a discrete position that will be reviewed by the tax authority in isolation from any other position, or one of a number of issues which are expected to be reviewed together concurrently and resolved simultaneously with a tax authority. Barclays Bank Group’s measurement of provisions is based upon its best estimate of the additional profit that will become subject to tax. For a discrete position, consideration is given only to the merits of that position. Where a number of issues are expected to be reviewed and resolved together, Barclays Bank Group will take into account not only the merits of its position in respect of each particular issue but also the overall level of provision relative to the aggregate of the uncertain tax positions across all the issues that are expected to be resolved at the same time. In addition, in assessing provision levels, it is assumed that tax authorities will review uncertain tax positions and that all facts will be fully and transparently disclosed. Critical accounting estimates and judgements There are two key areas of judgement that impact the reported tax position. Firstly, the level of provisioning for uncertain tax positions; and secondly, the recognition and measurement of deferred tax assets. The Barclays Bank Group does not consider there to be a significant risk of a material adjustment to the carrying amount of current and deferred tax balances, including provisions for uncertain tax positions in the next financial year. The provisions for uncertain tax positions cover a diverse range of issues and reflect advice from external counsel where relevant. It should be noted that only a proportion of the total uncertain tax positions will be under audit at any point in time, and could therefore be subject to challenge by a tax authority over the next year. Deferred tax assets have been recognised based on business profit forecasts. Details on the recognition of deferred tax assets is provided in this note. 2018 2017 2016
£m £m £m
Current tax charge/(credit)
Current year 269 (315) 336
Adjustment in respect of prior years (200) 44 (359)
69 (271) (23)
Deferred tax charge/(credit)
Current year 372 1,862 260
Adjustment in respect of prior years (37) (65) 65
335 1,797 325
Tax charge 404 1,526 302
home.barclays/annualreport Barclays Bank PLC Annual Report 179

Notes to the financial statements Performance/return
11 Tax continued The table below shows the reconciliation between the actual tax charge and the tax charge that would result from applying the standard UK corporation tax rate to the Barclays Bank Group’s profit before tax. 2018 2018 2017 2017 2016 2016
£m % £m % £m %
Profit before tax from continuing operations 1,286 1,758 1,894
Tax charge based on the standard UK corporation tax rate of 19% (2017: 19.25%, 2016: 20.0%)
244 19.0% 339 19.3% 379 20.0%
Impact of profits/losses earned in territories with different statutory rates to the UK (weighted average tax rate is 27.1% (2017: 38.2%, 2016: 41.9%))
104 8.1% 333 18.9% 415 21.9%
Recurring items:
Non-creditable taxes including withholding taxes 156 12.1% 191 10.9% 277 14.6%
Non-deductible expenses 67 5.2% 76 4.3% 100 5.3%
Impact of UK bank levy being non-deductible 42 3.3% 59 3.4% 72 3.8%
Tax adjustments in respect of share-based payments 11 0.9% 2 0.1% 34 1.8%
Non-taxable gains and income (232) (18.0%) (191) (10.9%) (180) (9.5%)
Changes in recognition of deferred tax and effect of unrecognised tax losses (104) (8.1%) (72) (4.1%) (178) (9.4%)
Impact of Barclays Bank PLC's overseas branches being taxed both locally and in the UK
16 1.2% (61) (3.5%) (128) (6.8%)
Adjustments in respect of prior years (237) (18.4%) (21) (1.2%) (294) (15.5%)
Banking surcharge and other items (17) (1.3%) (57) (3.2%) (128) (6.8%)
Non-recurring items:
One off re-measurement of US deferred tax assets - - 1,177 67.0% - -
Impact of the UK branch exemption on deferred tax assets - - (276) (15.7%) - -
Non-deductible provisions for UK customer redress 8 0.6% - - - -
Non-deductible provisions for investigations and litigation 346 26.9% 66 3.8% 48 2.5%
Non-taxable gains and income on divestments - - (39) (2.2%) (142) (7.5%)
Non-deductible impairments and losses on divestments - - - - 27 1.4%
Total tax charge 404 31.4% 1,526 86.8% 302 15.9%
Factors driving the effective tax rate The effective tax rate of 31.4% is higher than the UK corporation tax rate of 19% primarily due to profits earned outside the UK being taxed at local statutory tax rates that are higher than the UK tax rate, investigations and litigation being non-deductible for tax purposes, non-creditable taxes and non-deductible expenses including UK bank levy. These factors, which have each increased the effective tax rate, are partially offset by the impact of non-taxable gains and income in the period, changes in the recognition of deferred tax, and the impact of adjustments in respect of prior years. Barclays Bank Group’s future tax charge will be sensitive to the geographic mix of profits earned and the tax rates in force in the jurisdictions that the Group operates in. In the UK, legislation to reduce the corporation tax rate to 17% from 1 April 2020 has been enacted. Effective from 1 January 2019, a change in accounting standards requires the tax consequences of all payments on financial instruments that are classified as equity for accounting purposes, where those payments are considered to be a distribution of profit, to be included in the income statement tax charge. The Barclays Bank Group currently includes the tax credit associated with deductions for payments made under Additional Tier 1 instruments as a movement in reserves. This accounting change will result in that tax credit being included in the income statement tax charge, and this will have the effect of reducing the Barclays Bank Group’s effective tax rate from 2019. For illustrative purposes, if this future accounting approach had been applied in 2018, then the tax credit on payments under Additional Tier 1 instruments would have reduced the Barclays Bank Group’s total income statement tax charge by £175m. Tax in other comprehensive income Tax relating to each component of other comprehensive income on page 146 can be found in the consolidated statement of comprehensive income which includes within Other a tax credit of £27m (2017: £7m charge) on other items including share based payments. Tax in respect of discontinued operations Tax relating to the discontinued operations can be found in the disposal groups income statement (see Note 2). The tax charge of £138m (2017: £753m) relates to the profit from the ordinary activities of the discontinued operations.
home.barclays/annualreport Barclays Bank PLC Annual Report 180

Credit risk management
11 Tax continued Current tax assets and liabilities Movements on current assets and liabilities were as follows: Barclays Bank Group Barclays Bank PLC
2018 2017 2018 2017 £m £m £m £m
Assets 376 501 115 506
Liabilities (494) (708) (242) (751)
As at 1 January (118) (207) (127) (245)
Income statement from continuing operations (69) 271 196 727
Income statement from discontinued UK banking business (90) (974) (87) (974)
Other comprehensive income 168 26 144 17
Corporate income tax paid from continuing operations 409 (58) 150 (462)
Corporate income tax paid from discontinued UK banking business - 730 - 727
Transfer to Barclays Bank UK PLCa 677 - 676 -
Other movements 115 94 111 83
1,092 (118) 1,063 (127)
Assets 1,713 376 1,439 115
Liabilities (621) (494) (376) (242)
As at 31 December 1,092 (118) 1,063 (127) Note a Related to the transfer of current tax liabilities to Barclays Bank UK PLC as part of the disposal of the UK banking business. Refer to Note 2 for further information. Deferred tax assets and liabilities The deferred tax amounts on the balance sheet were as follows: Barclays Bank Group Barclays Bank PLC
2018 2017 2018 2017
£m £m £m £m
Intermediate Holding Company ("IHC Tax Group") 1,454 1,413 - -
US Branch Tax Group 1,087 1,234 1,087 1,234
UK Tax Group 3 413 5 445
Other 426 292 157 184
Deferred tax asset 2,970 3,352 1,249 1,863
Deferred tax liability - - - -
Net deferred tax 2,970 3,352 1,249 1,863 US deferred tax assets in the IHC and the US Branch The deferred tax asset in the IHC Tax Group of £1,454m (2017: £1,413m) includes £220m (2017: £286m) relating to tax losses and the deferred tax asset in the US Branch Tax Group of £1,087m (2017: £1,234m) includes £167m (2017: £283m) relating to tax losses. Under US tax rules, losses occurring prior to 1 January 2018 can be carried forward and offset against profits for a period of 20 years. The losses first arose in 2011 in the IHC and 2008 in the US Branch and therefore any unused amounts may begin to expire in 2031 and 2028 respectively. The remaining US deferred tax assets relate to temporary differences for which there is no time limit on recovery. The deferred tax assets for the IHC tax losses and the US Branch tax losses are currently projected to be fully utilised by 2020. UK Tax Group deferred tax asset The deferred tax asset in the UK Tax Group of £3m (2017: £413m) relates entirely to temporary differences. Other deferred tax assets The deferred tax asset of £426m (2017: £292m) in other entities within the Barclays Bank Group includes £142m (2017: £27m) relating to tax losses carried forward. These deferred tax assets relate to a number of different territories and their recognition is based on profit forecasts or local country law which indicate that it is probable that the losses and temporary differences will be utilised. Of the deferred tax asset of £426m (2017: £292m), an amount of £245m (2017: £218m) relates to entities which have suffered a loss in either the current or prior year. This has been taken into account in reaching the above conclusion that these deferred tax assets will be fully recovered in the future.
home.barclays/annualreport Barclays Bank PLC Annual Report 181

Notes to the financial statements Performance/return
11 Tax continued The table below shows movements on deferred tax assets and liabilities during the year. The amounts are different from those disclosed on the balance sheet and in the preceding table as they are presented before offsetting asset and liability balances where there is a legal right to set-off and an intention to settle on a net basis. Barclays Bank Group
Fixed asset timing
differences
Fair value through other
comprehensive income
Cash flow hedges
Retirement benefit
obligations
Loan impairment
allowanceOther
provisions
Tax losses
carried forward
Share based payments and
deferred compensation Other Total
£m £m £m £m £m £m £m £m £m £m
Assetsa 1,232 188 1 49 735 157 596 341 1,346 4,645
Liabilities (28) (143) (69) (218) - - - - (208) (666)
At 1 January 2018a 1,204 45 (68) (169) 735 157 596 341 1,138 3,979Income statement from continuing operations 61 (9) - (124) (76) (62) (104) (28) 7 (335)Income statement from discontinued UK banking business (48) - - - - - - - (48)Other comprehensive income - 97 103 (98) (18) 8 1 (10) (8) 75Transfer to Barclays Bank UK PLCb (447) - - - (279) - - - (21) (747)
Other movements (28) 7 1 (4) (3) 9 36 6 22 46
742 140 36 (395) 359 112 529 309 1,138 2,970
Assets 758 175 38 39 359 112 529 309 1,336 3,655
Liabilities (16) (35) (2) (434) - - - - (198) (685)
At 31 December 2018 742 140 36 (395) 359 112 529 309 1,138 2,970
Assets 1,772 183 - 91 151 251 503 664 2,004 5,619
Liabilities (92) (141) (326) - - - - - (301) (860)
At 1 January 2017 1,680 42 (326) 91 151 251 503 664 1,703 4,759Income statement from continuing operations (855) - - (195) (38) (69) 131 (307) (464) (1,797)Income statement from discontinued UK banking business 497 - - (127) - - - - 5 375Other comprehensive income - (3) 261 49 - - - (21) 22 308
Other movements (118) 6 (3) 13 (5) (25) (38) 5 (128) (293)
1,204 45 (68) (169) 108 157 596 341 1,138 3,352
Assets 1,232 188 1 49 108 157 596 341 1,346 4,018
Liabilities (28) (143) (69) (218) - - - - (208) (666)
At 31 December 2017 1,204 45 (68) (169) 108 157 596 341 1,138 3,352 Notes a Due to the adoption of IFRS 9 and IFRS 15 on 1 January 2018, additional deferred tax assets of £627m were recognised. For further information, refer to Note 43. b Related to the transfer of deferred tax assets to Barclays Bank UK PLC as part of the disposal of the UK banking business. Refer to Note 2 for further information.
home.barclays/annualreport Barclays Bank PLC Annual Report 182

Credit risk management
11 Tax continued Barclays Bank PLC
Fixed asset timing
differences
Fair value through other
comprehensive income
Cash flow hedges
Retirement benefit
obligations
Loan impairment
allowanceOther
provisions
Tax losses carried
forward
Share based payments and
deferred compensation Other Total
£m £m £m £m £m £m £m £m £m £m
Assetsa 1,145 172 1 21 474 51 285 98 629 2,876
Liabilities - (142) (68) (218) - - - - (174) (602)
At 1 January 2018a 1,145 30 (67) (197) 474 51 285 98 455 2,274Income statement from continuing operations 44 9 - (124) 7 (18) (119) (6) 43 (164)Income statement from discontinued UK banking business (48) - - - - - - - - (48)Other comprehensive income - 94 103 (93) (10) 25 - (4) (8) 107Transfer to Barclays Bank UK PLCb (447) - - - (279) - - - (21) (747)
Other movements (43) 3 - 1 (10) 3 1 (9) (119) (173)
651 136 36 (413) 182 61 167 79 350 1,249
Assets 651 171 38 20 182 61 167 79 475 1,844
Liabilities - (35) (2) (433) - - - - (125) (595)
At 31 December 2018 651 136 36 (413) 182 61 167 79 350 1,249
Assets 1,543 156 4 38 127 70 140 150 666 2,894
Liabilities - (132) (326) - - - - - (194) (652)
At 1 January 2017 1,543 24 (322) 38 127 70 140 150 472 2,242Income statement from continuing operations (787) - - (178) (32) (6) 134 (70) (169) (1,108)Income statement from discontinued UK banking business 497 - - (127) - - - - 5 375Other comprehensive income - 6 258 65 - - - (5) 21 345
Other movements (108) - (3) 5 (7) (13) 11 23 101 9
1,145 30 (67) (197) 88 51 285 98 430 1,863
Assets 1,145 172 1 21 88 51 285 98 604 2,465
Liabilities - (142) (68) (218) - - - - (174) (602)
At 31 December 2017 1,145 30 (67) (197) 88 51 285 98 430 1,863 Notes a Due to the adoption of IFRS 9 and IFRS 15 on 1 January 2018, additional deferred tax assets of £411m were recognised. For further information, refer to Note 43. b Related to the transfer of deferred tax assets to Barclays Bank UK PLC as part of the disposal of the UK banking business. Refer to Note 2 for further information. Other movements include the impact of changes in foreign exchange rates as well as deferred tax amounts relating to acquisitions and disposals. The amount of deferred tax liability expected to be settled after more than 12 months for the Barclays Bank Group is £576m (2017: £486m) and for Barclays Bank PLC is £551m (2017: £441m). The amount of deferred tax asset expected to be recovered after more than 12 months for the Barclays Bank Group is £2,932m (2017: £3,363m) and for Barclays Bank PLC is £1,546m (2017: £2,106m). These amounts are before offsetting asset and liability balances where there is a legal right to set-off and an intention to settle on a net basis. Unrecognised deferred tax Tax losses and temporary differences Deferred tax assets have not been recognised in respect of gross deductible temporary differences of £174m (2017: £157m), unused tax credits of £203m (2017: £546m), and gross tax losses of £16,313m (2017: £17,919m). The tax losses include capital losses of £3,225m (2017: £3,126m). Of these tax losses, £240m (2017: £409m) expire within five years, £259m (2017: £193m) expire within six to ten years, £948m (2017: £2,016m) expire within 11 to 20 years and £14,866m (2017: £15,301m) can be carried forward indefinitely. Deferred tax assets have not been recognised in respect of these items because it is not probable that future taxable profits and gains will be available against which they can be utilised.
home.barclays/annualreport Barclays Bank PLC Annual Report 183

Notes to the financial statements Performance/return
11 Tax continued For Barclays Bank PLC, deferred tax assets have not been recognised in respect of gross deductible temporary differences of £82m (2017: £127m), unused tax credits of £198m (2017: £542m), and gross tax losses of £7,235m (2017: £6,563m) which includes capital losses of £2,473m (2017: £2,598m). Of these tax losses, £214m (2017: £262m) expire within five years, £247m (2017: £193m) expire within six to ten years, £nil (2017: £241m) expire within 11 to 20 years and £6,774m (2017: £5,867m) can be carried forward indefinitely. Deferred tax assets have not been recognised in respect of these items because it is not probable that future taxable profits and gains will be available against which Barclays Bank PLC can utilise benefits. Barclays Bank Group investments in subsidiaries, branches and associates Deferred tax is not recognised in respect of the value of Barclays Bank Group's investments in subsidiaries, branches and associates where the Barclays Bank Group is able to control the timing of the reversal of the temporary differences and it is probable that such differences will not reverse in the foreseeable future. The aggregate amount of these temporary differences for which deferred tax liabilities have not been recognised was £0.6bn (2017: £0.1bn). 12 Dividends on ordinary shares The 2018 financial statements include £14,585m (2017: £674m) of dividends paid. This includes the final dividend declared in relation to the prior year of £142m (2017: £165m), half year dividends of £149m (2017: £208m) and dividends in specie of £14,294m primarily relating to the holding in Barclays Bank UK PLC. These result in a total dividend for the year of £6.23 (2017: 29p) per ordinary share. Dividends paid on preference shares amounted to £204m (2017: £242m). Dividends paid on the 4.75% €100 preference shares amounted to £421.16 per share (2017: £415.65). Dividends paid on the 6.278% US$100 preference shares amounted to £446.17 per share (2017: £483.37). Dividends paid on the 8.125% US$0.25 preference shares amounted to £1.54 per share (2017: £1.58). Dividends paid on other equity instruments amounted to £647m (2017: £639m). For further detail on other equity instruments, please refer to Note 30.
home.barclays/annualreport Barclays Bank PLC Annual Report 184

Notes to the financial statements Assets and liabilities held at fair value
The notes included in this section focus on assets and liabilities the Barclays Bank Group holds and recognises at fair value. Fair value refers to the price that would be received to sell an asset or the price that would be paid to transfer a liability in an arm’s-length transaction with a willing counterparty, which may be an observable market price or, where there is no quoted price for the instrument, may be an estimate based on available market data. Detail regarding the Barclays Bank Group’s approach to managing market risk can be found on pages 48 to 49. 13 Trading portfolio Accounting for trading portfolio assets and liabilities In accordance with IFRS 9, all assets and liabilities held for trading purposes are held at fair value with gains and losses in the changes in fair value taken to the income statement in net trading income (Note 7). Barclays Bank Group Barclays Bank PLC
2018 2017 2018 2017
£m £m £m £m
Debt securities and other eligible bills 57,134 51,195 37,812 35,753
Equity securities 39,565 59,338 28,403 40,932
Traded loans 7,234 3,140 7,234 3,137
Commodities 105 82 31 14
Trading portfolio assets 104,038 113,755 73,480 79,836
Debt securities and other eligible bills (24,125) (29,046) (22,083) (25,629)
Equity securities (12,489) (8,306) (24,543) (15,913)
Trading portfolio liabilities (36,614) (37,352) (46,626) (41,542)
14 Financial assets at fair value through the income statement Accounting for financial assets mandatorily at fair value Financial assets that are held for trading are recognised at fair value through profit or loss. In addition, financial assets are held at fair value through profit or loss if they do not contain contractual terms that give rise on specified dates to cash flows that are SPPI, or if the financial asset is not held in a business model that is either (i) a business model to collect the contractual cash flows or (ii) a business model that is achieved by both collecting contractual cash flows and selling. Accounting for financial assets designated at fair value Financial assets, other than those held for trading, are classified in this category if they are so irrevocably designated at inception and the use of the designation removes or significantly reduces an accounting mismatch. Subsequent changes in fair value for these instruments are recognised in the income statement in net investment income, except if reporting it in trading income reduces an accounting mismatch. The details on how the fair value amounts are derived for financial assets at fair value are described in Note 18. Barclays Bank Group Barclays Bank PLC
2018 2017 2018 2017
£m £m £m £m
Loans and advances 1,387 11,037 1,387 22,395
Debt securities 3,855 15 3,855 3,307
Equity securities - 4,671 - 8
Reverse repurchase agreements and other similar secured lending 106 100,040 106 91,443
Other financial assets - 519 - 29
Financial assets designated at fair value 5,348 116,282 5,348 117,182
Loans and advances 14,257 - 30,515 -
Debt securities 660 - 142 -
Equity securities 5,172 - 132 -
Reverse repurchase agreements and other similar secured lending 119,285 - 143,171 -
Other financial assets 528 - 57 -
Financial assets mandatorily at fair value 139,902 - 174,017 -
Total 145,250 116,282 179,365 117,182
home.barclays/annualreport Barclays Bank PLC Annual Report 185

Notes to the financial statements Assets and liabilities held at fair value
14 Financial assets at fair value through the income statement continued Credit risk of loans and advances designated at fair value and related credit derivatives The following table shows the maximum exposure to credit risk, the changes in fair value attributable to changes in credit risk, and the cumulative changes in fair value since initial recognition together with the amount by which related credit derivatives mitigate this risk: Barclays Bank Group Barclays Bank PLC
Maximum exposure as at 31 December
Changes in fair value during the
year ended
Cumulative changes in fair value from
inception Maximum exposure as at 31 December
Changes in fair value during the
year ended
Cumulative changes in fair value from
inception
2018 2017 2018 2017 2018 2017 2018 2017 2018 2017 2018 2017
£m £m £m £m £m £m £m £m £m £m £m £m
Loans and advances designated at fair value, attributable to credit risk 1,387 11,037 2 10 (8) 2 1,387 22,395 2 10 (8) 2
Value mitigated by related credit derivatives - 256 - 1 - (12) - 256 - 1 - (12)
15 Derivative financial instruments Accounting for derivatives Derivative instruments are contracts whose value is derived from one or more underlying financial instruments or indices defined in the contract. They include swaps, forward-rate agreements, futures, options and combinations of these instruments and primarily affect the Barclays Bank Group’s net interest income, net trading income and derivative assets and liabilities. Notional amounts of the contracts are not recorded on the balance sheet. Derivatives are used to hedge interest rate, exchange rate, commodity, and equity exposures and exposures to certain indices such as house price indices and retail price indices related to non-trading positions. All derivative instruments are held at fair value through profit or loss, except for derivatives that are in a designated cash flow or net investment hedge accounting relationship. Derivatives are classified as assets when their fair value is positive or as liabilities when their fair value is negative. This includes terms included in a contract or financial liability (the host), which, had it been a standalone contract, would have met the definition of a derivative. If these are separated from the host, i.e. when the economic characteristics of the embedded derivative are not closely related with those of the host contract and the combined instrument is not measured at fair value through profit or loss, then they are accounted for in the same way as derivatives. For financial assets, the requirements are whether the financial asset contain contractual terms that give rise on specified dates to cash flows that are SPPI, and consequently the requirements for accounting for embedded derivatives are not applicable to financial assets. Hedge accounting The Barclays Bank Group applies the requirements of IAS 39 Financial Instruments: Recognition and Measurement for hedge accounting purposes. The Barclays Bank Group applies hedge accounting to represent, the economic effects of its interest rate, currency and contractually linked inflation risk management strategies. Where derivatives are held for risk management purposes, and when transactions meet the required criteria for documentation and hedge effectiveness, the Barclays Bank Group applies fair value hedge accounting, cash flow hedge accounting, or hedging of a net investment in a foreign operation, as appropriate to the risks being hedged. Fair value hedge accounting Changes in fair value of derivatives that qualify and are designated as fair value hedges are recorded in the income statement, together with changes in the fair value of the hedged asset or liability that are attributable to the hedged risk. The fair value changes adjust the carrying value of the hedged asset or liability held at amortised cost. If hedge relationships no longer meet the criteria for hedge accounting, hedge accounting is discontinued. For fair value hedges of interest rate risk, the fair value adjustment to the hedged item is amortised to the income statement over the period to maturity of the previously designated hedge relationship using the effective interest method. If the hedged item is sold or repaid, the unamortised fair value adjustment is recognised immediately in the income statement. For items classified as fair value through other comprehensive income, the hedge accounting adjustment is included in other comprehensive income. Cash flow hedge accounting For qualifying cash flow hedges, the fair value gain or loss associated with the effective portion of the cash flow hedge is recognised initially in other comprehensive income, and then recycled to the income statement in the periods when the hedged item will affect profit or loss. Any ineffective portion of the gain or loss on the hedging instrument is recognised in the income statement immediately. When a hedging instrument expires or is sold, or when a hedge no longer meets the criteria for hedge accounting, any cumulative gain or loss existing in equity at that time remains in equity and is recognised when the hedged item is ultimately recognised in the income statement. When a forecast transaction is no longer expected to occur, the cumulative gain or loss that was recognised in equity is immediately transferred to the income statement. Hedges of net investments The Barclays Bank Group’s net investments in foreign operations, including monetary items accounted for as part of the net investment, are hedged for foreign currency risks using both derivatives and foreign currency borrowings. Hedges of net investments are accounted for similarly to cash flow hedges; the effective portion of the gain or loss on the hedging instrument is being recognised directly in other comprehensive income and the
home.barclays/annualreport Barclays Bank PLC Annual Report 186

Credit risk management
15 Derivative financial instruments continued ineffective portion being recognised immediately in the income statement. The cumulative gain or loss recognised in other comprehensive income is recognised in the income statement on the disposal or partial disposal of the foreign operation, or other reductions in the Barclays Bank Group’s investment in the operation.
Barclays Bank Group Barclays Bank PLC
Notional contract amount
Fair value Notional contract amount
Fair value
Assets Liabilities Assets Liabilities
£m £m £m £m £m £m
As at 31 December 2018
Total derivative assets/(liabilities) held for trading 43,920,658 222,522 (219,527) 32,477,707 221,086 (221,476)Total derivative assets/(liabilities) held for risk management 116,441 161 (65) 117,333 161 (114)
Derivative assets/(liabilities) 44,037,099 222,683 (219,592) 32,595,040 221,247 (221,590)
As at 31 December 2017
Total derivative assets/(liabilities) held for trading 35,747,945 237,741 (237,242) 28,273,039 232,042 (228,124)
Total derivative assets/(liabilities) held for risk management 175,785 246 (1,103) 175,785 246 (1,103)
Derivative assets/(liabilities) 35,923,730 237,987 (238,345) 28,448,824 232,288 (229,227) Derivative asset exposures would be £203bn (2017: £217bn) lower than reported under IFRS if netting were permitted for assets and liabilities with the same counterparty or for which Barclays Bank Group holds cash collateral. Similarly, derivative liabilities would be £202bn (2017: £217bn) lower reflecting counterparty netting and collateral placed. In addition, non-cash collateral of £6bn (2017: £6bn) was held in respect of derivative assets. The Barclays Bank Group received collateral from clients in support of over the counter derivative transactions. These transactions are generally undertaken under International Swaps and Derivative Association (ISDA) agreements governed by either UK or New York law. Further Information on netting arrangements of derivative financial instruments can be found within Note 19 Offsetting financial assets and financial liabilities. Trading derivatives are managed within the Barclays Bank Group’s market risk management policies, which are outlined on pages 48 to 49. The Barclays Bank Group's exposure to credit risk arising from derivative contracts are outlined in the Credit Risk section on pages 60 to 94.
home.barclays/annualreport Barclays Bank PLC Annual Report 187

Notes to the financial statements Assets and liabilities held at fair value
15 Derivative financial instruments continued The fair values and notional amounts of derivatives held for trading are set out in the following table:
Derivatives held for trading Barclays Bank Group Barclays Bank PLC
Notional contract amount
Fair value Notional contract amount
Fair value
Assets Liabilities Assets Liabilities
£m £m £m £m £m £m
As at 31 December 2018
Foreign exchange derivatives
Forward foreign exchange 3,465,171 32,584 (33,055) 3,459,709 32,550 (32,974)
Currency swaps 1,182,800 27,139 (25,972) 1,182,029 26,801 (25,763)
OTC options bought and sold 552,853 4,259 (4,805) 552,332 4,165 (4,726)
OTC derivatives 5,200,824 63,982 (63,832) 5,194,070 63,516 (63,463)Foreign exchange derivatives cleared by central counterparty 72,526 163 (233) 72,526 163 (233)
Exchange traded futures and options – bought and sold 23,585 7 (7) 10,724 - -
Foreign exchange derivatives 5,296,935 64,152 (64,072) 5,277,320 63,679 (63,696)
Interest rate derivatives
Interest rate swaps 7,343,450 102,869 (96,400) 5,363,992 102,709 (96,289)
Forward rate agreements 342,883 171 (306) 281,775 33 (53)
OTC options bought and sold 2,292,525 20,922 (22,589) 2,292,525 20,922 (22,589)
OTC derivatives 9,978,858 123,962 (119,295) 7,938,292 123,664 (118,931)
Interest rate derivatives cleared by central counterparty 15,794,162 974 (1,014) 12,853,069 530 (529)
Exchange traded futures and options – bought and sold 11,087,714 356 (323) 2,021,430 16 (25)
Interest rate derivatives 36,860,734 125,292 (120,632) 22,812,791 124,210 (119,485)
Credit derivatives
OTC swaps 386,508 6,575 (5,239) 335,270 5,855 (4,543)
Credit derivatives cleared by central counterparty 372,567 4,180 (4,280) 321,329 3,484 (3,560)
Credit derivatives 759,075 10,755 (9,519) 656,599 9,339 (8,103)
Equity and stock index derivatives
OTC options bought and sold 57,840 4,542 (7,719) 57,430 4,628 (7,733)
Equity swaps and forwards 132,656 5,169 (4,111) 132,651 5,165 (4,111)
OTC derivatives 190,496 9,711 (11,830) 190,081 9,793 (11,844)
Exchange traded futures and options – bought and sold 692,435 11,171 (12,066) 117,541 3,079 (3,550)
Equity and stock index derivatives 882,931 20,882 (23,896) 307,622 12,872 (15,394)
Commodity derivatives
OTC options bought and sold 1,648 26 (34) 1,633 26 (34)
Commodity swaps and forwards 8,108 495 (374) 8,108 495 (374)
OTC derivatives 9,756 521 (408) 9,741 521 (408)
Exchange traded futures and options – bought and sold 111,227 920 (1,000) 13,633 344 (438)
Commodity derivatives 120,983 1,441 (1,408) 23,374 865 (846)
Derivatives with subsidiaries - - - 3,400,001 10,121 (13,952)
Derivative assets/(liabilities) held for trading 43,920,658 222,522 (219,527) 32,477,707 221,086 (221,476)
Total OTC derivatives held for trading 15,766,442 204,751 (200,604) 13,667,454 203,349 (199,189)
Total derivatives cleared by central counterparty held for trading 16,239,255 5,317 (5,527) 13,246,924 4,177 (4,322)
Total exchange traded derivatives held for trading 11,914,961 12,454 (13,396) 2,163,328 3,439 (4,013)
Derivatives with subsidiaries held for trading - - - 3,400,001 10,121 (13,952)
Derivative assets/(liabilities) held for trading 43,920,658 222,522 (219,527) 32,477,707 221,086 (221,476)
home.barclays/annualreport Barclays Bank PLC Annual Report 188
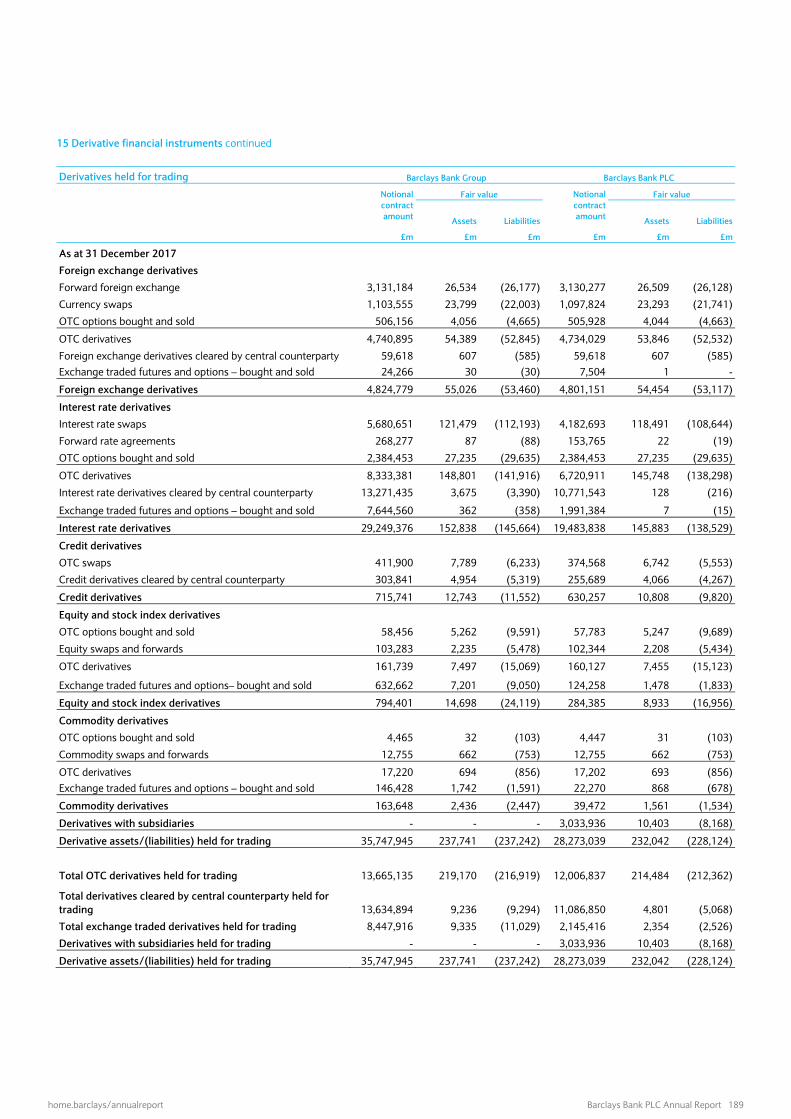
Credit risk management
15 Derivative financial instruments continued Derivatives held for trading Barclays Bank Group Barclays Bank PLC
Notional contract amount
Fair value Notional contract amount
Fair value
Assets Liabilities Assets Liabilities
£m £m £m £m £m £m
As at 31 December 2017
Foreign exchange derivatives
Forward foreign exchange 3,131,184 26,534 (26,177) 3,130,277 26,509 (26,128)
Currency swaps 1,103,555 23,799 (22,003) 1,097,824 23,293 (21,741)
OTC options bought and sold 506,156 4,056 (4,665) 505,928 4,044 (4,663)
OTC derivatives 4,740,895 54,389 (52,845) 4,734,029 53,846 (52,532)
Foreign exchange derivatives cleared by central counterparty 59,618 607 (585) 59,618 607 (585)Exchange traded futures and options – bought and sold 24,266 30 (30) 7,504 1 -
Foreign exchange derivatives 4,824,779 55,026 (53,460) 4,801,151 54,454 (53,117)
Interest rate derivatives
Interest rate swaps 5,680,651 121,479 (112,193) 4,182,693 118,491 (108,644)
Forward rate agreements 268,277 87 (88) 153,765 22 (19)
OTC options bought and sold 2,384,453 27,235 (29,635) 2,384,453 27,235 (29,635)
OTC derivatives 8,333,381 148,801 (141,916) 6,720,911 145,748 (138,298)
Interest rate derivatives cleared by central counterparty 13,271,435 3,675 (3,390) 10,771,543 128 (216)
Exchange traded futures and options – bought and sold 7,644,560 362 (358) 1,991,384 7 (15)
Interest rate derivatives 29,249,376 152,838 (145,664) 19,483,838 145,883 (138,529)
Credit derivatives
OTC swaps 411,900 7,789 (6,233) 374,568 6,742 (5,553)
Credit derivatives cleared by central counterparty 303,841 4,954 (5,319) 255,689 4,066 (4,267)
Credit derivatives 715,741 12,743 (11,552) 630,257 10,808 (9,820)
Equity and stock index derivatives
OTC options bought and sold 58,456 5,262 (9,591) 57,783 5,247 (9,689)
Equity swaps and forwards 103,283 2,235 (5,478) 102,344 2,208 (5,434)
OTC derivatives 161,739 7,497 (15,069) 160,127 7,455 (15,123)
Exchange traded futures and options– bought and sold 632,662 7,201 (9,050) 124,258 1,478 (1,833)
Equity and stock index derivatives 794,401 14,698 (24,119) 284,385 8,933 (16,956)
Commodity derivatives
OTC options bought and sold 4,465 32 (103) 4,447 31 (103)
Commodity swaps and forwards 12,755 662 (753) 12,755 662 (753)
OTC derivatives 17,220 694 (856) 17,202 693 (856)Exchange traded futures and options – bought and sold 146,428 1,742 (1,591) 22,270 868 (678)
Commodity derivatives 163,648 2,436 (2,447) 39,472 1,561 (1,534)
Derivatives with subsidiaries - - - 3,033,936 10,403 (8,168)
Derivative assets/(liabilities) held for trading 35,747,945 237,741 (237,242) 28,273,039 232,042 (228,124)
Total OTC derivatives held for trading 13,665,135 219,170 (216,919) 12,006,837 214,484 (212,362)
Total derivatives cleared by central counterparty held for trading 13,634,894 9,236 (9,294) 11,086,850 4,801 (5,068)
Total exchange traded derivatives held for trading 8,447,916 9,335 (11,029) 2,145,416 2,354 (2,526)
Derivatives with subsidiaries held for trading - - - 3,033,936 10,403 (8,168)
Derivative assets/(liabilities) held for trading 35,747,945 237,741 (237,242) 28,273,039 232,042 (228,124)
home.barclays/annualreport Barclays Bank PLC Annual Report 189

Notes to the financial statements Assets and liabilities held at fair value
The fair values and notional amounts of derivative instruments held for risk management are set out in the following table: Derivatives held for risk management Barclays Bank Group Barclays Bank PLC
Notional contract amount
Fair value Notional contract amount
Fair value
Assets Liabilities Assets Liabilities
£m £m £m £m £m £m
As at 31 December 2018
Derivatives designated as cash flow hedges
Interest rate swaps 2,622 18 (7) 2,431 18 (7)
Interest rate derivatives cleared by central counterparty 45,995 - - 44,509 - -
Derivatives designated as cash flow hedges 48,617 18 (7) 46,940 18 (7)
Derivatives designated as fair value hedges
Interest rate swaps 2,598 143 (48) 2,265 143 (48)
Forward foreign exchange - - - 1,031 - (39)
Interest rate derivatives cleared by central counterparty 62,258 - - 60,173 - -
Derivatives designated as fair value hedges 64,856 143 (48) 63,469 143 (87)
Derivatives designated as hedges of net investments
Forward foreign exchange 2,968 - (10) 6,924 - (20)
Derivatives designated as hedges of net investment 2,968 - (10) 6,924 - (20)
Derivative assets/(liabilities) held for risk management 116,441 161 (65) 117,333 161 (114)
Total OTC derivatives held for risk management 8,188 161 (65) 12,651 161 (114)
Total derivatives cleared by central counterparty held for risk management 108,253 - - 104,682 - -
Derivative assets/(liabilities) held for risk management 116,441 161 (65) 117,333 161 (114)
As at 31 December 2017
Derivatives designated as cash flow hedges
Currency swaps - - - - - -
Interest rate swaps 1,808 88 (3) 1,808 88 (3)
Interest rate derivatives cleared by central counterparty 66,214 - - 66,214 - -
Derivatives designated as cash flow hedges 68,022 88 (3) 68,022 88 (3)
Derivatives designated as fair value hedges
Interest rate swaps 7,345 117 (1,090) 7,345 117 (1,090)
Forward foreign exchange - - - - - -
Interest rate derivatives cleared by central counterparty 97,436 - - 97,436 - -
Derivatives designated as fair value hedges 104,781 117 (1,090) 104,781 117 (1,090)
Derivatives designated as hedges of net investments
Forward foreign exchange 2,982 41 (10) 2,982 41 (10)
Derivatives designated as hedges of net investment 2,982 41 (10) 2,982 41 (10)
Derivatives with subsidiaries - - - - - -
Derivative assets/(liabilities) held for risk management 175,785 246 (1,103) 175,785 246 (1,103)
Total OTC derivatives held for risk management 12,135 246 (1,103) 12,135 246 (1,103)
Total derivatives cleared by central counterparty held for risk management 163,650 - - 163,650 - -
Derivative assets/(liabilities) held for risk management 175,785 246 (1,103) 175,785 246 (1,103)
home.barclays/annualreport Barclays Bank PLC Annual Report 190

Credit risk management
The Barclays Bank Group has hedged the following forecast cash flows, which primarily vary with interest rates. These cash flows are expected to impact the income statement in the following periods, excluding any hedge adjustments that may be applied:
TotalUp to one
yearOne
to two yearsTwo
to three yearsThree to four
years Four
to five yearsMore than five years
£m £m £m £m £m £m £m
2018
Barclays Bank Group
Forecast receivable cash flows 2,526 562 592 477 356 255 284
Barclays Bank PLC
Forecast receivable cash flows 2,526 562 592 477 356 255 284
2017
Barclays Bank Group
Forecast receivable cash flows 2,272 370 470 497 424 293 218
Barclays Bank PLC
Forecast receivable cash flows 2,272 370 470 497 424 293 218
The maximum length of time over which the Barclays Bank Group hedges exposure to the variability in future cash flows for forecast transactions, excluding those forecast transactions related to the payment of variable interest on existing financial instruments is 10 years (2017: 10 years). Amounts recognised in net interest income Barclays Bank Group Barclays Bank PLC
2018 2017 2018 2017
£m £m £m £m
Gains on the hedged items attributable to the hedged risk 231 519 241 519
Losses on the hedging instruments (300) (383) (309) (383)
Fair value ineffectiveness (69) 136 (68) 136
Cash flow hedging ineffectiveness (57) (201) (57) (201)
Net investment hedging ineffectiveness (1) 2 (1) 2
Gains and losses transferred from the cash flow hedging reserve to the income statement include a £213m gain (2017: £586m gain) to net interest income for Barclays Bank Group and Barclays Bank PLC. Hedge accounting Hedge accounting is applied predominantly for the following risks: (i) Interest rate risk - Interest rate risk predominantly arises due to a mismatch between fixed interest rates and floating interest rates.
Interest rate risk also includes exposure to inflation risk for certain types of investments. fixed interest rate exposures into variable rates. (ii) Currency risk - Currency risk arises due to assets or liabilities being denominated in different currencies than the functional currency of
the relevant entity. At a consolidated level currency risk also arises when the functional currency of subsidiaries is different from the parent.
(iii) Contractually linked Inflation risk - Hedged inflation risk arises from financial instruments with contractually specified inflation risk. Barclays Bank Group does not hedge inflation risk that arises from other activities.
In order to hedge the risks to which Barclays Bank Group is exposed, the hedging instruments employed are interest rate swaps, inflation swaps, currency swaps, and foreign currency debt which are used to: (i) Swap fixed interest rate exposures into variable rates. (ii) Swap variable interest rate exposures into fixed rates. (iii) Swap inflation exposure into either fixed or variable interest rates. (iv) Swap foreign currency net investment exposure to local currency. The hedging instruments share the same risk exposures as the hedged items, being interest rate risk, inflation risk and foreign currency risk. Hedge effectiveness is assessed with reference to the shared risks, but to the extent hedging instruments are exposed to different risks than the hedged items, this could result in hedge ineffectiveness or hedge accounting failures.
home.barclays/annualreport Barclays Bank PLC Annual Report 191

Notes to the financial statements Assets and liabilities held at fair value
15 Derivative financial instruments continued In some cases, certain items which are economically hedged may be ineligible hedged items for the purposes of IAS 39, such as core deposits and equity. In these instances, a proxy hedging solution can be utilised whereby portfolios of floating rate assets are designated as eligible hedged items in cash flow hedges.
The ratio between the hedged item and the hedging instruments is typically determined with reference to the sensitivity of the hedged item on designation to the risk factor, compared to that of the hedging instrument. In many cases the ratio is 100%. In some hedging relationships, Barclays Bank Group would designate risk components of hedged items as follows: (i) Benchmark interest rate risk as a component of interest rate risk, such as the LIBOR component; (ii) Inflation risk as a contractually specified component of a debt instrument; (iii) Spot exchange rate risk for foreign currency financial assets or financial liabilities; (iv) Components of cash flows of hedged items, for example certain interest payments for part of the life of an instrument. Using the benchmark interest rate risk results in other risks such as credit risk and liquidity risk being excluded from the hedge accounting relationship. LIBOR is considered the predominant interest rate risk and therefore the hedged items change in fair value on a fully proportionate basis with reference to this risk. For disclosures of the extent of risk exposures that Barclays Bank Group manages please refer to Risk review section. In respect of many of the Barclays’ Bank Group hedge accounting relationships, the hedged item and hedging instrument change frequently due to the dynamic nature of the risk management and hedge accounting strategy. The Barclays Bank Group risk management strategy is to hedge interest rate risk with interest rate derivatives (predominantly interest rate swaps), currency risk with currency derivatives and inflation risk with inflation derivatives. The interest rate risk management strategy is to reduce Barclays Bank Group’s exposure to interest rate risk to within approved risk limits. Barclays Bank Group applies hedge accounting to dynamic scenarios, predominantly in relation to interest rate risk, with a combination of hedged items (some hedged items are designated by proxy) in order for its financial statements to reflect as closely as possible the economic risk management undertaken. Hedge relationships are analysed and rebalanced on a daily basis. In some cases, if the hedge accounting objective changes, the relevant hedge accounting relationship is de-designated; in some cases a de-designated relationship is replaced with a different hedge accounting relationship. Changes in the GBP value of net investments due to foreign currency movements are captured in the currency translation reserve, resulting in a movement in CET1 capital. The Barclays Bank Group’s strategy is to minimise the volatility of the capital ratios caused by foreign exchange movements, by matching the CET1 capital movements to the revaluation of the Barclays Group’s foreign currency RWA exposures. Net investment hedges are designated where necessary to reduce the exposure to movement in a particular exchange rate to within mandated limits. As far as possible, existing external currency liabilities are designated as the hedging instruments. Hedging relationships are reviewed, and adjusted if necessary, at least once a month. Sources of ineffectiveness affecting hedge accounting are as follows: (i) Mismatches between the contractual terms of the hedged item and hedging instrument, including basis differences between the hedged
risk and the risk exposure of the hedging instrument; (ii) Changes in credit risk of the hedging instruments; (iii) If a hedge accounting relationship becomes over hedged. This might occur in hedges of net investments if the net asset value designated
at the start of the period falls below the amount of the hedging instrument; (iv) In cash flow hedging solution, when a hedge is built using external swaps having non-zero present value, it creates ineffectiveness. No other source of ineffectiveness has arisen during the period. Hedge effectiveness is determined with reference to quantitative tests, predominantly regression testing, which takes into account the regression co-efficient, the slope of the regression line, and ensuring that the relevant confidence intervals are complied with. There were no instances of forecast transactions for which hedge accounting had been used in the previous period, but which are no longer expected to occur.
home.barclays/annualreport Barclays Bank PLC Annual Report 192

Credit risk management
15 Derivative financial instruments continued Amount, timing and uncertainty of future cash flows The following table shows the hedging instruments which are carried on the Barclays Bank Group’s balance sheet:
Carrying value
Nominal amount
Change in fair value used as a basis to
determine ineffectiveness Derivative assets Derivative liabilities Loan liabilities
Hedge type Risk category £m £m £m £m £m
As at 31 December 2018
Barclays Bank Group
Fair value Interest rate risk 125 (44) - 61,331 (329)
Inflation risk 18 (4) - 3,525 29
Cash flow Interest rate risk 18 (7) - 48,617 (248)
Net investment Foreign exchange risk - (10) (12,325) 15,300 (745)
Barclays Bank PLC
Fair value Interest rate risk 125 (44) - 58,913 (347)
Foreign exchange risk - (39) (1,099) 2,130 9
Inflation risk 18 (4) - 3,525 29
Cash flow Interest rate risk 18 (7) - 46,940 (248)
Net investment Foreign exchange risk - (20) - 6,924 (304)
The following table profiles the expected notional values of current hedging instruments in future years:
2019 2020 2021 2022 2023 2024 and later
As at 31 December 2018 £m £m £m £m £m £m
Barclays Bank Group
Fair value hedges of interest rate risk
Notional amount 61,791 54,711 42,856 34,892 29,058 23,830
Fair value hedges of inflation risk
Notional amount 3,107 1,998 1,754 1,331 1,159 986
Barclays Bank PLC
Fair value hedges of interest rate risk
Notional amount 63,926 55,690 43,834 34,892 29,058 23,830
Fair value hedges of inflation risk
Notional amount 3,107 1,998 1,754 1,331 1,159 986
For Barclays Bank Group, there are 975 fair value hedges of interest rate risk and 44 fair value hedges of inflation risk with an average fixed rate of 2.31% and 1% respectively across the relationships and for Barclays Bank PLC, there are 977 fair value hedges of interest rate risk and 44 fair value of inflation risk with an average fixed rate of 2.31% and 1% respectively across the relationships.
home.barclays/annualreport Barclays Bank PLC Annual Report 193

Notes to the financial statements Assets and liabilities held at fair value
15 Derivative financial instruments continued
Hedged items in fair value hedge accounting relationships including the ineffectiveness recognised in the income statement
Accumulated fair value adjustment
included in carrying amount
Hedged item statement of financial position classification and risk category Carrying amount Total
Of which: Accumulated fair
value adjustment on items no longer in a
hedge relationship
Change in fair value used as a
basis to determine
ineffectiveness
Hedge ineffectiveness
recognised in the income statement
Line item in the income statement used to
recognise ineffectivenessAs at 31 December 2018 £m £m £m £m £m
Barclays Bank Group
Assets Loans and advances classified as amortised cost - Interest rate risk 924 63 54 (236) (84) Net interest income- Inflation risk 512 312 - 2 (1) Net interest income
Debt securities classified as FVOCI - Interest rate risk 26,340 392 - (75) 20 Net interest income- Inflation risk 2,907 (21) - (50) (18) Net interest income
Liabilities Debt securities in issue classified as amortised cost - Interest rate risk 32,508 (295) (317) 590 14 Net interest incomeBarclays Bank PLC
Assets Loans and advances classified as amortised cost - Interest rate risk 924 63 54 (217) (83) Net interest income- Foreign exchange risk 2,070 54 - (9) - - Inflation risk 512 312 - 2 (1) Net interest income
Debt securities classified as FVOCI - Interest rate risk 26,340 392 - (75) 20 Net interest income- Inflation risk 2,907 (20) - (50) (18) Net interest income
Liabilities Debt securities in issue classified as amortised cost - Interest rate risk 32,508 (295) (317) 590 14 Net interest income For items classified as fair value through other comprehensive income, the hedge accounting adjustment is not included in the carrying amount, but rather adjusts other comprehensive income.
home.barclays/annualreport Barclays Bank PLC Annual Report 194

Credit risk management
Hedged items in cash flow hedge accounting and hedges of net investments in foreign operations including the effect on the income statement and OCI
Description of hedge relationship and hedged risk
Change in value of hedged item
used as the basis for
recognising ineffectiveness
Balance in cash flow
hedge reserve for continuing
hedges
Balance in foreign
currency reserve for continuing
hedges
Balances remaining in cash
flow hedge reserve for which
hedge accounting is no
longer applied
Balances remaining in
foreign currency translation
reserve for which hedge
accounting is no longer applied
Hedging gains or
losses recognised in
OCI during the period
Hedge ineffectiveness
recognised within the
income statement
Line item in the statement of
comprehensive income used to recognise
ineffectivenessAs at 31 December 2018 £m £m £m £m £m £m £m
Barclays Bank Group
Cash flow hedge of interest rate risk
Loans and advances classified as amortised cost 191 61 - 88 - 189 (57) Net interest income
Hedge of net investment in foreign operation
USD foreign operations 719 - 1,646 - - 719 -
EUR foreign operations - - - - 86 - -
ZAR foreign operations - - - - (1) - -
CHF foreign operations 4 - - - 53 4 -
HKD foreign operations 2 - - - 23 2 -
JPY foreign operations 14 - - - 77 14 -
MXN foreign operations 21 - - - (14) 21 -
SEK foreign operations (13) - - - 13 (13) -
SGD foreign operations 1 - - - 78 1 (1) Net interest income
TWD foreign operations - - - - 2 - -
BRL foreign operations (4) - (3) - - (4) -
CNY foreign operations - - - - 2 - -
INR foreign operations - - - - 6 - -
Total 744 - 1,643 - 325 744 (1)
Barclays Bank PLC
Cash flow hedge of interest rate risk
Loans and advances classified as amortised cost 191 61 - 88 - 189 (57) Net interest income
Hedge of net investment in foreign operation
USD foreign operations 300 - 970 - - 300 -
EUR foreign operations - - - - 8 - -
CHF foreign operations - - - - (2) - -
HKD foreign operations (1) - - - 1 (1) -
JPY foreign operations 2 - - - 8 2 -
SGD foreign operations 1 - - - 1 1 -
THB foreign operations - - - - - - (1) Net interest income
KRW foreign operations 1 - - - 2 1 -
TWD foreign operations - - - - 2 - -
CNY foreign operations - - - - 4 - -
INR foreign operations - - - - (13) - -
Total 303 - 970 - 11 303 (1)
home.barclays/annualreport Barclays Bank PLC Annual Report 195
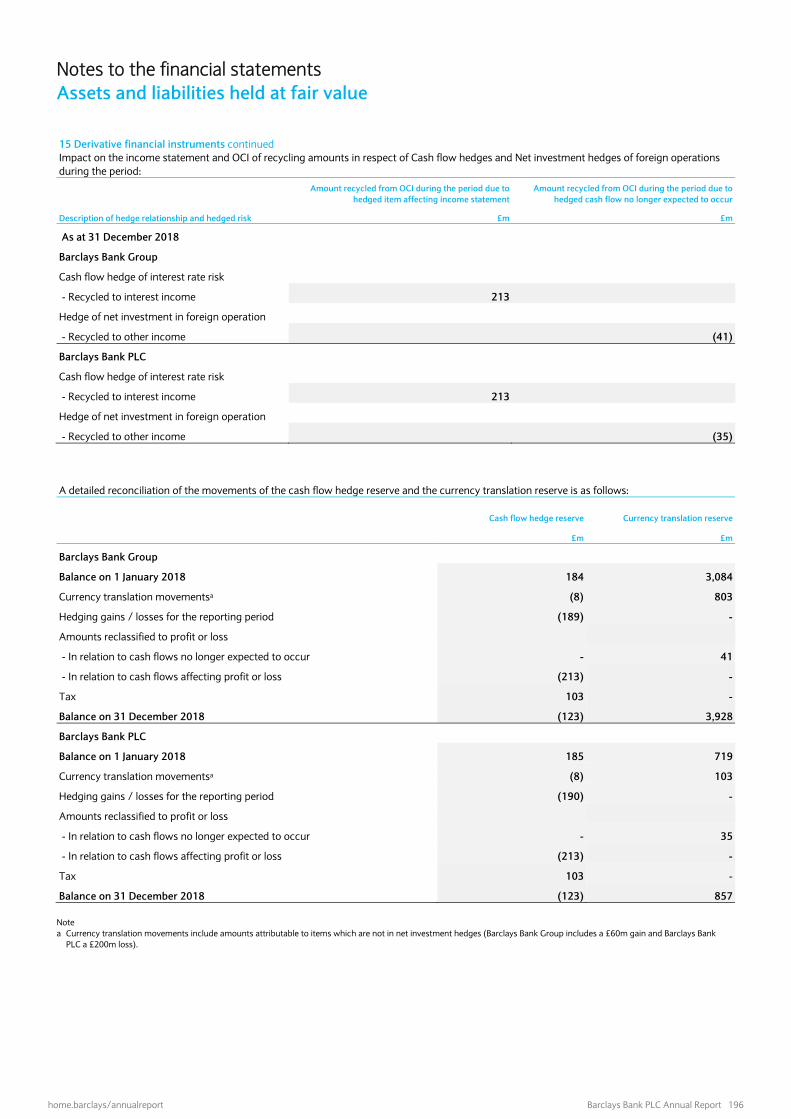
Notes to the financial statements Assets and liabilities held at fair value
15 Derivative financial instruments continued Impact on the income statement and OCI of recycling amounts in respect of Cash flow hedges and Net investment hedges of foreign operations during the period:
Amount recycled from OCI during the period due to
hedged item affecting income statementAmount recycled from OCI during the period due to
hedged cash flow no longer expected to occur
Description of hedge relationship and hedged risk £m £m
As at 31 December 2018
Barclays Bank Group
Cash flow hedge of interest rate risk - Recycled to interest income 213
Hedge of net investment in foreign operation - Recycled to other income (41)
Barclays Bank PLC
Cash flow hedge of interest rate risk - Recycled to interest income 213
Hedge of net investment in foreign operation - Recycled to other income (35)
A detailed reconciliation of the movements of the cash flow hedge reserve and the currency translation reserve is as follows:
Cash flow hedge reserve Currency translation reserve
£m £m
Barclays Bank Group
Balance on 1 January 2018 184 3,084
Currency translation movementsa (8) 803
Hedging gains / losses for the reporting period (189) -
Amounts reclassified to profit or loss
- In relation to cash flows no longer expected to occur - 41
- In relation to cash flows affecting profit or loss (213) -
Tax 103 -
Balance on 31 December 2018 (123) 3,928
Barclays Bank PLC
Balance on 1 January 2018 185 719
Currency translation movementsa (8) 103
Hedging gains / losses for the reporting period (190) -
Amounts reclassified to profit or loss
- In relation to cash flows no longer expected to occur - 35
- In relation to cash flows affecting profit or loss (213) -
Tax 103 -
Balance on 31 December 2018 (123) 857 Note
a Currency translation movements include amounts attributable to items which are not in net investment hedges (Barclays Bank Group includes a £60m gain and Barclays Bank PLC a £200m loss).
home.barclays/annualreport Barclays Bank PLC Annual Report 196

Credit risk management
16 Financial assets at fair value through other comprehensive income and Financial investments Accounting for financial assets at fair value through other comprehensive income (‘FVOCI’) under IFRS 9 effective from 1 January 2018 Financial assets that are debt instruments held in a business model that is achieved by both collecting contractual cash flows and selling and that contain contractual terms that give rise on specified dates to cash flows that are SPPI are measured at FVOCI. They are subsequently re-measured at fair value and changes therein (except for those relating to impairment, interest income and foreign currency exchange gains and losses) are recognised in other comprehensive income until the assets are sold. Interest (calculated using the effective interest method) is recognised in the income statement in net interest income (Note 5). Upon disposal, the cumulative gain or loss recognised in other comprehensive income is included in net investment income. In determining whether the business model is achieved by both collecting contractual cash flows and selling financial assets, it is determined that both collecting contractual cash flows and selling financial assets are integral to achieving the objective of the business model. The Barclays Bank Group will consider past sales and expectations about future sales to establish if the business model is achieved. For equity securities that are not held for trading, the Barclays Bank Group may make an irrevocable election on initial recognition to present subsequent changes in the fair value of the instrument in other comprehensive income (except for dividend income which is recognised in profit or loss). Gains or losses on the de-recognition of these equity securities are not transferred to profit or loss. These assets are also not subject to the impairment requirements and therefore no amounts are recycled to the income statement. Where the Barclays Bank Group has not made the irrevocable election to present subsequent changes in the fair value of the instrument in other comprehensive income, equity securities are measured at fair value through profit or loss. Accounting for financial investments under IAS 39 for 2017 Available for sale financial assets are held at fair value with gains and losses being included in other comprehensive income. The Barclays Bank Group uses this classification for assets that are not derivatives and are not held for trading purposes or otherwise designated at fair value through profit or loss, or at amortised cost. Dividends and interest (calculated using the effective interest method) are recognised in the income statement in net interest income or, net investment income. On disposal, the cumulative gain or loss recognised in other comprehensive income is also included in net investment income. Held to maturity assets are held at amortised cost. The Barclays Bank Group uses this classification when there is an intent and ability to hold the asset to maturity. Interest on the investments are recognised in the income statement within net interest income. Barclays Bank Group Barclays Bank PLC
2018 2017 2018 2017
£m £m £m £m
Debt securities and other eligible bills at fair value through other comprehensive income 44,315 - 43,029 -
Equity securities at fair value through other comprehensive income 11 - 9 -
Loans and advances at fair value through other comprehensive income 668 - 668 -
Available for sale debt securities and other eligible bills 52,020 49,197
Available for sale equity securities 1,834 277
Held to maturity debt securities 5,109 5,109
Financial assets at fair value through other comprehensive income/Financial investments 44,994 58,963 43,706 54,583
home.barclays/annualreport Barclays Bank PLC Annual Report 197

Notes to the financial statements Assets and liabilities held at fair value
17 Financial liabilities designated at fair value Accounting for liabilities designated at fair value through profit and loss In accordance with IFRS 9, financial liabilities may be designated at fair value, with gains and losses taken to the income statement within net trading income (Note 7) and net investment income (Note 8). Movements in own credit are reported through other comprehensive income. On derecognition of the financial liability no amount relating to own credit risk are recycled to the income statement. The Barclays Bank Group has the ability to make the fair value designation when holding the instruments at fair value reduces an accounting mismatch (caused by an offsetting liability or asset being held at fair value), or is managed by the Barclays Bank Group on the basis of its fair value, or includes terms that have substantive derivative characteristics (Note 15). The details on how the fair value amounts are arrived for financial liabilities designated at fair value are described in Note 18. Barclays Bank Group Barclays Bank PLC
2018 2017 2018 2017
Fair value
Contractual amount due on maturity Fair value
Contractual amount due on maturity Fair value
Contractual amount due on maturity Fair value
Contractual amount due on maturity
£m £m £m £m £m £m £m £m
Debt securities 46,649 54,159 42,563 46,920 44,620 52,246 41,692 46,060
Deposits 31,706 32,053 4,448 4,414 14,958 15,316 4,774 4,739
Repurchase agreements and other similar secured borrowing 139,386 139,626 126,691 126,822 157,388 157,834 122,578 122,707
Other financial liabilities - - 16 16 - - - -
Financial liabilities designated at fair value 217,741 225,838 173,718 178,172 216,966 225,396 169,044 173,506
The cumulative own credit net loss recognised is £121m (2017: £179m).
home.barclays/annualreport Barclays Bank PLC Annual Report 198

Credit risk management
18 Fair value of financial instruments Accounting for financial assets and liabilities – fair values Financial instruments that are held for trading are recognised at fair value through profit or loss. In addition, financial assets are held at fair value through profit or loss if they do not contain contractual terms that give rise on specified dates to cash flows that are SPPI, or if the financial asset is not held in a business model that is either (i) a business model to collect the contractual cash flows or (ii) a business model that is achieved by both collecting contractual cash flows and selling. Subsequent changes in fair value for these instruments are recognised in the income statement in net investment income, except if reporting it in trading income reduces an accounting mismatch. All financial instruments are initially recognised at fair value on the date of initial recognition (including transaction costs, other than financial instruments held at fair value through profit or loss) and, depending on the classification of the asset or liability, may continue to be held at fair value either through profit or loss or other comprehensive income. The fair value of a financial instrument is the price that would be received to sell an asset or paid to transfer a liability in an orderly transaction between market participants at the measurement date. Wherever possible, fair value is determined by reference to a quoted market price for that instrument. For many of the Barclays Bank Group’s financial assets and liabilities, especially derivatives, quoted prices are not available and valuation models are used to estimate fair value. The models calculate the expected cash flows under the terms of each specific contract and then discount these values back to a present value. These models use as their basis independently sourced market inputs including, for example, interest rate yield curves, equities and commodities prices, option volatilities and currency rates. For financial liabilities measured at fair value, the carrying amount reflects the effect on fair value of changes in own credit spreads derived from observable market data such as in primary issuance and redemption activity for structured notes. On initial recognition, it is presumed that the transaction price is the fair value unless there is observable information available in an active market to the contrary. The best evidence of an instrument’s fair value on initial recognition is typically the transaction price. However, if fair value can be evidenced by comparison with other observable current market transactions in the same instrument, or is based on a valuation technique whose inputs include only data from observable markets, then the instrument should be recognised at the fair value derived from such observable market data. For valuations that have made use of unobservable inputs, the difference between the model valuation and the initial transaction price (Day One profit) is recognised in profit or loss either: on a straight-line basis over the term of the transaction; or over the period until all model inputs will become observable where appropriate; or released in full when previously unobservable inputs become observable. Various factors influence the availability of observable inputs and these may vary from product to product and change over time. Factors include the depth of activity in the relevant market, the type of product, whether the product is new and not widely traded in the marketplace, the maturity of market modelling and the nature of the transaction (bespoke or generic). To the extent that valuation is based on models or inputs that are not observable in the market, the determination of fair value can be more subjective, dependent on the significance of the unobservable input to the overall valuation. Unobservable inputs are determined based on the best information available, for example by reference to similar assets, similar maturities or other analytical techniques. The sensitivity of valuations used in the financial statements to possible changes in significant unobservable inputs is shown on page 210. Critical accounting estimates and judgements The valuation of financial instruments often involves a significant degree of judgement and complexity, in particular where valuation models make use of unobservable inputs (‘Level 3’ assets and liabilities). This note provides information on these instruments, including the related unrealised gains and losses recognised in the period, a description of significant valuation techniques and unobservable inputs, and a sensitivity analysis. Valuation IFRS 13 Fair value measurement requires an entity to classify its assets and liabilities according to a hierarchy that reflects the observability of significant market inputs. The three levels of the fair value hierarchy are defined below. Quoted market prices – Level 1 Assets and liabilities are classified as Level 1 if their value is observable in an active market. Such instruments are valued by reference to unadjusted quoted prices for identical assets or liabilities in active markets where the quoted price is readily available, and the price represents actual and regularly occurring market transactions. An active market is one in which transactions occur with sufficient volume and frequency to provide pricing information on an ongoing basis. Valuation technique using observable inputs – Level 2 Assets and liabilities classified as Level 2 have been valued using models whose inputs are observable either directly or indirectly. Valuations based on observable inputs include assets and liabilities such as swaps and forwards which are valued using market standard pricing techniques, and options that are commonly traded in markets where all the inputs to the market standard pricing models are observable. Valuation technique using significant unobservable inputs – Level 3 Assets and liabilities are classified as Level 3 if their valuation incorporates significant inputs that are not based on observable market data (unobservable inputs). A valuation input is considered observable if it can be directly observed from transactions in an active market, or if there is compelling external evidence demonstrating an executable exit price. Unobservable input levels are generally determined via reference to observable inputs, historical observations or using other analytical techniques.
home.barclays/annualreport Barclays Bank PLC Annual Report 199

Notes to the financial statements Assets and liabilities held at fair value
18 Fair value of financial instruments continued The following table shows Barclays Bank Group’s assets and liabilities that are held at fair value disaggregated by valuation technique (fair value hierarchy) and balance sheet classification: Assets and liabilities held at fair value
2018 2017
Valuation technique using Valuation technique using
Level 1 Level 2 Level 3 Total Level 1 Level 2 Level 3 Total
Barclays Bank Group £m £m £m £m £m £m £m £m
Trading portfolio assets 51,029 49,396 3,613 104,038 63,925 47,853 1,977 113,755
Financial assets at fair value through the income statement
8,918 131,682 4,650 145,250 4,347 104,188 7,747 116,282
Derivative financial assets 6,813 210,655 5,215 222,683 3,786 228,867 5,334 237,987
Available for sale investments - - - - 22,841 30,618 395 53,854
Financial assets at fair value through other comprehensive income
15,751 28,888 355 44,994 - - - -
Investment property - - 9 9 - - 116 116
Assets included in disposal groups classified as held for salea
- - - - - - 29 29
Total assets 82,511 420,621 13,842 516,974 94,899 411,526 15,598 522,023
Trading portfolio liabilities (19,401) (17,210) (3) (36,614) (20,905) (16,443) (4) (37,352)
Financial liabilities designated at fair value (76) (217,404) (261) (217,741) - (173,238) (480) (173,718)
Derivative financial liabilities (6,152) (208,697) (4,743) (219,592) (3,631) (229,517) (5,197) (238,345)
Total liabilities (25,629) (443,311) (5,007) (473,947) (24,536) (419,198) (5,681) (449,415)
Note a Disposal groups held for sale and measured at fair value less cost to sell are in included in the fair value table. The following table shows Barclays Bank PLC’s assets and liabilities that are held at fair value disaggregated by valuation technique (fair value hierarchy) and balance sheet classification: Assets and liabilities held at fair value
2018 2017
Valuation technique using Valuation technique using
Level 1 Level 2 Level 3 Total Level 1 Level 2 Level 3 Total
Barclays Bank PLC £m £m £m £m £m £m £m £m
Trading portfolio assets 33,925 36,093 3,462 73,480 41,795 36,113 1,928 79,836Financial assets at fair value through the income statement 3,971 171,381 4,013 179,365 3 110,381 6,798 117,182
Derivative financial assets - 216,033 5,214 221,247 - 226,956 5,332 232,288
Available for sale investments - - - - 16,302 32,895 277 49,474Financial assets at fair value through other comprehensive income 14,571 28,780 355 43,706 - - - -
Total assets 52,467 452,287 13,044 517,798 58,100 406,345 14,335 478,780
Trading portfolio liabilities (30,425) (16,201) - (46,626) (26,068) (15,474) - (41,542)
Financial liabilities designated at fair value - (216,715) (251) (216,966) - (168,834) (210) (169,044)
Derivative financial liabilities - (216,792) (4,798) (221,590) - (223,878) (5,349) (229,227)
Total liabilities (30,425) (449,708) (5,049) (485,182) (26,068) (408,186) (5,559) (439,813)
home.barclays/annualreport Barclays Bank PLC Annual Report 200

Credit risk management
The following table shows Barclays Bank Group’s assets and liabilities that are held at fair value disaggregated by valuation technique (fair value hierarchy) and product type: Assets and liabilities held at fair value by product type Assets Liabilities
Valuation technique using Valuation technique using
Level 1 Level 2 Level 3 Level 1 Level 2 Level 3
Barclays Bank Group £m £m £m £m £m £m
As at 31 December 2018
Interest rate derivatives - 122,975 2,478 - (118,231) (2,456)
Foreign exchange derivatives - 63,960 192 - (63,897) (185)
Credit derivatives - 9,374 1,381 - (9,188) (331)
Equity derivatives 6,813 12,933 1,136 (6,152) (16,001) (1,743)
Commodity derivatives - 1,413 28 - (1,380) (28)
Government and government sponsored debt 38,910 47,882 14 (8,143) (11,154) -
Corporate debt - 14,529 456 - (5,085) -
Certificates of deposit, commercial paper and other money market instruments
- 1,135 - - (8,556) (10)
Margin lending - 10,388 - - (26,875) -
Reverse repurchase and repurchase agreements - 118,623 768 - (139,361) -
Non-asset backed loans - 7,378 4,452 - - -
Asset backed securities - 2,265 688 - (245) -
Issued debt - - - - (42,104) (251)
Equity cash products 36,705 7,195 698 (11,258) (1,181) (3)
Private equity investments 7 - 190 - - -
Assets and liabilities held for sale - - - - - -
Othera 76 571 1,361 (76) (53) -
Total 82,511 420,621 13,842 (25,629) (443,311) (5,007)
As at 31 December 2017
Interest rate derivatives - 150,325 2,718 - (143,890) (2,867)
Foreign exchange derivatives - 54,907 160 - (53,346) (124)
Credit derivatives - 11,357 1,386 - (11,312) (240)
Equity derivatives 3,786 9,848 1,064 (3,631) (18,527) (1,961)
Commodity derivatives - 2,430 6 - (2,442) (5)
Government and government sponsored debt 34,782 49,853 49 (13,079) (13,116) -
Corporate debt - 15,098 871 - (3,580) (4)
Certificates of deposit, commercial paper and other money market instruments
- 1,491 - - (7,377) (250)
Reverse repurchase and repurchase agreements - 100,038 - - (126,691) -
Non-asset backed loans - 5,710 6,657 - - -
Asset backed securities - 1,837 626 - (221) -
Issued debt - - - - (38,177) (214)
Equity cash products b 56,323 7,733 502 (7,826) (388) -
Private equity investments 8 1 817 - - (16)
Assets and liabilities held for sale - - 29 - - -
Othera, b - 898 713 - (131) -
Total 94,899 411,526 15,598 (24,536) (419,198) (5,681)
Notes a Other includes commercial real estate loans, funds and fund-linked products, asset backed loans, physical commodities and investment property. b Level 3 preference shares of £390m were reclassified from others to equity cash products.
home.barclays/annualreport Barclays Bank PLC Annual Report 201

Notes to the financial statements Assets and liabilities held at fair value
18 Fair value of financial instruments continued Valuation techniques and sensitivity analysis Sensitivity analysis is performed on products with significant unobservable inputs (Level 3) to generate a range of reasonably possible alternative valuations. The sensitivity methodologies applied take account of the nature of the valuation techniques used, as well as the availability and reliability of observable proxy and historical data and the impact of using alternative models. Sensitivities are dynamically calculated on a monthly basis. The calculation is based on range or spread data of a reliable reference source or a scenario based on relevant market analysis alongside the impact of using alternative models. Sensitivities are calculated without reflecting the impact of any diversification in the portfolio. The valuation techniques used for the material products within Levels 2 and 3, and observability and sensitivity analysis for products within Level 3, are described below. Interest rate derivatives Description: Derivatives linked to interest rates or inflation indices. The category includes futures, interest rate and inflation swaps, swaptions, caps, floors, inflation options, balance guaranteed swaps and other exotic interest rate derivatives. Valuation: Interest rate and inflation derivatives are generally valued using curves of forward rates constructed from market data to project and discount the expected future cash flows of trades. Instruments with optionality are valued using volatilities implied from market inputs, and use industry standard or bespoke models depending on the product type. Observability: In general, inputs are considered observable up to liquid maturities which are determined separately for each input and underlying. Unobservable inputs are generally set by referencing liquid market instruments and applying extrapolation techniques or inferred via another reasonable method. Level 3 sensitivity: Sensitivity to unobservable valuation inputs is based on the dispersion of consensus data services where available, or alternatively it is based on stress scenarios or historic data. Foreign exchange derivatives Description: Derivatives linked to the foreign exchange (FX) market. The category includes FX forward contracts, FX swaps and FX options. The majority are traded as over the counter (OTC) derivatives. Valuation: FX derivatives are valued using industry standard and bespoke models depending on the product type. Valuation inputs include FX rates, interest rates, FX volatilities, interest rate volatilities, FX interest rate correlations and others as appropriate. Observability: FX correlations, forwards and volatilities are generally observable up to liquid maturities which are determined separately for each input and underlying. Unobservable inputs are set by referencing liquid market instruments and applying extrapolation techniques, or inferred via another reasonable method. Level 3 sensitivity: Sensitivity relating to unobservable valuation inputs is primarily based on the dispersion of consensus data services. Credit derivatives Description: Derivatives linked to the credit spread of a referenced entity, index or basket of referenced entities or a pool of referenced assets (e.g. a securitised product). The category includes single name and index credit default swaps (CDS) and asset backed CDS. Valuation: CDS are valued on industry standard models using curves of credit spreads as the principal input. Credit spreads are observed directly from broker data, third party vendors or priced to proxies. Observability: CDS contracts referencing entities that are actively traded are generally considered observable. Other valuation inputs are considered observable if products with significant sensitivity to the inputs are actively traded in a liquid market. Unobservable valuation inputs are generally determined with reference to recent transactions or inferred from observable trades of the same issuer or similar entities. Level 3 sensitivity: Sensitivity to unobservable CDS contracts is determined by applying a shift to credit spread curves based on the average range of pricing observed in the market for similar CDS. Equity derivatives Description: Exchange traded or OTC derivatives linked to equity indices and single names. The category includes vanilla and exotic equity products. Valuation: Equity derivatives are valued using industry standard models. Valuation inputs include stock prices, dividends, volatilities, interest rates, equity repurchase curves and, for multi-asset products, correlations. Observability: In general, valuation inputs are observable up to liquid maturities which are determined separately for each input and underlying. Unobservable inputs are set by referencing liquid market instruments and applying extrapolation techniques, or inferred via another reasonable method. Level 3 sensitivity: Sensitivity is generally estimated using the dispersion of consensus data services.
home.barclays/annualreport Barclays Bank PLC Annual Report 202

Credit risk management
18 Fair value of financial instruments continued Commodity derivatives Description: Exchange traded and OTC derivatives based on underlying commodities such as metals, crude oil and refined products, agricultural, power and natural gas. Valuation: Commodity swaps and options are valued using models incorporating discounting of cash flows and other industry standard modelling techniques. Valuation inputs include forward curves, volatilities implied from market observable inputs and correlations. Observability: Commodity correlations, forwards and volatilities are generally observable up to liquid maturities which are determined separately for each input and underlying. Unobservable inputs are set with reference to similar observable products, or by applying extrapolation techniques to observable inputs. Level 3 sensitivity: Sensitivity is determined primarily by measuring historical variability over a period of years. Where historical data is unavailable or uncertainty is due to volumetric risk, sensitivity is measured by applying appropriate stress scenarios or using proxy bid-offer spread levels. Complex derivative instruments Valuation estimates made by counterparties with respect to complex derivative instruments, for the purpose of determining the amount of collateral to be posted, often differ, sometimes significantly, from Barclays Bank Group’s own estimates. In almost all cases, Barclays Bank Group has been able to successfully resolve such differences or otherwise reach an accommodation with respect to collateral posting levels, including in certain cases by entering into compromise collateral arrangements. Due to the ongoing nature of collateral calls, Barclays Bank Group will often be engaged in discussion with one or more counterparties in respect of such differences at any given time. Valuation estimates made by counterparties for collateral purposes are considered, like any other third party valuation, when determining Barclays Bank Group’s fair value estimates. Government and government sponsored debt Description: Government bonds, supra sovereign bonds and agency bonds. Valuation: Liquid bonds that are actively traded through an exchange or clearing house are marked to the levels observed in these markets. Other actively traded bonds are valued using observable market prices sourced from broker quotes, inter-dealer prices or other reliable pricing sources. Observability: Prices for actively traded bonds are considered observable. Unobservable bonds prices are generally determined by reference to bond yields for actively traded bonds from the same (or a similar) issuer. Level 3 sensitivity: Sensitivity is generally determined by using a range of observable alternative prices. Corporate debt Description: Primarily corporate bonds. Valuation: Corporate bonds are valued using observable market prices sourced from broker quotes, inter-dealer prices or other reliable pricing sources. Observability: Prices for actively traded bonds are considered observable. Unobservable bonds prices are generally determined by reference to bond yields or CDS spreads for actively traded instruments issued by or referencing the same (or a similar) issuer. Level 3 sensitivity: Sensitivity is generally determined by applying a shift to bond yields using the average ranges of external levels observed in the market for similar bonds. Certificates of deposit, commercial paper and other money market instruments Description: Certificates of deposit, commercial paper and other money market instruments. Valuation: Instruments are valued using observable market prices sourced from broker quotes, inter-dealer prices or other reliable pricing services. Observability: Prices for actively traded instruments are considered observable. Unobservable instrument prices are generally determined by reference to bond yields or CDS spreads for actively traded instruments issued by or referencing the same (or a similar) issuer. Level 3 sensitivity: Sensitivity is generally calculated by using a range of observable alternative prices. Margin Lending Description: Includes Prime Brokerage Margin lending, and other similar secured lending agreements. The agreements are primarily short-term in nature. Valuation: Prime Brokerage Margin Lending transactions are generally valued by discounting the expected future cash flows using industry standard models that incorporate market interest rates and repurchase rates, based on the specific details of the transaction. Observability: Inputs are deemed observable up to liquid maturities, and are determined based on the specific features of the transaction. Unobservable inputs are generally set by referencing liquid market instruments and applying extrapolation techniques, or inferred via another reasonable method. Level 3 sensitivity: Sensitivity is generally estimated using the dispersion of consensus data services, or historic trade data. In general, the sensitivity of unobservable inputs is not significant to the overall valuation given the predominantly short-term nature of the agreements.
home.barclays/annualreport Barclays Bank PLC Annual Report 203

Notes to the financial statements Assets and liabilities held at fair value
18 Fair value of financial instruments continued Reverse repurchase and repurchase agreements Description: Includes securities purchased under resale agreements, securities sold under repurchase agreements, and other similar secured lending agreements. The agreements are primarily short-term in nature. Valuation: Repurchase and reverse repurchase agreements are generally valued by discounting the expected future cash flows using industry standard models that incorporate market interest rates and repurchase rates, based on the specific details of the transaction. Observability: Inputs are deemed observable up to liquid maturities, and are determined based on the specific features of the transaction. Unobservable inputs are generally set by referencing liquid market instruments and applying extrapolation techniques, or inferred via another reasonable method. Level 3 sensitivity: Sensitivity is generally estimated using the dispersion of consensus data services, stress scenarios or historic data. In general, the sensitivity of unobservable inputs is not significant to the overall valuation given the predominantly short-term nature of the agreements. Non-asset backed loans Description: Largely made up of fixed rate loans. Valuation: Fixed rate loans are valued using models that discount expected future cash flows based on interest rates and loan spreads. Observability: Within this loan population, the loan spread is generally unobservable. Unobservable loan spreads are determined by incorporating funding costs, the level of comparable assets such as gilts, issuer credit quality and other factors. Level 3 sensitivity: The sensitivity of fixed rate loans is calculated by applying a shift to loan spreads. Asset backed securities Description: Securities that are linked to the cash flows of a pool of referenced assets via securitisation. The category includes residential mortgage backed securities, commercial mortgage backed securities, CDOs, collateralised loan obligations (CLOs) and other asset backed securities. Valuation: Where available, valuations are based on observable market prices sourced from broker quotes and inter-dealer prices. Otherwise, valuations are determined using industry standard discounted cash flow analysis that calculates the fair value based on valuation inputs such as constant default rate, conditional prepayment rate, loss given default and yield. These inputs are determined by reference to a number of sources including proxying to observed transactions, market indices or market research, and by assessing underlying collateral performance. Proxying to observed transactions, indices or research requires an assessment and comparison of the relevant securities’ underlying attributes including collateral, tranche, vintage, underlying asset composition (historical losses, borrower characteristics and loan attributes such as loan to value ratio and geographic concentration) and credit ratings (original and current). Observability: Where an asset backed product does not have an observable market price and the valuation is determined using a discounted cash flow analysis, the instrument is considered unobservable. Level 3 sensitivity: The sensitivity analysis for asset backed products is based on externally sourced pricing dispersion or by stressing the inputs of discount cash flow analysis. Issued debt Description: Debt notes issued by Barclays Bank Group. Valuation: Issued debt is valued using discounted cash flow techniques and industry standard models incorporating various inputs observed for each instrument. Observability: Barclays Bank Group issued notes are generally observable. Structured notes are debt instruments containing embedded derivatives. Where either an input to the embedded derivative or the debt instrument is deemed unobservable and significant to the overall valuation of the note, the structured note is classified as Level 3. Level 3 sensitivity: Sensitivity to the unobservable input in the embedded derivative is calculated in line with the method used for the derivative instrument concerned. Equity cash products Description: Includes listed equities, Exchange Traded Funds (ETF) and preference shares. Valuation: Valuation of equity cash products is primarily determined through market observable prices. Observability: Prices for actively traded equity cash products are considered observable. Unobservable equity prices are generally determined by reference to actively traded instruments that are similar in nature, or inferred via another reasonable method. Level 3 sensitivity: Sensitivity is generally calculated based on applying a shift to the valuation of the underlying asset. Private equity investments Description: Includes private equity holdings and principal investments.
home.barclays/annualreport Barclays Bank PLC Annual Report 204

Credit risk management
18 Fair value of financial instruments continued Valuation: Private equity investments are valued in accordance with the ‘International Private Equity and Venture Capital Valuation Guidelines’ which require the use of a number of individual pricing benchmarks such as the prices of recent transactions in the same or similar entities, discounted cash flow analysis and comparison with the earnings multiples of listed companies. While the valuation of unquoted equity instruments is subjective by nature, the relevant methodologies are commonly applied by other market participants and have been consistently applied over time. Observability: Inputs are considered observable if there is active trading in a liquid market of products with significant sensitivity to the inputs. Unobservable inputs include earnings estimates, multiples of comparative companies, marketability discounts and discount rates. Level 3 sensitivity: Private equity valuation models are each sensitive to a number of key assumptions, such as projected future earnings, comparator multiples, marketability discounts and discount rates. Valuation sensitivity is generally estimated by shifting assumptions to reasonable alternative levels. Assets and liabilities held for sale Description: Assets and liabilities held for sale consist of disposal groups Barclays Bank Group intend to sell. Valuation: Assets and liabilities held for sale are valued at the lower of carrying value and fair value less costs to sell. Level 3 sensitivity: The disposal groups that are measured at fair value less cost to sell are valued at the agreed price less costs to sell and are not expected to display significant sensitivity. The sensitivity of the assets and liabilities measured at carrying value is explained within the relevant product descriptions. Other Description: Other includes commercial real estate loans, funds and fund-linked products, asset backed loans, physical commodities and investment property. Assets and liabilities reclassified between Level 1 and Level 2 During the period, there were no material transfers between Level 1 to Level 2 (2017: £3,807m of government bond assets, and £1,023m/£(950)m of commodity derivative assets and liabilities transferred from Level 1 to Level 2). Level 3 movement analysis The following table summarises the movements in the Level 3 balances during the period. Transfers have been reflected as if they had taken place at the beginning of the year. Assets and liabilities included in disposal groups classified as held for sale and measured at fair value less cost to sell are not included as these are measured at fair value on a non-recurring basis. Asset and liability transfers between Level 2 and Level 3 are primarily due to 1) an increase or decrease in observable market activity related to an input or 2) a change in the significance of the unobservable input, with assets and liabilities classified as Level 3 if an unobservable input is deemed significant.
home.barclays/annualreport Barclays Bank PLC Annual Report 205

Notes to the financial statements Assets and liabilities held at fair value
Analysis of movements in Level 3 assets and liabilities
As at 1 January
2018a
Total gains and losses in the period
recognised in the income statement
Total gains or losses
recognised in OCI
Transfers As at 31 December
2018 Purchases Sales Issues SettlementsTrading income
Other income In Out
Barclays Bank Group £m £m £m £m £m £m £m £m £m £m £m
Government and government sponsored debt 49 14 (49) - - - - - - - 14 Corporate debt 871 108 (88) - (23) 9 - - 39 (528) 388 Non-asset backed loans 166 5,514 (3,480) - - - - - 71 (8) 2,263 Asset backed securities 627 205 (168) - (2) (21) - - 58 (35) 664 Equity cash products 68 18 (9) - - (16) - - 107 (32) 136 Other 196 4 (6) - (20) (32) - - 145 (139) 148 Trading portfolio assets 1,977 5,863 (3,800) - (45) (60) - - 420 (742) 3,613 Non-asset backed loans 6,073 364 (4,432) - (194) 25 - - - - 1,836 Private equity investments 688 188 (7) - (231) 2 (10) - 60 (499) 191 Equity cash products 398 87 (1) - - 1 74 - - - 559 Other 360 6,624 (4,920) - (47) 29 18 - - - 2,064 Financial assets at fair value through the income statement 7,519 7,263 (9,360) - (472) 57 82 - 60 (499) 4,650 Equity cash products 36 - (16) - - - - - - (18) 2 Private equity investments 129 - - - - - - - - (129) -Other 40 - - - - - - (1) 314 - 353 Financial assets at fair value through other comprehensive income 205 - (16) - - - - (1) 314 (147) 355 Investment property 116 9 (115) - - - (1) - - - 9 Trading portfolio liabilities (4) - - - - (3) - - - 4 (3) Certificates of deposit, commercial paper and other money market instruments (250) - - - 5 - (3) - - 238 (10)Issued debt (214) - - (4) 9 33 - - (225) 150 (251)Other (16) - - - - - - - - 16 -Financial liabilities designated at fair value (480) - - (4) 14 33 (3) - (225) 404 (261) Interest rate derivatives (150) 1 (1) - 196 (25) - - (71) 72 22 Foreign exchange derivatives 37 - - - (9) 5 - - (13) (13) 7 Credit derivatives 1,146 (6) 3 - (12) (85) - - 7 (3) 1,050 Equity derivatives (896) 72 (570) - 125 73 1 - 128 460 (607)Commodity derivatives - - - - - - - - - - -Net derivative financial instrumentsb 137 67 (568) - 300 (32) 1 - 51 516 472 Total 9,470 13,202 (13,859) (4) (203) (5) 79 (1) 620 (464) 8,835 Notes a Balances as at 1 January 2018 include the IFRS 9 transition impact. Balances as at 31 December 2017 have been presented on an IAS 39 basis. b The derivative financial instruments are represented on a net basis. On a gross basis, derivative financial assets are £5,215m (2017: £5,334m) and derivative financial liabilities are
£4,743m (2017: £5,197m).
home.barclays/annualreport Barclays Bank PLC Annual Report 206

Credit risk management
Analysis of movements in Level 3 assets and liabilities
As at 1 January
2017 Purchases Sales Issues Settlements
Total gains and losses in the period
recognised in the income statement
Total gains or losses
recognised in OCI
Transfers As at 31
December 2017
Trading income
Other income In Out
Barclays Bank Group £m £m £m £m £m £m £m £m £m £m £m
Government and government sponsored debt 3 46 - - - - - - - - 49 Corporate debt 969 73 (47) - (98) 21 - - 6 (53) 871 Non-asset backed loans 151 435 (187) - (221) (8) - - 1 (5) 166 Asset backed securities 515 195 (78) - (9) 9 - - - (5) 627 Equity cash products 77 24 (11) - - (19) - - - (3) 68 Other 350 2 (77) - (97) 25 (1) - 3 (9) 196
Trading portfolio assets 2,065 775 (400) - (425) 28 (1) - 10 (75) 1,977 Non-asset backed loans 8,616 - - - (2,284) 159 - - - - 6,491 Asset backed loans 201 27 (25) - (3) (17) (3) - 6 (31) 155 Private equity investments 562 26 (127) - (1) (1) 29 - 21 (11) 498 Equity cash productsa 185 - - - (1) (7) 205 - 16 - 398 Othera 383 4,675 (4,646) - (247) 41 (8) - 16 (9) 205 Financial assets at fair value through the income statement 9,947 4,728 (4,798) - (2,536) 175 223 - 59 (51) 7,747 Equity cash products 73 - - - - - 1 2 5 (45) 36 Private equity investments 294 15 (78) - - - (5) 37 60 (4) 319 Other 5 36 - - (2) - - 1 - - 40
Available for sale investments 372 51 (78) - (2) - (4) 40 65 (49) 395 Investment property 81 114 (69) - - - (10) - - - 116 Trading portfolio liabilities (7) (4) 1 - - 2 - - (1) 5 (4) Certificates of deposit, commercial paper and other money market instruments (319) - 69 - - - 9 - (104) 95 (250)Issued debt (298) - 84 - - - - - - - (214)Other (223) - - - 204 - (6) - - 9 (16)Financial liabilities designated at fair value (840) - 153 - 204 - 3 - (104) 104 (480) Interest rate derivatives 899 58 (1) - (208) (166) - - (11) (721) (150)Foreign exchange derivatives 81 - - - (12) 27 - - (13) (46) 37Credit derivatives 1,370 5 (2) - (29) (128) - - (69) (1) 1,146Equity derivatives (970) (220) (14) - 374 (43) - - (16) (7) (896)Commodity derivatives (5) - - - - 4 - - 1 - -
Net derivative financial instruments 1,375 (157) (17) - 125 (306) - - (108) (775) 137 Assets and liabilities held for sale 574 - (574) - - - - - - - -
Total 13,567 5,507 (5,782) - (2,634) (101) 211 40 (79) (841) 9,888Net assets held for sale measured at fair value on non-recurring basis 29 Total 13,567 5,507 (5,782) - (2,634) (101) 211 40 (79) (841) 9,917 Note a Preference shares of £390m were reclassified from others to equity cash products.
home.barclays/annualreport Barclays Bank PLC Annual Report 207

Notes to the financial statements Assets and liabilities held at fair value
Analysis of movements in Level 3 assets and liabilities
As at 1
January 2018a
Total gains and losses in the period recognised in the income statement Total gains or
losses recognised in
OCI
Transfers As at 31
December 2018
Purchases Sales Issues Settlements
Trading income
Other income In Out
Barclays Bank PLC £m £m £m £m £m £m £m £m £m £m £m
Trading portfolio assets 1,929 5,722 (3,724) - (44) (45) - - 354 (730) 3,462Financial assets at fair value through the income statement 7,404 6,867 (9,356) - (78) (6) 73 - 12 (903) 4,013Fair value through other comprehensive income 187 - (16) - - - - (1) 314 (129) 355Financial liabilities designated at fair value (226) - - (4) 6 33 - - (225) 165 (251)Net derivative financial instrumentsb (16) 67 (568) - 354 11 1 - 51 516 416
Total 9,278 12,656 (13,664) (4) 238 (7) 74 (1) 506 (1,081) 7,995
Analysis of movements in Level 3 assets and liabilities
As at 1
January 2017
Total gains and losses in the period recognised in the income statement Total gains or
losses recognised in
OCI
Transfers As at 31
December 2017
Purchases Sales Issues Settlements
Trading income
Other income In Out
Barclays Bank PLC £m £m £m £m £m £m £m £m £m £m £m
Trading portfolio assets 2,003 534 (214) - (383) 36 - - 11 (59) 1,928Financial assets at fair value through the income statement 9,135 4,657 (4,666) - (2,502) (34) 193 - 15 - 6,798Available for sale investments 250 14 (24) - - - (4) 28 54 (41) 277
Investment property 16 - (16) - - - - - - - -Trading portfolio liabilities - (5) - - - (1) - - (1) 7 -Financial liabilities designated at fair value (467) - 3 - 238 16 - - (7) 7 (210)Net derivative financial instrumentsb 1,226 (159) (12) - 124 (312) - - (110) (774) (17)
Total 12,163 5,041 (4,929) - (2,523) (295) 189 28 (38) (860) 8,776 Notes a Balances as at 1 January 2018 include the IFRS 9 transition impact. Balances as at 31 December 2017 have been presented on an IAS 39 basis. b The derivative financial instruments are represented on a net basis. On a gross basis, derivative financial assets are £5,214m (2017: £5,332m) and derivative financial liabilities are
£4,798m (2017: £5,349m).
home.barclays/annualreport Barclays Bank PLC Annual Report 208

Credit risk management
Unrealised gains and losses on Level 3 financial assets and liabilities The following tables disclose the unrealised gains and losses recognised in the year arising on Level 3 financial assets and liabilities held at year end. Unrealised gains and losses recognised during the period on Level 3 assets and liabilities held at year end
2018 2017
Income statement Other compre-hensiveincome
Income statement Other compre-hensive incomeBarclays Bank Group
Trading income
Other income Total
Trading income
Other income Totala
As at 31 December £m £m £m £m £m £m £m £m
Trading portfolio assets (60) - - (60) (34) - - (34)Financial assets at fair value through the income statement 44 68 - 112 147 200 - 347
Available for sale investments - - - - - (4) 29 25
Fair value through other comprehensive income - - (1) (1) - - - -
Investment property - (1) - (1) - (10) - (10)
Trading portfolio liabilities (3) - - (3) 3 - - 3
Financial liabilities designated at fair value 55 - - 55 58 10 - 68
Net derivative financial instruments (14) - - (14) (301) - - (301)
Total 22 67 (1) 88 (127) 196 29 98
Unrealised gains and losses recognised during the period on Level 3 assets and liabilities held at year end
2018 2017
Income statement Other
compre-hensive income Total
Income statement Other
compre-hensive income TotalaBarclays Bank PLC
Trading income
Other income
Trading income
Other income
As at 31 December £m £m £m £m £m £m £m £m
Trading portfolio assets (45) - - (45) (20) - - (20)
Financial assets designated at fair value 40 58 - 98 158 217 - 375
Available for sale assets - - - - - (4) 28 24
Fair value through other comprehensive income - - (1) (1) - - - -
Financial liabilities designated at fair value 55 - - 55 58 - - 58
Net derivative financial instruments 29 - - 29 (307) - - (307)
Total 79 58 (1) 136 (111) 213 28 130
Sensitivity analysis of valuations using unobservable inputs
2018 2017
Favourable changes Unfavourable changes Favourable changes Unfavourable changes
Income
statement EquityIncome
statement EquityIncome
statement Equity Income
statement Equity
£m £m £m £m £m £m £m £m
Interest rate derivatives 80 - (162) - 114 - (138) -
Foreign exchange derivatives 7 - (10) - 6 - (6) -
Credit derivatives 126 - (73) - 106 - (79) -
Equity derivatives 110 - (112) - 99 - (99) -
Commodity derivatives 1 - (1) - 3 - (3) -
Corporate debt 10 - (2) - 4 - (3) -
Non asset backed loans 141 - (210) - 243 - (468) -
Asset backed securities - - - - 1 - - -
Equity cash products 121 - (155) - 12 24 (8) (24)
Private equity investments - - (10) - 133 13 (138) (13)
Othera 2 - (2) - 5 - (5) -
Total 598 - (737) - 726 37 (947) (37) Note a Other includes commercial real estate loans, funds and fund-linked products, asset backed loans, physical commodities and investment property.
home.barclays/annualreport Barclays Bank PLC Annual Report 209

Notes to the financial statements Assets and liabilities held at fair value
18 Fair value of financial instruments continued The effect of stressing unobservable inputs to a range of reasonably possible alternatives, alongside considering the impact of using alternative models, would be to increase fair values by up to £598m (2017: £763m) or to decrease fair values by up to £737m (2017: £984m) with all the potential effect impacting profit and loss. Significant unobservable inputs The following table discloses the valuation techniques and significant unobservable inputs for assets and liabilities recognised at fair value and classified as Level 3 along with the range of values used for those significant unobservable inputs:
Valuation technique(s) a Significant unobservable inputs
2018 Range
2017 Range
Min Max Min Max Unitsb
Derivative financial instrumentsc
Interest rate derivatives Discounted cash flows Inflation forwards 1 2 1 3 %
Credit spread 6 897 45 1,320 bps
Yield 0.1 0.2 0.1 0.1 bps
Comparable pricing Price - 100 - 100 points
Option model Inflation volatility 33 174 35 201 bps vol
IR - IR correlation (26) 100 (24) 99 %
FX - IR correlation (30) 78 (30) 24 %
Interest rate volatility 10 199 5 353 bps vol
Credit derivatives Discounted cash flows Credit spread 142 209 122 190 bps
Comparable pricing Price 10 96 97 97 points
Equity derivatives Option model Equity volatility 2 81 3 92 %
Equity - equity correlation (100) 100 (100) 100 %
Discounted cash flow Discounted margin (171) 301 (105) 301 bpsNon-derivative financial instruments
Non-asset backed loans Discounted cash flows Loan spread 30 196 30 596 bps
Credit spread 25 800 300 726 bps
Price - 118 - 50 points
Comparable pricing Price - 100 - 100 pointsReverse repurchase and repurchase agreements Discounted cash flows Funding spread (20) 139 - - bps
Asset backed securities Comparable pricing Price - 102 - 99 points
Otherd Discounted cash flows Credit spread 143 575 152 299 bps Notes a A range has not been provided for Net Asset Value as there would be a wide range reflecting the diverse nature of the positions. b The units used to disclose ranges for significant unobservable inputs are percentages, points and basis points. Points are a percentage of par; for example, 100 points equals 100%
of par. A basis point equals 1/100th of 1%; for example, 150 basis points equals 1.5%. c Certain derivative instruments are classified as Level 3 due to a significant unobservable credit spread input into the calculation of the Credit Valuation Adjustment for the
instruments. The range of significant unobservable credit spreads is between 6-897bps (2017: 31-596bps). d Other includes commercial real estate loans, funds and fund-linked products, asset backed loans, physical commodities and investment property.
home.barclays/annualreport Barclays Bank PLC Annual Report 210

Credit risk management
18 Fair value of financial instruments continued The following section describes the significant unobservable inputs identified in the table above, and the sensitivity of fair value measurement of the instruments categorised as Level 3 assets or liabilities to increases in significant unobservable inputs. Where sensitivities are described, the inverse relationship will also generally apply. Where reliable interrelationships can be identified between significant unobservable inputs used in fair value measurement, a description of those interrelationships is included below. Forwards A price or rate that is applicable to a financial transaction that will take place in the future. In general, a significant increase in a forward in isolation will result in a fair value increase for the contracted receiver of the underlying (currency, bond, commodity, etc.), but the sensitivity is dependent on the specific terms of the instrument. Credit spread Credit spreads typically represent the difference in yield between an instrument and a benchmark security or reference rate. Credit spreads reflect the additional yield that a market participant demands for taking on exposure to the credit risk of an instrument and form part of the yield used in a discounted cash flow calculation. In general, a significant increase in credit spread in isolation will result in a movement in a fair value decrease for a cash asset. For a derivative instrument, a significant increase in credit spread in isolation can result in a fair value increase or decrease depending on the specific terms of the instrument. Volatility Volatility is a measure of the variability or uncertainty in return for a given derivative underlying. It is an estimate of how much a particular underlying instrument input or index will change in value over time. In general, volatilities are implied from observed option prices. For unobservable options the implied volatility may reflect additional assumptions about the nature of the underlying risk, and the strike/maturity profile of a specific contract. In general a significant increase in volatility in isolation will result in a fair value increase for the holder of a simple option, but the sensitivity is dependent on the specific terms of the instrument. There may be interrelationships between unobservable volatilities and other unobservable inputs (e.g. when equity prices fall, implied equity volatilities generally rise) but these are generally specific to individual markets and may vary over time. Correlation Correlation is a measure of the relationship between the movements of two variables. Correlation can be a significant input into valuation of derivative contracts with more than one underlying instrument. Credit correlation generally refers to the correlation between default processes for the separate names that make up the reference pool of a CDO structure. A significant increase in correlation in isolation can result in a fair value increase or decrease depending on the specific terms of the instrument. Comparable price Comparable instrument prices are used in valuation by calculating an implied yield (or spread over a liquid benchmark) from the price of a comparable observable instrument, then adjusting that yield (or spread) to account for relevant differences such as maturity or credit quality. Alternatively, a price-to-price basis can be assumed between the comparable and unobservable instruments in order to establish a value. In general, a significant increase in comparable price in isolation will result in an increase in the price of the unobservable instrument. For derivatives, a change in the comparable price in isolation can result in a fair value increase or decrease depending on the specific terms of the instrument. Loan spread Loan spreads typically represent the difference in yield between an instrument and a benchmark security or reference rate. Loan spreads typically reflect credit quality, the level of comparable assets such as gilts and other factors, and form part of the yield used in a discounted cash flow calculation. The ESHLA portfolio primarily consists of long-dated fixed rate loans extended to counterparties in the UK Education, Social Housing and Local Authority sectors. The loans are categorised as Level 3 in the fair value hierarchy due to their illiquid nature and the significance of unobservable loan spreads to the valuation. Valuation uncertainty arises from the long-dated nature of the portfolio, the lack of secondary market in the loans and the lack of observable loan spreads. The majority of ESHLA loans are to borrowers in heavily regulated sectors that are considered extremely low credit risk, and have a history of zero defaults since inception. While the overall loan spread range is from 30bps to 196bps (2017: 30bps to 596bps), the vast majority of spreads are concentrated towards the bottom end of this range, with 99% of the loan notional being valued with spreads less than 200bps consistently for both years. In general, a significant increase in loan spreads in isolation will result in a fair value decrease for a loan.
home.barclays/annualreport Barclays Bank PLC Annual Report 211

Notes to the financial statements Assets and liabilities held at fair value
18 Fair value of financial instruments continued Loss given default Loss given default represents the expected loss upon liquidation of the collateral as a percentage of the balance outstanding. In general, a significant increase in the loss given default in isolation will translate to lower recovery and lower projected cash flows to pay to the securitisation, resulting in a movement in fair value that is unfavourable for the holder of the securitised product. EBITDA multiple EBITDA multiple is the ratio of the valuation of the investment to the earnings before interest, taxes, depreciation and amortisation. In general, a significant increase in the multiple will result in a fair value increase for an investment. Fair value adjustments Key balance sheet valuation adjustments are quantified below: 2018 2017
£m £m
Exit price adjustments derived from market bid-offer spreads (451) (391)
Uncollateralised derivative funding (47) (45)
Derivative credit valuation adjustments (125) (103)
Derivative debit valuation adjustments 237 131 Exit price adjustments derived from market bid-offer spreads Barclays Bank Group uses mid-market pricing where it is a market maker and has the ability to transact at, or better than, mid-price (which is the case for certain equity, bond and vanilla derivative markets). For other financial assets and liabilities, bid-offer adjustments are recorded to reflect the exit level for the expected close out strategy. The methodology for determining the bid-offer adjustment for a derivative portfolio involves calculating the net risk exposure by offsetting long and short positions by strike and term in accordance with the risk management and hedging strategy. Bid-offer levels are generally derived from market quotes such as broker data. Less liquid instruments may not have a directly observable bid-offer level. In such instances, an exit price adjustment may be derived from an observable bid-offer level for a comparable liquid instrument, or determined by calibrating to derivative prices, or by scenario or historical analysis. Exit price adjustments derived from market bid-offer spreads have increased by £60m to £451m as a result of movements in market bid offer spreads. Discounting approaches for derivative instruments Collateralised In line with market practice, the methodology for discounting collateralised derivatives takes into account the nature and currency of the collateral that can be posted within the relevant credit support annex (CSA). The CSA aware discounting approach recognises the ‘cheapest to deliver’ option that reflects the ability of the party posting collateral to change the currency of the collateral. Uncollateralised A fair value adjustment of £47m is applied to account for the impact of incorporating the cost of funding into the valuation of uncollateralised and partially collateralised derivative portfolios and collateralised derivatives where the terms of the agreement do not allow the rehypothecation of collateral received. This adjustment is referred to as the Funding Fair Value Adjustment (FFVA). FFVA has increased by £2m to £47m mainly as a result of change in Barclays funding spreads and trading activity. FFVA is determined by calculating the net expected exposure at a counterparty level and applying a funding rate to the exposure that reflects the market cost of funding. Barclays Bank Group’s internal Treasury rates are used as an input to the calculation. The approach takes into account the probability of default of each counterparty, as well as any mandatory break clauses. FFVA incorporates a scaling factor which is an estimate of the extent to which the cost of funding is incorporated into observed traded levels. On calibrating the scaling factor, it is with the assumption that Credit Valuation Adjustments (CVA) and Debit Valuation Adjustments (DVA) are retained as valuation components incorporated into such levels. The effect of incorporating this scaling factor at 31 December 2018 was to reduce FFVA by £141m (2017: £138m). The approach outlined above has been in use since 2012 with no significant changes. Barclays Bank Group continues to monitor market practices and activity to ensure the approach to uncollateralised derivative valuation remains appropriate. Derivative credit and debit valuation adjustments CVA and DVA are incorporated into derivative valuations to reflect the impact on fair value of counterparty credit risk and Barclays Bank Group’s own credit quality respectively. These adjustments are calculated for uncollateralised and partially collateralised derivatives across all asset classes. CVA and DVA are calculated using estimates of exposure at default, probability of default and recovery rates, at a counterparty level. Counterparties include (but are not limited to) corporates, sovereigns and sovereign agencies and supranationals.
home.barclays/annualreport Barclays Bank PLC Annual Report 212

Credit risk management
18 Fair value of financial instruments continued Exposure at default is generally estimated through the simulation of underlying risk factors through approximating with a more vanilla structure, or by using current or scenario-based mark to market as an estimate of future exposure. Probability of default and recovery rate information is generally sourced from the CDS markets. Where this information is not available, or considered unreliable, alternative approaches are taken based on mapping internal counterparty ratings onto historical or market-based default and recovery information. In particular, this applies to sovereign related names where the effect of using the recovery assumptions implied in CDS levels would imply a £50m (2017: £50m) increase in CVA. Correlation between counterparty credit and underlying derivative risk factors, termed ‘wrong-way,’ or ‘right-way’ risk, is not systematically incorporated into the CVA calculation but is adjusted where the underlying exposure is directly related to the counterparty. CVA increased by £22m to £125m because of widening of counterparty credit spreads, changes in non-credit factors impacting CVA and trading activity. DVA increased by £106m to £237m, primarily as a result of Barclays’ credit spreads widening. Portfolio exemptions Barclays Bank Group uses the portfolio exemption in IFRS 13 Fair Value Measurement to measure the fair value of groups of financial assets and liabilities. Instruments are measured using the price that would be received to sell a net long position (i.e. an asset) for a particular risk exposure or to transfer a net short position (i.e. a liability) for a particular risk exposure in an orderly transaction between market participants at the balance sheet date under current market conditions. Accordingly, Barclays Bank Group measures the fair value of the group of financial assets and liabilities consistently with how market participants would price the net risk exposure at the measurement date. Unrecognised gains as a result of the use of valuation models using unobservable inputs The amount that has yet to be recognised in income that relates to the difference between the transaction price (the fair value at initial recognition) and the amount that would have arisen had valuation models using unobservable inputs been used on initial recognition, less amounts subsequently recognised, is £141m (2017: £109m) for financial instruments measured at fair value and £31m (2017: £253m) for financial instruments carried at amortised cost. The increase in financial instruments measured at fair value of £32m was driven by additions £65m (2017: £34m) offset by a transfer out of £15m (December 2017: £nil) to Barclays Bank UK PLC and £18m (2017: £104m) of amortisation and releases. The decrease of £222m in financial instruments carried at amortised cost was driven by the transfer out of £222m (December 2017: £nil) to Barclays Bank UK PLC and £2m (2017: £22m) of amortization and releases offset by additions of £2m (2017: £119m). Third party credit enhancements Structured and brokered certificates of deposit issued by Barclays Bank Group are insured up to $250,000 per depositor by the Federal Deposit Insurance Corporation (FDIC) in the US. The FDIC is funded by premiums that Barclays Bank Group and other banks pay for deposit insurance coverage. The carrying value of these issued certificates of deposit that are designated under the IFRS 9 fair value option includes this third party credit enhancement. The on-balance sheet value of these brokered certificates of deposit amounted to £4,797m (2017: £4,070m).
home.barclays/annualreport Barclays Bank PLC Annual Report 213

Notes to the financial statements Assets and liabilities held at fair value
Comparison of carrying amounts and fair values The following tables summarises the fair value of financial assets and liabilities measured at amortised cost on Barclays Bank Group’s and Barclays Bank PLC’s balance sheet: Barclays Bank Group 2018 2017
Carrying amount Fair value Level 1 Level 2 Level 3
Carrying amount Fair value Level 1 Level 2 Level 3
As at 31 December £m £m £m £m £m £m £m £m £m £m
Financial assets Loans and advances at amortised cost – Home loans 13,160 12,592 - - 12,592 147,002 145,262 - - 145,262– Credit cards, unsecured and other retail lending 31,921 33,115 - - 33,115 55,767 55,106 655 - 54,451– Finance lease receivablesa 1,886 2,057 2,854 2,964 – Corporate loans 89,992 89,671 223 66,703 22,745 124,076 122,209 8,986 64,472 48,751Reverse repurchase agreements and other similar secured lending 1,613 1,613 - 1,613 - 12,546 12,546 - 12,546 -Assets included in disposal groups classified as held for saleb - - - - - 1,164 1,195 - - 1,195 Financial liabilities Deposits at amortised cost – Banks (15,569) (15,569) (4,623) (10,946) - (12,335) (12,341) (4,375) (7,966) -– Current and demand accounts (77,264) (77,264) (77,264) - - (146,255) (146,232) (146,232) - -– Savings accounts (26,980) (26,980) (26,980) - - (134,339) (134,369) (134,369) - -– Other time deposits (79,524) (79,524) (48,573) (30,951) - (106,260) (106,325) (62,750) (37,724) (5,851)Repurchase agreements and other similar secured lending (7,378) (7,378) - (7,378) - (40,338) (40,338) - (40,338) -Debt securities in issue (39,063) (39,083) - (36,967) (2,116) (69,386) (70,824) - (68,503) (2,321)Subordinated liabilities (35,327) (36,174) - (36,174) - (24,193) (25,451) - (25,451) - Notes a The fair value hierarchy for finance lease receivables is not required as part of the standard. b Disposal groups held for sale and measured at fair value less cost to sell are included in the fair value table.
Barclays Bank PLC 2018 2017
Carrying amount Fair value Level 1 Level 2 Level 3
Carrying amount Fair value Level 1 Level 2 Level 3
As at 31 December £m £m £m £m £m £m £m £m £m £m
Financial assets Loans and advances at amortised cost – Home loans 12,229 11,679 - - 11,679 146,052 144,311 - - 144,311– Credit cards, unsecured and other retail lending 4,716 4,716 - - 4,716 31,542 30,972 655 - 30,317– Corporate loans 139,819 139,617 223 118,005 21,389 182,770 180,964 5,532 127,794 47,638Reverse repurchase agreements and other similar secured lending 5,766 5,766 - 5,766 - 22,964 22,964 - 22,964 - Financial liabilities Deposits at amortised cost – Banks (17,524) (17,524) (4,581) (12,943) - (13,494) (13,494) (4,047) (9,447) -– Current and demand accounts (70,942) (70,942) (70,942) - - (203,347) (203,325) (140,143) (63,106) (76)– Savings accounts (17,440) (17,440) (17,440) - - (126,794) (126,824) (126,824) - -– Other time deposits (125,111) (125,111) (48,573) (76,538) - (82,267) (82,281) (60,615) (15,812) (5,854)Repurchase agreements and other similar secured lending (11,113) (11,113) - (11,113) - (49,883) (49,883) - (49,883) -Debt securities in issue (26,391) (26,428) - (26,249) (179) (55,874) (56,758) - (56,580) (178)Subordinated liabilities (35,085) (35,894) - (35,894) - (24,203) (25,222) - (25,222) -
home.barclays/annualreport Barclays Bank PLC Annual Report 214

Credit risk management
18 Fair value of financial instruments continued The fair value is an estimate of the price that would be received to sell an asset or paid to transfer a liability in an orderly transaction between market participants at the measurement date. As a wide range of valuation techniques are available, it may not be appropriate to directly compare this fair value information to independent market sources or other financial institutions. Different valuation methodologies and assumptions can have a significant impact on fair values which are based on unobservable inputs. Financial assets The carrying value of financial assets held at amortised cost (including loans and advances to banks and customers, and other lending such as reverse repurchase agreements and cash collateral on securities borrowed) is determined in accordance with the relevant accounting policy in Note 20. Loans and advances at amortised cost The fair value of loans and advances, for the purpose of this disclosure, is derived from discounting expected cash flows in a way that reflects the current market price for lending to issuers of similar credit quality. Where market data or credit information on the underlying borrowers is unavailable, a number of proxy/extrapolation techniques are employed to determine the appropriate discount rates. For retail lending (i.e. Home loans and Credit cards) tailored discounted cash flow models are predominantly used to estimate the fair value of different product types. For example, for home loans different models are used to estimate fair values of tracker, offset and fixed rate mortgage products. Key inputs to these models are the differentials between historic and current product margins and estimated prepayment rates. The fair value of Corporate loans is calculated by the use of discounted cash flow techniques where the gross loan values are discounted at a rate of difference between contractual margins and hurdle rates or spreads where Barclays Bank Group charges a margin over LIBOR depending on credit quality and loss given default and years to maturity. Reverse repurchase agreements The fair value of reverse repurchase agreements approximates carrying amount as these balances are generally short dated and fully collateralised. Financial liabilities The carrying value of financial liabilities held at amortised cost (including customer accounts, other deposits, repurchase agreements and cash collateral on securities lent, debt securities in issue and subordinated liabilities) is determined in accordance with the accounting policy in Note 1. Deposits at amortised cost In many cases, the fair value disclosed approximates carrying value because the instruments are short term in nature or have interest rates that reprice frequently, such as customer accounts and other deposits and short-term debt securities. The fair value for deposits with longer-term maturities, mainly time deposits, are estimated using discounted cash flows applying either market rates or current rates for deposits of similar remaining maturities. Consequently, the fair value discount is minimal. Debt securities in issue Fair values of other debt securities in issue are based on quoted prices where available, or where the instruments are short dated, carrying amount approximates fair value. Repurchase agreements The fair value of repurchase agreements approximates carrying amounts as these balances are generally short dated. Subordinated liabilities Fair values for dated and undated convertible and non-convertible loan capital are based on quoted market rates for the issuer concerned or issuers with similar terms and conditions.
home.barclays/annualreport Barclays Bank PLC Annual Report 215
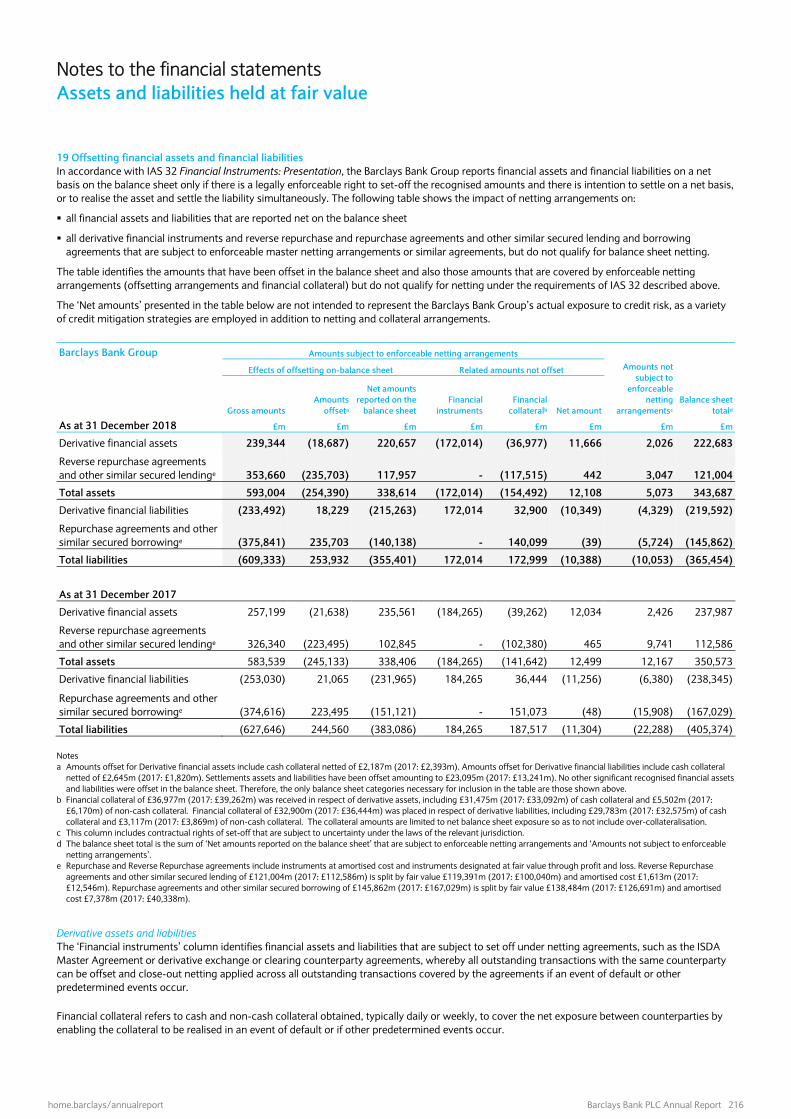
Notes to the financial statements Assets and liabilities held at fair value
19 Offsetting financial assets and financial liabilities In accordance with IAS 32 Financial Instruments: Presentation, the Barclays Bank Group reports financial assets and financial liabilities on a net basis on the balance sheet only if there is a legally enforceable right to set-off the recognised amounts and there is intention to settle on a net basis, or to realise the asset and settle the liability simultaneously. The following table shows the impact of netting arrangements on:
all financial assets and liabilities that are reported net on the balance sheet
all derivative financial instruments and reverse repurchase and repurchase agreements and other similar secured lending and borrowing agreements that are subject to enforceable master netting arrangements or similar agreements, but do not qualify for balance sheet netting.
The table identifies the amounts that have been offset in the balance sheet and also those amounts that are covered by enforceable netting arrangements (offsetting arrangements and financial collateral) but do not qualify for netting under the requirements of IAS 32 described above.
The ‘Net amounts’ presented in the table below are not intended to represent the Barclays Bank Group’s actual exposure to credit risk, as a variety of credit mitigation strategies are employed in addition to netting and collateral arrangements. Barclays Bank Group Amounts subject to enforceable netting arrangements
Amounts not subject to
enforceable netting
arrangementsc
Balance sheet totald
Effects of offsetting on-balance sheet Related amounts not offset
Gross amounts Amounts
offseta
Net amounts reported on the
balance sheetFinancial
instrumentsFinancial
collateralb Net amount
As at 31 December 2018 £m £m £m £m £m £m £m £m
Derivative financial assets 239,344 (18,687) 220,657 (172,014) (36,977) 11,666 2,026 222,683
Reverse repurchase agreements and other similar secured lendinge 353,660 (235,703) 117,957 - (117,515) 442 3,047 121,004
Total assets 593,004 (254,390) 338,614 (172,014) (154,492) 12,108 5,073 343,687
Derivative financial liabilities (233,492) 18,229 (215,263) 172,014 32,900 (10,349) (4,329) (219,592)
Repurchase agreements and other similar secured borrowinge (375,841) 235,703 (140,138) - 140,099 (39) (5,724) (145,862)
Total liabilities (609,333) 253,932 (355,401) 172,014 172,999 (10,388) (10,053) (365,454)
As at 31 December 2017
Derivative financial assets 257,199 (21,638) 235,561 (184,265) (39,262) 12,034 2,426 237,987
Reverse repurchase agreements and other similar secured lendinge 326,340 (223,495) 102,845 - (102,380) 465 9,741 112,586
Total assets 583,539 (245,133) 338,406 (184,265) (141,642) 12,499 12,167 350,573
Derivative financial liabilities (253,030) 21,065 (231,965) 184,265 36,444 (11,256) (6,380) (238,345)
Repurchase agreements and other similar secured borrowinge (374,616) 223,495 (151,121) - 151,073 (48) (15,908) (167,029)
Total liabilities (627,646) 244,560 (383,086) 184,265 187,517 (11,304) (22,288) (405,374) Notes a Amounts offset for Derivative financial assets include cash collateral netted of £2,187m (2017: £2,393m). Amounts offset for Derivative financial liabilities include cash collateral
netted of £2,645m (2017: £1,820m). Settlements assets and liabilities have been offset amounting to £23,095m (2017: £13,241m). No other significant recognised financial assets and liabilities were offset in the balance sheet. Therefore, the only balance sheet categories necessary for inclusion in the table are those shown above.
b Financial collateral of £36,977m (2017: £39,262m) was received in respect of derivative assets, including £31,475m (2017: £33,092m) of cash collateral and £5,502m (2017: £6,170m) of non-cash collateral. Financial collateral of £32,900m (2017: £36,444m) was placed in respect of derivative liabilities, including £29,783m (2017: £32,575m) of cash collateral and £3,117m (2017: £3,869m) of non-cash collateral. The collateral amounts are limited to net balance sheet exposure so as to not include over-collateralisation.
c This column includes contractual rights of set-off that are subject to uncertainty under the laws of the relevant jurisdiction. d The balance sheet total is the sum of ‘Net amounts reported on the balance sheet’ that are subject to enforceable netting arrangements and ‘Amounts not subject to enforceable
netting arrangements’. e Repurchase and Reverse Repurchase agreements include instruments at amortised cost and instruments designated at fair value through profit and loss. Reverse Repurchase
agreements and other similar secured lending of £121,004m (2017: £112,586m) is split by fair value £119,391m (2017: £100,040m) and amortised cost £1,613m (2017: £12,546m). Repurchase agreements and other similar secured borrowing of £145,862m (2017: £167,029m) is split by fair value £138,484m (2017: £126,691m) and amortised cost £7,378m (2017: £40,338m).
Derivative assets and liabilities The ‘Financial instruments’ column identifies financial assets and liabilities that are subject to set off under netting agreements, such as the ISDA Master Agreement or derivative exchange or clearing counterparty agreements, whereby all outstanding transactions with the same counterparty can be offset and close-out netting applied across all outstanding transactions covered by the agreements if an event of default or other predetermined events occur. Financial collateral refers to cash and non-cash collateral obtained, typically daily or weekly, to cover the net exposure between counterparties by enabling the collateral to be realised in an event of default or if other predetermined events occur.
home.barclays/annualreport Barclays Bank PLC Annual Report 216

Credit risk management
19 Offsetting financial assets and financial liabilities continued Repurchase and reverse repurchase agreements and other similar secured lending and borrowing The ‘Amounts offset’ column identifies financial assets and liabilities that are subject to set off under netting agreements, such as Global Master Repurchase Agreements and Global Master Securities Lending Agreements, whereby all outstanding transactions with the same counterparty can be offset and close-out netting applied across all outstanding transactions covered by the agreements if an event of default or other predetermined events occur. Financial collateral typically comprises highly liquid securities which are legally transferred and can be liquidated in the event of counterparty default. These offsetting and collateral arrangements and other credit risk mitigation strategies used by the Barclays Bank Group are further explained in the Credit risk mitigation section on pages 63 - 66. Barclays Bank PLC Amounts subject to enforceable netting arrangements
Amounts not subject to
enforceable netting
arrangementsc
Balance sheet totald
Effects of offsetting on-balance sheet Related amounts not offset
Gross amounts Amounts
offseta
Net amounts reported on the
balance sheetFinancial
instrumentsFinancial
collateralb Net amount
As at 31 December 2018 £m £m £m £m £m £m £m £m
Derivative financial assets 237,992 (18,687) 219,305 (171,095) (36,665) 11,545 1,942 221,247Reverse repurchase agreements and other similar secured lendinge 393,246 (249,442) 143,804 - (143,738) 66 5,239 149,043
Total assets 631,238 (268,129) 363,109 (171,095) (180,403) 11,611 7,181 370,290
Derivative financial liabilities (235,735) 18,229 (217,506) 171,095 32,888 (13,523) (4,084) (221,590)Repurchase agreements and other similar secured borrowinge (412,473) 249,442 (163,031) - 162,992 (39) (5,470) (168,501)
Total liabilities (648,208) 267,671 (380,537) 171,095 195,880 (13,562) (9,554) (390,091)
As at 31 December 2017
Derivative financial assets 251,542 (21,638) 229,904 (178,496) (38,231) 13,177 2,384 232,288Reverse repurchase agreements and other similar secured lendinge 363,046 (259,592) 103,454 - (103,454) - 10,953 114,407
Total assets 614,588 (281,230) 333,358 (178,496) (141,685) 13,177 13,337 346,695
Derivative financial liabilities (243,910) 21,065 (222,845) 178,496 34,038 (10,311) (6,382) (229,227)Repurchase agreements and other similar secured borrowinge (417,414) 259,592 (157,822) - 157,822 - (14,639) (172,461)
Total liabilities (661,324) 280,657 (380,667) 178,496 191,860 (10,311) (21,021) (401,688) Notes a Amounts offset for Derivative financial assets include cash collateral netted of £2,187m (2017: £2,393m). Amounts offset for Derivative financial liabilities include cash collateral
netted of £2,645m (2017: £1,820m). Settlements assets and liabilities have been offset amounting to £9,144m (2017: £5,780m). No other significant recognised financial assets and liabilities were offset in the balance sheet. Therefore, the only balance sheet categories necessary for inclusion in the table are those shown above.
b Financial collateral of £36,665m (2017: £38,231m) was received in respect of derivative assets, including £31,191m (2017: £32,061m) of cash collateral and £5,474m (2017: £6,170m) of non-cash collateral. Financial collateral of £32,888m (2017: £34,038m) was placed in respect of derivative liabilities, including £30,310m (2017: £31,542m) of cash collateral and £2,578m (2017: £2,496m) of non-cash collateral. The collateral amounts are limited to net balance sheet exposure so as to not include over-collateralisation.
c This column includes contractual rights of set-off that are subject to uncertainty under the laws of the relevant jurisdiction. d The balance sheet total is the sum of ‘Net amounts reported on the balance sheet’ that are subject to enforceable netting arrangements and ‘Amounts not subject to enforceable
netting arrangements’. e Repurchase and Reverse Repurchase agreements include instruments at amortised cost and instruments designated at fair value through profit and loss. Reverse Repurchase
agreements and other similar secured lending of £149,043m (2017: £114,407m) is split by fair value £143,277m (2017: £91,443m) and amortised cost £5,766m (2017: £22,964m). Repurchase agreements and other similar secured borrowing of £168,501m (2017: £172,461m) is split by fair value £157,388m (2017: £122,578m) and amortised cost £11,113m (2017: £49,883m).
home.barclays/annualreport Barclays Bank PLC Annual Report 217

Notes to the financial statements Financial instruments held at amortised cost Credit risk management
The notes included in this section focus on instruments that are held at amortised cost arising from the Barclays Bank Group’s retail and wholesale lending including loans and advances, deposits and finance leases. Details regarding the Barclays Bank Group’s liquidity and capital position can be found on pages 98 to 115. 20 Loans and advances and deposits at amortised cost Accounting for loans and advances and deposits held at amortised cost under IFRS 9 effective from 1 January 2018 Loans and advances to customers and banks, customer accounts, debt securities and most financial liabilities, are held at amortised cost. That is, the initial fair value (which is normally the amount advanced or borrowed) is adjusted for repayments and the amortisation of coupon, fees and expenses to represent the effective interest rate of the asset or liability. Balances deferred on-balance sheet as effective interest rate adjustments are amortised to interest income over the life of the financial instrument to which they relate. Financial assets that are held in a business model to collect the contractual cash flows and that contain contractual terms that give rise on specified dates to cash flows that are SPPI, are measured at amortised cost. The carrying value of these financial assets at initial recognition includes any directly attributable transaction costs. Refer to note 1 for details on ‘solely payments of principal and interest’. In determining whether the business model is a ‘hold to collect’ model, the objective of the business model must be to hold the financial asset to collect contractual cash flows rather than holding the financial asset for trading or short-term profit taking purposes. While the objective of the business model must be to hold the financial asset to collect contractual cash flows this does not mean Barclays Bank Group is required to hold the financial assets until maturity. When determining if the business model objective is to collect contractual cash flows Barclays Bank Group will consider past sales and expectations about future sales. Accounting for loans and advances and deposits held at amortised cost under IAS 39 for 2017 Loans and advances to customers and banks, customer accounts, debt securities and most financial liabilities, are held at amortised cost. That is, the initial fair value (which is normally the amount advanced or borrowed) is adjusted for repayments and the amortisation of coupon, fees and expenses to represent the effective interest rate of the asset or liability. Balances deferred on-balance sheet as effective interest rate adjustments are amortised to interest income over the life of the financial instrument to which they relate. In accordance with IAS 39, where the Barclays Bank Group no longer intends to trade in financial assets it may transfer them out of the held for trading classification and measure them at amortised cost if they meet the definition of a loan. The initial value used for the purposes of establishing amortised cost is fair value on the date of the transfer.
home.barclays/annualreport Barclays Bank PLC Annual Report 218

Credit risk management
20 Loans and advances and deposits at amortised cost continued
Loans and advances at amortised cost Barclays Bank Group
2018 2017
Loans to
banksLoans to
customers Total Loans to
banks Loans to
customers Total
As at 31 December £m £m
£m
£m £m £m
Gross loans and advances at amortised cost excluding debt securities at amortised cost 10,229 128,728 138,957 11,179 316,692 327,871
Less: allowance for impairment (1) (3,837) (3,838) - (4,652) (4,652)
Loans and advances at amortised cost excluding debt securities at amortised cost 10,228 124,891 135,119 11,179 312,040 323,219
Gross debt securities at amortised cost - 1,845 1,845 - 1,371 1,371
Less: allowance for impairment - (5) (5) - - -
Debt securities at amortised cost - 1,840 1,840 - 1,371 1,371
Total gross loans and advances at amortised cost 10,229 130,573 140,802 11,179 318,063 329,242
Less: allowance for impairment (1) (3,842) (3,843) - (4,652) (4,652)
Total loans and advances at amortised cost 10,228 126,731 136,959 11,179 313,411 324,590
Deposits at amortised cost
Barclays Bank Group
2018 2017
Deposits from
banks
Deposits from
customers Total
Deposits from
banks
Deposits from
customers Total
As at 31 December £m £m
£m
£m £m £m
Deposits at amortised cost 15,569 183,768 199,337 12,335 386,854 399,189
Loans and advances at amortised cost
Barclays Bank PLC
2018 2017
Loans to
banksLoans to
customers Total Loans to
banks Loans to
customers Total
As at 31 December £m £m
£m
£m £m £m
Gross loans and advances at amortised cost excluding debt securities at amortised cost 14,004 142,220 156,224 11,598 345,417 357,015
Less: allowance for impairment (2) (1,219) (1,221) - (3,131) (3,131)
Loans and advances at amortised cost excluding debt securities at amortised cost 14,002 141,001 155,003 11,598 342,286 353,884
Gross debt securities at amortised cost - 1,766 1,766 - 1,371 1,371
Less: allowance for impairment - (5) (5) - - -
Debt securities at amortised cost - 1,761 1,761 - 1,371 1,371
Total gross loans and advances at amortised cost 14,004 143,986 157,990 11,598 346,788 358,386
Less: allowance for impairment (2) (1,224) (1,226) - (3,131) (3,131)
Total loans and advances at amortised cost 14,002 142,762 156,764 11,598 343,657 355,255
Deposits at amortised cost
Barclays Bank PLC
2018 2017
Deposits from
banks
Deposits from
customers Total
Deposits from
banks
Deposits from
customers Total
£m £m
£m
£m £m £m
Deposits at amortised cost 17,524 213,493 231,017 13,494 412,408 425,902
home.barclays/annualreport Barclays Bank PLC Annual Report 219

Notes to the financial statements Financial instruments held at amortised cost
21 Finance leases Accounting for finance leases The Barclays Bank Group applies IAS 17 Leases in accounting for finance leases, both where it is the lessor or the lessee. A finance lease is a lease which confers substantially all the risks and rewards of the leased assets on the lessee. Where the Barclays Bank Group is the lessor, the leased asset is not held on the balance sheet; instead a finance lease receivable is recognised representing the minimum lease payments receivable under the terms of the lease, discounted at the rate of interest implicit in the lease. Where the Barclays Bank Group is the lessee, the leased asset is recognised in property, plant and equipment and a finance lease liability is recognised, representing the minimum lease payments payable under the lease, discounted at the rate of interest implicit in the lease. Interest income or expense is recognised in interest receivable or payable, allocated to accounting periods to reflect a constant periodic rate of return. Finance lease receivables Finance lease receivables are included within loans and advances at amortised cost. The Barclays Bank Group specialises in the provision of leasing and other asset finance facilities across a broad range of asset types to business customers. 2018 2017
Gross investment in finance lease
receivables
Future finance income
Present value of minimum
lease payments receivable
Un-guaranteed
residual values
Gross investment in finance lease
receivables
Future finance income
Present value of minimum
lease payments receivable
Un-guaranteed
residual values
£m £m £m £m £m £m £m £m
Barclays Bank Group - - - -
Not more than one year 1,333 (110) 1,223 86 1,130 (91) 1,039 69
Over one year but not more than five years 2,012 (171) 1,841 148 1,750 (135) 1,615 156
Over five years 381 (44) 337 22 284 (32) 252 21
Total 3,726 (325) 3,401 256 3,164 (258) 2,906 246 The impairment allowance for uncollectable finance lease receivables amounted to £87m (2017: £57m). Finance lease liabilities The Barclays Bank Group leases items of property, plant and equipment on terms that meet the definition of finance leases. Finance lease liabilities are included within Note 25. As at 31 December 2018, the total future minimum payments under finance leases were £4m (2017: £3m). The carrying amount of assets held under finance leases was £3m (2017: £3m).
home.barclays/annualreport Barclays Bank PLC Annual Report 220
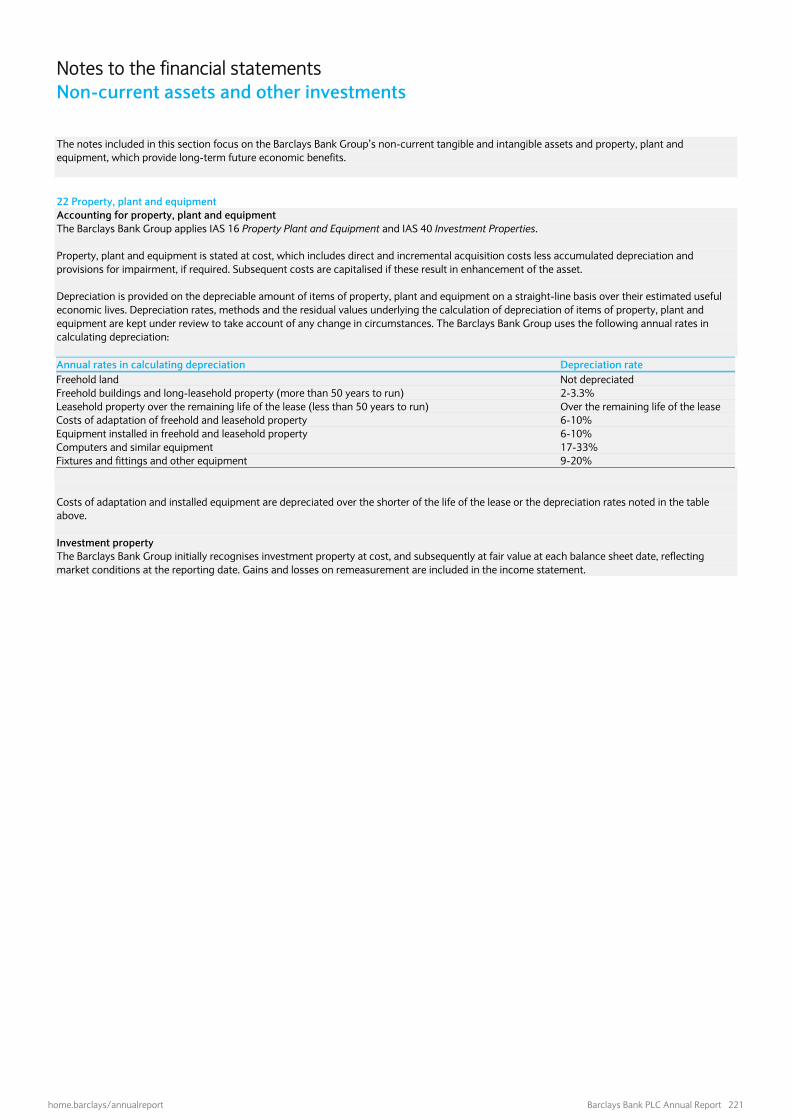
Notes to the financial statements Non-current assets and other investments
The notes included in this section focus on the Barclays Bank Group’s non-current tangible and intangible assets and property, plant and equipment, which provide long-term future economic benefits. 22 Property, plant and equipment Accounting for property, plant and equipment The Barclays Bank Group applies IAS 16 Property Plant and Equipment and IAS 40 Investment Properties. Property, plant and equipment is stated at cost, which includes direct and incremental acquisition costs less accumulated depreciation and provisions for impairment, if required. Subsequent costs are capitalised if these result in enhancement of the asset. Depreciation is provided on the depreciable amount of items of property, plant and equipment on a straight-line basis over their estimated useful economic lives. Depreciation rates, methods and the residual values underlying the calculation of depreciation of items of property, plant and equipment are kept under review to take account of any change in circumstances. The Barclays Bank Group uses the following annual rates in calculating depreciation: Annual rates in calculating depreciation Depreciation rate Freehold land Freehold buildings and long-leasehold property (more than 50 years to run) Leasehold property over the remaining life of the lease (less than 50 years to run) Costs of adaptation of freehold and leasehold property
Equipment installed in freehold and leasehold property
Computers and similar equipment Fixtures and fittings and other equipment
Not depreciated 2-3.3% Over the remaining life of the lease 6-10% 6-10% 17-33% 9-20%
Costs of adaptation and installed equipment are depreciated over the shorter of the life of the lease or the depreciation rates noted in the table above. Investment property The Barclays Bank Group initially recognises investment property at cost, and subsequently at fair value at each balance sheet date, reflecting market conditions at the reporting date. Gains and losses on remeasurement are included in the income statement.
home.barclays/annualreport Barclays Bank PLC Annual Report 221

Notes to the financial statements Non-current assets and other investments risk management
22 Property, plant and equipment continued Barclays Bank Group Barclays Bank PLC
Investment
property Property EquipmentLeased assets Total
Investment property Property Equipment Total
£m £m £m £m £m £m £m £m £m
Cost As at 1 January 2018 116 2,243 1,066 9 3,434 - 1,080 357 1,437
Transfer of UK banking business - (958) - - (958) - (958) - (958)
Additions 9 155 79 - 243 - 144 40 184
Disposals (115) (45) (101) - (261) - (49) (55) (104)
Change in fair value of investment properties
(3) - - - (3) - - - -
Exchange and other movements 2 68 35 - 105 - 1 (1) -
As at 31 December 2018 9 1,463 1,079 9 2,560 - 218 341 559Accumulated depreciation and impairment As at 1 January 2018 - (983) (923) (9) (1,915) - (533) (339) (872)
Transfer of UK banking business - 448 - - 448 - 448 - 448
Additions - (60) (32) - (92) - (60) (32) (92)
Depreciation charge - (61) (58) - (119) - (13) (10) (23)
Impairment charge - (1) - - (1) - - - -
Disposals - 22 94 - 116 - 27 50 77
Exchange and other movements - (23) (27) - (50) - 3 3 6
As at 31 December 2018 - (658) (946) (9) (1,613) - (128) (328) (456)
Net book value 9 805 133 - 947 - 90 13 103
Cost As at 1 January 2017 81 3,101 2,862 10 6,054 15 1,582 2,209 3,806
Additions 114 173 176 - 463 - 100 110 210
Disposals (69) (895) (1,893) (1) (2,858) (16) (602) (1,948) (2,566)
Change in fair value of investment properties
(5) - - - (5) - - - -
Exchange and other movements (5) (136) (79) - (220) 1 - (14) (13)
As at 31 December 2017 116 2,243 1,066 9 3,434 - 1,080 357 1,437Accumulated depreciation and impairment As at 1 January 2017 - (1,312) (2,267) (9) (3,588) - (569) (1,783) (2,352)
Depreciation charge - (141) (162) - (303) - (90) (107) (197)
Impairment charge - (28) - - (28) - (34) - (34)
Disposals - 487 1,518 - 2,005 - 159 1,540 1,699
Exchange and other movements - 11 (12) - (1) - 1 11 12
As at 31 December 2017 - (983) (923) (9) (1,915) - (533) (339) (872)
Net book value 116 1,260 143 - 1,519 - 547 18 565
Property rentals of £nil (2017: £1m) and £6m (2017: £6m) have been included in net investment income and other income respectively within Barclays Bank Group. Property rentals of £nil (2017: £3m) has been included in other income in Barclays Bank PLC. The fair value of investment property is determined by reference to current market prices for similar properties, adjusted as necessary for condition and location, or by reference to recent transactions updated to reflect current economic conditions. Discounted cash flow techniques may be employed to calculate fair value where there have been no recent transactions, using current external market inputs such as market rents and interest rates. Valuations are carried out by management with the support of appropriately qualified independent valuers. Refer to Note 18 for further details.
home.barclays/annualreport Barclays Bank PLC Annual Report 222

Credit risk management
23 Goodwill and intangible assets Accounting for goodwill and intangible assets Goodwill The carrying value of goodwill is determined in accordance with IFRS 3 Business Combinations and IAS 36 Impairment of Assets.
Goodwill arising on the acquisition of subsidiaries represents the excess of the fair value of the purchase consideration over the fair value of the Barclays Bank Group’s share of the assets acquired and the liabilities and contingent liabilities assumed on the date of the acquisition.
Goodwill is reviewed annually for impairment, or more frequently when there are indications that impairment may have occurred. The test involves comparing the carrying value of goodwill with the present value of the pre-tax cash flows, discounted at a rate of interest that reflects the inherent risks, of the cash generating unit (CGU) to which the goodwill relates, or the CGU’s fair value if this is higher. Intangible assets Intangible assets other than goodwill are accounted for in accordance with IAS 38 Intangible Assets. Intangible assets are initially recognised when they are separable or arise from contractual or other legal rights, the cost can be measured reliably and, in the case of intangible assets not acquired in a business combination, where it is probable that future economic benefits attributable to the assets will flow from their use. Intangible assets are stated at cost (which is, in the case of assets acquired in a business combination, the acquisition date fair value) less accumulated amortisation and provisions for impairment, if any, and are amortised over their useful lives in a manner that reflects the pattern to which they contribute to future cash flows, generally using the amortisation periods set out below:
Annual rates in calculating amortisation Amortisation period Goodwill Internally generated softwarea Other software
Customer lists Licences and other
Not amortised 12 months to 6 years 12 months to 6 years 12 months to 25 years 12 months to 25 years
Note a Exceptions to the above rate relate to useful lives of certain core banking platforms that are assessed individually and, if appropriate, amortised over longer periods ranging from 10 to 15 years
Intangible assets are reviewed for impairment when there are indications that impairment may have occurred.
home.barclays/annualreport Barclays Bank PLC Annual Report 223

Notes to the financial statements Non-current assets and other investments risk management
23 Goodwill and intangible assets continued
Goodwill
Internally generated
software Other software Customer lists Licences and
other Total £m £m £m £m £m £m
Barclays Bank Group Cost As at 1 January 2018 4,710 1,287 96 1,547 490 8,130Transfer of UK banking business (4,276) - - (90) - (4,366)Additions and disposals - (8) 11 - 13 (16)Exchange and other movements 11 63 (7) 83 29 179As at 31 December 2018 445 1,342 100 1,540 532 3,959Accumulated amortisation and impairment As at 1 January 2018 (860) (787) (75) (1,210) (313) (3,245)Transfer of UK banking business 750 - - 79 - 829Additions and disposals - 161 (1) 0 12 172Amortisation charge - (156) (11) (78) (31) (276)Impairment charge - (1) - - - (1)Exchange and other movements (1) (29) 9 (68) (22) (111)As at 31 December 2018 (111) (812) (78) (1,277) (354) (2,632)Net book value 334 530 22 263 178 1,327Barclays Bank PLC Cost As at 1 January 2018 4,232 306 9 102 22 4,671Transfer of UK banking business (4,068) - - (90) - (4,158)Additions and disposals (218) 6 (8) (220)Exchange and other movements - 3 (9) (1) (1) (8)As at 31 December 2018 164 91 6 11 13 285Accumulated amortisation and impairment As at 1 January 2018 (819) (246) (9) (87) (12) (1,173)Transfer of UK banking business 750 - - 79 - 829Disposals 0 189 (6) 0 10 193Amortisation charge - (15) (1) (2) - (18)Impairment charge - - - - - -Exchange and other movements - (5) 13 - (1) 7As at 31 December 2018 (69) (77) (3) (10) (3) (162)Net book value 95 14 3 1 10 123
home.barclays/annualreport Barclays Bank PLC Annual Report 224

Credit risk management
Goodwill
Internally generated
software Other software Customer lists Licences and
other Total
£m £m £m £m £m £m
Barclays Bank Group
Cost
As at 1 January 2017 4,797 4,422 150 1,708 551 11,628
Additions and disposals - (2,911) (49) (12) (19) (2,991)
Exchange and other movements (87) (224) (5) (149) (42) (507)
As at 31 December 2017 4,710 1,287 96 1,547 490 8,130
Accumulated amortisation and impairment
As at 1 January 2017 (930) (1,666) (109) (1,232) (343) (4,280)
Disposals - 1,132 45 15 36 1,228
Amortisation charge - (329) (14) (101) (34) (478)
Impairment charge - (12) - - - (12)
Exchange and other movements 70 88 3 108 28 297
As at 31 December 2017 (860) (787) (75) (1,210) (313) (3,245)
Net book value 3,850 500 21 337 177 4,885
Barclays Bank PLC
Cost
As at 1 January 2017 4,240 3,351 59 116 61 7,827
Additions and disposals - (3,046) (50) (15) (39) (3,150)
Exchange and other movements (8) 1 - 1 - (6)
As at 31 December 2017 4,232 306 9 102 22 4,671
Accumulated amortisation and impairment
As at 1 January 2017 (827) (1,169) (44) (96) (40) (2,176)
Disposals - 1,131 37 15 36 1,219
Amortisation charge - (201) (2) (6) (5) (214)
Impairment charge - (2) - - - (2)
Exchange and other movements 8 (5) - - (3) -
As at 31 December 2017 (819) (246) (9) (87) (12) (1,173)
Net book value 3,413 60 - 15 10 3,498 Goodwill Goodwill is allocated to business operations according to business segments as follows: Barclays Bank Group Barclays Bank PLC
2018 2017 2018 2017
£m £m £m £m
Consumer, Cards and Payments 334 325 95 95
Total net book value of goodwill 334 325 95 95 Goodwill Testing goodwill for impairment involves a significant amount of judgement. This includes the identification of independent CGUs and the allocation of goodwill to these units based on which units are expected to benefit from the acquisition. The allocation is reviewed following business reorganisations. Cash flow projections necessarily take into account changes in the market in which a business operates including the level of growth, competitive activity, and the impacts of regulatory change. Determining both the expected pre-tax cash flows and the risk adjusted interest rate appropriate to the operating unit requires the exercise of judgement. The estimation of pre-tax cash flows is sensitive to the periods for which detailed forecasts are available and to assumptions regarding long-term sustainable cash flows. Other intangible assets Determining the estimated useful lives of intangible assets (such as those arising from contractual relationships) requires an analysis of circumstances. The assessment of whether an asset is exhibiting indicators of impairment as well as the calculation of impairment, which requires the estimate of future cash flows and fair values less costs to sell, also requires the preparation of cash flow forecasts and fair values for assets that may not be regularly bought and sold.
home.barclays/annualreport Barclays Bank PLC Annual Report 225

Notes to the financial statements Non-current assets and other investments risk management
23 Goodwill and intangible assets continued Impairment testing of goodwill During 2018, Barclays Bank Group recognised an impairment charge of £nil (2017: £nil). Key assumptions The key assumptions used for impairment testing are set out below for each significant goodwill balance. Other goodwill of £95m (2017: £95m) was allocated to multiple CGUs which are not considered individually significant. Goodwill within Barclays US Consumer Bank was £239m (2017: £230m). The carrying value of the CGUs have been determined by using net asset values. The recoverable amounts of the CGUs, calculated as value in use, have been determined using cash flow predictions based on financial budgets approved by management, covering a five-year period, with a terminal growth rate range of 0% to 3.5% (2017: 3.5% to 4.8%) applied thereafter. The forecasted cash flows have been discounted at a pre-tax rate of 13.7% (2017: 13.9%). Based on these assumptions, the total recoverable amount exceeded the carrying amount including goodwill by £6,643m (2017: £5,326m). A one percentage point change in the discount rate or terminal growth rate would increase or decrease the recoverable amount by £1,164m (2017: £707m) and £797m (2017: £411m) respectively. A reduction in the forecast cash flows of 10% per annum would reduce the recoverable amount by £1,231m (2017: £855m). 24 Operating leases Accounting for operating leases The Barclays Bank Group applies IAS 17 Leases, for operating leases. An operating lease is a lease where substantially all of the risks and rewards of the leased assets remain with the lessor. Where the Barclays Bank Group is the lessor, lease income is recognised on a straight-line basis over the period of the lease unless another systematic basis is more appropriate. The Barclays Bank Group holds the leased assets on-balance sheet within property, plant and equipment. Where the Barclays Bank Group is the lessee, rentals payable are recognised as an expense in the income statement on a straight-line basis over the lease term unless another systematic basis is more appropriate. Operating lease commitments The Barclays Bank Group leases various offices, branches and other premises under non-cancellable operating lease arrangements. With such operating lease arrangements, the asset is kept on the lessor’s balance sheet and the Barclays Bank Group reports the future minimum lease payments as an expense over the lease term. The leases have various terms, escalation and renewal rights. There are no contingent rents payable. Operating lease rentals of £158m (2017: £248m) have been included in administration and general expenses. The future minimum lease payments by the Barclays Bank Group and Barclays Bank PLC under non-cancellable operating leases are as follows: Barclays Bank Group Barclays Bank PLC
2018 2017 2018 2017
Property Equipment Property Equipment Property Equipment Property Equipment
£m £m £m £m £m £m £m £m
Not more than one year 115 - 203 - 40 - 118 -
Over one year but not more than five years 258 - 476 9 114 - 325 9
Over five years 698 - 619 - 193 - 153 -
Total 1,071 - 1,298 9 347 - 596 9
Total future minimum sublease payments to be received under non-cancellable subleases was £13m (2017: £45m) for the Barclays Bank Group and £3m (2017: £nil) for Barclays Bank PLC.
home.barclays/annualreport Barclays Bank PLC Annual Report 226
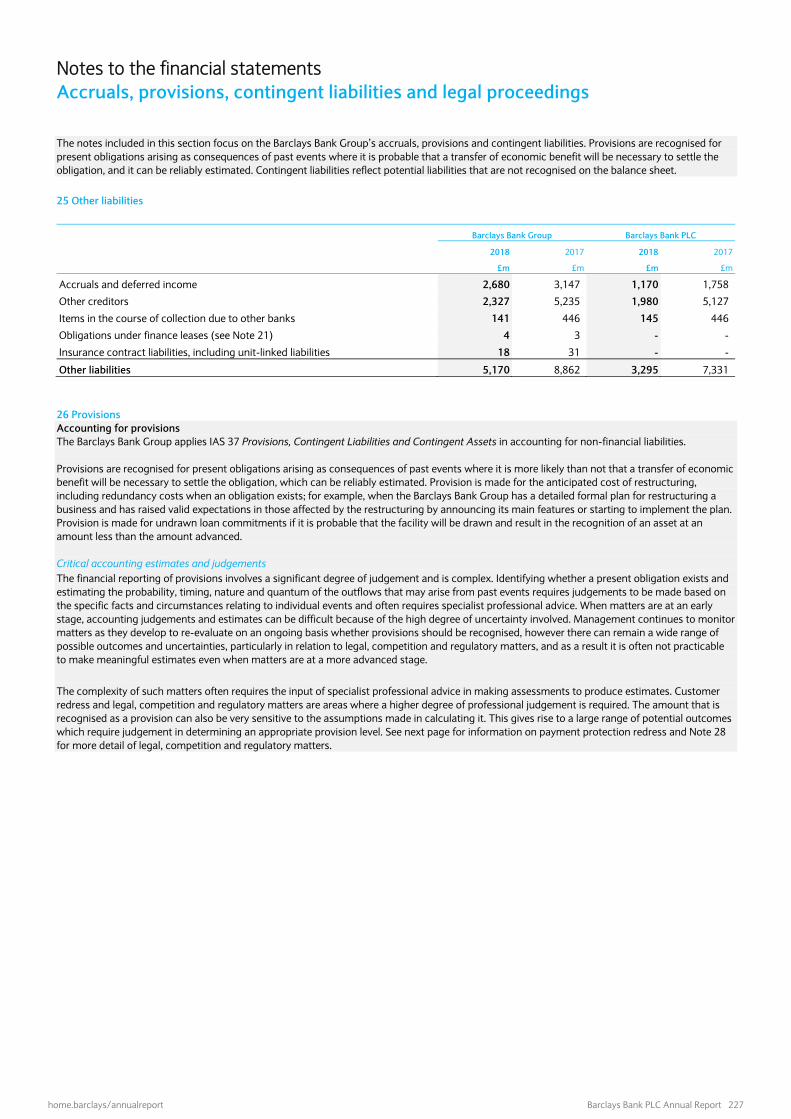
Notes to the financial statements Accruals, provisions, contingent liabilities and legal proceedings Credit risk management
The notes included in this section focus on the Barclays Bank Group’s accruals, provisions and contingent liabilities. Provisions are recognised for present obligations arising as consequences of past events where it is probable that a transfer of economic benefit will be necessary to settle the obligation, and it can be reliably estimated. Contingent liabilities reflect potential liabilities that are not recognised on the balance sheet. 25 Other liabilities Barclays Bank Group Barclays Bank PLC
2018 2017 2018 2017
£m £m £m £m
Accruals and deferred income 2,680 3,147 1,170 1,758
Other creditors 2,327 5,235 1,980 5,127
Items in the course of collection due to other banks 141 446 145 446
Obligations under finance leases (see Note 21) 4 3 - -
Insurance contract liabilities, including unit-linked liabilities 18 31 - -
Other liabilities 5,170 8,862 3,295 7,331
26 Provisions Accounting for provisions The Barclays Bank Group applies IAS 37 Provisions, Contingent Liabilities and Contingent Assets in accounting for non-financial liabilities. Provisions are recognised for present obligations arising as consequences of past events where it is more likely than not that a transfer of economic benefit will be necessary to settle the obligation, which can be reliably estimated. Provision is made for the anticipated cost of restructuring, including redundancy costs when an obligation exists; for example, when the Barclays Bank Group has a detailed formal plan for restructuring a business and has raised valid expectations in those affected by the restructuring by announcing its main features or starting to implement the plan. Provision is made for undrawn loan commitments if it is probable that the facility will be drawn and result in the recognition of an asset at an amount less than the amount advanced. Critical accounting estimates and judgements The financial reporting of provisions involves a significant degree of judgement and is complex. Identifying whether a present obligation exists and estimating the probability, timing, nature and quantum of the outflows that may arise from past events requires judgements to be made based on the specific facts and circumstances relating to individual events and often requires specialist professional advice. When matters are at an early stage, accounting judgements and estimates can be difficult because of the high degree of uncertainty involved. Management continues to monitor matters as they develop to re-evaluate on an ongoing basis whether provisions should be recognised, however there can remain a wide range of possible outcomes and uncertainties, particularly in relation to legal, competition and regulatory matters, and as a result it is often not practicable to make meaningful estimates even when matters are at a more advanced stage. The complexity of such matters often requires the input of specialist professional advice in making assessments to produce estimates. Customer redress and legal, competition and regulatory matters are areas where a higher degree of professional judgement is required. The amount that is recognised as a provision can also be very sensitive to the assumptions made in calculating it. This gives rise to a large range of potential outcomes which require judgement in determining an appropriate provision level. See next page for information on payment protection redress and Note 28 for more detail of legal, competition and regulatory matters.
home.barclays/annualreport Barclays Bank PLC Annual Report 227

Notes to the financial statements Accruals, provisions, contingent liabilities and legal proceedings Credit risk management
26 Provisions continued
Undrawn contractually
committed facilities and
guarantees provideda
Conduct redress
Legal, competition
and regulatory matters
Onerous
contracts
Redundancy and
restructuring
Payment Protection Insurance
Other customer
redressSundry
provisions Total
£m £m £m £m £m £m £m £m
Barclays Bank Group
As at 1 January 2018 143 106 420 1,606 639 435 294 3,643
Additions 58 82 462 400 119 1,668 37 2,826
Amounts utilised (51) (71) (11) (308) (182) (1,633) (63) (2,319)
Unused amounts reversed (15) (29) (554) - (12) (98) (24) (732)
Transfer of UK banking business (48) (16) (87) (1,698) (428) (2) (26) (2,305)
Exchange and other movements 3 (4) (13) - (9) 41 (4) 14
As at 31 December 2018 90 68 217 - 127 411 214 1,127
Barclays Bank PLC
As at 1 January 2018 108 93 353 1,540 590 388 230 3,302
Additions 9 55 443 381 76 806 27 1,797
Amounts utilised (48) (57) (11) (295) (138) (779) (61) (1,389)
Unused amounts reversed (4) (21) (510) - (9) (87) (20) (651)
Transfer of UK banking business (48) (16) (87) (1,626) (426) (2) (25) (2,230)
Exchange and other movements 1 (8) (14) - (10) 21 (1) (11)
As at 31 December 2018 18 46 174 - 83 347 150 818 Note a Undrawn contractually committed facilities and guarantees provisions are accounted for under IFRS 9.
Provisions expected to be recovered or settled within no more than 12 months after 31 December 2018 for Barclays Bank Group were £791m (2017: £2,242m) and for Barclays Bank PLC were £625m (2017: £2,047m). In Q1 2018, prior to the transfer of the UK banking business to Barclays Bank UK PLC, a £400m addition relating to PPI was recognised in Barclays Bank Group. Onerous contracts Onerous contract provisions comprise an estimate of the costs involved with fulfilling the terms and conditions of contracts net of any expected benefits to be received. Redundancy and restructuring These provisions comprise the estimated cost of restructuring, including redundancy costs where an obligation exists. Additions made during the year relate to formal restructuring plans and have either been utilised, or reversed, where total costs are now expected to be lower than the original provision amount. Undrawn contractually committed facilities and guarantees Impairment allowance under IFRS 9 considers both the drawn and the undrawn counterparty exposure. For retail portfolios, the total impairment allowance is allocated to the drawn exposure to the extent that the allowance does not exceed the exposure as ECL is not reported separately. Any excess is reported on the liability side of the balance sheet as a provision. For wholesale portfolios the impairment allowance on the undrawn exposure is reported on the liability side of the balance sheet as a provision. Provisions are made if it is probable that a facility will be drawn and the resulting asset is expected to have a realisable value that is less than the amount advanced. Customer redress Customer redress provisions comprise the estimated cost of making redress payments to customers, clients and counterparties for losses or damages associated with inappropriate judgement in the execution of Barclays Bank Group’s business activities. Provisions for other customer redress include smaller provisions across the retail and corporate businesses which are likely to be utilised in the next 12 months. Legal, competition and regulatory matters The Barclays Bank Group is engaged in various legal proceedings, both in the UK and a number of other overseas jurisdictions, including the US. For further information in relation to legal proceedings and discussion of the associated uncertainties, please refer to Note 28. Sundry provisions This category includes provisions that do not fit into any of the other categories, such as fraud losses and dilapidation provisions.
home.barclays/annualreport Barclays Bank PLC Annual Report 228

Credit risk management
27 Contingent liabilities and commitments Accounting for contingent liabilities Contingent liabilities are possible obligations whose existence will be confirmed only by uncertain future events, and present obligations where the transfer of economic resources is uncertain or cannot be reliably measured. Contingent liabilities are not recognised on the balance sheet but are disclosed unless the likelihood of an outflow of economic resources is remote. The following table summarises the nominal principal amount of contingent liabilities and commitments which are not recorded on-balance sheet: Barclays Bank Group Barclays Bank PLC
2018 2017 2018 2017
£m £m £m £m
Guarantees and letters of credit pledged as collateral security 15,046 14,275 21,303 22,680Performance guarantees, acceptances and endorsements 4,348 4,737 4,349 4,737Total contingent liabilities 19,394 19,012 25,652 27,417 Of which: Financial guarantees carried at fair value 4 4 Documentary credits and other short-term trade related transactions 1,741 812 1,741 812Standby facilities, credit lines and other commitments 256,027 314,761 189,991 252,109Total commitments 257,768 315,573 191,732 252,921 Of which: Loan commitments carried at fair value 11,703 11,703 Provisions held against contingent liabilities and commitments equal £217m for Barclays Bank Group and £174m for Barclays Bank PLC. Post IFRS 9, loan commitments carried at fair value amounted to £18.9bn as at 1 January 2018. Contingent liabilities and commitment balances transferred to Barclays Bank UK Group as part of the business disposal included guarantees and letters of credit pledged as collateral security of £793m and standby facilities, credit lines and other commitments of £67,791m. The Financial Services Compensation Scheme (the FSCS) is the UK’s government-backed compensation scheme for customers of authorised institutions that are unable to pay claims. The compensation paid out to customers is funded through loan facilities provided by HM Treasury to the FSCS which at 31 December 2018 has been completely repaid and has nil balance (2017: £4.7bn). Further details on contingent liabilities relating to legal and competition and regulatory matters can be found in Note 28. 28 Legal, competition and regulatory matters Barclays Bank PLC and the Barclays Bank Group face legal, competition and regulatory challenges, many of which are beyond our control. The extent of the impact on Barclays of these matters cannot always be predicted but may materially impact our operations, financial results, condition and prospects. Matters arising from a set of similar circumstances can give rise to either a contingent liability or a provision, or both, depending on the relevant facts and circumstances. In connection with the implementation of structural reform in the UK, on 1 April 2018, the UK banking business was transferred from Barclays Bank PLC to Barclays Bank UK PLC, a separate subsidiary of Barclays PLC. This transfer included the rights and liabilities in respect of certain of the matters described below (which are also disclosed in the financial statements of Barclays Bank UK PLC), although Barclays Bank PLC may remain the party on record to the relevant proceedings. Investigations into certain advisory services agreements and other matters and civil action The UK Serious Fraud Office (SFO), the Financial Conduct Authority (FCA), the US Department of Justice (DoJ) and the US Securities and Exchange Commission (SEC) have been conducting investigations into two advisory services agreements entered into by Barclays Bank PLC. These agreements were entered into with Qatar Holding LLC (Qatar Holding) in June and October 2008 (the Agreements). The FCA commenced an investigation into whether the Agreements may have related to Barclays PLC’s capital raisings in June and November 2008 (the Capital Raisings). The existence of the June 2008 advisory services agreement was disclosed, but the entry into the advisory services agreement in October 2008 and the fees payable under the Agreements, which amounted to a total of £322m payable over a period of five years, were not disclosed in the announcements or public documents relating to the Capital Raisings. The SFO also commenced an investigation into the Agreements and into a $3bn loan (the Loan) provided by Barclays Bank PLC in November 2008 to the State of Qatar. SFO Proceedings In 2017, the SFO charged Barclays PLC with two offences of conspiring with certain former senior officers and employees of Barclays to commit fraud by false representations relating to the Agreements and one offence of unlawful financial assistance in relation to the Loan. In February 2018, the SFO also charged Barclays Bank PLC with the same offence in respect of the Loan. In May 2018, the Crown Court dismissed all charges against Barclays PLC and Barclays Bank PLC, and in October 2018, the High Court denied the SFO’s application to reinstate the charges, which were consequently dismissed. FCA Proceedings and other investigations In 2013, the FCA issued warning notices (the Notices) finding that, while Barclays PLC and Barclays Bank PLC believed at the time of the execution of the Agreements that there should be at least some unspecified and undetermined value to be derived from them, the primary purpose of the Agreements was not to obtain advisory services but to make additional payments, which would not be disclosed, for the Qatari participation in the Capital Raisings. The Notices concluded that Barclays PLC and Barclays Bank PLC were in breach of certain disclosure-related listing rules and
home.barclays/annualreport Barclays Bank PLC Annual Report 229

Notes to the financial statements Accruals, provisions, contingent liabilities and legal proceedings Credit risk management
28 Legal, competition and regulatory matters continued Barclays PLC was also in breach of Listing Principle 3 (the requirement to act with integrity towards holders and potential holders of the Company’s shares). In this regard, the FCA considers that Barclays PLC and Barclays Bank PLC acted recklessly. The financial penalty provided in the Notices against Barclays is £50m. Barclays PLC and Barclays Bank PLC continue to contest the findings. The FCA action has been stayed due to the SFO proceedings pending against certain former Barclays executives, trial in respect of which commenced in January 2019. In addition, the DoJ and the SEC have been conducting investigations relating to the Agreements. Civil Action In 2016, PCP Capital Partners LLP and PCP International Finance Limited (PCP) served a claim on Barclays Bank PLC seeking damages for fraudulent misrepresentation and deceit, arising from alleged statements made by Barclays Bank PLC to PCP in relation to the terms on which securities were to be issued to potential investors, allegedly including PCP, in the November 2008 capital raising. PCP seeks damages of up to £1,477m (plus interest from November 2017) and costs. Barclays Bank PLC is defending the claim and trial is scheduled to commence in October 2019. Claimed amounts/Financial impact It is not currently practicable to provide an estimate of the financial impact of the actions described on Barclays or what effect they might have upon Barclays’ operating results, cash flows or financial position in any particular period. The financial penalty provided in the FCA’s Notices against Barclays is £50m. PCP has made a claim against Barclays Bank PLC for damages of up to £1,477m plus interest and costs. These amounts do not necessarily reflect Barclays’ potential financial exposure in respect of these matters. Investigations into certain business relationships In 2012, the DoJ and SEC commenced investigations in relation to whether certain relationships with third parties who assist Barclays PLC to win or retain business are compliant with the US Foreign Corrupt Practices Act. Various regulators in other jurisdictions are also being briefed on the investigations. Separately, Barclays is cooperating with the DoJ and SEC in relation to an investigation into certain of its hiring practices in Asia and elsewhere and is keeping certain regulators in other jurisdictions informed. Claimed amounts/Financial impact It is not currently practicable to provide an estimate of the financial impact of the actions described on Barclays or what effect they might have upon Barclays’ operating results, cash flows or financial position in any particular period. Investigations relating to whistleblowing systems and controls In 2017, the FCA and the Prudential Regulation Authority (PRA) commenced investigations into the Barclays Group Chief Executive Officer (CEO), relating to his attempt in 2016 to identify the author of a letter that was treated by Barclays Bank PLC as a whistleblow, and into Barclays Bank PLC, as to its responsibilities relating to the attempt by the CEO to identify the author of the letter, as well as Barclays’ systems and controls and culture relating to whistleblowing. In May 2018, the FCA and PRA published final notices confirming their finding that the CEO’s actions in relation to this matter represented a breach of Individual Conduct Rule 2 (requirement to act with due skill, care and diligence). There were no findings by the FCA or PRA that the CEO acted with a lack of integrity nor any findings that he lacked fitness and propriety to continue to perform his role as Group Chief Executive Officer. In respect of its investigation relating to Barclays Bank PLC, the FCA and PRA concluded that they would not take enforcement action in respect of this matter. However, each of Barclays Bank PLC and Barclays Bank UK PLC agreed to be subject to requirements to report to the FCA and PRA on certain aspects of their whistleblowing programmes. The New York Department of Financial Services (NYDFS) and the Federal Reserve Bank of New York also conducted their own investigations in respect of this matter. In December 2018, the NYDFS issued a consent order that imposed a $15m civil penalty on Barclays Bank PLC, which has been paid, for failings in its whistleblowing programme as well as certain remediation and reporting obligations related to its whistleblowing programme. All regulatory investigations relating to these events are now concluded. Claimed amounts/Financial impact Aside from the settlement discussed above, there is no financial impact on Barclays’ operating results, cash flows or financial position. Investigations into LIBOR and other benchmarks Regulators and law enforcement agencies, including certain competition authorities, from a number of governments have been conducting investigations relating to Barclays Bank PLC’s involvement in manipulating certain financial benchmarks, such as LIBOR and EURIBOR. In 2012, Barclays Bank PLC announced that it had reached settlements with the Financial Services Authority (FSA) (as predecessor to the FCA), the US Commodity Futures Trading Commission (CFTC) and the DoJ in relation to their investigations concerning certain benchmark interest rate submissions, and Barclays Bank PLC paid total penalties of £290m. The settlement with the DoJ was made by entry into a Non-Prosecution Agreement (NPA) which has now expired. Barclays PLC, Barclays Bank PLC and Barclays Capital Inc. (BCI) have reached settlements with certain other regulators and law enforcement agencies. Barclays Bank PLC continues to respond to requests for information from the SFO in relation to its ongoing LIBOR investigation, including in respect of Barclays Bank PLC. Claimed amounts/Financial impact Aside from the settlements discussed above, it is not currently practicable to provide an estimate of any further financial impact of the actions described on Barclays or what effect they might have upon Barclays’ operating results, cash flows or financial position in any particular period.
home.barclays/annualreport Barclays Bank PLC Annual Report 230

Credit risk management
28 Legal, competition and regulatory matters continued LIBOR and other benchmark civil actions Following settlement of the investigations referred to above in ‘Investigations into LIBOR and other benchmarks’, various individuals and corporates in a range of jurisdictions have threatened or brought civil actions against Barclays and other banks in relation to LIBOR and/or other benchmarks. While certain cases have been dismissed, settled or settled subject to final approval from the relevant court (and in the case of class actions, the right of class members to opt out of the settlement and to seek to file their own claims), other actions remain pending and their ultimate impact is unclear. USD LIBOR Cases in the Multidistrict Litigation Court The majority of the USD LIBOR cases, which have been filed in various US jurisdictions, have been consolidated for pre-trial purposes before a single judge in the US District Court in the Southern District of New York (SDNY). The complaints are substantially similar and allege, amongst other things, that Barclays PLC, Barclays Bank PLC, BCI and other financial institutions individually and collectively violated provisions of the US Sherman Antitrust Act (Antitrust Act), the US Commodity Exchange Act (CEA), the US Racketeer Influenced and Corrupt Organizations Act (RICO), the Securities Exchange Act of 1934 and various state laws by manipulating USD LIBOR rates. Certain of the proposed class actions have been settled. Barclays has settled claims purportedly brought on behalf of plaintiffs that (i) engaged in USD LIBOR-linked over-the-counter transactions (OTC Class); (ii) purchased USD LIBOR-linked financial instruments on an exchange; (iii) purchased USD LIBOR-linked debt securities; or (iv) issued loans linked to USD LIBOR (Lender Class) and paid $120m, $20m, $7.1m and $4m respectively. The settlements with the OTC Class and the Lender Class have received final court approval. The other settlements remain subject to final court approval and/or the right of class members to opt out of the settlement and to seek to file their own claims. The remaining putative class actions and individual actions seek unspecified damages with the exception of five lawsuits, in which the plaintiffs are seeking a combined total in excess of $1.25bn in actual damages against all defendants, including Barclays Bank PLC, plus punitive damages. Some of the lawsuits also seek trebling of damages under the Antitrust Act and RICO. EURIBOR Case in the SDNY In 2015, $94m was paid in settlement of a EURIBOR-related class action. The court granted final approval of Barclays’ settlement in May 2018. Additional USD LIBOR Cases in the SDNY In 2015, an individual action against Barclays Bank PLC and other panel bank defendants was dismissed by the SDNY. The plaintiff alleged that the panel bank defendants conspired to increase USD LIBOR, which caused the value of bonds pledged as collateral for a loan to decrease, ultimately resulting in the sale of the bonds at a low point in the market. In March 2018, the court denied the plaintiff’s motion for leave to amend its complaint and dismissed the case. The plaintiff’s appeal of the court’s order is pending. In January 2019, two putative class actions were filed in the SDNY against Barclays PLC, Barclays Bank PLC, BCI, other financial institution defendants and Intercontinental Exchange Inc. and certain of its affiliates (ICE), asserting antitrust and unjust enrichment claims on allegations that, beginning in 2014, defendants manipulated USD LIBOR through defendants’ submissions to ICE, which took over rate-setting duties for LIBOR from the British Bankers' Association in 2014. These two actions were consolidated in February 2019. Sterling LIBOR Case in SDNY In 2015, a putative class action was filed in the SDNY against Barclays Bank PLC and other Sterling LIBOR panel banks by a plaintiff involved in exchange-traded and over-the-counter derivatives that were linked to Sterling LIBOR. The complaint alleges, among other things, that the defendants manipulated the Sterling LIBOR rate between 2005 and 2010 and, in so doing, committed CEA, Antitrust Act, and RICO violations. In 2016, this class action was consolidated with an additional putative class action making similar allegations against Barclays Bank PLC and BCI and other Sterling LIBOR panel banks. The defendants’ motion to dismiss was granted in December 2018. The plaintiff has asked the court to reconsider this decision. Japanese Yen LIBOR Cases in SDNY In 2012, a putative class action was filed in the SDNY against Barclays Bank PLC and other Japanese Yen LIBOR panel banks by a plaintiff involved in exchange-traded derivatives. The complaint also names members of the Japanese Bankers Association’s Euroyen Tokyo Interbank Offered Rate (Euroyen TIBOR) panel, of which Barclays Bank PLC is not a member. The complaint alleges, amongst other things, manipulation of the Euroyen TIBOR and Yen LIBOR rates and breaches of the CEA and Antitrust Act between 2006 and 2010. In 2014, the court dismissed the plaintiff’s antitrust claims in full, but the plaintiff’s CEA claims remain pending. Discovery is ongoing. In 2017, a second putative class action concerning Yen LIBOR which was filed in the SDNY against Barclays PLC, Barclays Bank PLC and BCI was dismissed in full. The complaint makes similar allegations to the 2012 class action. The plaintiffs have appealed the dismissal. SIBOR/SOR Case in the SDNY In 2016, a putative class action was filed in the SDNY against Barclays PLC, Barclays Bank PLC, BCI and other defendants, alleging manipulation of the Singapore Interbank Offered Rate (SIBOR) and Singapore Swap Offer Rate (SOR). The plaintiffs amended their complaint in 2017 following dismissal by the court of the claims against Barclays for failure to state a claim. In October 2018, the court dismissed all claims against Barclays PLC, Barclays Bank PLC and BCI, a decision that the plaintiffs are challenging.
home.barclays/annualreport Barclays Bank PLC Annual Report 231

Notes to the financial statements Accruals, provisions, contingent liabilities and legal proceedings Credit risk management
28 Legal, competition and regulatory matters continued Non-US Benchmarks Cases In the UK, certain local authorities have brought claims against Barclays asserting that they entered into loans in reliance on misrepresentations made by Barclays in respect of its conduct in relation to LIBOR. In addition to the US and UK actions described above, legal proceedings have been brought or threatened against Barclays in connection with alleged manipulation of LIBOR and EURIBOR and other benchmarks in the UK, a number of other jurisdictions in Europe, Israel and Argentina. Additional proceedings in other jurisdictions may be brought in the future. Claimed amounts/Financial impact Aside from the settlements discussed above, it is not currently practicable to provide an estimate of any further financial impact of the actions described on Barclays or what effect they might have upon Barclays’ operating results, cash flows or financial position in any particular period. Foreign Exchange Investigations Various regulatory and enforcement authorities across multiple jurisdictions have been investigating a range of issues associated with Foreign Exchange sales and trading, including electronic trading. In 2015 Barclays reached settlements with the CFTC, the DoJ, the NYDFS, the Board of Governors of the Federal Reserve System (Federal Reserve) and the FCA (together, the 2015 Resolving Authorities) in relation to investigations into certain sales and trading practices in the Foreign Exchange market. In connection with these settlements, Barclays paid total penalties of approximately $2.38bn and agreed to undertake certain remedial actions. Under the plea agreement with the DoJ, in addition to a criminal fine, Barclays PLC agreed to a term of probation of three years during which Barclays PLC, including its subsidiaries, must, amongst other things, (i) commit no crime whatsoever in violation of the federal laws of the US, (ii) implement and continue to implement a compliance program designed to prevent and detect the conduct that gave rise to the plea agreement, (iii) report credible evidence of criminal violations of US antitrust or fraud laws to the relevant US authority, and (iv) strengthen its compliance and internal controls as required by relevant regulatory or enforcement agencies. In January 2017, the US District Court for the District of Connecticut accepted the plea agreement and in accordance with the agreement sentenced Barclays PLC to pay $650m as a fine and $60m for violating the NPA (which amounts are part of the $2.38bn referred to above) and to serve three years of probation from the date of the sentencing order. Barclays also continues to provide relevant information to certain of the 2015 Resolving Authorities. The European Commission is one of a number of authorities still conducting an investigation into certain trading practices in the Foreign Exchange market. The DoJ has also conducted an investigation into conduct relating to certain trading activities in connection with certain transactions during 2011 and 2012. Barclays has been providing information to the DoJ and other relevant authorities reviewing this conduct. In February 2018, the DoJ issued a letter closing its investigation of Barclays in exchange for, among other things, Barclays’ agreement to pay $12.9m in disgorgement and restitution, which can be offset by any settlement amount paid as civil restitution. Barclays resolved a related civil dispute. The amount paid was not material to Barclays. Claimed amounts/Financial impact Aside from the settlements discussed above, it is not currently practicable to provide an estimate of any further financial impact of the actions described on Barclays or what effect they might have on Barclays’ operating results, cash flows or financial position in any particular period. Civil actions in respect of Foreign Exchange Following settlement of certain investigations referred to above in ‘Foreign Exchange Investigations’ a number of individuals and corporates in a range of jurisdictions have threatened or brought civil actions against Barclays and other banks in relation to Foreign Exchange or may do so in the future. Certain of these cases have been dismissed, settled or settled subject to final approval from the relevant court (and in the case of class actions, the right of class members to opt out of the settlement and to seek to file their own claims). Consolidated FX Action In 2014, a number of civil actions filed in the SDNY on behalf of proposed classes of plaintiffs alleging manipulation of Foreign Exchange markets under the Antitrust Act and New York state law and naming several international banks as defendants, including Barclays Bank PLC, were combined into a single consolidated action (Consolidated FX Action). In 2015, Barclays Bank PLC and BCI settled the Consolidated FX Action and paid $384m. The settlement received final court approval in August 2018. FX Opt Out Action In November 2018, a group of sixteen plaintiffs (and several of their affiliates) who opted out of the Consolidated FX Action settlement filed a complaint in the SDNY against the Consolidated FX Action defendants, including Barclays Bank PLC and BCI. ERISA FX Action Since 2015, several civil actions have been filed in the SDNY on behalf of proposed classes of plaintiffs purporting to allege different legal theories of injury (other than those alleged in the Consolidated FX Action) related to alleged manipulation of Foreign Exchange rates, including claims under the US Employee Retirement Income Security Act (ERISA) statute (ERISA Claims), and naming several international banks as defendants, including Barclays PLC, Barclays Bank PLC and BCI. The Court dismissed the ERISA Claims. This dismissal was affirmed on appeal in 2018 and is not subject to further appeal.
home.barclays/annualreport Barclays Bank PLC Annual Report 232

Credit risk management
28 Legal, competition and regulatory matters continued Retail Basis Action A putative action was filed in the Northern District of California (and subsequently transferred to the SDNY) against several international banks, including Barclays PLC and BCI, on behalf of a putative class of individuals that exchanged currencies on a retail basis at bank branches (Retail Basis Claims). The Court has ruled that the Retail Basis Claims are not covered by the settlement agreement in the Consolidated FX Action. The Court subsequently dismissed all Retail Basis Claims against Barclays and all other defendants. The plaintiffs amended their complaint and sought to expand the action to include credit card, debit card and wire transactions, which expansion the Court denied. State Law FX Action In 2016, a putative class action was filed in the SDNY under federal, New York and California law on behalf of proposed classes of stockholders of Exchange Traded Funds and others who supposedly were indirect investors in FX Instruments. The plaintiffs’ counsel subsequently amended the complaint to bring claims on behalf of a proposed class of investors under federal and various state laws who traded FX Instruments through FX dealers or brokers not alleged to have manipulated Foreign Exchange Rates. A different group of plaintiffs subsequently filed another action and asserted substantively similar claims. These two actions were consolidated and a consolidated complaint was filed in 2017. The consolidated action was dismissed, but the plaintiffs were permitted to file an amended complaint, except as to their federal claims, in November 2018. Non-US FX Actions In addition to the actions described above, legal proceedings have been brought or are threatened against Barclays in connection with manipulation of Foreign Exchange in the UK, a number of other jurisdictions in Europe and Israel, and additional proceedings may be brought in the future. Claimed amounts/Financial impact Aside from the settlement described above, it is not currently practicable to provide an estimate of any further financial impact of the actions described on Barclays or what effect they might have upon Barclays’ operating results, cash flows or financial position in any particular period. Metals investigations Barclays Bank PLC has provided information to the DoJ, the CFTC and other authorities in connection with investigations into metals and metals-based financial instruments. Claimed amounts/Financial impact It is not currently practicable to provide an estimate of the financial impact of the actions described on Barclays or what effect they might have upon Barclays’ operating results, cash flows or financial position in any particular period. Civil actions in respect of the gold and silver fix A number of civil complaints, each on behalf of a proposed class of plaintiffs, have been consolidated and transferred to the SDNY. The complaints allege that Barclays Bank PLC and other members of The London Gold Market Fixing Ltd. manipulated the prices of gold and gold derivative contracts in violation of the CEA, the Antitrust Act, and state antitrust and consumer protection laws. Also, in the US, a proposed class of plaintiffs filed a complaint against a number of banks, including Barclays Bank PLC, BCI and Barclays Capital Services Ltd., alleging manipulation of the price of silver in violation of the CEA and antitrust laws. The court has dismissed this action as against the Barclays entities. Civil actions have also been filed in Canadian courts against Barclays PLC, Barclays Bank PLC, Barclays Capital Canada Inc., BCI and Barclays Capital PLC on behalf of proposed classes of plaintiffs alleging manipulation of gold and silver prices in violation of Canadian law. Claimed amounts/Financial impact It is not currently practicable to provide an estimate of the financial impact of the actions described on Barclays or what effect they might have upon Barclays’ operating results, cash flows or financial position in any particular period. US residential and commercial mortgage-related activity and litigation There have been various investigations and civil litigation relating to secondary market trading of US Residential Mortgage-Backed Securities (RMBS) and US Commercial Mortgage-Backed Securities (CMBS). DoJ Civil Action In December 2016, the DoJ filed a civil complaint against Barclays Bank PLC, Barclays PLC, BCI, Barclays Group US Inc., Barclays US LLC, BCAP LLC, Securitized Asset Backed Receivables LLC and Sutton Funding LLC, in the US District Court in the Eastern District of New York (EDNY) containing a number of allegations, including mail and wire fraud, relating to mortgage-backed securities sold between 2005 and 2007. In March 2018, Barclays reached a settlement with the DoJ to resolve this complaint. Barclays paid a civil penalty of $2bn in connection with this settlement. RMBS Repurchase Requests Barclays was the sole provider of various loan-level representations and warranties (R&Ws) with respect to: approximately $5bn of Barclays sponsored securitisations; approximately $0.2bn of sales of loans to government sponsored enterprises (GSEs); and approximately $3bn of loans sold to others In addition, an entity that Barclays acquired in 2007 (Acquired Subsidiary) provided R&Ws on $19.4bn of loans it sold to third parties. R&Ws on the remaining Barclays sponsored securitisations were primarily provided by third-party originators directly to the securitisation trusts with a Barclays subsidiary, such as the depositor for the securitisation, providing more limited R&Ws. There are no stated expiration provisions applicable to most R&Ws made by Barclays, the Acquired Subsidiary or these third parties.
home.barclays/annualreport Barclays Bank PLC Annual Report 233

Notes to the financial statements Accruals, provisions, contingent liabilities and legal proceedings Credit risk management
28 Legal, competition and regulatory matters continued Under certain circumstances, Barclays and/or the Acquired Subsidiary may be required to repurchase the related loans or make other payments related to such loans if the R&Ws are breached. The unresolved repurchase requests received on or before 31 December 2018 associated with all R&Ws made by Barclays or the Acquired Subsidiary on loans sold to GSEs and others and private-label activities had an original unpaid principal balance of approximately $2.1bn at the time of such sale. The unresolved repurchase requests discussed above relate to civil actions that have been commenced by the trustees for certain RMBS securitisations in which the trustees allege that Barclays and/or the Acquired Subsidiary must repurchase loans that violated the operative R&Ws. Such trustees and other parties making repurchase requests have also alleged that the operative R&Ws may have been violated with respect to a greater (but unspecified) amount of loans than the amount of loans previously stated in specific repurchase requests made by such trustees. This litigation is ongoing. In May 2018, the Acquired Subsidiary agreed to a settlement of a civil action relating to claims for indemnification for losses allegedly suffered by a loan purchaser as a result of alleged breaches of R&Ws provided by the Acquired Subsidiary in connection with loan sales to the purchaser during the period 1997 to 2007. The amount paid was not material to Barclays. Claimed amounts/Financial impact It is not currently practicable to provide an estimate of any further financial impact of the actions described on Barclays or what effect they might have upon Barclays’ operating results, cash flows or financial position in any particular period. Alternative trading systems In 2014, the New York State Attorney General (NYAG) filed a complaint (NYAG Complaint) against Barclays PLC and BCI in the Supreme Court of the State of New York alleging, amongst other things, that Barclays PLC and BCI engaged in fraud and deceptive practices in connection with LX, Barclays’ SEC-registered alternative trading system (ATS). In February 2016, Barclays reached separate settlement agreements with the SEC and the NYAG to resolve those agencies’ claims against Barclays PLC and BCI relating to the operation of LX and paid $35m to each. Barclays PLC and BCI were named in a purported class action by an institutional financial services firm under California law based on allegations similar to those in the NYAG Complaint. In October 2016, the federal court in California granted the motion of Barclays PLC and BCI to dismiss the entire complaint. In July 2018, the court of appeals affirmed the dismissal. Following the filing of the NYAG Complaint, Barclays PLC and BCI were also named in a putative shareholder securities class action along with certain current and former executives. The plaintiffs claim that holders of Barclays American Depository Receipts (ADRs) suffered damages when the ADRs declined in value as a result of the allegations in the NYAG Complaint. The parties have agreed to a settlement of this action for $27m, which is subject to final court approval. Claimed amounts/Financial impact Barclays does not expect the financial impact of the actions described to be material to Barclays’ operating results, cash flows or financial position. Treasury auction securities civil actions and related matters Various civil actions have been filed against Barclays Bank PLC, BCI and other financial institutions alleging violations of antitrust and other laws relating to the markets for US Treasury securities and Supranational, Sovereign and Agency securities. Certain governmental authorities are also conducting investigations relating to trading of certain government and agency securities in various markets. Numerous putative class action complaints have been filed in US Federal Court against Barclays Bank PLC, BCI and other financial institutions that have served as primary dealers in US Treasury securities. Those actions have been consolidated and in 2017, plaintiffs in the putative class action filed a consolidated amended complaint in the US Federal Court in New York against the defendants as well as certain corporations that operate electronic trading platforms on which US Treasury securities are traded. The complaint purports to assert claims under US federal antitrust laws and state common law based on allegations that the defendants (i) conspired to manipulate the US Treasury securities market and/or (ii) conspired to prevent the creation of certain platforms by boycotting or threatening to boycott such trading platforms. The defendants have filed a motion to dismiss. In addition, certain plaintiffs have filed a related, direct action against BCI and certain other financial institutions that have served as primary dealers in US Treasury securities. This complaint alleges that defendants conspired to fix and manipulate the US Treasury securities market in violation of US federal antitrust laws, the CEA and state common law. Barclays PLC, Barclays Bank PLC, BCI, Barclays Services Limited, Barclays Capital Securities Limited and certain other financial institutions have been named as defendants in a civil antitrust complaint that alleges that the defendants engaged in a conspiracy to fix prices and restrain competition in the market for US dollar-denominated Supranational, Sovereign and Agency bonds (SSA Bonds) from 2009 through 2015. The defendants have moved to dismiss the action. In February 2019, indirect purchasers of SSA Bonds filed a separate but related complaint making similar allegations. Certain governmental authorities are conducting investigations into activities relating to the trading of certain government and agency securities in various markets and Barclays has been providing information to various authorities on an ongoing basis. Claimed amounts/Financial impact It is not currently practicable to provide an estimate of the financial impact of the actions described on Barclays or what effect they might have upon Barclays’ operating results, cash flows or financial position in any particular period.
home.barclays/annualreport Barclays Bank PLC Annual Report 234

Credit risk management
28 Legal, competition and regulatory matters continued Mexican Government Bond civil action Barclays PLC, Barclays Bank PLC, BCI, Barclays Capital Securities Limited, Barclays Bank Mexico, S.A., Grupo Financiero Barclays Mexico, S.A. de C.V. and Banco Barclays S.A., together with other financial institutions that allegedly transacted in Mexican government bonds (MGB), are named as defendants in a class action consolidated in the SDNY. The plaintiffs assert antitrust and state law claims arising out of an alleged conspiracy to fix the prices of MGB from 2006 through mid-2017. Defendants have moved to dismiss the consolidated action. Claimed amounts/Financial impact It is not currently practicable to provide an estimate of the financial impact of the actions described on Barclays or what effect they might have upon Barclays’ operating results, cash flows or financial position in any particular period. American Depositary Shares Barclays PLC and Barclays Bank PLC were named as defendants in a securities class action consolidated in the SDNY that alleged misstatements and omissions in offering documents for certain American Depositary Shares issued by Barclays Bank PLC in April 2008 with an original face amount of approximately $2.5 billion (the April 2008 Offering). The plaintiffs asserted claims under the Securities Act of 1933, alleging misstatements and omissions concerning (amongst other things) Barclays Bank PLC’s exposure to mortgage and credit market risk and its financial condition. In 2017, the SDNY granted the defendants’ motion for summary judgment on all claims against them, a decision affirmed by the appellate court in November 2018. Claimed amounts/Financial impact Absent the summary judgment decision being overturned on appeal, Barclays does not expect the financial impact of the action described to be material to Barclays’ operating results, cash flows or financial position. BDC Finance L.L.C. In 2008, BDC Finance L.L.C. (BDC) filed a complaint in the NY Supreme Court alleging that Barclays Bank PLC had breached a contract in connection with a portfolio of total return swaps governed by an ISDA Master Agreement (collectively, the Agreement) when it failed to transfer approximately $40m of alleged excess collateral in response to BDC’s 2008 demand (Demand). BDC asserts that under the Agreement Barclays Bank PLC was not entitled to dispute the Demand before transferring the alleged excess collateral and that even if the Agreement entitled Barclays Bank PLC to dispute the Demand before making the transfer, Barclays Bank PLC failed to dispute the Demand. BDC demands damages totalling $298m plus attorneys’ fees, expenses, and pre-judgement interest. Following a trial on certain liability issues, the court ruled in December 2018 that Barclays Bank PLC was not a defaulting party. In January 2019, BDC filed a notice of appeal of that decision. In 2011, BDC’s investment advisor, BDCM Fund Adviser, L.L.C. and its parent company, Black Diamond Capital Holdings, L.L.C. also sued Barclays Bank PLC and BCI in Connecticut State Court for unspecified damages allegedly resulting from Barclays Bank PLC’s conduct relating to the Agreement, asserting claims for violation of the Connecticut Unfair Trade Practices Act and tortious interference with business and prospective business relations. The Connecticut case is currently stayed. Claimed amounts/Financial impact It is not currently practicable to provide an estimate of the financial impact of the actions described on Barclays or what effect they might have upon Barclays’ operating results, cash flows or financial position in any particular period. BDC has made claims against Barclays totalling $298m plus attorneys’ fees, expenses, and pre-judgement interest. This amount does not necessarily reflect Barclays’ potential financial exposure if a ruling were to be made against it. Civil actions in respect of the US Anti-Terrorism Act Civil complaints against Barclays Bank PLC and other banks allege engagement in a conspiracy and violation of the US Anti-Terrorism Act (ATA). These include various civil complaints filed in the US Federal Courts in the EDNY and SDNY by separate groups of plaintiffs (aggregating over 4,000) alleging that Barclays Bank PLC and a number of other banks engaged in a conspiracy and violated the ATA by facilitating US dollar denominated transactions for the Government of Iran and various Iranian banks, which in turn funded acts of terrorism that injured or killed the plaintiffs’ family members. The plaintiffs seek to recover for pain, suffering and mental anguish pursuant to the provisions of the ATA, which allows for the tripling of any proven damages and attorneys' fees. In respect of a motion by defendants to dismiss one of the complaints, in July 2018, a magistrate judge (to whom the court referred the motion) issued a recommendation that the motion be denied; the defendants objected to that recommendation; and the motion is pending before the court. Claimed amounts/Financial impact It is not currently practicable to provide an estimate of the financial impact of the actions described on Barclays or what effect they might have upon Barclays’ operating results, cash flows or financial position in any particular period. Interest rate swap and credit default swap US civil actions Barclays PLC, Barclays Bank PLC, and BCI, together with other financial institutions that act as market makers for interest rate swaps (IRS), Trade Web, and ICAP, are named as defendants in several antitrust class actions which were consolidated in the SDNY in 2016. The complaints allege the defendants conspired to prevent the development of exchanges for IRS and demand unspecified money damages, treble damages and legal fees. Plaintiffs include certain swap execution facilities, as well as buy-side investors. The buy-side investors claim to represent a class that transacted in fixed-for-floating IRS with defendants in the US from 2008 to the present, including, for example, US retirement and pension funds, municipalities, university endowments, corporations, insurance companies and investment funds. The case is in discovery.
home.barclays/annualreport Barclays Bank PLC Annual Report 235

Notes to the financial statements Accruals, provisions, contingent liabilities and legal proceedings Credit risk management
28 Legal, competition and regulatory matters continued In 2017, a separate suit was filed in the US District Court in the SDNY against the same financial institution defendants in the IRS cases, including Barclays PLC, Barclays Bank PLC, and BCI, claiming that certain conduct alleged in the IRS cases also caused plaintiff to suffer harm with respect to the Credit Default Swaps market. The defendants have moved to dismiss this action. Separately, in June 2018, trueEX LLC filed an antitrust class action in the SDNY against eleven financial institutions that act as dealers in the IRS market, including Barclays Bank PLC and BCI, alleging that the defendants unlawfully conspired to block trueEX from successfully entering the market with its IRS trading platform. trueEX LLC also alleges that the defendants more generally boycotted other anonymous, all-to-all IRS trading platforms. In November 2018, the court dismissed certain claims for unjust enrichment and tortious interference, but denied a motion to dismiss the federal and state antitrust claims which remain pending. Claimed amounts/Financial impact It is not currently practicable to provide an estimate of the financial impact of the actions described on Barclays or what effect they might have upon Barclays’ operating results, cash flows or financial position in any particular period. Portuguese Competition Authority investigation The Portuguese Competition Authority is investigating whether competition law was infringed by the exchange of information about retail credit products amongst 15 banks in Portugal, including Barclays, over a period of 11 years with particular reference to mortgages, consumer lending and lending to small and medium enterprises. Barclays is cooperating with the investigation. Claimed amounts/Financial impact It is not currently practicable to provide an estimate of the financial impact of the matter described on Barclays or what effect it might have upon Barclays’ operating results, cash flows or financial position in any particular period. Investigations relating to retail structured deposits and capital protected structured notes In 2015, the FCA commenced an enforcement investigation relating to the design, manufacture and sale of structured deposits by Barclays from November 2009. In January 2018, the FCA also commenced an enforcement investigation relating to the design, manufacture and sale of capital protected structured notes by Barclays from June 2008 to July 2014. The FCA has now closed these investigations with no action to be taken against Barclays. Claimed amounts/Financial impact There is no financial impact on Barclays’ operating results, cash flows or financial position. Investigation into collections and recoveries relating to unsecured lending In February 2018, the FCA commenced an enforcement investigation in relation to whether or not Barclays implemented effective systems and controls with respect to collections and recoveries and whether or not it paid due consideration to the interests of customers in default and arrears. Claimed amounts/Financial impact It is not currently practicable to provide an estimate of the financial impact of the investigation on Barclays or what effect that it might have upon Barclays’ operating results, cash flows or financial position in any particular period. HM Revenue & Customs (HMRC) assessments concerning UK Value Added Tax In 2018, HMRC issued notices that have the effect of removing certain overseas subsidiaries that have operations in the UK from Barclays’ UK VAT group, in which group supplies between members are generally free from VAT. The notices have retrospective effect and correspond to assessments of £181m (inclusive of interest), of which Barclays would expect to attribute an amount of approximately £128m to Barclays Bank UK PLC and £53m to Barclays Bank PLC. Barclays has appealed HMRC’s decision to the First Tier Tribunal (Tax Chamber). Claimed amounts/Financial impact The total amount of the HMRC assessments is approximately £181m, inclusive of interest. General Barclays Bank PLC and its subsidiaries are engaged in various other legal, competition and regulatory matters in the UK, the US and a number of other overseas jurisdictions. The Barclays Bank Group is subject to legal proceedings brought by and against Barclays which arise in the ordinary course of business from time to time, including (but not limited to) disputes in relation to contracts, securities, debt collection, consumer credit, fraud, trusts, client assets, competition, data management and protection, money laundering, financial crime, employment, environmental and other statutory and common law issues. The Barclays Bank Group is also subject to enquiries and examinations, requests for information, audits, investigations and legal and other proceedings by regulators, governmental and other public bodies in connection with (but not limited to) consumer protection measures, compliance with legislation and regulation, wholesale trading activity and other areas of banking and business activities in which Barclays is or has been engaged. Barclays is cooperating with the relevant authorities and keeping all relevant agencies briefed as appropriate in relation to these matters and others described in this note on an ongoing basis. At the present time, Barclays Bank PLC does not expect the ultimate resolution of any of these other matters to have a material adverse effect on its financial position. However, in light of the uncertainties involved in such matters and the matters specifically described in this note, there can be no assurance that the outcome of a particular matter or matters (including formerly active matters or those matters arising after the date of this note) will not be material to Barclays Bank PLC’s results, operations or cash flow for a particular period, depending on, amongst other things, the amount of the loss resulting from the matter(s) and the amount of profit otherwise reported for the reporting period.
home.barclays/annualreport Barclays Bank PLC Annual Report 236

Notes to the financial statements Capital instruments, equity and reserves
The notes included in this section focus on the Barclays Bank Group’s loan capital and shareholders’ equity including issued share capital, retained earnings, other equity balances and interests of minority shareholders in our subsidiary entities (non-controlling interests). For more information on capital management and how the Barclays Bank Group maintains sufficient capital to meet our regulatory requirements refer to page 50. 29 Subordinated liabilities Accounting for subordinated liabilities Subordinated liabilities are measured at amortised cost using the effective interest method under IFRS 9. Barclays Bank Group Barclays Bank PLC
2018 2017 2018 2017
£m £m £m £m
Opening balance as at 1 January 24,193 23,871 24,203 23,878Issuances 221 3,041 - 3,041Redemptions (3,246) (1,378) (3,246) (1,371)Other 14,159 (1,341) 14,128 (1,345)Total subordinated liabilities 35,327 24,193 35,085 24,203
Issuances of USD floating rate notes totalling £221m. Redemptions totalling £3,246m include £500m Fixed/Floating Rate Subordinated Callable Notes, €1,750m 6% Fixed Rate Subordinated Notes (£1,532m), $1,000m 7.75% Contingent Capital Notes (£713m), $99m 7.7% Undated Subordinated Notes (£72m), €40m Floating Rate Subordinated Notes 2018 (£35m), €235m CMS Linked Subordinated Notes (£206m), £140m 8.25% Undated Subordinated Notes and a number of small redemptions by Barclays Securities Japan Limited totalling £48m. Other movements include an increase of £16,987m due to a change in the level of subordination of certain loans made to Barclays Bank PLC by Barclays PLC which were previously reported as debt securities in issue. This was part of amendments made to the loans to meet internal minimum requirements for own funds and eligible liabilities (MREL) criteria to ensure they will qualify as internal MREL resources under MREL requirements applying in 2019. In addition, there was an increase of £294m as a result of a 2018 reclassification of equity to debt. These increases were partially offset by £3,001m relating to the disposal of the UK banking business. Subordinated liabilities include accrued interest and comprise undated and dated subordinated liabilities as follows: Barclays Bank Group Barclays Bank PLC
2018 2017 2018 2017
£m £m £m £m
Undated subordinated liabilities 4,313 4,192 4,454 4,261
Dated subordinated liabilities 31,014 20,001 30,631 19,942
Total subordinated liabilities 35,327 24,193 35,085 24,203
None of the Barclays Bank Group’s subordinated liabilities are secured.
home.barclays/annualreport Barclays Bank PLC Annual Report 237
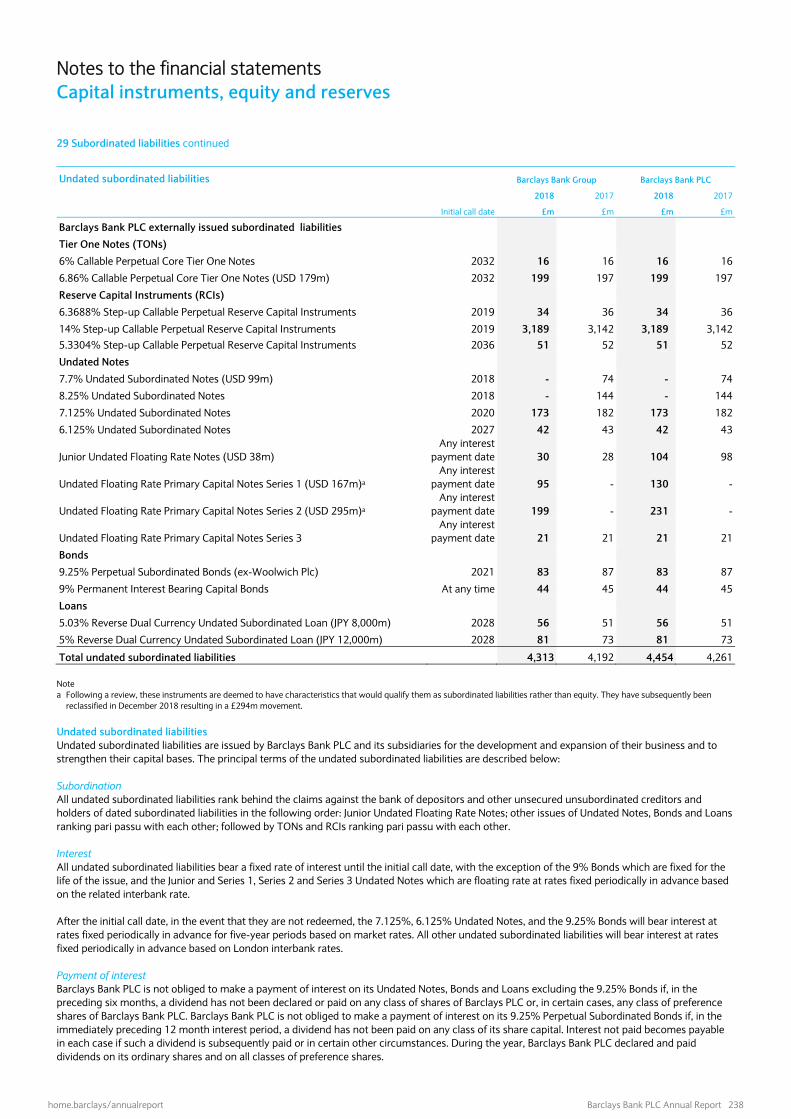
Notes to the financial statements Capital instruments, equity and reserves
29 Subordinated liabilities continued Undated subordinated liabilities Barclays Bank Group Barclays Bank PLC
2018 2017 2018 2017
Initial call date £m £m £m £m
Barclays Bank PLC externally issued subordinated liabilities
Tier One Notes (TONs)
6% Callable Perpetual Core Tier One Notes 2032 16 16 16 16
6.86% Callable Perpetual Core Tier One Notes (USD 179m) 2032 199 197 199 197
Reserve Capital Instruments (RCIs)
6.3688% Step-up Callable Perpetual Reserve Capital Instruments 2019 34 36 34 36
14% Step-up Callable Perpetual Reserve Capital Instruments 2019 3,189 3,142 3,189 3,1425.3304% Step-up Callable Perpetual Reserve Capital Instruments 2036 51 52 51 52
Undated Notes
7.7% Undated Subordinated Notes (USD 99m) 2018 - 74 - 74
8.25% Undated Subordinated Notes 2018 - 144 - 144
7.125% Undated Subordinated Notes 2020 173 182 173 182
6.125% Undated Subordinated Notes 2027 42 43 42 43
Junior Undated Floating Rate Notes (USD 38m) Any interest
payment date 30 28 104 98
Undated Floating Rate Primary Capital Notes Series 1 (USD 167m)a Any interest
payment date 95 - 130 -
Undated Floating Rate Primary Capital Notes Series 2 (USD 295m)a Any interest
payment date 199 - 231 -
Undated Floating Rate Primary Capital Notes Series 3 Any interest
payment date 21 21 21 21
Bonds
9.25% Perpetual Subordinated Bonds (ex-Woolwich Plc) 2021 83 87 83 87
9% Permanent Interest Bearing Capital Bonds At any time 44 45 44 45
Loans
5.03% Reverse Dual Currency Undated Subordinated Loan (JPY 8,000m) 2028 56 51 56 51
5% Reverse Dual Currency Undated Subordinated Loan (JPY 12,000m) 2028 81 73 81 73
Total undated subordinated liabilities 4,313 4,192 4,454 4,261 Note a Following a review, these instruments are deemed to have characteristics that would qualify them as subordinated liabilities rather than equity. They have subsequently been
reclassified in December 2018 resulting in a £294m movement. Undated subordinated liabilities Undated subordinated liabilities are issued by Barclays Bank PLC and its subsidiaries for the development and expansion of their business and to strengthen their capital bases. The principal terms of the undated subordinated liabilities are described below: Subordination All undated subordinated liabilities rank behind the claims against the bank of depositors and other unsecured unsubordinated creditors and holders of dated subordinated liabilities in the following order: Junior Undated Floating Rate Notes; other issues of Undated Notes, Bonds and Loans ranking pari passu with each other; followed by TONs and RCIs ranking pari passu with each other. Interest All undated subordinated liabilities bear a fixed rate of interest until the initial call date, with the exception of the 9% Bonds which are fixed for the life of the issue, and the Junior and Series 1, Series 2 and Series 3 Undated Notes which are floating rate at rates fixed periodically in advance based on the related interbank rate. After the initial call date, in the event that they are not redeemed, the 7.125%, 6.125% Undated Notes, and the 9.25% Bonds will bear interest at rates fixed periodically in advance for five-year periods based on market rates. All other undated subordinated liabilities will bear interest at rates fixed periodically in advance based on London interbank rates. Payment of interest Barclays Bank PLC is not obliged to make a payment of interest on its Undated Notes, Bonds and Loans excluding the 9.25% Bonds if, in the preceding six months, a dividend has not been declared or paid on any class of shares of Barclays PLC or, in certain cases, any class of preference shares of Barclays Bank PLC. Barclays Bank PLC is not obliged to make a payment of interest on its 9.25% Perpetual Subordinated Bonds if, in the immediately preceding 12 month interest period, a dividend has not been paid on any class of its share capital. Interest not paid becomes payable in each case if such a dividend is subsequently paid or in certain other circumstances. During the year, Barclays Bank PLC declared and paid dividends on its ordinary shares and on all classes of preference shares.
home.barclays/annualreport Barclays Bank PLC Annual Report 238

29 Subordinated liabilities continued No payment of principal or any interest may be made unless Barclays Bank PLC satisfies a specified solvency test. Barclays Bank PLC may elect to defer any payment of interest on the RCIs. Any such deferred payment of interest must be paid on the earlier of: (i) the date of redemption of the RCIs, (ii) the coupon payment date falling on or nearest to the tenth anniversary of the date of deferral of such payment, and (iii) in respect of the 14% RCIs only, substitution. Whilst such deferral is continuing, neither Barclays Bank PLC nor Barclays PLC may declare or pay a dividend, subject to certain exceptions, on any of its ordinary shares or preference shares. Barclays Bank PLC may elect to defer any payment of interest on the TONs if it determines that it is, or such payment would result in it being, in non-compliance with capital adequacy requirements and policies of the PRA. Any such deferred payment of interest will only be payable on a redemption of the TONs. Until such time as Barclays Bank PLC next makes a payment of interest on the TONs, neither Barclays Bank PLC nor Barclays PLC may (i) declare or pay a dividend, subject to certain exceptions, on any of their respective ordinary shares or Preference Shares, or make payments of interest in respect of Barclays Bank PLC’s Reserve Capital Instruments and (ii) certain restrictions on the redemption, purchase or reduction of their respective share capital and certain other securities also apply. Repayment All undated subordinated liabilities are repayable, at the option of Barclays Bank PLC generally in whole at the initial call date and on any subsequent coupon or interest payment date or in the case of the 7.125%, 6.125% Undated Notes and the 9.25% Bonds on any fifth anniversary after the initial call date. In addition, each issue of undated subordinated liabilities is repayable, at the option of Barclays Bank PLC, in whole for certain tax reasons, either at any time, or on an interest payment date. There are no events of default except non-payment of principal or mandatory interest. Any repayments require the prior approval of the PRA. Other All issues of undated subordinated liabilities are non-convertible.
home.barclays/annualreport Barclays Bank PLC Annual Report 239
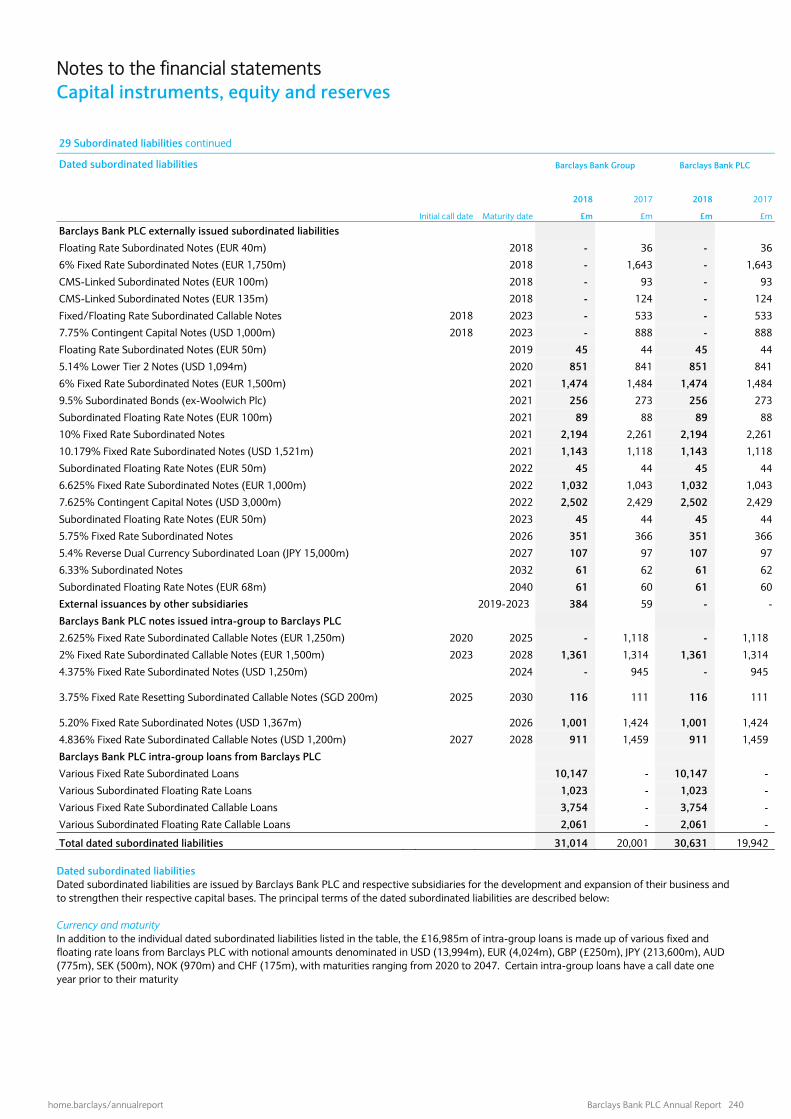
Notes to the financial statements Capital instruments, equity and reserves
29 Subordinated liabilities continued
Dated subordinated liabilities Barclays Bank Group Barclays Bank PLC
2018 2017 2018 2017
Initial call date Maturity date £m £m £m £m
Barclays Bank PLC externally issued subordinated liabilities Floating Rate Subordinated Notes (EUR 40m) 2018 - 36 - 36
6% Fixed Rate Subordinated Notes (EUR 1,750m) 2018 - 1,643 - 1,643
CMS-Linked Subordinated Notes (EUR 100m) 2018 - 93 - 93
CMS-Linked Subordinated Notes (EUR 135m) 2018 - 124 - 124
Fixed/Floating Rate Subordinated Callable Notes 2018 2023 - 533 - 533
7.75% Contingent Capital Notes (USD 1,000m) 2018 2023 - 888 - 888
Floating Rate Subordinated Notes (EUR 50m) 2019 45 44 45 44
5.14% Lower Tier 2 Notes (USD 1,094m) 2020 851 841 851 841
6% Fixed Rate Subordinated Notes (EUR 1,500m) 2021 1,474 1,484 1,474 1,484
9.5% Subordinated Bonds (ex-Woolwich Plc) 2021 256 273 256 273
Subordinated Floating Rate Notes (EUR 100m) 2021 89 88 89 88
10% Fixed Rate Subordinated Notes 2021 2,194 2,261 2,194 2,261
10.179% Fixed Rate Subordinated Notes (USD 1,521m) 2021 1,143 1,118 1,143 1,118
Subordinated Floating Rate Notes (EUR 50m) 2022 45 44 45 44
6.625% Fixed Rate Subordinated Notes (EUR 1,000m) 2022 1,032 1,043 1,032 1,043
7.625% Contingent Capital Notes (USD 3,000m) 2022 2,502 2,429 2,502 2,429
Subordinated Floating Rate Notes (EUR 50m) 2023 45 44 45 44
5.75% Fixed Rate Subordinated Notes 2026 351 366 351 366
5.4% Reverse Dual Currency Subordinated Loan (JPY 15,000m) 2027 107 97 107 97
6.33% Subordinated Notes 2032 61 62 61 62
Subordinated Floating Rate Notes (EUR 68m) 2040 61 60 61 60
External issuances by other subsidiaries 2019-2023 384 59 - -
Barclays Bank PLC notes issued intra-group to Barclays PLC
2.625% Fixed Rate Subordinated Callable Notes (EUR 1,250m) 2020 2025 - 1,118 - 1,118
2% Fixed Rate Subordinated Callable Notes (EUR 1,500m) 2023 2028 1,361 1,314 1,361 1,314
4.375% Fixed Rate Subordinated Notes (USD 1,250m) 2024 - 945 - 945
3.75% Fixed Rate Resetting Subordinated Callable Notes (SGD 200m)
2025 2030 116 111 116 111
5.20% Fixed Rate Subordinated Notes (USD 1,367m) 2026 1,001 1,424 1,001 1,424
4.836% Fixed Rate Subordinated Callable Notes (USD 1,200m) 2027 2028 911 1,459 911 1,459
Barclays Bank PLC intra-group loans from Barclays PLC
Various Fixed Rate Subordinated Loans 10,147 - 10,147 -
Various Subordinated Floating Rate Loans 1,023 - 1,023 -
Various Fixed Rate Subordinated Callable Loans 3,754 - 3,754 -
Various Subordinated Floating Rate Callable Loans 2,061 - 2,061 -
Total dated subordinated liabilities 31,014 20,001 30,631 19,942 Dated subordinated liabilities Dated subordinated liabilities are issued by Barclays Bank PLC and respective subsidiaries for the development and expansion of their business and to strengthen their respective capital bases. The principal terms of the dated subordinated liabilities are described below: Currency and maturity In addition to the individual dated subordinated liabilities listed in the table, the £16,985m of intra-group loans is made up of various fixed and floating rate loans from Barclays PLC with notional amounts denominated in USD (13,994m), EUR (4,024m), GBP (£250m), JPY (213,600m), AUD (775m), SEK (500m), NOK (970m) and CHF (175m), with maturities ranging from 2020 to 2047. Certain intra-group loans have a call date one year prior to their maturity
home.barclays/annualreport Barclays Bank PLC Annual Report 240

29 Subordinated liabilities continued Subordination All dated subordinated liabilities, both externally issued and issued intra-group to Barclays PLC, rank behind the claims against the bank of depositors and other unsecured unsubordinated creditors but before the claims of the undated subordinated liabilities and the holders of their equity. The Barclays Bank PLC intra-group loans from Barclays PLC rank pari passu amongst themselves but ahead of the Barclays Bank PLC notes issued intra-group to Barclays PLC and the Barclays Bank PLC externally issued subordinated liabilities. The external dated subordinated liabilities issued by subsidiaries, are similarly subordinated as the external subordinated liabilities issued by Barclays Bank PLC Interest Interest on floating rate notes and loans is set by reference to market rates at the time of issuance and fixed periodically in advance, based on the related interbank or local bank rates. Interest on fixed rate notes and loans is set by reference to market rates at the time of issuance and fixed until maturity. Interest on fixed rate callable notes and loans is set by reference to market rates at the time of issuance and fixed until the call date. After the call date, in the event that the notes or loans are not redeemed, the interest rate will be re-set to either a fixed or floating rate until maturity based on market rates. Repayment Those subordinated liabilities with a call date are repayable at the option of the issuer, on conditions governing the respective debt obligations, some in whole or in part, and some only in whole. The remaining dated subordinated liabilities outstanding at 31 December 2018 are redeemable only on maturity, subject in particular cases, to provisions allowing an early redemption in the event of certain changes in tax law or, to certain changes in legislation or regulations. Any repayments prior to maturity may require, in the case of Barclays Bank PLC, the prior approval of the PRA, or in the case of the overseas issues, the approval of the local regulator for that jurisdiction and of the PRA in certain circumstances. There are no committed facilities in existence at the balance sheet date which permit the refinancing of debt beyond the date of maturity. Other The 7.625% Contingent Capital Notes will be automatically transferred from investors to Barclays PLC (or another entity within the Barclays Group) for nil consideration in the event the Barclays PLC consolidated CRD IV CET1 ratio (FSA October 2012 transitional statement) falls below 7.0%. 30 Ordinary shares, share premium, and other equity Called up share capital, allotted and fully paid
Ordinary share
capitalPreference
share capital Share premium
Total share capital and
share premiumOther equity instruments
£m £m £m £m £m
As at 1 January 2018 2,342 19 12,092 14,453 8,982
AT1 securities issuance - - - - 1,925
AT1 securities redemption - - - - (1,242)
Redemption of preference shares - (13) - (13) -
Capital reorganisation - - (12,092) (12,092) -
Net equity impact of intra-group transfers - - - - (2,070)
As at 31 December 2018 2,342 6 - 2,348 7,595
As at 1 January 2017 2,342 28 12,092 14,462 6,486
AT1 securities issuance - - - - 2,496
Redemption of preference shares - (9) - (9) -
As at 31 December 2017 2,342 19 12,092 14,453 8,982
Ordinary shares The issued ordinary share capital of Barclays Bank PLC, as at 31 December 2018, comprised 2,342m (2017: 2,342m) ordinary shares of £1 each. Ordinary share capital and share premium constitutes 100% (2017: 60%) of total share capital and share premium issued.
home.barclays/annualreport Barclays Bank PLC Annual Report 241

Notes to the financial statements Capital instruments, equity and reserves
30 Ordinary shares, share premium, and other equity continued Preference shares The issued preference share capital of Barclays Bank PLC, as at 31 December 2018, comprised 1,000 Sterling Preference Shares of £1 each (2017: 1,000); 31,856 Euro Preference Shares of €100 each (2017: 31,856); and 58,133 US Dollar Preference Shares of $100 each (2017: 58,133). In the last quarter of 2018, 106 million US Dollar Preference Shares of $0.25 each were redeemed. Sterling £1 Preference Shares 1,000 Sterling cumulative callable preference shares of £1 each (the £1 Preference Shares) were issued on 31 December 2004 at nil premium. The £1 Preference Shares entitle the holders thereof to receive Sterling cumulative cash dividends out of distributable profits of Barclays Bank PLC, semi-annually at a rate reset semi-annually equal to the Sterling interbank offered rate for six-month sterling deposits. Barclays Bank PLC shall be obliged to pay such dividends if: (1) it has profits available for the purpose of distribution under the Companies Act 2006 as at each dividend payment date; and (2) it is solvent on the relevant dividend payment date, provided that a capital regulations condition is satisfied on such dividend payment date. The dividends shall not be due and payable on the relevant dividend payment date except to the extent that Barclays Bank PLC could make such payment and still be solvent immediately thereafter. Barclays Bank PLC shall be considered solvent on any date if: (1) it is able to pay its debts to senior creditors as they fall due; and (2) its auditors have reported within the previous six months that its assets exceed its liabilities. If Barclays Bank PLC shall not pay, or shall pay only in part, a dividend for a period of seven days or more after the due date for payment, the holders of the £1 Preference Shares may institute proceedings for the winding-up of Barclays Bank PLC. No remedy against Barclays Bank PLC shall be available to the holder of any £1 Preference Shares for the recovery of amounts owing in respect of £1 Preference Shares other than the institution of proceedings for the winding-up of Barclays Bank PLC and/or proving in such winding-up. On a winding-up or other return of capital (other than a redemption or purchase by Barclays Bank PLC of any of its issued shares, or a reduction of share capital, permitted by the Articles of Barclays Bank PLC and under applicable law), the assets of Barclays Bank PLC available to shareholders shall be applied in priority to any payment to the holders of ordinary shares and any other class of shares in the capital of Barclays Bank PLC then in issue ranking junior to the £1 Preference Shares on such a return of capital and pari passu on such a return of capital with the holders of any other class of shares in the capital of Barclays Bank PLC then in issue (other than any class of shares in the capital of Barclays Bank PLC then in issue ranking in priority to the £1 Preference Shares on a winding-up or other such return of capital), in payment to the holders of the £1 Preference Shares of a sum equal to the aggregate of: (1) an amount equal to the dividends accrued thereon for the then current dividend period (and any accumulated arrears thereof) to the date of the commencement of the winding-up or other such return of capital; and (2) an amount equal to £1 per £1 Preference Share. After payment of the full amount of the liquidating distributions to which they are entitled, the holders of the £1 Preference Shares will have no right or claim to any of the remaining assets of Barclays Bank PLC and will not be entitled to any further participation in such return of capital. The £1 Preference Shares are redeemable at the option of Barclays Bank PLC, in whole but not in part only, subject to the Companies Act 2006 and its Articles. Holders of the £1 Preference Shares are not entitled to receive notice of, or to attend, or vote at, any general meeting of Barclays Bank PLC. Euro Preference Shares 140,000 Euro 4.75% non-cumulative callable preference shares of €100 each (the 4.75% Preference Shares) were issued on 15 March 2005 for a consideration of €1,383.3m (£966.7m), of which the nominal value was €14m and the balance was share premium. The 4.75% Preference Shares entitle the holders thereof to receive Euro non-cumulative cash dividends out of distributable profits of Barclays Bank PLC, annually at a fixed rate of 4.75% per annum on the amount of €10,000 per preference share until 15 March 2020, and thereafter quarterly at a rate reset quarterly equal to 0.71% per annum above the Euro interbank offered rate for three-month Euro deposits. The 4.75% Preference Shares are redeemable at the option of Barclays Bank PLC, in whole but not in part only, on 15 March 2020, and on each dividend payment date thereafter at €10,000 per share plus any dividends accrued for the then current dividend period to the date fixed for redemption. US Dollar Preference Shares 100,000 US Dollar 6.278% non-cumulative callable preference shares of $100 each (the 6.278% Preference Shares), represented by 100,000 American Depositary Shares, Series 1, were issued on 8 June 2005 for a consideration of $995.4m (£548.1m), of which the nominal value was $10m and the balance was share premium. The 6.278% Preference Shares entitle the holders thereof to receive US Dollar non-cumulative cash dividends out of distributable profits of Barclays Bank PLC, semi-annually at a fixed rate of 6.278% per annum on the amount of $10,000 per preference share until 15 December 2034, and thereafter quarterly at a rate reset quarterly equal to 1.55% per annum above the London interbank offered rate for three-month US Dollar deposits. The 6.278% Preference Shares are redeemable at the option of Barclays Bank PLC, in whole but not in part only, on 15 December 2034, and on each dividend payment date thereafter at $10,000 per share plus any dividends accrued for the then current dividend period to the date fixed for redemption. 106 million US Dollar 8.125% non-cumulative callable preference shares of $0.25 each (the 8.125% Preference Shares), represented by 106 million American Depositary Shares, Series 5, were issued on 11 April 2008 and 25 April 2008 for a total consideration of $2,650m (£1,345m), of which the nominal value was $26.5m and the balance was share premium. The 8.125% Preference Shares entitle the holders thereof to receive US Dollar non-cumulative cash dividends out of distributable profits of Barclays Bank PLC, quarterly at a fixed rate of 8.125% per annum on the amount of $25 per preference share. The 8.125% Preference Shares were redeemed in full on December 15, 2018, with payment being made on Monday, December 17, 2018.
home.barclays/annualreport Barclays Bank PLC Annual Report 242

30 Ordinary shares, share premium, and other equity continued No redemption or purchase of any 4.75% Preference Shares and the 6.278% Preference Shares (together, the Preference Shares) may be made by Barclays Bank PLC without the prior approval of the UK PRA and any such redemption will be subject to the Companies Act 2006 and the Articles of Barclays Bank PLC. On a winding-up of Barclays Bank PLC or other return of capital (other than a redemption or purchase of shares of Barclays Bank PLC, or a reduction of share capital), a holder of Preference Shares will rank in the application of assets of Barclays Bank PLC available to shareholders: (1) junior to the holder of any shares of Barclays Bank PLC in issue ranking in priority to the Preference Shares; (2) equally in all respects with holders of other preference shares and any other shares of Barclays Bank PLC in issue ranking pari passu with the Preference Shares; and (3) in priority to the holders of ordinary shares and any other shares of Barclays Bank PLC in issue ranking junior to the Preference Shares. The holders of the £13m 6% Callable Perpetual Core Tier One Notes and the $179m 6.86% Callable Perpetual Core Tier One Notes of Barclays Bank PLC (together, the TONs) and the holders of the £35m 5.3304% Step-up Callable Perpetual Reserve Capital Instruments, the £33m 6.3688% Step-up Callable Perpetual Reserve Capital Instruments and the £3,000m 14% Step-up Callable Perpetual Reserve Capital Instruments of Barclays Bank PLC (together, the RCIs) would, for the purposes only of calculating the amounts payable in respect of such securities on a winding-up of Barclays Bank PLC, subject to limited exceptions and to the extent that the TONs and the RCIs are then in issue, rank pari passu with the holders of the most senior class or classes of preference shares then in issue in the capital of Barclays Bank PLC. Accordingly, the holders of the preference shares would rank equally with the holders of such TONs and RCIs on such a winding-up of Barclays Bank PLC (unless one or more classes of shares of Barclays Bank PLC ranking in priority to the preference shares are in issue at the time of such winding-up, in which event the holders of such TONs and RCIs would rank equally with the holders of such shares and in priority to the holders of the preference shares). Subject to such ranking, in such event, holders of the preference shares will be entitled to receive out of assets of Barclays Bank PLC available for distributions to shareholders, liquidating distributions in the amount of €10,000 per 4.75% Preference Share and $10,000 per 6.278% Preference Share, plus, in each case, an amount equal to the accrued dividend for the then current dividend period to the date of the commencement of the winding-up or other such return of capital. If a dividend is not paid in full on any preference shares on any dividend payment date, then a dividend restriction shall apply. This dividend restriction will mean that neither Barclays Bank PLC nor Barclays PLC may (a) declare or pay a dividend (other than payment by Barclays PLC of a final dividend declared by its shareholders prior to the relevant dividend payment date, or a dividend paid by Barclays Bank PLC to Barclays PLC) on any of their respective ordinary shares, other preference shares or other share capital or (b) redeem, purchase, reduce or otherwise acquire any of their respective share capital, other than shares of Barclays Bank PLC held by Barclays PLC or a wholly owned subsidiary, until the earlier of: (1) the date on which Barclays Bank PLC next declares and pays in full a preference dividend; and (2) the date on or by which all the preference shares are redeemed in full or purchased by Barclays Bank PLC. Holders of the preference shares are not entitled to receive notice of, or to attend, or vote at, any general meeting of Barclays Bank PLC. Barclays Bank PLC is not permitted to create a class of shares ranking as regards participation in the profits or assets of Barclays Bank PLC in priority to the preference shares, save with the sanction of a special resolution of a separate general meeting of the holders of the preference shares (requiring a majority of not less than three-fourths of the holders of the preference shares voting at the separate general meeting) or with the consent in writing of the holders of three-fourths of the preference shares. Except as described above, the holders of the preference shares have no right to participate in the surplus assets of Barclays Bank PLC. Capital Reorganisation On 11 September 2018, the High Court of Justice in England and Wales confirmed the cancellation of the share premium account of Barclays Bank PLC, with the balance of £12,092m credited to retained earnings. Other equity instruments Other equity instruments of £7,595m (2017: £8,982m) include AT1 securities issued by Barclays Bank PLC. The AT1 securities are perpetual securities with no fixed maturity and are structured to qualify as AT1 instruments under CRD IV. In 2018, there was one issuance (2017: two issuances) of Fixed Rate Resetting Perpetual Subordinated Contingent Convertible Securities, with principal amount totalling $2.5bn (2017: £2.5bn). There was also one redemption in 2018 (2017: none), with principal amount totalling $2.0bn. During the year, £2,070m of Additional Tier 1 (AT1) securities issued by Barclays PLC were transferred from Barclays Bank PLC to Barclays Bank UK PLC.
home.barclays/annualreport Barclays Bank PLC Annual Report 243

Notes to the financial statements Capital instruments, equity and reserves
30 Ordinary shares, share premium, and other equity continued AT1 equity instruments 2018 2017
Initial call date £m £m
AT1 equity instruments - Barclays Bank PLC 8.25% Perpetual Subordinated Contingent Convertible Securities (USD 2,000m) 2018 - 1,242
7.0% Perpetual Subordinated Contingent Convertible Securities 2019 - 698
6.625% Perpetual Subordinated Contingent Convertible Securities (USD 1,211m) 2019 715 715
6.5% Perpetual Subordinated Contingent Convertible Securities (EUR 1,077m) 2019 860 860
8.0% Perpetual Subordinated Contingent Convertible Securities (EUR 1,000m) 2020 836 836
7.875% Perpetual Subordinated Contingent Convertible Securities 2022 1,000 1,000
7.875% Perpetual Subordinated Contingent Convertible Securities (USD 1,500m) 2022 1,136 1,136
7.25% Perpetual Subordinated Contingent Convertible Securities 2023 500 1,250
7.75% Perpetual Subordinated Contingent Convertible Securities (USD 2,500m) 2023 1,925 -
5.875% Perpetual Subordinated Contingent Convertible Securities 2024 623 1,245
Total AT1 equity instruments 7,595 8,982 31 Reserves Currency translation reserve The currency translation reserve represents the cumulative gains and losses on the retranslation of the Barclays Bank Group net investment in foreign operations, net of the effects of hedging. Available for sale reserve Following the adoption of IFRS 9, accumulated fair value changes of £260m previously recognised in the available for sale reserve are now recorded in fair value through other comprehensive income. Fair value through other comprehensive income reserve The fair value through other comprehensive income reserve represent the changes in the fair value of fair value through other comprehensive income investments since initial recognition. Cash flow hedging reserve The cash flow hedging reserve represents the cumulative gains and losses on effective cash flow hedging instruments that will be recycled to the income statement when the hedged transactions affect profit or loss. Own credit reserve The own credit reserve reflects the cumulative own credit gains and losses on financial liabilities at fair value. Amounts in the own credit reserve are not recycled to profit or loss in future periods. Other reserves and other shareholders’ equity Other reserves relate to redeemed ordinary and preference shares issued by the Barclays Bank Group. Included in other shareholders’ equity are capital notes which bear interest at rates fixed periodically in advance, based on London interbank rates. These notes are repayable at the option of the Barclays Bank PLC, in whole on any interest payment date. Barclays Bank PLC is not obliged to make a payment of interest on its capital notes if, in the preceding six months, a dividend has not been declared or paid on any class of shares of Barclays PLC. Barclays Bank Group Barclays Bank PLC
2018 2017 2018 2017
£m £m £m £m
Currency translation reserve 3,927 3,084 857 719
Available for sale reserve - 396 - (19)
Fair value through other comprehensive income reserve (298) - (302) -
Cash flow hedging reserve (123) 184 (123) 185
Own credit reserve (121) (179) (121) (178)
Other reserves and other shareholders' equity (24) 323 72 386
Total 3,361 3,808 383 1,093
home.barclays/annualreport Barclays Bank PLC Annual Report 244

32 Non-controlling interests
Profit attributable to non-controlling
interest Equity attributable to non-controlling
interest Dividends paid to non-controlling
interest
2018 2017 2016 2018 2017 2016 2018 2017 2016
£m £m £m £m £m £m £m £m £m
Barclays Africa Group Limited - 140 402 - - 3,507 - 173 235
Other non-controlling interests - 4 3 2 1 15 - - -
Total - 144 405 2 1 3,522 - 173 235
Barclays Bank PLC’s shareholding in BAGL has reduced from 50.1% in 2016 to 14.9% in 2017. Following the disposal BAGL is not considered as a subsidiary of Barclays Bank Group and has been deconsolidated for accounting purposes and is accounted for as an asset available for sale in 2017.
home.barclays/annualreport Barclays Bank PLC Annual Report 245
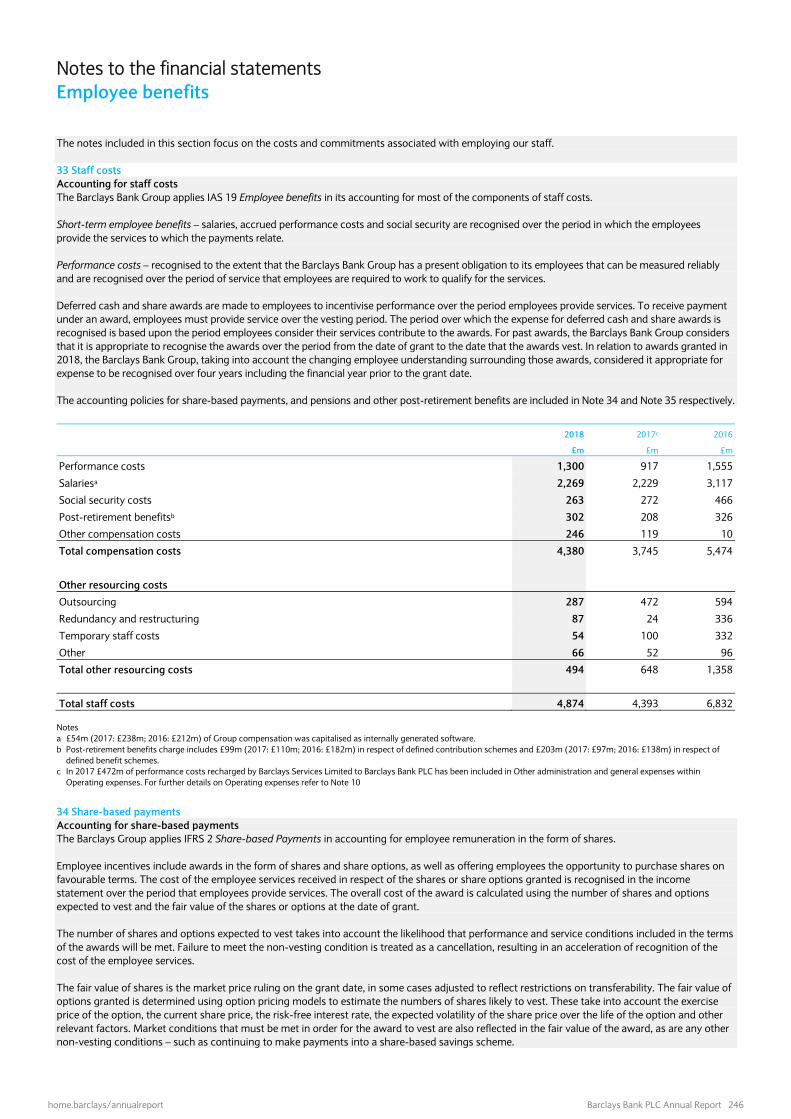
Notes to the financial statements Employee benefits Credit risk management
The notes included in this section focus on the costs and commitments associated with employing our staff. 33 Staff costs Accounting for staff costs The Barclays Bank Group applies IAS 19 Employee benefits in its accounting for most of the components of staff costs. Short-term employee benefits – salaries, accrued performance costs and social security are recognised over the period in which the employees provide the services to which the payments relate. Performance costs – recognised to the extent that the Barclays Bank Group has a present obligation to its employees that can be measured reliably and are recognised over the period of service that employees are required to work to qualify for the services. Deferred cash and share awards are made to employees to incentivise performance over the period employees provide services. To receive payment under an award, employees must provide service over the vesting period. The period over which the expense for deferred cash and share awards is recognised is based upon the period employees consider their services contribute to the awards. For past awards, the Barclays Bank Group considers that it is appropriate to recognise the awards over the period from the date of grant to the date that the awards vest. In relation to awards granted in 2018, the Barclays Bank Group, taking into account the changing employee understanding surrounding those awards, considered it appropriate for expense to be recognised over four years including the financial year prior to the grant date. The accounting policies for share-based payments, and pensions and other post-retirement benefits are included in Note 34 and Note 35 respectively. 2018 2017c 2016
£m £m £m
Performance costs 1,300 917 1,555
Salariesa 2,269 2,229 3,117
Social security costs 263 272 466
Post-retirement benefitsb 302 208 326
Other compensation costs 246 119 10
Total compensation costs 4,380 3,745 5,474
Other resourcing costs
Outsourcing 287 472 594
Redundancy and restructuring 87 24 336
Temporary staff costs 54 100 332
Other 66 52 96
Total other resourcing costs 494 648 1,358
Total staff costs 4,874 4,393 6,832 Notes a £54m (2017: £238m; 2016: £212m) of Group compensation was capitalised as internally generated software. b Post-retirement benefits charge includes £99m (2017: £110m; 2016: £182m) in respect of defined contribution schemes and £203m (2017: £97m; 2016: £138m) in respect of
defined benefit schemes. c In 2017 £472m of performance costs recharged by Barclays Services Limited to Barclays Bank PLC has been included in Other administration and general expenses within
Operating expenses. For further details on Operating expenses refer to Note 10
34 Share-based payments Accounting for share-based payments The Barclays Group applies IFRS 2 Share-based Payments in accounting for employee remuneration in the form of shares. Employee incentives include awards in the form of shares and share options, as well as offering employees the opportunity to purchase shares on favourable terms. The cost of the employee services received in respect of the shares or share options granted is recognised in the income statement over the period that employees provide services. The overall cost of the award is calculated using the number of shares and options expected to vest and the fair value of the shares or options at the date of grant. The number of shares and options expected to vest takes into account the likelihood that performance and service conditions included in the terms of the awards will be met. Failure to meet the non-vesting condition is treated as a cancellation, resulting in an acceleration of recognition of the cost of the employee services. The fair value of shares is the market price ruling on the grant date, in some cases adjusted to reflect restrictions on transferability. The fair value of options granted is determined using option pricing models to estimate the numbers of shares likely to vest. These take into account the exercise price of the option, the current share price, the risk-free interest rate, the expected volatility of the share price over the life of the option and other relevant factors. Market conditions that must be met in order for the award to vest are also reflected in the fair value of the award, as are any other non-vesting conditions – such as continuing to make payments into a share-based savings scheme.
home.barclays/annualreport Barclays Bank PLC Annual Report 246

Credit risk management
34 Share-based payments continued The charge for the year arising from share based payment schemes was as follows: Charge for the year
2018 2017
£m £m
Share Value Plan 40 87
Deferred Share Value Plan 195 65
Others 131 55
Total equity settled 366 207
Cash settled 1 1
Total share based payments 367 208
The terms of the main current plans are as follows: Share Value Plan (SVP) The SVP was introduced in March 2010 and approved by shareholders (for Executive Director participation and use of new issue shares) at the AGM in April 2011. SVP awards are granted to participants in the form of a conditional right to receive Barclays PLC shares or provisional allocations of Barclays PLC shares which vest or are considered for release over a period of three, five or seven years. Participants do not pay to receive an award or to receive a release of shares. The grantor may also make a dividend equivalent payment to participants on release of a SVP award. SVP awards are also made to eligible employees for recruitment purposes. All awards are subject to potential forfeiture in certain leaver scenarios. Deferred Share Value Plan (DSVP) The DSVP was introduced in February 2017. The terms of the DSVP are materially the same as the terms of the SVP as described above, save that Executive Directors are not eligible to participate in the DSVP and the DSVP operates over market purchase shares only. Other schemes In addition to the SVP and DSVP, the Barclays Group operates a number of other schemes settled in Barclays PLC Shares including Sharesave (both UK and Ireland), Sharepurchase (both UK and overseas), and the Barclays Group Long Term Incentive Plan. A delivery of upfront shares to ‘Material Risk Takers’ can be made as Share Incentive Award. Share option and award plans The weighted average fair value per award granted, weighted average share price at the date of exercise/release of shares during the year, weighted average contractual remaining life and number of options and awards outstanding (including those exercisable) at the balance sheet date are as follows:
2018 2017
Weighted average fair value per
award granted in year
Weighted average share price at
exercise/ release during year
Weightedaverage
remainingcontractuallife in years
Number ofoptions/
awardsoutstanding
(000s)
Weighted average fair value per
award granted in year
Weighted average share price at
exercise/ release during year
Weightedaverage
remainingcontractuallife in years
Number ofoptions/
awardsoutstanding
(000s)
£ £ £ £
SVPa,b 1.99 2.11 <1 58,370 2.30 2.30 1 167,476
DSVPa,b 1.94 2.10 1 183,962 2.25 2.07 1 115,929
Othersa 0.36-2.11 1.82-2.11 0-3 38,092 0.41-2.30 1.52-2.30 0-3 129,307 Notes a Options/award granted over Barclays PLC shares. b Nil cost award and therefore the weighted average exercise price was nil. SVP and DSVP are nil cost awards on which the performance conditions are substantially completed at the date of grant. Consequently, the fair value of these awards is based on the market value at that date.
home.barclays/annualreport Barclays Bank PLC Annual Report 247

Notes to the financial statements Employee benefits Credit risk management
34 Share-based payments continued Movements in options and awards The movement in the number of options and awards for the major schemes and the weighted average exercise price of options was:
SVPa,b DSVPa,b Othersa,c
Number (000s) Number (000s) Number (000s) Weighted average
ex. price (£)
2018 2017 2018 2017 2018 2017 2018 2017
Outstanding at beginning of year/acquisition date 167,476 291,464 115,929 - 129,307 180,265 1.39 1.38
Transfers in the yeard (2,450) 59,990 (2,547) - (90,609) (49,822) - -
Granted in the year 855 322 119,668 121,885 61,736 88,597 1.51 1.66
Exercised/released in the year (102,752) (172,718) (39,820) (1,964) (56,498) (73,762) 1.50 1.52
Less: forfeited in the year (4,759) (11,582) (9,268) (3,992) (5,844) (12,247) 1.52 1.42
Less: expired in the year - - - - - (3,724) 1.72 2.03
Outstanding at end of year 58,370 167,476 183,962 115,929 38,092 129,307 1.39 1.41
Of which exercisable: - 18 - - 4,083 15,620 1.90 1.58 Notes a Options/award granted over Barclays PLC shares. b Nil cost award and therefore the weighted average exercise price was nil. c The number of awards within Others at the end of the year principally relates to Sharesave (number of awards exercisable at end of year was (1,339,640)). The weighted average
exercise price relates to Sharesave. d Awards of employees transferred between Barclays Bank Group and the rest of Group. Certain Barclays Bank Group’s share option plans enable certain directors and employees to subscribe for new ordinary shares of Barclays PLC. There were no significant modifications to the share based payments arrangements in 2018 and 2017. As at 31 December 2018, the total liability arising from cash-settled share based payments transactions was £2m (2017: £2m).
home.barclays/annualreport Barclays Bank PLC Annual Report 248

Credit risk management
35 Pensions and post-retirement benefits Accounting for pensions and post-retirement benefits The Barclays Bank Group operates a number of pension schemes and post-employment benefit schemes. Defined contribution schemes – the Barclays Bank Group recognises contributions due in respect of the accounting period in the income statement. Any contributions unpaid at the balance sheet date are included as a liability. Defined benefit schemes – the Barclays Bank Group recognises its obligations to members of each scheme at the period end, less the fair value of the scheme assets after applying the asset ceiling test. Each scheme’s obligations are calculated using the projected unit credit method. Scheme assets are stated at fair value as at the period end. Changes in pension scheme liabilities or assets (remeasurements) that do not arise from regular pension cost, net interest on net defined benefit liabilities or assets, past service costs, settlements or contributions to the scheme, are recognised in other comprehensive income. Remeasurements comprise experience adjustments (differences between previous actuarial assumptions and what has actually occurred), the effects of changes in actuarial assumptions, return on scheme assets (excluding amounts included in the interest on the assets) and any changes in the effect of the asset ceiling restriction (excluding amounts included in the interest on the restriction). Post-employment benefit schemes – the cost of providing healthcare benefits to retired employees is accrued as a liability in the financial statements over the period that the employees provide services to the Barclays Group, using a methodology similar to that for defined benefit pension schemes. Pension schemes UK Retirement Fund (UKRF) The UKRF is Barclays Bank Group’s main scheme, representing 97% of Barclays Bank Group’s total retirement benefit obligations. Barclays Bank PLC is the principal employer of the UKRF. The UKRF was closed to new entrants on 1 October 2012, and comprises 10 sections, the two most significant of which are: Afterwork, which comprises a contributory cash balance defined benefit element, and a voluntary defined contribution element. The cash
balance element is accrued each year and revalued until Normal Retirement Age in line with the increase in Retail Price Index (RPI) (up to a maximum of 5% p.a.). An increase of up to 2% a year may also be added at Barclays’ discretion. Between 1 October 2003 and 1 October 2012 the majority of new UK employees (except for the employees of the investment banking business within Barclays International) were eligible to join this section. The costs of ill-health retirements and death in service benefits for Afterwork members are borne by the UKRF. The main risks that Barclays runs in relation to Afterwork are limited although additional contributions are required if pre-retirement investment returns are not sufficient to provide for the benefits.
The 1964 Pension Scheme. Most employees recruited before July 1997 built up benefits in this non-contributory defined benefit scheme in
respect of service up to 31 March 2010. Pensions were calculated by reference to service and pensionable salary. From 1 April 2010, members became eligible to accrue future service benefits in either Afterwork or the Pension Investment Plan (PIP), a historic defined contribution section which is now closed to future contributions. The risks that Barclays runs in relation to the 1964 section are typical of final salary pension schemes, principally that investment returns fall short of expectations, that inflation exceeds expectations, and that retirees live longer than expected.
Barclays Pension Savings Plan (BPSP) From 1 October 2012, a new UK pension scheme, the BPSP, was established to satisfy Auto Enrolment legislation. The BPSP is a defined contribution scheme providing benefits for all new UK hires from 1 October 2012, employees of the investment banking business within Barclays International who were in PIP as at 1 October 2012, and also all UK employees who were not members of a pension scheme at that date. As a defined contribution scheme, BPSP is not subject to the same investment return, inflation or life expectancy risks for Barclays that defined benefit schemes are. Members’ benefits reflect contributions paid and the level of investment returns achieved. Other Apart from the UKRF and the BPSP, Barclays operates a number of smaller pension and long-term employee benefits and post-retirement health care plans globally, the largest of which are the US defined benefit schemes. Many of the schemes are funded, with assets backing the obligations held in separate legal vehicles such as trusts. Others are operated on an unfunded basis. The benefits provided, the approach to funding, and the legal basis of the schemes, reflect local environments.
Governance The UKRF operates under trust law and is managed and administered on behalf of the members in accordance with the terms of the Trust Deed and Rules and all relevant legislation. The Corporate Trustee is Barclays Pension Funds Trustees Limited, a private limited company and a wholly owned subsidiary of Barclays Bank PLC. The Trustee is the legal owner of the assets of the UKRF which are held separately from the assets of Barclays PLC. The Trustee Board comprises six Management Directors selected by Barclays, of whom three are independent Directors with no relationship with Barclays (and who are not members of the UKRF), plus three Member Nominated Directors selected from eligible active staff and pensioner members who apply for the role. The BPSP is a Group Personal Pension arrangement which operates as a collection of personal pension plans. Each personal pension plan is a direct contract between the employee and the BPSP provider (Legal & General Assurance Society Limited), and is regulated by the FCA. Similar principles of pension governance apply to Barclays Bank PLC’s other pension schemes, depending on local legislation.
home.barclays/annualreport Barclays Bank PLC Annual Report 249

Notes to the financial statements Employee benefits Credit risk management
35 Pensions and post-retirement benefits continued Amounts recognised The following tables include amounts recognised in the income statement and an analysis of benefit obligations and scheme assets for all Barclays Bank Group defined benefit schemes. The net position is reconciled to the assets and liabilities recognised on the balance sheet. The tables include funded and unfunded post-retirement benefits. Income statement charge 2018 2017 £m £m
Current service cost 64 261Net finance cost (24) (12)Past service cost 134 (3)Other movements 5 -Total 179 246 Barclays Bank Group is the principal employer of the UKRF and hence Scheme Assets and Defined Benefit Obligations relating to the UKRF are recognised within Barclays Bank Group. Barclays Bank UK and Barclays Execution Services are participating employers in the UKRF and their share of the UKRF service cost is borne by them. Of the £240m current service cost in the below table, £69m relates to Barclays Bank UK PLC, £83m relates to Barclays Execution Services and £24m relates to an adjustment made for discontinued operations relating to Barclays Bank UK PLC. While the entire current service cost is accounted for in Barclays Bank Group on balance sheet, the income statement charge is accounted for across all the participating employers.
Balance sheet reconciliation 2018 2017
Barclays Bank
Group TotalBarclays Bank
PLC TotalOf which relates
to UKRFBarclays Bank
Group Total Barclays Bank PLC
TotalOf which relates
to UKRF £m £m £m £m £m £m
Benefit obligation at beginning of the year (30,243) (29,554) (29,160) (33,020) (32,325) (31,847)Current service cost (240) (230) (226) (261) (251) (245)Interest costs on scheme liabilities (705) (688) (677) (843) (822) (810)Past service cost (134) (139) (140) 3 1 -Remeasurement loss - financial 1,129 1,092 1,075 (386) (350) (330)Remeasurement (loss)/gain - demographic (242) (243) (245) (229) (234) (240)Remeasurement (loss)/gain - experience (75) (92) (94) (612) (609) (614)Employee contributions (4) (1) (1) (5) (1) (1)Benefits paid 2,205 2,169 2,167 4,970 4,942 4,927Exchange and other movements 72 51 - 140 95 -Benefit obligation at end of the year (28,237) (27,635) (27,301) (30,243) (29,554) (29,160)Fair value of scheme assets at beginning of the year 30,922 30,364 30,112 32,657 32,125 31,820Interest income on scheme assets 729 716 709 855 839 831Employer contribution 754 746 741 1,152 1,136 1,124Settlements (106) (58) - - - -Remeasurement - return on plan assets greater than discount rate (400) (371) (360) 1,333 1,280 1,263Employee contributions 4 1 1 5 1 1Benefits paid (2,205) (2,169) (2,167) (4,970) (4,942) (4,927)Exchange and other movements 24 30 - (110) (75) -Fair value of scheme assets at the end of the year 29,722 29,259 29,036 30,922 30,364 30,112Net surplus/(deficit) 1,485 1,624 1,735 679 810 952Retirement benefit assets 1,768 1,748 1,735 966 959 952Retirement benefit liabilities (283) (124) - (287) (149) -Net retirement benefit assets/(liabilities) 1,485 1,624 1,735 679 810 952 Included within the Barclays Bank Group’s benefit obligation was £757m (2017: £894m) relating to overseas pensions and £172m (2017: £189m) relating to other post-employment benefits. Included within the Barclays Bank PLC’s benefit obligation was £238m (2017: £286m) relating to overseas pensions and £89m (2017: £108m) relating to other post-employment benefits. As at 31 December 2018, the UKRF’s scheme assets were in surplus versus IAS 19 obligations by £1,735m (2017: £952m). The movement for the UKRF was driven by an increase in the discount rate and payment of deficit contributions, offset by lower than assumed asset returns and revised early retirement and cash commutation factors. Barclays Bank Group has considered all of the implications of the High Court ruling in the Lloyds Banking Group Pension Trustees case on the requirement to equalise pensions in respect of Guaranteed Minimum Pensions (GMP). This resulted in a £140m increase in pension obligation which has been recognised as a past service cost. Any future clarifications to GMP equalisation leading to a change in financial assumptions are expected to be recognised in equity.
home.barclays/annualreport Barclays Bank PLC Annual Report 250

Credit risk management
35 Pensions and post-retirement benefits continued Of the £2,167m (2017: £4,927m) UKRF benefits paid out, £1,420m (2017: £4,151m) related to transfers out of the fund. Where a scheme’s assets exceed its obligation, an asset is recognised to the extent that it does not exceed the present value of future contribution holidays or refunds of contributions (the “asset ceiling”). In the case of the UKRF the asset ceiling is not applied as, in certain specified circumstances such as wind-up, Barclays expects to be able to recover any surplus. The Trustee does not have a substantive right to augment benefits, nor do they have the right to wind up the plan except in the dissolution of the Barclays Bank Group or termination of contributions by the Barclays Bank Group. The application of the asset ceiling to other plans is considered on an individual plan basis. Critical accounting estimates and judgements Actuarial valuation of the schemes’ obligation is dependent upon a series of assumptions. Below is a summary of the main financial and demographic assumptions adopted for the UKRF. Key UKRF financial assumptions 2018 2017
% p.a. % p.a.
Discount rate 2.71 2.46
Inflation rate (RPI) 3.25 3.22
The UKRF discount rate assumption for 2018 was based on a variant of the standard Willis Towers Watson RATE Link model. This variant includes all bonds rated AA by at least one of the four major ratings agencies, and assumes that yields after year 30 are flat. The RPI inflation assumption for 2018 was set by reference to the Bank of England’s implied inflation spot curve, assuming the spot curve remains flat after 30 years. The inflation assumption incorporates a deduction of 20 basis points as an allowance for an inflation risk premium. The methodology used to derive the discount rate and price inflation assumptions is consistent with that used at the prior year end. The UKRF’s post-retirement mortality assumptions are based on a best estimate assumption derived from an analysis in 2016 of Barclays own post-retirement mortality experience, and taking account of the recent evidence from published mortality surveys. An allowance has been made for future mortality improvements based on the 2017 core projection model published by the Continuous Mortality Investigation Bureau subject to a long-term trend of 1.25% pa in future improvements. The methodology used is consistent with the prior year end, except that the 2016 core projection model was used at 2017. The table below shows how the assumed life expectancy at 60, for members of the UKRF, has varied over the past three years: Assumed life expectancy 2018 2017 2016
Life expectancy at 60 for current pensioners (years)
– Males 27.7 27.8 27.9
– Females 29.4 29.4 29.7
Life expectancy at 60 for future pensioners currently aged 40 (years)
– Males 29.2 29.3 29.7
– Females 31.0 31.0 31.7
The assumption for future transfers out has been adjusted to reflect volumes experienced in 2018 which were lower than previously assumed. The revised assumption is that 7.5% of the benefit obligation in respect of deferred members will transfer out during 2019, 5% in 2020, 2.5% in 2021, tapering down to 0% from 2022 onwards (2017: 15% of the benefit obligation in respect of deferred members will transfer out during 2019, 10% in 2020, 5% in 2021, tapering down to 0% from 2022 onwards). Sensitivity analysis on actuarial assumptions The sensitivity analysis has been calculated by valuing the UKRF liabilities using the amended assumptions shown in the table below and keeping the remaining assumptions the same as disclosed in the table above, except in the case of the inflation sensitivity where other assumptions that depend on assumed inflation have also been amended correspondingly. The difference between the recalculated liability figure and that stated in the balance sheet reconciliation table above is the figure shown. The selection of these movements to illustrate the sensitivity of the defined benefit obligation to key assumptions should not be interpreted as Barclays expressing any specific view of the probability of such movements happening.
home.barclays/annualreport Barclays Bank PLC Annual Report 251

Notes to the financial statements Employee benefits Credit risk management
35 Pensions and post-retirement benefits continued Change in key assumptions
2018 2017
(Decrease)/Increase in UKRF defined
benefit obligation
(Decrease)/Increase in UKRF defined
benefit obligation
£bn £bn
Discount rate
0.50% p.a. increase (2.1) (2.4)
0.25% p.a. increase (1.1) (1.2)
0.25% p.a. decrease 1.1 1.3
0.50% p.a. decrease 2.4 2.8
Assumed RPI
0.50% p.a. increase 1.3 1.6
0.25% p.a. increase 0.7 0.8
0.25% p.a. decrease (0.6) (0.7)
0.50% p.a. decrease (1.3) (1.5)
Life expectancy at 60
One year increase 0.9 1.0
One year decrease (0.9) (1.0) The weighted average duration of the benefit payments reflected in the defined benefit obligation for the UKRF is 17 years. Assets A long-term investment strategy has been set for the UKRF, with its asset allocation comprising a mixture of equities, bonds, property and other appropriate assets. This recognises that different asset classes are likely to produce different long-term returns and some asset classes may be more volatile than others. The long-term investment strategy ensures, among other aims, that investments are adequately diversified. Asset managers are permitted some flexibility to vary the asset allocation from the long-term investment strategy within control ranges agreed with the Trustee from time to time. The UKRF also employs derivative instruments, where appropriate, to achieve a desired exposure or return, or to match assets more closely to liabilities. The value of assets shown reflects the assets held by the scheme, with any derivative holdings reflected on a fair value basis.
home.barclays/annualreport Barclays Bank PLC Annual Report 252
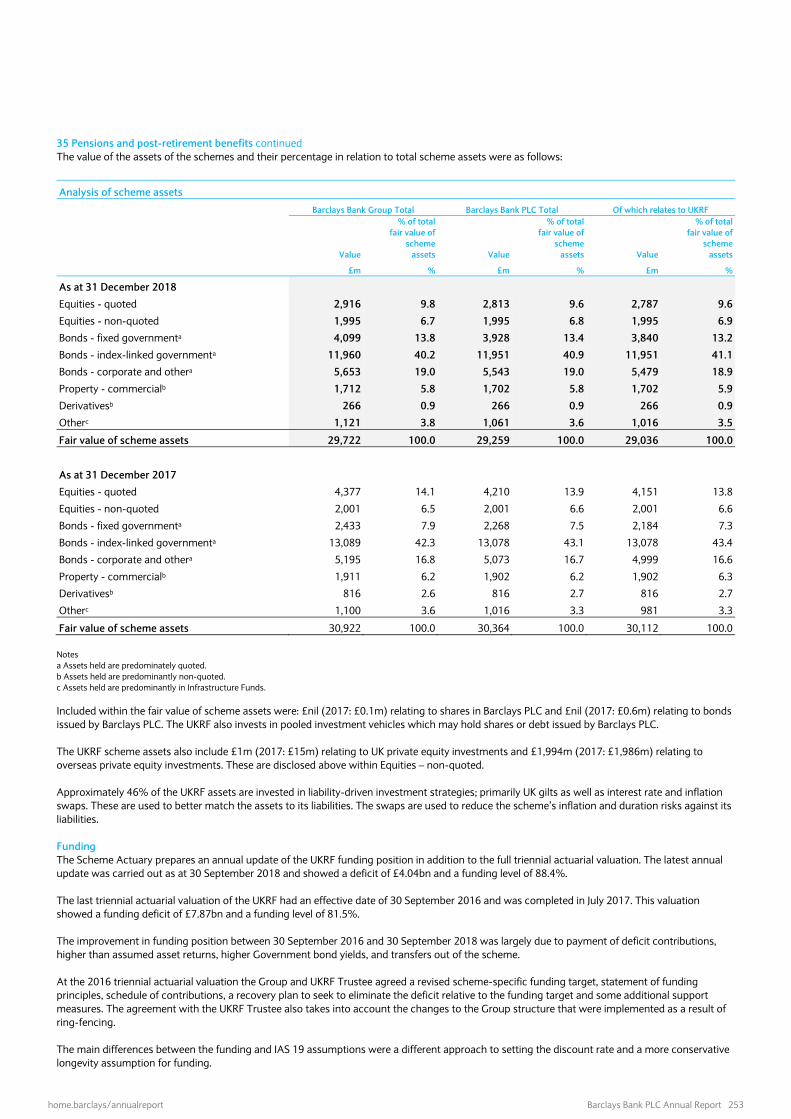
Credit risk management
35 Pensions and post-retirement benefits continued The value of the assets of the schemes and their percentage in relation to total scheme assets were as follows: Analysis of scheme assets Barclays Bank Group Total Barclays Bank PLC Total Of which relates to UKRF
Value
% of total fair value of
scheme assets Value
% of total fair value of
scheme assets Value
% of total fair value of
scheme assets
£m % £m % £m %
As at 31 December 2018
Equities - quoted 2,916 9.8 2,813 9.6 2,787 9.6
Equities - non-quoted 1,995 6.7 1,995 6.8 1,995 6.9
Bonds - fixed governmenta 4,099 13.8 3,928 13.4 3,840 13.2
Bonds - index-linked governmenta 11,960 40.2 11,951 40.9 11,951 41.1
Bonds - corporate and othera 5,653 19.0 5,543 19.0 5,479 18.9
Property - commercialb 1,712 5.8 1,702 5.8 1,702 5.9
Derivativesb 266 0.9 266 0.9 266 0.9
Otherc 1,121 3.8 1,061 3.6 1,016 3.5
Fair value of scheme assets 29,722 100.0 29,259 100.0 29,036 100.0
As at 31 December 2017
Equities - quoted 4,377 14.1 4,210 13.9 4,151 13.8
Equities - non-quoted 2,001 6.5 2,001 6.6 2,001 6.6
Bonds - fixed governmenta 2,433 7.9 2,268 7.5 2,184 7.3
Bonds - index-linked governmenta 13,089 42.3 13,078 43.1 13,078 43.4
Bonds - corporate and othera 5,195 16.8 5,073 16.7 4,999 16.6
Property - commercialb 1,911 6.2 1,902 6.2 1,902 6.3
Derivativesb 816 2.6 816 2.7 816 2.7
Otherc 1,100 3.6 1,016 3.3 981 3.3
Fair value of scheme assets 30,922 100.0 30,364 100.0 30,112 100.0 Notes a Assets held are predominately quoted. b Assets held are predominantly non-quoted. c Assets held are predominantly in Infrastructure Funds. Included within the fair value of scheme assets were: £nil (2017: £0.1m) relating to shares in Barclays PLC and £nil (2017: £0.6m) relating to bonds issued by Barclays PLC. The UKRF also invests in pooled investment vehicles which may hold shares or debt issued by Barclays PLC. The UKRF scheme assets also include £1m (2017: £15m) relating to UK private equity investments and £1,994m (2017: £1,986m) relating to overseas private equity investments. These are disclosed above within Equities – non-quoted. Approximately 46% of the UKRF assets are invested in liability-driven investment strategies; primarily UK gilts as well as interest rate and inflation swaps. These are used to better match the assets to its liabilities. The swaps are used to reduce the scheme’s inflation and duration risks against its liabilities. Funding The Scheme Actuary prepares an annual update of the UKRF funding position in addition to the full triennial actuarial valuation. The latest annual update was carried out as at 30 September 2018 and showed a deficit of £4.04bn and a funding level of 88.4%. The last triennial actuarial valuation of the UKRF had an effective date of 30 September 2016 and was completed in July 2017. This valuation showed a funding deficit of £7.87bn and a funding level of 81.5%. The improvement in funding position between 30 September 2016 and 30 September 2018 was largely due to payment of deficit contributions, higher than assumed asset returns, higher Government bond yields, and transfers out of the scheme. At the 2016 triennial actuarial valuation the Group and UKRF Trustee agreed a revised scheme-specific funding target, statement of funding principles, schedule of contributions, a recovery plan to seek to eliminate the deficit relative to the funding target and some additional support measures. The agreement with the UKRF Trustee also takes into account the changes to the Group structure that were implemented as a result of ring-fencing. The main differences between the funding and IAS 19 assumptions were a different approach to setting the discount rate and a more conservative longevity assumption for funding.
home.barclays/annualreport Barclays Bank PLC Annual Report 253

Notes to the financial statements Employee benefits Credit risk management
35 Pensions and post-retirement benefits continued The deficit reduction contributions agreed with the UKRF Trustee as part of the 30 September 2016 valuation recovery plan are shown in the table below.
Deficit contributions
30 September 2016 valuation
Year £m
2017 7402018 5002019 5002020 5002021 to 2026 1,000 each year The deficit reduction contributions are in addition to the regular contributions to meet the Barclays Bank Group’s share of the cost of benefits accruing over each year. The next funding valuation of the UKRF is due to be completed in 2020 with an effective date of 30 September 2019. Other support measures agreed at the same time as the valuation Collateral - The UKRF Trustee and Barclays Bank PLC have entered into an arrangement whereby a collateral pool has been put in place to provide security for the UKRF funding deficit as it increases or decreases over time, and associated deficit recovery contributions. The collateral pool is currently made up of government securities. Agreement was made with the Trustee to increase the proportion of the deficit covered from 88.5% to 100% effective from 26 March 2018 with an overall cap remaining of £9.0bn. The arrangement provides the UKRF Trustee with dedicated access to the pool of assets in the event of Barclays Bank PLC not paying a deficit reduction contribution to the UKRF or in the event of Barclays Bank PLC’s insolvency. These assets are included within Note 40 Assets pledged. Support from Barclays PLC - In the event of Barclays Bank PLC not paying a deficit reduction contribution payment required under the 2016 valuation recovery plan by a specified pre-payment date, Barclays PLC has entered into an arrangement whereby it will be required to use, in first priority, dividends received from Barclays Bank UK PLC (if any) to invest the proceeds in Barclays Bank PLC (up to the maximum amount of the deficit reduction contribution unpaid by Barclays Bank PLC). The proceeds of the investment will be used to discharge Barclays Bank PLC’s unpaid deficit reduction contribution. Participation - As permitted under the Financial Services and Markets Act 2000 (Banking Reform) (Pensions) Regulations 2015, Barclays Bank UK PLC is a participating employer in the UKRF and will remain so during a transitional phase until September 2025 as set out in a deed of participation. Barclays Bank UK PLC will make contributions for the future service of its employees who are currently Afterwork members and, in the event of Barclays Bank PLC's insolvency during this period provision has been made to require Barclays Bank UK PLC to become the principal employer of the UKRF. Barclays Bank PLC’s Section 75 debt would be triggered by the insolvency (the debt would be calculated after allowing for the payment to the UKRF of the collateral above). Defined benefit contributions paid with respect to the UKRF were as follows: Contributions paid £m
2018 741
2017 1,124
2016 634
There were £nil (2017: £153m; 2016: £112m) Section 75 contributions included within the Barclays Group’s contributions paid as no participating employers left the UKRF scheme in 2018. The Barclays Group’s expected contribution to the UKRF in respect of defined benefits in 2019 is £725m (2018: £716m). In addition, the expected contributions to UK defined contribution schemes in 2019 is £34m (2018: £35m) to the UKRF and £168m (2018: £146m) to the BPSP.
home.barclays/annualreport Barclays Bank PLC Annual Report 254

Notes to the financial statements Scope of consolidation
The section presents information on the Barclays Bank Group’s investments in subsidiaries, joint ventures and associates and its interests in structured entities. Detail is also given on securitisation transactions the Barclays Bank Group has entered into and arrangements that are held off-balance sheet. 36 Principal subsidiaries Barclays Bank Group applies IFRS 10 Consolidated Financial Statements. The consolidated financial statements combine the financial statements of Barclays Bank PLC and all of its subsidiaries. Subsidiaries are entities over which Barclays Bank Group has control. Under IFRS 10, this is when Barclays Bank Group is exposed or has rights to variable returns from its involvement in the entity and has the ability to affect those returns through its power over the entity. Barclays Bank Group reassesses whether it controls an entity if facts and circumstances indicate that there have been changes to its power, its rights to variable returns or its ability to use its power to affect the amount of its returns. Intra-group transactions and balances are eliminated on consolidation and consistent accounting policies are used throughout the Barclays Bank Group for the purposes of the consolidation. Changes in ownership interests in subsidiaries are accounted for as equity transactions if they occur after control has been obtained and they do not result in loss of control. The significant judgements used in applying this policy are set out below. Accounting for investment in subsidiaries In the individual financial statements of Barclays Bank PLC, investments in subsidiaries are stated at cost less impairment. Investments in subsidiaries, the principal of which are engaged in banking related activities, are recorded on the balance sheet at historical cost less any impairment. At 31 December 2018 the historical cost of investments in subsidiaries was £15,452m (2017: £15,525m), and impairment allowances recognised against these investments totalled £494m (2017: £911m). The decrease in historic cost is predominantly due to intra-group transfers, partially offset by capital injections into various subsidiaries. The decrease in impairment is predominantly due to the release of impairment on an investment transferred to Barclays Bank UK PLC. Principal subsidiaries for the Barclays Bank Group are set out below. This includes those subsidiaries that are most significant in the context of the Barclays Bank Group’s business, results or financial position.
Principal place of business or incorporation
Percentage of
voting rights held
Non-controlling interests -
proportion of ownership
interests
Non-controlling interests -
proportion of voting interests
Company Name Nature of business % % %
Barclays Bank Ireland PLC Ireland Banking, holding company 100 - -
Barclays Capital Inc. United States Securities dealing 100 - -
Barclays Capital Securities Limited England Securities dealing 100 - -
Barclays Securities Japan Limited Japan Securities dealing 100 - -
Barclays Bank Delaware United States Credit card issuer 100 - - The country of registration or incorporation is also the principal area of operation of each of the above subsidiaries. Ownership interests are in some cases different to voting interests due to the existence of non-voting equity interests, such as preference shares. See Note 32 for more information. Significant judgements and assumptions used to determine the scope of the consolidation Determining whether the Barclays Bank Group has control of an entity is generally straightforward based on ownership of the majority of the voting capital. However, in certain instances, this determination will involve significant judgement, particularly in the case of structured entities where voting rights are often not the determining factor in decisions over the relevant activities. This judgement will involve assessing the purpose and design of the entity. It will also often be necessary to consider whether the Barclays Bank Group, or another involved party with power over the relevant activities, is acting as a principal in its own right or as an agent on behalf of others. There is also often considerable judgement involved in the ongoing assessment of control over structured entities. In this regard, where market conditions have deteriorated such that the other investors’ exposures to the structure’s variable returns have been substantively eliminated, the Barclays Bank Group may conclude that the managers of the structured entity are acting as its agent and therefore will consolidate the structured entity. An interest in equity voting rights exceeding 50% would typically indicate that the Barclays Bank Group has control of an entity. However, the entity set out below is excluded from consolidation because the Barclays Bank Group does not have exposure to its variable returns.
Country of registration or incorporation Company name Percentage of voting
rights held (%)Equity shareholders' funds
(£m) Retained profit for the
year (£m)
Cayman Islands Palomino Limited 100 - -
home.barclays/annualreport Barclays Bank PLC Annual Report 255
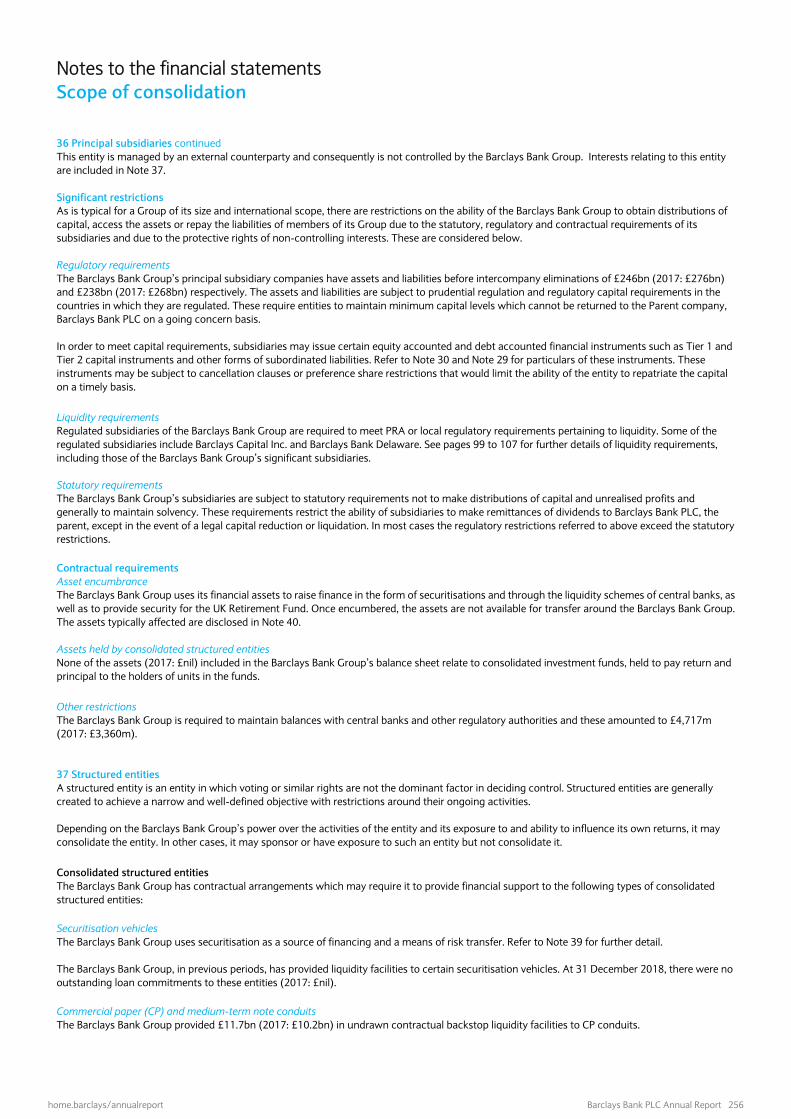
Notes to the financial statements Scope of consolidation
36 Principal subsidiaries continued This entity is managed by an external counterparty and consequently is not controlled by the Barclays Bank Group. Interests relating to this entity are included in Note 37. Significant restrictions As is typical for a Group of its size and international scope, there are restrictions on the ability of the Barclays Bank Group to obtain distributions of capital, access the assets or repay the liabilities of members of its Group due to the statutory, regulatory and contractual requirements of its subsidiaries and due to the protective rights of non-controlling interests. These are considered below. Regulatory requirements The Barclays Bank Group’s principal subsidiary companies have assets and liabilities before intercompany eliminations of £246bn (2017: £276bn) and £238bn (2017: £268bn) respectively. The assets and liabilities are subject to prudential regulation and regulatory capital requirements in the countries in which they are regulated. These require entities to maintain minimum capital levels which cannot be returned to the Parent company, Barclays Bank PLC on a going concern basis. In order to meet capital requirements, subsidiaries may issue certain equity accounted and debt accounted financial instruments such as Tier 1 and Tier 2 capital instruments and other forms of subordinated liabilities. Refer to Note 30 and Note 29 for particulars of these instruments. These instruments may be subject to cancellation clauses or preference share restrictions that would limit the ability of the entity to repatriate the capital on a timely basis. Liquidity requirements Regulated subsidiaries of the Barclays Bank Group are required to meet PRA or local regulatory requirements pertaining to liquidity. Some of the regulated subsidiaries include Barclays Capital Inc. and Barclays Bank Delaware. See pages 99 to 107 for further details of liquidity requirements, including those of the Barclays Bank Group’s significant subsidiaries. Statutory requirements The Barclays Bank Group’s subsidiaries are subject to statutory requirements not to make distributions of capital and unrealised profits and generally to maintain solvency. These requirements restrict the ability of subsidiaries to make remittances of dividends to Barclays Bank PLC, the parent, except in the event of a legal capital reduction or liquidation. In most cases the regulatory restrictions referred to above exceed the statutory restrictions. Contractual requirements Asset encumbrance The Barclays Bank Group uses its financial assets to raise finance in the form of securitisations and through the liquidity schemes of central banks, as well as to provide security for the UK Retirement Fund. Once encumbered, the assets are not available for transfer around the Barclays Bank Group. The assets typically affected are disclosed in Note 40. Assets held by consolidated structured entities None of the assets (2017: £nil) included in the Barclays Bank Group’s balance sheet relate to consolidated investment funds, held to pay return and principal to the holders of units in the funds. Other restrictions The Barclays Bank Group is required to maintain balances with central banks and other regulatory authorities and these amounted to £4,717m (2017: £3,360m). 37 Structured entities A structured entity is an entity in which voting or similar rights are not the dominant factor in deciding control. Structured entities are generally created to achieve a narrow and well-defined objective with restrictions around their ongoing activities. Depending on the Barclays Bank Group’s power over the activities of the entity and its exposure to and ability to influence its own returns, it may consolidate the entity. In other cases, it may sponsor or have exposure to such an entity but not consolidate it. Consolidated structured entities The Barclays Bank Group has contractual arrangements which may require it to provide financial support to the following types of consolidated structured entities: Securitisation vehicles The Barclays Bank Group uses securitisation as a source of financing and a means of risk transfer. Refer to Note 39 for further detail. The Barclays Bank Group, in previous periods, has provided liquidity facilities to certain securitisation vehicles. At 31 December 2018, there were no outstanding loan commitments to these entities (2017: £nil). Commercial paper (CP) and medium-term note conduits The Barclays Bank Group provided £11.7bn (2017: £10.2bn) in undrawn contractual backstop liquidity facilities to CP conduits.
home.barclays/annualreport Barclays Bank PLC Annual Report 256

37 Structured entities continued Fund management entities In previous periods, Barclays Bank Group had contractually guaranteed the performance of certain cash investments in a number of managed investment funds which resulted in their consolidation. As at 31 December 2018, the notional value of the guarantees were £nil (2017: £nil) as the European Wealth Funds associated with these guarantees were either closed or ownership has been transferred outside the Barclays Bank Group and they are no longer consolidated. Employee benefit and other trusts Barclays Bank PLC provides capital contributions to employee benefit trusts to enable them to meet obligations to the employees of Barclays Bank PLC in relation to Barclays Group’s share-based remuneration arrangements. During 2018, the Barclays Bank Group provided undrawn liquidity facilities of £2.6bn (2017: £1.8bn) to certain trusts. Unconsolidated structured entities in which the Barclays Bank Group has an interest An interest in a structured entity is any form of contractual or non-contractual involvement which creates variability in returns arising from the performance of the entity for the Barclays Bank Group. Such interests include holdings of debt or equity securities, derivatives that transfer financial risks from the entity to the Barclays Bank Group, lending, loan commitments, financial guarantees and investment management agreements. Interest rate swaps, foreign exchange derivatives that are not complex and which expose the Barclays Bank Group to insignificant credit risk by being senior in the payment waterfall of a securitisation and derivatives that are determined to introduce risk or variability to a structured entity are not considered to be an interest in an entity and have been excluded from the disclosures below. The nature and extent of the Barclays Bank Group’s interests in structured entities is summarised below:
Summary of interests in unconsolidated structured entities
Secured
financingShort-term
traded interestsTraded
derivatives Other interests Total
£m £m £m £m £m
As at 31 December 2018
Assets
Trading portfolio assets - 12,206 - - 12,206
Financial assets at fair value through the income statement 32,359 - - 2,595 34,954
Derivative financial instruments - - 5,236 - 5,236
Loans and advances at amortised cost - - - 15,019 15,019
Other assets - - - 13 13
Total assets 32,359 12,206 5,236 17,627 67,428
Liabilities
Derivative financial instruments - - 6,438 2,586 9,024
As at 31 December 2017
Assets
Trading portfolio assets - 10,788 - 699 11,487
Financial assets at fair value through the income statement 31,520 - - 2,721 34,241
Derivative financial instruments - - 4,380 - 4,380
Loans and advances at amortised cost 5,481 - - 17,386 22,867
Reverse repurchase agreements and other similar secured lending 753 - - - 753
Other assets - - - 509 509
Total assets 37,754 10,788 4,380 21,315 74,237
Liabilities
Derivative financial instruments - - 5,193 3,356 8,549
Secured financing arrangements, short-term traded interests and traded derivatives are typically managed under market risk management policies described on pages 48 to 49 which includes an indication of the change of risk measures compared to last year. For this reason, the total assets of these entities are not considered meaningful for the purposes of understanding the related risks and so have not been presented. Other interests include conduits and lending where the interest is driven by normal customer demand. Secured financing The Barclays Bank Group routinely enters into reverse repurchase contracts, stock borrowing and similar arrangements on normal commercial terms where the counterparty to the arrangement is a structured entity. Due to the nature of these arrangements, especially the transfer of collateral and ongoing margining, the Barclays Bank Group has minimal exposure to the performance of the structured entity counterparty. This includes margin lending which is presented under financial assets at fair value through the income statement to align to the balance sheet presentation.
home.barclays/annualreport Barclays Bank PLC Annual Report 257
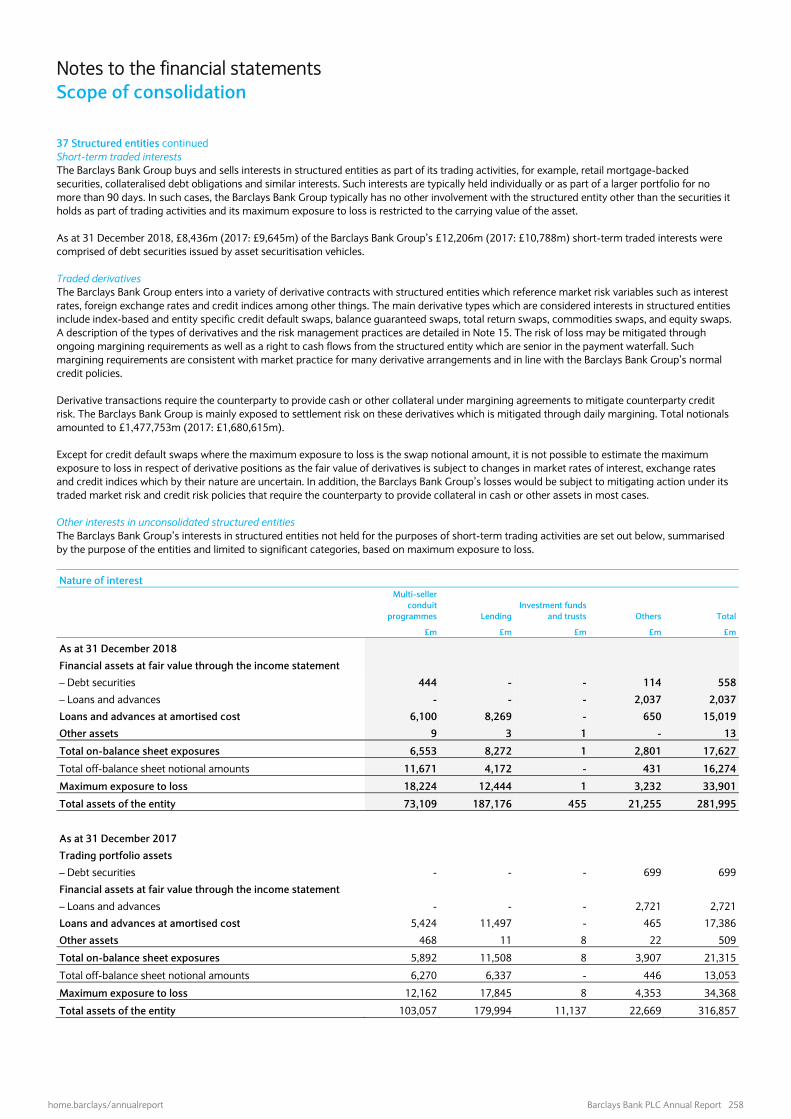
Notes to the financial statements Scope of consolidation
37 Structured entities continued Short-term traded interests The Barclays Bank Group buys and sells interests in structured entities as part of its trading activities, for example, retail mortgage-backed securities, collateralised debt obligations and similar interests. Such interests are typically held individually or as part of a larger portfolio for no more than 90 days. In such cases, the Barclays Bank Group typically has no other involvement with the structured entity other than the securities it holds as part of trading activities and its maximum exposure to loss is restricted to the carrying value of the asset. As at 31 December 2018, £8,436m (2017: £9,645m) of the Barclays Bank Group’s £12,206m (2017: £10,788m) short-term traded interests were comprised of debt securities issued by asset securitisation vehicles. Traded derivatives The Barclays Bank Group enters into a variety of derivative contracts with structured entities which reference market risk variables such as interest rates, foreign exchange rates and credit indices among other things. The main derivative types which are considered interests in structured entities include index-based and entity specific credit default swaps, balance guaranteed swaps, total return swaps, commodities swaps, and equity swaps. A description of the types of derivatives and the risk management practices are detailed in Note 15. The risk of loss may be mitigated through ongoing margining requirements as well as a right to cash flows from the structured entity which are senior in the payment waterfall. Such margining requirements are consistent with market practice for many derivative arrangements and in line with the Barclays Bank Group’s normal credit policies. Derivative transactions require the counterparty to provide cash or other collateral under margining agreements to mitigate counterparty credit risk. The Barclays Bank Group is mainly exposed to settlement risk on these derivatives which is mitigated through daily margining. Total notionals amounted to £1,477,753m (2017: £1,680,615m). Except for credit default swaps where the maximum exposure to loss is the swap notional amount, it is not possible to estimate the maximum exposure to loss in respect of derivative positions as the fair value of derivatives is subject to changes in market rates of interest, exchange rates and credit indices which by their nature are uncertain. In addition, the Barclays Bank Group’s losses would be subject to mitigating action under its traded market risk and credit risk policies that require the counterparty to provide collateral in cash or other assets in most cases. Other interests in unconsolidated structured entities The Barclays Bank Group’s interests in structured entities not held for the purposes of short-term trading activities are set out below, summarised by the purpose of the entities and limited to significant categories, based on maximum exposure to loss.
Nature of interest
Multi-seller conduit
programmes LendingInvestment funds
and trusts Others Total
£m £m £m £m £m
As at 31 December 2018
Financial assets at fair value through the income statement
– Debt securities 444 - - 114 558
– Loans and advances - - - 2,037 2,037
Loans and advances at amortised cost 6,100 8,269 - 650 15,019
Other assets 9 3 1 - 13
Total on-balance sheet exposures 6,553 8,272 1 2,801 17,627
Total off-balance sheet notional amounts 11,671 4,172 - 431 16,274
Maximum exposure to loss 18,224 12,444 1 3,232 33,901
Total assets of the entity 73,109 187,176 455 21,255 281,995
As at 31 December 2017
Trading portfolio assets
– Debt securities - - - 699 699
Financial assets at fair value through the income statement
– Loans and advances - - - 2,721 2,721
Loans and advances at amortised cost 5,424 11,497 - 465 17,386
Other assets 468 11 8 22 509
Total on-balance sheet exposures 5,892 11,508 8 3,907 21,315
Total off-balance sheet notional amounts 6,270 6,337 - 446 13,053
Maximum exposure to loss 12,162 17,845 8 4,353 34,368
Total assets of the entity 103,057 179,994 11,137 22,669 316,857
home.barclays/annualreport Barclays Bank PLC Annual Report 258

37 Structured entities continued Maximum exposure to loss Unless specified otherwise below, the Barclays Bank Group’s maximum exposure to loss is the total of its on-balance sheet positions and its off-balance sheet arrangements, being loan commitments and financial guarantees. Exposure to loss is mitigated through collateral, financial guarantees, the availability of netting and credit protection held. Multi-seller conduit programme The multi-seller conduit engages in providing financing to various clients and holds whole or partial interests in pools of receivables or similar obligations. These instruments are protected from loss through over-collateralisation, seller guarantees, or other credit enhancements provided to the conduit. The Barclays Bank Group’s off-balance sheet exposure included in the table above represents liquidity facilities that are provided to the conduit for the benefit of the holders of the commercial paper issued by the conduit and will only be drawn where the conduit is unable to access the commercial paper market. If these liquidity facilities are drawn, the Barclays Bank Group is protected from loss through over-collateralisation, seller guarantees, or other credit enhancements provided to the conduit. Lending The portfolio includes lending provided by the Barclays Bank Group to unconsolidated structured entities in the normal course of its lending business to earn income in the form of interest and lending fees and includes loans to structured entities that are generally collateralised by property, equipment or other assets. All loans are subject to the Barclays Bank Group’s credit sanctioning process. Collateral arrangements are specific to the circumstances of each loan with additional guarantees and collateral sought from the sponsor of the structured entity for certain arrangements. During the period the Barclays Bank Group incurred an impairment of £66m (2017: £11m) against such facilities. Investment funds and trusts In the course of its fund management activities, the Barclays Bank Group establishes pooled investment funds that comprise investments of various kinds, tailored to meet certain investors’ requirements. The Barclays Bank Group’s interest in funds is generally restricted to a fund management fee, the value of which is typically based on the performance of the fund. The Barclays Bank Group acts as trustee to a number of trusts established by or on behalf of its clients. The purpose of the trusts, which meet the definition of structured entities, is to hold assets on behalf of beneficiaries. The Barclays Bank Group’s interest in trusts is generally restricted to unpaid fees which, depending on the trust, may be fixed or based on the value of the trust assets. Barclays Bank PLC has no other risk exposure to the trusts. Other This includes fair value loans with structured entities where the market risk is materially hedged with corresponding derivative contracts, interests in debt securities issued by securitisation vehicles and drawn and undrawn loan facilities to these entities. Assets transferred to sponsored unconsolidated structured entities Assets transferred to sponsored unconsolidated structured entities were immaterial. 38 Investments in associates and joint ventures Accounting for associates and joint ventures The Barclays Bank Group applies IAS 28 Investments in Associates and IFRS 11 Joint Arrangements. Associates are entities in which the Barclays Bank Group has significant influence, but not control, over the operating and financial policies. Generally, the Barclays Bank Group holds more than 20%, but less than 50%, of their voting shares. Joint ventures are arrangements where the Barclays Bank Group has joint control and rights to the net assets of the entity. The Barclays Bank Group’s investments in associates and joint ventures are initially recorded at cost and increased (or decreased) each year by the Barclays Bank Group’s share of the post-acquisition profit/(loss). The Barclays Bank Group ceases to recognise its share of the losses of equity accounted associates when its share of the net assets and amounts due from the entity have been written off in full, unless it has a contractual or constructive obligation to make good its share of the losses. In some cases, investments in these entities may be held at fair value through profit or loss, for example, those held by private equity businesses. There are no individually significant investments in joint ventures or associates held by Barclays Bank Group. 2018 2017
Associates Joint ventures Total Associates Joint ventures Total £m £m £m £m £m £m
Equity accounted 481 281 762 402 316 718
Held at fair value through profit or loss - 509 509 - 447 447
Total 481 790 1,271 402 763 1,165 Summarised financial information for the Barclays Bank Group’s equity accounted associates and joint ventures is set out below. The amounts shown are the net income of the investees, not just the Barclays Bank Group’s share for the year ended 31 December 2018, with the exception of certain undertakings for which the amounts are based on accounts made up to dates not earlier than three months before the balance sheet date.
home.barclays/annualreport Barclays Bank PLC Annual Report 259

Notes to the financial statements Scope of consolidation
38 Investments in associates and joint ventures continued Associates Joint ventures
2018 2017 2018 2017
£m £m £m £m
Profit from continuing operations 173 117 54 77
Other comprehensive income / (expenses) 28 - 32 (15)
Total comprehensive income from continuing operations 201 117 86 62 Unrecognised shares of the losses of individually immaterial associates and joint ventures were £nil (2017: £nil). The Barclays Bank Group’s associates and joint ventures are subject to statutory or contractual requirements such that they cannot make remittances of dividends or make loan repayments to Barclays Bank PLC without agreement from the external parties. The Barclays Bank Group’s share of commitments and contingencies of its associates and joint ventures comprised unutilised credit facilities provided to customers of £1,715m (2017: £1,712m). In addition, the Barclays Bank Group has made commitments to finance or otherwise provide resources to its joint ventures and associates of £318m (2017: £246m). 39 Securitisations Accounting for securitisations The Barclays Bank Group uses securitisations as a source of finance and a means of risk transfer. Such transactions generally result in the transfer of contractual cash flows from portfolios of financial assets to holders of issued debt securities. Securitisations may, depending on the individual arrangement, result in continued recognition of the securitised assets and the recognition of the debt securities issued in the transaction; lead to partial continued recognition of the assets to the extent of the Barclays Bank Group’s continuing involvement in those assets or to derecognition of the assets and the separate recognition, as assets or liabilities, of any rights and obligations created or retained in the transfer. Full derecognition only occurs when the Barclays Bank Group transfers both its contractual right to receive cash flows from the financial assets, or retains the contractual rights to receive the cash flows, but assumes a contractual obligation to pay the cash flows to another party without material delay or reinvestment, and also transfers substantially all the risks and rewards of ownership, including credit risk, prepayment risk and interest rate risk. In the course of its normal banking activities, Barclays Bank Group makes transfers of financial assets, either where legal rights to the cash flows from the asset are passed to the counterparty or beneficially, where Barclays Bank Group retains the rights to the cash flows but assumes a responsibility to transfer them to the counterparty. Depending on the nature of the transaction, this may result in derecognition of the assets in their entirety, partial derecognition or no derecognition of the assets subject to the transfer. A summary of the main transactions, and the assets and liabilities and the financial risks arising from these transactions, is set out below: Transfers of financial assets that do not result in derecognition Securitisations Barclays Bank Group was party to securitisation transactions involving its credit card balances. In these transactions, the assets, interests in the assets, or beneficial interests in the cash flows arising from the assets, are transferred to a special purpose entity, which then issues interest bearing debt securities to third party investors. Securitisations may, depending on the individual arrangement, result in continued recognition of the securitised assets and the recognition of the debt securities issued in the transaction. Partial continued recognition of the assets to the extent of Barclays Bank Group’s continuing involvement in those assets can also occur or derecognition of the assets and the separate recognition, as assets or liabilities, of any rights and obligations created or retained in the transfer.
home.barclays/annualreport Barclays Bank PLC Annual Report 260

39 Securitisations continued The following table shows the carrying amount of securitised assets that have not resulted in full derecognition, together with the associated liabilities, for each category of asset on the balance sheet:
2018 2017
Assets Liabilities Assets Liabilities
Carrying amount Fair value
Carrying amount Fair value
Carrying amount Fair value
Carrying amount Fair value
£m £m £m £m £m £m £m £m
Barclays Bank Group
Loans and advances at amortised cost
Credit card, unsecured lending and other retail lending 3,042 3,094 (2,975) (2,962) 3,772 3,757 (3,635) (3,626)
Barclays Bank PLC -
Loans and advances at amortised cost
Credit card, unsecured lending and other retail lending - - - - 765 750 (750) (753) Balances included within loans and advances at amortised cost represent securitisations where substantially all the risks and rewards of the asset have been retained by Barclays Bank Group. The relationship between the transferred assets and the associated liabilities is that holders of notes may only look to cash flows from the securitised assets for payments of principal and interest due to them under the terms of their notes, although the contractual terms of their notes may be different to the maturity and interest of the transferred assets.
For transfers of assets in relation to repurchase agreements, see Note 40 Continuing involvement in financial assets that have been derecognised In some cases, the Barclays Bank Group may have transferred a financial asset in its entirety but may have continuing involvement in it. This arises in asset securitisations where loans and asset backed securities were derecognised as a result of the Barclays Bank Group’s involvement with commercial mortgage backed securities. Continuing involvement largely arises from providing financing into these structures in the form of retained notes, which do not bear first losses. The table below shows the potential financial implications of such continuing involvement: Continuing involvementa Gain/(loss) from continuing involvement
Carrying amount Fair valueMaximum
exposure to loss For the year ended Cumulative to 31
December
Type of transfer £m £m £m £m £m
2018
Commercial mortgage backed securities 135 135 135 2 3
2017
Commercial mortgage backed securities 94 94 94 1 1 Note a Assets which represent the Barclays Bank Group’s continuing involvement in derecognised assets are recorded in Loans and advances at amortised cost.
home.barclays/annualreport Barclays Bank PLC Annual Report 261

Notes to the financial statements Scope of consolidation
40 Assets pledged Assets are pledged as collateral to secure liabilities under repurchase agreements, securitisations and stock lending agreements or as security deposits relating to derivatives. The following table summarises the nature and carrying amount of the assets pledged as security against these liabilities: Barclays Bank Group Barclays Bank PLC
2018 2017 2018 2017
£m £m £m £m
Cash collateral 53,540 56,351 54,994 50,794
Loans and advances at amortised cost 12,597 41,772 8,614 35,400
Trading portfolio assets 63,373 73,899 41,048 54,118
Financial assets at fair value through the income statement 7,450 4,798 3,847 1,588
Financial investments - 15,058 - 21,970
Financial assets at fair value through other comprehensive income 9,179 - 14,534 -
Assets pledged 146,139 191,878 123,037 163,870
Barclays Bank Group has an additional £4bn of loans and advances within its asset backed funding programmes that can readily be used to raise additional secured funding and are available to support future issuances. Total assets pledged includes a collateral pool put in place to provide security for the UKRF funding deficit. Refer to Note 35 for further details. Collateral held as security for assets Under certain transactions, including reverse repurchase agreements and stock borrowing transactions, Barclays Bank Group is allowed to resell or re-pledge the collateral held. The fair value at the balance sheet date of collateral accepted and re-pledged to others was as follows: Barclays Bank Group Barclays Bank PLC
2018 2017 2018 2017
£m £m £m £m
Fair value of securities accepted as collateral 597,100 608,412 610,856 595,756
Of which fair value of securities re-pledged/transferred to others 530,364 547,637 553,147 564,886
Additional disclosure has been included in collateral and other credit enhancements (pages 63 to 66).
home.barclays/annualreport Barclays Bank PLC Annual Report 262

Notes to the financial statements Other disclosure matters
The notes included in this section focus on related party transactions, Auditors’ remuneration, Directors’ remuneration and Transition disclosures. Related parties include any subsidiaries, associates, joint ventures and Key Management Personnel. 41 Related party transactions and Directors’ remuneration Related party transactions Parties are considered to be related if one party has the ability to control the other party or exercise significant influence over the other party in making financial or operational decisions, or one other party controls both. The disposal of the UK banking business to Barclays Bank UK PLC and transfer of ownership of Barclays Bank UK PLC to Barclays PLC has materially affected the financial position and the performance of the Barclays Bank Group during this period with regards to its related party transactions. Refer to Note 2 for further details, including intra-group balances. Parent company The parent company, which is also the ultimate parent company, is Barclays PLC, which holds 100% of the issued ordinary shares of Barclays Bank PLC. Subsidiaries Transactions between Barclays Bank PLC and its subsidiaries also meet the definition of related party transactions. Where these are eliminated on consolidation, they are not disclosed in the Barclays Bank Group’s financial statements. A list of the Barclays Bank Group’s principal subsidiaries is shown in Note 36. Fellow subsidiaries Transactions between the Barclays Bank Group and other subsidiaries of the parent company also meet the definition of related party transactions. Associates, joint ventures and other entities The Barclays Bank Group provides banking services to its associates, joint ventures and the Barclays Bank Group pension funds (principally the UK Retirement Fund), providing loans, overdrafts, interest and non-interest bearing deposits and current accounts to these entities as well as other services. Barclays Bank Group companies also provide investment management and custodian services to the Barclays Bank Group pension schemes. All of these transactions are conducted on the same terms as third party transactions. Summarised financial information for the Barclays Bank Group’s investments in associates and joint ventures is set out in Note 38. Amounts included in the Barclays Bank Group’s financial statements, in aggregate, by category of related party entity are as follows:
ParentFellow
subsidiaries Associates Joint ventures Pension funds
£m £m £m £m £m
For the year ended and as at 31 December 2018
Total income (416) (3) - 7 3
Credit impairment and other provisions - - - - -
Operating expenses (122) (3,630) (1) (7) -
Total assets 727 1,091 12 1,288 3
Total liabilities 21,405 2,058 85 2 139
For the year ended and as at 31 December 2017
Total income 3 1 (20) 61 4
Credit impairment and other provisions - - 2 - -
Operating expenses (999) (4,009) - (23) -
Total assets 716 163 2 1,048 2
Total liabilities 24,205 1,015 75 2 162
Guarantees, pledges or commitments given in respect of these transactions in the year were £20m (2017: £27m) predominantly relating to associates. No guarantees, pledges or commitments were received in the year. Derivatives transacted on behalf of the pensions funds were £3m (2017: £3m).
home.barclays/annualreport Barclays Bank PLC Annual Report 263

Notes to the financial statements Other disclosure matters
Amounts included in Barclays Bank PLC’s financial statements, in aggregate, by category of related party entity are as follows:
Parent SubsidiariesFellow
subsidiaries Associates Joint ventures Pension funds
£m £m £m £m £m £m
As at 31 December 2018
Total assets 721 178,571 1,069 8 1,282 3
Total liabilities 21,405 122,546 2,000 85 (2) 139
As at 31 December 2017
Total assets 716 148,542 159 2 1,048 2
Total liabilities 24,204 123,795 969 75 2 162
It is the normal practice of Barclays Bank PLC to provide its subsidiaries with support and assistance by way of guarantees, indemnities, letters of comfort and commitments, as may be appropriate, with a view to enabling them to meet their obligations and to maintain their good standing, including commitment of capital and facilities. For dividends paid to Barclays PLC see Note 12. Key Management Personnel Key Management Personnel are defined as those persons having authority and responsibility for planning, directing and controlling the activities of Barclays Bank PLC (directly or indirectly) and comprise the Directors and Officers of Barclays Bank PLC, certain direct reports of the Chief Executive Officer and the heads of major business units and functions. There were no material related party transactions with entities under common directorship where a member of Key Management Personnel (or any connected person) is also a member of Key Management Personnel (or any connected person) of Barclays Bank PLC. The Barclays Bank Group provides banking services to Key Management Personnel and persons connected to them. Transactions during the year and the balances outstanding were as follows: Loans outstanding 2018 2017
£m £m
As at 1 January 4.8 9.2
Loans issued during the yeara 12.6 0.5
Loan repayments during the yearb (2.8) (4.9)
As at 31 December 14.6 4.8 Notes a Includes loans issued to existing Key Management Personnel and new or existing loans issued to newly appointed Key Management Personnel. b Includes loan repayments by existing Key Management Personnel and loans to former Key Management Personnel. No allowances for impairment were recognised in respect of loans to Key Management Personnel (or any connected person). Deposits outstanding 2018 2017
£m £m
As at 1 January 6.9 7.3
Deposits received during the yeara 17.4 25.7
Deposits repaid during the yearb (21.4) (26.1)
As at 31 December 2.9 6.9 Notes a Includes deposits received from existing Key Management Personnel and new or existing deposits received from newly appointed Key Management Personnel. b Includes deposits repaid by existing Key Management Personnel and deposits of former Key Management Personnel. Total commitments outstanding Total commitments outstanding refer to the total of any undrawn amounts on credit card and/or overdraft facilities provided to Key Management Personnel. Total commitments outstanding as at 31 December 2018 were £0.5m (2017: £0.3m). Loans to Directors and other Key Management Personnel (and persons connected to them), (a) were made in the ordinary course of business, (b) were generally made on substantially the same terms, including interest rates and collateral, as those prevailing at the same time for comparable transactions with other persons and (c) did not involve more than a normal risk of collectability or present other unfavourable features.
home.barclays/annualreport Barclays Bank PLC Annual Report 264

41 Related party transactions and Directors’ remuneration continued Remuneration of Key Management Personnel Total remuneration awarded to Key Management Personnel below represents the awards made to individuals that have been approved by the Board Remuneration Committee as part of the latest remuneration decisions. Costs recognised in the income statement reflect the accounting charge for the year included within operating expenses. The difference between the values awarded and the recognised income statement charge principally relates to the recognition of deferred costs for prior year awards. Figures are provided for the period that individuals met the definition of Key Management Personnel. 2018 2017
£m £m
Salaries and other short-term benefits 50.7 33.9
Pension costs 0.3 0.1
Other long-term benefits 12.6 18.4
Share-based payments 24.8 26.8
Employer social security charges on emoluments 8.5 9.6
Costs recognised for accounting purposes 96.9 88.8
Employer social security charges on emoluments (8.5) (9.6)
Other long-term benefits – difference between awards granted and costs recognised 4.5 (9.8)
Share-based payments – difference between awards granted and costs recognised (2.1) (11.7)
Total remuneration awarded 90.8 57.7 Disclosure required by the Companies Act 2006 The following information regarding the Barclays Bank PLC Board of Directors is presented in accordance with the Companies Act 2006:
2018 2017
£m £m
Aggregate emolumentsa 10.5 8.5
Amounts paid under LTIPsb 0.6 1.1
11.1 9.6 Notes a The aggregate emoluments include amounts paid for the 2018 year. In addition, deferred cash and share awards for 2018 with a total value at grant of £5.1m will be made to
Directors which will only vest subject to meeting certain conditions. b The figure above for ‘Amounts paid under LTIPs’ for 2018 relates to an LTIP award that was released to a Director in 2018. Dividend shares released on the award are excluded. Pension contributions totalling £11,848 were paid to defined contribution schemes on behalf of Directors (2017: £nil). There were no notional pension contributions to defined contribution schemes. As at 31 December 2018, there were no Directors accruing benefits under a defined benefit scheme (2017: nil). Of the figures in the table above, the amounts attributable to the highest paid Director are as follows: 2018 2017
£m £m
Aggregate emolumentsa 3.6 2.3
Amounts paid under LTIPs - 1.1
3.6 3.4 Note a The aggregate emoluments include amounts paid for the 2018 year. In addition, deferred cash and share awards for 2018 with a total value at grant of £4.1m will be made to the
highest paid Director which will only vest subject to meeting certain conditions. There were no actual pension contributions paid to defined contribution schemes (2017: £nil). There were no notional pension contributions to defined contribution schemes. Advances and credit to Directors and guarantees on behalf of Directors In accordance with Section 413 of the Companies Act 2006, the total amount of advances and credits made available in 2018 to persons who served as Directors during the year was £nil (2017: £0.2m). The total value of guarantees entered into on behalf of Directors during 2018 was £nil (2017: £nil).
home.barclays/annualreport Barclays Bank PLC Annual Report 265

Notes to the financial statements Other disclosure matters
42 Auditors’ remuneration Auditors’ remuneration is included within consultancy, legal and professional fees in administration and general expenses and comprises: 2018 2017 2016
£m £m £m
Audit of the Barclays Bank Group's annual accounts 14 11 14
Other services:
Audit of the Company's subsidiariesa 10 27 27
Other audit related feesb 6 8 4
Other servicesc 1 2 4
Total Auditors' remuneration 31 48 49
Notes a Comprises the fees for the statutory audit of the subsidiaries both inside and outside UK and fees for the work performed by associates of KPMG in respect of the consolidated
financial statements of the Company. b Comprises services in relation to statutory and regulatory filings. These include audit services for the review of the interim financial information under the Listing Rules of the UK
listing authority. c Includes consultation on tax matters, tax advice relating to transactions and other tax planning and advice in 2016. KPMG became the Barclays Group’s principal auditor in 2017. PwC was the principal auditor in 2016. The figures shown in the above table relate to fees paid to KPMG or PwC as principal auditor, of which the fees paid in relation to discontinued operations were £nil (KPMG 2017: £4m, PwC 2016: £12m).
home.barclays/annualreport Barclays Bank PLC Annual Report 266

43 Transition disclosures Impairment allowance reconciliations Reconciliation from IAS 39 to IFRS 9 - financial assets under IFRS 9 subject to an increase in impairment allowance The table below reconciles the closing impairment allowances for financial assets in accordance with IAS 39, and provisions for loan commitments and financial guarantee contracts in accordance with IAS 37, Provisions, Contingent Liabilities and Contingent Assets as at 31 December 2017, and the opening impairment allowances determined in accordance with IFRS 9 as at 1 January 2018. Reconciliation of impairment allowance and provisions
As at 31 December 2017 As at 1 January 2018
Impairment allowance under IAS 39 or
provisions under IAS 37Reclassification
impact
Additional IFRS 9
impairment allowance
Impairment allowance under
IFRS 9
Barclays Bank Group £m £m £m £m
Loans and advances at amortised cost and other assetsa 4,652 (52) 2,508 7,108Available for sale investments/financial assets at fair value through other comprehensive income
38 (38) 3 3
Total on-balance sheet 4,690 (90) 2,511 7,111Provision for undrawn contractually committed facilities and guarantee contracts
79 - 341 420
Total impairment and provision 4,769 (90) 2,852 7,531
Note a Includes impairment of £5m for cash collateral and settlement balances and £1m for other assets. The introduction of IFRS 9 increased the total impairment allowance held by Barclays Bank Group by £2.8bn, from £4.8bn as at 31 December
2017 to £7.5bn as at 1 January 2018, as a result of earlier recognition of impairment allowances. The reclassification impact is due to assets moving to a fair value through income statement treatment that do not have an impairment
allowance under IFRS 9.
home.barclays/annualreport Barclays Bank PLC Annual Report 267

Notes to the financial statements Other disclosure matters
43 Transition disclosures continued Balance sheet movement – impact of transition to IFRS 9 and IFRS 15 The table below presents the impact of the changes to balance sheet presentation and of the transition to IFRS 9 and IFRS 15 on Barclays Bank Group balance sheet showing separately the changes arising from reclassification and any associated remeasurement, and the impact of increased impairment.
As at 31 December
2017
As at 31 December
2017
As at 1 January
2018
Barclays Bank Group
IAS 39 measurement
category
IFRS 9 measurement
category
Published IAS 39 carrying
amount
Balance sheet presentation
changes
Revised IAS 39 carrying
amountIFRS 15 impact
IFRS 9 presentation
changes
IFRS 9 classification and
measurement
IFRS 9 impairment
change
IFRS 9 carrying amount
Assets £m £m £m £m £m £m £m £m
Cash and balances at central banks
Amortised cost
Amortised cost
171,036 - 171,036 - - - - 171,036
Items in the course of collection from other banks
Amortised cost
Amortised cost
2,153 (2,153) - - - - - -
Loans and advances to banks Amortised cost
Amortised cost
36,209 (36,209) - - - - - -
Loans and advances to customers
Amortised cost
Amortised cost
365,553 (365,553) - - - - - -
Cash collateral and settlement balances
Amortised cost
Amortised cost
- 77,172 77,172 - - (2,398) (5) 74,769
Loans and advances at amortised cost
Amortised cost
Amortised cost
- 324,590 324,590 - 5,109 (9,453) (2,502) 317,744
Reverse repurchase agreements and other similar secured lending
Amortised cost
Amortised cost
12,546 - 12,546 - - (11,949) - 597
Trading portfolio assets FVTPL FVTPL 113,755 - 113,755 - - 413 - 114,168Financial assets designated at fair value FVTPL FVTPL
116,282 (116,282) - - - - - -
Financial assets at fair value through the income statementa FVTPL FVTPL
- 116,282 116,282 - - 23,929 - 140,211
Derivative financial instruments FVTPL FVTPL
237,987 - 237,987 - - - - 237,987
Financial investments AFS - debt instruments FVOCI
52,067 - 52,067 - (50,932) (1,135) - -
Financial investments AFS - equity instruments FVOCI
1,787 - 1,787 - (1,422) (365) - -
Financial investments Amortised cost
Amortised cost
5,109 - 5,109 - (5,109) - - -
Financial assets at fair value through other comprehensive income AFS FVOCI
- - - - 52,354 934 - 53,288
Investments in associates and joint ventures N/A N/A
718 - 718 - - (19) - 699
Goodwill and intangible assets N/A N/A
4,885 - 4,885 - - - - 4,885
Property, plant and equipment N/A N/A
1,519 - 1,519 - - - - 1,519
Current tax assets N/A N/A 376 - 376 - - - - 376
Deferred tax assets N/A N/A 3,352 - 3,352 (22) - - 649 3,979
Retirement benefit assets N/A N/A 966 - 966 - - - - 966Prepayments, accrued income and other assets
Amortised cost
Amortised cost
1,850 (1,850) - - - - - -
Other assets Amortised cost
Amortised cost
- 4,003 4,003 89 - 28 (1) 4,119
Assets included in disposal groups classified as held for sale N/A N/A
1,193 - 1,193 - - - - 1,193
Total assets 1,129,343 - 1,129,343 67 - (15) (1,859) 1,127,536
Note a Comprised of mandatory fair value assets of £130.2bn and designated fair value assets of £10.0bn.
home.barclays/annualreport Barclays Bank PLC Annual Report 268

As at 31 December
2017
As at 31 December
2017
As at 1 January
2018
Barclays Bank Group
IAS 39 measurement
category
IFRS 9measurement
category
Published IAS 39
carrying amount
Balance sheet
presentation changes
Revised IAS 39 carrying
amount
IFRS 15
impact
IFRS 9 presentation
changes
IFRS 9 classification
and measurement
IFRS 9 impairment
change
IFRS 9 carrying amount
Liabilities £m £m £m £m £m £m £m £m
Deposits from banks Amortised cost
Amortised cost
37,906 (37,906) - - - - - -
Deposits at amortised cost Amortised cost
Amortised cost
- 399,189 399,189 - - (18,860) - 380,329
Items in the course of collection due to other banks
Amortised cost
Amortised cost
446 (446) - - - - - -
Customer accounts Amortised cost
Amortised cost
429,426 (429,426) - - - - - -
Cash collateral and settlement balances
Amortised cost
Amortised cost
- 68,143 68,143 - - (2,218) - 65,925
Repurchase agreements and other similar secured borrowing
Amortised cost
Amortised cost
40,338 - 40,338 - - (25,285) - 15,053
Debt securities in issue Amortised cost
Amortised cost
69,386 - 69,386 - - - - 69,386
Subordinated liabilities Amortised cost
Amortised cost
24,193 - 24,193 - - - - 24,193
Trading portfolio liabilities FVTPL FVTPL 37,352 - 37,352 - - - - 37,352Financial liabilities designated at fair value
FVTPL FVTPL 173,718 - 173,718 - - 46,365 - 220,083
Derivative financial instruments FVTPL FVTPL 238,345 - 238,345 - - - - 238,345Current tax liabilities N/A N/A 494 - 494 - - - - 494Deferred tax liabilities N/A N/A - - - - - - - -Retirement benefit liabilities N/A N/A 287 - 287 - - - - 287Accruals, deferred income and other liabilities
Amortised cost
Amortised cost
8,416 (8,416) - - - - - -
Other liabilities Amortised cost
Amortised cost
- 8,862 8,862 - - - - 8,862
Provisions N/A N/A 3,302 - 3,302 - - - 341 3,643Total liabilities 1,063,609 - 1,063,609 - - 2 341 1,063,952
Equity
Called up share capital and share premium
N/A N/A 14,453 - 14,453 - - - - 14,453
Other reserves N/A N/A 3,808 - 3,808 - - (139) 3 3,672Retained earnings N/A N/A 38,490 - 38,490 67 - 122 (2,203) 36,476Other equity instruments N/A N/A 8,982 - 8,982 - - - - 8,982Total equity excluding non-controlling interests
N/A N/A 65,733 - 65,733 67 - (17) (2,200) 63,583
Non-controlling interests N/A N/A 1 - 1 - - - - 1Total equity 65,734 - 65,734 67 - (17) (2,200) 63,584
Total liabilities and equity 1,129,343 - 1,129,343 67 - (15) (1,859) 1,127,536
home.barclays/annualreport Barclays Bank PLC Annual Report 269

Notes to the financial statements Other disclosure matters
43 Transition disclosures continued Balance sheet and IFRS 9 presentation changes The following voluntary changes in presentation have been made as a result of the review of accounting presentation following the adoption of IFRS 9, and is expected to provide more relevant information to the users of the financial statements. These presentational changes have no effect on the measurement of these items and therefore had no impact on retained earnings or profit for any period. The effect of these presentational changes on transition are noted below: ‘Items in the course of collection from other banks’ and ‘prepayments, accrued income and other assets’ are reported in ‘other assets’. Equally,
‘items in the course of collection due to other banks’ and ‘accruals, deferred income and other liabilities’ are reported in ‘other liabilities’ ‘Loans and advances to banks’ and ‘loans and advances to customers’ have been disaggregated and are now reported in ‘loans and advances at
amortised cost’ and ‘cash collateral and settlement balances’ ‘Deposits from banks’ and ‘customer accounts’ have been disaggregated and are now reported in ‘deposits at amortised cost’ and ‘cash collateral
and settlement balances’ ‘Financial assets designated at fair value’ are now reported within ‘financial assets at fair value through the income statement’ The majority of available for sale assets which were previously reported in ‘financial investments’ are now reported in ‘financial assets at fair value
through other comprehensive income’ Held to maturity assets which were previously reported in ‘financial investments’ are now reported in ‘loans and advances at amortised cost’. IFRS 15 impact On adoption of IFRS 15, Barclays Bank Group changed its accounting treatment in relation to certain costs incurred in obtaining contracts with credit card customers. The costs of acquiring such contracts had previously been recognised as operating expenses when they were incurred. The adoption of IFRS 15 has resulted in the costs being capitalised as a cost to obtain an asset and recognised within ‘other assets’ on the balance sheet. The asset will be amortised over the expected life of the customer relationship, with the corresponding expense recognised in the income statement. The cumulative effect of the change as of 1 January 2018 was an increase to retained earnings of £67m and the recognition of an asset of £89m. There were no other material changes to fee recognition from the adoption of IFRS 15. IFRS 9 classification and measurement This column represents the changes to the balance sheet from classification and measurement. The net effect is a decrease in shareholders’ equity of £17m, with no significant offsetting movements. The classification changes include the transfer of certain Barclays International Prime Services and Equities positions from an amortised cost to a fair value approach. There are no other changes in measurement category.
IFRS 9 impairment change Additional impairment from the adoption of IFRS 9 is shown in the impairment change column. The increase in impairment results in the recognition of a deferred tax asset. The post-tax impact is a reduction in shareholders’ equity of £2.2bn. Impairment allowance under IFRS 9 considers both the drawn and the undrawn counterparty exposure. For retail portfolios, the total impairment allowance is allocated to the drawn exposure to the extent that the allowance does not exceed the exposure. Any excess is reported on the liability side of the balance sheet as a provision. For wholesale portfolios the impairment allowance on the undrawn exposure is reported on the liability side of the balance sheet as a provision. Impact of IFRS 9 per financial statement line item The narrative below provides further granularity on the impact of changes to the balance sheet from the transition to IFRS 9 and IFRS 15 on Barclays Bank Group’s balance sheet as presented in the table on page 147. The analysis shows transfers between balance sheet lines arising from reclassification and any associated remeasurement, and the impact of increased impairment. Further details are provided for balance sheet lines with multiple impacts. The classification and measurement changes outlined in the following tables are consistent between Barclays Bank Group and Barclays Bank PLC. Assets Cash collateral and settlement balances – measured on an amortised cost basis Transfer out: Balances of £2,398m are reclassified to ‘Financial assets at fair value through the income statement' as a result of the assessment of the business model. Balances are reclassified from amortised cost to fair value through profit and loss as the business model is classified as ‘Other’ rather than 'Hold to Collect' as the portfolio is risk managed on a fair value basis. Expected credit losses have decreased the balances by £5m.
home.barclays/annualreport Barclays Bank PLC Annual Report 270

43 Transition disclosures continued Loans and advances at amortised cost Transfer in: Held to maturity assets of £5,109m which were previously reported in ‘Financial Investments’ are reported in this balance sheet line. 'Financial investments’ (available for sale) balances of £653m, 'Financial assets designated at fair value' balances of £485m, and 'Trading portfolio assets' of £73m are reclassified to this balance sheet line following the assessment of the business model which is classified as 'Hold to Collect' and meets the SPPI test. There has been a remeasurement impact of £29m due to reclassification to an amortised cost line from 'Financial assets designated at fair value'. Transfer out: Balances of £9,266m are reclassified to 'Financial assets mandatory at fair value', balances of £478m moved to 'Trading portfolio assets', and balances of £15m reclassified to 'Financial assets designated at fair value' as a result of the assessment of the business model which is classified as ‘Other’ rather than 'Hold to Collect'. The balances are subsequently measured on a fair value basis rather than amortised cost. In addition, balances of £934m are reclassified to 'Financial assets at fair value through other comprehensive income’ as a result of the assessment of the business model which is classified as 'Hold to Collect and Sell' and meets the SPPI test. Expected credit losses have decreased the balance by £2,502m.
As at 31
December 2017
As at 1 January 2018
Revised IAS 39 carrying
amountIFRS 15 impact
IFRS 9 presentation
changesIFRS 9
classificationIFRS 9
measurement
IFRS 9 impairment
change
IFRS 9 carrying amount
Barclays Bank Group £m £m £m £m £m £m £m
Loans and advances at amortised cost
Opening balance 324,590 324,590
Transfer in:
– From financial investments (held to maturity) - - 5,109 - - - 5,109
– From financial investments (available for sale) - - - 653 - - 653
– From financial assets designated at fair value - - - 485 29 - 514
– From trading portfolio assets - - - 73 - - 73
Transfer out: -
– To financial assets mandatory at fair value - - - (9,266) - - (9,266)– To financial assets at fair value through other comprehensive income - - - (934) - - (934)
– To trading portfolio assets - - - (478) - - (478)
– To financial assets designated at fair value - - - (15) - - (15)
Increase in expected credit losses - - - - - (2,502) (2,502)
Total loans and advances at amortised cost 324,590 - 5,109 (9,482) 29 (2,502) 317,744
Reverse repurchase agreements and other similar secured lending – measured on an amortised cost basis Transfer out: Balances of £11,949m are reclassified to ‘Financial assets at fair value through the income statement' as a result of the assessment of the business model which is classified as ‘Other’ rather than 'Hold to Collect'. The balances are subsequently measured on a fair value basis rather than amortised cost. Trading portfolio assets – measured on a fair value basis Transfer in: Balances from 'Loans and advances at amortised cost' of £478m, ‘Financial investments’ of £10m, and 'Financial assets mandatory at fair value' of £9m are reclassified to this balance sheet line as a result of assessment of business model in accordance with IFRS 9. There has been a remeasurement impact of £11m due to reclassification from an amortised cost basis. Transfers out: Balances of £73m are reclassified to 'Loans and advances at amortised cost' as a result of assessment of business model which is classified as 'hold to collect' and meets the SPPI test.
home.barclays/annualreport Barclays Bank PLC Annual Report 271

Notes to the financial statements Other disclosure matters
43 Transition disclosures continued Financial assets at fair value through the income statement Balances of £105,844m are moved to Financial assets mandatory at fair value’ for presentational purposes and in accordance with IFRS 9. Transfer in: Balance of £15m from 'Loans and advances at amortised cost' are elected to ‘Financial assets designated at fair value'. ‘Reverse repurchase agreements and other similar secured lending’ of £11,949m, 'Loans and advances at amortised cost' of £9,266m and ‘Cash collateral and settlement balances’ of £2,398m are reclassified to this balance sheet line as a result of the assessment of business model which is classified as 'Other' rather than ‘Hold to Collect’. The balances are subsequently measured on a fair value basis rather than amortised cost. There has been a remeasurement impact of £14m due to reclassification from an amortised cost basis. Balances of £838m are reclassified from ‘Financial investments (available for sale)’ as a result of the assessment of the business model which is classified as ‘Other’ rather than 'Hold to Collect and Sell’. The balances are subsequently measured on a fair value basis rather than amortised cost. Transfer out: Balances of £485m are reclassified to 'Loans and advances at amortised cost' as a result of the assessment of the business model which is classified as 'Hold to Collect' and meets the SPPI test. In addition, balances of £28m and £9m are reclassified to ‘Other assets’ and ‘Trading portfolio assets’ as a result of the assessment of the business model in accordance with IFRS 9.
As at 31
December 2017
As at 1 January 2018
Revised IAS 39 carrying
amountIFRS 15 impact
IFRS 9 presentation
changesIFRS 9
classificationIFRS 9
measurement
IFRS 9 impairment
change
IFRS 9 carrying amount
Barclays Bank Group £m £m £m £m £m £m £m
Financial assets at fair value through the income statement
Financial assets designated at fair value
Opening balance 116,282 116,282
Transfer in:
– From loans and advances at amortised cost - - - 15 - - 15
Transfer out:
– To financial assets mandatory at fair value - - (105,844) - - - (105,844)
– To loans and advances at amortised cost - - - (485) - - (485)
Financial assets mandatory at fair value
Transfer in:
– From financial assets designated at fair value - - 105,844 - - - 105,844
– From reverse repurchase agreements - - - 11,949 - - 11,949
– From loans and advances at amortised cost - - - 9,266 (14) - 9,252
– From cash collateral and settlement balances - - - 2,398 - - 2,398– From financial investments (available for sale) - - - 838 - - 838
Transfer out:
– To other assets - - - (28) - - (28)
– To trading portfolio assets - - - (9) - - (9)Total financial assets at fair value through the income statement 116,282 - - 23,943 (14) - 140,211
home.barclays/annualreport Barclays Bank PLC Annual Report 272

43 Transition disclosures continued Financial investments Transfer out: The Barclays Bank Group has applied the fair value through other comprehensive income option under IFRS 9 for the value of £52,354m as a result of the assessment of the business model with balances moving to ‘Financial assets at fair value through other comprehensive income’. Balances of £838m are reclassified to 'Financial assets at fair value through the income statement' and balances of £9m reclassified to ‘Trading portfolio assets’ as a result of the assessment of the business model which is classified as ‘Other’ rather than 'Hold to Collect'. Balances of £653m are reclassified to 'Loans and advances at amortised cost' as a result of the assessment of the business model which is classified as 'Hold to Collect' and meets the SPPI test. From a presentational basis, Held to maturity assets of £5,109m are now reported in ‘Loans and advances at amortised cost’. As at 31
December 2017
As at 1 January 2018
Revised IAS 39 carrying
amountIFRS 15 impact
IFRS 9 presentation
changesIFRS 9
classificationIFRS 9
measurement
IFRS 9 impairment
change
IFRS 9 carrying amount
Barclays Bank Group £m £m £m £m £m £m £m
Financial investments
Available for sale (measured at fair value)
Opening balance 53,854 53,854
Transfer out: – To financial assets at fair value through other comprehensive income - - (52,354) - - - (52,354)– To other financial assets at fair value through the income statement - - - (838) - - (838)
– To trading portfolio assets - - - (9) - - (9)
– To loans and advances at amortised cost - - - (653) - - (653)
Held to maturity (measured at amortised cost)
Opening balance 5,109 5,109
Transfer out:
– To loans and advances at amortised cost - - (5,109) - - - (5,109)
Total financial investments 58,963 - (57,463) (1,500) - - -
Financial assets at fair value through other comprehensive income Transfer in: As above, Barclays has applied the fair value through other comprehensive income option under IFRS 9 for the value of £52,354m. Balances of £934m are reclassified from 'Loans and advances at amortised cost' as a result of the assessment of the business model which is classified as 'Hold to Collect and Sell’ and meets the SPPI test. Investments in associates and joint ventures The adoption of IFRS 9 on associates and joint ventures results in a lower Barclays Bank Group share of profit and loss, thereby decreasing the investment by £19m. Deferred tax assets The balance has increased by £627m due to the tax impact of expected credit losses of £649m, offset by £22m due to the impact of IFRS 15. Other assets Transfer in: Balances of £28m reclassified from ‘Financial assets at fair value through the income statement' as a result of the assessment of the business model which is classified as 'Hold to Collect' and meets the SPPI test. In addition, the balance increased by £89m due to the impact of IFRS 15. Expected credit losses have decreased the balance by £1m.
home.barclays/annualreport Barclays Bank PLC Annual Report 273

Notes to the financial statements Other disclosure matters
43 Transition disclosures continued Liabilities Deposits at amortised cost Transfer out: Balances of £18,860m are reclassified to 'Financial liabilities designated at fair value' as a result of trades that are linked to assets for accounting symmetry. Cash collateral and settlement balances – measured on an amortised cost basis Transfer out: Balances of £2,218m are reclassified to 'Financial liabilities designated at fair value' as a result of trades that are linked to assets for accounting symmetry. Repurchase agreements and other similar secured borrowing – measured on an amortised cost basis Transfer out: Balances of £25,285m are reclassified to 'Financial liabilities designated at fair value' as a result of trades that are linked to assets for accounting symmetry. Financial liabilities designated at fair value Transfer in: 'Repurchase agreements and other similar secured borrowing' balances of £25,285m, 'Deposits at amortised cost' balances of £18,860m, and 'Cash collateral and settlement balances' of £2,218m reclassified to this balance sheet line as a result of trades that are linked to assets for accounting symmetry. There has been a remeasurement impact of £2m due to reclassification from 'Repurchase agreements and other similar secured borrowing' on an amortised cost basis.
As at 31
December 2017
As at 1 January 2018
Revised IAS 39 carrying
amountIFRS 15 impact
IFRS 9 presentation
changesIFRS 9
classificationIFRS 9
measurement
IFRS 9 impairment
change
IFRS 9 carrying amount
Barclays Bank Group £m £m £m £m £m £m
Financial liabilities designated at fair value
Opening balance 173,718 173,718
Transfers in: - From repurchase agreements and other similar secured borrowing - - - 25,285 2 - 25,287
- From deposits at amortised cost - - - 18,860 - - 18,860
- From cash collateral and settlement balances - - - 2,218 - - 2,218Total financial liabilities designated at fair value 173,718 - - 46,363 2 - 220,083
Provisions The balance has increased by £341m due to expected credit losses on off balance sheet positions.
home.barclays/annualreport Barclays Bank PLC Annual Report 274

43 Transition disclosures continued Equity The adoption of IFRS 9 results in a credit moving from the fair value through other comprehensive income reserve (formerly available for sale reserve) to retained earnings to reflect the cumulative impairment recognised in profit or loss in accordance with IFRS 9 (net of impairment losses previously recognised in profit or loss under IAS 39). The amount transferred from 'Other reserves' to 'Retained earnings' was £139m. In addition, a £3m increase relates to expected credit losses on ‘Fair value through other comprehensive income’. The cumulative remeasurement due to reclassification was £17m. The cumulative expected credit losses (post-tax) recognised in ‘Retained earnings’ was £2,203m. In addition, the balance increased by £67m due to the impact of IFRS 15. As at 31
December 2017
As at 1 January 2018
Revised IAS 39 carrying
amountIFRS 15 impact
IFRS 9 presentation
changesIFRS 9
classificationIFRS 9
measurement
IFRS 9 impairment
change
IFRS 9 carrying amount
Barclays Bank Group £m £m £m £m £m £m £m
Other reserves
Opening balance 3,808 3,808
Transfers out:
- To retained earnings - - - (139) - - (139)Increases in expected credit losses - - - - - 3 3
Total other reserves 3,808 - - (139) - 3 3,672
As at 31
December 2017
As at 1 January 2018
Revised IAS 39 carrying
amountIFRS 15 impact
IFRS 9 presentation
changesIFRS 9
classificationIFRS 9
measurement
IFRS 9 impairment
change
IFRS 9 carrying amount
Barclays Bank Group £m £m £m £m £m £m
Retained earnings
Opening balance 38,490 38,490
Increases/(decreases):
From other reserves - - - 139 - - 139
Remeasurement due to reclassifications - - - (17) - - (17)
Increases due to IFRS 15 - 67 - - - - 67
Impairment (after tax) - - - - - (2,203) (2,203)
Total retained earnings 38,490 67 - 122 - (2,203) 36,476
home.barclays/annualreport Barclays Bank PLC Annual Report 275

Notes to the financial statements Other disclosure matters
43 Transition disclosures continued Reclassification to amortised cost The following table shows the effects of the reclassification of financial assets and financial liabilities from IAS 39 categories into the amortised cost category under IFRS 9. The table shows the fair value gains or losses that would have been recognised had these balances not been reclassified to amortised cost.
Barclays Bank Group Total
As at 31 December 2018 £m
From available for sale financial assets under IAS 39 Fair value as at 31 December 2018 490
Fair value loss that would have been recognised for the year ended 31 December 2018 in other comprehensive income if the financial assets had not been reclassified
(1)
From financial assets at fair value through the income statement under IAS 39
Fair value as at 31 December 2018 86
Fair value gain that would have been recognised for the year ended 31 December 2018 in profit or loss if the financial liabilities had not been reclassified
1
Effective interest rate determined on the date of initial application 1%
Interest income recognised for the year ended 31 December 2018 1
The balance as at 31 December 2018 of £490m reflects a decrease since transition due to disposals of assets of £162m during the year and the
fair value decrease of £1m (1 January 2018: £653m). The majority of the balance is related to the Municipals portfolio that contains highly rated floating rate bonds measured at par with no fair value impact. The fair value loss that would have been recognised is £1m related to collateralised mortgage obligations. The balance as at 31 December 2018 of £86m is mainly related to the ESHLA portfolio and the fair value gain that would have been recognised
for the period was £1m (1 January 2018: £85m).
Due to the implementation of structural reform in the UK, on 1 April 2018, the UK banking business was transferred from Barclays Bank PLC to Barclays Bank UK PLC, a separate subsidiary of Barclays PLC. Further details on the discontinued operations can be found in the Movement in gross exposures and impairment allowance including provisions for loan commitments and financial guarantees table within the Credit Risk Section.
home.barclays/annualreport Barclays Bank PLC Annual Report 276

Reconciliation of impairment allowance and provisions
As at 31 December 2017 As at 1 January 2018
Impairment allowance under IAS 39 or
provisions under IAS 37Reclassification
impact
Additional IFRS 9
impairment allowance
Impairment allowance under
IFRS 9
Barclays Bank PLC £m £m £m £m
Loans and advances at amortised cost and other assetsa 3,249 (16) 1,668 4,901Available for sale investments/financial assets at fair value through other comprehensive income
16 (16) 3 3
Total on-balance sheet 3,265 (32) 1,671 4,904Provision for undrawn contractually committed facilities and guarantee contracts
79 - 274 353
Total impairment and provision 3,344 (32) 1,945 5,257
Note a Includes impairment of £4m for cash collateral and settlement balances. The introduction of IFRS 9 increased the total impairment allowance held by Barclays Bank PLC by £1.9bn, from £3.3bn as at 31 December 2017
to £5.3bn as at 1 January 2018, as a result of earlier recognition of impairment allowances. The reclassification impact is due to assets moving to a fair value through income statement treatment that do not have an impairment
allowance under IFRS 9.
home.barclays/annualreport Barclays Bank PLC Annual Report 277

Notes to the financial statements Other disclosure matters
43 Transition disclosures continued Balance sheet movement – impact of transition to IFRS 9 and IFRS 15 The table below presents the impact of the changes to balance sheet presentation and of the transition to IFRS 9 and IFRS 15 on Barclays Bank PLC balance sheet showing separately the changes arising from reclassification and any associated remeasurement, and the impact of increased impairment.
As at 31 December
2017
As at 31 December
2017
As at 1 January
2018
Barclays Bank PLC Published IAS 39 carrying amount
Balance sheet presentation
changes
Published IAS 39
carrying amount
Balance sheet
presentation changes
Revised IAS 39 carrying
amount
IFRS 9 presentation
changes
IFRS 9 classification
and measurement
IFRS 9 impairment
change
IFRS 9 carrying amount
Assets £m £m £m £m £m £m £m
Cash and balances at central banks Amortised cost
Amortised cost
165,713 - 165,713 - - - 165,713
Items in the course of collection from other banks
Amortised cost
Amortised cost
1,011 (1,011) - - - - -
Loans and advances to banks Amortised cost
Amortised cost
37,255 (37,255) - - - - -
Loans and advances to customers Amortised cost
Amortised cost
388,960 (388,960) - - - - -
Cash collateral and settlement balances
Amortised cost
Amortised cost
- 70,960 70,960 - (2,269) (4) 68,687
Loans and advances at amortised cost
Amortised cost
Amortised cost
- 355,255 355,255 5,109 (8,672) (1,664) 350,028
Reverse repurchase agreements and other similar secured lending
Amortised cost
Amortised cost
22,964 - 22,964 - (14,902) - 8,062
Trading portfolio assets FVTPL FVTPL 79,836 - 79,836 - 395 - 80,231Financial assets designated at fair value FVTPL FVTPL
117,182 (117,182) - - - - -
Financial assets at fair value through the income statementa FVTPL FVTPL
- 117,182 117,182 - 25,768 - 142,950
Derivative financial instruments FVTPL FVTPL 232,288 - 232,288 - - - 232,288
Financial investments AFS - debt instruments FVOCI
49,197 - 49,197 (49,087) (110) - -
Financial investments AFS - equity instruments FVOCI
277 - 277 (60) (217) - -
Financial investments Amortised cost
Amortised cost
5,109 - 5,109 (5,109) - - -
Financial assets at fair value through other comprehensive income AFS FVOCI
- - - 49,147 (1) - 49,146
Investments in associates and joint ventures N/A N/A
165 - 165 - - - 165
Investment in subsidiaries N/A N/A 14,614 - 14,614 - - - 14,614
Goodwill and intangible assets N/A N/A 3,498 - 3,498 - - - 3,498
Property, plant and equipment N/A N/A 565 - 565 - - - 565
Current tax assets N/A N/A 115 - 115 - - - 115
Deferred tax assets N/A N/A 1,863 - 1,863 - - 411 2,274
Retirement benefit assets N/A N/A 959 - 959 - - - 959Prepayments, accrued income and other assets
Amortised cost
Amortised cost
3,429 (3,429) - - - - -
Other assets Amortised cost
Amortised cost
- 4,440 4,440 - - - 4,440
Assets included in disposal groups classified as held for sale N/A N/A
- - - - - - -
Total assets 1,125,000 - 1,125,000 - (8) (1,257) 1,123,735
home.barclays/annualreport Barclays Bank PLC Annual Report 278

As at 31 December
2017
As at 31 December
2017
As at 1 January
2018
Barclays Bank PLC
IAS 39 measurement
category
IFRS 9measurement
category
Published IAS 39
carrying amount
Balance sheet
presentation changes
Revised IAS 39 carrying
amount
IFRS 9 presentation
changes
IFRS 9 classification
and measurement
IFRS 9 impairment
change
IFRS 9 carrying amount
Liabilities £m £m £m £m £m £m £m
Deposits from banks Amortised cost
Amortised cost
38,364 (38,364) - - - - -
Deposits at amortised cost Amortised cost
Amortised cost
- 425,902 425,902 - (8,971) - 416,931
Items in the course of collection due to other banks
Amortised cost
Amortised cost
446 (446) - - - - -
Customer accounts Amortised cost
Amortised cost
448,079 (448,079) - - - - -
Cash collateral and settlement balances
Amortised cost
Amortised cost
- 60,541 60,541 - (331) - 60,210
Repurchase agreements and other similar secured borrowing
Amortised cost
Amortised cost
49,883 - 49,883 - (25,051) - 24,832
Debt securities in issue Amortised cost
Amortised cost
55,874 - 55,874 - - - 55,874
Subordinated liabilities Amortised cost
Amortised cost
24,203 - 24,203 - - - 24,203
Trading portfolio liabilities FVTPL FVTPL 41,542 - 41,542 - - - 41,542Financial liabilities designated at fair value
FVTPL FVTPL 169,044 - 169,044 - 34,351 - 203,395
Derivative financial instruments FVTPL FVTPL 229,227 - 229,227 - - - 229,227Current tax liabilities N/A N/A 242 - 242 - - - 242Deferred tax liabilities N/A N/A - - - - - - -Retirement benefit liabilities N/A N/A 149 - 149 - - - 149Accruals, deferred income and other liabilities
Amortised cost
Amortised cost
6,885 (6,885) - - - - -
Other liabilities Amortised cost
Amortised cost
- 7,331 7,331 - - - 7,331
Provisions N/A N/A 3,028 - 3,028 - - 274 3,302Total liabilities 1,066,966 - 1,066,966 - (2) 274 1,067,238
Equity Called up share capital and share premium
N/A N/A 14,453 - 14,453 - - - 14,453
Other reserves N/A N/A 1,093 - 1,093 - (115) 3 981Retained earnings N/A N/A 33,506 - 33,506 - 109 (1,534) 32,081Other equity instruments N/A N/A 8,982 - 8,982 - - - 8,982Total equity excluding non-controlling interests
N/A N/A 58,034 - 58,034 - (6) (1,531) 56,497
Non-controlling interests N/A N/A - - - - - - -Total equity 58,034 - 58,034 - (6) (1,531) 56,497
Total liabilities and equity 1,125,000 - 1,125,000 - (8) (1,257) 1,123,735
home.barclays/annualreport Barclays Bank PLC Annual Report 279

Notes to the financial statements Other disclosure matters
43 Transition disclosures continued Reclassification to amortised cost The following table shows the effects of the reclassification of financial assets and financial liabilities from IAS 39 categories into the amortised cost category under IFRS 9. The table shows the fair value gains or losses that would have been recognised had these balances not been reclassified to amortised cost. Barclays Bank PLC Total
As at 31 December 2018 £m
From available for sale financial assets under IAS 39 Fair value as at 31 December 2018 10
Fair value change that would have been recognised for the year ended 31 December 2018 in other comprehensive income if the financial assets had not been reclassified
-
From financial assets at fair value through the income statement IAS 39
Fair value as at 31 December 2018 86
Fair value gain that would have been recognised for the year ended 31 December 2018 in profit or loss if the financial liabilities had not been reclassified
1
Effective interest rate determined on the date of initial application 1%
Interest income recognised for the year ended 31 December 2018 1 The balance as at 31 December 2018 of £10m reflects a decrease since transition due to disposals of assets of £160m during the year (1 January
2018: £170m). The balance as at 31 December 2018 of £86m is mainly related to the ESHLA portfolio and the fair value gain that would have been recognised
for the period was £1m (1 January 2018: £85m).
home.barclays/annualreport Barclays Bank PLC Annual Report 280

44 Related undertakings The Barclays Bank Group’s corporate structure consists of a number of related undertakings, comprising subsidiaries, joint ventures, associates and significant other interests. A full list of these undertakings, the country of incorporation and the ownership of each share class is set out below. The information is provided as at 31 December 2018. The entities are grouped by the countries in which they are incorporated. The profits earned by the activities of these entities are in some cases taxed in countries other than the country of incorporation. Barclays’2018 Country Snapshot provides details of where the Group carries on its business, where its profits are subject to tax and the taxes it pays in each country it operates in. Wholly owned subsidiaries Unless otherwise stated the undertakings below are wholly owned and consolidated by Barclays and the share capital disclosed comprises ordinary and/or common shares, 100% of the nominal value of which is held by Barclays Bank Group subsidiaries.
Notes A Directly held by Barclays Bank PLC Class F Preference Shares, Class H 2012 B Partnership Interest Ordinary Shares, Class H 2012 Preference C Membership Interest Shares, Class H Ordinary Shares, Class H D Trust Interest Preference Shares, Class I Preference Shares, E Guarantor Class J Ordinary Shares, Class J Preference F Preference Shares Shares G A Preference Shares W First Class Common Shares, Second Class H B Preference Shares Common Shares I Ordinary/Common Shares in addition to other X PEF Carry Shares shares Y EUR Tracker 1 Shares, GBP Tracker 1 J A Ordinary Shares Shares, USD Tracker 1 Shares, USD Tracker K B Ordinary Shares 2 Shares, USD Tracker 3 shares L C Ordinary Shares Z Not Consolidated (see Note37 Structured entities) M F Ordinary Shares AA USD Linked Ordinary Shares N W Ordinary Shares BB Redeemable Class B Shares O Redeemable Preference Shares CC A Ordinary, Y Ordinary, Z Ordinary P Non-Redeemable Ordinary Class A & B DD Nominal Shares Q Core Shares and Insurance (Classified) Shares EE Redeemable Class A & Class B Preference Shares R B, C, D, E (94.36%), F (94.36%), G (94.36%), H FF Class B Redeemable Preference Shares (94.36%), I (94.36%), J (95.23%) and K Class GG Class A1 Ordinary Shares, Class A2 Ordinary Shares Shares S A Unit Shares, B Unit Shares HH Class A Unit Shares T Non-Redeemable Ordinary Shares II A Shares – Tranche I, Premium – Tranche I, C U Preferred Shares Class A,B,C and D Shares – Tranche II, Premium – Tranche II V Class A Ordinary Shares, Class A Preference JJ Capital Contribution Shares Shares, Class B Ordinary Shares, Class C KK Registered Address not in country of incorporation Ordinary Shares, Class C Preference Shares, Class D Ordinary Shares, Class D Preference Shares, Class E Ordinary Shares, Class E Preference Shares, Class F Ordinary Shares,
Wholly owned subsidiaries Note Wholly owned subsidiaries Note Wholly owned subsidiaries Note United Kingdom CP Propco 1 Limited - Hill House, 1 Little New Street, London, - 1 Churchill Place, London, E14 5HP CP Propco 2 Limited EC4A 3TR Aequor Investments Limited CP Topco Limited J, K Barclays Mercantile Limited (In Liquidation) A Ardencroft Investments Limited A DMW Realty Limited A Barclays Nominees (Branches) Limited (In A B D & B Investments Limited Dorset Home Loans Limited A Liquidation) B.P.B. (Holdings) Limited A Durlacher Nominees Limited A Barclays Nominees (K.W.S.) Limited (In A Barafor Limited Eagle Financial and Leasing Services (UK) A Liquidation) Barclay Leasing Limited Limited Barclays Stockbrokers Limited (In Liquidation) A Barclays (Barley) Limited J,K Equity Value Investments No.1 Limited A Barclays USD Funding LLP (In Liquidation) B Barclays Aldersgate Investments Limited A Equity Value Investments No.2 Limited BMBF (No.3) Limited (In Liquidation) Barclays Capital Asia Holdings Limited A Finpart Nominees Limited A BMBF (No.6) Limited (In Liquidation) Barclays Capital Finance Limited A Foltus Investments Limited BMBF (No.9) Limited (In Liquidation) Barclays Capital Japan Securities Holdings Hawkins Funding Limited A Gerrard Financial Planning Limited (In Liquidation) Limited Heraldglen Limited G, H, I Gerrard Management Services Limited (In A Barclays Capital Nominees (No.2) Limited J.V. Estates Limited Liquidation) Barclays Capital Nominees (No.3) Limited A Kirsche Investments Limited A Gerrard Nominees Limited (In Liquidation) Barclays Capital Nominees Limited A Long Island Assets Limited Greig, Middleton Nominees Limited (In Barclays Capital Principal Investments Limited A Maloney Investments Limited A Liquidation) Barclays Capital Securities Client Nominee Limited A Menlo Investments Limited A Lombard Street Nominees Limited (In Barclays Capital Securities Limited A,F, I,O Mercantile Credit Company Limited A Liquidation) Barclays CCP Funding LLP A, B Mercantile Leasing Company (No.132) A - 5 The North Colonnade, Canary Wharf, Barclays Directors Limited A Limited London, E14 4BB Barclays Executive Schemes Trustees Limited A MK Opportunities LP B Leonis Investments LLP A, B Barclays Funds Investments Limited A Murray House Investment Management A Preferred Liquidity Limited Partnership B Barclays Group Holdings Limited A Limited - 1 New Street Square, London, EC4A 3HQ Barclays Investment Management Limited A Naxos Investments Limited A Keepier Investments (In Liquidation) Barclays Leasing (No.9) Limited Northwharf Nominees Limited A - Logic House, Waterfront Business Park, Barclays Long Island Limited A Real Estate Participation Management Fleet Road, Fleet, GU1 3SB Barclays Marlist Limited A Limited The Logic Group Enterprises Limited Barclays Mercantile Business Finance Limited A Real Estate Participation Services Limited The Logic Group Holdings Limited A, J Barclays Nominees (George Yard) Limited A Relative Value Investments UK Limited B - 9, allée Scheffer, L-2520 Barclays Pension Funds Trustees Limited A Liability Partnership Barclays Claudas Investments Partnership B, KK Barclays Private Bank Relative Value Trading Limited Barclays Pelleas Investments Limited Partnership B, KK Barclays Services (Japan) Limited A Roder Investments No. 1 Limited A, I, Y Blossom Finance General Partnership B, KK Barclays Shea Limited A Roder Investments No. 2 Limited A, I, Y Barclays Term Funding Limited Liability B Ruthenium Investments Limited A Argentina Partnership RVT CLO Investments LLP B - 855 Leandro N.Alem Avenue, 8th Floor, Barclays Wealth Nominees Limited A Surety Trust Limited A Buenos Aires Barcosec Limited A Swan Lane Investments Limited Compañía Sudamerica S.A. A Barsec Nominees Limited A US Real Estate Holdings No.1 Limited - Marval, O’Farrell & Mairal, Av. Leandro N. BB Client Nominees Limited A US Real Estate Holdings No. 2 Limited Alem 882, Buenos Aires, C1001AAQ BMBF (No.24) Limited US Real Estate Holdings No.3 Limited Compañia Regional del Sur S.A. A BMI (No.9) Limited Wedd Jefferson (Nominees) Limited A Carnegie Holdings Limited A,I, J,K Westferry Investments Limited A Brazil Chapelcrest Investments Limited
Woolwich Plan Managers Limited A - Av. Brigadeiro Faria Lima, No. 4.440, 12th
Clydesdale Financial Services Limited Woolwich Qualifying Employee Share A Floor, Bairro Itaim Bibi, Sao Paulo, CEP, Cobalt Investments Limited A Ownership Trustee Limited 04538-132 Cornwall Homes Loans Limited A Woolwich Surveying Services Limited A Barclays Brasil Assessoria Financeira Ltda. A CP Flower Guaranteeco (UK) Limited A, E Zeban Nominees Limited A BNC Brazil Consultoria Empresarial Ltda A
home.barclays/annualreport Barclays Bank PLC Annual Report 281

Notes to the financial statements Other disclosure matters
44 Related undertakings continued Wholly owned subsidiaries Note Wholly owned subsidiaries Note Wholly owned subsidiaries Note Canada India Barclays International Luxembourg Dollar - 333 Bay Street, Suite 4910, Toronto, ON M5H - 208 Ceejay House, Shivsagar Estate, Dr A Holdings S.à r.l. 2R2 Beasant Road, Worli, Mumbai, 400 018 Barclays Lamorak Investments S.à r.l. T Barclays Capital Canada Inc. Barclays Securities (India) Private Limited Barclays Leto Investments S.à r.l. J, K, L - Stikeman Elliot LLP, 199 Bay Street, 5300 Barclays Wealth Trustees (India) Private Limited Barclays Luxembourg EUR Holdings S.à r.l T Commerce Court West, Toronto, ON M5OL 1B9 - Level 10, Block B6, Nirlon Knowledge Park, Barclays Luxembourg Finance S.à r.l. Barclays Corporation Limited A Off Western Express Highway, Goregaon Barclays Luxembourg GBP Holdings S.à r.l. T (East), Mumbai, 40063 Barclays Luxembourg Global Funding S.à r.l. J, K Cayman Islands Barclays Investments & Loans (India) Limited A, F, I Barclays Luxembourg Holdings S.à r.l. I, AA - Maples Corporate Services Limited, PO Box Barclays Luxembourg Holdings SSC B 309, Ugland House, George Town, Grand Indonesia Barclays Pelleas Investments S.à r.l. Cayman, KY1-1104 - Barclays House, 12th Floor, Jl. Jend Sudirman - 68-70 Boulevard de la Petrusse, L-2320 Alymere Investments Limited G, H, I Kav. 22-23, Jakarta, 12920 Adler Toy Holding Sarl Analytical Trade UK Limited A PT Bank Barclays Indonesia (In Liquidation) A Barclays Capital (Cayman) Limited A - Plaza Lippo, 10th Floor, Jalan Jend, Sudirman Mauritius Braven Investments No.1 Limited Kav 25, Jakarta, 12920 - C/O Rogers Capital Corporate Services, St. Capton Investments Limited A PT Bhadra Buana Persada (In Liquidation) A Louis Business Centre, Cnr Desroches & St. Claudas Investments Limited A,I, EE Louis Streets, Port Louis Claudas Investments Two Limited Ireland Barclays Capital Mauritius Limited A Hurley Investments No.1 Limited - One Molesworth Street, Dublin 2, D02RF29 Barclays Capital Securities Mauritius Limited A Iris Investments 1 Limited (In Liquidation) Barclaycard International Payments Limited A - Fifth Floor, Ebene Esplanade, 24 Cybercity, Mintaka Investments No. 4 Limited Barclays Bank Ireland Public Limited Company A Ebene OGP Leasing Limited Barclays Europe Client Nominees Designated Barclays (H&B) Mauritius Limited (In A Pelleas Investments Limited A Activity Company Liquidation) Pelleas Investments Two Limited F, I Barclays Europe Firm Nominees Designated Barclays Mauritius Overseas Holdings Limited A Pippin Island Investments Limited Activity Company Razzoli Investments Limited A, F, I Barclays Europe Nominees Designated Activity Mexico RVH Limited A, F, I Company - Paseo de la Reforma 505, 41 Floor, Torre - PO Box 1093, Queensgate House, Grand - 25-28 North Wall Quay, Dublin 1, D01H104 Mayor, Col. Cuauhtemoc, CP 06500 Cayman, KY1-1102 Erimon Home Loans Ireland Limited A Barclays Bank Mexico, S.A. A,K,M Blaytell Limited (In Liquidation) A Barclays Capital Casa de Bolsa, S.A. de C.V. A,K,M Coskwo Limited (In Liquidation) A Isle of Man Grupo Financiero Barclays Mexico, S.A. de C.V. K,M Godler Limited (In Liquidation) A - Barclays House, Victoria Street, Douglas Servicios Barclays, S.A. de C.V. Harflane Limited (In Liquidation) A Barclays Nominees (Manx) Limited A Hentock Limited (In Liquidation) A - P O Box 9, Victoria Street, Douglas, IM99 Monaco Hollygrice Limited (In Liquidation) A 1AJ - 31 Avenue de la Costa, BP 339 Pilkbull Limited (In Liquidation) A Barclays Private Clients International Limited A, J, K Barclays Private Asset Management (Monaco) Strickyard Limited (In Liquidation) A S.A.M Winhall Limited (In Liquidation) A Japan - 190 Elgin Avenue, George Town, Grand - 10-1, Roppongi 6-chome, Minato-ku, Netherlands Cayman, KY1-9005 Tokyo - Prins Bernhardplein 200, 1097 Hj Calthorpe Investments Limited Barclays Funds and Advisory Japan Limited Amsterdam Gallen Investments Limited Barclays Securities Japan Limited Chewdef BidCo BV. (In Liquidation) A JV Assets Limited L Barclays Wealth Services Limited Palomino Limited A, Z Nigeria Wessex Investments Limited Jersey - Southgate House, Udi Street, Osborne - Walkers Corporate Limited, Cayman - 2nd Floor, Gaspé House, 66-72 Esplanade, Estate, Ikoyi, Lagos Corporate Centre, 27 Hospital Road, St. Helier, JE1 1GH Barclays Group Representative Office (NIG) A George Town, KY1- 9008 CP Newco 1 Limited A Limited (In Liquidation) Long Island Holding B Limited A CP Newco2 Limited J, K CP Newco3 Limited Philippines France - La Motte Chambers, St Helier, JE1 1BJ - 21/F, Philamlife Tower, 8767 Paseo de - 34/36 avenue de Friedland, Paris, 75008 Barclays Services Jersey Limited A Roxas, Makati City, 1226 BBAIL SAS A - 39 - 41 Broad Street, St Helier, JE2 3RR Meridian (SPV-AMC) Corporation Barclays Wealth Management Jersey Limited A Germany BIFML PTC Limited A Saudi Arabia - TaunusTurm, Taunustor 1, 60310, Frankfurt - 13 Castle Street, St. Helier, JE4 5UT - 3rd Floor Al Dahna Center, 114 Al-Ahsa Barclays Capital Effekten GmbH A Barclays Index Finance Trust S Street, PO Box 1454, Riyadh 11431 - Stuttgarter Straße 55-57, 73033 Göppingen - Lime Grove House, Green Street, St Helier, Barclays Saudi Arabia (In Liquidation) A Holding Stuttgarter Straße GmbH JE1 2ST Barbridge Limited (In Liquidation) A,I,DD Singapore Guernsey - 13 Library Place, St Helier, JE4 8NE - 10 Marina Boulevard, #24-01 Marina Bay - P.O. Box 33, Dorey Court, Admiral Park, St. Barclays Nominees (Jersey) Limited A Financial Centre, Tower 2, 018983 Peter Port, GY1 4AT Barclaytrust Channel Islands Limited A Barclays Bank (Singapore Nominees) Pte Ltd A Barclays Insurance Guernsey PCC Limited A, Q - Appleby Trust (Jersey) Limited, PO Box (In Liquidation) - PO BOX 41, Floor 2, Le Marchant House, Le 207, 13-14 Esplanade, St Helier, JE1 1BD Barclays Bank (South East Asia) Nominees Pte A Truchot, St Peter Port, GY1 3BE MK Opportunities GP Ltd A Ltd (In Liquidation) Barclays Nominees (Guernsey) Limited A Barclays Capital Futures (Singapore) Private Luxembourg Limited Hong Kong - 9, allée Scheffer, L-2520 Barclays Capital Holdings (Singapore) Private A - 42nd floor Citibank Tower, Citibank Plaza, Barclays Alzin Investments S.à r.l. Limited 3 Garden Road Barclays Bayard Investments S.à r.l. J, K Barclays Merchant Bank (Singapore) Ltd. Barclays Bank (Hong Kong Nominees) Limited A Barclays Bedivere Investments S.à r.l. (in Liquidation) Barclays Bordang Investments S.à r.l. Spain Barclays Capital Asia Nominees Limited (In Barclays BR Investments S.à r.l. - Calle Jose, Abascal 51, 28003, Madrid Liquidation) Barclays Cantal Investments S.à r.l. GG Barclays Tenedora De Immuebles SL. A - Level 41, Cheung Kong Center, 2 Queen's Barclays Capital Luxembourg S.à r.l. BVP Galvani Global, S.A.U. A Road Central Barclays Capital Trading Luxembourg S.à r.l. J, K Barclays Asia Limited A Barclays Claudas Investments S.à r.l. P Barclays Capital Asia Limited A Barclays Equity Index Investments S.à r.l.
home.barclays/annualreport Barclays Bank PLC Annual Report 282

44 Related undertakings continued Wholly owned subsidiaries Note Wholly owned subsidiaries Note Other Related Undertakings
Unless otherwise stated, the undertakings below are consolidated and the share capital disclosed comprises ordinary and/or common shares which are held by subsidiaries of the Group. The Group’s overall ownership percentage is provided for each undertaking.
Switzerland - CT Corporation System, 225 Hillsborough - Chemin de Grange Canal 18-20, PO Box Street, Raleigh, NC 27603 3941, 1211, Geneva Barclays US GPF Inc. Barclays Bank (Suisse) S.A. - CT Corporation System, 350 North St. Paul BPB Holdings SA Street, Dallas TX 75201 La Torretta Beverages LLC C United States La Torretta Hospitality LLC C - Corporation Trust Company, Corporation La Torretta Operations LLC C Trust Center, 1209 Orange Street, Wilmington - 500 Forest Point Circle, Charlotte, North DE 19801 Carolina 28273 Archstone Equity Holdings Inc Equifirst Corporation (In Liquidation) Other Related Undertakings Percentage Note Barclays BWA, Inc. - Aon Insurance Managers (USA) Inc., 76 St. United Kingdom Barclays Capital Derivatives Funding LLC C Paul Street, Suite 500, Burlington, VT05401- - 1 Churchill Place, London, Barclays Capital Energy Inc. 4477 E14 5HP Barclays Capital Holdings Inc. G, H, I Barclays Insurance U.S. Inc. PSA Credit Company Limited 50.00% A, J, L Barclays Capital Real Estate Finance Inc. (in liquidation) Barclays Capital Real Estate Holdings Inc. Zimbabwe - 1 Poultry, London, Barclays Capital Real Estate Inc. - 2 Premium Close, Mount Pleasant Business England, EC2R 8EJ Barclays Commercial Mortgage Securities LLC C Park, Mount Pleasant , Harare Igloo Regeneration (General 25.00% L, Z Barclays Electronic Commerce Holdings Inc. Branchcall Computers (Pvt) Limited A Partner) Limited Barclays Financial LLC C - 3 - 5 London Road, Barclays Group US Inc. G, I Rainham, Kent, ME8 7RG Barclays Oversight Management Inc. Trade Ideas Limited 20.00% A, Z Barclays Receivables LLC C - 50 Lothian Road, Festival Barclays Services Corporation Square, Edinburgh, EH3 Barclays US CCP Funding LLC C 9BY Barclays US Funding LLC C Equistone Founder Partner II 20.00% A,B,Z Barclays US Investments Inc. J, K L.P. Barclays US LLC A, I, U Equistone Founder Partner 35.00% A,B,Z BCAP LLC C III L.P. Crescent Real Estate Member LLC C - Building 6 Chiswick Park, Gracechurch Services Corporation 566 Chiswick High Road, Long Island Holding A LLC C London, W4 5HR LTDL Holdings LLC C Intelligent Processing 19.50% A, Z Marbury Holdings LLC C Solutions Limited Protium Finance I LLC C - 20-22 Bedford Row, Protium Master Mortgage LP B London, WC1R 4JS Protium REO I LP B Cyber Defence Alliance 25.00% A, E,Z Securitized Asset Backed Receivables LLC C Limited Sutton Funding LLC C - 30 Gresham Street, TPLL LLC C London, EC2V 7PG TPProperty LLC C Gresham Leasing March (3) 30.00% Z US Secured Investments LLC JJ Limited - 1201 North Market Street, P.O. Box 1347 - 5th Floor, 70 Gracechurch Wilmington, DE19801 Street, London, EC3V 0XL Barclays Bank Delaware F, I Camperdown UK Limited 50.00% A, J,Z Procella Investments LLC C - 2nd Floor, 110 Cannon Procella Investments No.1 LLC C Street, London, EC4N 6EU Procella Investments No.2 LLC C Vectorcommand Limited (in 30.39% J,K,Z Procella Investments No.3 LLC C Liquidation) Verain Investments LLC - 15 Canada Square, - 2711 Centerville Road, Suite 400, London, E14 5GL Wilmington, DE 19808 Woolwich Countryside 50.00% A,N,Z Analog Analytics Inc Limited (In Liquidation) Protium Master Grantor Trust D - 6th Floor 60 Gracechurch - 251 Little Falls Drive, New Castle County, Street, London, EC3V 0HR Wilmington DE 19808 BMC (UK) Limited 40.18% F, J Z Barclays Capital Equities Trading GP B - 13-15 York Buildings, Lagalla Investments LLC London, WC2N 6JU Relative Value Holdings, LLC BGF Group Limited 24.48% Z Surrey Funding Corporation - Hill House, 1 Little New Sussex Purchasing Corporation Street, London, EC4A 3TR - 745 Seventh Avenue, New York NY 10019 Claas Finance Limited (In 51.00% K Alynore Investments Limited Partnership B Liquidation) Barclays Payment Solutions Inc. Curve Investments GP B Cayman Islands Preferred Liquidity, LLC J - Maples Corporate - CT Corporation System, One Corporate Services Limited, PO Box Center, Floor 11, Hartford CT 06103-3220 309GT, Ugland House, Barclays Capital Inc. South Church Street, - c/o RL&F Service Corp, One Rodney Grand Cayman, KY1-1104 Square, 10th Floor, Tenth and King Streets, Cupric Canyon Capital LP 40.19% HH, Z Wilmington Southern Peaks Mining LP 55.69% HH, Z DE 19801 Third Energy Holdings 78.94% F,J,K,Z Analytical Trade Holdings LLC Limited Analytical Trade Investments LLC BB - 100 South West Street, Wilmington DE 19801 Barclays Dryrock Funding LLC C Wilmington Riverfront Receivables LLC J, K - 15 East North Street, Dover DE 19801 Barclays Services LLC C
home.barclays/annualreport Barclays Bank PLC Annual Report 283

Notes to the financial statements Other disclosure matters
44 Related undertakings continued Other related undertakings Percentage Note Other related undertakings Percentage Note Subsidiaries by virtue of control
The related undertakings below are subsidiaries in accordance with s.1162 Companies Act 2006 as Barclays can exercise dominant influence or control over them.
Korea, Republic of Gray’s Station, LLC 56.96% C, Z - 18th Floor, Daishin Finance Mira Vista Development LLC 78.40% C, Z Centre, 343, Samil-daero, Mira Vista Golf Club, L.C. 76.83% Z Jung-go, Seoul Mountainside Partners LLC 80.00% C, Z Woori BC Pegasus 70.00% A, W MVWP Investors LLC 60.80% C, Z Securitization Specialty Co., Northstar Mountain Properties, LLC 60.80% C, Z Limited Northstar Trailside Townhomes, 60.80% C, Z LLC Subsidiaries by virtue of Percentage Note Luxembourg Northstar Village Townhomes, LLC 56.93% C, Z control - 9, allée Scheffer, L-2520 Tahoe Club Company, LLC 60.80% C, Z United Kingdom BNRI Limehouse No.1 Sarl 96.30% R Tahoe Club Employee Company 60.80% Z - 1 Churchill Place, London, Partnership Investments S.à r.l. 33.40% I, J ,K ,L - 126 Riverfront Lane , 5th Floor, E14 5HP Preferred Funding S.à r.l. 33.33% FF Drawer 2770, Avon, CO 81620 Oak Pension Asset 00.00% Z Preferred Investments S.à r.l. 33.33% FF, I Blue River Land Company, LLC 39.55% C, Z Management Limited East West Resort Development XIV, 33.52% B, Z Water Street Investments 00.00% Z Malta L.P., L.L.L.P. Limited - RS2 Buildings, Fort Road, EWRD Summit, LLC 79.10% C, Z Mosta MST 1859 - 1701 Wynkoop Street, Suite 140, Cayman Islands RS2 Software PLC 18.25% A, Z Box 47, Denver, CO 80202 - PO Box 309GT, Ugland Central Platte Valley Management, 51.78% C, Z House, South Church Street, Monaco LLC Grand Cayman, KY1-1104 - 31 Avenue de la Costa, St. Charles Place, LLC 47.63% C, Z Hornbeam Limited 00.00% Z Monte Carlo The Park at One Riverfront, LLC 47.63% C, Z Barclays US Holdings Limited 10.00% A, H, J Societe Civile Immobiliere 31 75.00% A Union Center LLC 51.78% C, Z Avenue de la Costa - Corporation Trust Company, Corporation Trust Center, 1209 South Africa Orange Street, Wilmington DE - 9 Elektron Road, Techno 19801 Park, Stellenbosch 7600 DG Solar Lessee II, LLC 50.00% C, Z Imalivest Mineral Resources LP 66.41% J, K, Z DG Solar Lessee, LLC 50.00% C, Z
VS BC Solar Lessee I LLC 50.00% C, Z Sweden - 1415 Louisiana Street, Suite - c/o ForeningsSparbanken 1600, Houston, Texas, 77002 AB, 105 34 Stockholm Sabine Oil & Gas Holdings, Inc. 23.25% Z EnterCard Group AB 40.00% A, K, Z United States of America - 777 Main Street, Fort Worth TX 76102 CRE Diversified Holdings LLC 80.00% C, Z Crescent Legacy LLC 80.00% C, Z Crescent Crown Land Holding 80.00% C, Z SPV LLC
Crescent Plaza Residential LP, 80.00% C, Z LLC Crescent Plaza Residential, L.P. 80.00% B, Z Crescent Plaza Residential, LLC 80.00% C, Z Crescent Resort Development 80.00% C, Z LLC Crescent Tower Residences 80.00% C, Z GP, LLC Crescent Tower Residences, 80.00% B, Z L.P. Crescent TRS Holdings LLC 80.00% C, Z CREW Tahoe Holdings LLC 80.00% C, Z CREW Tahoe LLC 60.80% C, Z DBL Texas Holdings LLC 80.00% C, Z Desert Mountain Development 80.00% C, Z LLC Desert Mountain Properties 74.40% B, Z Limited Partnership East West Resort Development 74.75% B, Z V, L.P., L.L.L.P. East West Resort Development 80.00% C, Z VII LLC
home.barclays/annualreport Barclays Bank PLC Annual Report 284

Notes to the financial statements Other disclosure matters
Notes
The term Barclays Bank Group refers to Barclays Bank PLC together with its subsidiaries. Unless otherwise stated, the income statement analysis compares the year ended 31 December 2018 to the corresponding twelve months of 2017 and balance sheet analysis as at 31 December 2018 with comparatives relating to 31 December 2017. The abbreviations ‘£m’ and ‘£bn’ represent millions and thousands of millions of Pounds Sterling respectively; the abbreviations ‘$m’ and ‘$bn’ represent millions and thousands of millions of US Dollars respectively; the abbreviations ‘€m’ and ‘€bn’ represent millions and thousands of millions of Euros respectively.
There are a number of key judgement areas, for example impairment calculations, which are based on models and which are subject to ongoing adjustment and modifications. Reported numbers reflect best estimates and judgements at the given point in time.
Relevant terms that are used in this document but are not defined under applicable regulatory guidance or International Financial Reporting Standards (IFRS) are explained in the results glossary that can be accessed at home.barclays/results.
The information in this announcement, which was approved by the Board of Directors on 20 February 2019, does not comprise statutory accounts within the meaning of Section 434 of the Companies Act 2006. Statutory accounts for the year ended 31 December 2018, which contain an unqualified audit report under Section 495 of the Companies Act 2006 (which does not make any statements under Section 498 of the Companies Act 2006) will be delivered to the Registrar of Companies in accordance with Section 441 of the Companies Act 2006.
These results will be filed as a Form 20-F to the SEC as soon as practicable following their publication. Once filed with the SEC, copies of the Form 20-F will also be available from the Barclays Investor Relations website at home.barclays/results and from the SEC’s website at www.sec.gov.
Barclays Bank Group is a frequent issuer in the debt capital markets and regularly meets with investors via formal road-shows and other ad hoc meetings. Consistent with its usual practice, Barclays expects that from time to time over the coming quarter it will meet with investors globally to discuss these results and other matters relating to the Barclays Bank Group.
Forward-looking statements
This document contains certain forward-looking statements within the meaning of Section 21E of the US Securities Exchange Act of 1934, as amended, and Section 27A of the US Securities Act of 1933, as amended, with respect to the Barclays Bank Group. Barclays cautions readers that no forward-looking statement is a guarantee of future performance and that actual results or other financial condition or performance measures could differ materially from those contained in the forward-looking statements. These forward-looking statements can be identified by the fact that they do not relate only to historical or current facts. Forward-looking statements sometimes use words such as ‘may’, ‘will’, ‘seek’, ‘continue’, ‘aim’, ‘anticipate’, ‘target’, ‘projected’, ‘expect’, ‘estimate’, ‘intend’, ‘plan’, ‘goal’, ‘believe’, ‘achieve’ or other words of similar meaning. Examples of forward-looking statements include, among others, statements or guidance regarding or relating to the Barclays Bank Group’s future financial position, income growth, assets, impairment charges, provisions, business strategy, capital, leverage and other regulatory ratios, payment of dividends (including dividend payout ratios and expected payment strategies), projected levels of growth in the banking and financial markets, projected costs or savings, any commitments and targets, estimates of capital expenditures, plans and objectives for future operations, projected employee numbers, IFRS 9 impacts and other statements that are not historical fact. By their nature, forward-looking statements involve risk and uncertainty because they relate to future events and circumstances. These may be affected by changes in legislation, the development of standards and interpretations under International Financial Reporting Standards including the continuing impact of IFRS 9 implementation, evolving practices with regard to the interpretation and application of accounting and regulatory standards, the outcome of current and future legal proceedings and regulatory investigations, future levels of conduct provisions, the policies and actions of governmental and regulatory authorities, geopolitical risks and the impact of competition. In addition, factors including (but not limited to) the following may have an effect: capital, leverage and other regulatory rules applicable to past, current and future periods; UK, US, Eurozone and global macroeconomic and business conditions; the effects of any volatility in credit markets; market related risks such as changes in interest rates and foreign exchange rates; effects of changes in valuation of credit market exposures; changes in valuation of issued securities; volatility in capital markets; changes in credit ratings of any entities within the Barclays Bank Group or any securities issued by such entities; the potential for one or more countries exiting the Eurozone; instability as a result of the exit by the United Kingdom from the European Union and the disruption that may subsequently result in the UK and globally; and the success of future acquisitions, disposals and other strategic transactions. A number of these influences and factors are beyond the Barclays Bank Group’s control. As a result, the Barclays Bank Group’s actual future results, dividend payments, and capital and leverage ratios may differ materially from the plans, goals, expectations and guidance set forth in the Barclays Bank Group’s forward-looking statements. Additional risks and factors which may impact the Barclays Bank Group’s future financial condition and performance are identified in our filings with the SEC (including, without limitation, our Annual Report on Form 20-F for the fiscal year ended 31 December 2018), which are available on the SEC’s website at www.sec.gov.
Subject to our obligations under the applicable laws and regulations of the United Kingdom and the United States in relation to disclosure and ongoing information, we undertake no obligation to update publicly or revise any forward-looking statements, whether as a result of new information, future events or otherwise.
home.barclays/annualreport Barclays Bank PLC Annual Report 285