barclays plc results announcement · notes barclays plc 1 the terms barclays or group refer to...
TRANSCRIPT

Barclays PLC
Results Announcement
31 December 2017
Table of Contents
Barclays PLC
Results Announcement Page
Notes 1
Performance Highlights 2-3
Group Chief Executive Officer‟s Review 4
Group Finance Director‟s Review 5-7
Results by Business
Barclays UK 8-10
Barclays International 11-13
Head Office 14
Barclays Non-Core Results 15
Discontinued Operation Results 16
Quarterly Results Summary
17
Quarterly Results by Business 18-21
Performance Management
Margins and Balances 22
Remuneration 23-24
Risk Management
Overview 25
Credit Risk 26-28
Treasury and Capital Risk 29-40
Statement of Directors‟ Responsibilities 41
Condensed Consolidated Financial Statements 42-46
Financial Statement Notes 47-54
Appendix: Non-IFRS Performance Measures 55-57
Shareholder Information 58
BARCLAYS PLC, 1 CHURCHILL PLACE, LONDON, E14 5HP, UNITED KINGDOM. TELEPHONE: +44 (0) 20 7116 1000. COMPANY NO. 48839.
Notes
Barclays PLC 1
The terms Barclays or Group refer to Barclays PLC together with its subsidiaries. Unless otherwise stated, the income statement analysis compares
the year ended 31 December 2017 to the corresponding twelve months of 2016 and balance sheet analysis as at 31 December 2017 with
comparatives relating to 31 December 2016. The abbreviations „£m‟ and „£bn‟ represent millions and thousands of millions of Pounds Sterling
respectively; the abbreviations „$m‟ and „$bn‟ represent millions and thousands of millions of US Dollars respectively; and the abbreviations „€m‟ and
„€bn‟ represent millions and thousands of millions of Euros respectively.
There are a number of key judgement areas, for example impairment calculations, which are based on models and which are subject to ongoing
adjustment and modifications. Reported numbers reflect best estimates and judgements at the given point in time.
Relevant terms that are used in this document but are not defined under applicable regulatory guidance or International Financial Reporting
Standards (IFRS) are explained in the results glossary that can be accessed at home.barclays/results.
The information in this announcement, which was approved by the Board of Directors on 21 February 2018, does not comprise statutory accounts
within the meaning of Section 434 of the Companies Act 2006. Statutory accounts for the year ended 31 December 2017, which includes certain
information required for the Joint Annual Report on Form 20-F of Barclays PLC and Barclays Bank PLC to the US Securities and Exchange
Commission (SEC) and which contain an unqualified audit report under Section 495 of the Companies Act 2006 (which does not make any
statements under Section 498 of the Companies Act 2006) will be delivered to the Registrar of Companies in accordance with Section 441 of the
Companies Act 2006.
These results will be furnished as a Form 20-F to the SEC as soon as practicable following their publication. Once furnished with the SEC, copies of
the Form 20-F will also be available from the Barclays Investor Relations website at home.barclays/results and from the SEC‟s website at
www.sec.gov.
Barclays is a frequent issuer in the debt capital markets and regularly meets with investors via formal road-shows and other ad hoc meetings.
Consistent with its usual practice, Barclays expects that from time to time over the coming quarter it will meet with investors globally to discuss
these results and other matters relating to the Group.
Non-IFRS performance measures
Barclays‟ management believes that the non-IFRS performance measures included in this document provide valuable information to the readers of
the financial statements as they enable the reader to identify a more consistent basis for comparing the business‟ performance between financial
periods, and provide more detail concerning the elements of performance which the managers of these businesses are most directly able to
influence or are relevant for an assessment of the Group. They also reflect an important aspect of the way in which operating targets are defined and
performance is monitored by Barclays‟ management. However, any non-IFRS performance measures in this document are not a substitute for IFRS
measures and readers should consider the IFRS measures as well. Refer to the appendix on pages 55-57 for further information and calculations of
non-IFRS performance measures included throughout this document, and the most directly comparable IFRS measures.
Forward-looking statements
This document contains certain forward-looking statements within the meaning of Section 21E of the US Securities Exchange Act of 1934, as
amended, and Section 27A of the US Securities Act of 1933, as amended, with respect to the Group. Barclays cautions readers that no forward-
looking statement is a guarantee of future performance and that actual results or other financial condition or performance measures could differ
materially from those contained in the forward-looking statements. These forward-looking statements can be identified by the fact that they do not
relate only to historical or current facts. Forward-looking statements sometimes use words such as „may‟, „will‟, „seek‟, „continue‟, „aim‟, „anticipate‟,
„target‟, „projected‟, „expect‟, „estimate‟, „intend‟, „plan‟, „goal‟, „believe‟, „achieve‟ or other words of similar meaning. Examples of forward-looking
statements include, among others, statements or guidance regarding or relating to the Group‟s future financial position, income growth, assets,
impairment charges, provisions, business strategy, structural reform, capital, leverage and other regulatory ratios, payment of dividends (including
dividend payout ratios and expected payment strategies), projected levels of growth in the banking and financial markets, projected costs or savings,
any commitments and targets and the impact of any regulatory deconsolidation resulting from the sell down of the Group‟s interest in Barclays
Africa Group Limited, estimates of capital expenditures and plans and objectives for future operations, projected employee numbers, IFRS 9 impacts
and other statements that are not historical fact. By their nature, forward-looking statements involve risk and uncertainty because they relate to
future events and circumstances. These may be affected by changes in legislation, the development of standards and interpretations under
International Financial Reporting Standards including the implementation of IFRS 9, evolving practices with regard to the interpretation and
application of accounting and regulatory standards, the outcome of current and future legal proceedings and regulatory investigations, future levels
of conduct provisions, the policies and actions of governmental and regulatory authorities, geopolitical risks and the impact of competition. In
addition, factors including (but not limited to) the following may have an effect: capital, leverage and other regulatory rules (including with regard to
the future structure of the Group) applicable to past, current and future periods; UK, US, Africa, Eurozone and global macroeconomic and business
conditions; the effects of continued volatility in credit markets; market related risks such as changes in interest rates and foreign exchange rates;
effects of changes in valuation of credit market exposures; changes in valuation of issued securities; volatility in capital markets; changes in credit
ratings of any entities within the Group or any securities issued by such entities; the potential for one or more countries exiting the Eurozone; the
implications of the exercise by the United Kingdom of Article 50 of the Treaty of Lisbon and the disruption that may result in the UK and globally
from the withdrawal of the United Kingdom from the European Union and the success of future acquisitions, disposals and other strategic
transactions. A number of these influences and factors are beyond the Group‟s control. As a result, the Group‟s actual future results, dividend
payments, and capital and leverage ratios may differ materially from the plans, goals, expectations and guidance set forth in the Group‟s forward-
looking statements. Additional risks and factors which may impact the Group‟s future financial condition and performance are identified in our
filings with the SEC (including, without limitation, our annual report on form 20-F for the fiscal year ended 31 December 2017), which will be
available on the SEC‟s website at www.sec.gov.
Subject to our obligations under the applicable laws and regulations of the United Kingdom and the United States in relation to disclosure and
ongoing information, we undertake no obligation to update publicly or revise any forward-looking statements, whether as a result of new
information, future events or otherwise.
Performance Highlights
Barclays PLC 2
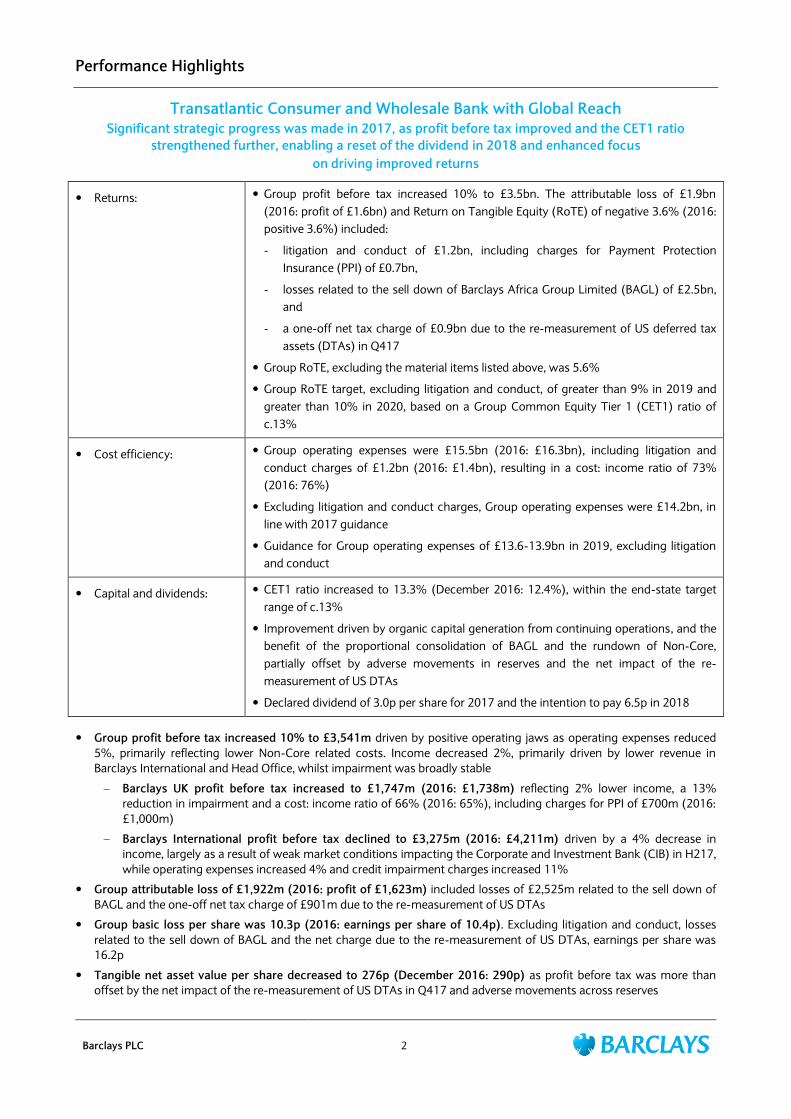
Transatlantic Consumer and Wholesale Bank with Global Reach Significant strategic progress was made in 2017, as profit before tax improved and the CET1 ratio
strengthened further, enabling a reset of the dividend in 2018 and enhanced focus
on driving improved returns
Returns:
Group profit before tax increased 10% to £3.5bn. The attributable loss of £1.9bn
(2016: profit of £1.6bn) and Return on Tangible Equity (RoTE) of negative 3.6% (2016:
positive 3.6%) included:
- litigation and conduct of £1.2bn, including charges for Payment Protection
Insurance (PPI) of £0.7bn,
- losses related to the sell down of Barclays Africa Group Limited (BAGL) of £2.5bn,
and
- a one-off net tax charge of £0.9bn due to the re-measurement of US deferred tax
assets (DTAs) in Q417
Group RoTE, excluding the material items listed above, was 5.6%
Group RoTE target, excluding litigation and conduct, of greater than 9% in 2019 and
greater than 10% in 2020, based on a Group Common Equity Tier 1 (CET1) ratio of
c.13%
Cost efficiency: Group operating expenses were £15.5bn (2016: £16.3bn), including litigation and
conduct charges of £1.2bn (2016: £1.4bn), resulting in a cost: income ratio of 73%
(2016: 76%)
Excluding litigation and conduct charges, Group operating expenses were £14.2bn, in
line with 2017 guidance
Guidance for Group operating expenses of £13.6-13.9bn in 2019, excluding litigation
and conduct
Capital and dividends: CET1 ratio increased to 13.3% (December 2016: 12.4%), within the end-state target
range of c.13%
Improvement driven by organic capital generation from continuing operations, and the
benefit of the proportional consolidation of BAGL and the rundown of Non-Core,
partially offset by adverse movements in reserves and the net impact of the re-
measurement of US DTAs
Declared dividend of 3.0p per share for 2017 and the intention to pay 6.5p in 2018
Group profit before tax increased 10% to £3,541m driven by positive operating jaws as operating expenses reduced
5%, primarily reflecting lower Non-Core related costs. Income decreased 2%, primarily driven by lower revenue in
Barclays International and Head Office, whilst impairment was broadly stable
– Barclays UK profit before tax increased to £1,747m (2016: £1,738m) reflecting 2% lower income, a 13%
reduction in impairment and a cost: income ratio of 66% (2016: 65%), including charges for PPI of £700m (2016:
£1,000m)
– Barclays International profit before tax declined to £3,275m (2016: £4,211m) driven by a 4% decrease in
income, largely as a result of weak market conditions impacting the Corporate and Investment Bank (CIB) in H217,
while operating expenses increased 4% and credit impairment charges increased 11%
Group attributable loss of £1,922m (2016: profit of £1,623m) included losses of £2,525m related to the sell down of
BAGL and the one-off net tax charge of £901m due to the re-measurement of US DTAs
Group basic loss per share was 10.3p (2016: earnings per share of 10.4p). Excluding litigation and conduct, losses
related to the sell down of BAGL and the net charge due to the re-measurement of US DTAs, earnings per share was
16.2p
Tangible net asset value per share decreased to 276p (December 2016: 290p) as profit before tax was more than
offset by the net impact of the re-measurement of US DTAs in Q417 and adverse movements across reserves
Performance Highlights
Barclays PLC 3
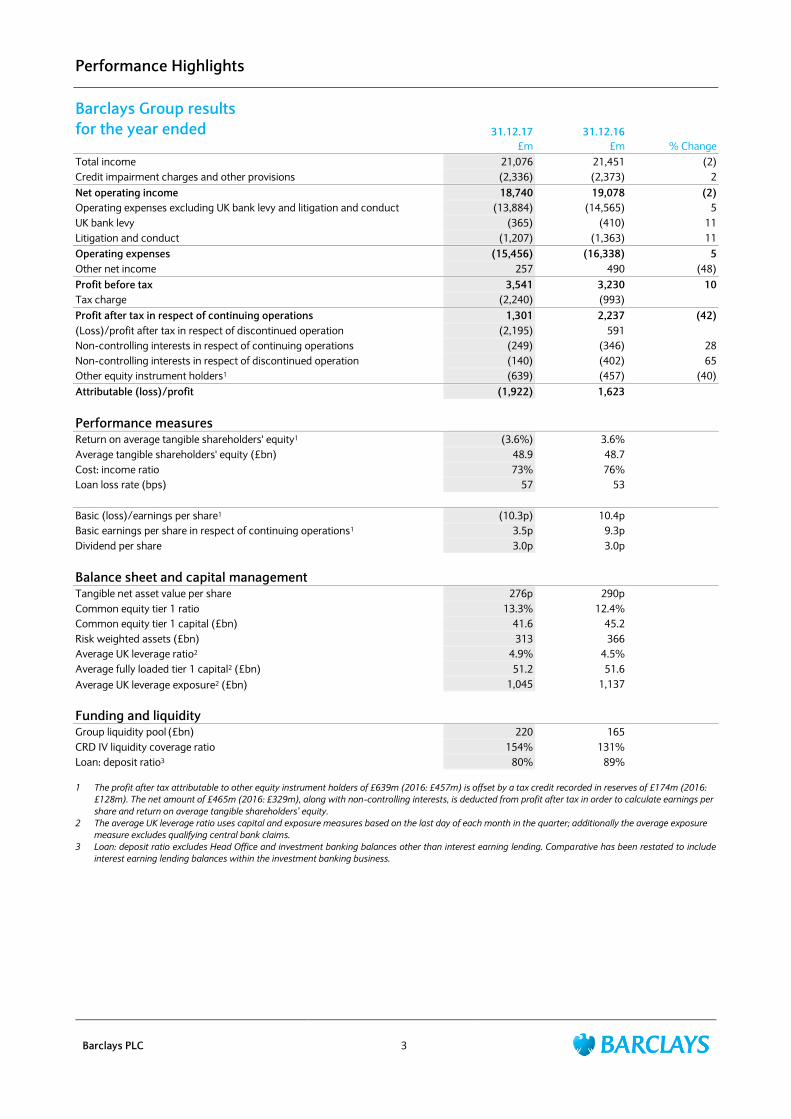
Barclays Group results
for the year ended 31.12.17 31.12.16
£m £m % Change
Total income 21,076 21,451 (2)
Credit impairment charges and other provisions (2,336) (2,373) 2
Net operating income 18,740 19,078 (2)
Operating expenses excluding UK bank levy and litigation and conduct (13,884) (14,565) 5
UK bank levy (365) (410) 11
Litigation and conduct (1,207) (1,363) 11
Operating expenses (15,456) (16,338) 5
Other net income 257 490 (48)
Profit before tax 3,541 3,230 10
Tax charge (2,240) (993)
Profit after tax in respect of continuing operations 1,301 2,237 (42)
(Loss)/profit after tax in respect of discontinued operation (2,195) 591
Non-controlling interests in respect of continuing operations (249) (346) 28
Non-controlling interests in respect of discontinued operation (140) (402) 65
Other equity instrument holders1 (639) (457) (40)
Attributable (loss)/profit (1,922) 1,623
Performance measures
Return on average tangible shareholders' equity1 (3.6%) 3.6%
Average tangible shareholders' equity (£bn) 48.9 48.7
Cost: income ratio 73% 76%
Loan loss rate (bps) 57 53
Basic (loss)/earnings per share1 (10.3p) 10.4p
Basic earnings per share in respect of continuing operations1 3.5p 9.3p
Dividend per share 3.0p 3.0p
Balance sheet and capital management
Tangible net asset value per share 276p 290p
Common equity tier 1 ratio 13.3% 12.4%
Common equity tier 1 capital (£bn) 41.6 45.2
Risk weighted assets (£bn) 313 366
Average UK leverage ratio2 4.9% 4.5%
Average fully loaded tier 1 capital2 (£bn) 51.2 51.6
Average UK leverage exposure2 (£bn) 1,045 1,137
Funding and liquidity
Group liquidity pool (£bn) 220 165
CRD IV liquidity coverage ratio 154% 131%
Loan: deposit ratio3 80% 89%
1 The profit after tax attributable to other equity instrument holders of £639m (2016: £457m) is offset by a tax credit recorded in reserves of £174m (2016:
£128m). The net amount of £465m (2016: £329m), along with non-controlling interests, is deducted from profit after tax in order to calculate earnings per
share and return on average tangible shareholders’ equity.
2 The average UK leverage ratio uses capital and exposure measures based on the last day of each month in the quarter; additionally the average exposure
measure excludes qualifying central bank claims.
3 Loan: deposit ratio excludes Head Office and investment banking balances other than interest earning lending. Comparative has been restated to include
interest earning lending balances within the investment banking business.
Group Chief Executive Officer’s Review
Barclays PLC 4
“2017 was a year of considerable strategic progress for Barclays. The sell down of our shareholding in Barclays
Africa, closure of our Non-Core unit, the establishment of our Service Company, and the creation of our UK ring-
fenced bank, mean that, in terms of size and structure, we are now the diversified Transatlantic Consumer and
Wholesale bank we set out in our strategy in March 2016.
We have a portfolio of profitable businesses, producing significant earnings, and have plans and investments in
place to grow those earnings over time.
We have already started to see some of the benefits of our work in 2017. Group profit before tax increased 10%
year-on-year as a result of our team’s focus on execution. Barclays UK navigated the year well, reaching a
digital banking milestone with our ten millionth customer. Within Barclays International, we increased Banking
fee share in our Corporate and Investment Bank in 2017, and our Consumer, Cards and Payments business
continued to produce very strong income while managing risk effectively.
Although we are only seven weeks into the first quarter, and it is too early to offer formal guidance, we are
pleased with the start to the year, and in particular in the markets businesses in CIB, where income is tracking
above the level for the corresponding period in 2017 in dollars, and also in sterling, despite the weaker dollar we
are currently experiencing.
Critically, as we have carried out the work to reshape the business, we have continued to generate capital
organically. Our CET1 ratio today stands at 13.3%, comfortably within our end-state target range.
While we still have a number of legacy conduct issues to address, I am confident in the capacity of this business
to generate excess capital going forward, and it remains our intention over time to return a greater proportion
of that excess capital to shareholders through dividends, and other means of capital distribution, including
share buybacks.
As a first demonstration of that intent, we are pleased to be able to announce today the restoration of the
dividend to six and a half pence for 2018.”
James E Staley, Group Chief Executive Officer
Group Finance Director’s Review
Barclays PLC 5
Financial performance in 2017 was encouraging, with increased profit before tax, a reduced cost: income ratio and strong
capital ratio progression. Significant progress was also made on strategic objectives in the year, with the closure of Barclays
Non-Core and the sale of a stake in, and consequent accounting deconsolidation of, BAGL. New Group returns targets were
set: to achieve RoTE of greater than 9% in 2019 and greater than 10% in 2020, excluding litigation and conduct, based on a
CET1 ratio of c.13%. The 2017 financial results provide a firm platform on which to build towards these.
Following the closure of Barclays Non-Core on 1 July 2017, Group results for 2017 included a Barclays Non-Core loss before
tax for the six months ended 30 June 2017 of £647m, compared to a loss before tax of £2,786m for the full year in 2016.
From 1 July 2017, residual Barclays Non-Core assets and liabilities were reintegrated into, and associated financial
performance subsequently reported in, Barclays UK, Barclays International and Head Office.
Group performance Profit before tax increased 10% to £3,541m driven by a 5% reduction in operating expenses, partially offset by a 2%
reduction in income and lower other net income. Results were impacted by the appreciation of average USD and EUR
against GBP of 5% and 7% respectively, compared to 2016, which positively impacted income and adversely affected
impairment and operating expenses
Total income decreased to £21,076m (2016: £21,451m) reflecting a £613m decrease in Barclays International and a
£262m reduction in Head Office, partially offset by a reduction in losses related to Non-Core
Credit impairment charges were broadly stable at £2,336m (2016: £2,373m) and reflected a charge of £168m in 2017
relating to deferred consideration from an asset sale in US Cards and the non-recurrence of a £320m charge in 2016
following the management review of the UK and US cards portfolio impairment modelling. Impairment increased in
Barclays International driven by an increase in underlying delinquency trends and business growth in US Cards. The
Group loan loss rate increased 4bps to 57bps
Operating expenses reduced 5% to £15,456m driven primarily by lower Non-Core related operating expenses. The cost:
income ratio reduced to 73% (2016: 76%)
Other net income of £257m (2016: £490m) primarily reflected a gain of £109m on the sale of Barclays‟ share in
VocaLink to MasterCard and a gain of £76m on the sale of a joint venture in Japan
Profit after tax in respect of continuing operations was £1,301m (2016: £2,237m). The tax charge of £2,240m included
a one-off tax charge of £1,177m due to the re-measurement of US DTAs as a result of the US Tax Cuts and Jobs Act,
partially offset by an unrelated £276m increase in US DTAs due to a re-measurement of Barclays Bank PLC‟s (BBPLC) US
branch DTAs
Loss after tax in respect of the Africa Banking discontinued operation of £2,195m included a £1,090m impairment of
Barclays‟ holding in BAGL and a £1,435m loss on the sale of 33.7% of BAGL‟s issued share capital, primarily due to
recycling of currency translation reserve losses to the income statement on accounting deconsolidation
RoTE was negative 3.6% (2016: positive 3.6%) and basic loss per share was 10.3p (2016: earnings per share of 10.4p).
Excluding litigation and conduct, losses related to the sell down of BAGL and the one-off net charge due to the re-
measurement of US DTAs, RoTE was 5.6% and earnings per share was 16.2p
Refer to pages 8-14 for further detail on Results by Business
Group capital and leverage The fully loaded CET1 ratio increased to 13.3% (December 2016: 12.4%) principally due to a reduction in risk weighted
assets (RWAs) of £52.6bn to £313.0bn. CET1 capital decreased £3.6bn to £41.6bn
– The sell down of Barclays‟ holding in BAGL to 14.9%, resulting in regulatory proportional consolidation, increased
the CET1 ratio by c.60bps with a £31.1bn reduction in RWAs, offset by a £1.8bn reduction due to BAGL minority
interests no longer being included in CET1 capital
– Losses in respect of the discontinued operation due to the impairment of Barclays‟ holding in BAGL allocated to
goodwill, and the recycling of the BAGL currency translation reserve losses to the income statement, had no
impact on CET1
– The CET1 ratio increased by a further c.50bps as a result of other RWA reductions, excluding the impact of foreign
currency movements, including reductions in Non-Core
– Excluding the impacts of BAGL and foreign currency movements, CET1 capital decreased further, as profits
relating to continuing operations, after absorbing the net impact of the re-measurement of US DTAs, were offset
by the redemption of USD preference shares and the payment of pension deficit reduction contributions in the
year
The average UK leverage ratio increased to 4.9% (December 2016: 4.5%) primarily driven by the issuance of additional
tier 1 (AT1) securities, the reduction in Non-Core related exposures and due to regulatory proportional consolidation of
BAGL
Tangible net asset value per share decreased to 276p (December 2016: 290p) as profit before tax was more than offset
by the net impact of the re-measurement of US DTAs in Q417 and adverse movements across reserves
Group Finance Director’s Review
Barclays PLC 6
Group funding and liquidity The Group continued to maintain surpluses to its internal and regulatory requirements. The liquidity pool increased to
£220bn (December 2016: £165bn) reflecting the approach of holding a conservative liquidity position and through net
deposit growth, the unwind of legacy Non-Core portfolios, money market borrowing and drawdown from the Bank of
England Term Funding Scheme. The liquidity coverage ratio (LCR) increased to 154% (December 2016: 131%),
equivalent to a surplus of £75bn (December 2016: £39bn) to 100%
Wholesale funding outstanding excluding repurchase agreements was £157bn (December 2016: £158bn). The Group
issued £11.5bn equivalent of capital and term senior unsecured debt from Barclays PLC (the Parent company) of which
£6.1bn was in public senior unsecured debt and £5.4bn in capital instruments. In the same period, £6.1bn of BBPLC
capital and senior public term instruments either matured or were redeemed, including the $1.375bn 7.1% Series 3 USD
preference shares
Other matters On 1 June 2017, Barclays sold 286 million ordinary shares of BAGL, representing 33.7% of BAGL‟s issued share capital.
The sale resulted in the accounting deconsolidation of BAGL from the Barclays Group. Following the sale, BAGL was no
longer reported as a discontinued operation, with the retained investment accounted for as an Available for Sale (AFS)
asset in Barclays‟ financial statements. The contribution of a further 1.5% of BAGL‟s ordinary shares to a Black
Economic Empowerment scheme in Q317 resulted in Barclays accounting for 126 million ordinary shares in BAGL,
representing 14.9% of BAGL‟s issued share capital. For regulatory reporting purposes, BAGL is treated on a proportional
consolidated basis
Barclays‟ measurement of its US DTAs reduced £0.9bn in Q417, as a £1.2bn decrease as result of the US Tax Cuts and
Jobs Act, enacted on 22 December 2017, was partially offset by an unrelated £0.3bn increase due to a re-measurement
of BBPLC‟s US branch DTAs, as a result of BBPLC making a tax election in the period to exclude the future profits and
losses of its overseas branches from UK taxation. The net reduction in the measurement of US DTAs resulted in a one-
off net charge of £0.9bn to Group profit after tax, a c.20bps reduction to the Group CET1 ratio and a decrease in
tangible net asset value of 5p per share
Additional charges of £700m (2016: £1,000m) relating to PPI were recognised in Q217. The remaining PPI provision as
at 31 December 2017 was £1.6bn (December 2016: £2.0bn). Management views its current PPI provision as
appropriate, however, will continue to closely monitor complaint trends and the associated provision adequacy
A provision of £240m in respect of Foreign Exchange matters was recognised in Q417
In June 2017, the Serious Fraud Office (SFO) brought certain charges against Barclays PLC in relation to matters that
arose in the context of Barclays‟ capital raisings in 2008. Further to that development, in February 2018, the SFO has
also charged BBPLC in respect of this matter
Certain legal proceedings and investigations relating to legacy issues remain outstanding. Resolving outstanding legacy
issues in an appropriate timeframe and manner will continue to be a priority
IFRS 9 Financial Instruments1 IFRS 9 Financial Instruments is effective for periods beginning on or after 1 January 2018. Barclays‟ estimated IFRS 9
impact is a decrease in shareholders‟ equity of approximately £2.2bn post-tax. The estimated reduction in shareholders‟
equity equates to a decrease in tangible net asset value of approximately 13p per share
The Group‟s CET1 ratio will be impacted by IFRS 9 primarily from an increase in credit impairment provisions net of tax,
offset by a reduction in the regulatory deduction where expected loss is greater than impairment
As at 1 January 2018, the expected fully loaded CET1 ratio impact without transitional arrangements would be an
estimated reduction of approximately 34bps. The Group intends to use transitional arrangements, under which the
impact is negligible as at 1 January 2018 and is expected to remain immaterial during 2018
1 Note:
– The estimated decrease in shareholders’ equity includes the impact of both balance sheet classification and measurement changes, and the increase to
credit impairment provisions compared to those at 31 December 2017 under IAS 39.
– This impact assessment has been estimated under an interim control environment with models that continue to undergo validation. The
implementation of the comprehensive end state control environment will continue as Barclays introduces business-as-usual controls throughout 2018.
Group Finance Director’s Review
Barclays PLC 7
Structural reform Barclays‟ plans for UK ring-fencing remain on track. The relevant court processes began in November 2017 with the
Sanction Hearing to be held on 26 and 27 February 2018 at which the Court will be requested to sanction Barclays‟ ring-
fencing transfer scheme. We intend to complete the reorganisation and establish the UK ring-fenced bank in April 2018,
ahead of the 1 January 2019 legislative deadline for implementation
Barclays Services Limited (the “Group Service Company”) was established in September 2017 as a direct subsidiary of
Barclays PLC to deliver operational continuity and to drive operational efficiencies across the Group
Illustrative, unaudited pro-forma financials for Barclays Bank UK PLC (BBUKPLC) and BBPLC will be available at
home.barclays/annualreport
Dividends A final dividend for 2017 of 2.0p per share will be paid on 5 April 2018, resulting in a total 3.0p dividend per share for
the year
Barclays understands the importance of the ordinary dividend for our shareholders. Barclays is therefore committed to
maintaining an appropriate balance between total cash returns to shareholders, investment in the business and
maintaining a strong capital position. Going forward, Barclays intends to pay an annual ordinary dividend that takes into
account these objectives and the medium-term earnings outlook of the Group. It is also the Board‟s intention to
supplement the ordinary dividends with additional returns to shareholders as and when appropriate
For 2018, Barclays anticipates resuming a total cash dividend of 6.5p per share, subject to regulatory approvals
Outlook and financial targets The Group is targeting RoTE, excluding litigation and conduct, of greater than 9% in 2019 and greater than 10% in
2020, based on a Group CET1 ratio of c.13%
Guidance for Group operating expenses, excluding litigation and conduct, is £13.6-13.9bn in 2019
As part of the US Tax Cuts and Jobs Act, the US federal corporate income tax rate has been reduced from 35% to 21%
with effect from 1 January 2018. Given the Group‟s substantial US operations, this is expected to result in a reduction of
the Group‟s effective tax rate in 2018 and future periods to mid-20 percent. Some of the provisions introduced into US
tax law by the Act are complex and present uncertainties, in particular the new US Base Erosion and Anti-Abuse Tax
(BEAT). Our current expectation is that in the event that BEAT liabilities are incurred by the Group these should not be
sufficiently material to cause the Group‟s effective tax rate to exceed mid-20 percent
Tushar Morzaria, Group Finance Director
Results by Business
Barclays PLC 8
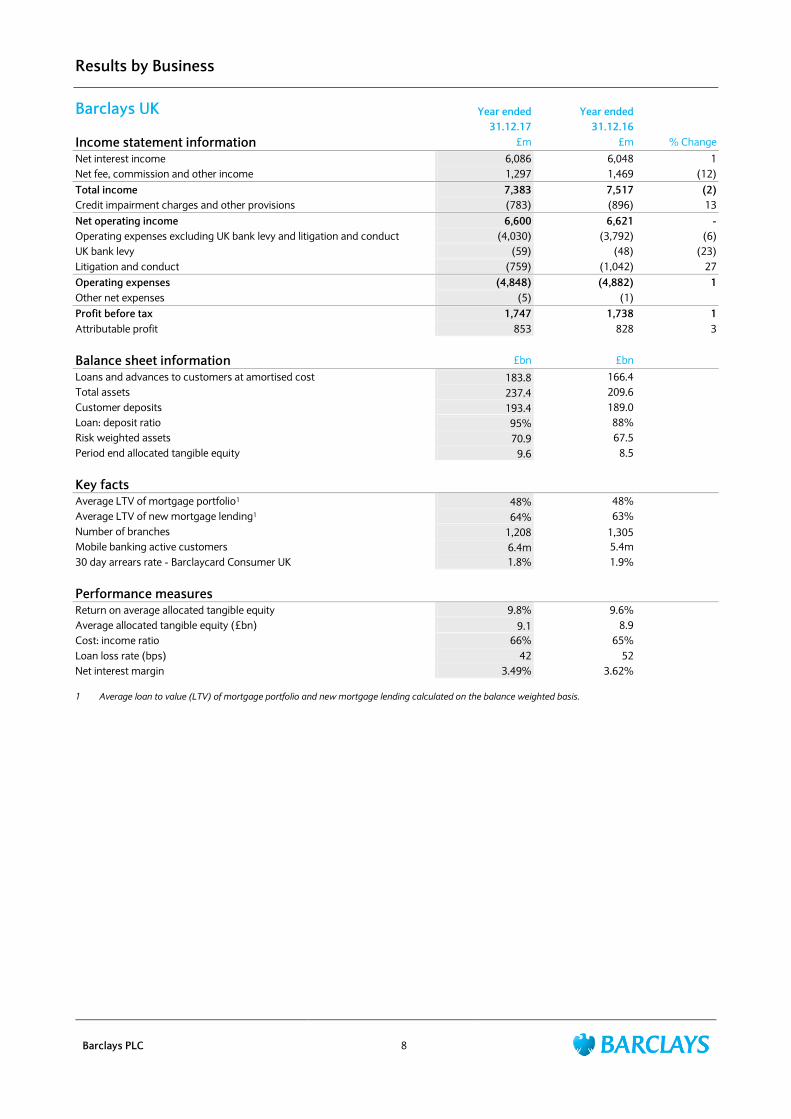
Barclays UK Year ended Year ended 31.12.17 31.12.16
Income statement information £m £m % Change
Net interest income 6,086 6,048 1
Net fee, commission and other income 1,297 1,469 (12)
Total income 7,383 7,517 (2)
Credit impairment charges and other provisions (783) (896) 13
Net operating income 6,600 6,621 -
Operating expenses excluding UK bank levy and litigation and conduct (4,030) (3,792) (6)
UK bank levy (59) (48) (23)
Litigation and conduct (759) (1,042) 27
Operating expenses (4,848) (4,882) 1
Other net expenses (5) (1)
Profit before tax 1,747 1,738 1
Attributable profit 853 828 3
Balance sheet information £bn £bn
Loans and advances to customers at amortised cost 183.8 166.4
Total assets 237.4 209.6
Customer deposits 193.4 189.0
Loan: deposit ratio 95% 88%
Risk weighted assets 70.9 67.5
Period end allocated tangible equity 9.6 8.5
Key facts
Average LTV of mortgage portfolio1 48% 48%
Average LTV of new mortgage lending1 64% 63%
Number of branches 1,208 1,305
Mobile banking active customers 6.4m 5.4m
30 day arrears rate - Barclaycard Consumer UK 1.8% 1.9%
Performance measures
Return on average allocated tangible equity 9.8% 9.6%
Average allocated tangible equity (£bn) 9.1 8.9
Cost: income ratio 66% 65%
Loan loss rate (bps) 42 52
Net interest margin 3.49% 3.62%
1 Average loan to value (LTV) of mortgage portfolio and new mortgage lending calculated on the balance weighted basis.
Results by Business
Barclays PLC 9
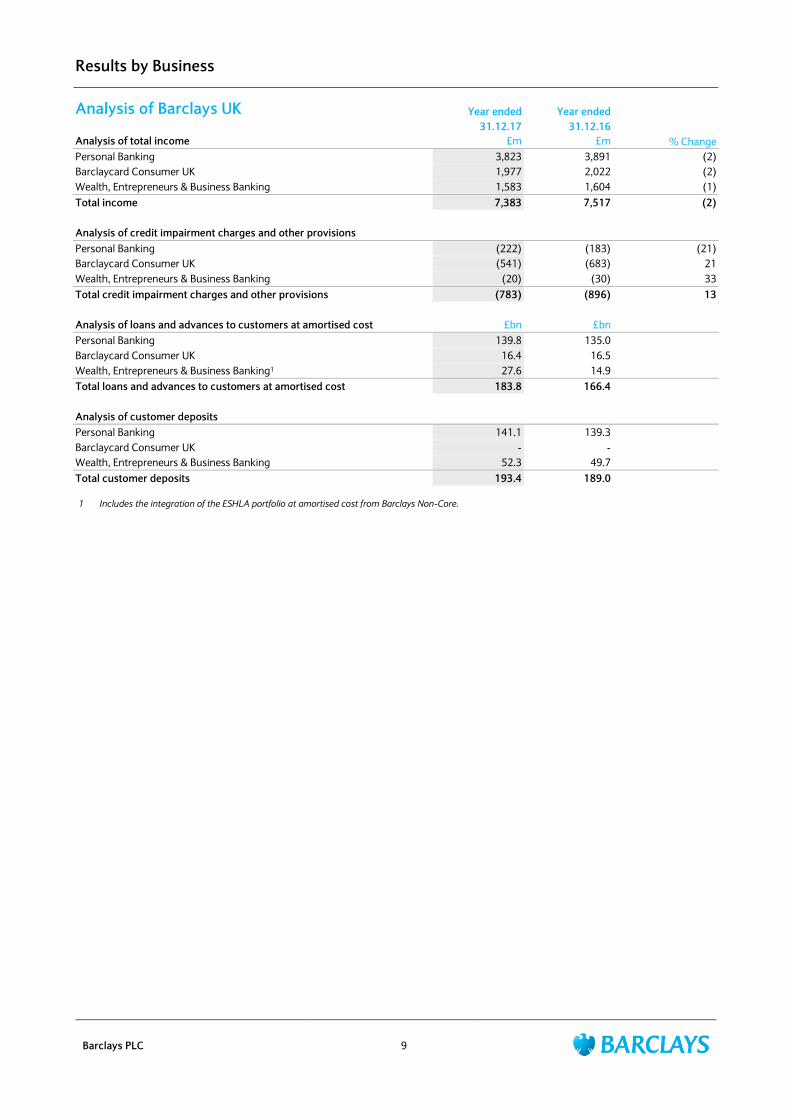
Analysis of Barclays UK Year ended Year ended 31.12.17 31.12.16
Analysis of total income £m £m % Change
Personal Banking 3,823 3,891 (2)
Barclaycard Consumer UK 1,977 2,022 (2)
Wealth, Entrepreneurs & Business Banking 1,583 1,604 (1)
Total income 7,383 7,517 (2)
Analysis of credit impairment charges and other provisions
Personal Banking (222) (183) (21)
Barclaycard Consumer UK (541) (683) 21
Wealth, Entrepreneurs & Business Banking (20) (30) 33
Total credit impairment charges and other provisions (783) (896) 13
Analysis of loans and advances to customers at amortised cost £bn £bn
Personal Banking 139.8 135.0
Barclaycard Consumer UK 16.4 16.5
Wealth, Entrepreneurs & Business Banking1 27.6 14.9
Total loans and advances to customers at amortised cost 183.8 166.4
Analysis of customer deposits
Personal Banking 141.1 139.3
Barclaycard Consumer UK - -
Wealth, Entrepreneurs & Business Banking 52.3 49.7
Total customer deposits 193.4 189.0
1 Includes the integration of the ESHLA portfolio at amortised cost from Barclays Non-Core.
Results by Business
Barclays PLC 10
2017 compared to 2016 Income statement
Profit before tax increased 1% to £1,747m as lower PPI charges of £700m (2016: £1,000m) and a reduction in credit
impairment charges were partially offset by the non-recurrence of the gain on disposal of Barclays‟ share of Visa Europe
Limited in 2016, higher costs of setting up the ring-fenced bank and increased investment, primarily in cyber resilience,
digital and technology
Total income decreased 2% to £7,383m, of which £151m reflected the non-recurrence of the gain on disposal of
Barclays‟ share of Visa Europe Limited in 2016
– Personal Banking income decreased 2% to £3,823m driven by the non-recurrence of the Visa gain and the impact of
the UK base rate reduction in 2016, partially offset by deposit pricing initiatives, growth in balances and an update to
effective interest rate (EIR) modelling
– Barclaycard Consumer UK income decreased 2% to £1,977m reflecting a provision for remediation in H217
– Wealth, Entrepreneurs & Business Banking (WEBB) income decreased 1% to £1,583m driven by the non-recurrence
of the Visa gain, partially offset by growth in balances
– Net interest income increased 1% to £6,086m due to deposit pricing initiatives and growth in loans and advances to
customers and deposits, partially offset by the impact of the UK base rate reduction in 2016
– Net interest margin decreased 13bps to 3.49% reflecting the integration of the Education, Social Housing and
Local Authority (ESHLA) portfolio from Non-Core on 1 July 2017
– Net fee, commission and other income decreased 12% to £1,297m driven by the non-recurrence of the Visa gain
Credit impairment charges decreased 13% to £783m principally reflecting the non-recurrence of a £200m charge in
2016 following the management review of the cards portfolio impairment modelling, partially offset by higher charges
in Barclaycard Consumer UK and Personal Banking
Operating expenses decreased 1% to £4,848m due to lower charges for PPI of £700m (2016: £1,000m), partially offset
by the costs of setting up the ring-fenced bank and increased investment, primarily in cyber resilience, digital and
technology. The cost: income ratio was 66% (2016: 65%)
Balance sheet
Loans and advances to customers increased 10% to £183.8bn and total assets increased 13% to £237.4bn, reflecting
the integration of the ESHLA portfolio from Non-Core into WEBB on 1 July 2017 and mortgage growth in Personal
Banking in H217
Customer deposits increased 2% to £193.4bn due to deposit growth, partially offset by the realignment of certain
clients between Barclays UK and Barclays International in preparation for structural reform
RWAs increased to £70.9bn (December 2016: £67.5bn) reflecting the integration of the ESHLA portfolio
Results by Business
Barclays PLC 11
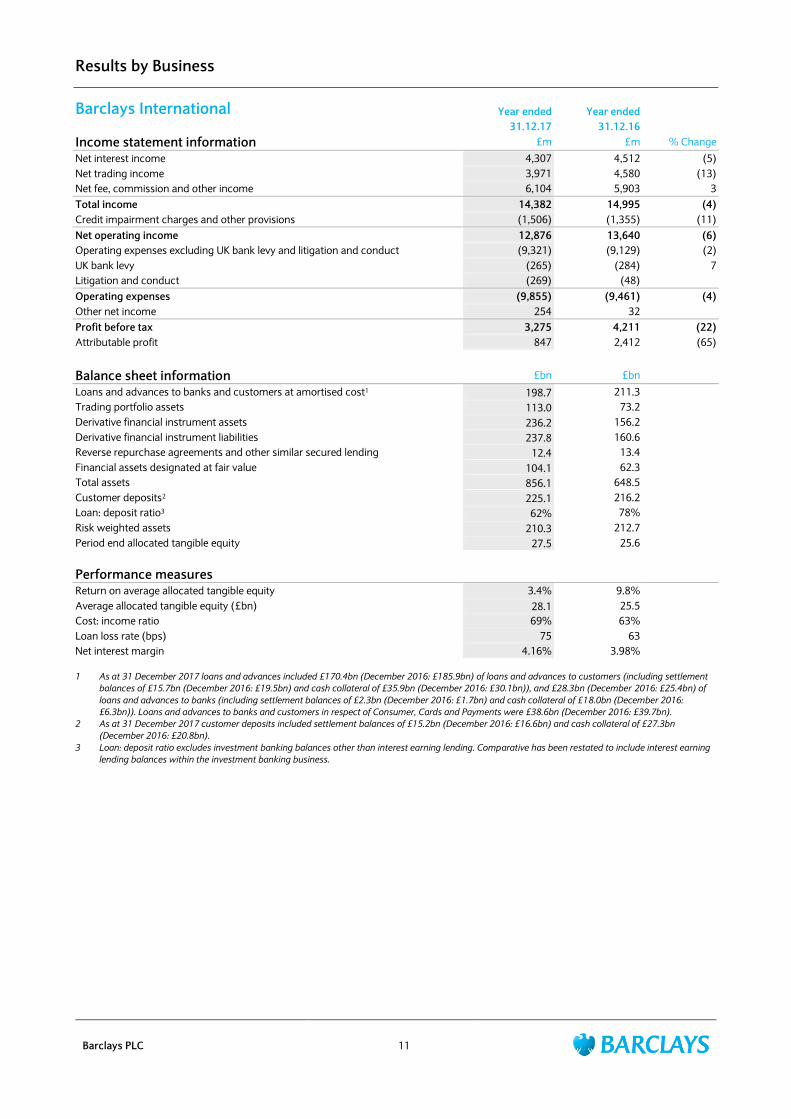
Barclays International Year ended Year ended
31.12.17 31.12.16
Income statement information £m £m % Change
Net interest income 4,307 4,512 (5)
Net trading income 3,971 4,580 (13)
Net fee, commission and other income 6,104 5,903 3
Total income 14,382 14,995 (4)
Credit impairment charges and other provisions (1,506) (1,355) (11)
Net operating income 12,876 13,640 (6)
Operating expenses excluding UK bank levy and litigation and conduct (9,321) (9,129) (2)
UK bank levy (265) (284) 7
Litigation and conduct (269) (48)
Operating expenses (9,855) (9,461) (4)
Other net income 254 32
Profit before tax 3,275 4,211 (22)
Attributable profit 847 2,412 (65)
Balance sheet information £bn £bn
Loans and advances to banks and customers at amortised cost1 198.7 211.3
Trading portfolio assets 113.0 73.2
Derivative financial instrument assets 236.2 156.2
Derivative financial instrument liabilities 237.8 160.6
Reverse repurchase agreements and other similar secured lending 12.4 13.4
Financial assets designated at fair value 104.1 62.3
Total assets 856.1 648.5
Customer deposits2 225.1 216.2
Loan: deposit ratio3 62% 78%
Risk weighted assets 210.3 212.7
Period end allocated tangible equity 27.5 25.6
Performance measures
Return on average allocated tangible equity 3.4% 9.8%
Average allocated tangible equity (£bn) 28.1 25.5
Cost: income ratio 69% 63%
Loan loss rate (bps) 75 63
Net interest margin 4.16% 3.98%
1 As at 31 December 2017 loans and advances included £170.4bn (December 2016: £185.9bn) of loans and advances to customers (including settlement
balances of £15.7bn (December 2016: £19.5bn) and cash collateral of £35.9bn (December 2016: £30.1bn)), and £28.3bn (December 2016: £25.4bn) of
loans and advances to banks (including settlement balances of £2.3bn (December 2016: £1.7bn) and cash collateral of £18.0bn (December 2016:
£6.3bn)). Loans and advances to banks and customers in respect of Consumer, Cards and Payments were £38.6bn (December 2016: £39.7bn).
2 As at 31 December 2017 customer deposits included settlement balances of £15.2bn (December 2016: £16.6bn) and cash collateral of £27.3bn
(December 2016: £20.8bn).
3 Loan: deposit ratio excludes investment banking balances other than interest earning lending. Comparative has been restated to include interest earning
lending balances within the investment banking business.
Results by Business
Barclays PLC 12
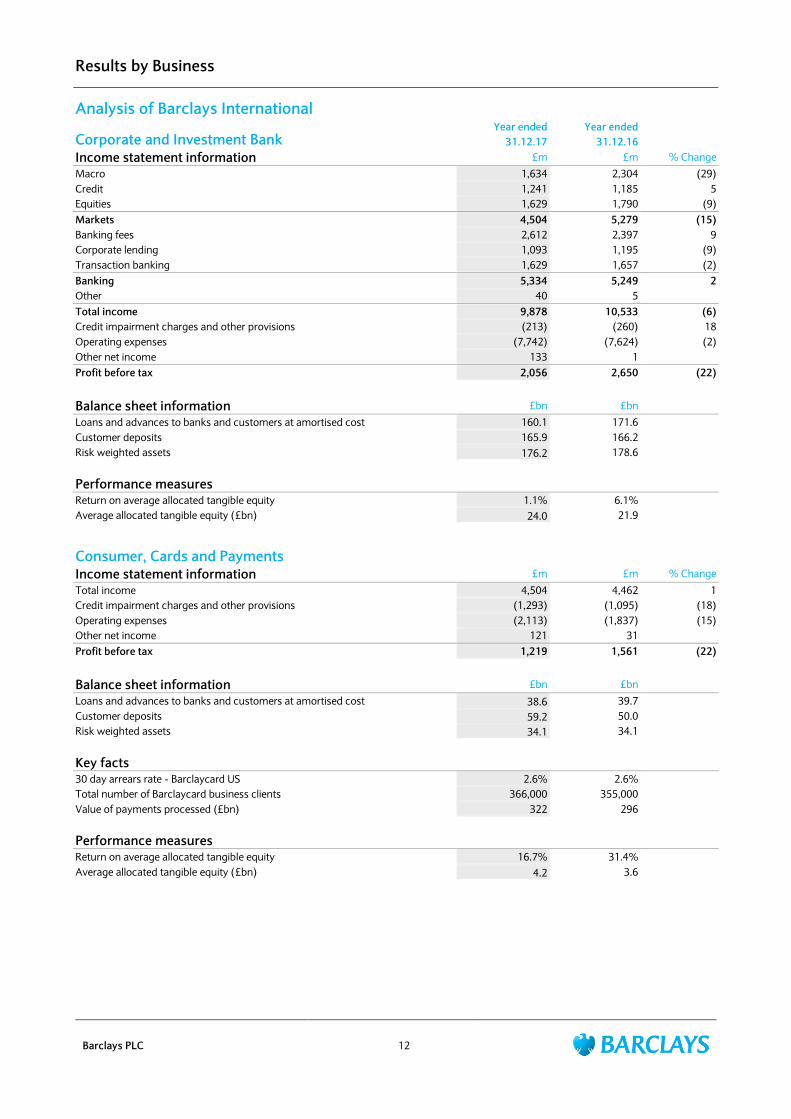
Analysis of Barclays International
Corporate and Investment Bank Year ended Year ended
31.12.17 31.12.16
Income statement information £m £m % Change
Macro 1,634 2,304 (29)
Credit 1,241 1,185 5
Equities 1,629 1,790 (9)
Markets 4,504 5,279 (15)
Banking fees 2,612 2,397 9
Corporate lending 1,093 1,195 (9)
Transaction banking 1,629 1,657 (2)
Banking 5,334 5,249 2
Other 40 5
Total income 9,878 10,533 (6)
Credit impairment charges and other provisions (213) (260) 18
Operating expenses (7,742) (7,624) (2)
Other net income 133 1
Profit before tax 2,056 2,650 (22)
Balance sheet information £bn £bn
Loans and advances to banks and customers at amortised cost 160.1 171.6
Customer deposits 165.9 166.2
Risk weighted assets 176.2 178.6
Performance measures
Return on average allocated tangible equity 1.1% 6.1%
Average allocated tangible equity (£bn) 24.0 21.9
Consumer, Cards and Payments
Income statement information £m £m % Change
Total income 4,504 4,462 1
Credit impairment charges and other provisions (1,293) (1,095) (18)
Operating expenses (2,113) (1,837) (15)
Other net income 121 31
Profit before tax 1,219 1,561 (22)
Balance sheet information £bn £bn
Loans and advances to banks and customers at amortised cost 38.6 39.7
Customer deposits 59.2 50.0
Risk weighted assets 34.1 34.1
Key facts
30 day arrears rate - Barclaycard US 2.6% 2.6%
Total number of Barclaycard business clients 366,000 355,000
Value of payments processed (£bn) 322 296
Performance measures
Return on average allocated tangible equity 16.7% 31.4%
Average allocated tangible equity (£bn) 4.2 3.6
Results by Business
Barclays PLC 13
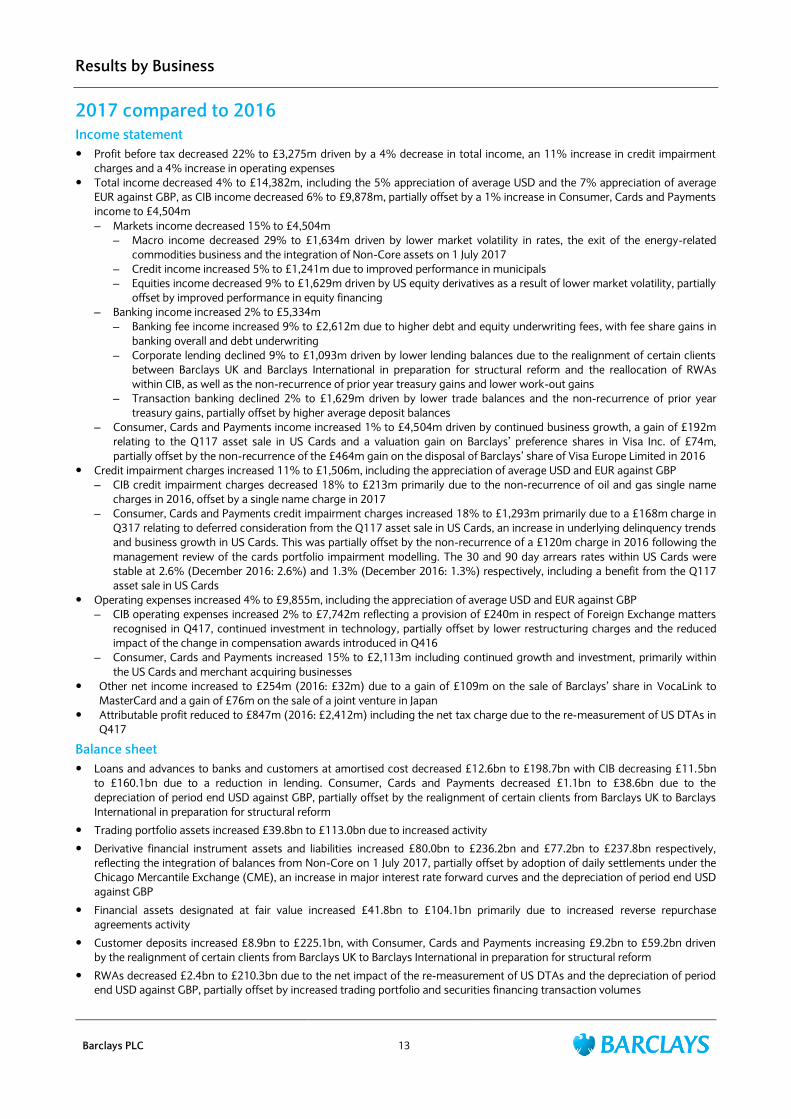
2017 compared to 2016 Income statement
Profit before tax decreased 22% to £3,275m driven by a 4% decrease in total income, an 11% increase in credit impairment
charges and a 4% increase in operating expenses
Total income decreased 4% to £14,382m, including the 5% appreciation of average USD and the 7% appreciation of average
EUR against GBP, as CIB income decreased 6% to £9,878m, partially offset by a 1% increase in Consumer, Cards and Payments
income to £4,504m
– Markets income decreased 15% to £4,504m
– Macro income decreased 29% to £1,634m driven by lower market volatility in rates, the exit of the energy-related
commodities business and the integration of Non-Core assets on 1 July 2017
– Credit income increased 5% to £1,241m due to improved performance in municipals
– Equities income decreased 9% to £1,629m driven by US equity derivatives as a result of lower market volatility, partially
offset by improved performance in equity financing
– Banking income increased 2% to £5,334m
– Banking fee income increased 9% to £2,612m due to higher debt and equity underwriting fees, with fee share gains in
banking overall and debt underwriting
– Corporate lending declined 9% to £1,093m driven by lower lending balances due to the realignment of certain clients
between Barclays UK and Barclays International in preparation for structural reform and the reallocation of RWAs
within CIB, as well as the non-recurrence of prior year treasury gains and lower work-out gains
– Transaction banking declined 2% to £1,629m driven by lower trade balances and the non-recurrence of prior year
treasury gains, partially offset by higher average deposit balances
– Consumer, Cards and Payments income increased 1% to £4,504m driven by continued business growth, a gain of £192m
relating to the Q117 asset sale in US Cards and a valuation gain on Barclays‟ preference shares in Visa Inc. of £74m,
partially offset by the non-recurrence of the £464m gain on the disposal of Barclays‟ share of Visa Europe Limited in 2016
Credit impairment charges increased 11% to £1,506m, including the appreciation of average USD and EUR against GBP
– CIB credit impairment charges decreased 18% to £213m primarily due to the non-recurrence of oil and gas single name
charges in 2016, offset by a single name charge in 2017
– Consumer, Cards and Payments credit impairment charges increased 18% to £1,293m primarily due to a £168m charge in
Q317 relating to deferred consideration from the Q117 asset sale in US Cards, an increase in underlying delinquency trends
and business growth in US Cards. This was partially offset by the non-recurrence of a £120m charge in 2016 following the
management review of the cards portfolio impairment modelling. The 30 and 90 day arrears rates within US Cards were
stable at 2.6% (December 2016: 2.6%) and 1.3% (December 2016: 1.3%) respectively, including a benefit from the Q117
asset sale in US Cards
Operating expenses increased 4% to £9,855m, including the appreciation of average USD and EUR against GBP
– CIB operating expenses increased 2% to £7,742m reflecting a provision of £240m in respect of Foreign Exchange matters
recognised in Q417, continued investment in technology, partially offset by lower restructuring charges and the reduced
impact of the change in compensation awards introduced in Q416
– Consumer, Cards and Payments increased 15% to £2,113m including continued growth and investment, primarily within
the US Cards and merchant acquiring businesses
Other net income increased to £254m (2016: £32m) due to a gain of £109m on the sale of Barclays‟ share in VocaLink to
MasterCard and a gain of £76m on the sale of a joint venture in Japan
Attributable profit reduced to £847m (2016: £2,412m) including the net tax charge due to the re-measurement of US DTAs in
Q417
Balance sheet
Loans and advances to banks and customers at amortised cost decreased £12.6bn to £198.7bn with CIB decreasing £11.5bn
to £160.1bn due to a reduction in lending. Consumer, Cards and Payments decreased £1.1bn to £38.6bn due to the
depreciation of period end USD against GBP, partially offset by the realignment of certain clients from Barclays UK to Barclays
International in preparation for structural reform
Trading portfolio assets increased £39.8bn to £113.0bn due to increased activity
Derivative financial instrument assets and liabilities increased £80.0bn to £236.2bn and £77.2bn to £237.8bn respectively,
reflecting the integration of balances from Non-Core on 1 July 2017, partially offset by adoption of daily settlements under the
Chicago Mercantile Exchange (CME), an increase in major interest rate forward curves and the depreciation of period end USD
against GBP
Financial assets designated at fair value increased £41.8bn to £104.1bn primarily due to increased reverse repurchase
agreements activity
Customer deposits increased £8.9bn to £225.1bn, with Consumer, Cards and Payments increasing £9.2bn to £59.2bn driven
by the realignment of certain clients from Barclays UK to Barclays International in preparation for structural reform
RWAs decreased £2.4bn to £210.3bn due to the net impact of the re-measurement of US DTAs and the depreciation of period
end USD against GBP, partially offset by increased trading portfolio and securities financing transaction volumes
Results by Business
Barclays PLC 14
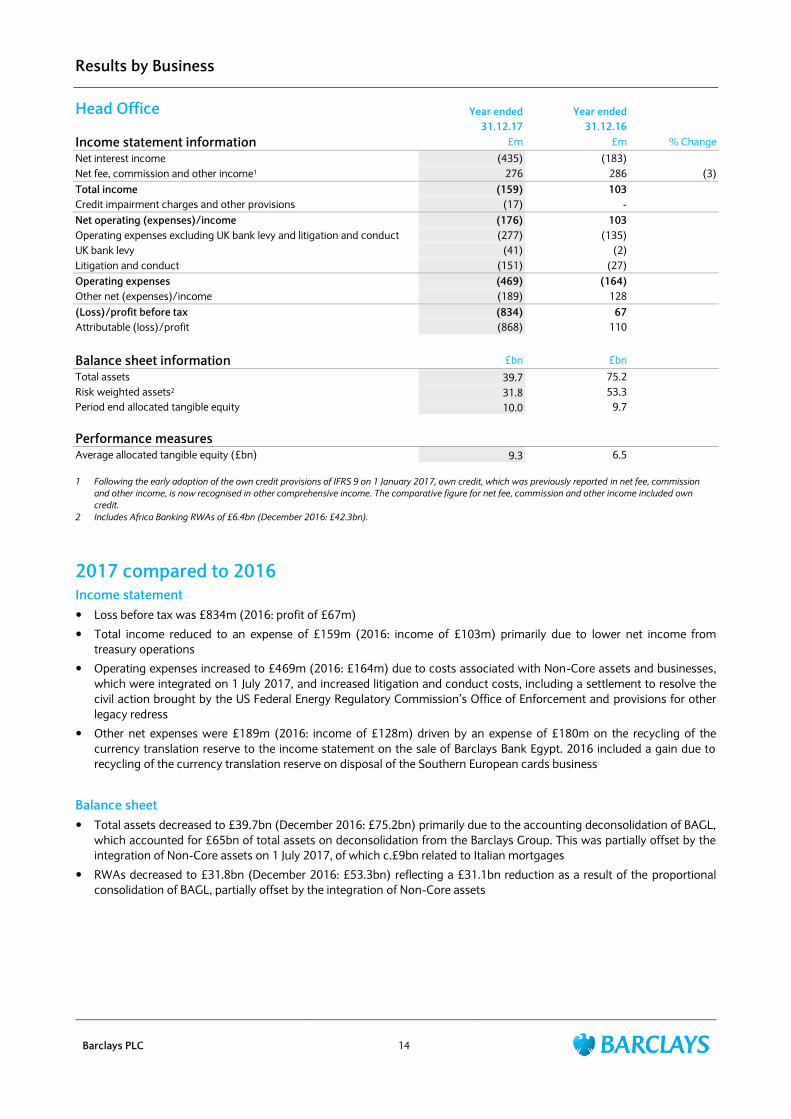
Head Office Year ended Year ended 31.12.17 31.12.16
Income statement information £m £m % Change
Net interest income (435) (183)
Net fee, commission and other income1 276 286 (3)
Total income (159) 103
Credit impairment charges and other provisions (17) -
Net operating (expenses)/income (176) 103
Operating expenses excluding UK bank levy and litigation and conduct (277) (135)
UK bank levy (41) (2)
Litigation and conduct (151) (27)
Operating expenses (469) (164)
Other net (expenses)/income (189) 128
(Loss)/profit before tax (834) 67
Attributable (loss)/profit (868) 110
Balance sheet information £bn £bn
Total assets 39.7 75.2
Risk weighted assets2 31.8 53.3
Period end allocated tangible equity 10.0 9.7
Performance measures
Average allocated tangible equity (£bn) 9.3 6.5
1 Following the early adoption of the own credit provisions of IFRS 9 on 1 January 2017, own credit, which was previously reported in net fee, commission
and other income, is now recognised in other comprehensive income. The comparative figure for net fee, commission and other income included own
credit.
2 Includes Africa Banking RWAs of £6.4bn (December 2016: £42.3bn).
2017 compared to 2016 Income statement
Loss before tax was £834m (2016: profit of £67m)
Total income reduced to an expense of £159m (2016: income of £103m) primarily due to lower net income from
treasury operations
Operating expenses increased to £469m (2016: £164m) due to costs associated with Non-Core assets and businesses,
which were integrated on 1 July 2017, and increased litigation and conduct costs, including a settlement to resolve the
civil action brought by the US Federal Energy Regulatory Commission‟s Office of Enforcement and provisions for other
legacy redress
Other net expenses were £189m (2016: income of £128m) driven by an expense of £180m on the recycling of the
currency translation reserve to the income statement on the sale of Barclays Bank Egypt. 2016 included a gain due to
recycling of the currency translation reserve on disposal of the Southern European cards business
Balance sheet
Total assets decreased to £39.7bn (December 2016: £75.2bn) primarily due to the accounting deconsolidation of BAGL,
which accounted for £65bn of total assets on deconsolidation from the Barclays Group. This was partially offset by the
integration of Non-Core assets on 1 July 2017, of which c.£9bn related to Italian mortgages
RWAs decreased to £31.8bn (December 2016: £53.3bn) reflecting a £31.1bn reduction as a result of the proportional
consolidation of BAGL, partially offset by the integration of Non-Core assets
Barclays Non-Core Results
Barclays PLC 15
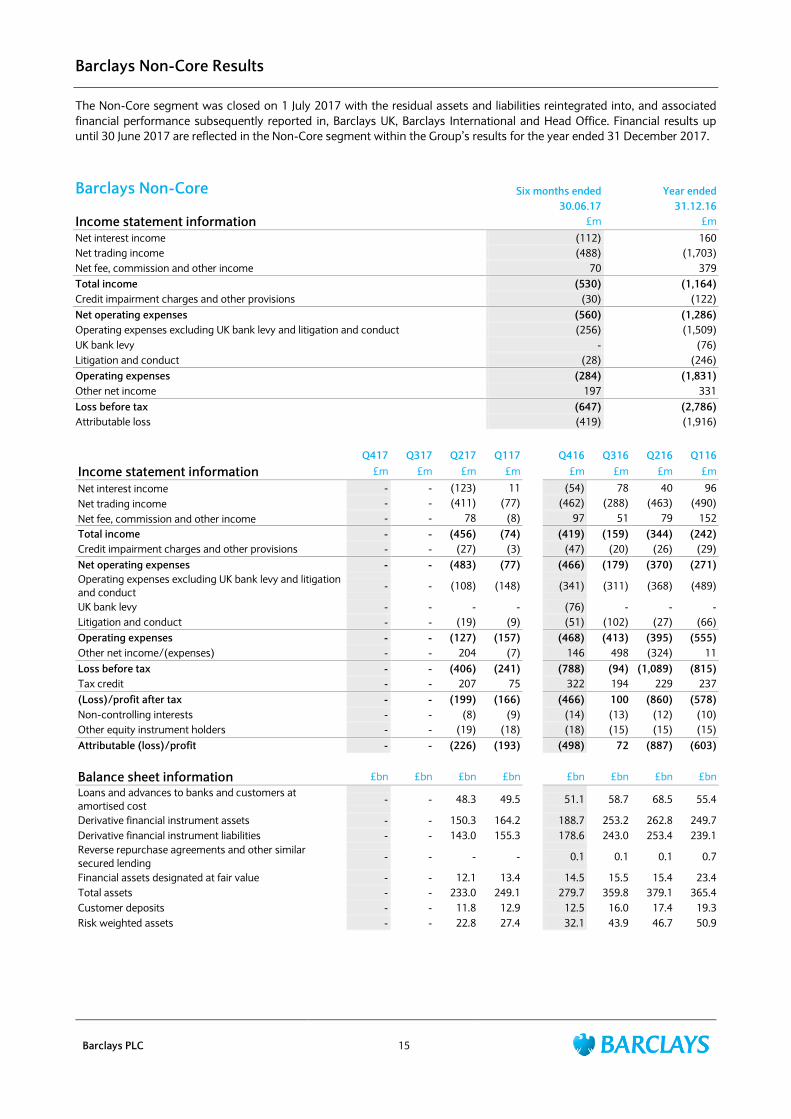
The Non-Core segment was closed on 1 July 2017 with the residual assets and liabilities reintegrated into, and associated
financial performance subsequently reported in, Barclays UK, Barclays International and Head Office. Financial results up
until 30 June 2017 are reflected in the Non-Core segment within the Group‟s results for the year ended 31 December 2017.
Barclays Non-Core Six months ended Year ended
30.06.17 31.12.16
Income statement information £m £m
Net interest income (112) 160
Net trading income (488) (1,703)
Net fee, commission and other income 70 379
Total income (530) (1,164)
Credit impairment charges and other provisions (30) (122)
Net operating expenses (560) (1,286)
Operating expenses excluding UK bank levy and litigation and conduct (256) (1,509)
UK bank levy - (76)
Litigation and conduct (28) (246)
Operating expenses (284) (1,831)
Other net income 197 331
Loss before tax (647) (2,786)
Attributable loss (419) (1,916)
Q417 Q317 Q217 Q117 Q416 Q316 Q216 Q116
Income statement information £m £m £m £m £m £m £m £m
Net interest income - - (123) 11 (54) 78 40 96
Net trading income - - (411) (77) (462) (288) (463) (490)
Net fee, commission and other income - - 78 (8) 97 51 79 152
Total income - - (456) (74) (419) (159) (344) (242)
Credit impairment charges and other provisions - - (27) (3) (47) (20) (26) (29)
Net operating expenses - - (483) (77) (466) (179) (370) (271)
Operating expenses excluding UK bank levy and litigation
and conduct - - (108) (148) (341) (311) (368) (489)
UK bank levy - - - - (76) - - -
Litigation and conduct - - (19) (9) (51) (102) (27) (66)
Operating expenses - - (127) (157) (468) (413) (395) (555)
Other net income/(expenses) - - 204 (7) 146 498 (324) 11
Loss before tax - - (406) (241) (788) (94) (1,089) (815)
Tax credit - - 207 75 322 194 229 237
(Loss)/profit after tax - - (199) (166) (466) 100 (860) (578)
Non-controlling interests - - (8) (9) (14) (13) (12) (10)
Other equity instrument holders - - (19) (18) (18) (15) (15) (15)
Attributable (loss)/profit - - (226) (193) (498) 72 (887) (603)
Balance sheet information £bn £bn £bn £bn £bn £bn £bn £bn
Loans and advances to banks and customers at
amortised cost - - 48.3 49.5 51.1 58.7 68.5 55.4
Derivative financial instrument assets - - 150.3 164.2 188.7 253.2 262.8 249.7
Derivative financial instrument liabilities - - 143.0 155.3 178.6 243.0 253.4 239.1
Reverse repurchase agreements and other similar
secured lending - - - - 0.1 0.1 0.1 0.7
Financial assets designated at fair value - - 12.1 13.4 14.5 15.5 15.4 23.4
Total assets - - 233.0 249.1 279.7 359.8 379.1 365.4
Customer deposits - - 11.8 12.9 12.5 16.0 17.4 19.3
Risk weighted assets - - 22.8 27.4 32.1 43.9 46.7 50.9
Discontinued Operation Results
Barclays PLC 16
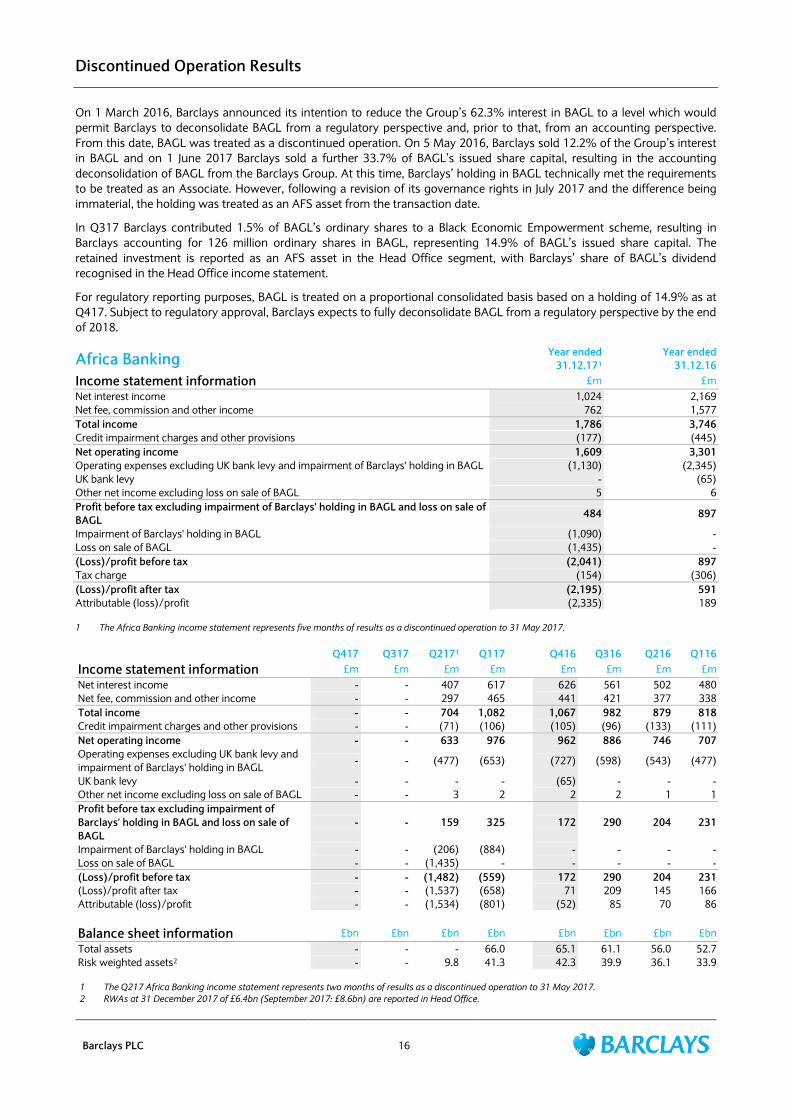
On 1 March 2016, Barclays announced its intention to reduce the Group‟s 62.3% interest in BAGL to a level which would
permit Barclays to deconsolidate BAGL from a regulatory perspective and, prior to that, from an accounting perspective.
From this date, BAGL was treated as a discontinued operation. On 5 May 2016, Barclays sold 12.2% of the Group‟s interest
in BAGL and on 1 June 2017 Barclays sold a further 33.7% of BAGL‟s issued share capital, resulting in the accounting
deconsolidation of BAGL from the Barclays Group. At this time, Barclays‟ holding in BAGL technically met the requirements
to be treated as an Associate. However, following a revision of its governance rights in July 2017 and the difference being
immaterial, the holding was treated as an AFS asset from the transaction date.
In Q317 Barclays contributed 1.5% of BAGL‟s ordinary shares to a Black Economic Empowerment scheme, resulting in
Barclays accounting for 126 million ordinary shares in BAGL, representing 14.9% of BAGL‟s issued share capital. The
retained investment is reported as an AFS asset in the Head Office segment, with Barclays‟ share of BAGL‟s dividend
recognised in the Head Office income statement.
For regulatory reporting purposes, BAGL is treated on a proportional consolidated basis based on a holding of 14.9% as at
Q417. Subject to regulatory approval, Barclays expects to fully deconsolidate BAGL from a regulatory perspective by the end
of 2018.
Africa Banking Year ended Year ended
31.12.171 31.12.16
Income statement information £m £m
Net interest income 1,024 2,169
Net fee, commission and other income 762 1,577
Total income 1,786 3,746
Credit impairment charges and other provisions (177) (445)
Net operating income 1,609 3,301
Operating expenses excluding UK bank levy and impairment of Barclays' holding in BAGL (1,130) (2,345)
UK bank levy - (65)
Other net income excluding loss on sale of BAGL 5 6
Profit before tax excluding impairment of Barclays' holding in BAGL and loss on sale of
BAGL 484 897
Impairment of Barclays' holding in BAGL (1,090) -
Loss on sale of BAGL (1,435) -
(Loss)/profit before tax (2,041) 897
Tax charge (154) (306)
(Loss)/profit after tax (2,195) 591
Attributable (loss)/profit (2,335) 189
1 The Africa Banking income statement represents five months of results as a discontinued operation to 31 May 2017.
Q417 Q317 Q2171 Q117 Q416 Q316 Q216 Q116
Income statement information £m £m £m £m £m £m £m £m
Net interest income - - 407 617 626 561 502 480
Net fee, commission and other income - - 297 465 441 421 377 338
Total income - - 704 1,082 1,067 982 879 818
Credit impairment charges and other provisions - - (71) (106) (105) (96) (133) (111)
Net operating income - - 633 976 962 886 746 707
Operating expenses excluding UK bank levy and
impairment of Barclays' holding in BAGL - - (477) (653) (727) (598) (543) (477)
UK bank levy - - - - (65) - - -
Other net income excluding loss on sale of BAGL - - 3 2 2 2 1 1
Profit before tax excluding impairment of
Barclays' holding in BAGL and loss on sale of
BAGL
- - 159 325 172 290 204 231
Impairment of Barclays' holding in BAGL - - (206) (884) - - - -
Loss on sale of BAGL - - (1,435) - - - - -
(Loss)/profit before tax - - (1,482) (559) 172 290 204 231
(Loss)/profit after tax - - (1,537) (658) 71 209 145 166
Attributable (loss)/profit - - (1,534) (801) (52) 85 70 86
Balance sheet information £bn £bn £bn £bn £bn £bn £bn £bn
Total assets - - - 66.0 65.1 61.1 56.0 52.7
Risk weighted assets2 - - 9.8 41.3 42.3 39.9 36.1 33.9
1 The Q217 Africa Banking income statement represents two months of results as a discontinued operation to 31 May 2017.
2 RWAs at 31 December 2017 of £6.4bn (September 2017: £8.6bn) are reported in Head Office.
Quarterly Results Summary
Barclays PLC 17
Barclays Group
Q417 Q317 Q217 Q117 Q416 Q316 Q216 Q116
Income statement information £m £m £m £m £m £m £m £m
Net interest income 2,272 2,475 2,579 2,519 2,523 2,796 2,530 2,688
Net fee, commission and other income 2,750 2,698 2,479 3,304 2,469 2,650 3,442 2,353
Total income 5,022 5,173 5,058 5,823 4,992 5,446 5,972 5,041
Credit impairment charges and other provisions (573) (709) (527) (527) (653) (789) (488) (443)
Net operating income 4,449 4,464 4,531 5,296 4,339 4,657 5,484 4,598
Operating expenses excluding UK bank levy and
litigation and conduct (3,621) (3,274) (3,398) (3,591) (3,812) (3,581) (3,425) (3,747)
UK bank levy (365) - - - (410) - - -
Litigation and conduct (383) (81) (715) (28) (97) (741) (447) (78)
Operating expenses (4,369) (3,355) (4,113) (3,619) (4,319) (4,322) (3,872) (3,825)
Other net income/(expenses) 13 (2) 241 5 310 502 (342) 20
Profit before tax 93 1,107 659 1,682 330 837 1,270 793
Tax (charge)/credit (1,138) (324) (305) (473) 50 (328) (467) (248)
(Loss)/profit after tax in respect of continuing
operations (1,045) 783 354 1,209 380 509 803 545
(Loss)/profit after tax in respect of discontinued
operation - - (1,537) (658) 71 209 145 166
Attributable to:
Ordinary equity holders of the parent (1,294) 583 (1,401) 190 99 414 677 433
Other equity instrument holders 181 157 162 139 139 110 104 104
Non-controlling interests 68 43 56 222 213 194 167 174
Balance sheet information £bn £bn £bn £bn £bn £bn £bn £bn
Total assets 1,133.2 1,149.3 1,135.3 1,203.8 1,213.1 1,324.0 1,351.3 1,248.9
Risk weighted assets 313.0 324.3 327.4 360.9 365.6 373.4 366.3 363.0
CRR leverage exposure 1,124.5 1,150.6 1,122.1 1,196.9 1,125.5 1,185.1 1,155.4 1,082.0
Performance measures
Return on average tangible shareholders' equity (10.3%) 5.1% (11.0%) 1.8% 1.1% 3.6% 5.8% 3.8%
Average tangible shareholders' equity (£bn) 48.1 48.9 49.3 49.4 48.9 49.4 48.3 48.3
Cost: income ratio 87% 65% 81% 62% 87% 79% 65% 76%
Loan loss rate (bps) 56 66 49 47 58 66 41 40
Basic (loss)/earnings per share (7.3p) 3.7p (8.0p) 1.3p 0.8p 2.6p 4.2p 2.7p
Basic (loss)/earnings per share in respect of
continuing operations (7.3p) 3.7p 1.0p 6.1p 1.1p 2.1p 3.8p 2.2p
Quarterly Results by Business
Barclays PLC 18
Barclays UK
Q417 Q317 Q217 Q117 Q416 Q316 Q216 Q116
Income statement information £m £m £m £m £m £m £m £m
Net interest income 1,540 1,501 1,534 1,511 1,502 1,569 1,476 1,501
Net fee, commission and other income 330 351 286 330 326 374 467 302
Total income 1,870 1,852 1,820 1,841 1,828 1,943 1,943 1,803
Credit impairment charges and other provisions (184) (201) (220) (178) (180) (350) (220) (146)
Net operating income 1,686 1,651 1,600 1,663 1,648 1,593 1,723 1,657
Operating expenses excluding UK bank levy and
litigation and conduct (1,117) (980) (974) (959) (989) (904) (947) (952)
UK bank levy (59) - - - (48) - - -
Litigation and conduct (53) (11) (699) 4 (28) (614) (399) (1)
Operating expenses (1,229) (991) (1,673) (955) (1,065) (1,518) (1,346) (953)
Other net (expenses)/income (5) 1 (1) - - - (1) -
Profit/(loss) before tax 452 661 (74) 708 583 75 376 704
Attributable profit/(loss) 245 423 (285) 470 383 (163) 141 467
Balance sheet information £bn £bn £bn £bn £bn £bn £bn £bn
Loans and advances to customers at amortised cost 183.8 182.2 166.6 164.5 166.4 166.6 166.0 166.2
Total assets 237.4 230.4 203.4 203.0 209.6 209.1 204.6 201.7
Customer deposits 193.4 189.3 187.4 184.4 189.0 185.5 181.7 179.1
Risk weighted assets 70.9 70.0 66.1 66.3 67.5 67.4 67.1 69.7
Performance measures
Return on average allocated tangible equity 10.7% 18.4% (12.7%) 21.6% 18.2% (7.1%) 6.6% 20.5%
Average allocated tangible equity (£bn) 9.6 9.4 8.7 8.9 8.6 8.7 9.0 9.3
Cost: income ratio 66% 54% 92% 52% 58% 78% 69% 53%
Loan loss rate (bps) 39 43 52 43 42 82 52 34
Net interest margin 3.32% 3.28% 3.70% 3.69% 3.56% 3.72% 3.56% 3.62%
Analysis of Barclays UK
Analysis of total income £m £m £m £m £m £m £m £m
Personal Banking 1,020 926 933 944 934 970 1,068 919
Barclaycard Consumer UK 445 539 495 498 507 561 463 491
Wealth, Entrepreneurs & Business Banking 405 387 392 399 387 412 412 393
Total income 1,870 1,852 1,820 1,841 1,828 1,943 1,943 1,803
Analysis of credit impairment (charges)/releases
and other provisions
Personal Banking (56) (60) (56) (50) (50) (47) (44) (42)
Barclaycard Consumer UK (124) (145) (149) (123) (118) (291) (169) (105)
Wealth, Entrepreneurs & Business Banking (4) 4 (15) (5) (12) (12) (7) 1
Total credit impairment charges and other
provisions (184) (201) (220) (178) (180) (350) (220) (146)
Analysis of loans and advances to customers at
amortised cost £bn £bn £bn £bn £bn £bn £bn £bn
Personal Banking 139.8 138.4 136.5 134.4 135.0 135.3 134.7 134.7
Barclaycard Consumer UK 16.4 16.3 16.2 16.1 16.5 16.2 16.2 16.0
Wealth, Entrepreneurs & Business Banking 27.6 27.5 13.9 14.0 14.9 15.1 15.1 15.5
Total loans and advances to customers at
amortised cost 183.8 182.2 166.6 164.5 166.4 166.6 166.0 166.2
Analysis of customer deposits
Personal Banking 141.1 140.1 138.5 137.3 139.3 137.2 134.8 132.9
Barclaycard Consumer UK - - - - - - - -
Wealth, Entrepreneurs & Business Banking 52.3 49.2 48.9 47.1 49.7 48.3 46.9 46.2
Total customer deposits 193.4 189.3 187.4 184.4 189.0 185.5 181.7 179.1
Quarterly Results by Business
Barclays PLC 19
Barclays International
Q417 Q317 Q217 Q117 Q416 Q316 Q216 Q116
Income statement information £m £m £m £m £m £m £m £m
Net interest income 987 1,148 1,060 1,112 1,046 1,355 1,001 1,110
Net trading income 935 815 1,039 1,182 1,131 1,074 1,130 1,245
Net fee, commission and other income 1,397 1,352 1,511 1,844 1,415 1,422 1,908 1,158
Total income 3,319 3,315 3,610 4,138 3,592 3,851 4,039 3,513
Credit impairment charges and other provisions (386) (495) (279) (346) (426) (420) (240) (269)
Net operating income 2,933 2,820 3,331 3,792 3,166 3,431 3,799 3,244
Operating expenses excluding UK bank levy and
litigation and conduct (2,428) (2,182) (2,276) (2,435) (2,497) (2,337) (2,074) (2,221)
UK bank levy (265) - - - (284) - - -
Litigation and conduct (255) (5) 4 (13) (17) (17) (10) (4)
Operating expenses (2,948) (2,187) (2,272) (2,448) (2,798) (2,354) (2,084) (2,225)
Other net income 21 19 202 12 5 8 11 8
Profit before tax 6 652 1,261 1,356 373 1,085 1,726 1,027
Attributable (loss)/profit (1,168) 359 819 837 43 623 1,171 575
Balance sheet information £bn £bn £bn £bn £bn £bn £bn £bn
Loans and advances to banks and customers at
amortised cost 198.7 220.7 204.8 226.1 211.3 233.7 230.6 215.9
Trading portfolio assets 113.0 91.2 83.3 83.0 73.2 73.8 68.1 64.3
Derivative financial instrument assets 236.2 242.8 108.4 105.3 156.2 155.6 181.4 150.1
Derivative financial instrument liabilities 237.8 242.9 116.8 112.8 160.6 160.5 187.5 155.4
Reverse repurchase agreements and other similar
secured lending 12.4 15.5 17.2 17.6 13.4 17.3 19.7 19.1
Financial assets designated at fair value 104.1 103.7 94.1 81.3 62.3 72.0 68.3 59.6
Total assets 856.1 867.1 681.6 677.2 648.5 681.9 679.9 618.4
Customer deposits 225.1 241.0 230.3 241.0 216.2 224.1 226.5 213.1
Risk weighted assets 210.3 218.2 212.2 214.3 212.7 214.6 209.3 202.2
Performance measures
Return on average allocated tangible equity (15.9%) 5.4% 12.4% 12.5% 1.0% 10.0% 19.2% 9.5%
Average allocated tangible equity (£bn) 28.5 28.9 27.4 27.7 26.6 25.7 24.8 25.1
Cost: income ratio 89% 66% 63% 59% 78% 61% 52% 63%
Loan loss rate (bps) 76 88 54 62 78 71 41 50
Net interest margin 4.31% 4.21% 4.07% 4.06% 3.91% 4.21% 3.92% 3.78%
Quarterly Results by Business
Barclays PLC 20
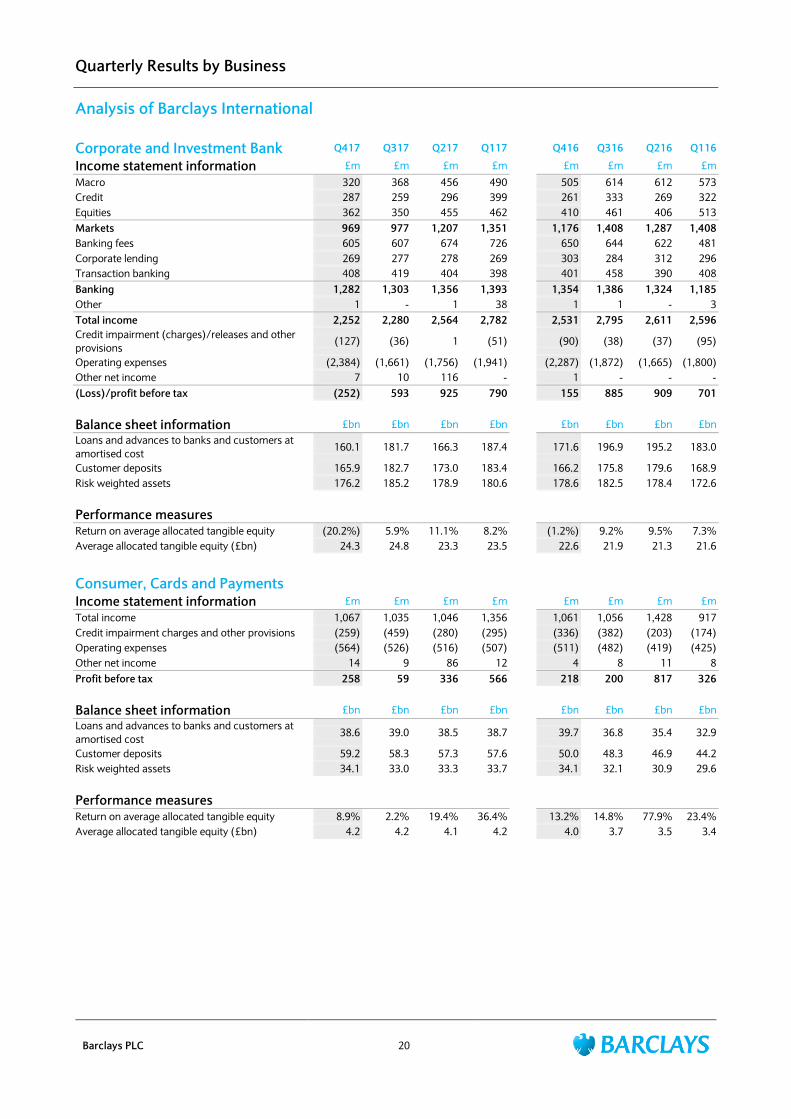
Analysis of Barclays International
Corporate and Investment Bank Q417 Q317 Q217 Q117 Q416 Q316 Q216 Q116
Income statement information £m £m £m £m £m £m £m £m
Macro 320 368 456 490 505 614 612 573
Credit 287 259 296 399 261 333 269 322
Equities 362 350 455 462 410 461 406 513
Markets 969 977 1,207 1,351 1,176 1,408 1,287 1,408
Banking fees 605 607 674 726 650 644 622 481
Corporate lending 269 277 278 269 303 284 312 296
Transaction banking 408 419 404 398 401 458 390 408
Banking 1,282 1,303 1,356 1,393 1,354 1,386 1,324 1,185
Other 1 - 1 38 1 1 - 3
Total income 2,252 2,280 2,564 2,782 2,531 2,795 2,611 2,596
Credit impairment (charges)/releases and other
provisions (127) (36) 1 (51) (90) (38) (37) (95)
Operating expenses (2,384) (1,661) (1,756) (1,941) (2,287) (1,872) (1,665) (1,800)
Other net income 7 10 116 - 1 - - -
(Loss)/profit before tax (252) 593 925 790 155 885 909 701
Balance sheet information £bn £bn £bn £bn £bn £bn £bn £bn
Loans and advances to banks and customers at
amortised cost 160.1 181.7 166.3 187.4 171.6 196.9 195.2 183.0
Customer deposits 165.9 182.7 173.0 183.4 166.2 175.8 179.6 168.9
Risk weighted assets 176.2 185.2 178.9 180.6 178.6 182.5 178.4 172.6
Performance measures
Return on average allocated tangible equity (20.2%) 5.9% 11.1% 8.2% (1.2%) 9.2% 9.5% 7.3%
Average allocated tangible equity (£bn) 24.3 24.8 23.3 23.5 22.6 21.9 21.3 21.6
Consumer, Cards and Payments
Income statement information £m £m £m £m £m £m £m £m
Total income 1,067 1,035 1,046 1,356 1,061 1,056 1,428 917
Credit impairment charges and other provisions (259) (459) (280) (295) (336) (382) (203) (174)
Operating expenses (564) (526) (516) (507) (511) (482) (419) (425)
Other net income 14 9 86 12 4 8 11 8
Profit before tax 258 59 336 566 218 200 817 326
Balance sheet information £bn £bn £bn £bn £bn £bn £bn £bn
Loans and advances to banks and customers at
amortised cost 38.6 39.0 38.5 38.7 39.7 36.8 35.4 32.9
Customer deposits 59.2 58.3 57.3 57.6 50.0 48.3 46.9 44.2
Risk weighted assets 34.1 33.0 33.3 33.7 34.1 32.1 30.9 29.6
Performance measures
Return on average allocated tangible equity 8.9% 2.2% 19.4% 36.4% 13.2% 14.8% 77.9% 23.4%
Average allocated tangible equity (£bn) 4.2 4.2 4.1 4.2 4.0 3.7 3.5 3.4
Quarterly Results by Business
Barclays PLC 21
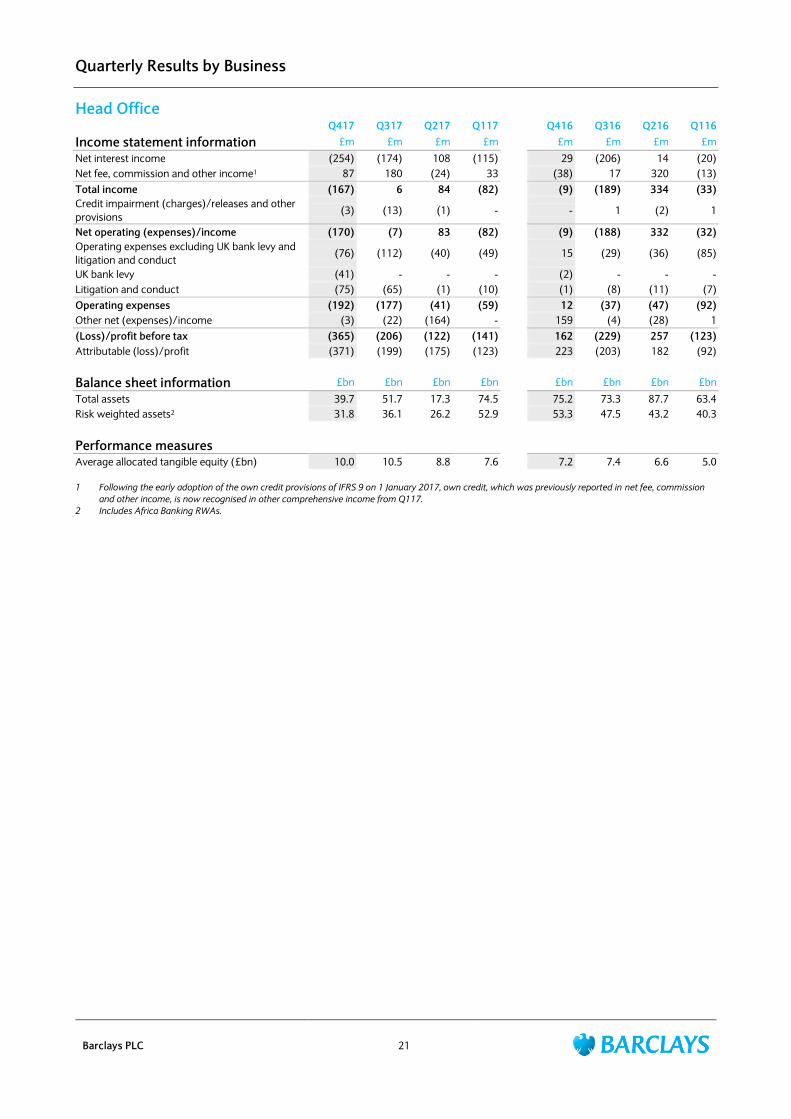
Head Office
Q417 Q317 Q217 Q117 Q416 Q316 Q216 Q116
Income statement information £m £m £m £m £m £m £m £m
Net interest income (254) (174) 108 (115) 29 (206) 14 (20)
Net fee, commission and other income1 87 180 (24) 33 (38) 17 320 (13)
Total income (167) 6 84 (82) (9) (189) 334 (33)
Credit impairment (charges)/releases and other
provisions (3) (13) (1) - - 1 (2) 1
Net operating (expenses)/income (170) (7) 83 (82) (9) (188) 332 (32)
Operating expenses excluding UK bank levy and
litigation and conduct (76) (112) (40) (49) 15 (29) (36) (85)
UK bank levy (41) - - - (2) - - -
Litigation and conduct (75) (65) (1) (10) (1) (8) (11) (7)
Operating expenses (192) (177) (41) (59) 12 (37) (47) (92)
Other net (expenses)/income (3) (22) (164) - 159 (4) (28) 1
(Loss)/profit before tax (365) (206) (122) (141) 162 (229) 257 (123)
Attributable (loss)/profit (371) (199) (175) (123) 223 (203) 182 (92)
Balance sheet information £bn £bn £bn £bn £bn £bn £bn £bn
Total assets 39.7 51.7 17.3 74.5 75.2 73.3 87.7 63.4
Risk weighted assets2 31.8 36.1 26.2 52.9 53.3 47.5 43.2 40.3
Performance measures
Average allocated tangible equity (£bn) 10.0 10.5 8.8 7.6 7.2 7.4 6.6 5.0
1 Following the early adoption of the own credit provisions of IFRS 9 on 1 January 2017, own credit, which was previously reported in net fee, commission
and other income, is now recognised in other comprehensive income from Q117.
2 Includes Africa Banking RWAs.
Performance Management
Barclays PLC 22
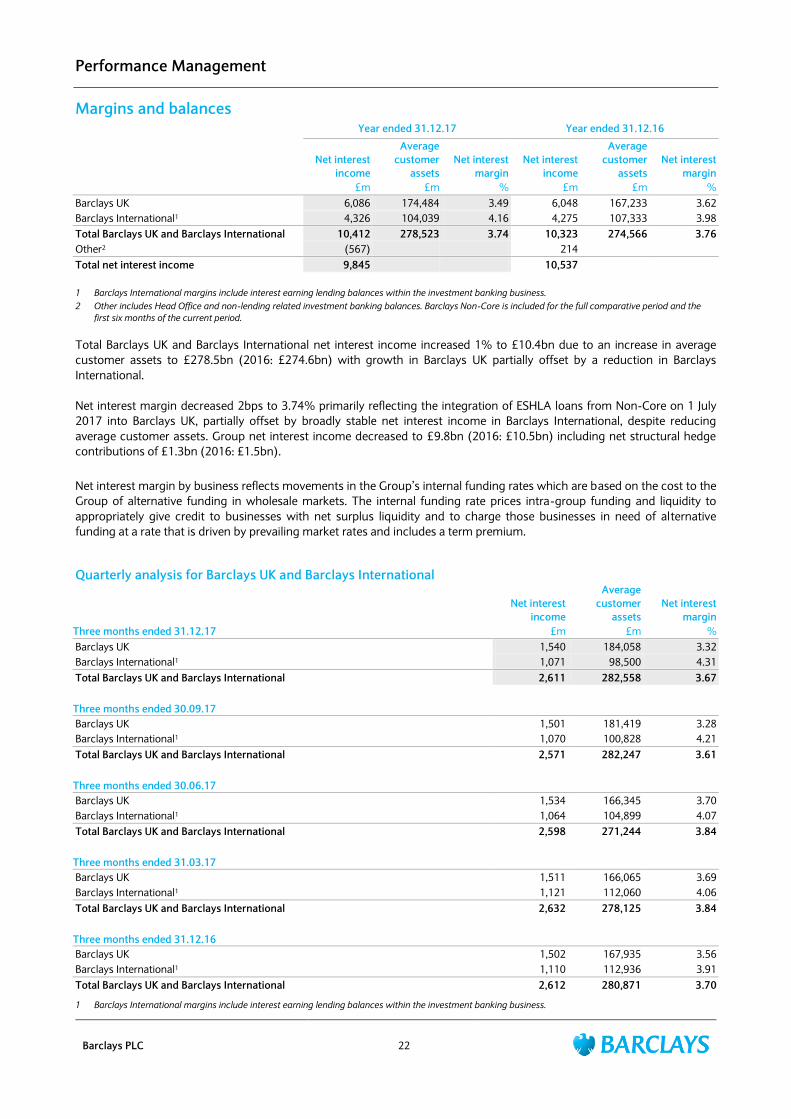
Margins and balances
Year ended 31.12.17 Year ended 31.12.16
Net interest
income
Average
customer
assets
Net interest
margin
Net interest
income
Average
customer
assets
Net interest
margin
£m £m % £m £m %
Barclays UK 6,086 174,484 3.49 6,048 167,233 3.62
Barclays International1 4,326 104,039 4.16 4,275 107,333 3.98
Total Barclays UK and Barclays International 10,412 278,523 3.74 10,323 274,566 3.76
Other2 (567) 214
Total net interest income 9,845 10,537
1 Barclays International margins include interest earning lending balances within the investment banking business.
2 Other includes Head Office and non-lending related investment banking balances. Barclays Non-Core is included for the full comparative period and the
first six months of the current period.
Total Barclays UK and Barclays International net interest income increased 1% to £10.4bn due to an increase in average
customer assets to £278.5bn (2016: £274.6bn) with growth in Barclays UK partially offset by a reduction in Barclays
International.
Net interest margin decreased 2bps to 3.74% primarily reflecting the integration of ESHLA loans from Non-Core on 1 July
2017 into Barclays UK, partially offset by broadly stable net interest income in Barclays International, despite reducing
average customer assets. Group net interest income decreased to £9.8bn (2016: £10.5bn) including net structural hedge
contributions of £1.3bn (2016: £1.5bn).
Net interest margin by business reflects movements in the Group‟s internal funding rates which are based on the cost to the
Group of alternative funding in wholesale markets. The internal funding rate prices intra-group funding and liquidity to
appropriately give credit to businesses with net surplus liquidity and to charge those businesses in need of alternative
funding at a rate that is driven by prevailing market rates and includes a term premium.
Quarterly analysis for Barclays UK and Barclays International
Net interest
income
Average
customer
assets
Net interest
margin
Three months ended 31.12.17 £m £m %
Barclays UK 1,540 184,058 3.32
Barclays International1 1,071 98,500 4.31
Total Barclays UK and Barclays International 2,611 282,558 3.67
Three months ended 30.09.17
Barclays UK 1,501 181,419 3.28
Barclays International1 1,070 100,828 4.21
Total Barclays UK and Barclays International 2,571 282,247 3.61
Three months ended 30.06.17
Barclays UK 1,534 166,345 3.70
Barclays International1 1,064 104,899 4.07
Total Barclays UK and Barclays International 2,598 271,244 3.84
Three months ended 31.03.17
Barclays UK 1,511 166,065 3.69
Barclays International1 1,121 112,060 4.06
Total Barclays UK and Barclays International 2,632 278,125 3.84
Three months ended 31.12.16
Barclays UK 1,502 167,935 3.56
Barclays International1 1,110 112,936 3.91
Total Barclays UK and Barclays International 2,612 280,871 3.70
1 Barclays International margins include interest earning lending balances within the investment banking business.
Performance Management
Barclays PLC 23
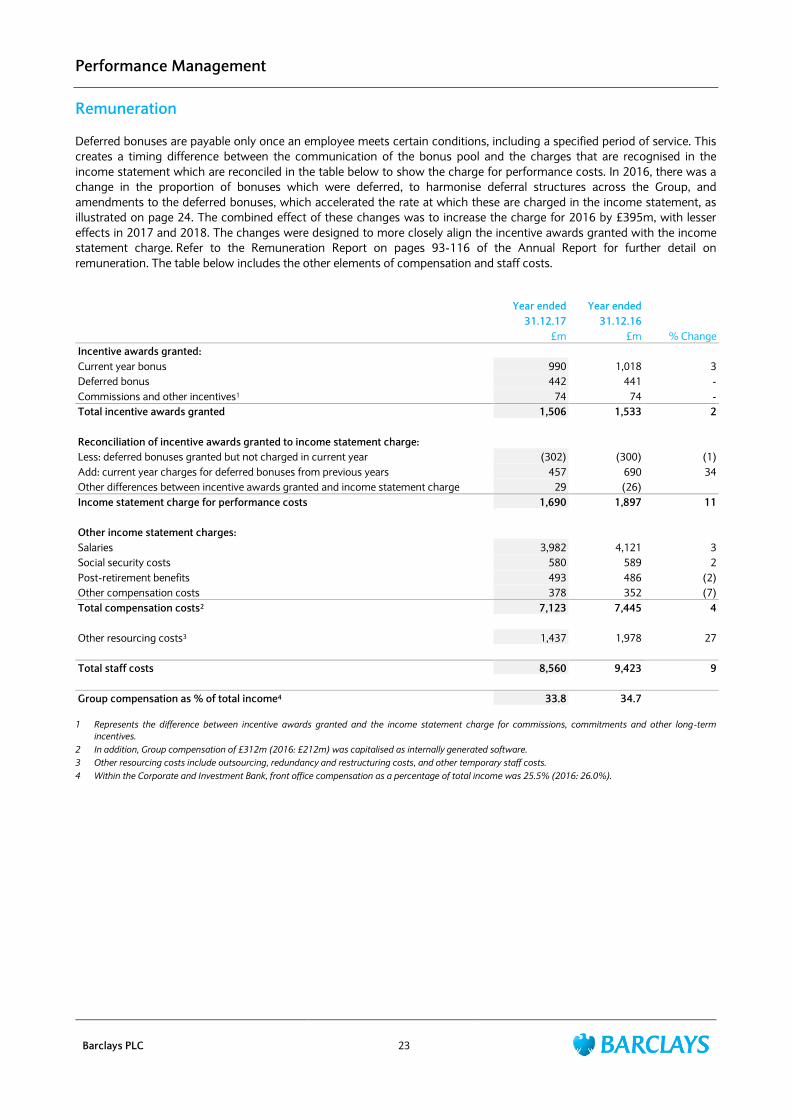
Remuneration
Deferred bonuses are payable only once an employee meets certain conditions, including a specified period of service. This
creates a timing difference between the communication of the bonus pool and the charges that are recognised in the
income statement which are reconciled in the table below to show the charge for performance costs. In 2016, there was a
change in the proportion of bonuses which were deferred, to harmonise deferral structures across the Group, and
amendments to the deferred bonuses, which accelerated the rate at which these are charged in the income statement, as
illustrated on page 24. The combined effect of these changes was to increase the charge for 2016 by £395m, with lesser
effects in 2017 and 2018. The changes were designed to more closely align the incentive awards granted with the income
statement charge. Refer to the Remuneration Report on pages 93-116 of the Annual Report for further detail on
remuneration. The table below includes the other elements of compensation and staff costs.
Year ended Year ended
31.12.17 31.12.16
£m £m % Change
Incentive awards granted:
Current year bonus 990 1,018 3
Deferred bonus 442 441 -
Commissions and other incentives1 74 74 -
Total incentive awards granted 1,506 1,533 2
Reconciliation of incentive awards granted to income statement charge:
Less: deferred bonuses granted but not charged in current year (302) (300) (1)
Add: current year charges for deferred bonuses from previous years 457 690 34
Other differences between incentive awards granted and income statement charge 29 (26)
Income statement charge for performance costs 1,690 1,897 11
Other income statement charges:
Salaries 3,982 4,121 3
Social security costs 580 589 2
Post-retirement benefits 493 486 (2)
Other compensation costs 378 352 (7)
Total compensation costs2 7,123 7,445 4
Other resourcing costs3 1,437 1,978 27
Total staff costs 8,560 9,423 9
Group compensation as % of total income4 33.8 34.7
1 Represents the difference between incentive awards granted and the income statement charge for commissions, commitments and other long-term
incentives.
2 In addition, Group compensation of £312m (2016: £212m) was capitalised as internally generated software.
3 Other resourcing costs include outsourcing, redundancy and restructuring costs, and other temporary staff costs.
4 Within the Corporate and Investment Bank, front office compensation as a percentage of total income was 25.5% (2016: 26.0%).
Performance Management
Barclays PLC 24
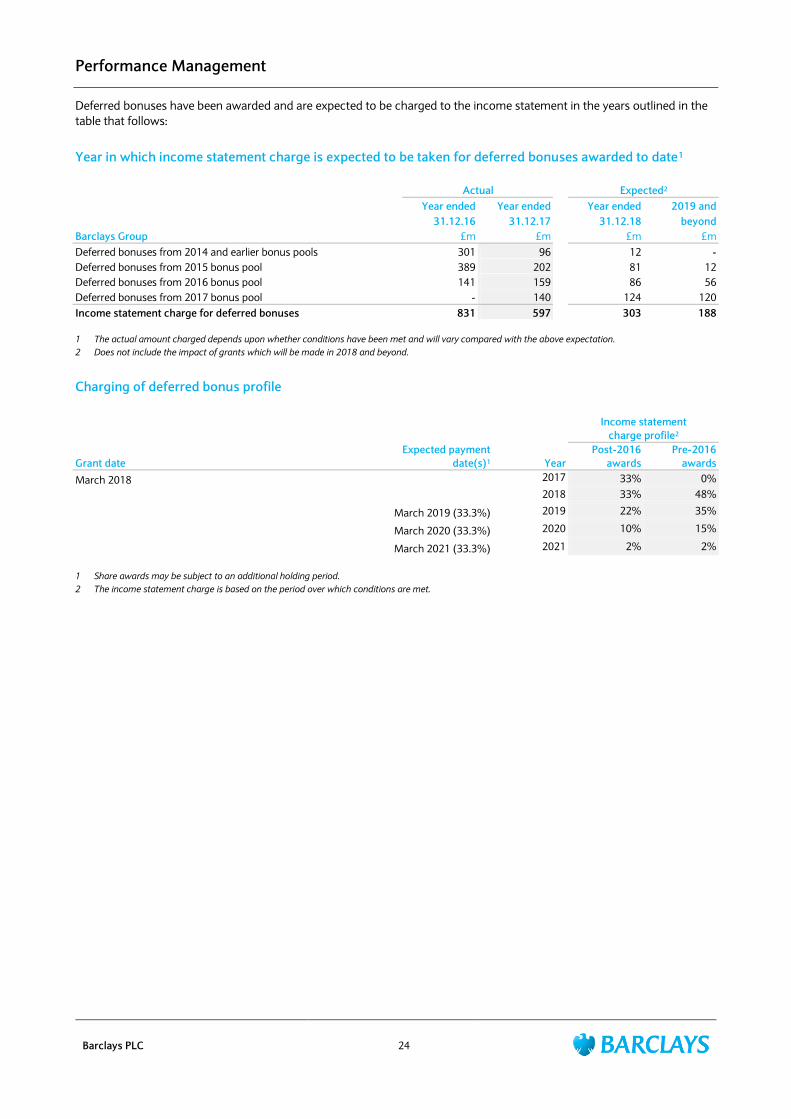
Deferred bonuses have been awarded and are expected to be charged to the income statement in the years outlined in the
table that follows:
Year in which income statement charge is expected to be taken for deferred bonuses awarded to date1
Actual Expected2
Year ended Year ended Year ended 2019 and
31.12.16 31.12.17 31.12.18 beyond
Barclays Group £m £m £m £m
Deferred bonuses from 2014 and earlier bonus pools 301 96 12 -
Deferred bonuses from 2015 bonus pool 389 202 81 12
Deferred bonuses from 2016 bonus pool 141 159 86 56
Deferred bonuses from 2017 bonus pool - 140 124 120
Income statement charge for deferred bonuses 831 597 303 188
1 The actual amount charged depends upon whether conditions have been met and will vary compared with the above expectation.
2 Does not include the impact of grants which will be made in 2018 and beyond.
Charging of deferred bonus profile
Income statement
charge profile2
Grant date
Expected payment
date(s)1 Year
Post-2016
awards
Pre-2016
awards
March 2018 2017 33% 0%
2018 33% 48%
March 2019 (33.3%) 2019 22% 35%
March 2020 (33.3%) 2020 10% 15%
March 2021 (33.3%) 2021 2% 2%
1 Share awards may be subject to an additional holding period.
2 The income statement charge is based on the period over which conditions are met.
Risk Management
Barclays PLC 25
Risk management and principal risks
The roles and responsibilities of the business groups, Risk and Compliance, in the management of risk in the firm are
defined in the Enterprise Risk Management Framework. The purpose of the framework is to identify the principal risks of
the firm, the process by which the firm sets its appetite for these risks in its business activities, and the consequent limits
which it places on related risk taking. The framework identifies eight principal risks: Credit Risk; Market Risk; Treasury and
Capital Risk; Operational Risk; Conduct Risk; Reputation Risk; Model Risk; and Legal Risk. Further detail on these risks and
how they are managed is available in the 2017 Annual Report or online at: home.barclays/annualreport.
The following section gives an overview of Credit Risk and Treasury and Capital Risk for the period.
Credit Risk
Barclays PLC 26
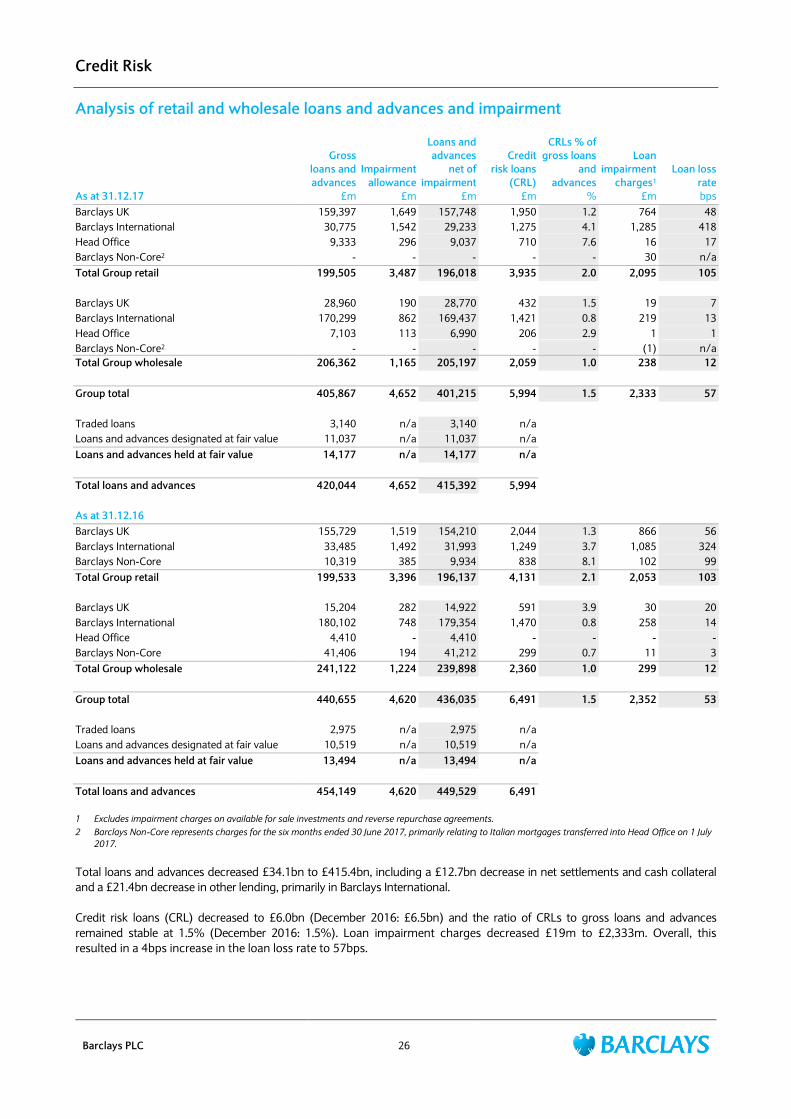
Analysis of retail and wholesale loans and advances and impairment
Gross
loans and
advances
Impairment
allowance
Loans and
advances
net of
impairment
Credit
risk loans
(CRL)
CRLs % of
gross loans
and
advances
Loan
impairment
charges1
Loan loss
rate
As at 31.12.17 £m £m £m £m % £m bps
Barclays UK 159,397 1,649 157,748 1,950 1.2 764 48
Barclays International 30,775 1,542 29,233 1,275 4.1 1,285 418
Head Office 9,333 296 9,037 710 7.6 16 17
Barclays Non-Core2 - - - - - 30 n/a
Total Group retail 199,505 3,487 196,018 3,935 2.0 2,095 105
Barclays UK 28,960 190 28,770 432 1.5 19 7
Barclays International 170,299 862 169,437 1,421 0.8 219 13
Head Office 7,103 113 6,990 206 2.9 1 1
Barclays Non-Core2 - - - - - (1) n/a
Total Group wholesale 206,362 1,165 205,197 2,059 1.0 238 12
Group total 405,867 4,652 401,215 5,994 1.5 2,333 57
Traded loans 3,140 n/a 3,140 n/a
Loans and advances designated at fair value 11,037 n/a 11,037 n/a
Loans and advances held at fair value 14,177 n/a 14,177 n/a
Total loans and advances 420,044 4,652 415,392 5,994
As at 31.12.16
Barclays UK 155,729 1,519 154,210 2,044 1.3 866 56
Barclays International 33,485 1,492 31,993 1,249 3.7 1,085 324
Barclays Non-Core 10,319 385 9,934 838 8.1 102 99
Total Group retail 199,533 3,396 196,137 4,131 2.1 2,053 103
Barclays UK 15,204 282 14,922 591 3.9 30 20
Barclays International 180,102 748 179,354 1,470 0.8 258 14
Head Office 4,410 - 4,410 - - - -
Barclays Non-Core 41,406 194 41,212 299 0.7 11 3
Total Group wholesale 241,122 1,224 239,898 2,360 1.0 299 12
Group total 440,655 4,620 436,035 6,491 1.5 2,352 53
Traded loans 2,975 n/a 2,975 n/a
Loans and advances designated at fair value 10,519 n/a 10,519 n/a
Loans and advances held at fair value 13,494 n/a 13,494 n/a
Total loans and advances 454,149 4,620 449,529 6,491
1 Excludes impairment charges on available for sale investments and reverse repurchase agreements.
2 Barclays Non-Core represents charges for the six months ended 30 June 2017, primarily relating to Italian mortgages transferred into Head Office on 1 July
2017.
Total loans and advances decreased £34.1bn to £415.4bn, including a £12.7bn decrease in net settlements and cash collateral
and a £21.4bn decrease in other lending, primarily in Barclays International.
Credit risk loans (CRL) decreased to £6.0bn (December 2016: £6.5bn) and the ratio of CRLs to gross loans and advances
remained stable at 1.5% (December 2016: 1.5%). Loan impairment charges decreased £19m to £2,333m. Overall, this
resulted in a 4bps increase in the loan loss rate to 57bps.
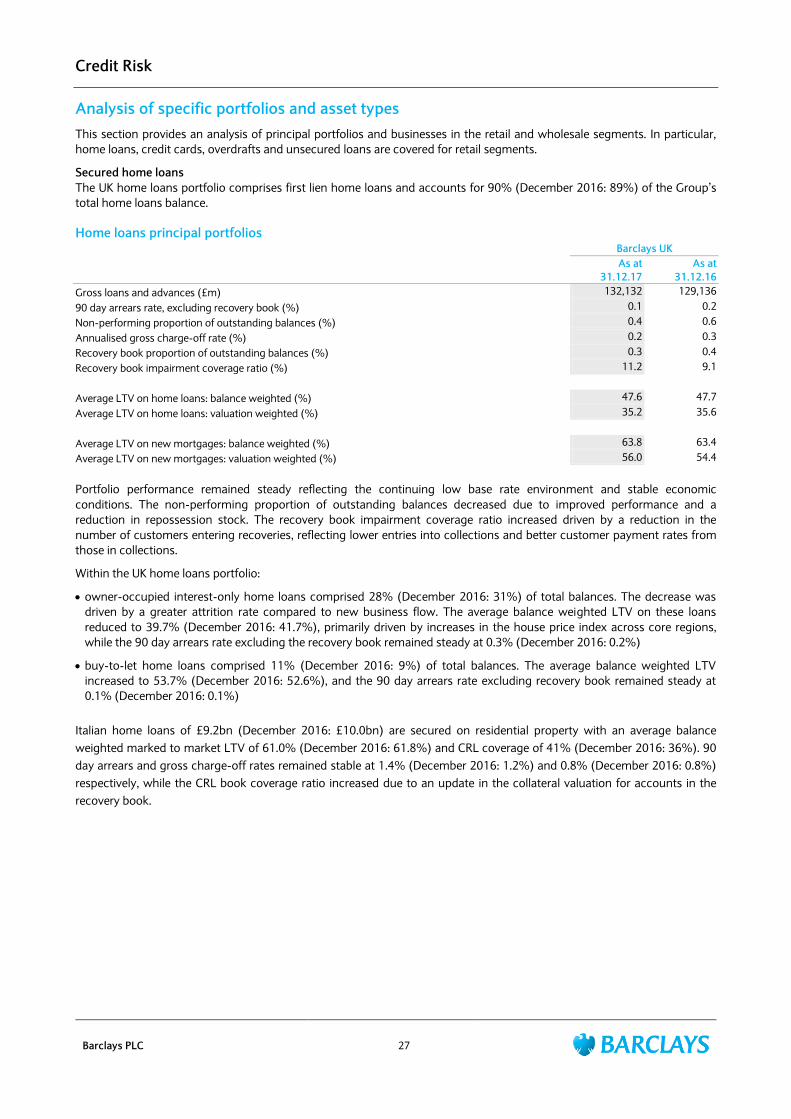
Credit Risk
Barclays PLC 27
Analysis of specific portfolios and asset types
This section provides an analysis of principal portfolios and businesses in the retail and wholesale segments. In particular,
home loans, credit cards, overdrafts and unsecured loans are covered for retail segments.
Secured home loans
The UK home loans portfolio comprises first lien home loans and accounts for 90% (December 2016: 89%) of the Group‟s
total home loans balance. Home loans principal portfolios
Barclays UK
As at
31.12.17
As at
31.12.16
Gross loans and advances (£m) 132,132 129,136
90 day arrears rate, excluding recovery book (%) 0.1 0.2
Non-performing proportion of outstanding balances (%) 0.4 0.6
Annualised gross charge-off rate (%) 0.2 0.3
Recovery book proportion of outstanding balances (%) 0.3 0.4
Recovery book impairment coverage ratio (%) 11.2 9.1
Average LTV on home loans: balance weighted (%) 47.6 47.7
Average LTV on home loans: valuation weighted (%) 35.2 35.6
Average LTV on new mortgages: balance weighted (%) 63.8 63.4
Average LTV on new mortgages: valuation weighted (%) 56.0 54.4
Portfolio performance remained steady reflecting the continuing low base rate environment and stable economic
conditions. The non-performing proportion of outstanding balances decreased due to improved performance and a
reduction in repossession stock. The recovery book impairment coverage ratio increased driven by a reduction in the
number of customers entering recoveries, reflecting lower entries into collections and better customer payment rates from
those in collections.
Within the UK home loans portfolio:
owner-occupied interest-only home loans comprised 28% (December 2016: 31%) of total balances. The decrease was
driven by a greater attrition rate compared to new business flow. The average balance weighted LTV on these loans
reduced to 39.7% (December 2016: 41.7%), primarily driven by increases in the house price index across core regions,
while the 90 day arrears rate excluding the recovery book remained steady at 0.3% (December 2016: 0.2%)
buy-to-let home loans comprised 11% (December 2016: 9%) of total balances. The average balance weighted LTV
increased to 53.7% (December 2016: 52.6%), and the 90 day arrears rate excluding recovery book remained steady at
0.1% (December 2016: 0.1%)
Italian home loans of £9.2bn (December 2016: £10.0bn) are secured on residential property with an average balance
weighted marked to market LTV of 61.0% (December 2016: 61.8%) and CRL coverage of 41% (December 2016: 36%). 90
day arrears and gross charge-off rates remained stable at 1.4% (December 2016: 1.2%) and 0.8% (December 2016: 0.8%)
respectively, while the CRL book coverage ratio increased due to an update in the collateral valuation for accounts in the
recovery book.
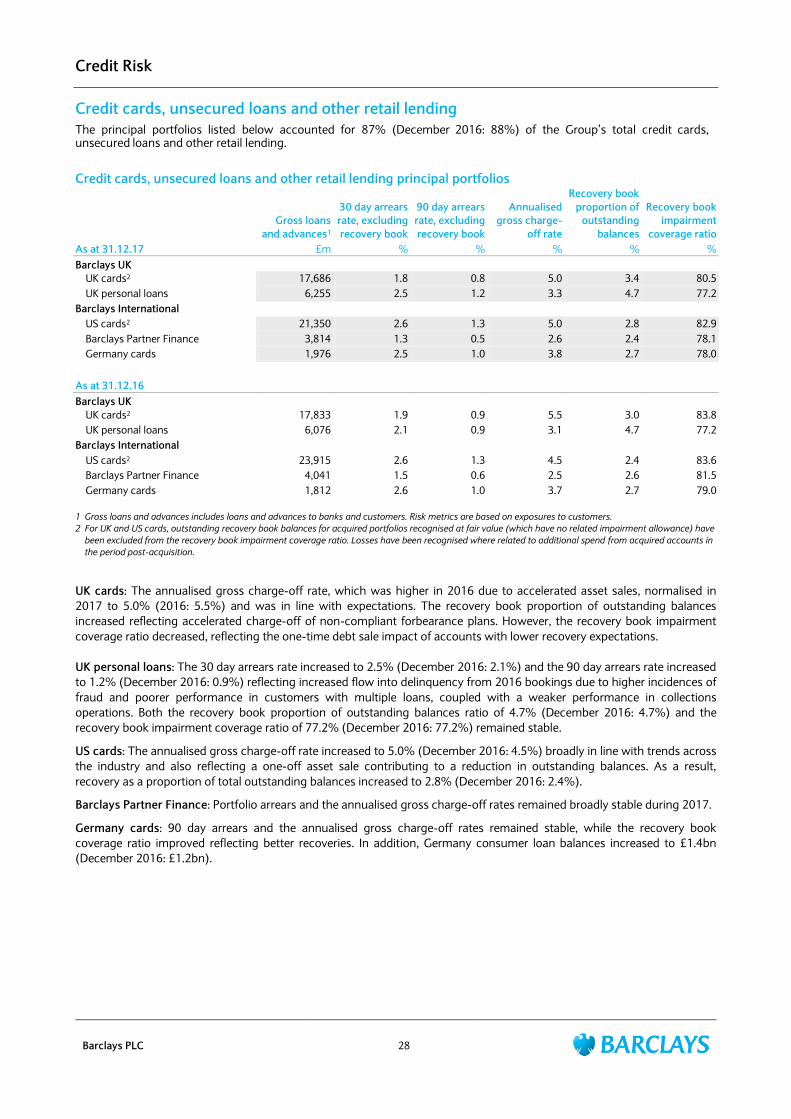
Credit Risk
Barclays PLC 28
Credit cards, unsecured loans and other retail lending
The principal portfolios listed below accounted for 87% (December 2016: 88%) of the Group‟s total credit cards, unsecured loans and other retail lending.
Credit cards, unsecured loans and other retail lending principal portfolios
Gross loans
and advances1
30 day arrears
rate, excluding
recovery book
90 day arrears
rate, excluding
recovery book
Annualised
gross charge-
off rate
Recovery book
proportion of
outstanding
balances
Recovery book
impairment
coverage ratio
As at 31.12.17 £m % % % % %
Barclays UK
UK cards2 17,686 1.8 0.8 5.0 3.4 80.5
UK personal loans 6,255 2.5 1.2 3.3 4.7 77.2
Barclays International
US cards2 21,350 2.6 1.3 5.0 2.8 82.9
Barclays Partner Finance 3,814 1.3 0.5 2.6 2.4 78.1
Germany cards 1,976 2.5 1.0 3.8 2.7 78.0
As at 31.12.16
Barclays UK
UK cards2 17,833 1.9 0.9 5.5 3.0 83.8
UK personal loans 6,076 2.1 0.9 3.1 4.7 77.2
Barclays International
US cards2 23,915 2.6 1.3 4.5 2.4 83.6
Barclays Partner Finance 3 4,041 1.5 0.6 2.5 2.6 81.5
Germany cards 1,812 2.6 1.0 3.7 2.7 79.0
1 Gross loans and advances includes loans and advances to banks and customers. Risk metrics are based on exposures to customers.
2 For UK and US cards, outstanding recovery book balances for acquired portfolios recognised at fair value (which have no related impairment allowance) have
been excluded from the recovery book impairment coverage ratio. Losses have been recognised where related to additional spend from acquired accounts in
the period post-acquisition.
UK cards: The annualised gross charge-off rate, which was higher in 2016 due to accelerated asset sales, normalised in
2017 to 5.0% (2016: 5.5%) and was in line with expectations. The recovery book proportion of outstanding balances
increased reflecting accelerated charge-off of non-compliant forbearance plans. However, the recovery book impairment
coverage ratio decreased, reflecting the one-time debt sale impact of accounts with lower recovery expectations.
UK personal loans: The 30 day arrears rate increased to 2.5% (December 2016: 2.1%) and the 90 day arrears rate increased
to 1.2% (December 2016: 0.9%) reflecting increased flow into delinquency from 2016 bookings due to higher incidences of
fraud and poorer performance in customers with multiple loans, coupled with a weaker performance in collections
operations. Both the recovery book proportion of outstanding balances ratio of 4.7% (December 2016: 4.7%) and the
recovery book impairment coverage ratio of 77.2% (December 2016: 77.2%) remained stable.
US cards: The annualised gross charge-off rate increased to 5.0% (December 2016: 4.5%) broadly in line with trends across
the industry and also reflecting a one-off asset sale contributing to a reduction in outstanding balances. As a result,
recovery as a proportion of total outstanding balances increased to 2.8% (December 2016: 2.4%).
Barclays Partner Finance: Portfolio arrears and the annualised gross charge-off rates remained broadly stable during 2017.
Germany cards: 90 day arrears and the annualised gross charge-off rates remained stable, while the recovery book
coverage ratio improved reflecting better recoveries. In addition, Germany consumer loan balances increased to £1.4bn
(December 2016: £1.2bn).
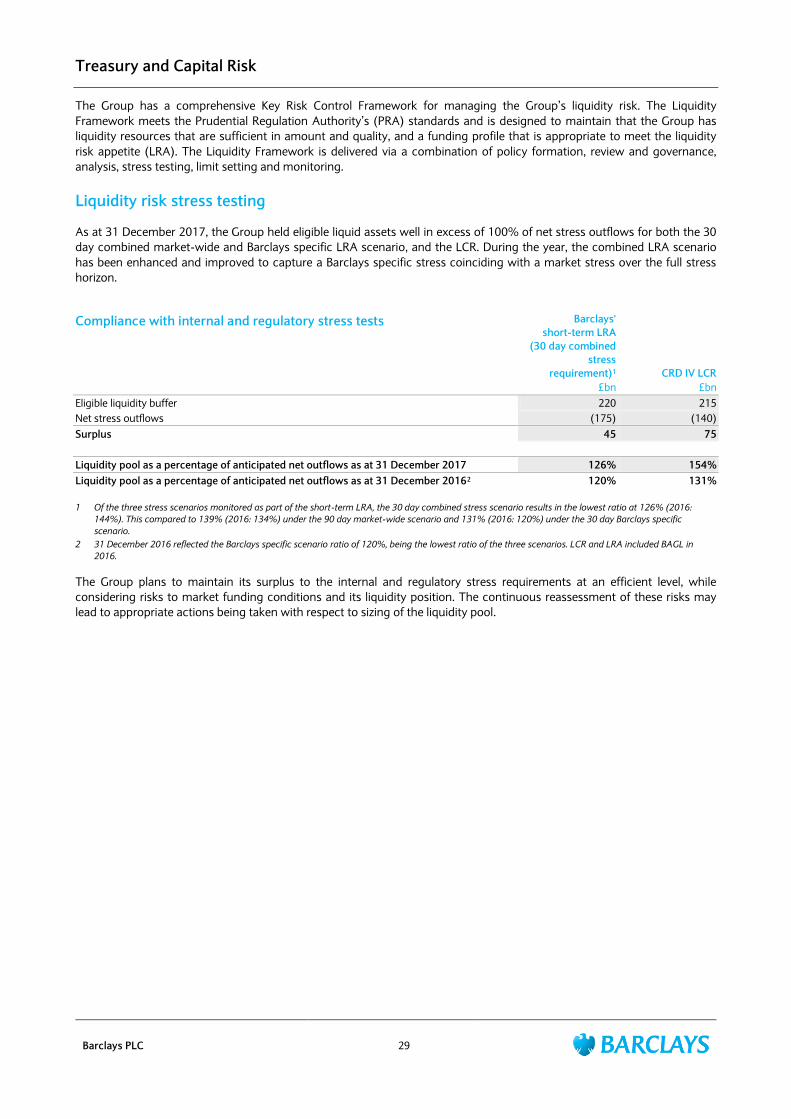
Treasury and Capital Risk
Barclays PLC 29
The Group has a comprehensive Key Risk Control Framework for managing the Group‟s liquidity risk. The Liquidity
Framework meets the Prudential Regulation Authority‟s (PRA) standards and is designed to maintain that the Group has
liquidity resources that are sufficient in amount and quality, and a funding profile that is appropriate to meet the liquidity
risk appetite (LRA). The Liquidity Framework is delivered via a combination of policy formation, review and governance,
analysis, stress testing, limit setting and monitoring.
Liquidity risk stress testing
As at 31 December 2017, the Group held eligible liquid assets well in excess of 100% of net stress outflows for both the 30
day combined market-wide and Barclays specific LRA scenario, and the LCR. During the year, the combined LRA scenario
has been enhanced and improved to capture a Barclays specific stress coinciding with a market stress over the full stress
horizon.
Compliance with internal and regulatory stress tests Barclays'
short-term LRA
(30 day combined
stress
requirement)1 CRD IV LCR
£bn £bn
Eligible liquidity buffer 220 215
Net stress outflows (175) (140)
Surplus 45 75
Liquidity pool as a percentage of anticipated net outflows as at 31 December 2017 126% 154%
Liquidity pool as a percentage of anticipated net outflows as at 31 December 20162 120% 131%
1 Of the three stress scenarios monitored as part of the short-term LRA, the 30 day combined stress scenario results in the lowest ratio at 126% (2016:
144%). This compared to 139% (2016: 134%) under the 90 day market-wide scenario and 131% (2016: 120%) under the 30 day Barclays specific
scenario.
2 31 December 2016 reflected the Barclays specific scenario ratio of 120%, being the lowest ratio of the three scenarios. LCR and LRA included BAGL in
2016.
The Group plans to maintain its surplus to the internal and regulatory stress requirements at an efficient level, while
considering risks to market funding conditions and its liquidity position. The continuous reassessment of these risks may
lead to appropriate actions being taken with respect to sizing of the liquidity pool.
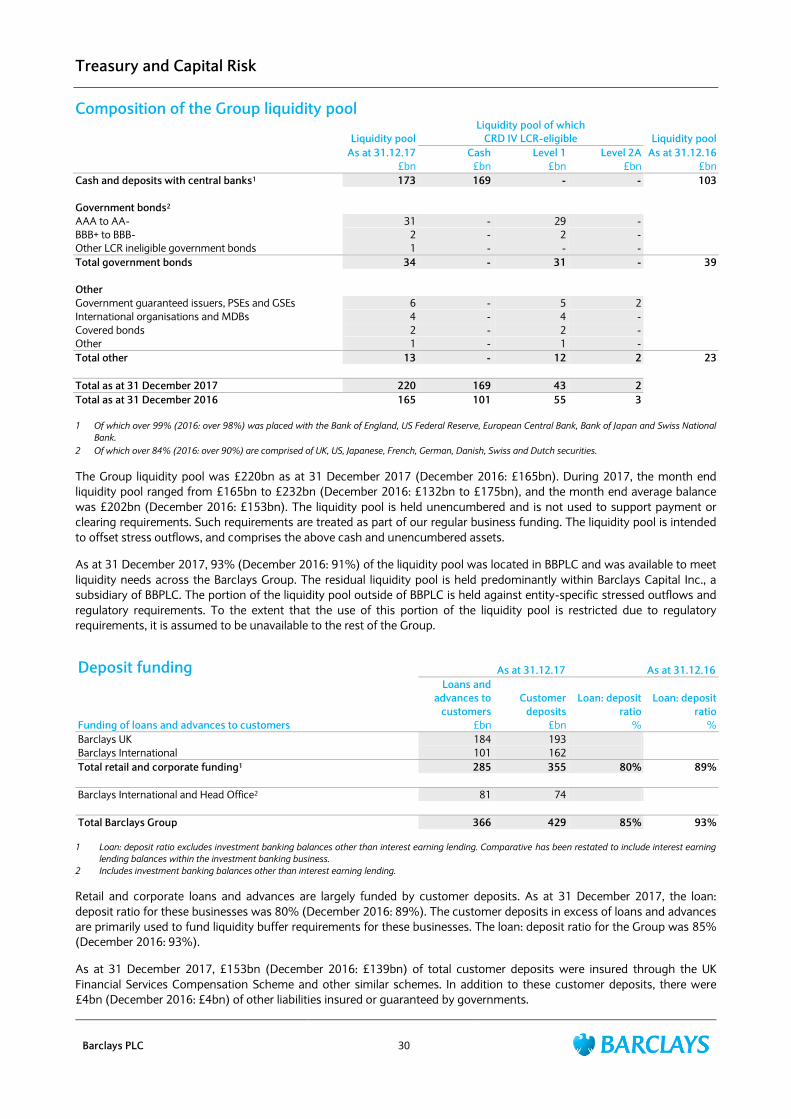
Treasury and Capital Risk
Barclays PLC 30
Composition of the Group liquidity pool
Liquidity pool
Liquidity pool of which
CRD IV LCR-eligible Liquidity pool
As at 31.12.17 Cash Level 1 Level 2A As at 31.12.16
£bn £bn £bn £bn £bn
Cash and deposits with central banks1 173 169 - - 103
Government bonds2
AAA to AA- 31 - 29 -
BBB+ to BBB- 2 - 2 -
Other LCR ineligible government bonds 1 - - -
Total government bonds 34 - 31 - 39
Other
Government guaranteed issuers, PSEs and GSEs 6 - 5 2
International organisations and MDBs 4 - 4 -
Covered bonds 2 - 2 -
Other 1 - 1 -
Total other 13 - 12 2 23
Total as at 31 December 2017 220 169 43 2
Total as at 31 December 2016 165 101 55 3
1 Of which over 99% (2016: over 98%) was placed with the Bank of England, US Federal Reserve, European Central Bank, Bank of Japan and Swiss National
Bank.
2 Of which over 84% (2016: over 90%) are comprised of UK, US, Japanese, French, German, Danish, Swiss and Dutch securities.
The Group liquidity pool was £220bn as at 31 December 2017 (December 2016: £165bn). During 2017, the month end
liquidity pool ranged from £165bn to £232bn (December 2016: £132bn to £175bn), and the month end average balance
was £202bn (December 2016: £153bn). The liquidity pool is held unencumbered and is not used to support payment or
clearing requirements. Such requirements are treated as part of our regular business funding. The liquidity pool is intended
to offset stress outflows, and comprises the above cash and unencumbered assets.
As at 31 December 2017, 93% (December 2016: 91%) of the liquidity pool was located in BBPLC and was available to meet
liquidity needs across the Barclays Group. The residual liquidity pool is held predominantly within Barclays Capital Inc., a
subsidiary of BBPLC. The portion of the liquidity pool outside of BBPLC is held against entity-specific stressed outflows and
regulatory requirements. To the extent that the use of this portion of the liquidity pool is restricted due to regulatory
requirements, it is assumed to be unavailable to the rest of the Group.
Deposit funding As at 31.12.17 As at 31.12.16
Loans and
advances to
customers
Customer
deposits
Loan: deposit
ratio
Loan: deposit
ratio
Funding of loans and advances to customers £bn £bn % %
Barclays UK 184 193
Barclays International 101 162
Total retail and corporate funding1 285 355 80% 89%
Barclays International and Head Office2 81 74
Total Barclays Group 366 429 85% 93%
1 Loan: deposit ratio excludes investment banking balances other than interest earning lending. Comparative has been restated to include interest earning
lending balances within the investment banking business.
2 Includes investment banking balances other than interest earning lending.
Retail and corporate loans and advances are largely funded by customer deposits. As at 31 December 2017, the loan:
deposit ratio for these businesses was 80% (December 2016: 89%). The customer deposits in excess of loans and advances
are primarily used to fund liquidity buffer requirements for these businesses. The loan: deposit ratio for the Group was 85%
(December 2016: 93%).
As at 31 December 2017, £153bn (December 2016: £139bn) of total customer deposits were insured through the UK
Financial Services Compensation Scheme and other similar schemes. In addition to these customer deposits, there were
£4bn (December 2016: £4bn) of other liabilities insured or guaranteed by governments.
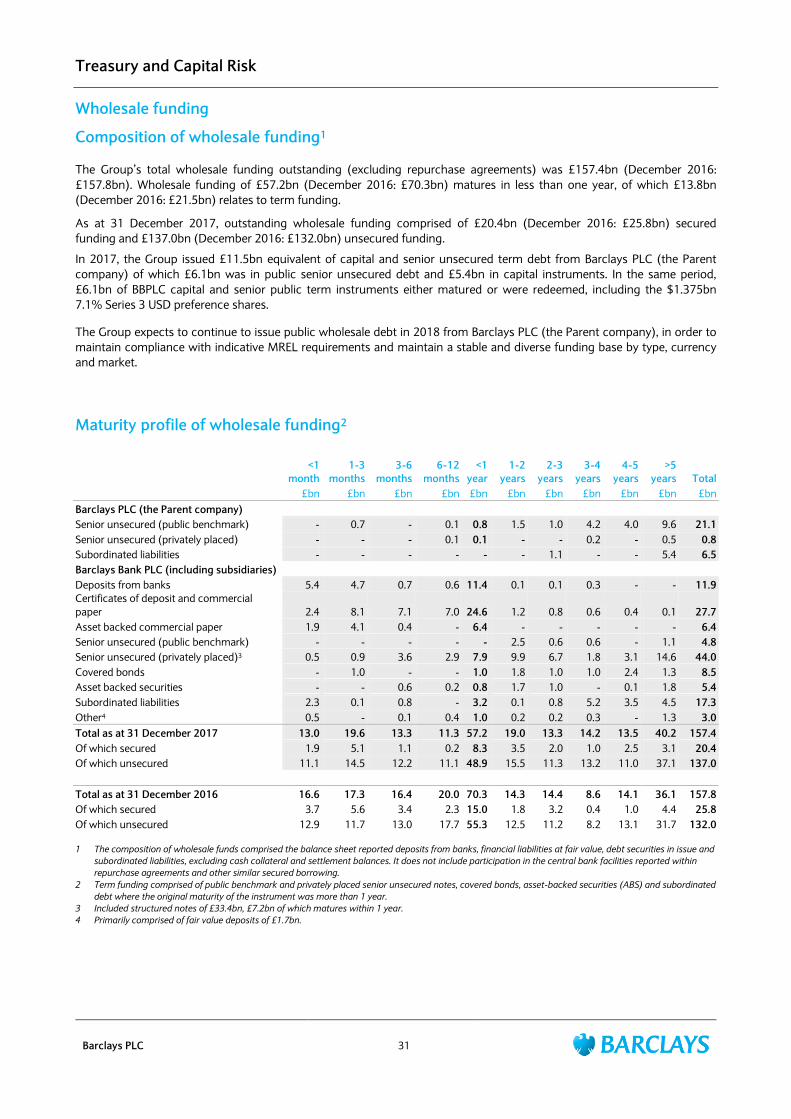
Treasury and Capital Risk
Barclays PLC 31
Wholesale funding
Composition of wholesale funding1
The Group‟s total wholesale funding outstanding (excluding repurchase agreements) was £157.4bn (December 2016:
£157.8bn). Wholesale funding of £57.2bn (December 2016: £70.3bn) matures in less than one year, of which £13.8bn
(December 2016: £21.5bn) relates to term funding.
As at 31 December 2017, outstanding wholesale funding comprised of £20.4bn (December 2016: £25.8bn) secured
funding and £137.0bn (December 2016: £132.0bn) unsecured funding.
In 2017, the Group issued £11.5bn equivalent of capital and senior unsecured term debt from Barclays PLC (the Parent
company) of which £6.1bn was in public senior unsecured debt and £5.4bn in capital instruments. In the same period,
£6.1bn of BBPLC capital and senior public term instruments either matured or were redeemed, including the $1.375bn
7.1% Series 3 USD preference shares.
The Group expects to continue to issue public wholesale debt in 2018 from Barclays PLC (the Parent company), in order to
maintain compliance with indicative MREL requirements and maintain a stable and diverse funding base by type, currency
and market.
Maturity profile of wholesale funding2
<1
month
1-3
months
3-6
months
6-12
months
<1
year
1-2
years
2-3
years
3-4
years
4-5
years
>5
years Total
£bn £bn £bn £bn £bn £bn £bn £bn £bn £bn £bn
Barclays PLC (the Parent company)
Senior unsecured (public benchmark) - 0.7 - 0.1 0.8 1.5 1.0 4.2 4.0 9.6 21.1
Senior unsecured (privately placed) - - - 0.1 0.1 - - 0.2 - 0.5 0.8
Subordinated liabilities - - - - - - 1.1 - - 5.4 6.5
Barclays Bank PLC (including subsidiaries)
Deposits from banks 5.4 4.7 0.7 0.6 11.4 0.1 0.1 0.3 - - 11.9
Certificates of deposit and commercial
paper 2.4 8.1 7.1 7.0 24.6 1.2 0.8 0.6 0.4 0.1 27.7
Asset backed commercial paper 1.9 4.1 0.4 - 6.4 - - - - - 6.4
Senior unsecured (public benchmark) - - - - - 2.5 0.6 0.6 - 1.1 4.8
Senior unsecured (privately placed)3 0.5 0.9 3.6 2.9 7.9 9.9 6.7 1.8 3.1 14.6 44.0
Covered bonds - 1.0 - - 1.0 1.8 1.0 1.0 2.4 1.3 8.5
Asset backed securities - - 0.6 0.2 0.8 1.7 1.0 - 0.1 1.8 5.4
Subordinated liabilities 2.3 0.1 0.8 - 3.2 0.1 0.8 5.2 3.5 4.5 17.3
Other4 0.5 - 0.1 0.4 1.0 0.2 0.2 0.3 - 1.3 3.0
Total as at 31 December 2017 13.0 19.6 13.3 11.3 57.2 19.0 13.3 14.2 13.5 40.2 157.4
Of which secured 1.9 5.1 1.1 0.2 8.3 3.5 2.0 1.0 2.5 3.1 20.4
Of which unsecured 11.1 14.5 12.2 11.1 48.9 15.5 11.3 13.2 11.0 37.1 137.0
Total as at 31 December 2016 16.6 17.3 16.4 20.0 70.3 14.3 14.4 8.6 14.1 36.1 157.8
Of which secured 3.7 5.6 3.4 2.3 15.0 1.8 3.2 0.4 1.0 4.4 25.8
Of which unsecured 12.9 11.7 13.0 17.7 55.3 12.5 11.2 8.2 13.1 31.7 132.0
1 The composition of wholesale funds comprised the balance sheet reported deposits from banks, financial liabilities at fair value, debt securities in issue and
subordinated liabilities, excluding cash collateral and settlement balances. It does not include participation in the central bank facilities reported within
repurchase agreements and other similar secured borrowing.
2 Term funding comprised of public benchmark and privately placed senior unsecured notes, covered bonds, asset-backed securities (ABS) and subordinated
debt where the original maturity of the instrument was more than 1 year.
3 Included structured notes of £33.4bn, £7.2bn of which matures within 1 year.
4 Primarily comprised of fair value deposits of £1.7bn.
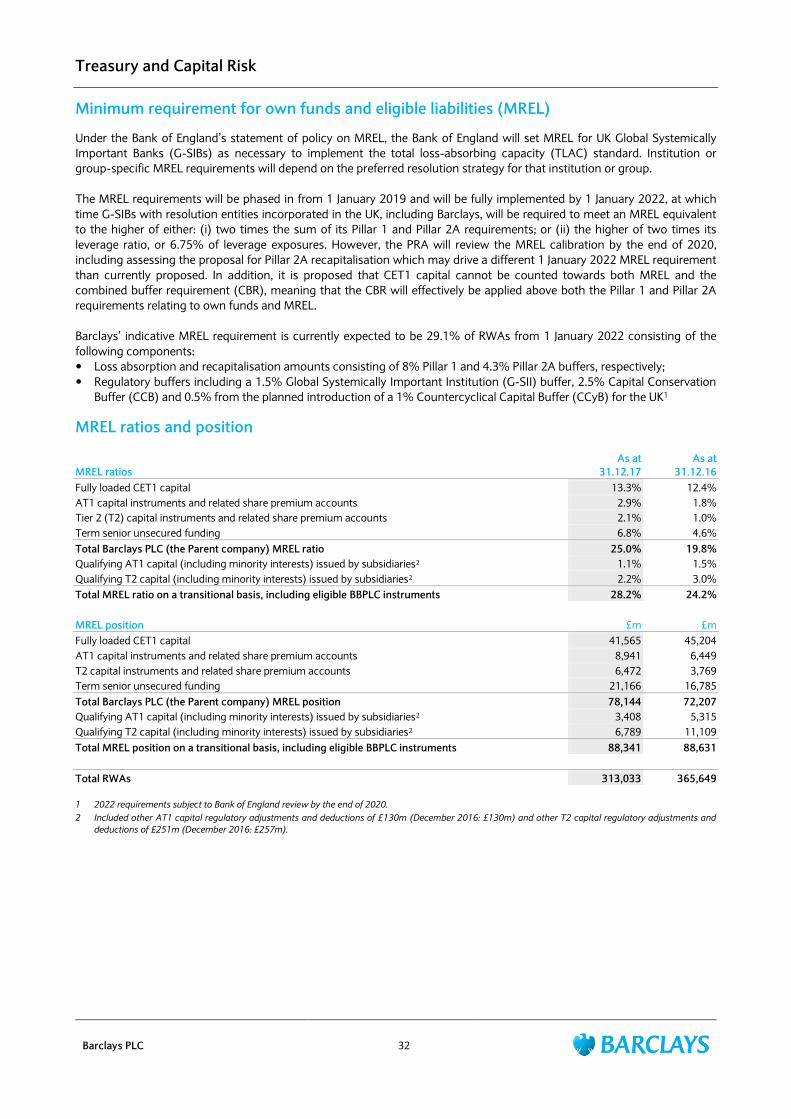
Treasury and Capital Risk
Barclays PLC 32
Minimum requirement for own funds and eligible liabilities (MREL)
Under the Bank of England‟s statement of policy on MREL, the Bank of England will set MREL for UK Global Systemically
Important Banks (G-SIBs) as necessary to implement the total loss-absorbing capacity (TLAC) standard. Institution or
group-specific MREL requirements will depend on the preferred resolution strategy for that institution or group.
The MREL requirements will be phased in from 1 January 2019 and will be fully implemented by 1 January 2022, at which
time G-SIBs with resolution entities incorporated in the UK, including Barclays, will be required to meet an MREL equivalent
to the higher of either: (i) two times the sum of its Pillar 1 and Pillar 2A requirements; or (ii) the higher of two times its
leverage ratio, or 6.75% of leverage exposures. However, the PRA will review the MREL calibration by the end of 2020,
including assessing the proposal for Pillar 2A recapitalisation which may drive a different 1 January 2022 MREL requirement
than currently proposed. In addition, it is proposed that CET1 capital cannot be counted towards both MREL and the
combined buffer requirement (CBR), meaning that the CBR will effectively be applied above both the Pillar 1 and Pillar 2A
requirements relating to own funds and MREL.
Barclays‟ indicative MREL requirement is currently expected to be 29.1% of RWAs from 1 January 2022 consisting of the
following components:
Loss absorption and recapitalisation amounts consisting of 8% Pillar 1 and 4.3% Pillar 2A buffers, respectively;
Regulatory buffers including a 1.5% Global Systemically Important Institution (G-SII) buffer, 2.5% Capital Conservation
Buffer (CCB) and 0.5% from the planned introduction of a 1% Countercyclical Capital Buffer (CCyB) for the UK1
MREL ratios and position
MREL ratios
As at
31.12.17
As at
31.12.16
Fully loaded CET1 capital 13.3% 12.4%
AT1 capital instruments and related share premium accounts 2.9% 1.8%
Tier 2 (T2) capital instruments and related share premium accounts 2.1% 1.0%
Term senior unsecured funding 6.8% 4.6%
Total Barclays PLC (the Parent company) MREL ratio 25.0% 19.8%
Qualifying AT1 capital (including minority interests) issued by subsidiaries2 1.1% 1.5%
Qualifying T2 capital (including minority interests) issued by subsidiaries2 2.2% 3.0%
Total MREL ratio on a transitional basis, including eligible BBPLC instruments 28.2% 24.2%
MREL position £m £m
Fully loaded CET1 capital 41,565 45,204
AT1 capital instruments and related share premium accounts 8,941 6,449
T2 capital instruments and related share premium accounts 6,472 3,769
Term senior unsecured funding 21,166 16,785
Total Barclays PLC (the Parent company) MREL position 78,144 72,207
Qualifying AT1 capital (including minority interests) issued by subsidiaries2 3,408 5,315
Qualifying T2 capital (including minority interests) issued by subsidiaries2 6,789 11,109
Total MREL position on a transitional basis, including eligible BBPLC instruments 88,341 88,631
Total RWAs 313,033 365,649
1 2022 requirements subject to Bank of England review by the end of 2020.
2 Included other AT1 capital regulatory adjustments and deductions of £130m (December 2016: £130m) and other T2 capital regulatory adjustments and
deductions of £251m (December 2016: £257m).
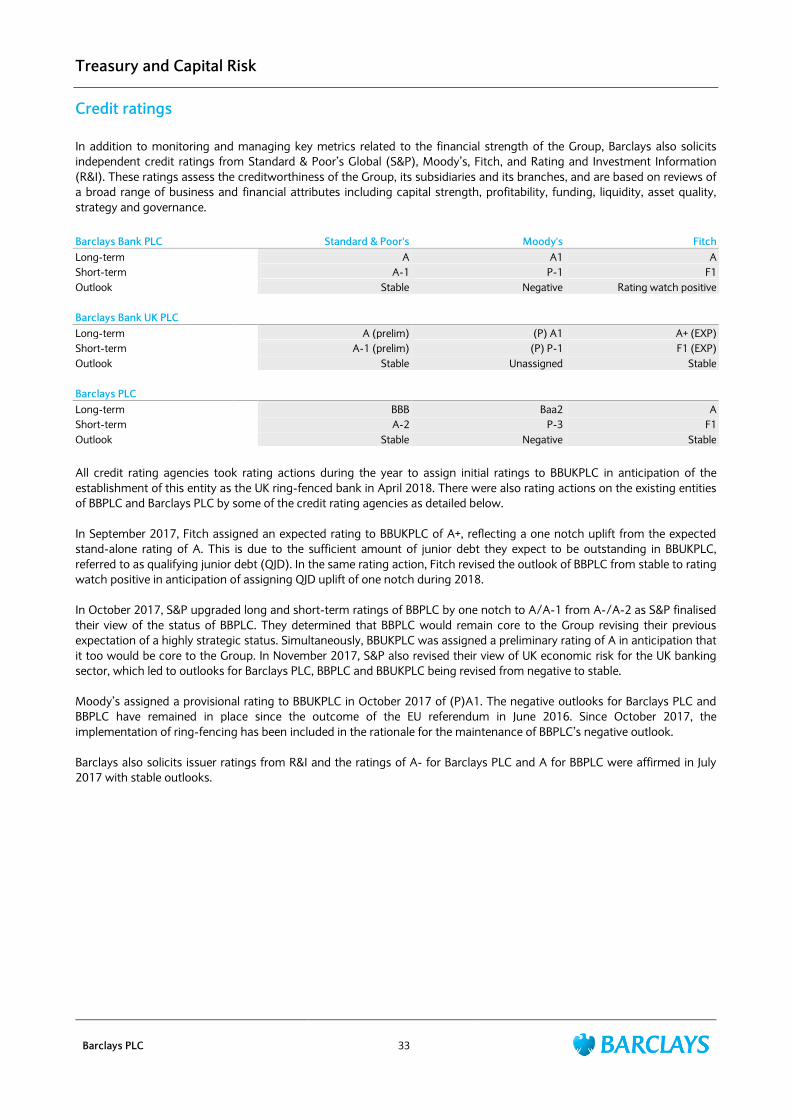
Treasury and Capital Risk
Barclays PLC 33
Credit ratings
In addition to monitoring and managing key metrics related to the financial strength of the Group, Barclays also solicits
independent credit ratings from Standard & Poor‟s Global (S&P), Moody‟s, Fitch, and Rating and Investment Information
(R&I). These ratings assess the creditworthiness of the Group, its subsidiaries and its branches, and are based on reviews of
a broad range of business and financial attributes including capital strength, profitability, funding, liquidity, asset quality,
strategy and governance. Barclays Bank PLC Standard & Poor's Moody's Fitch
Long-term A A1 A
Short-term A-1 P-1 F1
Outlook Stable Negative Rating watch positive
Barclays Bank UK PLC
Long-term A (prelim) (P) A1 A+ (EXP)
Short-term A-1 (prelim) (P) P-1 F1 (EXP)
Outlook Stable Unassigned Stable
Barclays PLC
Long-term BBB Baa2 A
Short-term A-2 P-3 F1
Outlook Stable Negative Stable
All credit rating agencies took rating actions during the year to assign initial ratings to BBUKPLC in anticipation of the
establishment of this entity as the UK ring-fenced bank in April 2018. There were also rating actions on the existing entities
of BBPLC and Barclays PLC by some of the credit rating agencies as detailed below.
In September 2017, Fitch assigned an expected rating to BBUKPLC of A+, reflecting a one notch uplift from the expected
stand-alone rating of A. This is due to the sufficient amount of junior debt they expect to be outstanding in BBUKPLC,
referred to as qualifying junior debt (QJD). In the same rating action, Fitch revised the outlook of BBPLC from stable to rating
watch positive in anticipation of assigning QJD uplift of one notch during 2018.
In October 2017, S&P upgraded long and short-term ratings of BBPLC by one notch to A/A-1 from A-/A-2 as S&P finalised
their view of the status of BBPLC. They determined that BBPLC would remain core to the Group revising their previous
expectation of a highly strategic status. Simultaneously, BBUKPLC was assigned a preliminary rating of A in anticipation that
it too would be core to the Group. In November 2017, S&P also revised their view of UK economic risk for the UK banking
sector, which led to outlooks for Barclays PLC, BBPLC and BBUKPLC being revised from negative to stable.
Moody‟s assigned a provisional rating to BBUKPLC in October 2017 of (P)A1. The negative outlooks for Barclays PLC and
BBPLC have remained in place since the outcome of the EU referendum in June 2016. Since October 2017, the
implementation of ring-fencing has been included in the rationale for the maintenance of BBPLC‟s negative outlook.
Barclays also solicits issuer ratings from R&I and the ratings of A- for Barclays PLC and A for BBPLC were affirmed in July
2017 with stable outlooks.
Treasury and Capital Risk
Barclays PLC 34
CRD IV capital
Barclays‟ end point CET1 regulatory requirement is expected to be 11.4% comprising of a 4.5% Pillar 1 minimum, a 2.5%
CCB, a 1.5% G-SII buffer, a 2.4% Pillar 2A requirement and an expected 0.5% CCyB.
The CCB and the G-SII buffer, determined by the PRA in line with guidance from the Financial Stability Board (FSB), are
subject to phased implementation at 25% per annum from 2016 with full effect from 2019. The CCB has been set at 2.5%
with 1.25% applicable for 2017. The G-SII buffer was set at 2% with 1% applicable for 2017. On 21 November 2016 the FSB
confirmed that the G-SII buffer has been set at 1.5% with 1.1% applicable for 2018. On 21 November 2017 the FSB
confirmed that the G-SII buffer will remain at 1.5% applicable for 2019.
On 25 September 2017 the Financial Policy Committee (FPC) reaffirmed that it expects to increase the UK CCyB rate from
0% to 0.5% applicable from 27 June 2018 and to 1% applicable from 28 November 2018. Based on current UK exposures,
Barclays‟ CCyB is expected to be approximately 0.5% from November 2018. Other national authorities also determine the
appropriate CCyBs that should be applied to exposures in their jurisdiction, however based on current exposures these are
not material.
Barclays‟ Pillar 2A requirement as per the PRA‟s Individual Capital Guidance (ICG) for Q417 and 2018 is 4.3% of which at
least 56.25% needs to be met in CET1 form, equating to approximately 2.4% of RWAs. Certain elements of the Pillar 2A
requirement are a fixed quantum whilst others are a proportion of RWAs and are based on a point in time assessment. The
Pillar 2A requirement is subject to at least annual review.
For regulatory reporting purposes, BAGL is treated on a proportional consolidation basis based on Barclays‟ holding in BAGL
of 14.9%.
As at 31 December 2017, Barclays‟ CET1 ratio was 13.3% which exceeded the 2017 transitional minimum requirement of
9.2%, which comprised of a 4.5% Pillar 1 minimum, a 2.4% Pillar 2A requirement, a 1.25% CCB, a 1% G-SII buffer and a 0%
CCyB.
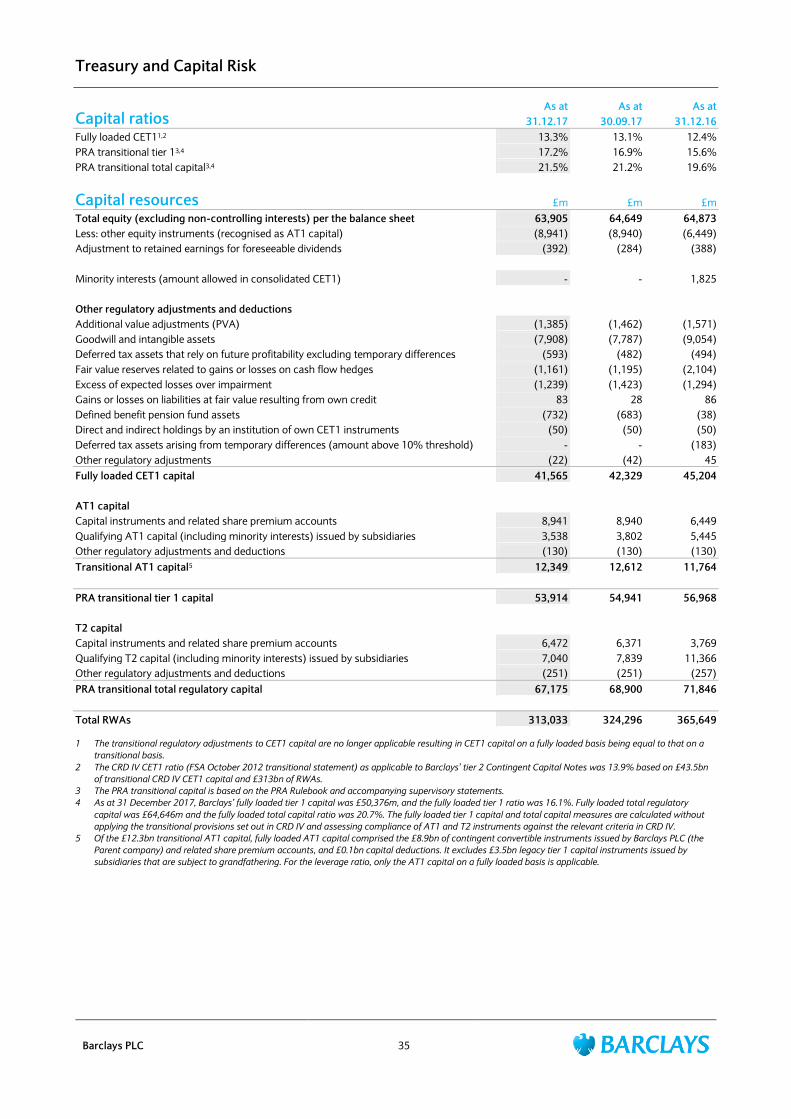
Treasury and Capital Risk
Barclays PLC 35
Capital ratios As at As at As at
31.12.17 30.09.17 31.12.16
Fully loaded CET11,2 13.3% 13.1% 12.4%
PRA transitional tier 13,4 17.2% 16.9% 15.6%
PRA transitional total capital3,4 21.5% 21.2% 19.6%
Capital resources £m £m £m
Total equity (excluding non-controlling interests) per the balance sheet 63,905 64,649 64,873
Less: other equity instruments (recognised as AT1 capital) (8,941) (8,940) (6,449)
Adjustment to retained earnings for foreseeable dividends (392) (284) (388)
Minority interests (amount allowed in consolidated CET1) - - 1,825
Other regulatory adjustments and deductions
Additional value adjustments (PVA) (1,385) (1,462) (1,571)
Goodwill and intangible assets (7,908) (7,787) (9,054)
Deferred tax assets that rely on future profitability excluding temporary differences (593) (482) (494)
Fair value reserves related to gains or losses on cash flow hedges (1,161) (1,195) (2,104)
Excess of expected losses over impairment (1,239) (1,423) (1,294)
Gains or losses on liabilities at fair value resulting from own credit 83 28 86
Defined benefit pension fund assets (732) (683) (38)
Direct and indirect holdings by an institution of own CET1 instruments (50) (50) (50)
Deferred tax assets arising from temporary differences (amount above 10% threshold) - - (183)
Other regulatory adjustments (22) (42) 45
Fully loaded CET1 capital 41,565 42,329 45,204
AT1 capital
Capital instruments and related share premium accounts 8,941 8,940 6,449
Qualifying AT1 capital (including minority interests) issued by subsidiaries 3,538 3,802 5,445
Other regulatory adjustments and deductions (130) (130) (130)
Transitional AT1 capital5 12,349 12,612 11,764
PRA transitional tier 1 capital 53,914 54,941 56,968
T2 capital
Capital instruments and related share premium accounts 6,472 6,371 3,769
Qualifying T2 capital (including minority interests) issued by subsidiaries 7,040 7,839 11,366
Other regulatory adjustments and deductions (251) (251) (257)
PRA transitional total regulatory capital 67,175 68,900 71,846
Total RWAs 313,033 324,296 365,649
1 The transitional regulatory adjustments to CET1 capital are no longer applicable resulting in CET1 capital on a fully loaded basis being equal to that on a
transitional basis.
2 The CRD IV CET1 ratio (FSA October 2012 transitional statement) as applicable to Barclays’ tier 2 Contingent Capital Notes was 13.9% based on £43.5bn
of transitional CRD IV CET1 capital and £313bn of RWAs.
3 The PRA transitional capital is based on the PRA Rulebook and accompanying supervisory statements.
4 As at 31 December 2017, Barclays’ fully loaded tier 1 capital was £50,376m, and the fully loaded tier 1 ratio was 16.1%. Fully loaded total regulatory
capital was £64,646m and the fully loaded total capital ratio was 20.7%. The fully loaded tier 1 capital and total capital measures are calculated without
applying the transitional provisions set out in CRD IV and assessing compliance of AT1 and T2 instruments against the relevant criteria in CRD IV.
5 Of the £12.3bn transitional AT1 capital, fully loaded AT1 capital comprised the £8.9bn of contingent convertible instruments issued by Barclays PLC (the
Parent company) and related share premium accounts, and £0.1bn capital deductions. It excludes £3.5bn legacy tier 1 capital instruments issued by
subsidiaries that are subject to grandfathering. For the leverage ratio, only the AT1 capital on a fully loaded basis is applicable.
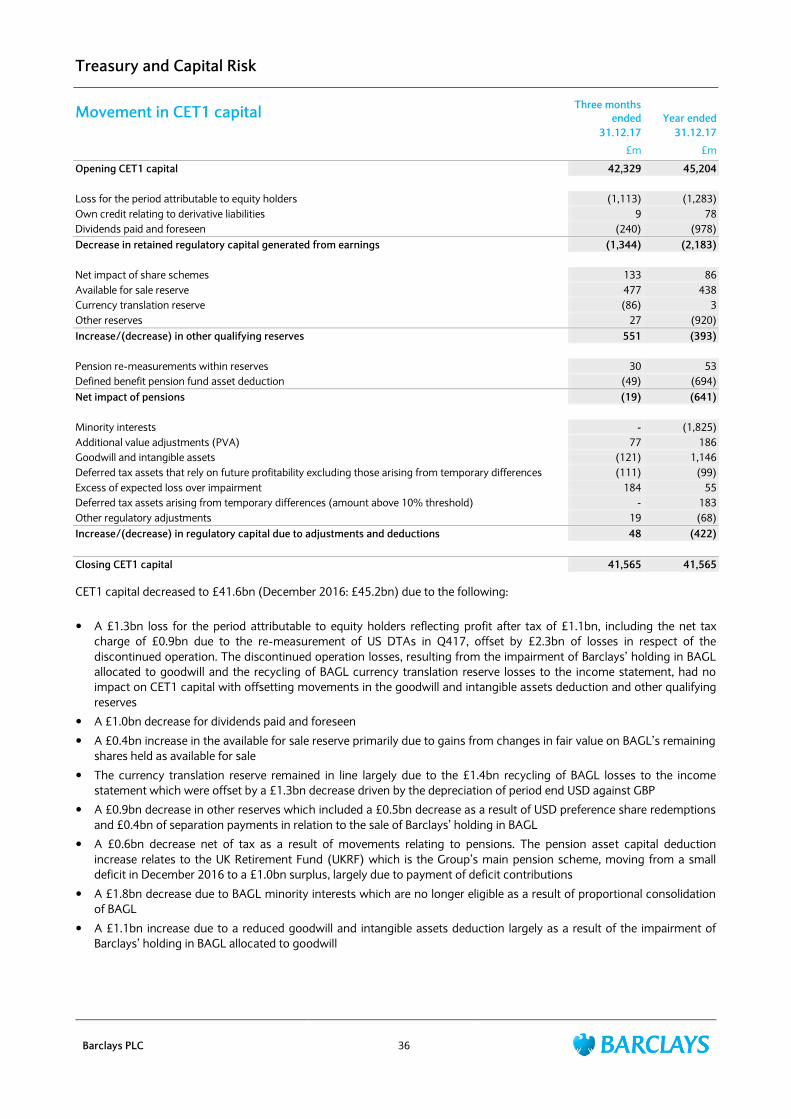
Treasury and Capital Risk
Barclays PLC 36
Movement in CET1 capital Three months
ended Year ended 31.12.17 31.12.17
£m £m
Opening CET1 capital 42,329 45,204
Loss for the period attributable to equity holders (1,113) (1,283)
Own credit relating to derivative liabilities 9 78
Dividends paid and foreseen (240) (978)
Decrease in retained regulatory capital generated from earnings (1,344) (2,183)
Net impact of share schemes 133 86
Available for sale reserve 477 438
Currency translation reserve (86) 3
Other reserves 27 (920)
Increase/(decrease) in other qualifying reserves 551 (393)
Pension re-measurements within reserves 30 53
Defined benefit pension fund asset deduction (49) (694)
Net impact of pensions (19) (641)
Minority interests - (1,825)
Additional value adjustments (PVA) 77 186
Goodwill and intangible assets (121) 1,146
Deferred tax assets that rely on future profitability excluding those arising from temporary differences (111) (99)
Excess of expected loss over impairment 184 55
Deferred tax assets arising from temporary differences (amount above 10% threshold) - 183
Other regulatory adjustments 19 (68)
Increase/(decrease) in regulatory capital due to adjustments and deductions 48 (422)
Closing CET1 capital 41,565 41,565
CET1 capital decreased to £41.6bn (December 2016: £45.2bn) due to the following:
A £1.3bn loss for the period attributable to equity holders reflecting profit after tax of £1.1bn, including the net tax
charge of £0.9bn due to the re-measurement of US DTAs in Q417, offset by £2.3bn of losses in respect of the
discontinued operation. The discontinued operation losses, resulting from the impairment of Barclays‟ holding in BAGL
allocated to goodwill and the recycling of BAGL currency translation reserve losses to the income statement, had no
impact on CET1 capital with offsetting movements in the goodwill and intangible assets deduction and other qualifying
reserves
A £1.0bn decrease for dividends paid and foreseen
A £0.4bn increase in the available for sale reserve primarily due to gains from changes in fair value on BAGL‟s remaining
shares held as available for sale
The currency translation reserve remained in line largely due to the £1.4bn recycling of BAGL losses to the income
statement which were offset by a £1.3bn decrease driven by the depreciation of period end USD against GBP
A £0.9bn decrease in other reserves which included a £0.5bn decrease as a result of USD preference share redemptions
and £0.4bn of separation payments in relation to the sale of Barclays‟ holding in BAGL
A £0.6bn decrease net of tax as a result of movements relating to pensions. The pension asset capital deduction
increase relates to the UK Retirement Fund (UKRF) which is the Group‟s main pension scheme, moving from a small
deficit in December 2016 to a £1.0bn surplus, largely due to payment of deficit contributions
A £1.8bn decrease due to BAGL minority interests which are no longer eligible as a result of proportional consolidation
of BAGL
A £1.1bn increase due to a reduced goodwill and intangible assets deduction largely as a result of the impairment of
Barclays‟ holding in BAGL allocated to goodwill
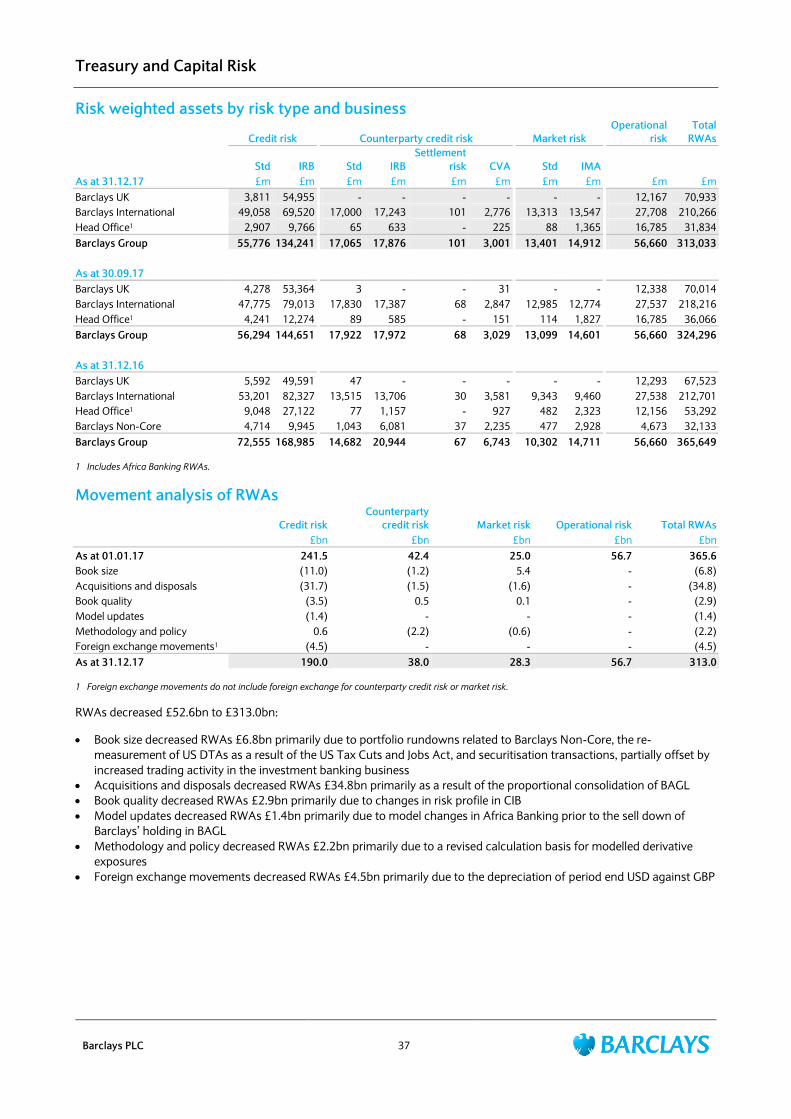
Treasury and Capital Risk
Barclays PLC 37
Risk weighted assets by risk type and business
Credit risk Counterparty credit risk Market risk
Operational
risk
Total
RWAs
Std IRB Std IRB
Settlement
risk CVA Std IMA
As at 31.12.17 £m £m £m £m £m £m £m £m £m £m
Barclays UK 3,811 54,955 - - - - - - 12,167 70,933
Barclays International 49,058 69,520 17,000 17,243 101 2,776 13,313 13,547 27,708 210,266
Head Office1 2,907 9,766 65 633 - 225 88 1,365 16,785 31,834
Barclays Group 55,776 134,241 17,065 17,876 101 3,001 13,401 14,912 56,660 313,033
As at 30.09.17
Barclays UK 4,278 53,364 3 - - 31 - - 12,338 70,014
Barclays International 47,775 79,013 17,830 17,387 68 2,847 12,985 12,774 27,537 218,216
Head Office1 4,241 12,274 89 585 - 151 114 1,827 16,785 36,066
Barclays Group 56,294 144,651 17,922 17,972 68 3,029 13,099 14,601 56,660 324,296
As at 31.12.16
Barclays UK 5,592 49,591 47 - - - - - 12,293 67,523
Barclays International 53,201 82,327 13,515 13,706 30 3,581 9,343 9,460 27,538 212,701
Head Office1 9,048 27,122 77 1,157 - 927 482 2,323 12,156 53,292
Barclays Non-Core 4,714 9,945 1,043 6,081 37 2,235 477 2,928 4,673 32,133
Barclays Group 72,555 168,985 14,682 20,944 67 6,743 10,302 14,711 56,660 365,649
1 Includes Africa Banking RWAs.
Movement analysis of RWAs
Credit risk
Counterparty
credit risk Market risk Operational risk Total RWAs
£bn £bn £bn £bn £bn
As at 01.01.17 241.5 42.4 25.0 56.7 365.6
Book size (11.0) (1.2) 5.4 - (6.8)
Acquisitions and disposals (31.7) (1.5) (1.6) - (34.8)
Book quality (3.5) 0.5 0.1 - (2.9)
Model updates (1.4) - - - (1.4)
Methodology and policy 0.6 (2.2) (0.6) - (2.2)
Foreign exchange movements1 (4.5) - - - (4.5)
As at 31.12.17 190.0 38.0 28.3 56.7 313.0
1 Foreign exchange movements do not include foreign exchange for counterparty credit risk or market risk.
RWAs decreased £52.6bn to £313.0bn:
Book size decreased RWAs £6.8bn primarily due to portfolio rundowns related to Barclays Non-Core, the re-
measurement of US DTAs as a result of the US Tax Cuts and Jobs Act, and securitisation transactions, partially offset by
increased trading activity in the investment banking business
Acquisitions and disposals decreased RWAs £34.8bn primarily as a result of the proportional consolidation of BAGL
Book quality decreased RWAs £2.9bn primarily due to changes in risk profile in CIB
Model updates decreased RWAs £1.4bn primarily due to model changes in Africa Banking prior to the sell down of
Barclays‟ holding in BAGL
Methodology and policy decreased RWAs £2.2bn primarily due to a revised calculation basis for modelled derivative
exposures
Foreign exchange movements decreased RWAs £4.5bn primarily due to the depreciation of period end USD against GBP
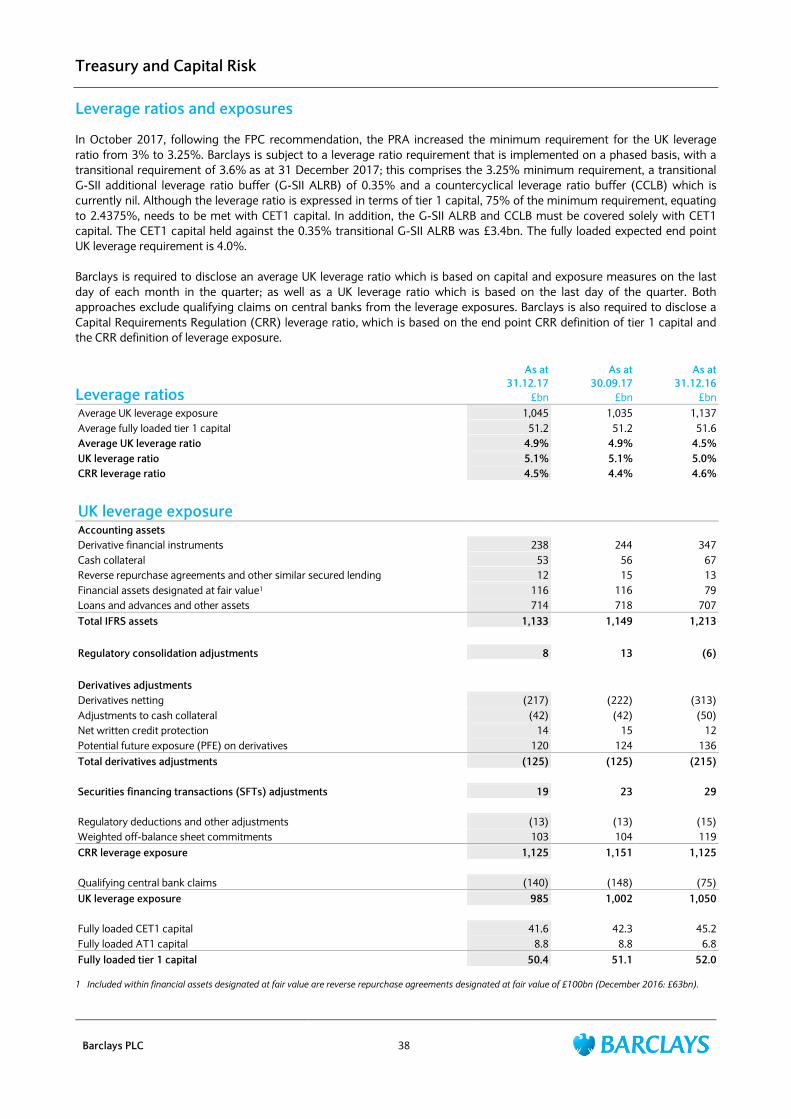
Treasury and Capital Risk
Barclays PLC 38
Leverage ratios and exposures
In October 2017, following the FPC recommendation, the PRA increased the minimum requirement for the UK leverage
ratio from 3% to 3.25%. Barclays is subject to a leverage ratio requirement that is implemented on a phased basis, with a
transitional requirement of 3.6% as at 31 December 2017; this comprises the 3.25% minimum requirement, a transitional
G-SII additional leverage ratio buffer (G-SII ALRB) of 0.35% and a countercyclical leverage ratio buffer (CCLB) which is
currently nil. Although the leverage ratio is expressed in terms of tier 1 capital, 75% of the minimum requirement, equating
to 2.4375%, needs to be met with CET1 capital. In addition, the G-SII ALRB and CCLB must be covered solely with CET1
capital. The CET1 capital held against the 0.35% transitional G-SII ALRB was £3.4bn. The fully loaded expected end point
UK leverage requirement is 4.0%.
Barclays is required to disclose an average UK leverage ratio which is based on capital and exposure measures on the last
day of each month in the quarter; as well as a UK leverage ratio which is based on the last day of the quarter. Both
approaches exclude qualifying claims on central banks from the leverage exposures. Barclays is also required to disclose a
Capital Requirements Regulation (CRR) leverage ratio, which is based on the end point CRR definition of tier 1 capital and
the CRR definition of leverage exposure.
Leverage ratios
As at
31.12.17
As at
30.09.17
As at
31.12.16
£bn £bn £bn
Average UK leverage exposure 1,045 1,035 1,137
Average fully loaded tier 1 capital 51.2 51.2 51.6
Average UK leverage ratio 4.9% 4.9% 4.5%
UK leverage ratio 5.1% 5.1% 5.0%
CRR leverage ratio 4.5% 4.4% 4.6%
UK leverage exposure
Accounting assets
Derivative financial instruments 238 244 347
Cash collateral 53 56 67
Reverse repurchase agreements and other similar secured lending 12 15 13
Financial assets designated at fair value1 116 116 79
Loans and advances and other assets 714 718 707
Total IFRS assets 1,133 1,149 1,213
Regulatory consolidation adjustments 8 13 (6)
Derivatives adjustments
Derivatives netting (217) (222) (313)
Adjustments to cash collateral (42) (42) (50)
Net written credit protection 14 15 12
Potential future exposure (PFE) on derivatives 120 124 136
Total derivatives adjustments (125) (125) (215)
Securities financing transactions (SFTs) adjustments 19 23 29
Regulatory deductions and other adjustments (13) (13) (15)
Weighted off-balance sheet commitments 103 104 119
CRR leverage exposure 1,125 1,151 1,125
Qualifying central bank claims (140) (148) (75)
UK leverage exposure 985 1,002 1,050
Fully loaded CET1 capital 41.6 42.3 45.2
Fully loaded AT1 capital 8.8 8.8 6.8
Fully loaded tier 1 capital 50.4 51.1 52.0
1 Included within financial assets designated at fair value are reverse repurchase agreements designated at fair value of £100bn (December 2016: £63bn).
Treasury and Capital Risk
Barclays PLC 39
The average UK leverage ratio increased to 4.9% (December 2016: 4.5%) primarily driven by the issuance of AT1 securities,
the reduction in Non-Core related exposures and due to regulatory proportional consolidation of BAGL.
The CRR leverage ratio decreased to 4.5% (December 2016: 4.6%). The difference between the average UK leverage ratio
and the CRR leverage ratio movement is primarily driven by an increase in cash at central banks, which are excluded from
the UK leverage ratio calculation. Additionally, the year end fully loaded tier 1 capital is lower than the average due to the re-
measurement of US DTAs as a result of the US Tax Cuts and Jobs Act.
Loans and advances and other assets increased £7bn to £714bn. This was primarily due to a £69bn increase in cash
and balances at central banks largely driven by an increase in the cash contribution to the Group liquidity pool mainly
exempt under UK leverage rules and a £70bn decrease in assets held for sale driven by the sell down of Barclays‟ holding
in BAGL
Reverse repurchase agreements increased £36bn to £112bn primarily due to an increase in matched book trading
Net derivative leverage exposures decreased £33bn to £166bn due to a reduction in interest rate and foreign exchange
derivatives, the rundown of Non-Core related assets, a decrease in cash collateral and the depreciation of period end
USD and JPY against GBP
Regulatory consolidation adjustments increased £14bn to £8bn primarily due to the proportional consolidation of BAGL
following the sell down of Barclays‟ holding
Weighted off balance sheet commitments decreased £16bn to £103bn primarily due to the proportional consolidation
of BAGL following the sell down of Barclays‟ holding
Additional Barclays regulatory disclosures are prepared in accordance with the European Banking Authority (EBA)
Guidelines on disclosure requirements under Part Eight of Regulation (EU) No 575/2013 (refer to the Barclays Pillar 3
Report) and will be disclosed on 22 February 2018, available at home.barclays/results.
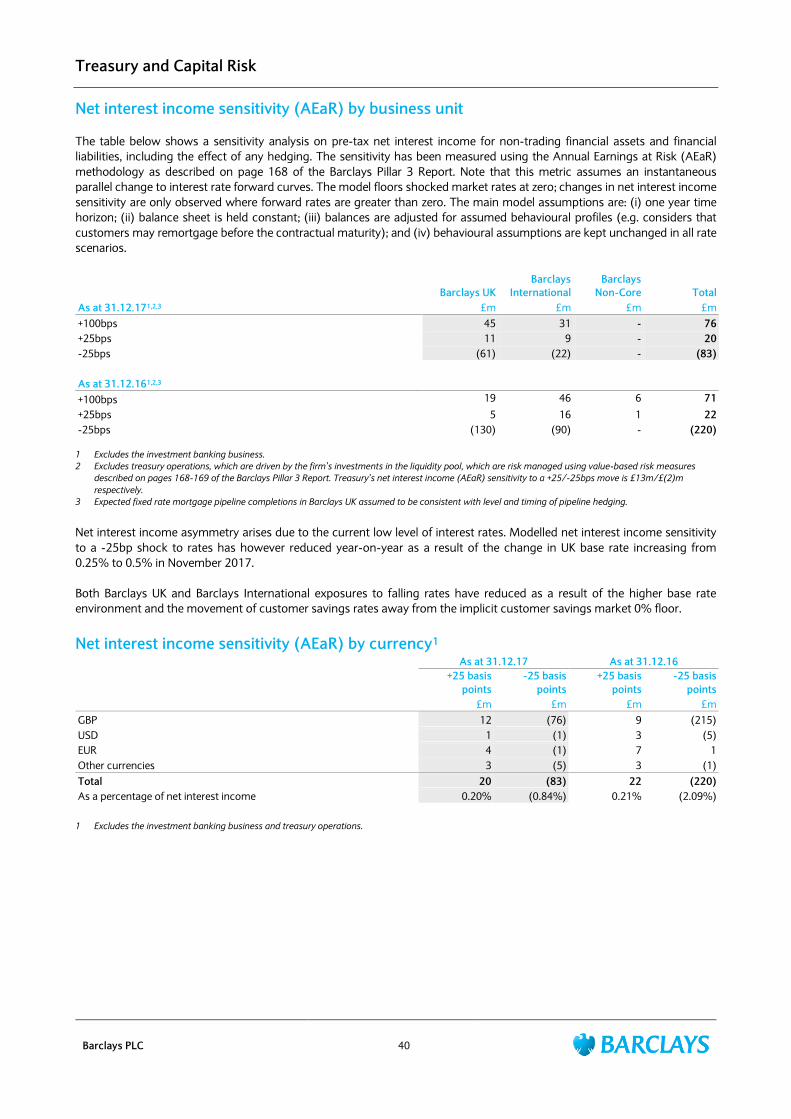
Treasury and Capital Risk
Barclays PLC 40
Net interest income sensitivity (AEaR) by business unit
The table below shows a sensitivity analysis on pre-tax net interest income for non-trading financial assets and financial
liabilities, including the effect of any hedging. The sensitivity has been measured using the Annual Earnings at Risk (AEaR)
methodology as described on page 168 of the Barclays Pillar 3 Report. Note that this metric assumes an instantaneous
parallel change to interest rate forward curves. The model floors shocked market rates at zero; changes in net interest income
sensitivity are only observed where forward rates are greater than zero. The main model assumptions are: (i) one year time
horizon; (ii) balance sheet is held constant; (iii) balances are adjusted for assumed behavioural profiles (e.g. considers that
customers may remortgage before the contractual maturity); and (iv) behavioural assumptions are kept unchanged in all rate
scenarios.
Barclays UK
Barclays
International
Barclays
Non-Core Total
As at 31.12.171,2,3 £m £m £m £m
+100bps 45 31 - 76
+25bps 11 9 - 20
-25bps (61) (22) - (83)
As at 31.12.161,2,3
+100bps 19 46 6 71
+25bps 5 16 1 22
-25bps (130) (90) - (220)
1 Excludes the investment banking business.
2 Excludes treasury operations, which are driven by the firm’s investments in the liquidity pool, which are risk managed using value-based risk measures
described on pages 168-169 of the Barclays Pillar 3 Report. Treasury’s net interest income (AEaR) sensitivity to a +25/-25bps move is £13m/£(2)m
respectively.
3 Expected fixed rate mortgage pipeline completions in Barclays UK assumed to be consistent with level and timing of pipeline hedging.
Net interest income asymmetry arises due to the current low level of interest rates. Modelled net interest income sensitivity
to a -25bp shock to rates has however reduced year-on-year as a result of the change in UK base rate increasing from
0.25% to 0.5% in November 2017.
Both Barclays UK and Barclays International exposures to falling rates have reduced as a result of the higher base rate
environment and the movement of customer savings rates away from the implicit customer savings market 0% floor.
Net interest income sensitivity (AEaR) by currency1 As at 31.12.17 As at 31.12.16
+25 basis
points
-25 basis
points
+25 basis
points
-25 basis
points
£m £m £m £m
GBP 12 (76) 9 (215)
USD 1 (1) 3 (5)
EUR 4 (1) 7 1
Other currencies 3 (5) 3 (1)
Total 20 (83) 22 (220)
As a percentage of net interest income 0.20% (0.84%) 0.21% (2.09%)
1 Excludes the investment banking business and treasury operations.
Statement of Directors’ Responsibilities
Barclays PLC 41
Each of the Directors (the names of whom are set out below) confirm that:
to the best of their knowledge, the condensed consolidated financial statements (set out on pages 42 to 46), which
have been prepared in accordance with the IFRSs as adopted by the European Union, give a true and fair view of the
assets, liabilities, financial position and profit or loss of the Company and the undertakings included in the consolidation
taken as a whole. The condensed consolidated financial statements should be read in conjunction with the annual
financial statements as included in the Annual Report for the year ended 31 December 2017; and
to the best of their knowledge, the management information (set out on pages 1 to 40) includes a fair review of the
development and performance of the business and the position of the Company and the undertakings included in the
consolidation taken as a whole, together with a description of the principal risks and uncertainties that they face. This
management information should be read in conjunction with the principal risks and uncertainties included in the Annual
Report for the year ended 31 December 2017.
Signed on behalf of the Board by
James E Staley Tushar Morzaria
Group Chief Executive Group Finance Director
Barclays PLC Board of Directors:
Chairman
John McFarlane
Executive Directors
James E Staley (Group Chief Executive)
Tushar Morzaria (Group Finance Director)
Non-executive Directors
Mike Ashley
Tim Breedon CBE
Sir Ian Cheshire
Mary Francis CBE
Crawford Gillies
Sir Gerry Grimstone
Reuben Jeffery III
Matthew Lester
Dambisa Moyo
Diane Schueneman
Mike Turner CBE
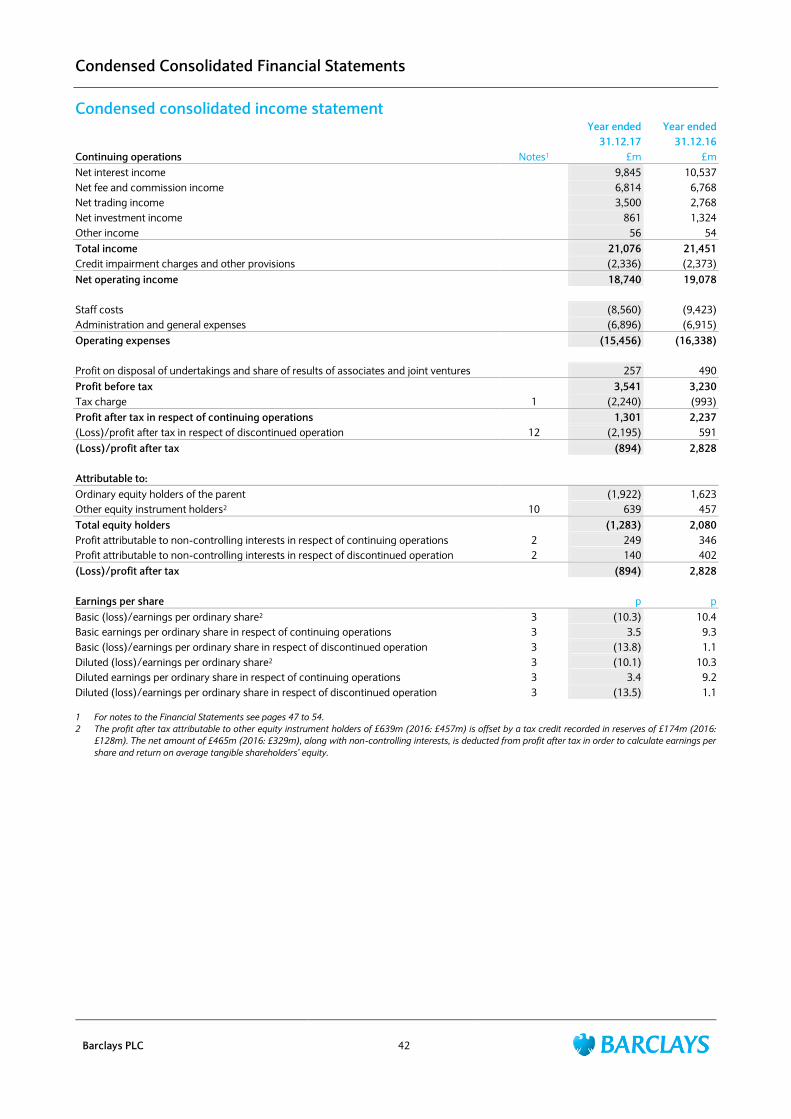
Condensed Consolidated Financial Statements
Barclays PLC 42
Condensed consolidated income statement Year ended Year ended
31.12.17 31.12.16
Continuing operations Notes1 £m £m
Net interest income 9,845 10,537
Net fee and commission income 6,814 6,768
Net trading income 3,500 2,768
Net investment income 861 1,324
Other income 56 54
Total income 21,076 21,451
Credit impairment charges and other provisions (2,336) (2,373)
Net operating income 18,740 19,078
Staff costs (8,560) (9,423)
Administration and general expenses (6,896) (6,915)
Operating expenses (15,456) (16,338)
Profit on disposal of undertakings and share of results of associates and joint ventures 257 490
Profit before tax 3,541 3,230
Tax charge 1 (2,240) (993)
Profit after tax in respect of continuing operations 1,301 2,237
(Loss)/profit after tax in respect of discontinued operation 12 (2,195) 591
(Loss)/profit after tax (894) 2,828
Attributable to:
Ordinary equity holders of the parent (1,922) 1,623
Other equity instrument holders2 10 639 457
Total equity holders (1,283) 2,080
Profit attributable to non-controlling interests in respect of continuing operations 2 249 346
Profit attributable to non-controlling interests in respect of discontinued operation 2 140 402
(Loss)/profit after tax (894) 2,828
Earnings per share p p
Basic (loss)/earnings per ordinary share2 3 (10.3) 10.4
Basic earnings per ordinary share in respect of continuing operations 3 3.5 9.3
Basic (loss)/earnings per ordinary share in respect of discontinued operation 3 (13.8) 1.1
Diluted (loss)/earnings per ordinary share2 3 (10.1) 10.3
Diluted earnings per ordinary share in respect of continuing operations 3 3.4 9.2
Diluted (loss)/earnings per ordinary share in respect of discontinued operation 3 (13.5) 1.1
1 For notes to the Financial Statements see pages 47 to 54.
2 The profit after tax attributable to other equity instrument holders of £639m (2016: £457m) is offset by a tax credit recorded in reserves of £174m (2016:
£128m). The net amount of £465m (2016: £329m), along with non-controlling interests, is deducted from profit after tax in order to calculate earnings per
share and return on average tangible shareholders’ equity.
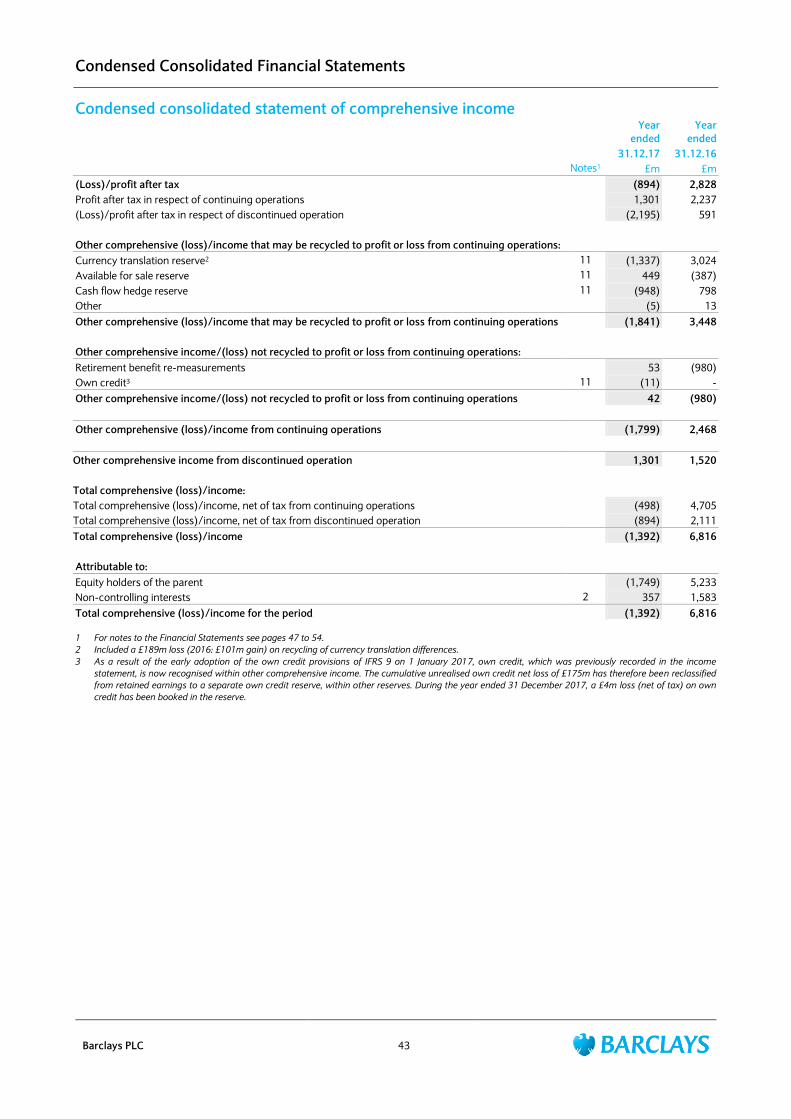
Condensed Consolidated Financial Statements
Barclays PLC 43
Condensed consolidated statement of comprehensive income
Year
ended
Year
ended
31.12.17 31.12.16
Notes1 £m £m
(Loss)/profit after tax (894) 2,828
Profit after tax in respect of continuing operations 1,301 2,237
(Loss)/profit after tax in respect of discontinued operation (2,195) 591
Other comprehensive (loss)/income that may be recycled to profit or loss from continuing operations:
Currency translation reserve2 11 (1,337) 3,024
Available for sale reserve 11 449 (387)
Cash flow hedge reserve 11 (948) 798
Other (5) 13
Other comprehensive (loss)/income that may be recycled to profit or loss from continuing operations (1,841) 3,448
Other comprehensive income/(loss) not recycled to profit or loss from continuing operations:
Retirement benefit re-measurements 53 (980)
Own credit3 11 (11) -
Other comprehensive income/(loss) not recycled to profit or loss from continuing operations 42 (980)
Other comprehensive (loss)/income from continuing operations (1,799) 2,468
Other comprehensive income from discontinued operation 1,301 1,520
Total comprehensive (loss)/income:
Total comprehensive (loss)/income, net of tax from continuing operations (498) 4,705
Total comprehensive (loss)/income, net of tax from discontinued operation (894) 2,111
Total comprehensive (loss)/income (1,392) 6,816
Attributable to:
Equity holders of the parent (1,749) 5,233
Non-controlling interests 2 357 1,583
Total comprehensive (loss)/income for the period (1,392) 6,816
1 For notes to the Financial Statements see pages 47 to 54.
2 Included a £189m loss (2016: £101m gain) on recycling of currency translation differences.
3 As a result of the early adoption of the own credit provisions of IFRS 9 on 1 January 2017, own credit, which was previously recorded in the income
statement, is now recognised within other comprehensive income. The cumulative unrealised own credit net loss of £175m has therefore been reclassified
from retained earnings to a separate own credit reserve, within other reserves. During the year ended 31 December 2017, a £4m loss (net of tax) on own
credit has been booked in the reserve.
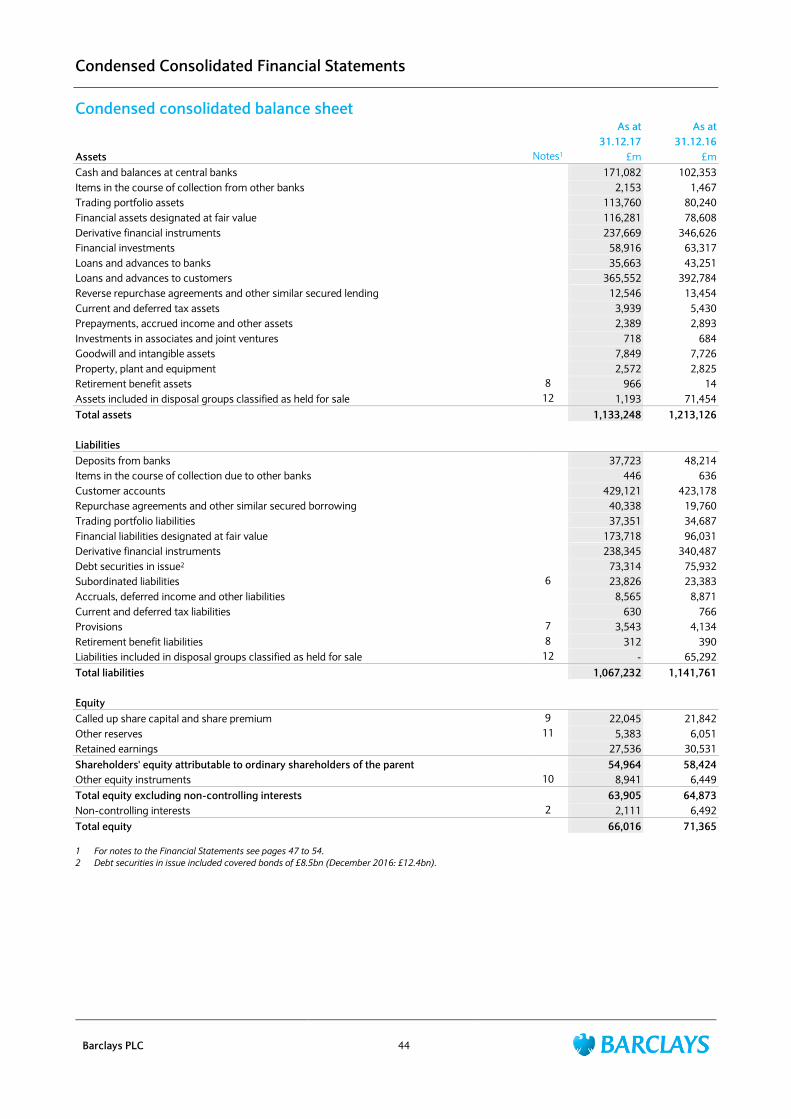
Condensed Consolidated Financial Statements
Barclays PLC 44
Condensed consolidated balance sheet
As at As at
31.12.17 31.12.16
Assets Notes1 £m £m
Cash and balances at central banks 171,082 102,353
Items in the course of collection from other banks 2,153 1,467
Trading portfolio assets 113,760 80,240
Financial assets designated at fair value 116,281 78,608
Derivative financial instruments 237,669 346,626
Financial investments 58,916 63,317
Loans and advances to banks 35,663 43,251
Loans and advances to customers 365,552 392,784
Reverse repurchase agreements and other similar secured lending 12,546 13,454
Current and deferred tax assets 3,939 5,430
Prepayments, accrued income and other assets 2,389 2,893
Investments in associates and joint ventures 718 684
Goodwill and intangible assets 7,849 7,726
Property, plant and equipment 2,572 2,825
Retirement benefit assets 8 966 14
Assets included in disposal groups classified as held for sale 12 1,193 71,454
Total assets 1,133,248 1,213,126
Liabilities
Deposits from banks 37,723 48,214
Items in the course of collection due to other banks 446 636
Customer accounts 429,121 423,178
Repurchase agreements and other similar secured borrowing 40,338 19,760
Trading portfolio liabilities 37,351 34,687
Financial liabilities designated at fair value 173,718 96,031
Derivative financial instruments 238,345 340,487
Debt securities in issue2 73,314 75,932
Subordinated liabilities 6 23,826 23,383
Accruals, deferred income and other liabilities 8,565 8,871
Current and deferred tax liabilities 630 766
Provisions 7 3,543 4,134
Retirement benefit liabilities 8 312 390
Liabilities included in disposal groups classified as held for sale 12 - 65,292
Total liabilities 1,067,232 1,141,761
Equity
Called up share capital and share premium 9 22,045 21,842
Other reserves 11 5,383 6,051
Retained earnings 27,536 30,531
Shareholders' equity attributable to ordinary shareholders of the parent 54,964 58,424
Other equity instruments 10 8,941 6,449
Total equity excluding non-controlling interests 63,905 64,873
Non-controlling interests 2 2,111 6,492
Total equity 66,016 71,365
1 For notes to the Financial Statements see pages 47 to 54.
2 Debt securities in issue included covered bonds of £8.5bn (December 2016: £12.4bn).
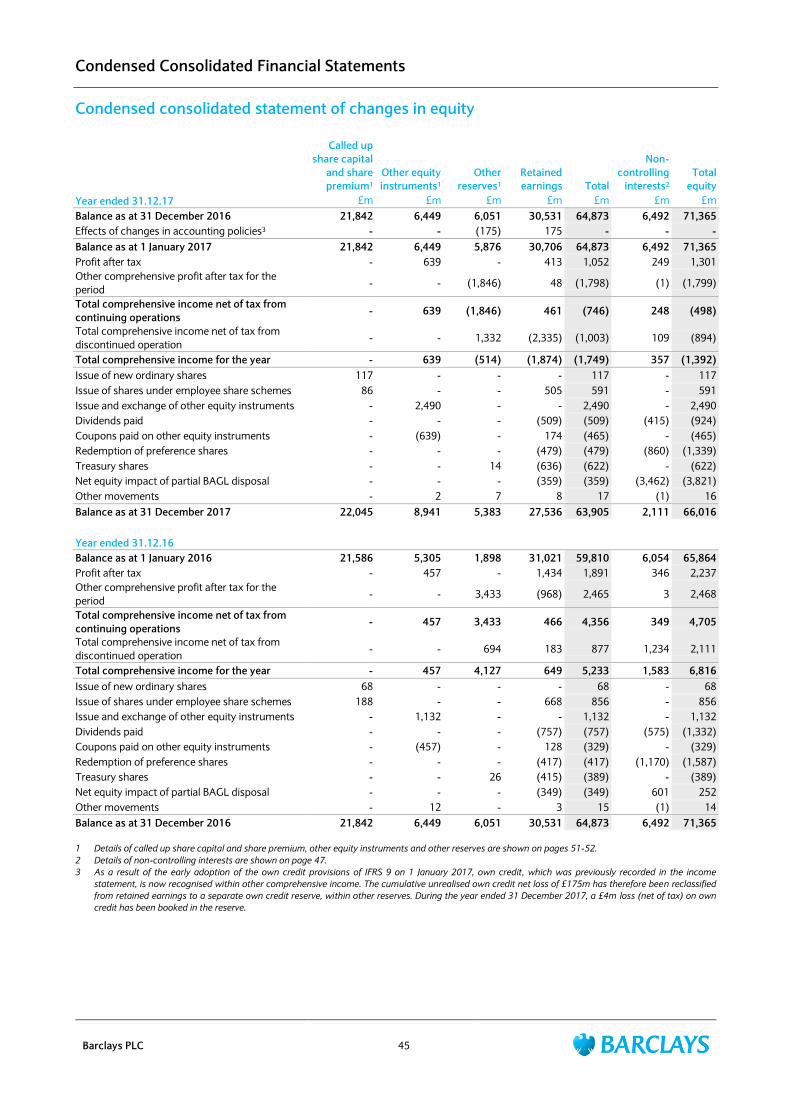
Condensed Consolidated Financial Statements
Barclays PLC 45
Condensed consolidated statement of changes in equity
Called up
share capital
and share
premium1
Other equity
instruments1
Other
reserves1
Retained
earnings Total
Non-
controlling
interests2
Total
equity
Year ended 31.12.17 £m £m £m £m £m £m £m
Balance as at 31 December 2016 21,842 6,449 6,051 30,531 64,873 6,492 71,365
Effects of changes in accounting policies3 - - (175) 175 - - -
Balance as at 1 January 2017 21,842 6,449 5,876 30,706 64,873 6,492 71,365
Profit after tax - 639 - 413 1,052 249 1,301
Other comprehensive profit after tax for the
period - - (1,846) 48 (1,798) (1) (1,799)
Total comprehensive income net of tax from
continuing operations - 639 (1,846) 461 (746) 248 (498)
Total comprehensive income net of tax from
discontinued operation - - 1,332 (2,335) (1,003) 109 (894)
Total comprehensive income for the year - 639 (514) (1,874) (1,749) 357 (1,392)
Issue of new ordinary shares 117 - - - 117 - 117
Issue of shares under employee share schemes 86 - - 505 591 - 591
Issue and exchange of other equity instruments - 2,490 - - 2,490 - 2,490
Dividends paid - - - (509) (509) (415) (924)
Coupons paid on other equity instruments - (639) - 174 (465) - (465)
Redemption of preference shares - - - (479) (479) (860) (1,339)
Treasury shares - - 14 (636) (622) - (622)
Net equity impact of partial BAGL disposal - - - (359) (359) (3,462) (3,821)
Other movements - 2 7 8 17 (1) 16
Balance as at 31 December 2017 22,045 8,941 5,383 27,536 63,905 2,111 66,016
Year ended 31.12.16
Balance as at 1 January 2016 21,586 5,305 1,898 31,021 59,810 6,054 65,864
Profit after tax - 457 - 1,434 1,891 346 2,237
Other comprehensive profit after tax for the
period - - 3,433 (968) 2,465 3 2,468
Total comprehensive income net of tax from
continuing operations - 457 3,433 466 4,356 349 4,705
Total comprehensive income net of tax from
discontinued operation - - 694 183 877 1,234 2,111
Total comprehensive income for the year - 457 4,127 649 5,233 1,583 6,816
Issue of new ordinary shares 68 - - - 68 - 68
Issue of shares under employee share schemes 188 - - 668 856 - 856
Issue and exchange of other equity instruments - 1,132 - - 1,132 - 1,132
Dividends paid - - - (757) (757) (575) (1,332)
Coupons paid on other equity instruments - (457) - 128 (329) - (329)
Redemption of preference shares - - - (417) (417) (1,170) (1,587)
Treasury shares - - 26 (415) (389) - (389)
Net equity impact of partial BAGL disposal - - - (349) (349) 601 252
Other movements - 12 - 3 15 (1) 14
Balance as at 31 December 2016 21,842 6,449 6,051 30,531 64,873 6,492 71,365
1 Details of called up share capital and share premium, other equity instruments and other reserves are shown on pages 51-52.
2 Details of non-controlling interests are shown on page 47.
3 As a result of the early adoption of the own credit provisions of IFRS 9 on 1 January 2017, own credit, which was previously recorded in the income
statement, is now recognised within other comprehensive income. The cumulative unrealised own credit net loss of £175m has therefore been reclassified
from retained earnings to a separate own credit reserve, within other reserves. During the year ended 31 December 2017, a £4m loss (net of tax) on own
credit has been booked in the reserve.
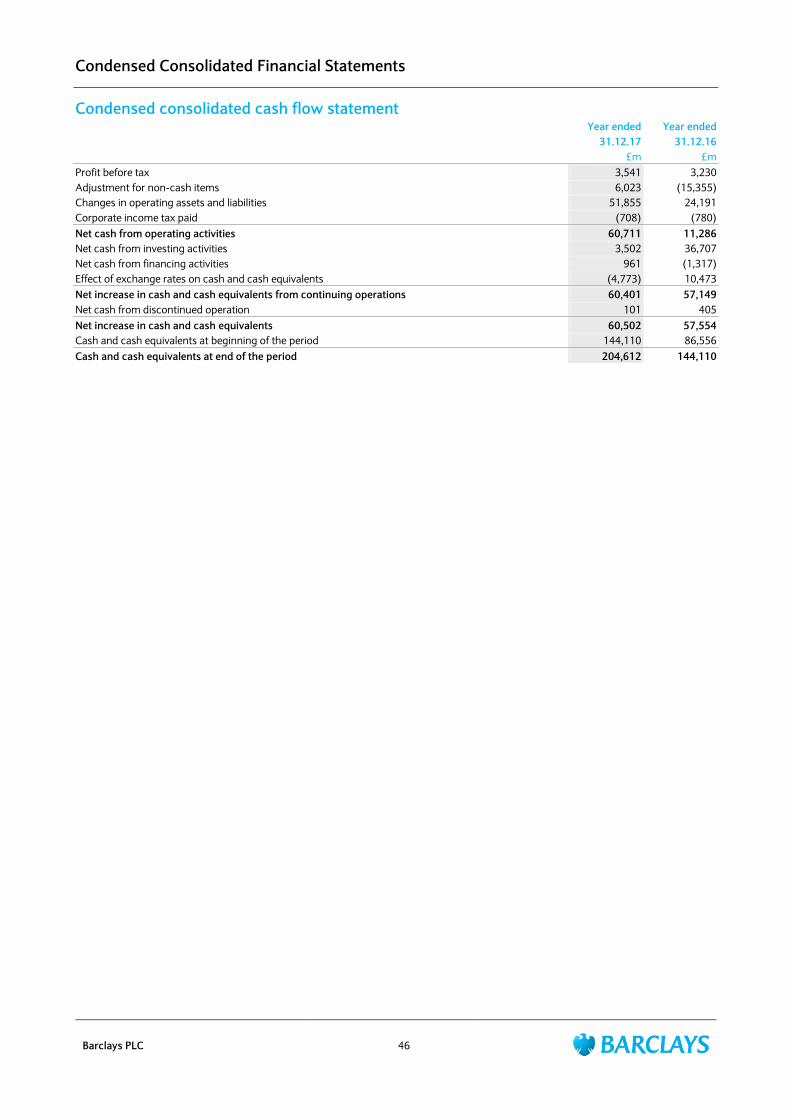
Condensed Consolidated Financial Statements
Barclays PLC 46
Condensed consolidated cash flow statement Year ended Year ended
31.12.17 31.12.16
£m £m
Profit before tax 3,541 3,230
Adjustment for non-cash items 6,023 (15,355)
Changes in operating assets and liabilities 51,855 24,191
Corporate income tax paid (708) (780)
Net cash from operating activities 60,711 11,286
Net cash from investing activities 3,502 36,707
Net cash from financing activities 961 (1,317)
Effect of exchange rates on cash and cash equivalents (4,773) 10,473
Net increase in cash and cash equivalents from continuing operations 60,401 57,149
Net cash from discontinued operation 101 405
Net increase in cash and cash equivalents 60,502 57,554
Cash and cash equivalents at beginning of the period 144,110 86,556
Cash and cash equivalents at end of the period 204,612 144,110
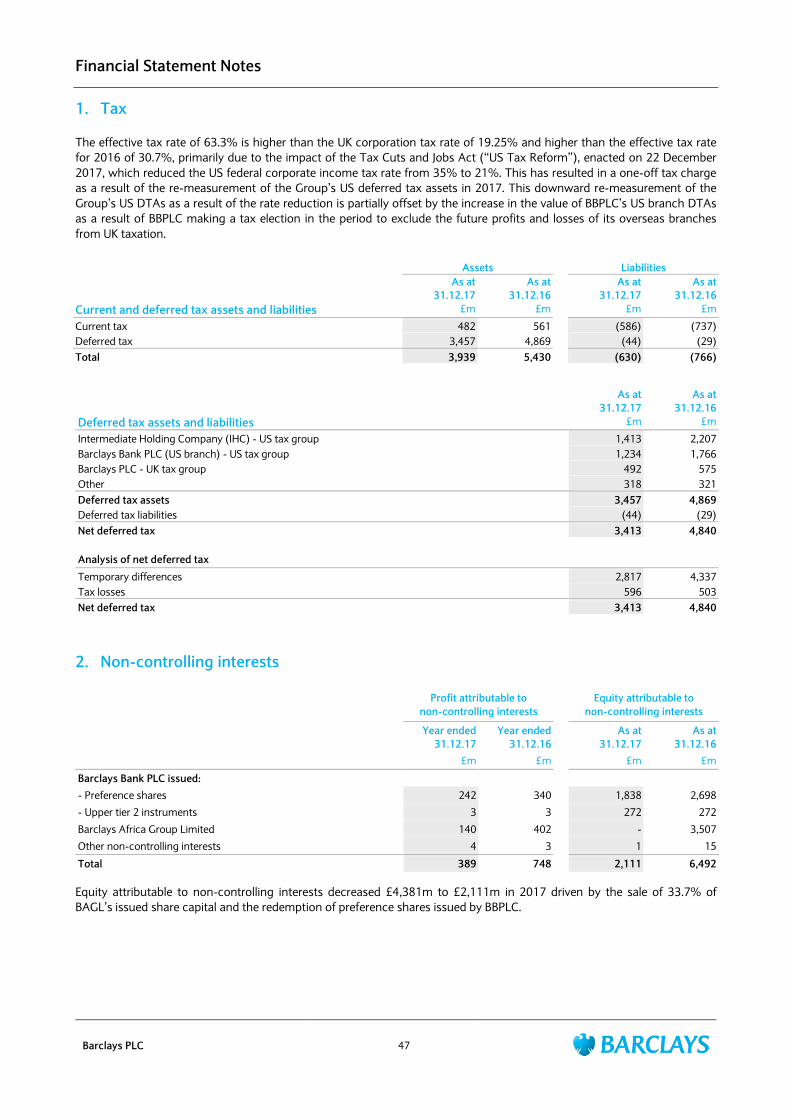
Financial Statement Notes
Barclays PLC 47
1. Tax
The effective tax rate of 63.3% is higher than the UK corporation tax rate of 19.25% and higher than the effective tax rate
for 2016 of 30.7%, primarily due to the impact of the Tax Cuts and Jobs Act (“US Tax Reform”), enacted on 22 December
2017, which reduced the US federal corporate income tax rate from 35% to 21%. This has resulted in a one-off tax charge
as a result of the re-measurement of the Group‟s US deferred tax assets in 2017. This downward re-measurement of the
Group‟s US DTAs as a result of the rate reduction is partially offset by the increase in the value of BBPLC‟s US branch DTAs
as a result of BBPLC making a tax election in the period to exclude the future profits and losses of its overseas branches
from UK taxation.
Assets Liabilities
As at
31.12.17
As at
31.12.16
As at
31.12.17
As at
31.12.16
Current and deferred tax assets and liabilities £m £m £m £m
Current tax 482 561 (586) (737)
Deferred tax 3,457 4,869 (44) (29)
Total 3,939 5,430 (630) (766)
As at
31.12.17
As at
31.12.16
Deferred tax assets and liabilities £m £m
Intermediate Holding Company (IHC) - US tax group 1,413 2,207
Barclays Bank PLC (US branch) - US tax group 1,234 1,766
Barclays PLC - UK tax group 492 575
Other 318 321
Deferred tax assets 3,457 4,869
Deferred tax liabilities (44) (29)
Net deferred tax 3,413 4,840
Analysis of net deferred tax
Temporary differences 2,817 4,337
Tax losses 596 503
Net deferred tax 3,413 4,840
2. Non-controlling interests
Profit attributable to
non-controlling interests
Equity attributable to
non-controlling interests
Year ended
31.12.17
Year ended
31.12.16
As at
31.12.17
As at
31.12.16
£m £m £m £m
Barclays Bank PLC issued:
- Preference shares 242 340 1,838 2,698
- Upper tier 2 instruments 3 3 272 272
Barclays Africa Group Limited 140 402 - 3,507
Other non-controlling interests 4 3 1 15
Total 389 748 2,111 6,492
Equity attributable to non-controlling interests decreased £4,381m to £2,111m in 2017 driven by the sale of 33.7% of
BAGL‟s issued share capital and the redemption of preference shares issued by BBPLC.
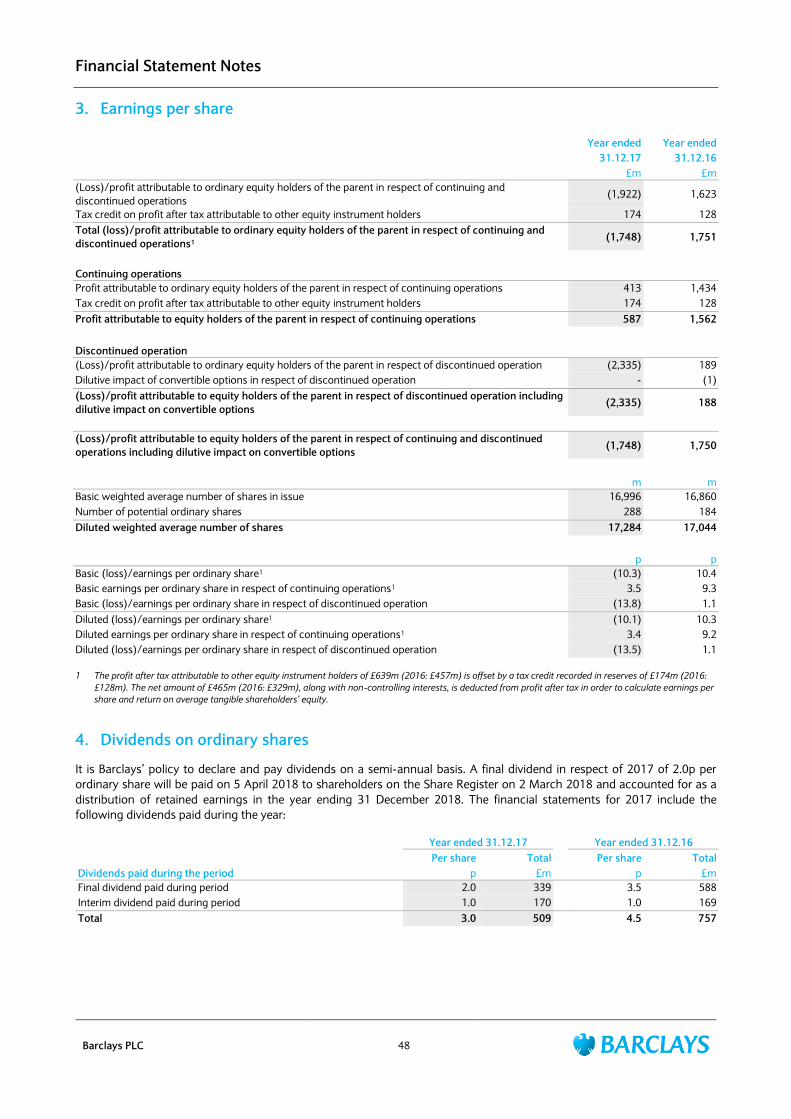
Financial Statement Notes
Barclays PLC 48
3. Earnings per share
Year ended Year ended
31.12.17 31.12.16
£m £m
(Loss)/profit attributable to ordinary equity holders of the parent in respect of continuing and
discontinued operations (1,922) 1,623
Tax credit on profit after tax attributable to other equity instrument holders 174 128
Total (loss)/profit attributable to ordinary equity holders of the parent in respect of continuing and
discontinued operations1 (1,748) 1,751
Continuing operations
Profit attributable to ordinary equity holders of the parent in respect of continuing operations 413 1,434
Tax credit on profit after tax attributable to other equity instrument holders 174 128
Profit attributable to equity holders of the parent in respect of continuing operations 587 1,562
Discontinued operation
(Loss)/profit attributable to ordinary equity holders of the parent in respect of discontinued operation (2,335) 189
Dilutive impact of convertible options in respect of discontinued operation - (1)
(Loss)/profit attributable to equity holders of the parent in respect of discontinued operation including
dilutive impact on convertible options (2,335) 188
(Loss)/profit attributable to equity holders of the parent in respect of continuing and discontinued
operations including dilutive impact on convertible options (1,748) 1,750
m m
Basic weighted average number of shares in issue 16,996 16,860
Number of potential ordinary shares 288 184
Diluted weighted average number of shares 17,284 17,044
p p
Basic (loss)/earnings per ordinary share1 (10.3) 10.4
Basic earnings per ordinary share in respect of continuing operations1 3.5 9.3
Basic (loss)/earnings per ordinary share in respect of discontinued operation (13.8) 1.1
Diluted (loss)/earnings per ordinary share1 (10.1) 10.3
Diluted earnings per ordinary share in respect of continuing operations1 3.4 9.2
Diluted (loss)/earnings per ordinary share in respect of discontinued operation (13.5) 1.1
1 The profit after tax attributable to other equity instrument holders of £639m (2016: £457m) is offset by a tax credit recorded in reserves of £174m (2016:
£128m). The net amount of £465m (2016: £329m), along with non-controlling interests, is deducted from profit after tax in order to calculate earnings per
share and return on average tangible shareholders’ equity.
4. Dividends on ordinary shares
It is Barclays‟ policy to declare and pay dividends on a semi-annual basis. A final dividend in respect of 2017 of 2.0p per
ordinary share will be paid on 5 April 2018 to shareholders on the Share Register on 2 March 2018 and accounted for as a
distribution of retained earnings in the year ending 31 December 2018. The financial statements for 2017 include the
following dividends paid during the year:
Year ended 31.12.17 Year ended 31.12.16
Per share Total Per share Total
Dividends paid during the period p £m p £m
Final dividend paid during period 2.0 339 3.5 588
Interim dividend paid during period 1.0 170 1.0 169
Total 3.0 509 4.5 757
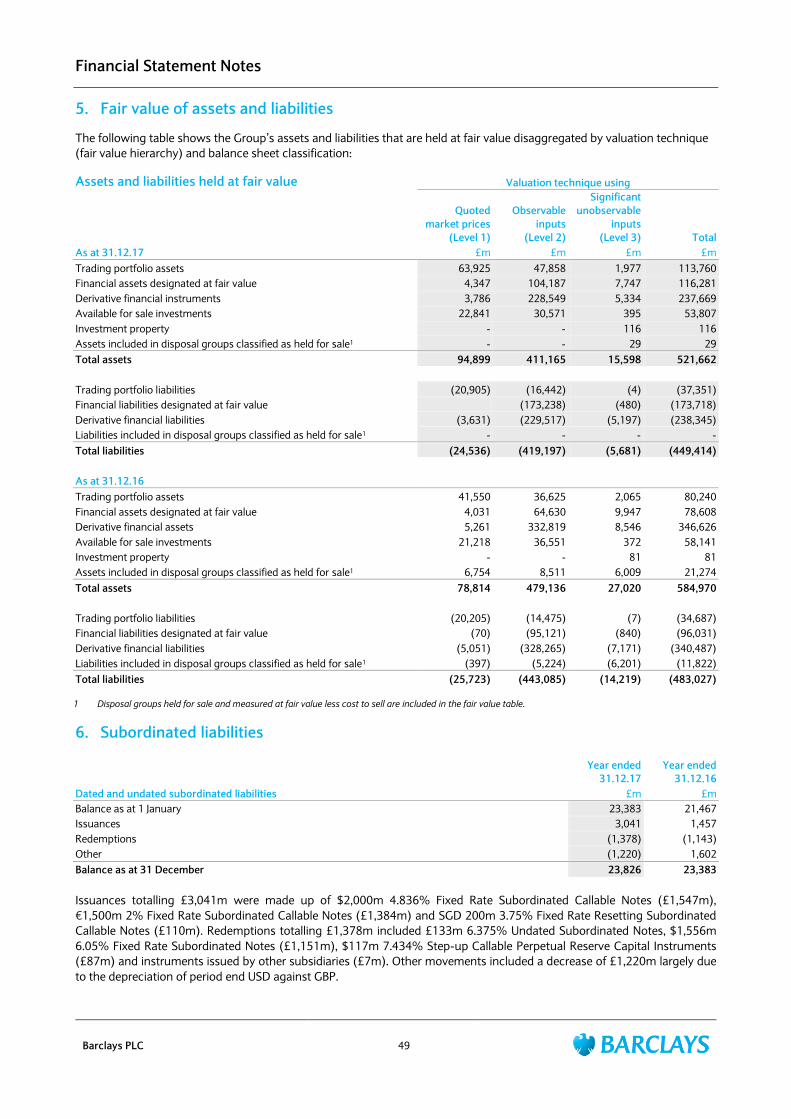
Financial Statement Notes
Barclays PLC 49
5. Fair value of assets and liabilities
The following table shows the Group‟s assets and liabilities that are held at fair value disaggregated by valuation technique
(fair value hierarchy) and balance sheet classification:
Assets and liabilities held at fair value Valuation technique using
Quoted
market prices
(Level 1)
Observable
inputs
(Level 2)
Significant
unobservable
inputs
(Level 3) Total
As at 31.12.17 £m £m £m £m
Trading portfolio assets 63,925 47,858 1,977 113,760
Financial assets designated at fair value 4,347 104,187 7,747 116,281
Derivative financial instruments 3,786 228,549 5,334 237,669
Available for sale investments 22,841 30,571 395 53,807
Investment property - - 116 116
Assets included in disposal groups classified as held for sale1 - - 29 29
Total assets 94,899 411,165 15,598 521,662
Trading portfolio liabilities (20,905) (16,442) (4) (37,351)
Financial liabilities designated at fair value (173,238) (480) (173,718)
Derivative financial liabilities (3,631) (229,517) (5,197) (238,345)
Liabilities included in disposal groups classified as held for sale1 - - - -
Total liabilities (24,536) (419,197) (5,681) (449,414)
As at 31.12.16
Trading portfolio assets 41,550 36,625 2,065 80,240
Financial assets designated at fair value 4,031 64,630 9,947 78,608
Derivative financial assets 5,261 332,819 8,546 346,626
Available for sale investments 21,218 36,551 372 58,141
Investment property - - 81 81
Assets included in disposal groups classified as held for sale1 6,754 8,511 6,009 21,274
Total assets 78,814 479,136 27,020 584,970
Trading portfolio liabilities (20,205) (14,475) (7) (34,687)
Financial liabilities designated at fair value (70) (95,121) (840) (96,031)
Derivative financial liabilities (5,051) (328,265) (7,171) (340,487)
Liabilities included in disposal groups classified as held for sale1 (397) (5,224) (6,201) (11,822)
Total liabilities (25,723) (443,085) (14,219) (483,027)
1 Disposal groups held for sale and measured at fair value less cost to sell are included in the fair value table.
6. Subordinated liabilities
Year ended
31.12.17
Year ended
31.12.16
Dated and undated subordinated liabilities £m £m
Balance as at 1 January 23,383 21,467
Issuances 3,041 1,457
Redemptions (1,378) (1,143)
Other (1,220) 1,602
Balance as at 31 December 23,826 23,383
Issuances totalling £3,041m were made up of $2,000m 4.836% Fixed Rate Subordinated Callable Notes (£1,547m),
€1,500m 2% Fixed Rate Subordinated Callable Notes (£1,384m) and SGD 200m 3.75% Fixed Rate Resetting Subordinated
Callable Notes (£110m). Redemptions totalling £1,378m included £133m 6.375% Undated Subordinated Notes, $1,556m
6.05% Fixed Rate Subordinated Notes (£1,151m), $117m 7.434% Step-up Callable Perpetual Reserve Capital Instruments
(£87m) and instruments issued by other subsidiaries (£7m). Other movements included a decrease of £1,220m largely due
to the depreciation of period end USD against GBP.
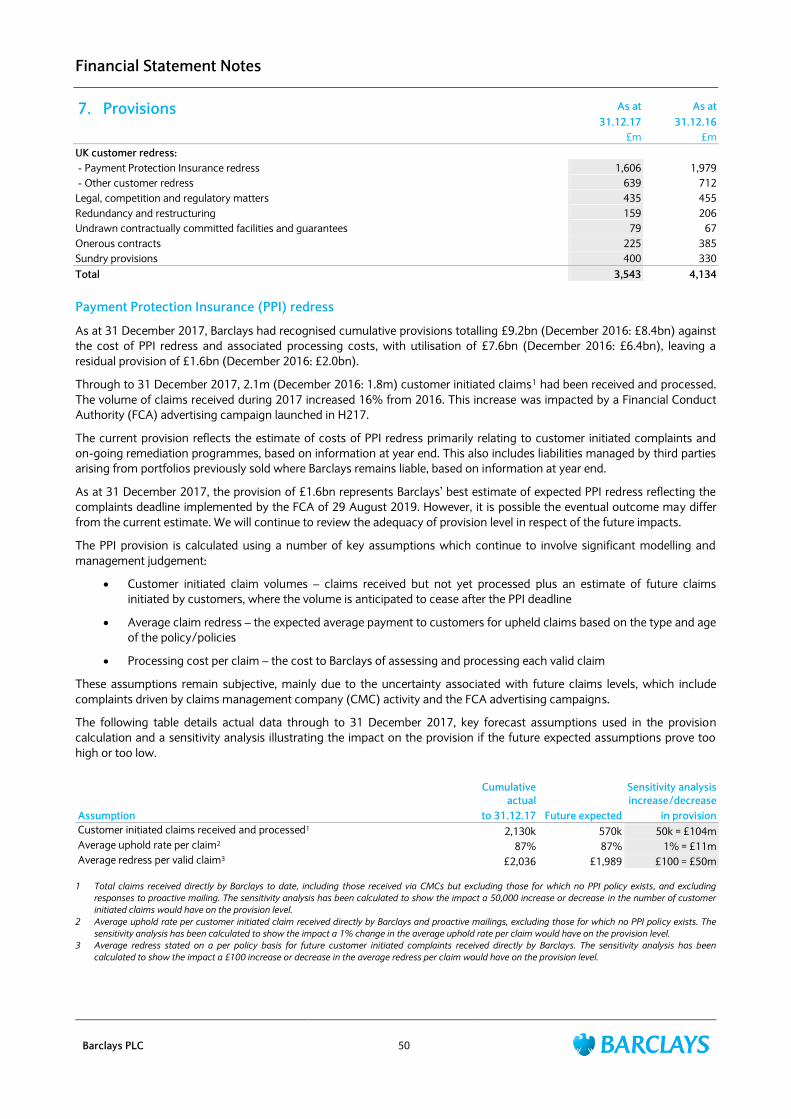
Financial Statement Notes
Barclays PLC 50
7. Provisions As at As at
31.12.17 31.12.16
£m £m
UK customer redress:
- Payment Protection Insurance redress 1,606 1,979
- Other customer redress 639 712
Legal, competition and regulatory matters 435 455
Redundancy and restructuring 159 206
Undrawn contractually committed facilities and guarantees 79 67
Onerous contracts 225 385
Sundry provisions 400 330
Total 3,543 4,134
Payment Protection Insurance (PPI) redress
As at 31 December 2017, Barclays had recognised cumulative provisions totalling £9.2bn (December 2016: £8.4bn) against
the cost of PPI redress and associated processing costs, with utilisation of £7.6bn (December 2016: £6.4bn), leaving a
residual provision of £1.6bn (December 2016: £2.0bn).
Through to 31 December 2017, 2.1m (December 2016: 1.8m) customer initiated claims1 had been received and processed.
The volume of claims received during 2017 increased 16% from 2016. This increase was impacted by a Financial Conduct
Authority (FCA) advertising campaign launched in H217.
The current provision reflects the estimate of costs of PPI redress primarily relating to customer initiated complaints and
on-going remediation programmes, based on information at year end. This also includes liabilities managed by third parties
arising from portfolios previously sold where Barclays remains liable, based on information at year end.
As at 31 December 2017, the provision of £1.6bn represents Barclays‟ best estimate of expected PPI redress reflecting the
complaints deadline implemented by the FCA of 29 August 2019. However, it is possible the eventual outcome may differ
from the current estimate. We will continue to review the adequacy of provision level in respect of the future impacts.
The PPI provision is calculated using a number of key assumptions which continue to involve significant modelling and
management judgement:
Customer initiated claim volumes – claims received but not yet processed plus an estimate of future claims
initiated by customers, where the volume is anticipated to cease after the PPI deadline
Average claim redress – the expected average payment to customers for upheld claims based on the type and age
of the policy/policies
Processing cost per claim – the cost to Barclays of assessing and processing each valid claim
These assumptions remain subjective, mainly due to the uncertainty associated with future claims levels, which include
complaints driven by claims management company (CMC) activity and the FCA advertising campaigns.
The following table details actual data through to 31 December 2017, key forecast assumptions used in the provision
calculation and a sensitivity analysis illustrating the impact on the provision if the future expected assumptions prove too
high or too low.
Cumulative
actual
Sensitivity analysis
increase/decrease
Assumption to 31.12.17 Future expected in provision
Customer initiated claims received and processed1 2,130k 570k 50k = £104m
Average uphold rate per claim2 87% 87% 1% = £11m
Average redress per valid claim3 £2,036 £1,989 £100 = £50m
1 Total claims received directly by Barclays to date, including those received via CMCs but excluding those for which no PPI policy exists, and excluding
responses to proactive mailing. The sensitivity analysis has been calculated to show the impact a 50,000 increase or decrease in the number of customer
initiated claims would have on the provision level.
2 Average uphold rate per customer initiated claim received directly by Barclays and proactive mailings, excluding those for which no PPI policy exists. The
sensitivity analysis has been calculated to show the impact a 1% change in the average uphold rate per claim would have on the provision level.
3 Average redress stated on a per policy basis for future customer initiated complaints received directly by Barclays. The sensitivity analysis has been
calculated to show the impact a £100 increase or decrease in the average redress per claim would have on the provision level.
Financial Statement Notes
Barclays PLC 51
8. Retirement benefits As at 31 December 2017, the Group‟s IAS 19 pension surplus across all schemes was £0.7bn (2016: £0.4bn deficit). The UK
Retirement Fund (UKRF), which is the Group‟s main scheme, had a surplus of £1.0bn (2016: £27m deficit). The movement
for the UKRF was driven by payment of deficit contributions, higher than assumed asset returns, updated mortality
assumptions and lower expected future price inflation, offset by a decrease in the discount rate, transfers out of the scheme
and the introduction of an assumption for future transfers out.
UKRF funding valuations
The scheme actuary prepares an annual update of the UKRF funding position in addition to the full triennial actuarial
valuation. The latest annual update was carried out as at 30 September 2017 and showed a deficit of £4.8bn and a funding
level of 86.8%.
The last triennial actuarial valuation of the UKRF had an effective date of 30 September 2016 and was completed in July
2017. This valuation showed a funding deficit of £7.9bn and a funding level of 81.5%.
The improvement in funding position between 30 September 2016 and 30 September 2017 was largely due to payment of
deficit contributions, higher than assumed asset returns, higher government bond yields and transfers out of the scheme.
The recovery plan agreed as part of the 2016 triennial actuarial valuation requires BBPLC to pay deficit contributions of
£0.5bn per annum between 2018 and 2020, followed by £1.0bn per annum between 2021 and 2026. The deficit reduction
contributions are in addition to the regular contributions to meet the Group‟s share of the cost of benefits accruing over
each year. The agreement with the UKRF Trustee also takes into account the changes to the Group structure that will be
implemented as a result of ring-fencing1. BBPLC will remain as the principal employer of the UKRF. Additional support
measures agreed include a collateral arrangement, joint participation of BBUKPLC until 2025, and support from Barclays
PLC should BBPLC not pay the deficit contributions to the UKRF.
The next triennial actuarial valuation of the UKRF is due to be completed in 2020 with an effective date of 30 September
2019.
1 Refer to page 204 of the Annual Report for further information on structural reform.
9. Called up share capital
Called up share capital comprised of 17,060m (2016: 16,963m) ordinary shares of 25p each. The increase was due to the
issuance of 46m (2016: 116m) shares under employee share schemes and a further 51m (2016: 42m) issued as part of the
Barclays PLC Scrip Dividend Programme.
10. Other equity instruments
Other equity instruments of £8,941m (2016: £6,449m) included AT1 securities issued by Barclays PLC. The increase was
primarily due to two issuances of GBP AT1 securities (December 2016: one issuance of USD AT1 securities), with a principal
amount of £2.5bn (December 2016: £1.1bn).
The AT1 securities are perpetual securities with no fixed maturity and are structured to qualify as AT1 instruments under
CRD IV.
All AT1 securities will be converted into ordinary shares of Barclays PLC, at a pre-determined price, should the fully loaded
CET1 ratio of Barclays PLC fall below 7.0%.
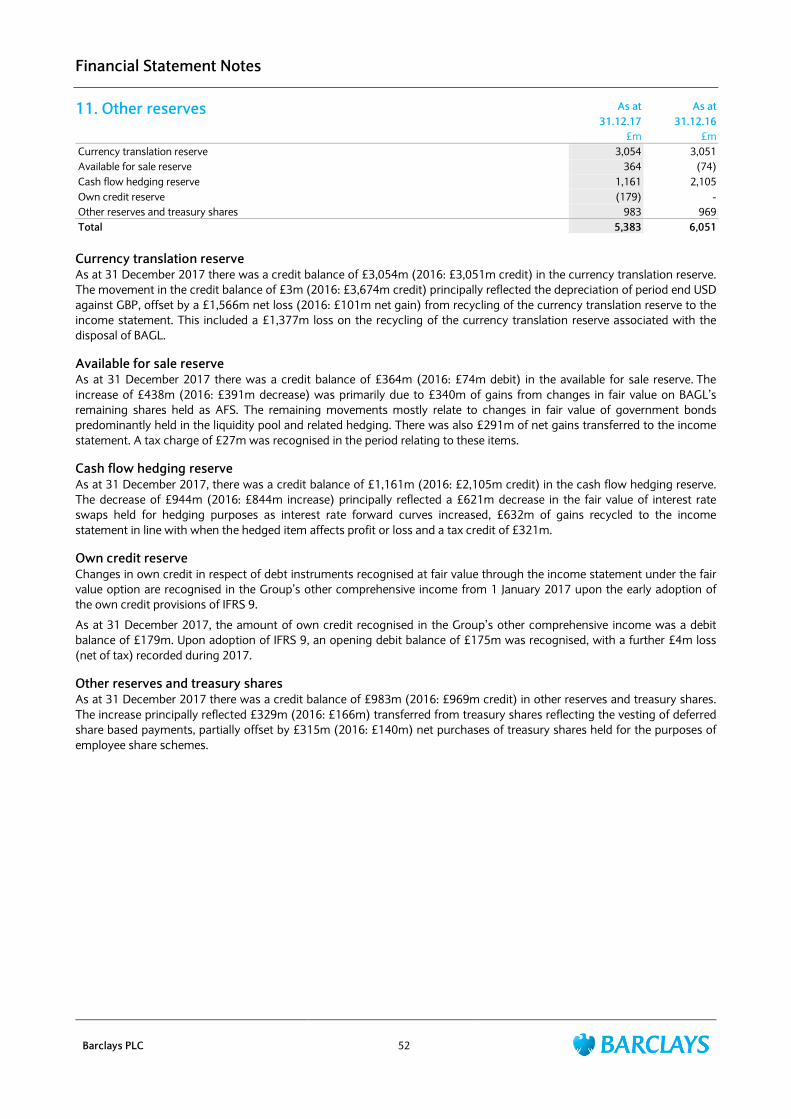
Financial Statement Notes
Barclays PLC 52
11. Other reserves
As at As at
31.12.17 31.12.16
£m £m
Currency translation reserve 3,054 3,051
Available for sale reserve 364 (74)
Cash flow hedging reserve 1,161 2,105
Own credit reserve (179) -
Other reserves and treasury shares 983 969
Total 5,383 6,051
Currency translation reserve
As at 31 December 2017 there was a credit balance of £3,054m (2016: £3,051m credit) in the currency translation reserve.
The movement in the credit balance of £3m (2016: £3,674m credit) principally reflected the depreciation of period end USD
against GBP, offset by a £1,566m net loss (2016: £101m net gain) from recycling of the currency translation reserve to the
income statement. This included a £1,377m loss on the recycling of the currency translation reserve associated with the
disposal of BAGL.
Available for sale reserve
As at 31 December 2017 there was a credit balance of £364m (2016: £74m debit) in the available for sale reserve. The
increase of £438m (2016: £391m decrease) was primarily due to £340m of gains from changes in fair value on BAGL‟s
remaining shares held as AFS. The remaining movements mostly relate to changes in fair value of government bonds
predominantly held in the liquidity pool and related hedging. There was also £291m of net gains transferred to the income
statement. A tax charge of £27m was recognised in the period relating to these items.
Cash flow hedging reserve
As at 31 December 2017, there was a credit balance of £1,161m (2016: £2,105m credit) in the cash flow hedging reserve.
The decrease of £944m (2016: £844m increase) principally reflected a £621m decrease in the fair value of interest rate
swaps held for hedging purposes as interest rate forward curves increased, £632m of gains recycled to the income
statement in line with when the hedged item affects profit or loss and a tax credit of £321m.
Own credit reserve
Changes in own credit in respect of debt instruments recognised at fair value through the income statement under the fair
value option are recognised in the Group‟s other comprehensive income from 1 January 2017 upon the early adoption of
the own credit provisions of IFRS 9.
As at 31 December 2017, the amount of own credit recognised in the Group‟s other comprehensive income was a debit
balance of £179m. Upon adoption of IFRS 9, an opening debit balance of £175m was recognised, with a further £4m loss
(net of tax) recorded during 2017.
Other reserves and treasury shares
As at 31 December 2017 there was a credit balance of £983m (2016: £969m credit) in other reserves and treasury shares.
The increase principally reflected £329m (2016: £166m) transferred from treasury shares reflecting the vesting of deferred
share based payments, partially offset by £315m (2016: £140m) net purchases of treasury shares held for the purposes of
employee share schemes.
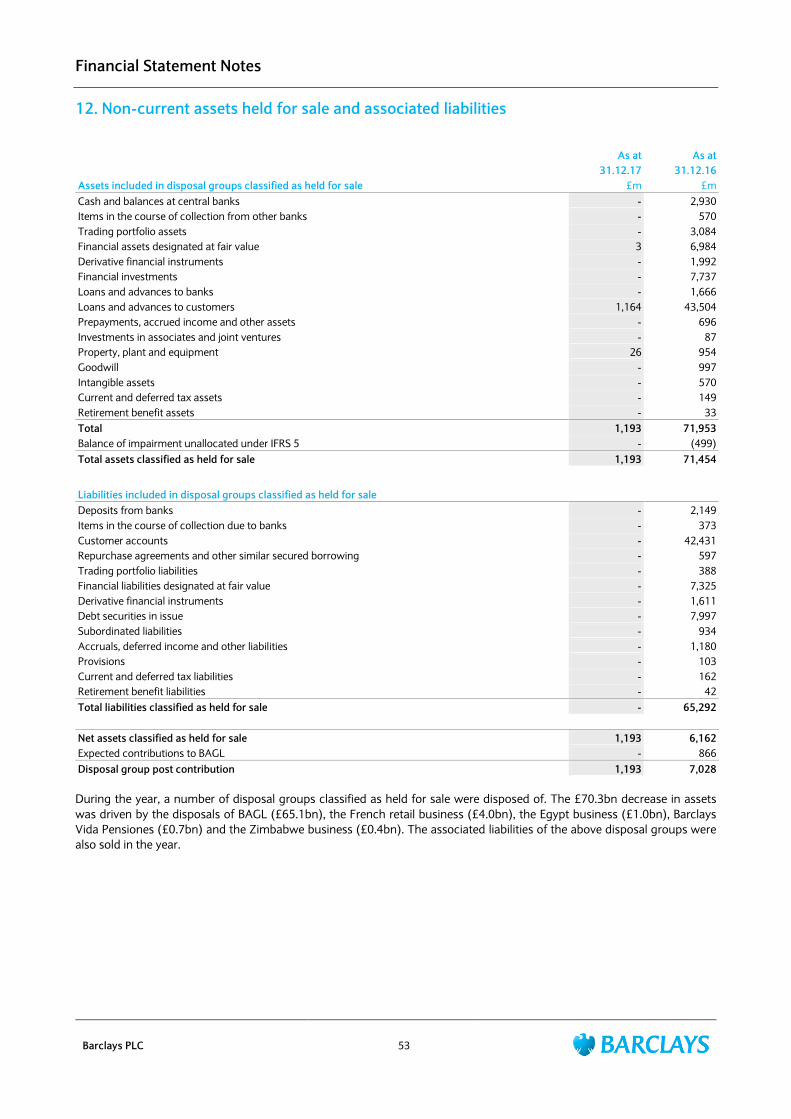
Financial Statement Notes
Barclays PLC 53
12. Non-current assets held for sale and associated liabilities
As at As at
31.12.17 31.12.16
Assets included in disposal groups classified as held for sale £m £m
Cash and balances at central banks - 2,930
Items in the course of collection from other banks - 570
Trading portfolio assets - 3,084
Financial assets designated at fair value 3 6,984
Derivative financial instruments - 1,992
Financial investments - 7,737
Loans and advances to banks - 1,666
Loans and advances to customers 1,164 43,504
Prepayments, accrued income and other assets - 696
Investments in associates and joint ventures - 87
Property, plant and equipment 26 954
Goodwill - 997
Intangible assets - 570
Current and deferred tax assets - 149
Retirement benefit assets - 33
Total 1,193 71,953
Balance of impairment unallocated under IFRS 5 - (499)
Total assets classified as held for sale 1,193 71,454
Liabilities included in disposal groups classified as held for sale
Deposits from banks - 2,149
Items in the course of collection due to banks - 373
Customer accounts - 42,431
Repurchase agreements and other similar secured borrowing - 597
Trading portfolio liabilities - 388
Financial liabilities designated at fair value - 7,325
Derivative financial instruments - 1,611
Debt securities in issue - 7,997
Subordinated liabilities - 934
Accruals, deferred income and other liabilities - 1,180
Provisions - 103
Current and deferred tax liabilities - 162
Retirement benefit liabilities - 42
Total liabilities classified as held for sale - 65,292
Net assets classified as held for sale 1,193 6,162
Expected contributions to BAGL - 866
Disposal group post contribution 1,193 7,028
During the year, a number of disposal groups classified as held for sale were disposed of. The £70.3bn decrease in assets
was driven by the disposals of BAGL (£65.1bn), the French retail business (£4.0bn), the Egypt business (£1.0bn), Barclays
Vida Pensiones (£0.7bn) and the Zimbabwe business (£0.4bn). The associated liabilities of the above disposal groups were
also sold in the year.
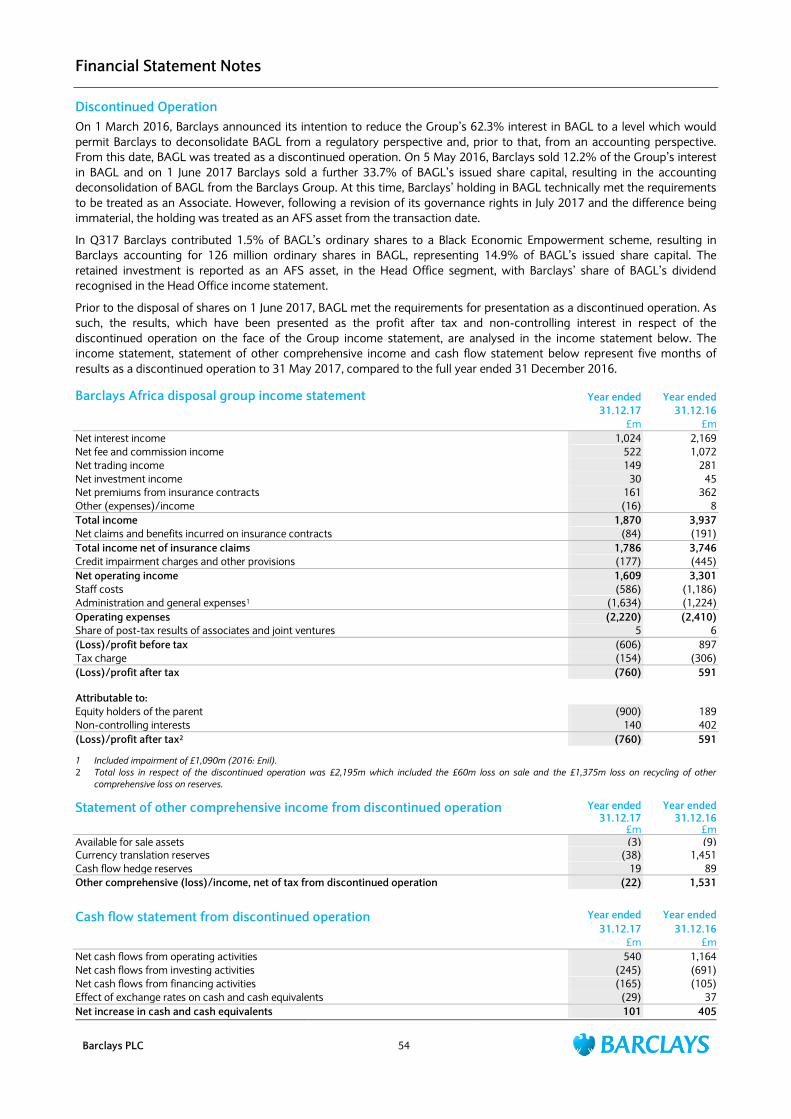
Financial Statement Notes
Barclays PLC 54
Discontinued Operation
On 1 March 2016, Barclays announced its intention to reduce the Group‟s 62.3% interest in BAGL to a level which would
permit Barclays to deconsolidate BAGL from a regulatory perspective and, prior to that, from an accounting perspective.
From this date, BAGL was treated as a discontinued operation. On 5 May 2016, Barclays sold 12.2% of the Group‟s interest
in BAGL and on 1 June 2017 Barclays sold a further 33.7% of BAGL‟s issued share capital, resulting in the accounting
deconsolidation of BAGL from the Barclays Group. At this time, Barclays‟ holding in BAGL technically met the requirements
to be treated as an Associate. However, following a revision of its governance rights in July 2017 and the difference being
immaterial, the holding was treated as an AFS asset from the transaction date.
In Q317 Barclays contributed 1.5% of BAGL‟s ordinary shares to a Black Economic Empowerment scheme, resulting in
Barclays accounting for 126 million ordinary shares in BAGL, representing 14.9% of BAGL‟s issued share capital. The
retained investment is reported as an AFS asset, in the Head Office segment, with Barclays‟ share of BAGL‟s dividend
recognised in the Head Office income statement.
Prior to the disposal of shares on 1 June 2017, BAGL met the requirements for presentation as a discontinued operation. As
such, the results, which have been presented as the profit after tax and non-controlling interest in respect of the
discontinued operation on the face of the Group income statement, are analysed in the income statement below. The
income statement, statement of other comprehensive income and cash flow statement below represent five months of
results as a discontinued operation to 31 May 2017, compared to the full year ended 31 December 2016.
Barclays Africa disposal group income statement Year ended Year ended
31.12.17 31.12.16
£m £m
Net interest income 1,024 2,169
Net fee and commission income 522 1,072
Net trading income 149 281
Net investment income 30 45
Net premiums from insurance contracts 161 362
Other (expenses)/income (16) 8
Total income 1,870 3,937
Net claims and benefits incurred on insurance contracts (84) (191)
Total income net of insurance claims 1,786 3,746
Credit impairment charges and other provisions (177) (445)
Net operating income 1,609 3,301
Staff costs (586) (1,186)
Administration and general expenses1 (1,634) (1,224)
Operating expenses (2,220) (2,410)
Share of post-tax results of associates and joint ventures 5 6
(Loss)/profit before tax (606) 897
Tax charge (154) (306)
(Loss)/profit after tax (760) 591
Attributable to:
Equity holders of the parent (900) 189
Non-controlling interests 140 402
(Loss)/profit after tax2 (760) 591
1 Included impairment of £1,090m (2016: £nil).
2 Total loss in respect of the discontinued operation was £2,195m which included the £60m loss on sale and the £1,375m loss on recycling of other
comprehensive loss on reserves.
Statement of other comprehensive income from discontinued operation Year ended Year ended 31.12.17 31.12.16
£m £m Available for sale assets (3) (9) Currency translation reserves (38) 1,451
Cash flow hedge reserves 19 89
Other comprehensive (loss)/income, net of tax from discontinued operation (22) 1,531
Cash flow statement from discontinued operation Year ended Year ended
31.12.17 31.12.16
£m £m
Net cash flows from operating activities 540 1,164
Net cash flows from investing activities (245) (691)
Net cash flows from financing activities (165) (105)
Effect of exchange rates on cash and cash equivalents (29) 37
Net increase in cash and cash equivalents 101 405
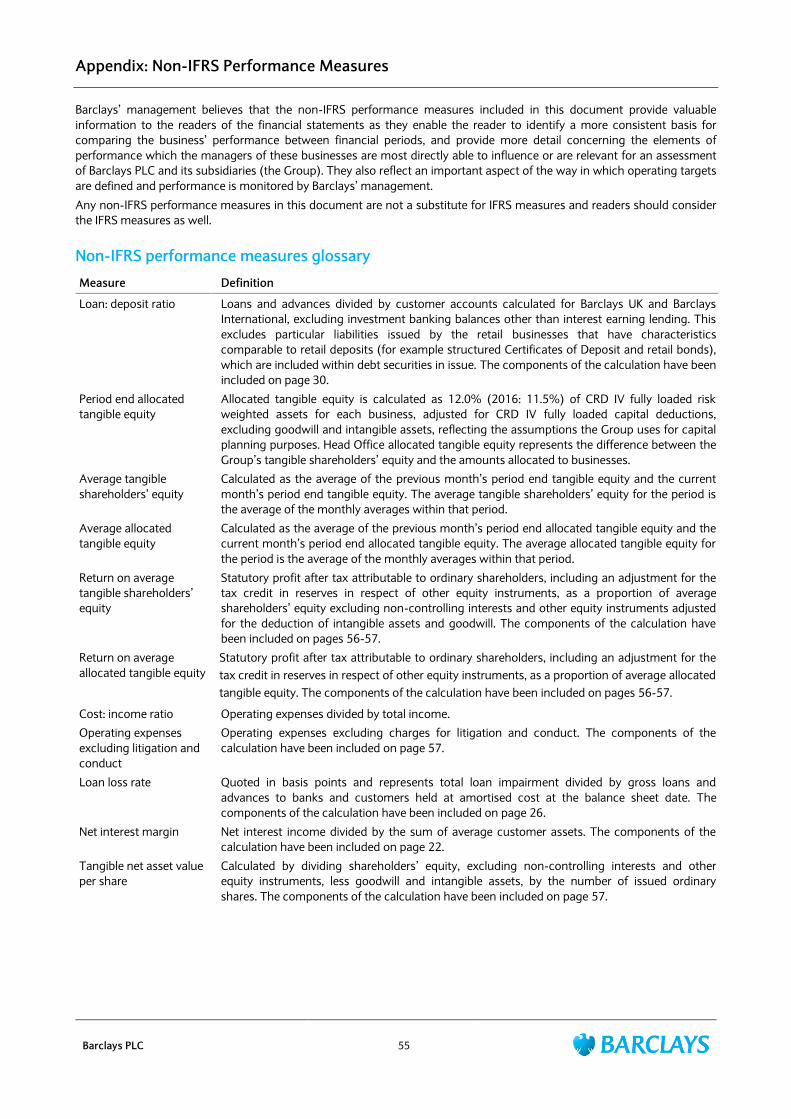
Appendix: Non-IFRS Performance Measures
Barclays PLC 55
Barclays‟ management believes that the non-IFRS performance measures included in this document provide valuable
information to the readers of the financial statements as they enable the reader to identify a more consistent basis for
comparing the business‟ performance between financial periods, and provide more detail concerning the elements of
performance which the managers of these businesses are most directly able to influence or are relevant for an assessment
of Barclays PLC and its subsidiaries (the Group). They also reflect an important aspect of the way in which operating targets
are defined and performance is monitored by Barclays‟ management.
Any non-IFRS performance measures in this document are not a substitute for IFRS measures and readers should consider
the IFRS measures as well.
Non-IFRS performance measures glossary
Measure Definition
Loan: deposit ratio Loans and advances divided by customer accounts calculated for Barclays UK and Barclays
International, excluding investment banking balances other than interest earning lending. This
excludes particular liabilities issued by the retail businesses that have characteristics
comparable to retail deposits (for example structured Certificates of Deposit and retail bonds),
which are included within debt securities in issue. The components of the calculation have been
included on page 30.
Period end allocated
tangible equity
Allocated tangible equity is calculated as 12.0% (2016: 11.5%) of CRD IV fully loaded risk
weighted assets for each business, adjusted for CRD IV fully loaded capital deductions,
excluding goodwill and intangible assets, reflecting the assumptions the Group uses for capital
planning purposes. Head Office allocated tangible equity represents the difference between the
Group‟s tangible shareholders‟ equity and the amounts allocated to businesses.
Average tangible
shareholders‟ equity
Calculated as the average of the previous month‟s period end tangible equity and the current
month‟s period end tangible equity. The average tangible shareholders‟ equity for the period is
the average of the monthly averages within that period.
Average allocated
tangible equity
Calculated as the average of the previous month‟s period end allocated tangible equity and the
current month‟s period end allocated tangible equity. The average allocated tangible equity for
the period is the average of the monthly averages within that period.
Return on average
tangible shareholders‟
equity
Statutory profit after tax attributable to ordinary shareholders, including an adjustment for the
tax credit in reserves in respect of other equity instruments, as a proportion of average
shareholders‟ equity excluding non-controlling interests and other equity instruments adjusted
for the deduction of intangible assets and goodwill. The components of the calculation have
been included on pages 56-57.
Return on average
allocated tangible equity
Statutory profit after tax attributable to ordinary shareholders, including an adjustment for the
tax credit in reserves in respect of other equity instruments, as a proportion of average allocated
tangible equity. The components of the calculation have been included on pages 56-57.
Cost: income ratio Operating expenses divided by total income.
Operating expenses
excluding litigation and
conduct
Operating expenses excluding charges for litigation and conduct. The components of the
calculation have been included on page 57.
Loan loss rate Quoted in basis points and represents total loan impairment divided by gross loans and
advances to banks and customers held at amortised cost at the balance sheet date. The
components of the calculation have been included on page 26.
Net interest margin Net interest income divided by the sum of average customer assets. The components of the
calculation have been included on page 22.
Tangible net asset value
per share
Calculated by dividing shareholders‟ equity, excluding non-controlling interests and other
equity instruments, less goodwill and intangible assets, by the number of issued ordinary
shares. The components of the calculation have been included on page 57.
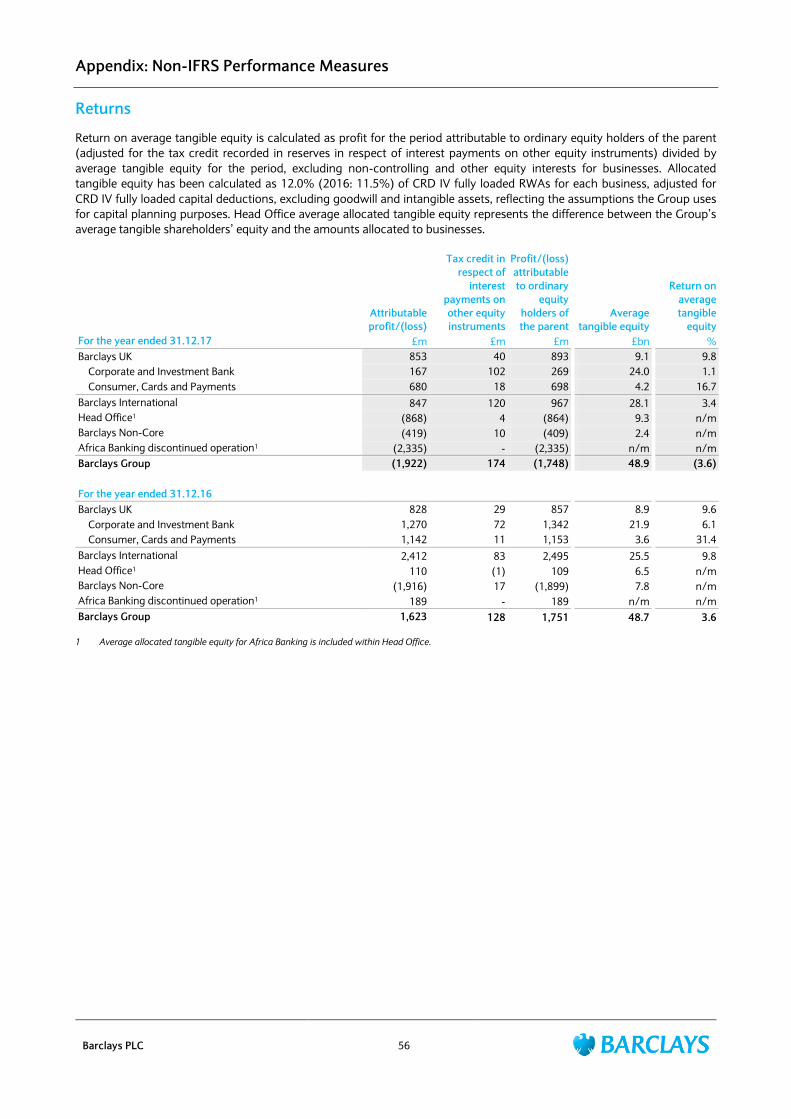
Appendix: Non-IFRS Performance Measures
Barclays PLC 56
Returns
Return on average tangible equity is calculated as profit for the period attributable to ordinary equity holders of the parent
(adjusted for the tax credit recorded in reserves in respect of interest payments on other equity instruments) divided by
average tangible equity for the period, excluding non-controlling and other equity interests for businesses. Allocated
tangible equity has been calculated as 12.0% (2016: 11.5%) of CRD IV fully loaded RWAs for each business, adjusted for
CRD IV fully loaded capital deductions, excluding goodwill and intangible assets, reflecting the assumptions the Group uses
for capital planning purposes. Head Office average allocated tangible equity represents the difference between the Group‟s
average tangible shareholders‟ equity and the amounts allocated to businesses.
Attributable
profit/(loss)
Tax credit in
respect of
interest
payments on
other equity
instruments
Profit/(loss)
attributable
to ordinary
equity
holders of
the parent
Average
tangible equity
Return on
average
tangible
equity
For the year ended 31.12.17 £m £m £m £bn %
Barclays UK 853 40 893 9.1 9.8
Corporate and Investment Bank 167 102 269 24.0 1.1
Consumer, Cards and Payments 680 18 698 4.2 16.7
Barclays International 847 120 967 28.1 3.4
Head Office1 (868) 4 (864) 9.3 n/m
Barclays Non-Core (419) 10 (409) 2.4 n/m
Africa Banking discontinued operation1 (2,335) - (2,335) n/m n/m
Barclays Group (1,922) 174 (1,748) 48.9 (3.6)
For the year ended 31.12.16
Barclays UK 828 29 857 8.9 9.6
Corporate and Investment Bank 1,270 72 1,342 21.9 6.1
Consumer, Cards and Payments 1,142 11 1,153 3.6 31.4
Barclays International 2,412 83 2,495 25.5 9.8
Head Office1 110 (1) 109 6.5 n/m
Barclays Non-Core (1,916) 17 (1,899) 7.8 n/m
Africa Banking discontinued operation1 189 - 189 n/m n/m
Barclays Group 1,623 128 1,751 48.7 3.6
1 Average allocated tangible equity for Africa Banking is included within Head Office.
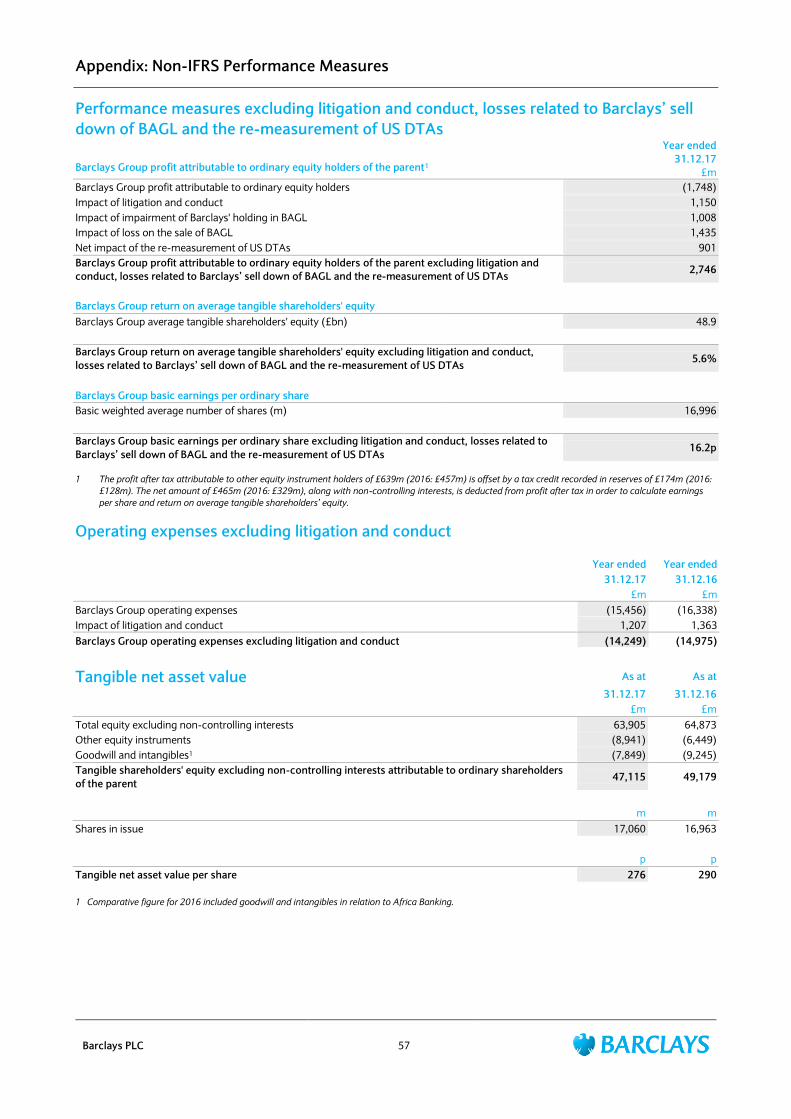
Appendix: Non-IFRS Performance Measures
Barclays PLC 57
Performance measures excluding litigation and conduct, losses related to Barclays’ sell
down of BAGL and the re-measurement of US DTAs Year ended
31.12.17
£m Barclays Group profit attributable to ordinary equity holders of the parent1
Barclays Group profit attributable to ordinary equity holders (1,748)
Impact of litigation and conduct 1,150
Impact of impairment of Barclays' holding in BAGL 1,008
Impact of loss on the sale of BAGL 1,435
Net impact of the re-measurement of US DTAs 901
Barclays Group profit attributable to ordinary equity holders of the parent excluding litigation and
conduct, losses related to Barclays’ sell down of BAGL and the re-measurement of US DTAs 2,746
Barclays Group return on average tangible shareholders' equity
Barclays Group average tangible shareholders' equity (£bn) 48.9
Barclays Group return on average tangible shareholders' equity excluding litigation and conduct,
losses related to Barclays’ sell down of BAGL and the re-measurement of US DTAs 5.6%
Barclays Group basic earnings per ordinary share
Basic weighted average number of shares (m) 16,996
Barclays Group basic earnings per ordinary share excluding litigation and conduct, losses related to
Barclays’ sell down of BAGL and the re-measurement of US DTAs 16.2p
1 The profit after tax attributable to other equity instrument holders of £639m (2016: £457m) is offset by a tax credit recorded in reserves of £174m (2016:
£128m). The net amount of £465m (2016: £329m), along with non-controlling interests, is deducted from profit after tax in order to calculate earnings
per share and return on average tangible shareholders’ equity.
Operating expenses excluding litigation and conduct
Year ended Year ended
31.12.17 31.12.16
£m £m
Barclays Group operating expenses (15,456) (16,338)
Impact of litigation and conduct 1,207 1,363
Barclays Group operating expenses excluding litigation and conduct (14,249) (14,975)
Tangible net asset value As at As at
31.12.17 31.12.16
£m £m
Total equity excluding non-controlling interests 63,905 64,873
Other equity instruments (8,941) (6,449)
Goodwill and intangibles1 (7,849) (9,245)
Tangible shareholders' equity excluding non-controlling interests attributable to ordinary shareholders
of the parent 47,115 49,179
m m
Shares in issue 17,060 16,963
p p
Tangible net asset value per share 276 290
1 Comparative figure for 2016 included goodwill and intangibles in relation to Africa Banking.
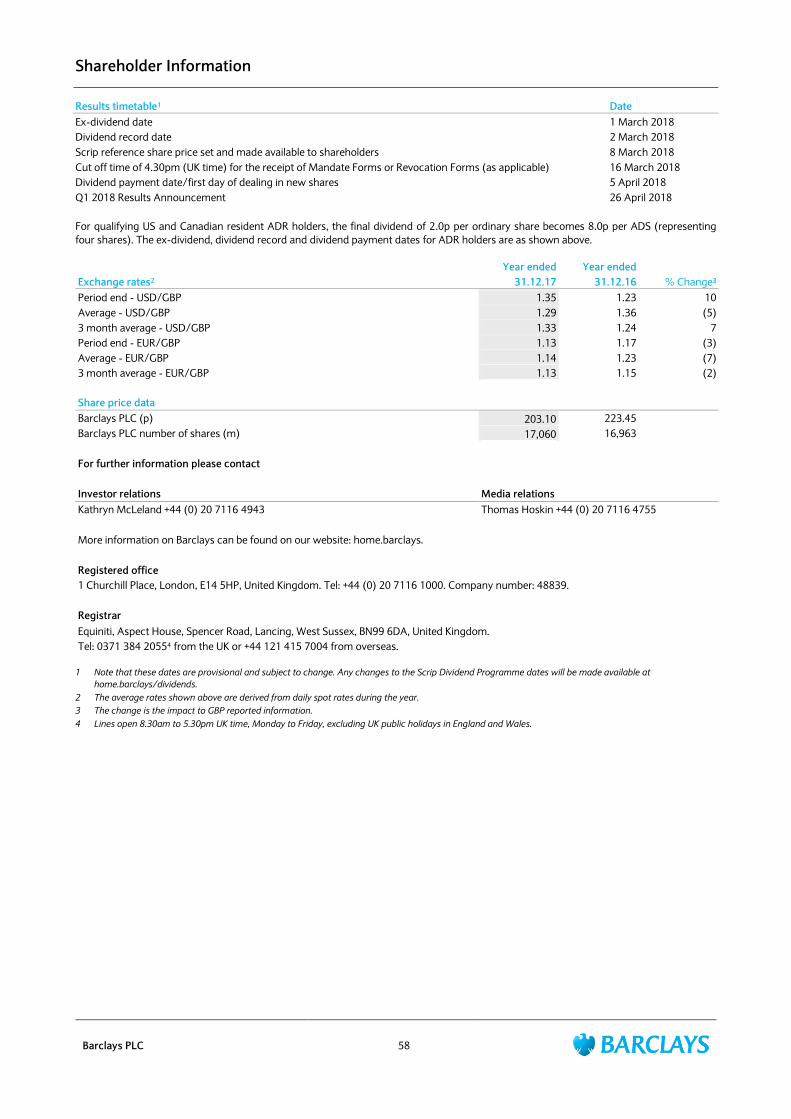
Shareholder Information
Barclays PLC 58
Results timetable1 Date
Ex-dividend date 1 March 2018
Dividend record date 2 March 2018
Scrip reference share price set and made available to shareholders 8 March 2018
Cut off time of 4.30pm (UK time) for the receipt of Mandate Forms or Revocation Forms (as applicable) 16 March 2018
Dividend payment date/first day of dealing in new shares 5 April 2018
Q1 2018 Results Announcement 26 April 2018
For qualifying US and Canadian resident ADR holders, the final dividend of 2.0p per ordinary share becomes 8.0p per ADS (representing
four shares). The ex-dividend, dividend record and dividend payment dates for ADR holders are as shown above.
Year ended Year ended
Exchange rates2 31.12.17 31.12.16 % Change3
Period end - USD/GBP 1.35 1.23 10
Average - USD/GBP 1.29 1.36 (5)
3 month average - USD/GBP 1.33 1.24 7
Period end - EUR/GBP 1.13 1.17 (3)
Average - EUR/GBP 1.14 1.23 (7)
3 month average - EUR/GBP 1.13 1.15 (2)
Share price data
Barclays PLC (p) 203.10 223.45
Barclays PLC number of shares (m) 17,060 16,963
For further information please contact
Investor relations Media relations
Kathryn McLeland +44 (0) 20 7116 4943 Thomas Hoskin +44 (0) 20 7116 4755
More information on Barclays can be found on our website: home.barclays.
Registered office
1 Churchill Place, London, E14 5HP, United Kingdom. Tel: +44 (0) 20 7116 1000. Company number: 48839.
Registrar
Equiniti, Aspect House, Spencer Road, Lancing, West Sussex, BN99 6DA, United Kingdom.
Tel: 0371 384 20554 from the UK or +44 121 415 7004 from overseas.
1 Note that these dates are provisional and subject to change. Any changes to the Scrip Dividend Programme dates will be made available at
home.barclays/dividends.
2 The average rates shown above are derived from daily spot rates during the year.
3 The change is the impact to GBP reported information.
4 Lines open 8.30am to 5.30pm UK time, Monday to Friday, excluding UK public holidays in England and Wales.