barga data science lecture 6
TRANSCRIPT
Deriving Knowledge from Data at Scale

Deriving Knowledge from Data at Scale
Feature extraction and selection are the most important but underrated step
of machine learning. Better features are better than better algorithms…

Deriving Knowledge from Data at Scale

Deriving Knowledge from Data at Scale

Deriving Knowledge from Data at Scale
Lecture Objectives
homework
There is an order or workflow
that takes place here, don’t lose
the forest in the trees…

Deriving Knowledge from Data at Scale
Review…

Deriving Knowledge from Data at Scale
• Cluster 0 – It contains a cluster of Females with an average age of 37 who live in inner city and possess saving account number and current account number. They are unmarried and do not have any mortgage or pep. The average monthly income is 23,300.
• Cluster 1 - It contains a cluster of Females with an average age of 44 who live in rural area and possess saving account number and current account number. They are married and do not have any mortgage or pep. The average monthly income is 27,772.
• Cluster 2 - It contains a cluster of Females with an average age of 48 who live in inner city and possess current account number but no saving account number. They are unmarried and do not have mortgage but do have pep. The average monthly income is 27,668.
• Cluster 3 - It contains a cluster of Females with an average age of 39 who live in town and possess saving account number and current account number. They are married and do not have any mortgage or pep. The average monthly income is 24,047.
• Cluster 4 - It contains a cluster of Males with an average age of 39 who live in inner city and possess current account number but no saving account number. They are married and have mortgage and pep. The average monthly income is 26,359.
• Cluster 5 - It contains a cluster of Males with an average age of 47 who live in inner city and possess saving account number and current account number. They are unmarried and do not have mortgage but do have pep. The average monthly income is 35,419.

Deriving Knowledge from Data at Scale

Deriving Knowledge from Data at Scale
Classifiers Lazy –> IBk

Deriving Knowledge from Data at Scale

Deriving Knowledge from Data at Scale

Deriving Knowledge from Data at Scale

Deriving Knowledge from Data at Scale

Deriving Knowledge from Data at Scale

Deriving Knowledge from Data at Scale15
Deriving Knowledge from Data at Scale
No Prob Target CustID Age
1 0.97 Y 1746 …
2 0.95 N 1024 …
3 0.94 Y 2478 …
4 0.93 Y 3820 …
5 0.92 N 4897 …
… … … …
99 0.11 N 2734 …
100 0.06 N 2422
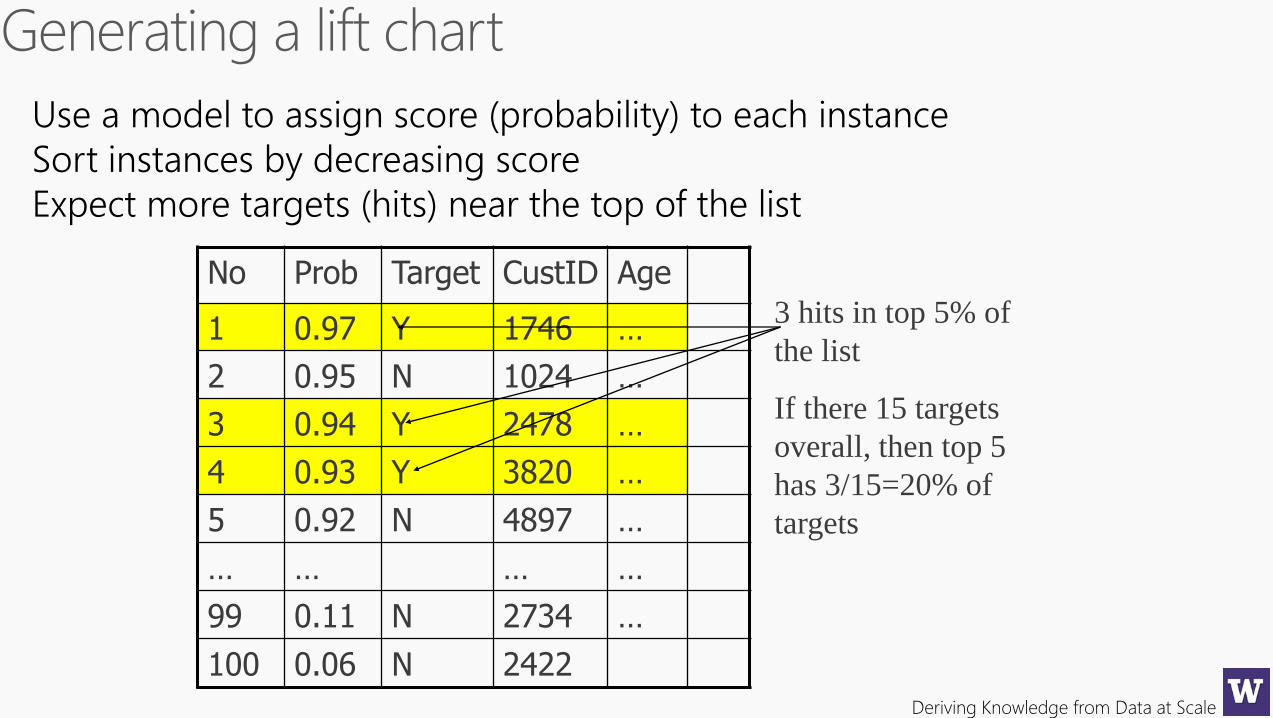
Use a model to assign score (probability) to each instance
Sort instances by decreasing score
Expect more targets (hits) near the top of the list
3 hits in top 5% of
the list
If there 15 targets
overall, then top 5
has 3/15=20% of
targets

Deriving Knowledge from Data at Scale
40% of responses for
10% of cost
Lift factor = 4
80% of responses for
40% of cost
Lift factor = 2Model
Random

Deriving Knowledge from Data at Scale

Deriving Knowledge from Data at Scale

Deriving Knowledge from Data at Scale

Deriving Knowledge from Data at Scale

Deriving Knowledge from Data at Scale
to impact…
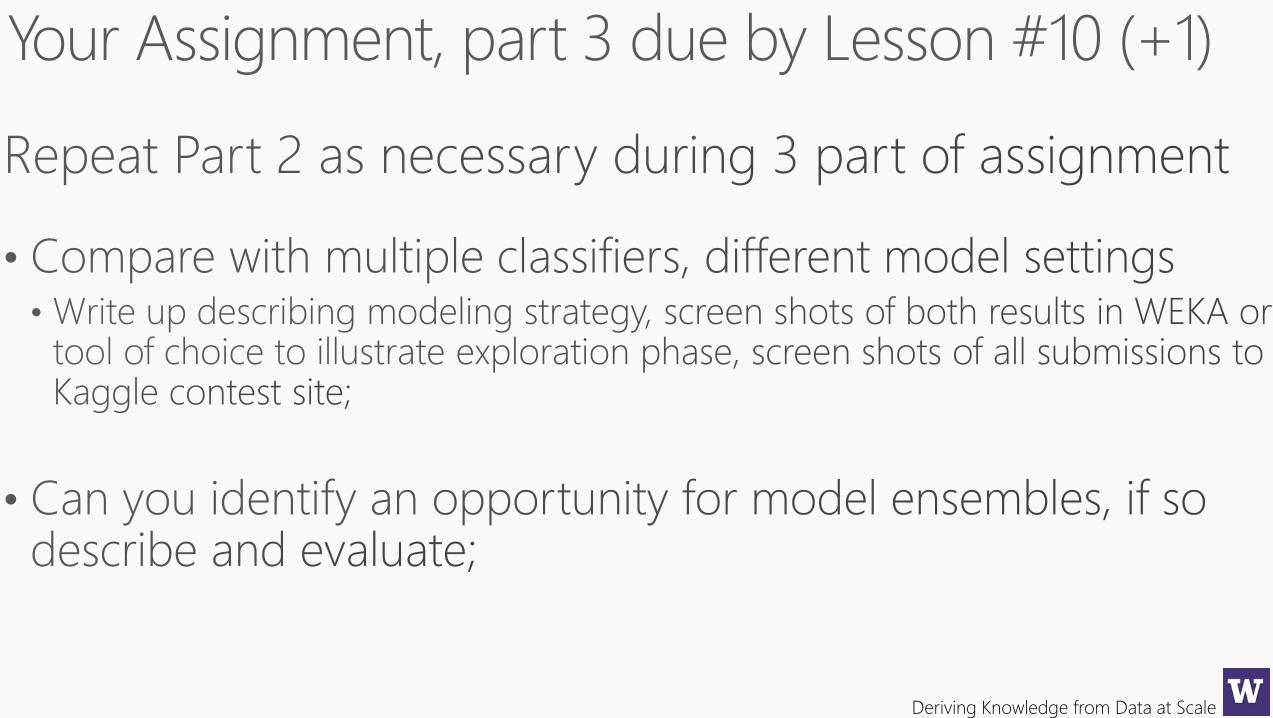
1. Build our predictive model in WEKA Explorer;
2. Use our model to score (predict) which new customers to target in our upcoming advertising campaign;• ARFF file manipulation (hacking), all too common pita…• Excel manipulation to join model output with our customers list
3. Compute the lift chart to assess business impact of our predictive model on the advertising campaign• How are Lift charts built, of all the charts and/or performance
measures from a model this one is ‘on you’ to construct;• Where is the business ‘bang for the buck’?

Deriving Knowledge from Data at Scale

Deriving Knowledge from Data at Scale

Deriving Knowledge from Data at Scale

Deriving Knowledge from Data at Scale
You can’t turn data lead into modeling gold – we’re data scientists, not data alchemists…

Deriving Knowledge from Data at Scale
Motivation: Real world examplesExample (1)
Lesson: Correct data transformation is important!

Deriving Knowledge from Data at Scale
Motivation: Real world examplesExample (2): KDD Cup 2001
Lesson: A model that uses lots of features can turn out to be
very sub-optimal, however well it is designed!

Deriving Knowledge from Data at Scale
Motivation: Real world examplesExample (3)
Lesson: Feature selection can be crucial even when the
number of features is small!

Deriving Knowledge from Data at Scale
Motivation: Real world examplesExample (4)
Lesson: Variations of the same ML method can give vastly
different performances!

Deriving Knowledge from Data at Scale

Deriving Knowledge from Data at Scale
Predictive modeling competitions
Photo by mikebaird, www.flickr.com/photos/mikebaird

Deriving Knowledge from Data at Scale
Global competitions
1½ weeks 70.8%
Competition closes 77%
State of the art 70%
Predicting HIV viral load
Improved by 10%

Deriving Knowledge from Data at Scale
Mismatch between those with data and
those with the skills to analyse it
Crowdsourcing

Deriving Knowledge from Data at Scale
Forecast Error
(MASE)
Existing model
Tourism Forecasting Competition
Aug 9 2 weeks
later
1 month
later
Competition
End

Deriving Knowledge from Data at Scale
• neural networks
• logistic regression
• support vector machine
• decision trees
• ensemble methods
• adaBoost
• Bayesian networks
• genetic algorithms
• random forest
• Monte Carlo methods
• principal component analysis
• Kalman filter
• evolutionary fuzzy modeling
Users apply different techniques

Deriving Knowledge from Data at Scale
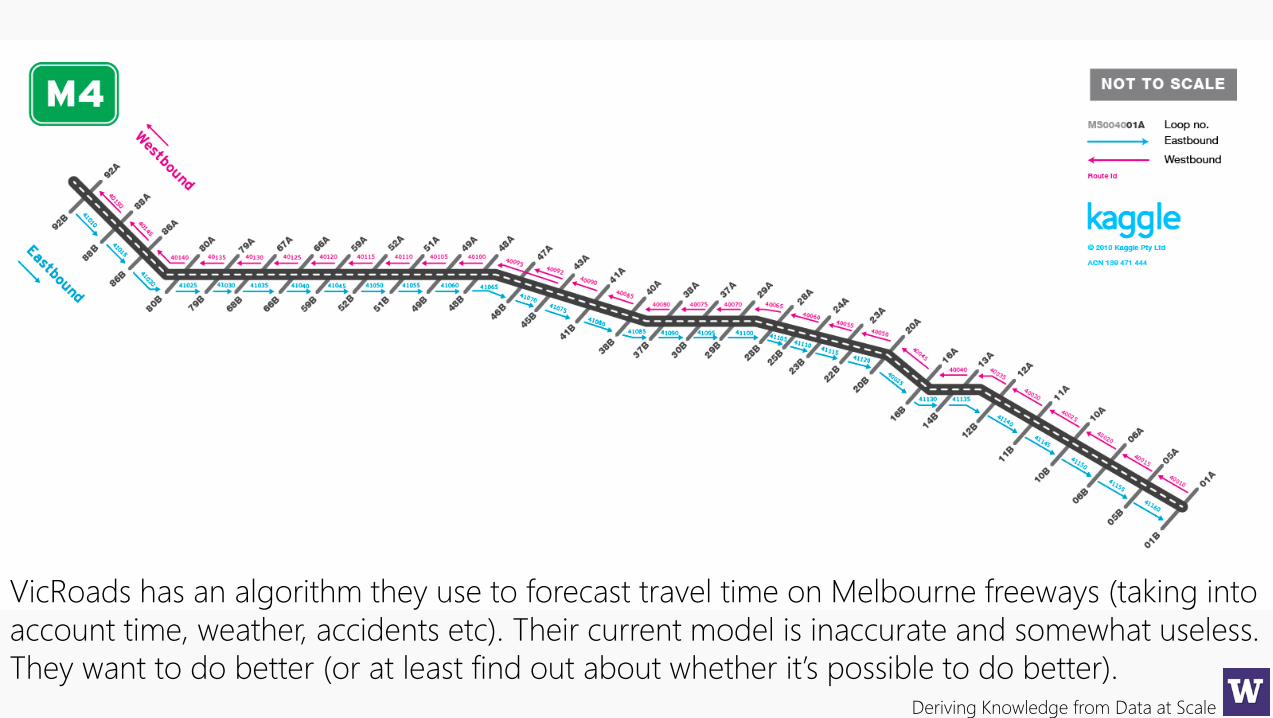
VicRoads has an algorithm they use to forecast travel time on Melbourne freeways (taking into
account time, weather, accidents, etc). Their current model is inaccurate and somewhat
useless. They want to do better (or at least find out about whether it’s possible to do better).

Deriving Knowledge from Data at Scale
1 2 3
Upload Submit Evaluate &
Exchange

Deriving Knowledge from Data at Scale
Use the wizard to post a competition

Deriving Knowledge from Data at Scale
Participants make their entries

Deriving Knowledge from Data at Scale
Competitions are judged based on predictive accuracy

Deriving Knowledge from Data at Scale
Competition Mechanics
Competitions are judged on objective criteria

Deriving Knowledge from Data at Scale
KaggleHow They Won It…

Deriving Knowledge from Data at Scale

Deriving Knowledge from Data at Scale

Deriving Knowledge from Data at Scale
Three Filesford_train
• 510 Trials, ~1,200 observations each spaced by 0.1 sec -> 604,330 rows
ford_test
• 100 Trials,~1,200 observations/trial, 120,841 rows
example_submission.csv

Deriving Knowledge from Data at Scale
Junpei Komiyama (#4)

Deriving Knowledge from Data at Scale
Junpei Komiyama (#4)

Deriving Knowledge from Data at Scale
Mick Wagner (#2)

Deriving Knowledge from Data at Scale
Mick Wagner (#2)

Deriving Knowledge from Data at Scale
Inference (#1)
Deriving Knowledge from Data at Scale
VicRoads has an algorithm they use to forecast travel time on Melbourne freeways (taking into
account time, weather, accidents etc). Their current model is inaccurate and somewhat useless.
They want to do better (or at least find out about whether it’s possible to do better).

Deriving Knowledge from Data at Scale

Deriving Knowledge from Data at Scale
François GUILLEM (#14)

Deriving Knowledge from Data at Scale
#1 used Random Forests

Deriving Knowledge from Data at Scale

Deriving Knowledge from Data at Scale
Homework Week 6
Monday Sept. 21st
Upload to site…
http://blog.kaggle.com/category/dojo/Content is 10 pages of interview on how the team(s) built their models, some have multiple interviews;
You will review at least 10 interviews, bounce around do not go sequentially.
1) What model(s) did they use, 2) insights they had that influenced modeling, 3) what feature creation and
selection, 4) other observations. I will cons all these together and upload as shared document on our site.

Deriving Knowledge from Data at Scale
5 Minute Break…

Deriving Knowledge from Data at Scale
Course Project

Deriving Knowledge from Data at Scale

Deriving Knowledge from Data at Scale
https://www.kaggle.com/c/springleaf-marketing-response
not
Determine whether to send a direct mail piece to a customer

Deriving Knowledge from Data at Scale
The Data

Deriving Knowledge from Data at Scale
The Rules

Deriving Knowledge from Data at Scale

Deriving Knowledge from Data at Scale

Deriving Knowledge from Data at Scale

Deriving Knowledge from Data at Scale
what is the data telling you

Deriving Knowledge from Data at Scale
Deriving Knowledge from Data at Scale

Deriving Knowledge from Data at Scale
Data Wrangling

Deriving Knowledge from Data at Scale
Data
Acquisition
Data
Exploration
Pre-
processing
Feature and
Target
construction
Train/ Test
split
Feature
selection
Model
training
Model
scoring
Model
scoring
Evaluation
Evaluation
Compare
metrics

Deriving Knowledge from Data at Scale
• Data preparation step is by far the most time consuming step
0
10
20
30
40
50
60
70
Understanding
of Domain
Understanding
of Data
Preparation of
Data
Data Mining Evaluation of
Results
Deployment of
Results
KDDM steps
relative effort [%] Cabena et al. estimates
Shearer estimatesCios and Kurgan estimates

Deriving Knowledge from Data at Scale
Out of Class Reading, highly recommended

Deriving Knowledge from Data at Scale
Out of Class Reading, highly recommended

Deriving Knowledge from Data at Scale
1. Do you have domain knowledge?
2. Are your features commensurate?
3. Do you suspect interdependence of features?
4. Do you need to prune the input variables
5. Do you need to assess features individually
6. Do you need a predictor?
7. Do you suspect your data is “dirty”
8. Do you know what to try first?
9. Do you have new ideas, time, computational resources, and enough examples?
10. Do you want a stable solution

Deriving Knowledge from Data at Scale

Deriving Knowledge from Data at Scale

Deriving Knowledge from Data at Scale

Deriving Knowledge from Data at Scale15 15
𝑃 = 0.5𝑃 = 0.5

Deriving Knowledge from Data at Scale
15 157 13
𝑃 = 0.5𝑃 = 0.5
𝑃 = 0.35𝑃 = 0.65

Deriving Knowledge from Data at Scale15 1515 15
𝑃 = 0.5𝑃 = 0.510 10

Deriving Knowledge from Data at Scale15 1515 15
𝑃 = 0.5𝑃 = 0.5
Time
T
r
a
i
n
T
e
s
t
Horizontal
Vertical

Deriving Knowledge from Data at Scale
Data Characterization…

Deriving Knowledge from Data at Scale
1. Unique values
2. Most frequent values
3. Highest and lowest values
4. Location and dispersion – gini, statistical test for dispersion
5. Quartiles

Deriving Knowledge from Data at Scale
1. Missing values
2. Outliers
3. Coding
4. Constraints

Deriving Knowledge from Data at Scale
Missing values – UCI machine learning repository, 31 of 68 data sets
reported to have missing values. “Missing” can mean many things…
MAR: "Missing at Random":– usually best case
– usually not true
Non-randomly missing
Presumed normal, so not measured
Causally missing
– attribute value is missing because of other attribute values (or because of
the outcome value!)

Deriving Knowledge from Data at Scale

Deriving Knowledge from Data at Scale

Deriving Knowledge from Data at Scale

Deriving Knowledge from Data at Scale
Outliers – may indicate ‘bad data’ or it may represent
something scientifically interesting in the data…
Simple working definition: an outlier is an element of a data sequence
S that is inconsistent with expectations, based on the majority of other
elements of S.
Sources of outliers
• Measurement errors
• Other uninteresting anomalous data
• Surprising observations that may be important

Deriving Knowledge from Data at Scale
Outliers – may indicate ‘bad data’ or it may represent
something scientifically interesting in the data…
Simple working definition: an outlier is an element of a data sequence
S that is inconsistent with expectations, based on the majority of other
elements of S.
Sources of outliers• Insurance company sees niche of sports car enthusiasts, married boomers
with kids and second family car. Low risk, lower rate to attract. Simple case
where outlier carries meaning for modeling…

Deriving Knowledge from Data at Scale
Outliers can distort the regression results. When an outlier is
included in the analysis, it pulls the regression line towards
itself. This can result in a solution that is more accurate for the
outlier, but less accurate for all the other cases in the data set.
Outliers – may indicate ‘bad data’ or it may represent
something scientifically interesting in the data…

Deriving Knowledge from Data at Scale
Identify outliers• Question origin, domain knowledge invaluable
• Dispersion – "spread" of a data set, departure from central tendency, use a box plot…
Deal with outliers• Winsorize – Set all outliers to a specified percentile of the data. Not
equivalent to trimming, which simply excludes data. In a Winsorizedestimator, extreme values are instead replaced by certain percentiles (thetrimmed minimum and maximum). Same as clipping in signal processing.
Outliers – may indicate ‘bad data’ or it may represent
something scientifically interesting in the data…

Deriving Knowledge from Data at Scale
Identify outliers• Question origin, domain knowledge invaluable
• Dispersion – "spread" of a data set, departure from central tendency, use a box plot…
Deal with outliers• Include – Robust statistics, a convenient way to summarize results when
they include a small proportion of outliers. A hot topic for research, seeNIPS 2010 Workshop, Robust Statistical learning (robustml).
Outliers – may indicate ‘bad data’ or it may represent
something scientifically interesting in the data…

Deriving Knowledge from Data at Scale
• Entity integrity
• Referential integrity
• Type checking
• Format
• Bounds checking
Constraints

Deriving Knowledge from Data at Scale
• weka.filters.unsupervised.instance.RemoveMisclassified
• weka.filters.unsupervised.instance.RemovePercentage
• weka.filters.unsupervised.instance.RemoveRange
• weka.filters.unsupervised.instance.RemoveWithValues
• weka.filters.unsupervised.instance.Resample

Deriving Knowledge from Data at Scale
5 Minute Break…
Deriving Knowledge from Data at Scale
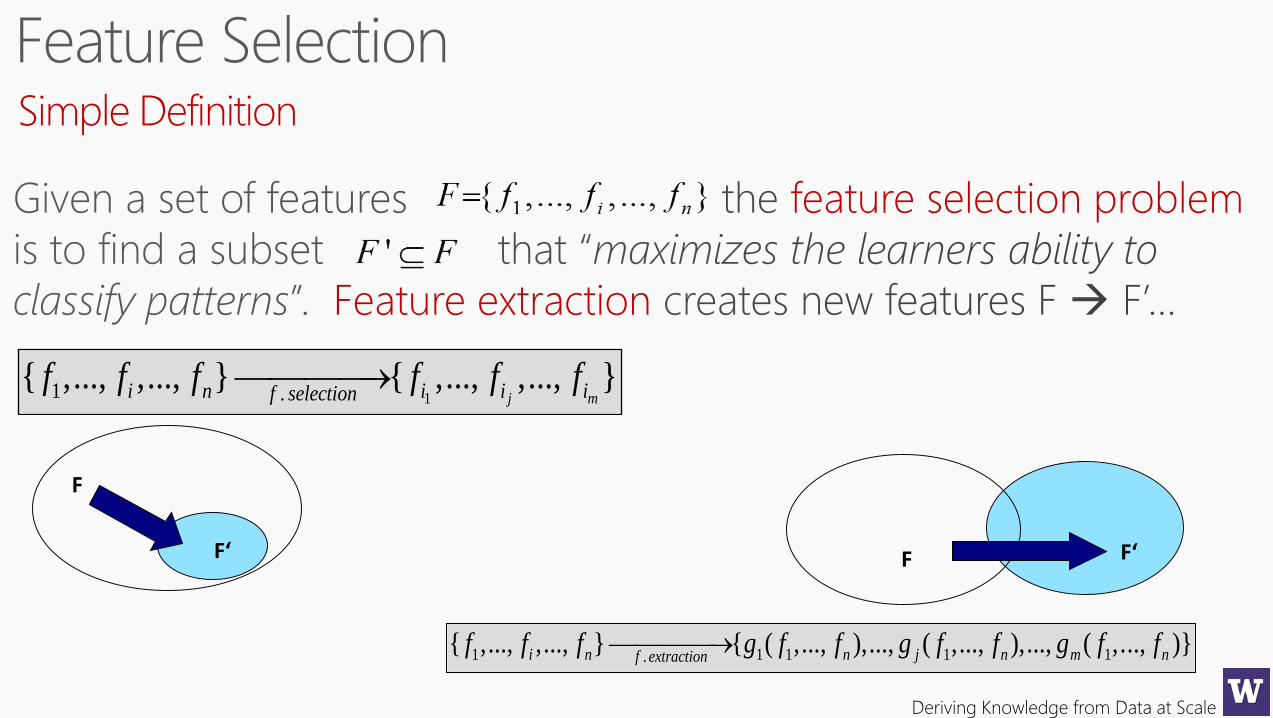
Simple Definition
feature selection problem
Feature extraction
11 .{ ,..., ,..., } { ,..., ,..., }
j mi n i i if selectionf f f f f f
F
F‘ F F‘
1 1 1 1 1.{ ,..., ,..., } { ( ,..., ),..., ( ,..., ),..., ( ,..., )}i n n j n m nf extraction
f f f g f f g f f g f f

Deriving Knowledge from Data at Scale

Deriving Knowledge from Data at Scale
3 types of methodsFilter Methods
Wrapper Methods
Embedded Methodsdecision trees, random forests

Deriving Knowledge from Data at Scale
Most learning methods implicitly do feature selection:• Decision Trees: use info gain or gain ratio to decide what attributes to use as
tests. Many features don’t get used.
• neural nets: backprop learns strong connections to some inputs, and near-
zero connections to other inputs.
• kNN, MBL (any similarity based learning): weights in Weighted Euclidean
Distance determine how important each feature is. Weights near zero mean
feature is not used.
• SVMs: maximum margin hyperplane may focus on important features,
ignore irrelevant features.
So why do we need feature selection?
Data Integration

Deriving Knowledge from Data at Scale
Curse of Dimensionality
exponentially
In many cases the information lost by
discarding variables is made up for by a
more accurate mapping/sampling in the
lower-dimensional space !

Deriving Knowledge from Data at Scale
Feature Selection and EngineeringOptimality?
This deserves a deeper treatment, which we will cover next week with hands-on exercises in class…

Deriving Knowledge from Data at Scale
Numerical data• Binning – a mapping to discrete categories;
• Recenter – shift by c where max, min, avg and median shift, the range and
standard deviation will not shift;
• Rescale – multiply everything by d, all measures change;
• Standard ND – recenter, make mean 0, divide all previous values by SD
Character data
• Lower case
• Spellcheck
• Data extraction (e.g. regular expressions)
Coding – shape and enrich…

Deriving Knowledge from Data at Scale

Deriving Knowledge from Data at Scale
feature
red
blue
green
red
red
green
blue
red blue green
1 0 0
0 1 0
0 0 1
1 0 0
1 0 0
0 0 1
0 1 0

Deriving Knowledge from Data at Scale
Outlook T empera ture Humidity Windy Play
sunny 85 85 false no
sunny 80 90 true no
overcast 83 78 false yes
rain 70 96 false yes
rain 68 80 false yes
rain 65 70 true no
overcast 64 65 true yes
sunny 72 95 false no
sunny 69 70 false yes
rain 75 80 false yes
sunny 75 70 true yes
overcast 72 90 true yes
overcast 81 75 false yes
rain 71 80 true no
Attributes:
Outlook (overcast, rain, sunny)
Temperature real
Humidity real
Windy (true, false)
Play (yes, no)
OutLook OutLook OutLook Temp Humidity Windy Windy Play Play
overcast rain sunny TRUE FALSE yes no
0 0 1 85 85 0 1 1 0
0 0 1 80 90 1 0 0 1
1 0 0 83 78 0 1 1 0
0 1 0 70 96 0 1 1 0
0 1 0 68 80 0 1 1 0
0 1 0 65 70 1 0 0 1
1 0 0 64 65 1 0 1 0
. . . . . . . . .
. . . . . . . . .
Standard
Spreadsheet
Format

Deriving Knowledge from Data at Scale

Deriving Knowledge from Data at Scale
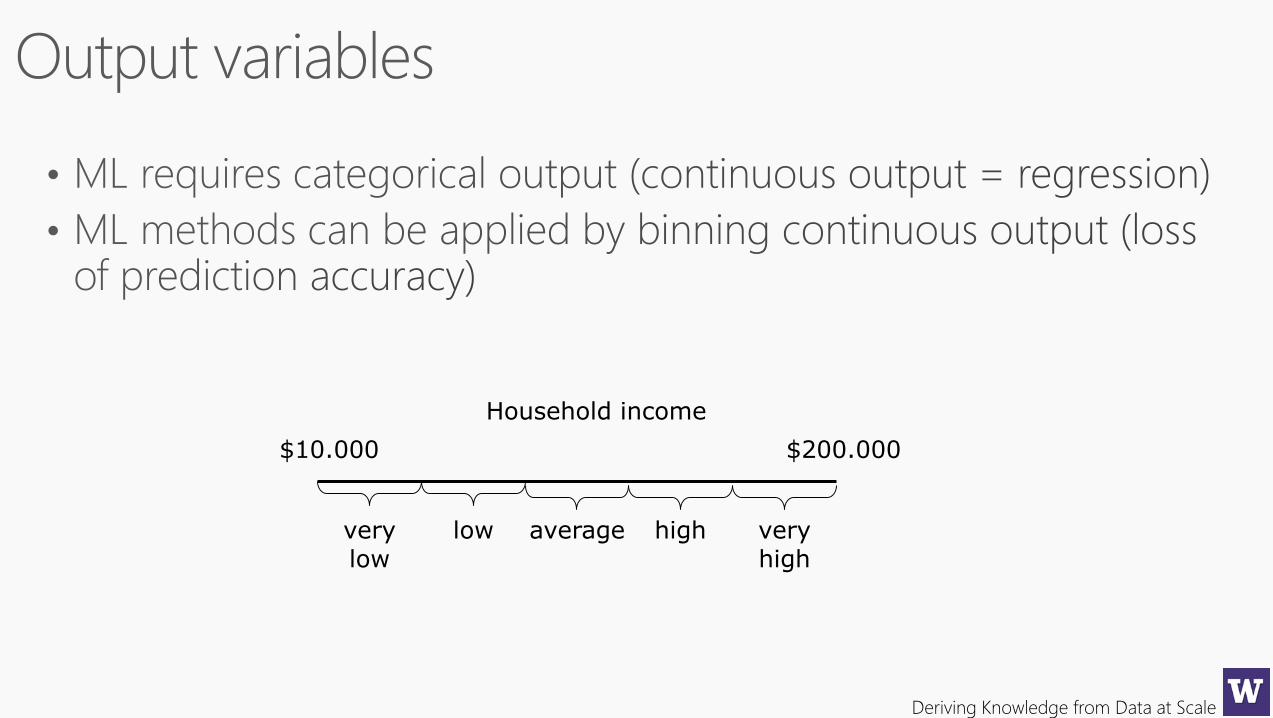
Deriving Knowledge from Data at Scale
Household income
$10.000 $200.000
verylow
low average high veryhigh

Deriving Knowledge from Data at Scale
Less features, more discrimination ability
concept hierarchies

Deriving Knowledge from Data at Scale
• Equal-width (distance) partitioning
uniform grid
• Equal-depth (frequency) partitioning
• Class label based partitioning

Deriving Knowledge from Data at Scale
into the user-specified

Deriving Knowledge from Data at Scale
[64,67) [67,70) [70,73) [73,76) [76,79) [79,82) [82,85]
Temperature values:
64 65 68 69 70 71 72 72 75 75 80 81 83 85
2 2
Count
4
2 2 20

Deriving Knowledge from Data at Scale
[0 – 200,000) … ….
1
Count
Salary in a corporation
[1,800,000 –
2,000,000]

Deriving Knowledge from Data at Scale
user-specified nFi number of intervals

Deriving Knowledge from Data at Scale
[64 .. .. .. .. 69] [70 .. 72] [73 .. .. .. .. .. .. .. .. 81] [83 .. 85]
Temperature values:
64 65 68 69 70 71 72 72 75 75 80 81 83 85
4
Count
4 4
2

Deriving Knowledge from Data at Scale

Deriving Knowledge from Data at Scale
4/12/2016 University of Waikato 119

Deriving Knowledge from Data at Scale
4/12/2016 University of Waikato 120

Deriving Knowledge from Data at Scale
4/12/2016 University of Waikato 121

Deriving Knowledge from Data at Scale
4/12/2016 University of Waikato 122

Deriving Knowledge from Data at Scale
4/12/2016 University of Waikato 123

Deriving Knowledge from Data at Scale
4/12/2016 University of Waikato 124

Deriving Knowledge from Data at Scale
4/12/2016 University of Waikato 125

Deriving Knowledge from Data at Scale
4/12/2016 University of Waikato 126
Deriving Knowledge from Data at Scale
4/12/2016 University of Waikato 127

Deriving Knowledge from Data at Scale
4/12/2016 University of Waikato 128
Deriving Knowledge from Data at Scale
4/12/2016 University of Waikato 129

Deriving Knowledge from Data at Scale
4/12/2016 University of Waikato 130

Deriving Knowledge from Data at Scale
4/12/2016 University of Waikato 131

Deriving Knowledge from Data at Scale
4/12/2016 University of Waikato 132

Deriving Knowledge from Data at Scale
4/12/2016 University of Waikato 133

Deriving Knowledge from Data at Scale
4/12/2016 University of Waikato 134

Deriving Knowledge from Data at Scale
4/12/2016 University of Waikato 135

Deriving Knowledge from Data at Scale
4/12/2016 University of Waikato 136

Deriving Knowledge from Data at Scale
4/12/2016 University of Waikato 137

Deriving Knowledge from Data at Scale
4/12/2016 University of Waikato 138

Deriving Knowledge from Data at Scale
4/12/2016 University of Waikato 139

Deriving Knowledge from Data at Scale

Deriving Knowledge from Data at Scale
Domain expertise, play a hunch in terms of feature discrimination

Deriving Knowledge from Data at Scale
That’s all for tonight….