barista or better? new evidence on the earnings of post · pdf filebarista or better? new...
TRANSCRIPT

Barista or Better? New Evidence on the Earnings of
Post-Secondary Education Graduates: A Tax Linkage
Approach
Ross E. Finnie (University of Ottawa, Canada)
Paper prepared for the 34
th IARIW General Conference
Dresden, Germany, August 21-27, 2016
Session 6E: Research Statistics Required to Support Higher Education Decision Making
Time: Thursday, August 25, 2016 [Afternoon]
Barista or Better? New Evidence on the Earnings of Post-Secondary Education Graduates: A Tax Linkage Approach
July 26, 2016
Ross Finnie
Kaveh Afshar
Eda Bozkurt
Masashi Miyairi
Dejan Pavlic/

ii
Funded in part by the Government of Canada's Sectoral Initiatives Program.
Financé en partie par le gouvernement du Canada par le biais du Programme d’appui aux initiatives
sectorielles.
The opinions and interpretations in this publication are those of the author and do not necessarily
reflect those of the Government of Canada.
Les opinions et les interprétations figurant dans la présente publication sont celles de l’auteur et
ne représentent pas nécessairement celles du gouvernement du Canada.

iii
Acknowledgements
The authors would like to thank Employment and Social Development Canada for
providing the resources that made this project possible. We are especially thankful to Frank
Vermaeten, Silvano Tocchi, Paul Thompson, and Benoît Tessier, as well as Heidi Bungay and
Suzanne Paré for their continued support and useful input, and to Tereshka Gama-Pinto for her
help in the early stages of this project.
We would also like to express our gratitude to Statistics Canada for their partnership in this
project. In particular, we would like to thank Jane Badets, Heather Dryburgh, and Diane Galarneau
for all their efforts in support of this project.
Further thanks go to the colleges and universities that participated in this project, providing
the data on students upon which this project is based, while offering useful feedback and
suggestions throughout the research.
Additionally, we would like to thank Ellen Kachuck Rosenbluth for her helpful comments
and suggestions, and Michael Dubois of EPRI, who helped move this report to its final form.
Finally, we would like to express our appreciation to Innovation, Science and Economic
Development Canada (formerly Industry Canada) and the Ontario Human Capital Research and
Innovation Fund, to Sylvie Michaud at Statistics Canada, and to Allan Rock and Pierre Mercier
from the University of Ottawa for their wholehearted support of the original uOttawa pilot project
which started this whole line of research. Without pioneers like these, innovation would not
happen.
Published by the Education Policy Research Initiative (EPRI)
(613) 562-5800 ext. 2279
www.epri.ca
Authors
Ross Finnie, professor, Graduate School of Public and International Affairs, University of Ottawa
and director, EPRI
Kaveh Afshar, researcher, EPRI
Eda Bozkurt, researcher, EPRI
Masashi Miyairi, researcher, EPRI
Dejan Pavlic, senior researcher, EPRI
The Education Policy Research Initiative (EPRI) is a national research organization based at the
University of Ottawa. EPRI engages in research aimed at informing policy discussions focused on
education, skills, and the labour market.

iv
Related Materials
1. Infographs
2. Interactive Graphs
3. Executive Summary
4. Brief Series (forthcoming)
5. Complete Tables of
Results
For this material and for more information, visit EPRI’s website, www.epri.ca/tax-linkage.

v
Table of Contents
Executive Summary ......................................................................................................... vi
1. Introduction ............................................................................................................... 1
2. Literature Review ...................................................................................................... 2
2.1. Surveys and Census ............................................................................................ 3
2.2. Tax Linkage Approach ....................................................................................... 4
3. Data and Methodology .............................................................................................. 8
4. Analysis of Bachelor’s Degree Graduates ............................................................. 10
4.1. Earnings over Time: All Graduates Taken Together ........................................ 10
4.2. Earnings by Field of Study ............................................................................... 13
4.3. Further Focus on the Growth in Earnings ......................................................... 17
4.4. Cumulative Earnings by Field of Study ............................................................ 20
4.5. What Has Happened Since 2008? ..................................................................... 21
4.6. Earnings by Gender........................................................................................... 24
4.7. Distribution of Earnings .................................................................................... 27
4.8. Differences in the Earnings of Graduates across Institutions ........................... 33
5. Analysis of College Diploma Graduates ................................................................ 36
5.1. Earnings over Time: All Graduates Taken Together ........................................ 36
5.2. Earnings by Field of Study ............................................................................... 39
5.3. Further Focus on the Growth in Earnings ......................................................... 42
5.4. Cumulative Earnings by Field of Study ............................................................ 43
5.5. What Has Happened Since 2008? ..................................................................... 44
5.6. Earnings by Gender........................................................................................... 47
5.7. Distribution of Earnings .................................................................................... 49
5.8. Differences in the Earnings of Graduates across Institutions ........................... 54
6. Concluding Summary and Next Steps ................................................................... 56
6.1. Concluding Summary: The Findings and Their Significance ........................... 56
6.2. Next Steps: Using the Research Platform Developed for This Project ............ 56
6.3. Towards a Broader Skills Agenda .................................................................... 61
6.4. The Need to Act ................................................................................................ 62
7. Bibliography ............................................................................................................. 63
Appendix A: Data and Methodology
Appendix B: Bachelor's Degree Graduates Results
Appendix C: College Diploma Graduates Results

vi
Executive Summary
The skills that individuals develop play a pivotal role in determining their labour-market
opportunities and life chances in general, and are of vital importance to a country’s economic
performance and many social outcomes. Post-secondary education (PSE) is a primary means by
which Canadians obtain the skills that they need.
It is therefore essential to have accurate, up-to-date, and relevant learning and labour
market information (LLMI) that is widely available so that all players in the PSE system – students
making their PSE choices, PSE institutions deciding which programs to offer, policy makers, and
the general public – can make informed decisions.
This is especially relevant at a time when we are often confronted with the now familiar
barista trope – the suggestion (even assumption) that going to university, or college, particularly
in a non-STEM (Science, Technology, Engineering, Mathematics) field of study, is a waste of time
and will leave graduates stuck in a job with low earnings and little opportunity for career
advancement.
Empirical data on PSE graduates’ earnings constitute a critical element of the information
that is needed. Current data sources, however, have significant shortcomings, including their
relatively short-term nature.
In this context, the Education Policy Research Initiative (EPRI), a national policy-focused
research organization based at the University Ottawa, has undertaken an innovative research
project that uses administrative data on students provided by 14 PSE institutions from four
Canadian provinces linked to tax records held at Statistics Canada to track the labour market
outcomes of Canadian college (diploma) and university (bachelor’s) graduates from 2005 through
2013.
Main Findings
Funded by Employment and Social Development Canada (ESDC) and undertaken in
partnership with Statistics Canada, the study has produced a range of findings, which both support
and, conversely, sometimes challenge popular preconceptions:
Overall, 2005 bachelor’s degree graduates had average annual earnings of $45,200 (in 2014
dollars) in the first year after graduation, growing by 66% to reach $74,900 eight years out.

vii
College diploma graduates who finished their studies in 2005 had mean annual earnings of
$33,900 (in 2014 dollars) in the first year following graduation, growing by 59% to $54,000
eight years after graduation.
Engineering, Mathematics & Computer Science, and Business graduates generally had
higher incomes and greater earnings growth than others, but graduates of almost all other
fields of study, including the oft-maligned Humanities and Social Sciences bachelor’s
graduates, also performed well. Fine Arts graduates had the lowest earnings levels. Very
few graduates had truly barista-level earnings even to start, and they increasingly moved
even further from that level as they gained labour market experience.
Later cohorts of graduates generally had similar earnings patterns and the ranking of fields
of study remained consistent as well, although some fields of study did have greater
differences in earnings across cohorts than others.
Immediately following the 2008 financial crisis, first year earnings of all graduates taken
together (i.e., across all fields of study) first dipped, after having risen the two preceding
years, but stabilized in 2010. Across the entire 2005-2012 period, earnings rose for later
cohorts of graduates of certain fields of study, were stable for others, and declined for
another set, but those declines could be described as moderate to substantial (at worst),
rather than calamitous.
Next Steps
The dataset and analytical approach developed for this project represents a research
platform that would allow for a wide range of new projects that would further improve our
understanding of PSE graduates’ labour market outcomes, including the following possibilities:
Identifying the post-schooling labour market outcomes of specific groups of students, such
as Indigenous, immigrant and international students, or those from low socioeconomic
backgrounds (among others).
Probing the relationships between labour market outcomes and particular schooling
experiences, such as being enrolled in a co-op program, taking specific sets of courses, or
being exposed to innovative pedagogical approaches.
Isolating the role of factors such as students’ incoming grades and local labour market
conditions in order gain a better understanding of the value added of PSE and to develop

viii
more meaningful key performance indicators (KPIs).
Creating comparison groups of students who do not complete PSE and those who have not
attended PSE to further identify the contribution of PSE to graduates’ labour market
outcomes.
Looking at a broader set of student outcomes based on other measures available in the tax
data, such as the use of income support programs (EI, Social Assistance, others), the
establishment of families (marriage, children), or savings.
Linking the PSE tax-linked data to other datasets so that more factors that affect students’
outcomes and additional outcome measures could be included in the analysis.
The data linkage and related analytical approach developed for this study has demonstrated
that it could also be scaled up and extended to more students at more institutions. One obvious
strategy being developed uses Statistics Canada’s Postsecondary Student Information System
(PSIS), which gathers key student variables from PSE institutions in Canada. Using PSIS data
linked to tax data, other sets of graduates not included in this study could also be covered, including
graduate students, those in professional programs, certificate and trades students, and others.
An alternative approach to scaling up the current project would be to adopt the procedures
used in this study to gather data directly from additional PSE institutions. While this approach
would have the disadvantages of requiring separate data collections (as opposed to the PSIS
approach which uses data already being transferred) and would not give the general coverage that
the PSIS approach would provide, it would have other advantages, including being able to address
a wide range of research questions that would lie beyond a PSIS-only data platform and its limited
sets of variables available. A third, hybrid approach, would be to add additional variables to a
PSIS-based dataset.
The Bigger Picture
While the tax linkage approach employed in this study makes Canada an international
frontrunner in the study of education, skills, and labour market outcomes, other initiatives are
rapidly developing elsewhere. If Canada moves too slowly, too piecemeal, or too unambitiously,
it will soon be trailing its international counterparts.
A broader research agenda should, in particular, involve identifying the full range of skill
sets that matter and determining the potential role of PSE in helping individuals develop these

ix
skills. These should include not only conventional discipline-specific skills, but also essential
skills, higher order cognitive skills, and – in particular – “transferable” skills such as various
communications skills, being able to work in a (multi-disciplinary) team environment, and to be
continuously looking for opportunities to foster innovation that have been gaining so much interest
in recent years. The research platform established in this study could play a key role in making
progress on this new skills agenda.
Nothing less than a new policy research model, which brings together policy makers, data
providers, researchers, and other stakeholders in order to move forward on a broad skills-focused
research agenda in a timely manner, is required.

1
1. Introduction
The skills that individuals acquire play a pivotal role in determining their labour-market
opportunities and life chances generally, and are of vital importance to a country’s economic
performance and other social outcomes. Post-secondary education (PSE) is a primary means by
which Canadians obtain the skills they need.
It is therefore essential to have appropriate and timely learning and labour market
information (LLMI) widely available so that all players in the PSE system – students making their
PSE choices, PSE institutions making decisions about which programs to offer, policy makers,
and the general public – can make informed decisions.
One critical kind of information that needs to be accessible is empirical evidence regarding
the labour market performance of recent PSE graduates, and the earnings of PSE graduates are
almost certainly the most important kind of information in this respect.
This especially at a time when we are often confronted with the now familiar barista trope
– the suggestion (even assumption) that going to university, or college, particularly in a non-STEM
(Science, Technology, Engineering, Mathematics) field of study, is a waste of time and will leave
graduates stuck in a job with low earnings and little opportunity for career advancement.
It turns out that degree holders are faring relatively well in the labour market, and that their
earnings generally surpass the levels suggested by the hoary old barista tale by a wide margin.
In the past, only a limited set of data sources in Canada included information on graduates’
outcomes, and all had serious limitations. National surveys of graduates conducted by Statistics
Canada, general-purpose datasets such as the census and Labour Force Survey, and PSE
institutions’ surveys of their own graduates have provided interesting and useful evidence, but
none possess the detailed, accurate, consistent, extended, and up-to-date information on graduate
outcomes that is needed.
In an effort to fill this gap, the Education Policy Research Initiative (EPRI), a national
research organization based at the University of Ottawa, has undertaken a research project – funded
by Employment and Social Development Canada (ESDC) and conducted in partnership with
Statistics Canada – that uses administrative data provided by 14 PSE institutions from across four
Canadian provinces linked to tax records held at Statistics Canada to track the labour market

2
outcomes of Canadian college (diploma) and university (bachelor’s) graduates.
The research project had three primary objectives. First, to create new information on
graduates’ earnings. Secondly, to build a research platform that allows for the undertaking of
further research projects that could provide information on PSE graduates’ skills and earnings.
Finally, to demonstrate that linking administrative PSE data from multiple institutions with tax
data is feasible and that it provides practical information, and could be scaled up to cover more
graduates from more PSE institutions.
The next section of this report provides a summary of the current literature on the labour
market outcomes of graduates. Data and methodology are discussed next. This is followed by the
presentation of the empirical findings regarding the earnings of degree and diploma graduates in
the years following graduation. The report then concludes with a summary of the main findings, a
discussion of their meaning and implications, a broader discussion of how our thinking about what
skills matter and skill development in PSE needs to change, and finally, some directions for future
work.
2. Literature Review
In Canada, the transition from post-secondary education to the labour market has been the
focus of extensive theoretical and empirical research. Much of this literature has been primarily
on graduates’ earnings, which is probably the single best indicator of post-schooling outcomes,
while having the additional benefit of being measurable in various data sources.
Historically, the source of PSE graduates’ earnings data in Canada has been provided
through national and institutional surveys as well as census data. Most studies have focused on
how Canadian graduates fared in the labour market in comparison to graduates around the world,
and how certain sets of graduates have done compared to others within Canada. Over years of
research, Canadian graduates’ earnings have been dissected and compared by fields of study,
institution, credential, graduating cohort, academic performance, and an even wider array of
graduate-specific characteristics (e.g. gender, age, parents’ education, economic status, etc.).
While some studies have taken an explicit rate-of-return approach (Moussaly-Sergieh and
Vaillancourt, 2009), most have opted for a simpler focus on earnings differences/premia. The latter
strategy simplifies the analysis as it requires investigating only earnings. By contrast, other
3
approaches measuring the rate-of-return of PSE, which includes opportunity costs, considerably
complicate the analysis.
In this short review of what is a massive literature, we survey the different methodologies
and sources of data used to conduct analyses of graduates’ earnings with a specific focus on
Canadian research. We first review studies based on national and institutional surveys as well as
census data to gather learning and labour market information on recent graduates. Then we look
at more recent studies that link administrative student-level data to tax records – as done in this
project.
2.1. Surveys and Census
Researchers have used the Survey of Labour and Income Dynamics (SLID) and the revised
Labour Force Survey (LFS) to determine how recent graduates have been faring in the labour
market. These surveys were built to collect income data and other characteristic information such
as education level, marital status, household situation, etc. (Robb, 2001). SLID responders, who
were followed longitudinally, were encouraged to give permission to access income data from tax
files to ensure the accuracy of their information.
Robb et al (2001) used these two surveys coupled with the Survey of Consumer Finances
(SCF) – in order to increase the period of analysis – to determine the earnings premium of PSE
credential holders over non-PSE credential holders and compared the results with their American
counterparts. They determined that Canadian PSE graduates had lower premiums over non-PSE
graduates than Americans. Giles and Drewes (2002) used the same surveys to determine that Social
Sciences and Humanities graduates had, on average, lower earnings than graduates of more
vocationally oriented programs.
The National Graduate Survey (NGS) is geared specifically towards gathering data on
Canadian graduates. Created by Statistics Canada, the NGS is based on a stratified sampling
scheme that targets the national population of PSE graduates, and seeks to provide meaningful
data on post-graduation experiences at a detailed level. The NGS, as the most comprehensive
survey in Canada on the relationship between PSE and work, is often favoured by researchers.
Boothby (1999) used the NGS to determine earnings differences, which in some cases were
substantial, by field of study. The differences he observed across fields of study were statistically
significant, and consistent across cohorts. The research of Walters (2004), Finnie (1999), and

4
Finnie and Frenette (2001) corroborated Boothby’s findings, and further analyzed earnings by age
and gender as well as fields of study. Using a similar approach and the same survey, Betts et al.
(2013) observed that university characteristics (e.g. professor-student ratio, enrolment, and fees)
can effect labour market outcomes. Some examples of similar survey-based work in the
international context include Berger (1988), Rumberger and Thomas (1993), Dale and Kruger
(1999), Heijke and Meng (2011), Psacharopoulos and Velez (1993), Grogger and Eide (1995),
Julian (2012) to name a few.
Aside from national surveys, individual PSE institutions, and organizations representing
PSE institutions, have been conducting their own alumni data surveys for a long time (UNBC,
2015; uAlberta, 2015; COU, 2015; RUCBC, 2013). Although these data collection activities cover
specific sets of students relative to the surveys described above, they have produced interesting
results on earnings for recent graduates.
Moussaly-Sergieh and Vaillancourt (2009) and Boudarbat et al. (2010) opted for census
data to analyze labour market outcomes of PSE graduates. They claimed that the larger sample,
the consistency of the data, and the possibilities of adding further individual characteristics to the
analysis makes the census a valuable alternative source of information. Using this source,
Moussaly-Sergieh and Vaillancourt (2009) and Boudarbat et al. (2010) have determined that the
private returns of PSE graduates, over time, are worth the initial investment in education.
While these sources of data have shed some light on the transition between PSE and the
labour market, they have numerous limitations. First, both general purpose surveys such as the
LFS and census (i.e., apart from the NGS, which focuses on PSE graduates) contain limited
information on the responders while they were in PSE. Furthermore, the same individuals are not
followed over time, and the data are generally not collected on an annual basis, which often
necessitates the creation of “synthetic cohorts” as used by Green and Worswick (2009, 2012) to
observe labour market outcomes over time.
The information contained in surveys and the census is also self-reported by responders,
which means that the data collected are susceptible to being inaccurate and biased – although this
is less of a problem in recent years as all Statistics Canada survey platforms shift towards asking
respondents if they can be linked to their tax data.
The NGS, while rich in information on graduates while they were in PSE, is carried out

5
only every four or five years, follows students for a maximum of only five years, and especially
of late, has been suffering from low response rates and the likely bias this introduces. Also, in all
these cases, the time taken to collect and process the data, along with their often intermittent
collection intervals, do not typically produce up-to-date information.
As for institutions’ surveys of their own graduates, sample response rates tend to be low,
and therefore subject to important biases, and again the information is self-reported and therefore
potentially inaccurate and biased. Furthermore, students are again typically followed only for short
periods of time following graduation, thus restricting our ability to observe longer-run outcomes.
And again these surveys are expensive to carry out.
In summary, current sources of information on PSE graduates’ labour market outcomes all
have serious shortcomings. We therefore need to find another approach to collect timely and
accurate information on graduates on a large and representative scale in a cost effective manner.
Fortunately, some researchers have successfully linked PSE institution administrative data to
income tax data (two existing sources) to observe how recent graduates have been faring in the
labour market.
2.2. Tax Linkage Approach
The tax linkage approach entails linking PSE institutions’ administrative information to
income tax data in order to track and analyze graduates’ labour market outcomes. This innovative
approach is rapidly becoming a standard in the analysis of PSE graduates’ earnings in the OECD,
which is currently developing an initial tax linkage project that will appear in their upcoming
Education at Glance in the fall of 2016.
The New Zealand Government has proven to be one of the world leaders in tax linkage
studies. The Ministry of Education has published a series of related reports on the long-term
outcomes of post-secondary education graduates using Statistics New Zealand’s IDI (Integrated
Data Infrastructure). The IDI links student-level education data with administrative data on
earnings (from New Zealand’s revenue agency), on welfare benefits (from the New Zealand
Ministry of Social Development), and on border crossings (from Immigration New Zealand).
These reports cover about outcomes such as earnings and destination (employment, welfare,
schooling, or emigration) on an annual basis during a seven-year period following graduation by
individual characteristics such as education level, field of study, gender, and ethnicity.
6
Using the IDI, Park et al. (2014) investigated the relationship between future earnings and
post-secondary education level and field of study. Not surprisingly, they found that higher levels
of qualifications, especially those associated with a degree, led to higher earnings consistently
throughout the seven years that follow graduation. They also found that earnings differed
significantly by field of study for a given qualification level: for example, the median earnings for
medical bachelor’s degree holders was more than twice that for creative arts bachelor’s degree
holders. The results in this study reflect the labour market experiences of graduates who stayed in
New Zealand, where brain drain to other countries is a significant issue.
In a related study, Park (2014) used the IDI to examine what the graduates do in the years
following graduation. They found that these outcomes also differed significantly by level of
education and field of study. For example, graduates with higher qualification levels were more
likely to go overseas. Interestingly, the employment rates in New Zealand for graduates with
bachelor’s degrees or more, as a share of all graduates, decreased in the years following graduation
as these graduates were more likely to emigrate out of the country.
Several other studies followed a similar framework and utilized the IDI to provide
comparable analyses by gender and ethnicity. Mahoney et al. (2013, 2014a) also show that
earnings vary considerably by field of study five and seven years after graduation. They find that
young graduates with bachelor’s degrees in medicine are the highest earners, followed by dental
studies and pharmacy, and engineering, and that graduates from creative arts have the lowest
earnings among young graduates. In a separate report (Mahoney et al., 2014), the authors show
that employment rates also vary across fields of study, with education graduates having the highest
employment rate (76%) in the second year after study, followed by information technology (62%),
management and commerce (61%), creative arts (58%), and health (57%) graduates. The
remaining graduates were categorized as pursing further education, as emigrated overseas, as
receiving benefits, or were lost because of a lack of information (e.g. no tax records).
Mahoney (2014a) examined the earnings patterns after graduation for men and women
separately and found significant gender differences. For example, for higher qualification levels,
there was no gender gap in median earnings within the first few years of graduation, but after five
years there was a gap in favour of men. This study also highlighted important gender differences
in employment, further study, and emigration, as well as earnings differences by fields of study.
7
Mahoney (2014b) and Mahoney (2014c) repeated a similar exercise for the Maori and Pasifika
minorities, respectively, and found that earnings profiles of graduates belonging to these minority
groups tended to record weaker labour market performances than the rest of the country, especially
in the case of Maori.
In the United States, the federal government released a new College Scorecard (2013),
which combines information from the federal student financial aid system and federal tax returns.
The project has developed a tool which allows students to identify the average earnings of
graduates who attended almost any college and university in America, and to access graduate-
specific data such as the type of academic credential and institution, field of study, size of the
program, public vs. private institutions, gender, religious affiliations, and more (College
Scorecard, 2013). The project’s website, housed on the U.S. Department of Education’s website,
has an easy-to-use interactive tool for students and families which packages the information in a
clear and effective way. The website is not only an excellent tool for students, parents and
researchers, but the dataset itself provides the information required by social scientists to answer
important education policy questions.
Britton et al. (2016) conducted a similar exercise by using tax and student loan
administrative data to measure how the earnings of UK graduates vary with gender, institution
attended, field of study, and economic status. While creating this dataset produced similar results
to those of other tax linkage studies, it further demonstrated the growing interest in linking
administrative data to income tax data as opposed to relying on national or institutional surveys or
census data. The study produced interesting results, such as medicine, economics, law,
mathematics, and business graduates earn premiums over other PSE graduates, and students from
high income families earn more than students from low income families once they graduate – even
when the institution attended and field of study are equivalent.
Braga et al. (2014) used a linked tax and administrative dataset to estimate the effect of
teaching quality on Italian students’ academic and labour market performances, separately. The
authors found that teaching ability correlated positively with academic and labour market
outcomes; however, these results were mostly driven by students with previously strong abilities.
The Italian study, once again, testifies to the great flexibility and power of this type of dataset and
the numerous research opportunities it provides.

8
While rare in Canada, a limited number of tax linkage studies have been conducted. Heisz
(2001, 2003) used tax data for British Columbia graduates to find that annual incomes are relatively
high for those with applied degrees, and Frenette (2014) observed the earnings premium associated
with PSE (compared to no PSE) over a 20 year period.
These examples show clear benefits of using tax linkage approaches for studying the
outcomes of PSE graduates. First, it minimizes the risk of gathering inaccurate and biased data.
Moreover, since it merely involves linking existing datasets, there is no collection activity
associated with the data, which makes the approach relatively inexpensive, provides almost perfect
coverage and response rates, and allows the data to be ready for analysis with relatively little delay.
Finally, the quality of the administrative PSE data allows us to relate specific PSE experiences and
performance to labour market performances on a long-term basis. In short, tax linkage is less
resource intensive and more complete than any other methods currently used in Canada.
Given the goal to provide timely and accurate information on graduates on a large and
representative scale to enable all PSE stakeholders to make informed decisions, the tax linkage
approach seems to be the most efficient way forward.
3. Data and Methodology
In order to create the PSE-tax linked dataset, each of the 14 participating PSE institutions
provided administrative PSE data (program of study, etc.) for students who graduated from 2005
through 2012 to EPRI, without true identifiers, in order to construct a consistent and polished
dataset. Once the PSE dataset was cleaned, it was sent to Statistics Canada.
A separate dataset containing only personal identifiers (full name, precise date of birth,
postal code, gender, etc.) was sent by the institutions directly to Statistics Canada. These identifiers
were used to link individuals to their tax data. More than 97% of graduating students from all
institutions were matched to at least one tax year record, which captures more than 620,000
graduates from all institutions.
The PSE and individual tax data were then linked at Statistics Canada using a pseudo-
identifier created by institutions for these purposes and included on both files.
Before transferring the data for analysis within Statistics Canada, all true identifiers were
stripped from the data. EPRI researchers worked only with these de-identified data. Appropriate

9
security measures were taken to ensure the confidentiality of the data and student privacy. Only
aggregate results were eligible for release, and all results follow Statistics Canada’s disclosure
rules, which include suppressing low observation counts and rounding earnings to the nearest
$100.
To measure earnings, this analysis focuses on total before‐tax earnings, combining T4 slips
(including tips and gratuities), net self‐employment income, and other employment income. While
the focus is primarily on mean earnings, medians and other percentile points are also presented to
explore the underlying earnings distributions. All earnings are Consumer Price Index (CPI)
adjusted to 2014 dollars.
In order to focus on individuals who are actively engaged in the labour market, graduates
identified as pursuing further education were excluded from the analysis. The rationale behind the
further schooling restriction lies in the fact that individuals are arguably not actively engaged in
the labour market during their studies, that new skills and/or credential acquired lead to additional
earnings premium upon labour market entry, and the point of entry into the labour market is later
than for others, affecting the clear point from which to count years after graduation which is how
we track graduates. The exclusion rate of graduates pursuing further studies is substantial and
given the cumulative nature of the restriction (i.e. once excluded, the graduate is excluded for all
subsequent years), the number of excluded observations grows over the years following
graduation. For example, 30% of degree graduates were excluded the first year after graduation
and that number grew to 52% eight years after graduation. Diploma graduates on the other hand,
recorded exclusion rates of 23% for the first year and 45% for the eighth year after graduation.
These exclusion rates, however, varied by field of study (see Appendix A).
Graduates earning less than $1,000 a year were also excluded. However, given this very
low threshold, most graduates in part-time or part-year workers, those who are under-employed,
and even graduates who are unemployed for most of the year are included in the analysis (loss of
3-3.5% per year).
Finally, graduates who did not file taxes for a given year are excluded for that year. Like
graduates below the earnings threshold, excluded individuals are reintegrated in the sample every
year for which they have filed taxes and recorded earnings above $1,000. Appendix A contains
data on the exclusion rate and its effect on final sample sizes
10
Classification of Instructional Programs (CIP) codes were used to group programs under
specific fields of study. Statistics Canada and the participating PSE institutions were consulted on
these classifications to ensure that they were meaningful, appropriate, and followed established
conventions as much as possible. Programs which cannot be entered directly from high school
(e.g., law and medicine) were excluded from the sample, which is standard practice for Canadian
studies of this type. Appendix A presents the specific programs included in each field of study, as
well as the year-by-year distribution of graduates across cohorts.
4. Analysis of Bachelor’s Degree Graduates
The analysis of the bachelor’s degree cohorts focuses substantially on the 2005 cohort,
which is the first cohort of graduates included in the study and therefore the one followed for the
longest time. Certain results are presented for other graduating cohorts and show that the patterns
of the 2005 cohort are broadly representative of the general patterns across all cohorts. For all the
results presented below for the 2005 cohort, Appendix B contains results for all subsequent cohorts
through to the 2012 graduating cohort.1
4.1. Earnings over Time: All Graduates Taken Together
For the 2005 cohort, all bachelor’s graduates taken together (i.e., those from all fields of
study), average annual (mean) earnings were $45,200 in 2006, which was their first full year
following graduation (Figure 1).2 Earnings then grew steadily, increasing by $4,200 per year on
average, to finish at $74,900, or 66% above the starting level, eight years following graduation.
1 Confidence intervals were calculated for all the results presented below. These confidence
intervals were extremely tight and are, therefore, not reported in this paper, but are available from the
authors upon request. 2 All results are reported in 2014 constant dollars and rounded to the nearest $100.

11
Figure 1 – Mean Earnings, All Degree Graduates, 2005 Cohort
Comparing across other selected graduating cohorts representing those who completed
their studies in 2007, 2009, and 2011(Figure 2), the 2007 graduates started with annual earnings
of $47,600, or $2,400 above those who finished two years earlier, but followed a similar growth
trajectory to the 2005 cohort over time.3
The 2009 graduates entered the labour market in 2010, which was shortly after the 2008
financial crisis, so it might be expected that their first year earnings would be lower. This is indeed
the case as they were down a full $3,400, or about 7.7%, from the 2007 cohort, but they were only
$1,000, or about 2.3%, below what the 2005 cohort earned in their first year. The 2011 cohort
started at the same $44,000 level as the 2009 graduates.
3 Later cohorts of graduates are followed for fewer years relative to their graduation year because
the final year of earnings data available is the same for all graduates (2013), meaning that those starting
later are not followed for as long an interval following graduation.

12
Figure 2 – Mean Earnings, All Degree Graduates, Selected Cohorts4
Furthermore, for all cohorts, earnings growth remained strong in the years following
graduation. With the 2007 graduates doing exceptionally well, especially to start), a pattern
emerges whereby the others (those who finished in 2005, 2009, and 2011) all earned within $1,200
of each other in their first year following graduation, and all cohorts saw their earnings increase
substantially in their subsequent years in the labour market.
This broad similarity of earnings patterns across graduating cohorts is significant. While
one of the popular story lines is that university graduates are not doing well in the labour market,
the other is that the situation has got very much worse since the 2008 financial crisis. The data
clearly show, however, that neither of these “facts” is actually true.
4 The cohorts are a representative set of graduating cohorts, chosen because they start with the first
set of graduates and then pick up other cohorts two years apart. Again, results for all individual cohorts are
also available in Appendix B.

13
4.2. Earnings by Field of Study
First Year Earnings Levels
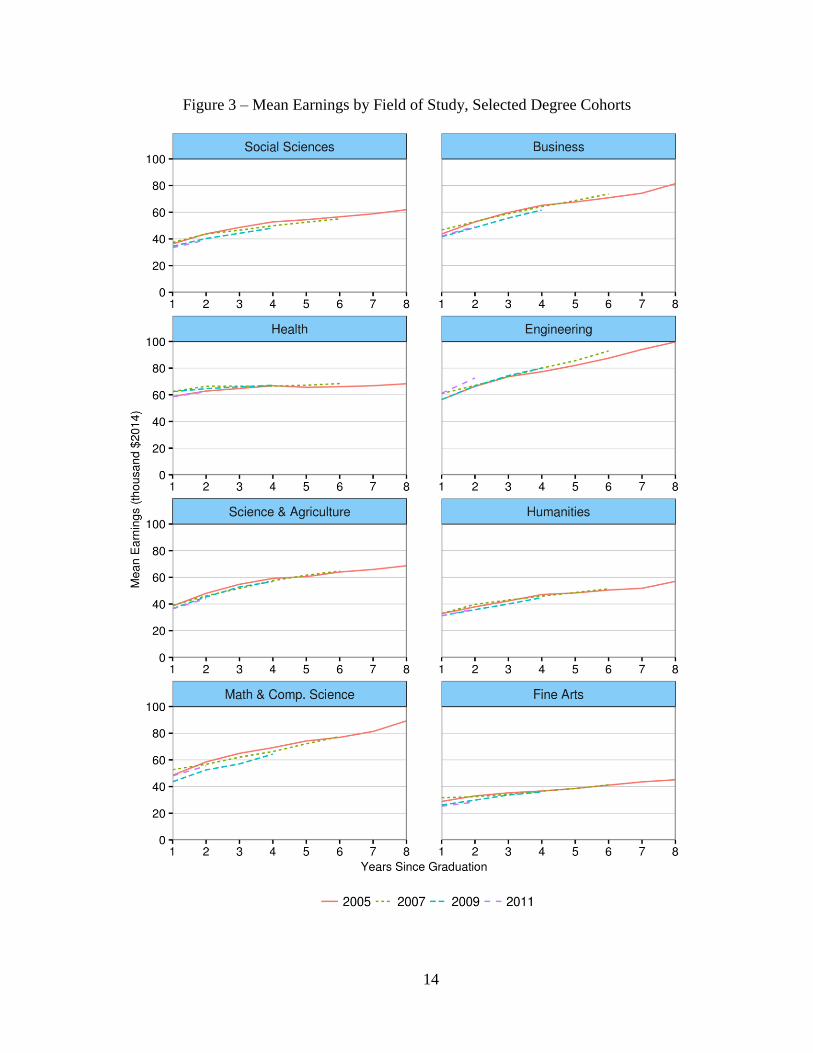
Across different fields of study (Figure 3), the patterns of first year earnings levels,
earnings growth, and final earnings levels vary substantially. It is important to note that earnings
data in the report include all earnings, be they from employment in the graduates’ fields of study
or outside their fields of study. Engineering and Health graduates (excluding doctors, dentists, and
pharmacists), consistently had the highest average earnings to start, generally in the $60,000 range
in the first year following graduation.
This group was generally followed, across all graduating cohorts, by Math & Computer
Science and Business Graduates (in that order), who started between the low $40,000s and as high
as $52,700 for the 2007 graduates in Math & Computer Science.
Graduates in Science & Agriculture, the Social Sciences, and the Humanities came next,
typically earning from the low $30,000s to around the $40,000 mark in their first year after leaving
school – with levels descending across the three fields listed (i.e., from higher to lower within the
broader range mentioned).
Finally, those in the Fine Arts had the lowest average first year earnings, ranging from
around $25,000 to just under $32,000 in their best year (again the 2007 graduates, as for most
fields of study).
Attaching specific numbers to these patterns, earnings in the first year after leaving school
for the 2005 cohort of graduates were as follows (from top to bottom): Health: $58,800,
Engineering: $56,400, Math & Computer Science: $48,500, Business: $43,700, Science &
Agriculture: $38,500, Social Sciences: $36,300, Humanities: $32,800, and Fine Arts: $28,800.
14
Figure 3 – Mean Earnings by Field of Study, Selected Degree Cohorts

15
Growth in Earnings
For earnings growth and final earnings levels, many of the patterns by field of study
illustrated above repeat; but some important differences also emerge.
To begin at the top, first year earnings levels together with earnings growth were such that
one field of study clearly led the pack in terms of final earnings levels: Engineering, with average
earnings of $99,600 eight years after graduation for the 2005 graduate cohort. This amounts to
earnings growth of about $6,200 per year averaged over the eight years following graduation. It
is important to remember that all of these numbers are adjusted for inflation, meaning that these
represent real earnings increases.
Math & Computer Science graduates follow, with final year earnings of $89,300 for the
2005 cohort, representing average increases of approximately $5,800 per year. Business graduates
are third, with final earnings of $81,400, and growth of $5,400 per year.
Two fields of study follow: Science & Agriculture graduates, with earnings of $68,700 for
the 2005 cohort, representing average earnings of $4,300 per year, and Health, with earnings of
$68,300, but earnings growth of only an average of $1,400 per year. That latter figure represents
the lowest earnings growth of any field of study, which leaves them in the middle rank of final
earnings, in contrast to their relatively high first year earnings levels. This low growth is
undoubtedly due to the strong occupation focus associated with studying in the health disciplines
(e.g., nursing programs prepare students to become nurses, physiotherapy programs prepare
students to become physiotherapists, and so on), and the corresponding highly structured and
generally highly unionized labour markets the graduates typically enter.
Social Science and Humanities graduates follow next, with final earnings, after eight years,
of $61,900 and $57,000, respectively, representing average increases of $3,700 and $3,500 per
year. The lowest long-run earnings are for Fine Arts graduates, at $45,100, after increases of an
average of $2,300 per year.
These patterns demonstrate the importance of having access to the long-term earnings
profiles provided by the tax data used in this study. Short-term outcomes such as those available
from institution-based graduate surveys, typically cover graduates for a maximum of two years
following graduation (with some exceptions), and Statistics Canada’s National Graduates Survey
captures graduates at a maximum of five years following graduation.

16
While short-term earnings are a good predictor of the general ordering of longer-run
outcomes in some cases (e.g., Engineers start more or less at the top and remain at the top later in
time), in some cases (Health graduates being the best example), short-term data represent a
relatively poor indicator of what longer-run earnings will be. Longitudinal tax-based studies are,
furthermore, able to follow graduates for even longer periods of time, depending on the data
available. For example, in a previous pilot project, the earnings of University of Ottawa graduates
were followed from 1998 to 2011, a full 13 years following graduation for the earliest cohorts.
Variations across Cohorts
Final considerations regarding the patterns by field of study concern the variation in
patterns across cohorts. Two fields of study have greater differences across graduating cohorts
than the others, these being Math & Computer Science and Engineering. The greater differences
in outcomes across cohorts presumably reflect two factors: the relatively specific skill sets that are
developed in these fields of study, and the shifts in the economic conditions of the sectors these
graduates typically enter over the period covered by the analysis.
It is interesting to note that these are also the fields of study with the highest long-run
earnings. Those higher earnings thus come with a risk factor (i.e., the variation in earnings across
graduating cohorts) that is greater than in other fields of study.5
In contrast, other fields of study are generally characterised by the development of broader
skill sets and a more diverse set of employment opportunities. Thus, as conditions in one area of
the economy where graduates in these fields might work deteriorate, they can shift to other sectors
in which their skills are also useful, and jobs can be found. Hence, earnings are more stable across
cohorts.
The exception is seen with regard to Health graduates, who may, like Engineers and those
in Math & Computer Science, possess relatively narrow, specific job-focused skill sets, but who
tend to find employment in areas of the economy which are generally more stable, such as the
public sector.6
5 The original uOttawa pilot study showed variability even more clearly, with its coverage of the
boom of the IT sector in the late 1990s followed by its bust, and the corresponding large shifts in the
earnings of IT graduates depending on their year of graduation 6 At least over this period; in other years, notably the mid-1990s, public sector job opportunities
changed a great deal from one year to the next. It would be interesting to see how Health graduates did over

17
The Barista Story?
The picture that emerges belies the popular barista story. While it is impossible to come up
with a meaningful true estimate of what baristas earn (or in fact how many university graduates
are working as baristas), a good approximation may be in the $12 per hour range. If we multiple
that by 35 hours per week, and allow that person to work – or at least be paid – all 52 weeks a year
(not typically the case for hourly workers of the barista type), that yields an annual earnings level
of $22,150.
Except perhaps for Fine Arts graduates, mean earnings, including those of Social Sciences
and Humanities graduates, are well above the barista benchmark in even the first year following
graduation, and they rise from there. Eight years out, the lowest mean earnings among those two
fields of study is $57,000 – in comparison to the barista earnings level. Even Fine Arts graduates,
who had the lowest average earnings levels started significantly above the barista level (at
$28,800), and eight years following graduation were about double that level.
4.3. Further Focus on the Growth in Earnings
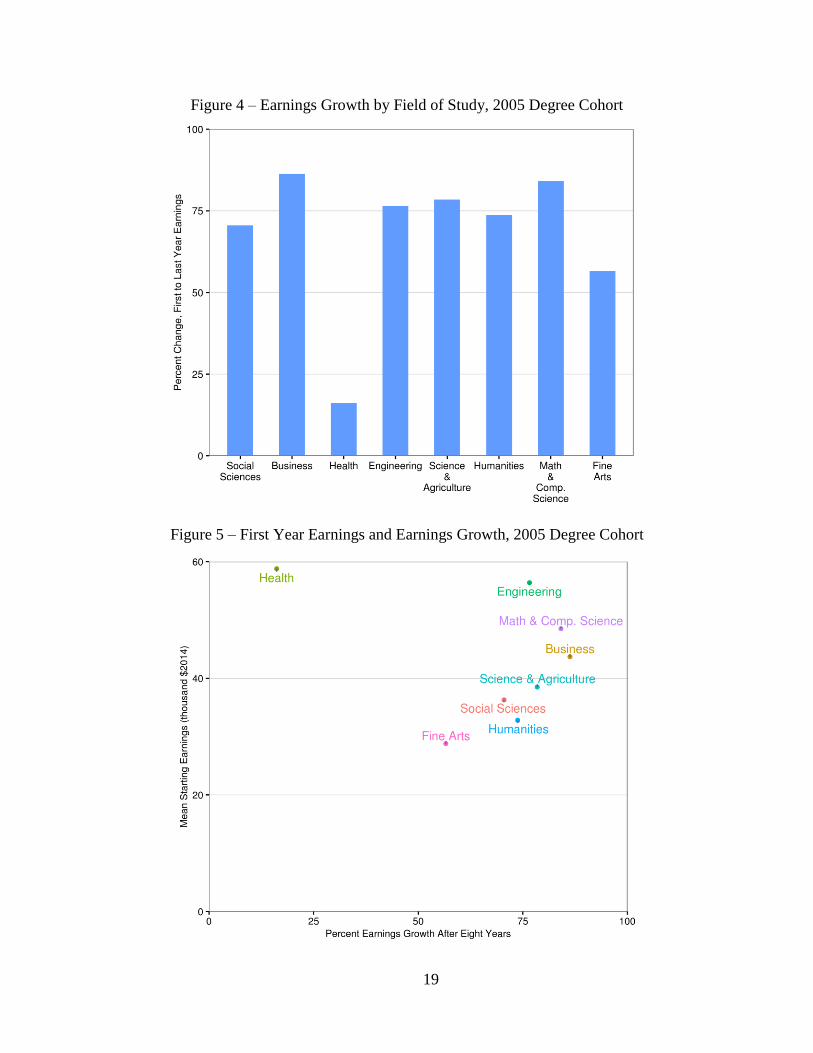
While earnings generally had an upward trajectory in all fields of study, earnings growth
rates varied. This is presented in Figure 4 for the 2005 graduation cohort. Business and Math &
Computer Science graduates experienced the greatest growth, at 86% and 84%, respectively. They
were followed by graduates in the Social Sciences, Engineering, Sciences & Agriculture, and the
Humanities, with earnings growth in a 71% to 78% band. Fine Arts followed, with 57% earnings
growth. Health graduates had the lowest earnings growth, at just 16%.
Again we emphasize the importance of having the long run perspective of earnings in the
years following graduation afforded by the tax data used in this study in order to identify the long-
run earnings patterns of graduates, including differences in earnings by field of study.
This finding has significant implications for many existing studies, especially those of an
econometric nature, which often allow for only a single difference in earnings across graduates of
different fields of study, regardless of when they graduated or the number of years since
graduation. But with the differences in earnings by field of study varying over the years following
graduation shown here, it becomes clear that any estimate of “the differences in earnings by field
this earlier period to test the hypothesis suggested.

18
of study” will be significantly dependent on when earnings are measured (i.e., at which point
following graduation or at which age) – or (otherwise put) on the composition of the samples used
to generate the estimates.
For example, earnings differences measured immediately following graduation (or based
on samples which are otherwise over-represented by younger workers) will tend to favour those
fields in which earnings start high but earnings growth over time is comparatively low, such as the
Health graduates in our samples. This contrasts with earnings differences measured in later years
(or with samples which otherwise have a higher proportion of older workers), which will tend to
favour the higher growth fields.
In general, estimates based on samples of graduates across a particular age range will
generate estimated differences across fields of study that represent a weighted average of the
different earnings gaps across graduates of different ages. And too often this is not taken into
account as it should be. That is, the differences in how earnings evolve in the years following
graduation are an important, indeed critical, element of the story regarding earnings differences by
field of study. There is no way around this except to measure the different earnings trajectories by
field of study, as done in this study.
Figure 5 combines the first year earnings from each field of study (the vertical axis) with
the earnings growth eight years after graduation (horizontal axis), for the 2005 graduation cohort.
Engineering appears on the top right hand side of the graph, highlighting its high first year earnings
and relatively strong earnings growth. By contrast, Health appears in the top left hand sector of
the graph, reflecting its high first year earnings but low earnings growth.
In general, we again see the wide differences in first year earnings levels (the height of the
points in the graph for the different fields of study), but relatively similar percentage growth rates
(their position in the horizontal plane). Fine Arts graduates are differentiated by their particularly
low first year earnings levels, as well as their decidedly below-average growth rates.
19
Figure 4 – Earnings Growth by Field of Study, 2005 Degree Cohort
Figure 5 – First Year Earnings and Earnings Growth, 2005 Degree Cohort
20
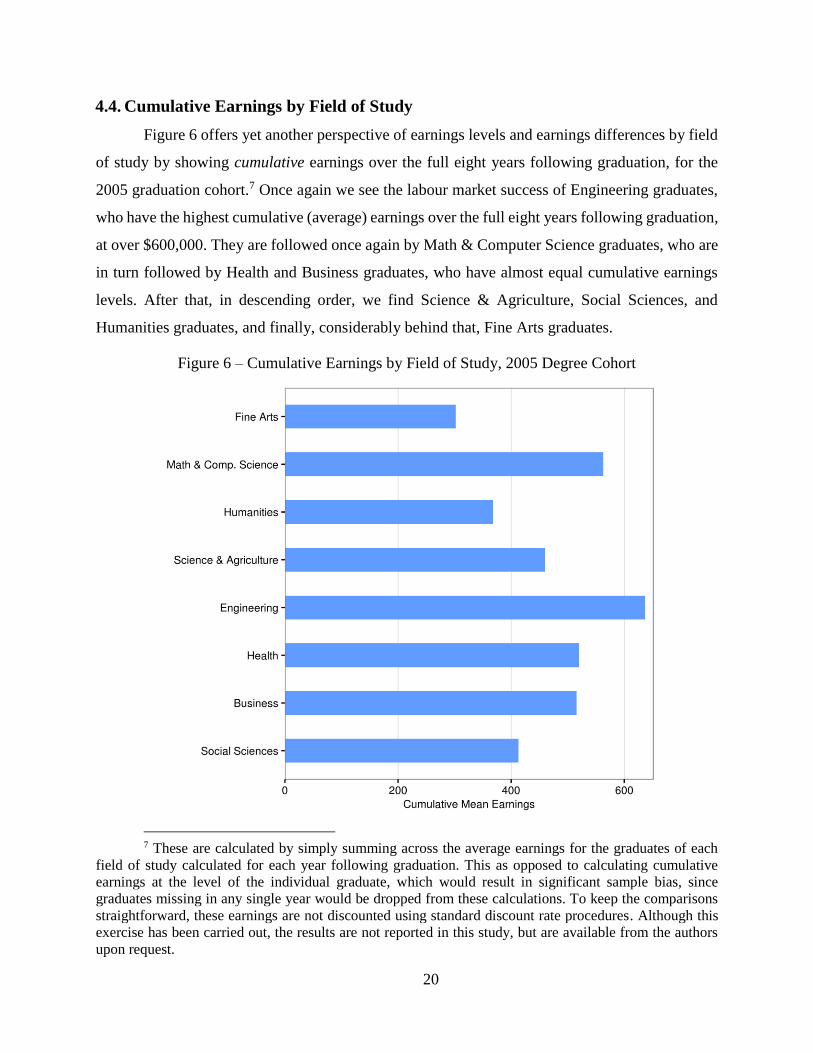
4.4. Cumulative Earnings by Field of Study
Figure 6 offers yet another perspective of earnings levels and earnings differences by field
of study by showing cumulative earnings over the full eight years following graduation, for the
2005 graduation cohort.7 Once again we see the labour market success of Engineering graduates,
who have the highest cumulative (average) earnings over the full eight years following graduation,
at over $600,000. They are followed once again by Math & Computer Science graduates, who are
in turn followed by Health and Business graduates, who have almost equal cumulative earnings
levels. After that, in descending order, we find Science & Agriculture, Social Sciences, and
Humanities graduates, and finally, considerably behind that, Fine Arts graduates.
Figure 6 – Cumulative Earnings by Field of Study, 2005 Degree Cohort
7 These are calculated by simply summing across the average earnings for the graduates of each
field of study calculated for each year following graduation. This as opposed to calculating cumulative
earnings at the level of the individual graduate, which would result in significant sample bias, since
graduates missing in any single year would be dropped from these calculations. To keep the comparisons
straightforward, these earnings are not discounted using standard discount rate procedures. Although this
exercise has been carried out, the results are not reported in this study, but are available from the authors
upon request.

21
4.5. What Has Happened Since 2008?
Signified by the global financial crisis, 2008 has been viewed as a seminal year in many
ways – including with respect to the value of PSE credentials. The popular story line has been that
regardless of how things were going before 2008, PSE graduates’ employment rates and earnings
levels took a sharp downward turn in that year and have not recovered since.
Figure 7 shows first year earnings by graduation cohort for all graduates taken together.
Those who finished their studies in 2005 had average earnings of $45,200 in their first full year
following graduation. Earnings then rose somewhat for the next two sets of graduates, to $47,100
and $47,600, respectively, for those who finished in 2006 and 2007.
Earnings then turned down for the 2008 through 2010 graduates, to a low of $43,800 for
the latter. But this cohort’s earnings were only $1,400 (or about 3%) below the level of the 2005
cohort, while the final set of graduates (those who finished in 2012) enjoyed a very small uptick.
A fair conclusion might be that although earnings did decline after 2008, the change was relatively
moderate, especially if a longer-run perspective across all cohorts is taken rather than comparing
the later cohorts to the peak earnings enjoyed by the 2007 graduates.
It is important to keep in mind that the inclusive nature of our samples means that all
graduates, except for the very few who made less than $1,000 in any given year, are included in
these numbers. The samples therefore reflect the record of the “underemployed” (i.e., those in part-
time jobs, those in part-year jobs, and those in jobs that would normally be considered below their
skill level as most of those graduates would still manage to earn at least $1,000 over the course of
the entire year), even as well as the vast majority of unemployed graduates (at any single point in
time).

22
Figure 7 – First Year Earnings, All Degree Graduates, 2005-2012 Cohorts
Looking at the trends by field of study (Figure 8), the results for the different fields
aggregate up to the patterns across all graduates, as demonstrated above. It is no surprise, therefore,
that the overall record was generally one of initial increases followed by small declines, and then
relative stability.
When measured against the 2005 initial (base) year and looking across the entire period,
the earnings of Engineering graduates in the year following graduation were substantially higher
for the final cohort relative to the first (up $6,400 or 11.3%); were essentially stable for Health and
Math & Computer Science graduates; were down a bit for Business Graduates ($1,700 or 3.9%);
and were down more substantially for the others (roughly in the $3-4,000 range, or between 8 and
13%). It is worth nothing, however, that the greater part of these latter declines were experienced
from 2007 through 2009 or 2010, and that the trends were flatter after that.
These patterns are not to be ignored. It will be important to see if the declines, in particular,
have continued in the years since those covered in this analysis. By and large, however, the record
has displayed a mixed set of changes which can be described as moderate to substantial (at worst),
rather than calamitous.

23
Figure 8 – First Year Earnings by Field of Study, 2005-2012 Degree Cohorts
24
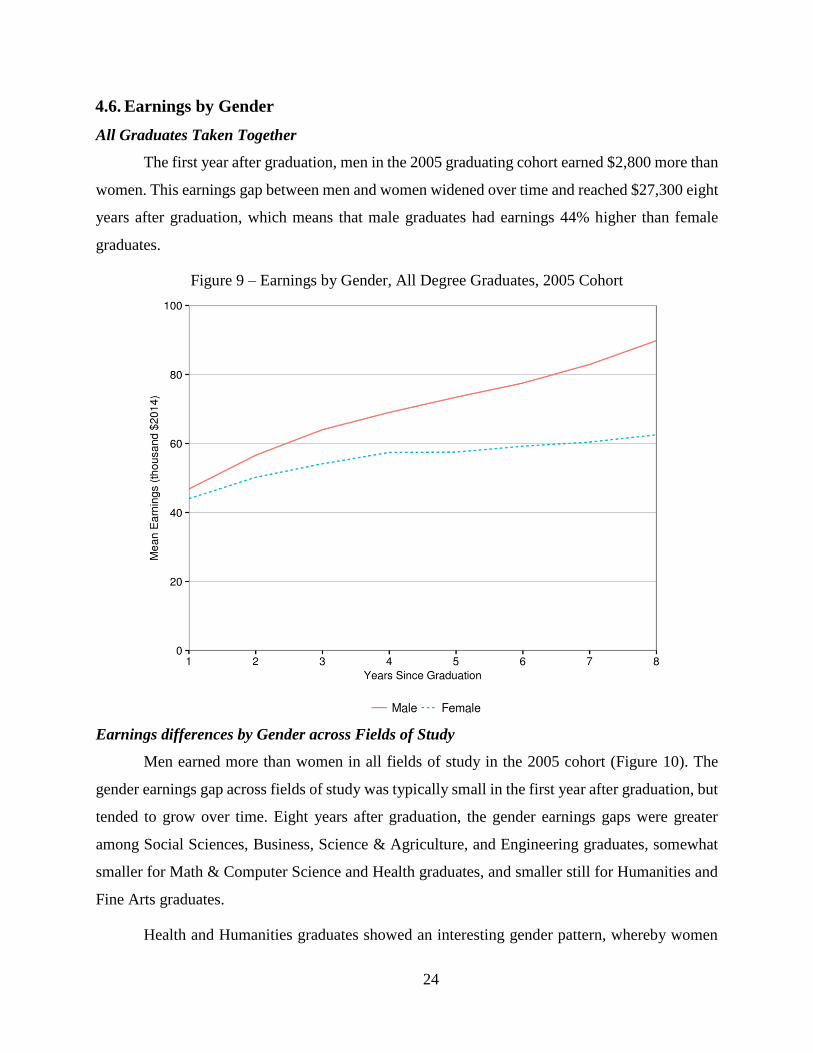
4.6. Earnings by Gender
All Graduates Taken Together
The first year after graduation, men in the 2005 graduating cohort earned $2,800 more than
women. This earnings gap between men and women widened over time and reached $27,300 eight
years after graduation, which means that male graduates had earnings 44% higher than female
graduates.
Figure 9 – Earnings by Gender, All Degree Graduates, 2005 Cohort
Earnings differences by Gender across Fields of Study
Men earned more than women in all fields of study in the 2005 cohort (Figure 10). The
gender earnings gap across fields of study was typically small in the first year after graduation, but
tended to grow over time. Eight years after graduation, the gender earnings gaps were greater
among Social Sciences, Business, Science & Agriculture, and Engineering graduates, somewhat
smaller for Math & Computer Science and Health graduates, and smaller still for Humanities and
Fine Arts graduates.
Health and Humanities graduates showed an interesting gender pattern, whereby women
25
started with higher average earnings than men, but men subsequently caught up and surpassed
women. Health is a particularly interesting case as men’s earnings grew steadily while women’s
earnings growth flattened – the only group of graduates for whom this is the case.
These gender patterns may be caused by a number of factors, including: i) differences in
the male-female distributions of graduates across the underlying specific disciplines (e.g.,
Economics versus Sociology within the Social Sciences) combined with different growth rates
across these disciplines, or to similar differences in the occupation or industry of employment for
men and women, ii) what labour economists refer to as labour supply factors, such as women
choosing to work fewer hours per week or fewer weeks per year, perhaps related to family or child-
raising, iii) women falling behind in earnings potential due to their reduced accumulations of work
experience, including years out of the labour force, or iv) labour market discrimination.
Unfortunately, attempting to identify these effects is beyond the scope of this analysis,
although future work could investigate at these factors, including gender differences in the
discipline/occupation/industry patterns of study and employment; the effects of being married or
the presence of children; the effects of past breaks from the labour force; and more.

26
Figure 10 – Earnings by Gender, by Field of Study, 2005 Degree Cohort

27
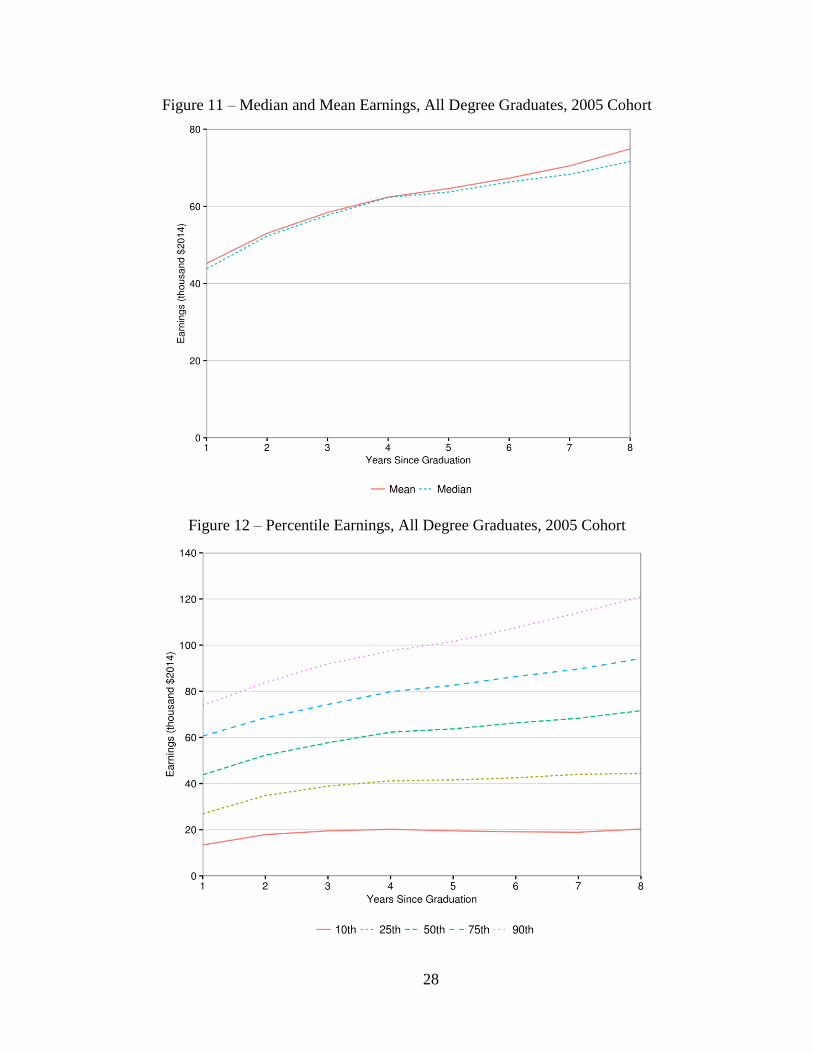
4.7. Distribution of Earnings
All Graduates Taken Together
Figure 11 shows mean versus median8 earnings for all graduates taken together for the
2005 cohort. Mean and median earnings track each other quite closely, but mean earnings rise a
little more quickly than median earnings in the years following graduation, indicating that the
earnings of higher earners grew faster than those of lower earners.
To probe these distributions of earnings further, we also present other percentile earnings
levels, representing the 90th, 75th, 50th (i.e., median again), 25th, and 10th percentile earnings levels
(Figure 12).
One point of interest is just how high some of the higher earnings levels are. The graduate
at the 90th percentile (meaning they were in the top 10% of all graduates) earned $120,000, while
the 75th percentile graduate earned $94,200, the median earned $71,600, and even the 25th
percentile earned $44,400.
In contrast, the bottom 10% made $20,300 or less. This is particularly significant in the
context of the barista theme, since that 10th percentile earnings level is very close to the barista
earnings level defined earlier ($22,000). The barista situation therefore applies to approximately
10% of all bachelor’s graduates, and is far from the norm, as we are often led to believe.
8 Mean earnings reflect the arithmetic average earnings across all earners, whereas median earnings
represent the earnings level of the person who is exactly in the middle of the earnings distribution in the
sense that 50% of all individuals in the sample have higher earnings, while the other 50% of individuals
have lower earnings.
28
Figure 11 – Median and Mean Earnings, All Degree Graduates, 2005 Cohort
Figure 12 – Percentile Earnings, All Degree Graduates, 2005 Cohort

29
Distribution of Earnings by Field of Study
Some interesting differences in these patterns also emerge by field of study. For example,
the differences between mean and median earnings grew as graduates gained labour market
experience for Business, Engineering, Math & Computer Science, and (less so) Science &
Agriculture graduates, suggesting a widening distribution of earnings among graduates in these
fields of study over time, but not others (Figure 13).
This is also seen in the top earners in these fields of study: those at the 75th and especially
the 90th percentiles have a widening earnings advantage relative to lower earners in their groups
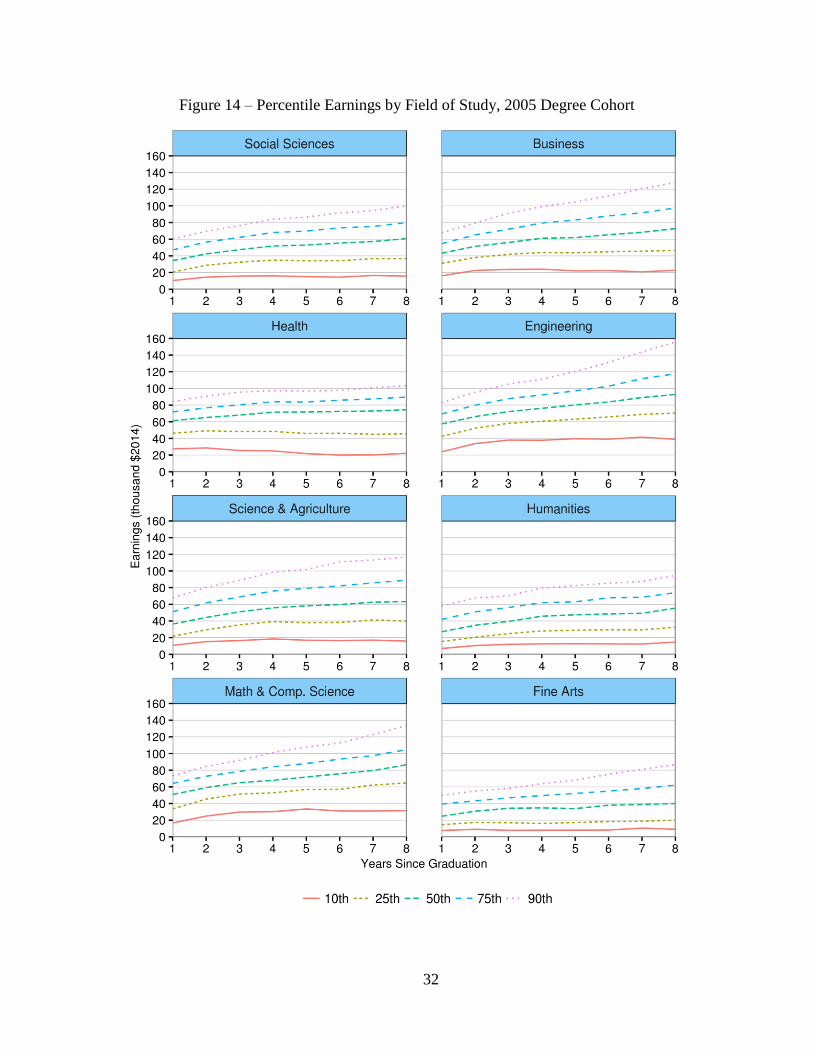
than is the case in other fields of study (Figure 14). In short, graduates in these fields of study do
especially well in comparison to their co-graduates as their earnings grow at faster rates over time.
Meanwhile the lowest earnings levels (10th percentile) are relatively flat for all fields of
study. These are also the groups that are in fact in the barista range, at least for all fields of study
except Mathematics & Computer Science and Engineering, where even their comparatively low
(10th percentile) graduates are above the barista level eight years after graduation.9
The only field of study where earnings are still in barista range for the 25 percentile level
is Fine Arts; for all other fields, their 25th percentile graduates are earnings upwards of $32,600.
More specifically, the 25 percentile earnings levels for these other fields of study are (from lowest
to highest): Humanities: $32,600, Social Sciences - $36,700, Science & Agriculture - $40,000,
Health - $45,500, and Business - $46,500, as well as Mathematics & Computer Science at $64,700,
and Engineering at a remarkable $70,400.
From these data, we cannot say why the lower earners are at those levels. We are unable to
differentiate, in particular, whether these low earnings levels are due to workers choosing to work
fewer hours per week or fewer weeks per years, perhaps because of family decisions or other life
choices, or because they cannot get better paying jobs. Only further research could begin to answer
these important questions.
One avenue of investigation in this regard would be to see if lower earnings individuals are
observed to have family responsibilities, as represented in the tax data by indicators of marital
9 The 10th percentile earnings levels eight years after graduation for these fields of study
are $31,500 and $40,000 respectively. For the others, the 10th percentile earnings levels range from
$15,900 to $22,600.
30
status or the presence of children, and whether – furthermore – there are observable gender
differences in these patterns, and effects.
Another route would be to see if the individuals at the lower earnings levels tend to be the
same people from one year to the next, or different people; and if the latter, what kind of earnings
levels these people had in the years preceding and following their periods of low earnings. Any
such patterns could be investigated further by observing whether earnings movements tend to be
associated with the onset of unemployment (proxies for some being the receipt of Employment
Insurance income), other indicators of economic hardship (e.g., the receipt of Social Assistance or
other forms of income support), a geographical move (perhaps related to high local unemployment
rates), or other identifiable factors.
Finally, it would be interesting to link earnings to performance while in PSE, and even
back to high school. Were the low earning graduates generally poor performers while in school,
and are their low earnings therefore an extension of that earlier schooling record into the labour
market (in which case we may be looking at a combination of ability, effort, and other student-
related factors)? Alternatively, did they perform well in school (in which case their labour market
outcomes cannot be explained by these kinds of factors), such that we need to explore other
reasons?10
10 Admission grades (i.e., high school grades) and final GPA are already available for some of the
institutions participating in this project, meaning that at least some first steps in this regard would be
relatively easy to take. For others, the data would have to be located and transferred, but in general, such
data are readily available. Either way, it would make sense to include high school grades and final GPA in
the data transfers related to any new project of this type.

31
Figure 13 – Median and Mean Earnings by Field of Study, 2005 Degree Cohort
32
Figure 14 – Percentile Earnings by Field of Study, 2005 Degree Cohort
33
4.8. Differences in the Earnings of Graduates across Institutions
What are the Differences?
Thus far, the analysis has presented results for graduates across all participating PSE
institutions taken together. We now address the question of how much variation there is in
graduates’ outcomes across institutions.
Figure 15 shows this in a simple format for the 2005 cohort by showing the earnings
profiles for the graduates from the institution with the highest earning graduates and the institution
with the lowest earning graduates, along with the aggregate means (i.e., across all students from
all institutions as seen earlier), for each field of study.11
Substantial differences in the outcomes of graduates across institutions are apparent for
some fields of study, such as Business, Engineering, Health, and (less so) Mathematics &
Computer Science, whereas the differences are narrower for the others, such as the Humanities,
Sciences & Agriculture, the Social Sciences, and Fine Arts.
For the fields of study in which the differences between the highest and lowest earning
graduates are substantial, these gaps may be due to graduates at the top institution having unusually
high earnings (e.g. Business), or those at the bottom having unusually low earnings (e.g. Health
and Mathematics & Computer Science), as seen in comparisons to the mean. In a final set they are
due to a combination of higher earnings at the top and lower earnings at the bottom (Engineering).
Interestingly, the gaps are generally wider for those fields in which the distributions of
earnings at the individual level are also wider. These are fields of study, in which the schooling is
generally occupational or job focused, and where, as a result, differences in local or sectoral
economic conditions could drive differences in earnings outcomes – across individual graduates
(as seen earlier) and across graduates from different institutions.
Conversely, the cross-institution differences are narrower in fields of study in which skill
sets are more general, which may enable graduates to move across sectors.
11 The identification of the highest and lowest earnings graduates was based on the cumulative
earnings (as defined above) for the graduates of each institution for each field of study. Once identified, the
earnings of the graduates of these institutions were adjusted to include a small random element so that the
actual mean earnings are not reported. The earnings profiles of the graduates of all institutions (i.e., not just
the high-low institutions) were graphed for reference. Showing just the high and low earner institutions
provides a simple representation while capturing the broader patterns.

34
Figure 15 – Earnings across Institutions by Fields of Study, 2005 Degree Cohort

35
What Explains Those Differences and Why Does Understanding This Matter?
There are a number of reasons for graduates’ outcomes to vary across institutions. In
addition to differences in local labour market conditions, as suggested above, another reason for
variation in graduates’ outcomes is that institutions generally admit students with different
(average) characteristics which could, of themselves, affect post-schooling labour market
outcomes. In other words, some institutions tend to have academically stronger students than
others, and those students are likely to have higher earnings regardless of the benefits of the
schooling they receive.
It would be useful to better understand the extent to which local labour market conditions
and students’ background characteristics, affect graduates’ earnings. Specifically, how much of a
‘hit’ do graduates take when local unemployment rates rise, and how much do family background
(income, parental education level, etc.) and pre-PSE student preparation (e.g., as measured by high
school grades) affect post-graduation earnings?
Such questions have a range of policy implications. This information could also be used to
generate graduates’ earnings outcomes at the institutional level adjusting for these and other related
factors in order to measure the value added of PSE and to develop better key performance
indicators.12
Fortunately, significant progress could be made on these fronts quite easily. Local labour
market conditions are easily measured and could be worked directly into the analysis of graduates’
outcomes. Student family background characteristics could be similarly measured (on a proxy
basis) by using postal code information on students to link to other data sources (e.g., the census)
which include various measures of family incomes, education levels, and other family or
neighbourhood characteristics at the postal code level.
12 Other factors that will affect cross-institution differences in graduates’ earnings include the
selection rules used to generate the samples, such as deleting graduates who go on to further studies. Some
institutions will have more students who continue their studies, leaving a more restricted sample of labour
market participants, whereas other institutions will have fewer students who continue their studies and
therefore a broader selection of graduates included in the analysis. Finally, the specific programs
represented in the categories analyzed, and the distribution of students across those programs may have an
impact on cross institution differences in earnings by field of study. In particular, within a specific field of
study, some institutions may have more of the programs – and more students – from which graduates
generally enjoy higher earnings.

36
The tax data to which students are linked for the purposes of tracking their post-graduation
earnings in this project could also be used to identify students’ family situations in earlier years
(i.e., at their point of entry into PSE or before) using related sets of family-based income tax files
currently available. Those data and any related linkages could be exploited further to track
students’ family situations by following the parents back in time. Both approaches have been used
previously by the lead author of this report for similar purposes in other research projects.
Finally, incoming student grades (a rough proxy of student ability) are currently collected
by institutions, and have already been transferred to Statistics Canada on the part of many of the
PSE institutions included in this project. They could be added for others relatively easily.
Other student characteristics that could similarly affect post-graduation earnings include
student ethnicity, immigration status, parental status, and language. For many of these variables,
the data are either already available or could easily be included in such an analysis.
To conclude, it is worth repeating that these factors are interesting to understand in terms
of how they affect students’ post-schooling earnings in their own right, and to better understand
the value added of PSE so as to arrive at better key performance indicators which measure student
outcomes taking these other factors into account.
5. Analysis of College Diploma Graduates
Like the analysis of bachelor’s degree graduates, the analysis of diploma graduates focuses
on the 2005 cohort, which is followed for the longest time, and which is also broadly representative
of the general patterns of all cohorts.13
5.1. Earnings over Time: All Graduates Taken Together
Among diploma earners graduating in 2005, annual mean earnings started at $33,900 in
the first year after graduation and grew to $54,000 eight years after graduation (Figure 16),
representing a 59% earnings growth over eight years or an average increase of almost 8.5% or
$2,900 on an annual basis.
13 Again, results for all individual cohorts are also available in Appendix C.
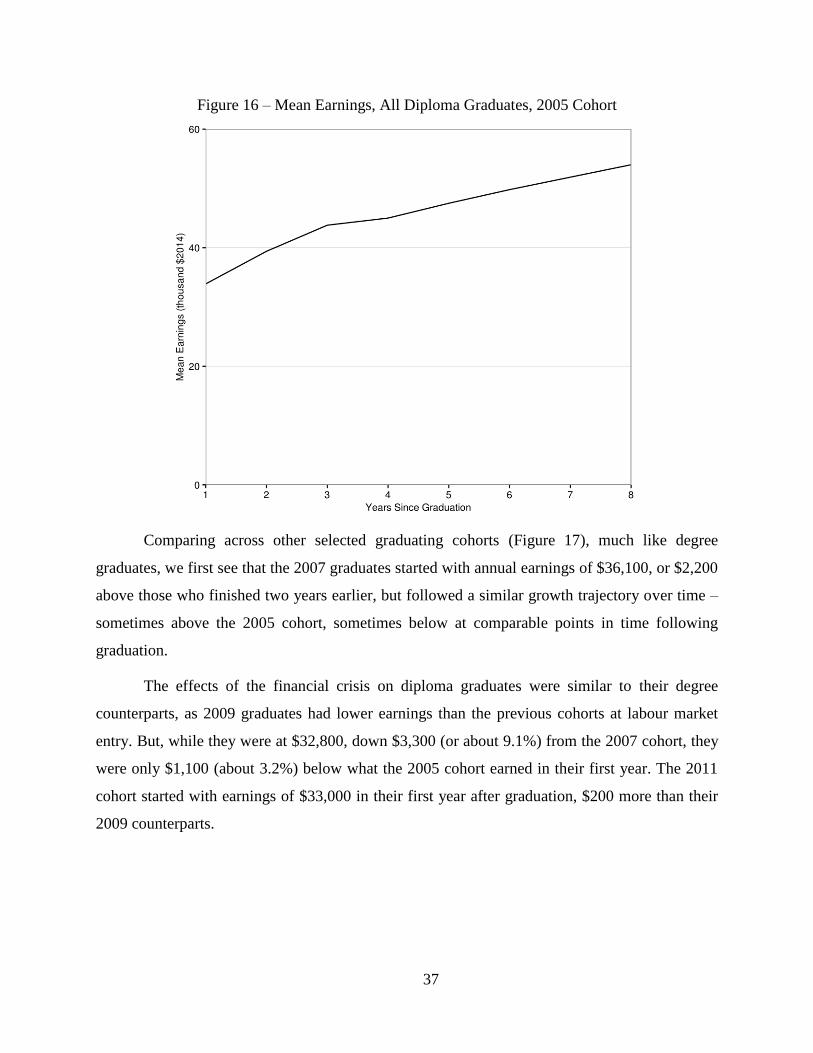
37
Figure 16 – Mean Earnings, All Diploma Graduates, 2005 Cohort
Comparing across other selected graduating cohorts (Figure 17), much like degree
graduates, we first see that the 2007 graduates started with annual earnings of $36,100, or $2,200
above those who finished two years earlier, but followed a similar growth trajectory over time –
sometimes above the 2005 cohort, sometimes below at comparable points in time following
graduation.
The effects of the financial crisis on diploma graduates were similar to their degree
counterparts, as 2009 graduates had lower earnings than the previous cohorts at labour market
entry. But, while they were at $32,800, down $3,300 (or about 9.1%) from the 2007 cohort, they
were only $1,100 (about 3.2%) below what the 2005 cohort earned in their first year. The 2011
cohort started with earnings of $33,000 in their first year after graduation, $200 more than their
2009 counterparts.

38
Figure 17 – Mean Earnings, All Diploma Graduates, Selected Cohorts
The 2007 graduates thus did exceptionally well, especially to start, while the others (those
who finished in 2005, 2009, and 2011) all earned within $1,100 of each other in their first year
following graduation, and all cohorts saw their earnings increase substantially in the following
years in the labour market.
The general pattern seems to be one whereby all graduating cohorts recorded earnings
trajectories that were more similar than different across all sets of graduates.
The labour market outcomes of college diploma graduates, which are consistent with
bachelor’s degree graduates’ results, suggest that that the impact of the 2008 financial crisis on
PSE graduates actually had limited repercussions.
If the assumption, as mentioned earlier, is that the average barista earns just under $22,000
annually, graduates from the cohort with the lowest starting mean earnings still earned $10,000
more than the average barista. More importantly, earnings rose steadily from there, to $54,000 for
the 2005 cohort of graduates, as shown earlier. This is 2.5 times the barista level.
But that is based on the average earnings level across all graduates. What do we find when
we dig deeper into the data?

39
5.2. Earnings by Field of Study
First Year Earnings Levels
Across the various fields of study (Figure 18), the patterns of first year earnings levels,
earnings growth, and final earnings levels varied substantially. Engineering and Health graduates
consistently had the highest earnings in the first year after graduation, generally in the $40,000
range.
Graduates of Arts & Education, Business, Science & Agriculture, and Personal, Protective,
& Transportation (PPT) Services, generally followed earning from the high $20,000s to the low
$30,000s in their first year of work. Finally, those in Fine Arts had the lowest average first year
earnings, ranging from around $22,400 to a maximum of $26,800 in their best year (again the 2007
graduates, as for most fields of study).
Specifically, earnings in the first year after leaving school for the 2005 cohort of graduates
were as follows (from top to bottom): Engineering: $40,300, Health: $39,500, Science &
Agriculture: $32,400, Business: $30,200, Arts & Education: $29,600, PPT Services: $29,400, and
Fine Arts: $25,100.
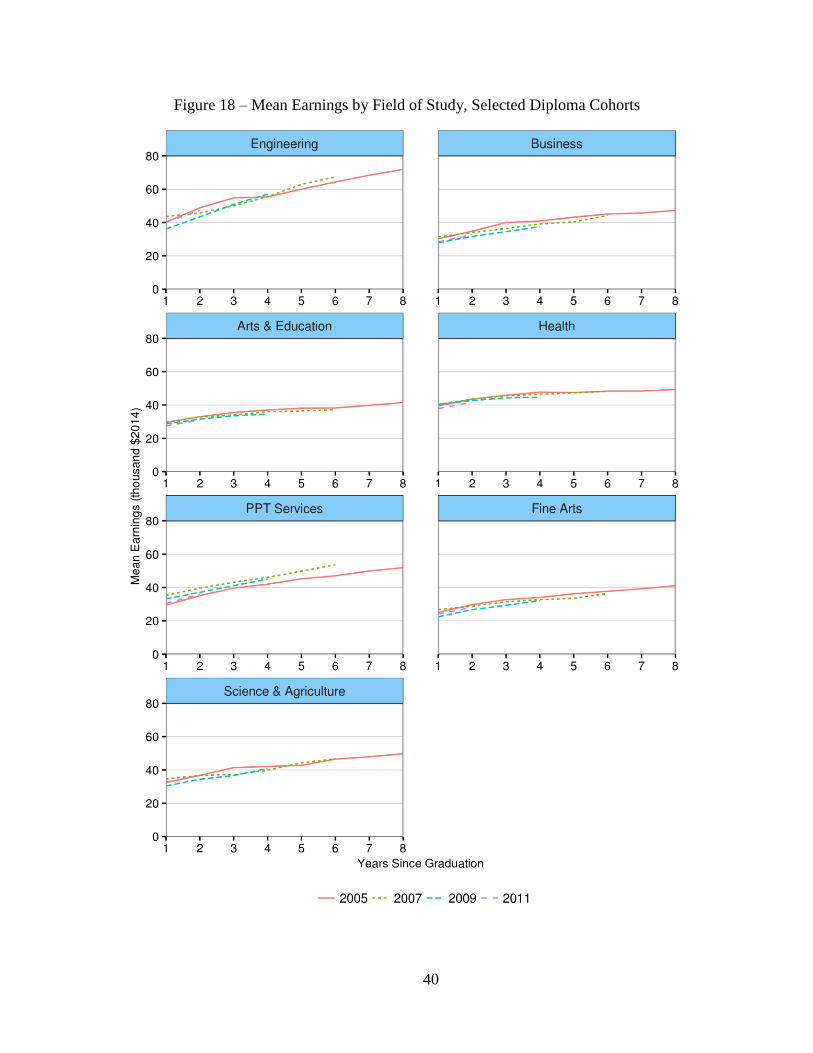
40
Figure 18 – Mean Earnings by Field of Study, Selected Diploma Cohorts

41
Growth in Earnings
To begin at the top, in terms of final earnings levels by field of study (first year earnings
combined with earnings growth), Engineering, with average earnings of $71,900 eight years after
graduation for the 2005 graduating cohort, led the pack. This amounts to earnings increases of
about $4,500 per year averaged over the full eight years following graduation.14
A broad pack of four fields of study follows: PPT Services, Science & Agriculture, Health,
and Business, with final-year earnings at $51,900, $49,700, $49,300, and $47,300 (respectively).
Like bachelor’s degree graduates, Health is notable. Health graduates’ middle ranking final-year
earnings contrasts with their comparatively high first year earnings levels, and reflects their low
increase in earnings over time. Once again, we believe that this is likely due to the strong
occupational focus associated with studying in the health disciplines, and the corresponding highly
structured, and generally highly unionized, labour market Health graduates often enter.
Finally, as Arts & Education and Fine Arts Graduates had the lowest earnings immediately
following graduating, they held this distinction eight years following graduation, finishing at
$41,500 and $41,100, respectively. Once again, these patterns demonstrate the value of having
access to long-term earnings profiles.
Variations across Cohorts
Final considerations relating to the patterns by field of study concern the variation in
patterns across cohorts. Greater differences in earnings across cohorts are evident for Engineering,
Business, and PPT Services. Other fields of study generally showed less variation across cohorts.
The Barista Story?
Except perhaps for Fine Arts graduates, mean earnings are well above the barista
benchmark in even the first year following graduation, and rise from there. By eight years out,
mean earnings range from $41,100 to $71,900 across the different fields of study – in comparison
to the barista level of $22,000. Fine Arts is where it comes closest, but even if graduates start just
above the barista level, by eight years following graduation they are close to double that level.
So even while the barista myth is often mentioned in the context of bachelor’s graduates,
diploma graduates generally outperform this norm as well.
14 Again remember that all earnings values are reported in constant (inflation adjusted) 2014 dollars.

42
5.3. Further Focus on the Growth in Earnings
While earnings generally had an upward trajectory in all fields of study, earnings growth
varied, as presented in Figure 19 for the 2005 graduation cohort. The graduates of Engineering
and PPT Services experienced the highest growth with 78% and 77%, respectively. They were
followed by graduates in Fine Arts, Business, Science & Agriculture, and Arts & Education, with
earnings growth of 64%, 57%, 53%, and 40%, respectively. Conversely, the mean annual earnings
for Health graduates increased the least (25%) eight years after graduation.
Again, as explained in the corresponding degree section above, we emphasize the
importance of having the long-run perspective of earnings in the years following graduation
afforded by the tax data used in this study in order to understand the earnings patterns of graduates,
including differences in earnings by field of study.
Figure 19 – Earnings Growth by Field of Study, 2005 Diploma Cohort
Figure 20 combines the first year earnings for each field of study (the vertical axis) with
the earnings growth eight years after graduation for diploma graduates (horizontal axis), for the
2005 graduating cohort. The figure shows the wide differences in first year earnings levels (the
height of their points in the graph), as well as substantially different growth rates (their position in
the horizontal plane).

43
Engineering and, to a lesser extent, PPT Services appear on the top right hand side of the
graph, highlighting their relatively high first year earnings and highest earnings growth rates.
Conversely, Health appears on the top left hand side, which shows that Health graduates
experienced high first year earnings but low earnings growth.
Figure 20 – First Year Earnings and Earnings Growth, 2005 Diploma Cohort
5.4. Cumulative Earnings by Field of Study
Figure 21 offers yet another perspective of earnings differences by field of study by
showing cumulative earnings over the eight years following graduation for the 2005 graduation
cohort. Once again, we see the labour market success of Engineering graduates, who recorded the
highest cumulative (average) earnings, at just over $450,000. They are followed by Health
graduates ($370,000), who are in turn followed by PPT Services and Science & Agriculture
($340,000), and Business graduates ($330,000). They, in turn, are followed by Arts & Education
($290,000) and Fine Arts graduates ($275,000).
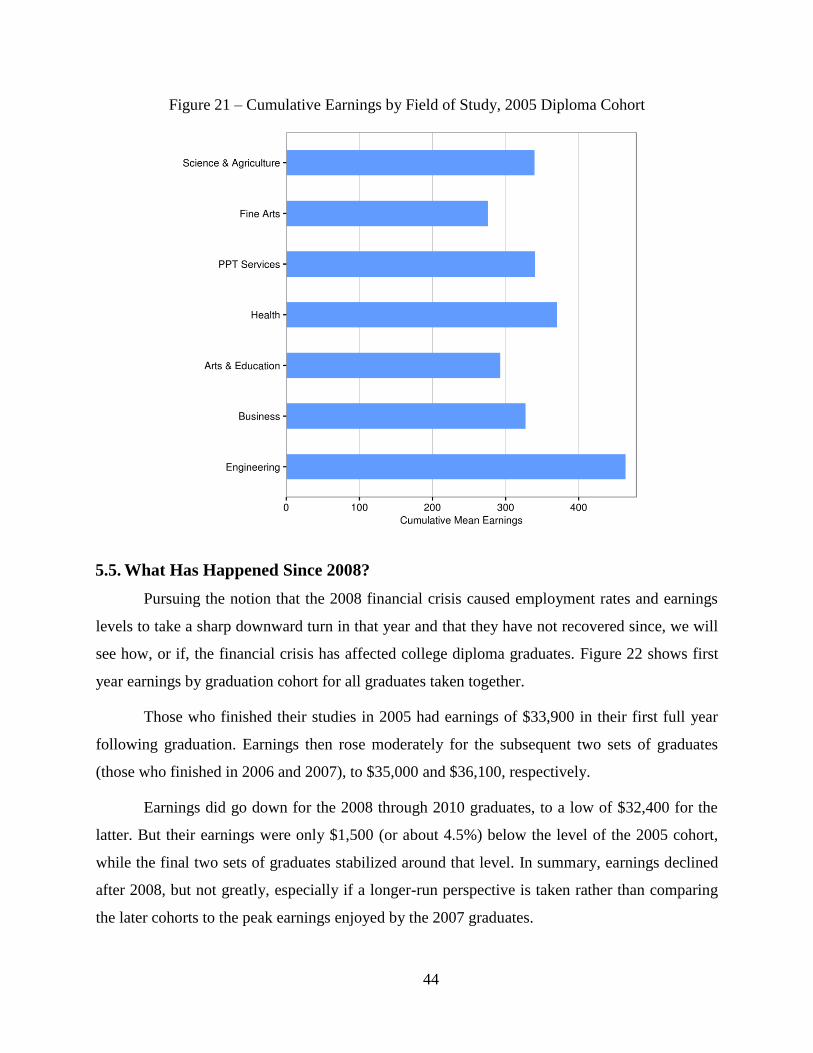
44
Figure 21 – Cumulative Earnings by Field of Study, 2005 Diploma Cohort
5.5. What Has Happened Since 2008?
Pursuing the notion that the 2008 financial crisis caused employment rates and earnings
levels to take a sharp downward turn in that year and that they have not recovered since, we will
see how, or if, the financial crisis has affected college diploma graduates. Figure 22 shows first
year earnings by graduation cohort for all graduates taken together.
Those who finished their studies in 2005 had earnings of $33,900 in their first full year
following graduation. Earnings then rose moderately for the subsequent two sets of graduates
(those who finished in 2006 and 2007), to $35,000 and $36,100, respectively.
Earnings did go down for the 2008 through 2010 graduates, to a low of $32,400 for the
latter. But their earnings were only $1,500 (or about 4.5%) below the level of the 2005 cohort,
while the final two sets of graduates stabilized around that level. In summary, earnings declined
after 2008, but not greatly, especially if a longer-run perspective is taken rather than comparing
the later cohorts to the peak earnings enjoyed by the 2007 graduates.

45
Figure 22 – First Year Earnings, All Diploma Graduates, 2005-2012 Cohorts
Looking at the trends by field of study (Figure 23), when measured against the 2005 initial
(base) year and looking across the entire period, Business graduates experienced the most
pronounced decline in first year earnings (11.6%), followed by Arts & Education and Health
graduates with declines of 8.4% and 4.3%, respectively. Graduates of Engineering, PPT Services,
and Fine Arts all experienced smaller declines in their first year earnings, ranging from 0.7% to
2.8%. Science & Agriculture graduates, however, recorded a net increase in earnings of 3.7%
relative to the base year, representing the only field of study in which the 2012 graduating cohort
had higher first year earnings than the 2005 cohort.
To reiterate, these patterns are significant, and it will be important to see if the declines, in
particular, have continued in the years since those covered in this analysis. By and large, however,
the record for diploma graduates, as for degree graduates, is characterized by a mixed set of
changes with declines that bear close watching in future years.

46
Figure 23 – First Year Earnings by Field of Study, 2005-2012 Diploma Cohorts

47
5.6. Earnings by Gender
All Graduates Taken Together
The first year after graduation, men in the 2005 graduating cohort earned $5,500 more than
women. The earnings gap between men and women widened over time and reached $23,600 eight
years after graduation, which means that male graduates had earnings 56% higher than female
graduates.
Figure 24 – Earnings by Gender, All Diploma Graduates, 2005 Cohort
Earnings differences by Gender across Fields of Study
The gender earnings gap also varied across fields of study (Figure 25). Eight years after
graduation, graduates of PPT Services had the largest gender-earnings gap at 61%. They were
followed closely by Science & Agriculture graduates at 58%. Fine arts graduates had the lowest
gender gap after eight years, at 19% while male graduates of other fields generally maintained
earnings of 30% to 40% higher than their female counterparts.
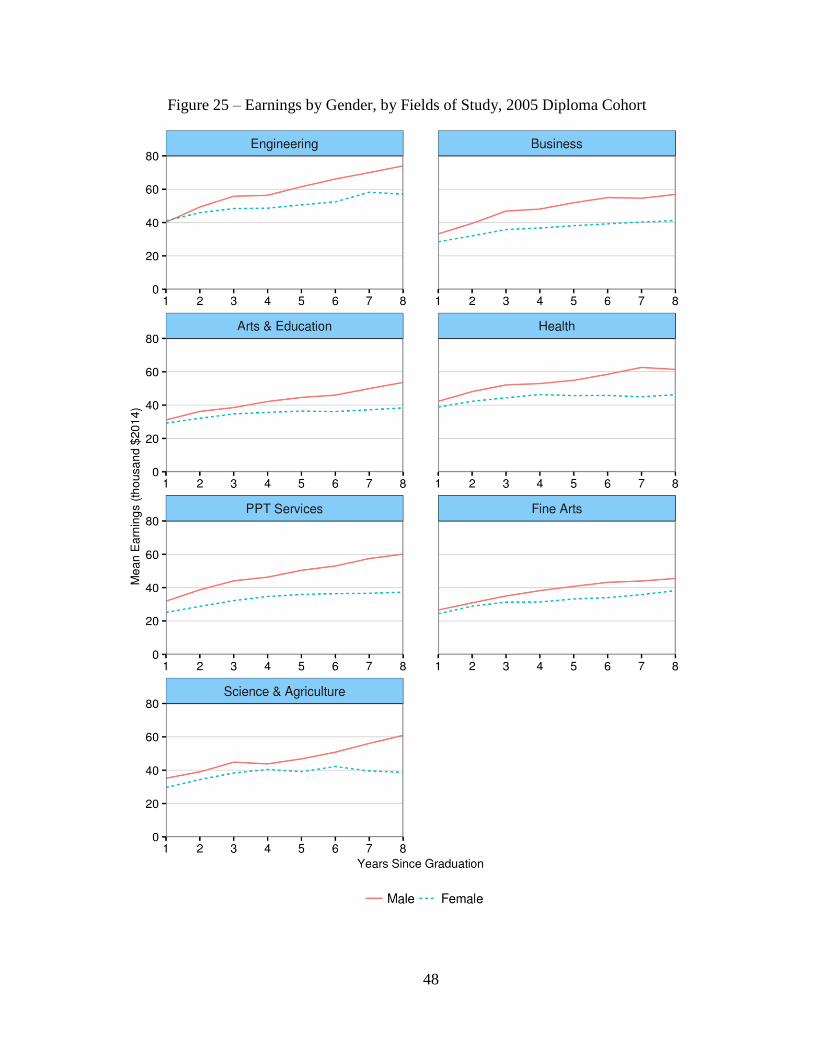
48
Figure 25 – Earnings by Gender, by Fields of Study, 2005 Diploma Cohort

49
5.7. Distribution of Earnings
All Graduates Taken Together
Figure 26 illustrates mean versus median earnings for all graduates taken together. Mean
earnings are higher than median earnings at labour market entry and rise somewhat more quickly
than median earnings in the years following graduation, which suggests that the earnings of top
earners grew faster than those of lower earners over time.
It is interesting to note how high some of the higher earnings levels are. The graduates at
the 90th percentile (those in the top 10% of all graduates) earned $95,600; the 75th percentile
graduate earned $70,300; the median earned $49,200; and the 25th percentile earned $30,400. The
bottom 10% made $14,500 or less.
Figure 27 is significant in the context of the barista theme, since it is below the barista
earnings level defined earlier, which is $22,000. The barista situation thus applies to about 10% of
all college diploma graduates.
Figure 26 – Median and Mean Earnings, All Diploma Graduates, 2005 Cohort

50
Figure 27 – Percentile Earnings, All Diploma Graduates, 2005 Cohort
Distribution of Earnings by Field of Study
Although mean earnings were slightly higher than the median at times for some fields of
study, the median earnings for diploma graduates closely followed the mean across fields of study.
Figure 28 shows that the difference between the two was less than 5% on average, suggesting that
mean values are not affected by outliers and are closely representative of earnings profiles. While
Engineering and Business graduates are on the higher end of that gap, PPT Services graduates
recorded the largest difference between their mean and median, which ranged between 10% and
12% five and seven years after graduation.
These sets of high performing graduates are also seen in the percentile earnings distribution
(Figure 29). Top earners within PPT Services, Engineering, and Business at the 75th and especially
the 90th percentiles have a widening earnings advantage relative to lower earners in their groups
than those in other fields of study. In short, graduates in these fields of study do especially well in
comparison to their co-graduates as their earnings grow at faster rates over time.
Much like percentile earnings variations in bachelor’s degree graduates, the data do not
explain what drove these graduates to perform exceptionally well or why this phenomenon is more

51
common in certain fields of study.
Meanwhile the lowest earnings levels (see the 25th percentile lines for each field of study)
are relatively flat for all fields of study. From these data, we cannot say why this is. We are unable
to differentiate, in particular, whether the low earnings levels are due to workers choosing to work
fewer hours per week or fewer weeks per year, (perhaps because of family decisions or other life
choices), or because they cannot get better paying jobs. Only further research, as suggested in the
corresponding bachelor’s degree section, could begin to answer these important questions.
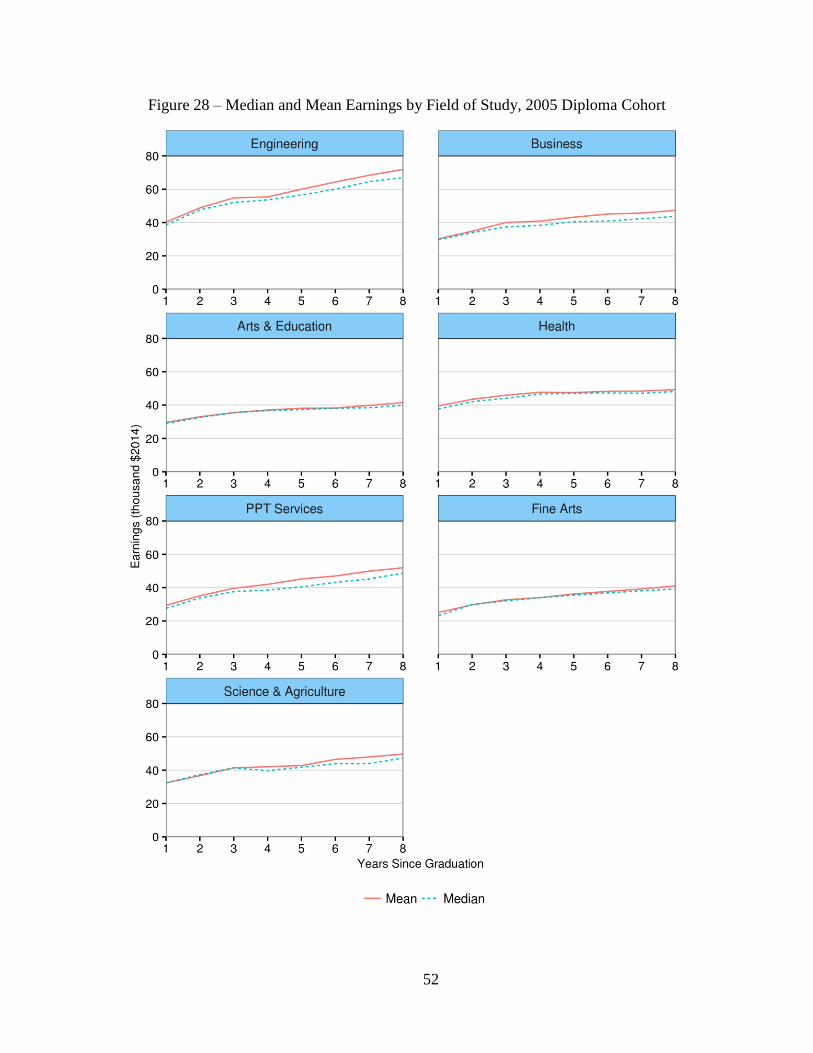
52
Figure 28 – Median and Mean Earnings by Field of Study, 2005 Diploma Cohort
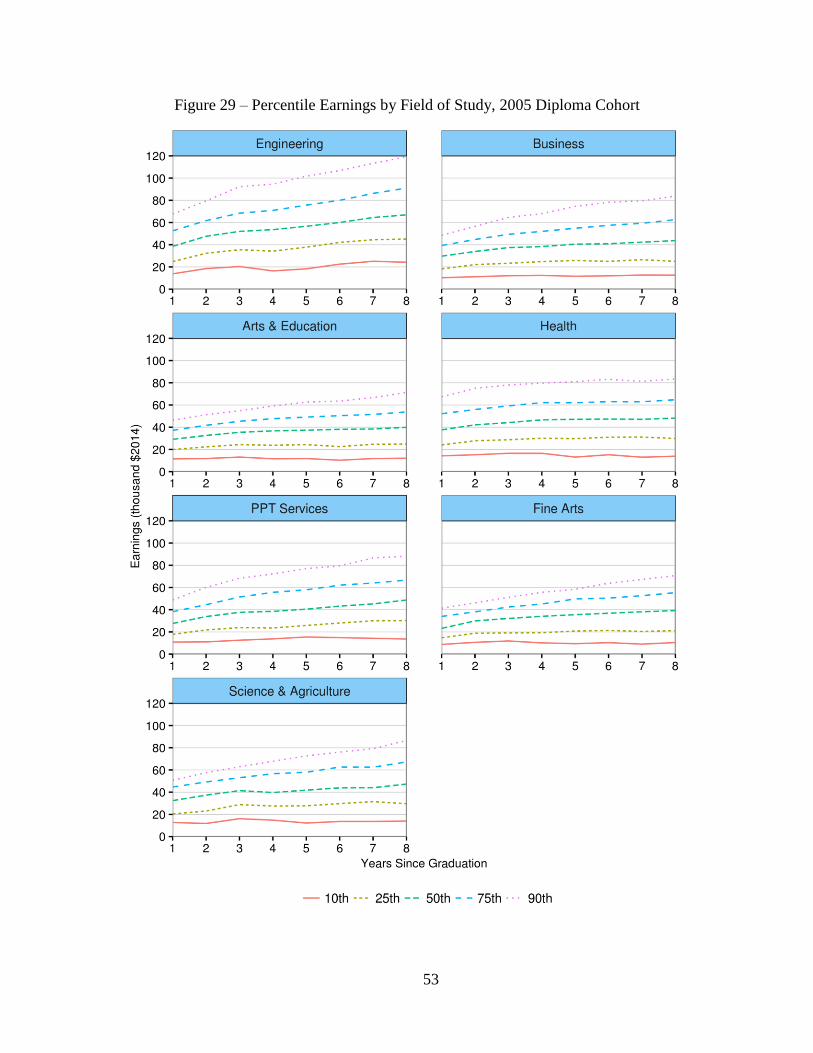
53
Figure 29 – Percentile Earnings by Field of Study, 2005 Diploma Cohort

54
5.8. Differences in the Earnings of Graduates across Institutions
Differences in earnings across the graduates of different institutions for college diploma
graduates were measured using the same methodology as for bachelor’s graduates, which
identified the institutions with the highest earning graduates and the lowest earnings graduates in
each field of study. In contrast to the bachelor’s results, almost all fields of study for diploma
graduates show substantial differences in earnings across institutions, the only clear exception
being PPT Services, where the differences are small (Figure 30).
The reason for this could be that Canadian colleges are generally mandated with developing
occupationally-specific, practical job skills in their students, often catering to local labour market
needs. This means that the graduates of different institutions may do considerably better or worse
than the graduates of others, depending on local labour market conditions for their graduates in
different fields of study.
The need to understand the impact of local labour markets, the different characteristics of
students, and other factors discussed in the bachelor’s section applies equally to diploma graduates
as to bachelors graduates (discussed above).

55
Figure 30 – Earnings across Institutions by Fields of Study, 2005 Diploma Cohort

56
6. Concluding Summary and Next Steps
6.1. Concluding Summary: The Findings and Their Significance
This report has described an innovative research project that uses administrative data on
students provided by 14 PSE institutions from four Canadian provinces linked to tax records held
at Statistics Canada to track the labour market outcomes of Canadian college (diploma) and
university (bachelor’s) graduates from 2005 through 2013.
Some of the findings were expected, including the relatively high earnings enjoyed by
Engineering graduates. Other findings related to the earnings levels of graduates of other fields of
study, such as the Humanities and Social Sciences (including the liberal arts), would seem to
counter popular conceptions. While it has been commonly assumed that studying in these fields of
study leads to low earnings levels and limited career progression – i.e., the barista myth – the
evidence presented here suggests otherwise.
Regardless of pre-conceptions and what are considered to be acceptable levels of earnings,
the findings on what PSE graduates earn in the years following graduation reported in this study
represent new and unique information that could be of practical use to a range of PSE stakeholders,
including students making PSE choices, PSE institutions making program decisions, policy
makers, and the general public.
The findings also demonstrate the value of looking at earnings over more extended periods
of time than past graduate surveys have done. This allows us to observe, for example, that Health
graduates of bachelor’s and diploma programs perform better than most other disciplines in the
first few years after graduation, but that over time graduates from other disciplines tend to catch‐
up and in some case surpass them. Other longer-run earnings patterns also differ from what is seen
immediately after graduation. All stakeholders and decision makers could benefit from this type
of extended analysis.
6.2. Next Steps: Using the Research Platform Developed for This Project
A Wide Range of Possibilities
The dataset and analytical approach that have been developed for this study could be used
in a range of other projects that would push our understanding of PSE students’ labour market
outcomes forward in a range of interesting and useful directions.

57
One obvious starting point would be to look at outcomes at the specific program level or
by particular discipline (e.g. Psychology), as opposed to the broader field of study categories used
in this study (e.g. the Social Sciences).15
The post-schooling labour market outcomes of specific groups of students, such as
Indigenous, immigrant and international students, or those from low socioeconomic backgrounds
(among others) could also be explored.
In addition, the relationships between labour market outcomes and particular schooling
experiences, such as being enrolled in a co-op program, taking specific sets of courses, or being
exposed to innovative pedagogical approaches, could also be investigated. This could help identify
the schooling experiences that lead to better labour market outcomes, which would in turn enable
PSE institutions to enhance students’ learnings experiences on the basis of sound empirical
evidence. Institutions could also engage in new pilot projects or experiments that could be
evaluated using this platform which links students’ PSE experiences to their post-schooling
outcomes.
Other projects could explore the relationships between labour market outcomes and a range
of other factors that may affect earnings, such as students’ incoming grades and local labour market
conditions. These relationships are of particular interest because they could contribute to the
development of more meaningful key performance indicators (KPIs) for PSE institutions. For
example, graduates of one institution may earn more (or have higher employment rates) than those
of another, but this could be due, at least in part, to differences in the characteristics of the students
attending each institution and the strength of the labour markets students face after leaving PSE –
neither of which reflects the quality of the schooling experiences provided by the institution, the
skills students developed while in school, or institutional performance more generally. The current
project provides a platform for adjusting student outcomes for these sorts of influences.
Similarly, while earnings are often seen to reflect the skills which students possess at the
end of their studies, looking at earnings after taking account of incoming student characteristics
would provide a better measure of the value added of their PSE experiences, which is often the
more interesting concept for a range of reasons.
15 A pilot project of this type is currently being completed using University of Ottawa graduates.

58
Further in this line, tax data on those students who did not complete PSE or who never
attended PSE could be used to establish comparison groups that could better identify the
contribution of PSE to graduates’ labour market outcomes.
Finally, the platform established in this project could be used to look at a broader set of
student outcomes based on other measures available in the tax data, such as the use of income
support programs (EI, Social Assistance, others), the establishment of families (marriage,
children), or savings.
Getting the Required Data
Some extensions could be facilitated easily by transferring additional variables from the
participating colleges and universities. Information on high school grades, other incoming student
characteristics, program details, and specific schooling experiences could be added simply by
identifying, cleaning, and transferring over the additional variables.
It would be similarly straight-forward to pull additional variables from the tax files to
which students have already been linked, such as those representing some of the additional
outcome variables of interest mentioned above (specific income sources, family status, etc.)
Other information could be added by using the postal code information available in the
PSE data and tax files to link students/graduates to other data sources, such as the Labour Force
Survey or the census, in order to obtain associated aggregate level data. Local unemployment rates
and related economic indicators could, for example, be used to capture the economic conditions
graduates face after graduation (as mentioned above), while neighbourhood socioeconomic
characteristics (incomes, education levels, other population characteristics) could be used as
proxies for students’ own family backgrounds to see how outcomes vary along these dimensions.
Another step would involve using the tax files to which students have been linked to further
link students to their family (parents’) income levels and other socio-economic background
indicators in earlier years (i.e., during and prior to their PSE years) available on tax-based datasets.
These examples only begin to point to some of the potential of the tax-linked data used in
this project.
Linking to Other Datasets
In addition to pulling more information from the PSE and tax data used in this project,

59
other individual-level data linkages could be added. One particular direction would be to link the
PSE-tax linked files developed in this study to K-12 data in order to gain a longer perspective of
learning processes and subsequent labour market outcomes. Usable K-12 data are already available
in some provinces, while others are moving in this direction with the advent of unique student
education numbers.
That said, the personal information already available on students (name, birth date, postal
code) is probably sufficient to make these linkages in many cases (as demonstrated by the high
match rates achieved in this project with a similar set of identifiers), so there is not necessarily a
need to wait for the development of student identifiers to move forward at this time. This would
also permit analysis of what has happened in the past, rather than waiting for students to move
from K-12 into PSE and then into the labour market as would be required if only recently available
education identifiers were relied upon for these purposes.
Furthermore, once K-12 data were linked to PSE data, the merged files could be used not
only to extend work on post-schooling outcomes, but also to broaden the overall research agenda
to look at access to PSE (who goes and who doesn’t) and preparation for PSE over the K-12 years.
Other data sets to which linkages could be made include those related to student loans,
employment data, job programs, health, incarcerations, vital statistics, and to the range of other
administrative data currently held at the local, provincial, and federal levels.
Among the most innovative examples of data-linkage work is New Zealand, where an
“Integrated Data Infrastructure (IDI)” has been developed. This data infrastructure is essentially a
set of file linkages which “...combines information from a range of organizations (such as health
and education data) to provide the insights government needs to improve social and economic
outcomes for New Zealanders.” Explaining the value of integrated data, the government website
states, “With all personal information removed, integrated data gives a safe view across
government so agencies can deliver better services to the public and ensure investment is made
where it’s needed most. Integrated data is particularly useful to help address complex social issues
such as crime and vulnerable children.”16
16 For more on the IDI, go here http://www.stats.govt.nz/browse_for_stats/snapshots-of-
nz/integrated-data-infrastructure.aspx

60
The IDI started with a linkage of PSE and tax data, as used in the current project, after
which substantial enhancements were soon undertaken. In a relatively short time, the IDI has paid
substantial dividends to New Zealand researchers, policy makers, and other stakeholders, and
could serve as an excellent model for Canada.
Extending to More Students at More Institutions
This project has demonstrated the feasibility of using linked PSE-tax data to track
graduates’ earnings. This approach could be scaled up and extended to include more graduates at
more PSE institutions to the point that all graduates from all PSE institutions could be included.
One obvious strategy currently being developed uses Statistics Canada’s Postsecondary
Student Information System (PSIS), which gathers key student variables from PSE institutions in
Canada. Using PSIS data linked to tax data, not only could the analysis be extended to more
graduates, but it could also include others sets of graduates not included in this study, including
graduate students, those in professional programs, certificate and trades students, and others.
Furthermore, if PSE data for an entire jurisdiction, such as a province or region, were used,
in addition to looking at labour market outcomes at such a broad level, projects that analyzed
students’ progression through PSE could be undertaken. Such projects could focus on pathways
and outcomes related to graduation, continuing in the same program, changing programs within or
across institutions, and leaving PSE without graduating. These PSE experiences could also be
related to students’ post-schooling labour market outcomes. For example, the post-schooling
earnings of students with a bachelor’s degree could be compared to bachelor’s graduates who went
on to obtain a college diploma or graduate degree, and vice versa.
An alternative approach to extending the current project would be to adopt the procedures
used in this study to gather data directly from additional PSE institutions. This approach would
not require the universal buy-in that a PSIS-based project might demand; could bring together
similar institutions from diverse sets of jurisdictions (e.g., a broad sampling of large research-
intensive universities, polytechnics/institutes of technology, or smaller teaching universities and
colleges); and perhaps most importantly, could address a wider range of research questions that
would lie beyond a PSIS-only data platform as more variables could be collected than the limited
sets available in the PSIS.
A third, hybrid, approach would be to work with the PSIS, but add other variables to those

61
files. The different approaches could be adopted concurrently – each one having its own
advantages and contributing in its own way to the overall goals of this general line of research on
students’ PSE experiences and labour market outcomes.
6.3. Towards a Broader Skills Agenda
There is growing interest in issues related to the education, skills, and labour market nexus.
People understand that skills matter. But too often discussions do not consider broadly enough the
types of skills that matter, the value of different skill sets, or the role PSE can play in helping
individuals develop valuable skills.
The current project could contribute to this agenda by forming the basis for initiatives
which track students from the point they enter PSE, move through the PSE system, and then enter
the labour market. In this way, skill levels at the beginning of PSE (or earlier), skill development
during PSE, and the value of skills in the work place could be empirically assessed. Discussions
and policy development related to the role of PSE in helping students develop their range of skills
could then be informed by empirical evidence rather than ideas and conjectures.
The skills of interest should, however, include more than conventional discipline-specific
skills, and should also include other essential skills and competencies such as literacy and
numeracy, higher order cognitive skills such as critical thinking and problem solving, and
“transferable” skills such as communication skills, being able to work in a (multi-disciplinary)
team environment, or having the mindset to be alert to opportunities to innovate.
Addressing the skills issue in this way could adjust our fundamental notions of both skills
and the purpose of PSE. But for this to happen, we first need to gain a better understanding of what
skills matter, how they relate to earnings and other labour market outcomes, and how they can be
developed in PSE.
Focusing on skills may, perhaps ironically, be the way of the future for the fields of study
which have often been criticized as offering the least in the ways of skills development, such as
the liberal arts. This project has demonstrated that these graduates do have skills which are of value
in the labour market, but it remains to be better understood what those skills are and what role PSE
should play in developing these skills.

62
6.4. The Need to Act
While the tax linkage approach employed in this study makes Canada an international
frontrunner in the study of education, skills, and labour market outcomes, other initiatives are
rapidly developing elsewhere. If Canada moves too slowly, too piecemeal, or too unambitiously,
it will soon be trailing its international counterparts. Nothing less than a new policy research model
which brings together policy makers, data providers, researchers, and other stakeholders is
required in order to move forward on a broad skills-focused research agenda in a timely manner.

63
7. Bibliography
Arcidiacono, P. (2004). Ability Sorting and the Returns to College Major. Journal of
Econometrics, 121(1), 343-375.
Berger, M.C. (1988). Cohort size effects on earnings: Differences by College Major. Economics of
Education Review, 7(4), 375–383.
Betts, J., Ferral, C., & Finnie, R. (2013). The Role of University Characteristics in Determining Post-
Graduation Outcomes: Panel Evidence from Three Canadian Cohorts. Canadian Public Policy,
39 (Supplement), 81-106.
Birch, E. R., Li, I., & Miller, P. W. (2009). The Influences of Institution Attended and Field of
Study on Graduates' Starting Salaries. Australian Economic Review, 42(1), 42-63.
Boothby, D. (1999). Earnings Differences by Detailed Field of Study of University Graduates. Applied
Research Branch, Strategic Policy, Human Resources Development Canada, R-00-1-5E.
Boudarbat, B., Lemieux, T., & Riddell, W. C. (2010). The Evolution of the Returns to Human
Capital in Canada, 1980–2005.Canadian Public Policy, 36(1), 63-89.
Braga, M., Paccagnella, M., and Pellizzari, M. (2014) The Academic and Labor Market Returns
of University Professors. Italy: Centre for Economic Policy Research. ISSN 0265-8003
Brewer, D. J., Eide, E. R., & Ehrenberg, R. G. (1999). Does it pay to attend an elite private college?
Cross-cohort evidence on the effects of college type on earnings. Journal of Human
Resources, 104-123.
Britton, J., Dearden, L., Shephard, N., and Vignoles, A. (2016) How English Domiciled Graduate
Earnings Vary with Gender, Institution Attended, Subject and Scocio-Economic
Background. United Kingdom: Institute for Fiscal Studies, ESRC.
Council of Ontario Universities (2015). "University Works: 2015 Employment Report".
Dale, S.B. and Krueger, A.B. (1999) Estimating the Payoff to Attending a more Selective College:
an Application of Selection on Observables and Unobservables. National Bureau of
Economic Research.
Di Paolo, A., & Mañé, F. (2013). Determinants and consequences of qualification and skills
mismatch among recent PhD graduates.

64
Drewes, T., & Giles, P. (2002). Liberal Arts Degrees and the Labour market. Education Quarterly
Review, 8(2), 19-25.
Emery, H. (2004). Total and Private Returns to University Education in Canada: 1960-2030 and
in Comparison to other Post-Secondary Training. John Deutsch Institute for the Study of
Economic Policy, Queen’s University, Kingston.
Frank, K., Frenette, M., Morissette, R. (2015). "Labour Market Outcomes of Young Postsecondary
Graduates, 2005 to 2012", Economic Insights, Statistics Canada.
Ferrer, A. M., & Riddell, W. C. (2002). The Role of Credentials in the Canadian Labour Market.
Canadian Journal of Economics, 35(4), 879-905.
Finnie, R., & Frenette, M. (2003). Earning Differences by Major Field of Study: Evidence from Three
Cohorts of Recent Canadian Graduates. Economics of Education Review, 22(2), 179-192.
Frenette, M. (2014) .An Investment of a Lifetime? The Long-term Labour Market Premiums
Associated with a Postsecondary Education (No. 2014359e). Statistics Canada, Analytical
Studies Branch.
Green, David, A. and Worswick, Christopher. (2009) “Entry Earnings of Immigrant Men in
Canada: The Roles of Labour Market Entry Effects and Returns to Foreign Experience”
University of British Columbia.
Green, David, A. and Worswick, Christopher. (2012) “Immigrant earnings profiles in the presence
of human capital investment: Measuring cohort and macro effects” Labour Economics,
Issue 19, 241–259.
Grogger, J. and Eide, E. (1999) “Changes in College Skills and the Rise in the College Wage
Premium” The Journal of Human Resources.
Heijke, H., & Meng, C. (2011). The Effects of Higher Education Programme Characteristics on the
Allocation and Performance of the Graduates. Education Economics, 19(1), 1–27.
Heisz, A. (2001). Income prospects of British Columbia university graduates. Analytical Studies
Branch, Statistics Canada.
Hoekstra, M. (2009). The Effect of Attending the Flagship State University on Earnings: A
Discontinuity-Based Approach. The Review of Economics and Statistics, 91(4), 717-724.

65
Julian, T. (2012). Work-Life Earnings by Field of Degree and Occupation for People with a Bachelor’s
Degree: 2011. American Survey Briefs, ACSBR/11-04.
Kelly, E., O’Connell, P. J., & Smyth, E. (2010). The Economic Returns to Field of Study and
Competencies among Higher Education Graduates in Ireland. Economics of Education
Review, 29(4), 650-657.
Mahoney, P. (2014a). Men and Women-Moving on Up: What Men and Women Earn after their
Tertiary Education, New Zealand Ministry of Education, Beyond tertiary study.
Mahoney, P. (2014b). The Outcome of Tertiary Education for Maori Graduates: What Maori
Graduates Earn and Do after their Tertiary Education, New Zealand Ministry of
Education, Beyond tertiary study.
Mahoney, P. (2014c). The Outcome of Tertiary Education for Pasifika Graduates: What Pasifika
Graduates Earn and Do after their Tertiary Education, New Zealand Ministry of
Education, Beyond tertiary study.
Mahoney, P., Park Z., Smyth R. (2013) Moving on Up: What Young People Earn after their
Tertiary Education. New Zealand Ministry of Education, Beyond tertiary study.
Moussaly-Sergieh, K., & Vaillancourt, F. (2009). Extra Earning Power: the Financial Returns to
University Education in Canada (No. 79). CD Howe Institute.
Nakamuro, M., & Inui, T. (2013). The Returns to College Quality in Japan: Does Your College
Choice Affect Your Earnings? ESRI Discussion Paper Series.
Park, Z., Mahoney, P., Smart, W., & Smyth, R. (2014). What Young Graduates Earn when they
Leave Study. New Zealand Ministry of Education, Tertiary education occasional paper.
Park, Z. (2014). What Young Graduates Do when they Leave Study. New Zealand Ministry of
Education, Beyond tertiary study.
Psacharopoulos, G., & Velez, E. (1993). Educational Quality and Labor Market Outcomes: Evidence
from Bogota, Colombia. Sociology of Education, 66(2), 130-145.
Research Universities' Council of British Columbia, "BC Labour Market Profile", January 2013.
Robb, A.L., Magee, L., and Burbidge, J.B. (2001) “Wages in Canada: SCF, SLID, LFS and the
Skill Premium.” Department of Economics, McMaster University.

66
Stark, A. (2007). Which Fields Pay, which Fields Don't?: An Examination of the Returns to
University Education in Canada by Detailed Field of Study. Department of Finance,
Economic and Fiscal Policy Branch.
Walters, D. (2004). “A comparison of the Labour Market Outcomes of Postsecondary Graduates of
Various Levels and Fields over a Four-Cohort Period.” Canadian Journal of Sociology, 29(1),
1-26.