barnett shale-woodford shale play of the delaware basin ... w tx barnett-woodford shale.pdf ·...
TRANSCRIPT
Barnett ShaleBarnett Shale--Woodford Woodford Shale play of the Delaware Shale play of the Delaware basin basin –– is it another giant is it another giant shale gas field in Texas?shale gas field in Texas?
Bob CluffBob CluffThe Discovery Group, IncThe Discovery Group, IncDenver, Colorado, USADenver, Colorado, USAbobcluff@[email protected]
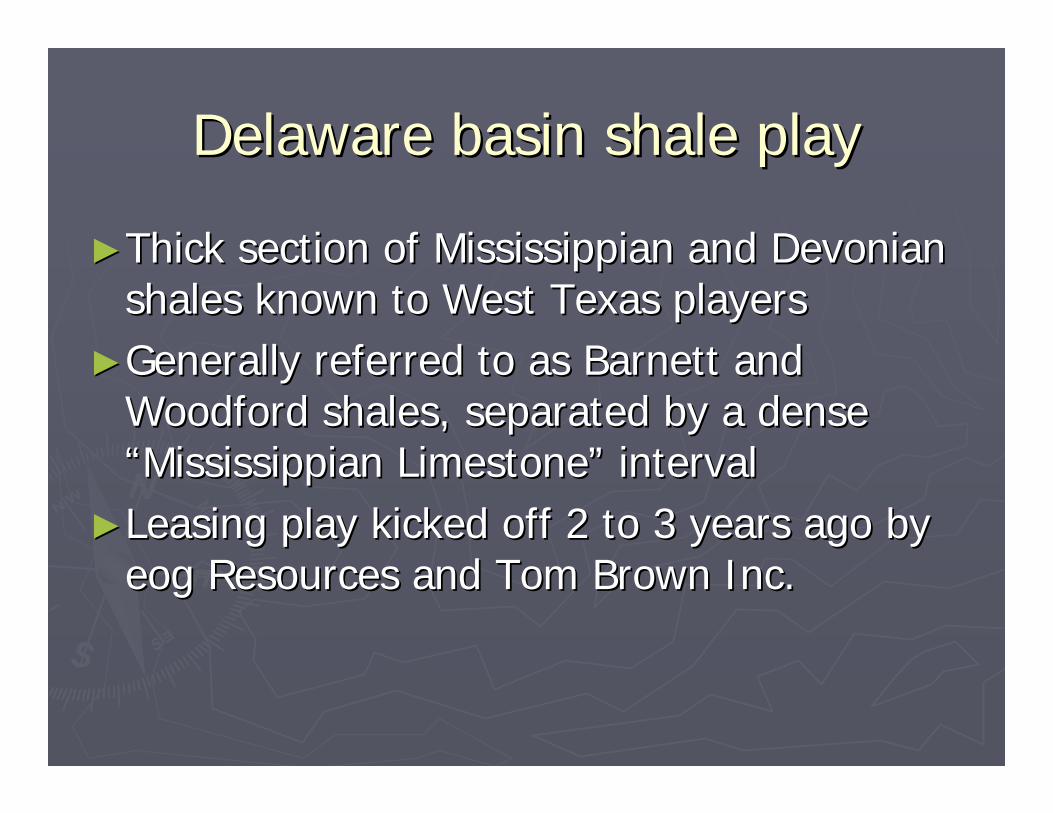
Delaware basin shale playDelaware basin shale play
►►Thick section of Mississippian and Devonian Thick section of Mississippian and Devonian shales known to West Texas playersshales known to West Texas players
►►Generally referred to as Barnett and Generally referred to as Barnett and Woodford shales, separated by a dense Woodford shales, separated by a dense ““Mississippian LimestoneMississippian Limestone”” intervalinterval
►►Leasing play kicked off 2 to 3 years ago by Leasing play kicked off 2 to 3 years ago by eogeog Resources and Tom Brown Inc.Resources and Tom Brown Inc.
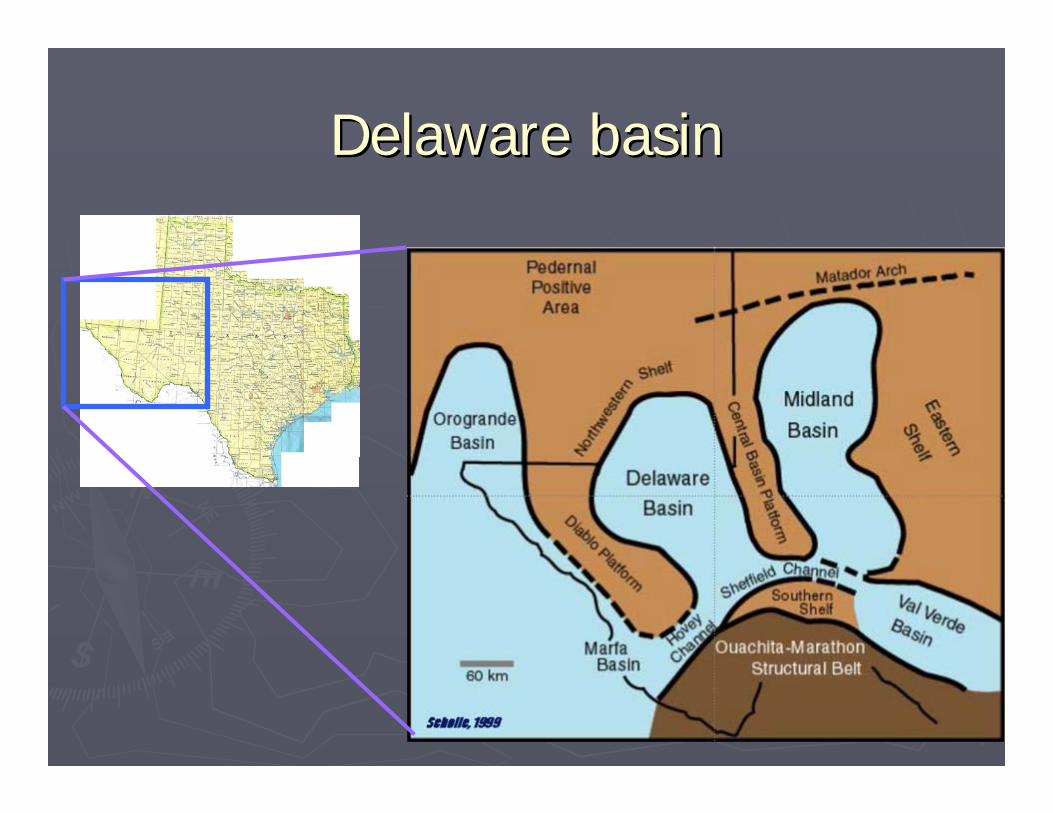
Delaware basinDelaware basin
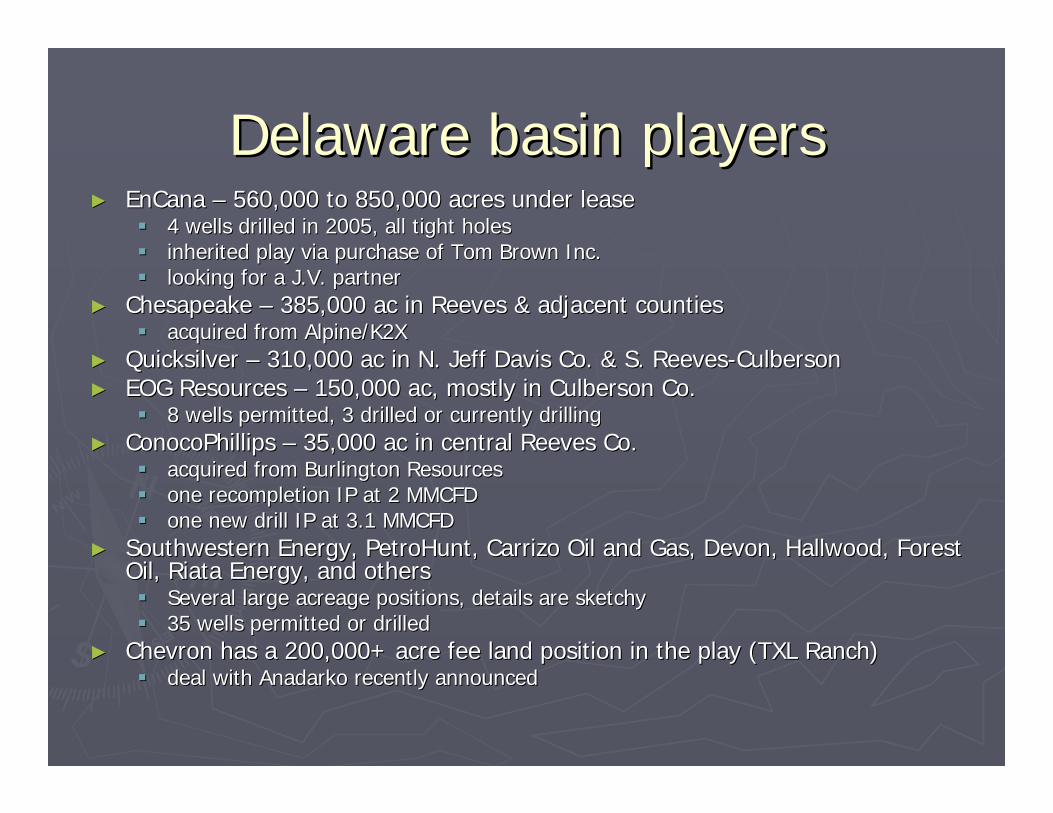
Delaware basin playersDelaware basin players►► EnCana EnCana –– 560,000 to 850,000 acres under lease560,000 to 850,000 acres under lease
4 wells drilled in 2005, all tight holes4 wells drilled in 2005, all tight holesinherited play via purchase of Tom Brown Inc.inherited play via purchase of Tom Brown Inc.looking for a J.V. partnerlooking for a J.V. partner
►► Chesapeake Chesapeake –– 385,000 ac in Reeves & adjacent counties385,000 ac in Reeves & adjacent countiesacquired from Alpine/K2Xacquired from Alpine/K2X
►► Quicksilver Quicksilver –– 310,000 ac in N. Jeff Davis Co. & S. Reeves310,000 ac in N. Jeff Davis Co. & S. Reeves--CulbersonCulberson►► EOG Resources EOG Resources –– 150,000 ac, mostly in Culberson Co.150,000 ac, mostly in Culberson Co.
8 wells permitted, 3 drilled or currently drilling8 wells permitted, 3 drilled or currently drilling►► ConocoPhillips ConocoPhillips –– 35,000 ac in central Reeves Co.35,000 ac in central Reeves Co.
acquired from Burlington Resourcesacquired from Burlington Resourcesone one recompletionrecompletion IP at 2 MMCFDIP at 2 MMCFDone new drill IP at 3.1 MMCFDone new drill IP at 3.1 MMCFD
►► Southwestern Energy, Southwestern Energy, PetroHuntPetroHunt, Carrizo Oil and Gas, Devon, , Carrizo Oil and Gas, Devon, HallwoodHallwood, Forest , Forest Oil, Oil, RiataRiata Energy, and othersEnergy, and others
Several large acreage positions, details are sketchySeveral large acreage positions, details are sketchy35 wells permitted or drilled35 wells permitted or drilled
►► Chevron has a 200,000+ acre fee land position in the play (TXL RChevron has a 200,000+ acre fee land position in the play (TXL Ranch)anch)deal with Anadarko recently announceddeal with Anadarko recently announced
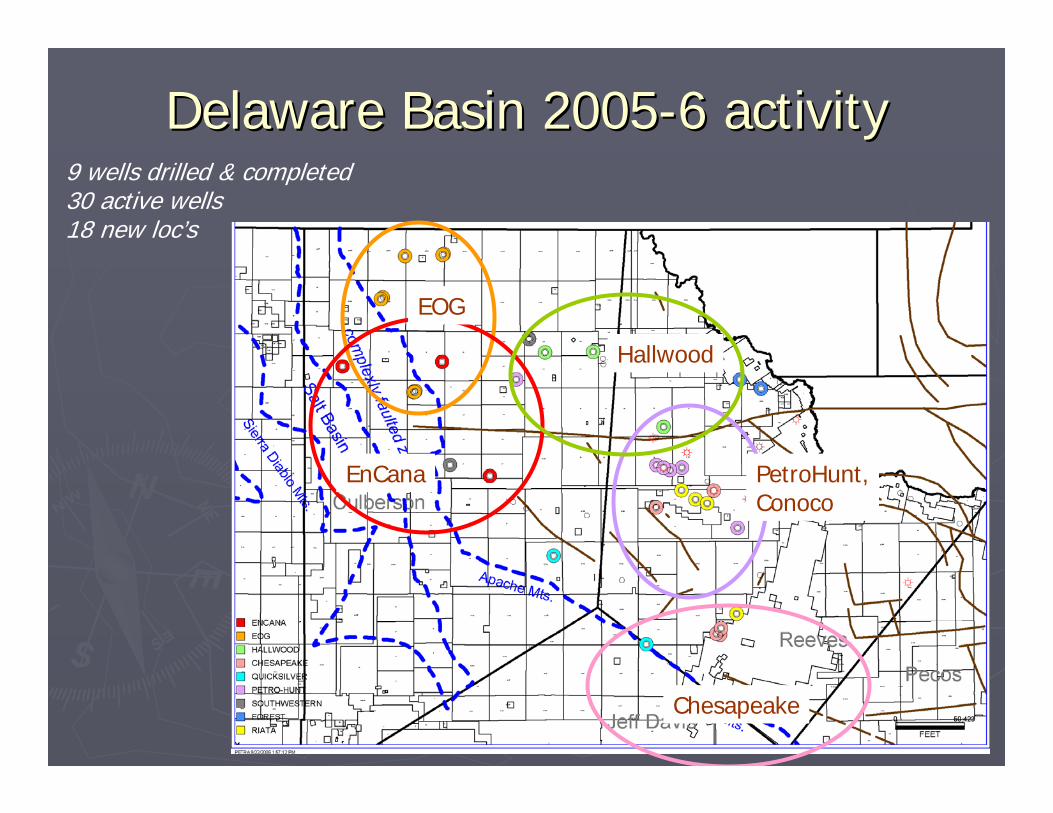
Delaware Basin 2005Delaware Basin 2005--6 activity6 activity
EOG
EnCana PetroHunt,Conoco
Chesapeake
Hallwood
9 wells drilled & completed30 active wells18 new loc’s
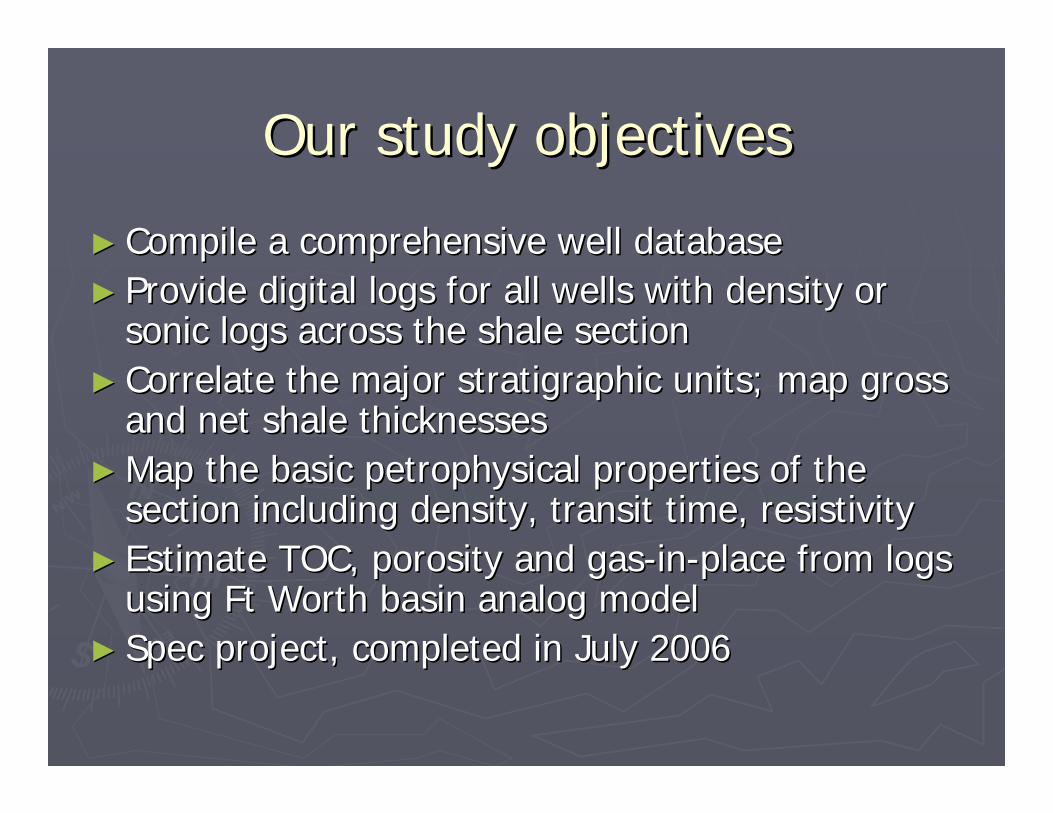
Our study objectivesOur study objectives
►► Compile a comprehensive well databaseCompile a comprehensive well database►► Provide digital logs for all wells with density or Provide digital logs for all wells with density or
sonic logs across the shale sectionsonic logs across the shale section►► Correlate the major stratigraphic units; map gross Correlate the major stratigraphic units; map gross
and net shale thicknessesand net shale thicknesses►► Map the basic petrophysical properties of the Map the basic petrophysical properties of the
section including density, transit time, resistivitysection including density, transit time, resistivity►► Estimate TOC, porosity and gasEstimate TOC, porosity and gas--inin--place from logs place from logs
using Ft Worth basin analog modelusing Ft Worth basin analog model►► Spec project, completed in July 2006Spec project, completed in July 2006
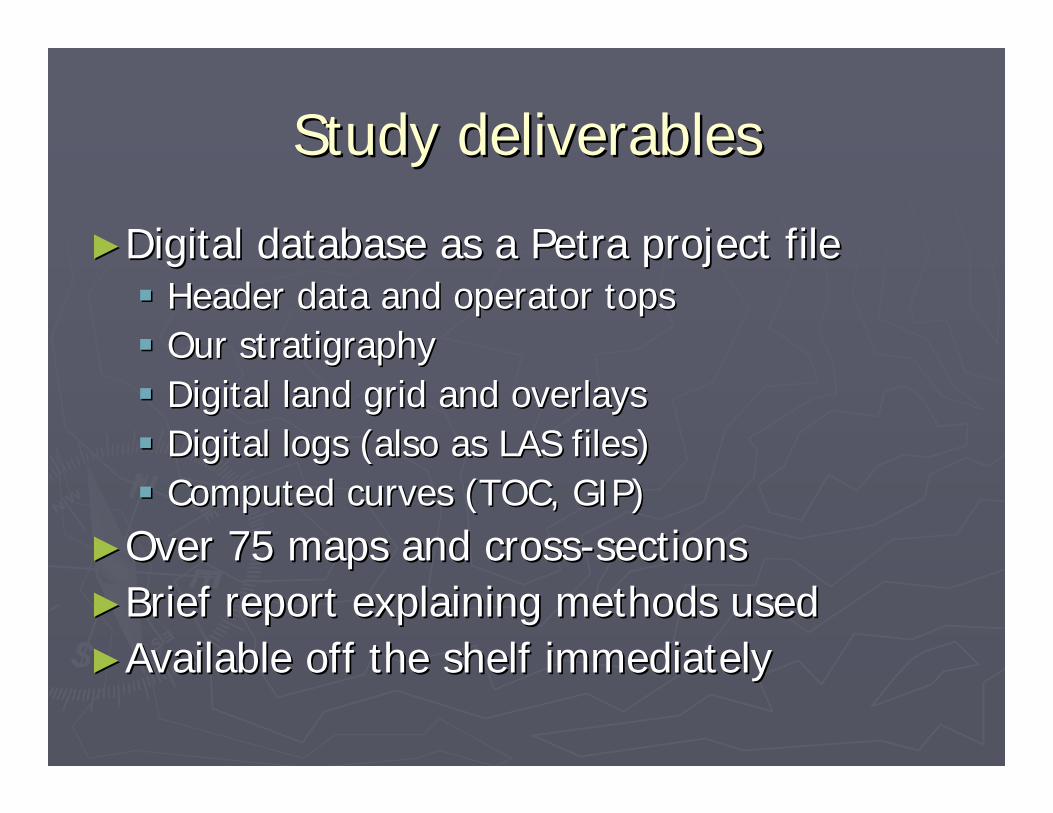
Study deliverablesStudy deliverables
►►Digital database as a Petra project fileDigital database as a Petra project fileHeader data and operator topsHeader data and operator topsOur Our stratigraphystratigraphyDigital land grid and overlaysDigital land grid and overlaysDigital logs (also as LAS files)Digital logs (also as LAS files)Computed curves (TOC, GIP)Computed curves (TOC, GIP)
►►Over 75 maps and crossOver 75 maps and cross--sectionssections►►Brief report explaining methods usedBrief report explaining methods used►►Available off the shelf immediatelyAvailable off the shelf immediately
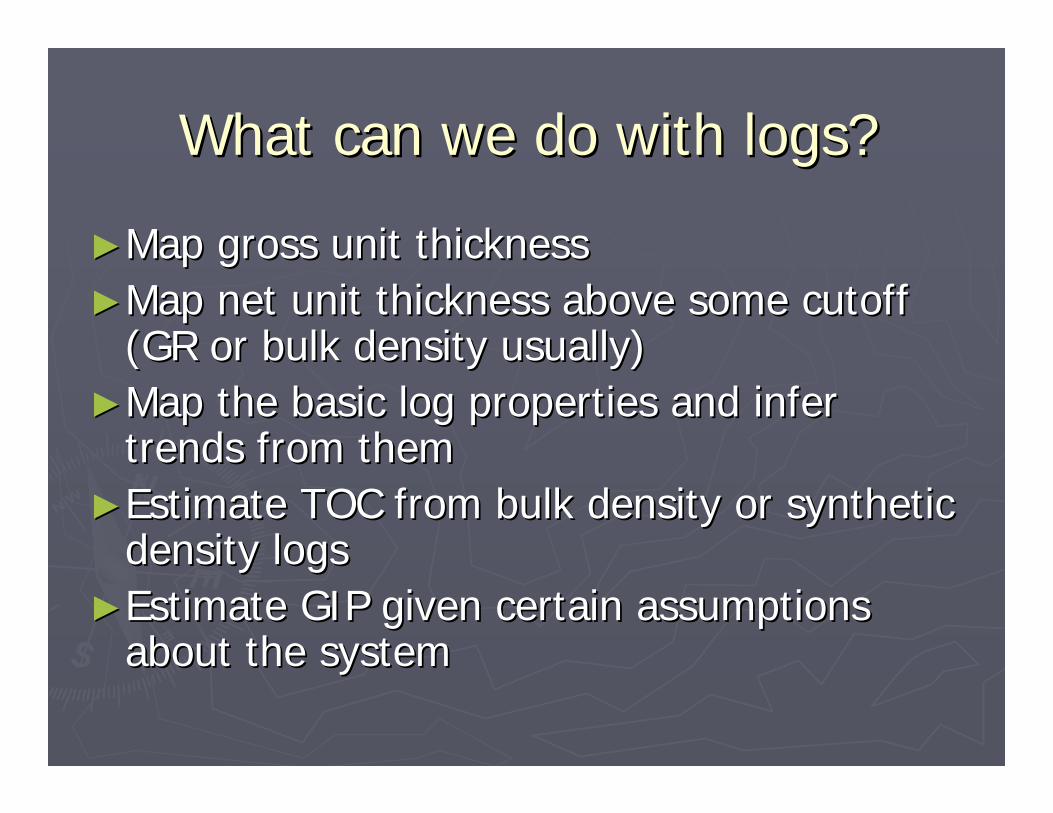
What can we do with logs?What can we do with logs?
►►Map gross unit thicknessMap gross unit thickness►►Map net unit thickness above some cutoff Map net unit thickness above some cutoff
(GR or bulk density usually)(GR or bulk density usually)►►Map the basic log properties and infer Map the basic log properties and infer
trends from themtrends from them►►Estimate TOC from bulk density or synthetic Estimate TOC from bulk density or synthetic
density logsdensity logs►►Estimate GIP given certain assumptions Estimate GIP given certain assumptions
about the systemabout the system
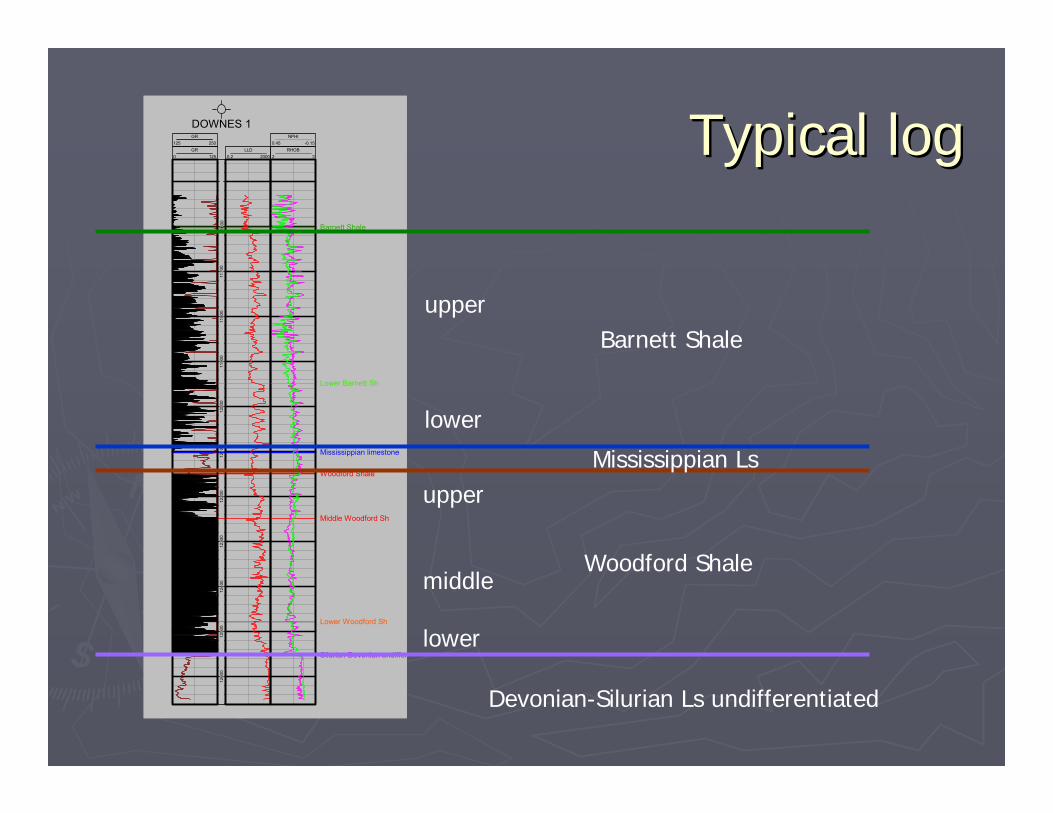
Typical logTypical logDOWNES 1
0 125GR
125 250GR
0.2 2000LLD
2 3RHOB
0.45 -0.15NPHI
Barnett Shale
Lower Barnett Sh
Mississippian limestone
Woodford Shale
Middle Woodford Sh
Lower Woodford Sh
Silurian-Devonian undiffer
1160
011
700
1180
011
900
1200
012
100
1220
012
300
1240
012
500
1260
0
Barnett Shale
Mississippian Ls
Woodford Shale
Devonian-Silurian Ls undifferentiated
upper
middle
lower
upper
lower
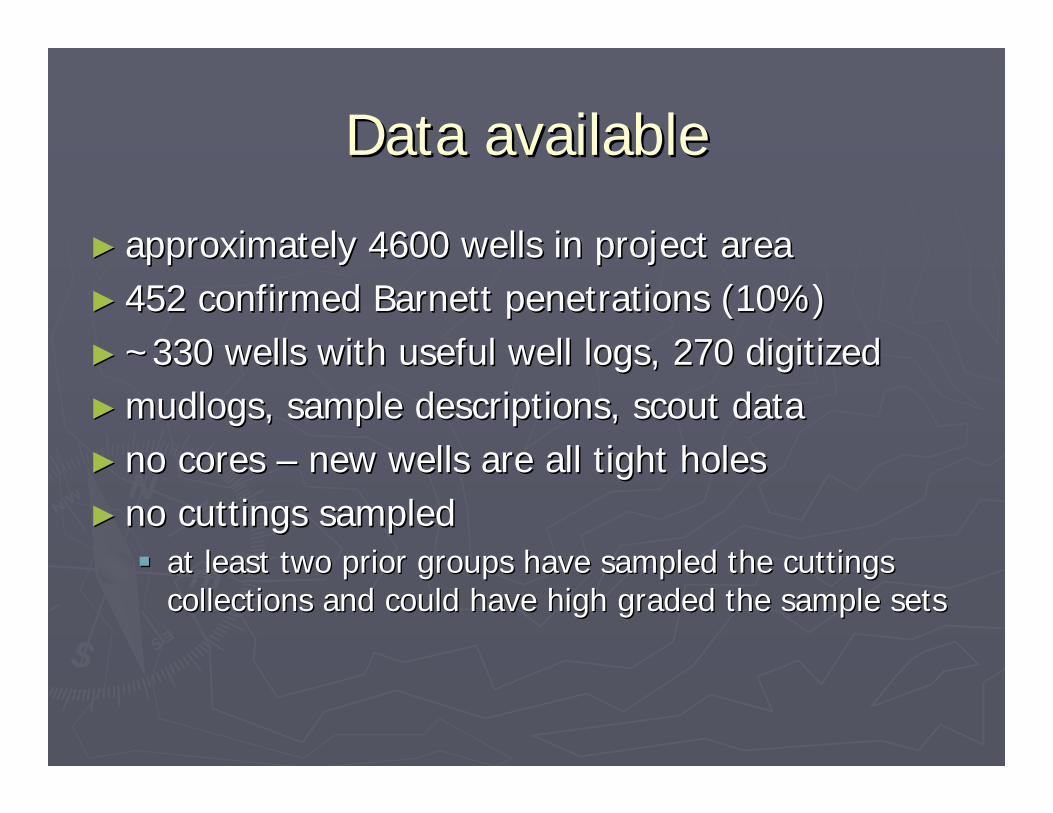
Data availableData available
►► approximately 4600 wells in project areaapproximately 4600 wells in project area►► 452 confirmed Barnett penetrations (10%)452 confirmed Barnett penetrations (10%)►► ~330 wells with useful well logs, 270 digitized~330 wells with useful well logs, 270 digitized►► mudlogsmudlogs, sample descriptions, scout data, sample descriptions, scout data►► no cores no cores –– new wells are all tight holesnew wells are all tight holes►► no cuttings sampledno cuttings sampled
at least two prior groups have sampled the cuttings at least two prior groups have sampled the cuttings collections and could have high graded the sample setscollections and could have high graded the sample sets
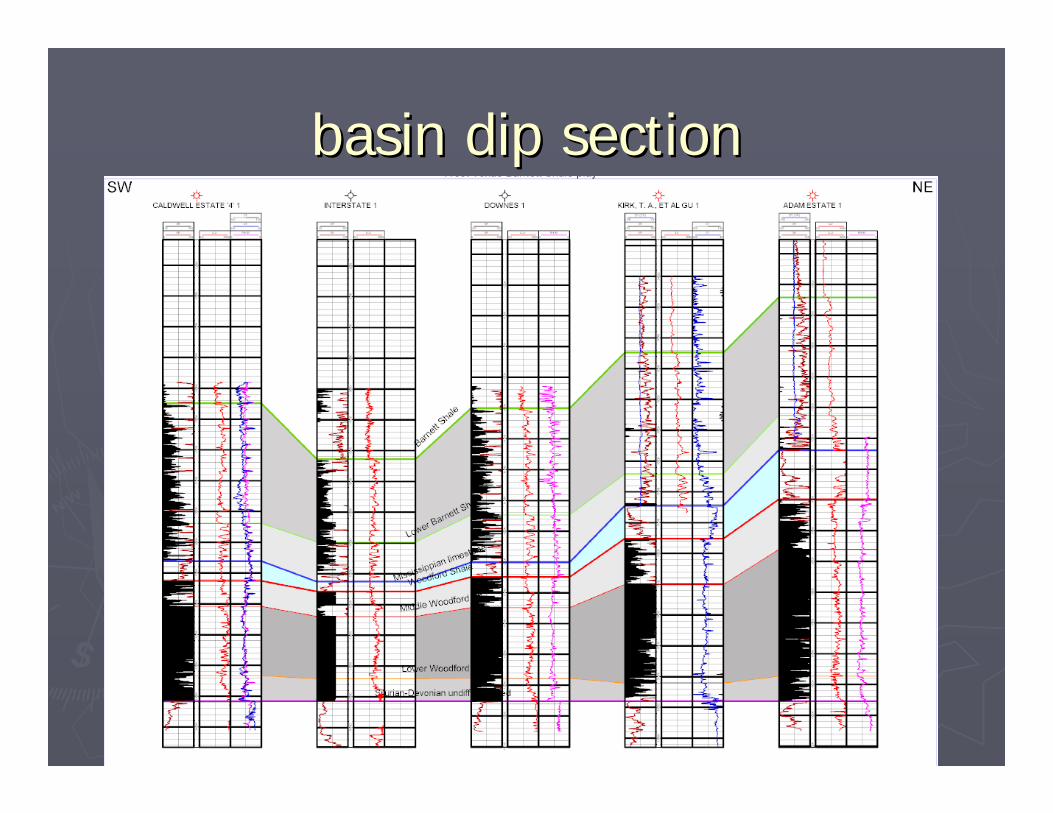
basin dip sectionbasin dip section
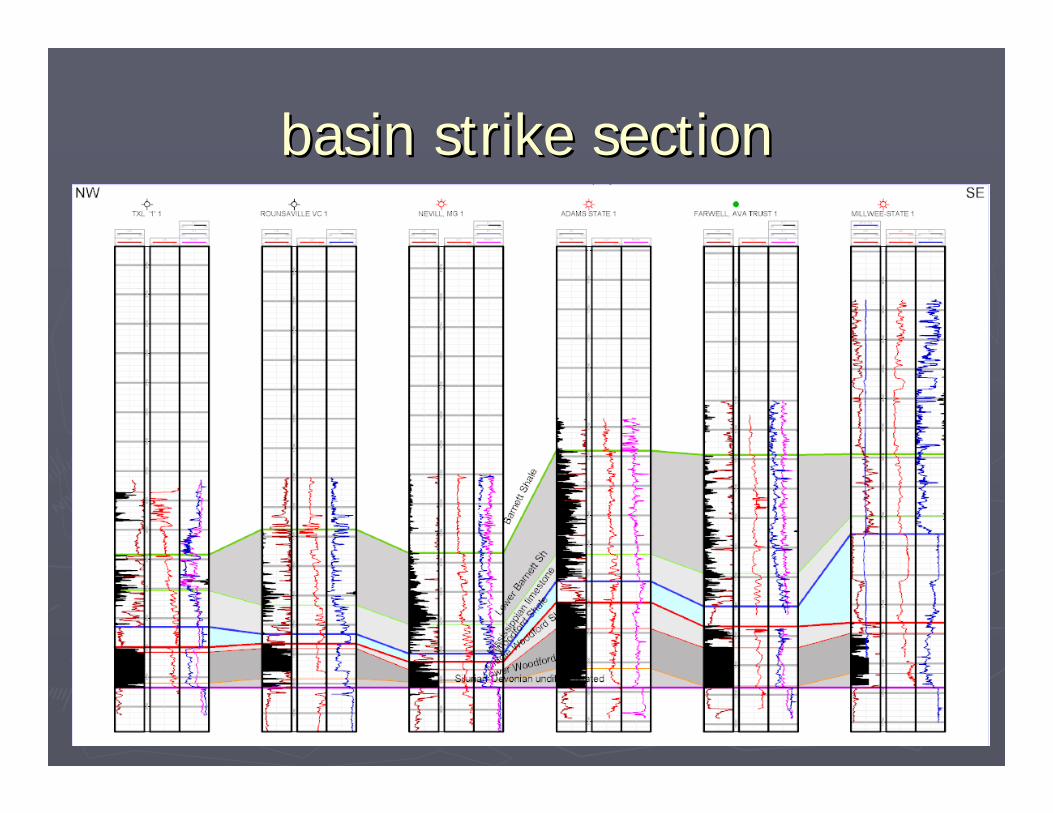
basin strike sectionbasin strike section
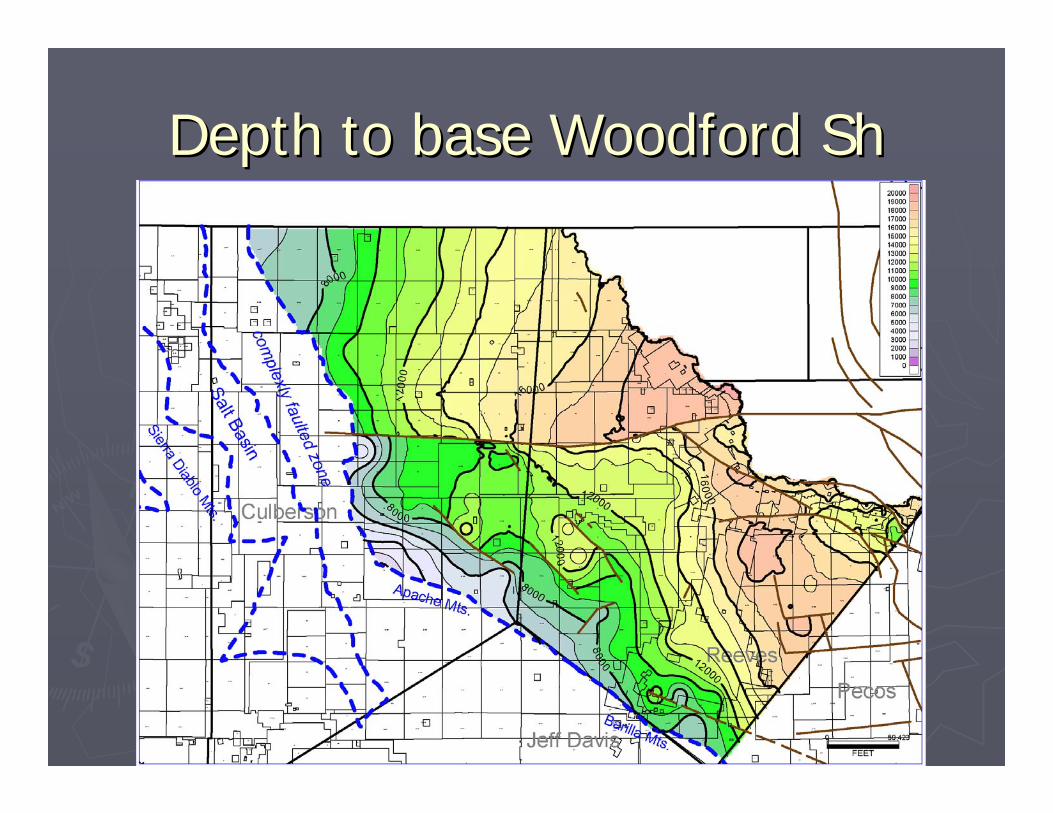
Depth to base Woodford Depth to base Woodford ShSh
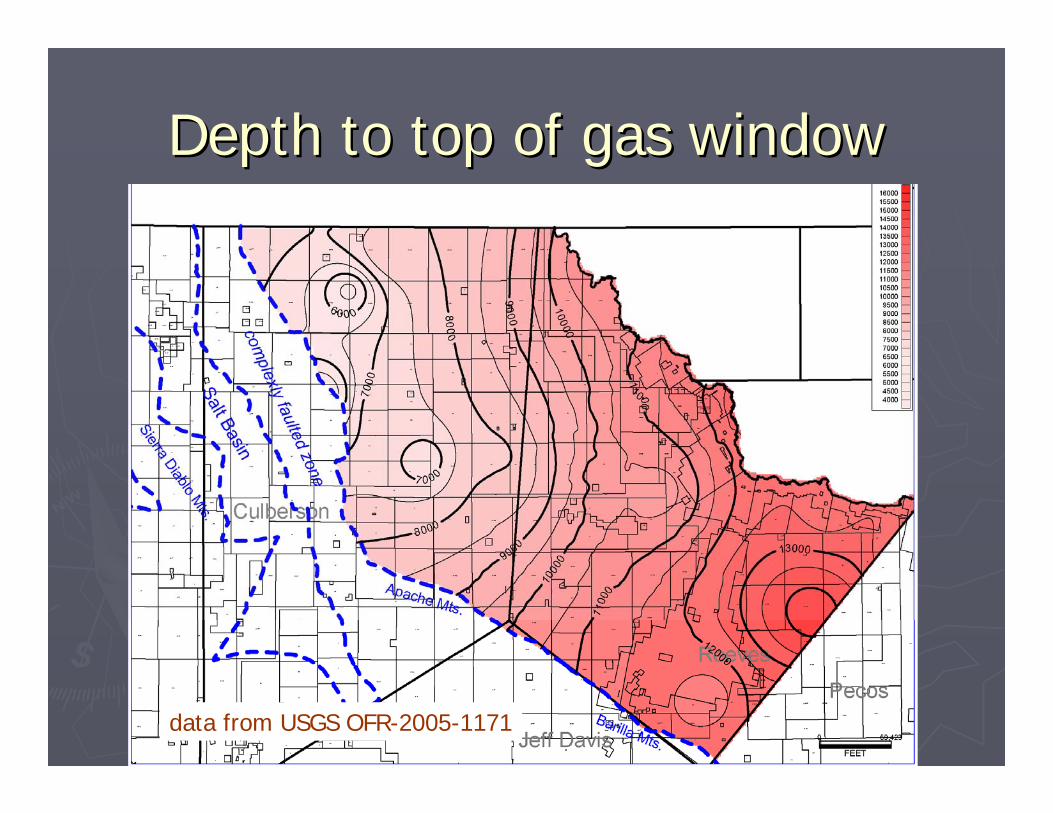
Depth to top of gas windowDepth to top of gas window
data from USGS OFR-2005-1171
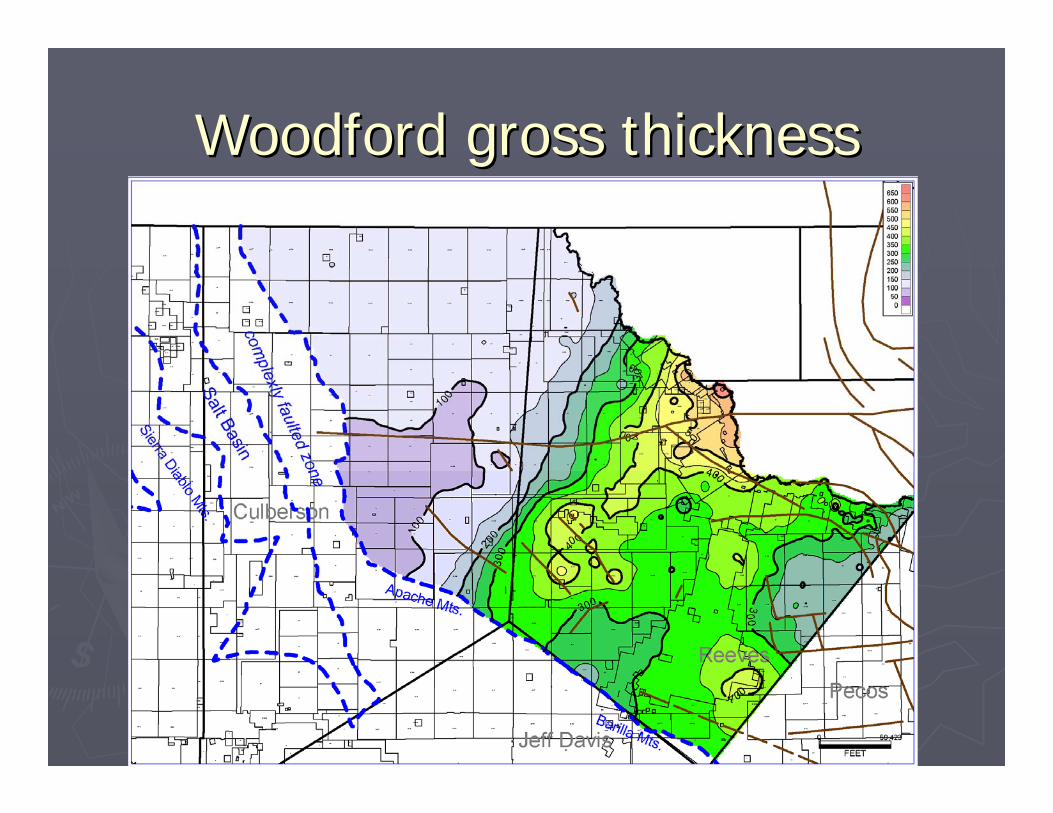
Woodford gross thicknessWoodford gross thickness
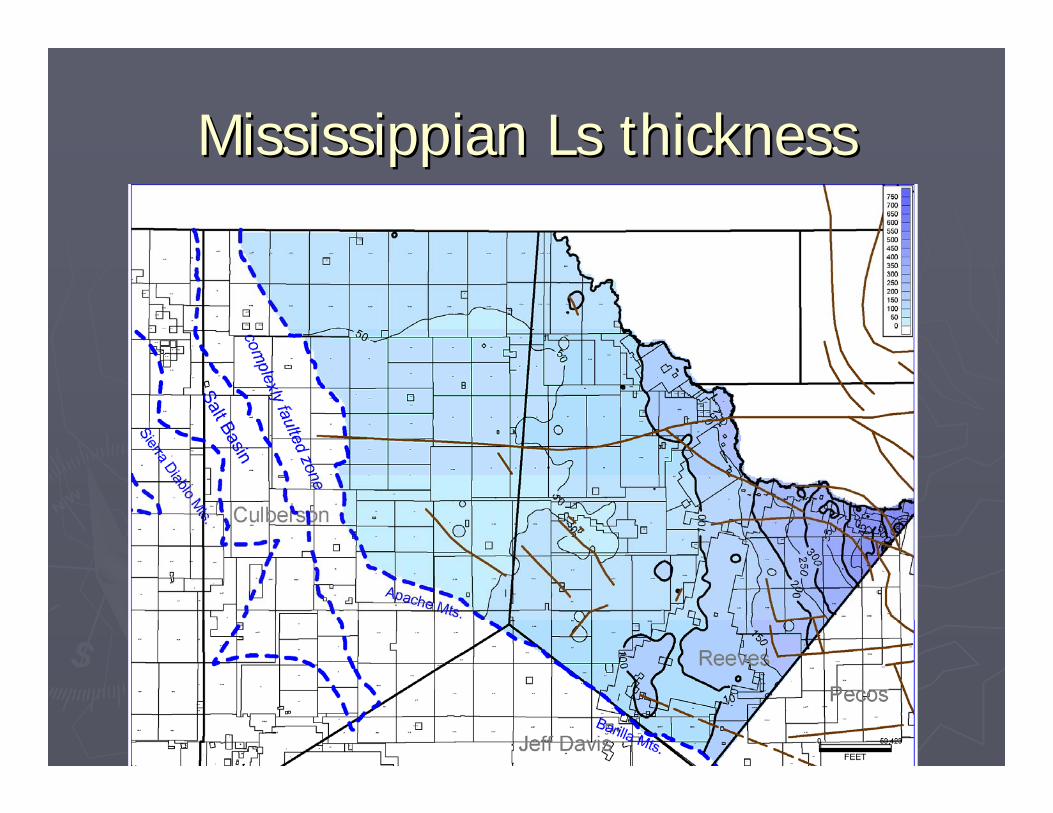
Mississippian Ls thicknessMississippian Ls thickness
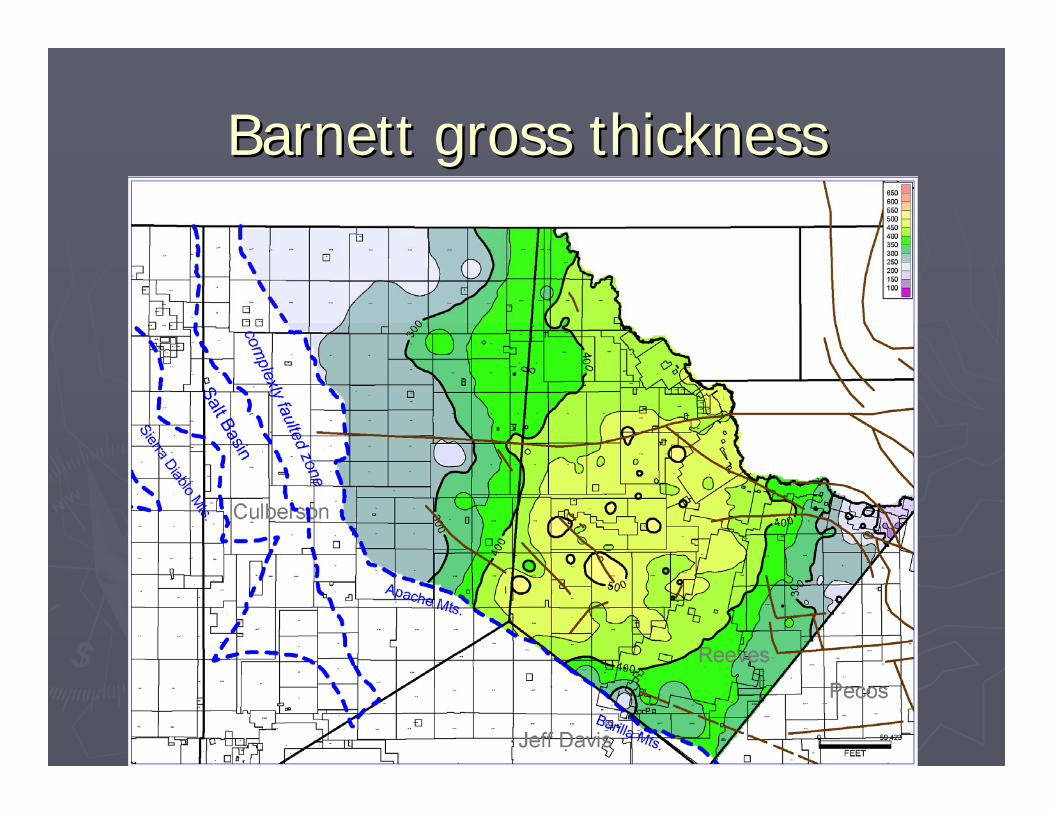
Barnett gross thicknessBarnett gross thickness
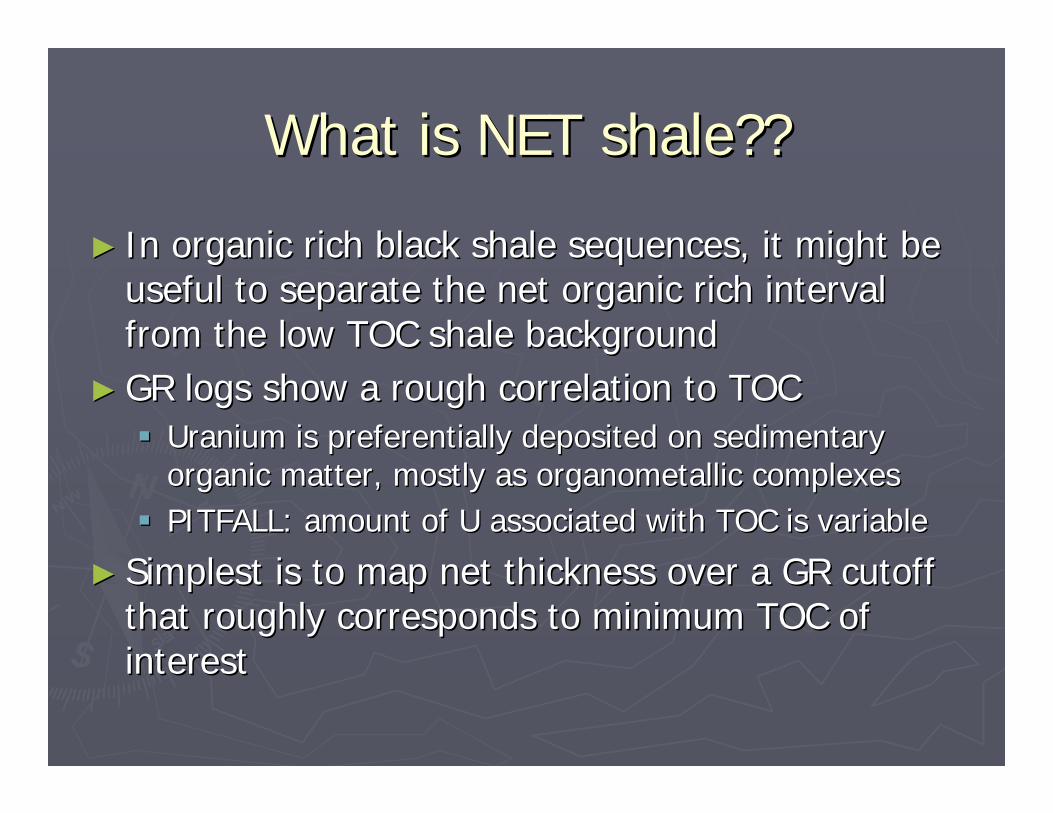
What is NET shale??What is NET shale??
►► In organic rich black shale sequences, it might be In organic rich black shale sequences, it might be useful to separate the net organic rich interval useful to separate the net organic rich interval from the low TOC shale backgroundfrom the low TOC shale background
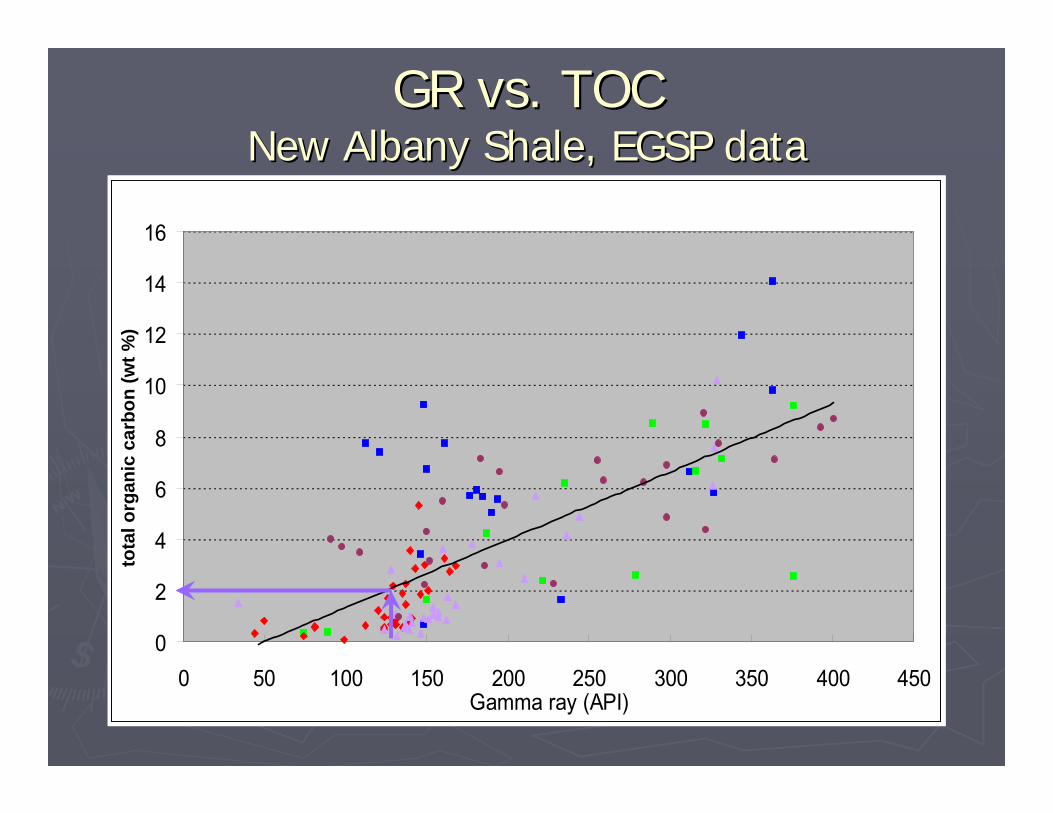
►► GR logs show a rough correlation to TOCGR logs show a rough correlation to TOCUranium is preferentially deposited on sedimentary Uranium is preferentially deposited on sedimentary organic matter, mostly as organic matter, mostly as organometallicorganometallic complexescomplexesPITFALL: amount of U associated with TOC is variablePITFALL: amount of U associated with TOC is variable
►► Simplest is to map net thickness over a GR cutoff Simplest is to map net thickness over a GR cutoff that roughly corresponds to minimum TOC of that roughly corresponds to minimum TOC of interestinterest
0
2
4
6
8
10
12
14
16
0 50 100 150 200 250 300 350 400 450Gamma ray (API)
GR vs. TOC GR vs. TOC New Albany Shale, EGSP dataNew Albany Shale, EGSP datato
tal o
rgan
ic c
arbo
n (w
t %)
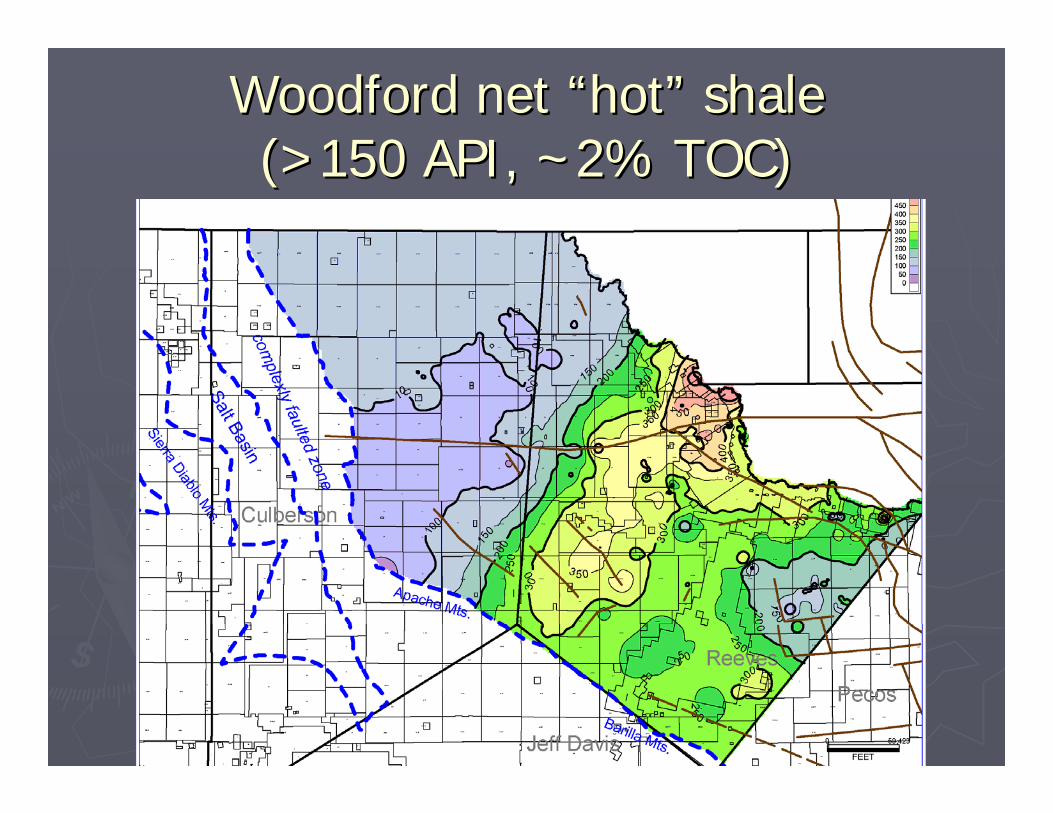
Woodford net Woodford net ““hothot”” shale shale (>150 API, ~2% TOC)(>150 API, ~2% TOC)
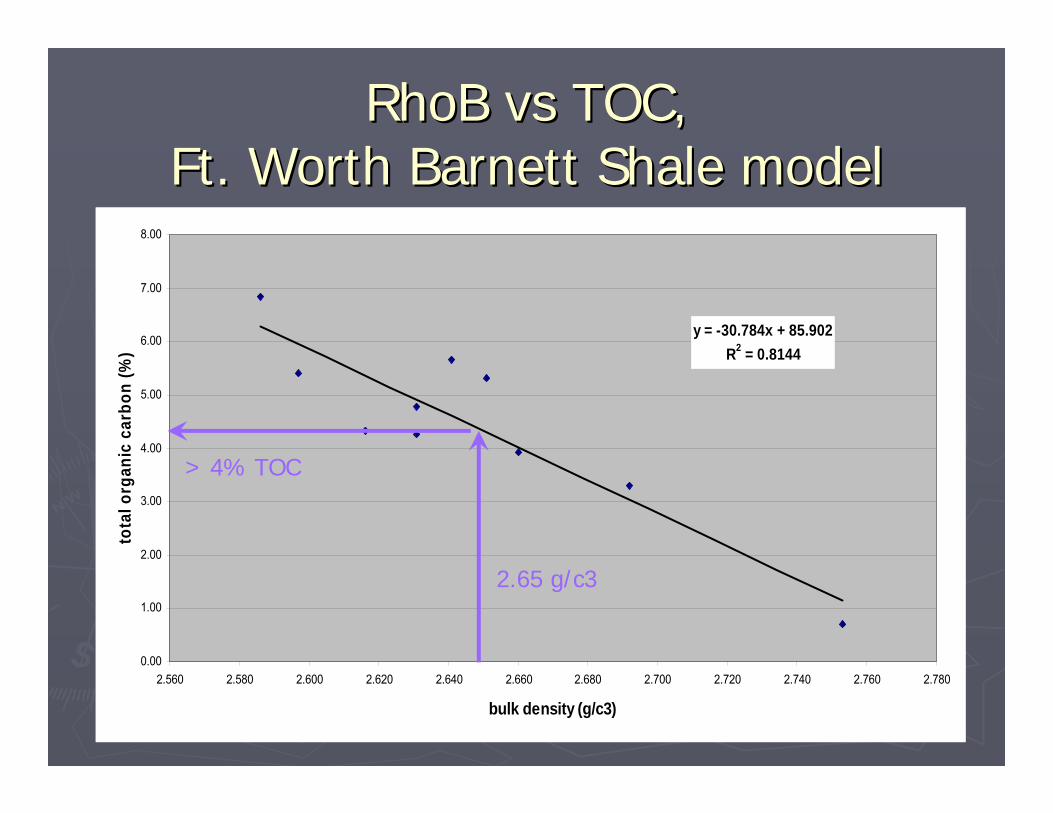
y = -30.784x + 85.902R2 = 0.8144
0.00
1.00
2.00
3.00
4.00
5.00
6.00
7.00
8.00
2.560 2.580 2.600 2.620 2.640 2.660 2.680 2.700 2.720 2.740 2.760 2.780
bulk density (g/c3)
tota
l org
anic
car
bon
(%)
RhoBRhoB vsvs TOC, TOC, Ft. Worth Barnett Shale modelFt. Worth Barnett Shale model
2.65 g/c3
> 4% TOC
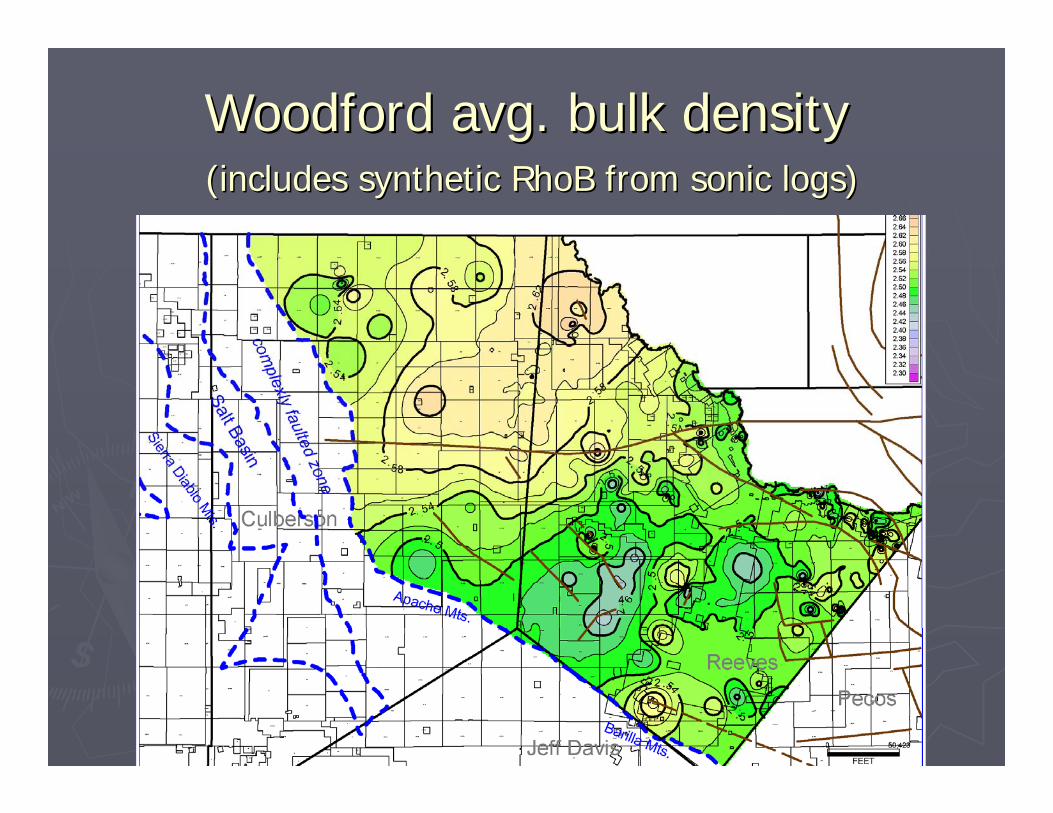
Woodford avg. bulk densityWoodford avg. bulk density(includes synthetic (includes synthetic RhoBRhoB from sonic logs)from sonic logs)
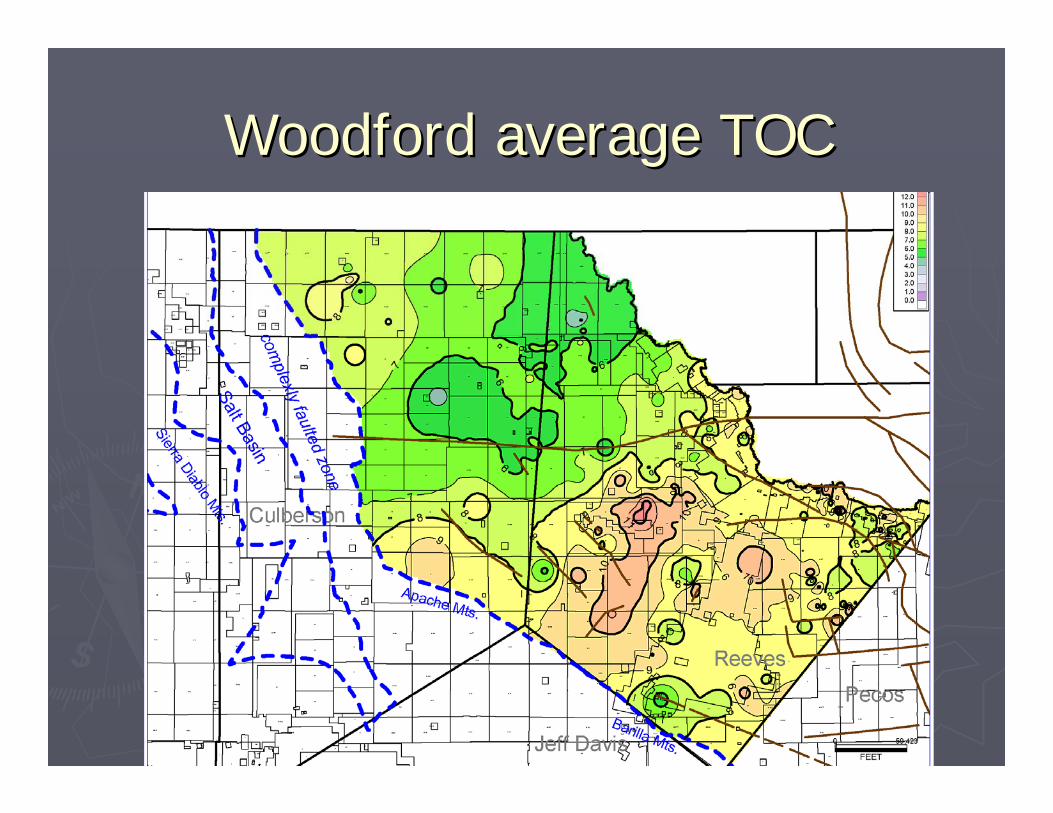
Woodford average TOCWoodford average TOC
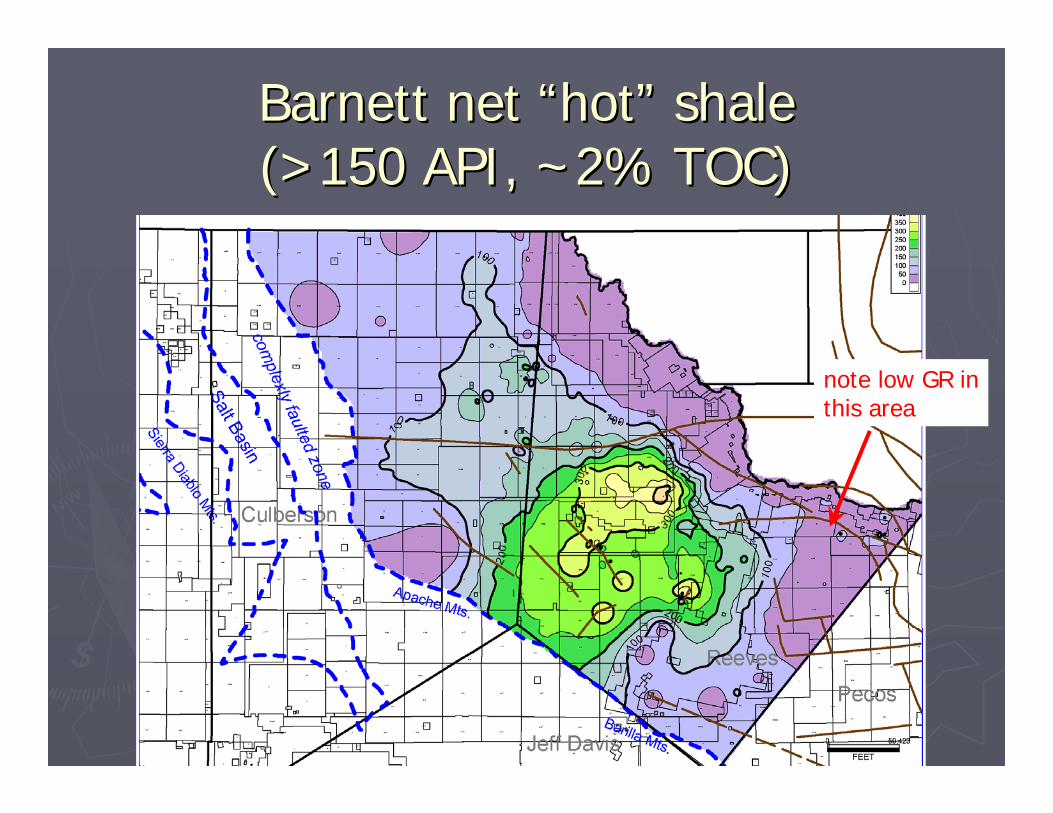
Barnett net Barnett net ““hothot”” shale shale (>150 API, ~2% TOC)(>150 API, ~2% TOC)
note low GR inthis area
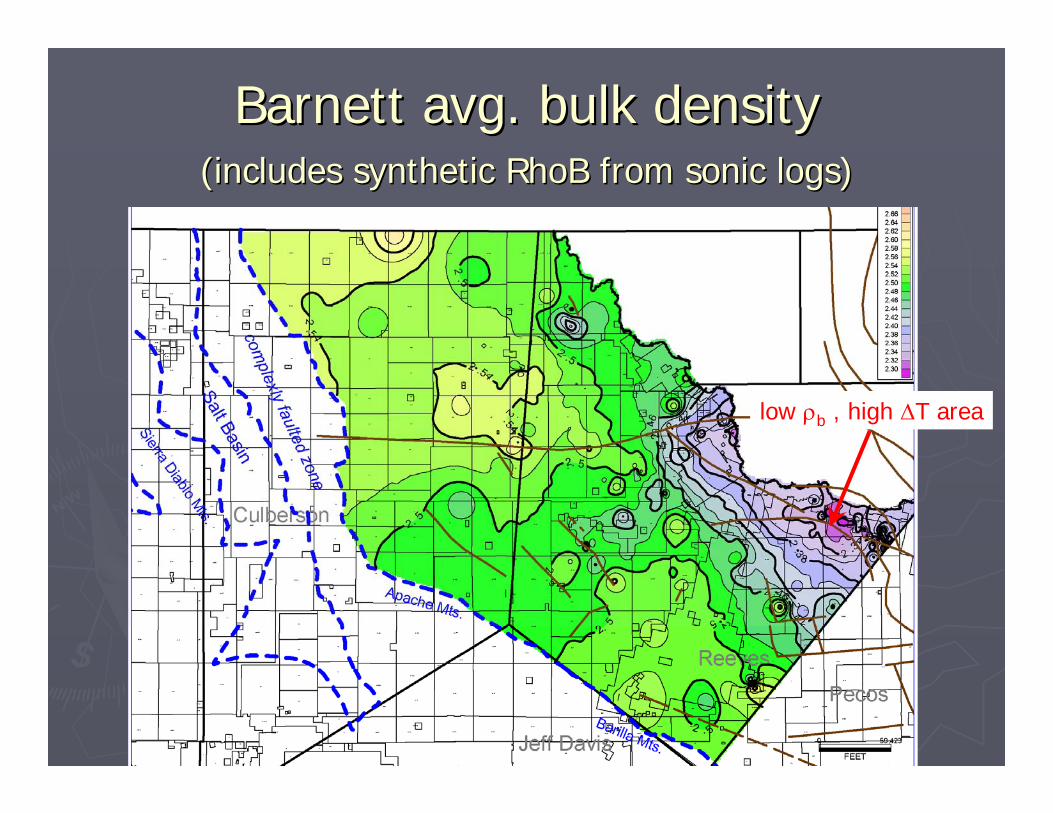
Barnett avg. bulk densityBarnett avg. bulk density(includes synthetic (includes synthetic RhoBRhoB from sonic logs)from sonic logs)
low ρb , high ∆T area
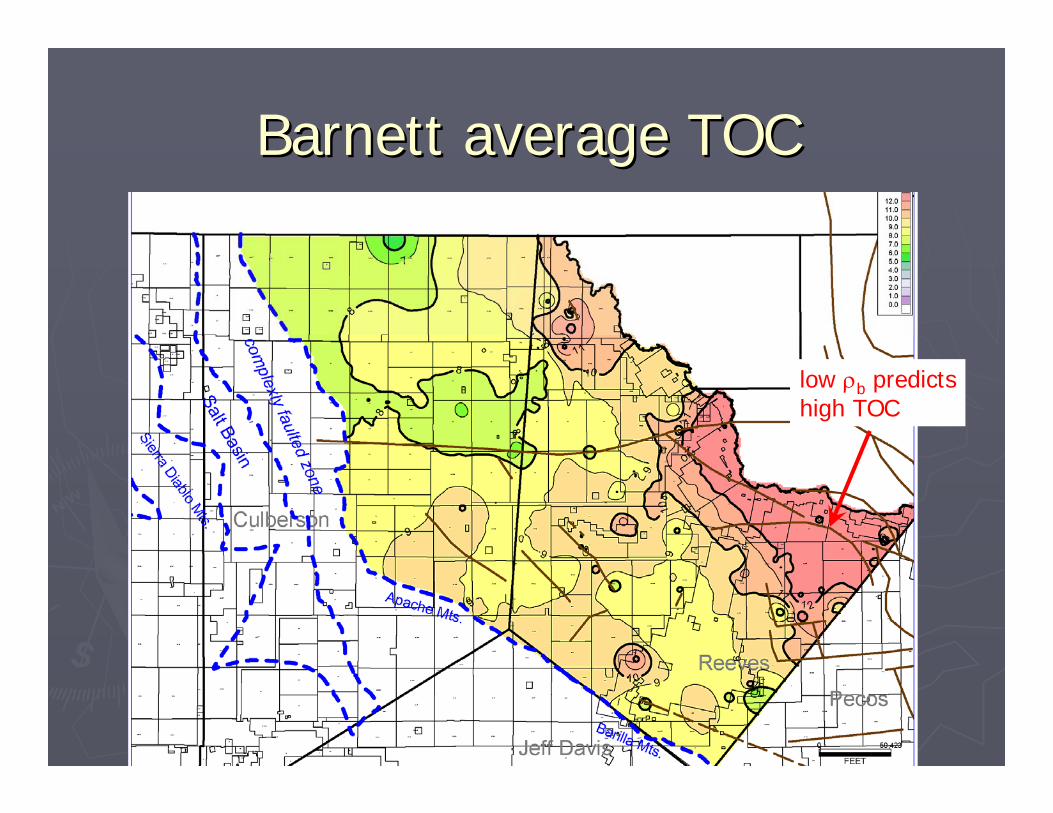
Barnett average TOCBarnett average TOC
low ρb predictshigh TOC
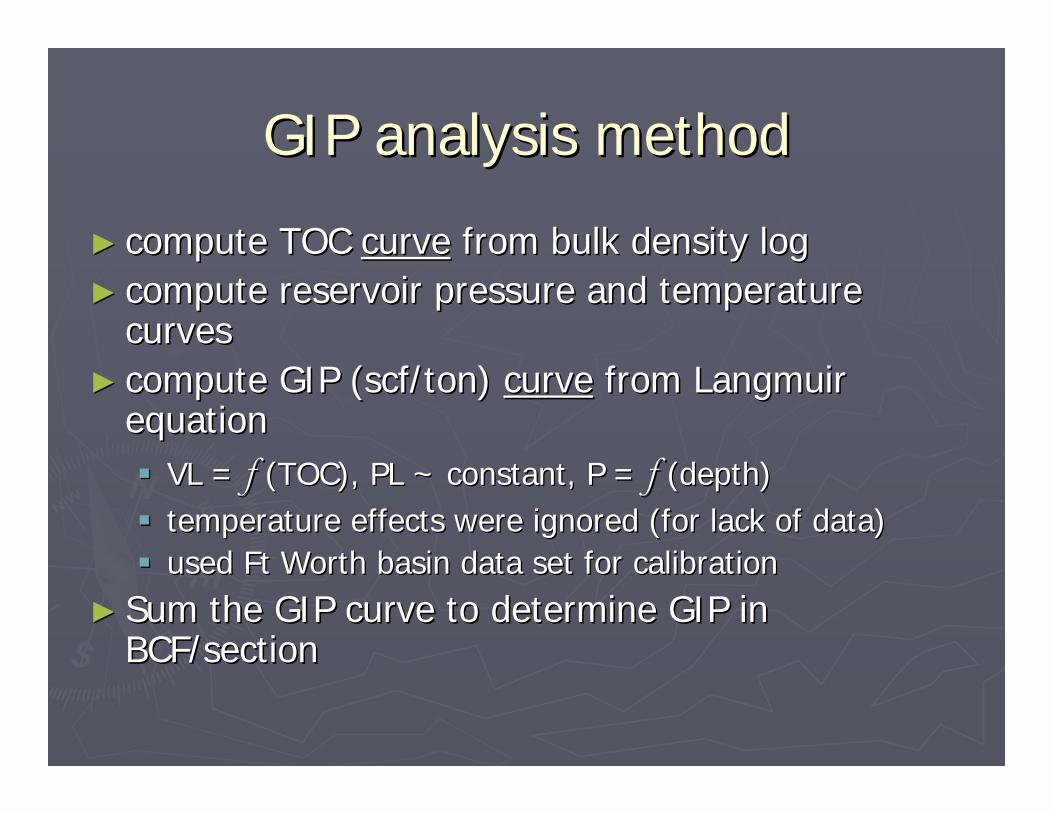
GIP analysis methodGIP analysis method
►► compute TOC compute TOC curvecurve from bulk density logfrom bulk density log►► compute reservoir pressure and temperature compute reservoir pressure and temperature
curvescurves►► compute GIP (compute GIP (scfscf/ton) /ton) curvecurve from Langmuir from Langmuir
equation equation VL = VL = f f (TOC), PL ~ constant, P = (TOC), PL ~ constant, P = f f (depth)(depth)temperature effects were ignored (for lack of data)temperature effects were ignored (for lack of data)used Ft Worth basin data set for calibrationused Ft Worth basin data set for calibration
►► Sum the GIP curve to determine GIP in Sum the GIP curve to determine GIP in BCF/sectionBCF/section
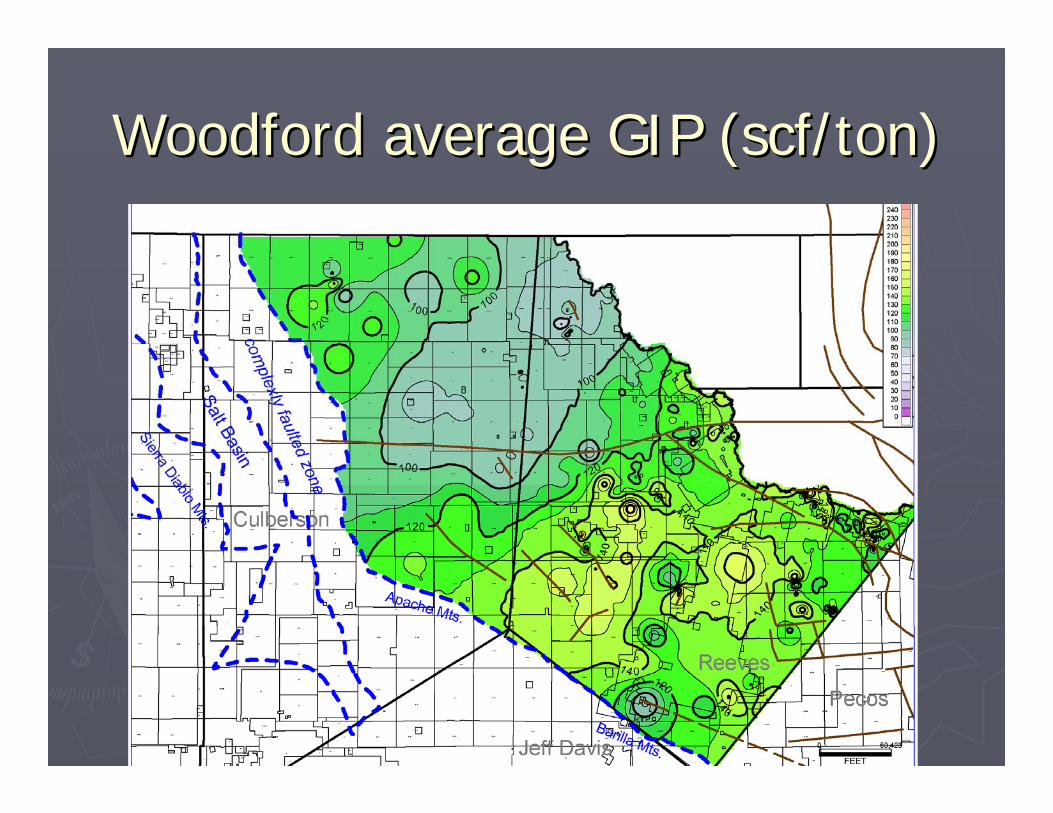
Woodford average GIP (Woodford average GIP (scfscf/ton)/ton)
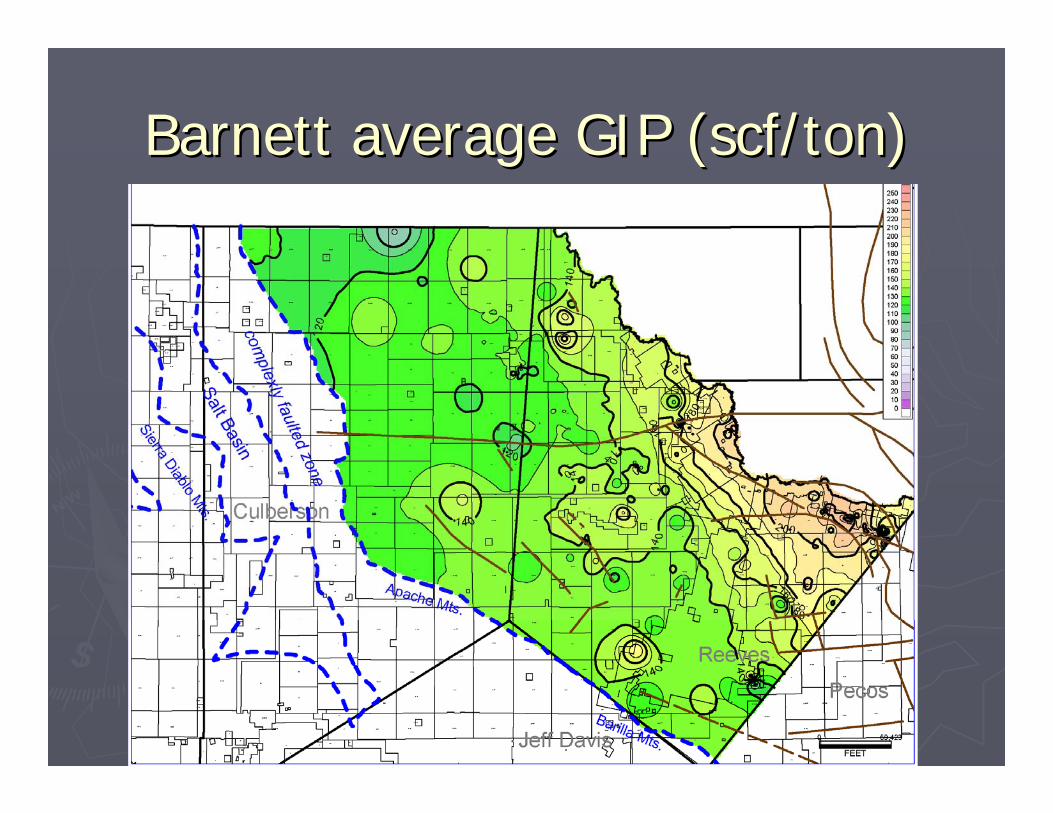
Barnett average GIP (Barnett average GIP (scfscf/ton)/ton)
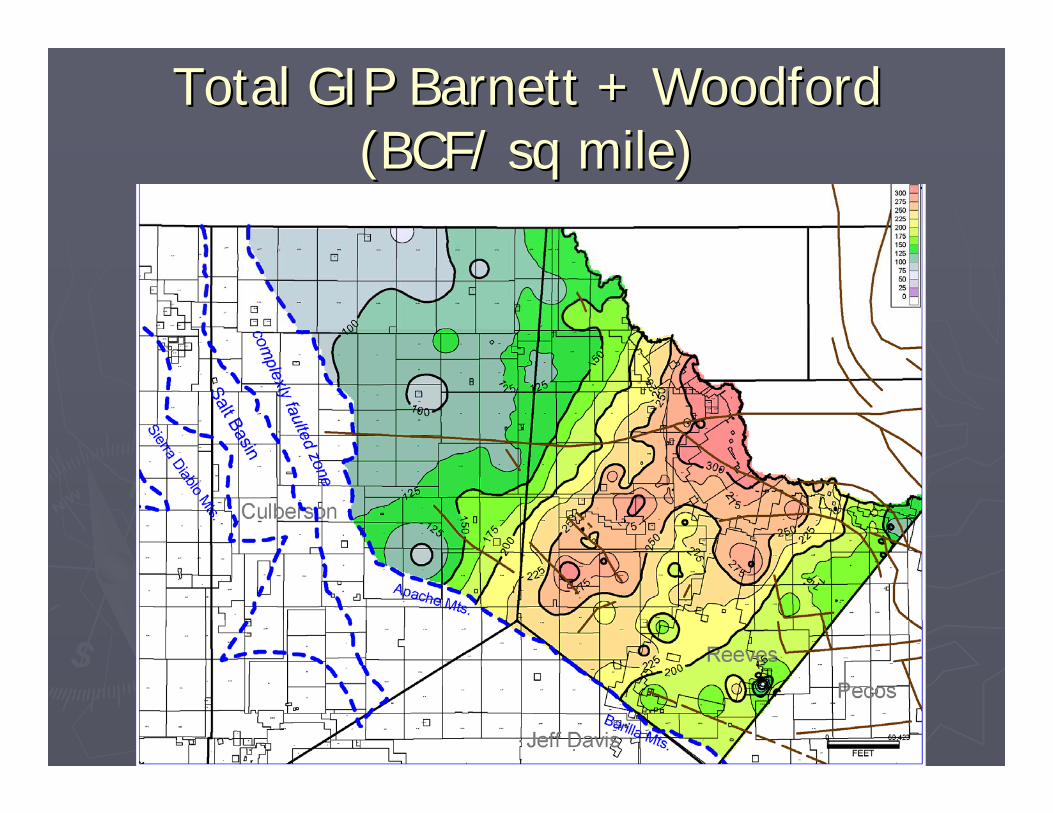
Total GIP Barnett + Woodford Total GIP Barnett + Woodford (BCF/ sq mile)(BCF/ sq mile)
Total play GIPTotal play GIP
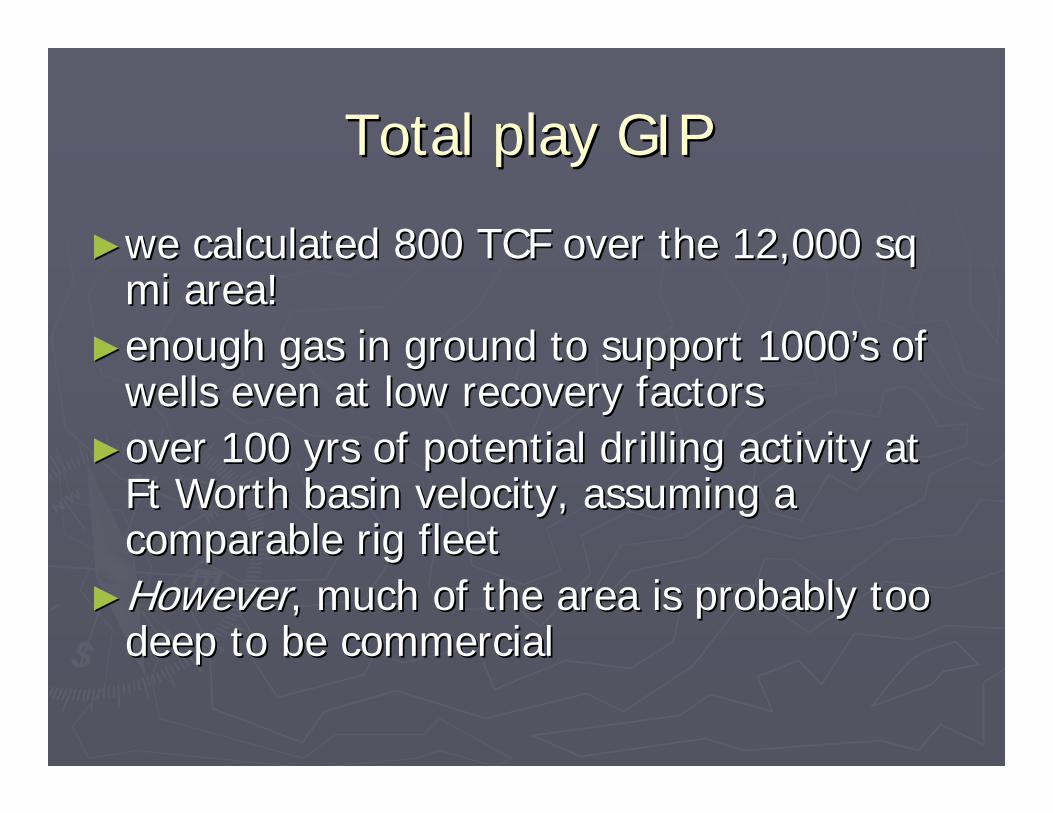
►►we calculated 800 TCF over the 12,000 sq we calculated 800 TCF over the 12,000 sq mi area! mi area!
►►enough gas in ground to support 1000enough gas in ground to support 1000’’s of s of wells even at low recovery factorswells even at low recovery factors
►►over 100 yrs of potential drilling activity at over 100 yrs of potential drilling activity at Ft Worth basin velocity, assuming a Ft Worth basin velocity, assuming a comparable rig fleetcomparable rig fleet
►►HoweverHowever, much of the area is probably too , much of the area is probably too deep to be commercialdeep to be commercial
SummarySummary
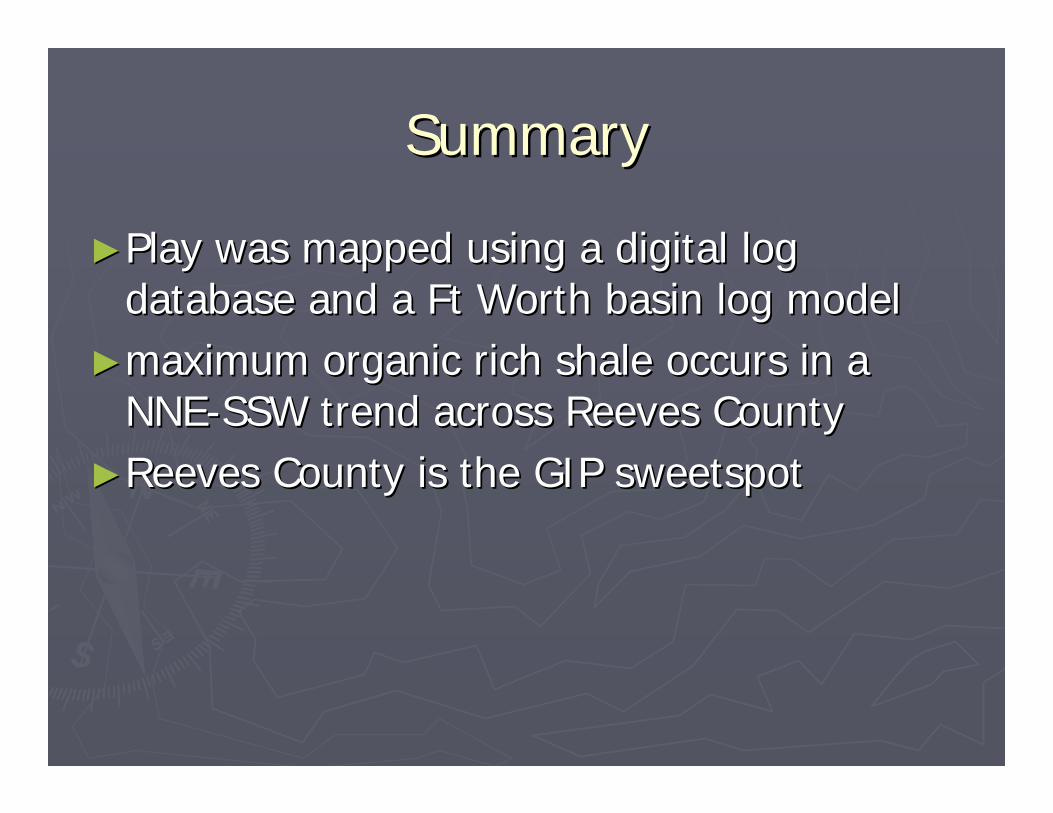
►►Play was mapped using a digital log Play was mapped using a digital log database and a Ft Worth basin log modeldatabase and a Ft Worth basin log model
►►maximum organic rich shale occurs in a maximum organic rich shale occurs in a NNENNE--SSW trend across Reeves CountySSW trend across Reeves County
►►Reeves County is the GIP Reeves County is the GIP sweetspotsweetspot
►►Culberson County has lower Culberson County has lower scfscf/ton due to /ton due to shallower depths (lower pressure) and lower shallower depths (lower pressure) and lower average TOCaverage TOC
►►Relative $$ advantage is not so obvious due Relative $$ advantage is not so obvious due to differences in drilling & completion coststo differences in drilling & completion costs
►►Core data will be required to locally calibrate Core data will be required to locally calibrate the modelthe model
►►NONETHELESS, directionally the maps are NONETHELESS, directionally the maps are validvalid
►►Whether this shale can actually deliver gas Whether this shale can actually deliver gas at commercial rates remains to be seenat commercial rates remains to be seen
shale permeability is difficult to assess from the shale permeability is difficult to assess from the available dataavailable datano information on the in situ stresses or no information on the in situ stresses or ““fracabilityfracability”” of the shalesof the shales
►►Will take at least 50 wells before industry Will take at least 50 wells before industry knows if it can deliver like the Ft. Worth knows if it can deliver like the Ft. Worth basin Barnett Shalebasin Barnett Shale